UNITED STATES
SECURITIES AND EXCHANGE COMMISSION
Washington, D.C. 20549
FORM N-CSR
CERTIFIED SHAREHOLDER REPORT OF REGISTERED
MANAGEMENT INVESTMENT COMPANIES
Investment Company Act file number 811-05601
SEI Institutional International Trust
(Exact name of registrant as specified in charter)
SEI Investments
One Freedom Valley Drive
Oaks, PA 19456
(Address of principal executive offices) (Zip code)
CT Corporation
155 Federal Street
Boston, MA 02110
(Name and address of agent for service)
Registrant’s telephone number, including area code: 1-800-342-5734
Date of fiscal year end: September 30, 2016
Date of reporting period: September 30, 2016
| Item 1. | Reports to Stockholders. |

September 30, 2016
ANNUAL REPORT
SEI Institutional International Trust
 | International Equity Fund | |
| Emerging Markets Equity Fund | |
| International Fixed Income Fund | |
| Emerging Markets Debt Fund | |

The Trust files its complete schedule of portfolio holdings with the Securities and Exchange Commission for the first and third quarter of each fiscal year on Form N-Q within sixty days after the end of the period. The Trust’s Forms N-Q are available on the Commission’s website at http://www.sec.gov, and may be reviewed and copied at the Commission’s Public Reference Room in Washington, DC. Information on the operation of the Public Reference Room may be obtained by calling 1-800-SEC-0330.
A description of the policies and procedures that the Trust uses to determine how to vote proxies relating to portfolio securities, as well as information relating to how a Fund voted proxies relating to portfolio securities during the most recent 12-month period ended June 30, is available (i) without charge, upon request, by calling 1-800-DIAL-SEI; and (ii) on the Commission’s website at http://www.sec.gov.
September 30, 2016 (Unaudited)
To Our Shareholders:
The Funds’ fiscal year — October 1, 2015 through September 30, 2016 — was notable for several key themes: energy-sector volatility spread to other areas of the market; major central-bank policies diverged, with the Federal Reserve (“Fed”) commencing rate increases while the European Central Bank (“ECB”), Bank of Japan (“BOJ”), Bank of England (“BOE”) and People’s Bank of China (“PBOC”) deepened their commitments to monetary accommodation; and, as a result of the diverging policies, major developed-market sovereign-bond yields continued to fall, with some edging into negative-rate territory. A vote (“Brexit”) by U.K. citizens in favor of leaving the European Union (“EU”) took place during the final third of the reporting period, briefly upending global financial markets and presenting major questions about how the relationship will be dissolved.
Geopolitical events
Severe unrest continued in certain areas of the Middle East, driven by the sometimes-opposing and sometimes-overlapping interests of Islamic State, the Syrian regime, Syrian nationalists, Kurdish forces and the Iraqi military. Regional superpowers Iran, Saudi Arabia and Turkey also applied varying degrees of indirect influence. Broader involvement escalated at the beginning of the period, with Russia’s airpower commitment and a redoubled coalition of Western powers targeting Islamic State after a series of attacks by religious extremists across the globe. Iraqi forces, supported by U.S. air and ground resources, began to make notable progress in reversing Islamic State gains as the reporting period progressed; at the same time, incidences of terrorism appeared to increase in Africa, Asia, Europe, the Middle East and North America. The latest Syrian ceasefire, established in mid-September 2016 and backed by U.S. and Russia to allow for humanitarian aid, only held for a few days, resulting in deteriorating cooperation between the U.S. and Russia. While the conflict that originated in Syria and Iraq appears to have influenced destabilizing events elsewhere around the globe, and taken a terrible human toll, it has not had a significant impact on global markets or the economy at this point.
It will be interesting, however, to see the ultimate effects of the ensuing Syrian migrant crisis on the EU. Immigration served as one of the key points of contention leading up to Great Britain’s Brexit vote in late June. U.K. Prime Minister David Cameron tendered his resignation as a result, Theresa May was appointed to the office, and a litany of questions entered the public dialogue on topics ranging from when the government would commence the formal withdrawal process to how negotiations would fare regarding trade agreements, and whether the immigration goals espoused by the Leave campaign would come to pass.
Immigration-driven ballot-box uncertainty has also taken center stage in the U.S. presidential election, where the leading primary candidates of the two major political parties — Hillary Clinton (Democrat) and Donald Trump (Republican) — faced off in their first televised debate just before the end of the reporting period.
Despite the considerable aforementioned instability in the Middle East, the price of oil remained mostly insulated from regional developments. Oil-price weakness, which persisted for the first third of the reporting period, remained primarily attributable to oversupply. Energy-export-dependent Venezuela succumbed to the economically depressive effects of low oil prices during the fiscal year. Food shortages and a breakdown of the rule of law appeared to worsen over the course of the fiscal year, despite a rebound in the price of oil. Brazil’s prospects also paled, and then recovered partially during the period, as a corruption investigation centering on its lead state-run oil company enveloped a cross-section of political leaders — culminating in the impeachment of President Dilma Rousseff. The Organization of Petroleum Exporting Countries (“OPEC”) reached an agreement in the weeks leading up to the end of the reporting period on the need for production cuts and cooperation from non-OPEC producers to effect a balanced market.
Economic and market performance
U.S. economic growth began to decelerate in the third quarter of 2015 (prior to the start of the reporting period), continuing into the fourth-quarter as industrial production and manufacturing came under pressure from the effects of U.S. dollar strength, and slowing further still during the first quarter of 2016. The second quarter saw a pickup, albeit a disappointing one relative to the same period in 2015. The labor market improved during the fiscal year; the unemployment rate started and finished the period at 5.0%, falling as low as 4.7% in May 2016, while the labor force participation rate increased from 62.5% to 62.9%. Average hourly earnings and real personal incomes gained with relative steadiness, bouncing around a rough mean of about 0.2% per month over the reporting period. The Fed
SEI Institutional International Trust / Annual Report / September 30, 2016 |
1 |
LETTER TO SHAREHOLDERS (Continued)
September 30, 2016 (Unaudited)
raised its target interest rate in mid-December 2015 for the first time since 2006, leaving behind a near-zero rate that had been in place since late 2008.
Europe’s economic expansion continued along a steady, but modest, trajectory leading up to the reporting period and through the second quarter of 2016 (the latest available information), save for an uptick in the growth rate during the first quarter. The ECB’s introduction of a negative deposit rate and expansion of its asset-purchase program in early 2015 (prior to the start of the Funds’ fiscal year) was followed in March 2016 by a deeper foray into negative-rate territory and additional asset-purchase commitments. Despite concerns as the Brexit vote approached in late June 2016, second-quarter U.K. economic growth was the highest in some time, albeit by a small margin. Much of the U.K.’s economic data showed worsening conditions in the immediate aftermath of the vote, followed by a recovery. Sterling depreciated substantially in the vote’s immediate wake, and then again as the reporting period concluded. The BOE delivered a rate cut coupled with asset-purchase and term-funding programs at its early-August meeting.
In the Asia-Pacific region, Japan started the fiscal year with an economic contraction in the fourth quarter of 2015, followed by a convincing recovery in the first quarter of 2016 and slow growth in the second quarter. The yen began strengthening relative to the U.S. dollar in December 2015, and continued through late June 2016. The BOJ adopted a negative benchmark interest rate and expanded its asset-purchase program, while the government introduced a sizeable fiscal reform proposal focused on government spending. As the end of the period approached the BOJ announced its latest policy endeavor: keeping the 10-year Japanese government bond yield at 0% with a commitment to alter its bond-buying pace as needed to meet this goal. The BOJ also expressed its intention not only to achieve, but temporarily exceed, its target inflation level (currently 2%) to increase inflation expectations. China’s economic growth mostly held firm during the period; while the pace of growth was below that of recent years, it remained considerably higher than most other economies. The PBOC loosened its monetary-policy stance, reducing benchmark interest rates and bank-reserve requirements during the reporting period. The government’s decision to peg its currency (the renminbi) to a basket of currencies instead of just the U.S. dollar had significant global repercussions — especially given the implications for a potential rebalancing of global trade and uncertainty about potential future actions. The renminbi was set for addition to the International Monetary Fund’s special drawing rights (“SDR”) currency basket immediately following the end of the reporting period.
Market developments
Risk assets advanced from the start of the fiscal year following severe declines in summer 2015, when China moderately devalued its currency. As 2015 came to a close, the questionable health of U.S. energy companies (which was caused by a persistent multi-year oil-price decline) raised concerns among high-yield bond investors. This resulted in a selloff that likely discouraged investor risk appetite, keeping a lid on performance at year end. The beginning of 2016 was marked by a global flight to quality, benefitting safe-haven assets and driving risk assets to their low points for the period.
A trend reversal took place in mid-February, with risk assets rallying into April, followed by mixed performance until late June. The price of oil (and commodities in general) also advanced sharply from mid-February into June. The Brexit vote caused a major spike in global stock-market volatility, yields were driven downward to record levels on perceived safe-haven investments like developed-market government bonds, and the currencies at the center of the developments — sterling and the euro — weakened substantially relative to the U.S. dollar and yen. Most of the stock-market losses, however, were recovered within a week’s time. A general sideways trend defined the last few months of the period, barring a selloff in anticipation of the Fed’s September policy announcement, which was followed by a recovery.
The U.S. dollar ended the fiscal year 2.5% lower against a trade-weighted basket of major currencies, having been as much as 3.75% higher in late January, and 5% lower in early May. The dollar finished the reporting period about 0.8% higher versus a broad trade-weighted basket, however, with advances and declines that mirrored those against major currencies.
Second-quarter 2016 earnings declined for companies in the S&P 500 Index; although a large majority fared better than analysts’ late-quarter average estimates. The consumer discretionary sector delivered the highest year-over-year earnings growth for the second quarter, while the energy sector continued to lag with deep losses.
2 |
SEI Institutional International Trust / Annual Report / September 30, 2016 |
For the full reporting period, the MSCI All-Country World Index, a proxy for global equities, advanced 11.96% in U.S. dollar terms. The MSCI All-Country World ex USA Index rose by 9.26%, less than its U.S.-inclusive counterpart. Emerging-market equity returns were elevated in U.S. dollar terms amid a broad rebound, with the MSCI Emerging Markets Index increasing by 16.78%.
U.S. equity returns were strong; the S&P 500 Index returned 15.43% during the fiscal year. U.S. large caps (represented by the Russell 1000 Index) lagged small caps (represented by the Russell 2000 Index) by a bit, returning 14.93% and 15.47%, respectively. While U.S. large-cap performance trailed U.S. small caps and emerging markets over the one-year period, their outperformance relative to these equity markets as well as those in Europe, Japan and globally remained intact when annualized over three, five and ten years through the end of the reporting period.
Technology and materials were among the best-performing sectors in the U.S. and globally. Industrials rounded out the top three worldwide, while telecommunications matched technology’s top performance in the U.S. The poorest-performing sectors were identical both globally and within the U.S.: financials were universally the worst (the only global sector to produce a loss, and were positive in the U.S.), followed by healthcare and consumer discretionary.
Global fixed income, as measured by the Bloomberg Barclays Global Aggregate Bond Index, advanced 8.83% in U.S. dollar terms during the fiscal year. Interest rates generally declined during the reporting period, as major central banks outside of the U.S. guided benchmark rates downward (into negative territory in some cases) and expanded their asset-purchase programs.
U.S. Treasurys generally performed well as the yield curve flattened (bond yields move inversely to prices) and rates fell across most maturities, with only the yields on Treasurys with maturities shorter than three years increasing during the full reporting period.
U.S. investment-grade corporate debt performed well, but was outpaced by the high-yield market. The BofA Merrill Lynch US High Yield Constrained Index increased by 12.82% during the full fiscal year. Mortgage- and asset-backed securities also delivered positive returns during the reporting period.
Emerging-market debt delivered strong returns universally. The J.P. Morgan GBI Emerging Markets Global Diversified Index, which tracks local-currency-denominated emerging-market bonds, increased by 17.06% in U.S. dollar terms during the reporting period. The J.P. Morgan EMBI Global Diversified Index, which tracks emerging-market debt denominated in external currencies (such as the U.S. dollar), advanced by 16.20%.
A combination of subdued inflation and dollar strength began to ease during the reporting period, reducing headwinds to the performance of inflation-sensitive assets such as Treasury inflation-protected securities and commodities. The former outpaced comparable Treasurys over the full period, while the latter — which had dropped by almost 20% through mid-February, according to the TR/CC CRB Commodities Total Return Index — staged a steep recovery to end the fiscal year with a 3.6% decline.
Our view
There are many things over which investors can lose sleep, but as long as central banks pursue aggressively easy policies in a world mostly characterized by slow economic growth and mild inflation pressures, we expect any pullback in the price of riskier assets would be limited.
In general (and especially as it pertains to the U.S.), we continue to view equity-market corrections as buy-on-the-dip opportunities. One reason for maintaining this point of view is our belief that the U.S. economy is on fairly solid ground. It’s true that growth in overall business activity continues to disappoint, but household finances are in good shape as a result of expanding employment and incomes as well as the bull market in stocks, bonds and home values. There is little reason to expect a serious slowing in consumer spending.
We also expect the change in business inventories — the most volatile part of gross domestic product (“GDP”), which has slowed in recent quarters — to rebound in the quarters ahead, supporting a reacceleration in overall U.S. GDP into the 2.5%-to-3.0% range.
Our main concern for the U.S. is weakness in business investment, which has negative implications for productivity. Slowing labor productivity growth and an acceleration in labor compensation growth is a bad combination. Since
SEI Institutional International Trust / Annual Report / September 30, 2016 |
3 |
LETTER TO SHAREHOLDERS (Concluded)
September 30, 2016 (Unaudited)
companies have been unable to raise prices sufficiently, the downward pressure on profit margins appears chronic. As this pressure intensifies, we expect companies will become more aggressive in their attempts to push through price increases.
This uptick in inflation, combined with the tightening labor market and slow-but-steady pace of economic growth, seems to have tipped the balance in favor of a hike in the federal funds rate, probably in December. At their latest meeting, Fed policymakers finally conceded that interest-rate normalization will take years to accomplish, leaving little room to cut rates aggressively in the event of a recession. Investors remain skeptical that the central bank will even achieve its stated objective of pushing its policy rate to the upside. As a result, risk assets should continue to be well supported. Although equity valuations remain elevated, they still appear reasonable relative to those of high-quality bonds.
With regard to the U.K., many observers have been surprised by the resiliency of its economy, although it is way too soon to sound the all-clear. The BOE has pre-emptively cut its base rate to the lowest level in the multi-century history of the central bank, and restarted its quantitative-easing program and previously successful funding-for-lending scheme. On the fiscal policy side, the new Chancellor of the Exchequer scrapped his predecessor’s austerity plans and is expected to introduce a new budget that abandons any notion of achieving a budgetary surplus by the end of the current parliament. In all, U.K. economic policy has shifted dramatically toward easing well before the negative effects of Brexit can be felt. However, while no one knows what a final Brexit agreement will look like, we suspect it will be nowhere near the position being pushed forward by various U.K. leaders. Given this uncertainty, we think investment is likely to slow in the months ahead.
Eurozone exports and imports are in decline. Household spending is growing faster than other areas of the economy, as is the case in the U.S. and the U.K., but Europe’s consumer rebound remains considerably less robust in comparison with these two countries. Although the labor market has certainly improved over the past three years, the country-by-country levels remain wildly disparate. This is especially so for the youth unemployment rate.
We’re concerned that it’s just a matter of time before another crisis tests the cohesion of the eurozone. ECB President Draghi knows he has a potential problem on his hands. He continues to reassure investors that the central bank has the will, the tools and the ability to improve the eurozone’s fortunes.
The Japanese economy still lacks momentum despite fiscal stimulus packages, structural reforms and extremely aggressive monetary-policy initiatives. Industrial output has trended lower over the past three years, hurt by the slowdown in global trade, and although the country’s merchandise trade balance has turned positive, this is merely the result of imports falling faster than exports.
On the positive side, housing construction is running near a cyclical high. The unemployment rate, which is structurally much lower than in other developed countries, dipped to 3.1%. Nominal wage increases remain stuck near zero, however, and inflation expectations have been nearly impossible to nudge to the upside. Our Asia-focused portfolio managers are heartened by improvements in corporate governance and the use of capital. Additionally, the latest fiscal-policy initiative is a significant one, with new spending amounting to ¥7.5 trillion. In the current fiscal year, stimulus is expected to reach 4.5% of GDP.
We think China’s economy will continue to reaccelerate in the near term. Although the country’s growth rate remains below trend, we are beginning to see an improving trajectory following two-and-a-half years of slowdown. The renminbi has depreciated steadily in the year to date, falling 7% against a basket of currencies and less than 3% against the greenback. While the depreciation of the renminbi has not reinvigorated exports, it appears to have stopped its two-year decline. Domestic economic growth in China has been relatively stable this year, with retail sales growing around 10% on a year-over-year basis and industrial output running at a 6% rate. Importantly, the country continues to evolve into a services-oriented economy, with that sector now accounting for more than half of GDP. Housing activity also has picked up. The question now becomes whether government economic policy flips back toward structural reform and economic rationalization and away from stimulus, given that business activity looks to be in a less fragile state than a year ago.
Before the global financial crisis, the U.S. and China were the primary growth engines of the world. Those engines are sputtering when compared to their pre-crisis performance. We think it’s possible that India eventually will become a third major engine of global growth. In the past year, its GDP growth was greater than China’s. While its
4 |
SEI Institutional International Trust / Annual Report / September 30, 2016 |
population is nearly as large, India is growing faster and is much younger. As India institutes economic, financial and legal reforms, it has the potential to grow rapidly for a long time.
On behalf of SEI Investments, I want to thank you for your continued confidence. We are working every day to maintain that confidence, and we look forward to serving your investment needs in the future.
Sincerely,

William T. Lawrence, CFA
Managing Director, Portfolio Management Team
SEI Institutional International Trust / Annual Report / September 30, 2016 |
5 |
MANAGEMENT’S DISCUSSION AND ANALYSIS OF FUND PERFORMANCE
September 30, 2016 (Unaudited)
International Equity Fund
I. Objective
The International Equity Fund (the “Fund”) seeks to provide long-term capital appreciation.
II. Multi-Manager Approach Statement
The Fund uses a multi-manager approach, relying on a number of sub-advisers with differing investment approaches to manage portions of the Fund’s portfolio, under the general supervision of SEI Investments Management Corporation (“SIMC”). The Fund utilized the following sub-advisers as of September 30, 2016: Acadian Asset Management LLC, Blackcrane Capital, LLC, Causeway Capital Management LLC, Henderson Global Investors (North America) Inc., INTECH Investment Management LLC, Neuberger Berman Investment Advisers LLC, Tradewinds Global Investors LLC, NWQ Investment Management Company, LLC, and WCM Investment Management. For the year ended September 30, 2016, sub-adviser Tradewinds Global Investors LLC was terminated from the Fund. The Tradewinds investment team migrated to NWQ Investment Management Company, LLC, which was then added to the Fund during the year.
III. Return vs. Benchmark
For the year ended September 30, 2016, the Fund’s Class A shares underperformed the MSCI EAFE Index (the “Index”), returning 5.63% versus the Index return of 6.52%.
IV. Fund Attribution
At the sector level, the Fund benefited from allocation while stock selection detracted. Selection was negative in industrials, materials, utilities and consumer staples, but helped in consumer discretionary due to holdings in retail and automobiles. An underweight to consumer staples had a negative impact as the sector - despite elevated valuations - continued to perform relatively well throughout the reporting period. On the back of a commodity-market recovery, as noted in the shareholder letter, materials was the best-performing sector for the period, followed closely by information technology. Hence, an overweight to and selection within information technology helped. An underweight to the troubled banking sector, which continues to suffer from low yields that hurt profitability, also benefited results. From an absolute point of view, financials was the overall laggard. While an overweight to industrials was positive, selection within the sector was disappointing, so the sector detracted as a whole. Defensive sectors such as telecommunications and utilities lagged slightly. Within
the Fund, selection in telecommunications added at the margin, while detracting slightly within utilities.
Regionally, the Fund was helped by selection, while country allocation detracted. The strongest results were achieved in Europe and the Middle East, led by France, and followed by the Netherlands, Italy and Germany, while selection detracted in Belgium and Portugal. The positives and negatives both mixed core and peripheral countries, so the result was due more to stock-specific outcomes rather than top-down calls. Selection in Japan also contributed, although an underweight to the country detracted. Supported by a strong yen, as the shareholder letter addressed, the country actually ended up outperforming the broader Index. An underweight to Pacific ex-Japan also hurt as the region posted the strongest overall results, driven by returns in New Zealand, Australia and Hong Kong. The U.K. was the weakest part of the benchmark; volatility spiked along with the surprising Brexit vote. The main culprits were an underweight to and selection within the materials sector, as well as poorly performing financial-sector holdings. As an asset class, emerging markets performed well during the period, outperforming its developed-markets peers. As a result, exposure to emerging markets in aggregate was positive. With regard to the Fund, the strongest contribution came from emerging Asia, particularly China, Taiwan and Korea, followed by emerging Europe and Africa, while the Fund’s holdings in Latin America detracted.
Manager performance was mixed. WCM Investment Management benefited from selection in emerging Asia, led by Taiwan, and followed by China, the U.K., Japan and Europe ex-U.K. Acadian Asset Management LLC’s quantitative model performed well in Europe and also added through holdings in emerging Asia. Neuberger Berman Management LLC had strong selection in Europe and Japan, with the most significant contributions from France and Switzerland, while the U.K. detracted. Henderson Global Investors (North America) was challenged within Europe and by holdings in Pacific ex-Japan, and via international holdings listed in the U.S. Japan was a bright spot, but could not overcome weakness in other parts of the portfolio. Causeway Capital Management LLC’s value-sensitive style was also not rewarded; its holdings in the U.K. performed poorly and its underweight to and selection within Pacific ex-Japan detracted as well. Selection in Korea contributed, but only partially mitigated overall results. Blackcrane Capital, LLC was primarily hurt by selection in emerging Asia. NWQ delivered strong results in Europe, but the U.K. was a detractor, as was an underweight to
6 |
SEI Institutional International Trust / Annual Report / September 30, 2016 |
Pacific ex-Japan. INTECH Investment Management LLC’s mathematical model produced benchmark-like results, with the U.K. detracting while Europe performed well.
AVERAGE ANNUAL TOTAL RETURN1
1 Year Return | Annualized 3 Year Return | Annualized 5 Year Return | Annualized 10 Year Return | Annualized Inception to Date | ||||||||||||||||
| International Equity Fund, Class A | 5.63% | 0.98% | 7.32% | -0.52% | 3.24% | |||||||||||||||
| International Equity Fund, Class I | 5.27% | 0.68% | 7.00% | -0.77% | 2.98% | |||||||||||||||
| International Equity Fund, Class Y | 5.77% | 1.09% | 7.39% | -0.48% | 3.25% | |||||||||||||||
| MSCI EAFE Index | 6.52% | 0.47% | 7.39% | 1.82% | 4.15% | |||||||||||||||
Comparison of Change in the Value of a $100,000 Investment in the International Equity Fund, Class A, Class I and Class Y, versus the MSCI EAFE Index
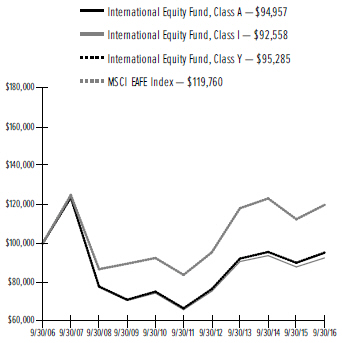
| ¹ | For the year ended September 30, 2016. Past performance is no indication of future performance. Class A shares were offered beginning December 20, 1989. Class I shares were offered beginning January 4, 2002. The performance of Class I shares prior to January 4, 2002 is calculated using the performance of Class A shares adjusted for the higher expenses of the Class I shares. Returns for Class I shares are substantially similar to those of Class A shares and differ only to the extent that Class I shares have higher total annual fund operating expenses than Class A shares. Class Y shares were offered beginning December 31, 2014. Class Y shares performance for the period prior to December 31, 2014 derived from the performance of Class A shares. Returns for Class Y shares are substantially similar to those of Class A shares and differ only to the extent that Class Y shares have lower total annual fund operating expenses than Class A shares. Returns shown do not reflect the deduction of taxes that a shareholder would pay on fund distributions or the redemption of fund shares. The returns for the period reflect fee waivers and/or reimbursements in effect for the period; absent fee waivers and reimbursements, performance would have been lower. |
SEI Institutional International Trust / Annual Report / September 30, 2016 |
7 |
MANAGEMENT’S DISCUSSION AND ANALYSIS OF FUND PERFORMANCE
September 30, 2016 (Unaudited)
Emerging Market Equity Fund
I. Objective
The Emerging Markets Equity Fund (the “Fund”) seeks to provide capital appreciation.
II. Multi-Manager Approach Statement
The Fund uses a multi-manager approach, relying on a number of sub-advisers with differing investment approaches to manage portions of the Fund’s portfolio, under the general supervision of SEI Investments Management Corp. (“SIMC”). The Fund utilized the following sub-advisers during the year ending September 30, 2016: Delaware Investment Fund Advisers, a series of Delaware Management Business Trust, J O Hambro Capital Management Limited, Kleinwort Benson Investors International Ltd, Lazard Asset Management LLC, Neuberger Berman Investment Advisers LLC, PanAgora Asset Management, Inc. and RWC Asset Advisors (US) LLC. For the year ended September 30, 2016, no manager changes were made.
III. Return vs. Benchmark
For the year ended September 30, 2016, the Fund’s Class A shares outperformed the MSCI Emerging Markets Index (Gross) (the “Index”), returning 20.66% versus the Index return of 17.21%.
IV. Fund Attribution
Emerging markets staged a broad comeback, as noted in the shareholder letter, and all sectors returned positive results during the Fund’s fiscal year. Information technology delivered the strongest performance followed by cyclical sectors energy and materials, while defensive sectors such as telecommunications and healthcare lagged. The Fund delivered strong overall stock selection, principally within information technology, followed by financials, consumer discretionary, energy, materials, real estate and telecommunications. Selection in utilities detracted, while consumer staples and healthcare produced benchmark-like results. Within information technology, our Chinese holdings in technology equipment and hardware, as well as software and services, performed strongly. Throughout the reporting period MSCI added numerous U.S.-listed American Depository Receipts (ADRs) to the benchmark, which boosted the performance of several of those stocks. Korea’s software and services stocks also performed strongly. A Russian internet stock that is listed in Europe also added to the sector’s positive results. While the financial sector overall performed slightly behind the benchmark, the Fund benefited from an underweight to the Chinese and Greek banking
sectors; however, an underweight to the Indian financial sector and selection within financials detracted. Within consumer discretionary, the Fund benefited from numerous holdings in China, India and Korea. Stocks in Brazil performed strongly in absolute terms but still lagged the benchmark, and selection detracted. An overweight to the Brazilian consumer sectors, however, was positive. Utilities overall detracted, so an underweight to the Brazilian utilities sector was positive.
Regionally, the Fund’s outperformance came mainly from selection, while allocation had a minor positive impact. The strongest contribution came from emerging Asia, led by strong results in China, followed by the more developed markets of Korea and Taiwan. India also produced positive selection, although a country-level underweight mitigated the benefit. From an absolute point of view, Indonesia was a strong-performing country, but was a slight negative for the Fund’s results. Latin America experienced a strong turnaround, hence our overweight to the region was a positive. The Fund benefited from an overweight to Brazil, good selection in Brazil and Mexico, exposure to Peru and a position in frontier market Argentina. Our underweight to the Europe, Middle East and Africa (EMEA) region helped as it overall lagged other parts of the asset class. Overall, the Fund benefited from good selection in Russia and underweights to Poland, Greece and Qatar. Exposure to Saudi Arabia, on the other hand, detracted. Stocks related to emerging markets, but listed in Canada, also added to results.
Fund manager results were generally positive. Delaware Investment Fund Advisers, a series of Delaware Management Business Trust, added the most, attributable to strong selection across the emerging-markets universe and an overweight to Latin America. In emerging Asia, holdings in China and India outperformed their respective benchmark components, while Korea’s holdings slightly lagged. In Latin America, the strongest contribution came from an overweight to and selection within Brazil. Neuberger Berman Management LLC’s positive results can be explained primarily by strong results in China, Korea and Taiwan, while Latin America (particularly Brazil) detracted slightly. RWC Asset Advisors (US) LLC fared well primarily in China, Korea, Brazil and Argentina. The manager also benefited from Canadian listings related to emerging markets. EMEA detracted slightly, particularly via holdings in the Greek banking sector and exposure to Saudi Arabia. J O Hambro Capital Management Limited showed strength in selection within emerging Asia and EMEA, while some holdings in Brazil lagged. Lazard Asset Management
8 |
SEI Institutional International Trust / Annual Report / September 30, 2016 |
LLC’s strategy delivered good results in EMEA, in particular via Russian holdings, and Latin America. PanAgora Asset Management Inc.’s model added value in emerging Asia, but struggled in EMEA and Latin America. Kleinwort Benson Investors International Ltd lagged the benchmark slightly due to weakness in emerging Asia, which was partially offset by positive results out of Latin America.
AVERAGE ANNUAL TOTAL RETURN1
1 Year Return | Annualized 3 Year Return | Annualized 5 Year Return | Annualized 10 Year Return | Annualized Inception to Date | ||||||||||||||||
| Emerging Markets Equity Fund, Class A | 20.66% | -0.62% | 2.97% | 2.35% | 4.12% | |||||||||||||||
| Emerging Markets Equity Fund, Class Y | 20.95% | -0.46% | 3.07% | 2.40% | 4.14% | |||||||||||||||
| MSCI Emerging Markets Index (Gross) | 17.21% | -0.21% | 3.39% | 4.28% | 5.77% | |||||||||||||||
Comparison of Change in the Value of a $100,000 Investment in the Emerging Markets Equity Fund, Class A and Class Y, versus the S&P 500 Index and the MSCI Emerging Markets Index (Gross)
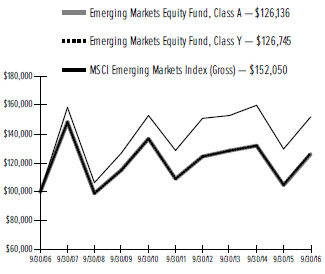
| ¹ | For the year ended September 30, 2016. Past performance is no indication of future performance. Class A shares were offered beginning January 17, 1995. Class Y shares were offered beginning December 31, 2014. Class Y shares performance for the period prior to December 31, 2014 derived from the performance of Class A shares. Returns for Class Y shares are substantially similar to those of Class A shares and differ only to the extent that Class Y shares have lower total annual fund operating expenses than Class A shares. Returns shown do not reflect the deduction of taxes that a shareholder would pay on fund distributions or the redemption of fund shares. The returns for the period reflect fee waivers and/or reimbursements in effect for the period; absent fee waivers and reimbursements, performance would have been lower. |
SEI Institutional International Trust / Annual Report / September 30, 2016 |
9 |
MANAGEMENT’S DISCUSSION AND ANALYSIS OF FUND PERFORMANCE
September 30, 2016 (Unaudited)
International Fixed Income Fund
I. Objective
The International Fixed Income Fund (the “Fund”) seeks to provide capital appreciation and current income.
II. Multi-Manager Approach Statement
The Fund uses a multi-manager approach, relying on a number of sub-advisers with differing investment approaches to manage portions of the Fund’s portfolio, under the general supervision of SEI Investments Management Corporation (“SIMC”). The Fund utilized the following sub-advisers during the year ending September 30, 2016: AllianceBernstein, L.P., FIL Investment Advisors and Wellington Management Company LLP. For the year ended September 30, 2016, no manager changes were made.
III. Return vs. Benchmark
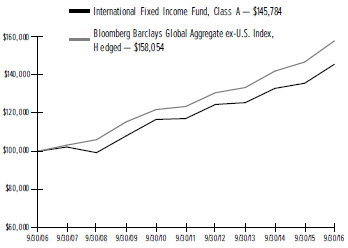
For the year ended September 30, 2016, the Fund’s Class A shares underperformed the Bloomberg Barclays Global Aggregate ex-US Index, Hedged (the “Index”), returning 7.32% versus the Index return of 7.53%.
IV. Fund Attribution
During the Fund’s fiscal year, accommodative policies from global central banks continued to dominate market themes, as the shareholder letter addressed, with the European Central Bank (ECB) expanding its quantitative-easing (QE) program to include corporate bonds. Lower global-growth expectations after China reset its growth profile and the rise of nationalism and protectionism increasing political risks were some of the key market concerns.
From a performance perspective, the Fund’s overall short-duration positions in sovereign bonds detracted, as government yields ended the year lower in the flight-to-quality environment. However, the overweight allocation to credit, especially in investment-grade and high-yield corporates, helped, as the new policies of including corporate purchases in the ECB’s and Bank of England’s QE made credit spreads tighten significantly. From a currency perspective, an underweight to U.K. Sterling (GBP) added value amid the Brexit outcome, but an overweight to the Japanese yen (JPY) detracted as investors lost faith in the Bank of Japan’s efforts to boost the economy.
From the sub-adviser perspective, Wellington Management Company LLP underperformed while FIL Investment Advisors and AllianceBernstein, L.P.outperformed. In the case of Wellington Management Company LLP, exposure to interest-rate risk detracted.
AllianceBernstein, L.P.’s outperformance can be attributed to its exposure to interest-rate risk, which worked well in a period when government yields ended lower. FIL Investment Advisors’ outperformance can be attributed to its exposure to interest-rate risk and yield-curve positioning.
The Fund used financial futures, interest-rate swaps and over-the-counter options during the reporting period to hedge existing exposures and gain exposure to particular areas of the market. Financial futures, especially European and euro-denominated futures, added value. However, interest-rate swaps detracted value, particularly Euro and GBP-denominated swaps, although this was offset by JPY-denominated swaps. Over-the-counter options had minimal impact on performance.
AVERAGE ANNUAL TOTAL RETURN1
1 Year Return | Annualized 3 Year Return | Annualized 5 Year Return | Annualized 10 Year Return | Annualized Inception to Date | ||||||||||||||||
| International Fixed Income Fund, Class A† | 7.32% | 5.08% | 4.45% | 3.84% | 4.52% | |||||||||||||||
| International Fixed Income Fund, Class Y† | N/A | N/A | N/A | N/A | 6.79%* | |||||||||||||||
| Bloomberg Barclays Global Aggregate ex-U.S. Index, Hedged | 7.53% | 5.78% | 5.04% | 4.68% | 5.94% | |||||||||||||||
Comparison of Change in the Value of a $100,000 Investment in the International Fixed Income Fund, Class A versus the Bloomberg Barclays Global Aggregate ex-US Index, Hedged
| ¹ | For the year ended September 30, 2016. Past performance is no indication of future performance. Class A shares were offered beginning September 1, |
10 |
SEI Institutional International Trust / Annual Report / September 30, 2016 |
| 1993. Class Y shares were offered beginning October 30, 2015 and therefore do not have performance history for a full year. Returns shown do not reflect the deduction of taxes that a shareholder would pay on fund distributions or the redemption of fund shares. The returns for the period reflect fee waivers and/or reimbursements in effect for the period; absent fee waivers and reimbursements, performance would have been lower. |
| † | The graph is based on only Class A shares. Returns for Class Y shares are substantially similar to those of Class A shares and differ only to the extent that Class Y shares have lower total annual fund operating expenses than Class A shares. |
| * | Cumulative inception to date as of October 30, 2015. |
N/A — Not Available
SEI Institutional International Trust / Annual Report / September 30, 2016 |
11 |
MANAGEMENT’S DISCUSSION AND ANALYSIS OF FUND PERFORMANCE
September 30, 2016 (Unaudited)
Emerging Markets Debt Fund
I. Objective
The Emerging Markets Debt Fund (the “Fund”) seeks to maximize total return.
II. Multi-Manager Approach
The Fund uses a multi-manager approach, relying on a number of sub-advisers with differing investment approaches to manage portions of the Fund’s portfolio, under the general supervision of SEI Investments Management Corp. (“SIMC”). The Fund utilized the following sub-advisers during the year ending September 30, 2016: Investec Asset Management Ltd., Neuberger Berman Investment Advisers LLC and Stone Harbor Investment Partners LP. For the year ended September 30, 2016, no manager changes were made.
III. Return vs. Benchmark
For the year ended September 30, 2016, the Fund’s Class A shares underperformed a hybrid of 50% J.P. Morgan EMBI Global Diversified Index and 50% J.P. Morgan GBI-EM Global Diversified (the “Index”), returning 16.40% versus the Index return of 16.75%.
IV. Fund Attribution
The year ended September 30, 2016 is a tale of two markets. The fourth quarter of 2015 was a continuation of several macro themes that had persisted throughout the prior year. Commodity prices (namely oil) continued to fall over the quarter, as the shareholder letter addressed, with Brent crude-oil prices beginning near $49 and ending the quarter near $37. This had a negative effect on emerging markets, as many rely on commodities and energy exports for revenues (Russia, Mexico, Brazil, and Venezuela, among others). The threat of a U.S. interest-rate hike which was finally realized at the Federal Reserve’s (Fed) December meeting also hurt emerging markets, as higher rates in the U.S. ignited a flight to safety for investors seeking better-yielding investments without the risks of emerging-market countries. Finally, all of these factors converged to weaken a majority of emerging-market currencies versus the U.S. dollar.
With the New Year came a change of the tide for emerging-markets debt. Brent crude-oil prices bottomed out around $28 in mid-January before climbing back over the next eight months to end the period back near $49. Other commodity prices also rose over this period, lifting emerging markets along with them. The threat of further U.S. interest-rate hikes appeared several times in the first three quarters of 2016, but each instance
passed with the Fed holding rates steady. This boosted emerging markets; with some developed-market countries’ interest rates having negative yields on bonds with maturities of 10 or more years, investors flowed back into emerging markets in a search for yield. In fact, the third quarter of 2016 alone saw $26 billion of inflows to hard-currency emerging-market debt, nearly tripling the total year-to-date inflows. One final macroeconomic event came when Great Britain surprised the world with its decision to leave the European Union. This affected countries across the emerging-market landscape, especially local-currency emerging-market debt, but did not have as large an impact as was originally expected. Overall, the macroeconomic landscape (most importantly, the rebound in oil prices and lack of further U.S. rate hikes) led to a majority of currencies strengthening over the first three quarters of 2016. Toward the end of the third quarter, the U.S. election began creeping into the picture. The increasing chances of a Donald Trump presidency hurt emerging-market countries due to Trump’s isolationist views (such as his desire to “kill” NAFTA, among other trade deals) which would adversely affect U.S. trading partners.
For the entire 12-month period ending September 30, 2016, both halves of the index performed well, especially compared to the previous year. The external-debt portion of the benchmark was up over 16% and the local-debt portion was up over 17%. In the external-debt portion, Venezuela was up almost 79%, Argentina advanced 35.5% and Brazil and Indonesia each rose 22.5%; only Belize had a negative return over the period, but it is the smallest-weighted country in the hard-currency index, representing only 0.07% of the total. In the local portion, Brazil was the top performer, returning almost 56.5%, with Indonesia advancing 42%, Russia increasing 26.5% and Colombia rising 22.25%. Only Mexico was down by 7% in the index as its currency, the peso, suffered as a result of investors using it as a proxy for emerging-market risk as a whole due to its relative liquidity to other emerging-market currencies, as well as the increasing possibility of a Trump presidency in the U.S. as the third quarter came to a close. In terms of currencies, Brazil’s real strengthened more than 21% relative to the U.S. dollar and Indonesia’s rupiah strengthened more than 13%, while the Mexican peso weakened 12.5%.
There were several idiosyncratic single-country stories that also affected markets over the period. In November 2015, Argentina elected Mauricio Macri, a conservative businessman who campaigned with the promise of reaching a deal with “holdout” creditors that had been
12 |
SEI Institutional International Trust / Annual Report / September 30, 2016 |
preventing the country from accessing global markets for 15 years. Macri kept his promise, reaching a deal with the holdouts and getting the country’s congress to approve the deal in March 2016. Argentina re-entered global markets in April 2016 with a $16.5 billion issuance (an emerging-market record at the time) that was almost three times oversubscribed.
Another big story at the beginning of 2016 was the scandal involving Petrobras, Brazil’s state-owned oil company, in which government officials allegedly received kickbacks for awarding contracts. As noted in the shareholder letter, this scandal reached the top of Brazil’s government, leading to the impeachment and eventual conviction and ejection of Brazilian president Dilma Rousseff in August. This news was well received, however, as new president Michel Temer is expected to bring a more fiscally conservative approach to the government, which should help to rein in the country’s fundamentals.
South Africa also experienced controversy in 2016 when President Jacob Zuma was accused of improperly using state funds, which deepened when he fired his well-liked finance minister and appointed a minister that was seen as under Zuma’s control. After markets reacted negatively to the newly installed finance minister, Zuma booted him and reinstated a man who had held the post during Zuma’s first five years as president, effectively giving South Africa three different finance ministers in the span on a single week.
Colombia had positive news in the third quarter when its government neared an agreement to end a decades-long war with the Revolutionary Armed Forces of Colombia (FARC) guerilla rebels. The deal was finalized in September, boosting the country’s outlook at the end of the reporting period, but was rejected by popular vote in the fourth quarter.
Turkey faced a setback when the Erdogan government thwarted a coup attempt near the end of July. In addition to the failed coup’s resulting political instability, Turkey’s debt was downgraded to “junk” status by Moody’s in September, citing external funding requirements and weakening credit fundamentals.
Finally, Indonesia had several positive headlines throughout the period. On top of benefiting from the rebound in oil prices, the country’s central bank cut interest rates three times throughout the quarter. A fourth cut was expected in the third quarter but the central bank held rates steady, which strengthened the country’s currency.
The top contributors to the Fund over the period were overweights to and selection within Indonesian local-currency debt, an overweight to Argentinian external debt (two of our three managers participated in the country’s bond sale in April), an overweight to Russian local debt and selection within Brazilian local debt and an overweight to Brazil’s external debt.
The top detractors to the Fund over the period were selection in external Turkish debt, selection in Colombia’s local and external debt and an underweight to South African local debt, combined with selection in the country’s external debt.
Neuberger Berman Investment Advisers LLC was the top-contributing manager, due primarily to positioning in Brazil, Indonesia and Argentina, which was partially offset by exposures to Colombia, Turkey and Venezuela. Stone Harbor Investment Partners LP also contributed on the merits of positioning in Venezuela, Indonesia and Russia, despite being held back in part by Mexican, South African and Polish exposures. Investec Asset Management Ltd. detracted due to positioning in Brazil, Mexico and South Africa, which was partially mitigated by exposures in Poland, Indonesia and Thailand.
Currency forwards and swap contracts were used in the Fund for the one-year period ending September 30, 2016 as a way to either hedge particular positions or gain exposure to additional areas of the market. Foreign-exchange (FX) hedges on local-currency bonds generally contributed to performance.
AVERAGE ANNUAL TOTAL RETURN1
| 1 Year Return | Annualized 3 Year Return | Annualized 5 Year Return | Annualized 10 Year Return | Annualized Inception to Date | ||||||||||||||||
| Emerging Markets Debt Fund, Class A | 16.40% | 0.92% | 2.92% | 5.30% | 8.30% | |||||||||||||||
| Emerging Markets Debt Fund, Class Y | 16.72% | 1.07% | 3.01% | 5.35% | 8.32% | |||||||||||||||
| J.P. Morgan EMBI Global Diversified Index | 16.20% | 8.19% | 7.75% | 7.73% | 8.97% | |||||||||||||||
| J.P. Morgan GBI-EM Global Diversified Index | 17.06% | -2.58% | 0.06% | 5.52% | N/A | |||||||||||||||
| 50/50 Hybrid of the J.P. Morgan EMBI Global Diversified Index and the J.P. Morgan GBI-EM Global Diversified Index | 16.75% | 2.75% | 3.91% | 6.70% | N/A | |||||||||||||||
SEI Institutional International Trust / Annual Report / September 30, 2016 |
13 |
MANAGEMENT’S DISCUSSION AND ANALYSIS OF FUND PERFORMANCE
September 30, 2016 (Unaudited)
Emerging Markets Debt Fund (Concluded)
Comparison of Change in the Value of a $100,000 Investment in the Emerging Markets Debt Fund, Class A and Class Y, versus a 50/50 Hybrid of the Following Indexes: the J.P. Morgan EMBI Global Diversified Index and the J.P. Morgan GBI-EM Global Diversified Index
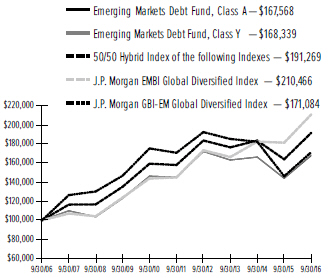
| ¹ | For the year ended September 30, 2016. Past performance is no indication of future performance. Class A shares were offered beginning June 26, 1997. Class Y shares were offered beginning December 31, 2014. Class Y shares performance for the period prior to December 31, 2014 derived from the performance of Class A shares. Returns for Class Y shares are substantially similar to those of Class A shares and differ only to the extent that Class Y shares have lower total annual fund operating expenses than Class A shares. Returns shown do not reflect the deduction of taxes that a shareholder would pay on fund distributions or the redemption of fund shares. The returns for the period reflect fee waivers and/or reimbursements in effect for the period; absent fee waivers and reimbursements, performance would have been lower. |
N/A — Not Available.
14 |
SEI Institutional International Trust / Annual Report / September 30, 2016 |
September 30, 2016
International Equity Fund
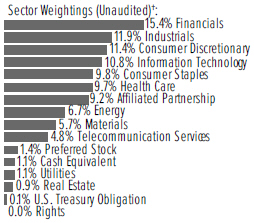
†Percentages based on total investments. Includes investments held as collateral for securities on loan (see Note 9).
| Description | Shares | Market Value ($ Thousands) | ||||||
COMMON STOCK — 94.2% | ||||||||
Argentina — 0.0% | ||||||||
Ternium ADR | 23,969 | $ | 470 | |||||
|
|
| ||||||
Australia — 2.1% | ||||||||
AGL Energy | 47,298 | 693 | ||||||
Alumina | 147,971 | 167 | ||||||
APA Group | 22,405 | 147 | ||||||
Aristocrat Leisure | 300,106 | 3,662 | ||||||
Australian Stock Exchange | 16,515 | 613 | ||||||
BlueScope Steel | 77,109 | 462 | ||||||
Brambles | 179,103 | 1,656 | ||||||
Caltex Australia | 20,574 | 545 | ||||||
Challenger | 74,453 | 587 | ||||||
CIMIC Group | 16,152 | 357 | ||||||
Cochlear | 20,821 | 2,260 | ||||||
Commonwealth Bank of Australia | 84,555 | 4,735 | ||||||
CSL | 171,746 | 14,127 | ||||||
CSR | 263,582 | 737 | ||||||
Dexus Property Group ‡ | 83,487 | 586 | ||||||
Domino’s Pizza Enterprises | 8,959 | 487 | ||||||
Downer EDI | 267,999 | 1,117 | ||||||
Fortescue Metals Group | 229,826 | 883 | ||||||
Insurance Australia Group | 1,219,170 | 5,139 | ||||||
Macquarie Group | 19,229 | 1,220 | ||||||
Mineral Resources | 31,183 | 267 | ||||||
Newcrest Mining | 181,103 | 3,062 | ||||||
Northern Star Resources | 302,396 | 1,075 | ||||||
OZ Minerals | 295,659 | 1,389 | ||||||
Qantas Airways | 1,652,590 | 3,972 | ||||||
Ramsay Health Care | 10,063 | 614 | ||||||
REA Group | 6,419 | 279 | ||||||
Scentre Group ‡ | 216,787 | 784 | ||||||
Seek | 51,921 | 623 | ||||||
South32 | 1,919,311 | 3,540 | ||||||
Star Entertainment Grp | 154,008 | 714 | ||||||
TPG Telecom | 44,293 | 295 | ||||||
Transurban Group | 151,827 | 1,326 | ||||||
| Description | Shares | Market Value ($ Thousands) | ||||||
COMMON STOCK (continued) | ||||||||
Treasury Wine Estates | 106,696 | $ | 909 | |||||
Vicinity Centres ‡ | 154,042 | 375 | ||||||
Vocus Communications | 72,572 | 348 | ||||||
|
|
| ||||||
| 59,752 | ||||||||
|
|
| ||||||
Austria — 0.3% | ||||||||
ANDRITZ | 80,595 | 4,398 | ||||||
BUWOG *(A) | 5,363 | 145 | ||||||
Lenzing | 1,104 | 130 | ||||||
OMV (A) | 90,699 | 2,617 | ||||||
|
|
| ||||||
| 7,290 | ||||||||
|
|
| ||||||
Belgium — 1.8% | ||||||||
Ageas | 355,833 | 13,012 | ||||||
AGFA-Gevaert * | 70,231 | 222 | ||||||
Anheuser-Busch InBev | 8,756 | 1,148 | ||||||
Barco | 2,100 | 164 | ||||||
Bekaert | 19,586 | 895 | ||||||
Colruyt (A) | 30,008 | 1,665 | ||||||
Groupe Bruxelles Lambert | 92,721 | 8,234 | ||||||
KBC Group | 255,012 | 14,908 | ||||||
Ontex Group | 345,000 | 10,949 | ||||||
Umicore (A) | 15,059 | 945 | ||||||
|
|
| ||||||
| 52,142 | ||||||||
|
|
| ||||||
Brazil — 0.4% | ||||||||
Ambev ADR | 716,864 | 4,365 | ||||||
Cia Energetica de Minas Gerais | 237,782 | 616 | ||||||
Embraer * | 1,271,600 | 5,511 | ||||||
|
|
| ||||||
| 10,492 | ||||||||
|
|
| ||||||
Canada — 2.9% | ||||||||
Agrium | 61,134 | 5,544 | ||||||
Alacer Gold * | 131,900 | 329 | ||||||
Alimentation Couche-Tard, Cl B | 110,900 | 5,365 | ||||||
Cameco (A) | 526,948 | 4,511 | ||||||
Canadian Imperial Bank of | 71,200 | 5,511 | ||||||
Canadian Natural Resources | 249,716 | 8,001 | ||||||
Canadian Pacific Railway | 69,623 | 10,632 | ||||||
Centerra Gold | 59,400 | 325 | ||||||
CGI Group, Cl A * | 16,000 | 761 | ||||||
Cogeco Communications | 18,940 | 933 | ||||||
Constellation Software | 16,200 | 7,290 | ||||||
Encana | 458,100 | 4,779 | ||||||
Enerflex | 21,000 | 225 | ||||||
Entertainment One | 106,941 | 315 | ||||||
Gildan Activewear | 396,000 | 11,040 | ||||||
High Liner Foods | 9,000 | 178 | ||||||
Home Capital Group, Cl B (A) | 119,900 | 2,463 | ||||||
Linamar | 21,100 | 880 | ||||||
Lucara Diamond | 63,300 | 188 | ||||||
Magna International, Cl A | 89,100 | 3,818 | ||||||
Manulife Financial | 104,500 | 1,472 | ||||||
Peyto Exploration & Development (A) | 62,900 | 1,762 | ||||||
Rogers Sugar | 30,600 | 156 | ||||||
SEI Institutional International Trust / Annual Report / September 30, 2016 |
15 |
SCHEDULE OF INVESTMENTS
September 30, 2016
International Equity Fund (Continued)
��
| Description | Shares | Market Value ($ Thousands) | ||||||
COMMON STOCK (continued) | ||||||||
Royal Bank of Canada (A) | 96,200 | $ | 5,948 | |||||
Suncor Energy | 61,792 | 1,712 | ||||||
Toronto-Dominion Bank | 11,100 | 492 | ||||||
Yamana Gold (A) | 132,200 | 568 | ||||||
|
|
| ||||||
| 85,198 | ||||||||
|
|
| ||||||
China — 1.2% | ||||||||
Alibaba Group Holding ADR * | 51,100 | 5,406 | ||||||
Baidu ADR * | 78,900 | 14,366 | ||||||
Ctrip.com International ADR *(A) | 136,124 | 6,339 | ||||||
STMicroelectronics | 47,470 | 388 | ||||||
Tencent Holdings | 336,000 | 9,306 | ||||||
|
|
| ||||||
| 35,805 | ||||||||
|
|
| ||||||
Denmark — 2.2% | ||||||||
Chr Hansen Holding | 108,800 | 6,497 | ||||||
Coloplast, Cl B | 105,057 | 8,192 | ||||||
DSV | 4,851 | 243 | ||||||
Genmab * | 9,015 | 1,554 | ||||||
H Lundbeck * | 16,273 | 537 | ||||||
ISS (A) | 294,392 | 12,281 | ||||||
Nets *(B) | 154,700 | 3,451 | ||||||
Novo Nordisk ADR | 188,439 | 7,837 | ||||||
Novozymes, Cl B | 161,567 | 7,158 | ||||||
Pandora | 43,604 | 5,314 | ||||||
Scandinavian Tobacco Group (A)(B) | 282,956 | 4,826 | ||||||
Vestas Wind Systems | 67,271 | 5,589 | ||||||
William Demant Holding *(A) | 19,665 | 402 | ||||||
|
|
| ||||||
| 63,881 | ||||||||
|
|
| ||||||
Finland — 0.8% | ||||||||
Cargotec, Cl B (A) | 12,793 | 587 | ||||||
Elisa, Cl A (A) | 22,619 | 836 | ||||||
Fortum | 70,275 | 1,137 | ||||||
Kone, Cl B | 11,751 | 598 | ||||||
Metso (A) | 9,601 | 280 | ||||||
Neste | 185,231 | 7,910 | ||||||
Orion, Cl B | 61,183 | 2,414 | ||||||
Sampo, Cl A (A) | 29,975 | 1,336 | ||||||
Stora Enso, Cl R (A) | 420,845 | 3,744 | ||||||
UPM-Kymmene | 176,967 | 3,742 | ||||||
|
|
| ||||||
| 22,584 | ||||||||
|
|
| ||||||
France — 9.1% | ||||||||
ABC arbitrage (A) | 16,852 | 121 | ||||||
Air Liquide (A) | 29,500 | 3,167 | ||||||
Arkema | 57,272 | 5,306 | ||||||
Atos | 29,616 | 3,197 | ||||||
BNP Paribas | 305,784 | 15,744 | ||||||
Boiron | 1,900 | 193 | ||||||
Bureau Veritas | 5,924 | 127 | ||||||
Capgemini | 3,296 | 323 | ||||||
Carrefour | 390,922 | 10,151 | ||||||
Christian Dior | 10,029 | 1,800 | ||||||
Cie de St.-Gobain | 3,428 | 148 | ||||||
| Description | Shares | Market Value ($ Thousands) | ||||||
COMMON STOCK (continued) | ||||||||
CNP Assurances | 19,539 | $ | 328 | |||||
Dassault Systemes | 9,285 | 806 | ||||||
Edenred | 5,387 | 126 | ||||||
Eiffage | 4,116 | 320 | ||||||
Elior Group (A)(B) | 127,300 | 2,916 | ||||||
Engie (A) | 762,129 | 11,824 | ||||||
Essilor International | 68,254 | 8,808 | ||||||
Euler Hermes Group (A) | 13,620 | 1,161 | ||||||
Eurazeo | 1,943 | 113 | ||||||
Eurofins Scientific | 23,266 | 10,585 | ||||||
Fonciere Des Regions ‡ | 2,767 | 258 | ||||||
Gecina ‡ | 3,803 | 599 | ||||||
Hermes International | 14,012 | 5,710 | ||||||
Ipsen (A) | 30,854 | 2,169 | ||||||
IPSOS | 104,695 | 3,420 | ||||||
Legrand | 120,767 | 7,129 | ||||||
L’Oreal | 4,919 | 928 | ||||||
LVMH Moet Hennessy Louis Vuitton | 38,927 | 6,645 | ||||||
Nexans * | 9,391 | 540 | ||||||
Nexity * | 11,399 | 603 | ||||||
Nokia | 2,157,255 | 12,483 | ||||||
Orange | 795,893 | 12,464 | ||||||
Orpea | 48,255 | 4,281 | ||||||
Pernod Ricard (A) | 39,450 | 4,672 | ||||||
Peugeot * | 240,989 | 3,687 | ||||||
Publicis Groupe (A) | 151,688 | 11,484 | ||||||
Remy Cointreau (A) | 3,259 | 278 | ||||||
Renault | 8,488 | 698 | ||||||
Rexel | 77,897 | 1,195 | ||||||
Sanofi (A) | 277,062 | 21,098 | ||||||
Schneider Electric | 297,148 | 20,760 | ||||||
SCOR | 11,804 | 367 | ||||||
Societe BIC | 722 | 107 | ||||||
Sodexo | 36,172 | 4,310 | ||||||
SPIE (A) | 183,020 | 3,644 | ||||||
Technicolor | 98,632 | 673 | ||||||
Technip (A) | 8,357 | 514 | ||||||
Thales | 109,096 | 10,056 | ||||||
Total (A) | 703,782 | 33,368 | ||||||
UBISOFT Entertainment *(A) | 6,237 | 236 | ||||||
Valeo | 158,035 | 9,223 | ||||||
Veolia Environnement | 25,474 | 587 | ||||||
Vetoquinol | 569 | 28 | ||||||
Vinci | 17,378 | 1,331 | ||||||
Zodiac Aerospace | 2,636 | 64 | ||||||
|
|
| ||||||
| 262,873 | ||||||||
|
|
| ||||||
Germany — 5.8% | ||||||||
Adidas | 57,163 | 9,933 | ||||||
Allianz | 45,355 | 6,752 | ||||||
AURELIUS Equity Opportunities & KGaA | 11,818 | 748 | ||||||
BASF | 98,920 | 8,468 | ||||||
Brenntag | 62,857 | 3,439 | ||||||
16 |
SEI Institutional International Trust / Annual Report / September 30, 2016 |
| Description | Shares | Market Value ($ Thousands) | ||||||
COMMON STOCK (continued) | ||||||||
Continental | 34,392 | $ | 7,248 | |||||
Deutsche Boerse | 102,697 | 8,031 | ||||||
Deutsche EuroShop | 3,766 | 175 | ||||||
Deutsche Lufthansa (A) | 303,231 | 3,384 | ||||||
Deutsche Telekom | 34,216 | 575 | ||||||
Deutsche Wohnen | 46,576 | 1,698 | ||||||
Evonik Industries | 132,982 | 4,507 | ||||||
Fresenius | 17,951 | 1,439 | ||||||
Fresenius Medical Care | 7,458 | 653 | ||||||
GEA Group | 56,551 | 3,149 | ||||||
Gerresheimer | 50,899 | 4,331 | ||||||
Hannover Rueck | 47,113 | 5,053 | ||||||
HeidelbergCement | 10,875 | 1,031 | ||||||
Henkel | 4,200 | 490 | ||||||
Hochtief | 52,812 | 7,458 | ||||||
Indus Holding | 47,670 | 2,721 | ||||||
Infineon Technologies | 63,691 | 1,139 | ||||||
Kloeckner * | 76,510 | 932 | ||||||
Koenig & Bauer * | 7,283 | 342 | ||||||
Linde | 53,000 | 9,019 | ||||||
Merck | 51,484 | 5,571 | ||||||
Muenchener Rueckversicherungs | 10,260 | 1,917 | ||||||
OSRAM Licht | 46,102 | 2,712 | ||||||
ProSiebenSat.1 Media | 19,286 | 827 | ||||||
QIAGEN * | 5,881 | 162 | ||||||
SAP | 435,764 | 39,858 | ||||||
SAP ADR (A) | 83,500 | 7,633 | ||||||
Siemens | 92,647 | 10,871 | ||||||
Software | 7,695 | 327 | ||||||
STADA Arzneimittel | 7,027 | 391 | ||||||
Suedzucker | 26,401 | 735 | ||||||
Symrise | 18,451 | 1,355 | ||||||
ThyssenKrupp | 18,812 | 450 | ||||||
TUI | 149,589 | 2,132 | ||||||
Vonovia | 21,748 | 825 | ||||||
|
|
| ||||||
| 168,481 | ||||||||
|
|
| ||||||
Hong Kong — 2.4% | ||||||||
AIA Group | 2,396,093 | 16,132 | ||||||
Bank of East Asia | 69,000 | 282 | ||||||
Chaoda Modern Agriculture * | 2,440,000 | 64 | ||||||
Cheung Kong Infrastructure Holdings | 94,000 | 812 | ||||||
China Merchants Holdings International | 1,433,338 | 3,849 | ||||||
China Mobile | 1,268,740 | 15,515 | ||||||
CLP Holdings | 114,500 | 1,188 | ||||||
CNOOC | 9,184,000 | 11,597 | ||||||
Henderson Land Development | 808,938 | 4,843 | ||||||
HK Electric Investments & HK Electric Investments (B) | 399,500 | 392 | ||||||
HKT Trust & HKT | 375,000 | 529 | ||||||
Hysan Development | 63,000 | 297 | ||||||
IMAX China Holding *(A)(B) | 1,123,558 | 5,505 | ||||||
Link ‡ | 75,000 | 553 | ||||||
| Description | Shares | Market Value ($ Thousands) | ||||||
COMMON STOCK (continued) | ||||||||
MTR | 177,000 | $ | 979 | |||||
New World Development | 309,000 | 406 | ||||||
Power Assets Holdings | 49,000 | 480 | ||||||
Samsonite International | 1,136,100 | 3,666 | ||||||
Techtronic Industries | 125,000 | 492 | ||||||
Wharf Holdings | 21,000 | 154 | ||||||
Wheelock | 54,000 | 321 | ||||||
Yue Yuen Industrial Holdings | 34,000 | 141 | ||||||
|
|
| ||||||
| 68,197 | ||||||||
|
|
| ||||||
India — 0.2% | ||||||||
HDFC Bank ADR | 91,183 | 6,555 | ||||||
Tata Motors ADR | 7,544 | 302 | ||||||
|
|
| ||||||
| 6,857 | ||||||||
|
|
| ||||||
Indonesia — 0.1% | ||||||||
Telekomunikasi Indonesia Persero | 4,560,300 | 1,513 | ||||||
|
|
| ||||||
Ireland — 0.3% | ||||||||
CRH (A) | 35,337 | 1,182 | ||||||
Experian | 436,527 | 8,771 | ||||||
Paddy Power Betfair | 812 | 92 | ||||||
|
|
| ||||||
| 10,045 | ||||||||
|
|
| ||||||
Israel — 1.3% | ||||||||
Bank Hapoalim | 120,797 | 685 | ||||||
Bezeq Israeli Telecommunication | 2,552,639 | 4,809 | ||||||
Check Point Software | 89,000 | 6,907 | ||||||
Frutarom Industries | 51,193 | 2,696 | ||||||
Teva Pharmaceutical Industries ADR | 522,138 | 24,024 | ||||||
|
|
| ||||||
| 39,121 | ||||||||
|
|
| ||||||
Italy — 1.2% | ||||||||
Atlantia | 44,587 | 1,132 | ||||||
Azimut Holding | 187,685 | 2,768 | ||||||
Brembo | 125,350 | 7,488 | ||||||
DiaSorin | 7,443 | 479 | ||||||
Enel | 152,537 | 681 | ||||||
EXOR | 75,024 | 3,043 | ||||||
Fiat Chrysler Automobiles *(A) | 98,905 | 628 | ||||||
Prysmian | 48,864 | 1,282 | ||||||
Recordati | 105,450 | 3,392 | ||||||
Saras (A) | 692,920 | 1,106 | ||||||
Tenaris (A) | 804,809 | 11,436 | ||||||
Terna Rete Elettrica Nazionale | 142,172 | 734 | ||||||
|
|
| ||||||
| 34,169 | ||||||||
|
|
| ||||||
Japan — 17.9% | ||||||||
77 Bank | 161,000 | 659 | ||||||
Adastria | 45,400 | 1,045 | ||||||
Air Water | 8,000 | 151 | ||||||
Aisin Seiki | 3,100 | 142 | ||||||
Alfresa Holdings | 27,600 | 586 | ||||||
Amada Holdings | 47,800 | 498 | ||||||
Arcland Sakamoto | 33,400 | 376 | ||||||
Asahi Breweries | 103,400 | 3,770 | ||||||
SEI Institutional International Trust / Annual Report / September 30, 2016 |
17 |
SCHEDULE OF INVESTMENTS
September 30, 2016
International Equity Fund (Continued)
| Description | Shares | Market Value ($ Thousands) | ||||||
COMMON STOCK (continued) | ||||||||
Asahi Glass | 556,000 | $ | 3,608 | |||||
ASKUL | 62,145 | 2,368 | ||||||
Astellas Pharma | 27,200 | 426 | ||||||
Bandai Namco Holdings | 7,900 | 242 | ||||||
Calsonic Kansei | 75,000 | 696 | ||||||
Canon Marketing Japan | 90,800 | 1,690 | ||||||
Central Japan Railway | 19,200 | 3,292 | ||||||
Coca-Cola West | 12,800 | 359 | ||||||
CyberAgent | 18,000 | 538 | ||||||
CYBERDYNE *(A) | 15,900 | 247 | ||||||
Dai Nippon Printing | 761,000 | 7,471 | ||||||
Daiichi Sankyo | 236,600 | 5,696 | ||||||
Daikin Industries | 63,700 | 5,970 | ||||||
Daikyo | 751,000 | 1,363 | ||||||
Daito Trust Construction | 39,500 | 6,339 | ||||||
Daiwa House Industry | 172,900 | 4,756 | ||||||
Don Quijote Holdings | 57,296 | 2,103 | ||||||
East Japan Railway | 176,300 | 15,969 | ||||||
Fuji Film Holdings | 529,271 | 19,627 | ||||||
Fuji Heavy Industries | 26,412 | 991 | ||||||
Fujitsu | 641,000 | 3,451 | ||||||
Fujitsu General | 147,000 | 3,192 | ||||||
Furukawa Electric | 83,200 | 2,267 | ||||||
Geo Holdings | 20,000 | 259 | ||||||
Hamamatsu Photonics | 9,700 | 298 | ||||||
Hino Motors * | 11,900 | 127 | ||||||
Hirose Electric | 1,200 | 158 | ||||||
Hisamitsu Pharmaceutical | 9,200 | 497 | ||||||
Hitachi | 3,125,000 | 14,626 | ||||||
Hitachi High-Technologies | 9,800 | 392 | ||||||
Hoshizaki | 7,500 | 684 | ||||||
Idemitsu Kosan | 1,200 | 25 | ||||||
IHI | 109,000 | 317 | ||||||
Iida Group Holdings | 20,400 | 411 | ||||||
Isuzu Motors | 22,700 | 267 | ||||||
Itochu | 57,900 | 730 | ||||||
Japan Airlines | 458,200 | 13,468 | ||||||
Japan Exchange Group | 15,900 | 249 | ||||||
Japan Prime Realty Investment, Cl A ‡ | 108 | 488 | ||||||
Japan Real Estate Investment, Cl A ‡ | 73 | 436 | ||||||
Japan Retail Fund Investment, Cl A ‡ | 186 | 460 | ||||||
Japan Tobacco | 526,744 | 21,600 | ||||||
JGC | 8,900 | 155 | ||||||
Kakaku.com | 16,800 | 305 | ||||||
Kaneka | 13,000 | 103 | ||||||
Kansai Paint | 291,900 | 6,410 | ||||||
Kao | 100,431 | 5,686 | ||||||
KDDI | 655,900 | 20,262 | ||||||
Keyence | 24,300 | 17,848 | ||||||
Kikkoman | 23,000 | 738 | ||||||
Koito Manufacturing * | 205,610 | 10,001 | ||||||
Komatsu | 467,800 | 10,701 | ||||||
| Description | Shares | Market Value ($ Thousands) | ||||||
COMMON STOCK (continued) | ||||||||
Konami Holdings | 63,900 | $ | 2,471 | |||||
Kose | 1,300 | 134 | ||||||
Kuraray | 11,000 | 163 | ||||||
Kyowa Hakko Kirin | 11,500 | 182 | ||||||
M3 * | 16,900 | 579 | ||||||
Mabuchi Motor | 185,500 | 10,271 | ||||||
Maeda Road Construction | 36,000 | 645 | ||||||
Makita | 15,500 | 1,105 | ||||||
Marui Group | 33,000 | 437 | ||||||
Maruichi Steel Tube | 8,900 | 308 | ||||||
McDonald’s Holdings Japan (A) | 5,200 | 153 | ||||||
Medipal Holdings | 7,100 | 123 | ||||||
MEIJI Holdings | 16,400 | 1,632 | ||||||
Miraca Holdings | 76,500 | 3,822 | ||||||
Mitsubishi Chemical Holdings | 26,200 | 164 | ||||||
Mitsubishi Electric | 16,000 | 205 | ||||||
Mitsubishi Gas Chemical | 11,500 | 165 | ||||||
Mitsui Chemicals | 118,000 | 561 | ||||||
Mixi * | 64,900 | 2,351 | ||||||
Mochida Pharmaceutical | 3,300 | 259 | ||||||
MS&AD Insurance Group Holdings | 436,800 | 12,180 | ||||||
Nabtesco | 93,100 | 2,639 | ||||||
Nagoya Railroad | 87,000 | 474 | ||||||
NGK Insulators | 3,000 | 62 | ||||||
Nichi-iko Pharmaceutical | 18,800 | 361 | ||||||
Nidec | 7,700 | 710 | ||||||
Nikon (A) | 390,000 | 5,824 | ||||||
Nippo | 28,000 | 533 | ||||||
Nippon Building Fund, Cl A ‡ | 149 | 946 | ||||||
Nippon Electric Glass | 30,000 | 156 | ||||||
Nippon Paint Holdings | 26,200 | 877 | ||||||
Nippon Prologis ‡ | 123 | 311 | ||||||
Nippon Telegraph & Telephone | 104,300 | 4,769 | ||||||
Nippon Telegraph & Telephone ADR | 291,338 | 13,346 | ||||||
Nisshin Seifun Group | 33,600 | 513 | ||||||
Nitori Holdings | 10,500 | 1,261 | ||||||
Nomura Real Estate Master Fund ‡ | 410 | 684 | ||||||
NTT Data | 37,200 | 1,858 | ||||||
NTT DOCOMO | 448,494 | 11,415 | ||||||
Obayashi | 45,600 | 453 | ||||||
Obic | 4,700 | 250 | ||||||
Odakyu Electric Railway | 5,000 | 111 | ||||||
Oenon Holdings | 44,000 | 101 | ||||||
Oji Holdings | 33,000 | 131 | ||||||
Ono Pharmaceutical | 56,700 | 1,581 | ||||||
Oracle Japan * | 3,600 | 203 | ||||||
Otsuka Holdings | 115,500 | 5,273 | ||||||
Panasonic | 1,761,500 | 17,640 | ||||||
Park24 | 13,500 | 440 | ||||||
Pigeon | 224,664 | 6,816 | ||||||
Pioneer * | 101,900 | 222 | ||||||
Pola Orbis Holdings | 1,500 | 135 | ||||||
18 |
SEI Institutional International Trust / Annual Report / September 30, 2016 |
| Description | Shares | Market Value ($ Thousands) | ||||||
COMMON STOCK (continued) | ||||||||
Rinnai | 4,300 | $ | 400 | |||||
Rohm | 121,500 | 6,463 | ||||||
Ryohin Keikaku | 600 | 122 | ||||||
Saizeriya | 33,400 | 761 | ||||||
Santen Pharmaceutical | 303,900 | 4,492 | ||||||
Secom | 6,900 | 515 | ||||||
Sekisui Chemical | 57,500 | 827 | ||||||
Sekisui House | 425,400 | 7,263 | ||||||
Seven & I Holdings | 180,200 | 8,514 | ||||||
Shimadzu | 16,000 | 244 | ||||||
Shimamura | 1,300 | 158 | ||||||
Shimano | 5,500 | 817 | ||||||
Shionogi | 113,000 | 5,801 | ||||||
Showa Shell Sekiyu | 19,900 | 185 | ||||||
SMC | 22,700 | 6,560 | ||||||
Sohgo Security Services | 6,400 | 343 | ||||||
Sony | 23,900 | 788 | ||||||
Stanley Electric | 6,400 | 173 | ||||||
Start Today | 25,200 | 435 | ||||||
Sumitomo Chemical | 415,000 | 1,847 | ||||||
Sumitomo Dainippon Pharma | 23,600 | 458 | ||||||
Sumitomo Mitsui Financial Group | 456,100 | 15,367 | ||||||
Sumitomo Mitsui Trust Holdings | 290,822 | 9,487 | ||||||
Sundrug | 58,400 | 4,903 | ||||||
Suntory Beverage & Food | 4,300 | 186 | ||||||
Suruga Bank | 24,900 | 597 | ||||||
Sysmex | 95,600 | 7,113 | ||||||
Taiheiyo Cement | 181,000 | 522 | ||||||
Taisei | 63,000 | 473 | ||||||
Taisho Pharmaceutical Holdings | 5,700 | 584 | ||||||
Teijin | 124,000 | 2,411 | ||||||
Temp Holdings | 423,222 | 7,448 | ||||||
Terumo | 31,600 | 1,216 | ||||||
THK * | 19,000 | 374 | ||||||
TIS | 46,400 | 1,206 | ||||||
Tochigi Bank | 65,000 | 265 | ||||||
Toho Gas | 63,000 | 590 | ||||||
Tokio Marine Holdings | 318,200 | 12,195 | ||||||
Tokyo Electric Power Holdings * | 400,300 | 1,732 | ||||||
Tokyo Electron | 15,500 | 1,375 | ||||||
Toppan Printing | 82,000 | 741 | ||||||
Topre | 81,200 | 1,705 | ||||||
Toridoll.corp | 20,800 | 480 | ||||||
Tosoh | 57,000 | 352 | ||||||
TOTO (A) | 19,700 | 744 | ||||||
Toyo Seikan Group Holdings | 25,900 | 457 | ||||||
Toyota Motor * | 107,600 | 6,202 | ||||||
Toyota Motor ADR (A) | 111,433 | 12,933 | ||||||
Trend Micro * | 15,600 | 544 | ||||||
Tsuruha Holdings | 98,352 | 11,391 | ||||||
Ube Industries | 1,875,000 | 3,594 | ||||||
United Urban Investment ‡ | 161 | 293 | ||||||
| Description | Shares | Market Value ($ Thousands) | ||||||
COMMON STOCK (continued) | ||||||||
Wacoal Holdings | 689,704 | $ | 7,792 | |||||
Warabeya Nichiyo | 13,300 | 279 | ||||||
West Japan Railway | 5,400 | 335 | ||||||
Yamada Denki | 22,500 | 112 | ||||||
Yamaha | 26,200 | 848 | ||||||
Yamazaki Baking | 389,100 | 9,575 | ||||||
Yaskawa Electric | 26,100 | 390 | ||||||
Yokogawa Electric | 22,400 | 299 | ||||||
Zenkoku Hosho | 13,100 | 544 | ||||||
|
|
| ||||||
| 520,414 | ||||||||
|
|
| ||||||
Jordan — 0.0% | ||||||||
Hikma Pharmaceuticals (A) | 33,494 | 878 | ||||||
|
|
| ||||||
Luxembourg — 0.1% | ||||||||
APERAM (A) | 61,933 | 2,804 | ||||||
|
|
| ||||||
Malaysia — 0.0% | ||||||||
Tenaga Nasional | 322,500 | 1,115 | ||||||
|
|
| ||||||
Malta — 0.0% | ||||||||
BGP Holdings * | 198,683 | – | ||||||
|
|
| ||||||
Mexico — 0.2% | ||||||||
Cemex ADR * | 373,804 | 2,968 | ||||||
Wal-Mart de Mexico | 1,390,000 | 3,049 | ||||||
|
|
| ||||||
| 6,017 | ||||||||
|
|
| ||||||
Netherlands — 7.2% | ||||||||
AerCap Holdings * | 101,800 | 3,918 | ||||||
Akzo Nobel | 354,702 | 24,075 | ||||||
ArcelorMittal *(A) | 854,015 | 5,223 | ||||||
ASML Holding | 182,051 | 20,006 | ||||||
Delta Lloyd (A) | 122,711 | 566 | ||||||
Heineken | 13,999 | 1,233 | ||||||
Heineken Holding | 40,772 | 3,277 | ||||||
ING Groep | 1,345,105 | 16,613 | ||||||
James Hardie Industries | 54,114 | 850 | ||||||
Koninklijke Ahold Delhaize | 876,443 | 19,984 | ||||||
Koninklijke DSM | 225,090 | 15,249 | ||||||
Koninklijke KPN | 132,407 | 440 | ||||||
Koninklijke Philips | 185,606 | 5,505 | ||||||
NN Group | 22,623 | 695 | ||||||
NXP Semiconductors * | 46,800 | 4,774 | ||||||
PostNL * | 946,783 | 4,310 | ||||||
Refresco Group (A)(B) | 304,411 | 5,063 | ||||||
RELX | 557,812 | 10,033 | ||||||
Royal Dutch Shell, Cl A (A) | 401,438 | 10,028 | ||||||
Royal Dutch Shell, Cl B | 1,142,171 | 29,698 | ||||||
Royal Dutch Shell ADR, Cl B (A) | 198,852 | 10,505 | ||||||
Unilever | 170,048 | 7,854 | ||||||
Wolters Kluwer | 242,788 | 10,421 | ||||||
|
|
| ||||||
| 210,320 | ||||||||
|
|
| ||||||
New Zealand — 0.1% | ||||||||
Air New Zealand | 193,571 | 263 | ||||||
SEI Institutional International Trust / Annual Report / September 30, 2016 |
19 |
SCHEDULE OF INVESTMENTS
September 30, 2016
International Equity Fund (Continued)
| Description | Shares | Market Value ($ Thousands) | ||||||
COMMON STOCK (continued) | ||||||||
Fisher & Paykel Healthcare | 31,502 | $ | 230 | |||||
Fletcher Building | 23,521 | 184 | ||||||
Meridian Energy | 206,328 | 391 | ||||||
Ryman Healthcare | 28,854 | 202 | ||||||
Spark New Zealand | 73,974 | 195 | ||||||
|
|
| ||||||
| 1,465 | ||||||||
|
|
| ||||||
Norway — 1.4% | ||||||||
Aker Solutions * | 803,083 | 3,756 | ||||||
Ementor *(A) | 110,406 | 1,121 | ||||||
Gjensidige Forsikring | 228,140 | 4,260 | ||||||
Grieg Seafood | 712,129 | 5,694 | ||||||
Marine Harvest (A) | 233,857 | 4,179 | ||||||
Norsk Hydro (A) | 167,008 | 720 | ||||||
Norwegian Air Shuttle *(A) | 74,578 | 2,734 | ||||||
Norwegian Finans Holding *(A) | 267,730 | 2,546 | ||||||
Orkla | 77,405 | 800 | ||||||
Salmar | 4,226 | 129 | ||||||
SpareBank 1 SMN | 222,442 | 1,555 | ||||||
Statoil | 203,671 | 3,418 | ||||||
Telenor (A) | 485,980 | 8,341 | ||||||
Veidekke (A) | 63,357 | 976 | ||||||
|
|
| ||||||
| 40,229 | ||||||||
|
|
| ||||||
Poland — 0.0% | ||||||||
Emperia Holding * | 4,811 | 89 | ||||||
Polski Koncern Naftowy Orlen | 13,890 | 236 | ||||||
|
|
| ||||||
| 325 | ||||||||
|
|
| ||||||
Portugal — 0.5% | ||||||||
Galp Energia, Cl B | 907,699 | 12,427 | ||||||
Jeronimo Martins | 37,502 | 650 | ||||||
|
|
| ||||||
| 13,077 | ||||||||
|
|
| ||||||
Russia — 0.4% | ||||||||
Rosneft GDR | 88,700 | 486 | ||||||
Yandex, Cl A * | 576,777 | 12,141 | ||||||
|
|
| ||||||
| 12,627 | ||||||||
|
|
| ||||||
Singapore — 0.8% | ||||||||
CapitaLand | 162,300 | 383 | ||||||
CapitaLand Commercial Trust ‡ | 107,000 | 125 | ||||||
City Developments | 1,382,900 | 9,247 | ||||||
ComfortDelgro | 334,800 | 693 | ||||||
DBS Group Holdings | 328,000 | 3,734 | ||||||
Jardine Cycle & Carriage | 14,800 | 469 | ||||||
Oversea-Chinese Banking | 929,000 | 5,946 | ||||||
Singapore Airlines | 133,700 | 1,034 | ||||||
Singapore Exchange | 152,700 | 832 | ||||||
Singapore Press Holdings | 50,100 | 141 | ||||||
Singapore Technologies Engineering | 63,100 | 150 | ||||||
Suntec Real Estate Investment Trust ‡ | 345,700 | 436 | ||||||
|
|
| ||||||
| 23,190 | ||||||||
|
|
| ||||||
South Africa — 0.3% | ||||||||
Anglo American Platinum * | 8,661 | 244 | ||||||
| Description | Shares | Market Value ($ Thousands) | ||||||
COMMON STOCK (continued) | ||||||||
Investec (A) | 576,954 | $ | 3,533 | |||||
Liberty Holdings | 47,052 | 400 | ||||||
Sappi * | 124,207 | 643 | ||||||
Shoprite Holdings | 355,299 | 4,939 | ||||||
|
|
| ||||||
| 9,759 | ||||||||
|
|
| ||||||
South Korea — 3.2% | ||||||||
Cosmax (A) | 76,053 | 10,513 | ||||||
Korea Electric Power | 9,971 | 490 | ||||||
KT ADR | 151,442 | 2,431 | ||||||
KT&G | 44,297 | 5,033 | ||||||
LG Display ADR | 215,154 | 2,737 | ||||||
Samsung Electronics | 20,800 | 30,320 | ||||||
Shinhan Financial Group | 334,500 | 12,205 | ||||||
SK Hynix | 7,965 | 293 | ||||||
SK Innovation | 4,098 | 606 | ||||||
SK Telecom | 74,994 | 15,417 | ||||||
SK Telecom ADR | 572,886 | 12,947 | ||||||
|
|
| ||||||
| 92,992 | ||||||||
|
|
| ||||||
Spain — 1.6% | ||||||||
ACS Actividades de Construccion y Servicios | 198,532 | 6,006 | ||||||
Aena (B) | 7,924 | 1,169 | ||||||
Almirall | 69,060 | 1,066 | ||||||
Amadeus IT Holding, Cl A | 38,504 | 1,927 | ||||||
Banco Bilbao Vizcaya Argentaria | 390,295 | 2,364 | ||||||
Bankinter | 27,888 | 198 | ||||||
CaixaBank | 2,077,388 | 5,256 | ||||||
Enagas | 14,851 | 447 | ||||||
Ferrovial | 62,777 | 1,337 | ||||||
Grifols ADR | 714,606 | 11,412 | ||||||
Iberdrola | 592,552 | 4,032 | ||||||
Industria de Diseno Textil | 139,271 | 5,171 | ||||||
International Consolidated Airlines Group | 16,473 | 86 | ||||||
Mapfre | 1,011,741 | 2,835 | ||||||
Prosegur Cia de Seguridad | 47,640 | 334 | ||||||
Red Electrica | 63,960 | 1,380 | ||||||
Repsol | 12,019 | 164 | ||||||
Zardoya Otis | 1,115 | 11 | ||||||
|
|
| ||||||
| 45,195 | ||||||||
|
|
| ||||||
Sweden — 1.4% | ||||||||
Alfa Laval | 139,848 | 2,201 | ||||||
Assa Abloy, Cl B | 71,165 | 1,449 | ||||||
BillerudKorsnas | 44,428 | 788 | ||||||
Boliden | 76,187 | 1,793 | ||||||
Bonava, Cl B * | 39,765 | 502 | ||||||
Electrolux, Cl B | 215,288 | 5,405 | ||||||
Granges | 59,798 | 611 | ||||||
Hufvudstaden, Cl A | 38,081 | 661 | ||||||
Husqvarna, Cl B | 129,116 | 1,128 | ||||||
Investor, Cl B | 71,270 | 2,610 | ||||||
L E Lundbergforetagen, Cl B | 16,420 | 1,081 | ||||||
Lundin Petroleum * | 28,286 | 518 | ||||||
20 |
SEI Institutional International Trust / Annual Report / September 30, 2016 |
| Description | Shares | Market Value ($ Thousands) | ||||||
COMMON STOCK (continued) | ||||||||
Mycronic | 29,296 | $ | 366 | |||||
NCC, Cl B | 39,765 | 1,044 | ||||||
Nordea Bank | 460,258 | 4,576 | ||||||
Oriflame Holding * | 22,492 | 826 | ||||||
Peab | 134,731 | 1,164 | ||||||
Securitas, Cl B | 50,259 | 844 | ||||||
Skanska, Cl B | 30,552 | 714 | ||||||
Svenska Cellulosa, Cl B | 159,015 | 4,735 | ||||||
Swedish Match | 13,566 | 499 | ||||||
Telefonaktiebolaget LM Ericsson ADR | 1,139,812 | 8,218 | ||||||
|
|
| ||||||
| 41,733 | ||||||||
|
|
| ||||||
Switzerland — 8.8% | ||||||||
ABB | 198,249 | 4,463 | ||||||
Actelion | 29,686 | 5,155 | ||||||
Aryzta | 192,148 | 8,539 | ||||||
Chocoladefabriken Lindt & Sprungli | 150 | 1,808 | ||||||
Cie Financiere Richemont | 199,724 | 12,181 | ||||||
Clariant | 180,258 | 3,109 | ||||||
Coca-Cola HBC * | 597,228 | 13,911 | ||||||
Dufry * | 101,208 | 12,721 | ||||||
Emmi | 1,144 | 785 | ||||||
EMS-Chemie Holding | 714 | 385 | ||||||
Galenica | 2,911 | 3,097 | ||||||
Geberit | 3,110 | 1,365 | ||||||
Givaudan | 4,367 | 8,908 | ||||||
Julius Baer Group * | 333,051 | 13,612 | ||||||
Lonza Group | 48,950 | 9,386 | ||||||
Nestle | 201,118 | 15,882 | ||||||
Novartis | 415,703 | 32,803 | ||||||
Pargesa Holding | 2,406 | 165 | ||||||
Partners Group Holding | 11,424 | 5,782 | ||||||
Roche Holding | 115,109 | 28,707 | ||||||
Schindler Holding | 8,827 | 1,665 | ||||||
SGS | 6,622 | 14,870 | ||||||
Sika | 356 | 1,735 | ||||||
Sonova Holding | 27,000 | 3,830 | ||||||
Swiss Life Holding | 19,570 | 5,084 | ||||||
Swiss Prime Site | 6,615 | 581 | ||||||
Swiss Re | 83,044 | 7,512 | ||||||
TE Connectivity | 65,600 | 4,223 | ||||||
Tecan Group | 3,617 | 636 | ||||||
UBS Group *(A) | 1,406,897 | 19,178 | ||||||
Wolseley (A) | 13,737 | 777 | ||||||
Zurich Insurance Group * | 52,047 | 13,443 | ||||||
|
|
| ||||||
| 256,298 | ||||||||
|
|
| ||||||
Taiwan — 0.5% | ||||||||
Hon Hai Precision Industry | 2,120,765 | 5,363 | ||||||
Taiwan Semiconductor Manufacturing ADR | 291,168 | 8,907 | ||||||
United Microelectronics ADR (A) | 208,687 | 386 | ||||||
|
|
| ||||||
| 14,656 | ||||||||
|
|
| ||||||
| Description | Shares | Market Value ($ Thousands) | ||||||
COMMON STOCK (continued) | ||||||||
Turkey — 0.1% | ||||||||
Turkiye Garanti Bankasi | 371,709 | $ | 987 | |||||
Turkiye Is Bankasi, Cl C | 286,373 | 454 | ||||||
Turkiye Vakiflar Bankasi Tao, Cl D (A) | 758,569 | 1,164 | ||||||
|
|
| ||||||
| 2,605 | ||||||||
|
|
| ||||||
United Kingdom — 14.2% | ||||||||
3i Group | 330,250 | 2,796 | ||||||
Abcam | 25,880 | 283 | ||||||
Aberdeen Asset Management | 116,658 | 493 | ||||||
Admiral Group | 31,613 | 843 | ||||||
Aon | 59,000 | 6,637 | ||||||
Ashtead Group | 539,109 | 8,917 | ||||||
Associated British Foods (A) | 106,122 | 3,595 | ||||||
AstraZeneca (A) | 85,823 | 5,574 | ||||||
Aviva | 2,700,859 | 15,464 | ||||||
Babcock International Group | 18,414 | 248 | ||||||
BAE Systems | 92,366 | 629 | ||||||
Balfour Beatty (A) | 1,679,004 | 6,108 | ||||||
Barclays | 7,799,100 | 17,032 | ||||||
Beazley | 66,742 | 336 | ||||||
Berendsen | 99,932 | 1,616 | ||||||
BGEO Group | 7,468 | 282 | ||||||
BHP Billiton | 42,068 | 637 | ||||||
BP (A) | 265,106 | 1,552 | ||||||
BP ADR | 170,014 | 5,978 | ||||||
British American Tobacco | 297,360 | 19,067 | ||||||
British Land ‡ | 28,741 | 236 | ||||||
Bunzl | 248,688 | 7,365 | ||||||
Carnival | 485,164 | 23,760 | ||||||
Cobham | 1,593,341 | 3,476 | ||||||
Compass Group | 871,245 | 16,954 | ||||||
DCC | 48,553 | 4,432 | ||||||
Diageo | 352,386 | 10,132 | ||||||
Direct Line Insurance Group | 340,405 | 1,615 | ||||||
Domino’s Pizza Group | 1,032,057 | 5,007 | ||||||
DS Smith | 2,266,593 | 11,332 | ||||||
Fresnillo (A) | 33,094 | 780 | ||||||
Genus | 21,832 | 553 | ||||||
GKN | 95,952 | 400 | ||||||
GlaxoSmithKline | 765,048 | 16,346 | ||||||
Glencore *(A) | 200,495 | 553 | ||||||
Greggs | 52,652 | 694 | ||||||
Hargreaves Lansdown (A) | 41,481 | 686 | ||||||
Howden Joinery Group | 757,800 | 4,263 | ||||||
HSBC Holdings | 1,993,035 | 15,009 | ||||||
Imperial Brands | 41,265 | 2,133 | ||||||
Imperial Brands ADR | 12,508 | 644 | ||||||
Inchcape | 57,618 | 494 | ||||||
Indivior | 326,107 | 1,298 | ||||||
Intertek Group (A) | 25,597 | 1,160 | ||||||
ITV | 31,499 | 77 | ||||||
J Sainsbury (A) | 45,178 | 144 | ||||||
SEI Institutional International Trust / Annual Report / September 30, 2016 |
21 |
SCHEDULE OF INVESTMENTS
September 30, 2016
International Equity Fund (Concluded)
| Description | Shares | Market Value ($ Thousands) | ||||||
COMMON STOCK (continued) | ||||||||
JD Sports Fashion | 13,514 | $ | 260 | |||||
Johnson Matthey | 17,491 | 749 | ||||||
Land Securities Group ‡ | 47,975 | 659 | ||||||
Legal & General Group (A) | 1,175,525 | 3,345 | ||||||
Lloyds Banking Group | 19,823,671 | 14,058 | ||||||
London Stock Exchange Group | 16,006 | 582 | ||||||
Mediclinic International (A) | 41,203 | 496 | ||||||
Merlin Entertainments (B) | 1,965,000 | 11,237 | ||||||
Mitie Group (A) | 1,662,416 | 4,144 | ||||||
Mondi (A) | 227,149 | 4,785 | ||||||
National Grid | 135,873 | 1,924 | ||||||
Old Mutual (A) | 56,137 | 148 | ||||||
Persimmon | 53,150 | 1,255 | ||||||
Petrofac (A) | 34,832 | 404 | ||||||
Prudential | 792,247 | 14,065 | ||||||
QinetiQ Group | 319,745 | 983 | ||||||
Randgold Resources | 5,423 | 546 | ||||||
Reckitt Benckiser Group | 148,774 | 14,059 | ||||||
Regus | 177,425 | 602 | ||||||
RELX | 494,184 | 9,400 | ||||||
Rentokil Initial | 3,710,047 | 10,732 | ||||||
Rightmove | 11,198 | 615 | ||||||
Royal Bank of Scotland Group *(A) | 4,446,799 | 10,318 | ||||||
Sage Group | 77,597 | 745 | ||||||
Schroders (A) | 85,554 | 2,998 | ||||||
Segro ‡ | 116,190 | 686 | ||||||
Severn Trent | 7,976 | 260 | ||||||
Smiths Group | 36,714 | 700 | ||||||
Spectris | 132,088 | 3,383 | ||||||
SSE | 404,140 | 8,249 | ||||||
SSP Group | 35,012 | 145 | ||||||
St. James’s Place (A) | 287,225 | 3,543 | ||||||
Subsea 7 *(A) | 30,724 | 331 | ||||||
TalkTalk Telecom Group | 1,203,585 | 3,165 | ||||||
Tate & Lyle | 132,482 | 1,290 | ||||||
Taylor Wimpey | 211,710 | 425 | ||||||
Tesco *(A) | 3,719,006 | 8,846 | ||||||
Travis Perkins | 206,866 | 4,154 | ||||||
Unilever | 27,681 | 1,314 | ||||||
United Utilities Group | 74,351 | 970 | ||||||
Vodafone Group | 7,021,897 | 20,259 | ||||||
Worldpay Group (B) | 903,000 | 3,474 | ||||||
WPP | 547,970 | 12,930 | ||||||
|
|
| ||||||
| 410,863 | ||||||||
|
|
| ||||||
United States — 3.4% | ||||||||
Accenture, Cl A | 62,305 | 7,612 | ||||||
Alphabet, Cl C * | 4,772 | 3,709 | ||||||
Axis Capital Holdings | 165,039 | 8,967 | ||||||
Cable One | 6,112 | 3,569 | ||||||
Chubb | 88,612 | 11,134 | ||||||
Cognizant Technology Solutions, | 137,316 | 6,551 | ||||||
Core Laboratories (A) | 70,910 | 7,965 | ||||||
| Description | Shares | Market Value ($ Thousands) | ||||||
COMMON STOCK (continued) | ||||||||
Crane | 57,421 | $ | 3,618 | |||||
Dave & Buster’s Entertainment * | 19,226 | 753 | ||||||
Flextronics International * | 536,917 | 7,313 | ||||||
HealthEquity *(A) | 103,990 | 3,936 | ||||||
ICON *(A) | 127,879 | 9,894 | ||||||
International Game Technology | 13,721 | 335 | ||||||
Lazard, Cl A | 133,680 | 4,861 | ||||||
Luxoft Holding, Cl A *(A) | 88,969 | 4,702 | ||||||
ManpowerGroup | 98,523 | 7,119 | ||||||
Nielsen Holdings (A) | 99,700 | 5,341 | ||||||
Patheon * | 15,890 | 471 | ||||||
Taro Pharmaceutical Industries * | 6,597 | 729 | ||||||
|
|
| ||||||
| 98,579 | ||||||||
|
|
| ||||||
Total Common Stock | 2,734,011 | |||||||
|
|
| ||||||
PREFERRED STOCK — 1.5% | ||||||||
Brazil — 0.2% | ||||||||
Itau Unibanco Holding ADR | 363,000 | 3,971 | ||||||
Metalurgica Gerdau, Cl A * | 1,058,100 | 1,114 | ||||||
|
|
| ||||||
| 5,085 | ||||||||
|
|
| ||||||
Germany — 0.9% | ||||||||
Bayerische Motoren Werke | 7,874 | 583 | ||||||
Henkel | 44,135 | 6,008 | ||||||
Porsche | 10,478 | 539 | ||||||
Volkswagen | 145,335 | 19,143 | ||||||
|
|
| ||||||
| 26,273 | ||||||||
|
|
| ||||||
South Korea — 0.4% | ||||||||
Hyundai Motor | 67,632 | 6,170 | ||||||
Samsung Electronics | 5,239 | 6,144 | ||||||
|
|
| ||||||
| 12,314 | ||||||||
|
|
| ||||||
Total Preferred Stock | 43,672 | |||||||
|
|
| ||||||
Number of Rights | ||||||||
RIGHTS — 0.0% | ||||||||
France — 0.0% | ||||||||
Air Liquide, | 29,500 | 80 | ||||||
|
|
| ||||||
Total Rights | 80 | |||||||
|
|
| ||||||
22 |
SEI Institutional International Trust / Annual Report / September 30, 2016 |
| Description | Face Amount (Thousands) | Market Value ($ Thousands) | ||||||
U.S. TREASURY OBLIGATION — 0.1% |
| |||||||
U.S. Treasury Bills | ||||||||
0.245%, 10/20/2016 (C) | $ | 3,040 | $ | 3,040 | ||||
|
|
| ||||||
Total U.S. Treasury Obligation | 3,040 | |||||||
|
|
| ||||||
| Shares | ||||||||
AFFILIATED PARTNERSHIP — 9.8% | ||||||||
SEI Liquidity Fund, L.P. | ||||||||
0.430% **†(D) | 284,415,861 | 284,416 | ||||||
|
|
| ||||||
Total Affiliated Partnership | 284,416 | |||||||
|
|
| ||||||
CASH EQUIVALENT — 1.2% | ||||||||
SEI Daily Income Trust, Government Fund, Cl A | ||||||||
0.220%**† | 34,928,742 | 34,929 | ||||||
|
|
| ||||||
Total Cash Equivalent | 34,929 | |||||||
|
|
| ||||||
Total Investments — 106.8% | $ | 3,100,148 | ||||||
|
|
| ||||||
A list of the open futures contracts held by the Fund at September 30, 2016, is as follows:
| Type of Contract | Number of Contracts Long | Expiration Date | Unrealized Appreciation (Depreciation) ($ Thousands) | |||||||||
DJ Euro Stoxx 50 Index | 393 | Dec-2016 | $123 | |||||||||
FTSE 100 Index | 105 | Dec-2016 | 299 | |||||||||
Hang Seng Index | 14 | Oct-2016 | (11) | |||||||||
SPI 200 Index | 35 | Dec-2016 | 98 | |||||||||
Topix Index | 76 | Dec-2016 | (30) | |||||||||
|
| |||||||||||
| $479 | ||||||||||||
|
| |||||||||||
For the year ended September 30, 2016, the total amount of all open futures contracts, as presented in the table above, are representative of the volume of activity for the derivative type during the year.
| Percentages are based on Net Assets of $2,902,822 ($ Thousands). |
| * | Non-income producing security. |
| ** | Rate shown is the 7-day effective yield as of September 30, 2016. |
| † | Investment in Affiliated Security (see Note 5). |
| ‡ | Real Estate Investment Trust. |
| (A) | This security or a partial position of this security is on loan at September 30, 2016 (see Note 9). The total market value of securities on loan at September 30, 2016 was $269,957 ($ Thousands). |
| (B) | Security exempt from registration under Rule 144A of the Securities Act of 1933. These securities may be resold in transactions exempt from registration normally to qualified institutions. On September 30, 2016, the value of these securities amounted to $38,033 ($ Thousands), representing 1.3% of the net assets of the Fund. |
| (C) | Security, or portion thereof, has been pledged as collateral on open futures contracts. |
| (D) | This security was purchased with cash collateral held from securities on loan (see Note 9). The total market value of such securities as of September 30, 2016 was $284,416 ($ Thousands). |
ADR — American Depositary Receipt
Cl — Class
DJ — Dow Jones
FTSE — Financial Times and Stock Exchange
GDR — Global Depositary Receipt
L.P. — Limited Partnership
SPI — Share Price Index
The following is a list of the level of inputs used as of September 30, 2016, in valuing the Fund’s investments and other financial instruments carried at value ($ Thousands):
| Investments in Securities | Level 1 | Level 2 | Level 3 | Total | ||||||||||||
Common Stock | $ | 551,525 | $ | 2,182,486 | $ | — | $ | 2,734,011 | ||||||||
Preferred Stock | 5,085 | 38,587 | — | 43,672 | ||||||||||||
Rights | — | 80 | — | 80 | ||||||||||||
U.S. Treasury Obligation | — | 3,040 | — | 3,040 | ||||||||||||
Affiliated Partnership | — | 284,416 | — | 284,416 | ||||||||||||
Cash Equivalent | 34,929 | — | — | 34,929 | ||||||||||||
|
|
|
|
|
|
|
| |||||||||
Total Investments in Securities | $ | 591,539 | $ | 2,508,609 | $ | — | $ | 3,100,148 | ||||||||
|
|
|
|
|
|
|
| |||||||||
| Other Financial Instruments | Level 1 | Level 2 | Level 3 | Total | ||||||||||||
Futures Contracts * | ||||||||||||||||
Unrealized Appreciation | $ | 520 | $ | — | $ | — | $ | 520 | ||||||||
Unrealized Depreciation | (41) | — | — | (41) | ||||||||||||
|
|
|
|
|
|
|
|
|
|
|
| |||||
| Total Other Financial Instruments | $ | 479 | $ | — | $ | — | $ | 479 | ||||||||
|
|
|
|
|
|
|
|
|
|
|
| |||||
*Futures contracts are valued at the unrealized appreciation (depreciation) on the instrument.
For the year ended September 30, 2016, there were transfers between Level 1 and Level 2 assets and liabilities. The primary reason for changes in the classifications between Levels 1 and 2 occurs when foreign equity securities are fair valued using other observable market-based inputs in place of the closing exchange price due to events occurring after the close of the exchange or market on which the investment is principally traded.
For the year ended September 30, 2016, there were no transfers between Level 2 and Level 3 assets and liabilities.
For more information on valuation inputs, see Note 2 – Significant Accounting Policies in Notes to Financial Statements.
Amounts designated as “—” are $0 or have been rounded to $0.
The accompanying notes are an integral part of the financial statements.
SEI Institutional International Trust / Annual Report / September 30, 2016 |
23 |
SCHEDULE OF INVESTMENTS
September 30, 2016
Emerging Market Equity Fund
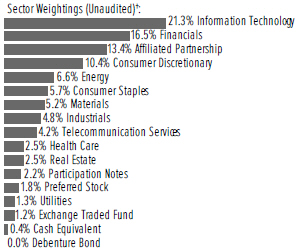
†Percentages based on total investments. Includes investments held as collateral for securities on loan (see Note 9).
| Description | Shares | Market Value ($ Thousands) | ||||||
COMMON STOCK — 92.7% | ||||||||
Argentina — 0.5% | ||||||||
Arcos Dorados Holdings, Cl A * | 240,500 | $ | 1,267 | |||||
Cresud SACIF y A ADR * | 52,900 | 945 | ||||||
IRSA Inversiones y Representaciones ADR * | 39,800 | 756 | ||||||
MercadoLibre | 14,664 | 2,712 | ||||||
YPF ADR | 137,590 | 2,507 | ||||||
|
|
| ||||||
| 8,187 | ||||||||
|
|
| ||||||
Austria — 0.2% | ||||||||
Erste Group Bank * | 88,170 | 2,630 | ||||||
|
|
| ||||||
Brazil — 6.2% | ||||||||
Ambev | 290,000 | 1,774 | ||||||
Ambev ADR (A) | 1,357,275 | 8,266 | ||||||
B2W Cia Digital * | 1,129,490 | 5,542 | ||||||
Banco Bradesco ADR * | 1,033,407 | 9,373 | ||||||
Banco do Brasil * | 309,380 | 2,186 | ||||||
Banco Santander Brasil ADR (A) | 187,223 | 1,254 | ||||||
BB Seguridade Participacoes | 347,900 | 3,213 | ||||||
BM&FBovespa * | 231,300 | 1,203 | ||||||
Braskem ADR | 151,264 | 2,326 | ||||||
BRF | 41,500 | 710 | ||||||
BRF ADR | 140,544 | 2,398 | ||||||
BTG Pactual Group * | 86,000 | 374 | ||||||
CCR | 381,229 | 2,007 | ||||||
CETIP - Mercados Organizados | 15,200 | 201 | ||||||
Cia Energetica de Minas Gerais ADR | 49,509 | 128 | ||||||
Cielo | 301,676 | 3,035 | ||||||
Cosan Industria e Comercio | 360,363 | 4,173 | ||||||
Cyrela Brazil Realty Empreendimentos e Participacoes | 82,000 | 257 | ||||||
EDP - Energias do Brasil | 89,300 | 395 | ||||||
Energisa | 252,300 | 1,611 | ||||||
FPC Par Corretora de Seguros | 344,700 | 1,554 | ||||||
| Description | Shares | Market Value ($ Thousands) | ||||||
COMMON STOCK (continued) | ||||||||
Gerdau ADR | 881,884 | $ | 2,399 | |||||
Hypermarcas | 456,139 | 3,949 | ||||||
Kroton Educacional | 406,600 | 1,865 | ||||||
Lojas Renner | 352,100 | 2,663 | ||||||
Mahle-Metal Leve | 75,100 | 537 | ||||||
MRV Engenharia e Participacoes | 728,600 | 2,675 | ||||||
Multiplus | 64,600 | 880 | ||||||
Petroleo Brasileiro ADR * | 1,156,230 | 10,788 | ||||||
Porto Seguro | 91,000 | 840 | ||||||
Qualicorp | 102,000 | 601 | ||||||
Rumo Logistica Operadora Multimodal * | 1,755,306 | 3,409 | ||||||
Sao Martinho | 57,100 | 1,021 | ||||||
Smiles | 57,800 | 967 | ||||||
Telefonica Brasil ADR (A) | 523,701 | 7,578 | ||||||
TIM Participacoes ADR | 356,400 | 4,362 | ||||||
Totvs | 52,900 | 503 | ||||||
Transmissora Alianca de Energia Eletrica | 7,300 | 47 | ||||||
Ultrapar Participacoes | 63,500 | 1,407 | ||||||
Vale ADR, Cl B *(A) | 209,085 | 1,150 | ||||||
WEG | 97,600 | 536 | ||||||
|
|
| ||||||
| 100,157 | ||||||||
|
|
| ||||||
Canada — 0.6% | ||||||||
First Quantum Minerals | 675,766 | 5,584 | ||||||
Parex Resources * | 194,312 | 2,462 | ||||||
SEMAFO * | 305,211 | 1,268 | ||||||
|
|
| ||||||
| 9,314 | ||||||||
|
|
| ||||||
Chile — 0.7% | ||||||||
Banco de Chile | 6,399,354 | 714 | ||||||
Banco Santander Chile | 19,521,854 | 1,008 | ||||||
Centros Comerciales Sudamericanos | 208,010 | 624 | ||||||
Cia Cervecerias Unidas ADR (A) | 57,991 | 1,171 | ||||||
Embotelladora Andina ADR, Cl B | 8,038 | 182 | ||||||
Enersis Americas ADR | 205,632 | 1,684 | ||||||
SACI Falabella | 396,500 | 2,901 | ||||||
Sociedad Quimica y Minera de Chile ADR | 114,936 | 3,092 | ||||||
|
|
| ||||||
| 11,376 | ||||||||
|
|
| ||||||
China — 18.3% | ||||||||
AAC Technologies Holdings | 138,133 | 1,392 | ||||||
Agile Property Holdings | 810,000 | 465 | ||||||
Agricultural Bank of China | 12,907,932 | 5,563 | ||||||
Air China | 3,420,000 | 2,317 | ||||||
Alibaba Group Holding ADR *(A) | 277,430 | 29,349 | ||||||
Angang Steel *(A) | 10,508,722 | 5,127 | ||||||
Anhui Conch Cement | 1,608,500 | 4,458 | ||||||
ANTA Sports Products (A) | 642,069 | 1,763 | ||||||
Baidu ADR * | 109,827 | 19,996 | ||||||
Bank of China | 16,991,105 | 7,832 | ||||||
Bank of Communications | 585,000 | 450 | ||||||
Beijing Capital International Airport | 1,344,000 | 1,530 | ||||||
Changyou.com ADR * | 114,400 | 3,117 | ||||||
China Biologic Products * | 7,882 | 981 | ||||||
24 |
SEI Institutional International Trust / Annual Report / September 30, 2016 |
| Description | Shares | Market Value ($ Thousands) | ||||||
COMMON STOCK (continued) | ||||||||
China Communications Services | 3,030,000 | $ | 1,910 | |||||
China Construction Bank | 21,024,379 | 15,728 | ||||||
China Life Insurance | 265,000 | 691 | ||||||
China Longyuan Power Group | 848,000 | 696 | ||||||
China Merchants Bank | 492,076 | 1,250 | ||||||
China Petroleum & Chemical | 7,489,839 | 5,552 | ||||||
China Railway Construction | 1,155,000 | 1,327 | ||||||
China Shenhua Energy | 2,288,623 | 4,536 | ||||||
China Telecom | 3,486,000 | 1,776 | ||||||
China Vanke | 1,492,424 | 3,893 | ||||||
Chongqing Rural Commercial Bank | 1,244,612 | 774 | ||||||
CITIC Securities | 2,411,400 | 5,183 | ||||||
Cogobuy Group *(A)(B) | 790,000 | 1,302 | ||||||
Ctrip.com International ADR * | 231,293 | 10,771 | ||||||
Datang International Power Generation | 1,490,000 | 400 | ||||||
Dongfeng Motor Group | 1,002,000 | 1,014 | ||||||
Great Wall Motor * | 744,000 | 734 | ||||||
Guangzhou R&F Properties | 2,705,737 | 4,293 | ||||||
Huaneng Power International | 940,000 | 592 | ||||||
Industrial & Commercial Bank of China | 38,380,868 | 24,176 | ||||||
JD.com ADR *(A) | 123,188 | 3,214 | ||||||
Jiangsu Expressway | 1,178,000 | 1,635 | ||||||
KWG Property Holding | 1,036,870 | 688 | ||||||
Longfor Properties | 1,013,000 | 1,571 | ||||||
NetEase ADR (A) | 18,752 | 4,515 | ||||||
New Oriental Education & Technology Group ADR * | 58,779 | 2,725 | ||||||
PetroChina | 606,000 | 405 | ||||||
PetroChina ADR | 63,546 | 4,245 | ||||||
PICC Property & Casualty | 2,597,800 | 4,362 | ||||||
Ping An Insurance Group of China | 2,317,000 | 12,151 | ||||||
SINA * | 175,100 | 12,928 | ||||||
Sinopec Engineering Group | 1,853,000 | 1,605 | ||||||
Sinopec Shanghai Petrochemical | 786,000 | 400 | ||||||
Sinopharm Group | 551,200 | 2,666 | ||||||
Sohu.com * | 171,500 | 7,589 | ||||||
TAL Education Group ADR * | 29,930 | 2,120 | ||||||
Tencent Holdings | 1,540,935 | 42,679 | ||||||
Tingyi Cayman Islands Holding (A) | 1,214,000 | 1,417 | ||||||
TravelSky Technology | 1,482,000 | 3,542 | ||||||
Tsingtao Brewery | 288,000 | 1,134 | ||||||
Uni-President China Holdings (A) | 3,953,400 | 2,825 | ||||||
Vipshop Holdings ADR * | 207,396 | 3,043 | ||||||
Want Want China Holdings (A) | 1,484,000 | 927 | ||||||
Weibo ADR * | 46,830 | 2,348 | ||||||
Zhejiang Expressway | 1,104,000 | 1,171 | ||||||
|
|
| ||||||
| 292,843 | ||||||||
|
|
| ||||||
Colombia — 0.3% | ||||||||
Almacenes Exito | 51,103 | 261 | ||||||
Bancolombia ADR, Cl R (A) | 67,878 | 2,650 | ||||||
Cementos Argos | 239,787 | 956 | ||||||
Cemex Latam Holdings * | 245,107 | 933 | ||||||
| Description | Shares | Market Value ($ Thousands) | ||||||
COMMON STOCK (continued) | ||||||||
Interconexion Electrica ESP | 132,641 | $ | 449 | |||||
|
|
| ||||||
| 5,249 | ||||||||
|
|
| ||||||
Czech Republic — 0.2% | ||||||||
Komercni Banka | 71,915 | 2,496 | ||||||
Moneta Money Bank *(B) | 437,975 | 1,395 | ||||||
|
|
| ||||||
| 3,891 | ||||||||
|
|
| ||||||
Egypt — 0.1% | ||||||||
Commercial International Bank Egypt GDR | 319,585 | 1,265 | ||||||
Global Telecom Holding SAE GDR * | 271,792 | 529 | ||||||
|
|
| ||||||
| 1,794 | ||||||||
|
|
| ||||||
Greece — 0.2% | ||||||||
Eurobank Ergasias * | 2,857,690 | 1,647 | ||||||
National Bank of Greece * | 8,801,353 | 1,844 | ||||||
|
|
| ||||||
| 3,491 | ||||||||
|
|
| ||||||
Hong Kong — 7.0% | ||||||||
AIA Group | 460,700 | 3,102 | ||||||
Beijing Enterprises Holdings | 499,700 | 2,551 | ||||||
Brilliance China Automotive Holdings | 4,191,518 | 4,734 | ||||||
Chaoda Modern Agriculture * | 2,056,181 | 54 | ||||||
China Conch Venture Holdings (A) | 766,500 | 1,499 | ||||||
China Everbright | 922,000 | 1,905 | ||||||
China Everbright Bank | 3,523,000 | 1,640 | ||||||
China Everbright International | 3,837,100 | 4,604 | ||||||
China Galaxy Securities | 472,500 | 435 | ||||||
China High Precision Automation Group * | 1,385,624 | – | ||||||
China High Speed Transmission Equipment Group | 1,065,000 | 1,085 | ||||||
China Medical System Holdings | 4,862,200 | 8,218 | ||||||
China Mengniu Dairy | 1,358,000 | 2,545 | ||||||
China Mobile | 1,703,041 | 20,825 | ||||||
China Mobile ADR | 111,540 | 6,862 | ||||||
China Overseas Land & Investment | 112,000 | 384 | ||||||
China Power International Development | 4,723,000 | 1,830 | ||||||
China Resources Power Holdings | 648,000 | 1,129 | ||||||
China State Construction International Holdings | 3,756,635 | 4,970 | ||||||
China Taiping Insurance Holdings * | 1,239,782 | 2,473 | ||||||
CIFI Holdings Group (A) | 1,938,000 | 614 | ||||||
CNOOC | 3,741,907 | 4,725 | ||||||
Fuyao Glass Industry Group (A)(B) | 634,667 | 1,735 | ||||||
Galaxy Entertainment Group * | 1,180,000 | 4,495 | ||||||
Geely Automobile Holdings | 5,358,060 | 4,831 | ||||||
GOME Electrical Appliances Holding | 4,465,000 | 551 | ||||||
Guangzhou Automobile Group | 1,094,000 | 1,419 | ||||||
Haier Electronics Group | 1,855,000 | 3,100 | ||||||
Hua Hong Semiconductor (B) | 505,900 | 592 | ||||||
Lee & Man Paper Manufacturing | 3,187,960 | 2,915 | ||||||
People’s Insurance Group of China | 3,687,000 | 1,518 | ||||||
Shanghai Industrial Holdings | 728,000 | 2,108 | ||||||
Shimao Property Holdings | 889,000 | 1,213 | ||||||
Skyworth Digital Holdings | 1,604,000 | 1,159 | ||||||
SEI Institutional International Trust / Annual Report / September 30, 2016 |
25 |
SCHEDULE OF INVESTMENTS
September 30, 2016
Emerging Market Equity Fund (Continued)
| Description | Shares | Market Value ($ Thousands) | ||||||
COMMON STOCK (continued) | ||||||||
SMI Holdings Group (A) | 9,116,000 | $ | 910 | |||||
Sunac China Holdings | 965,000 | 701 | ||||||
Sunny Optical Technology Group | 1,438,307 | 7,181 | ||||||
Techtronic Industries | 264,500 | 1,041 | ||||||
Tianneng Power International (A) | 1,382,000 | 1,190 | ||||||
|
|
| ||||||
| 112,843 | ||||||||
|
|
| ||||||
Hungary — 0.5% | ||||||||
Magyar Telekom | 142,287 | 233 | ||||||
MOL Hungarian Oil & Gas | 12,228 | 756 | ||||||
OTP Bank | 101,615 | 2,674 | ||||||
Richter Gedeon Nyrt | 208,630 | 4,237 | ||||||
|
|
| ||||||
| 7,900 | ||||||||
|
|
| ||||||
India — 8.6% | ||||||||
Apollo Tyres | 527,105 | 1,750 | ||||||
Aurobindo Pharma | 531,846 | 6,883 | ||||||
Axis Bank | 510,251 | 4,176 | ||||||
Bajaj Auto | 38,060 | 1,621 | ||||||
Bharat Financial Inclusion * | 140,923 | 1,877 | ||||||
Bharat Petroleum | 231,618 | 2,139 | ||||||
Cairn India | 775,375 | 2,351 | ||||||
Cummins India | 244,439 | 3,331 | ||||||
Dabur India | 777,782 | 3,174 | ||||||
Dewan Housing Finance | 588,410 | 2,524 | ||||||
DLF | 497,305 | 1,102 | ||||||
Glenmark Pharmaceuticals | 498,533 | 6,951 | ||||||
Grasim Industries | 9,632 | 701 | ||||||
HCL Technologies | 467,403 | 5,631 | ||||||
HDFC Bank ADR | 90,935 | 6,537 | ||||||
Hindustan Petroleum | 224,250 | 1,435 | ||||||
Hindustan Unilever | 200,898 | 2,621 | ||||||
Hindustan Zinc | 216,324 | 761 | ||||||
Housing Development Finance | 176,150 | 3,699 | ||||||
ICICI Bank ADR (A) | 926,391 | 6,920 | ||||||
IFCI | 2,704,652 | 1,074 | ||||||
Indian Oil | 150,526 | 1,321 | ||||||
IndusInd Bank | 127,465 | 2,302 | ||||||
Infosys | 397,586 | 6,198 | ||||||
Infosys ADR (A) | 85,520 | 1,350 | ||||||
ITC | 74,770 | 272 | ||||||
L&T Technology Services * | 58,766 | 748 | ||||||
Maruti Udyog | 46,890 | 3,881 | ||||||
NCC | 1,068,933 | 1,328 | ||||||
NHPC | 1,213,992 | 456 | ||||||
NTPC | 1,006,227 | 2,242 | ||||||
Parag Milk Foods *(B) | 380,505 | 1,679 | ||||||
Petronet LNG | 382,730 | 1,993 | ||||||
Power Finance | 848,588 | 1,542 | ||||||
Power Grid Corp of India | 1,255,794 | 3,340 | ||||||
Prestige Estates Projects | 563,460 | 1,639 | ||||||
Reliance Industries | 237,252 | 3,876 | ||||||
Reliance Industries GDR (B) | 414,382 | 13,602 | ||||||
Rural Electrification | 633,016 | 1,152 | ||||||
| Description | Shares | Market Value ($ Thousands) | ||||||
COMMON STOCK (continued) | ||||||||
SH Kelkar (B) | 337,509 | $ | 1,540 | |||||
Shriram Transport Finance | 178,331 | 3,133 | ||||||
Sun Pharmaceutical Industries | 18,398 | 206 | ||||||
Sun TV Network | 39,076 | 297 | ||||||
Tata Chemicals | 191,289 | 1,513 | ||||||
Tata Consultancy Services | 114,269 | 4,181 | ||||||
Tata Motors ADR (A) | 131,295 | 5,249 | ||||||
Vedanta | 783,762 | 2,045 | ||||||
Wipro | 163,131 | 1,175 | ||||||
Zee Entertainment Enterprises | 366,265 | 3,021 | ||||||
|
|
| ||||||
| 138,539 | ||||||||
|
|
| ||||||
Indonesia — 2.4% | ||||||||
Adaro Energy | 7,933,400 | 741 | ||||||
AKR Corporindo | 2,336,500 | 1,159 | ||||||
Astra International | 7,241,700 | 4,574 | ||||||
Bank Central Asia | 1,936,100 | 2,332 | ||||||
Bank Negara Indonesia Persero | 7,141,800 | 3,042 | ||||||
Bank Pembangunan Daerah Jawa Barat Dan Banten | 4,107,500 | 510 | ||||||
Bank Rakyat Indonesia Persero | 7,812,495 | 7,305 | ||||||
Bumi Serpong Damai | 10,509,800 | 1,780 | ||||||
Gudang Garam | 574,400 | 2,736 | ||||||
Indofood CBP Sukses Makmur | 561,800 | 408 | ||||||
Matahari Department Store | 1,368,600 | 1,944 | ||||||
Sumber Alfaria Trijaya | 34,848,100 | 1,397 | ||||||
Tambang Batubara Bukit Asam | 1,932,400 | 1,427 | ||||||
Telekomunikasi Indonesia Persero | 18,700,582 | 6,206 | ||||||
United Tractors | 2,132,353 | 2,894 | ||||||
|
|
| ||||||
| 38,455 | ||||||||
|
|
| ||||||
Italy — 0.0% | ||||||||
Prada | 139,100 | 447 | ||||||
|
|
| ||||||
Jordan — 0.1% | ||||||||
Hikma Pharmaceuticals (A) | 71,390 | 1,871 | ||||||
|
|
| ||||||
Kashmiri — 0.1% | ||||||||
Advanced Process Systems *(A) | 54,508 | 1,225 | ||||||
|
|
| ||||||
Malaysia — 0.7% | ||||||||
AirAsia | 4,435,000 | 2,992 | ||||||
AMMB Holdings | 435,100 | 431 | ||||||
Astro Malaysia Holdings | 1,974,679 | 1,303 | ||||||
Berjaya Sports Toto | 155,200 | 124 | ||||||
British American Tobacco Malaysia | 30,351 | 361 | ||||||
Inari Amertron | 2,278,375 | 1,829 | ||||||
IOI | 394,300 | 424 | ||||||
MISC BHD | 177,600 | 324 | ||||||
Petronas Chemicals Group | 319,000 | 513 | ||||||
Public Bank | 233,200 | 1,119 | ||||||
Sunway | 351,300 | 263 | ||||||
Tenaga Nasional | 94,200 | 326 | ||||||
Top Glove | 236,700 | 292 | ||||||
UEM Sunrise | 2,512,095 | 718 | ||||||
26 |
SEI Institutional International Trust / Annual Report / September 30, 2016 |
| Description | Shares | Market Value ($ Thousands) | ||||||
COMMON STOCK (continued) | ||||||||
Westports Holdings | 307,200 | $ | 326 | |||||
|
|
| ||||||
| 11,345 | ||||||||
|
|
| ||||||
Mexico — 3.6% | ||||||||
America Movil, Ser L | 2,379,574 | 1,360 | ||||||
America Movil ADR, Cl L (A) | 145,675 | 1,666 | ||||||
Cemex ADR * | 827,716 | 6,572 | ||||||
Coca-Cola Femsa ADR | 20,094 | 1,507 | ||||||
El Puerto de Liverpool | 37,000 | 388 | ||||||
Fomento Economico Mexicano | 514,900 | 4,748 | ||||||
Fomento Economico Mexicano ADR | 39,634 | 3,648 | ||||||
Gentera | 457,600 | 828 | ||||||
Grupo Aeroportuario del Pacifico, Cl B | 143,300 | 1,365 | ||||||
Grupo Bimbo, Ser A | 258,400 | 685 | ||||||
Grupo Financiero Banorte, Cl O | 2,235,390 | 11,757 | ||||||
Grupo Financiero Santander Mexico ADR (A) | 259,078 | 2,280 | ||||||
Grupo GICSA * | 1,772,100 | 1,154 | ||||||
Grupo Mexico, Ser B | 1,408,900 | 3,452 | ||||||
Grupo Televisa ADR | 188,703 | 4,848 | ||||||
Industrias Bachoco ADR | 5,760 | 289 | ||||||
Infraestructura Energetica Nova | 426,500 | 1,664 | ||||||
Inmobiliaria Vesta | 1,546,800 | 2,136 | ||||||
Kimberly-Clark de Mexico, Cl A | 170,700 | 387 | ||||||
Megacable Holdings | 117,700 | 453 | ||||||
Nemak (B) | 384,200 | 424 | ||||||
Promotora y Operadora de Infraestructura | 61,860 | 667 | ||||||
Unifin Financiera | 594,600 | 1,797 | ||||||
Wal-Mart de Mexico | 1,643,455 | 3,605 | ||||||
|
|
| ||||||
| 57,680 | ||||||||
|
|
| ||||||
Netherlands — 0.1% | ||||||||
VimpelCom ADR | 450,400 | 1,567 | ||||||
|
|
| ||||||
Pakistan — 0.3% | ||||||||
Engro Fertilizers | 2,550,000 | 1,505 | ||||||
United Bank | 1,660,800 | 3,161 | ||||||
|
|
| ||||||
| 4,666 | ||||||||
|
|
| ||||||
Peru — 0.7% | ||||||||
Cia de Minas Buenaventura ADR * | 217,847 | 3,015 | ||||||
Credicorp | 57,147 | 8,699 | ||||||
|
|
| ||||||
| 11,714 | ||||||||
|
|
| ||||||
Philippines — 1.0% | ||||||||
Aboitiz Equity Ventures | 459,410 | 720 | ||||||
Ayala | 171,180 | 3,032 | ||||||
BDO Unibank | 1,082,450 | 2,457 | ||||||
Cebu Air | 201,950 | 471 | ||||||
Globe Telecom | 7,585 | 321 | ||||||
GT Capital Holdings | 9,315 | 278 | ||||||
Metro Pacific Investments | 2,619,600 | 384 | ||||||
Metropolitan Bank & Trust | 1,255,500 | 2,216 | ||||||
Puregold Price Club | 844,500 | 741 | ||||||
SM Investments | 158,020 | 2,206 | ||||||
SM Prime Holdings | 1,722,621 | 1,003 | ||||||
| Description | Shares | Market Value ($ Thousands) | ||||||
COMMON STOCK (continued) | ||||||||
Universal Robina | 471,400 | $ | 1,736 | |||||
Vista Land & Lifescapes | 2,371,200 | 264 | ||||||
|
|
| ||||||
| 15,829 | ||||||||
|
|
| ||||||
Poland — 0.2% | ||||||||
Asseco Poland | 32,702 | 476 | ||||||
Energa (A) | 213,273 | 419 | ||||||
KGHM Polska Miedz | 22,099 | 431 | ||||||
PGE Polska Grupa Energetyczna | 310,307 | 823 | ||||||
Tauron Polska Energia * | 507,627 | 345 | ||||||
|
|
| ||||||
| 2,494 | ||||||||
|
|
| ||||||
Portugal — 0.3% | ||||||||
Galp Energia, Cl B | 135,018 | 1,848 | ||||||
Jeronimo Martins | 119,738 | 2,077 | ||||||
|
|
| ||||||
| 3,925 | ||||||||
|
|
| ||||||
Qatar — 0.2% | ||||||||
Barwa Real Estate | 119,577 | 1,111 | ||||||
Commercial Bank QSC | 62,585 | 663 | ||||||
Ooredoo QSC | 18,020 | 475 | ||||||
United Development | 64,728 | 363 | ||||||
|
|
| ||||||
| 2,612 | ||||||||
|
|
| ||||||
Romania — 0.0% | ||||||||
Banca Transilvania | 771,673 | 461 | ||||||
|
|
| ||||||
Russia — 5.6% | ||||||||
Etalon Group GDR | 56,800 | 156 | ||||||
Gazprom ADR | 1,835,598 | 7,758 | ||||||
Lukoil ADR (A) | 304,197 | 14,815 | ||||||
Magnit GDR (A) | 133,662 | 5,582 | ||||||
MegaFon GDR | 63,445 | 607 | ||||||
MMC Norilsk Nickel PJSC ADR | 111,295 | 1,780 | ||||||
Mobile TeleSystems ADR | 197,857 | 1,510 | ||||||
NovaTek GDR | 34,066 | 3,759 | ||||||
Novolipetsk Steel GDR | 296,454 | 3,839 | ||||||
Ros Agro GDR (A) | 41,447 | 550 | ||||||
Rosneft GDR | 899,352 | 4,925 | ||||||
Sberbank of Russia ADR (A) | 2,173,714 | 20,478 | ||||||
Severstal GDR | 140,054 | 1,673 | ||||||
Sistema GDR | 113,760 | 843 | ||||||
Surgutneftegas ADR | 104,761 | 507 | ||||||
Tatneft PAO ADR | 49,084 | 1,513 | ||||||
X5 Retail Group GDR * | 460,326 | 13,342 | ||||||
Yandex, Cl A * | 293,061 | 6,169 | ||||||
|
|
| ||||||
| 89,806 | ||||||||
|
|
| ||||||
South Africa — 4.7% | ||||||||
Alexander Forbes Group Holdings | 2,946,430 | 1,382 | ||||||
AngloGold Ashanti ADR * | 58,100 | 925 | ||||||
Aspen Pharmacare Holdings | 167,231 | 3,787 | ||||||
AVI | 119,322 | 817 | ||||||
Barclays Africa Group | 184,759 | 2,037 | ||||||
Bid | 149,405 | 2,816 | ||||||
Bidvest Group | 128,208 | 1,512 | ||||||
SEI Institutional International Trust / Annual Report / September 30, 2016 |
27 |
SCHEDULE OF INVESTMENTS
September 30, 2016
Emerging Market Equity Fund (Continued)
| Description | Shares | Market Value ($ Thousands) | ||||||
COMMON STOCK (continued) | ||||||||
Capitec Bank Holdings | 36,967 | $ | 1,732 | |||||
DataTec | 74,779 | 265 | ||||||
FirstRand | 1,755,976 | 6,080 | ||||||
Foschini Group | 52,192 | 532 | ||||||
Gold Fields | 280,900 | 1,370 | ||||||
Impala Platinum Holdings * | 215,405 | 1,091 | ||||||
Investec | 243,197 | 1,496 | ||||||
JSE | 35,284 | 412 | ||||||
Kumba Iron Ore *(A) | 103,757 | 946 | ||||||
Liberty Holdings | 278,807 | 2,370 | ||||||
Life Healthcare Group Holdings | 1,009,651 | 2,785 | ||||||
MMI Holdings | 271,382 | 444 | ||||||
Mondi | 94,515 | 1,986 | ||||||
MTN Group | 159,787 | 1,369 | ||||||
Murray & Roberts Holdings (A) | 420,128 | 340 | ||||||
Naspers, Cl N | 76,158 | 13,224 | ||||||
Nedbank Group | 160,900 | 2,609 | ||||||
Petra Diamonds * | 1,461,154 | 2,464 | ||||||
RMB Holdings | 102,036 | 437 | ||||||
Sappi * | 180,100 | 932 | ||||||
Sasol | 117,216 | 3,217 | ||||||
Sibanye Gold | 347,084 | 1,246 | ||||||
SPAR Group | 79,152 | 1,106 | ||||||
Standard Bank Group | 349,214 | 3,584 | ||||||
Steinhoff International Holdings | 407,370 | 2,327 | ||||||
Telkom | 407,975 | 1,800 | ||||||
Truworths International | 146,868 | 759 | ||||||
Tsogo Sun Holdings | 331,499 | 754 | ||||||
Vodacom Group | 182,741 | 2,052 | ||||||
Wilson Bayly Holmes-Ovcon | 45,758 | 513 | ||||||
Woolworths Holdings | 241,346 | 1,351 | ||||||
|
|
| ||||||
| 74,869 | ||||||||
|
|
| ||||||
South Korea — 13.3% | ||||||||
Amorepacific (A) | 589 | 209 | ||||||
BGF retail (A) | 25,565 | 4,480 | ||||||
CJ CGV (A) | 33,474 | 2,559 | ||||||
Com2uSCorp *(A) | 22,100 | 2,017 | ||||||
Coway (A) | 88,244 | 7,653 | ||||||
DGB Financial Group (A) | 123,841 | 1,021 | ||||||
Dongbu Insurance (A) | 38,832 | 2,405 | ||||||
Hana Financial Group (A) | 74,782 | 1,903 | ||||||
Hankook Tire (A) | 44,735 | 2,420 | ||||||
Hanssem | 16,530 | 2,658 | ||||||
Hanwha Techwin (A) | 55,938 | 3,254 | ||||||
Hite Jinro (A) | 52,224 | 1,071 | ||||||
Hugel *(A) | 2,010 | 777 | ||||||
Hyosung (A) | 24,866 | 2,958 | ||||||
Hyundai Development (A) | 152,022 | 7,120 | ||||||
Hyundai Marine & Fire Insurance (A) | 98,129 | 3,242 | ||||||
Hyundai Mobis (A) | 2,429 | 606 | ||||||
Hyundai Motor (A) | 37,232 | 4,603 | ||||||
Kangwon Land (A) | 52,205 | 1,863 | ||||||
| Description | Shares | Market Value ($ Thousands) | ||||||
COMMON STOCK (continued) | ||||||||
KB Financial Group (A) | 9,614 | $ | 330 | |||||
KB Financial Group ADR | 60,897 | 2,083 | ||||||
KCC (A) | 8,106 | 2,919 | ||||||
Kia Motors | 44,209 | 1,697 | ||||||
Korea Aerospace Industries (A) | 65,257 | 4,549 | ||||||
Korea Electric Power | 102,782 | 5,048 | ||||||
KT&G (A) | 48,802 | 5,545 | ||||||
LG (A) | 31,077 | 1,833 | ||||||
LG Chem (A) | 18,563 | 4,112 | ||||||
LG Display (A) | 15,433 | 395 | ||||||
LG Uplus | 241,784 | 2,581 | ||||||
Lotte Chemical (A) | 5,161 | 1,410 | ||||||
Lotte Chilsung Beverage (A) | 1,705 | 2,478 | ||||||
Lotte Confectionery (A) | 16,137 | 2,582 | ||||||
LS Cable (A) | 18,346 | 973 | ||||||
LS Industrial Systems (A) | 24,551 | 940 | ||||||
Mando (A) | 15,043 | 3,374 | ||||||
NAVER (A) | 11,638 | 9,364 | ||||||
NCSoft (A) | 29,811 | 8,046 | ||||||
Orion (A) | 5,114 | 3,853 | ||||||
Poongsan (A) | 35,048 | 1,081 | ||||||
POSCO (A) | 25,277 | 5,222 | ||||||
Posco Daewoo (A) | 52,222 | 1,170 | ||||||
Samlip General Foods (A) | 6,991 | 1,262 | ||||||
Samsung Electronics (A) | 33,172 | 48,354 | ||||||
Samsung Life Insurance (A) | 25,835 | 2,475 | ||||||
SFA Engineering (A) | 50,588 | 2,486 | ||||||
Shinhan Financial Group (A) | 42,035 | 1,534 | ||||||
SK Hynix (A) | 374,988 | 13,795 | ||||||
SK Innovation (A) | 13,118 | 1,942 | ||||||
SK Telecom | 8,435 | 1,734 | ||||||
SK Telecom ADR | 345,820 | 7,815 | ||||||
Tongyang Life Insurance (A) | 57,460 | 594 | ||||||
Viatron Technologies (A) | 35,500 | 901 | ||||||
Vieworks (A) | 36,108 | 2,139 | ||||||
Woori Bank * | 171,561 | 1,776 | ||||||
Yuhan (A) | 7,599 | 1,921 | ||||||
|
|
| ||||||
| 213,132 | ||||||||
|
|
| ||||||
Taiwan — 10.7% | ||||||||
Accton Technology | 1,827,700 | 2,873 | ||||||
Advanced Ceramic X | 252,400 | 1,763 | ||||||
Advanced Semiconductor Engineering | 5,936,570 | 7,149 | ||||||
Airtac International Group | 288,681 | 2,596 | ||||||
Asustek Computer | 257,000 | 2,300 | ||||||
AU Optronics | 2,663,000 | 984 | ||||||
Catcher Technology | 674,040 | 5,531 | ||||||
Cathay Financial Holding | 1,813,004 | 2,336 | ||||||
Chailease Holding | 883,404 | 1,575 | ||||||
Cheng Shin Rubber Industry | 730,000 | 1,543 | ||||||
Chunghwa Telecom | 111,000 | 392 | ||||||
Compal Electronics | 2,423,000 | 1,500 | ||||||
Delta Electronics | 924,100 | 4,959 | ||||||
28 |
SEI Institutional International Trust / Annual Report / September 30, 2016 |
| Description | Shares | Market Value ($ Thousands) | ||||||
COMMON STOCK (continued) | ||||||||
Eclat Textile | 397,006 | $ | 4,774 | |||||
Elite Advanced Laser | 124 | – | ||||||
eMemory Technology | 203,800 | 2,178 | ||||||
Ennoconn | 42,000 | 701 | ||||||
Farglory Land Development | 471,043 | 562 | ||||||
FLEXium Interconnect | 236,000 | 710 | ||||||
Formosa Chemicals & Fibre | 296,000 | 800 | ||||||
Formosa Petrochemical | 340,000 | 1,026 | ||||||
Formosa Plastics | 272,000 | 678 | ||||||
Foxconn Technology | 1,235,230 | 3,646 | ||||||
Fubon Financial Holding | 2,900,000 | 4,318 | ||||||
Hermes Microvision | 106,600 | 4,608 | ||||||
Highwealth Construction | 1,836,100 | 2,856 | ||||||
Hiwin Technologies | 197,503 | 1,041 | ||||||
Hon Hai Precision Industry | 3,299,304 | 8,344 | ||||||
Hota Industrial Manufacturing | 1,128,884 | 5,545 | ||||||
Hu Lane Associate | 364,600 | 1,820 | ||||||
Inventec | 1,980,000 | 1,624 | ||||||
Kenda Rubber Industrial | 229,197 | 366 | ||||||
Kingpak Technology | 190,911 | 1,014 | ||||||
King’s Town Bank | 424,000 | 359 | ||||||
Largan Precision | 22,446 | 2,750 | ||||||
Lite-On Technology | 1,739,937 | 2,511 | ||||||
MediaTek | 865,100 | 6,691 | ||||||
Merida Industry | 397,000 | 1,882 | ||||||
Micro-Star International | 606,000 | 1,582 | ||||||
Parade Technologies | 282,600 | 2,881 | ||||||
Pegatron | 966,000 | 2,504 | ||||||
Phison Electronics | 98,000 | 744 | ||||||
Powertech Technology | 1,263,000 | 3,291 | ||||||
Realtek Semiconductor | 380,173 | 1,258 | ||||||
Silicon Motion Technology ADR | 78,339 | 4,057 | ||||||
Simplo Technology | 474,000 | 1,558 | ||||||
Taiwan Semiconductor Manufacturing | 6,908,217 | 40,475 | ||||||
Taiwan Semiconductor Manufacturing ADR | 369,294 | 11,297 | ||||||
Tung Thih Electronic | 120,000 | 1,681 | ||||||
Uni-President Enterprises | 474,000 | 892 | ||||||
Vanguard International Semiconductor | 558,000 | 1,043 | ||||||
Wistron | 844,771 | 633 | ||||||
WPG Holdings | 1,321,000 | 1,569 | ||||||
|
|
| ||||||
| 171,770 | ||||||||
|
|
| ||||||
Thailand — 1.9% | ||||||||
AP Thailand NVDR | 2,502,800 | 525 | ||||||
Bangkok Bank NVDR (A) | 53,200 | 251 | ||||||
Bangkok Bank Foreign | 376,600 | 1,778 | ||||||
Bangkok Dusit Medical Services | 2,282,000 | 1,438 | ||||||
Bangkok Dusit Medical Services, | 378,200 | 238 | ||||||
Bangkok Expressway & Metro | 7,148,200 | 1,423 | ||||||
CP ALL | 1,162,700 | 2,073 | ||||||
CP Seven Eleven PCL | 253,700 | 452 | ||||||
Delta Electronics Thai | 107,400 | 246 | ||||||
Delta Electronics Thailand | 601,300 | 1,379 | ||||||
| Description | Shares | Market Value ($ Thousands) | ||||||
COMMON STOCK (continued) | ||||||||
Home Product Center | 3,186,600 | $ | 924 | |||||
IRPC | 3,918,600 | 525 | ||||||
Krung Thai Bank NVDR | 1,633,900 | 834 | ||||||
Land & Houses | 3,796,500 | 985 | ||||||
Land and Houses PCL NVDR | 5,120,389 | 1,325 | ||||||
PTT | 237,150 | 2,350 | ||||||
PTT Global Chemical | 1,474,600 | 2,525 | ||||||
PTT Global Chemical NVDR | 358,200 | 612 | ||||||
Siam Cement | 113,400 | 1,698 | ||||||
Siam Commercial Bank | 363,600 | 1,562 | ||||||
Sino-Thai Engineering & Construction NVDR | 1,725,485 | 1,184 | ||||||
Thai Oil (A) | 1,015,900 | 2,018 | ||||||
Thai Union Group NVDR | 2,262,500 | 1,399 | ||||||
Thanachart Capital NVDR (A) | 971,100 | 1,140 | ||||||
Tisco Financial Group | 276,600 | 421 | ||||||
Tisco Financial Group NVDR (A) | 564,300 | 857 | ||||||
|
|
| ||||||
| 30,162 | ||||||||
|
|
| ||||||
Turkey — 1.8% | ||||||||
Akbank | 1,536,028 | 4,123 | ||||||
Anadolu Efes Biracilik Ve Malt | 192,588 | 1,167 | ||||||
Arcelik | 75,036 | 530 | ||||||
Aselsan Elektronik Sanayi Ve | 684,998 | 2,152 | ||||||
Emlak Konut Gayrimenkul Yatirim Ortakligi ‡ | 3,579,202 | 3,634 | ||||||
Eregli Demir ve Celik Fabrikalari | 783,836 | 1,082 | ||||||
Ford Otomotiv Sanayi | 72,684 | 767 | ||||||
KOC Holding | 199,417 | 858 | ||||||
Petkim Petrokimya Holding | 353,499 | 537 | ||||||
TAV Havalimanlari Holding | 163,819 | 679 | ||||||
Tekfen Holding | 287,418 | 741 | ||||||
Tofas Turk Otomobil Fabrikasi | 359,212 | 2,625 | ||||||
Turk Hava Yollari *(A) | 176,863 | 304 | ||||||
Turkcell Iletisim Hizmetleri ADR * | 114,135 | 920 | ||||||
Turkiye Garanti Bankasi | 1,009,836 | 2,682 | ||||||
Turkiye Is Bankasi, Cl C (A) | 785,712 | 1,246 | ||||||
Turkiye Sise ve Cam Fabrikalari | 442,368 | 470 | ||||||
Ulker Biskuvi Sanayi | 393,364 | 2,807 | ||||||
Yapi ve Kredi Bankasi * | 693,656 | 850 | ||||||
|
|
| ||||||
| 28,174 | ||||||||
|
|
| ||||||
United Arab Emirates — 0.8% | ||||||||
Abu Dhabi Commercial Bank | 560,791 | 985 | ||||||
Air Arabia | 674,275 | 250 | ||||||
Aldar Properties | 1,771,304 | 1,288 | ||||||
Dubai Investments | 1,769,896 | 999 | ||||||
Dubai Islamic Bank | 1,205,886 | 1,780 | ||||||
Emaar Properties | 3,586,838 | 6,922 | ||||||
First Gulf Bank PJSC | 286,734 | 921 | ||||||
|
|
| ||||||
| 13,145 | ||||||||
|
|
| ||||||
United Kingdom — 0.6% | ||||||||
Kazakhmys * | 179,637 | 517 | ||||||
SABMiller (A) | 63,930 | 3,737 | ||||||
SEI Institutional International Trust / Annual Report / September 30, 2016 |
29 |
SCHEDULE OF INVESTMENTS
September 30, 2016
Emerging Market Equity Fund (Concluded)
| Description | Shares | Market Value ($ Thousands) | ||||||
COMMON STOCK (continued) | ||||||||
Tullow Oil * | 1,789,845 | $ | 5,906 | |||||
|
|
| ||||||
| 10,160 | ||||||||
|
|
| ||||||
United States — 0.2% | ||||||||
Freeport-McMoRan * | 184,990 | 2,009 | ||||||
PriceSmart | 13,465 | 1,128 | ||||||
|
|
| ||||||
| 3,137 | ||||||||
|
|
| ||||||
Total Common Stock | 1,486,860 | |||||||
|
|
| ||||||
Number of Participation Notes | ||||||||
PARTICIPATION NOTES — 2.6% | ||||||||
China — 0.6% | ||||||||
Hangzhou Hikvi, Expires 08/01/2017 * | 1,354,693 | 4,978 | ||||||
Huangshan Tourism Development, Expires 11/06/2020 * | 237,492 | 613 | ||||||
Poly Real Estate Group, Expires 02/21/2021 * | 2,238,800 | 3,223 | ||||||
Wuliangye Yibin, Expires 06/29/2020 * | 301,000 | 1,505 | ||||||
|
|
| ||||||
| 10,319 | ||||||||
|
|
| ||||||
India — 1.3% | ||||||||
Axis Bank, Expires 06/13/2018 * | 499,087 | 4,054 | ||||||
Britannia Industries, Expires 05/03/2021 * | 68,680 | 3,476 | ||||||
IRB Infrastructure Developers, Expires 06/25/2020 * | 587,620 | 2,161 | ||||||
Tata Motors, Expires 06/25/2020 * | 899,473 | 7,218 | ||||||
Zee Entertainment Enterprises, Expires 09/03/2019 * | 377,347 | 3,096 | ||||||
|
|
| ||||||
| 20,005 | ||||||||
|
|
| ||||||
Saudi Arabia — 0.1% | ||||||||
Al Tayyar, Expires 03/05/2018 * | 43,600 | 319 | ||||||
Al Tayyar Travel Group, Expires 03/05/2018 * | 12,884 | 94 | ||||||
Al Tayyar Travel Group, Expires 03/05/2018 * | 94,180 | 694 | ||||||
Mouwasat Medical Services, Expires 09/20/2017 * | 22,699 | 711 | ||||||
|
|
| ||||||
| 1,818 | ||||||||
|
|
| ||||||
Switzerland — 0.3% | ||||||||
CITIC Securities, Expires 10/22/2019 * | 691,727 | 1,672 | ||||||
Goertek, Expires 09/14/2021 * | 628,000 | 2,848 | ||||||
|
|
| ||||||
| 4,520 | ||||||||
|
|
| ||||||
United States — 0.2% | ||||||||
Motherson Sumi Systems, Expires 09/21/2021 * | 735,773 | 3,517 | ||||||
|
|
| ||||||
Vietnam — 0.1% | ||||||||
Hoa Phat Group, Expires 07/24/2018 * | 517,672 | 1,050 | ||||||
|
|
| ||||||
Total Participation Notes | 41,229 | |||||||
|
|
| ||||||
| Description | Shares | Market Value ($ Thousands) | ||||||
PREFERRED STOCK — 2.0% | ||||||||
Brazil — 1.8% | ||||||||
Banco Bradesco * | 295,920 | $ | 2,727 | |||||
Banco BTG Pactual * | 79,899 | 100 | ||||||
Braskem | 149,500 | 1,154 | ||||||
Cia Brasileira de Distribuicao | 58,600 | 964 | ||||||
Cia Brasileira de Distribuicao Grupo Pao de Acucar ADR (A) | 144,737 | 2,372 | ||||||
Cia Energetica de Minas Gerais | 239,800 | 633 | ||||||
Cia Paranaense de Energia | 139,600 | 1,454 | ||||||
Itau Unibanco Holding | 695,906 | 7,658 | ||||||
Itau Unibanco Holding ADR | 523,504 | 5,727 | ||||||
Itausa - Investimentos Itau | 558,084 | 1,440 | ||||||
Petroleo Brasileiro ADR, Cl A * | 344,317 | 2,861 | ||||||
Suzano Papel e Celulose, Cl A | 443,700 | 1,434 | ||||||
Telefonica Brasil | 28,300 | 413 | ||||||
Vale ADR, Cl B * | 59,211 | 279 | ||||||
|
|
| ||||||
| 29,216 | ||||||||
|
|
| ||||||
Colombia — 0.0% | ||||||||
Banco Davivienda | 10,030 | 103 | ||||||
Bancolombia | 62,401 | 605 | ||||||
|
|
| ||||||
| 708 | ||||||||
|
|
| ||||||
South Korea — 0.2% | ||||||||
Samsung Electronics (A) | 2,172 | 2,547 | ||||||
|
|
| ||||||
Total Preferred Stock | 32,471 | |||||||
|
|
| ||||||
EXCHANGE TRADED FUND — 1.3% | ||||||||
United States — 1.3% | ||||||||
iShares MSCI Emerging Markets ETF | 563,850 | 21,116 | ||||||
|
|
| ||||||
Total Exchange Traded Fund | 21,116 | |||||||
|
|
| ||||||
Face Amount (Thousands) | ||||||||
DEBENTURE BOND — 0.0% | ||||||||
Brazil — 0.0% | ||||||||
Vale, Ser 1997 | ||||||||
0.000%, 09/30/2049 (C) | BRL | 8 | – | |||||
|
|
| ||||||
Total Debenture Bond | – | |||||||
|
|
| ||||||
30 |
SEI Institutional International Trust / Annual Report / September 30, 2016 |
| Description | Shares | Market Value ($ Thousands) | ||||||
AFFILIATED PARTNERSHIP — 15.3% |
| |||||||
SEI Liquidity Fund, L.P. | ||||||||
0.430% **†(D) | 245,980,931 | $ | 245,981 | |||||
|
|
| ||||||
Total Affiliated Partnership | 245,981 | |||||||
|
|
| ||||||
CASH EQUIVALENT — 0.4% |
| |||||||
SEI Daily Income Trust, Government Fund, Cl A | ||||||||
0.220%**† | 6,665,105 | 6,665 | ||||||
|
|
| ||||||
Total Cash Equivalent |
| 6,665 | ||||||
|
|
| ||||||
Total Investments — 114.3% |
| $ | 1,834,322 | |||||
|
|
| ||||||
| Percentages are based on Net Assets of $1,605,178 ($ Thousands). |
| * | Non-income producing security. |
| ** | Rate shown is the 7-day effective yield as of September 30, 2016. |
| † | Investment in Affiliated Security (see Note 5). |
| ‡ | Real Estate Investment Trust. |
| (A) | This security or a partial position of this security is on loan at September 30, 2016 (see Note 9). The total market value of securities on loan at September 30, 2016 was $231,057 ($ Thousands). |
| (B) | Security exempt from registration under Rule 144A of the Securities Act of 1933. These securities may be resold in transactions exempt from registration normally to qualified institutions. On September 30, 2016, the value of these securities amounted to $22,269 ($ Thousands), representing 1.4% of the net assets of the Fund. |
| (C) | Variable Rate Security — The rate reported on the Schedule of Investments is the rate in effect as of September 30, 2016. |
| (D) | This security was purchased with cash collateral held from securities on loan (see Note 9). The total market value of such securities as of September 30, 2016 was $245,981 ($ Thousands). |
ADR — American Depositary Receipt
BRL — Brazilian Real
Cl — Class
ETF — Exchange Traded Fund
GDR — Global Depositary Receipt
MSCI — Morgan Stanley Capital International
NVDR — Non-Voting Depositary Receipt
L.P. — Limited Partnership
Ser — Series
The following is a list of the level of inputs used as of September 30, 2016, in valuing the Fund’s investments carried at value ($ Thousands):
| Investments in Securities | Level 1 | Level 2 | Level 3 | Total | ||||||||||||
Common Stock | $ | 497,828 | $ | 989,032 | $ | — | $ | 1,486,860 | ||||||||
Participation Notes | — | 41,229 | — | 41,229 | ||||||||||||
Preferred Stock | 29,824 | 2,647 | — | 32,471 | ||||||||||||
Exchange Traded Fund | 21,116 | — | — | 21,116 | ||||||||||||
Debenture Bond | — | — | — | — | ||||||||||||
Affiliated Partnership | — | 245,981 | — | 245,981 | ||||||||||||
Cash Equivalent | 6,665 | — | — | 6,665 | ||||||||||||
|
|
|
|
|
|
|
| |||||||||
Total Investments in Securities | $ | 555,433 | $ | 1,278,889 | $ | — | $ | 1,834,322 | ||||||||
|
|
|
|
|
|
|
| |||||||||
For the year ended September 30, 2016, there were transfers between Level 1 and Level 2 assets and liabilities. The primary reason for changes in the classifications between Levels 1 and 2 occurs when foreign equity securities are fair valued using other observable market-based inputs in place of the closing exchange price due to events occurring after the close of the exchange or market on which the investment is principally traded.
For the year ended September 30, 2016, there were no transfers between Level 2 and Level 3 assets and liabilities.
For more information on valuation inputs, see Note 2 – Significant Accounting Policies in Notes to Financial Statements.
Amounts designated as “—” are $0 or have been rounded to $0.
The accompanying notes are an integral part of the financial statements.
SEI Institutional International Trust / Annual Report / September 30, 2016 |
31 |
SCHEDULE OF INVESTMENTS
September 30, 2016
International Fixed Income Fund
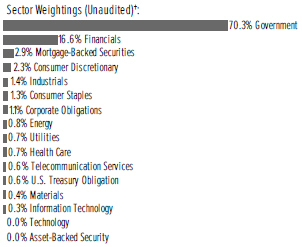
†Percentages based on total investments.
| Description | Face Amount (Thousands) | Market Value ($ Thousands) | ||||||||
GLOBAL BONDS — 93.7% | ||||||||||
Angola — 0.1% | ||||||||||
Republic of Angola Via Northern Lights III | ||||||||||
7.000%, 08/16/2019 | $ | 289 | $ | 289 | ||||||
|
|
| ||||||||
Argentina — 0.2% | ||||||||||
Argentine Republic Government International Bond | ||||||||||
6.875%, 04/22/2021 (A) | 245 | 267 | ||||||||
Provincia de Cordoba | ||||||||||
7.125%, 06/10/2021 (A) | 280 | 294 | ||||||||
|
|
| ||||||||
| 561 | ||||||||||
|
|
| ||||||||
Australia — 2.2% | ||||||||||
Australia & New Zealand Banking Group MTN | ||||||||||
3.625%, 07/18/2022 | EUR | 300 | 409 | |||||||
Commonwealth Bank of Australia MTN | ||||||||||
1.375%, 01/22/2019 | 560 | 653 | ||||||||
Government of Australia | ||||||||||
4.500%, 04/15/2020 | AUD | 270 | 228 | |||||||
4.500%, 04/21/2033 | 285 | 284 | ||||||||
4.250%, 04/21/2026 | 900 | 829 | ||||||||
3.750%, 04/21/2037 | 900 | 823 | ||||||||
2.750%, 04/21/2024 | 1,785 | 1,454 | ||||||||
Government of Australia , Ser 122 | ||||||||||
5.250%, 03/15/2019 | 2,000 | 1,667 | ||||||||
Government of Australia , Ser 124 | ||||||||||
5.750%, 05/15/2021 | 3,400 | 3,081 | ||||||||
National Australia Bank MTN | ||||||||||
2.625%, 01/13/2017 | EUR | 370 | 419 | |||||||
Queensland Treasury , Ser 17 | ||||||||||
6.000%, 09/14/2017 | AUD | 780 | 621 | |||||||
Westpac Banking MTN | ||||||||||
1.500%, 03/24/2021 | EUR | 220 | 265 | |||||||
| Description | Face Amount (Thousands) | Market Value ($ Thousands) | ||||||||
GLOBAL BONDS (continued) | ||||||||||
1.375%, 04/17/2020 | EUR | 230 | $ | 273 | ||||||
|
|
| ||||||||
| 11,006 | ||||||||||
|
|
| ||||||||
Austria — 0.2% | ||||||||||
Austria Government Bond | ||||||||||
0.750%, 10/20/2026 (A) | 190 | 227 | ||||||||
Republic of Austria | ||||||||||
4.150%, 03/15/2037 (A) | 115 | 220 | ||||||||
3.650%, 04/20/2022 (A) | 290 | 401 | ||||||||
3.150%, 06/20/2044 (A) | 150 | 272 | ||||||||
1.950%, 06/18/2019 (A) | 280 | 336 | ||||||||
|
|
| ||||||||
| 1,456 | ||||||||||
|
|
| ||||||||
Belgium — 2.2% | ||||||||||
Anheuser-Busch InBev MTN | ||||||||||
2.750%, 03/17/2036 | 75 | 101 | ||||||||
2.000%, 03/17/2028 | 510 | 641 | ||||||||
1.500%, 03/17/2025 | 1,150 | 1,382 | ||||||||
0.875%, 03/17/2022 | 560 | 652 | ||||||||
Belgium Government Bond | ||||||||||
2.150%, 06/22/2066 (A) | 1,100 | 1,561 | ||||||||
KBC Group MTN | ||||||||||
2.375%, 11/25/2024 (B) | 2,000 | 2,333 | ||||||||
Kingdom of Belgium | ||||||||||
3.750%, 06/22/2045 | 393 | 752 | ||||||||
3.000%, 06/22/2034 (A) | 350 | 552 | ||||||||
1.000%, 06/22/2031 (A) | 710 | 852 | ||||||||
0.800%, 06/22/2025 (A) | 715 | 860 | ||||||||
Kingdom of Belgium , Ser 44 | ||||||||||
5.000%, 03/28/2035 (A) | 150 | 298 | ||||||||
Kingdom of Belgium , Ser 58 | ||||||||||
3.750%, 09/28/2020 (A) | 496 | 654 | ||||||||
Kingdom of Belgium , Ser 69 | ||||||||||
1.250%, 06/22/2018 | 545 | 633 | ||||||||
|
|
| ||||||||
| 11,271 | ||||||||||
|
|
| ||||||||
Brazil — 1.1% | ||||||||||
Brazil Notas do Tesouro Nacional, Serie F | ||||||||||
10.000%, 01/01/2025 | BRL | 9,450 | 2,676 | |||||||
10.000%, 01/01/2027 | 9,001 | 2,508 | ||||||||
Embraer Overseas | ||||||||||
5.696%, 09/16/2023 | $ | 40 | 42 | |||||||
Minerva Luxembourg | ||||||||||
6.500%, 09/20/2026 (A) | 290 | 285 | ||||||||
Petrobras Global Finance | ||||||||||
8.375%, 05/23/2021 | 185 | 202 | ||||||||
|
|
| ||||||||
| 5,713 | ||||||||||
|
|
| ||||||||
Canada — 6.5% | ||||||||||
Bank of Nova Scotia MTN | ||||||||||
0.750%, 09/17/2021 | EUR | 570 | 669 | |||||||
Bell Canada | ||||||||||
3.350%, 06/18/2019 | CAD | 29 | 23 | |||||||
Bell Canada MTN | ||||||||||
4.700%, 09/11/2023 | 80 | 70 | ||||||||
32 |
SEI Institutional International Trust / Annual Report / September 30, 2016 |
| Description | Face Amount (Thousands) | Market Value ($ Thousands) | ||||||||
GLOBAL BONDS (continued) | ||||||||||
3.250%, 06/17/2020 | CAD | 95 | $ | 76 | ||||||
Canada Housing Trust No. 1 | ||||||||||
3.800%, 06/15/2021 (A) | 6,785 | 5,824 | ||||||||
Canadian Government Bond | ||||||||||
0.750%, 09/01/2021 | 1,790 | 1,372 | ||||||||
CDP Financial | ||||||||||
4.400%, 11/25/2019 (A) | $ | 850 | 927 | |||||||
Cenovus Energy | ||||||||||
5.700%, 10/15/2019 | 89 | 96 | ||||||||
3.000%, 08/15/2022 | 22 | 21 | ||||||||
Government of Canada | ||||||||||
5.750%, 06/01/2033 | CAD | 1,380 | 1,706 | |||||||
4.000%, 06/01/2041 | 1,000 | 1,121 | ||||||||
3.500%, 12/01/2045 | 3,450 | 3,730 | ||||||||
2.250%, 06/01/2025 | 2,207 | 1,870 | ||||||||
1.750%, 09/01/2019 | 1,000 | 788 | ||||||||
0.750%, 03/01/2021 | 5,245 | 4,022 | ||||||||
Muskrat Falls | ||||||||||
3.630%, 06/01/2029 (A) | 340 | 305 | ||||||||
NOVA Chemicals | ||||||||||
5.250%, 08/01/2023 (A) | $ | 150 | 153 | |||||||
Province of British Columbia | ||||||||||
3.250%, 12/18/2021 | CAD | 1,150 | 966 | |||||||
2.250%, 03/01/2019 | 575 | 453 | ||||||||
Province of Manitoba Canada | ||||||||||
3.850%, 12/01/2021 | 710 | 609 | ||||||||
Province of Ontario Canada | ||||||||||
3.500%, 06/02/2024 | 1,200 | 1,038 | ||||||||
3.450%, 06/02/2045 | 245 | 217 | ||||||||
2.600%, 06/02/2025 | 1,614 | 1,315 | ||||||||
2.400%, 06/02/2026 | 2,685 | 2,145 | ||||||||
Province of Quebec Canada | ||||||||||
3.500%, 12/01/2045 | 145 | 128 | ||||||||
3.000%, 09/01/2023 | 500 | 417 | ||||||||
2.750%, 09/01/2025 | 2,175 | 1,787 | ||||||||
Rogers Communications | ||||||||||
4.000%, 06/06/2022 | 165 | 138 | ||||||||
Royal Bank of Canada | ||||||||||
1.625%, 08/04/2020 | EUR | 290 | 349 | |||||||
Yamana Gold | ||||||||||
4.950%, 07/15/2024 | $ | 286 | 295 | |||||||
|
|
| ||||||||
| 32,630 | ||||||||||
|
|
| ||||||||
China — 0.1% | ||||||||||
Sinopec Group Overseas Development | ||||||||||
2.625%, 10/17/2020 | EUR | 240 | 292 | |||||||
Tencent Holdings MTN | ||||||||||
3.375%, 05/02/2019 (A) | 390 | 404 | ||||||||
|
|
| ||||||||
| 696 | ||||||||||
|
|
| ||||||||
Colombia — 0.2% | ||||||||||
Colombian TES | ||||||||||
7.000%, 05/04/2022 | COP | 2,678,900 | 946 | |||||||
| Description | Face Amount (Thousands) | Market Value ($ Thousands) | ||||||||
GLOBAL BONDS (continued) | ||||||||||
Ecopetrol | ||||||||||
7.375%, 09/18/2043 | $ | 121 | $ | 127 | ||||||
5.875%, 05/28/2045 | 109 | 100 | ||||||||
|
|
| ||||||||
| 1,173 | ||||||||||
|
|
| ||||||||
Croatia — 0.1% | ||||||||||
Croatia Government International Bond | ||||||||||
3.875%, 05/30/2022 | EUR | 240 | 292 | |||||||
|
|
| ||||||||
Czech Republic — 0.1% | ||||||||||
Government of Czech Republic | ||||||||||
4.700%, 09/12/2022 | CZK | 4,150 | 222 | |||||||
Government of Czech Republic , Ser 51 | ||||||||||
4.000%, 04/11/2017 | 8,050 | 343 | ||||||||
|
|
| ||||||||
| 565 | ||||||||||
|
|
| ||||||||
Denmark — 0.4% | ||||||||||
Danske Bank | ||||||||||
3.875%, 10/04/2023 (B) | EUR | 375 | 449 | |||||||
3.500%, 04/16/2018 | 155 | 184 | ||||||||
2.000%, 09/08/2021 (A) | $ | 360 | 360 | |||||||
Danske Bank MTN | ||||||||||
5.375%, 09/29/2021 (B) | GBP | 170 | 234 | |||||||
Kingdom of Denmark | ||||||||||
4.500%, 11/15/2039 | DKK | 1,300 | 369 | |||||||
4.000%, 11/15/2017 | 1,600 | 254 | ||||||||
1.500%, 11/15/2023 | 670 | 113 | ||||||||
|
|
| ||||||||
| 1,963 | ||||||||||
|
|
| ||||||||
Finland — 0.1% | ||||||||||
Government of Finland | ||||||||||
2.625%, 07/04/2042 (A) | EUR | 55 | 93 | |||||||
1.500%, 04/15/2023 (A) | 340 | 429 | ||||||||
|
|
| ||||||||
| 522 | ||||||||||
|
|
| ||||||||
France — 6.8% | ||||||||||
Air Liquide Finance | ||||||||||
2.250%, 09/27/2023 (A) | $ | 370 | 371 | |||||||
BNP Paribas | ||||||||||
5.019%, 12/31/2049 (B) | EUR | 250 | 286 | |||||||
BNP Paribas Home Loan MTN | ||||||||||
3.125%, 03/22/2022 | 200 | 267 | ||||||||
BPCE | ||||||||||
5.250%, 04/16/2029 | GBP | 100 | 150 | |||||||
1.750%, 11/29/2019 | EUR | 600 | 719 | |||||||
BPCE MTN(B) | ||||||||||
6.117%, 10/29/2049 | 150 | 178 | ||||||||
2.750%, 11/30/2027 | 900 | 1,047 | ||||||||
Bureau Veritas | ||||||||||
3.125%, 01/21/2021 | 100 | 123 | ||||||||
Caisse Centrale du Credit Immobilier de France MTN | ||||||||||
1.125%, 04/22/2019 | 100 | 117 | ||||||||
Caisse de Refinancement de l’Habitat | ||||||||||
3.750%, 12/12/2016 | 400 | 453 | ||||||||
SEI Institutional International Trust / Annual Report / September 30, 2016 |
33 |
SCHEDULE OF INVESTMENTS
September 30, 2016
International Fixed Income Fund (Continued)
| Description | Face Amount (Thousands) | Market Value ($ Thousands) | ||||||||
GLOBAL BONDS (continued) | ||||||||||
3.500%, 04/25/2017 | EUR | 350 | $ | 402 | ||||||
Caisse Francaise de Financement Local MTN | ||||||||||
4.875%, 07/03/2017 | 220 | 257 | ||||||||
3.625%, 02/26/2018 | 63 | 75 | ||||||||
Casino Guichard Perrachon MTN | ||||||||||
4.407%, 08/06/2019 | 700 | 868 | ||||||||
Credit Agricole | ||||||||||
6.637%, 05/29/2049 (B) | $ | 515 | 514 | |||||||
Credit Agricole Assurances | ||||||||||
4.750%, 09/27/2048 (B) | EUR | 400 | 451 | |||||||
Credit Agricole Home Loan | ||||||||||
3.250%, 03/23/2017 | 100 | 114 | ||||||||
Dexia Credit Local MTN | ||||||||||
2.000%, 01/22/2021 | 200 | 246 | ||||||||
1.625%, 10/29/2018 | 565 | 660 | ||||||||
1.375%, 09/18/2019 | 500 | 589 | ||||||||
0.625%, 01/21/2022 | 1,550 | 1,810 | ||||||||
Electricite de France | ||||||||||
6.500%, 01/26/2019 (A) | $ | 250 | 277 | |||||||
Elis | ||||||||||
3.000%, 04/30/2022 | 250 | 282 | ||||||||
Europcar Groupe | ||||||||||
5.750%, 06/15/2022 | EUR | 145 | 167 | |||||||
France Government Bond OAT | ||||||||||
0.500%, 05/25/2025 | 2,190 | 2,573 | ||||||||
0.500%, 05/25/2026 | 3,620 | 4,215 | ||||||||
0.250%, 11/25/2020 | 450 | 521 | ||||||||
0.000%, 05/25/2020 | 1,590 | 1,822 | ||||||||
0.000%, 05/25/2021 | 750 | 860 | ||||||||
Government of France | ||||||||||
4.750%, 04/25/2035 | 85 | 164 | ||||||||
4.500%, 04/25/2041 | 220 | 447 | ||||||||
4.000%, 10/25/2038 | 285 | 529 | ||||||||
3.250%, 05/25/2045 | 1,290 | 2,271 | ||||||||
2.500%, 05/25/2030 | 1,975 | 2,839 | ||||||||
1.750%, 05/25/2023 | 1,900 | 2,427 | ||||||||
0.500%, 11/25/2019 | 1,340 | 1,558 | ||||||||
Loxam SAS | ||||||||||
7.000%, 07/23/2022 | 150 | 182 | ||||||||
Rexel | ||||||||||
3.250%, 06/15/2022 | 240 | 276 | ||||||||
SCOR | ||||||||||
3.000%, 06/08/2046 (B) | 1,000 | 1,140 | ||||||||
SES | ||||||||||
3.600%, 04/04/2023 (A) | $ | 425 | 433 | |||||||
Societe Generale (B) | ||||||||||
6.999%, 12/29/2049 | EUR | 150 | 180 | |||||||
5.922%, 04/05/2017 (A) | $ | 180 | 182 | |||||||
Synlab Bondco | ||||||||||
6.250%, 07/01/2022 (A) | EUR | 160 | 190 | |||||||
TOTAL MTN(B) | ||||||||||
2.708%, 12/29/2049 | 750 | 843 | ||||||||
| Description | Face Amount (Thousands) | Market Value ($ Thousands) | ||||||||
GLOBAL BONDS (continued) | ||||||||||
2.625%, 12/29/2049 | EUR | 200 | $ | 217 | ||||||
Valeo MTN | ||||||||||
1.625%, 03/18/2026 | 100 | 121 | ||||||||
|
|
| ||||||||
| 34,413 | ||||||||||
|
|
| ||||||||
Germany — 5.4% | ||||||||||
Allianz Finance II BV MTN | ||||||||||
5.750%, 07/08/2041 (B) | 700 | 914 | ||||||||
Bundesobligation | ||||||||||
0.000%, 04/09/2021 | 2,750 | 3,179 | ||||||||
Bundesrepublik Deutschland | ||||||||||
6.250%, 01/04/2030 | 770 | 1,595 | ||||||||
4.000%, 01/04/2037 | 200 | 391 | ||||||||
2.500%, 07/04/2044 | 2,905 | 5,050 | ||||||||
2.500%, 08/15/2046 | 200 | 354 | ||||||||
1.000%, 08/15/2025 | 3,135 | 3,925 | ||||||||
0.500%, 02/15/2026 | 300 | 359 | ||||||||
0.000%, 08/15/2026 | 4,150 | 4,720 | ||||||||
Bundesrepublik Deutschland , Ser 00 | ||||||||||
5.500%, 01/04/2031 | 470 | 940 | ||||||||
Bundesrepublik Deutschland , Ser 03 | ||||||||||
4.750%, 07/04/2034 | 280 | 570 | ||||||||
Commerzbank MTN | ||||||||||
7.750%, 03/16/2021 | 900 | 1,183 | ||||||||
E.ON International Finance MTN | ||||||||||
6.000%, 10/30/2019 | GBP | 300 | 449 | |||||||
EnBW Energie Baden-Wuerttemberg | ||||||||||
3.375%, 04/05/2077 (B) | EUR | 875 | 976 | |||||||
FMS Wertmanagement | ||||||||||
1.125%, 12/07/2016 | 600 | 781 | ||||||||
Grand City Properties | ||||||||||
1.500%, 04/17/2025 | 700 | 810 | ||||||||
HeidelbergCement MTN | ||||||||||
2.250%, 06/03/2024 | 350 | 414 | ||||||||
KFW | ||||||||||
3.375%, 08/30/2017 | CHF | 370 | 396 | |||||||
RWE Finance MTN | ||||||||||
6.500%, 08/10/2021 | EUR | 120 | 175 | |||||||
RWE Finance , Ser E MTN | ||||||||||
6.250%, 06/03/2030 | GBP | 125 | 221 | |||||||
Volkswagen Financial Services MTN | ||||||||||
1.750%, 08/21/2017 | 230 | 300 | ||||||||
|
|
| ||||||||
| 27,702 | ||||||||||
|
|
| ||||||||
Greece — 0.0% | ||||||||||
Hellenic Republic Government Bond | ||||||||||
4.750%, 04/17/2019 (A) | EUR | 65 | 66 | |||||||
|
|
| ||||||||
Guernsey — 0.1% | ||||||||||
Credit Suisse Group Funding Guernsey MTN | ||||||||||
1.250%, 04/14/2022 | 245 | 275 | ||||||||
|
|
| ||||||||
34 |
SEI Institutional International Trust / Annual Report / September 30, 2016 |
| Description | Face Amount (Thousands) | Market Value ($ Thousands) | ||||||||
GLOBAL BONDS (continued) | ||||||||||
Indonesia — 0.2% | ||||||||||
Indonesia Government International Bond MTN | ||||||||||
2.875%, 07/08/2021 | EUR | 730 | $ | 876 | ||||||
|
|
| ||||||||
Ireland — 1.4% | ||||||||||
AIB Mortgage Bank MTN | ||||||||||
0.625%, 07/27/2020 | 305 | 353 | ||||||||
Ardagh Packaging Finance | ||||||||||
4.125%, 05/15/2023 (A) | 245 | 282 | ||||||||
Bank of Ireland MTN | ||||||||||
4.250%, 06/11/2024 (B) | 220 | 245 | ||||||||
Bank of Ireland Mortgage Bank | ||||||||||
1.750%, 03/19/2019 | 450 | 529 | ||||||||
0.500%, 01/20/2020 | 305 | 350 | ||||||||
CRH Funding MTN | ||||||||||
1.875%, 01/09/2024 | 250 | 306 | ||||||||
Ireland Government Bond | ||||||||||
4.500%, 10/18/2018 | 345 | 427 | ||||||||
4.500%, 04/18/2020 | 300 | 396 | ||||||||
3.400%, 03/18/2024 | 185 | 259 | ||||||||
2.000%, 02/18/2045 | 350 | 473 | ||||||||
1.000%, 05/15/2026 | 2,150 | 2,569 | ||||||||
0.800%, 03/15/2022 | 300 | 356 | ||||||||
|
|
| ||||||||
| 6,545 | ||||||||||
|
|
| ||||||||
Israel — 0.0% | ||||||||||
Israel Government Bond | ||||||||||
4.250%, 03/31/2023 | ILS | 750 | 242 | |||||||
|
|
| ||||||||
Italy — 7.1% | ||||||||||
Assicurazioni Generali MTN | ||||||||||
7.750%, 12/12/2042 (B) | EUR | 1,300 | 1,713 | |||||||
Buoni Poliennali Del Tesoro | ||||||||||
4.000%, 02/01/2037 | 555 | 845 | ||||||||
FCA Capital Ireland MTN | ||||||||||
2.875%, 01/26/2018 | 210 | 244 | ||||||||
2.625%, 04/17/2019 | 350 | 415 | ||||||||
Intesa Sanpaolo MTN | ||||||||||
5.017%, 06/26/2024 (A) | $ | 200 | 183 | |||||||
1.125%, 03/04/2022 | EUR | 1,950 | 2,218 | |||||||
Italy Buoni Poliennali Del Tesoro | ||||||||||
5.500%, 11/01/2022 | 3,255 | 4,743 | ||||||||
5.000%, 08/01/2034 | 335 | 562 | ||||||||
5.000%, 09/01/2040 | 1,000 | 1,742 | ||||||||
4.750%, 09/01/2044 (A) | 350 | 606 | ||||||||
4.500%, 03/01/2024 | 100 | 142 | ||||||||
4.000%, 09/01/2020 | 2,355 | 3,049 | ||||||||
3.750%, 05/01/2021 | 561 | 731 | ||||||||
3.750%, 09/01/2024 | 1,265 | 1,729 | ||||||||
3.500%, 03/01/2030 (A) | 1,290 | 1,807 | ||||||||
3.250%, 09/01/2046 (A) | 105 | 145 | ||||||||
2.700%, 03/01/2047 (A) | 650 | 805 | ||||||||
| Description | Face Amount (Thousands) | Market Value ($ Thousands) | ||||||||
GLOBAL BONDS (continued) | ||||||||||
2.500%, 12/01/2024 | EUR | 625 | $ | 788 | ||||||
2.000%, 12/01/2025 | 1,975 | 2,391 | ||||||||
1.650%, 03/01/2032 (A) | 110 | 126 | ||||||||
1.600%, 06/01/2026 | 1,000 | 1,165 | ||||||||
1.350%, 04/15/2022 | 4,347 | 5,131 | ||||||||
0.750%, 01/15/2018 | 720 | 818 | ||||||||
0.450%, 06/01/2021 | 3,125 | 3,541 | ||||||||
LKQ Italia Bondco | ||||||||||
3.875%, 04/01/2024 | 109 | 130 | ||||||||
Snam MTN | ||||||||||
1.375%, 11/19/2023 | 125 | 151 | ||||||||
Wind Acquisition Finance | ||||||||||
4.750%, 07/15/2020 (A) | $ | 200 | 201 | |||||||
|
|
| ||||||||
| 36,121 | ||||||||||
|
|
| ||||||||
Japan — 22.5% | ||||||||||
Government of Japan 10 Year Bond | ||||||||||
0.900%, 06/20/2022 | JPY | 782,200 | 8,231 | |||||||
0.800%, 09/20/2023 | 506,750 | 5,369 | ||||||||
0.300%, 12/20/2024 | 281,100 | 2,886 | ||||||||
0.100%, 06/20/2026 | 425,000 | 4,277 | ||||||||
Government of Japan 10 Year Bond , Ser 308 | ||||||||||
1.300%, 06/20/2020 | 295,600 | 3,089 | ||||||||
Government of Japan 10 Year Bond , Ser 314 | ||||||||||
1.100%, 03/20/2021 | 157,700 | 1,652 | ||||||||
Government of Japan 20 Year Bond | ||||||||||
1.700%, 06/20/2033 | 432,900 | 5,325 | ||||||||
1.400%, 09/20/2034 | 558,000 | 6,605 | ||||||||
1.000%, 12/20/2035 | 50,000 | 555 | ||||||||
0.200%, 06/20/2036 | 30,000 | 287 | ||||||||
Government of Japan 20 Year Bond , Ser 106 | ||||||||||
2.200%, 09/20/2028 | 46,600 | 582 | ||||||||
Government of Japan 20 Year Bond , Ser 112 | ||||||||||
2.100%, 06/20/2029 | 158,700 | 1,980 | ||||||||
Government of Japan 20 Year Bond , Ser 128 | ||||||||||
1.900%, 06/20/2031 | 55,000 | 685 | ||||||||
Government of Japan 20 Year Bond , Ser 140 | ||||||||||
1.700%, 09/20/2032 | 877,850 | 10,763 | ||||||||
Government of Japan 20 Year Bond , Ser 143 | ||||||||||
1.600%, 03/20/2033 | 298,400 | 3,620 | ||||||||
Government of Japan 20 Year Bond , Ser 144 | ||||||||||
1.500%, 03/20/2033 | 146,650 | 1,756 | ||||||||
Government of Japan 20 Year Bond , Ser 55 | ||||||||||
2.000%, 03/21/2022 | 305,050 | 3,384 | ||||||||
Government of Japan 20 Year Bond , Ser 99 | ||||||||||
2.100%, 12/20/2027 | 397,600 | 4,865 | ||||||||
Government of Japan 30 Year Bond | ||||||||||
1.400%, 12/20/2045 | 47,000 | 585 | ||||||||
0.300%, 06/20/2046 | 145,700 | 1,375 | ||||||||
Government of Japan 30 Year Bond , Ser 30 | ||||||||||
2.300%, 03/20/2039 | 295,900 | 4,116 | ||||||||
Government of Japan 30 Year Bond , Ser 33 | ||||||||||
2.000%, 09/20/2040 | 127,000 | 1,712 | ||||||||
SEI Institutional International Trust / Annual Report / September 30, 2016 |
35 |
SCHEDULE OF INVESTMENTS
September 30, 2016
International Fixed Income Fund (Continued)
| Description | Face Amount (Thousands) | Market Value ($ Thousands) | ||||||||
GLOBAL BONDS (continued) | ||||||||||
Government of Japan 30 Year Bond , Ser 34 | ||||||||||
2.200%, 03/20/2041 | JPY | 55,700 | $ | 780 | ||||||
Government of Japan 30 Year Bond , Ser 36 | ||||||||||
2.000%, 03/20/2042 | 94,450 | 1,289 | ||||||||
Government of Japan 30 Year Bond , Ser 38 | ||||||||||
1.800%, 03/20/2043 | 346,250 | 4,594 | ||||||||
Government of Japan 30 Year Bond , Ser 44 | ||||||||||
1.700%, 09/20/2044 | 207,000 | 2,721 | ||||||||
Government of Japan 40 Year Bond | ||||||||||
0.400%, 03/20/2056 | 210,000 | 1,984 | ||||||||
Government of Japan 40 Year Bond , Ser 6 | ||||||||||
1.900%, 03/20/2053 | 54,350 | 786 | ||||||||
Government of Japan 5 Year Bond | ||||||||||
0.300%, 09/20/2018 | 403,800 | 4,034 | ||||||||
0.200%, 06/20/2019 | 514,950 | 5,152 | ||||||||
0.100%, 12/20/2019 | 250,150 | 2,500 | ||||||||
0.100%, 03/20/2020 | 470,550 | 4,706 | ||||||||
0.100%, 12/20/2020 | 490,000 | 4,911 | ||||||||
Japan Treasury Discount | ||||||||||
0.000%, 11/21/2016 | 270,000 | 2,667 | ||||||||
0.000%, 12/19/2016 | 200,000 | 1,976 | ||||||||
Japanese Government CPI Linked Bond | ||||||||||
0.100%, 03/10/2025 | 51,844 | 539 | ||||||||
0.100%, 03/10/2026 | 236,800 | 2,467 | ||||||||
|
|
| ||||||||
| 114,805 | ||||||||||
|
|
| ||||||||
Kazakhstan — 0.1% | ||||||||||
Tengizchevroil Finance International | ||||||||||
4.000%, 08/15/2026 (A) | $ | 385 | 381 | |||||||
|
|
| ||||||||
Luxembourg — 0.2% | ||||||||||
Altice Financing MTN | ||||||||||
5.250%, 02/15/2023 | EUR | 235 | 274 | |||||||
Eurofins Scientific | ||||||||||
3.375%, 01/30/2023 | 300 | 354 | ||||||||
2.250%, 01/27/2022 | 200 | 231 | ||||||||
|
|
| ||||||||
| 859 | ||||||||||
|
|
| ||||||||
Malaysia — 0.2% | ||||||||||
Malaysia Government Bond | ||||||||||
5.734%, 07/30/2019 | MYR | 1,500 | 389 | |||||||
3.955%, 09/15/2025 | 1,475 | 364 | ||||||||
3.418%, 08/15/2022 | 445 | 108 | ||||||||
|
|
| ||||||||
| 861 | ||||||||||
|
|
| ||||||||
Mexico — 1.5% | ||||||||||
Mexican Bonos | ||||||||||
8.000%, 06/11/2020 | MXN | 58,346 | 3,250 | |||||||
7.750%, 11/13/2042 | 11,690 | 698 | ||||||||
Mexican Bonos , Ser M | ||||||||||
6.500%, 06/10/2021 | 5,356 | 285 | ||||||||
Mexican Bonos , Ser M20 | ||||||||||
10.000%, 12/05/2024 | 19,807 | 1,293 | ||||||||
| Description | Face Amount (Thousands) | Market Value ($ Thousands) | ||||||||
GLOBAL BONDS (continued) | ||||||||||
Mexican Bonos , Ser M30 | ||||||||||
10.000%, 11/20/2036 | MXN | 1,235 | $ | 89 | ||||||
Mexico Government International Bond MTN | ||||||||||
3.625%, 04/09/2029 | EUR | 275 | 367 | |||||||
Petroleos Mexicanos MTN | ||||||||||
5.125%, 03/15/2023 | 425 | 534 | ||||||||
4.625%, 09/21/2023 (A) | $ | 148 | 148 | |||||||
1.875%, 04/21/2022 | EUR | 380 | 410 | |||||||
United Mexican States MTN | ||||||||||
1.625%, 03/06/2024 | 416 | 483 | ||||||||
|
|
| ||||||||
| 7,557 | ||||||||||
|
|
| ||||||||
Morocco — 0.1% | ||||||||||
Kingdom of Morocco | ||||||||||
4.500%, 10/05/2020 | 370 | 468 | ||||||||
|
|
| ||||||||
Netherlands — 2.8% | ||||||||||
ABN AMRO Bank MTN | ||||||||||
6.375%, 04/27/2021 | 245 | 337 | ||||||||
2.875%, 06/30/2025 (B) | 1,000 | 1,178 | ||||||||
2.875%, 01/18/2028 (B) | 200 | 238 | ||||||||
Achmea BV MTN | ||||||||||
6.000%, 04/04/2043 (B) | 210 | 257 | ||||||||
Bharti Airtel International | ||||||||||
4.000%, 12/10/2018 | 270 | 326 | ||||||||
Cooperatieve Centrale Raiffeisen-Boerenleenbank BA | ||||||||||
2.500%, 05/26/2026 (B) | 260 | 305 | ||||||||
Cooperatieve Centrale Raiffeisen-Boerenleenbank BA MTN | ||||||||||
6.875%, 03/19/2020 | 1,200 | 1,591 | ||||||||
ING Bank MTN | ||||||||||
3.500%, 11/21/2023 (B) | 375 | 445 | ||||||||
3.375%, 03/23/2017 | 125 | 143 | ||||||||
3.000%, 04/11/2028 (B) | 1,400 | 1,670 | ||||||||
Kingdom of Netherlands | ||||||||||
5.500%, 01/15/2028 | 295 | 538 | ||||||||
4.000%, 01/15/2037 (A) | 300 | 582 | ||||||||
3.750%, 01/15/2042 (A) | 60 | 121 | ||||||||
2.000%, 07/15/2024 (A) | 625 | 827 | ||||||||
1.250%, 01/15/2019 (A) | 485 | 569 | ||||||||
0.250%, 01/15/2020 | 340 | 393 | ||||||||
0.250%, 07/15/2025 (A) | 574 | 666 | ||||||||
0.250%, 07/15/2025 (A) | 1,170 | 1,358 | ||||||||
NN Group | ||||||||||
4.625%, 04/08/2044 (B) | 625 | 744 | ||||||||
Rabobank Capital Funding | ||||||||||
5.556%, 12/31/2019 (B) | GBP | 153 | 211 | |||||||
RWE Finance MTN | ||||||||||
6.500%, 04/20/2021 | 245 | 389 | ||||||||
Schaeffler Finance | ||||||||||
2.500%, 05/15/2020 | EUR | 315 | 361 | |||||||
36 |
SEI Institutional International Trust / Annual Report / September 30, 2016 |
| Description | Face Amount (Thousands) | Market Value ($ Thousands) | ||||||||
GLOBAL BONDS (continued) | ||||||||||
Shell International Finance | ||||||||||
2.000%, 11/15/2018 | $ | 560 | $ | 567 | ||||||
Teva Pharmaceutical Finance Netherlands II BV | ||||||||||
1.875%, 03/31/2027 | EUR | 260 | 308 | |||||||
Teva Pharmaceutical Finance Netherlands III BV | ||||||||||
2.800%, 07/21/2023 | $ | 244 | 245 | |||||||
|
|
| ||||||||
| 14,369 | ||||||||||
|
|
| ||||||||
New Zealand — 0.5% | ||||||||||
New Zealand Government Bond | ||||||||||
6.000%, 05/15/2021 | NZD | 1,500 | 1,285 | |||||||
5.500%, 04/15/2023 | 320 | 281 | ||||||||
3.000%, 04/15/2020 | 1,420 | 1,070 | ||||||||
Reynolds Group Issuer | ||||||||||
5.750%, 10/15/2020 | $ | 102 | 105 | |||||||
Westpac Securities MTN | ||||||||||
0.875%, 06/24/2019 | EUR | 100 | 116 | |||||||
|
|
| ||||||||
| 2,857 | ||||||||||
|
|
| ||||||||
Norway — 0.4% | ||||||||||
DNB Bank | ||||||||||
6.012%, 01/29/2049 (B) | GBP | 150 | 198 | |||||||
Government of Norway | ||||||||||
4.500%, 05/22/2019 (A) | NOK | 2,120 | 291 | |||||||
3.750%, 05/25/2021 (A) | 830 | 117 | ||||||||
2.000%, 05/24/2023 (A) | 645 | 86 | ||||||||
Kommunalbanken MTN | ||||||||||
1.000%, 03/15/2018 (A) | $ | 800 | 800 | |||||||
SpareBank 1 Boligkreditt MTN | ||||||||||
2.375%, 11/22/2016 | EUR | 170 | 192 | |||||||
|
|
| ||||||||
| 1,684 | ||||||||||
|
|
| ||||||||
Panama — 0.1% | ||||||||||
Carnival | ||||||||||
1.875%, 11/07/2022 | 390 | 469 | ||||||||
|
|
| ||||||||
Poland — 0.6% | ||||||||||
Republic of Poland | ||||||||||
3.250%, 07/25/2025 | PLN | 3,792 | 1,022 | |||||||
2.500%, 07/25/2018 | 710 | 188 | ||||||||
Republic of Poland , Ser 1019 | ||||||||||
5.500%, 10/25/2019 | 1,520 | 439 | ||||||||
Republic of Poland , Ser 1021 | ||||||||||
5.750%, 10/25/2021 | 3,490 | 1,058 | ||||||||
Republic of Poland , Ser E MTN | ||||||||||
4.200%, 04/15/2020 | EUR | 200 | 258 | |||||||
|
|
| ||||||||
| 2,965 | ||||||||||
|
|
| ||||||||
Portugal — 0.8% | ||||||||||
EDP Finance BV MTN | ||||||||||
1.125%, 02/12/2024 | 1,000 | 1,086 | ||||||||
Obrigacoes do Tesouro | ||||||||||
4.800%, 06/15/2020 (A) | 1,070 | 1,338 | ||||||||
| Description | Face Amount (Thousands) | Market Value ($ Thousands) | ||||||||
GLOBAL BONDS (continued) | ||||||||||
Portugal Obrigacoes do Tesouro OT | ||||||||||
2.875%, 10/15/2025 (A) | EUR | 1,197 | $ | 1,318 | ||||||
|
|
| ||||||||
| 3,742 | ||||||||||
|
|
| ||||||||
Romania — 0.0% | ||||||||||
Romanian Government International Bond MTN | ||||||||||
4.625%, 09/18/2020 | 40 | 53 | ||||||||
3.625%, 04/24/2024 | 20 | 26 | ||||||||
|
|
| ||||||||
| 79 | ||||||||||
|
|
| ||||||||
Singapore — 0.3% | ||||||||||
Government of Singapore | ||||||||||
4.000%, 09/01/2018 | SGD | 495 | 384 | |||||||
3.125%, 09/01/2022 | 275 | 220 | ||||||||
3.000%, 09/01/2024 | 170 | 137 | ||||||||
Lincoln Finance | ||||||||||
6.875%, 04/15/2021 | EUR | 275 | 332 | |||||||
Temasek Financial I MTN | ||||||||||
2.375%, 01/23/2023 (A) | $ | 495 | 507 | |||||||
|
|
| ||||||||
| 1,580 | ||||||||||
|
|
| ||||||||
Slovak Republic — 0.0% | ||||||||||
Slovakia Government Bond | ||||||||||
3.375%, 11/15/2024 | EUR | 110 | 158 | |||||||
|
|
| ||||||||
Slovenia — 0.1% | ||||||||||
Slovenia Government Bond | ||||||||||
1.500%, 03/25/2035 | 380 | 425 | ||||||||
|
|
| ||||||||
South Africa — 0.1% | ||||||||||
Republic of South Africa | ||||||||||
8.000%, 01/31/2030 | ZAR | 8,625 | 577 | |||||||
|
|
| ||||||||
South Korea — 0.6% | ||||||||||
Korea Treasury Bond | ||||||||||
4.250%, 06/10/2021 | KRW | 1,270,230 | 1,307 | |||||||
4.000%, 12/10/2031 | 708,440 | 868 | ||||||||
3.750%, 12/10/2033 | 190,350 | 234 | ||||||||
3.500%, 03/10/2024 | 194,510 | 203 | ||||||||
3.250%, 09/10/2018 | 520,990 | 491 | ||||||||
3.000%, 09/10/2024 | 186,630 | 190 | ||||||||
2.750%, 03/10/2018 | 511,230 | 473 | ||||||||
2.750%, 12/10/2044 | 122,370 | 144 | ||||||||
|
|
| ||||||||
| 3,910 | ||||||||||
|
|
| ||||||||
Spain — 5.7% | ||||||||||
Banco de Sabadell | ||||||||||
0.875%, 11/12/2021 | EUR | 400 | 472 | |||||||
Banco Popular Espanol | ||||||||||
4.000%, 10/18/2016 | 100 | 113 | ||||||||
3.750%, 01/22/2019 | 100 | 123 | ||||||||
2.125%, 10/08/2019 | 100 | 120 | ||||||||
Bankia | ||||||||||
4.125%, 03/24/2036 | 350 | 563 | ||||||||
SEI Institutional International Trust / Annual Report / September 30, 2016 |
37 |
SCHEDULE OF INVESTMENTS
September 30, 2016
International Fixed Income Fund (Continued)
| Description | Face Amount (Thousands) | Market Value ($ Thousands) | ||||||||
GLOBAL BONDS (continued) | ||||||||||
BBVA International Preferred SAU | ||||||||||
5.919%, 10/18/2008 (B) | $ | 335 | $ | 334 | ||||||
CaixaBank | ||||||||||
0.000%, 01/09/2018 (B) | EUR | 200 | 225 | |||||||
Cirsa Funding Luxembourg | ||||||||||
5.875%, 05/15/2023 | 165 | 193 | ||||||||
5.750%, 05/15/2021 | 100 | 118 | ||||||||
Ferrovial Emisiones MTN | ||||||||||
3.375%, 06/07/2021 | 475 | 610 | ||||||||
Fondo de Amortizacion del Deficit Electrico MTN | ||||||||||
2.250%, 12/17/2016 | 700 | 791 | ||||||||
Fondo de Amortizacion del Deficit Electrico | ||||||||||
4.125%, 03/17/2017 | 200 | 229 | ||||||||
Government of Spain | ||||||||||
6.000%, 01/31/2029 | 465 | 814 | ||||||||
5.900%, 07/30/2026 (A) | 38 | 63 | ||||||||
5.500%, 04/30/2021 (A) | 780 | 1,096 | ||||||||
4.700%, 07/30/2041 (A) | 1,229 | 2,170 | ||||||||
4.400%, 10/31/2023 (A) | 388 | 557 | ||||||||
4.200%, 01/31/2037 (A) | 475 | 769 | ||||||||
2.900%, 10/31/2046 (A) | 1,640 | 2,218 | ||||||||
2.750%, 10/31/2024 (A) | 990 | 1,296 | ||||||||
2.150%, 10/31/2025 (A) | 290 | 364 | ||||||||
1.950%, 07/30/2030 (A) | 570 | 698 | ||||||||
1.600%, 04/30/2025 (A) | 535 | 645 | ||||||||
1.400%, 01/31/2020 | 885 | 1,043 | ||||||||
0.750%, 07/30/2021 | 11,000 | 12,784 | ||||||||
Santander Consumer Finance | ||||||||||
0.900%, 02/18/2020 | 300 | 343 | ||||||||
Telefonica Emisiones MTN | ||||||||||
5.375%, 02/02/2018 | GBP | 185 | 254 | |||||||
|
|
| ||||||||
| 29,005 | ||||||||||
|
|
| ||||||||
Supra-National — 0.4% | ||||||||||
European Investment Bank MTN | ||||||||||
1.250%, 05/12/2025 | SEK | 7,500 | 909 | |||||||
European Investment Bank | ||||||||||
1.900%, 01/26/2026 | JPY | 50,000 | 588 | |||||||
International Bank for Reconstruction & Development MTN | ||||||||||
1.000%, 12/28/2016 | GBP | 600 | 781 | |||||||
|
|
| ||||||||
| 2,278 | ||||||||||
|
|
| ||||||||
Sweden — 0.5% | ||||||||||
Kingdom of Sweden | ||||||||||
3.500%, 03/30/2039 | SEK | 545 | 96 | |||||||
1.500%, 11/13/2023 | 1,020 | 134 | ||||||||
1.000%, 11/12/2026 | 1,250 | 158 | ||||||||
Kingdom of Sweden , Ser 1047 | ||||||||||
5.000%, 12/01/2020 | 3,700 | 533 | ||||||||
Kingdom of Sweden , Ser 1052 | ||||||||||
4.250%, 03/12/2019 | 5,275 | 690 | ||||||||
| Description | Face Amount (Thousands) | Market Value ($ Thousands) | ||||||||
GLOBAL BONDS (continued) | ||||||||||
Nordea Bank MTN | ||||||||||
4.000%, 03/29/2021 | EUR | 255 | $ | 329 | ||||||
Skandinaviska Enskilda Banken MTN | ||||||||||
7.092%, 12/29/2049 (B) | 210 | 254 | ||||||||
Stadshypotek MTN | ||||||||||
4.250%, 10/10/2017 | AUD | 600 | 468 | |||||||
Vattenfall | ||||||||||
3.000%, 03/19/2077 (B) | EUR | 175 | 181 | |||||||
|
|
| ||||||||
| 2,843 | ||||||||||
|
|
| ||||||||
Switzerland — 1.9% | ||||||||||
Credit Suisse Group Funding Guernsey | ||||||||||
2.750%, 08/08/2025 | GBP | 750 | 968 | |||||||
Credit Suisse | ||||||||||
5.750%, 09/18/2025 (B) | EUR | 1,500 | 1,827 | |||||||
Demeter Investments BV for Zurich Insurance MTN | ||||||||||
3.500%, 10/01/2046 (B) | 1,300 | 1,524 | ||||||||
Dufry Finance | ||||||||||
4.500%, 08/01/2023 | 220 | 260 | ||||||||
Glencore Finance Europe MTN | ||||||||||
1.250%, 03/17/2021 | 300 | 334 | ||||||||
Glencore Funding | ||||||||||
2.875%, 04/16/2020 (A) | $ | 200 | 199 | |||||||
2.125%, 04/16/2018 (A) | 242 | 240 | ||||||||
Government of Switzerland | ||||||||||
3.500%, 04/08/2033 | CHF | 100 | 169 | |||||||
3.000%, 05/12/2019 | 160 | 182 | ||||||||
2.000%, 04/28/2021 | 1,070 | 1,252 | ||||||||
2.000%, 05/25/2022 | 110 | 132 | ||||||||
1.500%, 04/30/2042 | 150 | 218 | ||||||||
1.250%, 06/11/2024 | 260 | 309 | ||||||||
LafargeHolcim Finance US | ||||||||||
3.500%, 09/22/2026 (A) | $ | 200 | 204 | |||||||
UBS Group Funding Jersey MTN | ||||||||||
1.250%, 09/01/2026 | EUR | 1,700 | 1,898 | |||||||
UBS Group Funding Jersey | ||||||||||
4.125%, 09/24/2025 (A) | $ | 220 | 231 | |||||||
|
|
| ||||||||
| 9,947 | ||||||||||
|
|
| ||||||||
Thailand — 0.2% | ||||||||||
Thailand Government Bond | ||||||||||
4.875%, 06/22/2029 | THB | 3,365 | 124 | |||||||
4.675%, 06/29/2044 | 1,800 | 72 | ||||||||
3.650%, 12/17/2021 | 16,020 | 505 | ||||||||
3.625%, 06/16/2023 | 7,815 | 249 | ||||||||
|
|
| ||||||||
| 950 | ||||||||||
|
|
| ||||||||
Turkey — 0.2% | ||||||||||
Turkey Government Bond | ||||||||||
9.400%, 07/08/2020 | TRY | 1,325 | 448 | |||||||
Turkey Government International Bond | ||||||||||
5.125%, 05/18/2020 | EUR | 235 | 289 | |||||||
|
|
| ||||||||
| 737 | ||||||||||
|
|
| ||||||||
38 |
SEI Institutional International Trust / Annual Report / September 30, 2016 |
| Description | Face Amount (Thousands) | Market Value ($ Thousands) | ||||||||
GLOBAL BONDS (continued) | ||||||||||
United Kingdom — 14.0% | ||||||||||
AA Bond | ||||||||||
4.720%, 07/02/2043 | 500 | $ | 683 | |||||||
Anglian Water Services Financing | ||||||||||
6.875%, 08/21/2023 | GBP | 230 | 409 | |||||||
Arqiva Financing MTN | ||||||||||
4.040%, 06/30/2020 | 220 | 305 | ||||||||
Aviva MTN | ||||||||||
3.375%, 12/04/2045 (B) | EUR | 500 | 554 | |||||||
Bank of Scotland | ||||||||||
7.281%, 05/29/2049 (B) | GBP | 950 | 1,481 | |||||||
Barclays MTN | ||||||||||
1.875%, 03/23/2021 | EUR | 1,750 | 2,029 | |||||||
Barclays Bank MTN | ||||||||||
10.000%, 05/21/2021 | GBP | 180 | 302 | |||||||
BAT International Finance MTN | ||||||||||
5.375%, 06/29/2017 | EUR | 425 | 497 | |||||||
4.000%, 11/23/2055 | GBP | 275 | 484 | |||||||
0.875%, 10/13/2023 | EUR | 625 | 728 | |||||||
Boparan Finance MTN | ||||||||||
4.375%, 07/15/2021 | 160 | 167 | ||||||||
BP Capital Markets | ||||||||||
1.487%, 09/26/2018 (B) | $ | 110 | 111 | |||||||
BP Capital Markets MTN | ||||||||||
2.177%, 09/28/2021 | EUR | 245 | 302 | |||||||
British Telecommunications MTN | ||||||||||
1.125%, 03/10/2023 | 300 | 353 | ||||||||
Canary Wharf Finance II | ||||||||||
6.455%, 04/22/2030 | GBP | 14 | 28 | |||||||
5.952%, 01/22/2035 | 20 | 35 | ||||||||
Coventry Building Society MTN | ||||||||||
4.625%, 04/19/2018 | 230 | 317 | ||||||||
Delphi Automotive | ||||||||||
1.500%, 03/10/2025 | EUR | 420 | 489 | |||||||
Direct Line Insurance Group | ||||||||||
9.250%, 04/27/2042 (B) | GBP | 100 | 161 | |||||||
FCE Bank MTN | ||||||||||
4.825%, 02/15/2017 | 200 | 263 | ||||||||
HBOS Capital Funding | ||||||||||
6.461%, 11/30/2049 (B) | 115 | 160 | ||||||||
Heathrow Funding MTN | ||||||||||
1.875%, 05/23/2022 | EUR | 750 | 916 | |||||||
HSBC Holdings | ||||||||||
0.875%, 09/06/2024 | 1,500 | 1,678 | ||||||||
HSBC Holdings MTN | ||||||||||
3.125%, 06/07/2028 | 600 | 727 | ||||||||
Imperial Tobacco Finance MTN | ||||||||||
3.375%, 02/26/2026 | 400 | 543 | ||||||||
International Game Technology | ||||||||||
4.750%, 02/15/2023 | 160 | 193 | ||||||||
Lecta | ||||||||||
6.500%, 08/01/2023 (A) | 113 | 125 | ||||||||
| Description | Face Amount (Thousands) | Market Value ($ Thousands) | ||||||||
GLOBAL BONDS (continued) | ||||||||||
Lloyds Bank MTN | ||||||||||
1.375%, 09/08/2022 | EUR | 420 | $ | 497 | ||||||
1.000%, 11/19/2021 | 300 | 349 | ||||||||
Mondi Finance MTN | ||||||||||
1.500%, 04/15/2024 | 900 | 1,071 | ||||||||
National Grid Gas Finance MTN | ||||||||||
1.125%, 09/22/2021 | GBP | 1,450 | 1,894 | |||||||
National Westminster Bank | ||||||||||
6.500%, 09/07/2021 | 220 | 332 | ||||||||
6.500%, 09/07/2021 | 1,300 | 1,965 | ||||||||
Nationwide Building Society MTN | ||||||||||
4.625%, 02/08/2021 | EUR | 550 | 746 | |||||||
4.125%, 03/20/2023 (B) | 2,295 | 2,683 | ||||||||
0.500%, 10/29/2019 | 345 | 392 | ||||||||
Northumbrian Water Finance | ||||||||||
6.875%, 02/06/2023 | GBP | 190 | 329 | |||||||
Pizzaexpress Financing | ||||||||||
6.625%, 08/01/2021 | 155 | 196 | ||||||||
Rio Tinto Finance MTN | ||||||||||
4.000%, 12/11/2029 | 165 | 259 | ||||||||
Royal Bank of Scotland MTN | ||||||||||
6.934%, 04/09/2018 | EUR | 300 | 366 | |||||||
5.500%, 03/23/2020 | 675 | 893 | ||||||||
3.875%, 10/19/2020 | 123 | 161 | ||||||||
Royal Bank of Scotland Group | ||||||||||
7.640%, 09/29/2017 (B) | $ | 200 | 194 | |||||||
Santander UK MTN | ||||||||||
4.250%, 04/12/2021 | EUR | 350 | 471 | |||||||
1.125%, 01/14/2022 | 330 | 384 | ||||||||
Santander UK | ||||||||||
6.222%, 05/29/2049 (B) | GBP | 170 | 219 | |||||||
Sky MTN | ||||||||||
1.500%, 09/15/2021 | EUR | 200 | 236 | |||||||
Standard Chartered | ||||||||||
6.409%, 01/30/2049 (A)(B) | $ | 500 | 485 | |||||||
TSB Banking Group MTN | ||||||||||
5.750%, 05/06/2026 (B) | GBP | 104 | 142 | |||||||
United Kingdom Gilt | ||||||||||
4.500%, 09/07/2034 | 120 | 236 | ||||||||
4.500%, 12/07/2042 | 1,500 | 3,223 | ||||||||
4.250%, 12/07/2027 | 125 | 221 | ||||||||
4.250%, 06/07/2032 | 2,600 | 4,859 | ||||||||
4.250%, 06/07/2032 | 110 | 206 | ||||||||
3.750%, 07/22/2052 | 135 | 289 | ||||||||
3.500%, 01/22/2045 | 1,060 | 2,009 | ||||||||
3.250%, 01/22/2044 | 910 | 1,642 | ||||||||
2.750%, 09/07/2024 | 850 | 1,293 | ||||||||
2.500%, 07/22/2065 | 2,620 | 4,706 | ||||||||
2.250%, 09/07/2023 | 2,080 | 3,038 | ||||||||
2.000%, 09/07/2025 | 4,300 | 6,233 | ||||||||
1.750%, 07/22/2019 | 765 | 1,039 | ||||||||
1.500%, 01/22/2021 | 1,750 | 2,396 | ||||||||
SEI Institutional International Trust / Annual Report / September 30, 2016 |
39 |
SCHEDULE OF INVESTMENTS
September 30, 2016
International Fixed Income Fund (Continued)
Description | Face Amount (Thousands) | Market Value ($ Thousands) | ||||||||
GLOBAL BONDS (continued) | ||||||||||
1.500%, 07/22/2026 | GBP | 350 | $ | 486 | ||||||
1.250%, 07/22/2018 | 830 | 1,100 | ||||||||
United Kingdom Treasury | ||||||||||
5.000%, 03/07/2025 | 1,430 | 2,525 | ||||||||
4.750%, 12/07/2030 | 1,035 | 1,996 | ||||||||
4.250%, 03/07/2036 | 595 | 1,155 | ||||||||
4.250%, 09/07/2039 | 1,170 | 2,346 | ||||||||
4.250%, 12/07/2040 | 500 | 1,017 | ||||||||
4.250%, 12/07/2046 | 130 | 281 | ||||||||
Virgin Media Secured Finance | ||||||||||
5.500%, 01/15/2021 | 300 | 428 | ||||||||
Wales & West Utilities Finance | ||||||||||
6.250%, 11/30/2021 | 240 | 392 | ||||||||
Western Power Distribution West Midlands | ||||||||||
3.875%, 10/17/2024 | 230 | 351 | ||||||||
|
|
| ||||||||
| 71,771 | ||||||||||
|
|
| ||||||||
United States — 5.4% | ||||||||||
21st Century Fox America | ||||||||||
4.500%, 02/15/2021 | $ | 75 | 83 | |||||||
Adient Global Holdings | ||||||||||
3.500%, 08/15/2024 (A) | EUR | 110 | 124 | |||||||
Aetna | ||||||||||
3.200%, 06/15/2026 | $ | 250 | 254 | |||||||
2.750%, 11/15/2022 | 40 | 41 | ||||||||
Altria Group | ||||||||||
4.750%, 05/05/2021 | 180 | 203 | ||||||||
4.250%, 08/09/2042 | 265 | 287 | ||||||||
American International Group | ||||||||||
5.750%, 03/15/2067 (B) | GBP | 150 | 196 | |||||||
Amgen | ||||||||||
1.250%, 02/25/2022 | 550 | 649 | ||||||||
Anthem | ||||||||||
4.650%, 01/15/2043 | $ | 110 | 120 | |||||||
2.300%, 07/15/2018 | 150 | 152 | ||||||||
AT&T | ||||||||||
4.875%, 06/01/2044 | GBP | 130 | 220 | |||||||
Bank of America MTN | ||||||||||
5.500%, 11/22/2021 | 225 | 338 | ||||||||
2.375%, 06/19/2024 | EUR | 835 | 1,051 | |||||||
0.537%, 03/28/2018 (B) | 300 | 337 | ||||||||
0.247%, 09/14/2018 (B) | 375 | 420 | ||||||||
Berkshire Hathaway | ||||||||||
1.125%, 03/16/2027 | 297 | 341 | ||||||||
0.500%, 03/13/2020 | 570 | 651 | ||||||||
Carnival | ||||||||||
1.625%, 02/22/2021 | 180 | 212 | ||||||||
CenturyLink | ||||||||||
7.500%, 04/01/2024 | $ | 130 | 139 | |||||||
Coca-Cola | ||||||||||
1.100%, 09/02/2036 | 145 | 162 | ||||||||
ConocoPhillips | ||||||||||
5.750%, 02/01/2019 | 420 | 458 | ||||||||
| Description | Face Amount (Thousands) | Market Value ($ Thousands) | ||||||||
GLOBAL BONDS (continued) | ||||||||||
Crown European Holdings | ||||||||||
2.625%, 09/30/2024 (A) | EUR | 240 | $ | 266 | ||||||
DH Europe Finance | ||||||||||
1.700%, 01/04/2022 | 535 | 647 | ||||||||
Diamond Offshore Drilling | ||||||||||
4.875%, 11/01/2043 | $ | 270 | 187 | |||||||
Discovery Communications | ||||||||||
1.900%, 03/19/2027 | EUR | 360 | 398 | |||||||
FedEx | ||||||||||
1.000%, 01/11/2023 | 560 | 648 | ||||||||
GE Capital European Funding Unlimited MTN | ||||||||||
2.250%, 07/20/2020 | 1,300 | 1,584 | ||||||||
General Electric | ||||||||||
1.875%, 05/28/2027 | 300 | 379 | ||||||||
Goldman Sachs Group MTN | ||||||||||
3.000%, 02/12/2031 | 926 | 1,183 | ||||||||
2.000%, 07/27/2023 | 230 | 278 | ||||||||
1.625%, 07/27/2026 | 825 | 940 | ||||||||
Goldman Sachs Group | ||||||||||
2.625%, 04/25/2021 | $ | 425 | 432 | |||||||
Hertz Holdings Netherlands BV | ||||||||||
4.125%, 10/15/2021 (A) | EUR | 114 | 131 | |||||||
Hess | ||||||||||
4.300%, 04/01/2027 | $ | 488 | 492 | |||||||
Honeywell International | ||||||||||
1.300%, 02/22/2023 | 240 | 287 | ||||||||
HSBC Holdings | ||||||||||
2.950%, 05/25/2021 | 375 | 380 | ||||||||
JPMorgan Chase MTN | ||||||||||
0.829%, 05/30/2017 (B) | GBP | 100 | 129 | |||||||
JPMorgan Chase | ||||||||||
3.200%, 06/15/2026 | $ | 425 | 436 | |||||||
Lam Research | ||||||||||
2.800%, 06/15/2021 | 359 | 368 | ||||||||
Mellon Capital III | ||||||||||
1.875%, 09/05/2066 (B) | GBP | 300 | 360 | |||||||
Molson Coors Brewing | ||||||||||
1.250%, 07/15/2024 | EUR | 1,710 | 1,978 | |||||||
Mondelez International | ||||||||||
2.375%, 03/06/2035 | 250 | 300 | ||||||||
Morgan Stanley MTN | ||||||||||
1.750%, 01/30/2025 | 830 | 988 | ||||||||
Morgan Stanley | ||||||||||
1.875%, 03/30/2023 | 490 | 592 | ||||||||
National Capital Trust I (B) | ||||||||||
5.620%, 12/17/2018 (A) | GBP | 35 | 48 | |||||||
5.620%, 09/29/2049 | 150 | 204 | ||||||||
Nordea Bank MTN | ||||||||||
2.250%, 05/27/2021 (A) | $ | 425 | 430 | |||||||
Odebrecht Finance | ||||||||||
7.125%, 06/26/2042 | 280 | 112 | ||||||||
40 |
SEI Institutional International Trust / Annual Report / September 30, 2016 |
| Description | Face Amount (Thousands) | Market Value ($ Thousands) | ||||||||
GLOBAL BONDS (continued) | ||||||||||
ONEOK Partners | ||||||||||
3.800%, 03/15/2020 | $ | 128 | $ | 132 | ||||||
Philip Morris International MTN | ||||||||||
2.875%, 03/03/2026 | EUR | 335 | 451 | |||||||
1.875%, 03/03/2021 | 300 | 364 | ||||||||
Plains All American Pipeline | ||||||||||
3.600%, 11/01/2024 | $ | 155 | 150 | |||||||
PNC Funding | ||||||||||
5.125%, 02/08/2020 | 300 | 333 | ||||||||
3.300%, 03/08/2022 | 150 | 159 | ||||||||
Priceline Group | ||||||||||
1.800%, 03/03/2027 | 380 | 429 | ||||||||
Principal Financial Group | ||||||||||
1.850%, 11/15/2017 | 175 | 176 | ||||||||
Prologis International Funding II MTN | ||||||||||
2.875%, 04/04/2022 | EUR | 220 | 277 | |||||||
Province of Quebec Canada | ||||||||||
2.500%, 04/20/2026 | $ | 70 | 72 | |||||||
Provincia de Buenos Aires | ||||||||||
5.750%, 06/15/2019 (A) | 179 | 185 | ||||||||
Prudential Financial | ||||||||||
5.625%, 06/15/2043 (B) | 125 | 135 | ||||||||
Republic Services | ||||||||||
4.750%, 05/15/2023 | 155 | 176 | ||||||||
Ryder System MTN | ||||||||||
5.850%, 11/01/2016 | 116 | 116 | ||||||||
S&P Global | ||||||||||
4.400%, 02/15/2026 | 313 | 350 | ||||||||
Sabine Pass Liquefaction | ||||||||||
5.625%, 04/15/2023 | 195 | 208 | ||||||||
Santander Issuances | ||||||||||
5.179%, 11/19/2025 | 400 | 408 | ||||||||
Seagate HDD Cayman | ||||||||||
4.750%, 06/01/2023 | 101 | 100 | ||||||||
4.750%, 01/01/2025 | 123 | 116 | ||||||||
Skandinaviska Enskilda Banken | ||||||||||
1.422%, 09/13/2019 (A)(B) | 200 | 200 | ||||||||
Societe Generale MTN | ||||||||||
2.500%, 04/08/2021 (A) | 500 | 513 | ||||||||
Thermo Fisher Scientific | ||||||||||
1.500%, 12/01/2020 | 426 | 502 | ||||||||
0.750%, 09/12/2024 | 155 | 174 | ||||||||
United Technologies | ||||||||||
1.125%, 12/15/2021 | 390 | 459 | ||||||||
Vale Overseas | ||||||||||
5.875%, 06/10/2021 | 169 | 177 | ||||||||
Valeant Pharmaceuticals International | ||||||||||
4.500%, 05/15/2023 (A) | EUR | 170 | 151 | |||||||
Verizon Communications | ||||||||||
2.625%, 12/01/2031 | 325 | 422 | ||||||||
Weatherford International | ||||||||||
4.500%, 04/15/2022 | $ | 20 | 17 | |||||||
| Description | Face Amount (Thousands) | Market Value ($ Thousands) | ||||||||
GLOBAL BONDS (continued) | ||||||||||
Wells Fargo MTN | ||||||||||
4.600%, 04/01/2021 | $ | 75 | $ | 83 | ||||||
Williams Partners | ||||||||||
3.900%, 01/15/2025 | 128 | 128 | ||||||||
ZF North America Capital | ||||||||||
2.750%, 04/27/2023 | EUR | 200 | 239 | |||||||
|
|
| ||||||||
| 28,017 | ||||||||||
|
|
| ||||||||
Total Global Bonds | 477,671 | |||||||||
|
|
| ||||||||
MORTGAGE-BACKED SECURITIES — 2.8% |
| |||||||||
Agency Mortgage-Backed Obligation — 0.7% |
| |||||||||
FHLMC Structured Agency Credit Risk Debt Notes, Ser 2014-DN1, Cl M1 | ||||||||||
1.524%, 02/25/2024 (B) | $ | 152 | 152 | |||||||
FHLMC Structured Agency Credit Risk Debt Notes, Ser 2014-HQ2, Cl M1 | ||||||||||
1.974%, 09/25/2024 (B) | 179 | 180 | ||||||||
FHLMC Structured Agency Credit Risk Debt Notes, Ser 2015-DNA1, Cl M2 | ||||||||||
2.375%, 10/25/2027 (B) | 490 | 498 | ||||||||
FHLMC Structured Agency Credit Risk Debt Notes, Ser 2015-DNA2, Cl M2 | ||||||||||
3.125%, 12/25/2027 (B) | 205 | 210 | ||||||||
FHLMC Structured Agency Credit Risk Debt Notes, Ser 2015-DNA2, Cl M1 | ||||||||||
1.674%, 12/25/2027 (B) | 97 | 97 | ||||||||
FHLMC Structured Agency Credit Risk Debt Notes, Ser 2015-HQ1, Cl M1 | ||||||||||
1.574%, 03/25/2025 (B) | 30 | 30 | ||||||||
FHLMC Structured Agency Credit Risk Debt Notes, Ser 2015-HQ2, Cl M1 | ||||||||||
1.624%, 05/25/2025 (B) | 203 | 203 | ||||||||
FHLMC Structured Agency Credit Risk Debt Notes, Ser 2015-HQA2, Cl M2 | ||||||||||
3.325%, 05/25/2028 (B) | 270 | 279 | ||||||||
FHLMC Structured Agency Credit Risk Debt Notes, Ser 2016-DNA1, Cl M2 | ||||||||||
3.325%, 07/25/2028 (B) | 276 | 285 | ||||||||
FHLMC Structured Agency Credit Risk Debt Notes, Ser 2016-HQA1, Cl M3 | ||||||||||
6.875%, 09/25/2028 (B) | 250 | 281 | ||||||||
|
|
| ||||||||
| 2,215 | ||||||||||
|
|
| ||||||||
Non-Agency Mortgage-Backed Obligation — 2.1% |
| |||||||||
Banc of America Commercial Mortgage, Ser 2007-5, Cl A4 | ||||||||||
5.492%, 02/10/2051 | 109 | 111 | ||||||||
Banc of America Commercial Mortgage, Ser 2015-UBS7, Cl A4 | ||||||||||
3.705%, 09/15/2048 | 180 | 198 | ||||||||
SEI Institutional International Trust / Annual Report / September 30, 2016 |
41 |
SCHEDULE OF INVESTMENTS
September 30, 2016
International Fixed Income Fund (Continued)
| Description | Face Amount (Thousands) | Market Value ($ Thousands) | ||||||||
MORTGAGE-BACKED SECURITIES (continued) |
| |||||||||
Bear Stearns Adjustable Rate Mortgage Trust, Ser 2004-6, Cl 3A | ||||||||||
3.358%, 09/25/2034 (B) | $ | 42 | $ | 41 | ||||||
Bear Stearns Commercial Mortgage Securities, Ser 2006-PW13, Cl AJ | ||||||||||
5.611%, 09/11/2041 (B) | 54 | 54 | ||||||||
Citigroup Commercial Mortgage Trust, Ser 2012-GC8, Cl A4 | ||||||||||
3.024%, 09/10/2045 | 125 | 132 | ||||||||
Citigroup Commercial Mortgage Trust, Ser 2014-GC19, Cl D | ||||||||||
5.063%, 03/10/2047 (A)(B) | 20 | 17 | ||||||||
Citigroup Commercial Mortgage Trust, Ser 2015-GC29, Cl A3 | ||||||||||
2.935%, 04/10/2048 | 30 | 31 | ||||||||
Citigroup Commercial Mortgage Trust, Ser 2015-GC29, Cl A4 | ||||||||||
3.192%, 04/10/2048 | 15 | 16 | ||||||||
Citigroup Commercial Mortgage Trust, Ser 2015-GC31, Cl A4 | ||||||||||
3.762%, 06/10/2048 | 65 | 71 | ||||||||
Citigroup Commercial Mortgage Trust, Ser 2015-GC35, Cl A4 | ||||||||||
3.818%, 11/10/2048 | 55 | 61 | ||||||||
Citigroup Mortgage Loan Trust, Ser 2005-2, Cl 1A4 | ||||||||||
2.959%, 05/25/2035 (B) | 398 | 371 | ||||||||
COBALT Commercial Mortgage Trust, Ser 2006- C1, Cl AM | ||||||||||
5.254%, 08/15/2048 | 30 | 30 | ||||||||
COMM Mortgage Trust, Ser 2006-C8, Cl A1A | ||||||||||
5.292%, 12/10/2046 | 14 | 14 | ||||||||
COMM Mortgage Trust, Ser 2012-CR1, Cl A3 | ||||||||||
3.391%, 05/15/2045 | 15 | 16 | ||||||||
COMM Mortgage Trust, Ser 2012-CR4, Cl A3 | ||||||||||
2.853%, 10/15/2045 | 130 | 136 | ||||||||
COMM Mortgage Trust, Ser 2012-CR5, Cl A3 | ||||||||||
2.540%, 12/10/2045 | 125 | 128 | ||||||||
COMM Mortgage Trust, Ser 2012-CRE4, Cl XA, IO | ||||||||||
2.067%, 10/15/2045 (B) | 170 | 13 | ||||||||
COMM Mortgage Trust, Ser 2012-LC4, Cl A4 | ||||||||||
3.288%, 12/10/2044 | 120 | 128 | ||||||||
COMM Mortgage Trust, Ser 2013-CCRE9, Cl A4 | ||||||||||
4.238%, 07/10/2045 (B) | 90 | 101 | ||||||||
COMM Mortgage Trust, Ser 2013-CR10, Cl A4 | ||||||||||
4.210%, 08/10/2046 (B) | 80 | 90 | ||||||||
COMM Mortgage Trust, Ser 2013-CR6, Cl D | ||||||||||
4.310%, 03/10/2046 (A)(B) | 515 | 458 | ||||||||
COMM Mortgage Trust, Ser 2013-CR6, Cl A4 | ||||||||||
3.101%, 03/10/2046 | 135 | 142 | ||||||||
COMM Mortgage Trust, Ser 2013-CR8, Cl A4 | ||||||||||
3.334%, 06/10/2046 | 130 | 139 | ||||||||
| Description | Face Amount (Thousands) | Market Value ($ Thousands) | ||||||||
MORTGAGE-BACKED SECURITIES (continued) |
| |||||||||
COMM Mortgage Trust, Ser 2013-CR9, Cl A3 | ||||||||||
4.022%, 07/10/2045 | $ | 50 | $ | 55 | ||||||
COMM Mortgage Trust, Ser 2013-LC13, Cl A5 | ||||||||||
4.205%, 09/10/2023 | 45 | 50 | ||||||||
COMM Mortgage Trust, Ser 2014-CCRE14, Cl A3 | ||||||||||
3.955%, 02/10/2047 | 70 | 77 | ||||||||
COMM Mortgage Trust, Ser 2014-CR16, Cl A4 | ||||||||||
4.051%, 04/10/2047 | 25 | 28 | ||||||||
COMM Mortgage Trust, Ser 2014-CR19, Cl A5 | ||||||||||
3.796%, 08/10/2047 | 180 | 197 | ||||||||
COMM Mortgage Trust, Ser 2014-CR21, Cl A3 | ||||||||||
3.528%, 12/10/2047 | 75 | 81 | ||||||||
COMM Mortgage Trust, Ser 2014-SAVA, Cl A | ||||||||||
1.658%, 06/15/2034 (A)(B) | 122 | 122 | ||||||||
COMM Mortgage Trust, Ser 2014-UBS2, Cl A5 | ||||||||||
3.961%, 03/10/2047 | 25 | 28 | ||||||||
COMM Mortgage Trust, Ser 2014-UBS4, Cl A5 | ||||||||||
3.694%, 08/10/2047 | 95 | 103 | ||||||||
COMM Mortgage Trust, Ser 2015-3BP, Cl A | ||||||||||
3.178%, 02/10/2035 (A) | 100 | 105 | ||||||||
COMM Mortgage Trust, Ser 2015-CR23, Cl A4 | ||||||||||
3.497%, 05/10/2048 | 80 | 86 | ||||||||
COMM Mortgage Trust, Ser 2015-CR24, Cl A5 | ||||||||||
3.696%, 08/10/2048 | 90 | 98 | ||||||||
COMM Mortgage Trust, Ser 2015-DC1, Cl A5 | ||||||||||
3.350%, 02/10/2048 | 155 | 164 | ||||||||
COMM Mortgage Trust, Ser 2015-LC19, Cl A4 | ||||||||||
3.183%, 02/10/2048 | 70 | 74 | ||||||||
COMM Mortgage Trust, Ser 2015-PC1, Cl A4 | ||||||||||
3.620%, 07/10/2050 | 50 | 54 | ||||||||
Commercial Mortgage Loan Trust, Ser 2008-LS1, Cl A4B | ||||||||||
6.296%, 12/10/2049 (B) | 194 | 199 | ||||||||
Commercial Mortgage Pass Through Certificates, Ser 2012-CR3, Cl A3 | ||||||||||
2.822%, 10/15/2045 | 70 | 73 | ||||||||
Commercial Mortgage Pass Through Certificates, Ser CR14, Cl XA, IO | ||||||||||
0.994%, 02/10/2047 (B) | 685 | 24 | ||||||||
Commercial Mortgage Pass-Through Certificates, Ser 2008-C1, Cl A3 | ||||||||||
6.267%, 02/15/2041 (B) | 55 | 57 | ||||||||
Commercial Mortgage Trust, Ser 2007-GG9, Cl AM | ||||||||||
5.475%, 03/10/2039 | 370 | 373 | ||||||||
Credit Suisse Commercial Mortgage Trust Series, Ser 2007-C2, Cl A3 | ||||||||||
5.542%, 01/15/2049 (B) | 15 | 15 | ||||||||
Credit Suisse Commercial Mortgage Trust, Ser 2007-C3, Cl A4 | ||||||||||
5.889%, 06/15/2039 (B) | 114 | 115 | ||||||||
42 |
SEI Institutional International Trust / Annual Report / September 30, 2016 |
| Description | Face Amount (Thousands) | Market Value ($ Thousands) | ||||||||
MORTGAGE-BACKED SECURITIES (continued) |
| |||||||||
Credit Suisse First Boston Mortgage Securities, Ser 2005-C2, Cl AMFX | ||||||||||
4.877%, 04/15/2037 | $ | 27 | $ | 24 | ||||||
CSAIL Commercial Mortgage Trust, Ser 2015-C2, Cl XA, IO | ||||||||||
1.055%, 06/15/2057 (B) | 537 | 29 | ||||||||
CSAIL Commercial Mortgage Trust, Ser 2015-C3, Cl A4 | ||||||||||
3.691%, 08/15/2048 | 160 | 175 | ||||||||
CSAIL Commercial Mortgage Trust, Ser 2015-C3, Cl D | ||||||||||
3.508%, 08/15/2048 (B) | 75 | 56 | ||||||||
CSAIL Commercial Mortgage Trust, Ser 2015-C4, Cl A4 | ||||||||||
3.808%, 11/15/2048 | 155 | 170 | ||||||||
CSAIL Commercial Mortgage Trust, Ser 2016-C5, Cl XA, IO | ||||||||||
1.213%, 11/15/2048 (B) | 997 | 66 | ||||||||
FNMA Connecticut Avenue Securities, Ser 2013-C01, Cl M1 | ||||||||||
2.525%, 10/25/2023 (B) | 61 | 62 | ||||||||
FNMA Connecticut Avenue Securities, Ser 2014-C01, Cl M1 | ||||||||||
2.124%, 01/25/2024 (B) | 439 | 442 | ||||||||
FNMA Connecticut Avenue Securities, Ser 2014-C02, Cl 2M1 | ||||||||||
1.474%, 05/25/2024 (B) | 8 | 8 | ||||||||
FNMA Connecticut Avenue Securities, Ser 2014-C04, Cl 2M1 | ||||||||||
2.625%, 11/25/2024 (B) | 80 | 80 | ||||||||
FNMA Connecticut Avenue Securities, Ser 2015-C02, Cl 2M1 | ||||||||||
1.725%, 05/25/2025 (B) | 35 | 35 | ||||||||
FNMA Connecticut Avenue Securities, Ser 2016-C02, Cl 1M1 | ||||||||||
2.588%, 09/25/2028 (B) | 441 | 447 | ||||||||
FNMA Connecticut Avenue Securities, Ser 2016-C04, Cl 1M2 | ||||||||||
4.775%, 01/25/2029 (B) | 95 | 97 | ||||||||
FNMA Connecticut Avenue Securities, Ser 2016-C05, Cl 2M1 | ||||||||||
1.875%, 01/25/2029 (B) | 155 | 155 | ||||||||
GE Commercial Mortgage Trust, Ser 2007-C1, Cl AM | ||||||||||
5.606%, 12/10/2049 (B) | 35 | 35 | ||||||||
GS Mortgage Securities II, Ser 2007-GG10, Cl A4 | ||||||||||
5.988%, 08/10/2045 (B) | 134 | 136 | ||||||||
GS Mortgage Securities II, Ser 2012-ALOH, Cl A | ||||||||||
3.551%, 04/10/2034 (A) | 100 | 108 | ||||||||
GS Mortgage Securities II, Ser GC30, Cl A4 | ||||||||||
3.382%, 05/10/2050 | 160 | 171 | ||||||||
| Description | Face Amount (Thousands) | Market Value ($ Thousands) | ||||||||
MORTGAGE-BACKED SECURITIES (continued) |
| |||||||||
GS Mortgage Securities Trust, Ser 2011-GC5, Cl XA, IO | ||||||||||
1.572%, 08/10/2044 (A)(B) | $ | 339 | $ | 18 | ||||||
GS Mortgage Securities Trust, Ser 2013-GC13, Cl XA, IO | ||||||||||
0.299%, 07/10/2046 (B) | 2,797 | 18 | ||||||||
GS Mortgage Securities Trust, Ser 2014-GC18, Cl A4 | ||||||||||
4.074%, 01/10/2047 | 95 | 106 | ||||||||
GS Mortgage Securities Trust, Ser 2014-GC20, Cl D | ||||||||||
5.029%, 04/10/2047 (A)(B) | 80 | 57 | ||||||||
GSR Mortgage Loan Trust, Ser 2005-AR1, Cl 4A1 | ||||||||||
2.378%, 01/25/2035 (B) | 96 | 90 | ||||||||
JPMBB Commercial Mortgage Securities, Ser 2014-C23, Cl XA, IO | ||||||||||
1.014%, 09/15/2047 (B) | 987 | 37 | ||||||||
JPMBB Commercial Mortgage Securities, Ser 2014-C26, Cl A4 | ||||||||||
3.494%, 01/15/2048 | 15 | 16 | ||||||||
JPMBB Commercial Mortgage Securities, Ser 2015-C27, Cl A4 | ||||||||||
3.179%, 02/15/2048 | 25 | 26 | ||||||||
JPMorgan Chase Commercial Mortgage Securities, Ser 2006-LDP9, Cl A3 | ||||||||||
5.336%, 05/15/2047 | 37 | 37 | ||||||||
JPMorgan Chase Commercial Mortgage Securities, Ser 2007-C1, Cl A4 | ||||||||||
5.716%, 02/15/2051 | 39 | 40 | ||||||||
JPMorgan Chase Commercial Mortgage Securities, Ser 2007-CB19, Cl A4 | ||||||||||
5.882%, 02/12/2049 (B) | 143 | 145 | ||||||||
JPMorgan Chase Commercial Mortgage Securities, Ser 2008-C2, Cl A4FL | ||||||||||
2.018%, 02/12/2051 (B) | 305 | 297 | ||||||||
JPMorgan Chase Commercial Mortgage Securities, Ser 2008-C2, Cl A4 | ||||||||||
6.068%, 02/12/2051 | 27 | 28 | ||||||||
JPMorgan Chase Commercial Mortgage Securities, Ser 2012-C8, Cl A3 | ||||||||||
2.829%, 10/15/2045 | 135 | 141 | ||||||||
JPMorgan Chase Commercial Mortgage Securities, Ser 2012-LC9, Cl A5 | ||||||||||
2.840%, 12/15/2047 | 135 | 141 | ||||||||
JPMorgan Chase Commercial Mortgage Securities, Ser 2014-INN, Cl A | ||||||||||
1.444%, 06/15/2029 (A)(B) | 130 | 129 | ||||||||
JPMorgan Mortgage Trust, Ser 2004-A5, Cl 3A1 | ||||||||||
2.798%, 12/25/2034 (B) | 78 | 78 | ||||||||
LB-UBS Commercial Mortgage Trust, Ser 2007-C6, Cl A4 | ||||||||||
5.858%, 07/15/2040 (B) | 86 | 87 | ||||||||
SEI Institutional International Trust / Annual Report / September 30, 2016 |
43 |
SCHEDULE OF INVESTMENTS
September 30, 2016
International Fixed Income Fund (Continued)
| Description | Face Amount (Thousands) | Market Value ($ Thousands) | ||||||||
MORTGAGE-BACKED SECURITIES (continued) |
| |||||||||
LB-UBS Commercial Mortgage Trust, Ser 2008-C1, Cl A2 | ||||||||||
6.287%, 04/15/2041 (B) | $ | 40 | $ | 42 | ||||||
LSTAR Commercial Mortgage Trust, Ser 2016-4, Cl A2 | ||||||||||
2.458%, 03/10/2049 (A)(B) | 159 | 159 | ||||||||
ML-CFC Commercial Mortgage Trust, Ser 2007-5, Cl AM | ||||||||||
5.419%, 08/12/2048 | 40 | 40 | ||||||||
Morgan Stanley Bank of America Merrill Lynch Trust, Ser 2012-C5, Cl A4 | ||||||||||
3.176%, 08/15/2045 | 40 | 42 | ||||||||
Morgan Stanley Bank of America Merrill Lynch Trust, Ser 2012-C6, Cl A4 | ||||||||||
2.858%, 11/15/2045 | 100 | 105 | ||||||||
Morgan Stanley Bank of America Merrill Lynch Trust, Ser 2013-C10, Cl A4 | ||||||||||
2.518%, 07/15/2046 (B) | 175 | 196 | ||||||||
Morgan Stanley Bank of America Merrill Lynch Trust, Ser 2013-C12, Cl A4 | ||||||||||
4.259%, 10/15/2046 (B) | 65 | 74 | ||||||||
Morgan Stanley Bank of America Merrill Lynch Trust, Ser 2013-C13, Cl A3 | ||||||||||
3.766%, 11/15/2046 | 130 | 143 | ||||||||
Morgan Stanley Bank of America Merrill Lynch Trust, Ser 2014-C14, Cl A5 | ||||||||||
4.064%, 02/15/2047 | 25 | 28 | ||||||||
Morgan Stanley Bank of America Merrill Lynch Trust, Ser 2014-C17, Cl A5 | ||||||||||
3.741%, 08/15/2047 | 65 | 71 | ||||||||
Morgan Stanley Bank of America Merrill Lynch Trust, Ser 2014-C19, Cl A4 | ||||||||||
3.526%, 12/15/2047 | 55 | 60 | ||||||||
Morgan Stanley Bank of America Merrill Lynch Trust, Ser 2015-C20, Cl A4 | ||||||||||
3.249%, 02/15/2048 | 65 | 69 | ||||||||
Morgan Stanley Bank of America Merrill Lynch Trust, Ser 2015-C22, Cl A4 | ||||||||||
3.306%, 04/15/2048 | 60 | 64 | ||||||||
Morgan Stanley Bank of America Merrill Lynch Trust, Ser 2015-C26, Cl XA, IO | ||||||||||
1.272%, 10/15/2048 (B) | 134 | 10 | ||||||||
Morgan Stanley Capital I Trust, Ser 2006-T21, Cl D | ||||||||||
5.400%, 10/12/2052 (A)(B) | 15 | 14 | ||||||||
Morgan Stanley Capital I Trust, Ser 2006-T21, Cl E | ||||||||||
5.400%, 10/12/2052 (A)(B) | 10 | 9 | ||||||||
Morgan Stanley Capital I Trust, Ser 2007-HQ13, Cl A3 | ||||||||||
5.569%, 12/15/2044 | 93 | 96 | ||||||||
| Description | Face Amount (Thousands) | Market Value ($ Thousands) | ||||||||
MORTGAGE-BACKED SECURITIES (continued) |
| |||||||||
Morgan Stanley Capital I Trust, Ser 2007-IQ14, Cl A4 | ||||||||||
5.692%, 04/15/2049 (B) | $ | 160 | $ | 162 | ||||||
Morgan Stanley Capital I Trust, Ser 2008-TOP29, Cl D | ||||||||||
6.477%, 01/11/2043 (A)(B) | 35 | 35 | ||||||||
Morgan Stanley Capital I Trust, Ser 2012-C4, Cl A4 | ||||||||||
3.244%, 03/15/2045 | 140 | 149 | ||||||||
Morgan Stanley Re-REMIC Trust, Ser 2010-GG10, Cl A4A | ||||||||||
5.988%, 08/15/2045 (A)(B) | 164 | 165 | ||||||||
SFAVE Commercial Mortgage Securities Trust, Ser 2015-5AVE, Cl A1 | ||||||||||
3.872%, 01/05/2043 (A)(B) | 135 | 140 | ||||||||
SFAVE Commercial Mortgage Securities Trust, Ser 2015-5AVE, Cl A2B | ||||||||||
4.144%, 01/05/2043 (A)(B) | 120 | 127 | ||||||||
UBS-Barclays Commercial Mortgage Trust, Ser 2012-C3, Cl A4 | ||||||||||
3.091%, 08/10/2049 | 40 | 42 | ||||||||
UBS-Barclays Commercial Mortgage Trust, Ser 2013-C5, Cl A4 | ||||||||||
3.185%, 03/10/2046 | 130 | 137 | ||||||||
UBS-Barclays Commercial Mortgage Trust, Ser 2013-C6, Cl A4 | ||||||||||
3.244%, 04/10/2046 | 120 | 127 | ||||||||
UBS-Barclays Commercial Mortgage Trust, Ser 2013-C6, Cl A3 | ||||||||||
2.971%, 04/10/2046 | 70 | 72 | ||||||||
Wells Fargo Commercial Mortgage Trust, Ser 2012-LC5, Cl D | ||||||||||
4.935%, 10/15/2045 (A)(B) | 35 | 34 | ||||||||
Wells Fargo Commercial Mortgage Trust, Ser 2015-C29, Cl A4 | ||||||||||
3.637%, 06/15/2048 | 180 | 195 | ||||||||
Wells Fargo Commercial Mortgage Trust, Ser 2015-C30, Cl A3 | ||||||||||
3.411%, 09/15/2058 | 165 | 177 | ||||||||
Wells Fargo Commercial Mortgage Trust, Ser 2015-LC22, Cl A4 | ||||||||||
3.839%, 09/15/2058 | 35 | 38 | ||||||||
Wells Fargo Commercial Mortgage Trust, Ser 2015-NXS1, Cl D | ||||||||||
4.241%, 05/15/2048 (B) | 65 | 53 | ||||||||
WFRBS Commercial Mortgage Trust, Ser 2011-C4, Cl A4 | ||||||||||
4.902%, 06/15/2044 (A)(B) | 120 | 135 | ||||||||
WFRBS Commercial Mortgage Trust, Ser 2011-C5, Cl A4 | ||||||||||
3.667%, 11/15/2044 | 45 | 49 | ||||||||
44 |
SEI Institutional International Trust / Annual Report / September 30, 2016 |
| Description | Face Amount (Thousands) | Market Value ($ Thousands) | ||||||||
MORTGAGE-BACKED SECURITIES (continued) |
| |||||||||
WFRBS Commercial Mortgage Trust, Ser 2012-C10, Cl A3 | ||||||||||
2.875%, 12/15/2045 | $ | 195 | $ | 203 | ||||||
WFRBS Commercial Mortgage Trust, Ser 2012-C6, Cl D | ||||||||||
5.771%, 04/15/2045 (A)(B) | 55 | 57 | ||||||||
WFRBS Commercial Mortgage Trust, Ser 2012-C8, Cl A3 | ||||||||||
3.001%, 08/15/2045 | 20 | 21 | ||||||||
WFRBS Commercial Mortgage Trust, Ser 2012-C9, Cl A3 | ||||||||||
2.870%, 11/15/2045 | 75 | 79 | ||||||||
WFRBS Commercial Mortgage Trust, Ser 2014-C20, Cl A5 | ||||||||||
3.995%, 05/15/2047 | 100 | 111 | ||||||||
WFRBS Commercial Mortgage Trust, Ser 2014-C21, Cl A5 | ||||||||||
3.678%, 08/15/2047 | 60 | 65 | ||||||||
WFRBS Commercial Mortgage Trust, Ser 2014-C24, Cl A5 | ||||||||||
3.607%, 11/15/2047 | 75 | 81 | ||||||||
WFRBS Commerical Mortgage Trust, Ser 2013-C15, Cl A3 | ||||||||||
3.881%, 08/15/2046 | 70 | 76 | ||||||||
|
|
| ||||||||
| 12,215 | ||||||||||
|
|
| ||||||||
Total Mortgage-Backed Securities | 14,430 | |||||||||
|
|
| ||||||||
CORPORATE OBLIGATIONS — 1.1% |
| |||||||||
United States — 1.1% | ||||||||||
Allison Transmission | ||||||||||
5.000%, 10/01/2024 (A) | 290 | 297 | ||||||||
Anadarko Petroleum | ||||||||||
6.375%, 09/15/2017 | 42 | 44 | ||||||||
CenturyLink | ||||||||||
6.450%, 06/15/2021 | 144 | 154 | ||||||||
Charter Communications Operating | ||||||||||
4.908%, 07/23/2025 (A) | 375 | 414 | ||||||||
3.579%, 07/23/2020 (A) | 180 | 188 | ||||||||
CNA Financial | ||||||||||
7.250%, 11/15/2023 | 110 | 134 | ||||||||
Cox Communications | ||||||||||
2.950%, 06/30/2023 (A) | 127 | 125 | ||||||||
Diamond 1 Finance | ||||||||||
5.450%, 06/15/2023 (A) | 240 | 257 | ||||||||
4.420%, 06/15/2021 (A) | 240 | 251 | ||||||||
Enterprise Products Operating | ||||||||||
5.950%, 02/01/2041 | 70 | 81 | ||||||||
General Motors Financial | ||||||||||
2.025%, 04/10/2018 (B) | 328 | 329 | ||||||||
| Description | Face Amount (Thousands) | Market Value ($ Thousands) | ||||||||
CORPORATE OBLIGATIONS (continued) |
| |||||||||
Hewlett Packard Enterprise | ||||||||||
4.900%, 10/15/2025 (A) | $ | 350 | $ | 374 | ||||||
JPMorgan Chase MTN | ||||||||||
2.295%, 08/15/2021 | 323 | 324 | ||||||||
Mylan | ||||||||||
3.150%, 06/15/2021 (A) | 349 | 356 | ||||||||
Navient MTN | ||||||||||
5.500%, 01/15/2019 | 248 | 252 | ||||||||
Pioneer Natural Resources | ||||||||||
4.450%, 01/15/2026 | 75 | 81 | ||||||||
PNC Bank | ||||||||||
2.700%, 11/01/2022 | 445 | 452 | ||||||||
S&P Global | ||||||||||
5.900%, 11/15/2017 | 325 | 339 | ||||||||
Time Warner | ||||||||||
4.875%, 03/15/2020 | 150 | 166 | ||||||||
Transocean | ||||||||||
9.000%, 07/15/2023 (A) | 280 | 271 | ||||||||
Western Digital | ||||||||||
7.375%, 04/01/2023 (A) | 265 | 291 | ||||||||
Williams Partners | ||||||||||
4.000%, 11/15/2021 | 150 | 155 | ||||||||
|
|
| ||||||||
Total Corporate Obligations | 5,335 | |||||||||
|
|
| ||||||||
U.S. TREASURY OBLIGATION — 0.6% |
| |||||||||
U.S. Treasury Inflation Indexed Bonds | ||||||||||
0.250%, 01/15/2025 | 3,160 | 3,219 | ||||||||
|
|
| ||||||||
Total U.S. Treasury Obligation | 3,219 | |||||||||
|
|
| ||||||||
ASSET-BACKED SECURITY — 0.0% |
| |||||||||
Other Asset-Backed Securities — 0.0% |
| |||||||||
Volta Electricity Receivables, Ser 2013-1, Cl SNR | ||||||||||
4.172%, 02/16/2017 | EUR | 36 | 41 | |||||||
|
|
| ||||||||
Total Asset-Backed Security | 41 | |||||||||
|
|
| ||||||||
Total Investments — 98.2% | $ | 500,696 | ||||||||
|
|
| ||||||||
SEI Institutional International Trust / Annual Report / September 30, 2016 |
45 |
SCHEDULE OF INVESTMENTS
September 30, 2016
International Fixed Income Fund (Continued)
A list of the open futures contracts held by the Fund at September 30, 2016, is as follows:
| Type of Contract | Number of Contracts Long (Short) | Expiration Date | Unrealized Appreciation (Depreciation) ($ Thousands) | |||||||||
3 Month Euribor | 18 | Dec-2016 | $(1) | |||||||||
Australian 10-Year Bond | 13 | Dec-2016 | 6 | |||||||||
Australian 3-Year Bond | (1) | Dec-2016 | – | |||||||||
Canadian 10-Year Bond | (6) | Dec-2016 | 2 | |||||||||
Euro | (180) | Dec-2016 | 20 | |||||||||
Euro-Bob | (24) | Dec-2016 | (10) | |||||||||
Euro-Bund | (18) | Dec-2016 | (23) | |||||||||
Euro-Buxl 30 Year Bond | (3) | Dec-2016 | (3) | |||||||||
Euro-OAT 10 Year Bond | (1) | Dec-2016 | (1) | |||||||||
Euro-Schatz | 50 | Dec-2016 | 4 | |||||||||
Japanese 10-Year Bond | 3 | Dec-2016 | 16 | |||||||||
Japanese 10-Year MINI | 79 | Dec-2016 | 40 | |||||||||
Long Gilt 10-Year Bond | (53) | Dec-2016 | 53 | |||||||||
U.S. 10-Year Treasury Note | (88) | Dec-2016 | (47) | |||||||||
U.S. 2-Year Treasury Note | (49) | Dec-2016 | – | |||||||||
U.S. 5-Year Treasury Note | (83) | Dec-2016 | (14) | |||||||||
U.S. Long Treasury Bond | 40 | Dec-2016 | (111) | |||||||||
U.S. Ultra Long Treasury Bond | (22) | Dec-2016 | 10 | |||||||||
Ultra 10-Year U.S. Treasury Bond | (17) | Dec-2016 | (5) | |||||||||
|
| |||||||||||
| $(64) | ||||||||||||
|
| |||||||||||
For the year ended September 30, 2016, the total amount of all open futures contracts, as presented in the table above, are representative of the volume of activity for the derivative type during the year.
A list of the open forward foreign currency contracts held by the Fund at September 30, 2016, is as follows:
Settlement Date | Currency to Deliver (Thousands) | Currency To Receive (Thousands) | Unrealized Appreciation (Depreciation) ($ Thousands) | |||||||||||||||||
10/04/16 | USD | 201 | PLN | 769 | $— | |||||||||||||||
11/10/16 | USD | 204 | CAD | 269 | 1 | |||||||||||||||
10/04/16-11/04/16 | USD | 320 | CAD | 415 | (4) | |||||||||||||||
10/04/16-10/04/16 | USD | 817 | MXN | 15,140 | (34) | |||||||||||||||
10/04/16 | USD | 877 | MYR | 3,619 | (2) | |||||||||||||||
10/04/16-11/04/16 | USD | 1,395 | NOK | 11,370 | 27 | |||||||||||||||
11/04/16 | USD | 135 | NOK | 1,080 | — | |||||||||||||||
10/04/16-11/04/16 | USD | 2,778 | NZD | 3,786 | (25) | |||||||||||||||
10/04/16 | USD | 3,893 | KRW | 4,308,616 | 20 | |||||||||||||||
11/04/16 | USD | 440 | SEK | 3,780 | 2 | |||||||||||||||
10/04/16-12/07/16 | USD | 3,772 | SEK | 32,055 | (23) | |||||||||||||||
10/04/16 | CHF | 2,375 | USD | 2,463 | 13 | |||||||||||||||
10/04/16-11/04/16 | CHF | 3,003 | USD | 3,100 | (4) | |||||||||||||||
10/04/16-10/28/16 | USD | 5,079 | AUD | 6,683 | 32 | |||||||||||||||
11/04/16-11/04/16 | USD | 575 | AUD | 751 | (1) | |||||||||||||||
10/11/16-11/04/16 | USD | 3,243 | GBP | 2,500 | 5 | |||||||||||||||
10/04/16-11/04/16 | USD | 3,428 | GBP | 2,586 | (69) | |||||||||||||||
10/04/16 | MYR | 3,619 | USD | 898 | 23 | |||||||||||||||
11/04/16 | MYR | 3,619 | USD | 876 | — | |||||||||||||||
10/04/16-12/14/16 | SGD | 7,338 | USD | 5,394 | 9 | |||||||||||||||
10/04/16-11/04/16 | USD | 3,011 | JPY | 308,757 | 38 | |||||||||||||||
10/04/16-11/04/16 | USD | 5,513 | JPY | 553,588 | (41) | |||||||||||||||
10/04/16-11/04/16 | NZD | 9,509 | USD | 6,942 | 31 | |||||||||||||||
10/04/16-10/14/16 | NZD | 2,077 | USD | 1,492 | (18) | |||||||||||||||
Settlement Date | Currency to Deliver (Thousands) | Currency To Receive (Thousands) | Unrealized Appreciation (Depreciation) ($ Thousands) | |||||||||||||||||
10/04/16-11/04/16 | NOK | 12,489 | USD | 1,531 | $(32) | |||||||||||||||
10/04/16-11/04/16 | PLN | 7,493 | USD | 1,961 | 4 | |||||||||||||||
10/07/16 | PLN | 7,040 | USD | 1,770 | (70) | |||||||||||||||
11/04/16 | ZAR | 7,652 | USD | 563 | 10 | |||||||||||||||
10/04/16 | ZAR | 7,652 | USD | 538 | (19) | |||||||||||||||
10/04/16-11/04/16 | AUD | 12,109 | USD | 9,301 | 42 | |||||||||||||||
10/04/16-11/04/16 | AUD | 12,677 | USD | 9,560 | (140) | |||||||||||||||
10/04/16-11/04/16 | USD | 9,239 | EUR | 8,247 | 31 | |||||||||||||||
10/04/16-10/11/16 | USD | 15,880 | EUR | 14,104 | (27) | |||||||||||||||
10/04/16-12/07/16 | SEK | 25,953 | USD | 3,069 | 35 | |||||||||||||||
10/04/16 | CZK | 13,857 | USD | 579 | 2 | |||||||||||||||
11/04/16 | CZK | 13,857 | USD | 577 | — | |||||||||||||||
11/03/16 | BRL | 13,909 | USD | 4,253 | 9 | |||||||||||||||
10/04/16-01/04/17 | BRL | 20,169 | USD | 5,644 | (513) | |||||||||||||||
10/04/16-11/10/16 | CAD | 44,645 | USD | 34,544 | 565 | |||||||||||||||
10/04/16-11/10/16 | CAD | 11,182 | USD | 8,461 | (50) | |||||||||||||||
10/04/16-11/04/16 | THB | 62,626 | USD | 1,810 | 2 | |||||||||||||||
10/04/16-11/16/16 | GBP | 28,727 | USD | 37,854 | 535 | |||||||||||||||
11/04/16-11/16/16 | GBP | 36,915 | USD | 47,948 | (35) | |||||||||||||||
10/04/16-10/04/16 | MXN | 39,560 | USD | 2,106 | 62 | |||||||||||||||
11/04/16-11/22/16 | MXN | 58,376 | USD | 2,974 | (28) | |||||||||||||||
10/04/16-11/18/16 | EUR | 64,142 | USD | 72,417 | 294 | |||||||||||||||
10/04/16-11/14/16 | EUR | 236,248 | USD | 264,034 | (1,714) | |||||||||||||||
10/04/16-11/04/16 | KRW | 8,617,232 | USD | 7,737 | (88) | |||||||||||||||
10/04/16-11/04/16 | JPY | 12,850,500 | USD | 127,851 | 855 | |||||||||||||||
10/04/16-11/04/16 | JPY | 3,852,391 | USD | 37,378 | (678) | |||||||||||||||
10/05/16-11/04/16 | ILS | 1,554 | USD | 413 | (1) | |||||||||||||||
10/06/16 | USD | 944 | TWD | 29,774 | 6 | |||||||||||||||
10/06/16 | TWD | 29,604 | USD | 935 | (10) | |||||||||||||||
10/11/16 | USD | 3,833 | DKK | 25,409 | 3 | |||||||||||||||
10/11/16 | DKK | 21,432 | USD | 3,211 | (25) | |||||||||||||||
10/13/16-10/13/16 | USD | 1,978 | RUB | 128,416 | 55 | |||||||||||||||
10/13/16 | RUB | 128,976 | USD | 1,992 | (50) | |||||||||||||||
10/21/16 | JPY | 197,883 | GBP | 1,459 | (60) | |||||||||||||||
11/28/16 | USD | 470 | TRY | 1,414 | (3) | |||||||||||||||
12/12/16-03/08/17 | USD | 239 | ARS | 4,411 | 32 | |||||||||||||||
06/14/17-06/16/17 | USD | 241 | ARS | 4,100 | (1) | |||||||||||||||
12/12/16 | ARS | 894 | USD | 57 | 1 | |||||||||||||||
12/15/16 | USD | 1,355 | INR | 91,730 | 8 | |||||||||||||||
12/20/16 | EUR | 3,405 | CZK | 92,000 | 9 | |||||||||||||||
01/04/17 | USD | 1,706 | BRL | 6,397 | 209 | |||||||||||||||
|
| |||||||||||||||||||
| $(795) | ||||||||||||||||||||
|
| |||||||||||||||||||
A list of the counterparties for the outstanding forward foreign currency contracts held by the Fund at September 30, 2016, is as follows:
| Counterparty | Currency to Deliver ($ Thousands) | Currency to Receive ($ Thousands) | Unrealized Appreciation (Depreciation) ($ Thousands) | |||||||||
Bank of America | $(22,162) | $22,640 | $478 | |||||||||
Bank of Montreal | (103,622) | 103,746 | 124 | |||||||||
Barclays PLC | (11,577) | 11,464 | (113) | |||||||||
BNP Paribas | (4,366) | 4,345 | (21) | |||||||||
46 |
SEI Institutional International Trust / Annual Report / September 30, 2016 |
| Counterparty | Currency to Deliver ($ Thousands) | Currency to Receive ($ Thousands) | Unrealized Appreciation (Depreciation) ($ Thousands) | |||||||||
Brown Brothers Harriman | $(49,748) | $49,280 | $(468) | |||||||||
Citigroup | (131,757) | 132,652 | 895 | |||||||||
Commonwealth Bank Of Australia | (2,395) | 2,398 | 3 | |||||||||
Credit Suisse First Boston | (8,965) | 8,944 | (21) | |||||||||
Deutsche Bank | (628) | 613 | (15) | |||||||||
Goldman Sachs | (91,519) | 91,732 | 213 | |||||||||
HSBC | (47,068) | 46,982 | (86) | |||||||||
ITG | (55,227) | 54,370 | (857) | |||||||||
JPMorgan Chase Bank | (14,428) | 14,430 | 2 | |||||||||
Merrill Lynch | (5,191) | 5,192 | 1 | |||||||||
Morgan Stanley | (10,329) | 10,360 | 31 | |||||||||
National Australia Capital Markets | (79,220) | 78,722 | (498) | |||||||||
National Bank of Australia | (113,374) | 112,757 | (617) | |||||||||
A list of the open OTC swap agreements held by the Fund at September 30, 2016, is as follows:
| Counterparty | Currency to Deliver ($ Thousands) | Currency to Receive ($ Thousands) | Unrealized Appreciation (Depreciation) ($ Thousands) | |||||||||
RBC | $(10,704) | $10,813 | $109 | |||||||||
Royal Bank of Scotland | (1,191) | 1,189 | (2) | |||||||||
SG Cowen | (5,566) | 5,569 | 3 | |||||||||
Standard Chartered | (8,129) | 8,159 | 30 | |||||||||
State Street | (3,352) | 3,334 | (18) | |||||||||
TD Securities | (373) | 371 | (2) | |||||||||
UBS | (3,307) | 3,307 | — | |||||||||
USAllianz | (4,402) | 4,437 | 35 | |||||||||
Wells Fargo | (61) | 60 | (1) | |||||||||
Westpac Banking | (1,919) | 1,919 | — | |||||||||
|
|
| ||||||||||
| $ (795) | ||||||||||||
|
|
| ||||||||||
For the year ended September 30, 2016, the total amount of all open forward foreign currency contracts, as presented in the table above, are representative of the volume of activity for the derivative type during the year.
| Credit Default Swaps | ||||||||||||||||||
| Counterparty | Reference Entity/Obligation | Buy/Sell Protection | (Pays)/Receives Rate | Termination Date | Notional Amount (Thousands) | Net ($ Thousands) | ||||||||||||
| Credit Suisse | Cmbx.Na.Bb.6 | SELL | 5.00 | 05/11/49 | (370 | ) | $ | (1 | ) | |||||||||
| Credit Suisse | Cmbx.Na.Bb.6 | SELL | 5.00 | 05/11/49 | (240 | ) | (11 | ) | ||||||||||
| Credit Suisse | Cmbx.Na.Bbb-.6 | SELL | 3.00 | 05/11/49 | (373 | ) | (6 | ) | ||||||||||
| Credit Suisse | Cmbx.Na.Bbb-.6 | SELL | 3.00 | 05/11/49 | (127 | ) | (2 | ) | ||||||||||
| Credit Suisse | Cmbx.Na.Bbb-.6 | SELL | 3.00 | 05/11/49 | (134 | ) | (3 | ) | ||||||||||
| Credit Suisse | Cmbx.Na.Bbb-.6 | SELL | 3.00 | 05/11/49 | (460 | ) | (5 | ) | ||||||||||
| Deutsche Bank | Cmbx.Na.Bbb-.6 | SELL | 3.00 | 05/11/49 | (406 | ) | (6 | ) | ||||||||||
|
|
| ||||||||||||||||
| $ | (34 | ) | ||||||||||||||||
|
|
| ||||||||||||||||
A list of the open centrally cleared swap agreements held by the Fund at September 30, 2016, is as follows:
| Interest Rate Swaps | ||||||||||||||||||
| Counterparty | Fund Pays | Fund Receives | Termination Date | Currency | Notional Amount (Thousands) | Net Unrealized Depreciation ($ Thousands) | ||||||||||||
| Citigroup | 2.13% | 3-Month USD - LIBOR | 11/09/25 | USD | 2,240 | $ | (149 | ) | ||||||||||
|
|
| ||||||||||||||||
For the year ended September 30, 2016, the total amount of all swap agreements, as presented in the table above, are representative of the volume of activity for the derivative type during the year.
Percentages are based on Net Assets of $510,058 ($ Thousands).
| (A) | Security exempt from registration under Rule 144A of the Securities Act of 1933. These securities may be resold in transactions exempt from registration normally to qualified institutions. On September 30, 2016, the value of these securities amounted to $48,478 ($ Thousands), representing 9.5% of the net assets of the Fund. |
| (B) | Variable Rate Security — The rate reported on the Schedule of Investments is the rate in effect as of September 30, 2016. |
| (C) | The rate reported is the effective yield at the time of purchase. |
ARS — Argentine Peso
AUD — Australian Dollar
BRL — Brazilian Real
CAD — Canadian Dollar
CHF — Swiss Franc
Cl — Class
COP — Colombian Peso
CPI — Consumer Price Index
CZK — Czech Koruna
DKK — Danish Krone
EUR — Euro
EURIBOR — Euro London Interbank Offered Rate
FHLMC — Federal Home Loan Mortgage Corporation
FNMA — Federal National Mortgage Association
GBP — British Pound Sterling
ILS — Israeli Shekel
INR — India Rupee
IO — Interest Only
JPY — Japanese Yen
KRW — Korean Won
LIBOR — London Interbank Offered Rate
MTN — Medium Term Note
MXN — Mexican Peso
MYR — Malaysian Ringgit
NOK — Norwegian Krone
NZD — New Zealand Dollar
PLC — Public Limited Company
SEI Institutional International Trust / Annual Report / September 30, 2016 |
47 |
SCHEDULE OF INVESTMENTS
September 30, 2016
International Fixed Income Fund (Concluded)
PLN — Polish Zloty
REMIC — Real Estate Mortgage Investment Conduit
RUB — Russian Ruble
SEK — Swedish Krona
Ser — Series
SGD — Singapore Dollar
THB — Thai Bhat
TRY — New Turkish Lira
TWD — Taiwan Dollar
USD — U.S. Dollar
ZAR — South African Rand
The following is a list of the level of inputs used as of September 30, 2016, in valuing the Fund’s investments and other financial instruments carried at value ($ Thousands):
| Investments in Securities | Level 1 | Level 2 | Level 3 | Total | ||||||||||||
Global Bonds | $ | – | $ | 477,671 | $ | – | $ | 477,671 | ||||||||
Mortgage-Backed Securities | – | 14,430 | – | 14,430 | ||||||||||||
Corporate Obligations | – | 5,335 | – | 5,335 | ||||||||||||
U.S. Treasury Obligation | – | 3,219 | – | 3,219 | ||||||||||||
Asset-Backed Security | – | 41 | – | 41 | ||||||||||||
|
|
|
|
|
|
|
|
|
|
|
| |||||
Total Investments in Securities | $ | – | $ | 500,696 | $ | – | $ | 500,696 | ||||||||
|
|
|
|
|
|
|
|
|
|
|
| |||||
| Other Financial Instruments | Level 1 | Level 2 | Level 3 | Total | ||||||||||||
Futures Contracts * | ||||||||||||||||
Unrealized Appreciation | $ | 151 | $ | — | $ | — | $ | 151 | ||||||||
Unrealized Depreciation | (215 | ) | — | — | (215 | ) | ||||||||||
Forwards Contracts * | ||||||||||||||||
Unrealized Appreciation | — | 2,970 | — | 2,970 | ||||||||||||
Unrealized Depreciation | — | (3,765 | ) | — | (3,765 | ) | ||||||||||
OTC Swaps | ||||||||||||||||
Credit Default Swaps * | ||||||||||||||||
Unrealized Depreciation | — | (34 | ) | — | (34 | ) | ||||||||||
Centrally Cleared Swaps | ||||||||||||||||
Interest Rate Swaps * | ||||||||||||||||
Unrealized Depreciation | — | (149 | ) | — | (149 | ) | ||||||||||
|
|
|
|
|
|
|
|
|
|
|
| |||||
Total Other Financial Instruments | $ | (64) | $ | (978) | $ | — | $ | (1,042 | ) | |||||||
|
|
|
|
|
|
|
|
|
|
|
| |||||
*Futures contracts, forwards contracts and swap contracts are valued at the unrealized appreciation (depreciation) on the instrument.
For the year ended September 30, 2016, there were no transfers between Level 1 and Level 2 assets and liabilities.
For the year ended September 30, 2016, there were no transfers between Level 2 and Level 3 assets and liabilities.
For more information on valuation inputs, see Note 2 – Significant Accounting Policies in Notes to Financial Statements.
Amounts designated as “—” are $0 or have been rounded to $0.
The accompanying notes are an integral part of the financial statements.
48 |
SEI Institutional International Trust / Annual Report / September 30, 2016 |
SCHEDULE OF INVESTMENTS
September 30, 2016
Emerging Markets Debt Fund
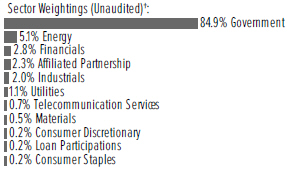
†Percentages based on total investments. Includes investments held as collateral for securities on loan (see Note 9).
| Description | Face Amount (Thousands) | Market Value ($ Thousands) | ||||||||
GLOBAL BONDS — 96.6% | ||||||||||
Angola — 0.3% | ||||||||||
Angolan Government International Bond | ||||||||||
9.500%, 11/12/2025 (A) | $ | 4,579 | $ | 4,551 | ||||||
Republic of Angola Via Northern Lights III | ||||||||||
7.000%, 08/16/2019 | 562 | 562 | ||||||||
|
|
| ||||||||
| 5,113 | ||||||||||
|
|
| ||||||||
Argentina — 3.8% | ||||||||||
Arcor SAIC | ||||||||||
6.000%, 07/06/2023 (B) | 183 | 195 | ||||||||
Argentina Bonar Bonds (C) | ||||||||||
27.919%, 10/09/2017 | ARS | 4,870 | 344 | |||||||
25.645%, 03/01/2018 | 4,696 | 320 | ||||||||
25.182%, 03/11/2019 | 11,481 | 781 | ||||||||
Argentine Bonad Bonds | ||||||||||
2.400%, 03/18/2018 | $ | 1,568 | 1,520 | |||||||
Argentine Bonos del Tesoro | ||||||||||
21.200%, 09/19/2018 | ARS | 26,573 | 1,772 | |||||||
Argentine Republic Government International | ||||||||||
Bond | ||||||||||
7.625%, 04/22/2046 (B) | $ | 40 | 45 | |||||||
Cablevision | ||||||||||
6.500%, 06/15/2021 (B) | 214 | 223 | ||||||||
City of Buenos Aires Argentina | ||||||||||
7.500%, 06/01/2027 (B) | 969 | 1,055 | ||||||||
Petrobras Argentina | ||||||||||
7.375%, 07/21/2023 (B) | 270 | 279 | ||||||||
Provincia de Buenos Aires | ||||||||||
9.950%, 06/09/2021 (B) | 1,240 | 1,426 | ||||||||
Provincia de Cordoba | ||||||||||
7.125%, 06/10/2021 (B) | 531 | 558 | ||||||||
Republic of Argentina | ||||||||||
8.280%, 12/31/2033 | 9,057 | 10,393 | ||||||||
8.280%, 12/31/2033 | 4,154 | 4,642 | ||||||||
7.820%, 12/31/2033 | EUR | 10,027 | 12,593 | |||||||
7.820%, 12/31/2033 | 3,808 | 4,731 | ||||||||
7.500%, 04/22/2026 | $ | 751 | 847 | |||||||
7.500%, 04/22/2026 | 866 | 977 | ||||||||
7.125%, 07/06/2036 | 1,107 | 1,172 | ||||||||
| Description | Face Amount (Thousands) | Market Value ($ Thousands) | ||||||||
GLOBAL BONDS (continued) | ||||||||||
6.875%, 04/22/2021 | $ | 735 | $ | 800 | ||||||
6.875%, 04/22/2021 | 274 | 298 | ||||||||
6.250%, 04/22/2019 | 85 | 90 | ||||||||
6.250%, 04/22/2019 | 150 | 159 | ||||||||
4.191%, 12/15/2035 (C) | EUR | 18,877 | 2,211 | |||||||
3.380%, 03/31/2019 (D) | 942 | 694 | ||||||||
3.043%, 12/15/2035 (C) | $ | 1,203 | 126 | |||||||
2.500%, 03/31/2019 (D) | 2,315 | 1,646 | ||||||||
0.750%, 02/22/2017 | 3,138 | 3,068 | ||||||||
0.044%, 12/15/2035 (C) | 11,382 | 1,212 | ||||||||
YPF | ||||||||||
8.750%, 04/04/2024 (A)(B) | 338 | 375 | ||||||||
8.500%, 07/28/2025 (B) | 2,463 | 2,709 | ||||||||
YPF MTN | ||||||||||
31.354%, 07/07/2020 (B)(C) | 500 | 583 | ||||||||
|
|
| ||||||||
| 57,844 | ||||||||||
|
|
| ||||||||
Armenia — 0.2% | ||||||||||
Republic of Armenia | ||||||||||
7.150%, 03/26/2025 (B) | 2,476 | 2,631 | ||||||||
|
|
| ||||||||
Azerbaijan — 1.1% | ||||||||||
Republic of Azerbaijan | ||||||||||
4.750%, 03/18/2024 (B) | 1,116 | 1,157 | ||||||||
Southern Gas Corridor | ||||||||||
6.875%, 03/24/2026 | 3,379 | 3,784 | ||||||||
State Oil of the Azerbaijan Republic | MTN | |||||||||
4.750%, 03/13/2023 | 4,332 | 4,269 | ||||||||
4.750%, 03/13/2023 (A) | 500 | 493 | ||||||||
State Oil of the Azerbaijan Republic | ||||||||||
6.950%, 03/18/2030 | 1,263 | 1,372 | ||||||||
6.950%, 03/18/2030 | 6,126 | 6,647 | ||||||||
|
|
| ||||||||
| 17,722 | ||||||||||
|
|
| ||||||||
Bahrain — 0.0% | ||||||||||
Bahrain Government International Bond | ||||||||||
7.000%, 01/26/2026 (B) | 641 | 676 | ||||||||
|
|
| ||||||||
Belize — 0.1% | ||||||||||
Belize Government International Bond | ||||||||||
6.767%, 08/20/2017 (D) | 2,637 | 1,444 | ||||||||
|
|
| ||||||||
Bermuda — 0.2% | ||||||||||
Government of Bermuda | ||||||||||
4.854%, 02/06/2024 | 2,480 | 2,740 | ||||||||
|
|
| ||||||||
Brazil — 8.6% | ||||||||||
Banco Nacional de Desenvolvimento Economico e Social | ||||||||||
6.500%, 06/10/2019 (B) | 660 | 711 | ||||||||
Braskem Finance | ||||||||||
5.750%, 04/15/2021 | 1,797 | 1,884 | ||||||||
Brazil Letras do Tesouro Nacional (E) | ||||||||||
17.573%, 07/01/2019 | BRL | 11,540 | 2,637 | |||||||
SEI Institutional International Trust / Annual Report / September 30, 2016 |
49 |
SCHEDULE OF INVESTMENTS
September 30, 2016
Emerging Markets Debt Fund (Continued)
| Description | Face Amount (Thousands) | Market Value ($ Thousands) | ||||||||
GLOBAL BONDS (continued) | ||||||||||
15.050%, 01/01/2019 | BRL | 93,674 | $ | 22,578 | ||||||
14.857%, 01/01/2020 | 25,000 | 5,400 | ||||||||
13.450%, 07/01/2018 | 23,119 | 5,861 | ||||||||
12.701%, 01/01/2017 | 8,210 | 2,447 | ||||||||
10.673%, 01/01/2018 | 59,944 | 15,986 | ||||||||
6.670%, 01/01/2019 | 8,972 | 2,158 | ||||||||
Brazil Loan Trust 1 | ||||||||||
5.477%, 07/24/2023 (B) | $ | 507 | 512 | |||||||
5.477%, 07/24/2023 | 300 | 302 | ||||||||
Brazil Minas SPE via State of Minas Gerais | ||||||||||
5.333%, 02/15/2028 | 1,176 | 1,158 | ||||||||
5.333%, 02/15/2028 | 3,952 | 3,893 | ||||||||
Brazil Notas do Tesouro Nacional Serie B | ||||||||||
6.000%, 08/15/2022 | BRL | 4,000 | 3,650 | |||||||
Brazil Notas do Tesouro Nacional | ||||||||||
10.000%, 01/01/2017 | 197 | 60 | ||||||||
Brazil Notas do Tesouro Nacional, Serie B | ||||||||||
6.000%, 05/15/2035 | 1,000 | 947 | ||||||||
Brazil Notas do Tesouro Nacional, Serie F | ||||||||||
10.000%, 01/01/2019 | 850 | 254 | ||||||||
10.000%, 01/01/2021 | 19,202 | 5,620 | ||||||||
10.000%, 01/01/2023 | 27,303 | 7,832 | ||||||||
10.000%, 01/01/2025 | 52,150 | 14,770 | ||||||||
10.000%, 01/01/2027 | 19,398 | 5,404 | ||||||||
Brazilian Government International Bond | ||||||||||
6.000%, 04/07/2026 (A) | $ | 1,242 | 1,376 | |||||||
5.625%, 02/21/2047 | 2,247 | 2,219 | ||||||||
BRF | ||||||||||
4.750%, 05/22/2024 | 1,660 | 1,697 | ||||||||
Cosan | ||||||||||
7.000%, 01/20/2027 | 281 | 292 | ||||||||
ESAL GmbH | ||||||||||
6.250%, 02/05/2023 (B) | 254 | 246 | ||||||||
Federal Republic of Brazil | ||||||||||
8.250%, 01/20/2034 | 2,540 | 3,258 | ||||||||
7.125%, 01/20/2037 | 341 | 401 | ||||||||
5.625%, 01/07/2041 | 1,540 | 1,532 | ||||||||
5.000%, 01/27/2045 | 3,201 | 2,905 | ||||||||
4.875%, 01/22/2021 | 546 | 583 | ||||||||
4.250%, 01/07/2025 | 611 | 609 | ||||||||
2.625%, 01/05/2023 | 1,154 | 1,067 | ||||||||
GTL Trade Finance | ||||||||||
5.893%, 04/29/2024 (B) | 149 | 147 | ||||||||
JBS Investments GmbH | ||||||||||
7.750%, 10/28/2020 | 830 | 869 | ||||||||
Klabin Finance | ||||||||||
5.250%, 07/16/2024 | 790 | 788 | ||||||||
Marfrig Overseas | ||||||||||
9.500%, 05/04/2020 (B) | 835 | 860 | ||||||||
9.500%, 05/04/2020 | 371 | 382 | ||||||||
Minerva Luxembourg | ||||||||||
6.500%, 09/20/2026 (B) | 879 | 864 | ||||||||
| Description | Face Amount (Thousands) | Market Value ($ Thousands) | ||||||||
GLOBAL BONDS (continued) | ||||||||||
6.500%, 09/20/2026 | $ | 780 | $ | 766 | ||||||
Petrobras Global Finance | ||||||||||
8.750%, 05/23/2026 | 1,458 | 1,611 | ||||||||
8.375%, 05/23/2021 | 1,954 | 2,135 | ||||||||
Petrobras International Finance | ||||||||||
5.375%, 01/27/2021 | 2,300 | 2,275 | ||||||||
Ultrapar International | ||||||||||
5.250%, 10/06/2026 | 330 | 324 | ||||||||
Vale Overseas | ||||||||||
6.250%, 08/10/2026 | 767 | 801 | ||||||||
|
|
| ||||||||
| 132,071 | ||||||||||
|
|
| ||||||||
Cameroon — 0.3% | ||||||||||
Republic of Cameroon International Bond | ||||||||||
9.500%, 11/19/2025 | 3,700 | 4,115 | ||||||||
|
|
| ||||||||
Chile — 0.7% | ||||||||||
Banco del Estado de Chile | ||||||||||
4.125%, 10/07/2020 (B) | 270 | 288 | ||||||||
4.125%, 10/07/2020 | 30 | 32 | ||||||||
Banco del Estado de Chile MTN | ||||||||||
3.875%, 02/08/2022 (B) | 230 | 244 | ||||||||
Bonos de la Tesoreria de la Republica en pesos | ||||||||||
6.000%, 01/01/2020 | CLP | 80,000 | 131 | |||||||
Chile Government International Bond | ||||||||||
3.125%, 01/21/2026 | $ | 1,144 | 1,214 | |||||||
Empresa Electrica Angamos | ||||||||||
4.875%, 05/25/2029 (B) | 1,323 | 1,300 | ||||||||
Empresa Nacional del Petroleo | ||||||||||
4.375%, 10/30/2024 (B) | 564 | 603 | ||||||||
3.750%, 08/05/2026 (B) | 387 | 392 | ||||||||
Nacional del Cobre de Chile | ||||||||||
6.150%, 10/24/2036 | 1,748 | 2,044 | ||||||||
5.625%, 09/21/2035 (A) | 880 | 975 | ||||||||
4.875%, 11/04/2044 (B) | 870 | 892 | ||||||||
4.500%, 09/16/2025 (B) | 726 | 766 | ||||||||
3.000%, 07/17/2022 (A)(B) | 843 | 840 | ||||||||
Republic of Chile | ||||||||||
5.500%, 08/05/2020 | CLP | 323,000 | 521 | |||||||
VTR Finance | ||||||||||
6.875%, 01/15/2024 (B) | $ | 106 | 111 | |||||||
|
|
| ||||||||
| 10,353 | ||||||||||
|
|
| ||||||||
China — 0.4% | ||||||||||
CNOOC Finance | ||||||||||
3.500%, 05/05/2025 (A) | 234 | 241 | ||||||||
Sinochem Offshore Capital MTN | ||||||||||
3.250%, 04/29/2019 (B) | 1,432 | 1,473 | ||||||||
Sinochem Overseas Capital | ||||||||||
4.500%, 11/12/2020 | 842 | 915 | ||||||||
Sinopec Capital | ||||||||||
3.125%, 04/24/2023 (B) | 539 | 552 | ||||||||
Sinopec Group Overseas Development | ||||||||||
4.375%, 04/10/2024 (B) | 800 | 885 | ||||||||
50 |
SEI Institutional International Trust / Annual Report / September 30, 2016 |
| Description | Face Amount (Thousands) | Market Value ($ Thousands) | ||||||||
GLOBAL BONDS (continued) | ||||||||||
3.500%, 05/03/2026 (B) | $ | 1,070 | $ | 1,117 | ||||||
2.750%, 05/03/2021 (B) | 1,070 | 1,098 | ||||||||
Three Gorges Finance I Cayman Islands | ||||||||||
3.150%, 06/02/2026 (B) | 200 | 205 | ||||||||
|
|
| ||||||||
| 6,486 | ||||||||||
|
|
| ||||||||
Colombia — 6.3% | ||||||||||
Bogota Distrito Capital | ||||||||||
9.750%, 07/26/2028 (B) | COP | 8,820,000 | 3,215 | |||||||
9.750%, 07/26/2028 | 370,000 | 135 | ||||||||
Colombian TES | ||||||||||
11.000%, 07/24/2020 | 14,826,900 | 5,903 | ||||||||
10.000%, 07/24/2024 | 10,003,100 | 4,129 | ||||||||
7.750%, 09/18/2030 | 27,469,900 | 10,058 | ||||||||
7.500%, 08/26/2026 | 41,933,700 | 15,075 | ||||||||
7.000%, 09/11/2019 | 17,784,600 | 6,263 | ||||||||
7.000%, 05/04/2022 | 43,072,000 | 15,206 | ||||||||
6.000%, 04/28/2028 | 18,090,300 | 5,750 | ||||||||
5.000%, 11/21/2018 | 7,741,400 | 2,614 | ||||||||
Ecopetrol | ||||||||||
7.375%, 09/18/2043 | $ | 436 | 459 | |||||||
5.875%, 09/18/2023 | 420 | 453 | ||||||||
5.875%, 05/28/2045 | 1,355 | 1,243 | ||||||||
5.375%, 06/26/2026 | 1,742 | 1,813 | ||||||||
Emgesa ESP | ||||||||||
8.750%, 01/25/2021 | COP | 870,000 | 299 | |||||||
Empresas Publicas de Medellin ESP | ||||||||||
8.375%, 02/01/2021 | 3,962,000 | 1,326 | ||||||||
7.625%, 09/10/2024 (B) | 3,116,000 | 975 | ||||||||
Financiera de Desarrollo Territorial Findeter | ||||||||||
7.875%, 08/12/2024 (B) | 1,127,000 | 353 | ||||||||
7.875%, 08/12/2024 | 884,000 | 277 | ||||||||
Pacific Exploration and Production | ||||||||||
5.625%, 01/19/2025 (B)(F) | $ | 2,298 | 425 | |||||||
Pacific Rubiales Energy | ||||||||||
5.375%, 01/26/2019 (F) | 900 | 166 | ||||||||
Republic of Colombia | ||||||||||
11.750%, 02/25/2020 | 322 | 421 | ||||||||
10.375%, 01/28/2033 | 360 | 569 | ||||||||
9.850%, 06/28/2027 | COP | 1,257,000 | 533 | |||||||
9.850%, 06/28/2027 | 3,803,000 | 1,611 | ||||||||
8.125%, 05/21/2024 | $ | 550 | 727 | |||||||
7.750%, 04/14/2021 | COP | 3,331,000 | 1,229 | |||||||
7.375%, 09/18/2037 | $ | 2,626 | 3,539 | |||||||
6.125%, 01/18/2041 | 4,400 | 5,313 | ||||||||
4.500%, 01/28/2026 | 340 | 375 | ||||||||
4.375%, 07/12/2021 | 3,546 | 3,840 | ||||||||
4.375%, 03/21/2023 | COP | 1,089,000 | 340 | |||||||
4.375%, 03/21/2023 | 1,782,000 | 556 | ||||||||
4.000%, 02/26/2024 | $ | 1,486 | 1,583 | |||||||
Republic of Colombia MTN | ||||||||||
3.875%, 03/22/2026 | EUR | 1,073 | 1,365 | |||||||
|
|
| ||||||||
| 98,138 | ||||||||||
|
|
| ||||||||
| Description | Face Amount (Thousands) | Market Value ($ Thousands) | ||||||||
GLOBAL BONDS (continued) | ||||||||||
Costa Rica — 1.2% | ||||||||||
Banco Nacional de Costa Rica | ||||||||||
6.250%, 11/01/2023 (B) | $ | 753 | $ | 784 | ||||||
5.875%, 04/25/2021 (A)(B) | 597 | 623 | ||||||||
Instituto Costarricense de Electricidad | ||||||||||
6.950%, 11/10/2021 | 400 | 424 | ||||||||
6.375%, 05/15/2043 | 250 | 218 | ||||||||
Republic of Costa Rica | ||||||||||
7.158%, 03/12/2045 (B) | 1,237 | 1,333 | ||||||||
7.158%, 03/12/2045 | 4,272 | 4,603 | ||||||||
7.158%, 03/12/2045 | 3,436 | 3,702 | ||||||||
7.000%, 04/04/2044 (B) | 2,978 | 3,179 | ||||||||
7.000%, 04/04/2044 | 2,687 | 2,868 | ||||||||
4.375%, 04/30/2025 | 702 | 681 | ||||||||
4.375%, 04/30/2025 (B) | 207 | 201 | ||||||||
4.250%, 01/26/2023 | 439 | 431 | ||||||||
|
|
| ||||||||
| 19,047 | ||||||||||
|
|
| ||||||||
Croatia — 1.4% | ||||||||||
Government of Croatia | ||||||||||
6.625%, 07/14/2020 (A) | 4,795 | 5,373 | ||||||||
6.375%, 03/24/2021 (A)(B) | 4,053 | 4,560 | ||||||||
6.375%, 03/24/2021 | 1,490 | 1,677 | ||||||||
6.000%, 01/26/2024 (B) | 3,741 | 4,302 | ||||||||
6.000%, 01/26/2024 | 770 | 886 | ||||||||
5.875%, 07/09/2018 | EUR | 150 | 185 | |||||||
5.500%, 04/04/2023 | $ | 200 | 222 | |||||||
3.000%, 03/11/2025 | EUR | 2,150 | 2,467 | |||||||
|
|
| ||||||||
| 19,672 | ||||||||||
|
|
| ||||||||
Dominican Republic — 1.3% | ||||||||||
Dominican Republic | ||||||||||
15.950%, 06/04/2021 | DOP | 3,800 | 99 | |||||||
11.500%, 05/10/2024 | 55,000 | 1,256 | ||||||||
11.000%, 01/05/2018 | 6,320 | 139 | ||||||||
11.000%, 07/30/2021 (B) | 53,760 | 1,160 | ||||||||
9.040%, 01/23/2018 | $ | 363 | 380 | |||||||
8.625%, 04/20/2027 | 1,707 | 2,091 | ||||||||
7.450%, 04/30/2044 (B) | 2,608 | 3,107 | ||||||||
7.450%, 04/30/2044 | 1,015 | 1,205 | ||||||||
6.875%, 01/29/2026 | 643 | 744 | ||||||||
6.850%, 01/27/2045 | 400 | 448 | ||||||||
6.850%, 01/27/2045 (B) | 3,708 | 4,153 | ||||||||
6.600%, 01/28/2024 | 882 | 993 | ||||||||
5.875%, 04/18/2024 | 210 | 226 | ||||||||
5.875%, 04/18/2024 (B) | 671 | 730 | ||||||||
5.500%, 01/27/2025 | 2,144 | 2,273 | ||||||||
|
|
| ||||||||
| 19,004 | ||||||||||
|
|
| ||||||||
Ecuador — 1.1% | ||||||||||
Ecuador Government International Bond | ||||||||||
10.750%, 03/28/2022 (B) | 2,017 | 2,057 | ||||||||
EP PetroEcuador via Noble Sovereign Funding I | ||||||||||
6.487%, 09/24/2019 (C) | 1,107 | 1,071 | ||||||||
SEI Institutional International Trust / Annual Report / September 30, 2016 |
51 |
SCHEDULE OF INVESTMENTS
September 30, 2016
Emerging Markets Debt Fund (Continued)
| Description | Face Amount (Thousands) | Market Value ($ Thousands) | ||||||||
GLOBAL BONDS (continued) | ||||||||||
Republic of Ecuador | ||||||||||
10.500%, 03/24/2020 (A) | $ | 2,229 | $ | 2,268 | ||||||
10.500%, 03/24/2020 (B) | 3,770 | 3,836 | ||||||||
7.950%, 06/20/2024 | 10,621 | 9,506 | ||||||||
|
|
| ||||||||
| 18,738 | ||||||||||
|
|
| ||||||||
Egypt — 0.1% | ||||||||||
Government of Egypt | ||||||||||
5.875%, 06/11/2025 (B) | 2,140 | 2,034 | ||||||||
|
|
| ||||||||
El Salvador — 0.7% | ||||||||||
Republic of El Salvador | ||||||||||
7.750%, 01/24/2023 | 1,559 | 1,731 | ||||||||
7.650%, 06/15/2035 | 105 | 110 | ||||||||
7.650%, 06/15/2035 | 3,040 | 3,181 | ||||||||
7.625%, 02/01/2041 | 870 | 903 | ||||||||
7.375%, 12/01/2019 | 226 | 241 | ||||||||
6.375%, 01/18/2027 (B) | 995 | 1,000 | ||||||||
6.375%, 01/18/2027 | 2,811 | 2,825 | ||||||||
5.875%, 01/30/2025 | 210 | 209 | ||||||||
5.875%, 01/30/2025 (B) | 638 | 636 | ||||||||
|
|
| ||||||||
| 10,836 | ||||||||||
|
|
| ||||||||
Ethiopia — 0.0% | ||||||||||
Federal Democratic Republic of Ethiopia | ||||||||||
6.625%, 12/11/2024 (B) | 510 | 502 | ||||||||
|
|
| ||||||||
Gabon — 0.2% | ||||||||||
Gabonese Republic | ||||||||||
8.200%, 12/12/2017 (A) | 282 | 292 | ||||||||
6.950%, 06/16/2025 (B) | 658 | 604 | ||||||||
6.375%, 12/12/2024 (B) | 1,134 | 1,037 | ||||||||
6.375%, 12/12/2024 (A) | 1,700 | 1,556 | ||||||||
|
|
| ||||||||
| 3,489 | ||||||||||
|
|
| ||||||||
Georgia — 0.1% | ||||||||||
Republic of Georgia | ||||||||||
6.875%, 04/12/2021 (B) | 663 | 739 | ||||||||
|
|
| ||||||||
Ghana — 0.9% | ||||||||||
Ghana Government International Bond | ||||||||||
9.250%, 09/15/2022 (B) | 1,282 | 1,314 | ||||||||
9.250%, 09/15/2022 | 377 | 386 | ||||||||
Republic of Ghana | ||||||||||
10.750%, 10/14/2030 (B) | 2,492 | 2,913 | ||||||||
10.750%, 10/14/2030 | 7,273 | 8,500 | ||||||||
8.125%, 01/18/2026 (B) | 54 | 50 | ||||||||
7.875%, 08/07/2023 | 2,192 | 2,041 | ||||||||
|
|
| ||||||||
| 15,204 | ||||||||||
|
|
| ||||||||
Guatemala — 0.1% | ||||||||||
Comcel Trust | ||||||||||
6.875%, 02/06/2024 (B) | 1,090 | 1,121 | ||||||||
| Description | Face Amount (Thousands) | Market Value ($ Thousands) | ||||||||
GLOBAL BONDS (continued) | ||||||||||
Comcel Trust via Comunicaciones Celulares | ||||||||||
6.875%, 02/06/2024 | $ | 350 | $ | 360 | ||||||
|
|
| ||||||||
| 1,481 | ||||||||||
|
|
| ||||||||
Hungary — 4.2% | ||||||||||
Magyar Export-Import Bank | ||||||||||
4.000%, 01/30/2020 (B) | 925 | 964 | ||||||||
Republic of Hungary | ||||||||||
7.625%, 03/29/2041 | 5,560 | 8,721 | ||||||||
7.000%, 06/24/2022 | HUF | 730,470 | 3,340 | |||||||
6.750%, 10/22/2028 | 932,610 | 4,679 | ||||||||
6.375%, 03/29/2021 | $ | 2,337 | 2,708 | |||||||
6.250%, 01/29/2020 | 910 | 1,023 | ||||||||
6.000%, 11/24/2023 | HUF | 3,274,370 | 14,754 | |||||||
5.750%, 11/22/2023 | $ | 4,834 | 5,692 | |||||||
5.500%, 06/24/2025 | HUF | 1,666,380 | 7,353 | |||||||
5.375%, 02/21/2023 | $ | 3,326 | 3,812 | |||||||
5.375%, 03/25/2024 | 873 | 1,014 | ||||||||
3.000%, 06/26/2024 | HUF | 2,177,530 | 8,135 | |||||||
|
|
| ||||||||
| 62,195 | ||||||||||
|
|
| ||||||||
India — 0.1% | ||||||||||
Bharti Airtel International Netherlands | ||||||||||
5.125%, 03/11/2023 | $ | 1,755 | 1,908 | |||||||
Vedanta Resources | ||||||||||
6.000%, 01/31/2019 (B) | 339 | 335 | ||||||||
|
|
| ||||||||
| 2,243 | ||||||||||
|
|
| ||||||||
Indonesia — 9.4% | ||||||||||
Indonesia Treasury Bond | ||||||||||
8.750%, 05/15/2031 | IDR | 111,536,000 | 9,610 | |||||||
8.250%, 07/15/2021 | 10,611,000 | 858 | ||||||||
Listrindo Capital BV | ||||||||||
4.950%, 09/14/2026 | $ | 350 | 351 | |||||||
Majapahit Holding | ||||||||||
7.875%, 06/29/2037 | 300 | 398 | ||||||||
7.875%, 06/29/2037 (B) | 205 | 272 | ||||||||
7.750%, 01/20/2020 | 894 | 1,028 | ||||||||
Pelabuhan Indonesia III | ||||||||||
4.875%, 10/01/2024 | 1,659 | 1,786 | ||||||||
Pertamina Persero MTN | ||||||||||
6.450%, 05/30/2044 | 439 | 510 | ||||||||
6.450%, 05/30/2044 (B) | 665 | 770 | ||||||||
5.625%, 05/20/2043 | 2,692 | 2,829 | ||||||||
5.625%, 05/20/2043 (B) | 889 | 934 | ||||||||
Pertamina Persero | ||||||||||
6.500%, 05/27/2041 (A)(B) | 380 | 444 | ||||||||
6.000%, 05/03/2042 (B) | 935 | 1,029 | ||||||||
6.000%, 05/03/2042 | 340 | 374 | ||||||||
5.250%, 05/23/2021 (B) | 921 | 1,004 | ||||||||
4.875%, 05/03/2022 (B) | 220 | 237 | ||||||||
Perusahaan Listrik Negara MTN | ||||||||||
5.250%, 10/24/2042 | 580 | 599 | ||||||||
52 |
SEI Institutional International Trust / Annual Report / September 30, 2016 |
| Description | Face Amount (Thousands) | Market Value ($ Thousands) | ||||||||
GLOBAL BONDS (continued) | ||||||||||
Republic of Indonesia MTN | ||||||||||
11.625%, 03/04/2019 | $ | 1,674 | $ | 2,057 | ||||||
11.625%, 03/04/2019 | 80 | 98 | ||||||||
11.625%, 03/04/2019 (B) | 975 | 1,198 | ||||||||
6.750%, 01/15/2044 (B) | 183 | 250 | ||||||||
5.875%, 01/15/2024 | 2,876 | 3,392 | ||||||||
5.875%, 01/15/2024 | 3,700 | 4,363 | ||||||||
5.875%, 01/15/2024 (B) | 888 | 1,047 | ||||||||
5.250%, 01/17/2042 | 692 | 792 | ||||||||
5.125%, 01/15/2045 (B) | 762 | 869 | ||||||||
4.750%, 01/08/2026 (B) | 2,723 | 3,041 | ||||||||
4.750%, 01/08/2026 | 1,484 | 1,657 | ||||||||
4.125%, 01/15/2025 | 1,331 | 1,420 | ||||||||
3.375%, 04/15/2023 (B) | 1,939 | 1,998 | ||||||||
Republic of Indonesia | ||||||||||
12.800%, 06/15/2021 | IDR | 210,000 | 20 | |||||||
11.000%, 09/15/2025 | 3,200,000 | 307 | ||||||||
9.000%, 03/15/2029 | 187,712,000 | 16,397 | ||||||||
8.500%, 10/12/2035 | $ | 925 | 1,400 | |||||||
8.375%, 03/15/2024 | IDR | 259,919,000 | 21,539 | |||||||
8.375%, 09/15/2026 | 93,384,000 | 7,774 | ||||||||
8.375%, 03/15/2034 | 113,294,000 | 9,462 | ||||||||
8.250%, 06/15/2032 | 17,369,000 | 1,444 | ||||||||
8.250%, 05/15/2036 | 108,822,000 | 8,987 | ||||||||
7.750%, 01/17/2038 | $ | 291 | 421 | |||||||
7.750%, 01/17/2038 | 5,118 | 7,401 | ||||||||
7.000%, 05/15/2022 | IDR | 158,680,000 | 12,238 | |||||||
7.000%, 05/15/2027 | 2,300,000 | 175 | ||||||||
6.625%, 05/15/2033 | 35,776,000 | 2,524 | ||||||||
6.625%, 02/17/2037 | $ | 1,076 | 1,411 | |||||||
6.125%, 05/15/2028 | IDR | 26,020,000 | 1,821 | |||||||
5.625%, 05/15/2023 | 44,408,000 | 3,171 | ||||||||
4.875%, 05/05/2021 (B) | $ | 200 | 220 | |||||||
4.875%, 05/05/2021 | 1,312 | 1,443 | ||||||||
3.375%, 07/30/2025 | EUR | 1,280 | 1,556 | |||||||
|
|
| ||||||||
| 144,926 | ||||||||||
|
|
| ||||||||
Iraq — 0.4% | ||||||||||
Republic of Iraq | ||||||||||
5.800%, 01/15/2028 | $ | 7,258 | 5,913 | |||||||
|
|
| ||||||||
Ivory Coast — 0.8% | ||||||||||
Ivory Coast Government Bond | ||||||||||
6.375%, 03/03/2028 (B) | 1,048 | 1,098 | ||||||||
5.750%, 12/31/2032 | 900 | 884 | ||||||||
5.750%, 12/31/2032 | 5,279 | 5,188 | ||||||||
5.750%, 12/31/2032 | 3,413 | 3,354 | ||||||||
5.375%, 07/23/2024 (B) | 1,551 | 1,559 | ||||||||
|
|
| ||||||||
| 12,083 | ||||||||||
|
|
| ||||||||
Jamaica — 0.5% | ||||||||||
Digicel Group | ||||||||||
8.250%, 09/30/2020 | 2,200 | 1,911 | ||||||||
8.250%, 09/30/2020 (B) | 213 | 185 | ||||||||
| Description | Face Amount (Thousands) | Market Value ($ Thousands) | ||||||||
GLOBAL BONDS (continued) | ||||||||||
7.125%, 04/01/2022 (B) | $ | 974 | $ | 745 | ||||||
Government of Jamaica | ||||||||||
7.875%, 07/28/2045 | 437 | 515 | ||||||||
7.625%, 07/09/2025 | 517 | 606 | ||||||||
6.750%, 04/28/2028 | 1,056 | 1,206 | ||||||||
Jamaica Government International Bond | ||||||||||
8.000%, 03/15/2039 | 1,937 | 2,315 | ||||||||
|
|
| ||||||||
| 7,483 | ||||||||||
|
|
| ||||||||
Kazakhstan — 0.8% | ||||||||||
Development Bank of Kazakhstan | ||||||||||
4.125%, 12/10/2022 | 770 | 755 | ||||||||
KazAgro National Management Holding MTN | ||||||||||
4.625%, 05/24/2023 | 370 | 356 | ||||||||
Kazakhstan Temir Zholy Finance | ||||||||||
6.950%, 07/10/2042 (B) | 250 | 272 | ||||||||
KazMunayGas National | ||||||||||
7.000%, 05/05/2020 (B) | 314 | 349 | ||||||||
KazMunayGas National MTN | ||||||||||
9.125%, 07/02/2018 | 942 | 1,040 | ||||||||
6.375%, 04/09/2021 (B) | 1,660 | 1,830 | ||||||||
6.375%, 04/09/2021 | 2,329 | 2,568 | ||||||||
Republic of Kazakhstan | ||||||||||
6.375%, 10/06/2020 (B) | 600 | 646 | ||||||||
Republic of Kazakhstan MTN | ||||||||||
6.500%, 07/21/2045 | 1,000 | 1,247 | ||||||||
5.125%, 07/21/2025 (B) | 940 | 1,059 | ||||||||
Samruk-Energy MTN | ||||||||||
3.750%, 12/20/2017 | 500 | 499 | ||||||||
Zhaikmunai | ||||||||||
6.375%, 02/14/2019 (B) | 197 | 181 | ||||||||
Zhaikmunai Via Zhaikmunai International | ||||||||||
7.125%, 11/13/2019 (B) | 230 | 212 | ||||||||
|
|
| ||||||||
| �� | 11,014 | |||||||||
|
|
| ||||||||
Kenya — 0.6% | ||||||||||
Kenya Government International Bond | ||||||||||
6.875%, 06/24/2024 (B) | 1,413 | 1,385 | ||||||||
6.875%, 06/24/2024 (A) | 3,285 | 3,219 | ||||||||
5.875%, 06/24/2019 (B) | 805 | 831 | ||||||||
Kenya Infrastructure Bond | ||||||||||
12.500%, 05/12/2025 | KES | 56,200 | 565 | |||||||
11.000%, 09/15/2025 | 230,000 | 2,182 | ||||||||
11.000%, 10/12/2026 | 20,000 | 184 | ||||||||
11.000%, 03/15/2027 | 124,850 | 1,172 | ||||||||
|
|
| ||||||||
| 9,538 | ||||||||||
|
|
| ||||||||
Lithuania — 0.0% | ||||||||||
Republic of Lithuania | ||||||||||
7.375%, 02/11/2020 (B) | $ | 195 | 232 | |||||||
|
|
| ||||||||
Malaysia — 4.3% | ||||||||||
1MDB Global Investments | ||||||||||
4.400%, 03/09/2023 | 5,100 | 4,513 | ||||||||
SEI Institutional International Trust / Annual Report / September 30, 2016 |
53 |
SCHEDULE OF INVESTMENTS
September 30, 2016
Emerging Markets Debt Fund (Continued)
| Description | Face Amount (Thousands) | Market Value ($ Thousands) | ||||||||
GLOBAL BONDS (continued) | ||||||||||
Malaysia Government Bond | ||||||||||
5.248%, 09/15/2028 | MYR | 1,050 | $ | 285 | ||||||
4.935%, 09/30/2043 | 4,200 | 1,075 | ||||||||
4.498%, 04/15/2030 | 1,240 | 316 | ||||||||
4.392%, 04/15/2026 | 10,601 | 2,702 | ||||||||
4.232%, 06/30/2031 | 11,200 | 2,804 | ||||||||
4.181%, 07/15/2024 | 11,316 | 2,846 | ||||||||
4.160%, 07/15/2021 | 4,260 | 1,070 | ||||||||
4.048%, 09/30/2021 | 4,330 | 1,084 | ||||||||
4.012%, 09/15/2017 | 900 | 221 | ||||||||
3.955%, 09/15/2025 | 29,823 | 7,356 | ||||||||
3.900%, 11/30/2026 | 700 | 174 | ||||||||
3.892%, 03/15/2027 | 1,369 | 334 | ||||||||
3.889%, 07/31/2020 | 2,330 | 576 | ||||||||
3.844%, 04/15/2033 | 1,770 | 411 | ||||||||
3.800%, 08/17/2023 | 27,695 | 6,835 | ||||||||
3.795%, 09/30/2022 | 9,500 | 2,339 | ||||||||
3.654%, 10/31/2019 | 13,430 | 3,306 | ||||||||
3.580%, 09/28/2018 | 4,747 | 1,168 | ||||||||
3.502%, 05/31/2027 | 1,050 | 247 | ||||||||
3.492%, 03/31/2020 | 5,460 | 1,332 | ||||||||
3.480%, 03/15/2023 | 14,448 | 3,492 | ||||||||
3.418%, 08/15/2022 | 15,169 | 3,658 | ||||||||
3.314%, 10/31/2017 | 27,497 | 6,704 | ||||||||
3.260%, 03/01/2018 | 22,500 | 5,494 | ||||||||
Malaysia Government Investment Issue | ||||||||||
4.070%, 09/30/2026 | 14,800 | 3,715 | ||||||||
Petronas Capital MTN | ||||||||||
3.500%, 03/18/2025 (A)(B) | $ | 2,593 | 2,790 | |||||||
|
|
| ||||||||
| 66,847 | ||||||||||
|
|
| ||||||||
Mexico — 9.0% | ||||||||||
Alfa | ||||||||||
6.875%, 03/25/2044 | 1,750 | 1,852 | ||||||||
America Movil | ||||||||||
7.125%, 12/09/2024 | MXN | 18,110 | 932 | |||||||
6.000%, 06/09/2019 | 12,420 | 634 | ||||||||
Banco Nacional de Comercio Exterior SNC | ||||||||||
3.800%, 08/11/2026 (B)(C) | $ | 791 | 768 | |||||||
BBVA Bancomer | ||||||||||
6.750%, 09/30/2022 (B) | 500 | 559 | ||||||||
Cemex | ||||||||||
7.750%, 04/16/2026 (B) | 2,278 | 2,527 | ||||||||
6.125%, 05/05/2025 (B) | 60 | 62 | ||||||||
5.700%, 01/11/2025 (A)(B) | 213 | 216 | ||||||||
Cemex Finance | ||||||||||
6.000%, 04/01/2024 | 1,090 | 1,117 | ||||||||
Comision Federal de Electricidad | ||||||||||
7.350%, 11/25/2025 | MXN | 39,785 | 1,922 | |||||||
5.750%, 02/14/2042 (B) | $ | 500 | 518 | |||||||
4.875%, 01/15/2024 (A)(B) | 237 | 249 | ||||||||
Fermaca Enterprises S de RL | ||||||||||
6.375%, 03/30/2038 (B) | 625 | 640 | ||||||||
| Description | Face Amount (Thousands) | Market Value ($ Thousands) | ||||||||
GLOBAL BONDS (continued) | ||||||||||
Mexican Bonos | ||||||||||
7.750%, 11/23/2034 | MXN | 55,928 | $ | 3,281 | ||||||
7.750%, 11/13/2042 | 14,194 | 847 | ||||||||
6.500%, 06/09/2022 | 87,639 | 4,677 | ||||||||
5.750%, 03/05/2026 | 60,750 | 3,078 | ||||||||
5.000%, 06/15/2017 | 34,891 | 1,804 | ||||||||
5.000%, 12/11/2019 | 128,020 | 6,493 | ||||||||
4.750%, 06/14/2018 | 801 | 41 | ||||||||
Mexican Bonos MTN | ||||||||||
3.625%, 03/15/2022 | $ | 1,259 | 1,327 | |||||||
Mexican Bonos , Ser M | ||||||||||
6.500%, 06/10/2021 | MXN | 246,800 | 13,138 | |||||||
Mexican Bonos , Ser M10 | ||||||||||
8.500%, 12/13/2018 | 43,500 | 2,384 | ||||||||
Mexican Bonos , Ser M20 | ||||||||||
10.000%, 12/05/2024 | 335,784 | 21,918 | ||||||||
8.500%, 05/31/2029 | 107,842 | 6,659 | ||||||||
8.000%, 12/07/2023 | 11,575 | 672 | ||||||||
7.750%, 05/29/2031 | 124,053 | 7,251 | ||||||||
Mexican Bonos , Ser M30 | ||||||||||
10.000%, 11/20/2036 | 45,111 | 3,249 | ||||||||
8.500%, 11/18/2038 | 107,378 | 6,837 | ||||||||
Mexican Udibonos | ||||||||||
2.000%, 06/09/2022 | 1,471 | 401 | ||||||||
Mexico City Airport Trust | ||||||||||
4.250%, 10/31/2026 (B) | $ | 428 | 429 | |||||||
Mexico Government International Bond | ||||||||||
4.350%, 01/15/2047 | 1,201 | 1,180 | ||||||||
Petroleos Mexicanos MTN | ||||||||||
6.875%, 08/04/2026 (A)(B) | 1,836 | 2,070 | ||||||||
6.875%, 08/04/2026 | 5,240 | 5,908 | ||||||||
6.750%, 09/21/2047 (B) | 1,672 | 1,672 | ||||||||
6.375%, 01/23/2045 (B) | 806 | 770 | ||||||||
5.625%, 01/23/2046 | 585 | 510 | ||||||||
4.625%, 09/21/2023 (B) | 1,185 | 1,187 | ||||||||
4.250%, 01/15/2025 | 3,625 | 3,498 | ||||||||
2.750%, 04/21/2027 | EUR | 350 | 348 | |||||||
Petroleos Mexicanos | ||||||||||
9.500%, 09/15/2027 | $ | 169 | 204 | |||||||
7.190%, 09/12/2024 | MXN | 77,130 | 3,681 | |||||||
6.625%, 06/15/2035 | $ | 5,112 | 5,203 | |||||||
6.625%, 06/15/2038 | 2,088 | 2,067 | ||||||||
6.500%, 06/02/2041 | 1,709 | 1,662 | ||||||||
6.375%, 02/04/2021 (B) | 326 | 355 | ||||||||
6.375%, 01/23/2045 | 389 | 371 | ||||||||
6.000%, 03/05/2020 (A) | 335 | 362 | ||||||||
5.500%, 01/21/2021 | 18 | 19 | ||||||||
5.500%, 06/27/2044 (A) | 1,558 | 1,351 | ||||||||
5.500%, 06/27/2044 | 284 | 246 | ||||||||
4.875%, 01/24/2022 | 271 | 276 | ||||||||
4.875%, 01/18/2024 | 1,348 | 1,365 | ||||||||
54 |
SEI Institutional International Trust / Annual Report / September 30, 2016 |
| Description | Face Amount (Thousands) | Market Value ($ Thousands) | ||||||||
GLOBAL BONDS (continued) | ||||||||||
Petroloes Mexicanos MTN | ||||||||||
5.625%, 01/23/2046 (B) | $ | 800 | $ | 698 | ||||||
Sixsigma Networks Mexico | ||||||||||
8.250%, 11/07/2021 (B) | 527 | 516 | ||||||||
Trust F | ||||||||||
6.950%, 01/30/2044 | 1,920 | 2,093 | ||||||||
United Mexican States MTN | ||||||||||
5.550%, 01/21/2045 | 338 | 392 | ||||||||
4.750%, 03/08/2044 | 200 | 207 | ||||||||
United Mexican States | ||||||||||
5.750%, 10/12/2110 | 468 | 495 | ||||||||
4.600%, 01/23/2046 | 1,653 | 1,676 | ||||||||
4.000%, 10/02/2023 | 1,376 | 1,470 | ||||||||
3.600%, 01/30/2025 (A) | 2,379 | 2,465 | ||||||||
|
|
| ||||||||
| 140,799 | ||||||||||
|
|
| ||||||||
Mongolia — 0.4% | ||||||||||
Development Bank of Mongolia MTN | ||||||||||
5.750%, 03/21/2017 | 902 | 884 | ||||||||
Mongolia Government Bond MTN | ||||||||||
10.875%, 04/06/2021 (B) | 1,845 | 1,976 | ||||||||
5.125%, 12/05/2022 | 2,119 | 1,860 | ||||||||
5.125%, 12/05/2022 | 481 | 422 | ||||||||
Trade & Development Bank of Mongolia MTN | ||||||||||
9.375%, 05/19/2020 (B) | 355 | 350 | ||||||||
9.375%, 05/19/2020 | 350 | 345 | ||||||||
|
|
| ||||||||
| 5,837 | ||||||||||
|
|
| ||||||||
Montenegro — 0.0% | ||||||||||
Republic of Montenegro | ||||||||||
5.750%, 03/10/2021 (B) | EUR | 551 | 658 | |||||||
|
|
| ||||||||
Morocco — 0.1% | ||||||||||
Kingdom of Morocco | ||||||||||
5.500%, 12/11/2042 | $ | 700 | 800 | |||||||
5.500%, 12/11/2042 (B) | 200 | 229 | ||||||||
OCP | ||||||||||
5.625%, 04/25/2024 (B) | 305 | 331 | ||||||||
4.500%, 10/22/2025 (B) | 288 | 292 | ||||||||
|
|
| ||||||||
| 1,652 | ||||||||||
|
|
| ||||||||
Namibia — 0.1% | ||||||||||
Namibia International Bonds | ||||||||||
5.250%, 10/29/2025 (B) | 1,132 | 1,196 | ||||||||
|
|
| ||||||||
Netherlands — 0.0% | ||||||||||
Marfrig Holdings Europe | ||||||||||
8.000%, 06/08/2023 (B) | 547 | 560 | ||||||||
|
|
| ||||||||
Nigeria — 0.1% | ||||||||||
Republic of Nigeria | ||||||||||
6.750%, 01/28/2021 | 851 | 857 | ||||||||
|
|
| ||||||||
| Description | Face Amount (Thousands) | Market Value ($ Thousands) | ||||||||
GLOBAL BONDS (continued) | ||||||||||
Oman — 0.3% | ||||||||||
Oman Government International Bond | ||||||||||
4.750%, 06/15/2026 (A)(B) | $ | 912 | $ | 915 | ||||||
4.750%, 06/15/2026 | 2,446 | 2,455 | ||||||||
3.625%, 06/15/2021 | 521 | 526 | ||||||||
|
|
| ||||||||
| 3,896 | ||||||||||
|
|
| ||||||||
Panama — 1.1% | ||||||||||
Panama Notas del Tesoro | ||||||||||
4.875%, 02/05/2021 | 704 | 763 | ||||||||
Republic of Panama | ||||||||||
9.375%, 01/16/2023 | 560 | 752 | ||||||||
9.375%, 04/01/2029 | 3,931 | 6,083 | ||||||||
8.875%, 09/30/2027 | 1,345 | 2,017 | ||||||||
8.125%, 04/28/2034 | 2,128 | 3,107 | ||||||||
6.700%, 01/26/2036 | 750 | 1,024 | ||||||||
4.300%, 04/29/2053 | 130 | 138 | ||||||||
4.000%, 09/22/2024 (A) | 521 | 570 | ||||||||
3.750%, 03/16/2025 (A) | 1,768 | 1,907 | ||||||||
|
|
| ||||||||
| 16,361 | ||||||||||
|
|
| ||||||||
Paraguay — 0.4% | ||||||||||
Republic of Paraguay | ||||||||||
6.100%, 08/11/2044 | 861 | 979 | ||||||||
6.100%, 08/11/2044 (B) | 3,356 | 3,817 | ||||||||
5.000%, 04/15/2026 | 956 | 1,028 | ||||||||
Telefonica Celular del Paraguay | ||||||||||
6.750%, 12/13/2022 | 200 | 207 | ||||||||
6.750%, 12/13/2022 | 200 | 207 | ||||||||
|
|
| ||||||||
| 6,238 | ||||||||||
|
|
| ||||||||
Peru — 1.7% | ||||||||||
Abengoa Transmision Sur | ||||||||||
6.875%, 04/30/2043 (B) | 273 | 290 | ||||||||
Peru Enhanced Pass-Through Finance (E) | ||||||||||
4.995%, 06/02/2025 (B) | 1,000 | 847 | ||||||||
1.229%, 05/31/2018 | 54 | 53 | ||||||||
1.227%, 05/31/2018 (B) | 145 | 142 | ||||||||
Peru Government Bond | ||||||||||
6.350%, 08/12/2028 | PEN | 2,895 | 849 | |||||||
Peruvian Government International Bond | ||||||||||
6.350%, 08/12/2028 | 2,061 | 604 | ||||||||
6.350%, 08/12/2028 (B) | 1,465 | 429 | ||||||||
Republic of Peru | ||||||||||
8.750%, 11/21/2033 | $ | 352 | 571 | |||||||
8.200%, 08/12/2026 | PEN | 5,401 | 1,883 | |||||||
6.950%, 08/12/2031 | 9,861 | 3,148 | ||||||||
6.950%, 08/12/2031 | 6,696 | 2,137 | ||||||||
6.850%, 02/12/2042 | 613 | 191 | ||||||||
6.550%, 03/14/2037 (A) | $ | 1,239 | 1,750 | |||||||
5.700%, 08/12/2024 (B) | PEN | 10,512 | 3,172 | |||||||
5.700%, 08/12/2024 | 3,584 | 1,081 | ||||||||
3.750%, 03/01/2030 | EUR | 6,608 | 8,731 | |||||||
SEI Institutional International Trust / Annual Report / September 30, 2016 |
55 |
SCHEDULE OF INVESTMENTS
September 30, 2016
Emerging Markets Debt Fund (Continued)
| Description | Face Amount (Thousands) | Market Value ($ Thousands) | ||||||||
GLOBAL BONDS (continued) | ||||||||||
Southern Copper | ||||||||||
3.875%, 04/23/2025 | $ | 680 | $ | 683 | ||||||
|
|
| ||||||||
| 26,561 | ||||||||||
|
|
| ||||||||
Philippines — 0.1% | ||||||||||
Republic of Philippines | ||||||||||
3.900%, 11/26/2022 | PHP | 45,000 | 926 | |||||||
|
|
| ||||||||
Poland — 4.6% | ||||||||||
Poland Government Bond | ||||||||||
2.750%, 04/25/2028 | PLN | 3,650 | 924 | |||||||
Republic of Poland | ||||||||||
5.750%, 04/25/2029 | 2,080 | 687 | ||||||||
5.250%, 10/25/2020 | 20,418 | 5,970 | ||||||||
5.125%, 04/21/2021 | $ | 1,016 | 1,148 | |||||||
5.000%, 03/23/2022 | 249 | 284 | ||||||||
4.000%, 10/25/2023 | PLN | 30,481 | 8,642 | |||||||
4.000%, 01/22/2024 | $ | 446 | 493 | |||||||
3.250%, 07/25/2025 | PLN | 34,726 | 9,359 | |||||||
3.250%, 04/06/2026 | $ | 834 | 882 | |||||||
3.000%, 03/17/2023 | 1,458 | 1,516 | ||||||||
2.750%, 08/25/2023 (A) | PLN | 16,397 | 5,450 | |||||||
2.500%, 07/25/2026 (A) | 44,395 | 11,188 | ||||||||
1.750%, 07/25/2021 | 48,238 | 12,278 | ||||||||
1.567%, 10/25/2018 (E) | 14,650 | 3,692 | ||||||||
1.500%, 04/25/2020 | 20,524 | 5,255 | ||||||||
Republic of Poland , Ser 0922 | ||||||||||
5.750%, 09/23/2022 | 12,209 | 3,774 | ||||||||
|
|
| ||||||||
| 71,542 | ||||||||||
|
|
| ||||||||
Qatar — 0.6% | ||||||||||
Ooredoo International Finance MTN | ||||||||||
7.875%, 06/10/2019 | $ | 665 | 769 | |||||||
State of Qatar | ||||||||||
9.750%, 06/15/2030 | 2,637 | 4,345 | ||||||||
6.400%, 01/20/2040 | 2,588 | 3,571 | ||||||||
|
|
| ||||||||
| 8,685 | ||||||||||
|
|
| ||||||||
Romania — 1.2% | ||||||||||
Government of Romania | ||||||||||
5.950%, 06/11/2021 | RON | 1,900 | 560 | |||||||
5.850%, 04/26/2023 | 9,250 | 2,792 | ||||||||
4.750%, 02/24/2025 | 15,450 | 4,440 | ||||||||
3.500%, 12/19/2022 | 5,115 | 1,361 | ||||||||
Government of Romania MTN | ||||||||||
6.750%, 02/07/2022 | $ | 1,730 | 2,087 | |||||||
6.750%, 02/07/2022 (B) | 1,333 | 1,608 | ||||||||
6.125%, 01/22/2044 | 5,044 | 6,797 | ||||||||
4.875%, 01/22/2024 | 212 | 242 | ||||||||
4.375%, 08/22/2023 | 396 | 438 | ||||||||
|
|
| ||||||||
| 20,325 | ||||||||||
|
|
| ||||||||
Russia — 4.7% | ||||||||||
Alfa Bank Via Alfa Bond Issuance | ||||||||||
7.750%, 04/28/2021 | 500 | 573 | ||||||||
| Description | Face Amount (Thousands) | Market Value ($ Thousands) | ||||||||
GLOBAL BONDS (continued) | ||||||||||
Evraz Group | ||||||||||
8.250%, 01/28/2021 | $ | 1,000 | $ | 1,093 | ||||||
Republic of Serbia | ||||||||||
7.250%, 09/28/2021 | 5,027 | 5,852 | ||||||||
Ritekro | ||||||||||
14.669%, 11/07/2022 (E)(G) | 914 | 457 | ||||||||
Russian Federal Bond - OFZ | ||||||||||
8.150%, 02/03/2027 | RUB | 41,490 | 665 | |||||||
7.600%, 04/14/2021 | 487,263 | 7,535 | ||||||||
7.600%, 07/20/2022 | 343,688 | 5,300 | ||||||||
7.500%, 03/15/2018 | 139,947 | 2,193 | ||||||||
7.500%, 02/27/2019 | 196,587 | 3,059 | ||||||||
7.050%, 01/19/2028 | 161,212 | 2,375 | ||||||||
7.000%, 01/25/2023 | 140,926 | 2,108 | ||||||||
7.000%, 08/16/2023 | 326,364 | 4,873 | ||||||||
6.800%, 12/11/2019 | 494,098 | 7,491 | ||||||||
6.700%, 05/15/2019 | 302,961 | 4,613 | ||||||||
6.400%, 05/27/2020 | 17,800 | 266 | ||||||||
6.200%, 01/31/2018 | 145,934 | 2,249 | ||||||||
0.000%, 12/03/2014 (D) | 22,770 | 337 | ||||||||
Russian Foreign Bond - Eurobond | ||||||||||
5.875%, 09/16/2043 | $ | 800 | 954 | |||||||
5.625%, 04/04/2042 | 1,400 | 1,617 | ||||||||
5.000%, 04/29/2020 (A)(B) | 484 | 522 | ||||||||
4.875%, 09/16/2023 | 7,200 | 7,916 | ||||||||
4.875%, 09/16/2023 (B) | 800 | 880 | ||||||||
3.250%, 04/04/2017 | 600 | 604 | ||||||||
Russian Railways Via RZD Capital | ||||||||||
5.700%, 04/05/2022 | 1,800 | 1,959 | ||||||||
Vnesheconombank Via VEB Finance | ||||||||||
6.902%, 07/09/2020 | 2,780 | 3,023 | ||||||||
6.800%, 11/22/2025 | 4,124 | 4,548 | ||||||||
6.800%, 11/22/2025 (B) | 150 | 165 | ||||||||
5.450%, 11/22/2017 (B) | 400 | 411 | ||||||||
|
|
| ||||||||
| 73,638 | ||||||||||
|
|
| ||||||||
Senegal — 0.2% | ||||||||||
Republic of Senegal | ||||||||||
8.750%, 05/13/2021 (B) | 540 | 613 | ||||||||
8.750%, 05/13/2021 | 90 | 102 | ||||||||
6.250%, 07/30/2024 (B) | 426 | 441 | ||||||||
6.250%, 07/30/2024 | 3,130 | 3,240 | ||||||||
|
|
| ||||||||
| 4,396 | ||||||||||
|
|
| ||||||||
Serbia — 0.2% | ||||||||||
Republic of Serbia | ||||||||||
7.250%, 09/28/2021 (B) | 200 | 233 | ||||||||
5.875%, 12/03/2018 (B) | 530 | 562 | ||||||||
4.875%, 02/25/2020 | 2,715 | 2,837 | ||||||||
|
|
| ||||||||
| 3,632 | ||||||||||
|
|
| ||||||||
Slovenia — 0.4% | ||||||||||
Slovenia Government International Bond | ||||||||||
5.850%, 05/10/2023 | 1,800 | 2,156 | ||||||||
56 |
SEI Institutional International Trust / Annual Report / September 30, 2016 |
| Description | Face Amount (Thousands) | Market Value ($ Thousands) | ||||||||
GLOBAL BONDS (continued) | ||||||||||
5.250%, 02/18/2024 | $ | 3,500 | $ | 4,105 | ||||||
|
|
| ||||||||
| 6,261 | ||||||||||
|
|
| ||||||||
South Africa — 5.9% | ||||||||||
Eskom Holdings MTN | ||||||||||
6.750%, 08/06/2023 (B) | 1,043 | 1,071 | ||||||||
Eskom Holdings | ||||||||||
7.125%, 02/11/2025 | 1,750 | 1,797 | ||||||||
7.125%, 02/11/2025 (B) | 2,101 | 2,158 | ||||||||
5.750%, 01/26/2021 | 289 | 287 | ||||||||
Republic of South Africa | ||||||||||
10.500%, 12/21/2026 | ZAR | 294,828 | 24,045 | |||||||
8.875%, 02/28/2035 | 43,130 | 3,034 | ||||||||
8.750%, 01/31/2044 | 20,346 | 1,384 | ||||||||
8.750%, 02/28/2048 | 91,349 | 6,201 | ||||||||
8.500%, 01/31/2037 | 142,682 | 9,594 | ||||||||
8.250%, 03/31/2032 | 159,763 | 10,740 | ||||||||
8.000%, 01/31/2030 | 72,394 | 4,844 | ||||||||
7.750%, 02/28/2023 | 45,001 | 3,176 | ||||||||
7.250%, 01/15/2020 | 8,121 | 580 | ||||||||
7.000%, 02/28/2031 | 103,711 | 6,300 | ||||||||
6.750%, 03/31/2021 | 34,863 | 2,414 | ||||||||
6.500%, 02/28/2041 | 39,901 | 2,120 | ||||||||
6.250%, 03/31/2036 | 78,799 | 4,181 | ||||||||
5.875%, 05/30/2022 | $ | 258 | 292 | |||||||
5.875%, 09/16/2025 (A) | 2,859 | 3,238 | ||||||||
4.875%, 04/14/2026 | 1,245 | 1,309 | ||||||||
South Africa Government International Bond | ||||||||||
5.000%, 10/12/2046 | 292 | 292 | ||||||||
4.300%, 10/12/2028 | 1,621 | 1,621 | ||||||||
Transnet SOC MTN | ||||||||||
9.500%, 05/13/2021 (B) | ZAR | 13,360 | 915 | |||||||
|
|
| ||||||||
| 91,593 | ||||||||||
|
|
| ||||||||
Sri Lanka — 0.8% | ||||||||||
Republic of Sri Lanka | ||||||||||
6.850%, 11/03/2025 (B) | $ | 908 | 974 | |||||||
6.850%, 11/03/2025 | 4,439 | 4,763 | ||||||||
6.250%, 07/27/2021 | 1,385 | 1,447 | ||||||||
5.875%, 07/25/2022 (B) | 2,251 | 2,313 | ||||||||
Sri Lanka Government International Bond | ||||||||||
6.825%, 07/18/2026 (B) | 1,209 | 1,300 | ||||||||
|
|
| ||||||||
| 10,797 | ||||||||||
|
|
| ||||||||
Supra-National — 0.2% | ||||||||||
European Investment Bank MTN | ||||||||||
8.500%, 09/17/2024 | ZAR | 9,200 | 670 | |||||||
7.200%, 07/09/2019 | IDR | 9,440,000 | 725 | |||||||
Inter-American Development Bank MTN | ||||||||||
7.350%, 09/12/2018 | 20,140,000 | 1,554 | ||||||||
|
|
| ||||||||
| 2,949 | ||||||||||
|
|
| ||||||||
Thailand — 2.3% | ||||||||||
Thailand Government Bond | ||||||||||
5.670%, 03/13/2028 | THB | 3,000 | 116 | |||||||
| Description | Face Amount (Thousands) | Market Value ($ Thousands) | ||||||||
GLOBAL BONDS (continued) | ||||||||||
4.875%, 06/22/2029 | THB | 193,959 | $ | 7,155 | ||||||
4.675%, 06/29/2044 | 4,171 | 167 | ||||||||
3.875%, 06/13/2019 | 68,000 | 2,079 | ||||||||
3.850%, 12/12/2025 | 130,090 | 4,300 | ||||||||
3.650%, 12/17/2021 | 346,356 | 10,918 | ||||||||
3.625%, 06/16/2023 | 193,080 | 6,158 | ||||||||
3.580%, 12/17/2027 | 29,970 | 979 | ||||||||
3.400%, 06/17/2036 | 61,500 | 1,997 | ||||||||
2.550%, 06/26/2020 | 40,000 | 1,189 | ||||||||
1.875%, 06/17/2022 | 15,000 | 429 | ||||||||
1.200%, 07/14/2021 | 59,400 | 1,780 | ||||||||
|
|
| ||||||||
| 37,267 | ||||||||||
|
|
| ||||||||
Tunisia — 0.2% | ||||||||||
Banque Centrale de Tunisie | ||||||||||
5.750%, 01/30/2025 (B) | $ | 3,118 | 3,047 | |||||||
|
|
| ||||||||
Turkey — 7.9% | ||||||||||
Export Credit Bank of Turkey MTN | ||||||||||
5.375%, 02/08/2021 (B) | 896 | 916 | ||||||||
Export Credit Bank of Turkey | ||||||||||
5.875%, 04/24/2019 (B) | 200 | 208 | ||||||||
5.000%, 09/23/2021 (B) | 538 | 543 | ||||||||
KOC Holding | ||||||||||
5.250%, 03/15/2023 | 1,840 | 1,883 | ||||||||
Republic of Turkey | ||||||||||
11.875%, 01/15/2030 | 900 | 1,497 | ||||||||
10.700%, 02/17/2021 | TRY | 23,372 | 8,242 | |||||||
10.600%, 02/11/2026 | 54,182 | 19,250 | ||||||||
10.500%, 01/15/2020 | 6,610 | 2,312 | ||||||||
10.400%, 03/27/2019 | 3,560 | 1,231 | ||||||||
10.400%, 03/20/2024 | 2,250 | 787 | ||||||||
9.500%, 01/12/2022 | 10,823 | 3,650 | ||||||||
9.000%, 07/24/2024 | 16,629 | 5,395 | ||||||||
8.800%, 11/14/2018 | 9,824 | 3,290 | ||||||||
8.500%, 07/10/2019 | 3,658 | 1,213 | ||||||||
8.500%, 09/14/2022 | 13,148 | 4,228 | ||||||||
8.300%, 06/20/2018 | 5,751 | 1,913 | ||||||||
8.000%, 03/12/2025 | 2,113 | 645 | ||||||||
8.000%, 02/14/2034 | $ | 1,350 | 1,744 | |||||||
7.500%, 11/07/2019 | 561 | 624 | ||||||||
7.400%, 02/05/2020 | TRY | 38,587 | 12,318 | |||||||
7.375%, 02/05/2025 | $ | 1,151 | 1,361 | |||||||
7.100%, 03/08/2023 | TRY | 6,560 | 1,951 | |||||||
7.000%, 03/11/2019 | $ | 453 | 491 | |||||||
7.000%, 06/05/2020 | 7,025 | 7,773 | ||||||||
6.875%, 03/17/2036 | 3,021 | 3,526 | ||||||||
6.750%, 04/03/2018 | 1,374 | 1,452 | ||||||||
6.750%, 05/30/2040 | 1,889 | 2,201 | ||||||||
6.625%, 02/17/2045 | 3,051 | 3,556 | ||||||||
6.300%, 02/14/2018 | TRY | 1,090 | 354 | |||||||
6.250%, 09/26/2022 | $ | 2,410 | 2,645 | |||||||
6.000%, 01/14/2041 | 115 | 123 | ||||||||
SEI Institutional International Trust / Annual Report / September 30, 2016 |
57 |
SCHEDULE OF INVESTMENTS
September 30, 2016
Emerging Markets Debt Fund (Continued)
| Description | Face Amount (Thousands) | Market Value ($ Thousands) | ||||||
GLOBAL BONDS (continued) | ||||||||
5.750%, 03/22/2024 | $ 333 | $ | 359 | |||||
5.625%, 03/30/2021 | 2,292 | 2,441 | ||||||
5.125%, 03/25/2022 | 2,063 | 2,146 | ||||||
4.875%, 04/16/2043 | 673 | 628 | ||||||
4.250%, 04/14/2026 | 2,171 | 2,123 | ||||||
3.000%, 08/02/2023 | TRY 5,302 | 2,363 | ||||||
TC Ziraat Bankasi MTN | ||||||||
4.750%, 04/29/2021 (B) | $ 561 | 558 | ||||||
TC Ziraat Bankasi | ||||||||
4.250%, 07/03/2019 (B) | 1,440 | 1,432 | ||||||
Turk Telekomunikasyon | ||||||||
4.875%, 06/19/2024 | 1,750 | 1,737 | ||||||
Turkey Government Bond | ||||||||
9.400%, 07/08/2020 | TRY 35,231 | 11,900 | ||||||
9.200%, 09/22/2021 | 5,330 | 1,784 | ||||||
Turkiye Garanti Bankasi | ||||||||
6.250%, 04/20/2021 | $ 1,000 | 1,053 | ||||||
|
|
| ||||||
| 125,846 | ||||||||
|
|
| ||||||
Ukraine — 1.2% | ||||||||
Government of Ukraine | ||||||||
7.750%, 09/01/2019 (B) | 70 | 69 | ||||||
7.750%, 09/01/2020 (B) | 6,551 | 6,402 | ||||||
7.750%, 09/01/2021 (B) | 1,895 | 1,839 | ||||||
7.750%, 09/01/2022 (B) | 3,651 | 3,524 | ||||||
7.750%, 09/01/2023 (B) | 930 | 893 | ||||||
7.750%, 09/01/2024 | 1,650 | 1,575 | ||||||
7.750%, 09/01/2024 (B) | 730 | 697 | ||||||
7.750%, 09/01/2025 (B) | 2,075 | 1,970 | ||||||
7.750%, 09/01/2026 (B) | 625 | 591 | ||||||
7.750%, 09/01/2026 | 1,410 | 1,333 | ||||||
7.750%, 09/01/2027 | 690 | 649 | ||||||
7.750%, 09/01/2027 (B) | 523 | 492 | ||||||
3.304%, 05/31/2040 (B)(C) | 1,406 | 450 | ||||||
Ukreximbank Via Biz Finance | ||||||||
9.625%, 04/27/2022 (B) | 1,711 | 1,677 | ||||||
|
|
| ||||||
| 22,161 | ||||||||
|
|
| ||||||
United Arab Emirates — 0.3% | ||||||||
DP World MTN | ||||||||
6.850%, 07/02/2037 | 1,800 | 2,081 | ||||||
MAF Global Securities | ||||||||
7.125%, 10/29/2049 (C) | 2,490 | 2,628 | ||||||
|
|
| ||||||
| 4,709 | ||||||||
|
|
| ||||||
Uruguay — 1.0% | ||||||||
Republic of Uruguay PIK | ||||||||
7.875%, 01/15/2033 | 3,244 | 4,582 | ||||||
Republic of Uruguay | ||||||||
5.100%, 06/18/2050 | 6,736 | 6,989 | ||||||
4.375%, 10/27/2027 | 2,503 | 2,694 | ||||||
4.125%, 11/20/2045 | 346 | 324 | ||||||
|
|
| ||||||
| 14,589 | ||||||||
|
|
| ||||||
| Description | Face Amount (Thousands) | Market Value ($ Thousands) | ||||||
GLOBAL BONDS (continued) | ||||||||
Venezuela — 1.3% | ||||||||
Petroleos de Venezuela | ||||||||
6.000%, 05/16/2024 | $ | 9,465 | $ | 4,045 | ||||
6.000%, 05/16/2024 | 2,782 | 1,189 | ||||||
6.000%, 11/15/2026 | 7,464 | 3,134 | ||||||
5.500%, 04/12/2037 | 4,700 | 1,950 | ||||||
5.375%, 04/12/2027 | 2,625 | 1,096 | ||||||
Republic of Venezuela | ||||||||
13.625%, 08/15/2018 | 144 | 109 | ||||||
13.625%, 08/15/2018 | 1,716 | 1,382 | ||||||
9.375%, 01/13/2034 | 4,526 | 2,344 | ||||||
9.250%, 05/07/2028 | 445 | 229 | ||||||
9.000%, 05/07/2023 | 1,000 | 507 | ||||||
8.250%, 10/13/2024 | 819 | 402 | ||||||
8.250%, 10/13/2024 | 562 | 276 | ||||||
8.250%, 10/13/2024 | 500 | 246 | ||||||
7.750%, 10/13/2019 | 1,862 | 1,144 | ||||||
7.650%, 04/21/2025 | 3,131 | 1,503 | ||||||
|
|
| ||||||
| 19,556 | ||||||||
|
|
| ||||||
Zambia — 0.1% | ||||||||
Republic of Zambia | ||||||||
8.970%, 07/30/2027 | 542 | 535 | ||||||
8.500%, 04/14/2024 | 1,122 | 1,103 | ||||||
5.375%, 09/20/2022 | 721 | 633 | ||||||
|
|
| ||||||
| 2,271 | ||||||||
|
|
| ||||||
Total Global Bonds | 1,501,358 | |||||||
|
|
| ||||||
LOAN PARTICIPATIONS — 0.2% | ||||||||
Singapore — 0.0% | ||||||||
Ashmore Cayman SPC, No. 1 | ||||||||
0.000%, 08/31/2011 (C)(G) | 262 | 131 | ||||||
Morton Bay | ||||||||
6.220%, 12/31/2013 (G) | 3,158 | – | ||||||
|
|
| ||||||
| 131 | ||||||||
|
|
| ||||||
Venezuela — 0.2% | ||||||||
Bolivarian Republic of Venezuela | ||||||||
6.250%, 01/10/2018 | 2,800 | 2,856 | ||||||
|
|
| ||||||
Total Loan Participations (Cost $6,195) ($ Thousands) | 2,987 | |||||||
|
|
| ||||||
58 |
SEI Institutional International Trust / Annual Report / September 30, 2016 |
| Description | Shares | Market Value ($ Thousands) | ||||||
AFFILIATED PARTNERSHIP — 2.3% |
| |||||||
SEI Liquidity Fund, L.P. | ||||||||
0.430% **†(H) | 36,123,986 | $ | 36,124 | |||||
|
|
| ||||||
Total Affiliated Partnership | 36,124 | |||||||
|
|
| ||||||
Total Investments — 99.1% | $ | 1,540,469 | ||||||
|
|
| ||||||
A list of the open futures contracts held by the Fund at September 30, 2016, is as follows:
| Type of Contract | Number of Contracts Long (Short) | Expiration Date | Unrealized Appreciation (Depreciation) ($ Thousands) | |||||||||
Euro-Bund Index | (69) | Dec-2016 | $(37) | |||||||||
Euro-Buxl 30 Year Bond | (18) | Dec-2016 | (12) | |||||||||
JSE Bond Future R186 | 470 | Nov-2016 | 31 | |||||||||
JSE Bond Future R207 | 598 | Nov-2016 | 29 | |||||||||
JSE Bond Future R208 | 352 | Nov-2016 | 20 | |||||||||
JSE Bond Future R2030 | 1,198 | Nov-2016 | 104 | |||||||||
Korea 3-Year Bond | 147 | Dec-2016 | 37 | |||||||||
U.S. 10-Year Treasury Note | 118 | Dec-2016 | (70) | |||||||||
U.S. 5-Year Treasury Note | (329) | Dec-2016 | (44) | |||||||||
U.S. Ultra Long Treasury Bond | (11) | Dec-2016 | 37 | |||||||||
|
| |||||||||||
| $95 | ||||||||||||
|
| |||||||||||
For the year ended September 30, 2016, the total amount of all open futures contracts, as presented in the table above, are representative of the volume of activity for the derivative type during the year.
A list of the open forward foreign currency contracts held by the Fund at September 30, 2016, is as follows:
Settlement Date | Currency to Deliver (Thousands) | Currency To Receive (Thousands) | Unrealized Appreciation (Depreciation) ($ Thousands) | |||||||||||||||||
10/03/16-12/21/16 | USD | 32,518 | EUR | 29,065 | $156 | |||||||||||||||
10/03/16-12/21/16 | USD | 28,563 | EUR | 25,316 | (41) | |||||||||||||||
10/03/16-11/10/16 | EUR | 5,707 | USD | 6,423 | 8 | |||||||||||||||
10/03/16-12/21/16 | EUR | 59,190 | USD | 66,149 | (409) | |||||||||||||||
10/04/16-12/02/16 | USD | 14,754 | BRL | 49,018 | 294 | |||||||||||||||
10/05/16-11/28/16 | USD | 20,703 | BRL | 67,617 | (148) | |||||||||||||||
10/05/16-11/28/16 | BRL | 70,903 | USD | 21,844 | 100 | |||||||||||||||
10/04/16-10/05/16 | BRL | 35,429 | USD | 10,769 | (136) | |||||||||||||||
10/05/16-07/19/17 | USD | 43,053 | RUB | 2,859,583 | 1,198 | |||||||||||||||
10/05/16-12/01/16 | RUB | 1,411,590 | USD | 21,595 | (749) | |||||||||||||||
11/02/16-12/21/16 | USD | 16,855 | PEN | 58,060 | 55 | |||||||||||||||
10/07/16 | USD | 4,747 | PEN | 15,974 | (59) | |||||||||||||||
12/20/16-12/21/16 | USD | 6,196 | MYR | 25,669 | 10 | |||||||||||||||
10/07/16-12/21/16 | USD | 32,255 | MYR | 131,775 | (386) | |||||||||||||||
10/11/16-12/21/16 | USD | 10,677 | COP | 32,304,681 | 416 | |||||||||||||||
10/11/16-12/21/16 | TRY | 39,143 | USD | 13,035 | 165 | |||||||||||||||
10/11/16-12/21/16 | COP | 15,429,826 | USD | 5,338 | 28 | |||||||||||||||
10/11/16-12/21/16 | COP | 49,861,867 | USD | 16,801 | (355) | |||||||||||||||
10/21/16-12/21/16 | USD | 34,927 | THB | 1,221,103 | 301 | |||||||||||||||
10/14/16-12/20/16 | USD | 5,789 | THB | 200,380 | (7) | |||||||||||||||
Settlement Date | Currency to Deliver | Currency To Receive | Unrealized Appreciation (Depreciation) ($ Thousands) | |||||||||||||||||
10/17/16 | EUR | 3,298 | HUF | 1,022,807 | $12 | |||||||||||||||
12/21/16-12/30/16 | EUR | 5,643 | HUF | 1,735,855 | (46) | |||||||||||||||
10/17/16-12/30/16 | HUF | 3,528,899 | EUR | 11,360 | (45) | |||||||||||||||
10/18/16-11/21/16 | EUR | 12,842 | PLN | 56,164 | 218 | |||||||||||||||
12/15/16-12/15/16 | EUR | 6,185 | PLN | 26,586 | (35) | |||||||||||||||
10/18/16-12/15/16 | PLN | 24,279 | EUR | 5,579 | (68) | |||||||||||||||
10/19/16-12/21/16 | SGD | 31,053 | USD | 22,721 | (71) | |||||||||||||||
11/30/16-12/21/16 | USD | 11,783 | MXN | 233,062 | 165 | |||||||||||||||
10/19/16-11/30/16 | USD | 21,416 | MXN | 406,137 | (521) | |||||||||||||||
10/21/16-12/21/16 | USD | 4,508 | HUF | 1,244,754 | 20 | |||||||||||||||
12/21/16 | USD | 743 | HUF | 203,993 | (1) | |||||||||||||||
10/21/16 | PLN | 5,261 | USD | 1,356 | (18) | |||||||||||||||
10/21/16 | USD | 2,979 | RON | 11,797 | 1 | |||||||||||||||
10/21/16 | USD | 3,066 | RON | 12,136 | — | |||||||||||||||
10/21/16-12/20/16 | THB | 100,053 | USD | 2,875 | (13) | |||||||||||||||
10/24/16-12/21/16 | USD | 5,223 | CLP | 3,517,161 | 96 | |||||||||||||||
12/21/16-12/21/16 | USD | 1,394 | CLP | 919,100 | (7) | |||||||||||||||
10/24/16 | CLP | 2,172,716 | USD | 3,313 | 20 | |||||||||||||||
10/24/16-12/21/16 | CLP | 2,712,525 | USD | 4,074 | (18) | |||||||||||||||
10/27/16-12/21/16 | ZAR | 580,925 | USD | 40,482 | (1,382) | |||||||||||||||
10/28/16 | IDR | 31,829,120 | USD | 2,453 | 14 | |||||||||||||||
11/22/16-05/23/17 | IDR | 133,547,974 | USD | 9,761 | (390) | |||||||||||||||
11/02/16 | PEN | 10,278 | USD | 3,012 | 2 | |||||||||||||||
12/27/16 | USD | 6,287 | INR | 425,223 | 21 | |||||||||||||||
11/04/16 | USD | 5,333 | INR | 356,584 | — | |||||||||||||||
11/07/16-12/21/16 | MXN | 462,163 | USD | 24,756 | 1,068 | |||||||||||||||
11/08/16-12/21/16 | MYR | 13,399 | USD | 3,261 | 20 | |||||||||||||||
12/20/16-12/21/16 | MYR | 16,573 | USD | 3,992 | (16) | |||||||||||||||
11/10/16-11/15/16 | USD | 10,783 | TRY | 32,389 | (79) | |||||||||||||||
11/10/16-12/21/16 | USD | 22,194 | IDR | 295,296,239 | 371 | |||||||||||||||
11/10/16-12/21/16 | USD | 12,836 | ZAR | 185,662 | 502 | |||||||||||||||
11/15/16-11/15/16 | USD | 15,197 | ZAR | 206,784 | (277) | |||||||||||||||
11/21/16 | EUR | 5,676 | RON | 25,271 | (1) | |||||||||||||||
11/30/16 | ARS | 15,714 | USD | 865 | (133) | |||||||||||||||
12/12/16 | USD | 3,055 | KRW | 3,374,115 | 8 | |||||||||||||||
12/12/16 | USD | 3,297 | KRW | 3,608,600 | (21) | |||||||||||||||
12/19/16-12/21/16 | USD | 19,277 | PHP | 928,595 | (151) | |||||||||||||||
12/19/16 | PHP | 299,403 | USD | 6,226 | 59 | |||||||||||||||
12/21/16 | USD | 12,920 | PLN | 50,266 | 198 | |||||||||||||||
12/21/16 | RON | 39,950 | USD | 10,108 | (9) | |||||||||||||||
12/21/16 | ILS | 63,170 | USD | 16,699 | (173) | |||||||||||||||
02/15/17 | CNY | 15,364 | USD | 2,293 | 8 | |||||||||||||||
12/21/16-02/15/17 | CNY | 115,460 | USD | 17,065 | (126) | |||||||||||||||
12/21/16 | TWD | 184,000 | USD | 5,829 | (88) | |||||||||||||||
12/21/16 | HUF | 2,462,498 | USD | 8,970 | 4 | |||||||||||||||
12/21/16-12/21/16 | HUF | 2,612,804 | USD | 9,462 | (50) | |||||||||||||||
12/21/16-12/21/16 | KRW | 12,394,079 | USD | 11,055 | (196) | |||||||||||||||
09/27/18 | EUR | 5,781 | CZK | 154,374 | (3) | |||||||||||||||
|
| |||||||||||||||||||
| $(690) | ||||||||||||||||||||
|
| |||||||||||||||||||
SEI Institutional International Trust / Annual Report / September 30, 2016 |
59 |
SCHEDULE OF INVESTMENTS
September 30, 2016
Emerging Markets Debt Fund (Continued)
A list of the counterparties for the outstanding forward foreign currency contracts held by the Fund at September 30, 2016, is as follows:
| Counterparty | Currency to Deliver ($ Thousands) | Currency to ($ Thousands) | Unrealized Appreciation (Depreciation) ($ Thousands) | |||||||||
Barclays PLC | $(14,820) | $14,717 | $(103) | |||||||||
Citibank | (14,024) | 14,665 | 641 | |||||||||
Citigroup | (322,293) | 322,753 | 460 | |||||||||
Goldman Sachs | (214,085) | 213,904 | (181) | |||||||||
| Counterparty | Currency to Deliver ($ Thousands) | Currency to Receive ($ Thousands) | Unrealized Appreciation (Depreciation) ($ Thousands) | |||||||||
HSBC | $(8,776) | $8,730 | $(46) | |||||||||
JPMorgan Chase Bank | (213,826) | 212,296 | (1,530) | |||||||||
Standard Bank | (64,609) | 64,678 | 69 | |||||||||
|
| |||||||||||
| $(690) | ||||||||||||
|
| |||||||||||
For the year ended September 30, 2016 the total amount of all open forward foreign currency contracts, as presented in the table above, are representative of the volume of activity for the derivative type during the year.
A list of the open OTC swap agreements held by the Fund at September 30, 2016, is as follows:
| Interest Rate Swaps | ||||||||||||||||
| Counterparty | Fund Pays | Fund Receives | Termination Date | Currency | Notional Amount (Thousands) | Net Unrealized Appreciation (Depreciation) ($ Thousands) | ||||||||||
Citibank | 0.35% | 6-Month CZK - PRIBOR | 06/27/21 | CZK | 15,000 | $ - | ||||||||||
Goldman Sachs | 28-Day MXN - TIIE | 6.38% | 09/16/26 | MXN | 26,000 | (4) | ||||||||||
Goldman Sachs | 1.99% | 6-Month HUF - BUBOR | 07/25/26 | HUF | 500,000 | (16) | ||||||||||
Goldman Sachs | 7.23% | COP Overnight Interbank Reference Rate | 05/04/26 | COP | 3,031,228 | (61) | ||||||||||
Goldman Sachs | 28-Day MXN - TIIE | 6.17% | 03/05/26 | MXN | 47,200 | (41) | ||||||||||
Goldman Sachs | 28-Day MXN - TIIE | 6.21% | 12/08/25 | MXN | 16,624 | (11) | ||||||||||
Goldman Sachs | 28-Day MXN - TIIE | 6.36% | 05/21/25 | MXN | 23,145 | 1 | ||||||||||
Goldman Sachs | 3.45% | 6-Month HUF - BUBOR | 05/11/25 | HUF | 800,000 | (444) | ||||||||||
Goldman Sachs | 1-Year BRL-CDI | 10.84% | 01/03/23 | BRL | 5,012 | (165) | ||||||||||
Goldman Sachs | 1-Day BRL - CETIP | 11.99% | 01/02/23 | BRL | 3,000 | (9) | ||||||||||
Goldman Sachs | 28-Day MXN - TIIE | 5.90% | 09/12/22 | MXN | 75,956 | (55) | ||||||||||
Goldman Sachs | 3-Month MYR - KLIBOR | 3.42% | 09/23/21 | MYR | 14,000 | (7) | ||||||||||
Goldman Sachs | 0.33% | 6-Month CZK - PRIBOR | 09/01/21 | CZK | 40,000 | 2 | ||||||||||
Goldman Sachs | 0.38% | 6-Month CZK - PRIBOR | 08/02/21 | CZK | 30,000 | (2) | ||||||||||
Goldman Sachs | 0.28% | 6-Month CZK - PRIBOR | 07/08/21 | CZK | 40,000 | 6 | ||||||||||
Goldman Sachs | 5.63% | 28-Day MXN - TIIE | 06/11/21 | MXN | 63,409 | 59 | ||||||||||
Goldman Sachs | 0.45% | 6-Month CZK - PRIBOR | 05/24/21 | CZK | 30,000 | (7) | ||||||||||
Goldman Sachs | 3-Month MYR - KLIBOR | 3.74% | 03/23/21 | MYR | 10,300 | 32 | ||||||||||
Goldman Sachs | 28-Day MXN - TIIE | 5.37% | 03/17/21 | MXN | 46,500 | (65) | ||||||||||
Goldman Sachs | CFETS 7-Day China Fixing Repo Rates | 2.49% | 02/04/21 | CNY | 18,000 | (28) | ||||||||||
Goldman Sachs | 1-Day BRL-CDI | 12.73% | 01/04/21 | BRL | 10,608 | 108 | ||||||||||
Goldman Sachs | 0.57% | 6-Month CZK - PRIBOR | 12/16/20 | CZK | 90,000 | (51) | ||||||||||
Goldman Sachs | 0.42% | 6-Month CZK - PRIBOR | 10/23/20 | CZK | 42,000 | (11) | ||||||||||
Goldman Sachs | 0.59% | 6-Month CZK - PRIBOR | 03/13/20 | CZK | 25,000 | (13) | ||||||||||
Goldman Sachs | 1-Day BRL - CETIP | 13.39% | 01/02/19 | BRL | 14,395 | 141 | ||||||||||
Goldman Sachs | 1-Day BRL - CETIP | 13.42% | 01/02/19 | BRL | 19,336 | 196 | ||||||||||
Goldman Sachs | 4.63% | 28-Day MXN - TIIE | 09/21/18 | MXN | 168,578 | 36 | ||||||||||
Goldman Sachs | 1-Year BRL-CDI | 11.81% | 01/02/18 | BRL | 9,833 | (116) | ||||||||||
Goldman Sachs | 1-Year BRL-CDI | 11.98% | 01/02/18 | BRL | 3,338 | (35) | ||||||||||
Goldman Sachs | 1-Day BRL - CETIP | 12.86% | 01/02/18 | BRL | 35,816 | (75) | ||||||||||
Goldman Sachs | 1-Day BRL - CETIP | 13.27% | 01/02/17 | BRL | 27,961 | (105) | ||||||||||
JPMorgan Chase Bank | 28-Day MXN - TIIE | 6.13% | 06/18/26 | MXN | 40,000 | (43) | ||||||||||
JPMorgan Chase Bank | 4.29% | 6-Month HUF - BUBOR | 08/04/24 | HUF | 300,000 | (228) | ||||||||||
JPMorgan Chase Bank | 0.36% | 6-Month CZK - PRIBOR | 09/29/21 | CZK | 20,000 | - | ||||||||||
JPMorgan Chase Bank | 1.38% | 6-Month HUF - BUBOR | 06/17/21 | HUF | 654,998 | (40) | ||||||||||
JPMorgan Chase Bank | CFETS 7-Day China Fixing Repo Rates | 2.83% | 05/09/21 | CNY | 8,000 | 4 | ||||||||||
JPMorgan Chase Bank | 0.39% | 6-Month CZK - PRIBOR | 04/04/21 | CZK | 25,000 | (3) | ||||||||||
JPMorgan Chase Bank | 0.30% | 6-Month CZK - PRIBOR | 02/26/21 | CZK | 61,000 | 2 | ||||||||||
JPMorgan Chase Bank | 7.16% | Columbia Overnight Interbank Reference Rate | 02/11/21 | COP | 10,000,000 | (163) | ||||||||||
JPMorgan Chase Bank | CFETS 7-Day China Fixing Repo Rates | 2.44% | 01/26/21 | CNY | 17,000 | (33) | ||||||||||
JPMorgan Chase Bank | 7.11% | Columbia Overnight Interbank Reference Rate | 01/22/21 | COP | 9,929,262 | (153) | ||||||||||
JPMorgan Chase Bank | 0.44% | 6-Month CZK - PRIBOR | 11/20/20 | CZK | 30,000 | (9) | ||||||||||
JPMorgan Chase Bank | 0.50% | 6-Month CZK - PRIBOR | 05/05/20 | CZK | 140,000 | (42) | ||||||||||
JPMorgan Chase Bank | 0.54% | 6-Month CZK - PRIBOR | 02/16/20 | CZK | 250,000 | (111) | ||||||||||
JPMorgan Chase Bank | 1-Day COP - Columbia IBR Overnight Interbank | 6.96% | 11/17/17 | COP | 28,888,912 | 30 | ||||||||||
JPMorgan Chase Bank | 1.77% | 3-Month HUF - BUBOR | 07/17/17 | HUF | 5,732,291 | (196) | ||||||||||
|
| |||||||||||||||
| $ (1,725) | ||||||||||||||||
|
| |||||||||||||||
60 |
SEI Institutional International Trust / Annual Report / September 30, 2016 |
| Credit Default Swaps | ||||||||||||||||
| Counterparty | Reference Entity/Obligation | Buy/Sell Protection | (Pays)/ Receives Rate | Termination Date | Notional Amount (Thousands) | Net Unrealized Depreciation ($Thousands) | ||||||||||
JPMorgan Chase Bank | United Mexican States | SELL | 1.00 | 6/20/26 | (1,200 | ) | $ (10) | |||||||||
| Cross Currency Swaps | ||||||||||||||||
| Counterparty | Fund Pays | Fund Receives | Termination Date | Currency | Notional Amount (Thousands) | Net Unrealized Appreciation ($ Thousands) | ||||||||||
JPMorgan Chase Bank | 3 Month USD LIBOR | 9.53% | 10/29/17 | TRY | 60,000 | $ 197 | ||||||||||
For the year ended September 30, 2016 the total amount of all open swap agreements, as presented in the table above, are representative of the volume of activity for the derivative type during the year.
| Percentages are based on Net Assets of $1,554,152 ($ Thousands). |
| ** | Rate shown is the 7-day effective yield as of September 30, 2016. |
| † | Investment in Affiliated Security (see Note 5). |
| (A) | This security or a partial position of this security is on loan at September 30, 2016 (see Note 9). The total market value of securities on loan at September 30, 2016 was $34,829 ($ Thousands). |
| (B) | Security exempt from registration under Rule 144A of the Securities Act of 1933. These securities may be resold in transactions exempt from registration normally to qualified institutions. On September 30, 2016, the value of these securities amounted to $168,861 ($ Thousands), representing 10.9% of the net assets of the Fund. |
| (C) | Variable Rate Security — The rate reported on the Schedule of Investments is the rate in effect as of September 30, 2016. |
| (D) | Step Bonds – The rate reflected on the Schedule of Investments is the effective yield on September 30, 2016. The coupon on a step bond changes on a specified date. |
| (E) | The rate reported is the effective yield at the time of purchase. |
| (F) | Security is in default on interest payment. |
| (G) | Securities considered illiquid. The total value of such securities as of September 30, 2016 was $588 ($ Thousands) and represented 0.0% of Net Assets (Unaudited). |
| (H) | This security was purchased with cash collateral held from securities on loan (see Note 9). The total market value of such securities as of September 30, 2016 was $36,124 ($ Thousands). |
ARS — Argentine Peso
BRL — Brazilian Real
BUBOR — Budapest Interbank Offered Rate
CDI — Average One-Day Interbank Deposit Rate
CETIP — Central of Custody and Financial Settlement of Securities
CFETS — China Foreign Exchange Trade System
CLP — Chilean Peso
CNY — Chinese Yuan
COP — Colombian Peso
CZK — Czech Koruna
DOP — Dominican Peso
EUR — Euro
HUF — Hungarian Forint
IBR — Interbank Rate
IDR — Indonesian Rupiah
ILS — Israeli Shekel
INR — Indian Rupee
JSE — Johannesburg Stock Exchange
KES — Kenyan Shilling
KLIBOR — Kuala Lumpur Interbank Offered Rate
KRW — Korean Won
LIBOR — London Interbank Offered Rate
L.P. — Limited Partnership
MTN — Medium Term Note
MXN — Mexican Peso
MYR — Malaysian Ringgit
PEN — Peruvian Inca
PHP— Philippine Peso
PIK — Payment-in-Kind
PLC — Public Limited Company
PLN — Polish Zloty
PRIBOR — Prague Interbank Offered Rate
RON — Romanian Leu
RUB — Russian Ruble
Ser — Series
SGD — Singapore Dollar
THB — Thai Bhat
TIIE — Equilibrium Interbank Offered Rate
TRY — Turkish Lira
TWD — Taiwan Dollar
USD — United States Dollar
ZAR — South African Rand
The following is a list of the level of inputs used as of September 30, 2016, in valuing the Fund’s investments and other financial instruments carried at value ($ Thousands):
| Investments in Securities | Level 1 | Level 2 | Level 3(1) | Total | ||||||||||||
Global Bonds | $ | – | $ | 1,497,451 | $ | 3,907 | $ | 1,501,358 | ||||||||
Loan Participations | – | 2,856 | 131 | 2,987 | ||||||||||||
Affiliated Partnership | – | 36,124 | – | 36,124 | ||||||||||||
|
|
|
|
|
|
|
| |||||||||
Total Investments in Securities | $ | – | $ | 1,536,431 | $ | 4,038 | $ | 1,540,469 | ||||||||
|
|
|
|
|
|
|
| |||||||||
| Other Financial Instruments | Level 1 | Level 2 | Level 3 | Total | ||||||||||||
Futures Contracts * | ||||||||||||||||
Unrealized Appreciation | $ | 258 | $ | – | $ | – | $ | 258 | ||||||||
Unrealized Depreciation | (163) | – | – | (163) | ||||||||||||
Forwards Contracts * | ||||||||||||||||
Unrealized Appreciation | – | 5,538 | – | 5,538 | ||||||||||||
Unrealized Depreciation | – | (6,228) | – | (6,228) | ||||||||||||
OTC Swaps | ||||||||||||||||
Credit Default Swaps * | ||||||||||||||||
Unrealized Depreciation | – | (10) | – | (10) | ||||||||||||
Interest Rate Swaps * | ||||||||||||||||
Unrealized Appreciation | – | 617 | – | 617 | ||||||||||||
Unrealized Depreciation | – | (2,342) | – | (2,342) | ||||||||||||
Cross Currency Swaps * | ||||||||||||||||
Unrealized Appreciation | – | 197 | – | 197 | ||||||||||||
|
|
|
|
|
|
|
| |||||||||
Total Other Financial Instruments | $ | 95 | $ | (2,228) | $ | – | $ | (2,133) | ||||||||
|
|
|
|
|
|
|
| |||||||||
(1) Of the $4,038 ($ Thousands) in Level 3 securities as of September 30, 2016, $4,038 ($ Thousands) or 0.26% as a percent of net assets are not valued via third party pricing vendors and broker quotes. If significant, the disclosure of the unobservable inputs and the interrelationships and sensitivity between these inputs are required for those Level 3 securities that are not valued by third party pricing vendors or broker quotes. A reconciliation of Level 3 investments is presented when the Fund
SEI Institutional International Trust / Annual Report / September 30, 2016 |
61 |
SCHEDULE OF INVESTMENTS
September 30, 2016
Emerging Markets Debt Fund (Concluded)
has significant amount of Level 3 investments at the beginning and/or end of the period in relation to net assets.
* Futures contracts, forwards contracts and swap contracts are valued at the unrealized appreciation (depreciation) on the instrument.
For the year ended September 30, 2016, there were no transfers between Level 1 and Level 2 assets and liabilities.
For the year ended September 30, 2016, there were no transfers between Level 2 and Level 3 assets and liabilities.
For more information on valuation inputs, see Note 2 – Significant Accounting Policies in Notes to Financial Statements.
Amounts designated as “—” are $0 or have been rounded to $0.
The accompanying notes are an integral part of the financial statements.
62 |
SEI Institutional International Trust / Annual Report / September 30, 2016 |
STATEMENTS OF ASSETS AND LIABILITIES ($ Thousands)
September 30, 2016
International Equity Fund | Emerging Markets Equity Fund | International Fixed Income Fund | Emerging Markets Debt Fund | |||||||||||||
Assets: | ||||||||||||||||
Investments, at value † | $ 2,780,803* | $ 1,581,676* | $ 500,696 | $ 1,504,345* | ||||||||||||
Affiliated investments, at value †† | 319,345 | 252,646 | – | 36,124 | ||||||||||||
Cash | 79,747 | 19,696 | 7,673 | 34,705 | ||||||||||||
Cash pledged as collateral for forward foreign currency contracts, futures contracts and swap contracts | – | – | 1,483 | 6,095 | ||||||||||||
Foreign currency, at value ††† | 876 | 1,586 | 21 | – | ||||||||||||
Receivable for fund shares sold | 1,376 | 574 | 252 | 1,022 | ||||||||||||
Receivable for investment securities sold | 2,794 | 9,951 | 3,077 | 8,730 | ||||||||||||
Dividends and interest receivable | 5,495 | 2,029 | 3,678 | 21,534 | ||||||||||||
Unrealized gain on forward foreign currency contracts | – | – | 2,970 | 5,538 | ||||||||||||
Unrealized gain on foreign spot currency contracts | 1 | 18 | 737 | 4 | ||||||||||||
Receivable from custodian | – | – | – | 685 | ||||||||||||
Due from broker | – | – | – | 136 | ||||||||||||
Swap contracts, at value †††† | – | – | – | 814 | ||||||||||||
Foreign tax reclaim receivable | 5,934 | 96 | – | – | ||||||||||||
Other receivable | – | 361 | – | – | ||||||||||||
Receivable for variation margin | 70 | – | 181 | 108 | ||||||||||||
Prepaid expenses | 23 | 12 | 5 | 12 | ||||||||||||
Total Assets | 3,196,464 | 1,868,645 | 520,773 | 1,619,852 | ||||||||||||
Liabilities: | ||||||||||||||||
Payable upon return on securities loaned | 284,416 | 245,981 | – | 36,124 | ||||||||||||
Payable for investment securities purchased | 3,265 | 10,775 | 5,204 | 16,806 | ||||||||||||
Payable for fund shares redeemed | 2,747 | 2,816 | 555 | 1,803 | ||||||||||||
Swap contracts, at value †††† | – | – | 241 | 2,465 | ||||||||||||
Payable to custodian | – | – | – | 127 | ||||||||||||
Foreign currency payable to custodian, at value ††† | – | – | – | 137 | ||||||||||||
Payable for variation margin | 267 | – | 123 | 114 | ||||||||||||
Administration fees payable | 1,065 | 591 | 188 | 570 | ||||||||||||
Unrealized loss on foreign currency spot contracts | 5 | 9 | 367 | 75 | ||||||||||||
Unrealized loss on forward foreign currency contracts | – | – | 3,765 | 6,228 | ||||||||||||
Trustees fees payable | 1 | – | – | – | ||||||||||||
Chief compliance officer fees payable | 3 | 2 | 1 | 2 | ||||||||||||
Administrative servicing fees payable | 4 | – | – | – | ||||||||||||
Shareholder servicing fees payable | 558 | 313 | 102 | 295 | ||||||||||||
Investment advisory fees payable | 1,018 | 1,253 | 68 | 664 | ||||||||||||
Accrued expense payable | 293 | 460 | 101 | 290 | ||||||||||||
Accrued foreign capital gains tax on appreciated securities | – | 1,267 | – | – | ||||||||||||
Total Liabilities | 293,642 | 263,467 | 10,715 | 65,700 | ||||||||||||
Net Assets | $ 2,902,822 | $ 1,605,178 | $ 510,058 | $ 1,554,152 | ||||||||||||
† Cost of investments | $ 2,706,061 | $ 1,531,267 | $ 489,497 | $ 1,503,969 | ||||||||||||
†† Cost of affiliated investments | 319,345 | 252,646 | – | 36,124 | ||||||||||||
††† Cost of foreign currency | 888 | 1,596 | 20 | (273) | ||||||||||||
†††† Cost (Premiums paid (received)) | – | – | 207 | (113) | ||||||||||||
* Includes market value of securities on loan | 269,416 | 231,057 | – | 34,829 | ||||||||||||
SEI Institutional International Trust / Annual Report / September 30, 2016 |
63 |
STATEMENTS OF ASSETS AND LIABILITIES ($ Thousands) (Concluded)
September 30, 2016
International Equity Fund | Emerging Markets Equity Fund | International Fixed Income Fund | Emerging Markets Debt Fund | |||||||||||||
Net Assets: | ||||||||||||||||
Paid-in Capital — (unlimited authorization — no par value) | $ 3,614,866 | $ 1,717,609 | $ 514,395 | $ 1,625,843 | ||||||||||||
Undistributed (distributions in excess of) net investment income (accumulated net investment loss) | 35,332 | 5,897 | (16,951) | (27,958) | ||||||||||||
Accumulated net realized gain (loss) on investments, futures contracts, foreign currency contracts and swap contracts | (822,350) | (167,484) | 2,924 | (41,954) | ||||||||||||
Net unrealized appreciation on investments | 74,742 | 50,409 | 11,199 | 376 | ||||||||||||
Net unrealized appreciation (depreciation) on futures contracts | 479 | – | (64) | 95 | ||||||||||||
Net unrealized appreciation (depreciation) on forward foreign currency contracts, foreign currencies and translation of other assets and liabilities denominated in foreign currencies | (247) | 14 | (1,262) | (712) | ||||||||||||
Net unrealized depreciation on swap contracts | – | – | (183) | (1,538) | ||||||||||||
Accumulated foreign capital gains tax on appreciated securities | – | (1,267) | – | – | ||||||||||||
Net Assets | $ 2,902,822 | $ 1,605,178 | $ 510,058 | $ 1,554,152 | ||||||||||||
Net Asset Value, Offering and Redemption Price Per Share — Class A | $ 9.58 | $ 10.09 | $ 10.51 | $ 10.08 | ||||||||||||
| ($2,729,762,106 ÷ | ($1,532,960,226 ÷ | ($497,156,668 ÷ | ($1,453,586,378 ÷ | |||||||||||||
| 285,093,839 shares) | 152,003,932 shares) | 47,292,738 shares) | 144,167,180 shares) | |||||||||||||
Net Asset Value, Offering and Redemption Price Per Share — Class I | $ 9.55 | N/A | N/A | N/A | ||||||||||||
| | ($4,341,001 ÷ 454,435 shares) | | ||||||||||||||
Net Asset Value, Offering and Redemption Price Per Share — Class Y | $ 9.59 | $ 10.11 | $ 10.50 | $ 10.12 | ||||||||||||
| | ($168,719,025 ÷ 17,591,244 shares) | | | ($72,217,619 ÷ 7,146,286 shares) | | | ($12,901,333 ÷ 1,228,294 shares) | | | ($100,565,451 ÷ 9,933,976 shares) | | |||||
N/A – Not applicable. Share classes currently not offered.
Amounts designated as “–” are $0 or have been rounded to $0.
The accompanying notes are an integral part of the financial statements.
64 |
SEI Institutional International Trust / Annual Report / September 30, 2016 |
STATEMENTS OF OPERATIONS ($ Thousands)
For the year ended September 30, 2016
| International Equity Fund | Emerging Markets Equity Fund | International Fixed Income Fund | Emerging Markets Debt Fund | |||||||||||||
Investment Income: | ||||||||||||||||
Dividends | $ | 78,416 | $ | 37,075 | $ | – | $ | – | ||||||||
Dividends from affiliated investments(1) | 152 | 19 | – | – | ||||||||||||
Interest Income | 489 | 161 | 10,188 | 97,007 | ||||||||||||
Security lending income — net (1)(2) | 2,391 | 1,303 | – | 168 | ||||||||||||
Less: foreign taxes withheld | (7,194) | (4,089) | (32) | (1,183) | ||||||||||||
Total Investment Income | 74,254 | 34,469 | 10,156 | 95,992 | ||||||||||||
Expenses: | ||||||||||||||||
Investment advisory fees | 14,236 | 15,380 | 1,501 | 12,214 | ||||||||||||
Administration fees | 12,686 | 6,596 | 2,252 | 6,466 | ||||||||||||
Shareholder servicing fees — Class A | 6,650 | 3,510 | 1,230 | 3,359 | ||||||||||||
Shareholder servicing fees — Class I | 12 | – | – | – | ||||||||||||
Administrative servicing fees — Class I | 12 | – | – | – | ||||||||||||
Printing fees | 556 | 280 | 96 | 284 | ||||||||||||
Proxy fees | 547 | 316 | 112 | 313 | ||||||||||||
Custodian/wire agent fees | 290 | 655 | 84 | 494 | ||||||||||||
Professional fees | 280 | 174 | 40 | 115 | ||||||||||||
Registration fees | 64 | 33 | 11 | 39 | ||||||||||||
Trustees’ fees | 41 | 22 | 7 | 21 | ||||||||||||
Overdraft fees | 22 | 15 | 8 | 12 | ||||||||||||
Chief compliance officer fees | 15 | 8 | 3 | 8 | ||||||||||||
Other expenses | 144 | 82 | 170 | 147 | ||||||||||||
Total Expenses | 35,555 | 27,071 | 5,514 | 23,472 | ||||||||||||
Less: | ||||||||||||||||
Waiver of investment advisory fees | (111) | (1,400) | (304) | (3,817) | ||||||||||||
Fees paid indirectly | – | (6) | – | – | ||||||||||||
Net Expenses | 35,444 | 25,665 | 5,210 | 19,655 | ||||||||||||
Net Investment Income | 38,810 | 8,804 | 4,946 | 76,337 | ||||||||||||
Net Realized Gain (Loss) on: | ||||||||||||||||
Investments | (79,685) | (78,102) | 7,415 | 5,256 | ||||||||||||
Futures contracts | (10,073) | – | 1,261 | (1,249) | ||||||||||||
Swap contracts | – | – | (2,969) | (9,765) | ||||||||||||
Purchased and written options | – | – | (15) | – | ||||||||||||
Foreign currency transactions | (1,906) | (1,081) | (16,154) | (76,847) | ||||||||||||
Net Change in Unrealized Appreciation (Depreciation) on: | ||||||||||||||||
Investments | 200,439 | 354,258 | 42,472 | 224,524 | ||||||||||||
Futures contracts | 2,335 | – | (327) | 351 | ||||||||||||
Swap contracts | – | – | 2,026 | 2,845 | ||||||||||||
Foreign capital gains tax on appreciated securities | 5 | (1,097) | – | – | ||||||||||||
Foreign currency translation of other assets and liabilities denominated in foreign currencies | 49 | 52 | (3,295) | (948) | ||||||||||||
Net Increase in Net Assets Resulting from Operations | $ | 149,974 | $ | 282,834 | $ | 35,360 | $ | 220,504 | ||||||||
(1) See Note 5 in the Notes to Financial Statements for additional information.
(2) Income is from the investment of collateral in an affiliated security.
Amounts designated as “–” are $0 or have been rounded to $0.
The accompanying notes are an integral part of the financial statements.
SEI Institutional International Trust / Annual Report / September 30, 2016 |
65 |
STATEMENTS OF CHANGES IN NET ASSETS ($ Thousands)
For the years ended September 30,
| International Equity Fund(1) | Emerging Markets Equity Fund(1) | |||||||||||||||
| 2016 | 2015 | 2016 | 2015 | |||||||||||||
Operations: | ||||||||||||||||
Net Investment income | $ | 38,810 | $ | 29,907 | $ | 8,804 | $ | 11,695 | ||||||||
Net realized gain (loss) on investments and futures contracts | (89,758) | 69,794 | (78,102) | (42,913) | ||||||||||||
Net realized loss on forward foreign currency contracts and foreign currency transactions | (1,906) | (1,670) | (1,081) | (1,467) | ||||||||||||
Net change in unrealized appreciation (depreciation) on investments and futures contracts | 202,774 | (267,021) | 354,258 | (332,286) | ||||||||||||
Net change in unrealized appreciation (depreciation) on forward foreign currency contracts, foreign currencies and translation of other assets and liabilities denominated in foreign currencies | 49 | (103) | 52 | 18 | ||||||||||||
Net change in unrealized appreciation (depreciation) on foreign capital tax gains on appreciated securities | 5 | – | (1,097) | 1,853 | ||||||||||||
Net Increase (Decrease) in Net Assets Resulting from Operations | 149,974 | (169,093) | 282,834 | (363,100) | ||||||||||||
Dividends and Distributions to Shareholders: | ||||||||||||||||
Net investment income: | ||||||||||||||||
Class A | (27,578) | (52,424) | (10,995) | (18,640) | ||||||||||||
Class I | (54) | (85) | N/A | N/A | ||||||||||||
Class Y | (1,652) | – | (481) | – | ||||||||||||
Total Dividends and Distributions | (29,284) | (52,509) | (11,476) | (18,640) | ||||||||||||
Capital Share Transactions: | ||||||||||||||||
Class A: | ||||||||||||||||
Proceeds from shares issued | 578,672 | 691,524 | 351,777 | 494,958 | ||||||||||||
Reinvestment of dividends & distributions | 25,415 | 48,485 | 10,181 | 17,391 | ||||||||||||
Cost of shares redeemed | (553,805) | (634,524) | (427,796) | (753,872) | ||||||||||||
Net Increase (Decrease) from Class A Transactions | 50,282 | 105,485 | (65,838) | (241,523) | ||||||||||||
Class I: | ||||||||||||||||
Proceeds from shares issued | 3,755 | 1,300 | N/A | N/A | ||||||||||||
Reinvestment of dividends & distributions | 23 | 53 | N/A | N/A | ||||||||||||
Cost of shares redeemed | (4,492) | (1,323) | N/A | N/A | ||||||||||||
Net Increase (Decrease) from Class I Transactions | (714) | 30 | N/A | N/A | ||||||||||||
Class Y: | ||||||||||||||||
Proceeds from shares issued | 59,717 | 154,735 | 31,024 | 57,875 | ||||||||||||
Reinvestment of dividends & distributions | 1,652 | – | 481 | – | ||||||||||||
Cost of shares redeemed | (32,774) | (22,503) | (18,477) | (6,060) | ||||||||||||
Net Increase from Class Y Transactions | 28,595 | 132,232 | 13,028 | 51,815 | ||||||||||||
Net Increase (Decrease) in Net Assets Derived from Capital Share Transactions | 78,163 | 237,747 | (52,810) | (189,708) | ||||||||||||
Net Increase (Decrease) in Net Assets | 198,853 | 16,145 | 218,548 | (571,448) | ||||||||||||
Net Assets: | ||||||||||||||||
Beginning of Year | 2,703,969 | 2,687,824 | 1,386,630 | 1,958,078 | ||||||||||||
End of Year | $ | 2,902,822 | $ | 2,703,969 | $ | 1,605,178 | $ | 1,386,630 | ||||||||
Undistributed Net Investment Income Included in Net Assets at End of Year | $ | 35,332 | $ | 25,838 | $ | 5,897 | $ | 6,484 | ||||||||
Capital Share Transactions: | ||||||||||||||||
Class A: | ||||||||||||||||
Shares issued | 62,276 | 70,760 | 40,420 | 49,684 | ||||||||||||
Reinvestment of distributions | 2,678 | 5,082 | 1,181 | 1,729 | ||||||||||||
Shares redeemed | (60,234) | (65,342) | (48,860) | (74,085) | ||||||||||||
Total Class A Transactions | 4,720 | 10,500 | (7,259) | (22,672) | ||||||||||||
Class I: | ||||||||||||||||
Shares issued | 401 | 134 | N/A | N/A | ||||||||||||
Reinvestment of distributions | 2 | 5 | N/A | N/A | ||||||||||||
Shares redeemed | (491) | (136) | N/A | N/A | ||||||||||||
Total Class I Transactions | (88) | 3 | N/A | N/A | ||||||||||||
Class Y: | ||||||||||||||||
Shares issued | 6,756 | 16,463 | 3,926 | 5,824 | ||||||||||||
Reinvestment of distributions | 174 | – | 56 | – | ||||||||||||
Shares redeemed | (3,548) | (2,254) | (2,044) | (616) | ||||||||||||
Total Class Y Transactions | 3,382 | 14,209 | 1,938 | 5,208 | ||||||||||||
Net Increase (Decrease) in Shares Outstanding from Share Transactions | 8,014 | 24,712 | (5,321) | (17,464) | ||||||||||||
(1) Class Y shares of the Fund commenced operations on December 31, 2014.
N/A – Not applicable. Share classes currently not offered.
Amounts designated as “–” are $0 or have been rounded to $0.
The accompanying notes are an integral part of the financial statements.
66 |
SEI Institutional International Trust / Annual Report / September 30, 2016 |
| International Fixed Income Fund(1) | Emerging Markets Debt Fund(2) | |||||||||||||||
| 2016 | 2015 | 2016 | 2015 | |||||||||||||
Operations: | ||||||||||||||||
Net Investment Income | $ | 4,946 | $ | 5,222 | $ | 76,337 | $ | 67,633 | ||||||||
Net Realized Gain (Loss) on Investments, Futures Contracts and Swap Contracts | 5,692 | (403) | (5,758) | (29,296) | ||||||||||||
Net Realized Gain (Loss) on Forward Foreign Currency Contracts and Foreign Currency Transactions | (16,154) | 40,448 | (76,847) | (56,413) | ||||||||||||
Net Change in Unrealized Appreciation (Depreciation) on Investments, Futures Contracts and Swap Contracts | 44,171 | (23,230) | 227,720 | (173,772) | ||||||||||||
Net Change in Unrealized Depreciation on Forward Foreign Currency Contracts, Foreign Currencies and Translation of Other Assets and Liabilities Denominated in Foreign Currencies | (3,295) | (11,844) | (948) | (2,079) | ||||||||||||
Net Increase (Decrease) in Net Assets Resulting from Operations | 35,360 | 10,193 | 220,504 | (193,927) | ||||||||||||
Dividends and Distributions to Shareholders: | ||||||||||||||||
Net Investment Income: | ||||||||||||||||
Class A | (27,071) | (38,714) | – | (25,714) | ||||||||||||
Class Y | (1) | – | – | (441) | ||||||||||||
Net Realized Gains: | ||||||||||||||||
Class A | (812) | – | – | (1,398) | ||||||||||||
Class Y | – | – | – | – | ||||||||||||
Total Dividends and Distributions | (27,884) | (38,714) | – | (27,553) | ||||||||||||
Capital Share Transactions: | ||||||||||||||||
Class A: | ||||||||||||||||
Proceeds from Shares Issued | 102,110 | 116,276 | 381,535 | 466,451 | ||||||||||||
Reinvestment of Dividends & Distributions | 25,432 | 34,693 | – | 24,076 | ||||||||||||
Cost of Shares Redeemed | (133,070) | (150,275) | (360,386) | (395,413) | ||||||||||||
Net Increase (Decrease) from Class A Transactions | (5,528) | 694 | 21,149 | 95,114 | ||||||||||||
Class Y: | ||||||||||||||||
Proceeds from Shares Issued | 17,670 | – | 29,615 | 94,421 | ||||||||||||
Reinvestment of Dividends & Distributions | – | – | – | 441 | ||||||||||||
Cost of Shares Redeemed | (5,517) | – | (23,066) | (8,277) | ||||||||||||
Net Increase from Class Y Transactions | 12,153 | – | 6,549 | 86,585 | ||||||||||||
Net Increase in Net Assets derived from Capital Share Transactions | 6,625 | 694 | 27,698 | 181,699 | ||||||||||||
Net Increase (Decrease) in Net Assets | 14,101 | (27,827) | 248,202 | (39,781) | ||||||||||||
Net Assets: | ||||||||||||||||
Beginning of Year | 495,957 | 523,784 | 1,305,950 | 1,345,731 | ||||||||||||
End of Year | $ | 510,058 | $ | 495,957 | $ | 1,554,152 | $ | 1,305,950 | ||||||||
Undistributed (Distributions in Excess of) Net Investment Income (Accumulated Net Investment Loss) Included in Net Assets at End of Year | $ | (16,951) | $ | 19,687 | $ | (27,958) | $ | (26,663) | ||||||||
Capital Share Transactions: | ||||||||||||||||
Class A: | ||||||||||||||||
Shares Issued | 9,984 | 10,971 | 41,702 | 48,643 | ||||||||||||
Reinvestment of Distributions | 2,578 | 3,346 | – | 2,455 | ||||||||||||
Shares Redeemed | (13,033) | (14,238) | (39,212) | (41,303) | ||||||||||||
Total Class A Transactions | (471) | 79 | 2,490 | 9,795 | ||||||||||||
Class Y: | ||||||||||||||||
Shares Issued | 1,784 | – | 3,391 | 9,882 | ||||||||||||
Reinvestment of Distributions | – | – | – | 47 | ||||||||||||
Shares Redeemed | (556) | – | (2,494) | (892) | ||||||||||||
Total Class Y Transactions | 1,228 | – | 897 | 9,037 | ||||||||||||
Net Increase in Shares Outstanding from Share Transactions | 757 | 79 | 3,387 | 18,832 | ||||||||||||
(1) Class Y shares of the Fund commenced operations on October 30, 2015.
(2) Class Y shares of the Fund commenced operations on December 31, 2014.
N/A – Not applicable. Share classes currently not offered.
Amounts designated as “–” are $0 or have been rounded to $0.
The accompanying notes are an integral part of the financial statements.
SEI Institutional International Trust / Annual Report / September 30, 2016 |
67 |
For the years or period ended September 30
For a Share Outstanding Throughout Each Year or Period
Net ning of | Net ment | Net lized on ments(1) | Total from | Dividends ment | Distri- butions | Total butions | Net Asset Value, End of Period | Total Return† | Net Assets Period | Ratio of Net Expenses to Average Net Assets* | Ratio of Expenses to Average Net Assets (Excluding Fees Paid Indirectly and Including Waivers)** | Ratio of Expenses to Average Net Assets (Excluding Fees Paid Indirectly and Waivers)** | Ratio of ment | Portfolio Turnover Rate† | ||||||||||||||||||||||||||||||||||||||||||||||
International Equity Fund |
| |||||||||||||||||||||||||||||||||||||||||||||||||||||||||||
Class A | ||||||||||||||||||||||||||||||||||||||||||||||||||||||||||||
2016 | $9.16 | $0.13 | $0.39 | $0.52 | $(0.10) | $ – | $(0.10) | $9.58 | 5.63 | % | $ | 2,729,762 | 1.27%(2)(3) | 1.27%(2)(3) | 1.28%(2)(3) | 1.36% | 45% | |||||||||||||||||||||||||||||||||||||||||||
2015 | 9.94 | 0.10 | (0.69) | (0.59) | (0.19) | – | (0.19) | 9.16 | (5.98 | ) | 2,568,634 | 1.24(2) | 1.24(2) | 1.24(2) | 1.04 | 68 | ||||||||||||||||||||||||||||||||||||||||||||
2014 | 9.71 | 0.18 | 0.18 | 0.36 | (0.13) | – | (0.13) | 9.94 | 3.66 | 2,682,482 | 1.24(2) | 1.24(2) | 1.24(2) | 1.78 | 60 | |||||||||||||||||||||||||||||||||||||||||||||
2013 | 8.19 | 0.13 | 1.53 | 1.66 | (0.14) | – | (0.14) | 9.71 | 20.47 | 2,350,201 | 1.25(2) | 1.25(2) | 1.25(2) | 1.50 | 47 | |||||||||||||||||||||||||||||||||||||||||||||
2012 | 7.29 | 0.14 | 0.92 | 1.06 | (0.16) | – | (0.16) | 8.19 | 14.76 | 1,842,851 | 1.26(2) | 1.26(2) | 1.26(2) | 1.75 | 56 | |||||||||||||||||||||||||||||||||||||||||||||
Class I | ||||||||||||||||||||||||||||||||||||||||||||||||||||||||||||
2016 | $9.15 | $0.10 | $0.38 | $0.48 | $(0.08) | $ – | $(0.08) | $9.55 | 5.27 | % | $ | 4,341 | 1.52%(3)(4) | 1.52%(3)(4) | 1.52%(3)(4) | 1.09% | 45% | |||||||||||||||||||||||||||||||||||||||||||
2015 | 9.92 | 0.08 | (0.69) | (0.61) | (0.16) | – | (0.16) | 9.15 | (6.18 | ) | 4,956 | 1.49(4) | 1.49(4) | 1.49(4) | 0.76 | 68 | ||||||||||||||||||||||||||||||||||||||||||||
2014 | 9.70 | 0.15 | 0.17 | 0.32 | (0.10) | – | (0.10) | 9.92 | 3.33 | 5,342 | 1.49(4) | 1.49(4) | 1.49(4) | 1.48 | 60 | |||||||||||||||||||||||||||||||||||||||||||||
2013 | 8.18 | 0.11 | 1.52 | 1.63 | (0.11) | – | (0.11) | 9.70 | 20.19 | 5,953 | 1.50(4) | 1.50(4) | 1.50(4) | 1.21 | 47 | |||||||||||||||||||||||||||||||||||||||||||||
2012 | 7.28 | 0.12 | 0.91 | 1.03 | (0.13) | – | (0.13) | 8.18 | 14.37 | 5,271 | 1.51(4) | 1.51(4) | 1.51(4) | 1.48 | 56 | |||||||||||||||||||||||||||||||||||||||||||||
Class Y | ||||||||||||||||||||||||||||||||||||||||||||||||||||||||||||
2016 | $9.18 | $0.16 | $0.37 | $0.53 | $(0.12) | $ – | $(0.12) | $9.59 | 5.77 | % | $ | 168,719 | 1.02%(3)(5) | 1.02%(3)(5) | 1.03%(3)(5) | 1.70% | 45% | |||||||||||||||||||||||||||||||||||||||||||
2015(6) | 9.39 | 0.13 | (0.34) | (0.21) | – | – | – | 9.18 | (2.24 | ) | 130,379 | 1.00(5) | 1.00(5) | 1.00(5) | 1.72 | 68 | ||||||||||||||||||||||||||||||||||||||||||||
Emerging Markets Equity Fund |
| |||||||||||||||||||||||||||||||||||||||||||||||||||||||||||
Class A | ||||||||||||||||||||||||||||||||||||||||||||||||||||||||||||
2016 | $8.43 | $0.05 | $1.68 | $1.73 | $(0.07) | $ – | $(0.07) | $10.09 | 20.66 | % | $ | 1,532,960 | 1.76%(3)(7) | 1.76%(3)(7) | 1.86%(3)(8) | 0.59% | 79% | |||||||||||||||||||||||||||||||||||||||||||
2015 | 10.76 | 0.07 | (2.29) | (2.22) | (0.11) | – | (0.11) | 8.43 | (20.78 | ) | 1,342,618 | 1.72(7) | 1.72(7) | 1.82(8) | 0.67 | 67 | ||||||||||||||||||||||||||||||||||||||||||||
2014 | 10.53 | 0.06 | 0.22 | 0.28 | (0.05) | – | (0.05) | 10.76 | 2.68 | 1,958,078 | 1.96(7) | 1.96(7) | 2.02(8) | 0.58 | 59 | |||||||||||||||||||||||||||||||||||||||||||||
2013 | 10.25 | 0.06 | 0.28 | 0.34 | (0.06) | – | (0.06) | 10.53 | 3.29 | 1,413,683 | 1.96(7) | 1.96(7) | 2.04(8) | 0.52 | 78 | |||||||||||||||||||||||||||||||||||||||||||||
2012 | 9.00 | 0.05 | 1.23 | 1.28 | (0.03) | – | (0.03) | 10.25 | 14.21 | 899,730 | 1.97(7) | 1.97(7) | 2.07(8) | 0.49 | 93 | |||||||||||||||||||||||||||||||||||||||||||||
Class Y | ||||||||||||||||||||||||||||||||||||||||||||||||||||||||||||
2016 | $8.45 | $0.09 | $1.66 | $1.75 | $(0.09) | $ – | $(0.09) | $10.11 | 20.95 | % | $ | 72,218 | 1.52%(3)(9) | 1.52%(3)(9) | 1.62%(3)(10) | 0.96% | 79% | |||||||||||||||||||||||||||||||||||||||||||
2015(6) | 10.08 | 0.10 | (1.73) | (1.63) | – | – | – | 8.45 | (16.17 | ) | 44,012 | 1.47(9) | 1.47(9) | 1.57(10) | 1.33 | 67 | ||||||||||||||||||||||||||||||||||||||||||||
International Fixed Income Fund |
| |||||||||||||||||||||||||||||||||||||||||||||||||||||||||||
Class A | ||||||||||||||||||||||||||||||||||||||||||||||||||||||||||||
2016 | $10.38 | $0.10 | $0.62 | $0.72 | $(0.57) | $(0.02) | $(0.59) | $10.51 | 7.32 | % | $ | 497,157 | 1.05%(3)(11) | 1.05%(3)(11) | 1.11%(3)(12) | 0.98% | 106% | |||||||||||||||||||||||||||||||||||||||||||
2015 | 10.98 | 0.11 | 0.11 | 0.22 | (0.82) | – | (0.82) | 10.38 | 2.02 | 495,957 | 1.02(11) | 1.02(11) | 1.07(12) | 1.00 | 78 | |||||||||||||||||||||||||||||||||||||||||||||
2014 | 10.42 | 0.14 | 0.48 | 0.62 | (0.06) | – | (0.06) | 10.98 | 5.96 | 523,784 | 1.02(11) | 1.02(11) | 1.20(12) | 1.32 | 104 | |||||||||||||||||||||||||||||||||||||||||||||
2013 | 10.82 | 0.14 | (0.06) | 0.08 | (0.48)(13) | – | (0.48) | 10.42 | 0.77 | 473,382 | 1.02(11) | 1.02(11) | 1.20(12) | 1.37 | 86 | |||||||||||||||||||||||||||||||||||||||||||||
2012 | 10.44 | 0.17 | 0.48 | 0.65 | (0.27) | – | (0.27) | 10.82 | 6.34 | 491,793 | 1.02(11) | 1.02(11) | 1.21(12) | 1.60 | 103 | |||||||||||||||||||||||||||||||||||||||||||||
Class Y | ||||||||||||||||||||||||||||||||||||||||||||||||||||||||||||
2016(14) | $10.45 | $0.12 | $0.55 | $0.67 | $(0.60) | $(0.02) | $(0.62) | $10.50 | 6.79 | % | $ | 12,901 | 0.80%(3)(15) | 0.80%(3)(15) | 0.87%(3)(16) | 1.23% | 106% | |||||||||||||||||||||||||||||||||||||||||||
Emerging Markets Debt Fund |
| |||||||||||||||||||||||||||||||||||||||||||||||||||||||||||
Class A | ||||||||||||||||||||||||||||||||||||||||||||||||||||||||||||
2016 | $8.66 | $0.49 | $0.93 | $1.42 | $ – | $ – | $ – | $10.08 | 16.40 | % | $ | 1,453,586 | 1.39%(3)(17) | 1.39%(3)(17) | 1.65%(3)(18) | 5.30% | 86% | |||||||||||||||||||||||||||||||||||||||||||
2015 | 10.20 | 0.47 | (1.81) | (1.34) | (0.19) | (0.01) | (0.20) | 8.66 | (13.35 | ) | 1,227,567 | 1.36(17) | 1.36(17) | 1.61(18) | 4.91 | 71 | ||||||||||||||||||||||||||||||||||||||||||||
2014 | 10.38 | 0.49 | (0.29) | 0.20 | (0.31) | (0.07) | (0.38) | 10.20 | 1.90 | 1,345,731 | 1.36(17) | 1.36(17) | 1.80(18) | 4.73 | 92 | |||||||||||||||||||||||||||||||||||||||||||||
2013 | 12.07 | 0.47 | (1.02) | (0.55) | (0.68) | (0.46) | (1.14) | 10.38 | (5.19 | ) | 1,182,296 | 1.36(17) | 1.36(17) | 1.81(18) | 4.20 | 90 | ||||||||||||||||||||||||||||||||||||||||||||
2012 | 10.81 | 0.55 | 1.36 | 1.91 | (0.63) | (0.02) | (0.65) | 12.07 | 18.48 | 1,165,102 | 1.36(17) | 1.36(17) | 1.80(18) | 4.85 | 102 | |||||||||||||||||||||||||||||||||||||||||||||
Class Y | ||||||||||||||||||||||||||||||||||||||||||||||||||||||||||||
2016 | $8.67 | $0.52 | $0.93 | $1.45 | $ – | $ – | $ – | $10.12 | 16.72 | % | $ | 100,566 | 1.14%(3)(19) | 1.14%(3)(19) | 1.40%(3)(20) | 5.55% | 86% | |||||||||||||||||||||||||||||||||||||||||||
2015(6) | 9.63 | 0.37 | (1.28) | (0.91) | (0.05) | – | (0.05) | 8.67 | (9.48 | ) | 78,383 | 1.11(19) | 1.11(19) | 1.36(20) | 5.24 | 71 | ||||||||||||||||||||||||||||||||||||||||||||
| † | Returns do not reflect the deduction of taxes that a shareholder would pay on fund distributions or the redemption of fund shares. |
| * | Includes Fees Paid Indirectly, if applicable. See Note 5 in Notes to Financial Statements |
| ** | See Note 5 in Notes to Financial Statements. |
| (1) | Per share net investment income and net realized and unrealized gains (losses) calculated using average shares. |
| (2) | The expense ratio includes overdraft fees. Had this expense been excluded the ratios would have been 1.27%, 1.24%, 1.24%, 1.25% and 1.26% for 2016, 2015, 2014, 2013 and 2012. |
| (3) | The expense ratio includes proxy expenses outside the cap. |
| (4) | The expense ratio includes overdraft fees. Had this expense been excluded the ratios would have been 1.52%, 1.49%, 1.49%, 1.50% and 1.51% for 2016, 2015, 2014, 2013 and 2012. |
| (5) | The expense ratio includes overdraft fees. Had this expense been excluded the ratios would have been 1.02% and 0.99% for 2016 and 2015. |
| (6) | Commenced operations on December 31, 2014. All ratios for the period have been annualized. |
| (7) | The expense ratio includes overdraft fees. Had this expense been excluded the ratios would have been 1.76%, 1.71%, 1.96%, 1.96% and 1.96% for 2016, 2015, 2014, 2013 and 2012. |
| (8) | The expense ratio includes overdraft fees. Had this expense been excluded the ratios would have been 1.86%, 1.81%, 2.02%, 2.04% and 2.06% for 2016, 2015, 2014, 2013 and 2012. |
68 |
SEI Institutional International Trust / Annual Report / September 30, 2016 |
| (9) | The expense ratio includes overdraft fees. Had this expense been excluded the ratios would have been 1.52% and 1.46% for 2016 and 2015. |
| (10) | The expense ratio includes overdraft fees. Had this expense been excluded the ratios would have been 1.62% and 1.46% for 2016 and 2015. |
| (11) | The expense ratio includes overdraft fees. Had this expense been excluded the ratios would have been 1.05%, 1.02%, 1.02%, 1.02% and 1.02% for 2016, 2015, 2014, 2013 and 2012. |
| (12) | The expense ratio includes overdraft fees. Had this expense been excluded the ratios would have been 1.11%, 1.07%, 1.20%, 1.20% and 1.20% for 2016, 2015, 2014, 2013 and 2012. |
| (13) | Includes a return of capital of $0.09 per share. |
| (14) | Commenced operations on October 30, 2015. All ratios for the period have been annualized. |
| (15) | The expense ratio includes overdraft fees. Had this expense been excluded the ratios would have been 0.80% for 2016. |
| (16) | The expense ratio includes overdraft fees. Had this expense been excluded the ratios would have been 0.87% for 2016. |
| (17) | The expense ratio includes overdraft fees. Had this expense been excluded the ratios would have been 1.39%, 1.36%, 1.36%, 1.36% and 1.36% for 2016, 2015, 2014, 2013 and 2012. |
| (18) | The expense ratio includes overdraft fees. Had this expense been excluded the ratios would have been 1.65%, 1.61%, 1.80%, 1.81% and 1.80% for 2016, 2015, 2014, 2013 and 2012. |
| (19) | The expense ratio includes overdraft fees. Had this expense been excluded the ratios would have been 1.14% and 1.11% for 2016 and 2015. |
| (20) | The expense ratio includes overdraft fees. Had this expense been excluded the ratios would have been 1.40% and 1.36% for 2016 and 2015. |
| Amounts | designated as “—” are either $0 or have been rounded to $0. |
The accompanying notes are an integral part of the financial statements
SEI Institutional International Trust / Annual Report / September 30, 2016 |
69 |
September 30, 2016
1. ORGANIZATION
SEI Institutional International Trust (the “Trust”) was organized as a Massachusetts business trust under a Declaration of Trust dated June 30, 1988.
The Trust is registered under the Investment Company Act of 1940, as amended, as an open-end investment company with four funds: International Equity Fund, Emerging Markets Equity Fund, International Fixed Income Fund and Emerging Markets Debt Fund (together the “Funds”) each of which are diversified Funds with the exception of the International Fixed Income Fund and the Emerging Markets Debt Fund. The Trust’s prospectuses provide a description of each Fund’s investment goal, principal strategies and risks. The Trust is registered to offer Class A and Class Y shares of each of the Funds and Class I shares of the International Equity Fund.
2. SIGNIFICANT ACCOUNTING POLICIES
The following is a summary of significant accounting policies consistently followed by the Funds.
Use of Estimates — The Funds are investment companies in conformity with accounting principles generally accepted in the United States of America (“U.S. GAAP”). Therefore, the Funds follow the accounting and reporting guidelines for investment companies. The preparation of financial statements, in conformity with U.S. GAAP requires management to make estimates and assumptions that affect the reported amounts of assets and liabilities and disclosure of contingent assets and liabilities as of the date of the financial statements and the reported amounts of increases and decreases in net assets from operations during the reporting period. Actual results could differ from those estimates.
Security Valuation — Securities listed on a securities exchange, market or automated quotation system for which quotations are readily available (other than securities traded on National Association of Securities Dealers Automated Quotations (NASDAQ) or as otherwise noted below) at the last quoted sale price on an exchange or market (foreign or domestic) on which the securities are traded, or, if there is no such reported sale, at the most recent quoted bid price. The Funds value securities traded on NASDAQ at the NASDAQ Official Closing Price. If available, debt securities, swaps (which are not centrally cleared), bank loans or collateralized debt obligations (including collateralized loan obligations), such as those held by the Funds, are priced based upon valuations provided by independent, third-party pricing agents. Such values generally reflect the last reported sales price if the security is actively traded. The third-party pricing agents may also value debt securities at an evaluated bid price by employing
methodologies that utilize actual market transactions, broker-supplied valuations or other methodologies designed to identify the market value for such securities. Redeemable securities issued by open-end investment companies are valued at the investment company’s applicable net asset value, with the exception of ETFs, which are priced as equity securities. The prices of foreign securities are reported in local currency and converted to U.S. dollars using currency exchange rates. If a security’s price cannot be obtained, as noted above, the Funds will value the securities using a bid price from at least one independent broker. If such prices are not readily available or cannot be valued using the methodologies described above, the Funds will value the security using the Funds’ Fair Value Pricing Policies and Procedures (“Fair Value Procedures”), as described below.
On the first day a new debt security purchase is recorded, if a price is not available from a third-party pricing agent or an independent broker, the security may be valued at its purchase price. Each day thereafter, the debt security will be valued according to the Funds’ Fair Value Procedures until a price from an independent source can be secured. Securities held by a Fund with remaining maturities of 60 days or less may be valued by the amortized cost method, which involves valuing a security at its cost on the date of purchase and thereafter (absent unusual circumstances) assuming a constant amortization to maturity of any discount or premium, regardless of the impact of fluctuations in general market rates of interest on the value of the instrument. While this method provides certainty in valuation, it may result in periods during which value, as determined by this method, is higher or lower than the price a Fund would receive if it sold the instrument. Further, the value of securities in the Fund can be expected to vary inversely with changes in prevailing interest rates. Should existing credit, liquidity or interest rate conditions in the relevant markets and issuer-specific circumstances suggest that amortized cost does not approximate fair value, then the amortized cost method may not be used.
Futures and swaps cleared through a central clearing house (“centrally cleared swaps”) are valued at the settlement price established each day by the board of exchange on which they are traded. The daily settlement prices for financial futures and centrally cleared swaps are provided by an independent source. On days when there is excessive volume, market volatility or the future or centrally cleared swap does not end trading by the time a Fund calculates its NAV, the settlement price may not be available at the time at which the Fund calculates its NAV. On such days, the best available price (which
70 |
SEI Insititution International Trust / Annual Report / September 30, 2016 |
is typically the last sales price) may be used to value a Fund’s futures or centrally cleared swaps position.
Foreign currency forward contracts are valued at the current day’s interpolated foreign exchange rate, as calculated using the current day’s spot rate, and the thirty, sixty, ninety and one-hundred eighty day forward rates provided by an independent source.
Prices for most securities held by a Fund are provided daily by third-party independent pricing agents. SEI Investments Management Corporation (“SIMC”) or a Sub-Adviser (“Sub-Adviser”), as applicable, reasonably believes that prices provided by independent pricing agents are reliable. However, there can be no assurance that such pricing service’s prices will be reliable. SIMC or a Sub-Adviser, as applicable, will continuously monitor the reliability of prices obtained from any pricing service and shall promptly notify the Funds’ administrator if it believes that a particular pricing service is no longer a reliable source of prices. The Funds’ administrator, in turn, will notify the Fair Value Pricing Committee (the “Committee”) if it receives such notification from SIMC or a Sub-Adviser, as applicable, or if the Funds’ administrator reasonably believes that a particular pricing service is no longer a reliable source for prices.
The Funds’ Fair Value Procedures provide that any change in a primary pricing agent or a pricing methodology requires prior approval by the Board of Trustees (“Board”) or its designated sub-committee. However, when the change would not materially affect valuation of a Fund’s net assets or involve a material departure in pricing methodology from that of the Fund’s existing pricing agent or pricing methodology, approval may be obtained at the next regularly scheduled meeting of the Board.
Securities for which market prices are not readily available, for which market prices are determined to be unreliable, or which cannot be valued using the methodologies described above are valued in accordance with the Fair Value Procedures established by the Board. The Funds’ Fair Value Procedures are implemented through the Committee designated by the Board. The Committee is currently composed of two members of the Board, as well as representatives from SIMC and its affiliates. Some of the more common reasons that may necessitate that a security be valued using Fair Value Procedures include: (i) the security’s trading has been halted or suspended, (ii) the security has been delisted from a national exchange, (iii) the security’s primary trading market is temporarily closed at a time when under normal conditions it would be open, or (iv) the security’s primary pricing source is not able or willing to provide a price. When a security is valued in accordance with the Fair Value Procedures,
the Committee will determine the value after taking into consideration relevant information reasonably available to the Committee. Examples of factors the Committee may consider include: (i) the facts giving rise to the need to fair value, (ii) the last trade price, (iii) the performance of the market or the issuer’s industry, (iv) the liquidity of the security, (v) the size of the holding in a Fund, or (vi) any other appropriate information.
The determination of a security’s fair value price often involves the consideration of a number of subjective factors, and is therefore subject to the unavoidable risk that the value assigned to a security may be higher or lower than the security’s value would be if a reliable market quotation for the security was readily available.
For securities that principally trade on a foreign market or exchange, a significant gap in time can exist between the time of a particular security’s last trade and the time at which a Fund calculates its Net Asset Value (“NAV”). The closing prices of such securities may no longer reflect their market value at the time a Fund calculates NAV if an event that could materially affect the value of those securities (a “Significant Event”), including substantial fluctuations in domestic or foreign markets or occurrences not tied directly to the securities markets, such as natural disasters, armed conflicts or significant governmental actions, has occurred between the time of the security’s last close and the time that the Fund calculates NAV. A Fund may invest in securities that are primarily listed on foreign exchanges that trade on weekends or other days when the Fund does not price its shares. As a result, the NAV of the Fund’s shares may change on days when shareholders will not be able to purchase or redeem Fund shares.
A Significant Event may relate to a single issuer or to an entire market sector. If SIMC or a Sub-Adviser becomes aware of a Significant Event that has occurred with respect to a security or group of securities after the closing of the exchange or market on which the security or securities principally trade, but before the time at which the Funds calculate NAV, it may request that a Committee meeting be called. In addition, the Funds use several processes, with respect to certain securities to monitor the pricing data supplied by various sources, including price comparisons and price movements. Any identified discrepancies are researched and subject to the procedures described above.
The International Equity Fund and Emerging Markets Equity Fund also use a third-party fair valuation vendor. The vendor provides a fair value for foreign securities held by these Funds based on certain factors and methodologies (involving, generally, tracking valuation correlations between the U.S. market and each non-U.S. security). Values from the fair value vendor are
SEI Insititution International Trust / Annual Report / September 30, 2016 |
71 |
NOTES TO FINANCIAL STATEMENTS (Continued)
September 30, 2016
applied in the event that there is a movement in the U.S. market that exceeds a specific threshold that has been established by the Committee. The Committee has also established a “confidence interval” which is used to determine the level of historical correlation between the value of a specific foreign security and movements in the U.S. market before a particular security will be fair valued when the threshold is exceeded. In the event that the threshold established by the Committee is exceeded on a specific day, the International Equity Fund and Emerging Markets Equity Fund will value the non-U.S. securities in their portfolios that exceed the applicable “confidence interval” based upon the adjusted prices provided by the fair valuation vendor.
In accordance with U.S. GAAP, fair value is defined as the price that the Fund would receive upon selling an investment in an orderly transaction to an independent buyer in the principal or most advantageous market of the investment. A three-tier hierarchy has been established to maximize the use of the observable market data and minimize the use of unobservable inputs and to establish classification of the fair value measurements for disclosure purposes. Inputs refer broadly to the assumptions that market participants would use in pricing an asset. Inputs may be observable or unobservable. Observable inputs are inputs that reflect the assumptions market participants would use in pricing the asset or liability developed based on market data obtained from sources independent of the reporting entity. Unobservable inputs are inputs that reflect the reporting entity’s own assumptions about the assumptions market participants would use in pricing the asset or liability developed based on the best information available in the circumstances.
The three-tier hierarchy of inputs is summarized in the three broad Levels listed below:
Level 1 — quoted prices in active markets for identical investments
Level 2 — other significant observable inputs (including quoted prices for similar investments, interest rates, prepayment speeds, credit risks, etc.)
Level 3 — significant unobservable inputs (including the Fund’s own assumptions in determining the fair value of investments)
Investments are classified within the level of the lowest significant input considered in determining fair value. Investments classified within Level 3 whose fair value measurement considers several inputs may include Level 1 or Level 2 inputs as components of the overall fair value measurement.
The valuation techniques used by the Funds to measure fair value during the year ended September 30, 2016 maximized the use of observable inputs and minimized the use of unobservable inputs.
For the year ended September 30, 2016, there have been no significant changes to the inputs or the Trust’s fair valuation methodologies.
Security Transactions and Investment Income — Security transactions are recorded on the trade date. Cost used in determining net realized capital gains and losses on the sale of securities is determined on the basis of specific identification. Dividend income and expense is recognized on the ex-dividend date, and interest income or expense is recognized using the accrual basis of accounting.
Distributions received on securities that represent a return of capital or capital gain are recorded as a reduction of cost of investments and/ or as a realized gain. The Trust estimates the components of distributions received that may be considered nontaxable distributions or capital gain distributions.
Amortization and accretion is calculated using the scientific interest method, which is not materially different from the effective interest method. Amortization of premiums and discounts is included in interest income.
Expenses — Expenses that are directly related to one of the Funds are charged directly to that Fund. Other operating expenses of the Trust are prorated to the Funds on the basis of relative daily net assets.
Classes —Class-specific expenses are borne by that class. Income, non-class specific expenses, and realized and unrealized gains/losses are allocated to the respective classes on the basis of relative daily net assets.
Foreign Currency Translation — The books and records of the Funds investing in international securities are maintained in U.S. dollars on the following basis:
(i) market value of investment securities, assets and liabilities at the current rate of exchange; and
(ii) purchases and sales of investment securities, income and expenses at the relevant rates of exchange prevailing on the respective dates of such transactions.
The Funds do not isolate that portion of gains and losses on investments in equity securities that is due to changes in the foreign exchange rates from that which is due to changes in market prices of equity securities.
The Funds report certain foreign-currency-related transactions as components of realized gains for financial reporting purposes, whereas such components
72 |
SEI Insititution International Trust / Annual Report / September 30, 2016 |
are treated as ordinary income for Federal income tax purposes.
Forward Foreign Currency Contracts — To the extent consistent with its investment objective and strategies, a Fund may enter into forward foreign currency contracts as hedges against either specific transactions, fund positions, speculative purposes or anticipated fund positions. All commitments are “marked-to-market” daily at the applicable foreign exchange rate, and any resulting unrealized gains or losses are recorded currently. The Fund realizes gains and losses at the time forward contracts are extinguished. Unrealized gains or losses on outstanding positions in forward foreign currency contracts held at the close of the year are recognized as ordinary income or loss for federal income tax purposes. The Fund could be exposed to risk if the counterparties to the contracts are unable to meet the terms of the contract and from unanticipated movements in the value of a foreign currency relative to the U.S. dollar.
Finally, the risk exists that losses could exceed amounts disclosed on the Statement of Assets and Liabilities. Refer to each Fund’s Schedule of Investments for details regarding open forward foreign currency contracts as of September 30, 2016, if applicable.
Futures Contracts — To the extent consistent with its investment objective and strategies, the Funds may purchase futures contracts to gain exposure to market changes, which may be more efficient or cost effective than actually buying the securities. To the extent consistent with its investment objective and strategies, a Fund may utilize futures contracts for tactical hedging purposes as well as to enhance the Funds’ returns and may also utilize futures contracts to efficiently assist in managing the Funds’ duration and yield curve exposure. Upon entering into such a contract, a Fund is required to deposit and maintain as collateral such initial margin as required by the exchange on which the contract is held. The contracts are marked to market daily and the resulting changes in value are accounted for as unrealized gains and losses. Variation margin payments are paid or received, depending upon whether unrealized losses or gains are incurred. When the contract is closed, the Funds record a realized gain or loss equal to the difference between the proceeds from (or cost of) the closing transaction and the amount invested in the contract.
Risks of entering into futures contracts include the possibility that there will be an imperfect price correlation between the futures and the underlying securities. Second, it is possible that a lack of liquidity for futures contracts could exist in the secondary market, resulting in an inability to close a position prior to its
maturity date. Third, the futures contract involves the risk that a Fund could lose more than the original margin deposit required to initiate a futures transaction.
Finally, the risk exists that losses could exceed amounts disclosed on the Statement of Assets and Liabilities. Refer to each Fund’s Schedule of Investments for details regarding open futures contracts as of September 30, 2016, if applicable.
Options/Swaptions Written/Purchased — To the extent consistent with its Investment Objective and Strategies, a Fund may invest in financial options/swaptions contracts for the purpose of hedging its existing portfolio securities, or securities that a Fund intends to purchase, against fluctuations in fair market value caused by changes in prevailing market interest rates. A Fund may also invest in financial option/swaption contracts to enhance its returns. When the Fund writes or purchases an option/swaption, an amount equal to the premium received or paid by the Fund is recorded as a liability or an asset and is subsequently adjusted to the current market value of the option/swaption written or purchased. Premiums received or paid from writing or purchasing options/ swaptions which expire unexercised are treated by the Fund on the expiration date as realized gains or losses. The difference between the premium and the amount paid or received on effecting a closing purchase or sale transaction, including brokerage commissions, is also treated as a realized gain or loss. If an option/swaption is exercised, the premium paid or received is added to the cost of the purchase or proceeds from the sale in determining whether the Fund has realized a gain or a loss.
The risk in writing a call option/swaption is a Fund may give up the opportunity for profit if the market price of the security increases. The risk in writing a put option/ swaption is a Fund may incur a loss if the market price of the security decreases and the option/swaption is exercised. The risk in purchasing an option/swaption is a Fund may pay a premium whether or not the option/swaption is exercised. The Funds also have the additional risk of being unable to enter into a closing transaction at an acceptable price if a liquid secondary market does not exist. Option/swaption contracts also involve the risk that they may not work as intended due to unanticipated developments in market conditions or other causes.
Finally, the risk exists that losses on written options could exceed amounts disclosed on the Statements of Assets and Liabilities. Refer to each Fund’s Schedule of Investments for details regarding open option/swaption contracts as of September 30, 2016, if applicable.
SEI Insititution International Trust / Annual Report / September 30, 2016 |
73 |
NOTES TO FINANCIAL STATEMENTS (Continued)
September 30, 2016
Swap Agreements — To the extent consistent with its investment objective and strategies, a Fund may invest in swap contracts as an efficient means to take and manage risk in the portfolio, including interest rate risk, credit risk and overall yield sensitivity. A swap agreement is a two-party contract under which an agreement is made to exchange returns from predetermined investments or instruments, including a particular interest rate, foreign currency, or “basket” of securities representing a particular index. Swap agreements are privately negotiated in the over-the-counter market (“OTC swaps”) or may be executed in a multilateral or other trade facility platform, such as a registered commodities exchange (“Centrally Cleared swaps”). Interest rate swaps involve the exchange by a Fund with another party of their respective commitments to pay or receive interest (e.g., an exchange of floating rate payments for fixed rate payments) with respect to a notional amount of principal. Credit default swaps involve the periodic payment by a Fund or counterparty of interest based on a specified rate multiplied by a notional amount assigned to an underlying debt instrument or group of debt instruments in exchange for the assumption of credit risk on the same instruments. In the event of a credit event, usually in the form of a credit rating downgrade, the party receiving periodic payments (i.e. floating rate payer) must pay the other party (i.e. fixed rate payer) an amount equal to the outstanding principal of the downgraded debt instrument. Total return swaps allow an investor to benefit from the cash flow without ever actually owning the underlying security. The receiver must pay any decline in value to the payer at the end of the total return swap. However, the investor does not need to make a payment if there is no decline in price. Payments can be made on various indices, bonds (i.e. mortgage backed securities, bank debt and corporate), loans or commodities. The value of a total return swap is equal to the change in value of the underlying asset versus the accrued income payment based on LIBOR (London Interbank Offered Rate) or some other form of index on the notional amount. Interest rate swaps involve the exchange by a Fund with another party of their respective commitments to pay or receive interest (e.g., an exchange of floating rate payments for fixed rate payments) with respect to a notional amount of principal to manage a Fund’s exposure to interest rates. Payments received or made are recorded as realized gains or losses. A Fund could be exposed to credit or market risk due to unfavorable changes in the fluctuation of interest rates or if the counterparty defaults on its obligation to perform. Risk of loss may exceed amounts recognized on the statement of assets and liabilities. In connection with swap agreements, securities/cash may be set aside as collateral by the Fund’s custodian. A Fund may enter
into swap agreements in order to, among other things, change the maturity or duration of the investment portfolio; protect a Fund’s value from changes in interest rates; or expose a Fund to a different security or market.
Swaps are marked-to-market daily based upon quotations from market makers and the resulting changes in market values, if any, are recorded as unrealized gains or losses in the Statement of Operations. Centrally cleared swaps are valued at the settlement price established each day by the board of exchange on which they are traded. The daily settlement prices for centrally cleared swaps are provided by an independent source. Net payments of interest are recorded as realized gains or losses. Daily changes in valuation of Centrally Cleared swaps, if any, are recorded as a receivable or payable for the change in value as appropriate (“variation margin”) on the Statements of Assets and Liabilities.
Entering into swap agreements involves, to varying degrees, elements of credit and market risk in excess of the amounts recognized on the Schedule of Investments or the Statement of Assets and Liabilities. Such risks involve the possibility that there will be no liquid market for these agreements, that the counterparty to the agreement may default on its obligation to perform and that there may be unfavorable changes in the fluctuation of interest rates. Risks also arise from potential losses from adverse market movements.
Counterparty risk may be mitigated by having a master netting arrangement between a Fund and the counterparty and by having the counterparty post collateral to cover a Fund’s exposure to the counterparty. Refer to each Fund’s Schedule of Investments for details regarding open swap contracts as of September 30, 2016, if applicable.
Delayed Delivery Transactions — A Fund may purchase or sell securities on a when-issued or delayed delivery basis. These transactions involve a commitment by the Fund to purchase or sell securities for a predetermined price or yield, with payment and delivery taking place beyond the customary settlement period. When delayed delivery purchases are outstanding, the Fund will set aside liquid assets in an amount sufficient to meet the purchase price. When purchasing a security on a delayed delivery basis, the Fund assumes the rights and risks of ownership of the security, including the risk of price and yield fluctuations, and takes such fluctuations into account when determining its net asset value. The Fund may dispose of or renegotiate a delayed delivery transaction after it is entered into, and may sell when-issued securities before they are delivered, which may result in a capital gain or loss. When the Fund has sold a security on a delayed delivery basis, the Fund does not
74 |
SEI Insititution International Trust / Annual Report / September 30, 2016 |
participate in future gains and losses with respect to the security.
Loan Participations and Brady Bonds — To the extent consistent with its investment objective and strategies, a Fund may invest in U.S. dollar-denominated fixed- and floating-rate loans (“Loans”) arranged through private negotiations between a foreign sovereign entity and one or more financial institutions (“Lenders”). The Fund invests in such Loans in the form of participations in Loans (“Participations”) or assignments of all or a portion of Loans from third parties. Participations typically result in a Fund having a contractual relationship only with the Lenders, not with the sovereign borrowers. The Fund has the right to receive payments of principal, interest and any fees to which it is entitled from the Lender selling the Participation and only upon receipt by the Lender of the payments from the borrower. In connection with purchasing Participations, the Fund generally has no right to enforce compliance by the borrower with the terms of the loan agreement relating to the Loan, nor any rights of set-off against the borrower, and the Fund will not benefit directly from any collateral supporting the Loan in which it has purchased the Participation. As a result, the Fund assumes the credit risk of both the borrower and the Lender that is selling the Participation.
Certain debt obligations, customarily referred to as “Brady Bonds,” are created through the exchange of existing commercial bank loans to foreign entities for new obligations in connection with debt restructuring under a plan introduced by former U.S. Secretary of the Treasury Nicholas F. Brady. Brady Bonds have only been issued since 1989, and, accordingly, do not have a long payment history. They are issued by governments that may have previously defaulted on the loans being restructured by the Brady Bonds, so they are subject to the risk of default by the issuer. They may be fully or partially collateralized or uncollateralized and issued in various currencies.
Dividends and Distributions to Shareholders — The International Equity, Emerging Markets Equity and International Fixed Income Funds will distribute substantially all of their net investment income and all net realized capital gains, if any, at least annually. The Emerging Markets Debt Fund will distribute substantially all of its net investment income, if any, at least quarterly and all net realized gains, if any, at least annually. All dividends and distributions are recorded on ex-dividend date.
Investments in Real Estate Investment Trusts (“REITs”)— Dividend income is recorded based on the income included in distributions received from the REIT investments using published REIT reclassifications including management estimates when actual amounts
are not available. Distributions received in excess of this estimated amount are recorded as a reduction of the cost of investments or reclassified to capital gains. The actual amounts of income, return of capital, and capital gains are only determined by each REIT after its fiscal year-end, and may differ from the estimated amounts.
Participation Notes (P-Notes) — To the extent consistent with its Investment Objective and Strategies, a Fund may acquire P-Notes issued by participating banks or broker-dealers. P-Notes are participation interest notes that are designed to offer a return linked to a particular underlying equity, debt, currency or market. The P-Notes in which the Fund may invest will typically have a maturity of one year. When purchasing a P-Note, the posting of margin is not required because the full cost of the P-Note (plus commission) is paid at the time of purchase. When the P-Note matures, the issuer will pay to, or receive from, the purchaser the difference between the minimal value of the underlying instrument at the time of purchase and that instrument’s value at maturity. Investments in P-Notes involve the same risks associated with a direct investment in the underlying foreign companies of foreign securities markets that they seek to replicate. In addition, there can be no assurance that the trading price of P-Notes will equal the underlying value of the foreign companies or foreign securities markets that they seek to replicate. The holder of a participation note that is linked to a particular underlying security is entitled to receive any dividends paid in connection with an underlying security or instrument. However, the holder of a participation note does not receive voting rights as it would if it directly owned the underlying security or instrument. P-Notes are generally traded over-the-counter. P-Notes constitute general unsecured contractual obligations of the banks or broker-dealers that issue them and the counterparty. There is also counterparty risk associated with these investments because the Fund is relying on the creditworthiness of such counterparty and has no rights under a participation note against the issuer of the underlying security.
3. CREDIT DERIVATIVES
A Fund may use credit default swaps to reduce risk where a Fund has exposure to the issuer, or to take an active long or short position with respect to the likelihood of an event of default. The reference obligation of the swap can be a single issuer, a “basket” of issuers, or an index. The underlying referenced assets are corporate debt, sovereign debt and asset backed securities.
The buyer of a credit default swap is generally obligated to pay the seller a periodic stream of payments over the term of the contract in return for a contingent payment
SEI Insititution International Trust / Annual Report / September 30, 2016 |
75 |
NOTES TO FINANCIAL STATEMENTS (Continued)
September 30, 2016
upon the occurrence of a credit event with respect to an underlying reference obligation. Generally, a credit event for corporate or sovereign reference obligations means bankruptcy, failure to pay, obligation acceleration, repudiation/moratorium or restructuring. For credit default swaps on asset-backed securities, a credit event may be triggered by events such as failure to pay principal, maturity extension, rating downgrade or write-down.
If a Fund is a seller of protection, and a credit event occurs, as defined under the terms of that particular swap agreement, a Fund will generally either (i) pay to the buyer an amount equal to the notional amount of the swap and take delivery of the referenced obligation, other deliverable obligations, or underlying securities comprising a referenced index or (ii) pay a net settlement amount in the form of cash or securities equal to the notional amount of the swap less the recovery value of the referenced obligation or underlying securities comprising a referenced index.
If a Fund is a buyer of protection and a credit event occurs, as defined under the terms of that particular swap agreement, a Fund will either (i) receive from the seller of protection an amount equal to the notional amount of the swap and deliver the referenced obligation, other deliverable obligations or underlying securities comprising the referenced index or (ii) receive a net settlement amount in the form of cash or securities equal to the notional amount of the swap less the recovery value of the referenced obligation or underlying securities comprising the referenced index. Recovery values are assumed by market makers considering either industry standard recovery rates or entity specific factors and considerations until a credit event occurs. If a credit event has occurred, the recovery value is determined by a facilitated auction whereby a minimum number of allowable broker bids, together with a specified valuation method, are used to calculate the settlement value.
As of September 30, 2016, the International Fixed Income Fund and the Emerging Markets Debt Fund are the sellers (“providing protection”) on a total notional amount of $2.1 million and $1.2 million, respectively. The notional amounts of the swaps are not recorded in the financial statements; however the notional amounts approximate the maximum potential amount of future payments that the Fund could be required to make if the Fund was the seller of protection and a credit event were to occur. Those credit default swaps (“CDS”) for which the Funds are providing protection at balance sheet date are summarized as follows:
International Fixed Income Fund
| ||||||||||||||||||||
Written Credit Derivative Contracts | Single Name CDS | CDS Index | ||||||||||||||||||
Reference Asset | Corp US$ | Sovereign US$ | ABS US$ | Corp US$ | Total | |||||||||||||||
Fair value of written credit derivatives | $ – | $ – | $ (241,118) | $ – | $ (241,118) | |||||||||||||||
Maximum potential amount of future payments | – | – | 2,110,000 | – | 2,110,000 | |||||||||||||||
Recourse provisions with the third parties any amounts paid under the credit derivative (including any purchased credit protection)1 | – | – | – | – | – | |||||||||||||||
Collateral held by the Partnership or other third parties which the Partnership can obtain upon occurrence of triggering event | – | – | – | – | – | |||||||||||||||
| 1 | Potential recoveries would include purchased credit derivatives to the extent they offset written credit derivatives which have an identical underlying, or a netting arrangement or credit support annex with the counterparty. There may be other potential recoveries from recourse provisions where agreements cover multiple derivative arrangements but those amounts have not been included. |
| Maximum Potential Amount of Future Payments by Contract Term | ||||||||||||||||||||||||
| 0-6 Months | 6-12 Months | 1-5 Years | 5-10 Years | >10 Years | Total | |||||||||||||||||||
Current credit spread* on underlying (in basis points) | ||||||||||||||||||||||||
0-100 | $ – | $ – | $ – | $ – | $ | – | $ | – | ||||||||||||||||
>101 | – | – | – | – | 2,110,000 | 2,110,000 | ||||||||||||||||||
Total | $ – | $ – | $ – | $ – | $ | 2,110,000 | $ | 2,110,000 | ||||||||||||||||
| * | The credit spread on the underlying asset is generally indicative of the current status of the underlying risk of the Fund having to perform. The spread also reflects the cost of buying/selling protection and may include upfront payments required to be made to enter into a contract. Higher credit spreads with a shorter contract term is indicative of a higher likelihood of performance by the Fund. |
76 |
SEI Insititution International Trust / Annual Report / September 30, 2016 |
Emerging Markets Debt Fund
| ||||||||||||||||||||
Written Credit Derivative Contracts | Single Name CDS | �� CDS Index | ||||||||||||||||||
Reference Asset | Corp US$ | Sovereign US$ | ABS US$ | Corp US$ | Total | |||||||||||||||
Fair value of written credit derivatives | $ – | $ (123,393) | $ – | $ – | $ (123,393) | |||||||||||||||
Maximum potential amount of future payments | – | 1,200,000 | – | – | 1,200,000 | |||||||||||||||
Recourse provisions with the third parties any amounts paid under the credit derivative (including any purchased credit protection)1 | – | – | – | – | – | |||||||||||||||
Collateral held by the Partnership or other third parties which the Partnership can obtain upon occurrence of triggering event | – | – | – | – | – | |||||||||||||||
| 1 | Potential recoveries would include purchased credit derivatives to the extent they offset written credit derivatives which have an identical underlying, or a netting arrangement or credit support annex with the counterparty. There may be other potential recoveries from recourse provisions where agreements cover multiple derivative arrangements but those amounts have not been included. |
| Maximum Potential Amount of Future Payments by Contract Term | ||||||||||||||||||||||||
| 0-6 Months | 6-12 Months | 1-5 Years | 5-10 Years | >10 Years | Total | |||||||||||||||||||
Current credit spread* on underlying (in basis points) | ||||||||||||||||||||||||
0-100 | $ — | $ — | $ — | $ | — | $ — | $ | — | ||||||||||||||||
>101 | — | — | — | 1,200,000 | — | 1,200,000 | ||||||||||||||||||
Total | $ — | $ — | $ — | $ | 1,200,000 | $ — | $ | 1,200,000 | ||||||||||||||||
| * | The credit spread on the underlying asset is generally indicative of the current status of the underlying risk of the Fund having to perform. The spread also reflects the cost of buying/selling protection and may include upfront payments required to be made to enter into a contract. Higher credit spreads with a shorter contract term is indicative of a higher likelihood of performance by the Fund. |
The credit spread disclosed above for each reference obligation where the Fund is the seller of protection is a representation of the current payment/performance risk of the swap.
4. DERIVATIVE CONTRACTS
The following tables include only Funds that had exposure to more than one type of risk on derivatives held throughout the year. For Funds that held derivatives throughout the year with only one type of risk exposure, additional information can be found on the Schedules of Investments and the Statements of Operations. The fair value of derivative instruments as of year end was as follows:
| Asset Derivatives | Liability Derivatives | |||||||||||
Year ended September 30, 2016 | Year ended September 30, 2016 ($ Thousands) | |||||||||||
Statements of Assets and Liabilities | Fair Value | Statements of Assets and Liabilities Location | Fair Value | |||||||||
International Fixed Income Fund | ||||||||||||
Interest rate contracts | Net Assets — Unrealized appreciation on futures contracts | $ | 151* | Net Assets – Unrealized depreciation on futures contracts | $ | 215* | ||||||
Net Assets — Unrealized appreciation on swap contracts | –† | Net Assets – Unrealized depreciation on swap contracts | 149† | |||||||||
Credit contracts | Net Assets — Unrealized appreciation on swap contracts | –† | Net Assets – Unrealized depreciation on swap contracts | 34† | ||||||||
Foreign exchange contracts | Unrealized gain on forward foreign currency contracts | 2,970 | Unrealized loss on forward foreign currency contracts | 3,765 | ||||||||
| Total derivatives not accounted for as hedging instruments | $ | 3,121 | $ | 4,163 |
SEI Institutional International Trust / Annual Report / September 30, 2016 |
77 |
NOTES TO FINANCIAL STATEMENTS (Continued)
September 30, 2016
| Asset Derivatives | Liability Derivatives | |||||||||||
Year ended September 30, 2016 | Year ended September 30, 2016 ($ Thousands) | |||||||||||
Statements of Assets and Liabilities Location | Fair Value | Statements of Assets and Liabilities Location | Fair Value | |||||||||
Emerging Markets Debt Fund | ||||||||||||
Interest rate contracts | Net Assets — Unrealized appreciation on futures contracts | $ | 258* | Net Assets — Unrealized depreciation on futures contracts | $ | 163* | ||||||
Net Assets — Unrealized appreciation on swap contracts | 617† | Net Assets — Unrealized depreciation on swap contracts | 2,342† | |||||||||
Credit Contracts | Net Assets — Unrealized appreciation on swap contracts | —† | Net Assets — Unrealized depreciation on swap contracts | 10† | ||||||||
Foreign exchange contracts | Unrealized gain on forward foreign currency contracts | 5,538 | Unrealized loss on forward foreign currency contracts | 6,228 | ||||||||
| Net Assets — Unrealized appreciation on swap contracts | 197† | Net Assets — Unrealized depreciation on swap contracts | —† | |||||||||
| Total derivatives not accounted for as hedging instruments | $ | 6,610 | $ | 8,743 |
| * | Includes cumulative appreciation/depreciation of futures contracts as reported in the Schedules of Investments. Only current day’s variation margin is reported within the Statements of Assets & Liabilities. |
| † | Includes cumulative appreciation/depreciation of swap contracts as reported in the Schedules of Investments. Market Value is reported within the Statements of Assets & Liabilities for OTC swap contracts that have paid premiums. For centrally cleared swap contracts current days variation margin is reported within the Statements of Assets & Liabilities. |
The effect of derivative instruments on the Statements of Operations for the year ended September 30, 2016.
Amount of realized gain or (loss) on derivatives recognized in income ($ Thousands):
| Derivatives Not Accounted for as Hedging Instruments | Options | Futures | Forward Currency Contracts | Swaps | Total | |||||||||||||||
International Fixed Income Fund | ||||||||||||||||||||
Interest rate contracts | $ | — | $ | 1,261 | $ | — | $ | (3,019) | $ | (1,758) | ||||||||||
Foreign exchange contracts | (15) | — | (7,860) | — | (7,875) | |||||||||||||||
Credit contracts | — | — | — | 50 | 50 | |||||||||||||||
Total | $ | (15) | $ | 1,261 | $ | (7,860) | $ | (2,969) | $ | (9,583) | ||||||||||
| Derivatives Not Accounted for as Hedging Instruments | Futures | Forward Currency Contracts | Swaps | Total | ||||||||||||||||
Emerging Markets Debt Fund | ||||||||||||||||||||
Interest rate contracts | $ | (1,249) | $ | — | $ | (608) | $ | (1,857) | ||||||||||||
Foreign exchange contracts | — | (14,914) | (8,898) | (23,812) | ||||||||||||||||
Credit contracts | — | — | (259) | (259) | ||||||||||||||||
Total | $ | (1,249) | $ | (14,914) | $ | (9,765) | $ | (25,928) | ||||||||||||
Change in unrealized appreciation or (depreciation) on derivatives recognized in income ($ Thousands):
| ||||||||||||||||||||
| Derivatives Not Accounted for as Hedging Instruments | Futures | Forward Currency | Swaps | Total | ||||||||||||||||
International Fixed Income Fund | ||||||||||||||||||||
Interest rate contracts | $ | (327) | $ | — | $ | 1,960 | $ | 1,633 | ||||||||||||
Foreign exchange contracts | — | (4,110) | — | (4,110) | ||||||||||||||||
Credit contracts | — | — | 66 | 66 | ||||||||||||||||
Total | $ | (327) | $ | (4,110) | $ | 2,026 | $ | (2,411) | ||||||||||||
78 |
SEI Insititution International Trust / Annual Report / September 30, 2016 |
| Derivatives Not Accounted for as Hedging Instruments | Futures | Forward Currency Contracts | Swaps | Total | ||||||||||||||||
Emerging Markets Debt Fund | ||||||||||||||||||||
Interest rate contracts | $ | 351 | $ | — | $ | 1,901 | $ | 2,252 | ||||||||||||
Foreign exchange contracts | — | (1,438) | 954 | (484) | ||||||||||||||||
Credit contracts | — | — | (10) | (10) | ||||||||||||||||
Total | $ | 351 | $ | (1,438) | $ | 2,845 | $ | 1,758 | ||||||||||||
A Fund is subject to various netting arrangements with select counterparties (“Master Agreements”). Master Agreements govern the terms of certain transactions, and reduce the counterparty risk associated with relevant transactions by specifying credit protection mechanisms and providing standardization that improves legal certainty. Since different types of transactions have different mechanics and are sometimes traded out of different legal entities of a particular counterparty organization, each type of transaction may be covered by a different Master Agreement, resulting in the need for multiple agreements with a single counterparty. As the Master Agreements are specific to unique operations of different asset types, they allow a Fund to close out and net its total exposure to a specific counterparty entity in the event of a default with respect to all the transactions governed under a single agreement with a specific counterparty entity.
Master Agreements can also help limit counterparty risk by specifying collateral posting arrangements at pre-arranged exposure levels. Under the Master Agreements, collateral is routinely transferred if the total net exposure to certain transactions (net of existing collateral already in place) governed under the relevant Master Agreement with a counterparty in a given account exceeds a specified threshold, which typically ranges from zero to $250,000 depending on the counterparty and the type of Master Agreement. United States Treasury Securities and U.S. dollar cash
are generally the preferred forms of collateral. Securities and cash pledged as collateral are reflected as assets in the Statements of Assets and Liabilities as either a component of investments at value (securities) or deposits due from counterparties (cash). Cash collateral received is not typically held in a segregated account and as such is reflected as a liability in the Statement of Assets and Liabilities as deposits due to counterparties. The market value of any securities received as collateral is not reflected as a component of net asset value. A Fund’s overall exposure to counterparty risk can change substantially within a short period, as it is affected by each transaction subject to the relevant Master Agreement.
Customer Account Agreements and related addendums govern exchange traded derivatives transactions such as futures, options on futures, and centrally cleared swaps. Exchange traded derivative transactions require posting of initial margin as determined by each relevant clearing agency which is segregated at a broker account registered with the Commodities Futures Trading Commission (CFTC), or the applicable regulator. In the US, counterparty risk is significantly reduced as creditors of the futures broker do not have claim to Fund assets in the segregated account. Additionally, portability of exposure in the event of default further reduces risk to the Funds. Variation margin, or changes in market value, are exchanged daily, but may not be netted between futures and cleared OTC derivatives.
The following is a summary of the market value and variation margin of exchange-traded or centrally cleared financial derivative instruments of the Funds as of September 30, 2016, ($ Thousands):
| Financial Derivatives Assets | Financial Derivatives Liabilities | |||||||||||||||||||||||||||
| Variation Margin Asset | Variation Margin Liability | |||||||||||||||||||||||||||
| Fund | Futures | Swap Agreements | Total | Futures | Swap Agreements | Total | ||||||||||||||||||||||
International Equity Fund | $ | 70 | $ | — | $ | 70 | $ | 267 | $ | – | $ | 267 | ||||||||||||||||
International Fixed Income Fund | 171 | 10 | 181 | 123 | – | 123 | ||||||||||||||||||||||
Emerging Markets Debt Fund | 108 | — | 108 | 114 | – | 114 | ||||||||||||||||||||||
Securities with an aggregate market value of $3,040 ($ Thousands) have been pledged as collateral for exchange-traded and centrally cleared derivative instruments as of September 30, 2016 for the International Equity Fund. Cash pledged as collateral for exchange-traded and centrally cleared derivative
instruments as of September 30, 2016 amounted to $3,569 ($ Thousands) for the International Fixed Income Fund.
International Swaps and Derivatives Association, Inc. Master Agreements and Credit Support Annexes (“ISDA Master Agreements”) govern OTC financial
SEI Insititution International Trust / Annual Report / September 30, 2016 |
79 |
NOTES TO FINANCIAL STATEMENTS (Continued)
September 30, 2016
derivative transactions entered into by a Fund and select counterparties. ISDA Master Agreements maintain provisions for general obligations, representations, agreements, collateral and events of default or termination. Events of termination include conditions that may entitle counterparties to elect to terminate early and cause settlement of all outstanding transactions under the applicable ISDA Master Agreement. Any election
to terminate early could be material to the financial statements. In limited circumstances, the ISDA Master Agreement may contain additional provisions that add additional counterparty protection beyond coverage of existing daily exposure if the counterparty has a decline in credit quality below a predefined level. These amounts, if any, may be segregated with a third party custodian.
The following is a summary by derivative type of the market value of OTC financial derivative instruments and collateral (received)/pledged as of September 30, 2016 ($ Thousands):
Financial Derivative Assets |
Financial Derivative Liabilities | |||||||||||||||||||||||||||||||||||
| International Fixed Income Fund | Forward Foreign Currency Contracts | Swap Agreements | Total Over the Counter | Forward Foreign Currency Contracts | Swap Agreements | Total Counter | Net Market Value of OTC | Collateral (Received) Pledged | Net Exposures* | |||||||||||||||||||||||||||
Bank of America | $ | 483 | $ | – | $ | 483 | $ | 5 | $ | – | $ | 5 | $ | 478 | $ | – | $ | 478 | ||||||||||||||||||
Bank of Montreal | 300 | – | 300 | 176 | – | 176 | 124 | – | 124 | |||||||||||||||||||||||||||
Barclays PLC | 27 | – | 27 | 140 | – | 140 | (113 | ) | – | (113 | ) | |||||||||||||||||||||||||
BNP Paribas | 5 | – | 5 | 26 | – | 26 | (21 | ) | – | (21 | ) | |||||||||||||||||||||||||
Brown Brothers Harriman | 84 | – | 84 | 552 | – | 552 | (468 | ) | – | (468 | ) | |||||||||||||||||||||||||
Citigroup | 1,003 | – | 1,003 | 108 | – | 108 | 895 | – | 895 | |||||||||||||||||||||||||||
Commonwealth Bank Of Australia | 3 | – | 3 | – | – | – | 3 | – | 3 | |||||||||||||||||||||||||||
Credit Suisse | – | – | – | – | 28 | 28 | (28 | ) | – | (28 | ) | |||||||||||||||||||||||||
Credit Suisse First Boston | 39 | – | 39 | 60 | – | 60 | (21 | ) | – | (21 | ) | |||||||||||||||||||||||||
Deutsche Bank | – | – | – | 15 | 6 | 21 | (21 | ) | – | (21 | ) | |||||||||||||||||||||||||
Goldman Sachs | 486 | – | 486 | 273 | – | 273 | 213 | – | 213 | |||||||||||||||||||||||||||
HSBC | 37 | – | 37 | 123 | – | 123 | (86 | ) | – | (86 | ) | |||||||||||||||||||||||||
ITG | 36 | – | 36 | 893 | – | 893 | (857 | ) | – | (857 | ) | |||||||||||||||||||||||||
JPMorgan Chase Bank | 37 | – | 37 | 35 | – | 35 | 2 | – | 2 | |||||||||||||||||||||||||||
Merrill Lynch | 2 | – | 2 | 1 | – | 1 | 1 | – | 1 | |||||||||||||||||||||||||||
Morgan Stanley | 63 | – | 63 | 32 | – | 32 | 31 | – | 31 | |||||||||||||||||||||||||||
National Australia Capital Markets | – | – | – | 498 | – | 498 | (498 | ) | – | (498 | ) | |||||||||||||||||||||||||
National Bank of Australia | 154 | – | 154 | 771 | – | 771 | (617 | ) | – | (617 | ) | |||||||||||||||||||||||||
RBC | 127 | – | 127 | 18 | – | 18 | 109 | – | 109 | |||||||||||||||||||||||||||
Royal Bank of Scotland | 1 | – | 1 | 3 | – | 3 | (2 | ) | – | (2 | ) | |||||||||||||||||||||||||
SG Cowen | 5 | – | 5 | 2 | – | 2 | 3 | – | 3 | |||||||||||||||||||||||||||
Standard Chartered | 35 | – | 35 | 5 | – | 5 | 30 | – | 30 | |||||||||||||||||||||||||||
State Street | 2 | – | 2 | 20 | – | 20 | (18 | ) | – | (18 | ) | |||||||||||||||||||||||||
TD Securities | – | – | – | 2 | – | 2 | (2 | ) | – | (2 | ) | |||||||||||||||||||||||||
UBS Securities | 2 | – | 2 | 2 | – | 2 | – | – | – | |||||||||||||||||||||||||||
USAllianz | 35 | – | 35 | – | – | – | 35 | – | 35 | |||||||||||||||||||||||||||
Wells Fargo | – | – | – | 1 | – | 1 | (1 | ) | – | (1 | ) | |||||||||||||||||||||||||
WestPac Banking | 4 | – | 4 | 4 | – | 4 | – | – | – | |||||||||||||||||||||||||||
Total | $ | 2,970 | $ | – | $ | 2,970 | $ | 3,765 | $ | 34 | $ | 3,799 | ||||||||||||||||||||||||
80 |
SEI Insititution International Trust / Annual Report / September 30, 2016 |
Financial Derivative Assets |
Financial Derivative Liabilities | |||||||||||||||||||||||||||||||||||
| Emerging Markets Debt Fund | Forward Foreign Currency Contracts | Swap Agreements | Total Counter | Forward Foreign Currency Contracts | Swap Agreements | Total Over the Counter | Net Market Value of OTC Derivatives | Collateral (Received) Pledged | Net Exposures(1) | |||||||||||||||||||||||||||
Barclays PLC | $ | 33 | $ | – | $ | 33 | $ | 136 | $ | – | $ | 136 | $ | (103 | ) | $ | – | $ | (103 | ) | ||||||||||||||||
Citibank | 641 | – | 641 | – | – | – | 641 | – | 641 | |||||||||||||||||||||||||||
Citigroup | 2,371 | – | 2,371 | 1,911 | – | 1,911 | 460 | – | 460 | |||||||||||||||||||||||||||
Goldman Sachs | 1,440 | 581 | 2,021 | 1,621 | 1,321 | 2,942 | (921 | ) | 690 | (231 | ) | |||||||||||||||||||||||||
HSBC | 13 | – | 13 | 59 | – | 59 | (46 | ) | – | (46 | ) | |||||||||||||||||||||||||
JPMorgan Chase Bank | 687 | 233 | 920 | 2,217 | 1,031 | 3,248 | (2,328 | ) | 2,328 | (2) | – | |||||||||||||||||||||||||
Standard Bank | 353 | – | 353 | 284 | – | 284 | 69 | – | 69 | |||||||||||||||||||||||||||
Total | $ | 5,538 | $ | 814 | $ | 6,352 | $ | 6,228 | $ | 2,352 | $ | 8,580 | ||||||||||||||||||||||||
| (1) | Net Exposures represents the net receivable/(payable) that would be due from/to the counterparty in the event of default. Exposure from OTC financial derivative instruments can only be netted across transactions governed under the same master agreement with the same legal entity. |
| (2) | Excess collateral pledged is not shown for financial reporting purposes. |
No securities have been pledged or have been received as collateral for OTC financial derivative instruments as governed by ISDA Master Agreements as of September 30, 2016.
Written options transactions entered into during the year ended September 30, 2016 are summarized as follows:
| International Fixed Income Fund | Number of Contracts | Premium ($ Thousands) | ||||||
Balance at the beginning of year | — | $ | — | |||||
Written | 22,788,000 | 158 | ||||||
Expired | (19,159,000 | ) | (99 | ) | ||||
Closing buys | (3,629,000 | ) | (59 | ) | ||||
Balance at the end of year | — | $ | — | |||||
5. INVESTMENT ADVISORY, ADMINISTRATION AND DISTRIBUTION AGREEMENTS, INVESTMENT SUB-ADVISORY AGREEMENTS AND OTHER TRANSACTIONS WITH AFFILIATES
Investment Advisory, Administration and Distribution Agreements — SIMC serves as investment adviser (the “Adviser”) to each Fund. In connection with serving as Adviser, SIMC is entitled to a fee, which is calculated daily and paid monthly, based on the average daily net assets of each fund.
SEI Investments Global Funds Services (the “Administrator”) provides administrative and transfer agency services to the Funds for annual fees, based on the average daily net assets of each fund.
SEI Investments Distribution Co. (“SIDCo.”) is the distributor of the shares of the Funds. The Funds have adopted a shareholder services plan and agreement (the Service Plan) with respect to Class A and Class I Shares that allows such shares to pay service providers a fee, based on average daily net assets of each respective Class of Shares, in connection with the ongoing servicing of shareholder accounts owning such shares. The International Equity Fund has also
adopted an administrative services plan and agreement (the Administrative Service Plan) with respect to Class I Shares that allows such Shares to pay service providers a fee, based on average daily net assets of the Class I Shares, in connection with ongoing administrative services for shareholder accounts owning such Shares.
The Service Plan and Administrative Service Plan provide that shareholder service fees and administrative service fees, respectively, on Class A and Class I Shares will be paid to SIDCo., which may then be used by SIDCo. to compensate financial intermediaries for providing shareholder services and administrative services, as applicable, with respect to the Shares.
The Adviser, Administrator and/or Distributor have voluntarily agreed to waive a portion of their fees in order to keep total direct operating expenses (exclusive of interest from borrowings, brokerage commissions, taxes, Trustees fees and extraordinary expenses not incurred in the ordinary course of the Funds’ business) at a specified level. The voluntary waivers by the Funds’ Adviser, Administrator and/or Distributor are limited to the Funds’ direct operating expenses and, therefore, do not apply to indirect expenses incurred by the Funds, such as acquired fund fees and expenses (AFFE). The waivers are voluntary and the Funds’ Adviser, Administrator and/or Distributor may discontinue all or part of any of these waivers at any time.
SEI Insititution International Trust / Annual Report / September 30, 2016 |
81 |
NOTES TO FINANCIAL STATEMENTS (Continued)
September 30, 2016
The following is a summary of annual fees payable to the Adviser, Administrator and Distributor and the contractual and voluntary expense limitation for each Fund will be as follows:
| Advisory Fee | Administration Fee | Shareholder Servicing Fee | Administrative Servicing Fee | Voluntary Expense Limitations | ||||||||||||||||
International Equity Fund | ||||||||||||||||||||
Class A | 0.505% | 0.45% | 0.25% | – | 1.24% | |||||||||||||||
Class I | 0.505% | 0.45% | 0.25% | 0.25% | 1.49% | |||||||||||||||
Class Y | 0.505% | 0.45% | – | – | 1.00% | |||||||||||||||
Emerging Markets Equity Fund* | ||||||||||||||||||||
Class A | 1.05% | 0.45% | 0.25% | – | N/A | |||||||||||||||
Class Y | 1.05% | 0.45% | – | – | N/A | |||||||||||||||
International Fixed Income Fund | ||||||||||||||||||||
Class A | 0.30% | 0.45% | 0.25% | – | 1.02% | |||||||||||||||
Class Y | 0.30% | 0.45% | – | – | 0.77% | |||||||||||||||
Emerging Markets Debt Fund | ||||||||||||||||||||
Class A | 0.85% | 0.45% | 0.25% | – | 1.36% | |||||||||||||||
Class Y | 0.85% | 0.45% | – | – | 1.11% | |||||||||||||||
| * | Renewed as of January 31, 2016, SIMC has contractually agreed to waive its management fee as necessary to keep the management fee paid by the Fund during its fiscal year from exceeding 0.95%. This fee waiver agreement shall remain in effect until January 31, 2017 and, unless earlier terminated, shall be automatically renewed for successive one-year periods thereafter. The agreement may be amended or terminated only with the consent of the Board of Trustees. |
N/A — Not applicable
Investment Sub-Advisory Agreements — As of September 30, 2016, SIMC has entered into Investment Sub-Advisory Agreements with the following parties:
| Investment Sub-Adviser |
International Equity Fund
Acadian Asset Management LLC
Blackcrane Capital, LLC
Causeway Capital Management LLC
Henderson Global Investors (North America) Inc.
INTECH Investment Management LLC
Neuberger Berman Investment Advisers LLC
NWQ Investment Management Company, LLC
WCM Investment Management
Emerging Markets Equity Fund
Delaware Investment Fund Advisers, a series of
Delaware Management Business Trust
J O Hambro Capital Management Limited
Kleinwort Benson Investors International Ltd.
Lazard Asset Management LLC
Neuberger Berman Investment Advisers LLC
PanAgora Asset Management, Inc.
RWC Asset Advisors (US) LLC
International Fixed Income Fund
AllianceBernstein L.P.
FIL Investment Advisors
Wellington Management Company, LLP
Emerging Markets Debt Fund
Investec Asset Management Ltd.
Neuberger Berman Fixed Investment Advisers LLC
Stone Harbor Investment Partners LP
Under the investment sub-advisory agreements, each
sub-adviser receives an annual fee, paid by SIMC.
Brokerage Commissions Paid to Affiliates — The Distributor may receive compensation on fund transactions effected for the Trust in accordance with the rules of the Securities and Exchange Commission (“SEC”). Accordingly, it is expected that fund transactions may result in brokerage commissions being paid to the Distributor. The SEC rules require that such commissions not exceed usual and customary commissions. There were no such commissions for the year ended September 30, 2016.
Fees Paid Indirectly — The Funds may direct certain fund trades to the Distributor who pays a portion of the Fund’s expenses. Accordingly, the expenses reduced, which were used to pay third party expenses, and the effect on the Fund’s expense ratio, as a percentage of the Fund’s average daily net assets for the year ended September 30, 2016 can be found on the Statement of Operations and Financial Highlights, if applicable.
Investment in Affiliated Securities — The Funds may invest in the SEI Daily Income Trust Government Fund, an affiliated money market fund to manage excess cash or to serve as margin or collateral for derivative positions (the SEI Daily Income Trust Prime Obligation Fund was closed on July 22, 2016). Additionally, the Funds may invest cash collateral from the securities lending program in the SEI Liquidity Fund, L.P., also an affiliated fund.
82 |
SEI Insititution International Trust / Annual Report / September 30, 2016 |
The following is summary of the transactions with affiliates for the year ended September 30, 2016 ($ Thousands):
| International Equity Fund | ||||||||||||||||
| ||||||||||||||||
| Security Description | Value 9/30/2015 | Purchases at Cost | Proceeds from Sales | Value 9/30/2016 | Dividend Income | |||||||||||
| ||||||||||||||||
SEI Liquidity Fund, L.P. | $ 233,929 | $1,341,953 | $(1,291,466) | $ 284,416 | $ 2,391 | |||||||||||
SEI Daily Income Trust, Prime Obligation Fund, Class A | 91,924 | 161,865 | (253,789) | – | 132 | |||||||||||
SEI Daily Income Trust, Government Fund, Class A | – | 78,819 | (43,890) | 34,929 | 20 | |||||||||||
|
|
|
|
|
|
|
| |||||||||
Totals | $325,853 | $1,582,637 | $(1,589,145) | $319,345 | $ 2,543 | |||||||||||
|
|
|
|
|
|
|
| |||||||||
| Emerging Markets Equity Fund | ||||||||||||||||
| ||||||||||||||||
| Security Description | Value 9/30/2015 | Purchases at Cost | Proceeds from Sales | Value 9/30/2016 | Dividend Income | |||||||||||
| ||||||||||||||||
SEI Liquidity Fund, L.P. | $135,645 | $844,490 | $(734,154) | $245,981 | $1,303 | |||||||||||
SEI Daily Income Trust, Prime Obligation Fund, Class A | 12,203 | 186,265 | (198,468) | – | 15 | |||||||||||
SEI Daily Income Trust, Government Fund, Class A | – | 40,933 | (34,268) | 6,665 | 4 | |||||||||||
|
|
|
|
|
|
|
| |||||||||
Totals | $147,848 | $1,071,688 | $(966,890) | $252,646 | $1,322 | |||||||||||
|
|
|
|
|
|
|
| |||||||||
| Emerging Markets Debt Fund | ||||||||||||||||
| ||||||||||||||||
| Security Description | Value 9/30/2015 | Purchases at Cost | Proceeds from Sales | Value 9/30/2016 | Dividend Income | |||||||||||
| ||||||||||||||||
SEI Liquidity Fund, L.P. | $20,810 | $207,275 | $(191,961) | $36,124 | $168 | |||||||||||
Payment to Affiliates—Certain Officers and Trustees of the Trust are also Officers and/or Directors of the Administrator, Adviser and/or the Distributor.
The Trust pays each unaffiliated Trustee an annual fee for attendance at quarterly, interim, and committee meetings. The Administrator or the Distributor pays compensation of Officers and affiliated Trustees.
A portion of the services provided by the Chief Compliance Officer (“CCO”) and his staff, whom are employees of the Administrator, are paid for by the Trust as incurred. The services include regulatory oversight of the Trust’s Adviser, sub-advisers and service providers.
Interfund Lending—The SEC has granted an exemption that permits the Trust to participate in an interfund lending program (“the Program”) with existing or future investment companies registered under the 1940 Act that are advised by SIMC (the “SEI Funds”). The Program
allows the SEI Funds to lend money to and borrow money from each other for temporary or emergency purposes. Participation in the Program is voluntary for both borrowing and lending funds. Interfund loans may be made only when the rate of interest to be charged is more favorable to the lending fund than an investment in overnight repurchase agreements (“Repo Rate”), and more favorable to the borrowing fund than the rate of interest that would be charged by a bank for short-term borrowings (“Bank Loan Rate”). The Bank Loan Rate will be determined using a formula reviewed annually by the SEI Funds’ Board of Trustees. The interest rate imposed on interfund loans is the average of the Repo Rate and the Bank Loan Rate. For the year ended September 30, 2016, the Trust had not participated in the Program.
6. INVESTMENT TRANSACTIONS
The cost of security purchases and the proceeds from the sale of securities, other than temporary cash investments and futures, during the year ended September 30, 2016, were as follows:
| ||||||||||||||||
| International Equity Fund ($ Thousands) | Emerging Markets Equity Fund ($ Thousands) | International Fixed Income Fund ($ Thousands) | Emerging Markets Debt Fund ($ Thousands) | |||||||||||||
| ||||||||||||||||
Purchases | ||||||||||||||||
U.S. Government | $– | $– | $80,216 | $209,232 | ||||||||||||
Other | 1,325,332 | 1,132,223(1) | 418,203 | 961,056 | ||||||||||||
Sales | ||||||||||||||||
U.S. Government | – | – | 50,254 | 90,096 | ||||||||||||
Other | 1,184,199 | 1,170,208(1) | 438,796 | 1,022,935 | ||||||||||||
(1) includes 17a-7 related party transactions of $5,462 ($ Thousands)
7. FEDERAL TAX INFORMATION:
It is each Fund’s intention to continue to qualify as a regulated investment company under Subchapter M
of the Internal Revenue Code and distribute all of its taxable income (including net capital gains). Accordingly, no provision for Federal income taxes is required.
SEI Insititution International Trust / Annual Report / September 30, 2016 |
83 |
NOTES TO FINANCIAL STATEMENTS (Continued)
September 30, 2016
The Funds may be subject to taxes imposed by countries in which they invest with respect to their investments in issuers existing or operating in such countries. Such taxes are generally based on income earned. The Funds accrue such taxes when the related income is earned.
Dividends from net investment income and distributions from net realized capital gains are determined in accordance with U.S. Federal income tax regulations, which may differ from those amounts determined under U.S. GAAP. These book/tax differences are either temporary or permanent in nature. To the extent these differences are permanent, they are charged or credited to paid-in capital, undistributed net investment income or accumulated net realized gain, as appropriate, in the period that the differences arise.
Accordingly, the following permanent differences, primarily attributable to different treatment for gains and losses on paydowns of mortgage and asset-backed securities for tax purposes, investments in swaps, investments in passive foreign investment companies, distribution reclassification, REIT income reclassification and foreign currency transactions have been reclassified to/from the following accounts as of September 30, 2016:
| Paid-in- Capital ($ Thousands) | Accumulated Realized Gain/(Loss) ($Thousands) | Undistributed Net Investment Income ($ Thousands) | ||||||||||
International Equity Fund | $ – | $ 32 | $ (32) | |||||||||
Emerging Markets Equity Fund | – | (2,085) | 2,085 | |||||||||
International Fixed Income Fund | – | 14,512 | (14,512) | |||||||||
Emerging Markets Debt Fund | – | 77,632 | (77,632) | |||||||||
The tax character of dividends and distributions declared during the last two years were as follows:
| Ordinary Income ($ Thousands) | Long-term Capital Gain ($ Thousands) | Total ($ Thousands) | ||||||||||||||
International Equity Fund | 2016 | $ 29,284 | $ – | $ 29,284 | ||||||||||||
| 2015 | 52,509 | – | 52,509 | |||||||||||||
Emerging Markets Equity Fund | 2016 | 11,476 | – | 11,476 | ||||||||||||
| 2015 | 18,640 | – | 18,640 | |||||||||||||
International Fixed Income Fund | 2016 | 27,843 | 41 | 27,884 | ||||||||||||
| 2015 | 38,714 | – | 38,714 | |||||||||||||
Emerging Markets Debt Fund | 2016 | – | – | – | ||||||||||||
| 2015 | 27,003 | 550 | 27,553 | |||||||||||||
As of September 30, 2016, the components of Distributable Earnings (Accumulated Losses) were as follows:
| Undistributed Ordinary Income ($ Thousands) | Undistributed Long-Term Capital Gain ($ Thousands) | Capital Loss ($ Thousands) | Post October | Late Year Ordinary Losses ($ Thousands) | Unrealized Appreciation (Depreciation) ($ Thousands) | Other Temporary Differences ($ Thousands) | Total Losses | |||||||||||||||||||||||||
International Equity Fund | $ | 38,542 | $ | – | $ | (801,314) | $ | – | $ | – | $ | 51,148 | $ | (420) | $ | (712,044) | ||||||||||||||||
Emerging Markets Equity Fund | 12,421 | – | (137,671) | – | – | 12,821 | (2) | (112,431) | ||||||||||||||||||||||||
International Fixed Income Fund | 2,957 | – | – | – | (3,557) | 9,542 | (13,279) | (4,337) | ||||||||||||||||||||||||
Emerging Markets Debt Fund | 7,701 | – | (37,895) | – | – | (5,964) | (35,533) | (71,691) | ||||||||||||||||||||||||
Post-October losses represent losses realized on investment transactions from November 1, 2015 through September 30, 2016 that, in accordance with Federal income tax regulations, the Funds may elect to defer and treat as having arisen in the following fiscal year.
For Federal income tax purposes, capital loss carryforwards may be carried forward and applied against future capital gains as follows:
| Expires 2017 ($ Thousands) | Expires 2018 ($ Thousands) | Total Capital Loss Carryforward 9/30/16 ($ Thousands) | ||||||||||
International Equity Fund | $ | 19,275 | $ | 690,357 | $ | 709,632 | ||||||
Emerging Markets Equity Fund | – | 10,206 | 10,206 | |||||||||
Under the Regulated Investment Company Modernization Act of 2010, Funds will be permitted to carry forward capital losses incurred in taxable years beginning after December 22, 2010 for an unlimited period. However, any losses incurred during those future taxable years will be required to be utilized prior to the losses incurred in pre-enactment taxable years. As a result of this ordering rule, pre-enactment capital loss carryforwards may be more likely to expire unused. Additionally, post-enactment capital losses that are carried forward will retain their character as either
84 |
SEI Insititution International Trust / Annual Report / September 30, 2016 |
short-term or long-term capital losses rather than being considered all short-term as under previous law.
| Short-Term ($ Thousands) | Long-Term ($ Thousands) | Total Capital Loss ($Thousands) | ||||||||||
International Equity Fund | $61,715 | $29,967 | $91,682 | |||||||||
Emerging Markets Equity Fund | 34,589 | 92,876 | 127,465 | |||||||||
Emerging Markets Debt Fund | 10,382 | 27,513 | 37,895 | |||||||||
* This table should be used in conjunction with the capital loss carryforwards table.
For Federal income tax purposes, the cost of securities owned at September 30, 2016, and the net realized gains or losses on securities sold for the period were not materially different from amounts reported for financial reporting purposes. These differences are primarily due to investments in partnerships, passive foreign investment companies and wash sales which cannot be used for Federal income tax purposes in the current year and have been deferred for use in future years. The aggregate gross unrealized appreciation and depreciation on total investments held by the Funds at September 30, 2016, was as follows:
Federal Tax Cost | Appreciated ($Thousands) | Depreciated Securities ($ Thousands) | Net Unrealized Appreciation (Depreciation) ($ Thousands) | |||||||||||||
International Equity Fund | $ | 3,049,232 | $ | 283,168 | $ | (232,252 | ) | $ | 50,916 | |||||||
Emerging Markets Equity Fund | 1,820,248 | 185,276 | (171,202 | ) | 14,074 | |||||||||||
International Fixed Income Fund | 489,645 | 21,700 | (10,649 | ) | | 11,051 | | |||||||||
Emerging Markets Debt Fund | 1,544,278 | 75,574 | (79,383 | ) | (3,809 | ) | ||||||||||
Management has analyzed the Funds’ tax positions taken on federal income tax returns for all open tax years and has concluded that as of September 30, 2016, no provision for income tax would be required in the Funds’ financial statements. The Funds’ federal and state income and federal excise tax returns for tax years for which the applicable statutes of limitations have not expired are subject to examination by the Internal Revenue Service and state departments of revenue.
8. CONCENTRATION/RISKS
In the normal course of business, the Trust enters into contracts that provide general indemnifications by the Trust to the counterparty to the contract. The Trust’s maximum exposure under these arrangements is dependent on future claims that may be made against the Trust and, therefore, cannot be estimated; however, management believes that, based on experience, the risk of loss from such claims is considered remote.
The following descriptions provide additional information about some of the risks of investing in the Funds:
Asset-Backed Securities Risk — Payment of principal and interest on asset-backed securities is dependent largely on the cash flows generated by the assets backing the securities, and asset-backed securities may not have the benefit of any security interest in the related assets.
Credit Risk — The risk that the issuer of a security or the counterparty to a contract will default or otherwise become unable to honor a financial obligation.
Currency Risk — To the extent a Fund takes positions in currencies, it will be subject to the risk that currency exchange rates may fluctuate in response to, among other things, changes in interest rates, intervention (or failure to intervene) by U.S. or foreign governments, central banks or supranational entities, or by the imposition of currency controls or other political developments in the United States or abroad.
Fixed Income Market Risk — The prices of a Fund’s fixed income securities respond to economic developments, particularly interest rate changes, as well as to perceptions about the creditworthiness of individual issuers, including governments and their agencies. Generally, the Fund’s fixed income securities will decrease in value if interest rates rise and vice versa. In the case of foreign securities, price fluctuations will reflect international economic and political events, as well as changes in currency valuations relative to the U.S. dollar.
Foreign Investment/Emerging Markets Risk — The risk that non-U.S. securities may be subject to additional risks due to, among other things, political, social and economic developments abroad, currency movements, and different legal, regulatory and tax environments. These additional risks may be heightened with respect to emerging market countries since political turmoil and rapid changes in economic conditions are more likely to occur in these countries.
Interest Rate Risk — The risk that a rise in interest rates will cause a fall in the value of fixed income securities, including U.S. Government Securities, in which the Fund invests. Although U.S. Government securities are considered to be among the safest investments, they are not guaranteed against price movements due to changing interest rates. A low interest rate environment may present greater interest rate risk, because there may be a greater likelihood of rates increasing and rates may increase more rapidly.
Mortgage-Backed Securities Risk — Mortgage-backed securities are affected by, among other things, interest rate changes and the possibility of prepayment of the
SEI Insititution International Trust / Annual Report / September 30, 2016 |
85 |
NOTES TO FINANCIAL STATEMENTS (Concluded)
September 30, 2016
underlying mortgage loans. Mortgage-backed securities are also subject to the risk that underlying borrowers will be unable to meet their obligations.
Please refer to each Fund’s current prospectus for additional disclosure regarding the risks associated with investing in the Funds. The foregoing is not intended to be a complete discussion of the risks associated with the investment strategies of the Funds.
9. SECURITIES LENDING
A Fund may lend portfolio securities to brokers, dealers and other financial organizations that meet capital and other credit requirements or other criteria established by the Trust’s Board of Trustees. These loans may not exceed 33 1/3% of the total asset value of a Fund (including the loan collateral). No Fund will lend portfolio securities to its Adviser, sub-adviser or their affiliates unless it has applied for and received specific authority to do so from the SEC. Loans of portfolio securities will be fully collateralized by cash. Collateral will be maintained in an amount equal to at least 100% of the current market value of the loaned securities by marking to market daily, although the borrower will be required to deliver collateral between 102% and 105% of the market value of borrowed securities for domestic and foreign securities, respectively. However, due to market fluctuations during the day, the value of securities loaned on a particular day may, during the course of the day, exceed the value of collateral. On each business day, the amount of collateral is adjusted based on the prior day’s market fluctuations and the current day’s lending activity. Income from lending activity is determined by the amount of interest earned on collateral, less any amounts payable to the borrowers of the securities and the lending agent. Lending securities involves certain risks, including the risk that a Fund may be delayed or prevented from recovering the collateral if the borrower fails to return the securities.
Cash collateral received in connection with securities lending is invested in short-term investments by the lending agent. These investments may include the SEI Liquidity Fund, L.P., and the Fund bears all of the gains and losses on such investment. There is no guarantee that these investments will not lose value.
The following is a summary of securities lending agreements held by certain Funds which would be subject to offset as of September 30, 2016 ($ Thousands):
| Securities Loaned at Value | Cash Collateral Received(1) | Net Amount | ||||||||||
International Equity Fund | $ | 269,416 | $ | 269,416 | $ | – | ||||||
Emerging Markets Equity Fund | 231,057 | 231,057 | – | |||||||||
Emerging Markets Debt Fund | 34,829 | 34,829 | – | |||||||||
| (1) | Excess collateral received in connection with the above securities lending transactions is not shown for financial reporting purposes. See each Fund’s Schedule of Investments for the total collateral received. |
| 10. | CONCENTRATION OF SHAREHOLDERS |
SEI Private Trust Company (“SPTC”) and SIMC are subsidiaries of SEI Investments Company. As of September 30, 2016, SPTC held of record the following:
| Fund | Class A | Class I | Class Y | |||||||||
International Equity Fund | 97.22% | 47.00% | 19.59% | �� | ||||||||
Emerging Markets Equity Fund | 91.05% | – | 39.07% | |||||||||
International Fixed Income Fund | 96.86% | – | 100.00% | |||||||||
Emerging Markets Debt Fund | 97.41% | – | 20.83% | |||||||||
SPTC is not a direct service provider to the SEI Funds. However, SPTC performs a role in the comprehensive investment solution that SEI provides to investors. SPTC holds shares in the Funds as custodian for shareholders that are clients of independent registered investment advisers, financial planners, bank trust departments and other financial advisers. SPTC maintains omnibus accounts at the Fund’s transfer agent.
11. SUBSEQUENT EVENTS
Management has evaluated the need for disclosures and/or adjustments resulting from subsequent events through the date the financial statements were issued. Based on this evaluation, no disclosure and/or adjustments were required to the financial statements as of September 30, 2016.
86 |
SEI Insititution International Trust / Annual Report / September 30, 2016 |
REPORT OF INDEPENDENT REGISTERED PUBLIC ACCOUNTING FIRM
The Shareholders and Board of Trustees
SEI Institutional International Trust:
We have audited the accompanying statements of assets and liabilities, including the schedules of investments, of SEI Institutional International Trust, comprised of the International Equity Fund, Emerging Markets Equity Fund, International Fixed Income Fund, and the Emerging Markets Debt Fund (collectively, the “Funds”), as of September 30, 2016, and the related statements of operations for the year then ended, the statements of changes in net assets for each of the years in the two-year period then ended, and the financial highlights for each of the years in the five-year period then ended. These financial statements and financial highlights are the responsibility of the Funds’ management. Our responsibility is to express an opinion on these financial statements and financial highlights based on our audits.
We conducted our audits in accordance with the standards of the Public Company Accounting Oversight Board (United States). Those standards require that we plan and perform the audit to obtain reasonable assurance about whether the financial statements and financial highlights are free of material misstatement. An audit includes examining, on a test basis, evidence supporting the amounts and disclosures in the financial statements. Our procedures included confirmation of securities owned as of September 30, 2016, by correspondence with the custodian, transfer agent and brokers or other appropriate auditing procedures. An audit also includes assessing the accounting principles used and significant estimates made by management, as well as evaluating the overall financial statement presentation. We believe that our audits provide a reasonable basis for our opinion.
In our opinion, the financial statements and financial highlights referred to above present fairly, in all material respects, the financial position of each of the Funds comprising the SEI Institutional International Trust as of September 30, 2016, the results of their operations for the year then ended, the changes in their net assets for each of the years in the two-year period then ended, and the financial highlights for each of the years in the five-year period then ended, in conformity with U.S. generally accepted accounting principles.

Philadelphia, Pennsylvania
November 28, 2016
SEI Institutional International Trust / Annual Report / September 30, 2016 |
87 |
TRUSTEES AND OFFICERS OF THE TRUST (Unaudited)
The following chart lists Trustees and Officers as of September 30, 2016.
Set forth below are the names, addresses, ages, position with the Trust, Term of Office and Length of Time Served, the principal occupations for the last five years, number of positions in fund complex overseen by trustee, and other directorships outside the fund complex of each of the persons currently serving as Trustees and Officers of the Trust. The Trust’s Statement of Additional Information (“SAI”) includes additional information about the Trustees and Officers. The SAI may be obtained without charge by calling 1-800-342-5734.
Name, Address, and Age | Position(s) Held with Trusts | Term of Office and Length of Time Served1 | Principal Occupation(s) During Past Five Years | Number of Portfolios in Fund Complex Overseen by Trustee2 | Other Directorships Held by Trustee | |||||
INTERESTED TRUSTEES
| ||||||||||
Robert A. Nesher One Freedom Valley Drive Oaks, PA 19456 70 yrs. old | Chairman of the Board of Trustees* | since 1995 | Currently performs various services on behalf of SEI for which Mr. Nesher is compensated. | 100 | Vice Chairman of The Advisors’ Inner Circle Fund III, Winton Series Trust and Winton Diversified Opportunities Fund since 2014. Vice Chairman of Gallery Trust since 2015. President and Director of SEI Structured Credit Fund, LP. Director of SEI Global Master Fund plc, SEI Global Assets Fund plc, SEI Global Investments Fund plc, SEI Investments—Global Funds Services, Limited, SEI Investments Global, Limited, SEI Investments (Europe) Ltd., SEI Multi-Strategy Funds PLC, SEI Global Nominee Ltd and SEI Investments—Unit Trust Management (UK) Limited. Director and President of SEI Opportunity Fund, L.P. to 2010. President, Director and Chief Executive Officer of SEI Alpha Strategy Portfolios, LP from 2007 to 2013. Trustee of The Advisors’ Inner Circle Fund, The Advisors’ Inner Circle Fund II, Bishop Street Funds, SEI Asset Allocation Trust, SEI Daily Income Trust, SEI Institutional Managed Trust, SEI Institutional International Trust, SEI Institutional Investments Trust, SEI Tax Exempt Trust, SEI Insurance Products Trust, Adviser Managed Trust, The KP Funds and SEI Catholic Values Trust.
| |||||
William M. Doran One Freedom Valley Drive Oaks, PA 19456 76 yrs. old | Trustee* | since 1995 | Self-employed consultant since 2003. Partner, Morgan, Lewis & Bockius LLP (law firm) from 1976 to 2003, counsel to the Trust, SEI, SIMC, the Administrator and the Distributor. | 100 | Director of SEI since 1974; Secretary of SEI since 1978. Director of SEI Investments Distribution Co. since 2003. Director of SEI Investments—Global Funds Services, Limited, SEI Investments Global, Limited, SEI Investments (Europe), Limited, SEI Investments (Asia) Limited, SEI Global Nominee Ltd. and SEI Investments—Unit Trust Management (UK) Limited. Trustee of SEI Liquid Asset Trust from 1982 to 2016. Trustee of O’Connor EQUUS from 2014 to 2016. Director of SEI Alpha Strategy Portfolios, LP from 2007 to 2013. Trustee of The Advisors’ Inner Circle Fund, The Advisors’ Inner Circle Fund II, The Advisors’ Inner Circle Fund III, Winton Series Trust, Winton Diversified Opportunities Fund, Gallery Trust, Bishop Street Funds, SEI Asset Allocation Trust, SEI Daily Income Trust, SEI Institutional Managed Trust, SEI Institutional International Trust, SEI Institutional Investments Trust, SEI Tax Exempt Trust, SEI Insurance Products Trust, Adviser Managed Trust, The KP Funds and SEI Catholic Values Trust.
| |||||
TRUSTEES
| ||||||||||
George J. Sullivan Jr. One Freedom Valley Drive, Oaks, PA 19456 73 yrs. old | Trustee | since 1996 | Retired since January 2012. Self-Employed Consultant, Newfound Consultants Inc. April 1997—December 2011. | 100 | Member of the independent review committee for SEI’s Canadian-registered mutual funds. Director of SEI Opportunity Fund, L.P. to 2010. Director of SEI Alpha Strategy Portfolios, LP from 2007 to 2013. Trustee of SEI Liquid Asset Trust from 1996 to 2016. Trustee/Director of State Street Navigator Securities Lending Trust, The Advisors’ Inner Circle Fund, The Advisors’ Inner Circle Fund II, Bishop Street Funds, SEI Structured Credit Fund, LP, SEI Asset Allocation Trust, SEI Daily Income Trust, SEI Institutional Managed Trust, SEI Institutional International Trust, SEI Institutional Investments Trust, SEI Tax Exempt Trust, SEI Insurance Products Trust, Adviser Managed Trust, The KP Funds and SEI Catholic Values Trust.
| |||||
| * | Messrs. Nesher and Doran are Trustees who may be deemed as “interested” persons of the Trust as that term is defined in the 1940 Act by virtue of their affiliation with SIMC and the Trust’s Distributor. |
| 1 | Each trustee shall hold office during the lifetime of this Trust until the election and qualification of his or her successor, or until he or she sooner dies, resigns or is removed in accordance with the Trust’s Declaration of Trust |
| 2 | The Fund Complex includes the following Trusts: SEI Asset Allocation Trust, SEI Daily Income Trust, SEI Institutional Investments Trust, Adviser Managed Trust, SEI Institutional International Trust, SEI Institutional Managed Trust, SEI Tax Exempt Trust, SEI Insurance Products Trust and New Covenant Funds. |
88 |
SEI Institutional International Trust / Annual Report / September 30, 2016 |
Name Address, and Age | Position(s) Held with Trusts | Term of Office and Length of Time Served1 | Principal Occupation(s) During Past Five Years | Number of Portfolios in Fund Complex Overseen by Trustee2 | Other Directorships Held by Trustee | |||||
TRUSTEES (continued)
| ||||||||||
Nina Lesavoy One Freedom Valley Drive, Oaks, PA 19456 59 yrs. old | Trustee | since 2003 | Founder and Managing Director, Avec Capital (strategic fundraising firm) since 2008. Managing Director, Cue Capital (strategic fundraising firm) from March 2002—March 2008. | 100 | Director of SEI Opportunity Fund, L.P. to 2010. Director of SEI Alpha Strategy Portfolios, LP from 2007 to 2013. Trustee of SEI Liquid Asset Trust from 2003 to 2016. Trustee/Director of SEI Structured Credit Fund, L.P., SEI Asset Allocation Trust, SEI Daily Income Trust, SEI Institutional Managed Trust, SEI Institutional International Trust, SEI Institutional Investments Trust, SEI Tax Exempt Trust, SEI Insurance Products Trust, Adviser Managed Trust and SEI Catholic Values Trust. | |||||
James M. Williams One Freedom Valley Drive, Oaks, PA 19456 69 yrs. old | Trustee | since 2004 | Vice President and Chief Investment Officer, J. Paul Getty Trust, Non-Profit Foundation for Visual Arts, since December 2002. President, Harbor Capital Advisors and Harbor Mutual Funds, 2000—2002. Director of SEI Alpha Strategy Portfolios, L.P. from 2007 to 2013. Manager, Pension Asset Management, Ford Motor Company, 1997—1999. | 100 | Director of SEI Opportunity Fund, L.P. to 2010. Director of SEI Alpha Strategy Portfolios, LP from 2007 to 2013, Trustee of SEI Liquid Asset Trust from 2004 to 2016. Trustee/Director of Ariel Mutual Funds, SEI Structured Credit Fund, LP, SEI Asset Allocation Trust, SEI Daily Income Trust, SEI Institutional Managed Trust, SEI Institutional International Trust, SEI Institutional Investments Trust, SEI Tax Exempt Trust, SEI Insurance Products Trust, Adviser Managed Trust and SEI Catholic Values Trust. | |||||
Mitchell A. Johnson One Freedom Valley Drive, Oaks, PA 19456 74 yrs. old | Trustee | since 2007 | Private Investor since 1994. | 100 | Director, Federal Agricultural Mortgage Corporation (Farmer Mac) since 1997. Director of SEI Alpha Strategy Portfolios, LP from 2007 to 2013. Trustee of SEI Liquid Asset Trust from 2007 to 2016. Trustee of the Advisors’ Inner Circle Fund, The Advisors’ Inner Circle Fund II, SEI Asset Allocation Trust, SEI Daily Income Trust, SEI Institutional Managed Trust, SEI Institutional International Trust, SEI Institutional Investments Trust, SEI Tax Exempt Trust, SEI Insurance Products Trust, Adviser Managed Trust, The KP Funds and SEI Catholic Values Trust. | |||||
Hubert L. Harris, Jr. One Freedom Valley Drive, Oaks, PA 19456 73 yrs. old | Trustee | since 2008 | Retired since December 2005. Owner of Harris Plantation, Inc. since 1995. Chief Executive Officer of Harris CAPM, a consulting asset and property management entity. Chief Executive Officer, INVESCO North America, August 2003—December 2005. Chief Executive Officer and Chair of the Board of Directors, AMVESCAP Retirement, Inc., January 1998— August 2003. | 100 | Director of AMVESCAP PLC from 1993-2004. Served as a director of a bank holding company, 2003-2009. Director, Aaron’s Inc., 2012—present. Chair of the Board of Trustees, Georgia Tech Foundation, Inc. (nonprofit corporation), 2007—2009, and member of the Executive Committee, 2003—2011; currently emeritus trustee. Member of the advisory board of the Georgia Tech Ivan Allen School of Liberal Arts and the Sam Nunn School of International Affairs, 2009-present. Member of the Board of Councilors of the Carter Center (nonprofit corporation). Director of SEI Alpha Strategy Portfolios, LP from 2008 to 2013. Trustee of SEI Asset Allocation Trust, SEI Daily Income Trust, SEI Institutional Managed Trust, SEI Institutional International Trust, SEI Institutional Investments Trust, SEI Tax Exempt Trust, SEI Insurance Products Trust, Adviser Managed Trust and SEI Catholic Values Trust. | |||||
Susan C. Cote One Freedom Valley Drive Oaks, PA 19456 61 years old | Trustee | since 2016 | Retired since July 2015. Americas Director of Asset Management, Ernst & Young LLP from 2006—2013. Global Asset Management Assurance Leader, Ernst & Young LLP from 2006—2015. Partner Ernst & Young LLP from 1997—2015. Prudential, 1983—1997. Retirement Investment Committee-Treasurer and Chair of Finance, Investment and Audit Committee of the New York Women’s Foundation. Independent Consultant to SEI Liquid Asset Allocation Trust. | 100 | Trustee of SEI Tax Exempt Trust, SEI Daily Income Trust, SEI Institutional International Trust, SEI Institutional Managed Trust, SEI Asset Allocation Trust, SEI Institutional Investments Trust, SEI Insurance Products Trust, Adviser Managed Trust and SEI Catholic Values Trust. | |||||
OFFICERS
| ||||||||||
Robert A. Nesher One Freedom Valley Drive, Oaks, PA 19456 70 yrs. Old | President and CEO | since 2005 | Currently performs various services on behalf of SEI for which Mr. Nesher is compensated. | N/A | N/A | |||||
James J. Hoffmayer One Freedom Valley Drive Oaks, PA 19456 43 yrs. old | Controller and Chief Financial Officer | since 2016 | Senior Director, Funds Accounting and Fund Administration, SEI Investments Global Funds Services (since September 2016); Senior Director of Fund Administration, SEI Investments Global Funds Services (since October 2014). Director of Financial Reporting, SEI Investments Global Funds Services (November 2004 —October 2014). | N/A | N/A | |||||
| 1 | Each trustee shall hold office during the lifetime of this Trust until the election and qualification of his or her successor, or until he or she sooner dies, resigns or is removed in accordance with the Trust’s Declaration of Trust. |
| 2 | The Fund Complex includes the following Trusts: SEI Asset Allocation Trust, SEI Daily Income Trust, SEI Institutional Investments Trust, Adviser Managed Trust, SEI Institutional International Trust, SEI Institutional Managed Trust, SEI Tax Exempt Trust, SEI Insurance Products Trust and New Covenant Funds. |
SEI Institutional International Trust / Annual Report / September 30, 2016 |
89 |
TRUSTEES AND OFFICERS OF THE TRUST (Unaudited) (Concluded)
Name Address, and Age | Position(s) Held with Trusts | Term of Office and Length of Time Served1 | Principal Occupation(s) During Past Five Years | Number of Portfolios in Fund Complex Overseen by Trustee2 | Other Directorships Held by Trustee | |||||
OFFICERS (continued)
| ||||||||||
| Russell Emery One Freedom Valley Drive Oaks, PA 19456 53 yrs. old | Chief Compliance Officer | since 2006 | Chief Compliance Officer of SEI Institutional Investments Trust, SEI Institutional Managed Trust, SEI Asset Allocation Trust, SEI Institutional International Trust, SEI Tax Exempt Trust, The Advisors’ Inner Circle Fund, The Advisors’ Inner Circle Fund II and Bishop Street Funds since March 2006. Chief Compliance Officer of SEI Liquid Asset Trust from 2006 to 2016. Chief Compliance Officer of SEI Structured Credit Fund, LP June 2007. Chief Compliance Officer of Adviser Managed Trust since December 2010. Chief Compliance Officer of SEI Alpha Strategy Portfolios, LP from 2007 to 2013. Chief Compliance Officer of SEI Insurance Products Trust and The KP Funds since 2013. Chief Compliance Officer of O’Connor EQUUS from 2014 to 2016. Chief Compliance Officer of The Advisors’ Inner Circle Fund III, Winton Series Trust and Winton Diversified Opportunities Fund since 2014. Chief Compliance Officer of SEI Catholic Values Trust and Gallery Trust since 2015. | N/A | N/A | |||||
| Timothy D Barto One Freedom Valley Drive Oaks, PA 19456 48 yrs. old | Vice President and Secretary | since 2002 | Vice President and Secretary of SEI Institutional Transfer Agent, Inc. since 2009. General Counsel and Secretary of SIMC and the Administrator since 2004. Vice President of SIMC and the Administrator since 1999. Vice President and Assistant Secretary of SEI since 2001. | N/A | N/A | |||||
| Aaron Buser One Freedom Valley Drive, Oaks, PA 19456 45 yrs. old | Vice President and Assistant Secretary | since 2008 | Vice President and Assistant Secretary of SEI Institutional Transfer Agent, Inc. since 2009. Vice President and Assistant Secretary of SIMC since 2007. Attorney Stark & Stark (law firm), March 2004—July 2007. | N/A | N/A | |||||
| David F. McCann One Freedom Valley Drive, Oaks, PA 19456 40 yrs. old | Vice President and Assistant Secretary | since 2009 | Vice President and Assistant Secretary of SEI Institutional Transfer Agent, Inc. since 2009. Vice President and Assistant Secretary of SIMC since 2008. Attorney, Drinker Biddle & Heath, LLP (law firm), May 2005 —October 2008. | N/A | N/A | |||||
| Stephen G. MacRae One Freedom Valley Drive, Oaks, PA 19456 47 yrs. old | Vice President | since 2012 | Director of Global Investment Product Management January 2004 to present. Global Funds Services, March 2005 to June 2006. | N/A | N/A | |||||
| Bridget E. Sudall One Freedom Valley Drive Oaks, PA 19456 36 yrs. old | Anti-Money Laundering Compliance Officer and Privacy Officer | since 2015 | Anti-Money Laundering Compliance Officer and Privacy Officer (since 2015), Senior Associate and AML Officer, Morgan Stanley Alternative Investment Partners, April 2011—March 2015, Investor Services Team Lead, Morgan Stanley Alternative Investment Partners, July 2007—April 2011. | N/A | N/A | |||||
| 1 | Each trustee shall hold office during the lifetime of this Trust until the election and qualification of his or her successor, or until he or she sooner dies, resigns or is removed in accordance with the Trust’s Declaration of Trust. |
| 2 | The Fund Complex includes the following Trusts: SEI Asset Allocation Trust, SEI Daily Income Trust, SEI Institutional Investments Trust, Adviser Managed Trust, SEI Institutional International Trust, SEI Institutional Managed Trust, SEI Tax Exempt Trust, SEI Insurance Products Trust and New Covenant Funds. |
90 |
SEI Institutional International Trust / Annual Report / September 30, 2016 |
DISCLOSURE OF FUND EXPENSES (Unaudited)
September 30, 2016
All mutual funds have operating expenses. As a shareholder of a fund, your investment is affected by these ongoing costs, which include (among others) costs for portfolio management, administrative services, and shareholder reports like this one. It is important for you to understand the impact of these costs on your investment returns.
Operating expenses such as these are deducted from the fund’s gross income and directly reduce your final investment return. These expenses are expressed as a percentage of the fund’s average net assets; this percentage is known as the fund’s expense ratio.
The following examples use the expense ratio and are intended to help you understand the ongoing costs (in dollars) of investing in your fund and to compare these costs with those of other mutual funds. The examples are based on an investment of $1,000 made at the beginning of the period shown and held for the entire period.
The table on this page illustrates your fund’s costs in two ways:
• Actual fund return. This section helps you to estimate the actual expenses after fee waivers that your Fund incurred over the period. The “Expenses Paid During Period” column shows the actual dollar expense cost incurred by a $1,000 investment in the Fund, and the “Ending Account Value” number is derived from deducting that expense cost from the Fund’s gross investment return.
You can use this information, together with the actual amount you invested in the Fund, to estimate the expenses you paid over that period. Simply divide your actual account value by $1,000 to arrive at a ratio (for example, an $8,600 account value divided by $1,000 = 8.6), then multiply that ratio by the number shown for your Fund under “Expenses Paid During Period.”
• Hypothetical 5% return. This section helps you compare your Fund’s costs with those of other mutual funds. It assumes that the fund had an annual 5% return before expenses during the year, but that the expense ratio (Column 3) for the period is unchanged. This example is useful in making comparisons because the Securities and Exchange Commission requires all mutual funds to make this 5% calculation. You can assess your Fund’s comparative cost by comparing the hypothetical result for your Fund in the “Expense Paid During Period” column with those that appear in the same charts in the shareholder reports for other funds.
NOTE: Because the return is set at 5% for comparison purposes — NOT your Fund’s actual return — the account values shown may not apply to your specific investment.
Beginning Account Value 4/1/16 | Ending Account Value 9/30/16 | Annualized Expense Ratios | Expenses Paid During Period * | |||||||||||||
International Equity Fund |
| |||||||||||||||
Actual Fund Return |
| |||||||||||||||
Class A | $1,000.00 | $1,037.90 | 1.26 | % | $6.44 | |||||||||||
Class I | 1,000.00 | 1,035.80 | 1.51 | 7.71 | ||||||||||||
Class Y | 1,000.00 | 1,039.00 | 1.01 | 5.16 | ||||||||||||
Hypothetical 5% Return |
| |||||||||||||||
Class A | $1,000.00 | $1,018.75 | 1.26 | % | $6.38 | |||||||||||
Class I | 1,000.00 | 1,017.50 | 1.51 | 7.64 | ||||||||||||
Class Y | 1,000.00 | 1,020.00 | 1.01 | 5.11 | ||||||||||||
Emerging Markets Equity Fund |
| |||||||||||||||
Actual Fund Return |
| |||||||||||||||
Class A | $1,000.00 | $1,127.40 | 1.75 | % | $9.33 | |||||||||||
Class Y | 1,000.00 | 1,128.30 | 1.50 | 8.00 | ||||||||||||
Hypothetical 5% Return |
| |||||||||||||||
Class A | $1,000.00 | $1,016.29 | 1.75 | % | $8.85 | |||||||||||
Class Y | 1,000.00 | 1,017.55 | 1.50 | 7.59 | ||||||||||||
| Beginning Account Value 4/1/16 | Ending Account Value 9/30/16 | Annualized Expense Ratios | Expenses Paid During Period * | |||||||||||||
International Fixed Income Fund |
| |||||||||||||||
Actual Fund Return |
| |||||||||||||||
Class A | $1,000.00 | $1,034.40 | 1.03 | % | $5.25 | |||||||||||
Class Y | 1,000.00 | 1,035.50 | 0.78 | 3.98 | ||||||||||||
Hypothetical 5% Return |
| |||||||||||||||
Class A | $1,000.00 | $1,019.90 | 1.03 | % | $5.22 | |||||||||||
Class Y | 1,000.00 | 1,021.16 | 0.78 | 3.95 | ||||||||||||
Emerging Markets Debt Fund |
| |||||||||||||||
Actual Fund Return |
| |||||||||||||||
Class A | $1,000.00 | $1,073.50 | 1.37 | % | $7.12 | |||||||||||
Class Y | 1,000.00 | 1,075.50 | 1.12 | 5.83 | ||||||||||||
Hypothetical 5% Return |
| |||||||||||||||
Class A | $1,000.00 | $1,018.20 | 1.37 | % | $6.93 | |||||||||||
Class Y | 1,000.00 | 1,019.45 | 1.12 | 5.67 | ||||||||||||
* Expenses are equal to the Fund’s annualized expense ratio multiplied by the average account value over the period, multiplied by 183/365 (to reflect the one-half year period shown).
SEI Institutional International Trust / Annual Report / September 30, 2016 |
91 |
BOARD OF TRUSTEES’ CONSIDERATIONS IN APPROVING THE ADVISORY AND SUB-ADVISORY AGREEMENTS (Unaudited)
SEI Institutional International Trust (the “Trust”) and SEI Investments Management Corporation (“SIMC”) have entered into an investment advisory agreement (the “Advisory Agreement”). Pursuant to the Advisory Agreement, SIMC is responsible for the investment advisory services provided to the series of the Trust (the “Funds”). Pursuant to separate sub-advisory agreements with SIMC (the “Sub-Advisory Agreements” and, together with the Advisory Agreement, the “Investment Advisory Agreements”), and under the supervision of SIMC and the Trust’s Board of Trustees (the “Board”), the sub-advisers (each, a “Sub-Adviser” and collectively, the “Sub-Advisers”) provide security selection and certain other advisory services with respect to all or a discrete portion of the assets of the Funds. The Sub-Advisers are also responsible for managing their employees who provide services to the Funds. The Sub-Advisers are selected based primarily upon the research and recommendations of SIMC, which evaluates quantitatively and qualitatively the Sub-Advisers’ skills and investment results in managing assets for specific asset classes, investment styles and strategies.
The Investment Company Act of 1940, as amended (the “1940 Act”), requires that the initial approval of, as well as the continuation of, the Funds’ Investment Advisory Agreements be specifically approved: (i) by the vote of the Board or by a vote of the shareholders of the Funds; and (ii) by the vote of a majority of the Trustees who are not parties to the Investment Advisory Agreements or “interested persons” of any party (the “Independent Trustees”), cast in person at a meeting called for the purpose of voting on such approval(s). In connection with their consideration of such approval(s), the Funds’ Trustees must request and evaluate, and SIMC and the Sub-Advisers are required to furnish, such information as may be reasonably necessary to evaluate the terms of the Investment Advisory Agreements. In addition, the Securities and Exchange Commission takes the position that, as part of their fiduciary duties with respect to a mutual fund’s fees, mutual fund boards are required to evaluate the material factors applicable to a decision to approve an Investment Advisory Agreement.
Consistent with these responsibilities, the Board calls and holds meetings each year to consider whether to approve new and/or renew existing Investment Advisory Agreements between the Trust and SIMC and SIMC and the Sub-Advisers with respect to the Funds of the Trust. In preparation for these meetings, the Board requests and reviews a wide variety of materials provided by SIMC and the Sub-Advisers, including information about SIMC’s and the Sub-Advisers’ affiliates, personnel and operations and the services provided pursuant to the Investment Advisory Agreements. The Board also receives data from third parties. This information is provided in addition to the detailed information about the Funds that the Board reviews during the course of each year, including information that relates to Fund operations and Fund performance. The Trustees also receive a memorandum from counsel regarding the responsibilities of Trustees in connection with their consideration of whether to approve the Trust’s Investment Advisory Agreements. Finally, the Independent Trustees receive advice from independent counsel to the Independent Trustees, meet in executive sessions outside the presence of Fund management and participate in question and answer sessions with representatives of SIMC and the Sub-Advisers.
Specifically, during the course of the Trust’s fiscal year, the Board requested and received written materials from SIMC and the Sub-Advisers regarding: (i) the quality of SIMC’s and the Sub-Advisers’ investment management and other services; (ii) SIMC’s and the Sub-Advisers’ investment management personnel; (iii) SIMC’s and the Sub-Advisers’ operations and financial condition; (iv) SIMC’s and the Sub-Advisers’ brokerage practices (including any soft dollar arrangements) and investment strategies; (v) the level of the advisory fees that SIMC charges the Funds and the level of the sub-advisory fees that SIMC pays the Sub-Advisers, compared with fees each charge to comparable accounts; (vi) the advisory fees charged by SIMC and the Funds’ overall fees and operating expenses compared with peer groups of mutual funds prepared by Broadridge, an independent provider of investment company data; (vii) the level of SIMC’s and the Sub-Advisers’ profitability from their Fund-related operations; (viii) SIMC’s and the Sub-Advisers’ compliance program, including a description of material compliance matters and material compliance violations; (ix) SIMC’s potential economies of scale; (x) SIMC’s and the Sub-Advisers’ policies on and compliance procedures for personal securities transactions; (xi) SIMC’s and the Sub-Advisers’ expertise and resources in domestic and/or international financial markets; and (xii) the Funds’ performance over various periods of time compared with peer groups of mutual funds prepared by Broadridge and the Funds’ benchmark indices.
At the March 28-30, 2016 meeting of the Board, the Trustees, including a majority of the Independent Trustees, approved the renewal of the Advisory Agreement. Also, each Sub-Advisory Agreement was either initially approved or, if the Sub-Advisory Agreement was already in effect (unless operating under an initial two-year term), renewed at meetings of the Board held during the course of the Trust’s fiscal year on December 7-9, 2015, June 20-22, 2016 and September 13-14, 2016. In each case, the Board’s approval (or renewal) was based on its consideration
92 |
SEI Institutional International Trust / Annual Report / September 30, 2016 |
and evaluation of the factors described above, as discussed at the meetings and at prior meetings. The following discusses some, but not all, of the factors that were considered by the Board in connection with its assessment of the Investment Advisory Agreements.
Nature, Extent and Quality of Services. The Board considered the nature, extent and quality of the services provided by SIMC and the Sub-Advisers to the Funds and the resources of SIMC and the Sub-Advisers and their affiliates dedicated to the Funds. In this regard, the Trustees evaluated, among other things, SIMC’s and each Sub-Adviser’s personnel, experience, track record and compliance program. Following evaluation, the Board concluded that, within the context of its full deliberations, the nature, extent and quality of services provided by SIMC and the Sub-Advisers to the Funds and the resources of SIMC and the Sub-Advisers and their affiliates dedicated to the Funds were sufficient to support the renewal of the Investment Advisory Agreements. In addition to advisory services, the Board considered the nature and quality of certain administrative, transfer agency and other non-investment advisory services provided to the Funds by SIMC and/or its affiliates.
Performance. In determining whether to renew SIMC’s Advisory Agreement, the Trustees considered the Funds’ performance relative to their peer groups and appropriate indexes/benchmarks. The Trustees reviewed performance information for each Fund, noting that they receive performance reports that permit them to monitor each Fund’s performance at board meetings throughout the year. As part of this review, the Trustees considered the composition of each peer group and selection criteria. In assessing Fund performance, the Trustees considered a report compiled by Broadridge, an independent third-party that was engaged to prepare an assessment of the Funds in connection with the renewal of the Advisory Agreement (the “Broadridge Report”). The Broadridge Report included metrics on risk analysis, volatility versus total return, net total return and performance consistency for the Funds and a universe of comparable funds. Based on the materials considered and discussed at the meetings, the Trustees found Fund performance satisfactory, or, where performance was materially below the benchmark and/or peer group, the Trustees were satisfied with the reasons provided to explain such performance. In connection with the approval or renewal of Sub-Advisory Agreements, the Board considered the performance of the Sub-Adviser relative to appropriate indexes/benchmarks. Following evaluation, the Board concluded that, within the context of its full deliberations, the performance of the Funds was sufficient to support renewal of SIMC’s Advisory Agreement, and the performance of each Sub-Adviser was sufficient support approval or renewal of the Sub-Advisory Agreement.
Fees. With respect to the Funds’ expenses under the Investment Advisory Agreements, the Trustees considered the rate of compensation called for by the Investment Advisory Agreements and the Funds’ net operating expense ratio in comparison to those of the Funds’ respective peer groups. In assessing Fund expenses, the Trustees considered the information in the Broadridge Report, which included various metrics related to fund expenses, including, but not limited to, contractual management fees at various fee levels, actual management fees (including transfer agent expenses), and actual total expenses for the Funds and a universe of comparable funds. Based on the materials considered and discussion at the meetings, the Trustees further determined that fees were either shown to be below the peer average in the comparative fee analysis, or that there was a reasonable basis for the fee level. The Trustees also considered the effects of SIMC’s contractual waiver of its management fee with respect to the Emerging Markets Equity Fund and its voluntary waiver of management and other fees to prevent total Fund operating expenses from exceeding a specified cap and concluded that SIMC, through waivers, has maintained the Funds’ net operating expenses at competitive levels for its distribution channels. In determining the appropriateness of fees, the Board also took into consideration the impact of fees incurred indirectly by the Funds as a result of investments into underlying funds, including funds from which SIMC or its affiliates earn fees. The Board also took into consideration compensation earned from the Funds by SIMC or its affiliates for non-advisory services, such as administration, transfer agency, shareholder services or brokerage, and considered whether SIMC and its affiliates may have realized other benefits from their relationship with the Funds, such as any research and brokerage services received under soft dollar arrangements. When considering fees paid to Sub-Advisers, the Board took into account the fact that the Sub-Advisers are compensated by SIMC and not by the Funds directly, and that such compensation with respect to any unaffiliated Sub-Adviser reflects an arms-length negotiation between the Sub-Adviser and SIMC. Following evaluation, the Board concluded that, within the context of its full deliberations, the expenses of the Funds are reasonable and supported renewal of the Investment Advisory Agreements. The Board also considered whether the Sub-Advisers and their affiliates may have realized other benefits from their relationship with the Funds, such as any research and brokerage services received under soft dollar arrangements.
SEI Institutional International Trust / Annual Report / September 30, 2016 |
93 |
BOARD OF TRUSTEES’ CONSIDERATIONS IN APPROVING THE ADVISORY AND SUB-ADVISORY AGREEMENTS (Unaudited) (Concluded)
Profitability. With regard to profitability, the Trustees considered compensation flowing to SIMC and the Sub-Advisers and their affiliates, directly or indirectly. The Trustees considered whether the levels of compensation and profitability were reasonable. As with the fee levels, when considering the profitability of the Sub-Advisers, the Board took into account the fact that compensation with respect to any unaffiliated Sub-Adviser reflects an arms-length negotiation between the Sub-Adviser and SIMC. In connection with the approval or renewal of each Sub-Advisory Agreement, the Board also took into consideration the impact that the fees paid to the Sub-Adviser have on SIMC’s advisory fee margin and profitability. Based on this evaluation, the Board concluded that, within the context of its full deliberations, the profitability of each of SIMC and the Sub-Advisers is reasonable and supported renewal of the Investment Advisory Agreements.
Economies of Scale. With respect to the Advisory Agreement, the Trustees considered whether any economies of scale were being realized by SIMC and their affiliates and, if so, whether the benefits of such economies of scale were passed along to the Funds’ shareholders through a graduated investment advisory fee schedule or other means, including any fee waivers by SIMC and its affiliates. The Trustees recognized that economies of scale are difficult to identify and quantify and are rarely identifiable on a fund-by-fund basis. Based on this evaluation, the Board determined that the fees were reasonable in light of the information that was provided by SIMC with respect to economies of scale.
Based on the Trustees’ deliberation and their evaluation of the information described above, the Board, including all of the Independent Trustees, with the assistance of Fund counsel and Independent Trustees’ counsel, unanimously approved the approval or renewal, as applicable, of the Investment Advisory Agreements and concluded that the compensation under the Investment Advisory Agreements is fair and reasonable in light of such services and expenses and such other matters as the Trustees considered to be relevant in the exercise of their reasonable judgment. In the course of its deliberations, the Board did not identify any particular factor (or conclusion with respect thereto) or single piece of information that was all-important, controlling or determinative of its decision, but considered all of the factors together, and each Trustee may have attributed different weights to the various factors (and conclusions with respect thereto) and information.
94 |
SEI Institutional International Trust / Annual Report / September 30, 2016 |
SHAREHOLDER VOTING RESULTS (Unaudited)
A Special Meeting of Shareholders of the SEI Institutional International Trust (the “Trust”) was held on March 14, 2016 for the purpose of considering the proposal to elect, as a slate of nominees, each of the current Trustees and one new Trustee to the Board of Trustees of the Trust. The proposal was approved with the following voting results:
| Trustee | Shares Voted | |||
Robert A. Nesher | ||||
For | 323,177,985.998 | |||
Withheld | 11,044,927.645 | |||
William M. Doran | ||||
For | 323,024,942.163 | |||
Withheld | 11,197,971.480 | |||
George J. Sullivan, JR. | ||||
For | 323,096,139.758 | |||
Withheld | 11,126,773.885 | |||
Nina Lesavoy | ||||
For | 323,262,205.837 | |||
Withheld | 10,960,707.806 | |||
James M. Williams | ||||
For | 323,146,095.237 | |||
Withheld | 11,076,818.406 | |||
Mitchell A. Johnson | ||||
For | 323,108,533.129 | |||
Withheld | 11,114,380.514 | |||
Hubert L. Harris, JR. | ||||
For | 323,070,850.003 | |||
Withheld | 11,152,063.640 | |||
Susan C. Cote | ||||
For | 323,245,529.226 | |||
Withheld | 10,977,384.417 | |||
A Special Meeting of Shareholders of the SEI Institutional International Trust (the “Trust”) was held on March 14, 2016 for the purpose of considering the proposal to amend the Agreement and Declaration of Trust for the Trust to reduce the shareholder quorum requirement from a majority to one-third (33 – 1/3%). The proposal was not approved. The voting results were as follows:
| Shares Voted | ||||
For | 289,620,063.037 | |||
Against | 25,993,139.004 | |||
Abstain | 12,007,918.012 | |||
Broker Non-Vote | 6,601,793.590 | |||
SEI Institutional International Trust / Annual Report / September 30, 2016 |
95 |
NOTICE TO SHAREHOLDERS (Unaudited)
For shareholders who do not have a September 30, 2016, taxable year end, this notice is for informational purposes only. For shareholders with a September 30, 2016, taxable year end, please consult your tax adviser as to the pertinence of this notice.
For the fiscal year ended September 30, 2016, the Funds are designating long term and qualifying dividend income with regard to distributions paid during the year as follows:
| (A) Return of Capital | (B) Long Term | (C) Ordinary | (D) Total | (E) Dividends | (F) Qualifying | (G) U.S. | (H) Interest | (I) Short-Term | ||||||||||
International Equity Fund | 0.00% | 0.00% | 100.00% | 100.00% | 0.00% | 100.00% | 0.00% | 0.00% | 0.00% | |||||||||
Emerging Markets Equity Fund | 0.00% | 0.00% | 100.00% | 100.00% | 0.00% | 100.00% | 0.00% | 0.00% | 0.00% | |||||||||
International Fixed Income Fund | 0.00% | 0.15% | 99.85% | 100.00% | 0.00% | 0.00% | 0.05% | 0.00% | 100.00% | |||||||||
Emerging Markets Debt Fund | 0.00% | 0.00% | 0.00% | 0.00% | 0.00% | 0.00% | 0.00% | 0.00% | 0.00% |
The Funds intend to pass through foreign tax credit to shareholders. For the fiscal year ended September 30, 2016, the amount of foreign source income and foreign tax credit are as follows:
| Fund | Foreign Source Income | Foreign Tax Credit Pass Through | ||||||
International Equity | $79,514,158 | $3,062,351 | ||||||
Emerging Markets Equity | 37,530,457 | 3,709,941 | ||||||
| (1) | “Dividends Received Deduction” represent dividends which qualify for the corporate dividends received deduction. |
| (2) | “Qualifying Dividend Income” represent qualifying dividends as created by the Jobs and Growth Tax Relief Reconciliation Act of 2003. It is the intention of the Fund to designate the max amount permitted by law. |
| (3) | “U.S. Government Interest” represent the amount of interest that was derived from direct U.S. Government obligations and distributed during the fiscal year. Generally, interest from direct U.S. Government obligations is exempt from state income tax. However, for shareholders who are residents of California, Connecticut or New York, the statutory threshold requirements were not satisfied to permit exemption of these amounts from state income. |
| (4) | The percentage in this column represents the amount of “Interest Related Dividend” is reflected as a percentage of ordinary income distribution. Interest related dividends is exempted from U.S. withholding tax when paid to foreign investors. |
| (5) | The percentage of this column represents the amount of “Short Term Capital Gain Dividend” is reflected as a percentage of short term capital gain distribution that is exempted from U.S. withholding tax when paid to foreign investors. |
Items (A), (B), (C) and (D) are based on the percentage of each fund’s total distribution.
Items (E) and (F) are based on the percentage of “Ordinary Income Distributions.”
Item (G) is based on the percentage of gross income of each Fund.
Item (H) is based on the percentage of net investment income distributions.
Item (I) is based on the percentage of short-term capital gains distributions.
Please consult your tax adviser for proper treatment of this information. This notification should be kept with your permanent tax records.
96 |
SEI Institutional International Trust / Annual Report / September 30, 2016 |
SEI INSTITUTIONAL INTERNATIONAL TRUST ANNUAL REPORT SEPTEMBER 30, 2016
Robert A. Nesher, Chairman |
Trustees |
William M. Doran |
George J. Sullivan, Jr. |
Nina Lesavoy |
James M. Williams |
Mitchell A. Johnson |
Susan Cote |
Hubert L. Harris, Jr. |
Officers |
Robert A. Nesher |
President and Chief Executive Officer |
James J. Hoffmayer |
Controller and Chief Financial Officer |
Russell Emery |
Chief Compliance Officer |
Timothy D. Barto |
Vice President, Secretary |
David F. McCann |
Vice President, Assistant Secretary |
Aaron Buser |
Vice President, Assistant Secretary |
Stephen G. MacRae |
Vice President |
Bridget E. Sudall |
Anti-Money Laundering Compliance Officer |
Privacy Officer |
| Investment Adviser |
| SEI Investments Management Corporation |
| Administrator |
| SEI Investments Global Funds Services |
| Distributor |
| SEI Investments Distribution Co. |
| Legal Counsel |
| Morgan, Lewis & Bockius LLP |
| Independent Registered Public Accounting Firm |
| KPMG LLP |
This report and the financial statements contained herein are submitted for the general information of the shareholders of the Trust and must be preceded or accompanied by a current prospectus. Shares of the Funds are not deposits or obligations of, or guaranteed or endorsed by, any bank. The shares are not federally insured by the Federal Deposit Insurance Corporation (FDIC), the Federal Reserve Board, or any other government agency. Investment in the shares involves risk, including the possible loss of principal. |
| For more information call |
| 1 800 DIAL SEI |
| (1 800 342 5734) |

1 Freedom Valley Drive, P.O. Box 1100, Oaks, PA 19456
SEI-F-018 (9/16)
| Item 2. | Code of Ethics. |
The Registrant has adopted a code of ethics that applies to the Registrant’s principal executive officer, principal financial officer, principal accounting officer or controller, or persons performing similar functions.
| Item 3. | Audit Committee Financial Expert. |
(a)(1) The Registrant’s Board of Trustees has determined that the Registrant has at least two audit committee financial experts serving on the audit committee.
(a) (2) The audit committee financial experts are George J. Sullivan, Jr. and Hubert L. Harris, Jr. Messrs. Sullivan and Harris are independent as defined in Form N-CSR Item 3 (a) (2).
| Item 4. | Principal Accountant Fees and Services. |
Fees billed by KPMG LLP (“KPMG”) related to the Registrant.
KPMG billed the Registrant aggregate fees for services rendered to the Registrant for the fiscal years 2016 and 2015 as follows:
| Fiscal 2016 | Fiscal 2015 | |||||||||||||
| All fees and services to the Registrant that were pre- approved | All fees and services to service affiliates that were pre- approved | All other fees and services to service affiliates that did not require pre- approval | All fees and approved | All fees and services to service affiliates that were pre- approved | All other fees and services to service affiliates that did not require pre- approval | |||||||||
(a) | Audit Fees(1) | $198,500 | $0 | N/A | $200,500 | $0 | N/A | |||||||
(b) | Audit-Related Fees | $0 | $0 | $0 | $0 | $0 | $0 | |||||||
(c) | Tax Fees | $0 | $0 | $0 | $0 | $0 | $0 | |||||||
(d) | All Other Fees(2) | $0 | $325,515 | $0 | $0 | $240,350 | $0 | |||||||
Notes:
| (1) | Audit fees include amounts related to the audit of the Registrant’s annual financial statements and services normally provided by the accountant in connection with statutory and regulatory filings. |
| (2) | See Item 4(g) for a description of the services comprising the fees disclosed under this category. |
(e)(1) The Registrant’s Audit Committee has adopted and the Board of Trustees has ratified an Audit and Non-Audit Services Pre-Approval Policy (the “Policy”), which sets forth the procedures and the conditions pursuant to which services proposed to be performed by the independent auditor of the Registrant may be pre-approved.
The Policy provides that all requests or applications for proposed services to be provided by the independent auditor must be submitted to the Registrant’s Chief Financial Officer (“CFO”) and must include a detailed description of the services proposed to be rendered. The CFO will determine whether such services: (1) require specific pre-approval; (2) are included within the list of services that have received the general pre-approval of the Audit Committee pursuant to the Policy; or (3) have been previously pre-approved in connection with the independent auditor’s annual engagement letter for the applicable year or otherwise. In any instance where services require pre-approval, the Audit Committee will consider whether such services are consistent with SEC’s rules and whether the provision of such services would impair the auditor’s independence.
Requests or applications to provide services that require specific pre-approval by the Audit Committee will be submitted to the Audit Committee by the CFO. The Audit Committee will be informed by the CFO on a quarterly basis of all services rendered by the independent auditor. The Audit Committee has delegated specific pre-approval authority to either the Audit Committee Chair or financial experts, provided that the estimated fee for any such proposed pre-approved service does not exceed $100,000 and any pre-approval decisions are reported to the Audit Committee at its next regularly scheduled meeting.
Services that have received the general pre-approval of the Audit Committee are identified and described in the Policy. In addition, the Policy sets forth a maximum fee per engagement with respect to each identified service that has received general pre-approval.
All services to be provided by the independent auditor shall be provided pursuant to a signed written engagement letter with the Registrant, the investment advisor or applicable control affiliate (except that matters as to which an engagement letter would be impractical because of timing issues or because the matter is small may not be the subject of an engagement letter) that sets forth both the services to be provided by the independent auditor and the total fees to be paid to the independent auditor for those services.
In addition, the Audit Committee has determined to take additional measures on an annual basis to meet its responsibility to oversee the work of the independent auditor and to assure the auditor’s independence from the Registrant, such as reviewing a formal written statement from the independent auditor delineating all relationships between the independent auditor and the Registrant, and discussing with the independent auditor its methods and procedures for ensuring independence.
(e)(2) Percentage of fees billed applicable to non-audit services pursuant to waiver of pre-approval requirement were as follows:
| Fiscal 2016 | Fiscal 2015 | |||
Audit-Related Fees | 0% | 0% | ||
Tax Fees | 0% | 0% | ||
All Other Fees | 0% | 0% |
(f) Not Applicable.
(g)(1) The aggregate non-audit fees and services billed by KPMG for the fiscal years 2016 and 2015 were $325,515 and $240,350, respectively. Non-audit fees consist of SSAE No.16 review of fund accounting and administration operations, and an attestation report in accordance with Rule 17Ad-13.
(h) During the past fiscal year, Registrant’s principal accountant provided certain non-audit services to Registrant’s investment adviser or to entities controlling, controlled by, or under common control with
Registrant’s investment adviser that provide ongoing services to Registrant that were not subject to pre-approval pursuant to paragraph (c)(7)(ii) of Rule 2-01 of Regulation S-X. The Audit Committee of Registrant’s Board of Trustees reviewed and considered these non-audit services provided by Registrant’s principal accountant to Registrant’s affiliates, including whether the provision of these non-audit services is compatible with maintaining the principal accountant’s independence.
| Item 5. | Audit Committee of Listed Registrants. |
Not applicable.
| Item 6. | Schedule of Investments |
The Schedules of Investments in securities of unaffiliated issuers as of the close of the reporting period for the International Equity Fund, Emerging Markets Equity Fund, International Fixed Income Fund, and Emerging Markets Debt Fund are included as part of the report to shareholders filed under Item 1 of this form.
| Item 7. | Disclosure of Proxy Voting Policies and Procedures for Closed-End Management Investment Companies. |
Not applicable.
| Item 8. | Portfolio Managers of Closed-End Management Investment Companies |
Not applicable.
| Item 9. | Purchases of Equity Securities by Closed-End Management Company and Affiliated Purchasers. |
Not applicable.
| Item 10. | Submission of Matters to a Vote of Security Holders. |
The Registrant has a standing Governance Committee (the “Committee”) currently consisting of the Independent Trustees. The Committee is responsible for evaluating and recommending nominees for election to the Registrant’s Board of Trustees (the “Board”). Pursuant to the Committee’s Charter, adopted on June 18, 2004, as amended, the Committee will review all shareholder recommendations for nominations to fill vacancies on the Board if such recommendations are submitted in writing and addressed to the Committee at the Registrant’s office.
| Item 11. | Controls and Procedures. |
(a) The Registrant’s principal executive and principal financial officers, or persons performing similar functions, have concluded that the Registrant’s disclosure controls and procedures (as defined in Rule 30a-3(c) under the Investment Company Act of 1940 (the “1940 Act”)) are effective, based on the evaluation of these controls and procedures required by Rule 30a-3(b) under the 1940 Act and Rules 13a-15(b) or 15d-15(b) under the Securities Exchange Act of 1934 as of a date within 90 days of the filing date of this report.
(b) There were no changes in the Registrant’s internal control over financial reporting (as defined in Rule 30a-3(d) under the 1940 Act) that occurred during the second fiscal quarter of the period covered by this report that have materially affected, or are reasonably likely to materially affect, the Registrants internal control over financial reporting.
| Items 12. | Exhibits. |
(a)(1) Code of Ethics attached hereto.
(a)(2) A separate certification for the principal executive officer and the principal financial officer of the Registrant as required by Rule 30a-2(a) under the Investment Company Act of 1940, as amended (17 CFR 270.30a-2(a)), are filed herewith.
(b) Officer certifications as required by Rule 30a-2(b) under the Investment Company Act of 1940, as amended (17 CFR 270.30a-2(b)) also accompany this filing as exhibits.
SIGNATURES
Pursuant to the requirements of the Securities Exchange Act of 1934 and the Investment Company Act of 1940, the Registrant has duly caused this report to be signed on its behalf by the undersigned, thereunto duly authorized.
| SEI Institutional International Trust | ||||||
| By: | /s/ Robert A. Nesher | |||||
| Robert A. Nesher | ||||||
| President & CEO | ||||||
Date: December 8, 2016
Pursuant to the requirements of the Securities Exchange Act of 1934 and the Investment Company Act of 1940, this report has been signed below by the following persons on behalf of the Registrant and in the capacities and on the dates indicated.
| By: | /s/ Robert A. Nesher | |||||
| Robert A. Nesher | ||||||
| President & CEO |
Date: December 8, 2016
| By: | /s/ James J. Hoffmayer | |||||
| James J. Hoffmayer | ||||||
| Controller & CFO |
Date: December 8, 2016