[ANNOTATED FORM N-CSR FOR ANNUAL REPORTS]
UNITED STATES
SECURITIES AND EXCHANGE COMMISSION
Washington, D.C. 20549
FORM N-CSR
CERTIFIED SHAREHOLDER REPORT OF REGISTERED
MANAGEMENT INVESTMENT COMPANIES
Investment Company Act file number | 811-05624 | |||||||
| ||||||||
Morgan Stanley Institutional Fund, Inc. | ||||||||
(Exact name of registrant as specified in charter) | ||||||||
| ||||||||
1221 Avenue of the Americas 22nd Floor New York, NY |
| 10020 | ||||||
(Address of principal executive offices) |
| (Zip code) | ||||||
| ||||||||
Ronald E. Robison | ||||||||
(Name and address of agent for service) | ||||||||
| ||||||||
Registrant’s telephone number, including area code: | 1-800-221-6726 |
| ||||||
| ||||||||
Date of fiscal year end: | 12/31 |
| ||||||
| ||||||||
Date of reporting period: | 12/31/05 |
| ||||||
Form N-CSR is to be used by management investment companies to file reports with the Commission not later than 10 days after the transmission to stockholders of any report that is required to be transmitted to stockholders under Rule 30e-1 under the Investment Company Act of 1940 (17 CFR 270.30e-1). The Commission may use the information provided on Form N-CSR in its regulatory, disclosure review, inspection, and policymaking roles.
A registrant is required to disclose the information specified by Form N-CSR, and the Commission will make this information public. A registrant is not required to respond to the collection of information contained in Form N-CSR unless the Form displays a currently valid Office of Management and Budget (“OMB”) control number. Please direct comments concerning the accuracy of the information collection burden estimate and any suggestions for reducing the burden to Secretary, Securities and Exchange Commission, 450 Fifth Street, NW, Washington, DC 20549-0609. The OMB has reviewed this collection of information under the clearance requirements of 44 U.S.C. Section 3507.
ITEM 1. REPORTS TO STOCKHOLDERS.
The Fund’s annual report transmitted to shareholders pursuant to Rule 30e-1 under the Investment Company Act of 1940 is as follows:
| 2005 Annual Report |
| |
December 31, 2005 |

Morgan Stanley Institutional Fund, Inc.
Global and International Equity Portfolios |
| Fixed Income Portfolio |
|
|
|
Active International Allocation |
| Emerging Markets Debt |
Emerging Markets |
|
|
Global Franchise |
| Money Market Portfolios |
Global Value Equity |
|
|
International Equity |
| Money Market |
International Growth Equity |
| Municipal Money Market |
International Magnum |
|
|
International Real Estate |
|
|
International Small Cap |
|
|
|
|
|
U.S. Equity Portfolios |
|
|
|
|
|
Focus Equity |
|
|
Large Cap Relative Value |
|
|
Small Company Growth |
|
|
U.S. Large Cap Growth |
|
|
U.S. Real Estate |
|
|
2005 Annual Report |
|
December 31, 2005 |
Table of Contents
Shareholder’s Letter |
| 3 |
Performance Summary |
| 4 |
Investment Overview and Portfolios of Investments |
|
|
Global and International Equity Portfolios: |
|
|
Active International Allocation |
| 6 |
Emerging Markets |
| 20 |
Global Franchise |
| 27 |
Global Value Equity |
| 31 |
International Equity |
| 37 |
International Growth Equity |
| 42 |
International Magnum |
| 46 |
International Real Estate |
| 53 |
International Small Cap |
| 58 |
|
|
|
U.S. Equity Portfolios: |
|
|
Focus Equity |
| 63 |
Large Cap Relative Value |
| 67 |
Small Company Growth |
| 72 |
U.S. Large Cap Growth |
| 77 |
U.S. Real Estate |
| 82 |
|
|
|
Fixed Income Portfolio: |
|
|
Emerging Markets Debt |
| 87 |
|
|
|
Money Market Portfolios: |
|
|
Money Market |
| 93 |
Municipal Money Market |
| 96 |
|
|
|
Statements of Assets and Liabilities |
| 101 |
Statements of Operations |
| 105 |
Statements of Changes in Net Assets |
| 109 |
Financial Highlights |
| 117 |
Notes to Financial Statements |
| 133 |
Report of Independent Registered |
|
|
Public Accounting Firm |
| 143 |
Federal Income Tax Information |
| 144 |
Director and Officer Information |
| 146 |
This report is authorized for distribution only when preceded or accompanied by prospectuses of the Morgan Stanley Institutional Fund, Inc. To receive a prospectus and/or SAI, which contains more complete information such as investment objectives, charges, expenses, policies for voting proxies, risk considerations, and describes in detail each of the Portfolio’s investment policies to the prospective investor, please call 1-(800)-548-7786. Please read the prospectuses carefully before you invest or send money. Additionally, you can access portfolio information including performance, characteristics, and investment team commentary through Morgan Stanley Investment Management’s website: www.morganstanley.com/im.
1
| 2005 Annual Report |
| |
December 31, 2005 |
Shareholder’s Letter
Dear Shareholders:
We are pleased to present to you the Fund’s Annual Report for the year ended December 31, 2005. Our Fund currently offers 17 portfolios providing investors with a full array of global and domestic equity and fixed-income products. The Fund’s portfolios, together with the portfolios of the Morgan Stanley Institutional Fund Trust, provide investors with a means to help them meet specific investment needs and to allocate their investments among equities (e.g., value and growth; small, medium, and large capitalization), fixed income (e.g., short, medium, and long duration; investment grade and high yield) and cash (e.g., money market).
Sincerely,

Ronald E. Robison
President and Principal Executive Officer
January 2006
2 |
|
2005 Annual Report |
|
December 31, 2005 |
Performance Summary
|
| Inception Dates |
|
|
| One Year |
| ||||||||
|
| Class A |
| Class B |
| Class A | Class B | Comparable |
| ||||||
Global and International Equity Portfolios: |
|
|
|
|
|
|
|
|
|
| |||||
Active International Allocation |
| 1/17/92 |
| 1/2/96 |
| 14.85 | % | 14.67 | % | 13.54 | % | (1) | |||
Emerging Markets |
| 9/25/92 |
| 1/2/96 |
| 34.54 |
| 34.17 |
| 34.00 | (2) | ||||
Global Franchise |
| 11/28/01 |
| 11/28/01 |
| 11.91 |
| 11.53 |
| 9.49 | (4) | ||||
Global Value Equity |
| 7/15/92 |
| 1/2/96 |
| 5.81 |
| 5.59 |
| 9.49 | (4) | ||||
International Equity |
| 8/4/89 |
| 1/2/96 |
| 6.45 |
| 6.20 |
| 13.54 | (1) | ||||
International Growth Equity† |
| 12/27/05 |
| 12/27/05 |
| — |
| — |
| — | (1) | ||||
International Magnum |
| 3/15/96 |
| 3/15/96 |
| 11.35 |
| 11.04 |
| 13.54 | (1) | ||||
International Real Estate |
| 10/1/97 |
| 10/1/97 |
| 15.52 |
| 15.22 |
| 12.17 | (3) | ||||
International Small Cap |
| 12/15/92 |
| — |
| 13.07 |
| — |
| 26.19 | (5) | ||||
U.S. Equity Portfolios: |
|
|
|
|
|
|
|
|
|
|
| ||||
Focus Equity |
| 3/8/95 |
| 1/2/96 |
| 17.60 |
| 17.30 |
| 5.26 | (6) | ||||
Large Cap Relative Value |
| 1/31/90 |
| 1/2/96 |
| 10.07 |
| 9.81 |
| 7.05 | (9) | ||||
Small Company Growth |
| 11/1/89 |
| 1/2/96 |
| 13.55 |
| 13.35 |
| 4.15 | (7) | ||||
U.S. Large Cap Growth |
| 4/2/91 |
| 1/2/96 |
| 15.72 |
| 15.41 |
| 5.26 | (6) | ||||
U.S. Real Estate |
| 2/24/95 |
| 1/2/96 |
| 17.66 |
| 17.37 |
| 12.16 | (8) | ||||
Fixed Income Portfolio: |
|
|
|
|
|
|
|
|
|
|
| ||||
Emerging Markets Debt |
| 2/1/94 |
| 1/2/96 |
| 12.78 |
| 12.54 |
| 10.73 | (10) | ||||
Money Market Portfolios: |
|
|
|
|
|
|
|
|
|
|
| ||||
Money Market |
| 11/15/88 |
| — |
| — |
| — |
| — |
| ||||
Municipal Money Market |
| 2/10/89 |
| — |
| — |
| — |
| — |
| ||||
Yield Information as of December 31, 2005
|
| 7 Day | 7 Day | 30 Day | 30 Day |
|
|
| ||||
|
| Current | Effective | Current | Comparable |
|
|
| ||||
|
| Yield†† | Yield†† | Yield††† | Yield |
|
|
| ||||
Money Market Portfolios: |
|
|
|
|
|
|
|
|
|
|
| |
Money Market |
| 3.94 | % | 4.01 | % | 3.88 | % | 3.60 | % (11) |
|
| |
Municipal Money Market |
| 3.02 |
| 3.07 |
| 2.72 |
| 2.51 | (12) |
|
| |
† Performance figures are not supplied as the Portfolio commenced operations on December 27, 2005.
†† The 7 day current yield and 7 day effective yield assume an annualization of the current yield with all dividends reinvested. As with all money market portfolios, yields will fluctuate as market conditions change and the 7 day yields are not necessarily indicative of future performance.
††† The 30 day current yield reflects the net investment income generated by the Portfolio over a specified 30 day period expressed as an annual percentage. Expenses accrued for the 30 day period include any fees charged to all shareholders. Yields will fluctuate as market conditions change and are not necessarily indicative of future performance.
3
| 2005 Annual Report |
|
|
| December 31, 2005 |
Performance Summary (cont’d)
Five Year |
| Ten Year |
| Since Inception |
| ||||||||||||||||||||||||||
|
|
|
| Comparable |
|
|
|
|
| Comparable |
|
|
| Comparable |
|
|
| Comparable |
| ||||||||||||
Class A | Class B | Indices |
| Class A | Class B |
| Indices |
| Class A | Class A |
| Class B | Class B |
| |||||||||||||||||
5.08 | % | 4.82 | % | 4.55 | % | (1) | 7.14 | % | — |
| 5.84 | % | (1) | 7.51 | % | 7.02 | % | 6.88 | % | 5.83 | % | (1) | |||||||||
18.33 |
| 18.03 |
| 19.09 | (2) | 9.09 |
| — |
| 6.83 | (2) | 10.08 |
| 9.19 |
| 8.72 |
| 6.76 | (2) | ||||||||||||
— |
| — |
| — | (4) | — |
| — |
| — | (4) | 16.15 |
| 7.85 |
| 15.81 |
| 7.85 | (4) | ||||||||||||
3.40 |
| 3.13 |
| 2.18 | (4) | 9.12 |
| — |
| 7.04 | (4) | 11.39 |
| 8.58 |
| 8.78 |
| 6.99 | (4) | ||||||||||||
8.00 |
| 7.77 |
| 4.55 | (1) | 11.72 |
| — |
| 5.84 | (1) | 11.36 |
| 5.05 |
| 11.39 |
| 5.83 | (1) | ||||||||||||
— |
| — |
| — | (1) | — |
| — |
| — | (1) | — |
| — |
| — |
| — | (1) | ||||||||||||
3.70 |
| 3.42 |
| 4.55 | (1) | — |
| — |
| — | (1) | 5.30 |
| 6.00 |
| 5.02 |
| 6.00 | (1) | ||||||||||||
22.73 |
| 22.40 |
| 20.82 | (3) | — |
| — |
| — | (3) | 14.78 |
| 13.12 |
| 14.49 |
| 13.12 | (3) | ||||||||||||
15.38 |
| — |
| 16.04 | (5) | 12.84 |
| — |
| 5.95 | (5) | 13.64 |
| 7.57 |
| — |
| — | (5) | ||||||||||||
|
|
|
|
|
|
|
|
|
|
|
|
|
|
|
|
|
|
|
| ||||||||||||
(0.09) |
| (0.34 | ) | (3.58) | (6) | 10.80 |
| — |
| 6.73 | (6) | 13.51 |
| 8.77 |
| 10.47 |
| 6.65 | (6) | ||||||||||||
4.28 |
| 4.01 |
| 5.28 | (9) | 10.59 |
| — |
| 10.94 | (9) | 11.06 |
| 12.23 |
| 10.22 |
| 10.88 | (9) | ||||||||||||
5.89 |
| 5.65 |
| 2.28 | (7) | 13.65 |
| — |
| 4.69 | (7) | 13.54 |
| 7.35 |
| 13.38 |
| 4.68 | (7) | ||||||||||||
(0.60) |
| (0.86 | ) | (3.58) | (6) | 9.38 |
| — |
| 6.73 | (6) | 10.95 |
| 8.72 |
| 9.05 |
| 6.65 | (6) | ||||||||||||
19.46 |
| 19.11 |
| 19.08 | (8) | 17.12 |
| — |
| 14.50 | (8) | 17.73 |
| 14.76 |
| 16.71 |
| 14.51 | (8) | ||||||||||||
|
|
|
|
|
|
|
|
|
|
|
|
|
|
|
|
|
|
|
| ||||||||||||
14.43 |
| 14.19 |
| 12.25 | (10) | 12.59 |
| — |
| 12.99 | (10) | 11.37 |
| 11.01 |
| 12.23 |
| 12.86 | (10) | ||||||||||||
— |
| — |
| — |
| — |
| — |
| — |
| — |
| — |
| — |
| — |
| ||||||||||||
— |
| — |
| — |
| — |
| — |
| — |
| — |
| — |
| — |
| — |
| ||||||||||||
Performance data quoted assumes that all dividends and distributions, if any, were reinvested and represents past performance, which is no guarantee of future results. Current performance may be lower or higher than the figures shown. For the most recent month-end performance figures, please visit www.morganstanley.com/im or call 1-800-548-7786. Investment returns and principal value will fluctuate and fund shares, when redeemed, may be worth more or less than their original cost.
Indices: | ||||
| ||||
(1) | MSCI EAFE (Europe, Australasia, and Far East) | (8) |
| National Association of Real Estate Investment Trusts (NAREIT) Equity |
(2) | MSCI Emerging Markets Free | (9) |
| Russell 1000 Value |
(3) | FTSE EPRA/NAREIT Global Real Estate Index | (10) |
| J.P. Morgan Emerging Markets Global Bond |
(4) | MSCI World | (11) |
| iMoneyNet Money Fund Comparable Yield |
(5) | MSCI EAFE Small Cap Total Return | (12) |
| iMoneyNet Municipal Money Fund Comparable Yield |
(6) | Russell 1000 Growth |
|
|
|
(7) | Russell 2000 Growth |
|
|
|
Investments in the Money Market or Municipal Money Market Portfolios are neither insured nor guaranteed by the Federal Deposit Insurance Corporation or any other government agency. Although the Money Market and Municipal Money Market Portfolios seek to preserve the value of your investment at $1.00 per share, it is possible to lose money by investing in these portfolios. Please read the Portfolios’ prospectuses carefully before you invest or send money.
4
2005 Annual Report | |
|
|
December 31, 2005 | |
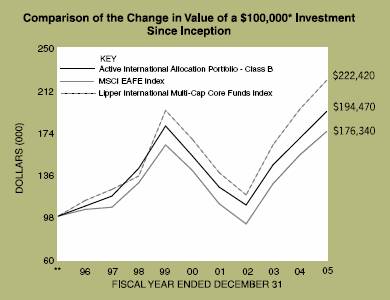
Investment Overview
Active International Allocation Portfolio
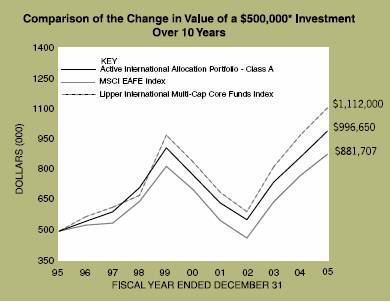
* Minimum Investment
** Commenced offering on January 2, 1996.
In accordance with SEC regulations, Portfolio performance shown assumes that all recurring fees (including management fees) were deducted and all dividends and distributions were reinvested.
Performance Compared to the Morgan Stanley Capital International (MSCI) EAFE Index(1) and the Lipper International Multi-Cap Core Funds Index(2)
|
| Total Returns(3) |
| ||||||
|
|
|
| Average Annual |
| ||||
|
| One |
| Five | Ten |
| Since |
| |
Portfolio – Class A (4) |
| 14.85 | % | 5.08 | % | 7.14 | % | 7.51 | % |
MSCI EAFE Index |
| 13.54 |
| 4.55 |
| 5.84 |
| 7.02 |
|
Lipper International Multi-Cap |
|
|
|
|
|
|
|
|
|
Core Funds Index |
| 13.76 |
| 5.70 |
| 8.32 |
| — |
|
Portfolio – Class B (5) |
| 14.67 |
| 4.82 |
| — |
| 6.88 |
|
MSCI EAFE Index |
| 13.54 |
| 4.55 |
| — |
| 5.83 |
|
Lipper International Multi-Cap |
|
|
|
|
|
|
|
|
|
Core Funds Index |
| 13.76 |
| 5.70 |
| — |
| 8.26 |
|
(1) The MSCI EAFE Index (Europe, Australasia, Far East) is a free float-adjusted market capitalization index that is designed to measure developed market equity performance, excluding the U.S. & Canada. The MSCI EAFE Index consists of the follow- ing 21 developed market country indices: Australia, Austria, Belgium, Denmark, Finland, France, Germany, Greece, Hong Kong, Ireland, Italy, Japan, the Nether- lands, New Zealand, Norway, Portugal, Singapore, Spain, Sweden, Switzerland and the United Kingdom.
(2) The Lipper International Multi-Cap Core Funds Index is an equally weighted performance index of the largest qualifying funds (based on net assets) in the Lipper International Multi-Cap Core Funds classification. The Index, which is adjusted for capital gains distributions and income dividends, is unmanaged and should not be considered an investment. There are currently 10 funds represented in this Index. As of the date of this report, the Portfolio is in the Lipper International Multi-Cap Core Funds classification.
(3) Total returns for the Portfolio reflect fees waived and expenses reimbursed, if applicable, by the Adviser. Without such waivers and reimbursements, total returns would have been lower. Fee waivers and/or expense reimbursements are voluntary and the Adviser reserves the right to commence or terminate any waiver and/or reimbursement at any time.
(4) Commenced operations on January 17, 1992
(5) Commenced offering on January 2, 1996
(6) For comparative purposes, average annual since inception returns listed for the Indexes refer to the inception date or initial offering of the respective share class of the Portfolio, not the inception of the Index.
Performance data quoted represents past performance, which is no guarantee of future results, and current performance may be lower or higher than the figures shown. Performance assumes that all dividends and distributions, if any, were reinvested. For the most recent month-end performance figures, please visit morganstanley.com/im. Investment return and principal value will fluctuate so that Portfolio shares, when redeemed, may be worth more or less than their original cost. Total returns do not reflect the deduction of taxes that a shareholder would pay on Portfolio distributions or the redemption of Portfolio shares.
The Active International Allocation Portfolio seeks long-term capital appreciation by investing primarily, in accordance with country and sector weightings determined by the Adviser, in equity securities of non-U.S. issuers which, in the aggregate, replicate broad market indices. Foreign investing involves certain risks, including currency fluctuations and controls, restrictions on foreign investments, less governmental
5
| 2005 Annual Report |
|
|
| December 31, 2005 |
Investment Overview (cont’d)
Active International Allocation Portfolio
supervision and regulation, less liquidity and the potential for market volatility and political instability.
Performance
For the year ended December 31, 2005, the Portfolio had a total return based on net asset value per share of 14.85%, net of fees, for Class A shares and 14.67%, net of fees, for Class B shares compared to 13.54% for the Morgan Stanley Capital International (MSCI) EAFE Index (the “Index”).
Factors Affecting Performance
• Overall, the international equity markets posted a solid gain in 2005. After a relatively weak start, Japan was the strongest performer for the year. The Asia ex-Japan and Europe regions both posted respectable gains. In our view, it was a testament to the mystery of the markets that European equities did so well in 2005 -given poor economic performance, a European Union constitutional crisis, French immigrant riots, and a stalemated German election. The European Central Bank remained largely on hold, however; the weak Euro helped exports and business sentiment, and corporate profits were often very strong. The United Kingdom continued to struggle with slowing consumer spending and a cooling housing market, although the climate improved as the year progressed and the Bank of England implemented a rate cut in the fourth quarter.
• The Portfolio’s performance for the 12-month period benefited primarily from an overweight to Japan relative to the Index, an underweight to the United Kingdom,and exposure (roughly 4% of the total Portfolio) to emerging markets. Above-benchmark allocations to Hong Kong and Switzerland detracted from performance.
• From a sector perspective, the Portfolio’s overweighted positions relative to the Index in materials, industrials and energy contributed to performance. Anunderweight to healthcare and a slight overweight to information technology were a drag to performance.
Management Strategies
• Throughout the period, our view was that the potential for returns in the international equity market outweighed the risks. Accordingly, the Portfolio was fully invested. Consistent with our long-standingdiscipline, we focused on trying to identify the major regions and sectors that offered the most upside, based on at least a six-month horizon.
• We like the economic and sentiment news we have recently seen out of Europe. At the close of the period, the Portfolio was marginally overweighted versus the Index in Germany, based on our view that the country represented an attractively valued, cyclical European market. The Portfolio has been underweight in the United Kingdom for some time.
• Although the Index does not include emerging markets,the Portfolio included a small stake in emerging markets, with a sprinkling in Brazil, Turkey, Russia, Poland, among others. Emerging markets have been driven higher by earnings growth; hence on a relative basis, we believe emerging markets are not wildly overpriced at this time.
• As of the close of the period, global earnings growth, though off-peak, appears to us to be healthy and supported by quiescent labor costs and reform-driven productivity. So far, the baton of economic growth has seemed to be passing with decent precision from Chinese fixed investment and the U.S. consumer to the Chinese consumer, U.S. business, Japan and Europe. In the U.S., economic growth remains on track, unemployment is low, and the Federal Open Market Committee (the “Fed”) has room to take rates higher, should it need to. European and Japanese central banks have appeared to follow the Fed’s cautionary lead of not being overly zealous. That said, we see potential risk to international equities from a range of factors, such as a U.S. housing market decline, an inability to fund the U.S. deficit, and an exogenous or financial shock which throttles global growth.
Expense Examples
As a shareholder of the Portfolio, you may incur two types of costs: (1) transactional costs, including redemption fees; (2) ongoing costs, including management fees, distribution (12b- 1) fees (in the case of Class B); and other Portfolio expenses. These examples are intended to help you understand your ongoing costs (in dollars) of investing in the Portfolio and to compare these costs with the ongoing costs of investing in other mutual funds.
The examples are based on an investment of $1,000 invested at the beginning of the six-month period ended December 31, 2005 and held for the entire six-month period.
Actual Expenses
The first line of the tables below provides information about actual account values and actual expenses. You may use the information in this line, together with the amount you invested, to estimate the expenses that you paid over the period. Simply divide your account value by $1,000 (for example, an $8,600 account value divided by $1,000 = 8.6), then multiply the result by the number in the first line under the heading entitled “Expenses Paid During Period” to
6
2005 Annual Report | |
|
|
December 31, 2005 | |
Investment Overview (cont’d)
Active International Allocation Portfolio
estimate the expenses you paid on your account during this period.
Hypothetical Example for Comparison Purposes
The second line of the tables below provides information about hypothetical account values and hypothetical expenses based on the Portfolio’s actual expense ratio and an assumed rate of return of 5% per year before expenses, which is not the Portfolio’s actual return. The hypothetical account values and expenses may not be used to estimate the actual ending account balance or expenses you paid for the period. You may use this information to compare the ongoing costs of investing in the Portfolio and other funds. To do so, compare this 5% hypothetical example with the 5% hypothetical examples that appear in the shareholder reports of the other funds.
Please note that the expenses shown in the table are meant to highlight your ongoing costs only and do not reflect any transactional costs, such as redemption fees. Therefore, the second line of the table is useful in comparing ongoing costs only, and will not help you determine the relative total costs of owning different funds. In addition, if these transactional costs were included, your costs would have been higher.
|
|
|
|
|
| Expenses Paid |
| ||
|
|
|
| Ending Account |
| During Period* |
| ||
|
| Beginning |
| Value |
| July 1, 2005 — |
| ||
|
| Account Value |
| December 31, |
| December 31, |
| ||
|
| July 1, 2005 |
| 2005 |
| 2005 |
| ||
Class A |
|
|
|
|
|
|
| ||
Actual |
| $1,000.00 |
|
| $1,169.80 |
| $4.38 |
|
|
Hypothetical (5% average annual return before expenses) |
| 1,000.00 |
|
| 1,021.17 |
| 4.08 |
|
|
|
|
|
|
|
|
|
|
|
|
Class B |
|
|
|
|
|
|
|
|
|
Actual |
| 1,000.00 |
|
| 1,169.90 |
| 5.69 |
|
|
Hypothetical (5% averageannual return before expenses) |
| 1,000.00 |
|
| 1,019.96 |
| 5.30 |
|
|
* Expenses are equal to Class A and Class B annualized net expense ratios of 0.80% and 1.04%, respectively, multiplied by the average account value over the period, multiplied by 184/365 (to reflect the one-half year period).
Graphic Presentation of Portfolio Holdings
The following graph depicts the Portfolio’s holdings by industry and/or security type, as a percentage of total investments.
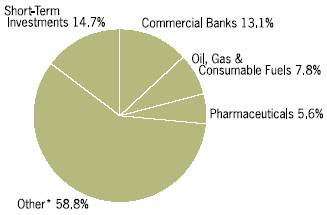
* Industries which do not appear in the above graph, as well as those which represent less than 5% of total investments, if applicable, are included in the category labeled “Other”.
January 2006
7
| 2005 Annual Report |
|
|
| December 31, 2005 |
Portfolio of Investments
Active International Allocation Portfolio
|
|
|
| Value |
| |
|
| Shares |
| (000) |
| |
Common Stocks (91.4%) |
|
|
|
|
| |
Australia (3.0%) |
|
|
|
|
| |
Alumina Ltd. |
| 91,525 |
| $ | 498 |
|
Amcor Ltd. |
| (c)71,068 |
| 389 |
| |
AMP Ltd. |
| 42,736 |
| 241 |
| |
Ansell Ltd. |
| 5,679 |
| 46 |
| |
Australia & New Zealand Banking Group Ltd. |
| 46,465 |
| 816 |
| |
Australian Gas Light Co., Ltd. |
| (c)14,942 |
| 188 |
| |
BHP Billiton Ltd. |
| 282,988 |
| 4,721 |
| |
BlueScope Steel Ltd. |
| (c)57,822 |
| 296 |
| |
Boral Ltd. |
| 47,082 |
| 280 |
| |
Brambles Industries Ltd. |
| 31,812 |
| 236 |
| |
Caltex Australia Ltd. |
| 29,853 |
| 424 |
| |
Coca-Cola Amatil Ltd. |
| (c)16,776 |
| 95 |
| |
Coles Myer Ltd. |
| (c)34,518 |
| 258 |
| |
Commonwealth Bank of Australia |
| 38,394 |
| 1,204 |
| |
CSL Ltd. |
| (c)2,842 |
| 89 |
| |
CSR Ltd. |
| 76,379 |
| 195 |
| |
Foster’s Group Ltd. |
| 65,602 |
| 268 |
| |
Insurance Australia Group Ltd. |
| 54,613 |
| 217 |
| |
James Hardie Industries N.V. |
| 37,648 |
| 248 |
| |
John Fairfax Holdings Ltd. |
| (c)32,240 |
| 95 |
| |
Leighton Holdings Ltd. |
| (c)7,115 |
| 93 |
| |
Lend Lease Corp., Ltd. |
| 13,618 |
| 145 |
| |
Macquarie Bank Ltd. |
| 6,715 |
| 336 |
| |
Macquarie Infrastructure Group |
| 72,726 |
| 190 |
| |
Mayne Pharma Ltd. |
| (a)22,671 |
| 42 |
| |
National Australia Bank Ltd. |
| 51,258 |
| 1,218 |
| |
Newcrest Mining Ltd. |
| 26,212 |
| 467 |
| |
OneSteel Ltd. |
| (c)44,821 |
| 110 |
| |
Orica Ltd. |
| (a)22,596 |
| 338 |
| |
Origin Energy Ltd. |
| (c)213,888 |
| 1,178 |
| |
PaperlinX Ltd. |
| (c)36,382 |
| 102 |
| |
Patrick Corp., Ltd. |
| 30,000 |
| 163 |
| |
QBE Insurance Group Ltd. |
| (c)22,311 |
| 321 |
| |
Rinker Group Ltd. |
| 75,117 |
| 906 |
| |
Rio Tinto Ltd. |
| (c)24,545 |
| 1,242 |
| |
Santos Ltd. |
| 157,070 |
| 1,411 |
| |
Sonic Healthcare Ltd. |
| 5,616 |
| 61 |
| |
Stockland |
| 1,020 |
| 5 |
| |
Stockland (New) |
| 22 |
| @— |
| |
Suncorp-Metway Ltd. |
| 17,718 |
| 261 |
| |
Symbion Health Ltd. |
| 28,935 |
| 75 |
| |
TABCORP Holdings Ltd. |
| 13,036 |
| 149 |
| |
Telstra Corp., Ltd. |
| 69,366 |
| 200 |
| |
Transurban Group |
| 18,215 |
| 88 |
| |
Wesfarmers Ltd. |
| (c)12,074 |
| 327 |
| |
Westpac Banking Corp. |
| 54,298 |
| 906 |
| |
Woodside Petroleum Ltd. |
| 85,928 |
| 2,470 |
| |
Woolworths Ltd. |
| 32,252 |
| 399 |
| |
|
|
|
| 24,007 |
| |
Austria (0.9%) |
|
|
|
|
| |
Bank Austria Creditanstalt AG |
| (c)4,989 |
| 555 |
| |
Boehler-Uddeholm AG |
| 607 |
| 103 |
| |
Erste Bank der Oesterreichischen Sparkassen AG |
| 39,914 |
| 2,223 |
| |
Flughafen Wien AG |
| 3,439 |
| 246 |
| |
IMMOFINANZ Immobilien Anlagen AG |
| (a)43,746 |
| $ | 420 |
|
Mayr-Melnhof Karton AG |
| 1,261 |
| 176 |
| |
OMV AG |
| 25,691 |
| 1,506 |
| |
RHI AG |
| (a)(c)4,852 |
| 131 |
| |
Telekom Austria AG |
| 36,248 |
| 815 |
| |
Verbund-Oesterreichische Elektrizitaetswirtschafts |
|
|
|
|
| |
AG, Class A |
| 1,230 |
| 439 |
| |
Voestalpine AG |
| 1,155 |
| 116 |
| |
Wienerberger AG |
| 4,544 |
| 182 |
| |
|
|
|
| 6,912 |
| |
Belgium (0.8%) |
|
|
|
|
| |
AGFA-Gevaert N.V. |
| 4,251 |
| 77 |
| |
Bekaert S.A. |
| 539 |
| 50 |
| |
Belgacom S.A. |
| 6,763 |
| 221 |
| |
Dexia |
| 58,800 |
| 1,356 |
| |
Fortis |
| 90,067 |
| 2,873 |
| |
KBC Groupe N.V. |
| 8,105 |
| 755 |
| |
Solvay S.A., Class A |
| 3,669 |
| 404 |
| |
UCB S.A. |
| 6,911 |
| 325 |
| |
Umicore |
| 1,150 |
| 136 |
| |
|
|
|
| 6,197 |
| |
Brazil (1.1%) |
|
|
|
|
| |
AmBev |
| 241,555 |
| 78 |
| |
AmBev (Preference) |
| 1,200,781 |
| 461 |
| |
Aracruz Celulose S.A., Class B (Preference) |
| 31,988 |
| 127 |
| |
Arcelor Brasil S.A. |
| 5,403 |
| 65 |
| |
Banco Bradesco S.A. (Preference) |
| 29,000 |
| 840 |
| |
Banco Itau Holding Financeira S.A. (Preference) |
| 30,170 |
| 726 |
| |
Brasil Telecom Participacoes S.A. (Preference) |
| 16,991,044 |
| 125 |
| |
Caemi Mineracao e Metalurgica S.A. (Preference) |
| 119,500 |
| 174 |
| |
CEMIG S.A. (Preference) |
| 7,110,000 |
| 289 |
| |
Cia Brasileira de Distribuicao Grupo Pao de |
|
|
|
|
| |
Acucar ADR (Preference) |
| (c)900 |
| 30 |
| |
Cia Siderurgica Nacional S.A. |
| 5,976 |
| 128 |
| |
Contax Participacoes S.A. |
| 9,831 |
| 12 |
| |
CVRD, Class A (Preference) |
| 40,221 |
| 1,440 |
| |
Electrobras S.A., Class B (Preference) |
| 8,073,614 |
| 137 |
| |
Embraer (Preference) |
| 24,416 |
| 240 |
| |
Embratel Participacoes S.A. (Preference) |
| (a)7,843,216 |
| 23 |
| |
Gerdau S.A. (Preference) |
| 15,500 |
| 260 |
| |
Klabin S.A. (Preference) |
| 43,000 |
| 76 |
| |
Petrobras S.A. (Preference) |
| 158,500 |
| 2,522 |
| |
Sadia S.A. (Preference) |
| 34,500 |
| 97 |
| |
Souza Cruz S.A. |
| 5,800 |
| 72 |
| |
Tele Centro Oeste Celular Participacoes S.A. |
| 5,908 |
| 68 |
| |
Tele Norte Leste Participacoes S.A. (Preference) |
| 20,831 |
| 370 |
| |
Telesp Celular Participacoes S.A. (Preference) |
| (a)13,125 |
| 50 |
| |
Unibanco ADR |
| (c)5,650 |
| 359 |
| |
Usiminas S.A., Class A (Preference) |
| 7,400 |
| 176 |
| |
Votorantim Celulose e Papel S.A. (Preference) |
| 5,968 |
| 74 |
| |
|
|
|
| 9,019 |
| |
Denmark (0.6%) |
|
|
|
|
| |
AP Moller - Maersk A/S |
| 74 |
| 766 |
| |
Danske Bank A/S |
| 34,745 |
| 1,224 |
| |
DSV A/S |
| 1,175 |
| 145 |
| |
8 | The accompanying notes are an integral part of the financial statements. |
2005 Annual Report | |
|
|
December 31, 2005 | |
Portfolio of Investments (cont’d)
Active International Allocation Portfolio
|
|
|
| Value |
| |
|
| Shares |
| (000) |
| |
Denmark (cont’d) |
|
|
|
|
| |
GN Store Nord A/S |
| 21,800 |
| $ | 285 |
|
Novo-Nordisk A/S, Class B |
| 17,800 |
| 1,001 |
| |
Novozymes A/S, Class B |
| 3,014 |
| 165 |
| |
TDC A/S |
| 11,000 |
| 659 |
| |
Vestas Wind Systems A/S |
| (a)10,650 |
| 175 |
| |
|
|
|
| 4,420 |
| |
Finland (1.2%) |
|
|
|
|
| |
Cargotec Corp., Class B |
| (a)2,604 |
| 90 |
| |
Fortum Oyj |
| 16,886 |
| 317 |
| |
Kesko Oyj, Class B |
| 4,358 |
| 124 |
| |
Kone Oyj, Class B |
| (a)5,208 |
| 207 |
| |
Metso Oyj |
| 7,730 |
| 212 |
| |
Neste Oil Oyj |
| (a)6,952 |
| 196 |
| |
Nokia Oyj |
| 323,165 |
| 5,911 |
| |
Outokumpu Oyj |
| (c)15,450 |
| 229 |
| |
Sampo Oyj, Class A |
| 22,919 |
| 399 |
| |
Stora Enso Oyj, Class R |
| 33,411 |
| 452 |
| |
TietoEnator Oyj |
| 10,536 |
| 385 |
| |
UPM-Kymmene Oyj |
| 29,359 |
| 576 |
| |
Uponor Oyj |
| (c)2,904 |
| 62 |
| |
Wartsila Oyj, Class B |
| 4,034 |
| 119 |
| |
|
|
|
| 9,279 |
| |
France (6.9%) |
|
|
|
|
| |
Accor S.A. |
| (c)18,464 |
| 1,016 |
| |
Alcatel S.A. |
| (a)87,177 |
| 1,081 |
| |
Alstom |
| (a)6,792 |
| 391 |
| |
Atos Origin S.A. |
| (a)1,557 |
| 103 |
| |
Autoroutes du Sud de la France |
| 5,067 |
| 300 |
| |
AXA S.A. |
| 142,852 |
| 4,610 |
| |
BNP Paribas S.A. |
| 75,639 |
| 6,120 |
| |
Bouygues S.A. |
| 16,979 |
| 830 |
| |
Business Objects S.A. |
| (a)4,600 |
| 186 |
| |
Cap Gemini S.A. |
| (a)13,124 |
| 527 |
| |
Carrefour S.A. |
| 31,579 |
| 1,480 |
| |
Casino Guichard Perrachon S.A. |
| (c)3,591 |
| 239 |
| |
Cie de Saint-Gobain |
| 18,247 |
| 1,085 |
| |
Cie Generale d’Optique Essilor International S.A. |
| 3,527 |
| 285 |
| |
CNP Assurances |
| 5,372 |
| 424 |
| |
Credit Agricole S.A. |
| 34,585 |
| 1,089 |
| |
Dassault Systemes S.A. |
| 4,244 |
| 240 |
| |
France Telecom S.A. |
| 75,785 |
| 1,883 |
| |
Gecina S.A. REIT |
| 3,084 |
| 354 |
| |
Groupe Danone |
| (c)13,945 |
| 1,457 |
| |
Hermes International |
| 445 |
| 111 |
| |
Imerys S.A. |
| 1,967 |
| 142 |
| |
Klepierre REIT |
| 2,600 |
| 244 |
| |
L’Air Liquide S.A. |
| 5,939 |
| 1,142 |
| |
L’Oreal S.A. |
| 2,146 |
| 160 |
| |
Lafarge S.A. |
| (c)9,247 |
| 832 |
| |
Lagardere S.C.A. |
| 6,292 |
| 484 |
| |
LVMH Moet Hennessy Louis Vuitton S.A. |
| 10,888 |
| 967 |
| |
Michelin (CGDE), Class B |
| 4,696 |
| 264 |
| |
Neopost S.A. |
| 2,457 |
| 246 |
| |
Pernod-Ricard S.A. |
| (c)1,088 |
| 190 |
| |
Peugeot S.A. |
| (c)5,348 |
| $ | 308 |
|
PPR S.A. |
| 2,823 |
| 318 |
| |
Publicis Groupe |
| 4,217 |
| 147 |
| |
Renault S.A. |
| (c)5,505 |
| 449 |
| |
Safran S.A. |
| 4,910 |
| 117 |
| |
Sanofi-Aventis S.A. |
| (c)65,208 |
| 5,713 |
| |
Schneider Electric S.A. |
| 13,164 |
| 1,174 |
| |
Societe BIC S.A. |
| 1,627 |
| 97 |
| |
Societe Generale |
| 29,834 |
| 3,670 |
| |
Societe Television Francaise 1 |
| (c)5,196 |
| 144 |
| |
Sodexho Alliance S.A. |
| (c)10,220 |
| 421 |
| |
Suez S.A. (VVPR-strip) |
| (a)2,940 |
| @— |
| |
Suez S.A. |
| 34,213 |
| 1,065 |
| |
Technip S.A. |
| 1,528 |
| 92 |
| |
Thales S.A. |
| (c)6,720 |
| 305 |
| |
Thomson |
| (c)10,855 |
| 227 |
| |
Total S.A. |
| 34,878 |
| 8,762 |
| |
Unibail |
| 4,206 |
| 560 |
| |
Valeo S.A. |
| 5,295 |
| 197 |
| |
Veolia Environnement |
| (c)7,021 |
| 318 |
| |
Vinci S.A. |
| (c)8,430 |
| 725 |
| |
Vivendi Universal S.A. |
| 39,320 |
| 1,232 |
| |
Zodiac S.A. |
| 631 |
| 40 |
| |
|
|
|
| 54,563 |
| |
Germany (6.9%) |
|
|
|
|
| |
Adidas-Salomon AG |
| 2,861 |
| 542 |
| |
Allianz AG (Registered) |
| 36,512 |
| 5,530 |
| |
Altana AG |
| 5,626 |
| 306 |
| |
BASF AG |
| 29,360 |
| 2,249 |
| |
Bayer AG |
| 35,613 |
| 1,488 |
| |
Bayerische Hypo-und Vereinsbank AG |
| (a)72,962 |
| 2,212 |
| |
Beiersdorf AG |
| 6,137 |
| 756 |
| |
Celesio AG |
| 2,419 |
| 208 |
| |
Commerzbank AG |
| 91,364 |
| 2,814 |
| |
Continental AG |
| 5,688 |
| 505 |
| |
DaimlerChrysler AG |
| 38,537 |
| 1,968 |
| |
Deutsche Bank AG (Registered) |
| 52,584 |
| 5,098 |
| |
Deutsche Boerse AG |
| 20,350 |
| 2,085 |
| |
Deutsche Lufthansa AG (Registered) |
| 18,151 |
| 269 |
| |
Deutsche Post AG (Registered) |
| (c)64,771 |
| 1,570 |
| |
Deutsche Telekom AG (Registered) |
| (c)165,931 |
| 2,766 |
| |
Douglas HoldingAG |
| 1,380 |
| 53 |
| |
E. ON AG |
| 51,698 |
| 5,349 |
| |
Epcos AG |
| (a)3,649 |
| 48 |
| |
Fresenius Medical Care AG |
| (c)4,509 |
| 475 |
| |
Fresenius Medical Care AG (Preference) |
| 300 |
| 28 |
| |
Henkel KGaA (Non-VotingShares) |
| 4,261 |
| 429 |
| |
Hochtief AG |
| 700 |
| 31 |
| |
Hypo Real Estate HoldingAG |
| 16,900 |
| 880 |
| |
InBev N.V. |
| 3,651 |
| 159 |
| |
Infineon Technologies AG |
| (a)28,610 |
| 262 |
| |
KarstadtQuelle AG |
| (a)(c)714 |
| 11 |
| |
Linde AG |
| 4,994 |
| 389 |
| |
MAN AG |
| 9,024 |
| 482 |
| |
Merck KGaA |
| 4,664 |
| 386 |
| |
Metro AG |
| 13,436 |
| 649 |
| |
The accompanying notes are an integral part of the financial statements. | 9 |
| 2005 Annual Report |
|
|
| December 31, 2005 |
Portfolio of Investments (cont’d)
Active International Allocation Portfolio
|
|
|
| Value |
| |
|
| Shares |
| (000) |
| |
Germany (cont’d) |
|
|
|
|
| |
Muenchener Rueckversicherungs AG (Registered) |
| 8,843 |
| $ | 1,197 |
|
Porsche AG (Non-VotingShares) |
| 365 |
| 262 |
| |
ProSiebenSAT.1 Media AG (Non-VotingShares) |
| 3,088 |
| 60 |
| |
Puma AG Rudolf Dassler Sport |
| 957 |
| 279 |
| |
RWE AG |
| 30,540 |
| 2,262 |
| |
RWE AG (Non-VotingShares) |
| 900 |
| 58 |
| |
SAP AG |
| 18,279 |
| 3,314 |
| |
ScheringAG |
| 11,591 |
| 777 |
| |
Siemens AG (Registered) |
| 58,294 |
| 4,997 |
| |
ThyssenKrupp AG |
| 20,103 |
| 419 |
| |
TUI AG |
| (c)15,183 |
| 311 |
| |
Volkswagen AG |
| (c)10,014 |
| 529 |
| |
Volkswagen AG (Non-VotingShares) |
| 5,035 |
| 194 |
| |
Wincor Nixdorf AG |
| 1,324 |
| 140 |
| |
|
|
|
| 54,796 |
| |
Greece (0.2%) |
|
|
|
|
| |
Alpha Bank A.E. |
| 11,274 |
| 330 |
| |
EFG Eurobank Ergasias S.A. |
| 6,542 |
| 207 |
| |
National Bank of Greece S.A. |
| 14,133 |
| 602 |
| |
OPAP S.A. |
| 12,910 |
| 445 |
| |
Titan Cement Co., S.A. |
| 3,150 |
| 128 |
| |
|
|
|
| 1,712 |
| |
HongKong(4.2%) |
|
|
|
|
| |
Bank of East Asia Ltd. |
| 344,594 |
| 1,042 |
| |
BOC HongKong Holdings Ltd. |
| 782,500 |
| 1,504 |
| |
Cathay Pacific Airways Ltd. |
| (c)214,000 |
| 374 |
| |
Cheung Kong Holdings Ltd. |
| (c)335,000 |
| 3,437 |
| |
Cheung Kong Infrastructure Holdings Ltd. |
| 107,000 |
| 337 |
| |
CLP Holdings Ltd. |
| 348,800 |
| 2,024 |
| |
Esprit Holdings Ltd. |
| 206,000 |
| 1,464 |
| |
Hang Lung Properties Ltd. |
| 408,000 |
| 637 |
| |
Hang Seng Bank Ltd. |
| (c)145,900 |
| 1,904 |
| |
Henderson Land Development Co., Ltd. |
| (c)145,000 |
| 683 |
| |
Hong Kong & China Gas Co., Ltd. |
| 839,079 |
| 1,791 |
| |
Hong Kong Exchanges & Clearing Ltd. |
| 221,000 |
| 916 |
| |
Hong Kong Electric Holdings Ltd. |
| 298,000 |
| 1,476 |
| |
Hopewell Holdings Ltd. |
| 131,000 |
| 329 |
| |
Hutchison Telecommunications International, Ltd. |
| (a)281,000 |
| 406 |
| |
Hutchison Whampoa Ltd. |
| 451,200 |
| 4,297 |
| |
Hysan Development Co., Ltd. |
| 135,958 |
| 337 |
| |
Johnson Electric Holdings Ltd. |
| 332,000 |
| 315 |
| |
Kerry Properties Ltd. |
| 89,250 |
| 236 |
| |
Kingboard Chemical Holdings Ltd. |
| 103,500 |
| 280 |
| |
Li & FungLtd. |
| 341,000 |
| 657 |
| |
Link REIT (The) |
| (a)349,000 |
| 662 |
| |
MTR Corp. |
| (c)293,585 |
| 577 |
| |
New World Development Ltd. |
| 479,598 |
| 659 |
| |
PCCW Ltd. |
| (c)775,411 |
| 477 |
| |
SCMP Group Ltd. |
| 18,000 |
| 7 |
| |
Shangri-La Asia Ltd. |
| 212,424 |
| 355 |
| |
Sino Land Co. |
| (c)274,109 |
| 332 |
| |
Sun Hung Kai Properties Ltd. |
| (c)268,000 |
| 2,610 |
| |
Swire Pacific Ltd., Class A |
| 184,000 |
| 1,652 |
| |
Techtronic Industries Co. |
| 186,500 |
| 444 |
| |
Television Broadcasts Ltd. |
| 58,000 |
| $ | 308 |
|
Wharf Holdings Ltd. |
| 266,600 |
| 942 |
| |
Yue Yuen Industrial Holdings Ltd. |
| 101,500 |
| 283 |
| |
|
|
|
| 33,754 |
| |
Ireland (0.4%) |
|
|
|
|
| |
Allied Irish Banks plc |
| 45,808 |
| 979 |
| |
Bank of Ireland |
| 53,484 |
| 842 |
| |
CRH plc |
| 29,769 |
| 876 |
| |
DCC plc |
| 1,882 |
| 40 |
| |
Elan Corp. plc |
| (a)22,642 |
| 298 |
| |
Grafton Group plc |
| (a)13,307 |
| 145 |
| |
Independent News & Media plc |
| 11,532 |
| 34 |
| |
Irish Life & Permanent plc |
| 3,435 |
| 70 |
| |
|
|
|
| 3,284 |
| |
Italy (1.2%) |
|
|
|
|
| |
Alleanza Assicurazioni S.p.A. |
| (c)7,412 |
| 92 |
| |
Assicurazioni Generali S.p.A. |
| 12,537 |
| 438 |
| |
Autogrill S.p.A. |
| (c)5,283 |
| 72 |
| |
Autostrade S.p.A. |
| 10,821 |
| 260 |
| |
Banca Antonveneta S.p.A. |
| 323 |
| 10 |
| |
Banca Fideuram S.p.A. |
| 2,390 |
| 13 |
| |
Banca Intesa S.p.A. |
| 87,231 |
| 462 |
| |
Banca Intesa S.p.A. RNC |
| 6,672 |
| 33 |
| |
Banca Monte dei Paschi di Siena S.p.A. |
| 6,867 |
| 32 |
| |
Banca Nazionale del Lavoro S.p.A. |
| (a)9,649 |
| 32 |
| |
Banca Popolare di Milano Scrl |
| 2,043 |
| 23 |
| |
Banche Popolari Unite Scrl |
| 611 |
| 14 |
| |
Banco Popolare di Verona e Novara Scrl |
| 8,766 |
| 177 |
| |
Benetton Group S.p.A. |
| 1,341 |
| 15 |
| |
Capitalia S.p.A. |
| 2,980 |
| 17 |
| |
Enel S.p.A. |
| 28,852 |
| 227 |
| |
ENI S.p.A. |
| 149,164 |
| 4,138 |
| |
Fiat S.p.A. |
| (a)(c)9,055 |
| 79 |
| |
Finmeccanica S.p.A. |
| 10,081 |
| 195 |
| |
Italcementi S.p.A. |
| (c)1,087 |
| 20 |
| |
Luxottica Group S.p.A. |
| 3,903 |
| 99 |
| |
Mediaset S.p.A. |
| 9,656 |
| 102 |
| |
Mediobanca S.p.A. |
| 4,940 |
| 94 |
| |
Mediolanum S.p.A. |
| (c)1,796 |
| 12 |
| |
Pirelli & C S.p.A. |
| 81,385 |
| 75 |
| |
Riunione Adriatica di Sicurta S.p.A. |
| 4,478 |
| 108 |
| |
Sanpaolo IMI S.p.A. |
| 36,041 |
| 564 |
| |
Seat Pagine Gialle S.p.A. |
| (a)38,991 |
| 18 |
| |
Snam Rete Gas S.p.A. |
| 4,549 |
| 19 |
| |
Telecom Italia S.p.A. |
| (c)314,268 |
| 915 |
| |
Telecom Italia S.p.A. RNC |
| 179,946 |
| 446 |
| |
Tiscali S.p.A. |
| (a)(c)2,748 |
| 9 |
| |
UniCredito Italiano S.p.A. |
| 108,755 |
| 749 |
| |
|
|
|
| 9,559 |
| |
Japan (28.6%) |
|
|
|
|
| |
77 Bank Ltd. (The) |
| 64,000 |
| 486 |
| |
Acom Co., Ltd. |
| (c)8,080 |
| 520 |
| |
Advantest Corp. |
| (c)9,190 |
| 927 |
| |
Aeon Co., Ltd. |
| 39,200 |
| 998 |
| |
Aeon Credit Service Co., Ltd. |
| 2,100 |
| 199 |
| |
10 | The accompanying notes are an integral part of the financial statements. |
2005 Annual Report | |
|
|
December 31, 2005 | |
Portfolio of Investments (cont’d)
Active International Allocation Portfolio
|
|
|
| Value |
| |
|
| Shares |
| (000) |
| |
Japan (cont’d) |
|
|
|
|
| |
Aiful Corp. |
| 7,150 |
| $ | 597 |
|
Ajinomoto Co., Inc. |
| 62,400 |
| 639 |
| |
Alps Electric Co., Ltd. |
| (c)15,800 |
| 220 |
| |
Amada Co., Ltd. |
| 26,000 |
| 229 |
| |
Asahi Breweries Ltd. |
| (c)33,600 |
| 410 |
| |
Asahi Glass Co., Ltd. |
| (c)108,800 |
| 1,406 |
| |
Asahi Kasei Corp. |
| 103,000 |
| 697 |
| |
Asatsu-DK, Inc. |
| 3,400 |
| 108 |
| |
Astellas Pharma, Inc. |
| 44,100 |
| 1,721 |
| |
Bank of Fukuoka Ltd. (The) |
| 86,000 |
| 736 |
| |
Bank of Kyoto Ltd (The) |
| 22,000 |
| 266 |
| |
Bank of Yokohama Ltd. (The) |
| 146,000 |
| 1,195 |
| |
Benesse Corp. |
| 5,000 |
| 175 |
| |
Bridgestone Corp. |
| (c)84,000 |
| 1,749 |
| |
Canon, Inc. |
| (c)69,800 |
| 4,085 |
| |
Casio Computer Co., Ltd. |
| (c)33,600 |
| 563 |
| |
Central Japan Railway Co. |
| 124 |
| 1,189 |
| |
Chiba Bank Ltd. (The) |
| 61,000 |
| 512 |
| |
Chiyoda Corp. |
| 18,000 |
| 414 |
| |
Chubu Electric Power Co., Inc. |
| (c)42,200 |
| 1,006 |
| |
Chugai Pharmaceutical Co., Ltd. |
| 20,607 |
| 442 |
| |
Citizen Watch Co., Ltd. |
| (c)34,300 |
| 285 |
| |
Coca-Cola West Japan Co., Ltd. |
| (c)1,300 |
| 30 |
| |
COMSYS Holdings Corp. |
| (c)15,000 |
| 215 |
| |
Credit Saison Co., Ltd. |
| (c)15,300 |
| 764 |
| |
CSK Holdings Corp. |
| (c)8,600 |
| 430 |
| |
Dai Nippon Printing Co., Ltd. |
| 37,600 |
| 670 |
| |
Daicel Chemical Industries Ltd. |
| 12,000 |
| 86 |
| |
Daiichi Sankyo Co., Ltd. |
| (a)61,005 |
| 1,177 |
| |
Daikin Industries Ltd. |
| 15,800 |
| 462 |
| |
Daimaru, Inc. |
| 24,000 |
| 346 |
| |
Dainippon Ink & Chemicals, Inc. |
| (c)53,000 |
| 230 |
| |
Daito Trust Construction Co., Ltd. |
| (c)14,100 |
| 730 |
| |
Daiwa House Industry Co., Ltd. |
| 73,600 |
| 1,151 |
| |
Daiwa Securities Group, Inc. |
| 300,000 |
| 3,402 |
| |
Denki Kagaku Kogyo K.K. |
| 36,000 |
| 159 |
| |
Denso Corp. |
| (c)60,250 |
| 2,080 |
| |
Dowa Mining Co., Ltd. |
| 49,000 |
| 531 |
| |
East Japan Railway Co. |
| 302 |
| 2,077 |
| |
Ebara Corp. |
| 30,800 |
| 166 |
| |
Eisai Co., Ltd. |
| (c)23,602 |
| 991 |
| |
FamilyMart Co., Ltd. |
| 4,900 |
| 166 |
| |
Fanuc Ltd. |
| 16,600 |
| 1,409 |
| |
Fast Retailing Co., Ltd. |
| 7,700 |
| 753 |
| |
Fuji Electric Holdings Co., Ltd. |
| 15,000 |
| 80 |
| |
Fuji Photo Film Co., Ltd. |
| (c)39,100 |
| 1,293 |
| |
Fuji Soft ABC, Inc. |
| 4,000 |
| 134 |
| |
Fuji Television Network, Inc. |
| 31 |
| 78 |
| |
Fujikura Ltd. |
| (c)22,000 |
| 178 |
| |
Fujitsu Ltd. |
| 153,200 |
| 1,167 |
| |
Furukawa Electric Co., Ltd. |
| (a)(c)53,800 |
| 421 |
| |
Hankyu Department Stores, Inc. |
| 9,000 |
| 79 |
| |
Hirose Electric Co., Ltd. |
| (c)4,900 |
| 654 |
| |
Hitachi Construction Machinery Co., Ltd. |
| 2,800 |
| 65 |
| |
Hitachi Ltd. |
| 294,000 |
| 1,983 |
| |
Hokkaido Electric Power Co., Inc. |
| 8,200 |
| $ | 167 |
|
Hokuhoku Financial Group, Inc. |
| (c)165,000 |
| 771 |
| |
Honda Motor Co., Ltd. |
| 84,404 |
| 4,818 |
| |
Hoya Corp. |
| 41,900 |
| 1,507 |
| |
Ibiden Co., Ltd. |
| 9,800 |
| 525 |
| |
Index Corp. |
| 111 |
| 201 |
| |
INPEX Corp. |
| 29 |
| 258 |
| |
Isetan Co., Ltd. |
| (c)16,100 |
| 343 |
| |
Ishihara Sangyo Kaisha Ltd. |
| 15,000 |
| 27 |
| |
Ishikawajima-Harima Heavy Industries Co., Ltd. |
| (a)93,000 |
| 294 |
| |
Ito En Ltd. |
| 1,900 |
| 114 |
| |
Itochu Corp. |
| 123,000 |
| 1,027 |
| |
Itochu Techno-Science Corp. |
| (c)3,400 |
| 163 |
| |
Japan Airlines Corp. |
| 79,000 |
| 215 |
| |
Japan Real Estate Investment Corp. REIT |
| 53 |
| 437 |
| |
Japan Retail Fund Investment Corp. REIT |
| 48 |
| 373 |
| |
Japan Tobacco, Inc. |
| 67 |
| 977 |
| |
JFE Holdings, Inc. |
| 32,000 |
| 1,075 |
| |
JGC Corp. |
| (c)24,000 |
| 457 |
| |
Joyo Bank Ltd. (The) |
| 115,000 |
| 685 |
| |
JS Group Corp. |
| (c)21,900 |
| 438 |
| |
JSR Corp. |
| 12,900 |
| 339 |
| |
Kajima Corp. |
| (c)113,400 |
| 652 |
| |
Kamigumi Co., Ltd. |
| 1,000 |
| 9 |
| |
Kaneka Corp. |
| 21,000 |
| 254 |
| |
Kansai Electric Power Co., Inc. (The) |
| 60,200 |
| 1,294 |
| |
Kao Corp. |
| 50,000 |
| 1,340 |
| |
Kawasaki Heavy Industries Ltd. |
| (c)93,000 |
| 339 |
| |
Kawasaki Kisen Kaisha Ltd. |
| 5,000 |
| 31 |
| |
Keihin Electric Express Railway Co., Ltd. |
| (c)32,000 |
| 252 |
| |
Keio Corp. |
| (c)19,000 |
| 114 |
| |
Keyence Corp. |
| 4,900 |
| 1,394 |
| |
Kikkoman Corp. |
| 10,000 |
| 97 |
| |
Kinden Corp. |
| 1,000 |
| 9 |
| |
Kintetsu Corp. |
| 140,200 |
| 561 |
| |
Kirin Brewery Co., Ltd. |
| (c)83,400 |
| 973 |
| |
Kobe Steel Ltd. |
| 166,000 |
| 538 |
| |
Kokuyo Co., Ltd. |
| 5,700 |
| 85 |
| |
Komatsu Ltd. |
| 96,400 |
| 1,595 |
| |
Konami Corp. |
| 11,900 |
| 262 |
| |
Konica Minolta Holdings, Inc. |
| 49,000 |
| 499 |
| |
Kubota Corp. |
| 132,000 |
| 1,110 |
| |
Kuraray Co., Ltd. |
| (c)29,500 |
| 306 |
| |
Kurita Water Industries Ltd. |
| (c)5,800 |
| 110 |
| |
Kyocera Corp. |
| 14,700 |
| 1,072 |
| |
Kyowa Hakko Kogyo Co., Ltd. |
| 28 |
| @— |
| |
Kyushu Electric Power Co., Inc. |
| 26,400 |
| 573 |
| |
Lawson, Inc. |
| 4,700 |
| 194 |
| |
Leopalace21 Corp. |
| 17,800 |
| 646 |
| |
Mabuchi Motor Co., Ltd. |
| (c)2,700 |
| 150 |
| |
Marubeni Corp. |
| (c)120,000 |
| 644 |
| |
Marui Co., Ltd. |
| 35,800 |
| 703 |
| |
Matsushita Electric Industrial Co., Ltd. |
| 176,000 |
| 3,396 |
| |
Matsushita Electric Works Ltd. |
| 28,000 |
| 262 |
| |
Meiji Dairies Corp. |
| (c)16,000 |
| 81 |
| |
The accompanying notes are an integral part of the financial statements. | 11 |
| 2005 Annual Report |
|
|
| December 31, 2005 |
Portfolio of Investments (cont’d)
Active International Allocation Portfolio
|
|
|
| Value |
| |
|
| Shares |
| (000) |
| |
Japan (cont’d) |
|
|
|
|
| |
Meiji Seika Kaisha Ltd. |
| 19,000 |
| $ | 101 |
|
Meitec Corp. |
| (c)2,400 |
| 78 |
| |
Millea Holdings, Inc. |
| 123 |
| 2,118 |
| |
Minebea Co., Ltd. |
| 33,000 |
| 176 |
| |
Mitsubishi Chemical Holdings Corp. |
| (a)73,500 |
| 463 |
| |
Mitsubishi Corp. |
| 109,700 |
| 2,429 |
| |
Mitsubishi Electric Corp. |
| 186,800 |
| 1,323 |
| |
Mitsubishi Estate Co., Ltd. |
| 178,000 |
| 3,699 |
| |
Mitsubishi Heavy Industries Ltd. |
| 316,000 |
| 1,394 |
| |
Mitsubishi Logistics Corp. |
| (c)7,000 |
| 118 |
| |
Mitsubishi Materials Corp. |
| (c)161,000 |
| 823 |
| |
Mitsubishi Rayon Co., Ltd. |
| (c)42,000 |
| 278 |
| |
Mitsubishi UFJ Financial Group, Inc. |
| 662 |
| 8,984 |
| |
Mitsui & Co., Ltd. |
| (c)132,800 |
| 1,707 |
| |
Mitsui Chemicals, Inc. |
| (c)42,000 |
| 283 |
| |
Mitsui Fudosan Co., Ltd. |
| 127,400 |
| 2,588 |
| |
Mitsui Mining & Smelting Co., Ltd. |
| 96,000 |
| 603 |
| |
Mitsui OSK Lines Ltd. |
| 13,000 |
| 113 |
| |
Mitsui Sumitomo Insurance Co., Ltd. |
| 102,000 |
| 1,248 |
| |
Mitsui Trust Holdings, Inc. |
| 48,545 |
| 583 |
| |
Mitsukoshi Ltd. |
| 32,000 |
| 209 |
| |
Mizuho Financial Group, Inc. |
| 844 |
| 6,701 |
| |
Murata Manufacturing Co., Ltd. |
| 19,800 |
| 1,270 |
| |
Namco Bandai Holdings, Inc. |
| (a)2,400 |
| 35 |
| |
NEC Corp. |
| 196,400 |
| 1,223 |
| |
NEC Electronics Corp. |
| (c)4,600 |
| 151 |
| |
Net One Systems Co., Ltd. |
| (c)69 |
| 167 |
| |
NGK Insulators Ltd. |
| (c)34,600 |
| 515 |
| |
NGK Spark Plug Co., Ltd. |
| (c)21,000 |
| 454 |
| |
Nidec Corp. |
| (c)10,000 |
| 851 |
| |
Nikko Cordial Corp. |
| 51,000 |
| 808 |
| |
Nikon Corp. |
| (c)27,000 |
| 426 |
| |
Nintendo Co., Ltd. |
| 13,000 |
| 1,571 |
| |
Nippon Building Fund, Inc. REIT |
| (c)63 |
| 532 |
| |
Nippon Electric Glass Co., Ltd. |
| 17,000 |
| 371 |
| |
Nippon Express Co., Ltd. |
| (c)74,800 |
| 456 |
| |
Nippon Meat Packers, Inc. |
| 18,600 |
| 195 |
| |
Nippon Mining Holdings, Inc. |
| 43,500 |
| 310 |
| |
Nippon Oil Corp. |
| 134,800 |
| 1,046 |
| |
Nippon Paper Group, Inc. |
| (c)70 |
| 280 |
| |
Nippon Sheet Glass Co., Ltd. |
| (c)37,000 |
| 162 |
| |
Nippon Steel Corp. |
| (c)418,000 |
| 1,489 |
| |
Nippon Telegraph & Telephone Corp. |
| 567 |
| 2,578 |
| |
Nippon Yusen Kabushiki Kaisha |
| 99,000 |
| 679 |
| |
Nishi-Nippon Bank Ltd (The) |
| 44,000 |
| 263 |
| |
Nissan Chemical Industries Ltd. |
| 11,000 |
| 157 |
| |
Nissan Motor Co., Ltd. |
| (c)250,900 |
| 2,543 |
| |
Nisshin Seifun Group, Inc. |
| 12,500 |
| 132 |
| |
Nisshinbo Industries, Inc. |
| 6,000 |
| 66 |
| |
Nissin Food Products Co., Ltd. |
| 6,500 |
| 188 |
| |
Nitto Denko Corp. |
| 17,800 |
| 1,388 |
| |
Nomura Holdings, Inc. |
| 181,500 |
| 3,479 |
| |
Nomura Research Institute Ltd. |
| 2,900 |
| 355 |
| |
NSK Ltd. |
| 62,000 |
| 424 |
| |
NTN Corp. |
| (c)44,000 |
| 348 |
| |
NTT Data Corp. |
| (c)166 |
| $ | 827 |
|
NTT DoCoMo, Inc. |
| 749 |
| 1,144 |
| |
Obayashi Corp. |
| 77,000 |
| 568 |
| |
Obic Co., Ltd. |
| 900 |
| 198 |
| |
OJI Paper Co., Ltd. |
| (c)96,400 |
| 570 |
| |
Oki Electric Industry Co., Ltd. |
| (c)52,000 |
| 190 |
| |
Okumura Corp. |
| 21,000 |
| 118 | �� | |
Olympus Corp. |
| (c)11,000 |
| 289 |
| |
Omron Corp. |
| 19,600 |
| 452 |
| |
Onward Kashiyama Co., Ltd. |
| (c)16,000 |
| 315 |
| |
Oracle Corp. Japan |
| (c)4,200 |
| 209 |
| |
Oriental Land Co., Ltd. |
| 5,700 |
| 311 |
| |
ORIX Corp. |
| 12,100 |
| 3,084 |
| |
Osaka Gas Co., Ltd. |
| 155,600 |
| 537 |
| |
Pioneer Corp. |
| (c)14,454 |
| 201 |
| |
Promise Co., Ltd. |
| 9,950 |
| 663 |
| |
Resona Holdings, Inc. |
| (a)411 |
| 1,656 |
| |
Ricoh Co., Ltd. |
| 56,000 |
| 981 |
| |
Rohm Co., Ltd. |
| 13,200 |
| 1,437 |
| |
Sanden Corp. |
| 1,000 |
| 5 |
| |
Sanken Electric Co., Ltd. |
| 13,000 |
| 210 |
| |
Sanyo Electric Co., Ltd. |
| (c)148,000 |
| 402 |
| |
Sapporo Holdings Ltd. |
| (c)17,000 |
| 95 |
| |
Secom Co., Ltd. |
| 14,600 |
| 764 |
| |
Seiko Epson Corp. |
| (c)9,800 |
| 246 |
| |
Sekisui Chemical Co., Ltd. |
| 44,000 |
| 298 |
| |
Sekisui House Ltd. |
| (c)87,600 |
| 1,103 |
| |
Seven & I Holdings Co., Ltd. |
| (a)64,000 |
| 2,741 |
| |
Sharp Corp. |
| 73,200 |
| 1,114 |
| |
Shimachu Co., Ltd. |
| 5,300 |
| 161 |
| |
Shimamura Co., Ltd. |
| (c)2,000 |
| 277 |
| |
Shimano, Inc. |
| (c)8,600 |
| 226 |
| |
Shimizu Corp. |
| 81,600 |
| 600 |
| |
Shin-Etsu Chemical Co., Ltd. |
| 33,896 |
| 1,803 |
| |
Shinsei Bank Ltd. |
| 140,000 |
| 810 |
| |
Shionogi & Co., Ltd. |
| (c)29,000 |
| 409 |
| |
Shiseido Co., Ltd. |
| (c)32,000 |
| 597 |
| |
Shizuoka Bank Ltd. (The) |
| 52,000 |
| 521 |
| |
Showa Denko K.K. |
| (c)55,000 |
| 215 |
| |
Showa Shell Sekiyu K.K. |
| (c)14,300 |
| 171 |
| |
Skylark Co., Ltd. |
| 11,200 |
| 179 |
| |
SMC Corp. |
| 5,800 |
| 829 |
| |
Softbank Corp. |
| 96,900 |
| 4,093 |
| |
Sompo Japan Insurance, Inc. |
| 70,000 |
| 947 |
| |
Sony Corp. |
| 62,097 |
| 2,539 |
| |
Stanley Electric Co., Ltd. |
| (c)6,300 |
| 102 |
| |
Sumitomo Bakelite Co., Ltd. |
| (c)11,000 |
| 91 |
| |
Sumitomo Chemical Co., Ltd. |
| 117,600 |
| 808 |
| |
Sumitomo Corp. |
| 80,400 |
| 1,040 |
| |
Sumitomo Electric Industries Ltd. |
| 59,800 |
| 908 |
| |
Sumitomo Heavy Industries Ltd. |
| 38,000 |
| 319 |
| |
Sumitomo Metal Industries Ltd. |
| 248,000 |
| 955 |
| |
Sumitomo Metal Mining Co., Ltd. |
| 90,800 |
| 1,124 |
| |
Sumitomo Mitsui Financial Group, Inc. |
| 198 |
| 2,099 |
| |
Sumitomo Realty & Development Co., Ltd. |
| 76,000 |
| 1,654 |
| |
Sumitomo Trust & Banking Co., Ltd. (The) |
| 113,000 |
| 1,155 |
| |
12 | The accompanying notes are an integral part of the financial statements. |
2005 Annual Report | |
|
|
December 31, 2005 | |
Portfolio of Investments (cont’d)
Active International Allocation Portfolio
|
|
|
| Value |
| |
|
| Shares |
| (000) |
| |
Japan (cont’d) |
|
|
|
|
| |
T&D Holdings, Inc. |
| 19,350 |
| $ | 1,284 |
|
Taiheiyo Cement Corp. |
| 52,000 |
| 211 |
| |
Taisei Corp. |
| 110,000 |
| 499 |
| |
Taisho Pharmaceutical Co., Ltd. |
| 15,441 |
| 289 |
| |
Taiyo Yuden Co., Ltd. |
| (c)7,000 |
| 96 |
| |
Takara Holdings, Inc. |
| 10,000 |
| 59 |
| |
Takashimaya Co., Ltd. |
| (c)33,000 |
| 527 |
| |
Takeda Pharmaceutical Co., Ltd. |
| 78,600 |
| 4,254 |
| |
Takefuji Corp. |
| 7,080 |
| 481 |
| |
Takuma Co., Ltd. |
| (c)7,000 |
| 47 |
| |
TDK Corp. |
| 10,600 |
| 731 |
| |
Teijin Ltd. |
| 74,400 |
| 473 |
| |
Teikoku Oil Co., Ltd. |
| (c)8,000 |
| 105 |
| |
Terumo Corp. |
| 17,300 |
| 512 |
| |
THK Co., Ltd. |
| 3,400 |
| 89 |
| |
TIS, Inc. |
| (c)4,004 |
| 124 |
| |
Tobu Railway Co., Ltd. |
| 76,400 |
| 401 |
| |
Toho Co., Ltd. |
| 6,000 |
| 134 |
| |
Tohoku Electric Power Co., Inc. |
| 35,500 |
| 723 |
| |
Tokyo Broadcasting System, Inc. |
| 9,500 |
| 258 |
| |
Tokyo Electric Power Co., Inc. (The) |
| 88,000 |
| 2,139 |
| |
Tokyo Electron Ltd. |
| (c)20,000 |
| 1,257 |
| |
Tokyo Gas Co., Ltd. |
| 183,600 |
| 816 |
| |
Tokyo Tatemono Co., Ltd. |
| (c)28,000 |
| 279 |
| |
Tokyu Corp. |
| (c)85,400 |
| 604 |
| |
TonenGeneral Sekiyu K.K. |
| 29,000 |
| 312 |
| |
Toppan Printing Co., Ltd. |
| (c)36,600 |
| 428 |
| |
Toray Industries, Inc. |
| 103,100 |
| 841 |
| |
Toshiba Corp. |
| (c)294,000 |
| 1,756 |
| |
Tosoh Corp. |
| (c)40,000 |
| 176 |
| |
Toto Ltd. |
| (c)43,600 |
| 369 |
| |
Toyo Seikan Kaisha Ltd. |
| (c)16,600 |
| 271 |
| |
Toyobo Co., Ltd. |
| (c)5,000 |
| 17 |
| |
Toyoda Gosei Co., Ltd. |
| 800 |
| 16 |
| |
Toyota Industries Corp. |
| 8,850 |
| 318 |
| |
Toyota Motor Corp. |
| 272,800 |
| 14,161 |
| |
Trend Micro, Inc. |
| (a)(c)12,700 |
| 480 |
| |
Uni-Charm Corp. |
| 3,500 |
| 157 |
| |
Uniden Corp. |
| (c)5,000 |
| 97 |
| |
UNY Co., Ltd. |
| (c)10,000 |
| 158 |
| |
Ushio, Inc. |
| (c)3,500 |
| 82 |
| |
USS Co., Ltd. |
| 2,730 |
| 174 |
| |
Wacoal Holdings Corp. |
| 6,000 |
| 81 |
| |
West Japan Railway Co. |
| 31 |
| 129 |
| |
Yahoo! Japan Corp. |
| 992 |
| 1,506 |
| |
Yakult Honsha Co., Ltd. |
| (c)8,800 |
| 183 |
| |
Yamada Denki Co., Ltd. |
| 9,700 |
| 1,214 |
| |
Yamaha Corp. |
| (c)8,600 |
| 143 |
| |
Yamaha Motor Co., Ltd. |
| 3,500 |
| 91 |
| |
Yamato Holdings Co., Ltd. |
| 24,000 |
| 398 |
| |
Yamazaki Baking Co., Ltd. |
| (c)8,000 |
| 65 |
| |
Yokogawa Electric Corp. |
| (c)19,300 |
| 329 |
| |
|
|
|
| 227,322 |
| |
Luxembourg (0.1%) |
|
|
|
|
| |
Arcelor |
| 27,629 |
| 685 |
| |
Mexico (1.0%) |
|
|
|
|
| |
Alfa S.A. de C.V., Class A |
| 27,500 |
| $ | 153 |
|
America Movil S.A. de C.V. |
| 1,487,000 |
| 2,172 |
| |
Cemex S.A. de C.V. |
| 240,400 |
| 1,426 |
| |
Coca-Cola Femsa S.A. de C.V. |
| 11,500 |
| 32 |
| |
Corp. GEO S.A. de C.V. |
| (a)31,700 |
| 112 |
| |
Fomento Economico Mexicano S.A. de C.V. |
| 52,600 |
| 381 |
| |
Grupo Carso S.A. de C.V., Class A1 |
| 61,700 |
| 150 |
| |
Grupo Financiero Banorte S.A. de C.V., Class O |
| 110,100 |
| 228 |
| |
Grupo Mexico S.A. de C.V., Class B |
| 87,200 |
| 203 |
| |
Grupo Modelo S.A., Class C |
| 43,400 |
| 157 |
| |
Grupo Televisa S.A. |
| 173,900 |
| 695 |
| |
Kimberly-Clark de Mexico S.A. de C.V., Class A |
| 41,500 |
| 148 |
| |
Telefonos de Mexico S.A. de C.V. |
| (c)1,000,500 |
| 1,238 |
| |
Urbi Desarrollos Urbanos S.A. de C.V. |
| (a)10,000 |
| 69 |
| |
Wal-Mart de Mexico S.A. de C.V., Series V |
| 151,400 |
| 840 |
| |
|
|
|
| 8,004 |
| |
Netherlands (4.7%) |
|
|
|
|
| |
ABN AMRO Holding N.V. |
| 116,252 |
| 3,040 |
| |
Aegon N.V. |
| 139,741 |
| 2,275 |
| |
Akzo Nobel N.V. |
| 15,033 |
| 697 |
| |
ASML Holding N.V. |
| (a)32,756 |
| 655 |
| |
Corio N.V. REIT |
| 5,854 |
| 318 |
| |
Euronext N.V. |
| 6,578 |
| 343 |
| |
European Aeronautic Defense & Space Co. N.V. |
| 14,611 |
| 552 |
| |
Hagemeyer N.V. |
| (a)4,613 |
| 15 |
| |
Heineken N.V. |
| 48,272 |
| 1,530 |
| |
ING Groep N.V. CVA |
| 126,199 |
| 4,377 |
| |
Koninklijke DSM NV |
| 8,260 |
| 337 |
| |
Koninklijke Numico N.V. |
| (a)8,920 |
| 369 |
| |
Koninklijke Philips Electronics N.V. |
| 56,394 |
| 1,753 |
| |
OCE N.V. |
| 6,272 |
| 91 |
| |
Reed Elsevier N.V. |
| 29,077 |
| 406 |
| |
Rodamco Europe N.V. REIT |
| 4,805 |
| 400 |
| |
Royal Dutch Shell plc |
| 244,852 |
| 7,461 |
| |
Royal Dutch Shell plc, Class B |
| 183,643 |
| 5,871 |
| |
Royal KPN N.V. |
| 106,404 |
| 1,067 |
| |
TNT N.V. |
| 46,071 |
| 1,440 |
| |
Unilever N.V. CVA |
| 48,175 |
| 3,299 |
| |
VNU N.V. |
| 10,953 |
| 363 |
| |
Wereldhave N.V. REIT |
| 2,385 |
| 225 |
| |
Wolters Kluwer N.V. CVA |
| 15,333 |
| 310 |
| |
|
|
|
| 37,194 |
| |
New Zealand (0.0%) |
|
|
|
|
| |
Carter Holt Harvey Ltd. |
| 50,325 |
| 86 |
| |
Telecom Corp. of New Zealand Ltd. |
| 20,139 |
| 83 |
| |
|
|
|
| 169 |
| |
Norway (0.4%) |
|
|
|
|
| |
DNB NOR ASA |
| 14,299 |
| 153 |
| |
Norsk Hydro ASA |
| 9,299 |
| 955 |
| |
Orkla ASA |
| 10,500 |
| 435 |
| |
Statoil ASA |
| 38,450 |
| 883 |
| |
Tandberg ASA |
| (c)10,600 |
| 65 |
| |
Tandberg Television ASA |
| (a)(c)5,400 |
| 71 |
| |
Telenor ASA |
| 44,200 |
| 434 |
| |
The accompanying notes are an integral part of the financial statements. | 13 |
| 2005 Annual Report |
|
|
| December 31, 2005 |
Portfolio of Investments (cont’d)
Active International Allocation Portfolio
|
|
|
| Value |
| |
|
| Shares |
| (000) |
| |
Norway (cont’d) |
|
|
|
|
| |
Yara International ASA |
| 11,619 |
| $ | 169 |
|
|
|
|
| 3,165 |
| |
Poland (0.5%) |
|
|
|
|
| |
Agora S.A. |
| 5,609 |
| 119 |
| |
Bank BPH |
| 1,394 |
| 322 |
| |
Bank Pekao S.A. |
| 11,930 |
| 641 |
| |
Bank Zachodni WBK S.A. |
| (a)3,886 |
| 169 |
| |
Grupa Kety S.A. |
| 163 |
| 6 |
| |
KGHM Polska Miedz S.A. |
| 19,397 |
| 373 |
| |
Polski Koncern Naftowy Orlen |
| 45,510 |
| 879 |
| |
Powszechna Kasa Oszczednosci Bank Polski S.A. |
| 56,862 |
| 508 |
| |
Prokom Software S.A. |
| 1,723 |
| 73 |
| |
Telekomunikacja Polska S.A. |
| 105,261 |
| 758 |
| |
|
|
|
| 3,848 |
| |
Portugal (0.1%) |
|
|
|
|
| |
Banco Comercial Portugues S.A. (Registered) |
| 97,694 |
| 270 |
| |
Brisa-Auto Estradas de Portugal S.A. |
| 23,604 |
| 200 |
| |
Energias de Portugal S.A. |
| 24,260 |
| 75 |
| |
Portugal Telecom SGPS S.A. (Registered) |
| 40,620 |
| 411 |
| |
PT Multimedia SGPS S.A. |
| 1,488 |
| 17 |
| |
|
|
|
| 973 |
| |
Russia (1.2%) |
|
|
|
|
| |
LUKOIL ADR |
| (c)64,300 |
| 3,826 |
| |
MMC Norilsk Nickel ADR |
| (c)9,800 |
| 929 |
| |
Mobile Telesystems ADR |
| (c)16,400 |
| 574 |
| |
OAO Gazprom ADR (Registered) |
| 6,535 |
| 477 |
| |
RAO Unified Energy System GDR |
| 10,550 |
| 447 |
| |
Surgutneftegaz ADR |
| (c)17,800 |
| 970 |
| |
Surgutneftegaz ADR (Preference) |
| 8,600 |
| 765 |
| |
Tatneft ADR |
| (c)8,100 |
| 535 |
| |
Vimpel-Communications ADR |
| (a)(c)19,500 |
| 862 |
| |
|
|
|
| 9,385 |
| |
Singapore (1.2%) |
|
|
|
|
| |
Ascendas REIT |
| 98,000 |
| 115 |
| |
CapitaLand Ltd. |
| 125,000 |
| 259 |
| |
CapitaMall Trust REIT |
| 82,500 |
| 111 |
| |
Chartered Semiconductor Manufacturing Ltd. |
| (a)(c)127,000 |
| 99 |
| |
City Developments Ltd. |
| 70,719 |
| 370 |
| |
ComfortDelgro Corp., Ltd. |
| 211,477 |
| 204 |
| |
Creative Technology Ltd. |
| 6,820 |
| 56 |
| |
DBS Group Holdings Ltd. |
| 130,612 |
| 1,296 |
| |
Fraser & Neave Ltd. |
| 21,000 |
| 234 |
| |
Jardine Cycle & Carriage Ltd. |
| 14,034 |
| 94 |
| |
Keppel Corp., Ltd. |
| 65,000 |
| 430 |
| |
Keppel Land Ltd. |
| (c)46,000 |
| 101 |
| |
MCL Land Ltd. |
| 10,104 |
| 10 |
| |
Neptune Orient Lines Ltd. |
| 59,000 |
| 119 |
| |
Overseas Union Enterprise Ltd. |
| 9,468 |
| 62 |
| |
Overseas-Chinese Banking Corp. |
| 258,712 |
| 1,042 |
| |
Parkway Holdings Ltd. |
| 78,000 |
| 99 |
| |
SembCorp Industries Ltd. |
| 102,183 |
| 168 |
| |
SembCorp Marine Ltd. |
| 70,000 |
| 116 |
| |
Singapore Airlines Ltd. |
| 62,000 |
| 462 |
| |
Singapore Exchange Ltd. |
| 96,539 |
| 168 |
| |
Singapore Land Ltd. |
| 19,000 |
| $ | 61 |
|
Singapore Post Ltd. |
| 171,000 |
| 118 |
| |
Singapore Press Holdings Ltd. |
| 187,028 |
| 484 |
| |
Singapore Technologies Engineering Ltd. |
| 157,296 |
| 271 |
| |
Singapore Telecommunications Ltd. |
| 797,595 |
| 1,252 |
| |
STATS ChipPAC Ltd. |
| (a)129,000 |
| 86 |
| |
United Overseas Bank Ltd. |
| 139,389 |
| 1,224 |
| |
United Overseas Land Ltd. (London Shares) |
| (c)64,189 |
| 97 |
| |
Venture Corp., Ltd. |
| 28,444 |
| 236 |
| |
|
|
|
| 9,444 |
| |
South Africa (0.8%) |
|
|
|
|
| |
Anglo American Platinum Corp., Ltd. |
| 4,400 |
| 318 |
| |
Anglo American plc (London Shares) |
| 76,111 |
| 2,591 |
| |
AngloGold Ashanti Ltd. |
| 8,900 |
| 442 |
| |
Gold Fields Ltd. |
| 24,800 |
| 438 |
| |
Harmony Gold Mining Co., Ltd. |
| (a)22,400 |
| 300 |
| |
Impala Platinum Holdings Ltd. |
| 4,300 |
| 633 |
| |
Kumba Resources Ltd. |
| 4,100 |
| 66 |
| |
Mittal Steel South Africa Ltd. |
| 13,500 |
| 131 |
| |
Nampak, Ltd. |
| 34,600 |
| 92 |
| |
Pretoria Portland Cement Co., Ltd. |
| 900 |
| 44 |
| |
Sappi Ltd. |
| 13,700 |
| 157 |
| |
Sasol Ltd. |
| 38,600 |
| 1,382 |
| |
|
|
|
| 6,594 |
| |
Spain (2.1%) |
|
|
|
|
| |
Abertis Infraestructuras S.A. |
| (c)22,215 |
| 559 |
| |
Acciona S.A. |
| 1,995 |
| 223 |
| |
Acerinox S.A. |
| (c)10,067 |
| 146 |
| |
ACS S.A. |
| 15,386 |
| 496 |
| |
Altadis S.A. |
| (c)14,776 |
| 670 |
| |
Antena 3 de Television S.A. |
| (c)3,070 |
| 73 |
| |
Banco Bilbao Vizcaya Argentaria S.A. |
| 129,993 |
| 2,321 |
| |
Banco Popular Espanol S.A. |
| (c)36,192 |
| 441 |
| |
Banco Santander Central Hispano S.A. |
| 182,115 |
| 2,404 |
| |
Cintra Concesiones de Infraestructuras de Transporte S.A. |
| (a)(c)10,671 |
| 123 |
| |
Endesa S.A. |
| (c)33,521 |
| 882 |
| |
Fomento de Construcciones y Contratas S.A. |
| 2,184 |
| 124 |
| |
Gas Natural SDG S.A. |
| (c)48,101 |
| 1,347 |
| |
Grupo Ferrovial S.A. |
| 3,504 |
| 243 |
| |
Iberdrola S.A. |
| (c)28,390 |
| 776 |
| |
Inditex S.A. |
| 11,867 |
| 387 |
| |
Indra Sistemas S.A. |
| 2,740 |
| 54 |
| |
Metrovacesa S.A. |
| 1,527 |
| 93 |
| |
Repsol YPF S.A. |
| (c)46,721 |
| 1,365 |
| |
Sacyr Vallehermoso S.A. |
| 4,896 |
| 119 |
| |
Sociedad General de Aguas de Barcelona S.A., Class A |
| (c)9,242 |
| 197 |
| |
Telefonica S.A. |
| 255,206 |
| 3,840 |
| |
Union Fenosa S.A. |
| (c)6,857 |
| 255 |
| |
|
|
|
| 17,138 |
| |
Sweden (1.7%) |
|
|
|
|
| |
Alfa Laval AB |
| 1,250 |
| 27 |
| |
Assa Abloy AB, Class B |
| 20,477 |
| 322 |
| |
Atlas Copco AB, Class A |
| 19,798 |
| 441 |
| |
14 | The accompanying notes are an integral part of the financial statements. |
2005 Annual Report | |
|
|
December 31, 2005 | |
Portfolio of Investments (cont’d)
Active International Allocation Portfolio
|
|
|
| Value |
| |
|
| Shares |
| (000) |
| |
Sweden (cont’d) |
|
|
|
|
| |
Atlas Copco AB, Class B |
| 12,297 |
| $ | 245 |
|
Electrolux AB, Class B |
| 12,800 |
| 333 |
| |
Eniro AB |
| 5,700 |
| 72 |
| |
Faberge AB |
| 3,300 |
| 63 |
| |
Getinge AB, Class B |
| 10,700 |
| 148 |
| |
Hennes & Mauritz AB, Class B |
| 20,050 |
| 681 |
| |
Holmen AB, Class B |
| 3,400 |
| 112 |
| |
Modern Times Group AB, Class B |
| (a)1,550 |
| 65 |
| |
Nordea Bank AB |
| 159,744 |
| 1,659 |
| |
Sandvik AB |
| 12,218 |
| 569 |
| |
Scania AB, Class B |
| 6,600 |
| 239 |
| |
Securitas AB, Class B |
| 800 |
| 13 |
| |
Skandia Forsakrings AB |
| (c)34,365 |
| 206 |
| |
Skandinaviska Enskilda Banken AB, Class A |
| 27,666 |
| 569 |
| |
Skanska AB, Class B |
| 20,351 |
| 310 |
| |
SKF AB, Class B |
| 19,264 |
| 270 |
| |
Ssab Svenskt Stal AB, Class A |
| 2,450 |
| 89 |
| |
Svenska Cellulosa AB, Class B |
| (c)10,822 |
| 405 |
| |
Svenska Handelsbanken, Class A |
| 44,936 |
| 1,114 |
| |
Swedish Match AB |
| 25,700 |
| 302 |
| |
Tele2 AB, Class B |
| (c)8,724 |
| 94 |
| |
Telefonaktiebolaget LM Ericsson, Class B |
| 1,014,842 |
| 3,487 |
| |
TeliaSonera AB |
| 91,487 |
| 492 |
| |
Volvo AB, Class A |
| 5,995 |
| 275 |
| |
Volvo AB, Class B |
| 13,485 |
| 636 |
| |
Wihlborgs Fastigheter AB |
| (a)660 |
| 16 |
| |
Wm-Data AB, Class B |
| 14,675 |
| 47 |
| |
|
|
|
| 13,301 |
| |
Switzerland (5.4%) |
|
|
|
|
| |
ABB Ltd. |
| (a)117,174 |
| 1,137 |
| |
Ciba Specialty Chemicals AG (Registered) |
| 3,881 |
| 251 |
| |
Clariant AG (Registered) |
| (a)12,551 |
| 185 |
| |
Compagnie Financiere Richemont AG, Class A |
| 25,202 |
| 1,097 |
| |
Credit Suisse Group (Registered) |
| 46,467 |
| 2,369 |
| |
Geberit AG (Registered) |
| 233 |
| 184 |
| |
Givaudan (Registered) |
| 390 |
| 264 |
| |
Holcim Ltd. (Registered) |
| 10,635 |
| 724 |
| |
Kudelski S.A. |
| (a)2,842 |
| 84 |
| |
Logitech International S.A. (Registered) |
| (a)6,122 |
| 288 |
| |
Lonza Group AG (Registered) |
| 2,078 |
| 127 |
| |
Nestle S.A. (Registered) |
| 29,996 |
| 8,971 |
| |
Nobel Biocare Holding AG |
| 1,835 |
| 404 |
| |
Novartis AG (Registered) |
| 157,623 |
| 8,283 |
| |
Roche Holding AG (Genusschein) |
| 47,384 |
| 7,115 |
| |
Schindler Holding AG |
| 400 |
| 159 |
| |
Serono S.A., Class B |
| 717 |
| 571 |
| |
STMicroelectronics N.V. |
| 13,398 |
| 241 |
| |
Straumann Holding AG |
| 833 |
| 193 |
| |
Sulzer AG (Registered) |
| 39 |
| 21 |
| |
Swatch Group AG (Registered) |
| 3,323 |
| 101 |
| |
Swatch Group AG, Class B |
| 1,618 |
| 240 |
| |
Swiss Reinsurance (Registered) |
| 4,922 |
| 360 |
| |
Swisscom AG (Registered) |
| 1,170 |
| 369 |
| |
Syngenta AG |
| (a)5,986 |
| 745 |
| |
Synthes, Inc. |
| 3,887 |
| 437 |
| |
UBS AG (Registered) |
| 75,365 |
| $ | 7,175 |
|
Valora Holding AG |
| (a)106 |
| 21 |
| |
Zurich Financial Services AG (Registered) |
| (a)3,566 |
| 760 |
| |
|
|
|
| 42,876 |
| |
Turkey (0.9%) |
|
|
|
|
| |
Akbank TAS |
| 146,800 |
| 1,196 |
| |
Anadolu Efes Biracilik ve Malt Sanayii A.S. |
| 4,184 |
| 117 |
| |
Arcelik A.S. |
| 36,423 |
| 254 |
| |
Dogan Sirketler Grubu Holdings A.S. |
| (a)76,581 |
| 249 |
| |
Dogan Yayin Holding A.S. |
| (a)45,949 |
| 182 |
| |
Eregli Demir ve Celik Fabrikalari TAS |
| 82,790 |
| 549 |
| |
Ford Otomotiv Sanayi A.S. |
| 21,644 |
| 189 |
| |
Haci Omer Sabanci Holding A.S. |
| 85,561 |
| 485 |
| |
Hurriyet Gazetecilik ve Matbaacilik A.S. |
| 26,363 |
| 103 |
| |
Koc Holding AS |
| 60,996 |
| 287 |
| |
Migros Turk TAS |
| 24,968 |
| 242 |
| |
Trakya Cam Sanayi A.S. |
| 8,985 |
| 35 |
| |
Tupras-Turkie Petrol Rafinerileri A.S. |
| 25,390 |
| 466 |
| |
Turk Hava Yollari Anonim Ortakligi |
| (a)9,337 |
| 58 |
| |
Turk Sise ve Cam Fabrikalari A.S. |
| 26,914 |
| 94 |
| |
Turkcell Iletisim Hizmetleri A.S. |
| 84,939 |
| 516 |
| |
Turkiye Garanti Bankasi A.S., Class C |
| (a)226,607 |
| 822 |
| |
Turkiye Is Bankasi |
| 157,193 |
| 1,362 |
| |
Yapi ve Kredi Bankasi A.S. |
| (a)72,976 |
| 340 |
| |
|
|
|
| 7,546 |
| |
United Kingdom (15.3%) |
|
|
|
|
| |
3i Group plc |
| 9,460 |
| 138 |
| |
Aegis Group plc |
| 47,607 |
| 100 |
| |
Alliance Unichem plc |
| 4,158 |
| 57 |
| |
Amec plc |
| 12,474 |
| 74 |
| |
Amvescap plc |
| 11,317 |
| 86 |
| |
ARM Holdings plc |
| 55,069 |
| 115 |
| |
Arriva plc |
| 8,423 |
| 84 |
| |
Associated British Ports Holdings plc |
| 17,825 |
| 180 |
| |
AstraZeneca plc |
| 106,855 |
| 5,201 |
| |
Aviva plc |
| 169,050 |
| 2,051 |
| |
BAA plc |
| 71,808 |
| 775 |
| |
BAE Systems plc |
| 195,723 |
| 1,286 |
| |
Balfour Beatty plc |
| 29,842 |
| 183 |
| |
Barclays plc |
| 359,084 |
| 3,775 |
| |
Barratt Developments plc |
| 10,583 |
| 180 |
| |
BBA Group plc |
| 30,496 |
| 172 |
| |
Bellway plc |
| 4,760 |
| 92 |
| |
Berkeley Group Holdings plc |
| (a)4,987 |
| 95 |
| |
BG Group plc |
| 197,532 |
| 1,953 |
| |
BHP Billiton plc |
| 133,568 |
| 2,182 |
| |
BOC Group plc |
| 27,433 |
| 565 |
| |
Boots Group plc |
| 39,473 |
| 411 |
| |
BP plc |
| 1,281,632 |
| 13,650 |
| |
Brambles Industries plc |
| 12,488 |
| 90 |
| |
British Airways plc |
| (a)33,509 |
| 193 |
| |
British American Tobacco plc |
| 86,518 |
| 1,935 |
| |
British Land Co. plc |
| 48,836 |
| 896 |
| |
British Sky Broadcasting plc |
| 47,903 |
| 409 |
| |
BT Group plc |
| 426,762 |
| 1,636 |
| |
The accompanying notes are an integral part of the financial statements. | 15 |
| 2005 Annual Report |
|
|
| December 31, 2005 |
Portfolio of Investments (cont’d)
Active International Allocation Portfolio
|
|
|
| Value |
| |
|
| Shares |
| (000) |
| |
United Kingdom (cont’d) |
|
|
|
|
| |
Bunzl plc |
| 25,151 |
| $ | 276 |
|
Burberry Group plc |
| 12,311 |
| 91 |
| |
Cable & Wireless plc |
| 136,412 |
| 280 |
| |
Cadbury Schweppes plc |
| 128,424 |
| 1,214 |
| |
Capita Group plc |
| 14,852 |
| 106 |
| |
Carnival plc |
| 15,671 |
| 890 |
| |
Centrica plc |
| 149,227 |
| 654 |
| |
Cobham plc |
| 68,671 |
| 200 |
| |
Compass Group plc |
| 189,046 |
| 717 |
| |
Corus Group plc |
| 237,550 |
| 241 |
| |
Daily Mail & General Trust, Class A |
| 13,552 |
| 184 |
| |
Davis Service Group plc |
| 1,205 |
| 10 |
| |
De La Rue plc |
| 5,960 |
| 48 |
| |
Diageo plc |
| 209,332 |
| 3,034 |
| |
DSG International plc |
| 81,957 |
| 231 |
| |
Electrocomponents plc |
| 36,111 |
| 175 |
| |
Emap plc |
| 11,328 |
| 168 |
| |
EMI Group plc |
| 35,703 |
| 149 |
| |
Enterprise Inns plc |
| 31,936 |
| 515 |
| |
Firstgroup plc |
| 22,576 |
| 156 |
| |
FKI plc |
| 7,577 |
| 15 |
| |
Friends Provident plc |
| 128,847 |
| 420 |
| |
GKN plc |
| 28,773 |
| 143 |
| |
GlaxoSmithKline plc |
| 361,435 |
| 9,135 |
| |
Group 4 Securicor plc |
| 7,592 |
| 21 |
| |
GUS plc |
| 34,714 |
| 616 |
| |
Hammerson plc |
| 26,779 |
| 471 |
| |
Hanson plc |
| 39,458 |
| 434 |
| |
Hays plc |
| 35,891 |
| 77 |
| |
HBOS plc |
| 209,972 |
| 3,587 |
| |
Hilton Group plc |
| 145,831 |
| 912 |
| |
HSBC Holdings plc |
| 633,051 |
| 10,162 |
| |
IMI plc |
| 28,309 |
| 245 |
| |
Imperial Chemical Industries plc |
| 65,126 |
| 372 |
| |
Imperial Tobacco Group plc |
| 36,729 |
| 1,098 |
| |
InterContinental Hotels Group plc |
| 42,568 |
| 615 |
| |
Invensys plc |
| (a)60,854 |
| 19 |
| |
ITV plc |
| 165,381 |
| 320 |
| |
Johnson Matthey plc |
| 12,054 |
| 293 |
| |
Kelda Group plc |
| 34,650 |
| 461 |
| |
Kesa Electricals plc |
| 11,073 |
| 50 |
| |
Kingfisher plc |
| 49,545 |
| 202 |
| |
Land Securities Group plc |
| 43,521 |
| 1,245 |
| |
Legal & General Group plc |
| 424,683 |
| 891 |
| |
Liberty International plc |
| 23,610 |
| 398 |
| |
Lloyds TSB Group plc |
| 301,709 |
| 2,536 |
| |
LogicaCMG plc |
| 45,843 |
| 140 |
| |
Man Group plc |
| 3,684 |
| 121 |
| |
Marks & Spencer Group plc |
| 70,639 |
| 614 |
| |
Meggitt plc |
| 31,964 |
| 199 |
| |
MFI Furniture plc |
| 6,439 |
| 9 |
| |
Misys plc |
| 30,954 |
| 127 |
| |
Mitchells & Butlers plc |
| 47,372 |
| 341 |
| |
National Express Group plc |
| 8,483 |
| 126 |
| |
National Grid plc |
| 186,219 |
| 1,821 |
| |
Next plc |
| 11,100 |
| $ | 293 |
|
Pearson plc |
| 34,469 |
| 408 |
| |
Peninsular & Oriental Steam Navigation Co. (The) |
| 56,275 |
| 451 |
| |
Persimmon plc |
| 11,913 |
| 258 |
| |
Pilkington plc |
| 72,958 |
| 187 |
| |
Prudential plc |
| 115,530 |
| 1,093 |
| |
Punch Taverns plc |
| 22,648 |
| 331 |
| |
Rank Group plc |
| 52,821 |
| 278 |
| |
Reckitt Benckiser plc |
| 63,654 |
| 2,103 |
| |
Reed Elsevier plc |
| 54,403 |
| 511 |
| |
Rentokil Initial plc |
| 39,028 |
| 110 |
| |
Reuters Group plc |
| 63,894 |
| 473 |
| |
Rexam plc |
| 30,620 |
| 268 |
| |
Rio Tinto plc |
| 57,868 |
| 2,643 |
| |
Rolls-Royce Group plc |
| (a)103,449 |
| 761 |
| |
Rolls-Royce Group plc, Class B |
| 2,771,398 |
| 5 |
| |
Royal & Sun Alliance Insurance Group |
| 172,865 |
| 374 |
| |
Royal Bank of Scotland Group plc |
| 163,866 |
| 4,948 |
| |
SABMiller plc |
| 26,725 |
| 488 |
| |
Sage Group plc |
| 85,242 |
| 378 |
| |
Sainsbury (J) plc |
| 70,097 |
| 380 |
| |
Scottish & Newcastle plc |
| 12,647 |
| 106 |
| |
Scottish & Southern Energy plc |
| 58,608 |
| 1,023 |
| |
Scottish Power plc |
| 126,874 |
| 1,186 |
| |
Serco Group plc |
| 19,444 |
| 105 |
| |
Severn Trent plc |
| 30,179 |
| 563 |
| |
Signet Group plc |
| 65,905 |
| 122 |
| |
Slough Estates plc |
| 37,845 |
| 390 |
| |
Smith & Nephew plc |
| 39,299 |
| 362 |
| |
Smiths Group plc |
| 33,869 |
| 610 |
| |
Stagecoach Group plc |
| 31,414 |
| 62 |
| |
Tate & Lyle plc |
| 44,799 |
| 434 |
| |
Taylor Woodrow plc |
| 25,889 |
| 169 |
| |
Tesco plc |
| 393,849 |
| 2,246 |
| |
TI Automotive Ltd., Class A |
| (a)(d)(l)1,505 |
| @— |
| |
Tomkins plc |
| 60,624 |
| 313 |
| |
Unilever plc |
| 187,722 |
| 1,862 |
| |
United Business Media plc |
| 12,279 |
| 135 |
| |
United Utilities plc |
| 5,482 |
| 63 |
| |
Vodafone Group plc |
| 3,117,437 |
| 6,731 |
| |
Whitbread plc |
| 23,322 |
| 381 |
| |
William Hill plc |
| 37,009 |
| 341 |
| |
Wimpey George plc |
| 17,309 |
| 143 |
| |
Wolseley plc |
| 34,291 |
| 723 |
| |
WPP Group plc |
| 42,200 |
| 457 |
| |
Yell Group plc |
| 27,504 |
| 254 |
| |
|
|
|
| 121,661 |
| |
Total Common Stocks (cost $600,007) |
|
|
| 726,807 |
| |
16 | The accompanying notes are an integral part of the financial statements. |
2005 Annual Report | |
|
|
December 31, 2005 | |
Portfolio of Investments (cont’d)
Active International Allocation Portfolio
|
| Face |
|
|
| ||
|
| Amount |
| Value |
| ||
|
| (000) |
| (000) |
| ||
Short-Term Investments (15.8%) | |||||||
Short-Term Debt Securities held as Collateral on Loaned Securities (8.2%) | |||||||
Abbey National Treasury Services, |
|
|
|
|
| ||
4.14%, 1/13/06 |
| $ | (h)1,545 |
| $ | 1,545 |
|
Alliance & Leister plc, 4.33%, 1/30/07 |
| (h)2,088 |
| 2,088 |
| ||
Bank of America, 4.31%, 11/7/06 |
| (h)459 |
| 459 |
| ||
Bank of New York Co., Inc., |
|
|
|
|
| ||
4.33%, 1/30/07 |
| (h)1,044 |
| 1,044 |
| ||
Bear Stearns, 4.38%, 6/15/06 |
| (h)2,088 |
| 2,088 |
| ||
Calyon NY, 4.40%, 2/27/06 |
| (h)835 |
| 835 |
| ||
Cancara Asset Securitisation Ltd., |
|
|
|
|
| ||
4.26%, 1/17/06 |
| 3,111 |
| 3,111 |
| ||
CC USA, Inc., 4.33%, 4/18/06 |
| (h)1,044 |
| 1,044 |
| ||
CIC NY, 4.34%, 2/13/06 |
| (h)3,132 |
| 3,132 |
| ||
Ciesco LLC, 4.25%, 1/17/06 |
| 1,037 |
| 1,037 |
| ||
Dekabank Deutsche Girozentrale, |
|
|
|
|
| ||
4.17%, 5/19/06 |
| (h)2,130 |
| 2,130 |
| ||
Deutsche Bank Securities, Inc., |
|
|
|
|
| ||
4.27%, 1/3/06 |
| 19,086 |
| 19,086 |
| ||
Goldman Sachs Group, Inc., |
|
|
|
|
| ||
4.38%, 1/30/07 |
| (h)1,044 |
| 1,044 |
| ||
HSBC USA, NY, 4.12%, 2/6/06 |
| 1,044 |
| 1,044 |
| ||
K2 (USA) LLC, |
|
|
|
|
| ||
4.33%, 4/25/06 |
| (h)1,044 |
| 1,044 |
| ||
4.34%, 2/15/06 |
| (h)919 |
| 919 |
| ||
4.35%, 2/15/06 |
| (h)418 |
| 418 |
| ||
Links Finance LLC, |
|
|
|
|
| ||
4.29%, 10/6/06 |
| (h)838 |
| 838 |
| ||
4.33%, 4/18/06 |
| (h)1,044 |
| 1,044 |
| ||
4.36%,2/27/06 |
| (h)1,253 |
| 1,253 |
| ||
Manufacturers & Traders, 4.37%, 12/29/06 |
| (h)626 |
| 626 |
| ||
Merck & Co., 4.37%, 2/23/06 |
| 1,082 |
| 1,082 |
| ||
Nationwide Building Society, |
|
|
|
|
| ||
4.58%, 1/2/07 |
| (h)2,422 |
| 2,422 |
| ||
Proctor & Gamble, 4.46%, 1/30/07 |
| (h)856 |
| 856 |
| ||
Rabobank USA Financial Corp., |
|
|
|
|
| ||
4.13%, 1/3/06 |
| 3,131 |
| 3,131 |
| ||
San Paolo IMI Bank, 4.33%, 2/23/06 |
| 1,879 |
| 1,879 |
| ||
Sigma Finance, Inc., 4.34%, 3/22/06 |
| (h)2,088 |
| 2,088 |
| ||
SLM Corp., 4.37%, 1/30/07 |
| (h)2,088 |
| 2,088 |
| ||
Tango Finance Corp., 4.33%, 3/22/06 |
| (h)1,754 |
| 1,754 |
| ||
Wachovia Bank N.A., 4.30%, 10/2/06 |
| (h)2,506 |
| 2,506 |
| ||
Wells Fargo Bank San Francisco N.A., |
|
|
|
|
| ||
4.30%, 12/1/06 |
| (h)1,462 |
| 1,462 |
| ||
|
|
|
| 65,097 |
| ||
Repurchase Agreement (7.6%) |
|
|
|
|
| ||
J.P. Morgan Securities, Inc., 4.05%, dated 12/30/05, due 1/3/06, repurchase price $60,183 |
| (f)60,156 |
| 60,156 |
| ||
Total Short-Term Investments (Cost $125,253) |
|
|
| 125,253 |
| ||
Total Investments (107.2%) (Cost $725,260) — including $61,520 of Securities Loaned |
|
|
| 852,060 |
| ||
Liabilities in Excess of Other Assets (-7.2%) |
|
|
| (57,516 | ) | ||
Net Assets (100%) |
|
|
| $ | 794,544 |
| |
(a) Non-income producing security.
(c) All or portion of security on loan at December 31, 2005.
(d) Security was valued at fair value — At December 31, 2005, the Portfolio held a fair valued security valued at less than $500, representing less than 0.05% of net assets.
(f) Represents the Portfolio’s undivided interest in a joint repurchase agreement which has a total value of $1,000,707,000. The repurchase agreement was fully collateralized by U.S. government agency securities at the date of this Portfolio of Investments as follows: Federal Farm Credit Bank: 2.00% to 7.35%, due 1/11/06 to 10/25/33; Federal Home Loan Mortgage Corp.: 1.88% to 7.22%, due 2/9/06 to 7/15/32; Federal National Mortgage Association: 2.50% to 7.25%, due 2/15/06 to 11/15/30, which had a total value of $1,020,741,791. The investment in the repurchase agreement is through participation in a joint account with affiliated parties pursuant to exemptive relief received by the Portfolio from the SEC.
(h) Variable/Floating Rate Security — interest rate changes on these instruments are based on changes in a designated base rate. The rates shown are those in effect on December 31, 2005.
(l) Security has been deemed illiquid - - at December 31, 2005.
@ Face Amount/Value is less than $500.
ADR American Depositary Receipts
CVA Certificaten Van Aandelen
GDR Global Depositary Receipts
REIT Real Estate Investment Trust
RNC Non-Convertible Savings Shares
The accompanying notes are an integral part of the financial statements. | 17 |
| 2005 Annual Report |
|
|
| December 31, 2005 |
Portfolio of Investments (cont’d)
Active International Allocation Portfolio
Foreign Currency Exchange Contract Information: |
The Portfolio had the following foreign currency exchange contract(s) open at period end:
Currency |
| Value |
| Settlement |
| In |
| Value |
| Net |
| ||||
AUD |
| 10,479 |
| $ 7,674 |
| 2/17/06 |
| USD |
| 7,810 |
| $ 7,810 |
| $ 136 |
|
EUR |
| 12,011 |
| 14,254 |
| 2/17/06 |
| USD |
| 14,128 |
| 14,128 |
| (126) |
|
EUR |
| 13,974 |
| 16,608 |
| 3/15/06 |
| USD |
| 16,761 |
| 16,761 |
| 153 |
|
EUR |
| 10,177 |
| 12,094 |
| 3/15/06 |
| USD |
| 12,202 |
| 12,202 |
| 108 |
|
EUR |
| 7,157 |
| 8,506 |
| 3/15/06 |
| USD |
| 8,582 |
| 8,582 |
| 76 |
|
GBP |
| 7,468 |
| 12,847 |
| 2/17/06 |
| USD |
| 12,815 |
| 12,815 |
| (32) |
|
GBP |
| 7,467 |
| 12,845 |
| 2/17/06 |
| USD |
| 12,815 |
| 12,815 |
| (30) |
|
GBP |
| 13 |
| 21 |
| 3/15/06 |
| USD |
| 22 |
| 22 |
| 1 |
|
GBP |
| 3,160 |
| 5,437 |
| 3/15/06 |
| USD |
| 5,599 |
| 5,599 |
| 162 |
|
HKD |
| 254,210 |
| 32,797 |
| 2/17/06 |
| USD |
| 32,801 |
| 32,801 |
| 4 |
|
JPY |
| 916,665 |
| 7,791 |
| 1/20/06 |
| USD |
| 8,007 |
| 8,007 |
| 216 |
|
JPY |
| 199,605 |
| 1,702 |
| 2/17/06 |
| USD |
| 1,692 |
| 1,692 |
| (10) |
|
JPY |
| 3,603,532 |
| 30,735 |
| 2/17/06 |
| USD |
| 30,543 |
| 30,543 |
| (192) |
|
JPY |
| 743,833 |
| 6,336 |
| 2/17/06 |
| USD |
| 6,300 |
| 6,300 |
| (36) |
|
JPY |
| 2,379,116 |
| 20,292 |
| 2/17/06 |
| USD |
| 19,916 |
| 19,916 |
| (376) |
|
JPY |
| 597,970 |
| 5,100 |
| 2/17/06 |
| USD |
| 5,000 |
| 5,000 |
| (100) |
|
JPY |
| 649,920 |
| 5,560 |
| 3/15/06 |
| USD |
| 5,473 |
| 5,473 |
| (87) |
|
JPY |
| 6,205 |
| 53 |
| 3/15/06 |
| USD |
| 52 |
| 52 |
| (1) |
|
SGD |
| 8,962 |
| 5,397 |
| 2/17/06 |
| USD |
| 5,345 |
| 5,345 |
| (52) |
|
SGD |
| 262 |
| 158 |
| 3/15/06 |
| USD |
| 157 |
| 157 |
| (1) |
|
SGD |
| 870 |
| 524 |
| 3/15/06 |
| USD |
| 521 |
| 521 |
| (3) |
|
USD |
| 16,300 |
| 16,300 |
| 2/17/06 |
| AUD |
| 21,921 |
| 16,053 |
| (247) |
|
USD |
| 42,912 |
| 42,912 |
| 2/17/06 |
| EUR |
| 36,071 |
| 42,809 |
| (103) |
|
USD |
| 10,612 |
| 10,612 |
| 2/17/06 |
| EUR |
| 8,931 |
| 10,600 |
| (12) |
|
USD |
| 5,345 |
| 5,345 |
| 2/17/06 |
| EUR |
| 4,449 |
| 5,280 |
| (65) |
|
USD |
| 5,490 |
| 5,490 |
| 3/15/06 |
| EUR |
| 4,579 |
| 5,442 |
| (48) |
|
USD |
| 7,614 |
| 7,614 |
| 3/15/06 |
| EUR |
| 6,351 |
| 7,547 |
| (67) |
|
USD |
| 10,273 |
| 10,273 |
| 3/15/06 |
| EUR |
| 8,561 |
| 10,174 |
| (99) |
|
USD |
| 12,281 |
| 12,281 |
| 3/15/06 |
| EUR |
| 10,247 |
| 12,178 |
| (103) |
|
USD |
| 13,364 |
| 13,364 |
| 3/15/06 |
| EUR |
| 11,137 |
| 13,236 |
| (128) |
|
USD |
| 152 |
| 152 |
| 3/15/06 |
| GBP |
| 86 |
| 148 |
| (4) |
|
USD |
| 2,902 |
| 2,902 |
| 3/15/06 |
| GBP |
| 1,640 |
| 2,821 |
| (81) |
|
USD |
| 29,047 |
| 29,047 |
| 2/17/06 |
| GBP |
| 16,780 |
| 28,867 |
| (180) |
|
USD |
| 32,801 |
| 32,801 |
| 2/17/06 |
| GBP |
| 18,491 |
| 31,811 |
| (990) |
|
USD |
| 3,254 |
| 3,254 |
| 3/15/06 |
| GBP |
| 1,839 |
| 3,162 |
| (92) |
|
USD |
| 3,476 |
| 3,476 |
| 3/15/06 |
| GBP |
| 1,966 |
| 3,382 |
| (94) |
|
USD |
| 6,797 |
| 6,797 |
| 3/15/06 |
| GBP |
| 3,844 |
| 6,613 |
| (184) |
|
USD |
| 9,536 |
| 9,536 |
| 2/17/06 |
| JPY |
| 1,124,216 |
| 9,588 |
| 52 |
|
USD |
| 15,842 |
| 15,842 |
| 2/17/06 |
| JPY |
| 1,887,629 |
| 16,099 |
| 257 |
|
USD |
| 7,810 |
| 7,810 |
| 2/17/06 |
| JPY |
| 904,148 |
| 7,711 |
| (99) |
|
USD |
| 3,283 |
| 3,283 |
| 3/15/06 |
| JPY |
| 390,045 |
| 3,337 |
| 54 |
|
USD |
| 4,867 |
| 4,867 |
| 3/15/06 |
| JPY |
| 577,830 |
| 4,944 |
| 77 |
|
USD |
| 10,084 |
| 10,084 |
| 3/15/06 |
| JPY |
| 1,197,280 |
| 10,244 |
| 160 |
|
USD |
| 2,936 |
| 2,936 |
| 3/15/06 |
| SEK |
| 23,081 |
| 2,920 |
| (16) |
|
USD |
| 3,387 |
| 3,387 |
| 3/15/06 |
| SGD |
| 5,649 |
| 3,405 |
| 18 |
|
USD |
| 1,013 |
| 1,013 |
| 3/15/06 |
| SGD |
| 1,690 |
| 1,018 |
| 5 |
|
|
|
|
| $468,109 |
|
|
|
|
|
|
| $465,930 |
| $ (2,179) |
|
|
|
|
|
|
|
|
|
|
|
|
|
|
|
|
|
AUD |
| — |
| Australian Dollar |
EUR |
| — |
| Euro |
GBP |
| — |
| British Pound |
HKD |
| — |
| Hong Kong Dollar |
JPY |
| — |
| Japanese Yen |
SEK |
| — |
| Swedish Krona |
SGD |
| — |
| Singapore Dollar |
USD |
| — |
| United States Dollar |
Futures Contracts: |
|
The Portfolio had the following futures contract(s) open at period end: |
|
| Number |
| Value |
| Expiration |
| Net |
| |||||
Long: |
|
|
|
|
|
|
|
|
| |||||
CAC 40 Index |
|
|
|
|
|
|
|
|
| |||||
(France) |
| 81 |
|
| $4,541 |
|
| Mar-06 |
|
| $ 49 |
|
| |
|
|
|
|
|
|
|
|
|
|
|
|
|
| |
DAX Index |
|
|
|
|
|
|
|
|
|
|
|
|
| |
(Germany) |
| 27 |
|
| 4,345 |
|
| Mar-06 |
|
| 93 |
|
| |
|
|
|
|
|
|
|
|
|
|
|
|
|
| |
FTSE 100 Index |
|
|
|
|
|
|
|
|
|
|
|
|
| |
(United Kingdom) |
| 151 |
|
| 14,591 |
|
| Mar-06 |
|
| 241 |
|
| |
|
|
|
|
|
|
|
|
|
|
|
|
|
| |
IBEX 35 Index |
|
|
|
|
|
|
|
|
|
|
|
|
| |
(Spain) |
| 19 |
|
| 2,406 |
|
| Jan-06 |
|
| 55 |
|
| |
|
|
|
|
|
|
|
|
|
|
|
|
|
| |
MSCI SING Index |
|
|
|
|
|
|
|
|
|
|
|
|
| |
(Singapore) |
| 118 |
|
| 3,938 |
|
| Jan-06 |
|
| (7 | ) |
| |
|
|
|
|
|
|
|
|
|
|
|
|
|
| |
MSCI Taiwan Index |
|
|
|
|
|
|
|
|
|
|
|
|
| |
(Taiwan) |
| 119 |
|
| 3,301 |
|
| Jan-06 |
|
| 18 |
|
| |
|
|
|
|
|
|
|
|
|
|
|
|
|
| |
OMX Index |
|
|
|
|
|
|
|
|
|
|
|
|
| |
(Sweden) |
| 273 |
|
| 3,306 |
|
| Jan-06 |
|
| 69 |
|
| |
|
|
|
|
|
|
|
|
|
|
|
|
|
| |
TOPIX Index |
|
|
|
|
|
|
|
|
|
|
|
|
| |
(Japan) |
| 209 |
|
| 29,135 |
|
| Mar-06 |
|
| 779 |
|
| |
|
|
|
|
|
|
|
| $ 1,297 |
|
| ||||
|
|
|
|
|
|
|
|
|
|
| ||||
18 |
|
2005 Annual Report | |
|
|
December 31, 2005 | |
Investment Overview
Emerging Markets Portfolio
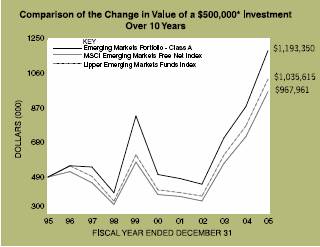
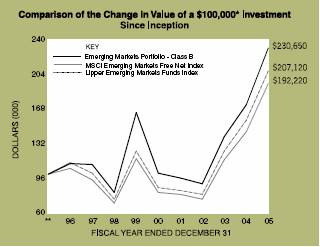
* | Minimum Investment |
** | Commenced offering on January 2, 1996. |
In accordance with SEC regulations, Portfolio performance shown assumes that all recurring fees (including management fees) were deducted and all dividends and distributions were reinvested.
Performance Compared to the Morgan Stanley Capital International (MSCI) Emerging Markets Free Net Index(1) and the Lipper Emerging Markets Funds Index(2)
|
| Total Returns(3) |
| ||||||
|
|
|
|
|
|
|
|
|
|
|
|
|
| Average Annual |
| ||||
|
| One |
| Five |
| Ten |
| Since |
|
|
| Year |
| Years |
| Years |
| Inception(6) |
|
Portfolio – Class A (4) |
| 34.54 | % | 18.33 | % | 9.09 | % | 10.08 | % |
MSCI Emerging Markets Free Net Index |
| 34.00 |
| 19.09 |
| 6.83 |
| 9.19 |
|
Lipper Emerging Markets Funds Index |
| 32.65 |
| 19.22 |
| 7.55 |
| — |
|
Portfolio – Class B (5) |
| 34.17 |
| 18.03 |
| — |
| 8.72 |
|
MSCI Emerging Markets Free Net Index |
| 34.00 |
| 19.09 |
| — |
| 6.76 |
|
Lipper Emerging Markets Funds Index |
| 32.65 |
| 19.22 |
| — |
| 7.46 |
|
(1) | The MSCI Emerging Markets Free Net Index is a free float-adjusted market capitalization index that is designed to measure equity market performance in the global emerging markets. The MSCI Emerging Markets Index consists of the following 26 emerging market country indices: Argentina, Brazil, Chile, China, Colombia, Czech Republic, Egypt, Hungary, India, Indonesia, Israel, Jordan, Korea, Malaysia, Mexico, Morocco, Pakistan, Peru, Philippines, Poland, Russia, South Africa, Taiwan, Thailand, Turkey and Venezuela. This series approximates the minimum possible dividend reinvestment. The dividend is reinvested after deduction of withholding tax, applying the rate to non-resident individuals who do not benefit from double taxation treaties. |
(2) | The Lipper Emerging Markets Funds Index is an equally weighted performance index of the largest qualifying funds (based on net assets) in the Lipper Emerging Markets Funds classification. The Index, which is adjusted for capital gains distributions and income dividends, is unmanaged and should not be considered an investment. There are currently 30 funds represented in this Index. As of the date of this report, the Portfolio is in the Lipper Emerging Markets Funds classification. |
(3) | Total returns for the Portfolio reflect fees waived and expenses reimbursed, if applicable, by the Adviser. Without such waivers and reimbursements, total returns would have been lower. Fee waivers and/or expense reimbursements are voluntary and the Adviser reserves the right to commence or terminate any waiver and/or reimbursement at any time. |
(4) | Commenced operations on September 25, 1992 |
(5) | Commenced offering on January 2, 1996 |
(6) | For comparative purposes, average annual since inception returns listed for the Indexes refer to the inception date or initial offering of the respective share class of the Portfolio, not the inception of the Index. |
Performance data quoted represents past performance, which is no guarantee of future results, and current performance may be lower or higher than the figures shown. Performance assumes that all dividends and distributions, if any, were reinvested. For the most recent month-end performance figures, please visit morganstanley.com/im. Investment return and principal value will fluctuate so that Portfolio shares, when redeemed, may be worth more or less than their original cost. Total returns do not reflect the deduction of taxes that a shareholder would pay on Portfolio distributions or the redemption of Portfolio shares.
The Emerging Markets Portfolio seeks long-term capital appreciation by investing primarily in growth-oriented equity securities of issuers in emerging market countries. Foreign investing involves certain risks, including currency fluctuations and controls, restrictions on foreign investments, less governmental supervision and regulation, less liquidity and the potential for market volatility and political instability.
| 19 |
| 2005 Annual Report |
|
|
| December 31, 2005 |
Investment Overview (cont’d)
Emerging Markets Portfolio
In addition, investing in emerging markets may involve a relative higher degree of volatility.
Performance
For the year ended December 31, 2005, the Portfolio had a total return based on net asset value per share of 34.54%, net of fees, for the Class A shares and 34.17%, net of fees, for the Class B shares compared to 34.00% for the Morgan Stanley Capital International (MSCI) Emerging Markets Free Net Index (the “Index”).
Factors Affecting Performance
• Global emerging markets posted a third consecutive calendar year of double-digit returns. The asset class appreciated 34.0% in 2005, following returns of 25.6% in 2004 and 55.3% in 2003. Emerging markets continued to outperform developed markets as well, beating the S&P 500® Index by 29 percentage points and developed international markets, as measured by the MSCI EAFE Index, by 20 percentage points.
• During the year, the emerging market asset class benefited from strong macro-economic growth, good corporate governance, a healthy consumer and attractive commodity prices. Latin America was the star performer, appreciating 50%; followed by Europe, Middle East and Africa (“EMEA”), returning 38.4%; and Asia, gaining 26.8%.
• Egypt, Colombia, Russia, Jordan and Argentina were among the best performing countries in the emerging markets region. Posting the only negative return in the region, Venezuela lagged most significantly, followed by Malaysia and Taiwan.
• Overall, country allocation contributed favorably to the Portfolio’s performance. The Portfolio’s underweight to Taiwan, and overweights to Mexico, Brazil and India were among the key drivers of relative performance. Overweights to Russia, up 73% for the year, and Egypt, up 161%, further enhanced performance.
• Certain stock selections detracted from performance. The Portfolio’s underweight in energy companies in China, South Africa and Russia slowed its pace.
• An underweight to South Korea, which rose 58%, tempered relative performance as well.
Management Strategies
• Relative to the Index, the Portfolio is overweighted in Latin America and EMEA, and underweighted Asia. As of the close of the period, Russia, Mexico, Brazil, Turkey and Poland were the focal areas of the Portfolio. In contrast, the Portfolio is underweighted in South Korea, Taiwan, Israel, Malaysia and China.
• The Portfolio is positioned for secular growth with overweights versus the Index in the consumer staples, consumer discretionary and wireless telecommunications sectors.
• We increased the Portfolio’s exposure to select Chinese banking stocks during the period, given the improved banking dynamics in the country and the rising consumer credit sector.
• On a country level, we trimmed the Portfolio’s position in Egypt and exited the market by the close of the reporting period. This strategy reflected our analysis of the slowdown in reform momentum and expensive valuations. We increased the Portfolio’s position in South Korea and South Africa by focusing on stocks with visible growth supported by domestic demand. We continued to emphasize Russia from a bottom-up and top-down perspective, given its overall economic conditions. Throughout the year, we increased the Portfolio’s exposure to Russia, focusing on domestic-oriented sectors and select energy stocks.
Expense Examples
As a shareholder of the Portfolio, you may incur two types of costs: (1) transactional costs, including redemption fees; (2) ongoing costs, including management fees, distribution (12b-1) fees (in the case of Class B); and other Portfolio expenses. These examples are intended to help you understand your ongoing costs (in dollars) of investing in the Portfolio and to compare these costs with the ongoing costs of investing in other mutual funds.
The examples are based on an investment of $1,000 invested at the beginning of the six-month period ended December 31, 2005 and held for the entire six-month period.
Actual Expenses
The first line of the tables below provides information about actual account values and actual expenses. You may use the information in this line, together with the amount you invested, to estimate the expenses that you paid over the period. Simply divide your account value by $1,000 (for example, an $8,600 account value divided by $1,000 = 8.6), then multiply the result by the number in the first line under the heading entitled “Expenses Paid During Period” to estimate the expenses you paid on your account during this period.
20 |
2005 Annual Report | |
|
|
December 31, 2005 | |
Investment Overview (cont’d)
Emerging Markets Portfolio
Hypothetical Example for Comparison Purposes
The second line of the tables below provides information about hypothetical account values and hypothetical expenses based on the Portfolio’s actual expense ratio and an assumed rate of return of 5% per year before expenses, which is not the Portfolio’s actual return. The hypothetical account values and expenses may not be used to estimate the actual ending account balance or expenses you paid for the period. You may use this information to compare the ongoing costs of investing in the Portfolio and other funds. To do so, compare this 5% hypothetical example with the 5% hypothetical examples that appear in the shareholder reports of the other funds.
Please note that the expenses shown in the table are meant to highlight your ongoing costs only and do not reflect any transactional costs, such as redemption fees. Therefore, the second line of the table is useful in comparing ongoing costs only, and will not help you determine the relative total costs of owning different funds. In addition, if these transactional costs were included, your costs would have been higher.
|
|
|
|
|
| Expenses Paid |
|
|
|
|
| Ending Account |
| During Period* |
|
|
| Beginning |
| Value |
| July 1, 2005 — |
|
|
| Account Value |
| December 31, |
| December 31, |
|
|
| July 1, 2005 |
| 2005 |
| 2005 |
|
Class A |
|
|
|
|
|
|
|
Actual |
| $1,000.00 |
| $1,273.40 |
| $ 7.96 |
|
Hypothetical (5% average |
|
|
|
|
|
|
|
annual return before expenses) |
| 1,000.00 |
| 1,018.20 |
| 7.07 |
|
|
|
|
|
|
|
|
|
Class B |
|
|
|
|
|
|
|
Actual |
| 1,000.00 |
| 1,271.80 |
| 9.39 |
|
Hypothetical (5% average |
|
|
|
|
|
|
|
annual return before expenses) |
| 1,000.00 |
| 1,016.94 |
| 8.34 |
|
* Expenses are equal to Class A and Class B annualized net expense ratios of 1.39% and 1.64%, respectively, multiplied by the average account value over the period, multiplied by 184/365 (to reflect the one-half year period).
Graphic Presentation of Portfolio Holdings
The following graph depicts the Portfolio’s holdings by industry and/or security type, as a percentage of total investments.
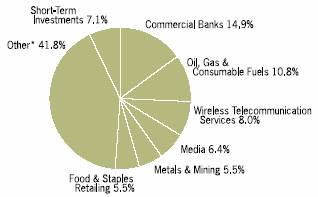
* Industries which do not appear in the above graph, as well as those which represent less than 5% of total investments, if applicable, are included in the category labeled “Other”.
January 2006
21
| 2005 Annual Report |
|
|
| December 31, 2005 |
Portfolio of Investments
Emerging Markets Portfolio
|
|
|
| Value |
| |
|
| Shares |
| (000) |
| |
Common Stocks (98.1%) (Unless otherwise noted) |
|
|
|
|
| |
Austria (0.3%) |
|
|
|
|
| |
Raiffeisen International Bank Holding AG |
| (a)(c)93,791 |
| $ | 6,168 |
|
Bermuda (0.3%) |
|
|
|
|
| |
Central European Media Enterprises Ltd. |
| (a)(c)96,300 |
| 5,576 |
| |
Brazil (12.6%) |
|
|
|
|
| |
All America Latina Logistica S.A. |
| 158,850 |
| 6,776 |
| |
Banco Itau Holding Financeira S.A. (Preference) |
| 362,620 |
| 8,731 |
| |
Banco Itau Holding Financeira S.A. ADR (Preference) |
| (c)772,600 |
| 18,558 |
| |
Banco Nacional S.A. (Preference) |
| (a)(l)295,998,880 |
| @— |
| |
CEMIG S.A. (Preference) |
| 70,786,092 |
| 2,876 |
| |
CEMIG S.A. ADR (Preference) |
| (c)113,100 |
| 4,169 |
| |
Cia Brasileira de Distribuicao Grupo Pao de Acucar ADR (Preference) |
| (c)120,400 |
| 3,961 |
| |
Cia Paranaense de Energia, Class B ADR (Preference) |
| (c)236,500 |
| 1,781 |
| |
Cia Paranaense de Energia, Class B (Preference) |
| 417,347,000 |
| 3,211 |
| |
CPFL Energia S.A. |
| 431,485 |
| 5,167 |
| |
CPFL Energia S.A. ADR |
| 49,710 |
| 1,732 |
| |
CVRD ADR |
| 52,100 |
| 2,143 |
| |
CVRD ADR (Preference) |
| 950,294 |
| 34,448 |
| |
CVRD, Class A (Preference) |
| 14,021 |
| 502 |
| |
Embratel Participacoes S.A. (Preference) |
| (a)2,608,643,900 |
| 7,586 |
| |
Empresa Brasileira de Aeronautica S.A. ADR |
| (c)299,920 |
| 11,727 |
| |
Gerdau S.A. (Preference) |
| 407,500 |
| 6,849 |
| |
Gerdau S.A. ADR |
| (c)218,779 |
| 3,649 |
| |
Investimentos Itau S.A. (Preference) |
| 2,295,824 |
| 7,265 |
| |
Perdigao S.A. (Preference) |
| 133,000 |
| 4,488 |
| |
Petrobras S.A. (Preference) |
| 400,836 |
| 6,379 |
| |
Petrobras S.A. ADR |
| 400,675 |
| 28,556 |
| |
Petrobras S.A. ADR (Preference) |
| 519,398 |
| 33,434 |
| |
Telesp Celular Participacoes S.A. |
| (a)51,813 |
| 188 |
| |
Telesp Celular Participacoes S.A. (Preference) |
| (a)1,156,776 |
| 4,378 |
| |
Tractebel Energia S.A. |
| 600,000 |
| 3,862 |
| |
Unibanco |
| 188,721 |
| 2,369 |
| |
Unibanco ADR |
| (c)287,980 |
| 18,307 |
| |
|
|
|
| 233,092 |
| |
Chile (0.6%) |
|
|
|
|
| |
Enersis S.A. ADR |
| (c)1,036,700 |
| 11,393 |
| |
China/Hong Kong (5.4%) |
|
|
|
|
| |
Air China Ltd., Class H |
| (a)858,000 |
| 274 |
| |
Asia Aluminum Holdings Ltd. |
| (a)29,964,000 |
| 2,589 |
| |
China Construction Bank, Class H |
| (a)(c)(e)29,154,000 |
| 10,152 |
| |
China Life Insurance Co., Ltd. |
| (a)(c)8,072,000 |
| 7,131 |
| |
China Mobile Hong Kong Ltd. |
| (c)2,522,000 |
| 11,937 |
| |
China Resources Power Holdings Co. |
| 7,869,000 |
| 4,440 |
| |
China Techfaith Wireless Communication Technology Ltd. ADR |
| (a)107,700 |
| 1,454 |
| |
China Unicom Ltd. |
| 6,258,000 |
| 5,085 |
| |
Global Bio-Chem Technology Group Co., Ltd. |
| (c)14,395,000 |
| 6,312 |
| |
GOME Electrical Appliances Holdings Ltd. |
| (c)13,650,000 |
| $ | 9,243 |
|
Grande Holdings Ltd. |
| (c)2,069,000 |
| 1,601 |
| |
Hopewell Highway Infrastructure Ltd. |
| (c)5,074,000 |
| 3,370 |
| |
Huadian Power International Corp., Ltd., Class H |
| 11,499,000 |
| 2,936 |
| |
Kingboard Chemical Holdings Ltd. |
| (c)1,943,000 |
| 5,263 |
| |
Moulin Global Eyecare Holdings Ltd. |
| (a)(d)(l)2,150,000 |
| @— |
| |
PetroChina Co., Ltd., Class H |
| 14,842,000 |
| 12,155 |
| |
Ping An Insurance Group Co. of China Ltd., Class H |
| 3,383,000 |
| 6,239 |
| |
Shougang Concord Century Holdings Ltd. |
| 12,407,000 |
| 592 |
| |
TPV Technology Ltd. |
| 8,139,000 |
| 8,027 |
| |
Victory City International Holdings Ltd. |
| (c)3,929,000 |
| 1,140 |
| |
|
|
|
| 99,940 |
| |
Colombia (0.5%) |
|
|
|
|
| |
BanColombia S.A. ADR |
| 293,730 |
| 8,468 |
| |
Hungary (0.7%) |
|
|
|
|
| |
Gedeon Richter Rt. |
| 76,353 |
| 13,717 |
| |
India (7.4%) |
|
|
|
|
| |
ABB Ltd. India |
| 157,082 |
| 6,720 |
| |
Aventis Pharma Ltd. |
| 110,424 |
| 4,063 |
| |
Bharat Heavy Electricals Corp. |
| 596,385 |
| 18,385 |
| |
Cipla Ltd. |
| 456,665 |
| 4,500 |
| |
Container Corp. of India Ltd. |
| 156,919 |
| 5,055 |
| |
Glenmark Pharmaceuticals Ltd. |
| 430,000 |
| 3,004 |
| |
Gujarat Ambuja Cements Ltd. GDR |
| 1,980,000 |
| 3,465 |
| |
Gujarat Ambuja Cements Ltd. |
| 480,000 |
| 849 |
| |
HDFC Bank Ltd. |
| 316,000 |
| 4,978 |
| |
Hero Honda Motors Ltd. |
| 405,385 |
| 7,746 |
| |
Hindalco Industries Ltd. |
| 922,792 |
| 2,941 |
| |
Hindustan Lever Ltd. |
| 1,498,260 |
| 6,568 |
| |
Housing Development Finance Corp. |
| 254,000 |
| 6,814 |
| |
ICICI Bank Ltd. ADR |
| 48,000 |
| 1,382 |
| |
India Info.com PCL |
| (d)(l)393,611 |
| @— |
| |
Infosys Technologies Ltd. |
| 229,036 |
| 15,254 |
| |
ITC Ltd. |
| 762,000 |
| 2,405 |
| |
ITC Ltd. (Registered) GDR |
| 651,000 |
| 2,025 |
| |
Mahindra & Mahindra Ltd. |
| 622,500 |
| 7,084 |
| |
Morgan Stanley Growth Fund |
| (a)(k)17,282,900 |
| 12,729 |
| |
Punj Lloyd Ltd. |
| (a)11,474 |
| 179 |
| |
Punjab National Bank |
| (d)372,500 |
| 4,092 |
| |
Reliance Industries Ltd. |
| 93,000 |
| 1,839 |
| |
Reliance Industries Ltd. GDR |
| (e)48,000 |
| 1,897 |
| |
Siemens India Ltd. |
| 64,000 |
| 5,136 |
| |
UTI Bank Ltd. |
| 241,000 |
| 1,534 |
| |
UTI Bank Ltd. GDR |
| (a)316,000 |
| 2,019 |
| |
Wipro Ltd. |
| 481,000 |
| 4,954 |
| |
|
|
|
| 137,617 |
| |
Indonesia (0.2%) |
|
|
|
|
| |
Bank Mandiri Persero Tbk PT |
| 19,001,000 |
| 3,170 |
| |
Malaysia (1.3%) |
|
|
|
|
| |
Bandar Raya Developments Bhd |
| 2,727,000 |
| 624 |
| |
Bumiputra-Commerce Holdings Bhd |
| 2,119,000 |
| 3,196 |
| |
IOI Corp. Bhd |
| 850,000 |
| 2,789 |
| |
Magnum Corp. Bhd |
| 4,457,000 |
| 2,240 |
| |
22 | The accompanying notes are an integral part of the financial statements. |
2005 Annual Report | |
|
|
December 31, 2005 | |
Portfolio of Investments (cont’d)
Emerging Markets Portfolio
|
|
|
| Value |
| |
|
| Shares |
| (000) |
| |
Malaysia (cont’d) |
|
|
|
|
| |
MK Land Holdings Bhd |
| 3,633,000 |
| $ | 490 |
|
Resorts World Bhd |
| 884,000 |
| 2,620 |
| |
Road Builder (M) Holdings Bhd |
| 1,658,000 |
| 610 |
| |
Tenaga Nasional Bhd |
| 2,602,000 |
| 6,816 |
| |
YTL Corp. Bhd |
| 3,293,066 |
| 4,661 |
| |
|
|
|
| 24,046 |
| |
Mexico (10.6%) |
|
|
|
|
| |
America Movil S.A. de C.V., Class L ADR |
| 2,077,709 |
| 60,794 |
| |
Empresas ICA Sociedad Controladora S.A. de C.V. |
| (a)890,883 |
| 2,178 |
| |
Empresas ICA Sociedad Controladora S.A. de C.V. ADR |
| (a)22,900 |
| 670 |
| |
Fomento Economico Mexicano S.A. de C.V. ADR |
| 247,720 |
| 17,962 |
| |
Grupo Televisa S.A. ADR |
| 618,040 |
| 49,752 |
| |
Kimberly-Clark de Mexico S.A. de C.V., Class A |
| 1,630,870 |
| 5,829 |
| |
Wal-Mart de Mexico S.A. de C.V. ADR |
| (c)156,092 |
| 8,657 |
| |
Wal-Mart de Mexico S.A. de C.V., Series V |
| 9,129,108 |
| 50,658 |
| |
|
|
|
| 196,500 |
| |
Morocco (0.8%) |
|
|
|
|
| |
Attijariwafa Bank |
| 11,599 |
| 1,557 |
| |
Banque Marocaine du Commerce Exterieur |
| 71,100 |
| 5,779 |
| |
ONA S.A. |
| 70,700 |
| 8,191 |
| |
|
|
|
| 15,527 |
| |
Pakistan (0.4%) |
|
|
|
|
| |
National Bank of Pakistan |
| 791,100 |
| 2,640 |
| |
Pakistan Telecommunication Co., Ltd. |
| 4,591,700 |
| 5,024 |
| |
|
|
|
| 7,664 |
| |
Peru (0.2%) |
|
|
|
|
| |
Credicorp Ltd. |
| 176,500 |
| 4,022 |
| |
Poland (3.7%) |
|
|
|
|
| |
Agora S.A. |
| 333,211 |
| 7,078 |
| |
Bank Millennium S.A. |
| 1,235,803 |
| 1,997 |
| |
Bank Pekao S.A. |
| 228,763 |
| 12,289 |
| |
Central European Distribution Corp. |
| (a)(c)249,200 |
| 10,003 |
| |
NFI Empik Media & Fasion S.A. |
| (a)758,047 |
| 1,587 |
| |
Polski Koncern Naftowy Orlen |
| 218,130 |
| 4,210 |
| |
Powszechna Kasa Oszczednosci Bank Polski S.A. |
| 1,286,003 |
| 11,480 |
| |
Telekomunikacja Polska S.A. GDR |
| 852,400 |
| 6,123 |
| |
TVN S.A. |
| (a)567,101 |
| 13,617 |
| |
|
|
|
| 68,384 |
| |
Russia (10.3%) |
|
|
|
|
| |
Alliance Cellulose Ltd. |
| (a)(d)(l)592,359 |
| @— |
| |
Efes Breweries International N.V. GDR |
| (a)197,380 |
| 5,615 |
| |
Highland Gold Mining Ltd. |
| 1,647,700 |
| 6,960 |
| |
LUKOIL ADR |
| (c)1,213,356 |
| 72,195 |
| |
MMC Norilsk Nickel ADR |
| 84,000 |
| 7,963 |
| |
Mobile Telesystems ADR |
| 213,800 |
| 7,483 |
| |
Mobile Telesystems GDR |
| 254,800 |
| 8,924 |
| |
OAO Gazprom ADR (Registered) |
| (c)234,540 |
| 17,121 |
| |
Pyaterochka Holding N.V. GDR |
| (a)(c)774,472 |
| 11,191 |
| |
RAO Unified Energy System GDR |
| 132,349 |
| $ | 5,612 |
|
Sberbank RF GDR |
| (a)210,650 |
| 27,532 |
| |
Surgutneftegaz ADR |
| (c)172,398 |
| 9,396 |
| |
Wimm-Bill-Dann Foods OJSC ADR |
| (a)(c)436,100 |
| 10,480 |
| |
|
|
|
| 190,472 |
| |
South Africa (12.7%) |
|
|
|
|
| |
African Bank Investments Ltd. |
| 4,150,700 |
| 16,071 |
| |
Anglo American plc (London Shares) |
| 1 |
| @— |
| |
Aveng Ltd. |
| (c)3,714,800 |
| 10,562 |
| |
Edgars Consolidated Stores Ltd. |
| 2,421,100 |
| 13,453 |
| |
Harmony Gold Mining Co., Ltd. |
| (a)(c)768,002 |
| 10,305 |
| |
Harmony Gold Mining Co., Ltd. ADR |
| (a)(c)771,573 |
| 10,069 |
| |
Impala Platinum Holdings Ltd. |
| 75,938 |
| 11,185 |
| |
J.D. Group Ltd. |
| 900,490 |
| 10,908 |
| |
Massmart Holdings Ltd. |
| 355,245 |
| 2,900 |
| |
Mittal Steel South Africa Ltd. |
| 200 |
| 2 |
| |
MTN Group Ltd. |
| 3,193,950 |
| 31,372 |
| |
Murray & Roberts Holdings Ltd. |
| 2,097,900 |
| 6,498 |
| |
Naspers Ltd., Class N |
| 1,560,360 |
| 27,622 |
| |
Pretoria Portland Cement Co., Ltd. |
| 173,800 |
| 8,426 |
| |
Shoprite Holdings Ltd. |
| 3,227,309 |
| 9,400 |
| |
Standard Bank Group Ltd. |
| 2,505,504 |
| 30,019 |
| |
Steinhoff International Holdings Ltd. |
| 4,469,521 |
| 13,244 |
| |
Tiger Brands Ltd. |
| 941,440 |
| 21,648 |
| |
Woolworths Holdings Ltd. |
| 578,800 |
| 1,299 |
| |
|
|
|
| 234,983 |
| |
South Korea (14.1%) |
|
|
|
|
| |
Amorepacific Corp. |
| (a)10,776 |
| 3,380 |
| |
Cheil Industries, Inc. |
| (a)178,210 |
| 4,970 |
| |
Daelim Industrial Co. |
| (a)53,330 |
| 3,811 |
| |
Doosan Heavy Industries and Construction Co., Ltd. |
| (a)388,940 |
| 14,650 |
| |
Doosan Infracore Co., Ltd. |
| (a)203,100 |
| 3,649 |
| |
GS Engineering & Construction Corp. |
| (a)220,680 |
| 11,609 |
| |
Hanjin Heavy Industries & Construction Co., Ltd. |
| (a)213,570 |
| 4,982 |
| |
Hankook Tire Co., Ltd. |
| (a)390,760 |
| 5,527 |
| |
Hanmi Pharm Co., Ltd. |
| (a)25,589 |
| 3,530 |
| |
Hyundai Mobis |
| (a)125,880 |
| 11,545 |
| |
Hyundai Motor Co. |
| (a)127,240 |
| 12,288 |
| |
Hyundai Motor Co. (Preference) |
| (a)99,880 |
| 6,801 |
| |
Kookmin Bank |
| (a)228,600 |
| 17,358 |
| |
Korea Zinc Co., Ltd. |
| (a)103,510 |
| 5,240 |
| |
KT&G Corp. |
| (a)250,270 |
| 11,191 |
| |
NHN Corp. |
| (a)27,310 |
| 7,319 |
| |
Orion Corp. |
| (a)56,714 |
| 15,790 |
| |
Pusan Bank |
| (a)334,260 |
| 4,396 |
| |
S-Oil Corp. |
| 44,960 |
| 3,151 |
| |
Samsung Electronics Co., Ltd. |
| 61,784 |
| 40,413 |
| |
Samsung Electronics Co., Ltd. (Preference) |
| 28,049 |
| 13,669 |
| |
Samsung Fire & Marine Insurance Co., Ltd. |
| 68,688 |
| 8,727 |
| |
Samsung SDI Co., Ltd. |
| (a)80,800 |
| 9,343 |
| |
Shinhan Financial Group Co., Ltd. |
| (a)389,610 |
| 15,874 |
| |
SK Corp. |
| (a)190,330 |
| 9,842 |
| |
The accompanying notes are an integral part of the financial statements. | 23 |
| 2005 Annual Report |
|
|
| December 31, 2005 |
Portfolio of Investments (cont’d)
Emerging Markets Portfolio
|
|
|
| Value |
| ||||
|
| Shares |
| (000) |
| ||||
South Korea (cont’d) |
|
|
|
|
| ||||
Woongjin Coway Co., Ltd. |
| (a)169,880 |
| $ | 4,038 |
| |||
Woori Finance Holdings Co., Ltd. |
| (a)412,680 |
| 8,233 |
| ||||
|
|
|
| 261,326 |
| ||||
Taiwan (8.8%) |
|
|
|
|
| ||||
Acer, Inc. |
| 2,331,000 |
| 5,858 |
| ||||
Asia Optical Co., Inc. |
| 59,000 |
| 405 |
| ||||
AU Optronics Corp. |
| 14,549,940 |
| 21,719 |
| ||||
Cathay Financial Holding Co., Ltd. |
| 4,484,000 |
| 8,128 |
| ||||
Cheng Shin Rubber Industry Co., Ltd. |
| 2,338,056 |
| 2,066 |
| ||||
China Steel Corp. |
| 4,265,700 |
| 3,249 |
| ||||
Chinatrust Financial Holding Co., Ltd. |
| 7,339,766 |
| 5,813 |
| ||||
Compal Electronics, Inc. |
| 6,425,000 |
| 5,794 |
| ||||
CTCI Corp. |
| 3,337,344 |
| 1,398 |
| ||||
Cyberlink Corp. |
| 116,479 |
| 320 |
| ||||
Delta Electronics, Inc. |
| 4,380,279 |
| 8,980 |
| ||||
Delta Electronics, Inc. GDR |
| 287,448 |
| 2,945 |
| ||||
Eva Airways Corp. |
| 1,109 |
| 1 |
| ||||
Far EasTone Telecommunications Co., Ltd. |
| 2,963,000 |
| 3,353 |
| ||||
Formosa Petrochemical Corp. |
| 2,800,000 |
| 4,964 |
| ||||
High Tech Computer Corp. |
| 468,000 |
| 8,782 |
| ||||
HON HAI Precision Industry Co., Ltd. |
| 2,329,048 |
| 12,771 |
| ||||
Infortrend Technology, Inc. |
| 1,040,000 |
| 1,578 |
| ||||
Kaulin Manufacturing Co., Ltd. |
| 1,382,063 |
| 1,255 |
| ||||
Largan Precision Co., Ltd. |
| 525,045 |
| 8,285 |
| ||||
MediaTek, Inc. |
| 1,107,715 |
| 13,059 |
| ||||
Phoenixtec Power Co., Ltd. |
| 2,248,355 |
| 2,452 |
| ||||
Polaris Securities Co., Ltd. |
| 4,069,969 |
| 1,841 |
| ||||
Radiant Opto-Electronics Corp. |
| 1,180,561 |
| 2,877 |
| ||||
Shin Kong Financial Holding Co., Ltd. |
| 15,221,555 |
| 11,848 |
| ||||
Springsoft, Inc. |
| 1,816,112 |
| 2,976 |
| ||||
Taishin Financial Holdings Co., Ltd. |
| 5,395,156 |
| 2,827 |
| ||||
Taiwan Mobile Co., Ltd. |
| 3,855,000 |
| 3,370 |
| ||||
Taiwan Semiconductor Manufacturing Co., Ltd. |
| 2,800,000 |
| 5,331 |
| ||||
Tsann Kuen Enterprise Co. |
| 2,674,611 |
| 4,473 |
| ||||
Vanguard International Semiconductor Corp. |
| 5,852,358 |
| 4,457 |
| ||||
|
|
|
| 163,175 |
| ||||
Thailand (2.6%) |
|
|
|
|
| ||||
Advanced Info Service PCL (Foreign) |
| 2,582,900 |
| 6,674 |
| ||||
Asian Property Development PCL |
| (d)15,446,800 |
| 1,288 |
| ||||
Bangkok Bank PCL (Foreign) |
| (c)1,926,700 |
| 5,401 |
| ||||
CH. Karnchang PCL (Foreign) |
| (c)(d)4,880,800 |
| 1,439 |
| ||||
CP Seven Eleven PCL (Foreign) |
| (d)20,236,400 |
| 2,910 |
| ||||
Italian-Thai Development PCL (Foreign) |
| (d)18,608,100 |
| 3,742 |
| ||||
Kasikornbank PCL (Foreign) |
| (c)2,125,500 |
| 3,886 |
| ||||
Lalin Property PCL (Foreign) |
| (d)4,391,500 |
| 529 |
| ||||
Land & Houses PCL (Foreign, Registered) |
| (c)9,781,000 |
| 2,122 |
| ||||
MBK PCL (Foreign) |
| (d)765,700 |
| 830 |
| ||||
PTT PCL (Foreign) |
| (d)1,221,500 |
| 6,729 |
| ||||
Siam City Bank PCL (Foreign, Registered) |
| 2,953,900 |
| 1,750 |
| ||||
Siam Commercial Bank PCL (Foreign, Registered) |
| 919,200 |
| 1,165 |
| ||||
Siam Makro PCL (Foreign) |
| (d)389,600 |
| $ | 660 |
| |||
Thai Oil PCL (Foreign) |
| (d)1,428,400 |
| 2,211 |
| ||||
Total Access Communication PCL |
| (a)1,430,600 |
| 4,635 |
| ||||
True Corp. PCL (Foreign) |
| (a)6,255,800 |
| 1,525 |
| ||||
|
|
|
| 47,496 |
| ||||
Turkey (4.6%) |
|
|
|
|
| ||||
Akcansa Cimento A.S. |
| 1,179,501 |
| 7,162 |
| ||||
BIM Birlesik Magazalar A.S. |
| (a)293,207 |
| 7,273 |
| ||||
Dogan Yayin Holding A.S. |
| (a)2,800,877 |
| 11,096 |
| ||||
Enka Insaat ve Sanayi A.S. |
| 146,305 |
| 1,820 |
| ||||
Haci Omer Sabanci Holding A.S. |
| 1,558,200 |
| 8,826 |
| ||||
Hurriyet Gazetecilik ve Matbaacilik A.S. |
| 2,926,155 |
| 11,484 |
| ||||
Turk Hava Yollari Anonim Ortakligi |
| (a)1,851,980 |
| 11,588 |
| ||||
Turkiye Garanti Bankasi A.S., Class C |
| (a)2,347,955 |
| 8,519 |
| ||||
Turkiye Vakiflar Bankasi TAO, Class D |
| (a)908,900 |
| 4,812 |
| ||||
Yapi ve Kredi Bankasi A.S. |
| (a)2,869,797 |
| 13,387 |
| ||||
|
|
|
| 85,967 |
| ||||
Total Common Stocks (Cost $1,309,602) |
|
|
| 1,818,703 |
| ||||
|
|
|
| Face |
|
|
| ||
|
|
|
| Amount |
|
|
| ||
|
|
|
| (000) |
|
|
| ||
Fixed Income Securities (0.5%) |
|
|
|
|
|
|
| ||
India (0.0%) |
|
|
|
|
|
|
| ||
Saurashtra Cement & Chemicals Ltd. (expired maturity) |
|
| INR |
| (b)(d)(l)700 |
| @— |
| |
Russia (0.5%) |
|
|
|
|
|
|
|
| |
MCSI Holding Ltd. (Secured Notes) |
|
| $ |
| (d)(l)10,337 |
| 9,820 |
| |
Total Fixed Income Securities (Cost $11,840) |
|
|
|
|
| 9,820 |
| ||
Short-Term Investments (7.6%) |
|
|
|
|
|
|
| ||
Short-Term Debt Securities held as Collateral on Loaned Securities (5.3%) |
|
|
|
|
|
|
| ||
Abbey National Treasury Services, |
|
|
|
|
|
|
| ||
4.14%, 1/13/06 |
|
|
| (h)2,339 |
| 2,339 |
| ||
Alliance & Leister plc, |
|
|
|
|
|
|
| ||
4.33%, 1/30/07 |
|
|
| (h)3,161 |
| 3,161 |
| ||
Bank of America, 4.31%, 11/7/06 |
|
|
| (h)695 |
| 695 |
| ||
Bank of New York Co., Inc., |
|
|
|
|
|
|
| ||
4.33%, 1/30/07 |
|
|
| (h)1,580 |
| 1,580 |
| ||
Bear Stearns, 4.38%, 6/15/06 |
|
|
| (h)3,161 |
| 3,161 |
| ||
Calyon NY, 4.40%, 2/27/06 |
|
|
| (h)1,264 |
| 1,264 |
| ||
Cancara Asset Securitisation Ltd., |
|
|
|
|
|
|
| ||
4.26%, 1/17/06 |
|
|
| 4,710 |
| 4,710 |
| ||
CC USA, Inc., 4.33%, 4/18/06 |
|
|
| (h)1,580 |
| 1,580 |
| ||
CIC NY, 4.34%, 2/13/06 |
|
|
| (h)4,741 |
| 4,741 |
| ||
Ciesco LLC, 4.25%, 1/17/06 |
|
|
| 1,570 |
| 1,570 |
| ||
Dekabank Deutsche Girozentrale, |
|
|
|
|
|
|
| ||
4.17%, 5/19/06 |
|
|
| (h)3,224 |
| 3,224 |
| ||
Deutsche Bank Securities, Inc., |
|
|
|
|
|
|
| ||
4.27%, 1/3/06 |
|
|
| 28,890 |
| 28,890 |
| ||
Goldman Sachs Group, Inc., |
|
|
|
|
|
|
| ||
4.38%, 1/30/07 |
|
|
| (h)1,580 |
| 1,580 |
| ||
HSBC USA, NY, 4.12%, 2/6/06 |
|
|
| 1,580 |
| 1,580 |
| ||
K2 (USA) LLC, |
|
|
|
|
|
|
| ||
4.33%, 4/25/06 |
|
|
| (h)1,580 |
| 1,580 |
| ||
4.34%, 2/15/06 |
|
|
| (h)1,391 |
| 1,391 |
| ||
4.35%, 2/15/06 |
|
|
| (h)632 |
| 632 |
| ||
24 | The accompanying notes are an integral part of the financial statements. |
2005 Annual Report | |
|
|
December 31, 2005 | |
Portfolio of Investments (cont’d)
Emerging Markets Portfolio
|
| Face |
|
|
| ||
|
| Amount |
| Value |
| ||
|
| (000) |
| (000) |
| ||
Short-Term Debt Securities held as Collateral on Loaned Securities (cont’d) |
|
|
|
|
| ||
Links Finance LLC, |
|
|
|
|
| ||
4.29%, 10/6/06 |
| $ | (h)1,268 |
| $ | 1,268 |
|
4.33%, 4/18/06 |
| (h)1,580 |
| 1,580 |
| ||
4.36%,2/27/06 |
| (h)1,896 |
| 1,896 |
| ||
Manufacturers & Traders, |
|
|
|
|
| ||
4.37%, 12/29/06 |
| (h)948 |
| 948 |
| ||
Merck & Co., 4.37%, 2/23/06 |
| 1,638 |
| 1,638 |
| ||
Nationwide Building Society, |
|
|
|
|
| ||
4.58%, 1/2/07 |
| (h)3,666 |
| 3,666 |
| ||
Proctor & Gamble, 4.46%, 1/30/07 |
| (h)1,296 |
| 1,296 |
| ||
Rabobank USA Financial Corp., |
|
|
|
|
| ||
4.13%, 1/3/06 |
| 4,739 |
| 4,739 |
| ||
San Paolo IMI Bank, 4.33%, 2/23/06 |
| 2,844 |
| 2,844 |
| ||
Sigma Finance, Inc., 4.34%, 3/22/06 |
| (h)3,160 |
| 3,160 |
| ||
SLM Corp., 4.37%, 1/30/07 |
| (h)3,161 |
| 3,161 |
| ||
Tango Finance Corp., 4.33%, 3/22/06 |
| (h)2,655 |
| 2,655 |
| ||
Wachovia Bank N.A., 4.30%, 10/2/06 |
| (h)3,793 |
| 3,793 |
| ||
Wells Fargo Bank San Francisco N.A., |
|
|
|
|
| ||
4.30%, 12/1/06 |
| (h)2,212 |
| 2,212 |
| ||
|
|
|
| 98,534 |
| ||
Repurchase Agreement (2.3%) |
|
|
|
|
| ||
J.P. Morgan Securities, Inc., 4.05%, dated 12/30/05, due 1/3/06, repurchase price $41,656 |
| (f)41,637 |
| 41,637 |
| ||
Total Short-Term Investments (Cost $140,171) |
|
|
| 140,171 |
| ||
Total Investments (106.2%) (Cost $1,461,613) including $94,556 of Securities Loaned |
|
|
| 1,968,694 |
| ||
Liabilities in Excess of Other Assets (-6.2%) |
|
|
| (115,541) |
| ||
Net Assets (100%) |
|
|
| $ | 1,853,153 |
| |
(a) | Non-income producing security. |
(b) | Issuer is in default. |
(c) | All or portion of security on loan at December 31, 2005. |
(d) | Security was valued at fair value — At December 31, 2005, the Portfolio held $41,010,000 of fair valued securities, representing 2.2% of net assets. |
(e) | 144A security — certain conditions for public sale may exist. Unless otherwise noted, these securities are deemed to be liquid. |
(f) | Represents the Portfolio’s undivided interest in a joint repurchase agreement which has a total value of $1,000,707,000. The repurchase agreement was fully collateralized by U.S. government agency securities at the date of this Portfolio of Investments as follows: Federal Farm Credit Bank: 2.00% to 7.35%, due 1/11/06 to 10/25/33; Federal Home Loan Mortgage Corp.: 1.88% to 7.22%, due 2/9/06 to 7/15/32; Federal National Mortgage Association: 2.50% to 7.25%, due 2/15/06 to 11/15/30, which had a total value of $1,020,741,791. The investment in the repurchase agreement is through participation in a joint account with affiliated parties pursuant to exemptive relief received by the Portfolio from the SEC. |
(h) | Variable/Floating Rate Security — interest rate changes on these instruments are based on changes in a designated base rate. The rates shown are those in effect on December 31, 2005. |
(k) | Investments of Securities of Affiliated issuer — The Morgan Stanley Growth Fund, acquired at a cost of $3,415,000, is advised by an affiliate of the Adviser. During the year ended December 31, 2005, the Portfolio had no purchases or sales of this security. The Portfolio derived no income from this security during the year ended December 31, 2005. |
(l) | Security has been deemed illiquid - at December 31, 2005. |
@ | Face Amount/Value is less than $500. |
ADR | American Depositary Receipts |
GDR | Global Depositary Receipts |
INR | Indian Rupee |
Foreign Currency Exchange Contract Information: |
|
The Portfolio had the following foreign currency exchange contract(s) open at period end: |
Currency |
| Value |
| Settlement |
| In |
| Value |
| Net |
| ||||||||
HKD |
| 2,376 |
| $ | 306 |
| 1/3/06 |
| USD |
| 306 |
| $ | 306 |
| $ | @— |
| |
USD |
| 21 |
| 21 |
| 1/3/06 |
| ZAR |
| 130 |
| 21 |
| @— |
| ||||
USD |
| 209 |
| 209 |
| 1/4/06 |
| ZAR |
| 1,333 |
| 210 |
| 1 |
| ||||
USD |
| 99 |
| 99 |
| 1/4/06 |
| ZAR |
| 633 |
| 100 |
| 1 |
| ||||
USD |
| 447 |
| 447 |
| 1/5/06 |
| ZAR |
| 2,847 |
| 450 |
| 3 |
| ||||
ZAR |
| 1,878 |
| 297 |
| 1/6/06 |
| USD |
| 297 |
| 297 |
| @— |
| ||||
ZAR |
| 7,219 |
| 1,141 |
| 1/9/06 |
| USD |
| 1,137 |
| 1,137 |
| (4 | ) | ||||
ZAR |
| 309,265 |
| 48,165 |
| 8/14/06 |
| USD |
| 45,773 |
| 45,773 |
| (2,392 | ) | ||||
|
|
|
| $ | 50,685 |
|
|
|
|
|
|
| $ | 48,294 |
| $ | (2,391 | ) | |
|
|
|
|
|
|
|
|
|
|
|
|
|
|
|
|
|
|
| |
HKD | — | Hong Kong Dollar |
USD | — | United States Dollar |
ZAR | — | South African Rand |
The accompanying notes are an integral part of the financial statements. | 25 |
| 2005 Annual Report |
|
|
| December 31, 2005 |
Investment Overview
Global Franchise Portfolio
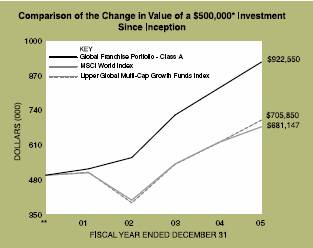
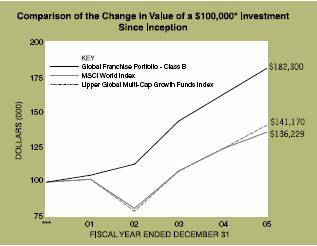
* | Minimum Investment |
** | Commenced operations on November 28, 2001 |
*** | Commenced offering on November 28, 2001 |
In accordance with SEC regulations, Portfolio performance shown assumes that all recurring fees (including management fees) were deducted and all dividends and distributions were reinvested.
Performance Compared to the Morgan Stanley Capital International (MSCI) World Index(1) and the Lipper Global Multi-Cap Growth Funds Index(2)
|
| Total Returns(3) |
| ||
|
|
|
| Average |
|
|
|
|
| Annual |
|
|
| Year |
| Since |
|
|
| One |
| Inception(6) |
|
Portfolio – Class A (4) |
| 11.91 | % | 16.15 | % |
Portfolio – Class B (5) |
| 11.53 |
| 15.81 |
|
MSCI World Index |
| 9.49 |
| 7.85 |
|
Lipper Global Multi-Cap Growth Funds Index |
| 13.66 |
| 8.79 |
|
(1) | The MSCI World Index is a free float-adjusted market capitalization index that is designed to measure global developed market equity performance. The MSCI World Index consists of the following 23 developed market country indices: Australia, Austria, Belgium, Canada, Denmark, Finland, France, Germany, Greece, Hong Kong, Ireland, Italy, Japan, Netherlands, New Zealand, Norway, Portugal, Singapore, Spain, Sweden, Switzerland, the United Kingdom and the United States. |
(2) | The Lipper Global Multi-Cap Growth Funds Index is an equally weighted performance index of the largest qualifying funds (based on net assets) in the Lipper Global Multi-Cap Growth Funds classification. The Index, which is adjusted for capital gains distributions and income dividends, is unmanaged and should not be considered an investment. There are currently 10 funds represented in this Index. As of the date of this report, the Portfolio is in the Lipper Global Multi-Cap Growth Funds classification. |
(3) | Total returns for the Portfolio reflect fees waived and expenses reimbursed, if applicable, by the Adviser. Without such waivers and/or reimbursements, total returns would have been lower. Fee waivers and/or expense reimbursements are voluntary and the Adviser reserves the right to commence or terminate any waiver and/or reimbursement at any time. |
(4) | Commenced operations on November 28, 2001 |
(5) | Commenced offering on November 28, 2001 |
(6) | For comparative purposes, average annual since inception returns listed for the Indexes refer to the inception date or initial offering of the respective share class of the Portfolio, not the inception of the Index. |
Performance data quoted represents past performance, which is no guarantee of future results, and current performance may be lower or higher than the figures shown. Performance assumes that all dividends and distributions, if any, were reinvested. For the most recent month-end performance figures, please visit morganstanley.com/im. Investment return and principal value will fluctuate so that Portfolio shares, when redeemed, may be worth more or less than their original cost. Total returns do not reflect the deduction of taxes that a shareholder would pay on Portfolio distributions or the redemption of Portfolio shares.
The Global Franchise Portfolio seeks long-term capital appreciation by investing primarily in equity securities of issuers located throughout the world, that it believes have, among other things, resilient business franchises and growth potential. This Portfolio’s concentration of its assets in a smaller number of companies may subject it to greater investment risk than a portfolio with a larger number of companies. Foreign investing involves certain risks, including currency fluctuations and controls, restrictions on foreign investments, less governmental supervision and regulation, less liquidity and the potential for market volatility and political instability.
26
2005 Annual Report | |
|
|
December 31, 2005 | |
Investment Overview (cont’d)
Global Franchise Portfolio
Performance
For the year ended December 31, 2005, the Portfolio had a total return based on net asset value per share of 11.91%, net of fees, for the Class A shares and 11.53%, net of fees, for the Class B shares, compared to 9.49% for the Morgan Stanley Capital International (MSCI) World Index (the “Index”).
Factors Affecting Performance
• Despite stubbornly high oil prices and concerns about rising global inflation, improving economic outlooks drove the strong performance of global markets in the 12-month period ended December 31, 2005. European economic growth began to show signs of momentum, the U.S. economy continued to grow moderately, and Japan’s economy also began to pick up.
• Energy (+29%), materials (+20%) and utilities (+14%) were the strongest performing sectors within the Index. The weakest performing sectors were telecommunication services (-9%), consumer discretionary (+2%) and information technology (+5%).
• The Portfolio’s top contributing stocks were British American Tobacco, Kone and Altria.
• However, holdings in GCap Media, The New York Times and SMG were the Portfolio’s largest detractors.
• On a sector basis, the Portfolio’s relative return benefited from our selection in the consumer staples and industrials sectors, as well as zero allocations to the telecommunication services and information technology sectors (both of which lagged in the benchmark return).
• In contrast, media stocks and a lack of exposure to the energy sector (one of the benchmark’s best performing groups) detracted from relative results.
• In line with our buy-and-hold approach, we initiated positions in four new stocks during the year (Unilever, Harley-Davidson, Pfizer and Scotts Miracle-Gro).
• We sold out of Cargotec (a spin-off from Kone); and, as a result of the acquisition of Allied Domecq by Pernod Ricard, we now hold a position in Pernod Ricard.
Management Strategies
• We continue our dialogue with a number of companies and are researching new ideas.
• We remain focused on the global brands philosophy of exceptional quality at compelling value. We continue to seek investment opportunities in companies with strong business franchises protected by a dominant intangible asset. Additionally, we demand sound management, substantial free cash flow and growth potential. We invest in these high quality companies only when we can identify compelling value as measured by a current free cash flow yield in excess of the risk-free bond yield. We seek to deliver attractive returns while striving to minimize business risk and valuation risk.
The information contained in this overview regarding specific securities is for informational purposes only and should not be construed as a recommendation to purchase or sell the securities mentioned.
Expense Examples
As a shareholder of the Portfolio, you may incur two types of costs: (1) transactional costs, including redemption fees; (2) ongoing costs, including management fees, distribution (12b-1) fees (in the case of Class B); and other Portfolio expenses.These examples are intended to help you understand your ongoing costs (in dollars) of investing in the Portfolio and to compare these costs with the ongoing costs of investing in other mutual funds.
The examples are based on an investment of $1,000 invested at the beginning of the six-month period ended December 31, 2005 and held for the entire six-month period.
Actual Expenses
The first line of the tables below provides information about actual account values and actual expenses. You may use the information in this line, together with the amount you invested, to estimate the expenses that you paid over the period. Simply divide your account value by $1,000 (for example, an $8,600 account value divided by $1,000 = 8.6), then multiply the result by the number in the first line under the heading entitled ‘‘Expenses Paid During Period’’ to estimate the expenses you paid on your account during this period.
Hypothetical Example for Comparison Purposes
The second line of the tables below provides information about hypothetical account values and hypothetical expenses based on the Portfolio’s actual expense ratio and an assumed rate of return of 5% per year before expenses, which is not the Portfolio’s actual return. The hypothetical account values and expenses may not be used to estimate the actual ending account balance or expenses you paid for the period. You may use this information to compare the ongoing costs of investing in the Portfolio and other funds. To do so, compare this 5% hypothetical example with the 5% hypothetical examples that appear in the shareholder reports of the other funds.
Please note that the expenses shown in the table are meant to highlight your ongoing costs only and do not reflect any transactional costs, such as redemption fees. Therefore, the second line of the table is useful in comparing ongoing costs only, and will not help you determine the relative total costs of
27
| 2005 Annual Report |
|
|
| December 31, 2005 |
Investment Overview (cont’d)
Global Franchise Portfolio
owning different funds. In addition, if these transactional costs were included, your costs would have been higher.
|
|
|
|
|
| Expenses Paid |
|
|
|
|
| Ending Account |
| During Period* |
|
|
| Beginning |
| Value |
| July 1, 2005 — |
|
|
| Account Value |
| December 31, |
| December 31, |
|
|
| July 1, 2005 |
| 2005 |
| 2005 |
|
Class A |
|
|
|
|
|
|
|
Actual |
| $1,000.00 |
| $1,079.80 |
| $5.24 |
|
Hypothetical (5% average annual return before expenses) |
| 1,000.00 |
| 1,020.21 |
| 5.09 |
|
|
|
|
|
|
|
|
|
Class B |
|
|
|
|
|
|
|
Actual |
| 1,000.00 |
| 1,077.90 |
| 6.55 |
|
Hypothetical (5% average annual return before expenses) |
| 1,000.00 |
| 1,018.95 |
| 6.36 |
|
* Expenses are equal to Class A and Class B annualized net expense ratios of 1.00% and 1.25%, respectively, multiplied by the average account value over the period, multiplied by 184/365 (to reflect the one-half year period).
Graphic Presentation of Portfolio Holdings
The following graph depicts the Portfolio’s holdings by industry and/or security type, as a percentage of total investments.
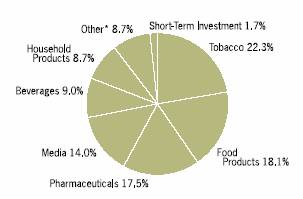
* | Industries which do not appear in the above graph, as well as those which represent less than 5% of total investments, if applicable, are included in the category labeled “Other”. |
January 2006
28
2005 Annual Report | |
|
|
December 31, 2005 | |
Portfolio of Investments
Global Franchise Portfolio
|
|
|
| Value |
|
|
| Shares |
| (000) |
|
Common Stocks (97.8%) |
|
|
|
|
|
Canada (1.9%) |
|
|
|
|
|
Torstar Corp., Class B |
| 89,037 |
| $ 1,696 |
|
Finland (3.9%) |
|
|
|
|
|
Kone Oyj, Class B |
| (a)87,593 |
| 3,477 |
|
France (8.3%) |
|
|
|
|
|
Groupe Danone |
| 28,474 |
| 2,975 |
|
Pernod-Ricard S.A. |
| 12,639 |
| 2,205 |
|
Sanofi-Aventis S.A. |
| 25,805 |
| 2,261 |
|
|
|
|
| 7,441 |
|
Netherlands (8.9%) |
|
|
|
|
|
Koninklijke Numico N.V. |
| (a)74,033 |
| 3,066 |
|
Reed Elsevier N.V. |
| 157,020 |
| 2,193 |
|
Wolters Kluwer N.V. CVA |
| 135,398 |
| 2,738 |
|
|
|
|
| 7,997 |
|
Spain (3.4%) |
|
|
|
|
|
Altadis S.A. |
| 64,878 |
| 2,943 |
|
Zardoya Otis S.A. |
| 5,319 |
| 135 |
|
|
|
|
| 3,078 |
|
Sweden (4.1%) |
|
|
|
|
|
Swedish Match AB |
| 310,216 |
| 3,651 |
|
Switzerland (6.2%) |
|
|
|
|
|
Nestle S.A. (Registered) |
| 10,063 |
| 3,010 |
|
Novartis AG (Registered) |
| 48,660 |
| 2,557 |
|
|
|
|
| 5,567 |
|
United Kingdom (34.8%) |
|
|
|
|
|
British American Tobacco plc |
| 287,322 |
| 6,427 |
|
Cadbury Schweppes plc |
| 518,500 |
| 4,902 |
|
Diageo plc |
| 224,930 |
| 3,260 |
|
GCAP Media plc |
| 180,166 |
| 902 |
|
GlaxoSmithKline plc |
| 98,120 |
| 2,480 |
|
Imperial Tobacco Group plc |
| 95,755 |
| 2,862 |
|
Reckitt Benckiser plc |
| 154,176 |
| 5,093 |
|
SMG plc |
| 673,377 |
| 996 |
|
Unilever plc |
| 220,728 |
| 2,189 |
|
WPP Group plc |
| 181,362 |
| 1,963 |
|
|
|
|
| 31,074 |
|
United States (26.3%) |
|
|
|
|
|
Altria Group, Inc. |
| 52,562 |
| 3,927 |
|
Bristol-Myers Squibb Co. |
| 100,468 |
| 2,309 |
|
Brown-Forman Corp., Class B |
| 36,186 |
| 2,508 |
|
Harley-Davidson, Inc. |
| 44,296 |
| 2,281 |
|
Kimberly-Clark Corp. |
| 43,914 |
| 2,620 |
|
Merck & Co., Inc. |
| 84,822 |
| 2,698 |
|
New York Times Co. (The), Class A |
| 75,929 |
| 2,008 |
|
Pfizer, Inc. |
| 142,266 |
| 3,318 |
|
Scotts Miracle-Gro Co. (The), Class A |
| 40,014 |
| 1,810 |
|
|
|
|
| 23,479 |
|
Total Common Stocks (Cost $67,414) |
|
|
| 87,460 |
|
|
| Face |
|
|
|
|
| Amount |
| Value |
|
|
| (000) |
| (000 | ) |
Short-Term Investment (1.7%) |
|
|
|
|
|
Repurchase Agreement (1.7%) |
|
|
|
|
|
J.P. Morgan Securities, Inc., 4.05%, dated 12/30/05, due 1/3/06, repurchase price $1,536 (Cost $1,535) |
| $ (f)1,535 |
| $1,535 |
|
Total Investments (99.5%) (Cost $68,949) |
|
|
| 88,995 |
|
Other Assets in Excess of Liabilities (0.5%) |
|
|
| 424 |
|
Net Assets (100%) |
|
|
| $89,419 |
|
(a) | Non-income producing security. |
(f) | Represents the Portfolio’s undivided interest in a joint repurchase agreement which has a total value of $1,000,707,000. The repurchase agreement was fully collateralized by U.S. government agency securities at the date of this Portfolio of Investments as follows: Federal Farm Credit Bank: 2.00% to 7.35%, due 1/11/06 to 10/25/33; Federal Home Loan Mortgage Corp.: 1.88% to 7.22%, due 2/9/06 to 7/15/32; Federal National Mortgage Association: 2.50% to 7.25%, due 2/15/06 to 11/15/30, which had a total value of $1,020,741,791. The investment in the repurchase agreement is through participation in a joint account with affiliated parties pursuant to exemptive relief received by the Portfolio from the SEC. |
CVA | Certificaten Van Aandelen |
Foreign Currency Exchange Contract Information: |
|
The Portfolio had the following foreign currency exchange contract(s) open at period end: |
Currency |
| Value |
| Settlement |
| In |
| Value |
| Net |
| |||||||
GBP |
| 8,975 |
| $ | 15,441 |
| 1/23/06 |
| USD |
| 15,815 |
| $ | 15,815 |
| $ | 374 |
|
GBP | — | British Pound |
USD | — | United States Dollar |
The accompanying notes are an integral part of the financial statements. | 29 |
| 2005 Annual Report |
|
|
| December 31, 2005 |
Investment Overview
Global Value Equity Portfolio
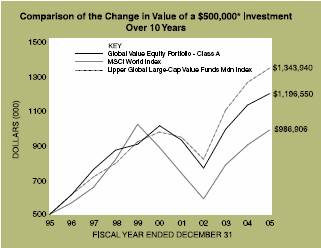
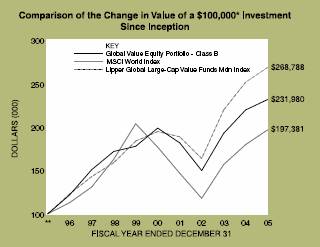
* | Minimum Investment |
** | Commenced offering on January 2, 1996 |
In accordance with SEC regulations, Portfolio performance shown assumes that all recurring fees (including management fees) were deducted and all dividends and distributions were reinvested.
Performance Compared to the Morgan Stanley Capital International (MSCI) World Index(1) and the Lipper Global Large-Cap Value Funds Median Index(2)
|
| Total Returns(3) |
| ||||||
|
|
|
| Average Annual |
| ||||
|
| One |
| Five |
| Ten |
| Since |
|
|
| Year |
| Years |
| Years |
| Inception(6) |
|
Portfolio – Class A (4) |
| 5.81 | % | 3.40 | % | 9.12 | % | 11.39 | % |
MSCI World Index |
| 9.49 |
| 2.18 |
| 7.04 |
| 8.58 |
|
Lipper Global Large-Cap Value Funds Mdn |
| 6.51 |
| 6.60 |
| 10.39 |
| — |
|
Portfolio – Class B (5) |
| 5.59 |
| 3.13 |
| — |
| 8.78 |
|
MSCI World Index |
| 9.49 |
| 2.18 |
| — |
| 6.99 |
|
Lipper Global Large-Cap Value Funds Mdn |
| 6.51 |
| 6.60 |
| — |
| 10.18 |
|
(1) | The MSCI World Index is a free float-adjusted market capitalization index that is designed to measure global developed market equity performance. The MSCI World Index consists of the following 23 developed market country indices: Australia, Austria, Belgium, Canada, Denmark, Finland, France, Germany, Greece, Hong Kong, Ireland, Italy, Japan, Netherlands, New Zealand, Norway, Portugal, Singapore, Spain, Sweden, Switzerland, the United Kingdom and the United States. |
(2) | The Lipper Global Large-Cap Value Funds Median Index is an equally weighted performance index of the largest qualifying funds (based on net assets) in the Lipper Global Large-Cap Value Funds classification. The Index, which is adjusted for capital gains distributions and income dividends, is unmanaged and should not be considered an investment. As of the date of this report, the Portfolio is in the Lipper Global Large-Cap Value Funds classification. |
(3) | Total returns for the Portfolio reflect fees waived and expenses reimbursed, if applicable, by the Adviser. Without such waivers and reimbursements, total returns would have been lower. Fee waivers and/or expense reimbursements are voluntary and the Adviser reserves the right to commence or terminate any waiver and/or reimbursement at any time. |
(4) | Commenced operations on July 15, 1992 |
(5) | Commenced offering on January 2, 1996 |
(6) | For comparative purposes, average annual since inception returns listed for the Indexes refer to the inception date or initial offering of the respective share class of the Portfolio, not the inception of the Index. |
Performance data quoted represents past performance, which is no guarantee of future results, and current performance may be lower or higher than the figures shown. Performance assumes that all dividends and distributions, if any, were reinvested. For the most recent month-end performance figures, please visit morganstanley.com/im. Investment return and principal value will fluctuate so that Portfolio shares, when redeemed, may be worth more or less than their original cost. Total returns do not reflect the deduction of taxes that a shareholder would pay on Portfolio distributions or the redemption of Portfolio shares.
The Global Value Equity Portfolio seeks long-term capital appreciation by investing primarily in equity securities of issuers throughout the world, including U.S. issuers. Foreign investing involves certain risks, including currency fluctuations and controls, restrictions on foreign investments, less governmental supervision and regulation, less liquidity and the potential for market volatility and political instability.
Performance
For the year ended December 31, 2005, the Portfolio had a total return based on net asset value per share of 5.81% for the
30
2005 Annual Report | |
|
|
December 31, 2005 | |
Investment Overview (cont’d)
Global Value Equity Portfolio
Class A shares, net of fees, and 5.59% for the Class B shares, net of fees, compared to 9.49% for the Morgan Stanley Capital International (MSCI) World Index (the “Index”).
Factors Affecting Performance
• Global stock markets posted mixed performance throughout the year. In the United States, soaring oil prices, inflationary concerns, ongoing monetary tightening and the Gulf Coast hurricanes called into question the pace of economic growth and resulted in more muted equity performance. The major European markets gained as investors took a more positive view of the prospects of the German economy. In the United Kingdom, equity markets were weaker due in part to concerns of slowing consumer and industrial trends. Market sentiment improved as the period progressed and the Bank of England reduced rates, however. Meanwhile, Japan’s market performed very strongly, boosted by a range of factors. Deflation abated, economic recovery continued, and the privatization of the Japanese postal system advanced. Despite high oil prices, the world economy appeared to be in a reasonably healthy state as the period came to a close.
• The Portfolio benefited from stock selection in the consumer staples sector, with holdings in the tobacco industry and food and beverage industries performing especially well. Because these companies enjoy predictable ongoing consumer demand for their products, they were particularly attractive in a less certain economic climate. The Portfolio was also well served by its industrials stocks. In particular, commercial aerospace stocks boosted returns as the market rewarded well-executed business strategies.
• However, these positive factors were overshadowed by stock selection and marginal underweight in the energy sector. Our value conscious discipline led us to favor integrated oil companies rather than higher priced and more historically volatile oil services stocks. While the Portfolio’s holdings posted strong returns in absolute terms, they did not keep pace with the exceptional performance of oil services.
• Financials stocks also detracted from performance, with insurance stocks falling short of expectations. Stock selection and overweighted positions in telecommunications services and healthcare further tempered the pace of relative performance.
• Although there were a number of stock changes in the Portfolio over the year, the key sector overweights and underweights relative to the benchmark remained the same.
Management Strategies
• The Portfolio was positioned defensively throughout the period. Our investment discipline found greater value in consumer staples, telecommunications services and pharmaceutical stocks. As the result of individual stock decisions, we continue to hold overweight positions relative to the Index in these sectors. Conversely, as of the close of the period, the Portfolio was underweight relative to the benchmark in the financials, energy and information technology sectors.
• Within telecommunications, we added Asian companies and pared exposure to European and U.S. companies. Our view is that these Asian companies are tradingat relatively compelling valuations and offer exciting growth potential.
• Our approach and philosophy remained unaltered throughout the period. Our disciplined and proven investment process was driven by rigorous individual stock selection, rather than by “top down” regional or sector allocations. We applied strict criteria for value and quality.
Expense Examples
As a shareholder of the Portfolio, you may incur two types of costs: (1) transactional costs, including redemption fees; (2) ongoing costs, including management fees, distribution (12b-1) fees (in the case of Class B); and other Portfolio expenses. These examples are intended to help you understand your ongoing costs (in dollars) of investing in the Portfolio and to compare these costs with the ongoing costs of investing in other mutual funds.
The examples are based on an investment of $1,000 invested at the beginning of the six-month period ended December 31, 2005 and held for the entire six-month period.
Actual Expenses
The first line of the tables below provides information about actual account values and actual expenses. You may use the information in this line, together with the amount you invested, to estimate the expenses that you paid over the period. Simply divide your account value by $1,000 (for example, an $8,600 account value divided by $1,000 = 8.6), then multiply the result by the number in the first line under the heading entitled “Expenses Paid During Period” to estimate the expenses you paid on your account during this
period.
Hypothetical Example for Comparison Purposes
The second line of the tables below provides information about hypothetical account values and hypothetical expenses based on the Portfolio’s actual expense ratio and an assumed rate of return of 5% per year before expenses, which is not the
31
| 2005 Annual Report |
|
|
| December 31, 2005 |
Investment Overview (cont’d)
Global Value Equity Portfolio
account balance or expenses you paid for the period. You may use this information to compare the ongoing costs of investing in the Portfolio and other funds. To do so, compare this 5% hypothetical example with the 5% hypothetical examples that appear in the shareholder reports of the other funds.
Please note that the expenses shown in the table are meant to highlight your ongoing costs only and do not reflect any transactional costs, such as redemption fees. Therefore, the second line of the table is useful in comparing ongoing costs only, and will not help you determine the relative total costs of owning different funds. In addition, if these transactional costs were included, your costs would have been higher
Graphic Presentation of Portfolio Holdings
The following graph depicts the Portfolio’s holdings by industry and/or security type, as a percentage of total investments.
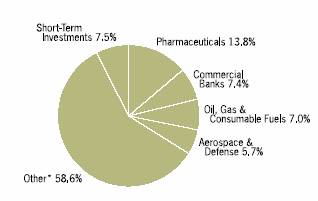
* | Industries which do not appear in the above graph, as well as those which represent less than 5% of total investments, if applicable, are included in the category labeled “Other”. |
January 2006
32
2005 Annual Report | |
|
|
December 31, 2005 | |
Portfolio of Investments
Global Value Equity Portfolio
|
| Value |
|
|
| |
|
| Shares |
| (000) |
| |
Common Stocks (97.4%) |
|
|
|
|
| |
Australia (2.1%) |
|
|
|
|
| |
Boral Ltd. |
| 107,179 |
| $ | 637 |
|
Foster’s Group Ltd. |
| 141,657 |
| 580 |
| |
National Australia Bank Ltd. |
| 42,773 |
| 1,016 |
| |
|
|
|
| 2,233 |
| |
Bermuda (3.2%) |
|
|
|
|
| |
Tyco International Ltd. |
| 89,918 |
| 2,595 |
| |
XL Capital Ltd., Class A |
| (c)13,375 |
| 901 |
| |
|
|
|
| 3,496 |
| |
France (5.7%) |
|
|
|
|
| |
BNP Paribas S.A. |
| 19,409 |
| 1,571 |
| |
Lafarge S.A. |
| (c)13,548 |
| 1,219 |
| |
Sanofi-Aventis S.A. |
| 18,411 |
| 1,613 |
| |
Total S.A. |
| 7,091 |
| 1,781 |
| |
|
|
|
| 6,184 |
| |
Germany (1.6%) |
|
|
|
|
| |
BASF AG |
| 7,905 |
| 606 |
| |
Bayerische Motoren Werke AG |
| 24,696 |
| 1,083 |
| |
|
|
|
| 1,689 |
| |
Hong Kong (0.6%) |
|
|
|
|
| |
Hong Kong Electric Holdings Ltd. |
| 121,680 |
| 603 |
| |
Ireland (2.3%) |
|
|
|
|
| |
Bank of Ireland |
| 94,405 |
| 1,488 |
| |
Kerry Group plc, Class A |
| 43,858 |
| 971 |
| |
|
|
|
| 2,459 |
| |
Italy (3.0%) |
|
|
|
|
| |
ENI S.p.A. |
| 75,267 |
| 2,087 |
| |
Telecom Italia S.p.A. RNC |
| 484,130 |
| 1,201 |
| |
|
|
|
| 3,288 |
| |
Japan (8.7%) |
|
|
|
|
| |
Astellas Pharma, Inc. |
| 30,000 |
| 1,171 |
| |
Canon, Inc. |
| (c)21,400 |
| 1,253 |
| |
Fuji Photo Film Co., Ltd. |
| 32,900 |
| 1,088 |
| |
Kao Corp. |
| 48,000 |
| 1,287 |
| |
Mitsui Sumitomo Insurance Co., Ltd. |
| 56,000 |
| 685 |
| |
Sumitomo Electric Industries Ltd. |
| 101,400 |
| 1,540 |
| |
Takeda Pharmaceutical Co., Ltd. |
| 32,400 |
| 1,753 |
| |
Toyota Motor Corp. |
| (c)11,600 |
| 602 |
| |
|
|
|
| 9,379 |
| |
Netherlands (4.3%) |
|
|
|
|
| |
Koninklijke Philips Electronics N.V. |
| 16,770 |
| 521 |
| |
Royal Dutch Shell plc ADR |
| 38,944 |
| 2,395 |
| |
Unilever N.V. CVA |
| 15,033 |
| 1,029 |
| |
Wolters Kluwer N.V. CVA |
| 36,281 |
| 734 |
| |
|
|
|
| 4,679 |
| |
New Zealand (0.9%) |
|
|
|
|
| |
Telecom Corp. of New Zealand Ltd. |
| (c)241,469 |
| 991 |
| |
South Korea (0.8%) |
|
|
|
|
| |
SK Telecom Co., Ltd. ADR |
| (c)42,079 |
| 854 |
| |
Spain (2.0%) |
|
|
|
|
| |
Banco Bilbao Vizcaya Argentaria S.A. |
| 60,725 |
| 1,084 |
| |
Telefonica S.A. |
| 68,281 |
| $ | 1,027 |
|
|
|
|
| 2,111 |
| |
Switzerland (4.1%) |
|
|
|
|
| |
Nestle S.A. (Registered) |
| 4,501 |
| 1,346 |
| |
Novartis AG (Registered) |
| 9,931 |
| 522 |
| |
Syngenta AG |
| (a)9,878 |
| 1,229 |
| |
UBS AG (Registered) |
| 13,659 |
| 1,301 |
| |
|
|
|
| 4,398 |
| |
Taiwan (0.8%) |
|
|
|
|
| |
Chunghwa Telecom Co., Ltd. ADR |
| (c)45,070 |
| 827 |
| |
United Kingdom (19.2%) |
|
|
|
|
| |
Amvescap plc |
| 82,213 |
| 625 |
| |
BAA plc |
| 65,447 |
| 706 |
| |
Barclays plc |
| 139,266 |
| 1,464 |
| |
Cadbury Schweppes plc |
| 231,597 |
| 2,190 |
| |
Diageo plc |
| 85,877 |
| 1,245 |
| |
GlaxoSmithKline plc |
| 117,701 |
| 2,975 |
| |
Imperial Tobacco Group plc |
| 68,291 |
| 2,041 |
| |
Morrison WM Supermarkets plc |
| 344,192 |
| 1,146 |
| |
Reckitt Benckiser plc |
| 7,496 |
| 248 |
| |
Reed Elsevier plc |
| 191,393 |
| 1,798 |
| |
Rentokil Initial plc |
| 152,988 |
| 430 |
| |
Rolls-Royce Group plc |
| (a)266,097 |
| 1,957 |
| |
Rolls-Royce Group plc, Class B |
| 8,788,175 |
| 16 |
| |
Royal Bank of Scotland Group plc |
| 57,602 |
| 1,739 |
| |
Vodafone Group plc |
| 743,892 |
| 1,606 |
| |
WPP Group plc |
| 55,168 |
| 597 |
| |
|
|
|
| 20,783 |
| |
United States (38.1%) |
|
|
|
|
| |
Alcoa, Inc. |
| 29,455 |
| 871 |
| |
Altria Group, Inc. |
| 34,272 |
| 2,561 |
| |
American Electric Power Co., Inc. |
| (c)29,579 |
| 1,097 |
| |
American International Group, Inc. |
| 9,641 |
| 658 |
| |
AT&T, Inc. |
| (c)22,261 |
| 545 |
| |
BJ’s Wholesale Club, Inc. |
| (a)(c)32,694 |
| 966 |
| |
Boeing Co. (The) |
| 43,263 |
| 3,039 |
| |
Bristol-Myers Squibb Co. |
| 54,051 |
| 1,242 |
| |
Chevron Corp. |
| 21,920 |
| 1,244 |
| |
Citigroup, Inc. |
| 94,249 |
| 4,574 |
| |
Exxon Mobil Corp. |
| 8,547 |
| 480 |
| |
First Data Corp. |
| 27,241 |
| 1,172 |
| |
Freddie Mac |
| 25,059 |
| 1,638 |
| |
General Dynamics Corp. |
| 4,666 |
| 532 |
| |
Hewlett-Packard Co. |
| 49,992 |
| 1,431 |
| |
International Business Machines Corp. |
| 31,461 |
| 2,586 |
| |
McDonald’s Corp. |
| 38,772 |
| 1,307 |
| |
Mellon Financial Corp. |
| 39,516 |
| 1,353 |
| |
Merrill Lynch & Co., Inc. |
| 21,944 |
| 1,486 |
| |
New York Times Co. (The), Class A |
| (c)16,392 |
| 434 |
| |
Northrop Grumman Corp. |
| 16,266 |
| 978 |
| |
Pfizer, Inc. |
| 75,300 |
| 1,756 |
| |
Schering-Plough Corp. |
| 108,427 |
| 2,261 |
| |
St. Paul Travelers Cos., Inc. (The) |
| 31,798 |
| 1,420 |
| |
Verizon Communications, Inc. |
| 32,460 |
| 978 |
| |
Viacom, Inc., Class B |
| (a)29,732 |
| 969 |
| |
The accompanying notes are an integral part of the financial statements. | 33 |
| 2005 Annual Report |
|
|
| December 31, 2005 |
Portfolio of Investments (cont’d)
Global Value Equity Portfolio
|
| Value |
|
|
| |
|
| Shares |
| (000) |
| |
United States (cont’d) |
|
|
|
|
| |
Wyeth |
| 52,077 |
| $ | 2,399 |
|
Xerox Corp. |
| (a)(c)78,672 |
| 1,153 |
| |
|
|
|
| 41,130 |
| |
Total Common Stocks (Cost $88,958) |
|
|
| 105,104 |
| |
|
| Face |
|
|
| |
|
| Amount |
|
|
| |
|
| (000) |
|
|
| |
Short-Term Investments (7.9%) |
|
|
|
|
| |
Short-Term Debt Securities held as Collateral on Loaned Securities (4.7%) |
|
|
|
|
| |
Abbey National Treasury Services, |
|
|
|
|
| |
4.14%, 1/13/06 |
| $ (h)121 |
| 121 |
| |
Alliance & Leister plc, 4.33%, 1/30/07 |
| (h)163 |
| 163 |
| |
Bank of America, 4.31%, 11/7/06 |
| (h)36 |
| 36 |
| |
Bank of New York Co., Inc., |
|
|
|
|
| |
4.33%, 1/30/07 |
| (h)82 |
| 82 |
| |
Bear Stearns, 4.38%, 6/15/06 |
| (h)163 |
| 163 |
| |
Calyon NY, 4.40%, 2/27/06 |
| (h)65 |
| 65 |
| |
Cancara Asset Securitisation Ltd., |
|
|
|
|
| |
4.26%, 1/17/06 |
| 243 |
| 243 |
| |
CC USA, Inc., 4.33%, 4/18/06 |
| (h)81 |
| 81 |
| |
CIC NY, 4.34%, 2/13/06 |
| (h)245 |
| 245 |
| |
Ciesco LLC, 4.25%, 1/17/06 |
| 81 |
| 81 |
| |
Dekabank Deutsche Girozentrale, 4.17%, 5/19/06 |
| (h)166 |
| 166 |
| |
Deutsche Bank Securities, Inc., |
|
|
|
|
| |
4.27%, 1/3/06 |
| 1,490 |
| 1,490 |
| |
Goldman Sachs Group, Inc., |
|
|
|
|
| |
4.38%, 1/30/07 |
| (h)82 |
| 82 |
| |
HSBC USA, NY, 4.12%, 2/6/06 |
| 82 |
| 82 |
| |
K2 (USA) LLC, |
|
|
|
|
| |
4.33%, 4/25/06 |
| (h)81 |
| 81 |
| |
4.34%, 2/15/06 |
| (h)72 |
| 72 |
| |
4.35%, 2/15/06 |
| (h)33 |
| 33 |
| |
Links Finance LLC, |
|
|
|
|
| |
4.29%, 10/6/06 |
| (h)65 |
| 65 |
| |
4.33%, 4/18/06 |
| (h)81 |
| 81 |
| |
4.36%,2/27/06 |
| (h)98 |
| 98 |
| |
Manufacturers & Traders, 4.37%, 12/29/06 |
| (h)49 |
| 49 |
| |
Merck & Co., 4.37%, 2/23/06 |
| 84 |
| 84 |
| |
Nationwide Building Society, |
|
|
|
|
| |
4.58%, 1/2/07 |
| (h)189 |
| 189 |
| |
Proctor & Gamble, 4.46%, 1/30/07 |
| (h)67 |
| 67 |
| |
Rabobank USA Financial Corp., |
|
|
|
|
| |
4.13%, 1/3/06 |
| 244 |
| 244 |
| |
San Paolo IMI Bank, 4.33%, 2/23/06 |
| 147 |
| 147 |
| |
Sigma Finance, Inc., 4.34%, 3/22/06 |
| (h)163 |
| 163 |
| |
SLM Corp., 4.37%, 1/30/07 |
| (h)163 |
| 163 |
| |
Tango Finance Corp., 4.33%, 3/22/06 |
| (h)137 |
| 137 |
| |
Wachovia Bank N.A., 4.30%, 10/2/06 |
| (h)196 |
| 196 |
| |
Wells Fargo Bank San Francisco N.A., |
|
|
|
|
| |
4.30%, 12/1/06 |
| (h)114 |
| 114 |
| |
|
|
|
| 5,083 |
| |
|
| Face |
|
|
| |
|
| Amount |
| Value |
| |
|
| (000) |
| (000) |
| |
Repurchase Agreement (3.2%) |
|
|
|
|
| |
J.P. Morgan Securities, Inc., 4.05%, dated 12/30/05, due 1/3/06, repurchase price $3,426 |
| $ (f)3,425 |
| $ | 3,425 |
|
Total Short-Term Investment (Cost $8,508) |
|
|
| 8,508 |
| |
Total Investments (105.3%) (Cost $97,466) — including $4,875 of Securities Loaned |
|
|
| 113,612 |
| |
Liabilities in Excess of Other Assets (-5.3%) |
|
|
| (5,674 | ) | |
Net Assets (100%) |
|
|
| $ | 107,938 |
|
(a) | Non-income producing security. |
(c) | All or portion of security on loan at December 31, 2005. |
(f) | Represents the Portfolio’s undivided interest in a joint repurchase agreement which has a total value of $1,000,707,000. The repurchase agreement was fully collateralized by U.S. government agency securities at the date of this Portfolio of Investments as follows: Federal Farm Credit Bank: 2.00% to 7.35%, due 1/11/06 to 10/25/33; Federal Home Loan Mortgage Corp.: 1.88% to 7.22%, due 2/9/06 to 7/15/32; Federal National Mortgage Association: 2.50% to 7.25%, due 2/15/06 to 11/15/30, which had a total value of $1,020,741,791. The investment in the repurchase agreement is through participation in a joint account with affiliated parties pursuant to exemptive relief received by the Portfolio from the SEC. |
(h) | Variable/Floating Rate Security — interest rate changes on these instruments are based on changes in a designated base rate. The rates shown are those in effect on December 31, 2005. |
ADR | American Depositary Receipts |
CVA | Certificaten Van Aandelen |
RNC | Non-Convertible Savings Shares |
34 | The accompanying notes are an integral part of the financial statements. |
2005 Annual Report | |
|
|
December 31, 2005 | |
Portfolio of Investments (cont’d)
Global Value Equity Portfolio
Foreign Currency Exchange Contract Information: |
The Portfolio had the following foreign currency exchange contract(s) open at period end: |
Currency |
| Value |
| Settlement |
| In |
| Value |
| Net |
| |||||||
USD |
| 14 |
| $ | 14 |
| 1/4/06 |
| AUD |
| 19 |
| $ | 14 |
| $ | @— |
|
USD |
| 27 |
| 27 |
| 1/4/06 |
| CHF |
| 36 |
| 27 |
| @— |
| |||
USD |
| 86 |
| 86 |
| 1/3/06 |
| EUR |
| 73 |
| 86 |
| @— |
| |||
USD |
| 15 |
| 15 |
| 1/4/06 |
| EUR |
| 13 |
| 15 |
| @— |
| |||
USD |
| 127 |
| 127 |
| 1/4/06 |
| GBP |
| 74 |
| 127 |
| @— |
| |||
USD |
| 5 |
| 5 |
| 1/3/06 |
| HKD |
| 39 |
| 5 |
| @— |
| |||
USD |
| 46 |
| 46 |
| 1/5/06 |
| JPY |
| 5,420 |
| 46 |
| @— |
| |||
USD |
| 6 |
| 6 |
| 1/5/06 |
| NZD |
| 9 |
| 6 |
| @— |
| |||
|
|
|
| $ | 326 |
|
|
|
|
|
|
| $ | 326 |
| $ | @— |
|
AUD | — | Australian Dollar |
CHF | — | Swiss Franc |
EUR | — | Euro |
GBP | — | British Pound |
HKD | — | Hong Kong Dollar |
JPY | — | Japanese Yen |
NZD | — | New Zealand Dollar |
USD | — | United States Dollar |
@ | — | Amount is less than $500. |
The accompanying notes are an integral part of the financial statements. | 35 |
| 2005 Annual Report |
|
|
| December 31, 2005 |
Investment Overview
International Equity Portfolio
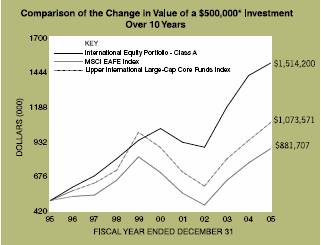
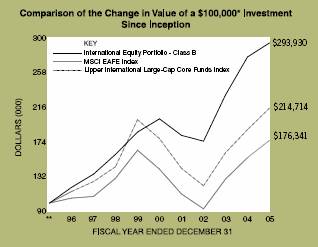
* | Minimum Investment |
** | Commenced offering on January 2, 1996 |
In accordance with SEC regulations, Portfolio performance shown assumes that all recurring fees (including management fees) were deducted and all dividends and distributions were reinvested.
Performance Compared to the Morgan Stanley Capital International (MSCI) EAFE Index(1) and the Lipper International Large-Cap Core Funds Index(2)
|
| Total Returns(3) |
| ||||||
|
|
|
|
|
|
|
|
|
|
|
|
|
| Average Annual |
| ||||
|
| One |
| Five |
| Ten |
| Since |
|
|
| Year |
| Years |
| Years |
| Inception(6) |
|
|
|
|
|
|
|
|
|
|
|
Portfolio – Class A (4) |
| 6.45 | % | 8.00 | % | 11.72 | % | 11.36 | % |
MSCI EAFE Index |
| 13.54 |
| 4.55 |
| 5.84 |
| 5.05 |
|
Lipper International Large-Cap Core Funds Index |
| 13.84 |
| 3.80 |
| 7.94 |
| 8.10 |
|
Portfolio – Class B (5) |
| 6.20 |
| 7.77 |
| — |
| 11.39 |
|
MSCI EAFE Index |
| 13.54 |
| 4.55 |
| — |
| 5.83 |
|
Lipper International Large-Cap Core Funds Index |
| 13.84 |
| 3.80 |
| — |
| 7.87 |
|
(1) | The MSCI EAFE Index (Europe, Australasia, Far East) is a free float-adjusted market capitalization index that is designed to measure developed market equity performance, excluding the U.S. & Canada. The MSCI EAFE Index consists of the following 21 developed market country indices: Australia, Austria, Belgium, Denmark, Finland, France, Germany, Greece, Hong Kong, Ireland, Italy, Japan, the Netherlands, New Zealand, Norway, Portugal, Singapore, Spain, Sweden, Switzerland and the United Kingdom. |
(2) | The Lipper International Large-Cap Core Funds Index is an equally weighted performance index of the largest qualifying funds (based on net assets) in the Lipper International Large-Cap Core Funds classification. The Index, which is adjusted for capital gains distributions and income dividends, is unmanaged and should not be considered an investment. There are currently 10 funds represented in this Index. As of the date of this report, the Portfolio is in the Lipper International Large-Cap Core Funds classification. |
(3) | Total returns for the Portfolio reflect fees waived and expenses reimbursed, if applicable, by the Adviser. Without such waivers and reimbursements, total returns would have been lower. Fee waivers and/or expense reimbursements are voluntary and the Adviser reserves the right to commence or terminate any waiver and/or reimbursement at any time. |
(4) | Commenced operations on August 4, 1989 |
(5) | Commenced offering on January 2, 1996 |
(6) | For comparative purposes, average annual since inception returns listed for the Indexes refer to the inception date or initial offering of the respective share class of the Portfolio, not the inception of the Index. |
Performance data quoted represents past performance, which is no guarantee of future results, and current performance may be lower or higher than the figures shown. Performance assumes that all dividends and distributions, if any, were reinvested. For the most recent month-end performance figures, please visit morganstanley.com/im. Investment return and principal value will fluctuate so that Portfolio shares, when redeemed, may be worth more or less than their original cost. Total returns do not reflect the deduction of taxes that a shareholder would pay on Portfolio distributions or the redemption of Portfolio shares.
The International Equity Portfolio seeks long-term capital appreciation by investing primarily in equity securities of non-U.S. issuers. Foreign investing involves certain risks, including currency fluctuations and controls, restrictions on foreign investments, less governmental supervision and regulation, less liquidity and the potential for market volatility and political instability.
36
2005 Annual Report | |
|
|
December 31, 2005 | |
Investment Overview (cont’d)
International Equity Portfolio
Performance
For the year ended December 31, 2005, the Portfolio had a total return based on net asset value per share of 6.45% for the Class A shares, net of fees, and 6.20% for the Class B shares, net of fees, compared to 13.54% for the Morgan Stanley Capital International (MSCI) EAFE Index (the “Index”).
Factors Affecting Performance
• Currency played a major role in returns for 2005. The U.S. dollar appreciated 15.2% against both the Japanese yen and the Euro, and 11.8% against the British sterling. For U.S.based investors, the strengthening dollar disguised the fact that in local currency terms, it was a fairly spectacular year, with the Index up 29.0% in 2005. In the highly buoyant local markets, the major standout was Japan, which advanced significantly in anticipation of, and following, Prime Minister Koizumi’s September election landslide.
• On a sector basis, cyclicals led the charge. The materials, industrials, energy and financials sectors posted the strongest gains. Telecommunications, consumer staples, consumer discretionary, and information technology lagged most significantly.
• The primary reason for the Portfolio’s underperformance was that our stock selection reflected a high degree of risk aversion and caution on a macro level. This positioning was out of step with the market. With the exception of a bad wobble in March and April, the bulls have had it their way for 2005, and the “goldilocks” scenario of low interest rates and higher-than-expected gross domestic product growth continued to play out through the close of the year.
• Performance was hindered by the Portfolio’s underweight relative to the benchmark and stock selection in Japan. The Portfolio’s average weighting in Japan for the year was 19.5% versus 22.5% compared to the Index, but the Portfolio largely focused on cheap, low volatility, high free-cash-flow generating companies with low economic sensitivity. These stocks have trailed as the market pursued cyclicality and risk.
• An overweight relative to the Index and stock selection in the telecommunications sector also hindered performance. The virtues of cheapness and low volatility had no attraction whatsoever for a market pursuing risk, particularly as telecommunication companies in general have no offset to a strengthening U.S. dollar.
Management Strategies
• As in 2004, 2005 was a year where investors were well rewarded for taking on risk. We have a longstanding history of being cautious on the U.S. consumer and, therefore, on the U.S. economy. The upside of this conservative and patient approach is that it has kept us out of much trouble, particularly during the bubble period of 1999 through 2002. However, 2005 was all about getting the macro right and we were premature at the expense of performance. The prevailing goldilocks economy was hardly helpful for a strategy that historically tends to have performance slippage in strong up markets.
Expense Examples
As a shareholder of the Portfolio, you may incur two types of costs: (1) transactional costs, including redemption fees; (2) ongoing costs, including management fees, distribution (12b-1) fees (in the case of Class B); and other Portfolio expenses. These examples are intended to help you understand your ongoing costs (in dollars) of investing in the Portfolio and to compare these costs with the ongoing costs of investing in other mutual funds.
The examples are based on an investment of $1,000 invested at the beginning of the six-month period ended December 31, 2005 and held for the entire six-month period.
Actual Expenses
The first line of the tables below provides information about actual account values and actual expenses. You may use the information in this line, together with the amount you invested, to estimate the expenses that you paid over the period. Simply divide your account value by $1,000 (for example, an $8,600 account value divided by $1,000 = 8.6), then multiply the result by the number in the first line under the heading entitled “Expenses Paid During Period” to estimate the expenses you paid on your account during this period.
Hypothetical Example for Comparison Purposes
The second line of the tables below provides information about hypothetical account values and hypothetical expenses based on the Portfolio’s actual expense ratio and an assumed rate of return of 5% per year before expenses, which is not the Portfolio’s actual return. The hypothetical account values and expenses may not be used to estimate the actual ending account balance or expenses you paid for the period. You may use this information to compare the ongoing costs of investing in the Portfolio and other funds. To do so, compare this 5% hypothetical example with the 5% hypothetical examples that appear in the shareholder reports of the other funds.
37
| 2005 Annual Report |
|
|
| December 31, 2005 |
Investment Overview (cont’d)
International Equity Portfolio
Please note that the expenses shown in the table are meant to highlight your ongoing costs only and do not reflect any transactional costs, such as redemption fees. Therefore, the second line of the table is useful in comparing ongoing costs only, and will not help you determine the relative total costs of owning different funds. In addition, if these transactional costs were included, your costs would have been higher.
|
|
|
|
|
| Expenses Paid |
|
|
|
|
| Ending Account |
| During Period* |
|
|
| Beginning |
| Value |
| July 1, 2005 — |
|
|
| Account Value |
| December 31, |
| December 31, |
|
|
| July 1, 2005 |
| 2005 |
| 2005 |
|
Class A |
|
|
|
|
|
|
|
Actual |
| $1,000.00 |
| $1,081.00 |
| $4.83 |
|
Hypothetical (5% average annual return before expenses) |
| 1,000.00 |
| 1,020.57 |
| 4.69 |
|
|
|
|
|
|
|
|
|
Class B |
|
|
|
|
|
|
|
Actual |
| 1,000.00 |
| 1,079.60 |
| 6.13 |
|
Hypothetical (5% average annual return before expenses) |
| 1,000.00 |
| 1,019.31 |
| 5.96 |
|
* Expenses are equal to Class A and Class B annualized net expense ratios of 0.92% and 1.17%, respectively, multiplied by the average account value over the period, multiplied by 184/365 (to reflect the one-half year period). | |||||||
Graphic Presentation of Portfolio Holdings
The following graph depicts the Portfolio’s holdings by industry and/or security type, as a percentage of total investments.
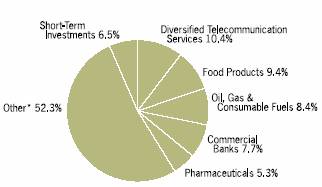
* | Industries which do not appear in the above graph, as well as those which represent less than 5% of total investments, if applicable, are included in the category labeled “Other”. |
January 2006
38
2005 Annual Report | |
|
|
December 31, 2005 | |
Portfolio of Investments
International Equity Portfolio
|
|
|
| Value |
| |
|
| Shares |
| (000) |
| |
Common Stocks (98.0%) |
|
|
|
|
| |
Australia (0.3%) |
|
|
|
|
| |
Orica Ltd. |
| 1,485,012 |
| $ | 22,216 |
|
Austria (1.6%) |
|
|
|
|
| |
Telekom Austria AG |
| (c)5,560,758 |
| 125,079 |
| |
Belgium (0.9%) |
|
|
|
|
| |
Fortis |
| (c)2,133,584 |
| 67,920 |
| |
France (10.4%) |
|
|
|
|
| |
BNP Paribas S.A. |
| 1,191,477 |
| 96,410 |
| |
Carrefour S.A. |
| (c)1,701,330 |
| 79,719 |
| |
France Telecom S.A. |
| (c)12,053,532 |
| 299,518 |
| |
Sanofi-Aventis S.A. |
| (c)891,939 |
| 78,138 |
| |
Societe Generale |
| 347,134 |
| 42,698 |
| |
Total S.A. |
| 895,091 |
| 224,859 |
| |
|
|
|
| 821,342 |
| |
Germany (7.4%) |
|
|
|
|
| |
Bayer AG |
| 979,455 |
| 40,920 |
| |
Bayerische Motoren Werke AG |
| 1,922,926 |
| 84,343 |
| |
Deutsche Telekom AG (Registered) |
| (c)3,384,630 |
| 56,417 |
| |
Linde AG |
| 765,625 |
| 59,613 |
| |
Muenchener Rueckversicherungs AG (Registered) |
| 359,329 |
| 48,656 |
| |
Porsche AG (Non-Voting Shares) |
| (c)143,828 |
| 103,349 |
| |
RWE AG |
| (c)1,060,543 |
| 78,533 |
| |
Siemens AG (Registered) |
| 1,317,103 |
| 112,890 |
| |
|
|
|
| 584,721 |
| |
Ireland (0.2%) |
|
|
|
|
| |
CRH plc (Dublin Shares) |
| 589,454 |
| 17,341 |
| |
Italy (3.1%) |
|
|
|
|
| |
ENI S.p.A. |
| 3,667,958 |
| 101,740 |
| |
Telecom Italia S.p.A. RNC |
| (c)57,603,275 |
| 142,866 |
| |
|
|
|
| 244,606 |
| |
Japan (18.6%) |
|
|
|
|
| |
Asatsu-DK, Inc. |
| (c)659,500 |
| 20,977 |
| |
Astellas Pharma, Inc. |
| 2,032,500 |
| 79,304 |
| |
Canon, Inc. |
| (c)1,372,200 |
| 80,310 |
| |
Central Japan Railway Co. |
| 10,938 |
| 104,839 |
| |
Dai Nippon Printing Co., Ltd. |
| (c)6,814,000 |
| 121,374 |
| |
Fuji Photo Film Co., Ltd. |
| 2,331,500 |
| 77,127 |
| |
Kansai Electric Power Co., Inc. (The) |
| 4,789,500 |
| 102,985 |
| |
Kao Corp. |
| 5,428,000 |
| 145,489 |
| |
Kyocera Corp. |
| 573,000 |
| 41,798 |
| |
Lawson, Inc. |
| (c)1,034,800 |
| 42,658 |
| |
Mitsubishi Electric Corp. |
| (c)16,086,000 |
| 113,930 |
| |
NEC Corp. |
| (c)14,663,000 |
| 91,290 |
| |
NTT DoCoMo, Inc. |
| 51,674 |
| 78,895 |
| |
Oriental Land Co., Ltd. |
| (c)1,013,000 |
| 55,249 |
| |
Osaka Gas Co., Ltd. |
| 15,161,000 |
| 52,339 |
| |
Rohm Co., Ltd. |
| 638,800 |
| 69,518 |
| |
Shinsei Bank Ltd. |
| 17,347,000 |
| 100,349 |
| |
Tokyo Gas Co., Ltd. |
| (c)21,811,500 |
| 96,944 |
| |
|
|
|
| 1,475,375 |
| |
Luxembourg (0.3%) |
|
|
|
|
| |
Arcelor |
| 907,775 |
| 22,515 |
| |
Netherlands (7.0%) |
|
|
|
|
| |
ABN AMRO Holding N.V. |
| (c)4,198,793 |
| $ | 109,804 |
|
Akzo Nobel N.V. |
| 1,296,899 |
| 60,108 |
| |
CSM N.V. CVA |
| 1,652,295 |
| 45,048 |
| |
ING Groep N.V. CVA |
| 2,762,333 |
| 95,816 |
| |
Unilever N.V. CVA |
| 3,495,600 |
| 239,399 |
| |
|
|
|
| 550,175 |
| |
New Zealand (0.9%) |
|
|
|
|
| |
Telecom Corp. of New Zealand Ltd. |
| (c)18,301,161 |
| 75,112 |
| |
Singapore (0.6%) |
|
|
|
|
| |
United Overseas Bank Ltd. |
| 5,032,000 |
| 44,179 |
| |
South Korea (1.6%) |
|
|
|
|
| |
Samsung Electronics Co., Ltd. GDR (Registered) |
| (c)(e)393,540 |
| 128,280 |
| |
Spain (1.7%) |
|
|
|
|
| |
Repsol YPF S.A. |
| (c)694,819 |
| 20,293 |
| |
Telefonica S.A. |
| 7,330,357 |
| 110,298 |
| |
|
|
|
| 130,591 |
| |
Sweden (1.1%) |
|
|
|
|
| |
Nordea Bank AB |
| 4,326,960 |
| 44,934 |
| |
SKF AB, Class B |
| 2,954,792 |
| 41,470 |
| |
|
|
|
| 86,404 |
| |
Switzerland (10.0%) |
|
|
|
|
| |
Credit Suisse Group (Registered) |
| 760,905 |
| 38,798 |
| |
Holcim Ltd. (Registered) |
| (c)1,883,246 |
| 128,273 |
| |
Nestle S.A. (Registered) |
| 1,136,107 |
| 339,794 |
| |
Novartis AG (Registered) |
| 2,880,789 |
| 151,384 |
| |
UBS AG (Registered) |
| 1,436,208 |
| 136,735 |
| |
|
|
|
| 794,984 |
| |
Taiwan (0.6%) |
|
|
|
|
| |
Chunghwa Telecom Co., Ltd. ADR |
| (c)2,745,932 |
| 50,388 |
| |
United Kingdom (31.7%) |
|
|
|
|
| |
BAA plc |
| 2,721,797 |
| 29,362 |
| |
Barclays plc |
| 5,813,923 |
| 61,119 |
| |
BHP Billiton plc |
| 6,983,931 |
| 114,094 |
| |
BOC Group plc |
| 6,355,850 |
| 131,008 |
| |
BP plc |
| 21,108,481 |
| 224,809 |
| |
British American Tobacco plc |
| 4,459,171 |
| 99,739 |
| |
Bunzl plc |
| 3,186,087 |
| 34,974 |
| |
Burberry Group plc |
| 1,046,108 |
| 7,735 |
| |
Cadbury Schweppes plc |
| 16,312,319 |
| 154,223 |
| |
GlaxoSmithKline plc |
| 5,081,601 |
| 128,437 |
| |
GUS plc |
| 2,949,682 |
| 52,375 |
| |
Hanson plc |
| 1,785,187 |
| 19,627 |
| |
Hays plc |
| 47,396,420 |
| 102,343 |
| |
Hilton Group plc |
| 6,733,037 |
| 42,110 |
| |
Imperial Tobacco Group plc |
| 7,482,567 |
| 223,624 |
| |
Intercontinental Hotels Group plc |
| 7,583,706 |
| 109,539 |
| |
National Grid plc |
| 11,831,751 |
| 115,730 |
| |
Reckitt Benckiser plc |
| 3,890,912 |
| 128,534 |
| |
Reed Elsevier plc |
| 16,778,261 |
| 157,618 |
| |
Rolls-Royce Group plc |
| (a)6,215,976 |
| 45,721 |
| |
Rolls-Royce Group plc, Class B |
| 211,008,541 |
| 370 |
| |
Royal Bank of Scotland Group plc |
| 4,649,829 |
| 140,405 |
| |
39 | The accompanying notes are an integral part of the financial statements. |
| 2005 Annual Report |
|
|
| December 31, 2005 |
Portfolio of Investments (cont’d)
International Equity Portfolio
|
|
|
| Value |
|
|
| Shares |
| (000) |
|
United Kingdom (cont’d) |
|
|
|
|
|
Royal Dutch Shell plc, Class A |
| 4,205,186 |
| $128,341 |
|
Scottish Power plc |
| 6,755,301 |
| 63,170 |
|
Vodafone Group plc |
| 71,641,262 |
| 154,694 |
|
Wolseley plc |
| 1,965,458 |
| 41,425 |
|
|
|
|
| 2,511,126 |
|
Total Common Stocks (Cost $6,427,623) |
|
|
| 7,752,354 |
|
|
| Face |
|
|
|
|
| Amount |
|
|
|
|
| (000) |
|
|
|
Short-Term Investments (6.8%) |
|
|
|
|
|
Short-Term Debt Securities held as Collateral on Loaned Securities (6.8%) |
|
|
|
|
|
Abbey National Treasury Services, |
|
|
|
|
|
4.14%, 1/13/06 |
| $ (h)12,829 |
| 12,829 |
|
Alliance & Leister plc, 4.33%, 1/30/07 |
| (h)17,334 |
| 17,334 |
|
Bank of America, 4.31%, 11/7/06 |
| (h)3,814 |
| 3,814 |
|
Bank of New York Co., Inc., |
|
|
|
|
|
4.33%, 1/30/07 |
| (h)8,667 |
| 8,667 |
|
Bear Stearns, 4.38%, 6/15/06 |
| (h)17,334 |
| 17,334 |
|
Calyon NY, 4.40%, 2/27/06 |
| (h)6,933 |
| 6,933 |
|
Cancara Asset Securitisation Ltd., |
|
|
|
|
|
4.26%, 1/17/06 |
| 25,830 |
| 25,830 |
|
CC USA, Inc., 4.33%, 4/18/06 |
| (h)8,667 |
| 8,667 |
|
CIC NY, 4.34%, 2/13/06 |
| (h)26,001 |
| 26,001 |
|
Ciesco LLC, 4.25%, 1/17/06 |
| 8,610 |
| 8,610 |
|
Dekabank Deutsche Girozentrale, |
|
|
|
|
|
4.17%, 5/19/06 |
| (h)17,681 |
| 17,681 |
|
Deutsche Bank Securities, Inc., |
|
|
|
|
|
4.27%, 1/3/06 |
| 158,449 |
| 158,449 |
|
Goldman Sachs Group, Inc., |
|
|
|
|
|
4.38%, 1/30/07 |
| (h)8,667 |
| 8,667 |
|
HSBC USA, NY, 4.12%, 2/6/06 |
| 8,667 |
| 8,667 |
|
K2 (USA) LLC, |
|
|
|
|
|
4.33%, 4/25/06 |
| (h)8,667 |
| 8,667 |
|
4.34%, 2/15/06 |
| (h)7,627 |
| 7,627 |
|
4.35%, 2/15/06 |
| (h)3,467 |
| 3,467 |
|
Links Finance LLC, |
|
|
|
|
|
4.29%, 10/6/06 |
| (h)6,953 |
| 6,953 |
|
4.33%, 4/18/06 |
| (h)8,667 |
| 8,667 |
|
4.36%,2/27/06 |
| (h)10,401 |
| 10,401 |
|
Manufacturers & Traders, 4.37%, 12/29/06 |
| (h)5,199 |
| 5,199 |
|
Merck & Co., 4.37%, 2/23/06 |
| 8,983 |
| 8,983 |
|
Nationwide BuildingSociety, |
|
|
|
|
|
4.58%, 1/2/07 |
| (h)20,108 |
| 20,108 |
|
Proctor & Gamble, 4.46%, 1/30/07 |
| (h)7,107 |
| 7,107 |
|
Rabobank USA Financial Corp., |
|
|
|
|
|
4.13%, 1/3/06 |
| 25,990 |
| 25,990 |
|
San Paolo IMI Bank, 4.33%, 2/23/06 |
| 15,601 |
| 15,601 |
|
Sigma Finance, Inc., 4.34%, 3/22/06 |
| (h)17,333 |
| 17,333 |
|
SLMCorp., 4.37%, 1/30/07 |
| (h)17,334 |
| 17,334 |
|
Tango Finance Corp., 4.33%, 3/22/06 |
| (h)14,561 |
| 14,561 |
|
Wachovia Bank N.A., 4.30%, 10/2/06 |
| (h)20,801 |
| 20,801 |
|
Wells Fargo Bank San Francisco N.A., |
|
|
|
|
|
4.30%, 12/1/06 |
| (h)12,134 |
| 12,134 |
|
Total Short-Term Investments (Cost $540,416) |
|
|
| 540,416 |
|
|
| Value |
|
|
| (000) |
|
Total Investments (104.8%) (Cost $6,968,039) — |
| $8,292,770 |
|
Liabilities in Excess of Other Assets (-4.8%) |
| (381,913 | ) |
Net Assets (100%) |
| $7,910,857 |
|
(a) Non-income producing security.
(c) All or portion of security on loan at December 31, 2005.
(e) 144A security — Certain conditions for public sale may exist. Unless otherwise noted, these securities are deemed to be liquid.
(h) Variable/FloatingRate Security — Interest rate changes on these instruments are based on changes in a designated base rate. The rates shown are those in effect on December 31, 2005.
ADR American Depositary Receipts
CVA Certificaten Van Aandelen
GDR Global Depositary Receipts
RNC Non-Convertible Savings Shares
Foreign Currency Exchange Contract Information: |
The Portfolio had the following foreign currency exchange contract(s) open at period end:
Currency |
| Value |
| Settlement |
| In |
| Value |
| Net |
| ||||||||
AUD |
| 22 |
| $ | 16 |
| 1/3/2006 |
|
| EUR |
| 13 |
| $ | 16 |
| $ | @— |
|
AUD |
| 478 |
| 351 |
| 1/4/2006 |
|
| EUR |
| 297 |
| 351 |
| @— |
| |||
CHF |
| 17,006 |
| 12,942 |
| 1/3/2006 |
|
| EUR |
| 10,910 |
| 12,916 |
| (26 | ) | |||
EUR |
| 61 |
| 72 |
| 1/4/2006 |
|
| NZD |
| 105 |
| 72 |
| @— |
| |||
GBP |
| 19,602 |
| 33,726 |
| 1/3/2006 |
|
| EUR |
| 28,499 |
| 33,739 |
| 13 |
| |||
GBP |
| 1,217 |
| 2,094 |
| 1/4/2006 |
|
| EUR |
| 1,772 |
| 2,098 |
| 4 |
| |||
GBP |
| 88,200 |
| 151,737 |
| 1/25/2006 |
|
| JPY |
| 17,860,368 |
| 151,903 |
| 166 |
| |||
GBP |
| 95,000 |
| 163,436 |
| 1/25/2006 |
|
| JPY |
| 19,377,673 |
| 164,808 |
| 1,372 |
| |||
JPY |
| 100,490 |
| 852 |
| 1/4/2006 |
|
| EUR |
| 720 |
| 852 |
| @— |
| |||
JPY |
| 2,755,663 |
| 23,377 |
| 1/5/2006 |
|
| EUR |
| 19,823 |
| 23,469 |
| 92 |
| |||
NZD |
| 92,000 |
| 62,702 |
| 1/25/2006 |
|
| JPY |
| 7,280,236 |
| 61,918 |
| (784 | ) | |||
SEK |
| 11,233 |
| 1,414 |
| 1/3/2006 |
|
| EUR |
| 1,194 |
| 1,414 |
| @— |
| |||
SGD |
| 59 |
| 36 |
| 1/3/2006 |
|
| EUR |
| 30 |
| 36 |
| @— |
| |||
SGD |
| 1,148 |
| 690 |
| 1/4/2006 |
|
| EUR |
| 584 |
| 690 |
| @— |
| |||
USD |
| 810 |
| 810 |
| 1/3/2006 |
|
| EUR |
| 684 |
| 810 |
| @— |
| |||
USD |
| 2,088 |
| 2,088 |
| 1/3/2006 |
|
| EUR |
| 1,763 |
| 2,088 |
| @— |
| |||
|
|
|
| $ | 456,343 |
|
|
|
|
|
|
| $ | 457,180 |
| $ | 837 |
| |
AUD | — | Australian Dollar |
CHF | — | Swiss Franc |
EUR | — | Euro |
GBP | — | British Pound |
JPY | — | Japanese Yen |
NZD | — | New Zealand Dollar |
SEK | — | Swedish Krona |
SGD | — | Singapore Dollar |
USD | — | United States Dollar |
@ | — | Amount is less than $500. |
The accompanying notes are an integral part of the financial statements. | 40 |
2005 Annual Report | |
|
|
December 31, 2005 | |
Investment Overview
International Growth Equity Portfolio
The International Growth Equity Portfolio seeks long-term capital appreciation by investing primarily in equity securities of non-U.S. issuers. Foreign investing involves certain risks, including currency fluctuations and controls, restrictions on foreign investments, less governmental supervision and regulation, less liquidity and the potential for market volatility and political instability.
Expense Examples
As a shareholder of the Portfolio, you may incur two types of costs: (1) transactional costs, including redemption fees; (2) ongoing costs, including management fees, distribution (12b-1) fees (in the case of Class B); and other Portfolio expenses. These examples are intended to help you understand your ongoing costs (in dollars) of investing in the Portfolio and to compare these costs with the ongoing costs of investing in other mutual funds.
The examples are based on an investment of $1,000 invested at the beginning of the six-month period ended December 31, 2005 and held for the entire six-month period.
Actual Expenses
The first line of the tables below provides information about actual account values and actual expenses. You may use the information in this line, together with the amount you invested, to estimate the expenses that you paid over the period. Simply divide your account value by $1,000 (for example, an $8,600 account value divided by $1,000 = 8.6), then multiply the result by the number in the first line under the heading entitled “Expenses Paid During Period” to estimate the expenses you paid on your account during this period.
Please note that both classes within the Portfolio commenced operations on December 27, 2005, therefore, “Actual Expenses Paid During the Period” reflect activity from December 27, 2005 through December 31, 2005.
Hypothetical Example for Comparison Purposes
The second line of the tables below provides information about hypothetical account values and hypothetical expenses based on the Portfolio’s actual expense ratio and an assumed rate of return of 5% per year before expenses, which is not the Portfolio’s actual return. The hypothetical account values and expenses may not be used to estimate the actual ending account balance or expenses you paid for the period. You may use this information to compare the ongoing costs of investing in the Portfolio and other funds. To do so, compare this 5% hypothetical example with the 5% hypothetical examples that appear in the shareholder reports of the other funds.
Please note that while the Portfolio commenced operations on December 27, 2005, for both Class A and Class B, the “Hypothetical Expenses Paid During the Period” reflect projected activity for the full six month period for the purposes of comparability. This projection assumes that the annualized expense ratio for both Class A and Class B was in effect during the period from July 1, 2005 to December 31, 2005.
Please note that the expenses shown in the table are meant to highlight your ongoing costs only and do not reflect any transactional costs, such as redemption fees. Therefore, the second line of the table is useful in comparing ongoing costs only, and will not help you determine the relative total costs of owning different funds. In addition, if these transactional costs were included, your costs would have been higher.
|
|
|
|
|
| Expenses Paid |
| |||
|
|
|
|
|
| During Period* |
| |||
|
| Beginning |
| Ending Account |
| December 27, |
| |||
|
| Account Value |
| Value |
| 2005 — |
| |||
|
| December |
| December 31, |
| December 31, |
| |||
|
| 27, 2005 |
| 2005 |
| 2005 |
| |||
Class A |
|
|
|
|
|
|
| |||
Actual |
| $1,000.00 |
|
| $ 993.00 |
|
| $0.11 |
|
|
Hypothetical (5% average annual return before expenses) |
| 1,000.00 |
|
| 1,021.17 |
|
| 4.08 |
|
|
|
|
|
|
|
|
|
|
|
|
|
Class B |
|
|
|
|
|
|
|
|
|
|
Actual |
| 1,000.00 |
|
| 993.00 |
|
| 0.14 |
|
|
Hypothetical (5% average annual return before expenses) |
| 1,000.00 |
|
| 1,020.16 |
|
| 5.09 |
|
|
* Expenses are equal to Class A and Class B annualized net expense ratios of 0.80% and 1.00%, respectively, multiplied by the average account value over the period, multiplied by 5/365 (to reflect the period).
41
| 2005 Annual Report |
|
|
| December 31, 2005 |
Investment Overview (cont’d)
International Growth Equity Portfolio
Graphic Presentation of Portfolio Holdings
The following graph depicts the Portfolio’s holdings by industry, as a percentage of total investments.
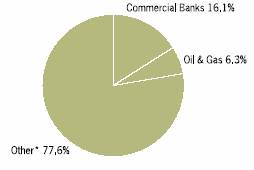
* Industries which do not appear in the above graph, as well as those which represent less than 5% of total investments, if applicable, are included in the category labeled “Other”.
January 2006
42
2005 Annual Report | |
|
|
December 31, 2005 | |
Portfolio of Investments
International Growth Equity Portfolio
|
|
|
| Value |
| |
|
| Shares |
| (000) |
| |
Common Stocks (98.5%) |
|
|
|
|
| |
Australia (1.8%) |
|
|
|
|
| |
BHP Billiton Ltd. |
| 5,226 |
| $ | 87 |
|
Austria (1.8%) |
|
|
|
|
| |
Erste Bank der Oesterreichischen Sparkassen AG |
| 1,635 |
| 91 |
| |
Canada (2.0%) |
|
|
|
|
| |
EnCana Corp. |
| 2,200 |
| 100 |
| |
Finland (1.8%) |
|
|
|
|
| |
Fortum Oyj |
| 4,737 |
| 89 |
| |
France (8.2%) |
|
|
|
|
| |
AXA S.A. |
| 2,826 |
| 91 |
| |
BNP Paribas S.A. |
| 949 |
| 77 |
| |
Cie Generale d’Optique Essilor International S.A. |
| 1,025 |
| 83 |
| |
LVMH Moet Hennessy Louis Vuitton S.A. |
| 689 |
| 61 |
| |
Total S.A. |
| 377 |
| 95 |
| |
|
|
|
| 407 |
| |
Germany (11.0%) |
|
|
|
|
| |
Adidas-Salomon AG |
| 366 |
| 69 |
| |
Celesio AG |
| 787 |
| 68 |
| |
Continental AG |
| 1,164 |
| 103 |
| |
Deutsche Bank AG (Registered) |
| 719 |
| 70 |
| |
E. ON AG |
| 954 |
| 99 |
| |
SAP AG |
| 370 |
| 67 |
| |
Siemens AG (Registered) |
| 797 |
| 68 |
| |
|
|
|
| 544 |
| |
Greece (2.9%) |
|
|
|
|
| |
Coca-Cola Hellenic Bottling Co. S.A. |
| 2,016 |
| 59 |
| |
National Bank of Greece S.A. |
| 2,008 |
| 86 |
| |
|
|
|
| 145 |
| |
Hong Kong (2.5%) |
|
|
|
|
| |
China Resources Power Holdings Co. |
| 96,000 |
| 54 |
| |
Esprit Holdings Ltd. |
| 9,500 |
| 68 |
| |
|
|
|
| 122 |
| |
Hungary (1.3%) |
|
|
|
|
| |
Mol Magyar Olaj-es Gazipari Rt. GDR |
| 700 |
| 65 |
| |
India (1.4%) |
|
|
|
|
| |
ICICI Bank Ltd. ADR |
| 2,500 |
| 72 |
| |
Ireland (4.7%) |
|
|
|
|
| |
Allied Irish Bank plc |
| 3,135 |
| 67 |
| |
Anglo Irish Bank Corp. plc |
| 7,018 |
| 107 |
| |
CRH plc (London Shares) |
| 2,022 |
| 59 |
| |
|
|
|
| 233 |
| |
Israel (1.5%) |
|
|
|
|
| |
Teva Pharmaceutical Industries Ltd. ADR |
| 1,800 |
| 77 |
| |
Japan (22.0%) |
|
|
|
|
| |
Canon, Inc. |
| 1,200 |
| 70 |
| |
Casio Computer Co., Ltd. |
| 3,600 |
| 60 |
| |
Daiwa Securities Group, Inc. |
| 7,000 |
| 80 |
| |
Hoya Corp. |
| 2,000 |
| 72 |
| |
JSR Corp. |
| 3,500 |
| 92 |
| |
Kobe Steel Ltd. |
| 26,000 |
| 84 |
| |
Kubota Corp. |
| 12,000 |
| 101 |
| |
Sharp Corp. |
| 5,000 |
| 76 |
| |
SMC Corp. |
| 600 |
| 86 |
| |
Sumitomo Realty & Development Co., Ltd. |
| 4,000 |
| $ | 87 |
|
Terumo Corp. |
| 1,900 |
| 56 |
| |
Toray Industries, Inc. |
| 10,000 |
| 82 |
| |
Toyota Motor Corp. |
| 2,800 |
| 145 |
| |
|
|
|
| 1,091 |
| |
Mexico (2.7%) |
|
|
|
|
| |
America Movil S.A. de C.V., Class L ADR |
| 2,500 |
| 73 |
| |
Wal-Mart de Mexico S.A. de C.V. ADR |
| 1,100 |
| 61 |
| |
|
|
|
| 134 |
| |
Netherlands (5.6%) |
|
|
|
|
| |
Axalto Holding N.V. |
| (a)2,616 |
| 72 |
| |
ING Groep N.V. CVA |
| 2,588 |
| 90 |
| |
Koninklijke Numico N.V. |
| (a)1,449 |
| 60 |
| |
Reed Elsevier N.V. |
| 3,871 |
| 54 |
| |
|
|
|
| 276 |
| |
Norway (1.3%) |
|
|
|
|
| |
Telenor ASA |
| 6,680 |
| 66 |
| |
Singapore (2.5%) |
|
|
|
|
| |
DBS Group Holdings Ltd. |
| 5,000 |
| 49 |
| |
Keppel Corp., Ltd. |
| 11,000 |
| 73 |
| |
|
|
|
| 122 |
| |
Spain (2.5%) |
|
|
|
|
| |
Banco Popular Espanol S.A. |
| 4,359 |
| 53 |
| |
Grupo Ferrovial S.A. |
| 1,049 |
| 73 |
| |
|
|
|
| 126 |
| |
Sweden (2.4%) |
|
|
|
|
| |
Getinge AB, Class B |
| 4,228 |
| 58 |
| |
Telefonaktiebolaget LM Ericsson ADR |
| (a)1,800 |
| 62 |
| |
|
|
|
| 120 |
| |
Switzerland (5.2%) |
|
|
|
|
| |
ABB Ltd. |
| (a)6,500 |
| 63 |
| |
Nestle S.A. ADR (Registered) |
| 800 |
| 60 |
| |
Novartis AG (Registered) |
| 1,399 |
| 73 |
| |
SGS S.A. |
| 72 |
| 61 |
| |
|
|
|
| 257 |
| |
Turkey (1.7%) |
|
|
|
|
| |
Akbank TAS ADR |
| (a)5,292 |
| 86 |
| |
United Kingdom (11.7%) |
|
|
|
|
| |
Barclays plc |
| 5,695 |
| 60 |
| |
BP plc |
| 10,523 |
| 112 |
| |
Capita Group plc |
| 6,757 |
| 48 |
| |
HSBC Holdings plc |
| 3,520 |
| 57 |
| |
Reckitt Benckiser plc |
| 1,909 |
| 63 |
| |
Royal Bank of Scotland Group plc |
| 2,127 |
| 64 |
| |
SABMiller plc |
| 3,534 |
| 65 |
| |
Tesco plc |
| 10,210 |
| 58 |
| |
Vodafone Group plc |
| 25,103 |
| 54 |
| |
|
|
|
| 581 |
| |
Total Common Stocks (Cost $4,924) |
|
|
| 4,891 |
| |
Total Investments (98.5%) (Cost $4,924) |
|
|
| 4,891 |
| |
Other Assets in Excess of Liabilities (1.5%) |
|
|
| 72 |
| |
Net Assets (100%) |
|
|
| $ | 4,963 |
|
43 | The accompanying notes are an integral part of the financial statements. |
| 2005 Annual Report |
|
|
| December 31, 2005 |
Portfolio of Investments (cont’d)
International Growth Equity Portfolio
(a) |
| Non-income producing security. |
ADR |
| American Depositary Receipts |
CVA |
| Certificaten Van Aandelen |
GDR |
| Global Depositary Receipts |
The accompanying notes are an integral part of the financial statements. | 44 |
2005 Annual Report | |
|
|
December 31, 2005 | |
Investment Overview
International Magnum Portfolio
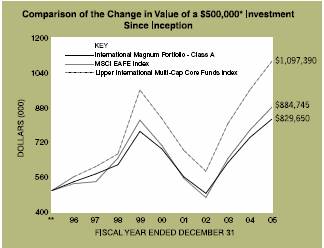
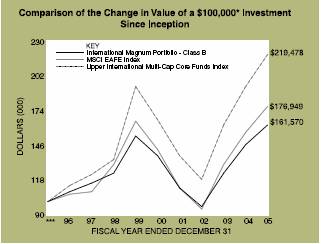
Minimum Investment | |
** | Commenced operations on March 15, 1996 |
*** | Commenced offering on March 15, 1996 |
In accordance with SEC regulations, Portfolio performance shown assumes that all recurring fees (including management fees) were deducted and all dividends and distributions were reinvested.
Performance Compared to the Morgan Stanley Capital International (MSCI) EAFE Index(1) and the Lipper International Multi-Cap Core Funds Index(2)
|
| Total Returns(3) |
| ||||
|
|
|
| Average Annual |
| ||
|
| One |
| Five |
| Since |
|
|
| Year |
| Years |
| Inception(6) |
|
Portfolio – Class A (4) |
| 11.35 | % | 3.70 | % | 5.30 | % |
Portfolio – Class B (5) |
| 11.04 |
| 3.42 |
| 5.02 |
|
MSCI EAFE Index |
| 13.54 |
| 4.55 |
| 6.00 |
|
Lipper International Multi-Cap Core Funds Index |
| 13.76 |
| 5.70 |
| 8.35 |
|
(1) |
| The MSCI EAFE Index (Europe, Australasia, Far East) is a free float-adjusted market capitalization index that is designed to measure developed market equity performance, excluding the U.S. & Canada. The MSCI EAFE Index consists of the following 21 developed market country indices: Australia, Austria, Belgium, Denmark, Finland, France, Germany, Greece, HongKong, Ireland, Italy, Japan, the Netherlands, New Zealand, Norway, Portugal, Singapore, Spain, Sweden, Switzerland and the United Kingdom. |
(2) |
| The Lipper International Multi-Cap Core Funds Index is an equally weighted performance index of the largest qualifying funds (based on net assets) in the Lipper International Multi-Cap Core Funds classification. The Index, which is adjusted for capital gains distributions and income dividends, is unmanaged and should not be considered an investment. There are currently 10 funds represented in this Index. As of the date of this report, the Portfolio is in the Lipper International Multi-Cap Core Funds classification. |
(3) |
| Total returns for the Portfolio reflect fees waived and expenses reimbursed, if applicable, by the Adviser. Without such waivers and reimbursements, total returns would have been lower. Fee waivers and/or expense reimbursements are voluntary and the Adviser reserves the right to commence or terminate any waiver and/or reimbursement at any time. |
(4) |
| Commenced operations on March 15, 1996 |
(5) |
| Commenced offering on March 15, 1996 |
(6) |
| For comparative purposes, average annual since inception returns listed for the Indexes refer to the inception date or initial offering of the respective share class of the Portfolio, not the inception of the Index. |
Performance data quoted represents past performance, which is no guarantee of future results, and current performance may be lower or higher than the figures shown. Performance assumes that all dividends and distributions, if any, were reinvested. For the most recent month-end performance figures, please visit morganstanley.com/im. Investment return and principal value will fluctuate so that Portfolio shares, when redeemed, may be worth more or less than their original cost. Total returns do not reflect the deduction of taxes that a shareholder would pay on Portfolio distributions or the redemption of Portfolio shares.
The International Magnum Portfolio seeks long-term capital appreciation by investing primarily in equity securities of non-U.S. issuers domiciled in EAFE countries. Foreign investing involves certain risks, including currency fluctuations and controls, restrictions on foreign investments, less governmental supervision and regulation, less liquidity and the potential for market volatility and political instability.
Performance
For the year ended December 31, 2005, the Portfolio had a total return based on net asset value per share of 11.35%, net
45
| 2005 Annual Report |
|
|
| December 31, 2005 |
Investment Overview (cont’d)
International Magnum Portfolio
of fees, for the Class A shares and 11.04%, net of fees, for the Class B shares compared to 13.54% for the Morgan Stanley Capital International (MSCI) EAFE Index (the “Index”).
Factors Affecting Performance
• International economic growth turned out to be surprisingly resilient, despite skyrocketing oil prices, U.S. natural disasters, rising interest rates and structural imbalances. Economic recovery set in Japan, heralding the end of its deflationary cycle and leading to strong stock market gains. Even Europe with its fragile economic recovery posted double-digit stock returns.
• Cyclical sectors outperformed during the year, with materials and industrials leading the way. Materials benefited from receding oil prices and solid consumer spending, while industrials rose in the aftermath of two devastating U.S. hurricanes. Energy outperformed the broad market as oil prices soared to new highs. Financials surprisingly outperformed despite the inversion of the bond yield curve. Financial stocks rallied in the fourth quarter amid speculation of a peak in the U.S. interest rate cycle. The health care sector underperformed relative to the broader index, as pharmaceutical stocks were dogged by patent expiry, lack of new drugs and competition from generics. Technology, particularly software and services stocks, gained from improved spending trends in security and storage. Telecommunications stocks trailed for the year given adverse sector trends and weak fundamentals.
• The primary cause of the underperformance during the year was driven by security selection within Europe and Japan. European performance was hampered by security selection within materials, consumer staples and consumer discretionary. Security selection within the Japanese materials and consumer discretionary groups also hurt overall results.
• Secondary causes of underperformance can be attributed to the Portfolio’s overweight to the underperforming European telecommunication sector and to an underweight to the Japanese financial sector. The latter sector gained on momentum and speculation, rather than on strong underlying fundamentals.
Management Strategies
• The Portfolio ended the year overweight to Japan and underweight to Europe and Asia ex-Japan. Within Europe, the Portfolio was overweight to the Euro-Zone and underweight the United Kingdom. These regional allocation decisions benefited the Portfolio throughout the year. As of the close of the period, Japan appears to be finally poised for recovery. Highlighting this revival is a pickup in domestic demand and a further decline in the unemployment rate. Japanese export volumes remain strong, adding to the broad based recovery that seems underway. In contrast to previous patches of growth primarily stimulated by exports, this recovery has gained sustenance from internal demand. The Euro Zone seems poised to participate in continued global growth with valuation remaining reasonable.
• As of the close of the period, the Portfolio’s largest overweight positions within sectors are to information technology, consumer staples, health care and telecommunication services. The Portfolio’s most significant underweights are to financials, utilities and energy.
Expense Examples
As a shareholder of the Portfolio, you may incur two types of costs: (1) transactional costs, including redemption fees; (2) ongoing costs, including management fees, distribution (12b-1) fees (in the case of Class B); and other Portfolio expenses. These examples are intended to help you understand your ongoing costs (in dollars) of investing in the Portfolio and to compare these costs with the ongoing costs of investing in other mutual funds.
The examples are based on an investment of $1,000 invested at the beginning of the six-month period ended December 31, 2005 and held for the entire six-month period.
Actual Expenses
The first line of the tables below provides information about actual account values and actual expenses. You may use the information in this line, together with the amount you invested, to estimate the expenses that you paid over the period. Simply divide your account value by $1,000 (for example, an $8,600 account value divided by $1,000 = 8.6), then multiply the result by the number in the first line under the heading entitled “Expenses Paid During Period” to estimate the expenses you paid on your account during this period.
Hypothetical Example for Comparison Purposes
The second line of the tables below provides information about hypothetical account values and hypothetical expenses based on the Portfolio’s actual expense ratio and an assumed rate of return of 5% per year before expenses, which is not the Portfolio’s actual return. The hypothetical account values and expenses may not be used to estimate the actual ending account balance or expenses you paid for the period. You may use this information to compare the ongoing costs of investing
46
2005 Annual Report | |
|
|
December 31, 2005 | |
Investment Overview (cont’d)
International Magnum Portfolio
in the Portfolio and other funds. To do so, compare this 5% hypothetical example with the 5% hypothetical examples that appear in the shareholder reports of the other funds.
Please note that the expenses shown in the table are meant to highlight your ongoing costs only and do not reflect any transactional costs, such as redemption fees. Therefore, the second line of the table is useful in comparing ongoing costs only, and will not help you determine the relative total costs of owning different funds. In addition, if these transactional costs were included, your costs would have been higher.
|
| Beginning |
| Ending Account |
| Expenses Paid |
|
Class A |
|
|
|
|
|
|
|
Actual |
| $1,000.00 |
| $1,133.60 |
| $5.38 |
|
Hypothetical (5% average annual return before expenses) |
| 1,000.00 |
| 1,020.16 |
| 5.09 |
|
|
|
|
|
|
|
|
|
Class B |
|
|
|
|
|
|
|
Actual |
| 1,000.00 |
| 1,132.50 |
| 6.72 |
|
Hypothetical (5% average annual return before expenses) |
| 1,000.00 |
| 1,018.95 |
| 6.36 |
|
* Expenses are equal to Class A and Class B annualized net expense ratios of 1.00% and 1.25%, respectively, multiplied by the average account value over the period, multiplied by 184/365 (to reflect the one-half year period).
Graphic Presentation of Portfolio Holdings
The following graph depicts the Portfolio’s holdings by industry and/or security type, as a percentage of total investments.
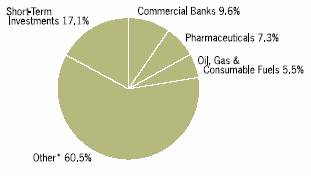
* Industries which do not appear in the above graph, as well as those which represent less than 5% of total investments, if applicable, are included in the category labeled “Other”.
January 2006
47
| 2005 Annual Report |
|
|
| December 31, 2005 |
Portfolio of Investments
International Magnum Portfolio
|
|
|
| Value |
| |
|
| Shares |
| (000) |
| |
Common Stocks (87.7%) |
|
|
|
|
| |
Australia (2.9%) |
|
|
|
|
| |
AMP Ltd. |
| 75,100 |
| $ | 424 |
|
Australia & New Zealand Banking Group Ltd. |
| 10,508 |
| 185 |
| |
BHP Billiton Ltd. |
| 40,489 |
| 676 |
| |
Coles Myer Ltd. |
| (c)11,700 |
| 88 |
| |
Gunns Ltd. |
| 51,800 |
| 123 |
| |
National Australia Bank Ltd. |
| 8,480 |
| 201 |
| |
Newcrest Mining Ltd. |
| 13,350 |
| 238 |
| |
Qantas Airways Ltd. |
| 29,400 |
| 87 |
| |
QBE Insurance Group Ltd. |
| (c)15,400 |
| 221 |
| |
Rio Tinto Ltd. |
| (c)14,050 |
| 711 |
| |
Westpac Banking Corp. |
| 14,700 |
| 245 |
| |
|
|
|
| 3,199 |
| |
Austria (0.8%) |
|
|
|
|
| |
Erste Bank der Oesterreichischen Sparkassen AG |
| 4,741 |
| 264 |
| |
Telekom Austria AG |
| 16,355 |
| 368 |
| |
Wiener Staedtische Allgemeine Versicherung AG |
| 3,400 |
| 201 |
| |
|
|
|
| 833 |
| |
Belgium (1.0%) |
|
|
|
|
| |
AGFA-Gevaert N.V. |
| 22,153 |
| 404 |
| |
Fortis |
| 7,150 |
| 228 |
| |
Solvay S.A., Class A |
| 4,176 |
| 460 |
| |
|
|
|
| 1,092 |
| |
Finland (0.5%) |
|
|
|
|
| |
Nokia Oyj |
| 31,141 |
| 570 |
| |
France (10.8%) |
|
|
|
|
| |
Atos Origin S.A. |
| (a)6,206 |
| 409 |
| |
AXA S.A. |
| 30,454 |
| 983 |
| |
BNP Paribas S.A. |
| 22,942 |
| 1,856 |
| |
Carrefour S.A. |
| 8,726 |
| 409 |
| |
Credit Agricole S.A. |
| 12,485 |
| 393 |
| |
France Telecom S.A. |
| 68,206 |
| 1,695 |
| |
Gaz de France |
| (a)(c)14,505 |
| 425 |
| |
Groupe Danone |
| 2,240 |
| 234 |
| |
Pernod-Ricard S.A. |
| (c)2,372 |
| 414 |
| |
Peugeot S.A. |
| (c)4,773 |
| 275 |
| |
Sanofi-Aventis S.A. |
| 13,849 |
| 1,213 |
| |
Schneider Electric S.A. |
| 6,223 |
| 555 |
| |
Societe Generale |
| 5,069 |
| 624 |
| |
Sodexho Alliance S.A. |
| (c)9,975 |
| 411 |
| |
Total S.A. |
| 7,855 |
| 1,973 |
| |
|
|
|
| 11,869 |
| |
Germany (6.7%) |
|
|
|
|
| |
Allianz AG (Registered) |
| 9,779 |
| 1,481 |
| |
Bayerische Motoren Werke AG |
| 25,146 |
| 1,103 |
| |
Commerzbank AG |
| 19,261 |
| 593 |
| |
Deutsche Bank AG (Registered) |
| 5,218 |
| 506 |
| |
Deutsche Telekom AG (Registered) |
| 45,963 |
| 766 |
| |
Fresenius Medical Care AG |
| (c)2,963 |
| 312 |
| |
Linde AG |
| 3,411 |
| 266 |
| |
Muenchener Rueckversicherungs AG (Registered) |
| 4,558 |
| 617 |
| |
SAP AG |
| 1,544 |
| 280 |
| |
Siemens AG (Registered) |
| 16,741 |
| $ | 1,435 |
|
|
|
|
| 7,359 |
| |
Greece (0.4%) |
|
|
|
|
| |
National Bank of Greece S.A. |
| 9,345 |
| 398 |
| |
Hong Kong (2.7%) |
|
|
|
|
| |
BOC Hong Kong Holdings Ltd. |
| 85,000 |
| 163 |
| |
Cheung Kong Holdings Ltd. |
| 18,000 |
| 185 |
| |
Dah Sing Financial Holdings Ltd. |
| 8,000 |
| 56 |
| |
Esprit Holdings Ltd. |
| 67,800 |
| 482 |
| |
Great Eagle Holdings Co. |
| 157,000 |
| 439 |
| |
Henderson Land Development Co., Ltd. |
| (c)113,000 |
| 532 |
| |
Hutchison Whampoa Ltd. |
| 20,000 |
| 191 |
| |
Hysan Development Co., Ltd. |
| 141,000 |
| 349 |
| |
New World Development Ltd. |
| 330,000 |
| 453 |
| |
Prosperity REIT |
| (a)562 |
| @— |
| |
Techtronic Industries Co. |
| 40,000 |
| 95 |
| |
|
|
|
| 2,945 |
| |
Ireland (0.7%) |
|
|
|
|
| |
Bank of Ireland |
| 26,352 |
| 415 |
| |
Kerry Group plc, Class A |
| 18,275 |
| 405 |
| |
|
|
|
| 820 |
| |
Italy (1.8%) |
|
|
|
|
| |
Banca Monte dei Paschi di Siena S.p.A. |
| (c)54,192 |
| 253 |
| |
ENI S.p.A. |
| 19,893 |
| 552 |
| |
Telecom Italia S.p.A. RNC |
| 217,761 |
| 540 |
| |
UniCredito Italiano S.p.A. |
| 92,901 |
| 640 |
| |
|
|
|
| 1,985 |
| |
Japan (21.8%) |
|
|
|
|
| |
Amada Co., Ltd. |
| 34,000 |
| 300 |
| |
Astellas Pharma, Inc. |
| 12,600 |
| 492 |
| |
Canon, Inc. |
| 12,000 |
| 702 |
| |
Casio Computer Co., Ltd. |
| (c)25,000 |
| 419 |
| |
Dai Nippon Printing Co., Ltd. |
| 18,000 |
| 321 |
| |
Daicel Chemical Industries Ltd. |
| 55,000 |
| 396 |
| |
Daifuku Co., Ltd. |
| (c)27,000 |
| 459 |
| |
Daiichi Sankyo Co., Ltd. |
| (a)19,700 |
| 380 |
| |
Daikin Industries Ltd. |
| 18,000 |
| 527 |
| |
Denki Kagaku Kogyo K.K. |
| 80,000 |
| 354 |
| |
East Japan Railway Co. |
| 50 |
| 344 |
| |
FamilyMart Co., Ltd. |
| 11,300 |
| 382 |
| |
Fuji Machine Manufacturing Co., Ltd. |
| 6,500 |
| 131 |
| |
Fuji Photo Film Co., Ltd. |
| (c)14,000 |
| 463 |
| |
Fujitec Co., Ltd. |
| 21,000 |
| 123 |
| |
Fujitsu Ltd. |
| 81,000 |
| 617 |
| |
Furukawa Electric Co., Ltd. |
| (a)(c)70,000 |
| 547 |
| |
Hitachi Capital Corp. |
| (c)18,200 |
| 363 |
| |
Hitachi High-Technologies Corp. |
| (c)6,900 |
| 173 |
| |
Hitachi Ltd. |
| 71,000 |
| 479 |
| |
House Foods Corp. |
| (c)9,200 |
| 140 |
| |
Kaneka Corp. |
| 42,000 |
| 508 |
| |
Kurita Water Industries Ltd. |
| (c)21,000 |
| 400 |
| |
Kyocera Corp. |
| 5,100 |
| 372 |
| |
Kyudenko Corp. |
| 10,000 |
| 70 |
| |
Lintec Corp. |
| 10,000 |
| 230 |
| |
Maeda Road Construction Co., Ltd. |
| 10,000 |
| 73 |
| |
The accompanying notes are an integral part of the financial statements. | 48 |
2005 Annual Report | |
|
|
December 31, 2005 | |
Portfolio of Investments (cont’d)
International Magnum Portfolio
|
|
|
| Value |
| |
|
| Shares |
| (000) |
| |
Japan (cont’d) |
|
|
|
|
| |
Matsushita Electric Industrial Co., Ltd. |
| 40,000 |
| $ | 772 |
|
Minebea Co., Ltd. |
| 48,000 |
| 256 |
| |
Mitsubishi Chemical Corp. |
| (a)47,500 |
| 299 |
| |
Mitsubishi Corp. |
| 34,000 |
| 753 |
| |
Mitsubishi Estate Co., Ltd. |
| 10,000 |
| 208 |
| |
Mitsubishi Heavy Industries Ltd. |
| 127,000 |
| 560 |
| |
Mitsumi Electric Co., Ltd. |
| (c)18,100 |
| 205 |
| |
Nagase & Co., Ltd. |
| 13,000 |
| 159 |
| |
NEC Corp. |
| 80,000 |
| 498 |
| |
Nifco, Inc. |
| (c)13,000 |
| 246 |
| |
Nintendo Co., Ltd. |
| 4,700 |
| 568 |
| |
Nippon Meat Packers, Inc. |
| 19,000 |
| 199 |
| |
Nippon Sheet Glass Co., Ltd. |
| (c)24,000 |
| 105 |
| |
Nippon Steel Corp. |
| (c)50,000 |
| 178 |
| |
Nippon Telegraph & Telephone Corp. |
| 60 |
| 273 |
| |
Nissan Motor Co., Ltd. |
| (c)60,000 |
| 608 |
| |
Nissha Printing Co., Ltd. |
| 3,000 |
| 87 |
| |
Nisshinbo Industries, Inc. |
| (c)20,000 |
| 219 |
| |
Obayashi Corp. |
| 47,000 |
| 346 |
| |
Ono Pharmaceutical Co., Ltd. |
| 7,800 |
| 353 |
| |
Ricoh Co., Ltd. |
| 29,000 |
| 508 |
| |
Rinnai Corp. |
| (c)5,600 |
| 133 |
| |
Rohm Co., Ltd. |
| 3,000 |
| 326 |
| |
Ryosan Co., Ltd. |
| (c)8,700 |
| 231 |
| |
Sanki Engineering Co., Ltd. |
| 4,000 |
| 35 |
| |
Sanwa Shutter Corp. |
| (c)29,000 |
| 179 |
| |
Sekisui Chemical Co., Ltd. |
| 47,000 |
| 318 |
| |
Sekisui House Ltd. |
| (c)28,000 |
| 352 |
| |
Shin-Etsu Polymer Co., Ltd. |
| 23,000 |
| 315 |
| |
Sony Corp. |
| 10,000 |
| 409 |
| |
Suzuki Motor Corp. |
| 21,200 |
| 393 |
| |
TDK Corp. |
| 5,400 |
| 372 |
| |
Teijin Ltd. |
| (c)54,000 |
| 343 |
| |
Toho Co., Ltd. |
| 7,400 |
| 166 |
| |
Tokyo Electric Power Co., Inc. (The) |
| 10,600 |
| 258 |
| |
Toshiba Corp. |
| 119,000 |
| 711 |
| |
Toyo Ink Manufacturing Co., Ltd. |
| 31,000 |
| 139 |
| |
Toyota Motor Corp. |
| 17,400 |
| 903 |
| |
Tsubakimoto Chain Co. |
| 47,000 |
| 327 |
| |
Yamaha Corp. |
| (c)23,100 |
| 384 |
| |
Yamaha Motor Co., Ltd. |
| 18,000 |
| 470 |
| |
|
|
|
| 23,929 |
| |
Netherlands (8.2%) |
|
|
|
|
| |
ASML Holding N.V. |
| (a)18,058 |
| 361 |
| |
CSM N.V. CVA |
| 7,796 |
| 213 |
| |
ING Groep N.V. CVA |
| 13,637 |
| 473 |
| |
Koninklijke Ahold N.V. |
| (a)53,209 |
| 399 |
| |
Koninklijke Numico N.V. |
| (a)5,901 |
| 244 |
| |
Royal Dutch Shell plc, Class A |
| 46,988 |
| 1,434 |
| |
Royal Dutch Shell plc, Class B |
| 42,139 |
| 1,347 |
| |
Royal KPN N.V. |
| 25,377 |
| 255 |
| |
TNT N.V. |
| 28,865 |
| 902 |
| |
Unilever N.V. CVA |
| 14,885 |
| 1,019 |
| |
VNU N.V. |
| 21,227 |
| 704 |
| |
Wolters Kluwer N.V. CVA |
| 84,969 |
| $ | 1,718 |
|
|
|
|
| 9,069 |
| |
Poland (0.8%) |
|
|
|
|
| |
Bank Pekao S.A. |
| 8,741 |
| 470 |
| |
Telekomunikacja Polska S.A. |
| 61,353 |
| 442 |
| |
|
|
|
| 912 |
| |
Portugal (0.4%) |
|
|
|
|
| |
Portugal Telecom SGPS S.A. (Registered) |
| 47,121 |
| 477 |
| |
Singapore (1.6%) |
|
|
|
|
| |
CapitaCommercial Trust REIT |
| 45,400 |
| 40 |
| |
CapitaLand Ltd. |
| 227,000 |
| 470 |
| |
City Developments Ltd. |
| 60,000 |
| 314 |
| |
Oversea-Chinese Banking Corp., Ltd. |
| 60,000 |
| 242 |
| |
SembCorp Industries Ltd. |
| 114,680 |
| 189 |
| |
Singapore Airlines Ltd. |
| 53,000 |
| 395 |
| |
Venture Corp., Ltd. |
| 20,000 |
| 166 |
| |
|
|
|
| 1,816 |
| |
South Africa (0.3%) |
|
|
|
|
| |
Anglo American plc (London Shares) |
| 9,380 |
| 319 |
| |
Spain (3.0%) |
|
|
|
|
| |
Altadis S.A. |
| 15,585 |
| 707 |
| |
Banco Bilbao Vizcaya Argentaria S.A. |
| 70,937 |
| 1,266 |
| |
Banco Santander Central Hispano S.A. |
| 50,883 |
| 672 |
| |
Telefonica S.A. |
| 40,069 |
| 603 |
| |
|
|
|
| 3,248 |
| |
Sweden (1.4%) |
|
|
|
|
| |
Atlas Copco AB, Class A |
| 11,461 |
| 255 |
| |
ForeningsSparbanken AB |
| 17,246 |
| 470 |
| |
Nordea Bank AB |
| 42,328 |
| 440 |
| |
Sandvik AB |
| 8,979 |
| 418 |
| |
|
|
|
| 1,583 |
| |
Switzerland (7.0%) |
|
|
|
|
| |
Ciba Specialty Chemicals AG (Registered) |
| 5,681 |
| 367 |
| |
Compagnie Financiere Richemont AG, Class A |
| 7,247 |
| 315 |
| |
Credit Suisse Group (Registered) |
| 12,453 |
| 635 |
| |
EFG International |
| (a)4,200 |
| 112 |
| |
Nestle S.A. (Registered) |
| 2,927 |
| 875 |
| |
Novartis AG (Registered) |
| 48,416 |
| 2,544 |
| |
Roche Holding AG (Genusschein) |
| 3,414 |
| 513 |
| |
Swiss Reinsurance (Registered) |
| 13,708 |
| 1,004 |
| |
UBS AG (Registered) |
| 11,575 |
| 1,102 |
| |
Zurich Financial Services AG (Registered) |
| (a)1,125 |
| 240 |
| |
|
|
|
| 7,707 |
| |
United Kingdom (14.9%) |
|
|
|
|
| |
ARM Holdings plc |
| 78,121 |
| 163 |
| |
AstraZeneca plc |
| 23,233 |
| 1,131 |
| |
Aviva plc |
| 20,566 |
| 249 |
| |
BG Group plc |
| 13,412 |
| 133 |
| |
BOC Group plc |
| 22,783 |
| 470 |
| |
BP plc |
| 90,888 |
| 968 |
| |
Bunzl plc |
| 37,598 |
| 413 |
| |
Cadbury Schweppes plc |
| 153,751 |
| 1,454 |
| |
Carnival plc |
| 2,333 |
| 132 |
| |
Diageo plc |
| 17,162 |
| 249 |
| |
49 | The accompanying notes are an integral part of the financial statements. |
| 2005 Annual Report |
|
|
| December 31, 2005 |
Portfolio of Investments (cont’d)
International Magnum Portfolio
|
|
|
| Value |
| |
|
| Shares |
| (000) |
| |
United Kingdom (cont’d) |
|
|
|
|
| |
GlaxoSmithKline plc |
| 72,495 |
| $ | 1,832 |
|
Hays plc |
| 181,852 |
| 393 |
| |
International Power plc |
| (a)97,238 |
| 401 |
| |
Man Group plc |
| 15,287 |
| 502 |
| |
Morrison WM Supermarkets plc |
| 483,340 |
| 1,609 |
| |
National Grid plc |
| 18,168 |
| 178 |
| |
Reckitt Benckiser plc |
| 10,338 |
| 341 |
| |
Reed Elsevier plc |
| 37,642 |
| 354 |
| |
Rexam plc |
| 44,115 |
| 386 |
| |
Rio Tinto plc |
| 7,937 |
| 362 |
| |
Rolls-Royce Group plc |
| (a)32,932 |
| 242 |
| |
Rolls-Royce Group plc, Class B |
| 1,108,278 |
| 2 |
| |
Royal Bank of Scotland Group plc |
| 38,870 |
| 1,174 |
| |
Scottish & Southern Energy plc |
| 14,546 |
| 254 |
| |
Smith & Nephew plc |
| 15,363 |
| 141 |
| |
Smiths Group plc |
| 12,011 |
| 216 |
| |
Standard Chartered plc |
| 7,819 |
| 174 |
| |
Tesco plc |
| 66,910 |
| 382 |
| |
Vodafone Group plc |
| 772,742 |
| 1,668 |
| |
William Hill plc |
| 41,574 |
| 383 |
| |
|
|
|
| 16,356 |
| |
Total Common Stocks (Cost $78,549) |
|
|
| 96,486 |
| |
|
| Face |
|
|
| ||
|
| Amount |
|
|
| ||
|
| (000) |
|
|
| ||
Short-Term Investments (18.0%) |
|
|
|
|
| ||
Short-Term Debt Securities held as Collateral on Loaned Securities (6.7%) |
|
|
|
|
| ||
Abbey National Treasury Services, |
|
|
|
|
| ||
4.14%, 1/13/06 |
| $ | (h)176 |
| 176 |
| |
Alliance & Leister plc, 4.33%, 1/30/07 |
| (h)237 |
| 237 |
| ||
Bank of America, 4.31%, 11/7/06 |
| (h)52 |
| 52 |
| ||
Bank of New York Co., Inc., 4.33%, 1/30/07 |
| (h)119 |
| 119 |
| ||
Bear Stearns, 4.38%, 6/15/06 |
| (h)237 |
| 237 |
| ||
Calyon NY, 4.40%, 2/27/06 |
| (h)95 |
| 95 |
| ||
Cancara Asset Securitisation Ltd., |
|
|
|
|
| ||
4.26%, 1/17/06 |
| 353 |
| 353 |
| ||
CC USA, Inc., 4.33%, 4/18/06 |
| (h)119 |
| 119 |
| ||
CIC NY, 4.34%, 2/13/06 |
| (h)356 |
| 356 |
| ||
Ciesco LLC, 4.25%, 1/17/06 |
| 118 |
| 118 |
| ||
Dekabank Deutsche Girozentrale, |
|
|
|
|
| ||
4.17%, 5/19/06 |
| (h)242 |
| 242 |
| ||
Deutsche Bank Securities, Inc., |
|
|
|
|
| ||
4.27%, 1/3/06 |
| 2,169 |
| 2,169 |
| ||
Goldman Sachs Group, Inc., 4.38%, 1/30/07 |
| (h)119 |
| 119 |
| ||
HSBC USA, NY, 4.12%, 2/6/06 |
| 119 |
| 119 |
| ||
K2 (USA) LLC, |
|
|
|
|
| ||
4.33%, 4/25/06 |
| (h)119 |
| 119 |
| ||
4.34%, 2/15/06 |
| (h)104 |
| 104 |
| ||
4.35%, 2/15/06 |
| (h)47 |
| 47 |
| ||
Links Finance LLC, |
|
|
|
|
| ||
4.29%, 10/6/06 |
| (h)95 |
| 95 |
| ||
4.33%, 4/18/06 |
| (h)119 |
| 119 |
| ||
4.36%,2/27/06 |
| (h)142 |
| 142 |
| ||
Manufacturers & Traders, |
|
|
|
|
| ||
4.37%, 12/29/06 |
| $ | (h)71 |
| $ | 71 |
|
Merck & Co., 4.37%, 2/23/06 |
| 123 |
| 123 |
| ||
Nationwide Building Society, |
|
|
|
|
| ||
4.58%, 1/2/07 |
| (h)275 |
| 275 |
| ||
Proctor & Gamble, 4.46%, 1/30/07 |
| (h)97 |
| 97 |
| ||
Rabobank USA Financial Corp., |
|
|
|
|
| ||
4.13%, 1/3/06 |
| 356 |
| 356 |
| ||
San Paolo IMI Bank, 4.33%, 2/23/06 |
| 213 |
| 213 |
| ||
Sigma Finance, Inc., 4.34%, 3/22/06 |
| (h)237 |
| 237 |
| ||
SLM Corp., 4.37%, 1/30/07 |
| (h)237 |
| 237 |
| ||
Tango Finance Corp., 4.33%, 3/22/06 |
| (h)199 |
| 199 |
| ||
Wachovia Bank N.A., 4.30%, 10/2/06 |
| (h)285 |
| 285 |
| ||
Wells Fargo Bank San Francisco N.A., |
|
|
|
|
| ||
4.30%, 12/1/06 |
| (h)166 |
| 166 |
| ||
|
|
|
| 7,396 |
| ||
Repurchase Agreement (11.3%) |
|
|
|
|
| ||
J.P. Morgan Securities, Inc., 4.05%, dated 12/30/05, due 1/3/06, repurchase price $12,456 |
| (f)12,450 |
| 12,450 |
| ||
Total Short-Term Investments (Cost $19,846) |
|
|
| 19,846 |
| ||
Total Investments (105.7%) (Cost $98,395) — |
|
|
| 116,332 |
| ||
Liabilities in Excess of Other Assets (-5.7%) |
|
|
| (6,329 | ) | ||
Net Assets (100%) |
|
|
| $ | 110,003 |
| |
(a) Non-income producing security.
(c) All or portion of security on loan at December 31, 2005.
(f) Represents the Portfolio’s undivided interest in a joint repurchase agreement which has a total value of $1,000,707,000. The repurchase agreement was fully collateralized by U.S. government agency securities at the date of this Portfolio of Investments as follows: Federal Farm Credit Bank: 2.00% to 7.35%, due 1/11/06 to 10/25/33; Federal Home Loan Mortgage Corp.: 1.88% to 7.22%, due 2/9/06 to 7/15/32; Federal National Mortgage Association: 2.50% to 7.25%, due 2/15/06 to 11/15/30, which had a total value of $1,020,741,791. The investment in the repurchase agreement is through participation in a joint account with affiliated parties pursuant to exemptive relief received by the Portfolio from the SEC.
(h) Variable/Floating Rate Security — interest rate changes on these instruments are based on changes in a designated base rate. The rates shown are those in effect on December 31, 2005.
@ Face Amount/Value is less than $500.
CVA Certificaten Van Aandelen
REIT Real Estate Investment Trust
RNC Non-Convertible Savings Shares
The accompanying notes are an integral part of the financial statements. | 50 |
2005 Annual Report | |
|
|
December 31, 2005 | |
Portfolio of Investments (cont’d)
International Magnum Portfolio
Foreign Currency Exchange Contract Information: |
The Portfolio had the following foreign currency exchange contract(s) open at period end:
Currency |
| Value |
| Settlement |
| In |
| Value |
| Net |
| |||||||
EUR |
| 382 |
| $ | 454 |
| 3/15/06 |
| USD |
| 458 |
| $ | 458 |
| $ | 4 |
|
EUR |
| 894 |
| 1,063 |
| 3/15/06 |
| USD |
| 1,073 |
| 1,073 |
| 10 |
| |||
EUR |
| 1,687 |
| 2,004 |
| 3/15/06 |
| USD |
| 2,021 |
| 2,021 |
| 17 |
| |||
EUR |
| 5,063 |
| 6,017 |
| 3/15/06 |
| USD |
| 6,071 |
| 6,071 |
| 54 |
| |||
GBP |
| 692 |
| 1,191 |
| 3/15/06 |
| USD |
| 1,223 |
| 1,223 |
| 32 |
| |||
GBP |
| 458 |
| 789 |
| 3/15/06 |
| USD |
| 812 |
| 812 |
| 23 |
| |||
GBP |
| 815 |
| 1,403 |
| 3/15/06 |
| USD |
| 1,442 |
| 1,442 |
| 39 |
| |||
GBP |
| 51 |
| 87 |
| 3/15/06 |
| USD |
| 87 |
| 87 |
| @— |
| |||
JPY |
| 150,902 |
| 1,291 |
| 3/15/06 |
| USD |
| 1,270 |
| 1,270 |
| (21) |
| |||
JPY |
| 55,925 |
| 478 |
| 3/15/06 |
| USD |
| 470 |
| 470 |
| (8) |
| |||
JPY |
| 736,791 |
| 6,304 |
| 3/15/06 |
| USD |
| 6,205 |
| 6,205 |
| (99) |
| |||
USD |
| 461 |
| 461 |
| 3/15/06 |
| AUD |
| 613 |
| 448 |
| (13) |
| |||
USD |
| 1,832 |
| 1,832 |
| 3/15/06 |
| AUD |
| 2,435 |
| 1,782 |
| (50) |
| |||
USD |
| 160 |
| 160 |
| 3/15/06 |
| AUD |
| 213 |
| 156 |
| (4) |
| |||
USD |
| 779 |
| 779 |
| 3/15/06 |
| EUR |
| 649 |
| 771 |
| (8) |
| |||
USD |
| 6,063 |
| 6,063 |
| 3/15/06 |
| EUR |
| 5,057 |
| 6,009 |
| (54) |
| |||
USD |
| 1,158 |
| 1,158 |
| 3/15/06 |
| EUR |
| 978 |
| 1,162 |
| 4 |
| |||
USD |
| 1,967 |
| 1,967 |
| 3/15/06 |
| GBP |
| 1,110 |
| 1,910 |
| (57) |
| |||
USD |
| 4,328 |
| 4,328 |
| 3/15/06 |
| GBP |
| 2,445 |
| 4,206 |
| (122) |
| |||
USD |
| 4,625 |
| 4,625 |
| 3/15/06 |
| GBP |
| 2,611 |
| 4,491 |
| (134) |
| |||
USD |
| 597 |
| 597 |
| 3/15/06 |
| GBP |
| 338 |
| 581 |
| (16) |
| |||
USD |
| 332 |
| 332 |
| 3/15/06 |
| GBP |
| 194 |
| 333 |
| 1 |
| |||
USD |
| 340 |
| 340 |
| 3/15/06 |
| JPY |
| 40,385 |
| 346 |
| 6 |
| |||
USD |
| 1,110 |
| 1,110 |
| 3/15/06 |
| JPY |
| 131,925 |
| 1,128 |
| 18 |
| |||
USD |
| 1,123 |
| 1,123 |
| 3/15/06 |
| JPY |
| 133,315 |
| 1,141 |
| 18 |
| |||
USD |
| 1,179 |
| 1,179 |
| 3/15/06 |
| JPY |
| 140,045 |
| 1,198 |
| 19 |
| |||
USD |
| 6,752 |
| 6,752 |
| 3/15/06 |
| JPY |
| 801,778 |
| 6,860 |
| 108 |
| |||
USD |
| 1,502 |
| 1,502 |
| 3/15/06 |
| JPY |
| 175,755 |
| 1,504 |
| 2 |
| |||
|
|
|
| $ | 55,389 |
|
|
|
|
|
|
| $ | 55,158 |
| $ | (231 | ) |
AUD | — | Australian Dollar |
EUR | — | Euro |
GBP | — | British Pound |
JPY | — | Japanese Yen |
USD | — | United States Dollar |
Futures Contracts: |
|
The Portfolio had the following futures contract(s) open at period end:
|
|
|
|
|
|
|
| Net |
|
|
|
|
|
|
|
|
| Unrealized |
|
|
| Number |
|
|
|
|
| Appreciation |
|
|
| of |
| Value |
| Expiration |
| (Depreciation) |
|
|
| Contracts |
| (000) |
| Date |
| (000) |
|
Long: |
|
|
|
|
|
|
|
|
|
DJ EURO STOXX 50 |
|
|
|
|
|
|
|
|
|
(Germany) |
| 99 |
| $4,205 |
| Mar-06 |
| $ 39 |
|
FTSE 100 Index |
|
|
|
|
|
|
|
|
|
(United Kingdom) |
| 17 |
| 1,643 |
| Mar-06 |
| 27 |
|
SPI 200 Index |
|
|
|
|
|
|
|
|
|
(Australia) |
| 5 |
| 433 |
| Mar-06 |
| 10 |
|
TOPIX Index |
|
|
|
|
|
|
|
|
|
(Japan) |
| 48 |
| 6,691 |
| Mar-06 |
| 123 |
|
|
|
|
|
|
|
|
| $199 |
|
|
|
|
|
|
|
|
|
|
|
51 | The accompanying notes are an integral part of the financial statements. |
| 2005 Annual Report |
|
|
| December 31, 2005 |
Investment Overview
International Real Estate Portfolio
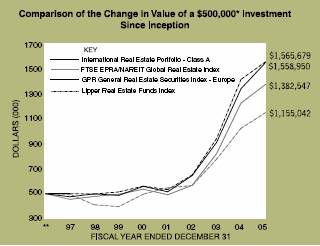

* Minimum Investment
** Commenced operations on October 1, 1997
*** Commenced offering on October 1, 1997
In accordance with SEC regulations, Portfolio performance shown assumes that all recurring fees (including management fees) were deducted and all dividends and distributions were reinvested.
Performance Compared to the FTSE EPRA/NAREIT Global Real Estate Index(1), the GPR General Real Estate Securities Index - Europe(2) and the Lipper Real Estate Funds Index(3)
|
| Total Returns(4) |
| ||||
|
|
|
| Average Annual |
| ||
|
| One |
| Five |
| Since |
|
|
| Year |
| Years |
| Inception(7) |
|
|
|
|
|
|
|
|
|
Portfolio – Class A (5) |
| 15.52 | % | 22.73 | % | 14.78 | % |
Portfolio – Class B (6) |
| 15.22 |
| 22.40 |
| 14.49 |
|
FTSE EPRA/NAREIT Global Real Estate Index |
| 12.17 |
| 20.82 |
| 13.12 |
|
GPR General Real Estate Securities Index - Europe |
| 9.92 |
| 22.74 |
| 14.83 |
|
Lipper Real Estate Funds Index |
| 12.27 |
| 18.36 |
| 10.71 |
|
(1) | The FTSE EPRA/NAREIT Global Real Estate Index (80% Europe/20% Asia) is a customized benchmark, 80% of which consists of the performance of the FTSE EPRA/NAREIT Europe Series and 20% of which consists of the performance of the FTSE EPRA/NAREIT Asia Series. These series are components of the FTSE EPRA/NAREIT Global Real Estate Index which is a market capitalization weighted index designed to reflect the stock performance of companies engaged in the North American, European and Asian real estate markets. The Index is rebalanced on a monthly basis. The Portfolio’s benchmark changed from the GPR General Real Estate Securities Index - Europe to the FTSE EPRA/NAREIT Global Real Estate Index (80%Europe/20%Asia) to more accurately reflect the Portfolio’s investible universe. |
|
|
(2) | The GPR General Real Estate Securities Index - Europe is a market capitalization weighted index of listed property/real estate securities in Europe measuring total return. |
|
|
(3) | The Lipper Real Estate Funds Index is an equally weighted performance index of the largest qualifying funds (based on net assets) in the Lipper Real Estate Funds classification. The Index, which is adjusted for capital gains distributions and income dividends, is unmanaged and should not be considered an investment. There are currently 30 funds represented in this Index. As of the date of this report, the Portfolio is in the Lipper Real Estate Funds classification. |
|
|
(4) | Total returns for the Portfolio reflect fees waived and expenses reimbursed, if applicable, by the Adviser. Without such waivers and reimbursements, total returns would have been lower. Fee waivers and/or expense reimbursements are voluntary and the Adviser reserves the right to commence or terminate any waiver and/or reimbursement at any time. |
|
|
(5) | Commenced operations on October 1, 1997 |
|
|
(6) | Commenced offering on October 1, 1997 |
|
|
(7) | For comparative purposes, average annual since inception returns listed for the Indexes refer to the inception date or initial offering of the respective share class of the Portfolio, not the inception of the Index. |
Performance data quoted represents past performance, which is no guarantee of future results, and current performance may be lower or higher than the figures shown. Performance assumes that all dividends and distributions, if any, were reinvested. For the most recent month-end performance figures, please visit morganstanley.com/im. Investment return and principal value will fluctuate so that Portfolio shares, when redeemed, may be worth more or less than their original cost. Total returns do not reflect the deduction of taxes that a shareholder would pay on Portfolio distributions or the redemption of Portfolio shares.
The International Real Estate Portfolio seeks to provide current income and long-term capital appreciation by investing primarily in equity securities of companies in the real estate industry located in various global markets throughout
52
2005 Annual Report | |
|
|
December 31, 2005 | |
Investment Overview (cont’d)
International Real Estate Portfolio
the world (excluding the United States and Canada). Foreign investing involves certain risks, including currency fluctuations and controls, restrictions on foreign investments, less governmental supervision and regulation, less liquidity and the potential for market volatility and political instability.
Performance
For the year ended December 31, 2005, the Portfolio had a total return of 15.52% for the Class A shares, net of fees, and 15.22% for the Class B shares, net of fees, compared to 12.17% for the FTSE EPRA/NAREIT Global Real Estate Index (the “Index”).
Factors Affecting Performance
• During the second half of the year, the Portfolio began investing in the Asian real estate securities markets, and holdings in this region added to absolute returns. The Portfolio’s overweight in Asia, particularly in Japan, also had a positive impact on relative performance versus the Index. An underweight in Australia was beneficial as well.
• In Europe, a country overweight in Spain and an underweight in Austria had a positive impact on relative performance, but underweights in France and Denmark detracted. Stock selection was positive in France and the Netherlands, but negatively affected performance in Spain and Sweden.
• In 2005, overall returns from property stocks in Europe and Asia were strong, and real estate securities outperformed the regional equity markets. In Europe, the performance can be attributed to improving real estate values and continued investor attraction to real estate. Asian returns were strong as the asset reflation story played out in an accelerated fashion, especially in the second half of 2005. In particular, property stocks in both Hong Kong and Japan translated improvements in both their economies and underlying real estate fundamentals into higher private real estate values and share prices.
• The European office market started to recover during the second half of 2005 and real estate fundamentals continued to strengthen. Demand for office space improved across the majority of European office markets, and vacancy rates declined as development completions remain low. Improving demand and declining vacancies have already led to rental growth in a number of European office markets.
• Throughout the reporting period, the real estate investment markets were very liquid across Europe and Asia, and this continued to boost capital values. As of the close of the period, there remains a large spread between property yields and interest rates, and strong investor demand has resulted in yield compression in the European and Asian real estate investment markets.
• Broadly speaking, real estate securities in the European market now trade at a premium to the net asset values (“NAV”) of underlying assets; the Asian market is trading close to NAV. Given the recovery in the office markets over the next 12 months, with retail markets still showing growth, and given the strong NAV growth reported by the listed companies, valuations do not appear to be too demanding at this time, in our view.
Management Strategies
• As discussed, the Portfolio began investing in Asian real estate market during the second half of the period. As of the close of the period, the Portfolio was overweighted in Asia relative to the Index, including in Japan.
• We added to positions in the United Kingdom during the year, thereby increasing the Portfolio’s overweight. We partly closed our underweight in Sweden, following a period of underperformance halfway through the year. We took profits in France during the first half of the period, and as a result, moved from an overweighted position to an underweighted position. The Portfolio also included underweights in Denmark and Austria, and an overweight in Spain.
Expense Examples
As a shareholder of the Portfolio, you may incur two types of costs: (1) transactional costs, including redemption fees; (2) ongoing costs, including management fees, distribution (12b-1) fees (in the case of Class B); and other Portfolio expenses. These examples are intended to help you understand your ongoing costs (in dollars) of investing in the Portfolio and to compare these costs with the ongoing costs of investing in other mutual funds.
The examples are based on an investment of $1,000 invested at the beginning of the six-month period ended December 31, 2005 and held for the entire six-month period.
Actual Expenses
The first line of the tables below provides information about actual account values and actual expenses. You may use the information in this line, together with the amount you invested, to estimate the expenses that you paid over the period. Simply divide your account value by $1,000 (for example, an $8,600 account value divided by $1,000 = 8.6), then multiply the result by the number in the first line under the heading entitled “Expenses Paid During Period” to
53
| 2005 Annual Report |
|
|
| December 31, 2005 |
Investment Overview (cont’d)
International Real Estate Portfolio
estimate the expenses you paid on your account during this period.
Hypothetical Example for Comparison Purposes
The second line of the tables below provides information about hypothetical account values and hypothetical expenses based on the Portfolio’s actual expense ratio and an assumed rate of return of 5% per year before expenses, which is not the Portfolio’s actual return. The hypothetical account values and expenses may not be used to estimate the actual ending account balance or expenses you paid for the period. You may use this information to compare the ongoing costs of investing in the Portfolio and other funds. To do so, compare this 5% hypothetical example with the 5% hypothetical examples that appear in the shareholder reports of the other funds.
Please note that the expenses shown in the table are meant to highlight your ongoing costs only and do not reflect any transactional costs, such as redemption fees. Therefore, the second line of the table is useful in comparing ongoing costs only, and will not help you determine the relative total costs of owning different funds. In addition, if these transactional costs were included, your costs would have been higher.
|
|
|
|
|
| Expenses Paid |
|
|
|
|
| Ending Account |
| During Period* |
|
|
| Beginning |
| Value |
| July 1, 2005 — |
|
|
| Account Value |
| December 31, |
| December 31, |
|
|
| July 1, 2005 |
| 2005 |
| 2005 |
|
Class A |
|
|
|
|
|
|
|
Actual |
| $1,000.00 |
| $1,112.70 |
| $5.33 |
|
Hypothetical (5% average annual return before expenses) |
| 1,000.00 |
| 1,020.16 |
| 5.09 |
|
|
|
|
|
|
|
|
|
Class B |
|
|
|
|
|
|
|
Actual |
| 1,000.00 |
| 1,111.30 |
| 6.65 |
|
Hypothetical (5% average annual return before expenses) |
| 1,000.00 |
| 1,018.90 |
| 6.36 |
|
* Expenses are equal to Class A and Class B annualized net expense ratios of 1.00% and 1.25%, respectively, multiplied by the average account value over the period, multiplied by 184/365 (to reflect the one-half year period).
Graphic Presentation of Portfolio Holdings
The following graph depicts the Portfolio’s holdings by industry and/or security type, as a percentage of total investments

* Industries which do not appear in the above graph, as well as those which represent less than 5% of total investments, if applicable, are included in the category labeled “Other”.
January 2006
54
2005 Annual Report | |
|
|
December 31, 2005 | |
Portfolio of Investments
International Real Estate Portfolio
|
|
|
| Value | |
|
| Shares |
| (000) | |
Common Stocks (97.8%) |
|
|
|
| |
Australia (8.3%) |
|
|
|
| |
Centro Properties Group |
| 244,100 |
| $ | 1,133 |
CFS Gandel Retail Trust |
| 633,500 |
| 929 | |
DB RREEF Trust |
| 915,400 |
| 933 | |
GPT Group |
| 707,300 |
| 2,127 | |
Investa Property Group |
| 432,700 |
| 630 | |
Macquarie CountryWide Trust |
| 318,400 |
| 462 | |
Macquarie Goodman Group |
| 392,600 |
| 1,376 | |
Mirvac Group |
| 302,900 |
| 915 | |
Stockland |
| 580,850 |
| 2,769 | |
Westfield Group |
| 765,050 |
| 10,189 | |
|
|
|
| 21,463 | |
Belgium (0.1%) |
|
|
|
| |
Befimmo S.C.A. REIT |
| 1,835 |
| 168 | |
China (0.5%) |
|
|
|
| |
Guangzhou R&F Properties Co., Ltd. |
| (a)391,000 |
| 1,362 | |
Finland (2.4%) |
|
|
|
| |
Sponda Oyj |
| 662,986 |
| 6,240 | |
France (7.5%) |
|
|
|
| |
Gecina S.A. REIT |
| 16,600 |
| 1,906 | |
Klepierre REIT |
| 62,926 |
| 5,907 | |
Silic REIT |
| 13,653 |
| 1,262 | |
Unibail REIT |
| 77,178 |
| 10,270 | |
|
|
|
| 19,345 | |
Germany (0.5%) |
|
|
|
| |
IVG Immobilien AG |
| 66,537 |
| 1,395 | |
Hong Kong (9.6%) |
|
|
|
| |
Cheung Kong Holdings Ltd. |
| 102,000 |
| 1,046 | |
GZI REIT |
| (a)963,000 |
| 428 | |
Henderson Land Development Co., Ltd. |
| 618,000 |
| 2,909 | |
Hong Kong Land Holdings Ltd. |
| 878,000 |
| 2,757 | |
Hysan Development Co., Ltd. |
| 741,760 |
| 1,837 | |
Kerry Properties Ltd. |
| 480,376 |
| 1,273 | |
Link REIT (The) |
| (a)732,000 |
| 1,388 | |
New World Development Ltd. |
| 2,649,000 |
| 3,639 | |
Sun Hung Kai Properties Ltd. |
| 856,000 |
| 8,335 | |
Swire Pacific Ltd., Class A |
| 88,000 |
| 790 | |
Wharf Holdings Ltd. |
| 54,000 |
| 191 | |
Wheelock & Co., Ltd. |
| 116,000 |
| 189 | |
|
|
|
| 24,782 | |
Italy (2.4%) |
|
|
|
| |
Beni Stabili S.p.A. |
| 6,458,327 |
| 6,227 | |
Japan (14.0%) |
|
|
|
| |
Aeon Mall Co., Ltd. |
| 22,000 |
| 1,073 | |
Diamond City Co., Ltd. |
| 11,000 |
| 450 | |
Heiwa Real Estate Co., Ltd. |
| 55,500 |
| 459 | |
Japan Real Estate Investment Corp. REIT |
| 54 |
| 445 | |
Japan Retail Fund Investment Corp. REIT |
| 4 |
| 31 | |
Mitsubishi Estate Co., Ltd. |
| 536,000 |
| 11,139 | |
Mitsui Fudosan Co., Ltd. |
| 472,000 |
| 9,589 | |
Nippon Building Fund, Inc. REIT |
| 53 |
| 447 | |
NTT Urban Development Corp. |
| 354 |
| 2,345 | |
Sumitomo Realty & Development Co., Ltd. |
| 336,000 |
| 7,310 | |
Tokyu Land Corp. |
| 293,000 |
| $ | 2,930 |
|
|
|
| 36,218 | |
Netherlands (8.3%) |
|
|
|
| |
Corio N.V. REIT |
| 68,873 |
| 3,742 | |
Eurocommercial Properties N.V. CVA REIT |
| 126,609 |
| 4,350 | |
Rodamco Europe N.V. REIT |
| 78,092 |
| 6,499 | |
Vastned Retail N.V. REIT |
| 32,967 |
| 2,098 | |
Wereldhave N.V. REIT |
| 51,076 |
| 4,816 | |
|
|
|
| 21,505 | |
Singapore (1.3%) |
|
|
|
| |
CapitaLand Ltd. |
| 534,000 |
| 1,105 | |
Fortune REIT |
| 373,000 |
| 274 | |
Keppel Land Ltd. |
| 92,000 |
| 202 | |
Singapore Land Ltd. |
| 65,000 |
| 209 | |
Suntec REIT |
| 636,000 |
| 413 | |
United Industrial Corp., Ltd. |
| 1,829,000 |
| 1,287 | |
|
|
|
| 3,490 | |
Spain (4.1%) |
|
|
|
| |
Fadesa Inmobiliaria S.A. |
| 39,835 |
| 1,313 | |
Inmobiliaria Colonial S.A. |
| 90,582 |
| 5,135 | |
Inmobiliaria Urbis S.A. |
| 130,613 |
| 2,398 | |
Metrovacesa S.A. |
| 28,670 |
| 1,741 | |
|
|
|
| 10,587 | |
Sweden (3.1%) |
|
|
|
| |
Castellum AB |
| 73,807 |
| 2,657 | |
Hufvudstaden AB, Class A |
| 824,833 |
| 5,399 | |
|
|
|
| 8,056 | |
Switzerland (1.5%) |
|
|
|
| |
Allreal Holding AG |
| 10,300 |
| 909 | |
PSP Swiss Property AG |
| (a)68,174 |
| 2,958 | |
|
|
|
| 3,867 | |
United Kingdom (34.2%) |
|
|
|
| |
British Land Co. plc |
| 962,360 |
| 17,651 | |
Brixton plc |
| 683,209 |
| 5,084 | |
Capital & Regional plc |
| 292,517 |
| 4,368 | |
Derwent Valley Holdings plc |
| 68,499 |
| 1,698 | |
Grainger Trust plc |
| 265,981 |
| 2,412 | |
Great Portland Estates plc |
| 24,720 |
| 183 | |
Hammerson plc |
| 504,420 |
| 8,870 | |
Land Securities Group plc |
| 760,946 |
| 21,773 | |
Liberty International plc |
| 540,507 |
| 9,118 | |
London Merchant Securities plc |
| 823,179 |
| 3,442 | |
Minerva plc |
| 725,155 |
| 3,415 | |
Shaftesbury plc |
| 165,626 |
| 1,317 | |
Slough Estates plc |
| 616,735 |
| 6,351 | |
Unite Group plc |
| 458,136 |
| 2,995 | |
|
|
|
| 88,677 | |
Total Common Stocks (Cost $234,666) |
|
|
| 253,382 | |
55 | The accompanying notes are an integral part of the financial statements. |
| 2005 Annual Report |
|
|
| December 31, 2005 |
Portfolio of Investments (cont’d)
International Real Estate Portfolio
|
| Face |
| Value |
| ||
Short-Term Investment (0.9%) |
|
|
|
|
| ||
Repurchase Agreement (0.9%) |
|
|
|
|
| ||
J.P. Morgan Securities, Inc., 4.05%, dated 12/30/05, due 1/3/06, repurchase price $2,325 (Cost $2,324) |
| $ | (f)2,324 |
| $ | 2,324 |
|
Total Investments (98.7%) (Cost $236,990) |
|
|
| 255,706 |
| ||
Other Assets in Excess of Liabilities (1.3%) |
|
|
| 3,479 |
| ||
Net Assets (100%) |
|
|
| $ | 259,185 |
| |
(a) | Non-income producing security. |
(f) | Represents the Portfolio’s undivided interest in a joint repurchase agreement which has a total value of $1,000,707,000. The repurchase agreement was fully collateralized by U.S. government agency securities at the date of this Portfolio of Investments as follows: Federal Farm Credit Bank: 2.00% to 7.35%, due 1/11/06 to 10/25/33; Federal Home Loan Mortgage Corp.: 1.88% to 7.22%, due 2/9/06 to 7/15/32; Federal National Mortgage Association: 2.50% to 7.25%, due 2/15/06 to 11/15/30, which had a total value of $1,020,741,791. The investment in the repurchase agreement is through participation in a joint account with affiliated parties pursuant to exemptive relief received by the Portfolio from the SEC. |
CVA | Certificaten Van Aandelen |
REIT | Real Estate Investment Trust |
Foreign Currency Exchange Contract Information: |
|
The Portfolio had the following foreign currency exchange contract(s) open at period end: |
Currency |
| Value |
| Settlement |
| In |
| Value |
| Net |
| ||||||||
HKD |
| 413 |
| $ | 53 |
| 1/3/06 |
| USD |
| 53 |
| $ | 53 |
| $ | @— |
|
|
JPY |
| 137,595 |
| 1,167 |
| 1/5/06 |
| USD |
| 1,165 |
| 1,165 |
| (2) |
|
| |||
USD |
| 2,692 |
| 2,692 |
| 1/3/06 |
| AUD |
| 3,685 |
| 2,703 |
| 11 |
|
| |||
USD |
| 108 |
| 108 |
| 1/4/06 |
| JPY |
| 12,697 |
| 108 |
| @— |
|
| |||
|
|
|
| $ | 4,020 |
|
|
|
|
|
|
| $ | 4,029 |
| $ | 9 |
|
|
|
|
|
|
|
|
|
|
|
|
|
|
|
|
|
|
| |||
AUD | — | Australian Dollar |
HKD | — | Hong Kong Dollar |
JPY | — | Japanese Yen |
USD | — | United States Dollar |
@ | — | Amount is less than $500. |
The accompanying notes are an integral part of the financial statements.
56
2005 Annual Report | |
|
|
December 31, 2005 | |
Investment Overview
International Small Cap Portfolio
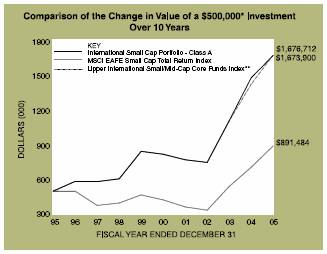
* | Minimum Investment |
** | The Lipper International Small/Mid-Cap Core Funds Index commenced operations on March 31, 2002. Performance data prior to December 31, 2002 is from the Lipper International Small Cap Index. |
In accordance with SEC regulations, Portfolio performance shown assumes that all recurring fees (including management fees) were deducted and all dividends and distributions were reinvested.
Performance Compared to the Morgan Stanley Capital International (MSCI) EAFE Small Cap Total Return Index(1) and the Lipper International Small/Mid-Cap Core Funds Index(2)
|
| Total Returns(4) |
| ||||||
|
|
|
| Average Annual |
| ||||
|
| One |
| Five |
| Ten |
| Since |
|
Portfolio – Class A (5) |
| 13.07 | % | 15.38 | % | 12.84 | % | 13.64 | % |
MSCI EAFE Small Cap Total Return Index |
| 26.19 |
| 16.04 |
| 5.95 |
| 7.57 |
|
Lipper International Small/Mid-Cap Core Funds |
| 17.65 |
| 13.45 |
| 11.95 |
| — |
|
(1) | The MSCI EAFE Small Cap Total Return Index is an unmanaged, market value weighted average of the performance of over 900 securities of companies listed on the stock exchanges of countries in Europe, Australasia and the Far East, including price performance and income from dividend payments. |
(2) | The Lipper International Small/Mid-Cap Core Funds Index is an equally weighted performance index of the largest qualifying funds (based on net assets) in the Lipper International Small/Mid-Cap Core Funds classification. The Index, which is adjusted for capital gains distributions and income dividends, is unmanaged and should not be considered an investment. There are currently 10 funds represented in this Index. As of the date of this report, the Portfolio is in the Lipper International Small/Mid-Cap Core Funds classification. |
(3) | The Lipper International Small/Mid-Cap Core Funds Index commenced operations on March 31, 2002. Performance data prior to December 31, 2002 is from the Lipper International Small Cap Index. |
(4) | Total returns for the Portfolio reflect fees waived and expenses reimbursed, if applicable, by the Adviser. Without such waivers and reimbursements, total returns would have been lower. Fee waivers and/or expense reimbursements are voluntary and the Adviser reserves the right to commence or terminate any waiver and/or reimbursement at any time. |
(5) | Commenced operations on December 15, 1992 |
(6) | For comparative purposes, average annual since inception returns listed for the Indexes refer to the inception date or initial offering of the respective share class of the Portfolio, not the inception of the Index. |
Performance data quoted represents past performance, which is no guarantee of future results, and current performance may be lower or higher than the figures shown. Performance assumes that all dividends and distributions, if any, were reinvested. For the most recent month-end performance figures, please visit morganstanley.com/im. Investment return and principal value will fluctuate so that Portfolio shares, when redeemed, may be worth more or less than their original cost. Total returns do not reflect the deduction of taxes that a shareholder would pay on Portfolio distributions or the redemption of Portfolio shares.
The International Small Cap Portfolio seeks long-term capital appreciation by investing primarily in equity securities of small non-U.S. companies. Investments in small sized corporations are more vulnerable to financial risks and other risks than larger corporations and may involve a higher degree of price volatility than investments in the general equity markets. Foreign investing involves certain risks, including currency fluctuations and controls, restrictions on foreign investments, less governmental supervision and regulation, less liquidity and the potential for market volatility and political instability.
Performance
For the year ended December 31, 2005, the Portfolio had a total return of 13.07%, net of fees, compared to 26.19% for the Morgan Stanley Capital International (MSCI) EAFE Small Cap Total Return Index (the “Index”).
Factors Affecting Performance
• During the first six months of 2005, international small capitalization equity markets were relatively subdued amid questions about the strength of economic activity due to higher oil prices, weaker consumer confidence and the sustainability of corporate earnings. However, in the third quarter, the Japanese equity market ignited on the back of better perceived economic activity and Prime Minister Koizumi’s re-election, and helped to drive considerably stronger returns for the second half of the year.
• The United Kingdom lagged most European markets as rising interest rates dampened consumer spending and economic activity slowed. The Nordic region rose 31.3%, benefiting from rising oil prices.
• One of the bigger surprises in 2005 was that the U.S. dollar strengthened 15.2% against both the Euro and the Japanese yen, and 11.8% against the British sterling
57
| 2005 Annual Report |
|
|
| December 31, 2005 |
Investment Overview (cont’d)
International Small Cap Portfolio
due to a number of factors, including increasing U.S. interest rates. For a non-U.S. investor, the Index rose 42.6% in local currency terms in 2005.
• Nine of the 10 sectors within the Index posted double-digit returns for the year. Against the backdrop of higher economic activity, cyclical sectors (energy, industrials, materials and financials) led as investors favored earnings momentum. Telecommunications significantly lagged other sectors as small-cap companies suffered along with their large-cap counterparts.
• Portfolio performance suffered due to our more cautious outlook, particularly during the second half of the period. While we are bottom-up investors and base our stock selection on fundamental research, our analysis of cash flow and earnings incorporate our perspective on the macro environment. Our view was that economic growth would likely slow. Accordingly, in 2004 and into 2005, we sold holdings geared to economic activity as they reached fair value targets. We found new value in sectors which were less economically sensitive but typically cash generative, such as consumer staples and lower-beta industrials stocks. However, these stocks were largely ignored by the market in 2005. Additionally, we underestimated the scale of operating leverage in some cyclical stocks.
• From an attribution standpoint, weak stock selection in the industrials (specifically, Japanese and Swiss), consumer discretionary and materials areas hindered performance relative to the Index. The Portfolio’s underweight to the energy sector was also a significant detractor from relative performance.
• Stock selection in information technology and consumer staples added value. Ignored by the market over several years, both sectors presented new investment opportunities which were rewarded during the period.
Management Strategies
• The Portfolio’s weighting in information technology increased from 7.8% to 13.4% over the year. The increase was due to the addition of new ideas, such as Dutch information technology service companies, as well as to good performance from several different companies in hardware, semi-conductors and software. Consumer staples also increased from 11.3% to 15.4%. The increase was driven both by the addition of new holdings (especially in the United Kingdom food area) as well as by good performance of existing holdings with dominant presences in niche markets.
• The Portfolio reflects a preference for defensive companies, with lower valuations, better balance sheets and strong franchises.
Expense Examples
As a shareholder of the Portfolio, you may incur two types of costs: (1) transactional costs, including redemption fees; (2) ongoing costs, including management fees and other Portfolio expenses. These examples are intended to help you understand your ongoing costs (in dollars) of investing in the Portfolio and to compare these costs with the ongoing costs of investing in other mutual funds.
The examples are based on an investment of $1,000 invested at the beginning of the six-month period ended December 31, 2005 and held for the entire six-month period.
Actual Expenses
The first line of the tables below provides information about actual account values and actual expenses. You may use the information in this line, together with the amount you invested, to estimate the expenses that you paid over the period. Simply divide your account value by $1,000 (for example, an $8,600 account value divided by $1,000 = 8.6), then multiply the result by the number in the first line under the heading entitled ���Expenses Paid During Period” to estimate the expenses you paid on your account during this period.
Hypothetical Example for Comparison Purposes
The second line of the tables below provides information about hypothetical account values and hypothetical expenses based on the Portfolio’s actual expense ratio and an assumed rate of return of 5% per year before expenses, which is not the Portfolio’s actual return. The hypothetical account values and expenses may not be used to estimate the actual ending account balance or expenses you paid for the period. You may use this information to compare the ongoing costs of investing in the Portfolio and other funds. To do so, compare this 5% hypothetical example with the 5% hypothetical examples that appear in the shareholder reports of the other funds.
Please note that the expenses shown in the table are meant to highlight your ongoing costs only and do not reflect any transactional costs, such as redemption fees. Therefore, the second line of the table is useful in comparing ongoing costs only, and will not help you determine the relative total costs of owning different funds. In addition, if these transactional costs were included, your costs would have been higher.
58
2005 Annual Report | |
|
|
December 31, 2005 | |
Investment Overview (cont’d)
International Small Cap Portfolio
|
| Beginning |
| Ending Account |
| Expenses Paid |
| ||
Class A |
|
|
|
|
|
|
| ||
Actual |
| $1,000.00 |
|
| $1,105.20 |
| $5.78 |
|
|
Hypothetical (5% average annual return before expenses) |
| 1,000.00 |
|
| 1,019.71 |
| 5.55 |
|
|
* Expenses are equal to Class A annualized net expense ratios of 1.09%, multiplied by the average account value over the period, multiplied by 184/365 (to reflect the one-half year period). |
| ||||||||
Graphic Presentation of Portfolio Holdings
The following graph depicts the Portfolio’s holdings by industry and/or security type, as a percentage of total investments.
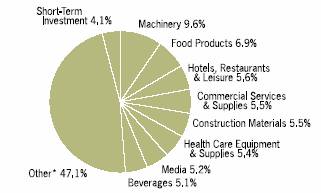
* Industries which do not appear in the above graph, as well as those which represent less than 5% of total investments, if applicable, are included in the category labeled “Other”.
January 2006
59
| 2005 Annual Report |
|
|
| December 31, 2005 |
Portfolio of Investments
International Small Cap Portfolio
|
|
|
| Value |
| |
|
| Shares |
| (000) |
| |
Common Stocks (96.4%) |
|
|
|
|
| |
Australia (4.0%) |
|
|
|
|
| |
Goodman Fielder Ltd. |
| (a)4,261,900 |
| $ | 6,532 |
|
Infomedia Ltd. |
| 13,617,249 |
| 5,193 |
| |
John Fairfax Holdings Ltd. |
| 3,959,671 |
| 11,644 |
| |
MYOB Ltd. |
| 11,195,394 |
| 8,744 |
| |
Pacific Brands Ltd. |
| 6,005,241 |
| 11,714 |
| |
Ramsay Health Care Ltd. |
| 1,639,126 |
| 11,420 |
| |
|
|
|
| 55,247 |
| |
Belgium (1.9%) |
|
|
|
|
| |
Elia System Operator S.A./N.V. |
| (a)98,559 |
| 3,675 |
| |
Omega Pharma S.A. |
| 430,737 |
| 22,442 |
| |
|
|
|
| 26,117 |
| |
Bermuda (1.0%) |
|
|
|
|
| |
Catlin Group Ltd. |
| 1,738,412 |
| 14,536 |
| |
Denmark (2.2%) |
|
|
|
|
| |
Carlsberg A/S, Class B |
| 253,150 |
| 13,578 |
| |
Danisco A/S |
| 226,155 |
| 17,315 |
| |
|
|
|
| 30,893 |
| |
Finland (1.2%) |
|
|
|
|
| |
Ramirent Oyj |
| 225,146 |
| 6,624 |
| |
Uponor Oyj |
| 439,902 |
| 9,374 |
| |
|
|
|
| 15,998 |
| |
France (6.7%) |
|
|
|
|
| |
Autoroutes du Sud de la France |
| 56,362 |
| 3,336 |
| |
Bull S.A. |
| (a)1,122,466 |
| 13,022 |
| |
Europeenne D’extincteurs |
| (a)(d)(m)(l)131,043 |
| @— |
| |
GL Trade S.A. |
| 189,611 |
| 8,530 |
| |
Ipsen S.A. |
| (a)377,601 |
| 10,693 |
| |
Neopost S.A. |
| 154,985 |
| 15,541 |
| |
Nexans S.A. |
| 149,597 |
| 7,107 |
| |
NRJ Group |
| 557,031 |
| 13,637 |
| |
Saft Groupe S.A. |
| (a)459,971 |
| 10,341 |
| |
Zodiac S.A. |
| (a)158,603 |
| 10,186 |
| |
|
|
|
| 92,393 |
| |
Germany (5.4%) |
|
|
|
|
| |
Celesio AG |
| 80,179 |
| 6,897 |
| |
GFK AG |
| 404,873 |
| 13,564 |
| |
Hugo Boss AG (Non-Voting Shares) |
| 319,223 |
| 11,224 |
| |
K&S AG |
| 218,180 |
| 13,186 |
| |
Sartorius AG (Non-Voting Shares) |
| 318,545 |
| 7,712 |
| |
SCS Standard Computersysteme AG |
| (a)(d)(m)(l)21,289 |
| @— |
| |
Techem AG |
| (a)510,737 |
| 22,916 |
| |
|
|
|
| 75,499 |
| |
Hong Kong (1.4%) |
|
|
|
|
| |
Asia Satellite Telecommunications Holdings Ltd. |
| 2,268,500 |
| 4,023 |
| |
Solomon Systech International Ltd. |
| 22,895,900 |
| 9,523 |
| |
Weichai Power Co., Ltd., Class H |
| 3,696,400 |
| 6,245 |
| |
|
|
|
| 19,791 |
| |
Ireland (3.2%) |
|
|
|
|
| |
C&C Group plc |
| 2,588,489 |
| 16,548 |
| |
Kerry Group plc, Class A |
| 1,281,655 |
| $ | 28,388 |
|
|
|
|
| 44,936 |
| |
Italy (4.9%) |
|
|
|
|
| |
Banca Italease S.p.A. |
| (a)170,521 |
| 4,346 |
| |
Buzzi Unicem S.p.A. |
| 1,056,355 |
| 16,533 |
| |
Cassa di Risparmio di Firenze S.p.A. |
| 3,796,217 |
| 11,235 |
| |
Davide Campari-Milano S.p.A. |
| 2,397,921 |
| 17,742 |
| |
Interpump S.p.A. |
| 590,809 |
| 3,843 |
| |
SAES Getters S.p.A. |
| 408,932 |
| 9,731 |
| |
Sogefi S.p.A. |
| 748,686 |
| 4,104 |
| |
|
|
|
| 67,534 |
| |
Japan (29.9%) |
|
|
|
|
| |
Aplus Co., Ltd. |
| (a)4,973,800 |
| 29,616 |
| |
Ariake Japan Co., Ltd. |
| 1,509,200 |
| 37,188 |
| |
Asia Securities Printing Co., Ltd. |
| 551,500 |
| 9,987 |
| |
Century Leasing System, Inc. |
| 180,200 |
| 3,164 |
| |
Fuyo General Lease Co., Ltd |
| 115,000 |
| 5,365 |
| |
HS Securities Co., Ltd. |
| 437,900 |
| 13,780 |
| |
Hurxley Corp. |
| 357,737 |
| 6,035 |
| |
Ito En Ltd. |
| 174,700 |
| 10,462 |
| |
Japan Securities Finance Co., Ltd. |
| 1,552,000 |
| 17,877 |
| |
Keisei Electric Railway Co., Ltd. |
| 915,000 |
| 6,248 |
| |
Mabuchi Motor Co., Ltd. |
| 253,400 |
| 14,078 |
| |
Megane TOP Co., Ltd. |
| 110,100 |
| 793 |
| |
Milbon Co., Ltd. |
| 187,200 |
| 6,018 |
| |
Nakanishi, Inc. |
| 204,100 |
| 22,852 |
| |
Nihon Trim Co., Ltd. |
| 160,800 |
| 8,866 |
| |
Nippon Restaurant System, Inc. |
| 433,300 |
| 17,274 |
| |
Nissha Printing Co., Ltd. |
| 225,000 |
| 6,527 |
| |
Nisshin Fire & Marine Insurance Co., Ltd. (The) |
| 3,265,200 |
| 13,100 |
| |
Patlite Corp. |
| 269,800 |
| 3,325 |
| |
Patlite Corp. (When Issued) |
| (a)290,400 |
| 3,579 |
| |
Rengo Co., Ltd. |
| 1,138,000 |
| 6,892 |
| |
Sanyo Electric Credit Co., Ltd. |
| 932,200 |
| 19,017 |
| |
Shinkawa Ltd. |
| 853,900 |
| 21,801 |
| |
Sumitomo Osaka Cement Co., Ltd. |
| 10,654,000 |
| 31,087 |
| |
Taiheiyo Cement Corp. |
| 7,249,000 |
| 29,452 |
| |
Taisei Lamick Co., Ltd. |
| 245,200 |
| 7,030 |
| |
Takuma Co., Ltd. |
| 1,562,000 |
| 10,440 |
| |
Toppan Forms Co., Ltd. |
| 758,300 |
| 10,928 |
| |
Union Tool Co. |
| 209,200 |
| 9,919 |
| |
Yamaichi Electronics Co., Ltd. |
| 637,500 |
| 10,452 |
| |
Yomiuri Land Co., Ltd. |
| 970,000 |
| 8,442 |
| |
Zentek Technology Japan, Inc. |
| (a)1,708 |
| 13,618 |
| |
|
|
|
| 415,212 |
| |
Netherlands (2.4%) |
|
|
|
|
| |
Getronics N.V. |
| 1,410,697 |
| 18,972 |
| |
Ordina N.V. |
| 394,522 |
| 6,768 |
| |
Van Lanschot N.V. CVA |
| 102,752 |
| 7,894 |
| |
|
|
|
| 33,634 |
| |
New Zealand (4.2%) |
|
|
|
|
| |
Fisher & Paykel Appliances Holdings Ltd. |
| 3,630,872 |
| 8,604 |
| |
Fisher & Paykel Healthcare Corp., Ltd. |
| 8,186,693 |
| 21,245 |
| |
Sky City Entertainment Group Ltd. |
| 3,404,081 |
| 10,903 |
| |
The accompanying notes are an integral part of the financial statements. | 60 |
2005 Annual Report | |
|
|
December 31, 2005 | |
Portfolio of Investments (cont’d)
International Small Cap Portfolio
|
|
|
| Value |
| |
|
| Shares |
| (000) |
| |
New Zealand (cont’d) |
|
|
|
|
| |
Warehouse Group Ltd. |
| 7,297,914 |
| $ | 17,692 |
|
|
|
|
| 58,444 |
| |
Norway (3.6%) |
|
|
|
|
| |
Schibsted ASA |
| 1,039,779 |
| 30,965 |
| |
Veidekke ASA |
| 241,529 |
| 6,889 |
| |
Visma ASA |
| 835,830 |
| 12,384 |
| |
|
|
|
| 50,238 |
| |
South Korea (1.5%) |
|
|
|
|
| |
KT&G Corp. |
| (a)453,480 |
| 20,277 |
| |
Spain (0.7%) |
|
|
|
|
| |
Miquel y Costas & Miquel S.A. |
| 339,759 |
| 9,674 |
| |
Sweden (2.7%) |
|
|
|
|
| |
Gunnebo AB |
| 579,915 |
| 5,730 |
| |
Saab AB, Class B |
| 812,490 |
| 17,386 |
| |
Swedish Match AB |
| 1,191,450 |
| 14,023 |
| |
|
|
|
| 37,139 |
| |
Switzerland (6.5%) |
|
|
|
|
| |
Bucher Industries AG |
| 172,592 |
| 13,765 |
| |
Edipresse S.A. (Bearer), Class B |
| 27,133 |
| 11,109 |
| |
Galenica Holding AG (Registered) |
| (a)61,957 |
| 11,081 |
| |
Kaba Holding AG, Class B (Registered) |
| (a)37,149 |
| 9,103 |
| |
Schindler Holding AG |
| 60,811 |
| 24,112 |
| |
Sia Abrasives Holding AG |
| 30,551 |
| 7,905 |
| |
SIG Holding AG (Registered) |
| 33,065 |
| 7,222 |
| |
Zehnder Group AG, Class B |
| 5,162 |
| 6,089 |
| |
|
|
|
| 90,386 |
| |
United Kingdom (13.0%) |
|
|
|
|
| |
Britvic plc |
| (a)3,009,205 |
| 12,762 |
| |
Cattles plc |
| 2,486,444 |
| 14,085 |
| |
De La Rue plc |
| 978,887 |
| 7,874 |
| |
Devro plc |
| 3,385,560 |
| 7,471 |
| |
FKI plc |
| 7,924,745 |
| 15,817 |
| |
GCAP Media plc |
| 973,982 |
| 4,877 |
| |
Keller Group plc |
| 1,204,909 |
| 8,888 |
| |
Luminar plc |
| 2,636,972 |
| 22,005 |
| |
RHM plc |
| 1,453,696 |
| 6,641 |
| |
Rotork plc |
| 1,603,277 |
| 18,454 |
| |
Spirax-Sarco Engineering plc |
| 1,195,781 |
| 18,157 |
| |
SSL International plc |
| 1,601,607 |
| 8,418 |
| |
Stagecoach Group plc |
| 3,240,382 |
| 6,439 |
| |
William Hill plc |
| 1,397,005 |
| 12,871 |
| |
Wincanton plc |
| 2,778,554 |
| 16,254 |
| |
|
|
|
| 181,013 |
| |
Total Common Stocks (Cost $1,051,138) |
|
|
| 1,338,961 |
| |
|
| Face |
|
|
| ||
Short-Term Investment (4.2%) |
|
|
|
|
| ||
Repurchase Agreement (4.2%) |
|
|
|
|
| ||
J.P. Morgan Securities, Inc., 4.05%, dated 12/30/05, due 1/3/06, repurchase price $57,810 (Cost $57,784) |
| $ | (f)57,784 |
| 57,784 |
| |
Total Investments (100.6%) (Cost $1,108,922) |
|
|
| $ | 1,396,745 |
| |
Liabilities in Excess of Other Assets (-0.6%) |
|
|
| (7,667) |
| ||
Net Assets (100%) |
|
|
| $ | 1,389,078 |
| |
(a) | Non-income producing security. |
(d) | Security was valued at fair value — At December 31, 2005, the Portfolio held fair valued securities, totaling less than $500, representing less than 0.05%of net assets. |
(f) | Represents the Portfolio’s undivided interest in a joint repurchase agreement which has a total value of $1,000,707,000. The repurchase agreement was fully collateralized by U.S. government agency securities at the date of this Portfolio of Investments as follows: Federal Farm Credit Bank: 2.00%to 7.35%, due 1/11/06 to 10/25/33; Federal Home Loan Mortgage Corp.: 1.88%to 7.22%, due 2/9/06 to 7/15/32; Federal National Mortgage Association: 2.50%to 7.25%, due 2/15/06 to 11/15/30, which had a total value of $1,020,741,791. The investment in the repurchase agreement is through participation in a joint account with affiliated parties pursuant to exemptive relief received by the Portfolio from the SEC. |
(l) | Security has been deemed illiquid - at December 31, 2005. |
(m) | Restricted security not registered under the Securities Act of 1933. Europeenne D’extincteurs was acquired 6/96 - 12/99 and has a current cost basis of $6,648,000. SCS Standard Computersysteme AG was acquired 4/04 and has a current cost basis of $0. At December 31, 2005, these securities had an aggregate market value of $0, representing0.0%of net assets. |
@ | Face Amount/Value is less than $500. |
CVA | Certificaten Van Aandelen |
Foreign Currency Exchange Contract Information: |
|
The Portfolio had the following foreign currency exchange contract(s) open at period end: |
Currency |
| Value |
| Settlement |
| In |
| Value |
| Net |
| ||||||||
CHF |
| 508 |
| $ | 387 |
| 1/3/06 |
| USD |
| 386 |
| $ | 386 |
| $ | (1) |
|
|
EUR |
| 19 |
| 23 |
| 1/3/06 |
| USD |
| 23 |
| 23 |
| @— |
|
| |||
EUR |
| 187 |
| 221 |
| 1/3/06 |
| USD |
| 221 |
| 221 |
| @— |
|
| |||
GBP |
| 113 |
| 195 |
| 1/4/06 |
| USD |
| 195 |
| 195 |
| @— |
|
| |||
USD |
| 37 |
| 37 |
| 1/4/06 |
| JPY |
| 4,331 |
| 37 |
| @— |
|
| |||
USD |
| 1,078 |
| 1,078 |
| 1/5/06 |
| JPY |
| 126,707 |
| 1,075 |
| (3) |
|
| |||
|
|
|
| $ | 1,941 |
|
|
|
|
|
|
| $ | 1,937 |
| $ | (4) |
|
|
CHF | — | Swiss Franc |
EUR | — | Euro |
GBP | — | British Pound |
JPY | — | Japanese Yen |
USD | — | United States Dollar |
61 | The accompanying notes are an integral part of the financial statements. |
| 2005 Annual Report |
|
|
| December 31, 2005 |
Investment Overview
Focus Equity Portfolio
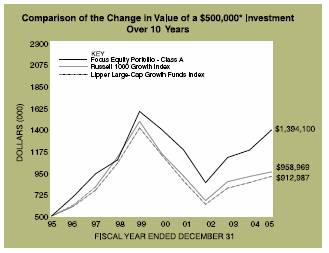
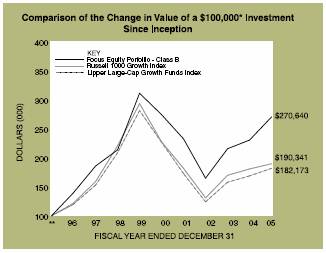
* Minimum Investment
** Commenced offering on January 2, 1996
In accordance with SEC regulations, Portfolio performance shown assumes that all recurring fees (including management fees) were deducted and all dividends and distributions were reinvested.
Performance Compared to the Russell 1000 Growth Index(1) and the Lipper Large-Cap Growth Funds Index(2)
|
| Total Returns(3) |
| ||||||
|
|
|
| Average Annual |
| ||||
|
| One |
| Five |
| Ten |
| Since |
|
Portfolio – Class A (4) |
| 17.60 | % | (0.09) | % | 10.80 | % | 13.51 | % |
Russell 1000 Growth Index |
| 5.26 |
| (3.58) |
| 6.73 |
| 8.77 |
|
Lipper Large-Cap Growth Funds Index |
| 7.58 |
| (4.29) |
| 6.21 |
| 8.32 |
|
Portfolio – Class B (5) |
| 17.30 |
| (0.34) |
| — |
| 10.47 |
|
Russell 1000 Growth Index |
| 5.26 |
| (3.58) |
| — |
| 6.65 |
|
Lipper Large-Cap Growth Funds Index |
| 7.58 |
| (4.29) |
| — |
| 6.18 |
|
(1) | The Russell 1000 Growth Index measures the performance of those Russell 1000 companies with higher price-to-book ratios and higher forecasted growth values. The Russell 1000 Index measures the performance of the 1,000 largest companies in the Russell 3000 Index. The Russell 3000 Index measures the performance of the 3,000 largest U.S. companies based on total market capitalization. |
(2) | The Lipper Large-Cap Growth Funds Index is an equally weighted performance index of the largest qualifying funds (based on net assets) in the Lipper Large-Cap Growth Funds classification. The Index, which is adjusted for capital gains distributions and income dividends, is unmanaged and should not be considered an investment. There are currently 30 funds represented in this Index. As of the date of this report, the Portfolio is in the Lipper Large-Cap Growth Funds classification. |
(3) | Total returns for the Portfolio reflect fees waived and expenses reimbursed, if applicable, by the Adviser. Without such waivers and reimbursements, total returns would have been lower. Fee waivers and/or expense reimbursements are voluntary and the Adviser reserves the right to commence or terminate any waiver and/or reimbursement at any time. |
(4) | Commenced operations on March 8, 1995 |
(5) | Commenced offering on January 2, 1996 |
(6) | For comparative purposes, average annual since inception returns listed for the Indexes refer to the inception date or initial offering of the respective share class of the Portfolio, not the inception of the Index. |
Performance data quoted represents past performance, which is no guarantee of future results, and current performance may be lower or higher than the figures shown. Performance assumes that all dividends and distributions, if any, were reinvested. For the most recent month-end performance figures, please visit morganstanley.com/im. Investment return and principal value will fluctuate so that Portfolio shares, when redeemed, may be worth more or less than their original cost. Total returns do not reflect the deduction of taxes that a shareholder would pay on Portfolio distributions or the redemption of Portfolio shares.
The Focus Equity Portfolio seeks capital appreciation by investing primarily in growth-oriented equity securities of large capitalization companies. The Portfolio’s concentration of its assets in a small number of issuers will subject it to greater risks.
Performance
For the year ended December 31, 2005, the Portfolio’s Class A shares had a total return of 17.60%, net of fees, and 17.30% for the Class B shares, net of fees, compared to 5.26% for the Russell 1000 Growth Index (the “Index”).
62
2005 Annual Report | |
|
|
December 31, 2005 | |
Investment Overview (cont’d)
Focus Equity Portfolio
Factors Affecting Performance
• Stock selection drove the Portfolio’s outperformance of the Index, more than offsetting the modest impact of less favorable sector allocations.
• Areas of particular strength included energy, healthcare and utilities. The Portfolio was well served by its overweighting in the energy sector relative to the Index. Moreover, the Portfolio’s crude oil producer exposure was a boon to performance. Within the healthcare sector, stock selection in the medical and dental instruments and supplies, biotechnology research and production, and healthcare management services companies were positive factors. In utilities, gas distributors and wireless companies benefited relative performance as well.
• Consumer staples positioning represented the Portfolio’s main area of weakness. An underweight in drug and grocery store chains detracted, as did an avoidance of the soft drink industry and household chemical industry.
• Technology exposure also limited the Portfolio’s pace. Here, stock selection in communications technology and computer technology companies hindered performance.
Management Strategies
• As of year-end, consumer discretionary represents the largest sector weight in the Portfolio, followed by healthcare and technology. The Portfolio’s consumer discretionary exposure is overweighted relative to the Index, while healthcare and technology are both underweighted.
• It is our goal to hold a portfolio of high quality growth stocks we believe will perform well regardless of the market environment. We continue to favor companies that have some uniqueness or dynamic competitive advantage in their business model, with a high quality stream of cash flow and the ability to re-deploy capital at a high rate of return.
Expense Examples
As a shareholder of the Portfolio, you may incur two types of costs: (1) transactional costs, including redemption fees; (2) ongoing costs, including management fees, distribution (12b-1) fees (in the case of Class B); and other Portfolio expenses. These examples are intended to help you understand your ongoing costs (in dollars) of investing in the Portfolio and to compare these costs with the ongoing costs of investing in other mutual funds.
The examples are based on an investment of $1,000 invested at the beginning of the six-month period ended December 31, 2005 and held for the entire six-month period.
Actual Expenses
The first line of the tables below provides information about actual account values and actual expenses. You may use the information in this line, together with the amount you invested, to estimate the expenses that you paid over the period. Simply divide your account value by $1,000 (for example, an $8,600 account value divided by $1,000 = 8.6), then multiply the result by the number in the first line under the heading entitled “Expenses Paid During Period” to estimate the expenses you paid on your account during this period.
Hypothetical Example for Comparison Purposes
The second line of the tables below provides information about hypothetical account values and hypothetical expenses based on the Portfolio’s actual expense ratio and an assumed rate of return of 5% per year before expenses, which is not the Portfolio’s actual return. The hypothetical account values and expenses may not be used to estimate the actual ending account balance or expenses you paid for the period. You may use this information to compare the ongoing costs of investing in the Portfolio and other funds. To do so, compare this 5% hypothetical example with the 5% hypothetical examples that appear in the shareholder reports of the other funds.
Please note that the expenses shown in the table are meant to highlight your ongoing costs only and do not reflect any transactional costs, such as redemption fees. Therefore, the second line of the table is useful in comparing ongoing costs only, and will not help you determine the relative total costs of owning different funds. In addition, if these transactional costs were included, your costs would have been higher.
|
| Beginning |
| Ending Account |
| Expenses Paid |
| |||||
Class A |
|
|
|
|
|
|
| |||||
Actual |
| $ | 1,000.00 |
|
| $ | 1,161.20 |
| $ | 4.47 |
|
|
Hypothetical (5% average |
| 1,000.00 |
|
| 1,021.07 |
| 4.18 |
|
| |||
|
|
|
|
|
|
|
|
|
| |||
Class B |
|
|
|
|
|
|
|
|
| |||
Actual |
| 1,000.00 |
|
| 1,159.90 |
| 5.88 |
|
| |||
Hypothetical (5% average |
| 1,000.00 |
|
| 1,019.76 |
| 5.50 |
|
| |||
|
|
|
|
|
|
|
|
|
| |||
* Expenses are equal to Class A and Class B annualized net expense ratios of 0.82% and 1.08%, respectively, multiplied by the average account value over the period, multiplied by 184/365 (to reflect the one-half year period). | ||||||||||||
63
| 2005 Annual Report |
|
|
| December 31, 2005 |
Investment Overview (cont’d)
Focus Equity Portfolio
Graphic Presentation of Portfolio Holdings
The following graph depicts the Portfolio’s holdings by industry and/or security type, as a percentage of total investments.
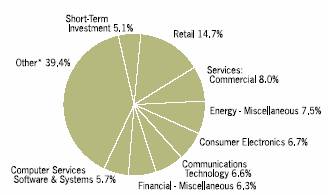
* | Industries which do not appear in the above graph, as well as those which represent less than 5% of total investments, if applicable, are included in the category labeled “Other”. |
January 2006
64
2005 Annual Report | |
|
|
December 31, 2005 | |
Portfolio of Investments
Focus Equity Portfolio
|
|
|
| Value |
| |
|
| Shares |
| (000) |
| |
Common Stocks (94.5%) |
|
|
|
|
| |
Advertising Agencies (4.3%) |
|
|
|
|
| |
Getty Images, Inc. |
| (a)17,454 |
| $ | 1,558 |
|
Monster Worldwide, Inc. |
| (a)31,400 |
| 1,282 |
| |
|
|
|
| 2,840 |
| |
Biotechnology Research & Production (2.4%) |
|
|
|
|
| |
Genentech, Inc. |
| (a)17,000 |
| 1,573 |
| |
Casinos & Gambling (2.7%) |
|
|
|
|
| |
International Game Technology |
| 58,100 |
| 1,788 |
| |
Communications Technology (6.6%) |
|
|
|
|
| |
America Movil S.A. de C.V., Class L ADR |
| 109,300 |
| 3,198 |
| |
Crown Castle International Corp. |
| (a)45,337 |
| 1,220 |
| |
|
|
|
| 4,418 |
| |
Computer Services Software & Systems (5.7%) |
|
|
|
|
| |
Google, Inc., Class A |
| (a)9,125 |
| 3,786 |
| |
Computer Technology (2.7%) |
|
|
|
|
| |
Dell, Inc. |
| (a)61,225 |
| 1,836 |
| |
Consumer Electronics (6.6%) |
|
|
|
|
| |
Electronic Arts, Inc. |
| (a)37,800 |
| 1,977 |
| |
Yahoo!, Inc. |
| (a)62,540 |
| 2,451 |
| |
|
|
|
| 4,428 |
| |
Diversified Financial Services (3.6%) |
|
|
|
|
| |
Brookfield Asset Management, Inc., Class A |
| 47,400 |
| 2,386 |
| |
Education Services (2.4%) |
|
|
|
|
| |
Apollo Group, Inc., Class A |
| (a)26,500 |
| 1,602 |
| |
Electronics: Semi-Conductors/Components (1.9%) |
|
|
|
|
| |
Marvell Technology Group Ltd. |
| (a)22,700 |
| 1,273 |
| |
Energy — Miscellaneous (7.4%) |
|
|
|
|
| |
Ultra Petroleum Corp. |
| (a)89,140 |
| 4,974 |
| |
Financial — Miscellaneous (6.3%) |
|
|
|
|
| |
Berkshire Hathaway, Inc., Class B |
| (a)886 |
| 2,601 |
| |
Chicago Mercantile Exchange Holdings, Inc. |
| 4,300 |
| 1,580 |
| |
|
|
|
| 4,181 |
| |
Health Care — Miscellaneous (1.7%) |
|
|
|
|
| |
Alcon, Inc. |
| 8,900 |
| 1,153 |
| |
Health Care Services (3.4%) |
|
|
|
|
| |
UnitedHealth Group, Inc. |
| 37,100 |
| 2,305 |
| |
Leisure Time (3.2%) |
|
|
|
|
| |
Carnival Corp. |
| 39,400 |
| 2,107 |
| |
Materials & Processing (4.7%) |
|
|
|
|
| |
Monsanto Co. |
| 40,880 |
| 3,169 |
| |
Recreational Vehicles & Boats (2.6%) |
|
|
|
|
| |
Harley-Davidson, Inc. |
| 33,900 |
| 1,746 |
| |
Retail (14.7%) |
|
|
|
|
| |
Amazon.Com, Inc. |
| (a)46,700 |
| 2,202 |
| |
Costco Wholesale Corp. |
| 61,000 |
| 3,018 |
| |
Home Depot, Inc. |
| 48,028 |
| 1,944 |
| |
Sears Holdings Corp. |
| (a)22,700 |
| 2,622 |
| |
|
|
|
| 9,786 |
| |
Services: Commercial (7.9%) |
|
|
|
|
| |
Corporate Executive Board Co. |
| 18,800 |
| 1,687 |
| |
eBay, Inc. |
| (a)83,705 |
| 3,620 |
| |
|
|
|
| 5,307 |
| |
Shipping(1.8%) |
|
|
|
|
| |
C.H. Robinson Worldwide, Inc. |
| 31,700 |
| $ | 1,174 |
|
Utilities: Gas Pipelines (1.9%) |
|
|
|
|
| |
Questar Corp. |
| 16,400 |
| 1,241 |
| |
Total Common Stocks (Cost $51,362) |
|
|
| 63,073 |
| |
|
| Face |
|
|
| ||
Short-Term Investment (5.1%) |
|
|
|
|
| ||
Repurchase Agreement (5.1%) |
|
|
|
|
| ||
J.P. Morgan Securities, Inc., 4.05%, dated 12/30/05, due 1/3/06, repurchase price $3,401 (Cost $3,399) |
| $ | (f)3,399 |
| 3,399 |
| |
Total Investments (99.6%) (Cost $54,761) |
|
|
| 66,472 |
| ||
Other Assets in Excess of Liabilities (0.4%) |
|
|
| 291 |
| ||
Net Assets (100%) |
|
|
| $ | 66,763 |
| |
(a) | Non-income producing security. |
(f) | Represents the Portfolio’s undivided interest in a joint repurchase agreement which has a total value of $1,000,707,000. The repurchase agreement was fully collateralized by U.S. government agency securities at the date of this Portfolio of Investments as follows: Federal Farm Credit Bank: 2.00% to 7.35%, due 1/11/06 to 10/25/33; Federal Home Loan Mortgage Corp.: 1.88% to 7.22%, due 2/9/06 to 7/15/32; Federal National Mortgage Association: 2.50% to 7.25%, due 2/15/06 to 11/15/30, which had a total value of $1,020,741,791. The investment in the repurchase agreement is through participation in a joint account with affiliated parties pursuant to exemptive relief received by the Portfolio from the SEC. |
ADR | American Depositary Receipts |
65 | The accompanying notes are an integral part of the financial statements. |
| 2005 Annual Report |
|
|
| December 31, 2005 |
Investment Overview
Large Cap Relative Value Portfolio
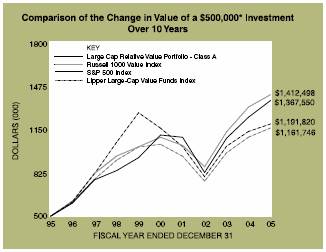
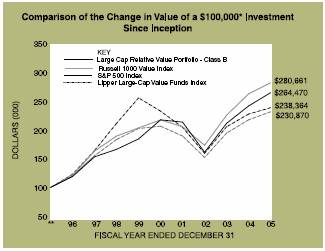
* Minimum Investment
** Commenced offering on January 2, 1996
In accordance with SEC regulations, Portfolio performance shown assumes that all recurring fees (including management fees) were deducted and all dividends and distributions were reinvested.
Performance Compared to the Russell 1000 Value Index(1) , the S&P 500 Index(2) and the Lipper Large-Cap Value Funds Index(3)
|
| Total Returns(4) |
| ||||||
|
|
|
| Average Annual |
| ||||
|
| One |
| Five |
| Ten |
| Since |
|
Portfolio – Class A (5) |
| 10.07 | % | 4.28 | % | 10.59 | % | 11.06 | % |
Russell 1000 Value Index |
| 7.05 |
| 5.28 |
| 10.94 |
| 12.23 |
|
S&P 500 Index |
| 4.91 |
| 0.55 |
| 9.07 |
| 11.09 |
|
Lipper Large-Cap Value Funds Index |
| 6.26 |
| 2.27 |
| 8.80 |
| 10.80 |
|
Portfolio – Class B (6) |
| 9.81 |
| 4.01 |
| — |
| 10.22 |
|
Russell 1000 Value Index |
| 7.05 |
| 5.28 |
| — |
| 10.88 |
|
S&P 500 Index |
| 4.91 |
| 0.55 |
| — |
| 8.99 |
|
Lipper Large-Cap Value Funds Index |
| 6.26 |
| 2.27 |
| — |
| 8.73 |
|
(1) The Russell 1000 Value Index measures the performance of those companies in the Russell 1000 Index with lower price-to-book ratios and lower forecasted growth values.
(2) The S&P 500 Index is a capitalization-weighted index of 500 stocks. The index is designed to measure performance of the broad domestic economy through changes in the aggregate market value of 500 stocks representing all major industries.
(3) The Lipper Large-Cap Value Funds Index is an equally weighted performance index of the largest qualifying funds (based on net assets) in the Lipper Large-Cap Value Fund classification. The Index, which is adjusted for capital gains distributions and income dividends, is unmanaged and should not be considered an investment. There are currently 30 funds represented in this Index. As of the date of this report, the Portfolio is in the Lipper Large-Cap Value Funds classification.
(4) Total returns for the Portfolio reflect fees waived and expenses reimbursed, if applicable, by the Adviser. Without such waivers and reimbursements, total returns would have been lower. Fee waivers and/or expense reimbursements are voluntary and the Adviser reserves the right to commence or terminate any waiver and/or reimbursement at any time.
(5) Commenced operations on January 31, 1990
(6) Commenced offering on January 2, 1996
(7) For comparative purposes, average annual since inception returns listed for the Indexes refer to the inception date or initial offering of the respective share class of the Portfolio, not the inception of the Index.
Performance data quoted represents past performance, which is no guarantee of future results, and current performance may be lower or higher than the figures shown. Performance assumes that all dividends and distributions, if any, were reinvested. For the most recent month-end performance figures, please visit morganstanley.com/im. Investment return and principal value will fluctuate so that Portfolio shares, when redeemed, may be worth more or less than their original cost. Total returns do not reflect the deduction of taxes that a shareholder would pay on Portfolio distributions or the redemption of Portfolio shares.
The Large Cap Relative Value Portfolio seeks high total return by investing primarily in equity securities that the Advisor believes to be undervalued relative to the stock market in general at the time of purchase.
Performance
For the year ended December 31, 2005, the Portfolio had a total return of 10.07% for the Class A shares, net of fees, and 9.81% for the Class B shares, net of fees, compared to 7.05%
66
2005 Annual Report | |
|
|
December 31, 2005 | |
Investment Overview (cont’d)
Large Cap Relative Value Portfolio
for the Russell 1000 Value Index (the “Index”) and 4.91% for the S&P 500 Index.
Factors Affecting Performance
• For the 12-month period ended December 31, 2005, the broad stock market produced a modest gain. Although rising interest rates and high oil prices fed investor uncertainty about the economy’s growth prospects, economic news remained generally upbeat and inflation was contained. With the exception of the U.S. auto industry, healthy corporate profits and strong earnings across a range of sectors helped support the market.
• Value stocks, which comprise the Portfolio, maintained a very slight edge over growth stocks. The narrowing of the performance gap between the two styles is historically consistent for this phase of the economic cycle.
• Our stock selection in financials was the most additive to the Portfolio’s return relative to the Index. Positioning here included considerable exposure to diversified financials and an underweight in regional banks.
• Healthcare stocks, primarily pharmaceuticals, were a strong positive contributor to relative returns. The performance of pharmaceutical stocks continued to improve on pipeline expectations and better news on patent protection.
• An underweight in energy (the Index’s best performing group) was offset by our strong selection in the sector, especially among refining and marketing companies.
• Detractors from performance relative to the Index were in consumer staples (primarily due to our selections in food and staples retailing), stock selection in telecommunication services, and a relative underweight in utilities (one of the market’s best performing areas).
Management Strategies
• We continue to seek value stocks using our bottom-up security selection process. We look for undervalued companies that offer a potential catalyst for change. Such catalysts could be new company management, growth or consolidation within an industry or sector, or new products.
• During the period, we continued to reduce the Portfolio’s energy exposure.
• As the yield curve flattened, we found selected opportunities among financial stocks. However, financials remained a considerable underweight relative to the Index.
• The Portfolio’s overall positioning was reasonably defensive at year end, with large-cap pharmaceuticals and consumer staples overweights, and financials and industrials underweights.
Expense Examples
As a shareholder of the Portfolio, you may incur two types of costs: (1) transactional costs, including redemption fees; (2) ongoing costs, including management fees, distribution (12b- 1) fees (in the case of Class B); and other Portfolio expenses. These examples are intended to help you understand your ongoing costs (in dollars) of investing in the Portfolio and to compare these costs with the ongoing costs of investing in other mutual funds.
The examples are based on an investment of $1,000 invested at the beginning of the six-month period ended December 31, 2005 and held for the entire six-month period.
Actual Expenses
The first line of the tables below provides information about actual account values and actual expenses. You may use the information in this line, together with the amount you invested, to estimate the expenses that you paid over the period. Simply divide your account value by $1,000 (for example, an $8,600 account value divided by $1,000 = 8.6), then multiply the result by the number in the first line under the heading entitled “Expenses Paid During Period” to estimate the expenses you paid on your account during this period.
Hypothetical Example for Comparison Purposes
The second line of the tables below provides information about hypothetical account values and hypothetical expenses based on the Portfolio’s actual expense ratio and an assumed rate of return of 5% per year before expenses, which is not the Portfolio’s actual return. The hypothetical account values and expenses may not be used to estimate the actual ending account balance or expenses you paid for the period. You may use this information to compare the ongoing costs of investing in the Portfolio and other funds. To do so, compare this 5% hypothetical example with the 5% hypothetical examples that appear in the shareholder reports of the other funds.
Please note that the expenses shown in the table are meant to highlight your ongoing costs only and do not reflect any transactional costs, such as redemption fees. Therefore, the second line of the table is useful in comparing ongoing costs only, and will not help you determine the relative total costs of
67
| 2005 Annual Report |
|
|
| December 31, 2005 |
Investment Overview (cont’d)
Large Cap Relative Value Portfolio
owning different funds. In addition, if these transactional costs were included, your costs would have been higher.
|
| Beginning |
| Ending Account |
| Expenses Paid |
| |||||
Class A |
|
|
|
|
|
|
| |||||
Actual |
| $ | 1,000.00 |
|
| $ | 1,076.00 |
| $ | 3.51 |
|
|
Hypothetical (5% average |
|
|
|
|
|
|
|
|
| |||
annual return before expenses) |
| 1,000.00 |
|
| 1,021.83 |
| 3.41 |
|
| |||
|
|
|
|
|
|
|
|
|
| |||
Class B |
|
|
|
|
|
|
|
|
| |||
Actual |
| 1,000.00 |
|
| 1,075.10 |
| 4.81 |
|
| |||
Hypothetical (5% average |
|
|
|
|
|
|
|
|
| |||
annual return before expenses) |
| 1,000.00 |
|
| 1,020.57 |
| 4.69 |
|
| |||
* Expenses are equal to Class A and Class B annualized net expense ratios of 0.67% and 0.92%, respectively, multiplied by the average account value over the period, multiplied by 184/365 (to reflect the one-half year period). | ||||||||||||
Graphic Presentation of Portfolio Holdings
The following graph depicts the Portfolio’s holdings by industry and/or security type, as a percentage of total investments.
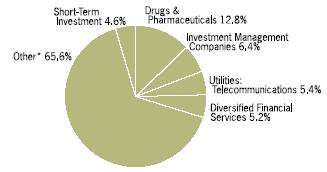
* Industries which do not appear in the above graph, as well as those which represent less than 5% of total investments, if applicable, are included in the category labeled “Other”.
January 2006
68
2005 Annual Report | |
|
|
December 31, 2005 | |
Portfolio of Investments
Large Cap Relative Value Portfolio
|
|
|
| Value |
| |
|
| Shares |
| (000) |
| |
Common Stocks (95.7%) |
|
|
|
|
| |
Aerospace (2.1%) |
|
|
|
|
| |
Northrop Grumman Corp. |
| 34,230 |
| $ | 2,058 |
|
Raytheon Co. |
| 53,650 |
| 2,154 |
| |
|
|
|
| 4,212 |
| |
Automobiles (0.9%) |
|
|
|
|
| |
Honda Motor Co., Ltd. ADR |
| 64,450 |
| 1,867 |
| |
Banks: Outside New York City (1.0%) |
|
|
|
|
| |
PNC Financial Services Group, Inc. |
| 34,440 |
| 2,129 |
| |
Beverages: Brewers (Wineries) (0.8%) |
|
|
|
|
| |
Diageo plc ADR |
| 27,230 |
| 1,588 |
| |
Beverages: Soft Drinks (1.5%) |
|
|
|
|
| |
Coca Cola Co. (The) |
| 77,260 |
| 3,114 |
| |
Biotechnology Research & Production (1.2%) |
|
|
|
|
| |
Chiron Corp. |
| (a)53,380 |
| 2,373 |
| |
Chemicals (4.1%) |
|
|
|
|
| |
Bayer AG ADR |
| 142,620 |
| 5,956 |
| |
Dow Chemical Co. (The) |
| 45,060 |
| 1,974 |
| |
Lanxess AG |
| (a)13,992 |
| 447 |
| |
|
|
|
| 8,377 |
| |
Communications & Media (4.0%) |
|
|
|
|
| |
Time Warner, Inc. |
| 287,510 |
| 5,014 |
| |
Walt Disney Co. (The) |
| 129,270 |
| 3,099 |
| |
|
|
|
| 8,113 |
| |
Communications Technology (0.9%) |
|
|
|
|
| |
Motorola, Inc. |
| 77,510 |
| 1,751 |
| |
Computer Services Software & Systems (2.0%) |
|
|
|
|
| |
Symantec Corp. |
| (a)232,260 |
| 4,065 |
| |
Computer Technology (0.9%) |
|
|
|
|
| |
Hewlett-Packard Co. |
| 66,150 |
| 1,894 |
| |
Cosmetics (0.2%) |
|
|
|
|
| |
Avon Products, Inc. |
| 16,940 |
| 484 |
| |
Diversified Financial Services (5.3%) |
|
|
|
|
| |
Bank of America Corp. |
| 66,550 |
| 3,071 |
| |
Merrill Lynch & Co., Inc. |
| 81,160 |
| 5,497 |
| |
State Street Corp. |
| 39,790 |
| 2,206 |
| |
|
|
|
| 10,774 |
| |
Drugs & Pharmaceuticals (12.8%) |
|
|
|
|
| |
Bristol-Myers Squibb Co. |
| 208,020 |
| 4,780 |
| |
Eli Lilly & Co. |
| 60,510 |
| 3,424 |
| |
GlaxoSmithKline plc ADR |
| 37,960 |
| 1,916 |
| |
Roche Holding AG ADR |
| 71,320 |
| 5,338 |
| |
Sanofi-Aventis ADR |
| 56,210 |
| 2,468 |
| |
Schering-Plough Corp. |
| 239,750 |
| 4,999 |
| |
Wyeth |
| 70,910 |
| 3,267 |
| |
|
|
|
| 26,192 |
| |
Electronics: Instruments Gauges & Meters (0.4%) |
|
|
|
|
| |
Applera Corp. - Applied Biosystems Group |
| 32,360 |
| 859 |
| |
Electronics: Semi-Conductors/Components (2.4%) |
|
|
|
|
| |
Intel Corp. |
| 108,620 |
| 2,711 |
| |
Micron Technology, Inc. |
| (a)171,180 |
| 2,279 |
| |
|
|
|
| 4,990 |
| |
Energy Equipment (2.1%) |
|
|
|
|
| |
Schlumberger Ltd. |
| 43,960 |
| $ | 4,271 |
|
Energy — Miscellaneous (0.5%) |
|
|
|
|
| |
Valero Energy Corp. |
| 20,680 |
| 1,067 |
| |
Entertainment (1.2%) |
|
|
|
|
| |
Viacom, Inc., Class B |
| (a)76,520 |
| 2,495 |
| |
Financial — Miscellaneous (3.4%) |
|
|
|
|
| |
Freddie Mac |
| 58,730 |
| 3,838 |
| |
Marsh & McLennan Cos., Inc. |
| 74,470 |
| 2,365 |
| |
MBNA Corp. |
| 24,910 |
| 676 |
| |
|
|
|
| 6,879 |
| |
Foods (3.4%) |
|
|
|
|
| |
Cadbury Schweppes plc ADR |
| 53,350 |
| 2,043 |
| |
Unilever N.V. (NY Shares) |
| 71,660 |
| 4,919 |
| |
|
|
|
| 6,962 |
| |
|
|
|
|
|
| |
Health Care — Miscellaneous (1.0%) |
|
|
|
|
| |
Bausch & Lomb, Inc. |
| 28,780 |
| 1,954 |
| |
Insurance: Life (1.7%) |
|
|
|
|
| |
Cigna Corp. |
| 30,870 |
| 3,448 |
| |
Insurance: Multi-Line (2.3%) |
|
|
|
|
| |
Ace Ltd. |
| 5,580 |
| 298 |
| |
Aegon N.V. (NY Shares) |
| 54,250 |
| 885 |
| |
Hartford Financial Services Group, Inc. |
| 23,710 |
| 2,037 |
| |
XL Capital Ltd., Class A |
| 20,800 |
| 1,402 |
| |
|
|
|
| 4,622 |
| |
Insurance: Property & Casualty (3.4%) |
|
|
|
|
| |
Chubb Corp. |
| 33,300 |
| 3,252 |
| |
St. Paul Travelers Cos., Inc. (The) |
| 84,141 |
| 3,758 |
| |
|
|
|
| 7,010 |
| |
Investment Management Companies (6.4%) |
|
|
|
|
| |
Citigroup, Inc. |
| 108,890 |
| 5,284 |
| |
Goldman Sachs Group, Inc. |
| 10,810 |
| 1,381 |
| |
J.P. Morgan Chase & Co. |
| 163,033 |
| 6,471 |
| |
|
|
|
| 13,136 |
| |
Manufacturing (2.5%) |
|
|
|
|
| |
Ingersoll Rand Co., Ltd. Class A |
| 43,680 |
| 1,763 |
| |
Siemens AG ADR |
| 39,970 |
| 3,421 |
| |
|
|
|
| 5,184 |
| |
Materials & Processing — Miscellaneous (1.7%) |
|
|
|
|
| |
Newmont Mining Corp. |
| 65,280 |
| 3,486 |
| |
Medical & Dental Instruments & Supplies (0.3%) |
|
|
|
|
| |
Boston Scientific Corp. |
| (a)29,110 |
| 713 |
| |
Multi-Sector Companies (2.5%) |
|
|
|
|
| |
General Electric Co. |
| 146,230 |
| 5,125 |
| |
Oil: Integrated Domestic (4.5%) |
|
|
|
|
| |
BP plc ADR |
| 44,560 |
| 2,862 |
| |
ConocoPhillips |
| 53,100 |
| 3,089 |
| |
Royal Dutch Shell plc ADR |
| 53,830 |
| 3,310 |
| |
|
|
|
| 9,261 |
| |
Oil: Integrated International (0.6%) |
|
|
|
|
| |
Exxon Mobil Corp. |
| 21,320 |
| 1,198 |
| |
Radio & TV Broadcasters (2.1%) |
|
|
|
|
| |
Clear Channel Communications, Inc. |
| 134,310 |
| 4,224 |
| |
69 | The accompanying notes are an integral part of the financial statements. |
| 2005 Annual Report |
|
|
| December 31, 2005 |
Portfolio of Investments (cont’d)
Large Cap Relative Value Portfolio
|
|
|
| Value |
| |
|
| Shares |
| (000) |
| |
Retail (3.3%) |
|
|
|
|
| |
Kohl’s Corp. |
| (a)36,950 |
| $ | 1,796 |
|
McDonald’s Corp. |
| 31,710 |
| 1,069 |
| |
Office Depot, Inc. |
| (a)25,830 |
| 811 |
| |
Wal-Mart Stores, Inc. |
| 67,680 |
| 3,168 |
| |
|
|
|
| 6,844 |
| |
Securities Brokerage & Services (1.5%) |
|
|
|
|
| |
Charles Schwab Corp. (The) |
| 204,380 |
| 2,998 |
| |
Services: Commercial (0.1%) |
|
|
|
|
| |
CCE Spinco, Inc. |
| (a)16,746 |
| 219 |
| |
Soaps & Household Chemicals (0.8%) |
|
|
|
|
| |
Procter & Gamble Co. |
| 28,400 |
| 1,644 |
| |
Tobacco (1.4%) |
|
|
|
|
| |
Altria Group, Inc. |
| 37,950 |
| 2,836 |
| |
Utilities: Electrical (3.1%) |
|
|
|
|
| |
American Electric Power Co., Inc. |
| 52,450 |
| 1,945 |
| |
Entergy Corp. |
| 34,900 |
| 2,396 |
| |
FirstEnergy Corp. |
| 42,030 |
| 2,059 |
| |
|
|
|
| 6,400 |
| |
Utilities: Telecommunications (5.4%) |
|
|
|
|
| |
France Telecom S.A. ADR |
| 94,680 |
| 2,352 |
| |
Sprint Nextel Corp. |
| 209,094 |
| 4,884 |
| |
Verizon Communications, Inc. |
| 124,820 |
| 3,760 |
| |
|
|
|
| 10,996 |
| |
Total Common Stocks (Cost $175,623) |
|
|
| 195,754 |
| |
|
| Face |
|
|
| ||
Short-Term Investment (4.7%) |
|
|
|
|
| ||
Repurchase Agreement (4.7%) |
|
|
|
|
| ||
J.P. Morgan Securities, Inc., 4.05%, dated 12/30/05, due 1/3/06, repurchase price $9,512 (Cost $9,508) |
| $ | (f)9,508 |
| 9,508 |
| |
Total Investments (100.4%) (Cost $185,131) |
|
|
| 205,262 |
| ||
Liabilities in Excess of Other Assets (-0.4%) |
|
|
| (790) |
| ||
Net Assets (100%) |
|
|
| $ | 204,472 |
| |
(a) | Non-income producing security. |
(f) | Represents the Portfolio’s undivided interest in a joint repurchase agreement which has a total value of $1,000,707,000. The repurchase agreement was fully collateralized by U.S. government agency securities at the date of this Portfolio of Investments as follows: Federal Farm Credit Bank: 2.00%to 7.35%, due 1/11/06 to 10/25/33; Federal Home Loan Mortgage Corp.: 1.88%to 7.22%, due 2/9/06 to 7/15/32; Federal National Mortgage Association: 2.50%to 7.25%, due 2/15/06 to 11/15/30, which had a total value of $1,020,741,791. The investment in the repurchase agreement is through participation in a joint account with affiliated parties pursuant to exemptive relief received by the Portfolio from the SEC. |
ADR | American Depositary Receipts |
The accompanying notes are an integral part of the financial statements. | 70 |
2005 Annual Report | |
|
|
December 31, 2005 | |
Investment Overview
Small Company Growth Portfolio
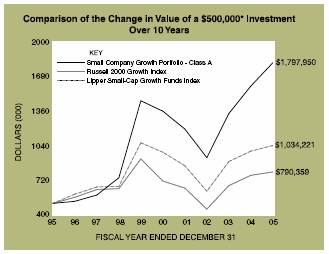
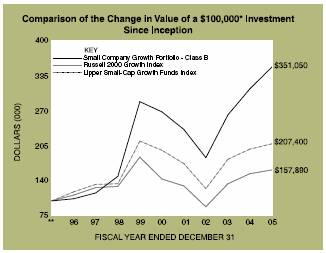
* Minimum Investment
** Commenced offering on January 2, 1996
In accordance with SEC regulations, Portfolio performance shown assumes that all recurring fees (including management fees) were deducted and all dividends and distributions were reinvested.
Performance Compared to the Russell 2000 Growth Index(1) and the Lipper Small-Cap Growth Funds Index(2)
|
| Total Returns(3) |
| ||||||
|
|
|
| Average Annual |
| ||||
|
| One |
| Five |
| Ten |
| Since |
|
Portfolio – Class A (4) |
| 13.55 | % | 5.89 | % | 13.65 | % | 13.54 | % |
Russell 2000 Growth Index |
| 4.15 |
| 2.28 |
| 4.69 |
| 7.35 |
|
Lipper Small-Cap Growth Funds Index |
| 5.34 |
| 1.25 |
| 7.54 |
| 10.43 |
|
Portfolio – Class B (5) |
| 13.35 |
| 5.65 |
| — |
| 13.38 |
|
Russell 2000 Growth Index |
| 4.15 |
| 2.28 |
| — |
| 4.68 |
|
Lipper Small-Cap Growth Funds Index |
| 5.34 |
| 1.25 |
| — |
| 7.57 |
|
(1) The Russell 2000 Growth Index measures the performance of those Russell 2000 companies with higher price-to-book ratios and higher forecasted growth values.
(2) The Lipper Small-Cap Growth Funds Index is an equally weighted performance index of the largest qualifying funds (based on net assets) in the Lipper Small-Cap Growth Funds classification. The Index, which is adjusted for capital gains distributions and income dividends, is unmanaged and should not be considered an investment. There are currently 30 funds represented in this Index. As of the date of this report, the Portfolio is in the Lipper Small-Cap Growth Funds classification.
(3) Total returns for the Portfolio reflect fees waived and expenses reimbursed, if applicable, by the Adviser. Without such waivers and reimbursements, total returns would have been lower. Fee waivers and/or expense reimbursements are voluntary and the Adviser reserves the right to commence or terminate any waiver and/or reimbursement at any time.
(4) Commenced operations on November 1, 1989
(5) Commenced offering on January 2, 1996
(6) For comparative purposes, average annual since inception returns listed for the Indexes refer to the inception date or initial offering of the respective share class of the Portfolio, not the inception of the Index.
Performance data quoted represents past performance, which is no guarantee of future results, and current performance may be lower or higher than the figures shown. Performance assumes that all dividends and distributions, if any, were reinvested. For the most recent month-end performance figures, please visit morganstanley.com/im. Investment return and principal value will fluctuate so that Portfolio shares, when redeemed, may be worth more or less than their original cost. Total returns do not reflect the deduction of taxes that a shareholder would pay on Portfolio distributions or the redemption of Portfolio shares.
The Small Company Growth Portfolio seeks long-term capital appreciation by investing primarily in growth-oriented equity securities of small capitalization companies. Investments in small sized corporations are more vulnerable to financial risks and other risks than larger corporations and may involve a higher degree of price volatility than investments in the general equity markets.
Performance
For the year ended December 31, 2005, the Portfolio had a total return of 13.55% for the Class A shares, net of fees, and 13.35% for the Class B shares, net of fees, compared to 4.15% for the Russell 2000 Growth Index (the “Index”).
71
| 2005 Annual Report |
|
|
| December 31, 2005 |
Investment Overview (cont’d)
Small Company Growth Portfolio
Factors Affecting Performance
• The Portfolio outperformed the Index due primarily to stock selection, with favorable sector allocations further enhancing performance.
• The Portfolio’s performance relative to the Index benefited most from its positioning in the healthcare, technology and financial services sectors. Performance within healthcare was driven by medical and dental instruments and supplies, biotechnology research and production, medical services, and drugs and pharmaceutical companies. Within the technology sector, positions in the computer services, software and systems industry and the communications technology industry contributed notably to relative return. A sector underweight also proved advantageous. In the financial services sector, relative performance was particularly enhanced by stock selection in the diversified financial services and information services industries.
• Within utilities, stock selection in the gas distributors industry added to relative performance as well.
• The Portfolio’s exposure to the consumer discretionary and consumer staples sectors proved least advantageous to relative performance. Within consumer discretionary, stock selection in the casinos and gaming industry was the main area of weakness; selection in the education services industry also tempered gains. In consumer staples, stock selection in food companies detracted from overall performance.
• Also on the downside, stock selection within the integrated oils industry hindered performance.
Management Strategies
• As of year-end, consumer discretionary represents the largest sector weight in the Portfolio, followed by healthcare and technology. The Portfolio’s consumer discretionary exposure is overweighted relative to the Index, while healthcare and technology are both underweighted.
• It is our goal to hold a portfolio of high quality growth stocks we believe will perform well regardless of the market environment. We continue to favor companies that have some uniqueness or dynamic competitive advantage in their business model, with a high quality stream of cash flow and the ability to re-deploy capital at a high rate of return.
Expense Examples
As a shareholder of the Portfolio, you may incur two types of costs: (1) transactional costs, including redemption fees; (2) ongoing costs, including management fees, distribution (12b-1) fees (in the case of Class B); and other Portfolio expenses. These examples are intended to help you understand your ongoing costs (in dollars) of investing in the Portfolio and to compare these costs with the ongoing costs of investing in other mutual funds.
The examples are based on an investment of $1,000 invested at the beginning of the six-month period ended December 31, 2005 and held for the entire six-month period.
Actual Expenses
The first line of the tables below provides information about actual account values and actual expenses. You may use the information in this line, together with the amount you invested, to estimate the expenses that you paid over the period. Simply divide your account value by $1,000 (for example, an $8,600 account value divided by $1,000 = 8.6), then multiply the result by the number in the first line under the heading entitled “Expenses Paid During Period” to estimate the expenses you paid on your account during this period.
Hypothetical Example for Comparison Purposes
The second line of the tables below provides information about hypothetical account values and hypothetical expenses based on the Portfolio’s actual expense ratio and an assumed rate of return of 5% per year before expenses, which is not the Portfolio’s actual return. The hypothetical account values and expenses may not be used to estimate the actual ending account balance or expenses you paid for the period. You may use this information to compare the ongoing costs of investing in the Portfolio and other funds. To do so, compare this 5% hypothetical example with the 5% hypothetical examples that appear in the shareholder reports of the other funds.
Please note that the expenses shown in the table are meant to highlight your ongoing costs only and do not reflect any transactional costs, such as redemption fees. Therefore, the second line of the table is useful in comparing ongoing costs only, and will not help you determine the relative total costs of owning different funds. In addition, if these transactional costs were included, your costs would have been higher.
72
2005 Annual Report | |
|
|
December 31, 2005 | |
Investment Overview (cont’d)
Small Company Growth Portfolio
|
| Beginning |
| Ending Account |
| Expenses Paid |
| |||||
Class A |
|
|
|
|
|
|
| |||||
Actual |
| $ | 1,000.00 |
|
| $ | 1,078.50 |
| $ | 5.40 |
|
|
Hypothetical (5%average |
|
|
|
|
|
|
|
|
| |||
annual return before expenses) |
| 1,000.00 |
|
| 1,020.01 |
| 5.24 |
|
| |||
|
|
|
|
|
|
|
|
|
| |||
Class B |
|
|
|
|
|
|
|
|
| |||
Actual |
| 1,000.00 |
|
| 1,077.90 |
| 6.70 |
|
| |||
Hypothetical (5%average |
|
|
|
|
|
|
|
|
| |||
annual return before expenses) |
| 1,000.00 |
|
| 1,018.75 |
| 6.51 |
|
| |||
* Expenses are equal to Class A and Class B annualized net expense ratios of 1.03% and 1.28%, respectively, multiplied by the average account value over the period, multiplied by 184/365 (to reflect the one-half year period). | ||||||||||||
Graphic Presentation of Portfolio Holdings
The following graph depicts the Portfolio’s holdings by industry and/or security type, as a percentage of total investments.
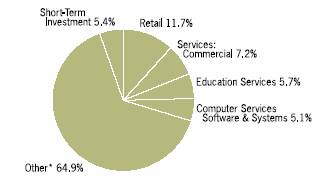
* Industries which do not appear in the above graph, as well as those which represent less than 5% of total investments, if applicable, are included in the category labeled “Other”.
January 2006
73
| 2005 Annual Report |
|
|
| December 31, 2005 |
Portfolio of Investments
Small Company Growth Portfolio
|
|
|
| Value |
| |
|
| Shares |
| (000) |
| |
Common Stocks (95.7%) |
|
|
|
|
| |
Advertising Agencies (1.2%) |
|
|
|
|
| |
Focus Media Holding Ltd. ADR |
| (a)601,834 |
| $ | 20,324 |
|
Biotechnology Research & Production (1.1%) |
|
|
|
|
| |
Idexx Laboratories, Inc. |
| (a)252,935 |
| 18,206 |
| |
Building: Cement (1.8%) |
|
|
|
|
| |
Eagle Materials, Inc. |
| 165,522 |
| 19,494 |
| |
Texas Industries, Inc. |
| 228,940 |
| 11,410 |
| |
|
|
|
| 30,904 |
| |
Casinos & Gambling (2.9%) |
|
|
|
|
| |
Kerzner International Ltd. |
| (a)507,390 |
| 34,883 |
| |
Shuffle Master, Inc. |
| (a)570,519 |
| 14,343 |
| |
|
|
|
| 49,226 |
| |
Chemicals (1.0%) |
|
|
|
|
| |
Nuco2, Inc. |
| (a)641,767 |
| 17,892 |
| |
Communications & Media (0.9%) |
|
|
|
|
| |
CKX, Inc. |
| (a)1,139,759 |
| 14,817 |
| |
Computer Services Software & Systems (5.2%) |
|
|
|
|
| |
Akamai Technologies, Inc. |
| (a)1,253,099 |
| 24,974 |
| |
Bankrate, Inc. |
| (a)358,855 |
| 10,593 |
| |
Blackboard, Inc. |
| (a)664,343 |
| 19,253 |
| |
Convera Corp. |
| (a)778,183 |
| 7,704 |
| |
Netease.com ADR |
| (a)292,826 |
| 16,445 |
| |
Sina Corp. |
| (a)388,031 |
| 9,375 |
| |
|
|
|
| 88,344 |
| |
Consumer Electronics (2.4%) |
|
|
|
|
| |
CNET Networks, Inc. |
| (a)1,516,055 |
| 22,271 |
| |
THQ, Inc. |
| (a)804,438 |
| 19,186 |
| |
|
|
|
| 41,457 |
| |
Consumer Staples — Miscellaneous (2.8%) |
|
|
|
|
| |
Peet’s Coffee & Tea, Inc. |
| (a)696,677 |
| 21,144 |
| |
Yankee Candle Co., Inc. |
| 1,045,896 |
| 26,775 |
| |
|
|
|
| 47,919 |
| |
Diversified (1.0%) |
|
|
|
|
| |
Beacon Roofing Supply, Inc. |
| (a)612,352 |
| 17,593 |
| |
Diversified Financial Services (1.2%) |
|
|
|
|
| |
Calamos Asset Management, Inc., Class A |
| 656,464 |
| 20,646 |
| |
Drugs & Pharmaceuticals (2.8%) |
|
|
|
|
| |
Adams Respiratory Therapeutics, Inc. |
| (a)397,372 |
| 16,157 |
| |
Flamel Technologies ADR |
| (a)394,391 |
| 7,446 |
| |
Gen-Probe, Inc. |
| (a)313,285 |
| 15,285 |
| |
Noven Pharmaceuticals, Inc. |
| (a)580,300 |
| 8,780 |
| |
|
|
|
| 47,668 |
| |
Education Services (5.7%) |
|
|
|
|
| |
Ambassadors Group, Inc. |
| 1,124,053 |
| 25,730 |
| |
Bright Horizons Family Solutions, Inc. |
| (a)734,690 |
| 27,220 |
| |
Strayer Education, Inc. |
| 474,656 |
| 44,476 |
| |
|
|
|
| 97,426 |
| |
Electronics: Semi-Conductors/Components (1.4%) |
|
|
|
|
| |
Tessera Technologies, Inc. |
| (a)953,512 |
| 24,648 |
| |
Energy — Miscellaneous (4.9%) |
|
|
|
|
| |
Gasco Energy, Inc. |
| (a)3,122,769 |
| $ | 20,392 |
|
Quicksilver Resources, Inc. |
| (a)395,882 |
| 16,631 |
| |
Range Resources Corp. |
| 1,745,182 |
| 45,968 |
| |
|
|
|
| 82,991 |
| |
Engineering & Contracting Services (0.7%) |
|
|
|
|
| |
Washington Group International, Inc. |
| 220,961 |
| 11,704 |
| |
Entertainment (0.5%) |
|
|
|
|
| |
Take-Two Interactive Software, Inc. |
| (a)433,963 |
| 7,681 |
| |
Foods (0.3%) |
|
|
|
|
| |
Rocky Mountain Chocolate Factory, Inc. |
| 282,330 |
| 4,595 |
| |
Health Care — Miscellaneous (1.1%) |
|
|
|
|
| |
VCA Antech, Inc. |
| (a)664,343 |
| 18,734 |
| |
Health Care Services (4.3%) |
|
|
|
|
| |
Stericycle, Inc. |
| (a)732,206 |
| 43,112 |
| |
Dade Behring Holdings, Inc. |
| 725,647 |
| 29,672 |
| |
|
|
|
| 72,784 |
| |
Homebuilding (2.0%) |
|
|
|
|
| |
Desarrolladora Homex S.A. de C.V. ADR |
| (a)1,119,342 |
| 34,341 |
| |
Hotel/Motel (4.2%) |
|
|
|
|
| |
BJ’s Restaurants, Inc. |
| (a)1,036,308 |
| 23,690 |
| |
Gaylord Entertainment Co. |
| (a)855,385 |
| 37,286 |
| |
Great Wolf Resorts, Inc. |
| (a)999,331 |
| 10,303 |
| |
|
|
|
| 71,279 |
| |
Investment Management Companies (2.8%) |
|
|
|
|
| |
Greenhill & Co., Inc. |
| 844,206 |
| 47,411 |
| |
Leisure Time (4.4%) |
|
|
|
|
| |
Polaris Industries, Inc. |
| 340,340 |
| 17,085 |
| |
SCP Pool Corp. |
| 860,328 |
| 32,022 |
| |
WMS Industries, Inc. |
| (a)1,065,732 |
| 26,739 |
| |
|
|
|
| 75,846 |
| |
Machinery: Industrial/Specialty (1.4%) |
|
|
|
|
| |
Middleby Corp. |
| (a)284,440 |
| 24,604 |
| |
Medical & Dental Instruments & Supplies (3.6%) |
|
|
|
|
| |
American Medical Systems Holdings, Inc. |
| (a)559,361 |
| 9,973 |
| |
Cyberonics, Inc. |
| (a)262,534 |
| 8,480 |
| |
Techne Corp. |
| (a)758,211 |
| 42,574 |
| |
|
|
|
| 61,027 |
| |
Oil: Crude Producers (0.6%) |
|
|
|
|
| |
GMX Resources, Inc. |
| (a)273,000 |
| 9,828 |
| |
Paper (0.8%) |
|
|
|
|
| |
Neenah Paper, Inc. |
| 494,833 |
| 13,855 |
| |
Publishing: Miscellaneous (1.9%) |
|
|
|
|
| |
Morningstar, Inc. |
| (a)921,379 |
| 31,917 |
| |
Real Estate Investment Trusts (1.0%) |
|
|
|
|
| |
Jones Lang LaSalle, Inc. |
| 333,701 |
| 16,802 |
| |
Restaurants (1.5%) |
|
|
|
|
| |
P.F. Chang’s China Bistro, Inc. |
| (a)530,556 |
| 26,331 |
| |
Retail (11.8%) |
|
|
|
|
| |
AFC Enterprises, Inc. |
| (a)1,152,350 |
| 17,424 |
| |
Blue Nile, Inc. |
| (a)833,583 |
| 33,602 |
| |
Build-A-Bear Workshop, Inc. |
| (a)908,275 |
| 26,921 |
| |
Citi Trends, Inc. |
| (a)597,654 |
| 25,514 |
| |
NetFlix, Inc. |
| (a)704,776 |
| 19,071 |
| |
The accompanying notes are an integral part of the financial statements. | 74 |
2005 Annual Report | |
|
|
December 31, 2005 | |
Portfolio of Investments (cont’d)
Small Company Growth Portfolio
|
|
|
| Value |
| |
|
| Shares |
| (000) |
| |
Retail (cont’d) |
|
|
|
|
| |
Overstock.com, Inc. |
| (a)386,792 |
| $ | 10,888 |
|
Pantry, Inc. (The) |
| (a)442,962 |
| 20,815 |
| |
Provide Commerce, Inc. |
| (a)208,247 |
| 6,895 |
| |
Tractor Supply Co. |
| (a)482,411 |
| 25,539 |
| |
Tuesday Morning Corp. |
| 714,674 |
| 14,951 |
| |
|
|
|
| 201,620 |
| |
Services: Commercial (7.3%) |
|
|
|
|
| |
Advisory Board Co. (The) |
| (a)1,019,062 |
| 48,579 |
| |
Coinstar, Inc. |
| (a)990,045 |
| 22,603 |
| |
Corporate Executive Board Co. |
| 333,941 |
| 29,954 |
| |
Macquarie Infrastructure Co. Trust |
| 768,804 |
| 23,679 |
| |
|
|
|
| 124,815 |
| |
Shoes (0.9%) |
|
|
|
|
| |
Deckers Outdoor Corp. |
| (a)578,500 |
| 15,978 |
| |
Technology — Miscellaneous (0.4%) |
|
|
|
|
| |
Housevalues, Inc. |
| (a)503,711 |
| 6,563 |
| |
Telecommunications Equipment (2.5%) |
|
|
|
|
| |
SBA Communications Corp., Class A |
| (a)2,373,438 |
| 42,485 |
| |
Textile Apparel Manufacturers (2.2%) |
|
|
|
|
| |
Carter’s, Inc. |
| (a)409,433 |
| 24,095 |
| |
Maidenform Brands, Inc. |
| (a)1,094,427 |
| 13,856 |
| |
|
|
|
| 37,951 |
| |
Truckers (3.2%) |
|
|
|
|
| |
Landstar System, Inc. |
| 1,295,591 |
| 54,078 |
| |
Total Common Stocks (Cost $1,394,764) |
|
|
| 1,632,290 |
| |
|
| Face |
|
|
| ||
Short-Term Investment (5.5%) |
|
|
|
|
| ||
Repurchase Agreement (5.5%) |
|
|
|
|
| ||
J.P. Morgan Securities, Inc., 4.05%, dated 12/30/05, due 1/3/06, repurchase price $93,697 |
| $ | (f)93,655 |
| 93,655 |
| |
Total Investments (101.2%) (Cost $1,488,419) |
|
|
| 1,725,945 |
| ||
Liabilities in Excess of Other Assets (-1.2%) |
|
|
| (21,248) |
| ||
Net Assets (100%) |
|
|
| $ | 1,704,697 |
| |
(a) | Non-income producing security. |
(f) | Represents the Portfolio’s undivided interest in a joint repurchase agreement which has a total value of $1,000,707,000. The repurchase agreement was fully collateralized by U.S. government agency securities at the date of this Portfolio of Investments as follows: Federal Farm Credit Bank: 2.00% to 7.35%, due 1/11/06 to 10/25/33; Federal Home Loan Mortgage Corp.: 1.88% to 7.22%, due 2/9/06 to 7/15/32; Federal National Mortgage Association: 2.50% to 7.25%, due 2/15/06 to 11/15/30, which had a total value of $1,020,741,791. The investment in the repurchase agreement is through participation in a joint account with affiliated parties pursuant to exemptive relief received by the Portfolio from the SEC. |
ADR | American Depositary Receipts |
75 | The accompanying notes are an integral part of the financial statements. |
| 2005 Annual Report |
|
|
| December 31, 2005 |
Investment Overview
U.S. Large Cap Growth Portfolio
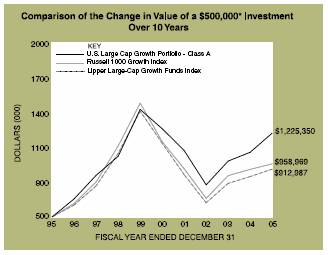
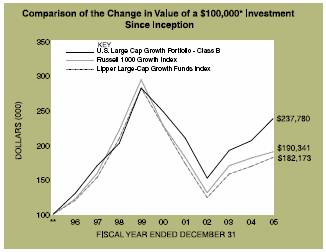
* Minimum Investment
** Commenced offering on January 2, 1996
In accordance with SEC regulations, Portfolio performance shown assumes that all recurring fees (including management fees) were deducted and all dividends and distributions were reinvested.
Performance Compared to the Russell 1000 Growth Index(1) and the Lipper Large-Cap Growth Funds Index(2)
|
| Total Returns(3) |
| ||||||
|
|
|
| Average Annual |
| ||||
|
| One |
| Five |
| Ten |
| Since |
|
Portfolio – Class A (4) |
| 15.72 | % | (0.60) | % | 9.38 | % | 10.95 | % |
Russell 1000 Growth Index |
| 5.26 |
| (3.58) |
| 6.73 |
| 8.72 |
|
Lipper Large-Cap Growth Funds Index |
| 7.58 |
| (4.29) |
| 6.21 |
| 8.54 |
|
Portfolio – Class B (5) |
| 15.41 |
| (0.86) |
| — |
| 9.05 |
|
Russell 1000 Growth Index |
| 5.26 |
| (3.58) |
| — |
| 6.65 |
|
Lipper Large-Cap Growth Funds Index |
| 7.58 |
| (4.29) |
| — |
| 6.18 |
|
(1) The Russell 1000 Growth Index measures the performance of those Russell 1000 companies with higher price-to-book ratios and higher forecasted growth values. The Russell 1000 Index measures the performance of the 1,000 largest companies in the Russell 3000 Index. The Russell 3000 Index measures the performance of the 3,000 largest U.S. companies based on total market capitalization.
(2) The Lipper Large-Cap Growth Funds Index is an equally weighted performance index of the largest qualifying funds (based on net assets) in the Lipper Large-Cap Growth Funds classification. The Index, which is adjusted for capital gains distributions and income dividends, is unmanaged and should not be considered an investment. There are currently 30 funds represented in this Index. As of the date of this report, the Portfolio is in the Lipper Large-Cap Growth Funds classification.
(3) Total returns for the Portfolio reflect fees waived and expenses reimbursed, if applicable, by the Adviser. Without such waivers and reimbursements, total returns would have been lower. Fee waivers and/or expense reimbursements are voluntary and the Adviser reserves the right to commence or terminate any waiver and/or reimbursement at any time.
(4) Commenced operations on April 2, 1991
(5) Commenced offering on January 2, 1996
(6) For comparative purposes, average annual since inception returns listed for the Indexes refer to the inception date or initial offering of the respective share class of the Portfolio, not the inception of the Index.
Performance data quoted represents past performance, which is no guarantee of future results, and current performance may be lower or higher than the figures shown. Performance assumes that all dividends and distributions, if any, were reinvested. For the most recent month-end performance figures, please visit morganstanley.com/im. Investment return and principal value will fluctuate so that Portfolio shares, when redeemed, may be worth more or less than their original cost. Total returns do not reflect the deduction of taxes that a shareholder would pay on Portfolio distributions or the redemption of Portfolio shares.
The U.S. Large Cap Growth Portfolio seeks long-term capital appreciation by investing primarily in growth-oriented equity securities of large capitalization companies.
Performance
For the year ended December 31, 2005, the Portfolio’s Class A shares had a total return of 15.72%, net of fees, and 15.41% for the Class B shares, net of fees, compared to 5.26% for the Russell 1000 Growth Index (the “Index”).
76
2005 Annual Report | |
|
|
December 31, 2005 | |
Investment Overview (cont’d)
U.S. Large Cap Growth Portfolio
Factors Affecting Performance
• Stock selection drove the Portfolio’s outperformance of the Index, with particular strength in utilities, healthcare and energy. This favorable stock selection more than offset the modest negative impact of sector allocations.
• Within utilities, the Portfolio benefited notably from security selection in wireless companies and gas distributors. In healthcare, stock selection was particularly advantageous in the medical and dental instruments and supplies companies industry and healthcare management services industry. Stock selection in the crude oil producers industry propelled gains within the Portfolio’s energy position.
• Overall performance was hindered by large sector overweight in consumer discretionary. A large sector overweight in consumer discretionary hindered overall performance. Within technology, stock selection in computer technology, computer services software, and communications technology industry hindered performance.
• Although a variety of healthcare stocks contributed gains, a sector-level underweight slowed the Portfolio’s pace versus the Index.
• Stock selection in the oil well equipment industry also clipped the overall returns.
Management Strategies
• As of year-end, consumer discretionary represents the largest sector weight in the Portfolio, followed by healthcare and technology. The Portfolio’s consumer discretionary exposure is overweighted relative to the Index, while healthcare and technology are both underweighted.
• It is our goal to hold a portfolio of high quality growth stocks we believe will perform well regardless of the market environment. We continue to favor companies that have some uniqueness or dynamic competitive advantage in their business model, with a high quality stream of cash flow and the ability to re-deploy capital at a high rate of return.
Expense Examples
As a shareholder of the Portfolio, you may incur two types of costs: (1) transactional costs, including redemption fees; (2) ongoing costs, including management fees, distribution (12b-1) fees (in the case of Class B); and other Portfolio expenses. These examples are intended to help you understand your ongoing costs (in dollars) of investing in the Portfolio and to compare these costs with the ongoing costs of investing in other mutual funds.
The examples are based on an investment of $1,000 invested at the beginning of the six-month period ended December 31, 2005 and held for the entire six-month period.
Actual Expenses
The first line of the tables below provides information about actual account values and actual expenses. You may use the information in this line, together with the amount you invested, to estimate the expenses that you paid over the period. Simply divide your account value by $1,000 (for example, an $8,600 account value divided by $1,000 = 8.6), then multiply the result by the number in the first line under the heading entitled “Expenses Paid During Period” to estimate the expenses you paid on your account during this period.
Hypothetical Example for Comparison Purposes
The second line of the tables below provides information about hypothetical account values and hypothetical expenses based on the Portfolio’s actual expense ratio and an assumed rate of return of 5% per year before expenses, which is not the Portfolio’s actual return. The hypothetical account values and expenses may not be used to estimate the actual ending account balance or expenses you paid for the period. You may use this information to compare the ongoing costs of investing in the Portfolio and other funds. To do so, compare this 5% hypothetical example with the 5% hypothetical examples that appear in the shareholder reports of the other funds.
Please note that the expenses shown in the table are meant to highlight your ongoing costs only and do not reflect any transactional costs, such as redemption fees. Therefore, the second line of the table is useful in comparing ongoing costs only, and will not help you determine the relative total costs of owning different funds. In addition, if these transactional costs were included, your costs would have been higher.
|
| Beginning |
| Ending Account |
| Expenses Paid |
| |||||
Class A |
|
|
|
|
|
|
| |||||
Actual |
| $ | 1,000.00 |
|
| $ | 1,155.20 |
| $ | 3.42 |
|
|
Hypothetical (5% average |
|
|
|
|
|
|
|
|
| |||
annual return before expenses) |
| 1,000.00 |
|
| 1,022.03 |
| 3.21 |
|
| |||
|
|
|
|
|
|
|
|
|
| |||
Class B |
|
|
|
|
|
|
|
|
| |||
Actual |
| 1,000.00 |
|
| 1,154.10 |
| 4.78 |
|
| |||
Hypothetical (5% average |
|
|
|
|
|
|
|
|
| |||
annual return before expenses) |
| 1,000.00 |
|
| 1,020.77 |
| 4.48 |
|
| |||
* Expenses are equal to Class A and Class B annualized net expense ratios of 0.63% and 0.88%, respectively, multiplied by the average account value over the period, multiplied by 184/365 (to reflect the one-half year period). | ||||||||||||
77
| 2005 Annual Report |
|
|
| December 31, 2005 |
Investment Overview (cont’d)
U.S. Large Cap Growth Portfolio
Graphic Presentation of Portfolio Holdings
The following graph depicts the Portfolio’s holdings by industry and/or security type, as a percentage of total investments.
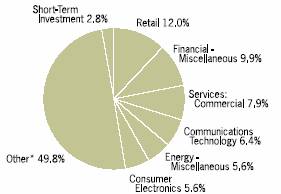
* Industries which do not appear in the above graph, as well as those which represent less than 5% of total investments, if applicable, are included in the category labeled “Other”.
January 2006
78
2005 Annual Report | |
|
|
December 31, 2005 | |
Portfolio of Investments
U.S. Large Cap Growth Portfolio
|
|
|
| Value |
| |
|
| Shares |
| (000) |
| |
Common Stocks (97.1%) |
|
|
|
|
| |
Advertising Agencies (3.6%) |
|
|
|
|
| |
Getty Images, Inc. |
| (a)192,941 |
| $ | 17,224 |
|
Monster Worldwide, Inc. |
| (a)379,248 |
| 15,481 |
| |
|
|
|
| 32,705 |
| |
Air Transport (1.4%) |
|
|
|
|
| |
Expeditors International of Washington, Inc. |
| 190,198 |
| 12,840 |
| |
Biotechnology Research & Production (1.9%) |
|
|
|
|
| |
Genentech, Inc. |
| (a)190,780 |
| 17,647 |
| |
Casinos & Gambling (2.2%) |
|
|
|
|
| |
International Game Technology |
| 653,875 |
| 20,126 |
| |
Communications Technology (6.3%) |
|
|
|
|
| |
America Movil S.A. de C.V., Class L ADR |
| 1,249,931 |
| 36,573 |
| |
Corning, Inc. |
| (a)438,663 |
| 8,624 |
| |
Crown Castle International Corp. |
| (a)461,108 |
| 12,408 |
| |
|
|
|
| 57,605 |
| |
Computer Services Software & Systems (4.9%) |
|
|
|
|
| |
Google, Inc., Class A |
| (a)106,739 |
| 44,282 |
| |
Computer Technology (4.1%) |
|
|
|
|
| |
Apple Computer, Inc. |
| (a)218,016 |
| 15,673 |
| |
Dell, Inc. |
| (a)712,143 |
| 21,357 |
| |
Seagate Technology, Inc. |
| (d)(l)186,100 |
| @— |
| |
|
|
|
| 37,030 |
| |
Consumer Electronics (5.6%) |
|
|
|
|
| |
Electronic Arts, Inc. |
| (a)388,982 |
| 20,348 |
| |
Yahoo!, Inc. |
| (a)769,513 |
| 30,149 |
| |
|
|
|
| 50,497 |
| |
Diversified Financial Services (2.6%) |
|
|
|
|
| |
Brookfield Asset Management, Inc., Class A |
| 475,581 |
| 23,936 |
| |
Education Services (2.1%) |
|
|
|
|
| |
Apollo Group, Inc., Class A |
| (a)314,525 |
| 19,016 |
| |
Electronics: Semi-Conductors/Components (1.5%) |
|
|
|
|
| |
Marvell Technology Group Ltd. |
| (a)238,719 |
| 13,390 |
| |
Energy — Miscellaneous (5.6%) |
|
|
|
|
| |
Southwestern Energy Co. |
| (a)331,174 |
| 11,902 |
| |
Ultra Petroleum Corp. |
| (a)694,675 |
| 38,763 |
| |
|
|
|
| 50,665 |
| |
Financial Data Processing Services & Systems (1.4%) |
|
|
|
|
| |
Paychex, Inc. |
| 321,319 |
| 12,249 |
| |
Financial — Miscellaneous (9.9%) |
|
|
|
|
| |
Berkshire Hathaway, Inc., Class B |
| (a)10,889 |
| 31,965 |
| |
Chicago Mercantile Exchange Holdings, Inc. |
| 48,763 |
| 17,920 |
| |
Countrywide Financial Corp. |
| 386,856 |
| 13,226 |
| |
Marsh & McLennan Cos., Inc. |
| 414,357 |
| 13,160 |
| |
Moody’s Corp. |
| 224,798 |
| 13,807 |
| |
|
|
|
| 90,078 |
| |
Health Care — Miscellaneous (1.3%) |
|
|
|
|
| |
Alcon, Inc. |
| 94,165 |
| 12,204 |
| |
Health Care Services (3.1%) |
|
|
|
|
| |
UnitedHealth Group, Inc. |
| 455,363 |
| 28,296 |
| |
Homebuilding (1.5%) |
|
|
|
|
| |
Pulte Homes, Inc. |
| 339,889 |
| $ | 13,378 |
|
Leisure Time (2.9%) |
|
|
|
|
| |
Carnival Corp. |
| 483,420 |
| 25,848 |
| |
Manufacturing (1.3%) |
|
|
|
|
| |
Tyco International Ltd. |
| 418,221 |
| 12,070 |
| |
Materials & Processing— Miscellaneous (4.1%) |
|
|
|
|
| |
Monsanto Co. |
| 483,484 |
| 37,485 |
| |
Medical & Dental Instruments & Supplies (2.7%) |
|
|
|
|
| |
Dade Behring Holdings, Inc. |
| 276,505 |
| 11,307 |
| |
St. Jude Medical, Inc. |
| (a)255,427 |
| 12,822 |
| |
|
|
|
| 24,129 |
| |
Recreational Vehicles & Boats (2.2%) |
|
|
|
|
| |
Harley-Davidson, Inc. |
| 390,546 |
| 20,109 |
| |
Retail (11.9%) |
|
|
|
|
| |
Amazon.Com, Inc. |
| (a)468,460 |
| 22,088 |
| |
Costco Wholesale Corp. |
| 721,250 |
| 35,680 |
| |
Home Depot, Inc. |
| 577,637 |
| 23,383 |
| |
Sears Holdings Corp. |
| (a)235,912 |
| 27,255 |
| |
|
|
|
| 108,406 |
| |
Services: Commercial (8.0%) |
|
|
|
|
| |
Corporate Executive Board Co. |
| 202,828 |
| 18,194 |
| |
eBay, Inc. |
| (a)965,126 |
| 41,742 |
| |
Iron Mountain, Inc. |
| (a)293,067 |
| 12,373 |
| |
|
|
|
| 72,309 |
| |
Shipping (1.4%) |
|
|
|
|
| |
C.H. Robinson Worldwide, Inc. |
| 333,710 |
| 12,357 |
| |
Tobacco (2.3%) |
|
|
|
|
| |
Altria Group, Inc. |
| 275,681 |
| 20,599 |
| |
Utilities: Gas Pipelines (1.3%) |
|
|
|
|
| |
Questar Corp. |
| 152,662 |
| 11,557 |
| |
Total Common Stocks (Cost $769,494) |
|
|
| 880,813 |
| |
|
| Face |
|
|
| ||
Short-Term Investment (2.8%) |
|
|
|
|
| ||
Repurchase Agreement (2.8%) |
|
|
|
|
| ||
J.P. Morgan Securities, Inc., 4.05%, dated 12/30/05, due 1/3/06, repurchase price $25,504 |
| $ | (f)25,493 |
| 25,493 |
| |
Total Investments (99.9%) (Cost $794,987) |
|
|
| 906,306 |
| ||
Other Assets in Excess of Liabilities (0.1%) |
|
|
| 1,277 |
| ||
Net Assets (100%) |
|
|
| $ | 907,583 |
| |
(a) | Non-income producing security. |
(d) | Security was valued at fair value — At December 31, 2005, the Portfolio held a fair valued security, valued at less than $500, representing less than 0.05% of net assets. |
79 | The accompanying notes are an integral part of the financial statements. |
| 2005 Annual Report |
|
|
| December 31, 2005 |
Portfolio of Investments (cont’d)
U.S. Large Cap Growth Portfolio
(f) | Represents the Portfolio’s undivided interest in a joint repurchase agreement which has a total value of $1,000,707,000. The repurchase agreement was fully collateralized by U.S. government agency securities at the date of this Portfolio of Investments as follows: Federal Farm Credit Bank: 2.00% to 7.35%, due 1/11/06 to 10/25/33; Federal Home Loan Mortgage Corp.: 1.88% to 7.22%, due 2/9/06 to 7/15/32; Federal National Mortgage Association: 2.50% to 7.25%, due 2/15/06 to 11/15/30, which had a total value of $1,020,741,791. The investment in the repurchase agreement is through participation in a joint account with affiliated parties pursuant to exemptive relief received by the Portfolio from the SEC. |
(l) | Security has been deemed illiquid - at December 31, 2005. |
@ | Face Amount/Value is less than $500. |
ADR | American Depositary Receipts |
The accompanying notes are an integral part of the financial statements. | 80 |
2005 Annual Report | |
|
|
December 31, 2005 | |
Investment Overview
U.S. Real Estate Portfolio
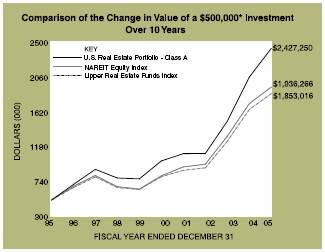
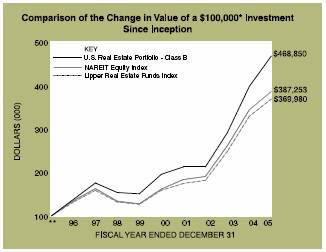
* | Minimum Investment |
** | Commenced offering on January 2, 1996 |
In accordance with SEC regulations, Portfolio performance shown assumes that all recurring fees (including management fees) were deducted and all dividends and distributions were reinvested.
Performance Compared to the National Association of Real Estate Investment Trusts (NAREIT) Equity Index(1) and the Lipper Real Estate Funds Index(2)
|
| Total Returns(3) |
| ||||||
|
|
|
| Average Annual |
| ||||
|
| One |
| Five |
| Ten |
| Since |
|
Portfolio – Class A (4) |
| 17.66 | % | 19.46 | % | 17.12 | % | 17.73 | % |
NAREIT Equity Index |
| 12.16 |
| 19.08 |
| 14.50 |
| 14.76 |
|
Lipper Real Estate Funds Index |
| 12.27 |
| 18.36 |
| 14.00 |
| — |
|
Portfolio – Class B (5) |
| 17.37 |
| 19.11 |
| — |
| 16.71 |
|
NAREIT Equity Index |
| 12.16 |
| 19.08 |
| — |
| 14.51 |
|
Lipper Real Estate Funds Index |
| 12.27 |
| 18.36 |
| — |
| 13.99 |
|
(1) The NAREIT Equity Index is an unmanaged market weighted index of tax qualified REITs listed on the New York Stock Exchange, American Stock Exchange and the NASDAQ National Market System, including dividends.
(2) The Lipper Real Estate Funds Index is an equally weighted performance index of the largest qualifying funds (based on net assets) in the Lipper Real Estate Funds classification. The Index, which is adjusted for capital gains distributions and income dividends, is unmanaged and should not be considered an investment. There are currently 30 funds represented in this Index. As of the date of this report, the Portfolio is in the Lipper Real Estate Funds classification.
(3) Total returns for the Portfolio reflect fees waived and expenses reimbursed, if applicable, by the Adviser. Without such waivers and reimbursements, total returns would have been lower. Fee waivers and/or expense reimbursements are voluntary and the Adviser reserves the right to commence or terminate any waiver and/or reimbursement at any time.
(4) Commenced operations on February 24, 1995
(5) Commenced offering on January 2, 1996
(6) For comparative purposes, average annual since inception returns listed for the Indexes refer to the inception date or initial offering of the respective share class of the Portfolio, not the inception of the Index.
Performance data quoted represents past performance, which is no guarantee of future results, and current performance may be lower or higher than the figures shown. Performance assumes that all dividends and distributions, if any, were reinvested. For the most recent month-end performance figures, please visit morganstanley.com/im. Investment return and principal value will fluctuate so that Portfolio shares, when redeemed, may be worth more or less than their original cost. Total returns do not reflect the deduction of taxes that a shareholder would pay on Portfolio distributions or the redemption of Portfolio shares.
The U.S. Real Estate Portfolio seeks to provide above average current income and long-term capital appreciation by investing primarily in equity securities of companies in the U.S. real estate industry, including real estate investment trusts (“REITs”). The Portfolio’s concentration in the real estate sector makes it subject to greater risk and volatility than other portfolios that are more diversified, and the value of its shares may be substantially affected by economic events in the real estate industry.
81
| 2005 Annual Report |
|
|
| December 31, 2005 |
Investment Overview (cont’d)
U.S. Real Estate Portfolio
Performance
For the year ended December 31, 2005, the Portfolio had a total return of 17.66% for the Class A shares, net of fees, and 17.37% for the Class B shares, net of fees, compared to 12.16% for the National Association of Real Estate Investment Trusts (NAREIT) Equity Index (the “Index”).
Factors Affecting Performance
• In 2005, the real estate sector continued to benefit from increased interest from institutional and retail investors. Moreover, the ongoing improvement in underlying real estate values contributed to and supported rising real estate securities prices. Numerous private takeover transactions of public real estate companies at meaningful premiums demonstrated the strong underlying value of these companies’ properties and provided evidence of strong demand for real estate.
• For the full year, each of the major sectors outperformed the Index. Apartment stocks advanced due to the continued improvement in fundamentals and a series of take-private transactions that supported asset values. Despite a disappointing recovery for cash flows, the office sector also outperformed. This strength may have been driven by sustained improvement in market values for office assets, as evidenced in a variety of private market transactions. In addition, supply and demand trends remained favorable for owners of office assets. Retail was mixed; the malls stocks significantly outperformed and the shopping center stocks modestly underperformed. Supply was the key differentiating factor, as there is very little new mall construction, while the shopping centers have witnessed significant new additions to supply.
• Turning to the smaller sectors, storage was the best performing of all sectors. These stocks were bolstered by several large transactions that confirmed the strong private market valuations for these assets. Hotel stocks modestly underperformed. The healthcare REITs dramatically underperformed due to lackluster earnings growth prospects.
• Stock selection was the largest contributor to the Portfolio’s outperformance, while sector allocation was also beneficial. Stock selection was favorable in every sector, with the most significant contributions generated in the apartment, office, retail and hotel sectors. From a top-down perspective, the largest contributors were an overweight to the storage sector and underweight to the healthcare and mixed office/industrial sectors. These positives were partially offset by the overweight to the hotel sector.
Management Strategies
• We maintained our core investment philosophy as a real estate value investor. This results in our ownership of stocks, which we believe, provide the best valuation relative to their underlying real estate values. Our company specific research leads us to specific preferences for sub-segments within each property sector.
• The Portfolio is currently overweighted in companies focused in the ownership of upscale urban hotels, coastal apartments, high quality retail assets and Class A office properties in central business district locations, and underweighted in owners of strip shopping centers and lesser quality offices. We have selectively added to stocks in key suburban markets, particularly in the office sector, where we have found attractively priced opportunities.
Expense Examples
As a shareholder of the Portfolio, you may incur two types of costs: (1) transactional costs, including redemption fees; (2) ongoing costs, including management fees, distribution (12b-1) fees (in the case of Class B); and other Portfolio expenses. These examples are intended to help you understand your ongoing costs (in dollars) of investing in the Portfolio and to compare these costs with the ongoing costs of investing in other mutual funds.
The examples are based on an investment of $1,000 invested at the beginning of the six-month period ended December 31, 2005 and held for the entire six-month period.
Actual Expenses
The first line of the tables below provides information about actual account values and actual expenses. You may use the information in this line, together with the amount you invested, to estimate the expenses that you paid over the period. Simply divide your account value by $1,000 (for example, an $8,600 account value divided by $1,000 = 8.6), then multiply the result by the number in the first line under the heading entitled “Expenses Paid During Period” to estimate the expenses you paid on your account during this period.
Hypothetical Example for Comparison Purposes
The second line of the tables below provides information about hypothetical account values and hypothetical expenses based on the Portfolio’s actual expense ratio and an assumed rate of return of 5% per year before expenses, which is not the Portfolio’s actual return. The hypothetical account values and expenses may not be used to estimate the actual ending account balance or expenses you paid for the period. You may use this information to compare the ongoing costs of investing
82
2005 Annual Report | |
|
|
December 31, 2005 | |
Investment Overview (cont’d)
U.S. Real Estate Portfolio
in the Portfolio and other funds. To do so, compare this 5% hypothetical example with the 5% hypothetical examples that appear in the shareholder reports of the other funds.
Please note that the expenses shown in the table are meant to highlight your ongoing costs only and do not reflect any transactional costs, such as redemption fees. Therefore, the second line of the table is useful in comparing ongoing costs only, and will not help you determine the relative total costs ofowning different funds. In addition, if these transactional costs were included, your costs would have been higher.
|
| Beginning |
| Ending Account |
| Expenses Paid |
| |||
Class A |
|
|
|
|
|
|
| |||
Actual |
| $ | 1,000.00 |
| $ | 1,085.60 |
| $ | 4.63 |
|
Hypothetical (5% average |
|
|
|
|
|
|
| |||
annual return before expenses) |
| 1,000.00 |
| 1,020.77 |
| 4.48 |
| |||
|
|
|
|
|
|
|
| |||
Class B |
|
|
|
|
|
|
| |||
Actual |
| 1,000.00 |
| 1,084.30 |
| 5.94 |
| |||
Hypothetical (5% average |
|
|
|
|
|
|
| |||
annual return before expenses) |
| 1,000.00 |
| 1,019.51 |
| 5.75 |
| |||
* Expenses are equal to Class A and Class B annualized net expense ratios of 0.88% and 1.13%, respectively, multiplied by the average account value over the period, multiplied by 184/365 (to reflect the one-half year period).
Graphic Presentation of Portfolio Holdings
The following graph depicts the Portfolio’s holdings by industry and/or security type, as a percentage of total investments.
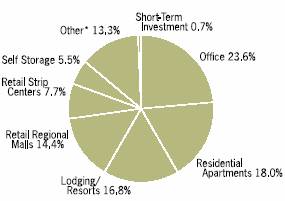
* Industries which do not appear in the above graph, as well as those which represent less than 5% of total investments, if applicable, are included in the category labeled “Other”.
January 2006
83
| 2005 Annual Report |
|
|
| December 31, 2005 |
Portfolio of Investments
U.S. Real Estate Portfolio
|
|
|
| Value |
| |
|
| Shares |
| (000) |
| |
Common Stocks (98.5%) |
|
|
|
|
| |
Diversified (3.6%) |
|
|
|
|
| |
CentraCore Properties Trust |
| 170,610 |
| $ | 4,584 |
|
Forest City Enterprises, Inc., Class A |
| 446,000 |
| 16,917 |
| |
Spirit Finance Corp. REIT |
| 136,160 |
| 1,546 |
| |
Vornado Realty Trust REIT |
| 311,430 |
| 25,995 |
| |
|
|
|
| 49,042 |
| |
Health Care (2.9%) |
|
|
|
|
| |
Brookdale Senior Living, Inc. |
| 26,400 |
| 787 |
| |
Cogdell Spencer, Inc. REIT |
| (a)179,250 |
| 3,027 |
| |
Health Care Property Investors, Inc. REIT |
| 323,460 |
| 8,268 |
| |
LTC Properties, Inc. REIT |
| 118,200 |
| 2,486 |
| |
Omega Healthcare Investors, Inc. REIT |
| 45 |
| 1 |
| |
Senior Housing Properties Trust REIT |
| 1,318,585 |
| 22,297 |
| |
Sunrise Senior Living REIT |
| 30,600 |
| 354 |
| |
Universal Health Reality Income Trust REIT |
| 63,470 |
| 1,989 |
| |
Windrose Medical Properties Trust REIT |
| 85,150 |
| 1,265 |
| |
|
|
|
| 40,474 |
| |
Industrial (4.6%) |
|
|
|
|
| |
AMB Property Corp. REIT |
| 846,110 |
| 41,603 |
| |
Cabot 2 Industrial Value Fund, Inc. |
| (i)(l)1,000 |
| 500 |
| |
Keystone Industries Fund LP |
| (i)(l)25,068 |
| 25 |
| |
ProLogis REIT |
| 442,989 |
| 20,697 |
| |
|
|
|
| 62,825 |
| |
Lodging/Resorts (16.6%) |
|
|
|
|
| |
Four Seasons Hotels, Inc. |
| 126,910 |
| 6,314 |
| |
Hersha Hospitality Trust REIT |
| 63,800 |
| 575 |
| |
Hilton Hotels Corp. |
| 2,670,603 |
| 64,388 |
| |
Host Marriott Corp. REIT |
| 4,450,340 |
| 84,334 |
| |
Interstate Hotels & Resorts, Inc. |
| (a)112,852 |
| 493 |
| |
Legacy Hotels REIT |
| 1,090,880 |
| 7,507 |
| |
MeriStar Hospitality Corp. REIT |
| (a)1,037,315 |
| 9,751 |
| |
Starwood Hotels & Resorts Worldwide, |
|
|
|
|
| |
Inc. |
| 850,511 |
| 54,313 |
| |
|
|
|
| 227,675 |
| |
Office (23.4%) |
|
|
|
|
| |
Arden Realty, Inc. REIT |
| 573,420 |
| 25,706 |
| |
Beacon Capital Partners, Inc. |
| (a)(d)(i)(l)335,100 |
| 1,010 |
| |
Boston Properties, Inc. REIT |
| 924,690 |
| 68,547 |
| |
Brandywine Realty Trust REIT |
| 446,625 |
| 12,465 |
| |
BRCP REIT LLC I |
| (i)(l)4,616,681 |
| 4,617 |
| |
Brookfield Properties Corp. |
| 2,197,934 |
| 64,663 |
| |
CarrAmerica Realty Corp. REIT |
| 53,150 |
| 1,841 |
| |
Equity Office Properties Trust REIT |
| 1,320,667 |
| 40,056 |
| |
Mack-Cali Realty Corp. REIT |
| 670,100 |
| 28,948 |
| |
Parkway Properties, Inc. REIT |
| 121,870 |
| 4,892 |
| |
Prentiss Properties Trust REIT |
| 311,250 |
| 12,662 |
| |
Reckson Associates Realty Corp. REIT |
| 453,045 |
| 16,301 |
| |
Republic Property Trust REIT |
| (a)346,600 |
| 4,159 |
| |
SL Green Realty Corp. REIT |
| 303,860 |
| 23,212 |
| |
Trizec Properties, Inc. REIT |
| 458,420 |
| 10,507 |
| |
|
|
|
| 319,586 |
| |
Office/Industrial — Mixed (0.8%) |
|
|
|
|
| |
Liberty Property Trust REIT |
| 181,220 |
| $ | 7,765 |
|
PS Business Parks, Inc. REIT |
| 66,490 |
| 3,271 |
| |
|
|
|
| 11,036 |
| |
Residential Apartments (17.9%) |
|
|
|
|
| |
American Campus Communities, Inc. |
|
|
|
|
| |
REIT |
| 187,850 |
| 4,659 |
| |
Archstone-Smith Trust REIT |
| 1,484,091 |
| 62,168 |
| |
AvalonBay Communities, Inc. REIT |
| 808,317 |
| 72,142 |
| |
BRE Properties, Inc. REIT |
| 77,280 |
| 3,515 |
| |
Equity Residential REIT |
| 1,170,429 |
| 45,787 |
| |
Essex Property Trust, Inc. REIT |
| 424,686 |
| 39,156 |
| |
Post Properties, Inc. REIT |
| 364,175 |
| 14,549 |
| |
United Dominion Realty Trust, Inc. REIT |
| 104,940 |
| 2,460 |
| |
|
|
|
| 244,436 |
| |
Residential Manufactured Homes (1.2%) |
|
|
|
|
| |
Equity Lifestyle Properties, Inc. REIT |
| 376,020 |
| 16,733 |
| |
Retail Regional Malls (14.3%) |
|
|
|
|
| |
General Growth Properties, Inc. REIT |
| 187,955 |
| 8,832 |
| |
Macerich Co. (The) REIT |
| 485,715 |
| 32,611 |
| |
Mills Corp. (The) REIT |
| 19,388 |
| 813 |
| |
Simon Property Group, Inc. REIT |
| 1,676,387 |
| 128,461 |
| |
Taubman Centers, Inc. REIT |
| 707,158 |
| 24,574 |
| |
|
|
|
| 195,291 |
| |
Retail Strip Centers (7.7%) |
|
|
|
|
| |
Acadia Realty Trust REIT |
| 309,120 |
| 6,198 |
| |
BPP Liquidating Trust REIT |
| (d)(l)113,290 |
| 6 |
| |
Cedar Shopping Centers, Inc. REIT |
| 147,400 |
| 2,074 |
| |
Developers Diversified Realty Corp. REIT |
| 21,905 |
| 1,030 |
| |
Federal Realty Investment Trust REIT |
| 723,575 |
| 43,885 |
| |
Pan Pacific Retail Properties, Inc. REIT |
| 8,940 |
| 598 |
| |
Ramco-Gershenson Properties REIT |
| 44,200 |
| 1,178 |
| |
Regency Centers Corp. REIT |
| 848,775 |
| 50,035 |
| |
|
|
|
| 105,004 |
| |
Self Storage (5.5%) |
|
|
|
|
| |
Public Storage, Inc. REIT |
| 601,935 |
| 40,763 |
| |
Shurgard Storage Centers, Inc., Class |
|
|
|
|
| |
A REIT |
| 602,942 |
| 34,193 |
| |
|
|
|
| 74,956 |
| |
Total Common Stocks (Cost $878,160) |
|
|
| 1,347,058 |
| |
Preferred Stocks (0.0%) |
|
|
|
|
| |
Residential Apartments (0.0%) |
|
|
|
|
| |
Atlantic Gulf Communities Corp., Series B |
| (d)(i)(l)107,021 |
| @— |
| |
Atlantic Gulf Communities Corp., Series B (Restricted) |
| (d)(i)(l)140,284 |
| @— |
| |
Atlantic Gulf Communities Corp., Series B (Convertible) |
| (a)(d)(l)75,165 |
| @— |
| |
Total Preferred Stocks (Cost $2,618) |
|
|
| @— |
| |
|
| The accompanying notes are an integral part of the financial statements. |
| 84 |
2005 Annual Report | |
|
|
December 31, 2005 | |
Portfolio of Investments (cont’d)
U.S. Real Estate Portfolio
|
| Face |
|
|
| ||
|
| Amount |
| Value |
| ||
|
| (000) |
| (000) |
| ||
Short-Term Investment (0.7%) |
|
|
|
|
| ||
Repurchase Agreement (0.7%) |
|
|
|
|
| ||
J.P. Morgan Securities, Inc., 4.05%, |
|
|
|
|
| ||
dated 12/30/05, due 1/3/06, |
|
|
|
|
| ||
repurchase price $9,230 |
|
|
|
|
| ||
(Cost $9,226) |
| $ | (f)9,226 |
| $ | 9,226 |
|
Total Investments (99.2%) (Cost $890,004) |
|
|
| 1,356,284 |
| ||
Other Assets in Excess of Liabilities (0.8%) |
|
|
| 11,034 |
| ||
Net Assets (100%) |
|
|
| $ | 1,367,318 |
| |
(a) Non-income producing security.
(d) Security was valued at fair value — At December 31, 2005, the Portfolio held $1,016,000 of fair valued securities, representing 0.07% of net assets.
(f) Represents the Portfolio’s undivided interest in a joint repurchase agreement which has a total value of $1,000,707,000. The repurchase agreement was fully collateralized by U.S. government agency securities at the date of this Portfolio of Investments as follows: Federal Farm Credit Bank: 2.00% to 7.35%, due 1/11/06 to 10/25/33; Federal Home Loan Mortgage Corp.: 1.88%to 7.22%, due 2/9/06 to 7/15/32; Federal National Mortgage Association: 2.50% to 7.25%, due 2/15/06 to 11/15/30, which had a total value of $1,020,741,791. The investment in the repurchase agreement is through participation in a joint account with affiliated parties pursuant to exemptive relief received by the Portfolio from the SEC.
(i) Restricted Security valued at fair value and not registered under the Securities Act of 1933. Atlantic Gulf Communities Corp., Series B Preferred was acquired 6/97 and has a current cost basis of $1,070,000. Atlantic Gulf Communities Corp., Series B Preferred was acquired 6/97 and has a current cost basis of $790,000. Beacon Capital Partners, Inc. was acquired 3/98 and has a current cost basis of $1,010,000, BRCP REIT LLC l was acquired 5/03 - 8/05 and has a current cost basis of $4,617,000. Cabot 2 Industrial Value Fund, Inc., was acquired 11/05 and has a current cost basis of $500,000. Keystone Industries Fund LP was acquired 10/05 and has a current basis of $25,000. At December 31, 2005, these securities had an aggregate market value of $6,152,000, representing 0.45%of net assets.
(l) Security has been deemed illiquid - at December 31, 2005.
@ Face Amount/Value is less than $500.
REIT Real Estate Investment Trust
Foreign Currency Exchange Contract Information: |
The Portfolio had the following foreign currency exchange contract(s) open at period end: |
Currency |
| Value |
| Settlement |
| In |
| Value |
| Net |
| ||||
USD |
| 7 |
| $ | 7 |
| 1/3/06 |
| CAD 8 |
| $ | 7 |
| $ @— |
|
USD |
| 31 |
| 31 |
| 1/4/06 |
| CAD 36 |
| 31 |
| @— |
| ||
|
|
|
| $ | 38 |
|
|
|
|
| $ | 38 |
| $ @— |
|
|
|
|
|
|
|
|
|
|
|
|
|
|
| ||
CAD — Canadian Dollar
USD — United States Dollar
85 | The accompanying notes are an integral part of the financial statements. |
| 2005 Annual Report |
|
|
| December 31, 2005 |
Investment Overview
Emerging Markets Debt Portfolio

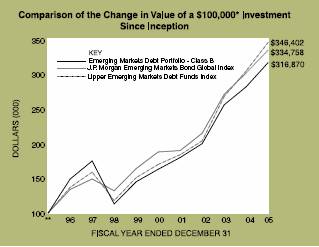
* Minimum Investment
** Commenced offering on January 2, 1996
In accordance with SEC regulations, Portfolio performance shown assumes that all recurring fees (including management fees) were deducted and all dividends and distributions were reinvested.
Performance Compared to the J.P. Morgan
Emerging Markets Bond Global Index(1) and the
Lipper Emerging Markets Debt Funds Index(2)
|
| Total Returns(3) |
| ||||||
|
|
|
| Average Annual |
| ||||
|
| One Year |
| Five Years |
| Ten Years |
| Since | (6) |
Portfolio – Class A (4) |
| 12.78 | % | 14.43 | % | 12.59 | % | 11.37 | % |
J.P. Morgan Emerging Markets Bond |
|
|
|
|
|
|
|
|
|
Global Index |
| 10.73 |
| 12.25 |
| 12.99 |
| 11.01 |
|
Lipper Emerging Markets Debt Funds |
|
|
|
|
|
|
|
|
|
Index |
| 13.75 |
| 15.23 |
| 13.38 |
| — |
|
Portfolio – Class B (5) |
| 12.54 |
| 14.19 |
| — |
| 12.23 |
|
J.P. Morgan Emerging Markets Bond |
|
|
|
|
|
|
|
|
|
Global Index |
| 10.73 |
| 12.25 |
| — |
| 12.86 |
|
Lipper Emerging Markets Debt Funds |
|
|
|
|
|
|
|
|
|
Index |
| 13.75 |
| 15.23 |
| — |
| 13.24 |
|
(1) | The J.P. Morgan Emerging Markets Bond Global Index tracks total returns for U.S. dollar - denominated debt instruments issued by emerging market sovereign and quasi - sovereign entities, including Brady Bonds, loans, Eurobonds and local market instruments for over 30 emerging market countries. |
(2) | The Lipper Emerging Markets Debt Funds Index is an equally weighted performance index of the largest qualifying funds (based on net assets) in the Lipper Emerging Markets Debt Funds classification. The Index, which is adjusted for capital gains distributions and income dividends, is unmanaged and should not be considered an investment. There are currently 10 funds represented in this Index. As of the date of this report, the Portfolio is in the Lipper Emerging Markets Debt Funds classification. |
(3) | Total returns for the Portfolio reflect fees waived and expenses reimbursed, if applicable, by the Adviser. Without such waivers and reimbursements, total returns would have been lower. Fee waivers and/or expense reimbursements are voluntary and the Adviser reserves the right to commence or terminate any waiver and/or reimbursement at any time. |
(4) | Commenced operations on February 1, 1994 |
(5) | Commenced offering on January 2, 1996 |
(6) | For comparative purposes, average annual since inception returns listed for the Indexes refer to the inception date or initial offering of the respective share class of the Portfolio, not the inception of the Index. |
Performance data quoted represents past performance, which is no guarantee of future results, and current performance may be lower or higher than the figures shown. Performance assumes that all dividends and distributions, if any, were reinvested. For the most recent month-end performance figures, please visit morganstanley.com/im. Investment return and principal value will fluctuate so that Portfolio shares, when redeemed, may be worth more or less than their original cost. Total returns do not reflect the deduction of taxes that a shareholder would pay on Portfolio distributions or the redemption of Portfolio shares.
The Emerging Markets Debt Portfolio seeks high total return by investing primarily in fixed income securities of government and government-related issuers and, to a lesser extent, of corporate issuers in emerging market countries. Foreign investing involves certain risks, including currency fluctuations and controls, restrictions on foreign investments, less governmental supervision and regulation, less liquidity and the potential for market volatility and political instability.
86
2005 Annual Report | |
|
|
December 31, 2005 | |
Investment Overview (cont’d)
Emerging Markets Debt Portfolio
In addition, investing in emerging markets may involve a relatively higher degree of volatility.
Performance
For the year ended December 31, 2005, the Portfolio had a total return of 12.78% for Class A, net of fees, shares and 12.54% for Class B, net of fees, shares compared to 10.73% for the J.P. Morgan Emerging Markets Bond Global Index (the “Index”).
Factors Affecting Performance
• As in 2004, the emerging markets debt (“EMD”) asset class ended 2005 as the top-performing fixed income asset class. The return of the Index was derived from a combination of tightening spreads and the relatively high levels of current income associated with emerging markets bonds.
• Fundamentals for emerging market (“EM”) economies strengthened throughout 2005 as most countries experienced improving terms of trade, increasing levels of international reserves and declining debt levels. These factors allowed the asset class to continue its migration upward toward investment grade credit ratings (as of December 31, 2005) (the average rating of the Index was one notch below investment grade) and to shrug off short periods of negative external market conditions during the year.
• EMD spreads compressed to new absolute lows in 2005 (as in 2004) reflecting the higher average rating, broadening investor base, and muted volatility of the asset class. The abundance of financial market liquidity greatly benefited emerging economies in 2005 just as it did in 2004, lifting EMD in spite of tight absolute valuations at the beginning of the year. High global growth, low global interest rates, high commodity prices, and a marked improvement in the quality of economic management proved to be a powerful mix for the EMD asset class in 2005, as in 2004.
• However, the performance of the EMD asset class during 2005 differed from 2004 in important aspects. Notably, EM policymakers accelerated the pace of their deleveraging. To the surprise of investors, most EM countries which benefited from revenue windfalls associated with high commodity prices aggressively paid down debt during 2005. Some used their swelling levels of reserves to pay off debt as it came due; some took a more aggressive stance and pre-paid debts falling due over the next 10 years; while others shifted their borrowings into local currency. The take-away from this phenomenon for investors is the desire on the part of policymakers in most emerging market countries to lessen their dependence on external borrowing. Read another way, most EM policymakers are determined to lessen their exposure to potential shocks emanating from the developed world and are taking the steps necessary to do so.
• Another notable difference between 2004 and 2005 was the emerging shift in the composition of growth in many emerging countries away from purely export-led growth to a mix of exports and domestic demand-driven growth.
• EM debt spreads were less volatile than U.S. high yield spreads and investment grade corporate spreads during 2005. This trend reflects the ongoing improvement in the balance sheets of emerging market borrowers and the growing acceptance of EM credits among institutional investors.
Management Strategies
• We maintained a neutral to slightly defensive risk bias for much of the year. The Portfolio’s spread duration and beta was near to or slightly below the Index’s levels for most of the year.
• The Portfolio was overweighted relative to its Index in Argentina, Indonesia, the Philippines, Turkish local markets and in Russia throughout the year.
• The Portfolio included exposure to the local markets of Argentina, Brazil and Turkey. We underweighted the debt of Ecuador based on our concerns about the country’s ability to service its debts beyond 2005, despite high oil revenues and manageable financing requirements for 2005.
• The Portfolio was underweighted relative to its Index in the external (dollar denominated) debt of Brazil, Turkey and most Asian credits due to concerns that valuations had outpaced fundamentals for those credits.
Expense Examples
As a shareholder of the Portfolio, you may incur two types of costs: (1) transactional costs, including redemption fees; (2) ongoing costs, including management fees, distribution (12b-1) fees (in the case of Class B); and other Portfolio expenses. These examples are intended to help you understand your ongoing costs (in dollars) of investing in the Portfolio and to compare these costs with the ongoing costs of investing in other mutual funds.
The examples are based on an investment of $1,000 invested at the beginning of the six-month period ended December 31, 2005 and held for the entire six-month period.
87
| 2005 Annual Report |
|
|
| December 31, 2005 |
Investment Overview (cont’d)
Emerging Markets Debt Portfolio
Actual Expenses
The first line of the tables below provides information about actual account values and actual expenses. You may use the information in this line, together with the amount you invested, to estimate the expenses that you paid over the period. Simply divide your account value by $1,000 (for example, an $8,600 account value divided by $1,000 = 8.6), then multiply the result by the number in the first line under the heading entitled ‘‘Expenses Paid During Period’’ to estimate the expenses you paid on your account during this period.
Hypothetical Example for Comparison Purposes
The second line of the tables below provides information about hypothetical account values and hypothetical expenses based on the Portfolio’s actual expense ratio and an assumed rate of return of 5% per year before expenses, which is not the Portfolio’s actual return. The hypothetical account values and expenses may not be used to estimate the actual ending account balance or expenses you paid for the period. You may use this information to compare the ongoing costs of investing in the Portfolio and other funds. To do so, compare this 5% hypothetical example with the 5% hypothetical examples that appear in the shareholder reports of the other funds.
Please note that the expenses shown in the table are meant to highlight your ongoing costs only and do not reflect any transactional costs, such as redemption fees. Therefore, the second line of the table is useful in comparing ongoing costs only, and will not help you determine the relative total costs of owning different funds. In addition, if these transactional costs were included, your costs would have been higher.
|
| Beginning |
| Ending Account |
| Expenses Paid |
| ||||||
Class A |
|
|
|
|
|
|
| ||||||
Actual |
| $ | 1,000.00 |
|
| $ | 1,058.00 |
|
|
| $ 5.14 |
| |
Hypothetical (5% average annual return before expenses) |
|
| 1,000.00 |
|
|
| 1,020.21 |
|
|
| 5.04 |
| |
|
|
|
|
|
|
|
|
|
|
|
|
| |
Class B |
|
|
|
|
|
|
|
|
|
|
|
| |
Actual |
|
| 1,000.00 |
|
|
| 1,057.20 |
|
|
| 6.43 |
| |
Hypothetical (5% average annual return before expenses) |
|
| 1,000.00 |
|
|
| 1,018.95 |
|
|
| 6.31 |
| |
* Expenses are equal to Class A and Class B annualized net expense ratios of 0.99% and 1.24%, respectively, multiplied by the average account value over the period, multiplied by 184/365 (to reflect the one-half year period).
Graphic Presentation of Portfolio Holdings
The following graph depicts the Portfolio’s holdings by industry and/or security type, as a percentage of total investments.
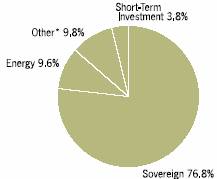
* Industries which do not appear in the above graph, as well as those which represent less than 5% of total investments, if applicable, are included in the category labeled “Other”.
January 2006
88
2005 Annual Report | |
|
|
December 31, 2005 | |
Portfolio of Investments
Emerging Markets Debt Portfolio
|
| Face |
|
|
| ||
|
| Amount |
| Value |
| ||
|
| (000) |
| (000) |
| ||
Debt Instruments (95.0%) |
|
|
|
|
| ||
Argentina (2.9%) |
|
|
|
|
| ||
Sovereign (2.9%) |
|
|
|
|
| ||
Republic of Argentina |
|
|
|
|
| ||
5.83%, 12/31/33 |
| $ | 5,470 |
| $ | 2,125 |
|
8.28%, 12/31/33 |
| (d)107 |
| 89 |
| ||
Republic of Argentina (Linked Variable Rate) |
|
|
|
|
| ||
86.70%, 4/10/49 |
| (b)1,120 |
| 454 |
| ||
|
|
|
| 2,668 |
| ||
Brazil (15.4%) |
|
|
|
|
| ||
Corporate (2.1%) |
|
|
|
|
| ||
Banco ABN AMRO Real S.A., |
|
|
|
|
| ||
Zero Coupon, 7/21/06 |
| (e)740 |
| 803 |
| ||
15.86%, 12/13/07 |
| 2,700 |
| 1,162 |
| ||
|
|
|
| 1,965 |
| ||
Sovereign (13.3%) |
|
|
|
|
| ||
Federative Republic of Brazil |
|
|
|
|
| ||
5.188%, 4/15/24 |
| (h)1,680 |
| 1,640 |
| ||
6.00%, 4/15/24 |
| (h)400 |
| 388 |
| ||
8.00%, 1/15/18 |
| 2,132 |
| 2,306 |
| ||
8.875%, 10/14/19 - 4/15/24 |
| 3,485 |
| 3,911 |
| ||
10.50%, 7/14/14 |
| 620 |
| 761 |
| ||
14.50%, 10/15/09 |
| 2,570 |
| 3,303 |
| ||
|
|
|
| 12,309 |
| ||
|
|
|
| 14,274 |
| ||
Bulgaria (1.4%) |
|
|
|
|
| ||
Sovereign (1.4%) |
|
|
|
|
| ||
Republic of Bulgaria |
|
|
|
|
| ||
8.25%, 1/15/15 |
| (e)1,043 |
| 1,262 |
| ||
Chile (1.3%) |
|
|
|
|
| ||
Corporate (1.3%) |
|
|
|
|
| ||
Empresa Nacional de Petroleo |
|
|
|
|
| ||
6.75%, 11/15/12 |
| (e)1,150 |
| 1,240 |
| ||
Colombia (2.1%) |
|
|
|
|
| ||
Sovereign (2.1%) |
|
|
|
|
| ||
Republic of Colombia |
|
|
|
|
| ||
8.125%, 5/21/24 |
| 480 |
| 521 |
| ||
8.25%, 12/22/14 |
| 220 |
| 245 |
| ||
9.75%, 4/9/11 |
| 279 |
| 315 |
| ||
10.375%, 1/28/33 |
| 100 |
| 132 |
| ||
11.75%, 2/25/20 |
| 535 |
| 743 |
| ||
|
|
|
| 1,956 |
| ||
Indonesia (4.6%) |
|
|
|
|
| ||
Corporate (4.6%) |
|
|
|
|
| ||
Pindo Deli Finance Mauritius |
|
|
|
|
| ||
Tranche A, 5.23%, 4/28/15 |
| (e)(h)393 |
| 328 |
| ||
Tranche B, 5.248%, 4/28/18 |
| (h)1,101 |
| 644 |
| ||
Tranche C, Zero Coupon, 4/28/25 |
| (e)(h)2,227 |
| 568 |
| ||
Tjiwi Kimia Finance Mauritius Ltd. |
|
|
|
|
| ||
Tranche A, 5.248%, 4/28/15 |
| (e)(h)2,217 |
| 1,930 |
| ||
Tranche B, 5.23%, 4/28/18 |
| $ | (e)(h)808 |
| $ | 550 |
|
Tranche C, Zero Coupon, 4/28/27 |
| (e)(h)998 |
| 274 |
| ||
|
|
|
| 4,294 |
| ||
Ivory Coast (0.1%) |
|
|
|
|
| ||
Sovereign (0.1%) |
|
|
|
|
| ||
Ivory Coast |
|
|
|
|
| ||
2.50%, 3/29/18 |
| (b)580 |
| 128 |
| ||
Malaysia (2.4%) |
|
|
|
|
| ||
Sovereign (2.4%) |
|
|
|
|
| ||
Government of Malaysia |
|
|
|
|
| ||
7.50%, 7/15/11 |
| 90 |
| 101 |
| ||
8.75%, 6/1/09 |
| 1,930 |
| 2,158 |
| ||
|
|
|
| 2,259 |
| ||
Mexico (18.1%) |
|
|
|
|
| ||
Corporate (7.3%) |
|
|
|
|
| ||
Pemex Project Funding Master Trust |
|
|
|
|
| ||
5.791%, 6/15/10 |
| (h)150 |
| 155 |
| ||
5.791%, 6/15/10 |
| (e)(h)1,080 |
| 1,121 |
| ||
9.125%, 10/13/10 |
| 1,260 |
| 1,453 |
| ||
9.125%, 12/1/23 |
| (e)460 |
| 568 |
| ||
9.75%, 9/15/27 |
| 290 |
| 389 |
| ||
10.00%, 9/15/27 |
| 320 |
| 429 |
| ||
10.00%, 9/15/27 |
| (e)1,600 |
| 2,140 |
| ||
Satelites Mexicanos S.A. de C.V. |
|
|
|
|
| ||
10.125%, expired maturity |
| (b)977 |
| 469 |
| ||
|
|
|
| 6,724 |
| ||
Sovereign (10.8%) |
|
|
|
|
| ||
United Mexican States |
|
|
|
|
| ||
6.375%, 1/16/13 |
| 780 |
| 831 |
| ||
8.125%, 12/30/19 |
| 1,423 |
| 1,750 |
| ||
8.375%, 1/14/11 |
| 4,040 |
| 4,616 |
| ||
10.375%, 2/17/09 |
| 940 |
| 1,084 |
| ||
United Mexican States MTN |
|
|
|
|
| ||
8.30%, 8/15/31 |
| 1,380 |
| 1,777 |
| ||
|
|
|
| 10,058 |
| ||
|
|
|
| 16,782 |
| ||
Nigeria (1.1%) |
|
|
|
|
| ||
Sovereign (1.1%) |
|
|
|
|
| ||
Central Bank of Nigeria |
|
|
|
|
| ||
6.25%, 11/15/20 |
| (n)1,000 |
| 1,010 |
| ||
Panama (2.1%) |
|
|
|
|
| ||
Sovereign (2.1%) |
|
|
|
|
| ||
Republic of Panama |
|
|
|
|
| ||
7.125%, 1/29/26 |
| 750 |
| 763 |
| ||
9.375%, 4/1/29 |
| 740 |
| 934 |
| ||
9.625%, 2/8/11 |
| 249 |
| 292 |
| ||
|
|
|
| 1,989 |
| ||
Peru (3.2%) |
|
|
|
|
| ||
Sovereign (3.2%) |
|
|
|
|
| ||
Republic of Peru |
|
|
|
|
| ||
89 | The accompanying notes are an integral part of the financial statements. |
| 2005 Annual Report |
|
|
| December 31, 2005 |
Portfolio of Investments (cont’d)
Emerging Markets Debt Portfolio
|
| Face |
|
|
| ||
|
| Amount |
| Value |
| ||
|
| (000) |
| (000) |
| ||
Peru (cont’d) |
|
|
|
|
| ||
Sovereign (cont’d) |
|
|
|
|
| ||
7.84%, 8/12/20 |
| $ | 3,260 |
| $ | 916 |
|
8.375%, 5/3/16 |
| 510 |
| 562 |
| ||
8.75%, 11/21/33 |
| 520 |
| 587 |
| ||
9.875%, 2/6/15 |
| 730 |
| 880 |
| ||
|
|
|
|
|
| ||
|
|
|
| 2,945 |
| ||
Philippines (9.4%) |
|
|
|
|
| ||
Sovereign (9.4%) |
|
|
|
|
| ||
Republic of Philippines |
|
|
|
|
| ||
8.875%, 3/17/15 |
| 3,470 |
| 3,856 |
| ||
9.50%, 2/2/30 |
| 4,085 |
| 4,810 |
| ||
10.625%, 3/16/25 |
| 70 |
| 89 |
| ||
|
|
|
| 8,755 |
| ||
Qatar (0.6%) |
|
|
|
|
| ||
Sovereign (0.6%) |
|
|
|
|
| ||
State of Qatar (Registered) |
|
|
|
|
| ||
9.75%, 6/15/30 |
| 350 |
| 535 |
| ||
Russia (18.1%) |
|
|
|
|
| ||
Corporate (1.4%) |
|
|
|
|
| ||
Gaz Capital for Gazprom |
|
|
|
|
| ||
8.625%, 4/28/34 |
| 1,040 |
| 1,321 |
| ||
Sovereign (16.7%) |
|
|
|
|
| ||
Aries Vermoegensverwaltungs GmbH |
|
|
|
|
| ||
(Registered) |
|
|
|
|
| ||
9.60%, 10/25/14 |
| 1,500 |
| 1,943 |
| ||
Russian Federation (Registered) |
|
|
|
|
| ||
5.00%, 3/31/30 |
| (e)(n)3,818 |
| 4,315 |
| ||
8.25%, 3/31/10 |
| 1,680 |
| 1,787 |
| ||
11.00%, 7/24/18 |
| 2,266 |
| 3,345 |
| ||
12.75%, 6/24/28 |
| 2,250 |
| 4,134 |
| ||
|
|
|
| 15,524 |
| ||
|
|
|
| 16,845 |
| ||
Tunisia (0.2%) |
|
|
|
|
| ||
Sovereign (0.2%) |
|
|
|
|
| ||
Banque Centrale de Tunisie |
|
|
|
|
| ||
7.375%, 4/25/12 |
| 210 |
| 235 |
| ||
Turkey (5.9%) |
|
|
|
|
| ||
Sovereign (5.9%) |
|
|
|
|
| ||
Citigroup Global Markets Holdings, Inc. |
|
|
|
|
| ||
(Turkish Lira Index Linked) |
|
|
|
|
| ||
Zero Coupon, 2/23/06 - 1/25/07 |
| 1,227 |
| 1,796 |
| ||
Republic of Turkey |
|
|
|
|
| ||
11.00%, 1/14/13 |
| 1,960 |
| 2,497 |
| ||
11.50%, 1/23/12 |
| 950 |
| 1,210 |
| ||
|
|
|
| 5,503 |
| ||
Venezuela (6.0%) |
|
|
|
|
| ||
Sovereign (6.0%) |
|
|
|
|
| ||
Republic of Venezuela |
|
|
|
|
| ||
8.50%, 10/8/14 |
| 590 |
| 650 |
| ||
9.375%, 1/13/34 |
| $ | 2,292 |
| $ | 2,722 |
|
10.75%, 9/19/13 |
| 1,790 |
| 2,206 |
| ||
|
|
|
| 5,578 |
| ||
Total Debt Instruments (Cost $84,689) |
|
|
| 88,258 |
| ||
|
| No.of |
|
|
| ||
|
| Warrants |
|
|
| ||
Warrants (0.5%) |
|
|
|
|
| ||
Argentina (0.3%) |
|
|
|
|
| ||
Republic of Argentina |
|
|
|
|
| ||
expiring 12/15/35 |
| 16,231,454 |
| 263 |
| ||
expiring 12/15/35 |
| (d)317,929 |
| 17 |
| ||
|
|
|
| 280 |
| ||
Mexico (0.1%) |
|
|
|
|
| ||
United Mexican States, expiring 9/1/06 |
| (a)900 |
| 54 |
| ||
Nigeria (0.0%) |
|
|
|
|
| ||
Central Bank of Nigeria, expiring 11/15/20 |
| 750 |
| 42 |
| ||
Venezuela (0.1%) |
|
|
|
|
| ||
Republic of Venezuela Oil-Linked Payment |
|
|
|
|
| ||
Obligation, expiring 4/15/20 |
| 2,700 |
| 78 |
| ||
Total Warrants (Cost $279) |
|
|
| 454 |
| ||
|
| Face |
|
|
| ||
|
| Amount |
|
|
| ||
|
|
|
|
|
| ||
Short-Term Investment (3.8%) |
|
|
|
|
| ||
Repurchase Agreement (3.8%) |
|
|
|
|
| ||
J.P. Morgan Securities, Inc., 4.05%, |
|
|
|
|
| ||
dated 12/30/05, due 1/3/06, |
|
|
|
|
| ||
repurchase price $3,531 |
|
|
|
|
| ||
(Cost $3,529) |
| $ | (f)3,529 |
| 3,529 |
| |
Total Investments (99.3%) (Cost $88,497) |
|
|
| 92,241 |
| ||
Other Assets in Excess of Liabilities (0.7%) |
|
|
| 649 |
| ||
Net Assets (100%) |
|
|
| $ | 92,890 |
| |
(b) Issuer is in default.
(d) Security was valued at fair value — At December 31, 2005, the Portfolio held $106,000 of fair valued securities, representing 0.11% of net assets.
(e) 144A security — certain conditions for public sale may exist. Unless otherwise noted, these securities are deemed to be liquid.
(f) Represents the Portfolio’s undivided interest in a joint repurchase agreement which has a total value of $1,000,707,000. The repurchase agreement was fully collateralized by U.S. government agency securities at the date of this Portfolio of Investments as follows: Federal Farm Credit Bank: 2.00% to 7.35%, due 1/11/06 to 10/25/33; Federal Home Loan Mortgage Corp.: 1.88% to 7.22%, due 2/9/06 to 7/15/32; Federal National Mortgage Association: 2.50% to 7.25%, due 2/15/06 to 11/15/30, which had a total value of $1,020,741,791. The investment in the repurchase agreement is through participation in a joint account with affiliated parties pursuant to exemptive relief received by the Portfolio from the SEC.
(h) Variable/Floating Rate Security — interest rate changes on these instruments are based on changes in a designated base rate. The rates shown are those in effect on December 31, 2005.
The accompanying notes are an integral part of the financial statements. | 90 |
2005 Annual Report | |
|
|
December 31, 2005 | |
Portfolio of Investments (cont’d)
Emerging Markets Debt Portfolio
(n) Step Bond — coupon rate increases in increments to maturity. Rate disclosed is as of December 31, 2005. Maturity date disclosed is the ultimate maturity date.
MTN Medium-Term Note
Futures Contracts: |
|
|
|
|
|
The Portfolio had the following futures contract(s) open at period end: |
|
|
| ~ |
|
|
| Number of |
| Value |
| Expiration |
| Net |
| ||
Short: |
|
|
|
|
|
|
|
|
| ||
U.S. 2 Year |
|
|
|
|
|
|
|
|
| ||
Treasury Note |
| 86 |
| $ | 17,646 |
| Mar-06 |
| $ | (11) |
|
|
|
|
|
|
|
|
|
|
|
|
|
|
|
|
|
|
|
|
|
|
|
|
|
91 | The accompanying notes are an integral part of the financial statements. |
| 2005 Annual Report |
|
|
| December 31, 2005 |
Investment Overview
Money Market Portfolio
The Money Market Portfolio seeks to maximize current income and preserve capital while maintaining high levels of liquidity. Investments in shares of the Portfolio are neither insured nor guaranteed by the Federal Deposit Insurance Corporation or any other government agency. Although the seeks to preserve the value of your investment at $1.00 per share, it is possible to lose money by investing in thePortfolio.
Performance
The seven day yield and seven day effective yield (which assumes an annualization of the current yield with all reinvested) for the Portfolio as of December 31, 2005, were 3.94% and 4.01%, respectively. The yield quotation more closely reflects the current earnings of the Portfolio than the total return. As with all money market portfolios, the seven day yields are not necessarily indicative of future performance.
Factors Affecting Performance
• During the year ended December 31, 2005, many economic trends strengthened, despite rising oil prices, inflationary concerns, and ongoing increases to the federal funds target rate. The average ISM Manufacturing Index during the six months ended December 31, 2005 was five percent higher than the ISM Manufacturing Index during the six months ended June 30, 2005. (The ISM Manufacturing Index measures factory activity.) Job growth, as measured by the change in non-farm payrolls, was healthy most of the year. Although this Index decelerated slightly during September and October possibly due to the effects of Hurricane Katrina, non-farm payroll data showed strong recuperative signs in the final two months of the year. Likewise, the index of leading economic indicators contracted in September but rebounded significantly in the following two months.
• U.S. economic growth slowed somewhat in the quarter ended June 30, 2005 compared with the prior quarter, but strengthened meaningfully in the quarter ended September 2005. Gross domestic product (“GDP”) grew by 3.8% in the first quarter of 2005, 3.3% in the second quarter of 2005, and then expanded by 4.1% in the third quarter of 2005.
• In response to the strengthening economy, the Federal Open Market Committee (the “Fed”) raised the federal funds target rate eight times during the reporting period, in increments of 25 basis points. These increases brought the target rate to 4.25% at the end of the year. In its December statement, the Fed indicated that although it no longer viewed monetary policy as accommodative, future measured increases to its target rate may be required. The Fed also expressed concern that rising energy prices and other increased costs could amplify inflationary pressures.
Management Strategy
• As of December 31, 2005, the Portfolio had net assets of $416 million. The average maturity of the Portfolio was 12 days.
• In the face of steadily rising interest rates, we maintained a strategy of keeping the average maturity of the Portfolio short. This enabled us to better capitalize on interest rate increases.
• The Portfolio seeks high liquidity and preservation of capital while generating a yield reflecting prevailing money market conditions. To do this, the management continued its long standing policy of purchasing only high quality, very liquid, money market securities. Reflecting a conservative approach, the Portfolio did not include derivative securities during the reporting period.
Expense Examples
As a shareholder of the Portfolio, you may incur ongoing costs, including management fees and other Portfolio expenses. These examples are intended to help you understand ongoing costs (in dollars) of investing in the Portfolio and to compare these costs with the ongoing costs of investing other mutual funds.
The examples are based on an investment of $1,000 invested the beginning of the six-month period ended December 31, 2005 and held for the entire six-month period.
Actual Expenses
The first line of the tables below provides information about actual account values and actual expenses. You may use the information in this line, together with the amount you invested, to estimate the expenses that you paid over the period. Simply divide your account value by $1,000 (for example, an $8,600 account value divided by $1,000 = 8.6), then multiply the result by the number in the first line under the heading entitled “Expenses Paid During Period” to estimate the expenses you paid on your account during this period.
Hypothetical Example for Comparison Purposes
The second line of the tables below provides information about hypothetical account values and hypothetical expenses based on the Portfolio’s actual expense ratio and an assumed rate of return of 5% per year before expenses, which is not the Portfolio’s actual return. The hypothetical account values and expenses may not be used to estimate the actual ending
92
2005 Annual Report | |
|
|
December 31, 2005 | |
Investment Overview (cont’d)
Money Market Portfolio
account balance or expenses you paid for the period. You may use this information to compare the ongoing costs of investing in the Portfolio and other funds. To do so, compare this 5% hypothetical example with the 5% hypothetical examples that appear in the shareholder reports of the other funds.
Please note that the expenses shown in the table are meant to highlight your ongoing costs only and do not reflect any transactional costs, such as redemption fees. Therefore, the second line of the table is useful in comparing ongoing costs only, and will not help you determine the relative total costs ofowning different funds. In addition, if these transactional costs were included, your costs would have been higher.
|
| Beginning |
| Ending Account |
| Expenses Paid |
|
Class A |
|
|
|
|
|
|
|
Actual |
| $1,000.00 |
| $1,017.10 |
| $2.08 |
|
Hypothetical (5% average annual return before expenses) |
| 1,000.00 |
| 1,023.14 |
| 2.09 |
|
* Expenses are equal to Class A annualized net expense ratios of 0.41%,multiplied by the average account value over the period, multiplied by 184/365 (to reflect the one-half year period).
Graphic Presentation of Portfolio Holdings
The following graph depicts the Portfolio’s holdings by industry and/or security type, as a percentage of total investments.
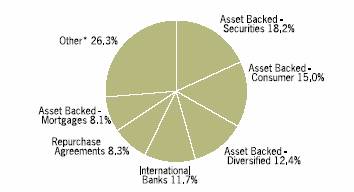
* Industries and/or security types which do not appear in the above graph, as well as those which represent less than 5% of total investments, if applicable, are included in the category labeled “Other”.
January 2006
93
| 2005 Annual Report |
|
|
| December 31, 2005 |
Portfolio of Investments
Money Market Portfolio
|
| Face |
|
|
|
|
| Amount |
| Value |
|
|
| (000) |
| (000) |
|
Certificates of Deposit (9.1%) |
|
|
|
|
|
Banking (4.3%) |
|
|
|
|
|
Wells Fargo Bank NA, 4.30%, 1/26/06 |
| $18,000 |
| $18,000 |
|
Major Banks (4.8%) |
|
|
|
|
|
World Savings Bank FSB, 4.04%, 1/3/06 |
| 20,000 |
| 20,000 |
|
Total Certificates of Deposit (Cost $38,000) |
|
|
| 38,000 |
|
Commercial Paper (82.8%) |
|
|
|
|
|
Asset Backed — Automotive (3.8%) |
|
|
|
|
|
DaimlerChrysler Revolving Auto Conduit LLC, |
|
|
|
|
|
4.34%, 1/26/06 |
| 16,000 |
| 15,952 |
|
Asset Backed — Consumer (15.0%) |
|
|
|
|
|
Bryant Park Funding LLC, 4.15%, 1/6/06 |
| (e)18,000 |
| 17,990 |
|
Gemini Securitization Corp., LLC |
|
|
|
|
|
4.33%, 1/24/06 |
| (e)18,000 |
| 17,950 |
|
Regency Markets No. 1 LLC |
|
|
|
|
|
4.31%, 1/10/06 |
| (e)8,000 |
| 7,991 |
|
4.32%, 1/17/06 |
| (e)10,000 |
| 9,981 |
|
Thames Asset Global Securitization, Inc., |
|
|
|
|
|
4.31%, 1/11/06 |
| (e)8,555 |
| 8,545 |
|
|
|
|
| 62,457 |
|
Asset Backed — Corporate (3.9%) |
|
|
|
|
|
Ciesco LLC, 4.15%, 1/9/06 |
| (e)16,000 |
| 15,985 |
|
Asset Backed — Diversified (12.5%) |
|
|
|
|
|
CRC Funding LLC |
|
|
|
|
|
4.14%, 1/10/06 |
| (e)10,000 |
| 9,990 |
|
4.20%, 1/9/06 |
| (e)8,000 |
| 7,993 |
|
Jupiter Securization Corp., 4.32%, 1/19/06 |
| 16,000 |
| 15,965 |
|
Yorktown Capital LLC, 4.33%, 1/24/06 |
| 18,000 |
| 17,950 |
|
|
|
|
| 51,898 |
|
Asset Backed — Mortgage (8.1%) |
|
|
|
|
|
Mortgage Interest Networking Trust, |
|
|
|
|
|
4.30%, 1/10/06 |
| (e)15,000 |
| 14,984 |
|
Sydney Capital Corp. |
|
|
|
|
|
4.35%, 1/23/06 |
| (e)12,000 |
| 11,968 |
|
4.44%, 3/1/06 |
| (e)6,690 |
| 6,642 |
|
|
|
|
| 33,594 |
|
Asset Backed — Securities (18.2%) |
|
|
|
|
|
Amstel Funding Corp., 4.47%, 1/6/06 |
| (e)20,000 |
| 19,988 |
|
Cancara Asset Securitisation LLC |
|
|
|
|
|
4.16%, 1/4/06 |
| (e)10,000 |
| 9,997 |
|
4.29%, 1/5/06 |
| (e)8,000 |
| 7,996 |
|
Galleon Capital LLC, 4.27%, 1/11/06 |
| (e)9,000 |
| 8,989 |
|
Golden Fish LLC |
|
|
|
|
|
4.26%, 1/13/06 |
| (e)9,000 |
| 8,987 |
|
4.27%, 1/17/06 |
| (e)10,000 |
| 9,981 |
|
Grampian Funding LLC, 4.31%, 1/18/06 |
| (e)10,000 |
| 9,980 |
|
|
|
|
| 75,918 |
|
Finance — Corporate (1.7%) |
|
|
|
|
|
CIT Group, Inc., 4.15%, 1/5/06 |
| 7,000 |
| 6,997 |
|
Insurance (3.6%) |
|
|
|
|
|
Irish Life & Permanent plc, 4.23%, 1/12/06 |
| (e)15,000 |
| 14,980 |
|
International Banks (11.7%) |
|
|
|
|
|
DNB NOR Bank ASA |
|
|
|
|
|
4.21%, 1/13/06 |
| $5,700 |
| $5,692 |
|
4.43%, 2/22/06 |
| 6,900 |
| 6,856 |
|
Nordea North America, Inc. |
|
|
|
|
|
4.22%, 1/19/06 |
| 10,200 |
| 10,179 |
|
4.24%, 1/20/06 |
| 10,100 |
| 10,077 |
|
Spintab AB, 4.17%, 1/5/06 |
| 16,000 |
| 15,993 |
|
|
|
|
| 48,797 |
|
Investment Bankers/Brokers/Services (4.3%) |
|
|
|
|
|
Goldman Sachs Group, Inc., 4.32%, 1/4/06 |
| 18,000 |
| 17,993 |
|
Total Commercial Paper (Cost $344,571) |
|
|
| 344,571 |
|
Repurchase Agreement (8.3%) |
|
|
|
|
|
Bear Stearns & Co., 4.27%, |
|
|
|
|
|
dated 12/30/05, due 1/3/06, |
|
|
|
|
|
repurchase price $34,616; fully |
|
|
|
|
|
collateralized by U.S. government agency |
|
|
|
|
|
securities at the date of this Portfolio of |
|
|
|
|
|
Investments as follows: Federal Home Loan |
|
|
|
|
|
Mortgage Corp., Adjustable Rate Mortgages: |
|
|
|
|
|
5.03% to 5.42%, due 2/1/30 to 6/1/35 and |
|
|
|
|
|
Federal National Mortgage Association, |
|
|
|
|
|
Adjustable Rate Mortgages: 3.82% to |
|
|
|
|
|
4.76%, due 4/1/33 to 10/1/35, valued at |
|
|
|
|
|
$35,292. |
|
|
|
|
|
(Cost $34,600) |
| 34,600 |
| 34,600 |
|
Total Investments (100.2%) (Cost $417,171) |
|
|
| 417,171 |
|
Liabilities in Excess of Other Assets (-0.2%) |
|
|
| (951 | ) |
Net Assets (100%) |
|
|
| $416,220 |
|
(e) 144A security — Certain conditions for public sale may exist. Unless otherwise noted, these securities are deemed to be liquid.
|
| The accompanying notes are an integral part of the financial statements. |
| 94 |
2005 Annual Report | |
|
|
December 31, 2005 | |
Investment Overview
Municipal Money Market Portfolio
The Municipal Money Market Portfolio seeks to maximize current tax-exempt income and preserve capital. Investments in shares of the Portfolio are neither insured nor guaranteed by the Federal Deposit Insurance Corporation or any other government agency. Although the Portfolio seeks to preserve its net asset value of $1.00 per share, it is possible to lose money by investing in the Portfolio.
Performance
The seven-day yield and seven-day effective yield (assuming an annualized current yield with all dividends reinvested) for the Portfolio as of December 31, 2005, were 3.02% and 3.07%, respectively. The seven-day taxable-equivalent yield and the seven-day taxable-equivalent effective yield for the Portfolio asof December 31, 2005 (assuming the maximum Federal income tax rate of 35%) were 4.65% and 4.72%, respectively. The seven-day yields are not necessarily indicative of future performance.
Factors Affecting Performance
• During the annual period ended December 31, 2005, the economy continued to grow at a good pace, despite soaring oil prices and the Gulf Coast hurricanes. Gains in employment were respectable, and consumer confidence and spending remained largely intact. Against this backdrop, the Federal Open Market Committee (the “Fed”) continued to raise the federal funds target rate. Through a series of eight increases of 25 basis points each, the Fed brought the target rate to 4.25% at the end of the period.
• Yields in the tax-free money markets fluctuated during the period, with shorter-term variable rate demand obligations (“VRDOs”) demonstrating greater volatility than one-year notes. For the overall period, however, yields across the municipal money market sector ended sharply higher.
• The Bond Buyer One Year Note Index, a benchmark indicator for the longest maturities in the tax-free money market sector, increased by 117 basis points, from 2.08% at the start of the reporting period to 3.25% at the close. The average yield for weekly VRDOs rose from 1.99% in June to 3.51% over the course of the year.
Management Strategies
• Throughout the period, we managed the Portfolio according to our long-standing conservative discipline. Based on our view that short-term rates would continue rise, we invested primarily in VRDOs. These securities offer daily or weekly reset features, which allowed the fund to quickly benefit from rising short-term rates.
• To help offset the potential volatility associated with without committing to the uncertainty of longer-dated municipal notes, we invested in fixed-rate tax-exempt commercial paper in the one- to three-month range. This strategy afforded us with the to invest in higher-yielding securities as they came to market.
• We used our research-intensive approach to seek out investments that would add value while meeting our conservative, risk-conscious criteria. These included financings for rural schools with attractive debt characteristics and the issues of certain smaller municipalities.
• We were able to increase the Portfolio’s yield by taking advantage of seasonal imbalances in supply and demand. Generally, we favored notes with maturities in the one to three-month range, while paring exposure to notes in the one-year range.
Expense Examples
As a shareholder of the Portfolio, you may incur ongoing costs, including management fees and other Portfolio expenses. These examples are intended to help you understand your ongoing costs (in dollars) of investing in the Portfolio and to compare these costs with the ongoing costs of investing in other mutual funds.
The examples are based on an investment of $1,000 invested at the beginning of the six-month period ended December 31, 2005 and held for the entire six-month period.
Actual Expenses
The first line of the tables below provides information about actual account values and actual expenses. You may use the information in this line, together with the amount you invested, to estimate the expenses that you paid over the period. Simply divide your account value by $1,000 (for example, an $8,600 account value divided by $1,000 = 8.6), then multiply the result by the number in the first line under the heading entitled “Expenses Paid During Period” to estimate the expenses you paid on your account during this period.
Hypothetical Example for Comparison Purposes
The second line of the tables below provides information about hypothetical account values and hypothetical expenses based on the Portfolio’s actual expense ratio and an assumed
95
| 2005 Annual Report |
|
|
| December 31, 2005 |
Investment Overview (cont’d)
Municipal Money Market Portfolio
rate of return of 5% per year before expenses, which is not the Portfolio’s actual return. The hypothetical account values and expenses may not be used to estimate the actual ending account balance or expenses you paid for the period. You may use this information to compare the ongoing costs of investing in the Portfolio and other funds. To do so, compare this 5% hypothetical example with the 5% hypothetical examples that appear in the shareholder reports of the other funds.
Please note that the expenses shown in the table are meant to highlight your ongoing costs only and do not reflect any transactional costs, such as redemption fees. Therefore, the line of the table is useful in comparing ongoing costs only, and will not help you determine the relative total costs of owning different funds. In addition, if these transactional costs were included, your costs would have been higher.
|
| Beginning |
| Ending Account |
| Expenses Paid |
|
Class A |
|
|
|
|
|
|
|
Actual |
| $1,000.00 |
| $1,011.40 |
| $2.03 |
|
Hypothetical (5% average annual return before expenses) |
| 1,000.00 |
| 1,023.19 |
| 2.04 |
|
* Expenses are equal to Class A annualized net expense ratios of 0.40%, multiplied by the average account value over the period, multiplied by 184/365 (to reflect the one-half year period).
Graphic Presentation of Portfolio Holdings
The following graph depicts the Portfolio’s holdings by security type, as a percentage of total investments.
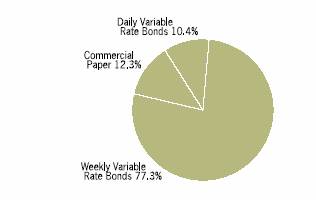
January 2006
96
2005 Annual Report | |
|
|
December 31, 2005 | |
Portfolio of Investments
Municipal Money Market Portfolio
|
| Face |
| Value (000) |
|
Tax-Exempt Instruments (99.9%) |
|
|
|
|
|
Fixed Rate Instruments (12.3%) |
|
|
|
|
|
Commercial Paper (12.3%) |
|
|
|
|
|
Austin, Texas, Combined Utility Systems, Ser. A, |
|
|
|
|
|
3.10%, 1/24/06 |
| $5,000 |
| $5,000 |
|
Honolulu City & County, Hawaii, Ser. H, |
|
|
|
|
|
2.85%, 2/16/06 |
| 2,700 |
| 2,700 |
|
Houston, Texas, Water & Sewer 2004, Ser. A, |
|
|
|
|
|
2.77%, 1/12/06 |
| 5,000 |
| 5,000 |
|
Illinois Educational Facilities Authority, Pooled, |
|
|
|
|
|
Ser. 1995, 3.08%, 1/25/06 |
| 5,800 |
| 5,800 |
|
Jacksonville Health Facilities Authority, Florida, Baptist |
|
|
|
|
|
Medical Center, Ser. 2004, 3.12%, 1/20/06 |
| 4,000 |
| 4,000 |
|
Metropolitan Atlanta Rapid Transit Authority, Georgia, |
|
|
|
|
|
Sales Tax, Ser. 2004 A, 3.12%, 1/26/06 |
| 7,500 |
| 7,500 |
|
North Carolina Capital Facilities Finance Agency, |
|
|
|
|
|
Duke University, Ser. A2, 3.10%, 1/24/06 |
| 1,606 |
| 1,606 |
|
Texas Public Finance Authority, Ser. 2003, |
|
|
|
|
|
2.82%, 1/19/06 |
| 4,500 |
| 4,500 |
|
Texas Tech University System, Texas, Ser. A, |
|
|
|
|
|
3.10%, 1/30/06 |
| 2,868 |
| 2,868 |
|
|
|
|
| 38,974 |
|
Variable/Floating Rate Instruments (87.6%) |
|
|
|
|
|
Daily Variable Rate Bonds (10.4%) |
|
|
|
|
|
Breckinridge County, Kentucky, Kentucky Association |
|
|
|
|
|
of Counties Leasing Trust 2002, Ser. A, |
|
|
|
|
|
3.70%, 2/1/32 |
| 4,200 |
| 4,200 |
|
Charlotte-Mecklenburg Hospital Authority, North |
|
|
|
|
|
Carolina, Carolinas Health Care System, |
|
|
|
|
|
Ser. 2005 D, 3.73%, 1/15/26 |
| 2,300 |
| 2,300 |
|
Clarksville Public Building Authority, Tennessee, |
|
|
|
|
|
Pooled Financing, Ser. 2003, 3.75%, 1/1/33 |
| 590 |
| 590 |
|
Harris County Health Facilities Development Corp., |
|
|
|
|
|
Texas, Methodist Hospital System, Ser. 2005 B, |
|
|
|
|
|
3.70%, 12/1/32 |
| 8,100 |
| 8,100 |
|
Harris County Health Facilities Development Corp., |
|
|
|
|
|
Texas, Texas Medical Center, Ser. B (FSA), |
|
|
|
|
|
3.70%, 5/15/29 |
| 4,740 |
| 4,740 |
|
Harris County Health Facilities Development Corp., |
|
|
|
|
|
Texas, Young Men’s Christian Association of the |
|
|
|
|
|
Greater Houston Area, Ser. 1999, |
|
|
|
|
|
3.70%, 7/1/34 |
| 3,200 |
| 3,200 |
|
Harris County Health Facilities Development Corp., |
|
|
|
|
|
Texas, Young Men’s Christian Association of the |
|
|
|
|
|
Greater Houston Area, Ser. 2002, |
|
|
|
|
|
3.70%, 7/1/37 |
| 1,800 |
| 1,800 |
|
Jacksonville Health Facilities Authority, Florida, Baptist |
|
|
|
|
|
Medical Center, Ser. 2003 A, 3.25%, 8/15/33 |
| 1,400 |
| 1,400 |
|
Missouri Development Finance Board, Nelson |
|
|
|
|
|
Gallery Foundation, Ser. 2001 B (MBIA), |
|
|
|
|
|
3.70%, 12/1/31 |
| 400 |
| 400 |
|
Murray City, Utah, IHC Health Services Inc., Ser. 2005 A, |
|
|
|
|
|
3.70%, 5/15/37 |
| 5,000 |
| 5,000 |
|
The University of North Carolina at Chapel Hill, |
|
|
|
|
|
Ser. 2001 B, 3.70%, 2/15/31 |
| 700 |
| 700 |
|
University of Missouri, Ser. 2001 A, 3.70%, 11/1/31 |
| 400 |
| 400 |
|
|
|
|
| 32,830 |
|
Weekly Variable Rate Bonds (77.2%) |
|
|
|
|
|
American Public Energy Agency, Nebraska, National |
|
|
|
|
|
Public Gas Agency 2003, Ser. A, 3.60%, 2/1/14 |
| $4,798 |
| $4,798 |
|
Bexar County Housing Finance Corp., Texas, Multi- |
|
|
|
|
|
Family P-FLOATs PT-2082, 3.55%, 1/20/10 |
| 1,000 |
| 1,000 |
|
Bi-State Development Agency of the Missouri-Illinois |
|
|
|
|
|
Metropolitan District, Metrolink Cross County |
|
|
|
|
|
Extension, Ser. 2002 A (FSA), 3.40%, 10/1/32 |
| 1,300 |
| 1,300 |
|
Broward County Health Facilities Authority, Florida, |
|
|
|
|
|
Henderson Mental Health Center, Ser. 2004, |
|
|
|
|
|
3.60%, 7/1/29 |
| 5,100 |
| 5,100 |
|
Centerra Metropolitan District No 1, Colorado, Ser. |
|
|
|
|
|
2004, 3.54%, 12/1/29 |
| 4,100 |
| 4,100 |
|
Central Washington University, Washington, |
|
|
|
|
|
System, Ser. 2002 ROCs II-R Ser. 2121 (FGIC), |
|
|
|
|
|
3.56%, 5/1/21 |
| 4,180 |
| 4,180 |
|
Charlotte, North Carolina, Convention Facility, Ser. |
|
|
|
|
|
2003 B COPs, 3.60%, 12/1/21 |
| 5,150 |
| 5,150 |
|
Chicago Board of Education, Illinois, Ser. 2004 D |
|
|
|
|
|
(FSA), 3.54%, 3/1/23 |
| 7,030 |
| 7,030 |
|
Coastal Bend Health Facilities Development Corp., |
|
|
|
|
|
Texas, Christus Health, Ser. 2005, Subser. B-3 |
|
|
|
|
|
(AMBAC), 3.49%, 7/1/41 |
| 5,000 |
| 5,000 |
|
Colorado Health Facilities Authority, NCMC, Inc., |
|
|
|
|
|
Ser. 2005 (FSA), 3.48%, 5/15/24 |
| 4,345 |
| 4,345 |
|
Dauphin County General Authority, Pennsylvania, |
|
|
|
|
|
Pinnacle Health System, Ser. 2005 (FSA), |
|
|
|
|
|
3.48%, 8/15/27 |
| 10,000 |
| 10,000 |
|
DeKalb County Housing Authority, Georgia, Multi- |
|
|
|
|
|
Family Housing Post Brook, Ser. 1995, 3.52%, |
|
|
|
|
|
6/1/25 |
| 4,300 |
| 4,300 |
|
Denver Urban Renewal Authority, Colorado, |
|
|
|
|
|
Stapleton Senior Tax Increment, Ser. 2004 A-1 |
|
|
|
|
|
P-FLOATs PT-999, 3.60%, 12/1/24 |
| 3,000 |
| 3,000 |
|
Duval County Housing Finance Authority, Florida, |
|
|
|
|
|
Sunbeam Road Apartments, Ser. 1997, |
|
|
|
|
|
3.52%, 7/1/25 |
| 4,100 |
| 4,100 |
|
Dyer, Indiana, Regency Place of Dyer, Ser. 1992 A |
|
|
|
|
|
TOBs (FHA), 3.69%, 8/1/12 |
| 2,520 |
| 2,520 |
|
Florida Department of Transportation, Turnpike, |
|
|
|
|
|
Ser. 2004 A ROCs II-R Ser. 314, 3.55%, 7/1/30 |
| 7,145 |
| 7,145 |
|
Fulton County Development Authority, Georgia, |
|
|
|
|
|
Morehouse College, Ser. 1997, 3.52%, 8/1/17 |
| 2,865 |
| 2,865 |
|
Garland Health Facilities Development Corp., Texas, |
|
|
|
|
|
Chambrel Club Hill, Ser. 2002, 3.54%, 11/15/32 |
| 4,900 |
| 4,900 |
|
Hamilton County, Ohio, Twin Towers and Twin |
|
|
|
|
|
Lakes, Ser. 2003 A, 3.59%, 7/1/23 |
| 3,500 |
| 3,500 |
|
Hawaii Department of Budget and Finance, Queens |
|
|
|
|
|
Health System, 1998, Ser. A, 3.56%, 7/1/26 |
| 6,300 |
| 6,300 |
|
Houston, Texas, Combined Utility System, MERLOTs, |
|
|
|
|
|
2004, Ser. C13 (MBIA), 3.54%, 5/15/25 |
| 2,985 |
| 2,985 |
|
Houston, Texas, Combined Utility System, MERLOTs, |
|
|
|
|
|
2004, Ser. C17 (MBIA), 3.54%, 5/15/26 |
| 3,000 |
| 3,000 |
|
Illinois Development Finance Authority, Jewish |
|
|
|
|
|
Federation of Metropolitan Chicago, Ser. 1999 |
|
|
|
|
|
(AMBAC), 3.58%, 9/1/24 |
| 2,760 |
| 2,760 |
|
Illinois Housing Development Authority, Village |
|
|
|
|
|
Center Development, Ser. 2004, 3.56%, 3/1/20 |
| 8,000 |
| 8,000 |
|
97 |
| The accompanying notes are an integral part of the financial statements. |
|
|
| 2005 Annual Report |
|
|
| December 31, 2005 |
Portfolio of Investments (cont’d)
Municipal Money Market Portfolio
|
| Face |
|
|
|
|
| Amount |
| Value |
|
|
| (000) |
| (000) |
|
Variable/Floating Rate Instruments (cont’d) |
|
|
|
|
|
Weekly Variable Rate Bonds (cont’d) |
|
|
|
|
|
Indiana Health Facility Financing Authority, |
|
|
|
|
|
Community Health Network, Ser. 2005 C, |
|
|
|
|
|
3.56%, 5/1/35 |
| $3,000 |
| $3,000 |
|
Indiana Transportation Finance Authority, Highway, |
|
|
|
|
|
Ser. 2004 C Ser. CDC 2004-5 (FGIC), |
|
|
|
|
|
3.55%, 12/1/18 |
| 2,735 |
| 2,735 |
|
Indiana Transportation Finance Authority, Highway, |
|
|
|
|
|
Ser. 2004 C, MERLOTs, Ser. B-21 (FGIC), |
|
|
|
|
|
3.54%, 12/1/22 |
| 2,095 |
| 2,095 |
|
Jackson County Hospital Finance Authority, |
|
|
|
|
|
Michigan, W. A. Foote Memorial Hospital, Ser. |
|
|
|
|
|
2005 A, 3.53%, 6/1/32 |
| 2,600 |
| 2,600 |
|
Jackson Health Educational & Housing Facility |
|
|
|
|
|
Board, Tennessee, Union University, Ser. 2005, |
|
|
|
|
|
3.55%, 7/1/19 |
| 5,800 |
| 5,800 |
|
Lancaster County Hospital Authority, Pennsylvania, |
|
|
|
|
|
Willow Valley Retirement Communities, Ser. |
|
|
|
|
|
2002 B (Radian), 3.53%, 12/1/07 |
| 4,000 |
| 4,000 |
|
Massachusetts Development Finance Agency, The |
|
|
|
|
|
Institute of Contemporary Art, Ser. 2004 A, |
|
|
|
|
|
3.52%, 7/1/34 |
| 7,000 |
| 7,000 |
|
Metropolitan Government of Nashville & Davidson |
|
|
|
|
|
County Health & Educational Facilities Board, |
|
|
|
|
|
Tennessee, Vanderbilt University, Ser. 2005 A-2, |
|
|
|
|
|
3.44%, 10/1/44 |
| 8,100 |
| 8,100 |
|
Minneapolis, Minnesota, Fairview Health Services, |
|
|
|
|
|
Ser. 2005 A (AMBAC), 3.48%, 11/15/32 |
| 4,000 |
| 4,000 |
|
Minneapolis, Minnesota, Guthrie Theater on the |
|
|
|
|
|
River, Ser. 2003 A, 3.51%, 10/1/23 |
| 6,700 |
| 6,700 |
|
Mississippi Development Bank, MGAM Natural Gas |
|
|
|
|
|
Supply, Ser. 2005, 3.60%, 7/1/15 |
| 8,000 |
| 8,000 |
|
Mississippi Hospital Equipment & Facilities |
|
|
|
|
|
Authority, Baptist Memorial Health Care, Ser. |
|
|
|
|
|
2004B1 P-FLOATs PA-1276, 3.56%, 9/1/24 |
| 6,025 |
| 6,025 |
|
Municipal Securities Pooled Trust Receipts, Various |
|
|
|
|
|
States, Ser. 2004 SG P-18, 3.66%, 1/1/35 |
| 2,374 |
| 2,374 |
|
New York City, New York, Fiscal 2006, Subser. E-4, |
|
|
|
|
|
3.51%, 8/1/34 |
| 6,500 |
| 6,500 |
|
North Carolina Medical Care Commission, Mission- |
|
|
|
|
|
St. Joseph’s Health System, Ser. 2003, |
|
|
|
|
|
3.60%, 10/1/18 |
| 6,425 |
| 6,425 |
|
Oak Park Heights, Minnesota, Multi-Family Boutwells |
|
|
|
|
|
Landing, Ser. 2005, 3.55%, 11/1/35 |
| 4,500 |
| 4,500 |
|
Orange County Industrial Development Authority, |
|
|
|
|
|
Florida, Independent Blood & Tissue Services of |
|
|
|
|
|
Florida, Inc., Ser. 2002, 3.55%, 10/1/27 |
| 3,290 |
| 3,290 |
|
Philadelphia Hospitals & Higher Education Facilities |
|
|
|
|
|
Authority, Pennsylvania, Temple University Health |
|
|
|
|
|
System, 2005, Ser. C, 3.40%, 7/1/28 |
| 5,500 |
| 5,500 |
|
Port St. Lucie, Florida, Utility System, Ser. 2005 |
|
|
|
|
|
(MBIA), 3.51%, 6/1/30 |
| 2,200 |
| 2,200 |
|
Raleigh, North Carolina, Downtown Improvement, |
|
|
|
|
|
Ser. 2005 B COPs, 3.49%, 2/1/34 |
| 7,000 |
| 7,000 |
|
Rancho Water District Financing Authority, |
|
|
|
|
|
California, Ser. 2001 B (FGIC), 3.31%, 8/1/31 |
| 4,400 |
| 4,400 |
|
Saline Area Schools, Michigan, Ser. 2002 B, |
|
|
|
|
|
3.39%, 5/1/30 |
| 2,500 |
| 2,500 |
|
Sayre Health Care Facilities Authority, Pennsylvania, |
|
|
|
|
|
VHA of Pennsylvania, Inc., Capital Asset |
|
|
|
|
|
Financing, Ser. 1985 B (AMBAC), |
|
|
|
|
|
3.56%, 12/1/20 |
| $1,400 |
| $1,400 |
|
University of New Mexico Regents, Ser. 2002 B, |
|
|
|
|
|
3.58%, 6/1/26 |
| 5,000 |
| 5,000 |
|
University of Texas, Permanent University Fund, |
|
|
|
|
|
PUTTERs, Ser. 411, 3.55%, 1/1/12 |
| 2,830 |
| 2,830 |
|
Virginia Public Building Authority, Ser. B ROCs II-R |
|
|
|
|
|
Ser. 6027, 3.56%, 8/1/14 |
| 1,985 |
| 1,985 |
|
Will County, Illinois, University of State Francis, |
|
|
|
|
|
Ser. 2005, 3.58%, 12/1/25 |
| 3,500 |
| 3,500 |
|
Williamsburg, Kentucky, Cumberland College, |
|
|
|
|
|
Ser. 2002, 3.56%, 9/1/32 |
| 9,190 |
| 9,190 |
|
York County School District No 4, South Carolina, |
|
|
|
|
|
Fort Mill, TOCs, Ser. 2004 F, 3.55%, 3/9/12 |
| 5,870 |
| 5,870 |
|
Yorkville United City Special Service Area 2004- |
|
|
|
|
|
106, Illinois, Special Tax, Ser. 2004, |
|
|
|
|
|
3.50%, 3/1/34 |
| 3,000 |
| 3,000 |
|
|
|
|
| 244,897 |
|
|
|
|
| 277,727 |
|
Total Tax-Exempt Instruments (Cost $316,701) |
|
|
| 316,701 |
|
Total Investments (99.9% (Cost $316,701) |
|
|
| 316,701 |
|
Other Assets in Excess of Liabilities (0.1%) |
|
|
| 442 |
|
Net Assets (100%) |
|
|
| $317,143 |
|
AMBAC |
| Ambac Assurance Corp. |
COPs |
| Certificates of Participation |
FGIC |
| Financial Guaranty Insurance Co. |
FHA |
| Federal Housing Administration |
FSA |
| Financial Security Assurance Inc. |
MBIA |
| MBIA Insurance Corp. |
MERLOTs |
| Municipal Exempt Receipts Liquidity Optional Tenders |
P-FLOATs |
| Puttable Floating Option Tax-Exempt Receipts |
PUTTERs |
| Puttable Tax-Exempt Receipts |
Radian |
| Radian Group, Inc. |
ROCs |
| Reset Option Certificates |
TOBs |
| Tender Option Bonds |
|
| The accompanying notes are an integral part of the financial statements. |
| 98 |
2005 Annual Report | |
|
|
December 31, 2005 | |
Portfolio of Investments (cont’d)
Municipal Money Market Portfolio
SUMMARY OF TAX-EXEMPT INSTRUMENTS BY STATE |
| |||||
|
|
|
| Percent |
| |
|
| Value |
| of Net |
| |
STATE |
| (000) |
| Assets |
| |
Texas |
| $ | 54,923 |
| 17.3 | % |
Illinois |
| 31,390 |
| 9.9 |
| |
Florida |
| 25,035 |
| 7.9 |
| |
North Carolina |
| 23,181 |
| 7.3 |
| |
Pennsylvania |
| 20,900 |
| 6.6 |
| |
Georgia |
| 16,865 |
| 5.3 |
| |
Minnesota |
| 15,200 |
| 4.8 |
| |
Tennessee |
| 14,490 |
| 4.6 |
| |
Mississippi |
| 14,025 |
| 4.4 |
| |
Kentucky |
| 13,390 |
| 4.2 |
| |
Colorado |
| 11,445 |
| 3.6 |
| |
Indiana |
| 10,350 |
| 3.3 |
| |
Hawaii |
| 9,000 |
| 2.8 |
| |
Massachusetts |
| 7,000 |
| 2.2 |
| |
New York |
| 6,500 |
| 2.1 |
| |
South Carolina |
| 5,870 |
| 1.9 |
| |
Michigan |
| 5,100 |
| 1.6 |
| |
New Mexico |
| 5,000 |
| 1.6 |
| |
Utah |
| 5,000 |
| 1.6 |
| |
Nebraska |
| 4,798 |
| 1.5 |
| |
California |
| 4,400 |
| 1.4 |
| |
Washington |
| 4,180 |
| 1.3 |
| |
Ohio |
| 3,500 |
| 1.1 |
| |
Delaware |
| 2,374 |
| 0.7 |
| |
Virginia |
| 1,985 |
| 0.6 |
| |
Missouri |
| 800 |
| 0.3 |
| |
|
| $ | 316,701 |
| 99.9 | % |
99 |
| The accompanying notes are an integral part of the financial statements. |
|
|
| 2005 Annual Report |
|
|
| December 31, 2005 |
Statements of Assets and Liabilities
|
| Active International |
| Emerging |
| Global |
| Global Value |
|
|
| Allocation |
| Markets |
| Franchise |
| Equity |
|
|
| Portfolio |
| Portfolio |
| Portfolio |
| Portfolio |
|
|
| (000) |
| (000) |
| (000) |
| (000) |
|
Assets: |
|
|
|
|
|
|
|
|
|
Investments in Securities of Unaffiliated Issuers, at Cost: |
| $725,260 |
| $1,458,198 |
| $68,949 |
| $97,466 |
|
Investment in Security of Affiliated Issuer, at Cost: |
| — |
| 3,415 |
| — |
| — |
|
Foreign Currency, at Cost: |
| 247 |
| 4,821 |
| 55 |
| 132 |
|
Investments in Securities of Unaffiliated Issuers, at Value:(1) |
| 852,060 |
| 1,955,965 |
| 88,995 |
| 113,612 |
|
Investment in Security of Affiliated Issuer, at Value: |
| — |
| 12,729 |
| — |
| — |
|
Foreign Currency, at Value: |
| 241 |
| 4,820 |
| 56 |
| 132 |
|
Cash |
| @— |
| — |
| 1 |
| 7 |
|
Due from Broker |
| 9,493 |
| — |
| — |
| — |
|
Receivable for Portfolio Shares Sold |
| 792 |
| 4,852 |
| — |
| — |
|
Receivable for Investments Sold |
| — |
| 4,893 |
| — |
| — |
|
Unrealized Appreciation on Foreign Currency Exchange Contracts |
| 1,479 |
| 5 |
| 374 |
| @— |
|
Foreign Withholding Tax Reclaim Receivable |
| 35 |
| 420 |
| 57 |
| 15 |
|
Dividends Receivable |
| 638 |
| 3,986 |
| 150 |
| 158 |
|
Interest Receivable |
| 14 |
| 123 |
| @— |
| 1 |
|
Other Assets |
| 15 |
| 37 |
| 2 |
| 3 |
|
Total Assets |
| 864,767 |
| 1,987,830 |
| 89,635 |
| 113,928 |
|
Liabilities: |
|
|
|
|
|
|
|
|
|
Collateral on Securities Loaned, at Value: |
| 65,097 |
| 98,534 |
| — |
| 5,083 |
|
Unrealized Depreciation on Foreign Currency Exchange Contracts |
| 3,658 |
| 2,396 |
| — |
| @— |
|
Payable for Investments Purchased |
| — |
| 3,932 |
| — |
| 623 |
|
Payable for Portfolio Shares Redeemed |
| 233 |
| 23,266 |
| 4 |
| 49 |
|
Investment Advisory Fees Payable |
| 1,063 |
| 5,126 |
| 175 |
| 179 |
|
Bank Overdraft Payable |
| — |
| 67 |
| — |
| — |
|
Payable for Administration Fees |
| 53 |
| 124 |
| 6 |
| 7 |
|
Payable for Custodian Fees |
| 40 |
| 248 |
| 7 |
| 7 |
|
Directors’ Fees and Expenses Payable |
| 16 |
| 65 |
| @— |
| 8 |
|
Distribution Fees — Class B |
| @— |
| 24 |
| 1 |
| 5 |
|
Deferred Capital Gain Country Tax |
| — |
| 785 |
| — |
| — |
|
Other Liabilities |
| 63 |
| 110 |
| 23 |
| 29 |
|
Total Liabilities |
| 70,223 |
| 134,677 |
| 216 |
| 5,990 |
|
Net Assets |
| $794,544 |
| $1,853,153 |
| $89,419 |
| $107,938 |
|
Net Assets Consist Of: |
|
|
|
|
|
|
|
|
|
Paid-in Capital |
| $732,282 |
| $1,343,145 |
| $68,856 |
| $92,860 |
|
Undistributed (Distributions in Excess of) Net Investment Income |
| (1,432 | ) | (11,174 | ) | 62 |
| (9 | ) |
Accumulated Net Realized Gain (Loss) |
| (62,204 | ) | 17,251 |
| 81 |
| (1,056 | ) |
Unrealized Appreciation (Depreciation) on: |
|
|
|
|
|
|
|
|
|
Investments |
| 126,800 |
| 506,308* |
| 20,046 |
| 16,146 |
|
Foreign Currency Exchange Contracts and Translations |
| (2,199 | ) | (2,377 | ) | 374 |
| (3 | ) |
Futures Contracts |
| 1,297 |
| — |
| — |
| — |
|
Net Assets |
| $794,544 |
| $1,853,153 |
| $89,419 |
| $107,938 |
|
CLASS A: |
|
|
|
|
|
|
|
|
|
Net Assets |
| $792,329 |
| $1,749,671 |
| $85,018 |
| $86,000 |
|
Shares Outstanding $0.001 par value shares of beneficial interest |
|
|
|
|
|
|
|
|
|
(500,000,000 shares authorized) (not in 000’s) |
| 63,719,002 |
| 68,999,265 |
| 5,419,569 |
| 4,817,103 |
|
Net Asset Value, Offering and Redemption Price Per Share |
| $12.43 |
| $25.36 |
| $15.69 |
| $17.85 |
|
CLASS B: |
|
|
|
|
|
|
|
|
|
Net Assets |
| $2,215 |
| $103,482 |
| $4,401 |
| $21,938 |
|
Shares Outstanding $0.001 par value shares of beneficial interest |
|
|
|
|
|
|
|
|
|
(500,000,000 shares authorized) (not in 000’s) |
| 175,287 |
| 4,127,085 |
| 282,894 |
| 1,240,275 |
|
Net Asset Value, Offering and Redemption Price Per Share |
| $12.64 |
| $25.07 |
| $15.56 |
| $17.69 |
|
(1) Including: |
|
|
|
|
|
|
|
|
|
Repurchase Agreements, at Value: |
| $60,156 |
| $41,637 |
| $1,535 |
| $3,425 |
|
Securities on Loan, at Value: |
| 61,520 |
| 94,556 |
| — |
| 4,875 |
|
@ Amount is less than $500.
* Net of $773 Deferred Capital Gain Country Tax.
|
| The accompanying notes are an integral part of the financial statements. |
| 100 |
2005 Annual Report | |
|
|
December 31, 2005 | |
Statements of Assets and Liabilities
|
| International |
| International |
| International |
| International |
| International |
|
|
| Equity |
| Growth Equity |
| Magnum |
| Real Estate |
| Small Cap |
|
|
| Portfolio |
| Portfolio^ |
| Portfolio |
| Portfolio |
| Portfolio |
|
|
| (000) |
| (000) |
| (000) |
| (000) |
| (000) |
|
Assets: |
|
|
|
|
|
|
|
|
|
|
|
Investments in Securities of Unaffiliated Issuers, at Cost: |
| $6,968,039 |
| $4,924 |
| $98,395 |
| $236,990 |
| $1,108,922 |
|
Foreign Currency, at Cost: |
| 54,972 |
| 1,175 |
| 407 |
| 5,765 |
| — |
|
Investments in Securities of Unaffiliated Issuers, at Value:(1) |
| 8,292,770 |
| 4,891 |
| 116,332 |
| 255,706 |
| 1,396,745 |
|
Foreign Currency, at Value: |
| 54,919 |
| 1,175 |
| 201 |
| 5,765 |
| — |
|
Cash |
| — |
| 3,277 |
| 1 |
| 1 |
| 1 |
|
Due from Adviser |
| — |
| 16 |
| — |
| — |
| — |
|
Due from Broker |
| — |
| — |
| 1,081 |
| — |
| — |
|
Receivable for Portfolio Shares Sold |
| 23,812 |
| — |
| 67 |
| 657 |
| 670 |
|
Receivable for Investments Sold |
| 113,309 |
| 94 |
| 87 |
| 2,091 |
| 1,671 |
|
Unrealized Appreciation on Foreign Currency Exchange Contracts |
| 1,647 |
| — |
| 355 |
| 11 |
| @— |
|
Foreign WithholdingTax Reclaim Receivable |
| 313 |
| — |
| 14 |
| 59 |
| 427 |
|
Dividends Receivable |
| 7,254 |
| — |
| 75 |
| 512 |
| 1,017 |
|
Interest Receivable |
| — |
| — |
| 3 |
| 1 |
| 13 |
|
Other Assets |
| 217 |
| — |
| 2 |
| 2 |
| 36 |
|
Total Assets |
| 8,494,241 |
| 9,453 |
| 118,218 |
| 264,805 |
| 1,400,580 |
|
Liabilities: |
|
|
|
|
|
|
|
|
|
|
|
Collateral on Securities Loaned, at Value |
| 540,416 |
| — |
| 7,396 |
| — |
| — |
|
Unrealized Depreciation on Foreign Currency Exchange Contracts |
| 810 |
| — |
| 586 |
| 2 |
| 4 |
|
Payable for Investments Purchased |
| 72 |
| 4,473 |
| — |
| 5,250 |
| 1,742 |
|
Bank Overdraft Payable |
| 3,356 |
| — |
| — |
| — |
| — |
|
Foreign Currency Overdraft Payable |
| — |
| — |
| — |
| — |
| 548 |
|
Payable for Portfolio Shares Redeemed |
| 20,937 |
| — |
| 15 |
| 13 |
| 5,622 |
|
Investment Advisory Fees Payable |
| 16,045 |
| — |
| 161 |
| 289 |
| 3,286 |
|
Payable for Administration Fees |
| 540 |
| @— |
| 8 |
| 15 |
| 95 |
|
Payable for Custodian Fees |
| 348 |
| 1 |
| 13 |
| 21 |
| 88 |
|
Directors’ Fees and Expenses Payable |
| 188 |
| @— |
| 9 |
| 1 |
| 17 |
|
Distribution Fees — Class B |
| 255 |
| @— |
| 1 |
| 2 |
| — |
|
Other Liabilities |
| 417 |
| 16 |
| 26 |
| 27 |
| 100 |
|
Total Liabilities |
| 583,384 |
| 4,490 |
| 8,215 |
| 5,620 |
| 11,502 |
|
Net Assets |
| $7,910,857 |
| $4,963 |
| $110,003 |
| $259,185 |
| $1,389,078 |
|
Net Assets Consist Of: |
|
|
|
|
|
|
|
|
|
|
|
Paid-in Capital |
| $6,440,705 |
| $5,000 |
| $96,985 |
| $237,739 |
| $1,053,908 |
|
Undistributed (Distributions in Excess of) Net Investment Income |
| (2,762 | ) | @— |
| (25 | ) | (490 | ) | (6,847 | ) |
Accumulated Net Realized Gain (Loss) |
| 147,377 |
| (1 | ) | (4,856 | ) | 3,237 |
| 54,227 |
|
Unrealized Appreciation (Depreciation) on: |
|
|
|
|
|
|
|
|
|
|
|
Investments |
| 1,324,732 |
| (33 | ) | 17,937 |
| 18,716 |
| 287,823 |
|
Foreign Currency Exchange Contracts and Translations |
| 805 |
| (3 | ) | (237 | ) | (17 | ) | (33 | ) |
Futures Contracts |
| — |
| — |
| 199 |
| — |
| — |
|
Net Assets |
| $7,910,857 |
| $4,963 |
| $110,003 |
| $259,185 |
| $1,389,078 |
|
CLASS A: |
|
|
|
|
|
|
|
|
|
|
|
Net Assets |
| $6,704,732 |
| $4,864 |
| $106,369 |
| $250,511 |
| $1,389,078 |
|
Shares Outstanding $0.001 par value shares of beneficial interest |
|
|
|
|
|
|
|
|
|
|
|
(500,000,000 shares authorized) (not in 000’s) |
| 329,618,679 |
| 490,000 |
| 8,178,030 |
| 10,601,817 |
| 57,542,060 |
|
Net Asset Value, Offering and Redemption Price Per Share |
| $20.34 |
| $9.93 |
| $13.01 |
| $23.63 |
| $24.14 |
|
CLASS B: |
|
|
|
|
|
|
|
|
|
|
|
Net Assets |
| $1,206,125 |
| $99 |
| $3,634 |
| $8,674 |
| $— |
|
Shares Outstanding $0.001 par value shares of beneficial interest |
|
|
|
|
|
|
|
|
|
|
|
(500,000,000 shares authorized) (not in 000’s) |
| 59,735,333 |
| 10,000 |
| 280,171 |
| 366,382 |
| — |
|
Net Asset Value, Offering and Redemption Price Per Share |
| $20.19 |
| $9.93 |
| $12.97 |
| $23.68 |
| $— |
|
(1) Including: Repurchase Agreements, at Value: |
| $— |
| $— |
| $12,450 |
| $2,324 |
| $57,784 |
|
Securities on Loan, at Value: |
| 509,480 |
| — |
| 7,006 |
| — |
| — |
|
@ Amount is less than $500.
^ International Growth Equity Portfolio commenced operations on December 27, 2005.
101 |
| The accompanying notes are an integral part of the financial statements. |
|
|
2005 Annual Report | |
|
|
December 31, 2005 | |
Statements of Assets and Liabilities
|
|
|
| Large Cap |
|
|
|
|
| ||||
|
| Focus |
| Relative |
| Small Company |
| U.S. Large |
| ||||
|
| Equity |
| Value |
| Growth |
| Cap Growth |
| ||||
|
| Portfolio |
| Portfolio |
| Portfolio |
| Portfolio |
| ||||
|
| (000) |
| (000) |
| (000) |
| (000) |
| ||||
Assets: |
|
|
|
|
|
|
|
|
| ||||
Investments in Securities of Unaffiliated Issuers, at Cost: |
| $ | 54,761 |
| $ | 185,131 |
| $ | 1,488,419 |
| $ | 794,987 |
|
Investments in Securities of Unaffiliated Issuers, at Value:(1) |
| 66,472 |
| 205,262 |
| 1,725,945 |
| 906,306 |
| ||||
Cash |
| — |
| 1 |
| @— |
| — |
| ||||
Receivable for Portfolio Shares Sold |
| 336 |
| 327 |
| 5,483 |
| 1,754 |
| ||||
Dividends Receivable |
| 73 |
| 234 |
| 52 |
| 1,102 |
| ||||
Interest Receivable |
| 1 |
| 2 |
| 21 |
| 6 |
| ||||
Other Assets |
| 1 |
| 4 |
| 39 |
| 18 |
| ||||
Total Assets |
| 66,883 |
| 205,830 |
| 1,731,540 |
| 909,186 |
| ||||
Liabilities: |
|
|
|
|
|
|
|
|
| ||||
Payable for Portfolio Shares Redeemed |
| — |
| 1,030 |
| 22,759 |
| 414 |
| ||||
Investment Advisory Fees Payable |
| 79 |
| 246 |
| 3,649 |
| 959 |
| ||||
Bank Overdraft Payable |
| 3 |
| — |
| — |
| 40 |
| ||||
Payable for Administration Fees |
| 5 |
| 14 |
| 118 |
| 63 |
| ||||
Payable for Custodian Fees |
| 2 |
| 5 |
| 12 |
| 6 |
| ||||
Directors’ Fees and Expenses Payable |
| 7 |
| 9 |
| 11 |
| 43 |
| ||||
Distribution Fees — Class B |
| 3 |
| 22 |
| 172 |
| 8 |
| ||||
Other Liabilities |
| 21 |
| 32 |
| 122 |
| 70 |
| ||||
Total Liabilities |
| 120 |
| 1,358 |
| 26,843 |
| 1,603 |
| ||||
Net Assets |
| $ | 66,763 |
| $ | 204,472 |
| $ | 1,704,697 |
| $ | 907,583 |
|
Net Assets Consist Of: |
|
|
|
|
|
|
|
|
| ||||
Paid-in Capital |
| $ | 83,789 |
| $ | 181,788 |
| $ | 1,485,095 |
| $ | 871,954 |
|
Undistributed (Distributions in Excess of) Net Investment Income |
| (7 | ) | (11 | ) | — |
| (44 | ) | ||||
Accumulated Net Investment Loss |
| — |
| — |
| (134 | ) | — |
| ||||
Accumulated Net Realized Gain (Loss) |
| (28,730 | ) | 2,564 |
| (17,790 | ) | (75,646 | ) | ||||
Unrealized Appreciation (Depreciation) on: |
|
|
|
|
|
|
|
|
| ||||
Investments |
| 11,711 |
| 20,131 |
| 237,526 |
| 111,319 |
| ||||
Net Assets |
| $ | 66,763 |
| $ | 204,472 |
| $ | 1,704,697 |
| $ | 907,583 |
|
CLASS A: |
|
|
|
|
|
|
|
|
| ||||
Net Assets |
| $ | 54,321 |
| $ | 102,973 |
| $ | 896,204 |
| $ | 871,905 |
|
Shares Outstanding $0.001 par value shares of beneficial interest |
|
|
|
|
|
|
|
|
| ||||
(500,000,000 shares authorized) (not in 000’s) |
| 3,674,180 |
| 9,279,295 |
| 69,551,341 |
| 44,746,073 |
| ||||
Net Asset Value, Offering and Redemption Price Per Share |
| $ | 14.78 |
| $ | 11.10 |
| $ | 12.89 |
| $ | 19.49 |
|
CLASS B: |
|
|
|
|
|
|
|
|
| ||||
Net Assets |
| $ | 12,442 |
| $ | 101,499 |
| $ | 808,493 |
| $ | 35,678 |
|
Shares Outstanding $0.001 par value shares of beneficial interest |
|
|
|
|
|
|
|
|
| ||||
(500,000,000 shares authorized) (not in 000’s) |
| 860,845 |
| 9,151,163 |
| 65,701,306 |
| 1,857,111 |
| ||||
Net Asset Value, Offering and Redemption Price Per Share |
| $ | 14.45 |
| $ | 11.09 |
| $ | 12.31 |
| $ | 19.21 |
|
(1) Including: |
|
|
|
|
|
|
|
|
| ||||
Repurchase Agreements, at Value: |
| $ | 3,399 |
| $ | 9,508 |
| $ | 93,655 |
| $ | 25,493 |
|
@ Amount is less than $500.
|
| The accompanying notes are an integral part of the financial statements. |
| 102 |
| 2005 Annual Report |
|
|
| December 31, 2005 |
Statements of Assets and Liabilities
|
|
|
| Emerging |
|
|
| Municipal |
| ||||
|
|
|
| Markets |
| Money |
| Money |
| ||||
|
| U.S. Real Estate |
| Debt |
| Market |
| Market |
| ||||
|
| Portfolio |
| Portfolio |
| Portfolio |
| Portfolio |
| ||||
|
| (000) |
| (000) |
| (000) |
| (000) |
| ||||
Assets: |
|
|
|
|
|
|
|
|
| ||||
Investments in Securities of Unaffiliated Issuers, at Cost: |
| $ | 890,004 |
| $ | 88,497 |
| $ | 417,171 |
| $ | 316,701 |
|
Foreign Currency, at Cost: |
| — |
| 13 |
| — |
| — |
| ||||
Investments in Securities of Unaffiliated Issuers, at Value:(1) |
| 1,356,284 |
| 92,241 |
| 417,171 |
| 316,701 |
| ||||
Foreign Currency, at Value: |
| — |
| 13 |
| — |
| — |
| ||||
Cash |
| 356 |
| 1 |
| 51 |
| 59 |
| ||||
Due from Broker |
| — |
| 444 |
| — |
| — |
| ||||
Receivable for Portfolio Shares Sold |
| 2,401 |
| 79 |
| — |
| — |
| ||||
Receivable for Investments Sold |
| 10,971 |
| — |
| — |
| 25 |
| ||||
Unrealized Appreciation on Foreign Currency Exchange Contracts |
| @— |
| — |
| — |
| — |
| ||||
Dividends Receivable |
| 5,908 |
| — |
| — |
| — |
| ||||
Interest Receivable |
| 2 |
| 1,785 |
| 227 |
| 1,155 |
| ||||
Other Assets |
| 33 |
| 2 |
| 13 |
| 10 |
| ||||
Total Assets |
| 1,375,955 |
| 94,565 |
| 417,462 |
| 317,950 |
| ||||
Liabilities: |
|
|
|
|
|
|
|
|
| ||||
Payable for Investments Purchased |
| 4,570 |
| 1,135 |
| — |
| — |
| ||||
Payable for Portfolio Shares Redeemed |
| 1,314 |
| 5 |
| — |
| — |
| ||||
Dividends Declared |
| — |
| — |
| 722 |
| 420 |
| ||||
Investment Advisory Fees Payable |
| 2,491 |
| 166 |
| 317 |
| 272 |
| ||||
Payable for Administration Fees |
| 94 |
| 7 |
| 18 |
| 15 |
| ||||
Payable for Custodian Fees |
| 11 |
| 4 |
| 3 |
| 2 |
| ||||
Directors’ Fees and Expenses Payable |
| 19 |
| 6 |
| 97 |
| 53 |
| ||||
Distribution Fees — Class B |
| 33 |
| @— |
| — |
| — |
| ||||
Other Liabilities |
| 105 |
| 352 |
| 85 |
| 45 |
| ||||
Total Liabilities |
| 8,637 |
| 1,675 |
| 1,242 |
| 807 |
| ||||
Net Assets |
| $ | 1,367,318 |
| $ | 92,890 |
| $ | 416,220 |
| $ | 317,143 |
|
Net Assets Consist Of: |
|
|
|
|
|
|
|
|
| ||||
Paid-in Capital |
| $ | 860,177 |
| $ | 173,367 |
| $ | 416,190 |
| $ | 317,124 |
|
Undistributed (Distributions in Excess of) Net Investment Income |
| 202 |
| (316 | ) | 34 |
| 21 |
| ||||
Accumulated Net Realized Gain (Loss) |
| 40,659 |
| (83,894 | ) | (4 | ) | (2 | ) | ||||
Unrealized Appreciation (Depreciation) on: |
|
|
|
|
|
|
|
|
| ||||
Investments |
| 466,280 |
| 3,744 |
| — |
| — |
| ||||
Foreign Currency Exchange Contracts and Translations |
| @— |
| @— |
| — |
| — |
| ||||
Futures Contracts |
| — |
| (11 | ) | — |
| — |
| ||||
Net Assets |
| $ | 1,367,318 |
| $ | 92,890 |
| $ | 416,220 |
| $ | 317,143 |
|
CLASS A: |
|
|
|
|
|
|
|
|
| ||||
Net Assets |
| $ | 1,209,668 |
| $ | 92,294 |
| $ | 416,220 |
| $ | 317,143 |
|
Shares Outstanding $0.001 par value shares of beneficial interest (500,000,000 shares authorized for U.S. Real Estate Portfolio and Emerging Market Debt Portfolio) (4,000,000,000 shares authorized for Money Market Portfolio and Municipal Money Market Portfolio) (not in 000’s) |
| 51,671,751 |
| 23,872,226 |
| 416,366,538 |
| 317,124,066 |
| ||||
Net Asset Value, Offering and Redemption Price Per Share |
| $ | 23.41 |
| $ | 3.87 |
| $ | 1.00 |
| $ | 1.00 |
|
CLASS B: |
|
|
|
|
|
|
|
|
| ||||
Net Assets |
| $ | 157,650 |
| $ | 596 |
| $ | — |
| $ | — |
|
Shares Outstanding $0.001 par value shares of beneficial interest (unlimited number of shares authorized) (not in 000’s) |
| 6,791,247 |
| 150,557 |
| — |
| — |
| ||||
Net Asset Value, Offering and Redemption Price Per Share |
| $ | 23.21 |
| $ | 3.95 |
| $ | — |
| $ | — |
|
(1) Including: |
|
|
|
|
|
|
|
|
| ||||
Repurchase Agreements, at Value: |
| $ | 9,226 |
| $ | 3,529 |
| $ | 34,600 |
| $ | — |
|
@ Amount is less than $500.
103 |
| The accompanying notes are an integral part of the financial statements. |
|
|
2005 Annual Report | |
|
|
December 31, 2005 | |
Statements of Operations
For the Year Ended December 31, 2005
|
| Active |
|
|
|
|
| Global |
|
|
|
|
| International |
| Emerging |
| Global |
| Value |
| International |
|
|
| Allocation |
| Markets |
| Franchise |
| Equity |
| Equity |
|
|
| Portfolio |
| Portfolio |
| Portfolio |
| Portfolio |
| Portfolio |
|
|
| (000) |
| (000) |
| (000) |
| (000) |
| (000) |
|
Investment Income: |
|
|
|
|
|
|
|
|
|
|
|
Dividends from Securities of Unaffiliated Issuers |
| $14,383 |
| $37,182 |
| $2,143 |
| $2,752 |
| $252,298 |
|
Interest |
| 2,479 |
| 3,235 |
| 67 |
| 165 |
| 10,488 |
|
Less: Foreign Taxes Withheld |
| (979 | ) | (2,618 | ) | (91 | ) | (117 | ) | (19,724 | ) |
Total Investment Income |
| 15,883 |
| 37,799 |
| 2,119 |
| 2,800 |
| 243,062 |
|
Expenses: |
|
|
|
|
|
|
|
|
|
|
|
Investment Advisory Fees (Note B) |
| 3,918 |
| 17,617 |
| 633 |
| 708 |
| 65,520 |
|
Administration Fees (Note C) |
| 482 |
| 1,172 |
| 63 |
| 85 |
| 6,552 |
|
Custodian Fees (Note E) |
| 237 |
| 1,509 |
| 39 |
| 45 |
| 2,158 |
|
Directors’ Fees and Expenses |
| 9 |
| 24 |
| 1 |
| 2 |
| 125 |
|
Professional Fees |
| 64 |
| 137 |
| 35 |
| 34 |
| 400 |
|
Bank Overdraft Expense |
| @— |
| 8 |
| 1 |
| — |
| 3 |
|
Shareholder ReportingFees |
| 189 |
| 152 |
| 23 |
| 29 |
| 749 |
|
Distribution Fees — Class B (Note D) |
| 6 |
| 234 |
| 11 |
| 69 |
| 2,861 |
|
Other Expenses |
| 115 |
| 130 |
| 51 |
| 53 |
| 468 |
|
Total Expenses |
| 5,020 |
| 20,983 |
| 857 |
| 1,025 |
| 78,836 |
|
Waiver of Investment Advisory Fees (Note B) |
| (192 | ) | — |
| (54 | ) | — |
| — |
|
Expense Offset (Note E) |
| (1 | ) | (6 | ) | (1 | ) | @— |
| (5 | ) |
Net Expenses |
| 4,827 |
| 20,977 |
| 802 |
| 1,025 |
| 78,831 |
|
Net Investment Income (Loss) |
| 11,056 |
| 16,822 |
| 1,317 |
| 1,775 |
| 164,231 |
|
Realized Gain (Loss): |
|
|
|
|
|
|
|
|
|
|
|
Investments Sold |
| 25,221 |
| 229,071* |
| 4,098 |
| 5,052 |
| 793,252 |
|
Foreign Currency Transactions |
| (6,997 | ) | 283 |
| 92 |
| (42 | ) | (53,388 | ) |
Futures Contracts |
| 13,146 |
| — |
| — |
| — |
| — |
|
Net Realized Gain (Loss) |
| 31,370 |
| 229,354 |
| 4,190 |
| 5,010 |
| 739,864 |
|
Change in Unrealized Appreciation (Depreciation): |
|
|
|
|
|
|
|
|
|
|
|
Investments |
| 51,513 |
| 204,528** |
| 2,249 |
| (540 | ) | (397,312 | ) |
Foreign Currency Exchange Contracts and Translations |
| (3,491 | ) | 2,214 |
| 1,217 |
| (16 | ) | (873 | ) |
Futures Contracts |
| 186 |
| — |
| — |
| — |
| — |
|
Net Change in Unrealized Appreciation (Depreciation) |
| 48,208 |
| 206,742 |
| 3,466 |
| (556 | ) | (398,185 | ) |
Total Net Realized Gain (Loss) and Change in Unrealized Appreciation (Depreciation) |
| 79,578 |
| 436,096 |
| 7,656 |
| 4,454 |
| 341,679 |
|
Net Increase (Decrease) in Net Assets Resultingfrom Operations |
| $90,634 |
| $452,918 |
| $8,973 |
| $6,229 |
| $505,910 |
|
@ Amount is less than $500.
* Net of Capital Gain Country Tax of $120.
** Net of Decrease in Deferred Capital Gain Country Tax Accrual of $168.
|
| The accompanying notes are an integral part of the financial statements. |
| 104 |
| 2005 Annual Report |
|
|
| December 31, 2005 |
Statements of Operations
For the Year Ended December 31, 2005
|
| International |
|
|
| International |
|
|
|
|
|
|
| Growth |
| International |
| Real |
| International |
| Focus |
|
|
| Equity |
| Magnum |
| Estate |
| Small Cap |
| Equity |
|
|
| Portfolio* |
| Portfolio |
| Portfolio |
| Portfolio |
| Portfolio |
|
|
| (000) |
| (000) |
| (000) |
| (000) |
| (000) |
|
Investment Income: |
|
|
|
|
|
|
|
|
|
|
|
Dividends from Securities of Unaffiliated Issuers |
| $— |
| $2,341 |
| $4,009 |
| $33,025 |
| $347 |
|
Interest |
| @— |
| 317 |
| 266 |
| 1,230 |
| 40 |
|
Less: Foreign Taxes Withheld |
| — |
| (199 | ) | (463 | ) | (2,537 | ) | (8 | ) |
Total Investment Income |
| @— |
| 2,459 |
| 3,812 |
| 31,718 |
| 379 |
|
Expenses: |
|
|
|
|
|
|
|
|
|
|
|
Investment Advisory Fees (Note B) |
| @— |
| 783 |
| 1,061 |
| 12,992 |
| 363 |
|
Administration Fees (Note C) |
| @— |
| 78 |
| 106 |
| 1,094 |
| 47 |
|
Custodian Fees (Note E) |
| 1 |
| 80 |
| 102 |
| 556 |
| 11 |
|
Directors’ Fees and Expenses |
| @— |
| 2 |
| 1 |
| 19 |
| 1 |
|
Bank Overdraft Expense |
| — |
| 1 |
| 1 |
| 1 |
| 1 |
|
Professional Fees |
| 16 |
| 49 |
| 78 |
| 72 |
| 52 |
|
Shareholder Reporting Fees |
| @— |
| 54 |
| 23 |
| 202 |
| 11 |
|
Distribution Fees — Class B (Note D) |
| @— |
| 8 |
| 5 |
| — |
| 21 |
|
Other Expenses |
| @— |
| 54 |
| 105 |
| 99 |
| 46 |
|
Total Expenses |
| 17 |
| 1,109 |
| 1,482 |
| 15,035 |
| 553 |
|
Waiver of Investment Advisory Fees (Note ) |
| @— |
| (122 | ) | (148 | ) | — |
| — |
|
Reimbursement of Investment Advisory Fees (Note B) |
| (17 | ) | — |
| — |
| — |
| — |
|
Expense Offset (Note E) |
| — |
| @— |
| (1 | ) | (3 | ) | @— |
|
Net Expenses |
| @— |
| 987 |
| 1,333 |
| 15,032 |
| 553 |
|
Net Investment Income (Loss) |
| @— |
| 1,472 |
| 2,479 |
| 16,686 |
| (174 | ) |
Realized Gain (Loss): |
|
|
|
|
|
|
|
|
|
|
|
Investments Sold |
| @— |
| 7,255 |
| 18,186 |
| 225,765 |
| 3,931 |
|
Foreign Currency Transactions |
| (1 | ) | (476 | ) | (41 | ) | (577 | ) | — |
|
Futures Contracts |
| — |
| 2,117 |
| — |
| — |
| — |
|
Net Realized Gain (Loss) |
| (1 | ) | 8,896 |
| 18,145 |
| 225,188 |
| 3,931 |
|
Change in Unrealized Appreciation (Depreciation): |
|
|
|
|
|
|
|
|
|
|
|
Investments |
| (33 | ) | 743 |
| 2,953 |
| (72,474 | ) | 5,645 |
|
Foreign Currency Exchange Contracts and Translations |
| (3 | ) | (383 | ) | (24 | ) | (205 | ) | — |
|
Futures Contracts |
| — |
| 69 |
| — |
| — |
| — |
|
Net Change in Unrealized Appreciation (Depreciation) |
| (36 | ) | 429 |
| 2,929 |
| (72,679 | ) | 5,645 |
|
Total Net Realized Gain (Loss) and Change in Unrealized Appreciation (Depreciation) |
| (37 | ) | 9,325 |
| 21,074 |
| 152,509 |
| 9,576 |
|
Net Increase (Decrease) in Net Assets Resulting from Operations |
| $(37 | ) | $10,797 |
| $23,553 |
| $169,195 |
| $9,402 |
|
* For the period from December 27, 2005 to December 31, 2005.
@ Amount is less than $500.
105 |
| The accompanying notes are an integral part of the financial statements. |
|
|
2005 Annual Report | |
|
|
December 31, 2005 | |
Statements of Operations
For the Year Ended December 31, 2005
|
| Large Cap |
| Small |
| U.S. Large |
|
|
| Emerging |
|
|
| Relative |
| Company |
| Cap |
| U.S. Real |
| Markets |
|
|
| Value |
| Growth |
| Growth |
| Estate |
| Debt |
|
|
| Portfolio |
| Portfolio |
| Portfolio |
| Portfolio |
| Portfolio |
|
|
| (000) |
| (000) |
| (000) |
| (000) |
| (000) |
|
Investment Income: |
|
|
|
|
|
|
|
|
|
|
|
Dividends from Securities of Unaffiliated Issuers |
| $3,447 |
| $13,766 |
| $5,033 |
| $33,655 |
| $— |
|
Interest |
| 310 |
| 1,546 |
| 399 |
| 617 |
| 5,999 |
|
Less: Foreign Taxes Withheld |
| @— |
| — |
| (106 | ) | (250 | ) | — |
|
Total Investment Income |
| 3,757 |
| 15,312 |
| 5,326 |
| 34,022 |
| 5,999 |
|
Expenses: |
|
|
|
|
|
|
|
|
|
|
|
Investment Advisory Fees (Note B) |
| 905 |
| 13,316 |
| 3,429 |
| 9,389 |
| 560 |
|
Administration Fees (Note C) |
| 148 |
| 1,189 |
| 549 |
| 987 |
| 60 |
|
Custodian Fees (Note E) |
| 33 |
| 83 |
| 43 |
| 68 |
| 24 |
|
Directors’ Fees and Expenses |
| 3 |
| 19 |
| 13 |
| 17 |
| 2 |
|
Bank Overdraft Expense |
| 1 |
| 6 |
| 20 |
| 2 |
| 7 |
|
Professional Fees |
| 29 |
| 80 |
| 65 |
| 82 |
| 39 |
|
Shareholder Reporting Fees |
| 70 |
| 549 |
| 197 |
| 296 |
| 11 |
|
Distribution Fees — Class B (Note D) |
| 224 |
| 1,898 |
| 226 |
| 384 |
| 1 |
|
Other Expenses |
| 70 |
| 196 |
| 122 |
| 144 |
| 48 |
|
Total Expenses |
| 1,483 |
| 17,336 |
| 4,664 |
| 11,369 |
| 752 |
|
Expense Offset (Note E) |
| @— |
| (9 | ) | @— |
| (2 | ) | (1 | ) |
Net Expenses |
| 1,483 |
| 17,327 |
| 4,664 |
| 11,367 |
| 751 |
|
Net Investment Income (Loss) |
| 2,274 |
| (2,015 | ) | 662 |
| 22,655 |
| 5,248 |
|
Realized Gain (Loss): |
|
|
|
|
|
|
|
|
|
|
|
Investments Sold |
| 14,891 |
| 177,923 |
| 50,227 |
| 182,280 |
| 2,181 |
|
Foreign Currency Translations |
| — |
| — |
| — |
| (6 | ) | (8 | ) |
Futures Contracts |
| — |
| — |
| — |
| — |
| 241 |
|
Net Realized Gain (Loss) |
| 14,891 |
| 177,923 |
| 50,227 |
| 182,274 |
| 2,414 |
|
Change in Unrealized Appreciation (Depreciation): |
|
|
|
|
|
|
|
|
|
|
|
Investments |
| 717 |
| 15,575 |
| 34,212 |
| (6,011 | ) | 1,261 |
|
Foreign Currency Exchange Contracts and Transactions |
| — |
| — |
| — |
| @— |
| (2 | ) |
Futures Contracts |
| — |
| — |
| — |
| — |
| (35 | ) |
Net Change in Unrealized Appreciation (Depreciation) |
| 717 |
| 15,575 |
| 34,212 |
| (6,011 | ) | 1,224 |
|
Total Net Realized Gain (Loss) and Change in Unrealized Appreciation (Depreciation) |
| 15,608 |
| 193,498 |
| 84,439 |
| 176,263 |
| 3,638 |
|
Net Increase (Decrease) in Net Assets Resulting from Operations |
| $17,882 |
| $191,483 |
| $85,101 |
| $198,918 |
| $8,886 |
|
@ Amount is less than $500.
|
| The accompanying notes are an integral part of the financial statements. |
| 106 |
| 2005 Annual Report |
|
|
| December 31, 2005 |
Statements of Operations
For the Year Ended December 31, 2005
|
|
|
| Municipal |
|
|
| Money |
| Money |
|
|
| Market |
| Market |
|
|
| Portfolio |
| Portfolio |
|
|
| (000) |
| (000) |
|
Investment Income: |
|
|
|
|
|
Interest |
| $14,694 |
| $9,749 |
|
Expenses: |
|
|
|
|
|
Investment Advisory Fees (Note B) |
| 1,371 |
| 1,218 |
|
Administration Fees (Note C) |
| 228 |
| 203 |
|
Custodian Fees (Note E) |
| 20 |
| 25 |
|
Directors’ Fees and Expenses |
| 17 |
| 11 |
|
Bank Overdraft Expense |
| 1 |
| 6 |
|
Professional Fees |
| 41 |
| 35 |
|
Shareholder Reporting Fees |
| 56 |
| 11 |
|
Other Expenses |
| 161 |
| 116 |
|
Total Expenses |
| 1,895 |
| 1,625 |
|
Expense Offset (Note E) |
| (1 | ) | (5 | ) |
Net Expenses |
| 1,894 |
| 1,620 |
|
Net Investment Income (Loss) |
| 12,800 |
| 8,129 |
|
Realized Gain (Loss): |
|
|
|
|
|
Investments Sold |
| — |
| @— |
|
Net Increase (Decrease) in Net Assets Resulting from Operations |
| $12,800 |
| $8,129 |
|
@ Amount is less than $500.
107 |
| The accompanying notes are an integral part of the financial statements. |
|
|
2005 Annual Report | |
|
|
December 31, 2005 | |
Statements of Changes in Net Assets
|
| Active International Allocation |
| Emerging Markets |
| |||||
|
| Year Ended |
| Year Ended |
| Year Ended |
| Year Ended | ||
Increase (Decrease) in Net Assets |
|
|
|
|
|
|
|
|
| |
Operations: |
|
|
|
|
|
|
|
|
| |
Net Investment Income (Loss) |
| $11,056 |
| $5,685 |
| $16,822 |
| $11,640 |
| |
Net Realized Gain (Loss) |
| 31,370 |
| 21,200 |
| 229,354 |
| 122,533 |
| |
Net Change in Unrealized Appreciation (Depreciation) |
| 48,208 |
| 51,085 |
| 206,742 |
| 107,426 |
| |
Net Increase (Decrease) in Net Assets Resulting from Operations |
| 90,634 |
| 77,970 |
| 452,918 |
| 241,599 |
| |
Distributions from and/or in Excess of: |
|
|
|
|
|
|
|
|
| |
Class A: |
|
|
|
|
|
|
|
|
| |
Net Investment Income |
| (8,193 | ) | (10,301 | ) | (23,918 | ) | (9,513 | ) | |
Class B: |
|
|
|
|
|
|
|
|
| |
Net Investment Income |
| (22 | ) | (42 | ) | (1,181 | ) | (416 | ) | |
Total Distributions |
| (8,215 | ) | (10,343 | ) | (25,099 | ) | (9,929 | ) | |
Capital Share Transactions:(1) |
|
|
|
|
|
|
|
|
| |
Class A: |
|
|
|
|
|
|
|
|
| |
Subscribed |
| 330,640 |
| 219,838 |
| 476,524 |
| 563,202 |
| |
Distributions Reinvested |
| 6,969 |
| 9,070 |
| 22,742 |
| 8,957 |
| |
Redeemed |
| (208,263 | ) | (68,754 | ) | (399,299 | ) | (564,272 | ) | |
Redemption Fees |
| 2 |
| — |
| 187 |
| 104 |
| |
Class B: |
|
|
|
|
|
|
|
|
| |
Subscribed |
| 948 |
| 2,286 |
| 56,394 |
| 38,135 |
| |
Distributions Reinvested |
| 22 |
| 42 |
| 1,163 |
| 413 |
| |
Redeemed |
| (1,667 | ) | (5,807 | ) | (52,962 | ) | (20,076 | ) | |
Redemption Fees |
| @— |
| 49 |
| 32 |
| 21 |
| |
Net Increase (Decrease) in Net Assets Resulting from Capital Share Transactions |
| 128,651 |
| 156,724 |
| 104,781 |
| 26,484 |
| |
Total Increase (Decrease) in Net Assets |
| 211,070 |
| 224,351 |
| 532,600 |
| 258,154 |
| |
Net Assets: |
|
|
|
|
|
|
|
|
| |
Beginning of Period |
| 583,474 |
| 359,123 |
| 1,320,553 |
| 1,062,399 |
| |
End of Period |
| $794,544 |
| $583,474 |
| $1,853,153 |
| $1,320,553 |
| |
Undistributed (Distributions in Excess of) Net Investment Income Included in End of Period Net Assets |
| $(1,432 | ) | $2,454 |
| $(11,174 | ) | $(3,455 | ) | |
(1) | Capital Share Transactions: |
|
|
|
|
|
|
|
|
|
| Class A: |
|
|
|
|
|
|
|
|
|
| Shares Subscribed |
| 28,928 |
| 22,277 |
| 22,141 |
| 34,353 |
|
| Shares Issued on Distributions Reinvested |
| 600 |
| 840 |
| 902 |
| 481 |
|
| Shares Redeemed |
| (18,827 | ) | (7,005 | ) | (19,439 | ) | (35,194 | ) |
| Net Increase (Decrease) in Class A Shares Outstanding |
| 10,701 |
| 16,112 |
| 3,604 |
| (360 | ) |
| Class B: |
|
|
|
|
|
|
|
|
|
| Shares Subscribed |
| 83 |
| 226 |
| 2,643 |
| 2,292 |
|
| Shares Issued on Distributions Reinvested |
| 2 |
| 4 |
| 47 |
| 22 |
|
| Shares Redeemed |
| (145 | ) | (574 | ) | (2,333 | ) | (1,282 | ) |
| Net Increase (Decrease) in Class B Shares Outstanding |
| (60 | ) | (344 | ) | 357 |
| 1,032 |
|
@ Amount is less than $500.
|
| The accompanying notes are an integral part of the financial statements. |
| 108 |
| 2005 Annual Report |
|
|
| December 31, 2005 |
Statements of Changes in Net Assets
|
| Global Franchise |
| Global Value Equity |
| |||||
|
| Portfolio |
| Portfolio |
| |||||
|
| Year Ended |
| Year Ended |
| Year Ended |
| Year Ended |
| |
|
| December 31, |
| December 31, |
| December 31, |
| December 31, |
| |
|
| 2005 |
| 2004 |
| 2005 |
| 2004 |
| |
|
| (000) |
| (000) |
| (000) |
| (000) |
| |
Increase (Decrease) in Net Assets |
|
|
|
|
|
|
|
|
| |
Operations: |
|
|
|
|
|
|
|
|
| |
Net Investment Income (Loss) |
| $1,317 |
| $1,235 |
| $1,775 |
| $1,094 |
| |
Net Realized Gain (Loss) |
| 4,190 |
| 7,045 |
| 5,010 |
| 5,938 |
| |
Net Change in Unrealized Appreciation (Depreciation) |
| 3,466 |
| 316 |
| (556 | ) | 4,931 |
| |
Net Increase (Decrease) in Net Assets Resulting from Operations |
| 8,973 |
| 8,596 |
| 6,229 |
| 11,963 |
| |
Distributions from and/or in Excess of: |
|
|
|
|
|
|
|
|
| |
Class A: |
|
|
|
|
|
|
|
|
| |
Net Investment Income |
| (1,562 | ) | — |
| (1,434 | ) | (832 | ) | |
Net Realized Gain |
| (4,637 | ) | (3,955 | ) | (3,111 | ) | (184 | ) | |
Class B: |
|
|
|
|
|
|
|
|
| |
Net Investment Income |
| (72 | ) | — |
| (300 | ) | (299 | ) | |
Net Realized Gain |
| (243 | ) | (277 | ) | (894 | ) | (83 | ) | |
Total Distributions |
| (6,514 | ) | (4,232 | ) | (5,739 | ) | (1,398 | ) | |
Capital Share Transactions: (1) |
|
|
|
|
|
|
|
|
| |
Class A: |
|
|
|
|
|
|
|
|
| |
Subscribed |
| 22,698 |
| 7,145 |
| 18,729 |
| 11,471 |
| |
Distributions Reinvested |
| 6,188 |
| 3,953 |
| 4,515 |
| 1,000 |
| |
Redeemed |
| (4,405 | ) | (36,966 | ) | (6,023 | ) | (6,705 | ) | |
Redemption Fees |
| @— |
| 149 |
| 7 |
| 9 |
| |
Class B: |
|
|
|
|
|
|
|
|
| |
Subscribed |
| 571 |
| 1,671 |
| 3,447 |
| 5,089 |
| |
Distributions Reinvested |
| 267 |
| 277 |
| 1,193 |
| 382 |
| |
Redeemed |
| (523 | ) | (871 | ) | (13,525 | ) | (11,020 | ) | |
Redemption Fees |
| — |
| 4 |
| 2 |
| 6 |
| |
Net Increase (Decrease) in Net Assets Resulting from Capital Share Transactions |
| 24,796 |
| (24,638 | ) | 8,345 |
| 232 |
| |
Total Increase (Decrease) in Net Assets |
| 27,255 |
| (20,274 | ) | 8,835 |
| 10,797 |
| |
Net Assets: |
|
|
|
|
|
|
|
|
| |
Beginning of Period |
| 62,164 |
| 82,438 |
| 99,103 |
| 88,306 |
| |
End of Period |
| $89,419 |
| $62,164 |
| $107,938 |
| $99,103 |
| |
Undistributed (Distributions in Excess of) Net Investment Income Included in End of Period Net Assets |
| $62 |
| $287 |
| $(9 | ) | $(8 | ) | |
(1) | Capital Share Transactions: |
|
|
|
|
|
|
|
|
|
| Class A: |
|
|
|
|
|
|
|
|
|
| Shares Subscribed |
| 1,454 |
| 479 |
| 1,055 |
| 693 |
|
| Shares Issued on Distributions Reinvested |
| 390 |
| 260 |
| 252 |
| 56 |
|
| Shares Redeemed |
| (274 | ) | (2,472 | ) | (336 | ) | (409 | ) |
| Net Increase (Decrease) in Class A Shares Outstanding |
| 1,570 |
| (1,733 | ) | 971 |
| 340 |
|
| Class B: |
|
|
|
|
|
|
|
|
|
| Shares Subscribed |
| 36 |
| 115 |
| 196 |
| 313 |
|
| Shares Issued on Distributions Reinvested |
| 17 |
| 18 |
| 67 |
| 22 |
|
| Shares Redeemed |
| (33 | ) | (59 | ) | (757 | ) | (688 | ) |
| Net Increase (Decrease) in Class B Shares Outstanding |
| 20 |
| 74 |
| (494 | ) | (353 | ) |
@ Amount is less than $500.
109 |
| The accompanying notes are an integral part of the financial statements. |
|
|
2005 Annual Report | |
|
|
December 31, 2005 | |
Statements of Changes in Net Assets
|
| International |
| International |
| International |
| ||||||||||
|
| Equity |
| Growth Equity Portfolio |
| Magnum |
| ||||||||||
|
| Year Ended |
| Year Ended |
| Period Ended |
| Year Ended |
| Year Ended |
| ||||||
|
| December 31, |
| December 31, |
| December 31, |
| December 31, |
| December 31, |
| ||||||
|
| (000) |
| (000) |
| (000) |
| (000) |
| (000) |
| ||||||
Increase (Decrease) in Net Assets |
|
|
|
|
|
|
|
|
|
|
| ||||||
Operations: |
|
|
|
|
|
|
|
|
|
|
| ||||||
Net Investment Income (Loss) |
| $ | 164,231 |
| $ | 102,520 |
| $ | @— |
| $ | 1,472 |
| $ | 1,041 |
| |
Net Realized Gain (Loss) |
| 739,864 |
| 668,910 |
| (1 | ) | 8,896 |
| 8,521 |
| ||||||
Net Change in Unrealized Appreciation (Depreciation) |
| (398,185 | ) | 578,627 |
| (36 | ) | 429 |
| 5,455 |
| ||||||
Net Increase (Decrease) in Net Assets Resultingfrom Operations |
| 505,910 |
| 1,350,057 |
| (37 | ) | 10,797 |
| 15,017 |
| ||||||
Distributions from and/or in Excess of: |
|
|
|
|
|
|
|
|
|
|
| ||||||
Class A: |
|
|
|
|
|
|
|
|
|
|
| ||||||
Net Investment Income |
| (106,112 | ) | (116,252 | ) | — |
| (1,254 | ) | (1,884 | ) | ||||||
Net Realized Gain |
| (503,334 | ) | (474,947 | ) | — |
| — |
| — |
| ||||||
Class B: |
|
|
|
|
|
|
|
|
|
|
| ||||||
Net Investment Income |
| (16,435 | ) | (15,360 | ) | — |
| (32 | ) | (44 | ) | ||||||
Net Realized Gain |
| (91,535 | ) | (71,363 | ) | — |
| — |
| — |
| ||||||
Total Distributions |
| (717,416 | ) | (677,922 | ) | — |
| (1,286 | ) | (1,928 | ) | ||||||
Capital Share Transactions: (1) |
|
|
|
|
|
|
|
|
|
|
| ||||||
Class A: |
|
|
|
|
|
|
|
|
|
|
| ||||||
Subscribed |
| 1,057,038 |
| 1,643,058 |
| 4,900 |
| 23,305 |
| 14,773 |
| ||||||
Distributions Reinvested |
| 566,819 |
| 549,353 |
| — |
| 1,234 |
| 1,707 |
| ||||||
Redeemed |
| (1,945,491 | ) | (1,245,518 | ) | — |
| (21,557 | ) | (26,151) |
| ||||||
Redemption Fees |
| 187 |
| 91 |
| — |
| @— |
| — |
| ||||||
Class B: |
|
|
|
|
|
|
|
|
|
|
| ||||||
Subscribed |
| 406,346 |
| 414,909 |
| 100 |
| 1,938 |
| 1,464 |
| ||||||
Distributions Reinvested |
| 107,811 |
| 86,576 |
| — |
| 31 |
| 44 |
| ||||||
Redeemed |
| (344,263 | ) | (237,977 | ) | — |
| (1,227 | ) | (1,484 | ) | ||||||
Redemption Fees |
| 32 |
| 18 |
| — |
| 1 |
| 6 |
| ||||||
Net Increase (Decrease) in Net Assets Resulting from Capital Share Transactions |
| (151,521 | ) | 1,210,510 |
| 5,000 |
| 3,725 |
| (9,641 | ) | ||||||
Total Increase (Decrease) in Net Assets |
| (363,027 | ) | 1,882,645 |
| 4,963 |
| 13,236 |
| 3,448 |
| ||||||
Net Assets: |
|
|
|
|
|
|
|
|
|
|
| ||||||
Beginning of Period |
| 8,273,884 |
| 6,391,239 |
| — |
| 96,767 |
| 93,319 |
| ||||||
End of Period |
| $ | 7,910,857 |
| $ | 8,273,884 |
| $ | 4,963 |
| $ | 110,003 |
| $ | 96,767 |
| |
Undistributed (Distributions in Excess of) Net Investment Income Included in End of Period Net Assets |
|
|
|
|
|
|
|
|
|
|
| ||||||
|
| $ | (2,762 | ) | $ | (6,123 | ) | $ | @— |
| $ | (25 | ) | $ | 257 |
| |
(1) | Capital Share Transactions: |
|
|
|
|
|
|
|
|
|
|
| |||||
| Class A: |
|
|
|
|
|
|
|
|
|
|
| |||||
| Shares Subscribed |
| 50,203 |
| 82,082 |
| 490 |
| 1,938 |
| 1,391 |
| |||||
| Shares Issued on Distributions Reinvested |
| 27,726 |
| 26,129 |
| — |
| 98 |
| 149 |
| |||||
| Shares Redeemed |
| (91,383 | ) | (61,971 | ) | — |
| (1,815 | ) | (2,512 | ) | |||||
| Net Increase (Decrease in Class A Shares Outstanding) |
| (13,454 | ) | 46,240 |
| 490 |
| 221 |
| (972 | ) | |||||
| Class B: |
|
|
|
|
|
|
|
|
|
|
| |||||
| Shares Subscribed |
| 19,383 |
| 20,517 |
| 10 |
| 159 |
| 140 |
| |||||
| Shares Issued on Distributions Reinvested |
| 5,321 |
| 4,164 |
| — |
| 3 |
| 4 |
| |||||
| Shares Redeemed |
| (16,439 | ) | (11,898 | ) | — |
| (102 | ) | (142 | ) | |||||
| Net Increase (Decrease) in Class B Shares Outstanding |
| 8,265 |
| 12,783 |
| 10 |
| 60 |
| 2 |
| |||||
@ Amount is less than $500.
^ International Growth Equity Portfolio commenced operations on December 27, 2005.
|
| The accompanying notes are an integral part of the financial statements. |
| 110 |
| 2005 Annual Report |
|
|
| December 31, 2005 |
Statements of Changes in Net Assets
|
| International Real Estate |
| International Small Cap |
| |||||
|
| Portfolio |
| Portfolio |
| |||||
|
| Year Ended |
| Year Ended |
| Year Ended |
| Year Ended |
| |
|
| December 31, |
| December 31, |
| December 31, |
| December 31, |
| |
|
| 2005 |
| 2004 |
| 2005 |
| 2004 |
| |
|
| (000) |
| (000) |
| (000) |
| (000) |
| |
Increase (Decrease) in Net Assets |
|
|
|
|
|
|
|
|
| |
Operations: |
|
|
|
|
|
|
|
|
| |
Net Investment Income (Loss) |
| $2,479 |
| $689 |
| $16,686 |
| $11,376 |
| |
Net Realized Gain (Loss) |
| 18,145 |
| 3,827 |
| 225,188 |
| 110,235 |
| |
Net Change in Unrealized Appreciation (Depreciation) |
| 2,929 |
| 10,091 |
| (72,679 | ) | 198,420 |
| |
Net Increase (Decrease) in Net Assets Resulting from Operations |
| 23,553 |
| 14,607 |
| 169,195 |
| 320,031 |
| |
Distributions from and/or in Excess of: |
|
|
|
|
|
|
|
|
| |
Class A: |
|
|
|
|
|
|
|
|
| |
Net Investment Income |
| (3,321 | ) | (821 | ) | (23,957 | ) | (16,593 | ) | |
Net Realized Gain |
| (13,425 | ) | — |
| (190,069 | ) | (89,822 | ) | |
Class B: |
|
|
|
|
|
|
|
|
| |
Net Investment Income |
| (99 | ) | (11 | ) | — |
| — |
| |
Net Realized Gain |
| (431 | ) | — |
| — |
| — |
| |
Total Distributions |
| (17,276 | ) | (832 | ) | (214,026 | ) | (106,415 | ) | |
Capital Share Transactions:(1) |
|
|
|
|
|
|
|
|
| |
Class A: |
|
|
|
|
|
|
|
|
| |
Subscribed |
| 221,133 |
| 15,851 |
| 277,611 |
| 290,544 |
| |
Distributions Reinvested |
| 15,117 |
| 821 |
| 201,916 |
| 97,500 |
| |
Redeemed |
| (42,622 | ) | (1,596 | ) | (321,709 | ) | (225,580 | ) | |
Redemption Fees |
| 46 |
| 1 |
| 8 |
| 7 |
| |
Class B: |
|
|
|
|
|
|
|
|
| |
Subscribed |
| 8,793 |
| 100 |
| — |
| — |
| |
Distributions Reinvested |
| 489 |
| @— |
| — |
| — |
| |
Redeemed |
| (1,495 | ) | (604 | ) | — |
| — |
| |
Net Increase (Decrease) in Net Assets Resulting from Capital Share Transactions |
| 201,461 |
| 14,573 |
| 157,826 |
| 162,471 |
| |
Total Increase (Decrease) in Net Assets |
| 207,738 |
| 28,348 |
| 112,995 |
| 376,087 |
| |
Net Assets: |
|
|
|
|
|
|
|
|
| |
Beginning of Period |
| 51,447 |
| 23,099 |
| 1,276,083 |
| 899,996 |
| |
End of Period |
| $259,185 |
| $51,447 |
| $1,389,078 |
| $1,276,083 |
| |
Undistributed (Distributions in Excess of) Net Investment Income |
| $(490 | ) | $(293 | ) | $(6,847 | ) | $(2,567 | ) | |
(1) | Capital Share Transactions: |
|
|
|
|
|
|
|
|
|
| Class A: |
|
|
|
|
|
|
|
|
|
| Shares Subscribed |
| 9,542 |
| 888 |
| 10,729 |
| 12,655 |
|
| Shares Issued on Distributions Reinvested |
| 643 |
| 37 |
| 8,366 |
| 3,943 |
|
| Shares Redeemed |
| (1,890 | ) | (86 | ) | (12,371 | ) | (9,636 | ) |
| Net Increase (Decrease) in Class A Shares Outstanding |
| 8,295 |
| 839 |
| 6,724 |
| 6,962 |
|
| Class B: |
|
|
|
|
|
|
|
|
|
| Shares Subscribed |
| 373 |
| 6 |
| — |
| — |
|
| Shares Issued on Distributions Reinvested |
| 21 |
| @— |
| — |
| — |
|
| Shares Redeemed |
| (65 | ) | (29 | ) | — |
| — |
|
| Net Increase (Decrease) in Class B Shares Outstanding |
| 329 |
| (23 | ) | — |
| — |
|
@ Amount is less than $500/500 Shares.
111 |
| The accompanying notes are an integral part of the financial statements. |
|
|
2005 Annual Report | |
|
|
December 31, 2005 | |
Statements of Changes in Net Assets
|
| Focus Equity |
| Large Cap Relative Value |
| |||||
|
| Portfolio |
| Portfolio |
| |||||
|
| Year Ended |
| Year Ended |
| Year Ended |
| Year Ended |
| |
|
| December 31, |
| December 31, |
| December 31, |
| December 31, |
| |
|
| 2005 |
| 2004 |
| 2005 |
| 2004 |
| |
|
| (000) |
| (000) |
| (000) |
| (000) |
| |
Increase (Decrease) in Net Assets |
|
|
|
|
|
|
|
|
| |
Operations: |
|
|
|
|
|
|
|
|
| |
Net Investment Income (Loss) |
| $(174 | ) | $212 |
| $2,274 |
| $2,119 |
| |
Net Realized Gain (Loss) |
| 3,931 |
| 2,863 |
| 14,891 |
| 17,231 |
| |
Net Change in Unrealized Appreciation (Depreciation) |
| 5,645 |
| 884 |
| 717 |
| 1,949 |
| |
Net Increase (Decrease) in Net Assets Resulting from Operations |
| 9,402 |
| 3,959 |
| 17,882 |
| 21,299 |
| |
Distributions from and/or in Excess of: |
|
|
|
|
|
|
|
|
| |
Class A: |
|
|
|
|
|
|
|
|
| |
Net Investment Income |
| (84 | ) | (103 | ) | (1,266 | ) | (1,367 | ) | |
Net Realized Gain |
| — |
| — |
| (2,991 | ) | — |
| |
Class B: |
|
|
|
|
|
|
|
|
| |
Net Investment Income |
| (14 | ) | — |
| (1,011 | ) | (745 | ) | |
Net Realized Gain |
| — |
| — |
| (2,953 | ) | — |
| |
Total Distributions |
| (98 | ) | (103 | ) | (8,221 | ) | (2,112 | ) | |
Capital Share Transactions: (1) |
|
|
|
|
|
|
|
|
| |
Class A: |
|
|
|
|
|
|
|
|
| |
Subscribed |
| 8,113 |
| 5,830 |
| 15,705 |
| 19,852 |
| |
Distributions Reinvested |
| 83 |
| 102 |
| 4,218 |
| 1,350 |
| |
Redeemed |
| (14,588 | ) | (17,889 | ) | (12,783 | ) | (50,149 | ) | |
Class B: |
|
|
|
|
|
|
|
|
| |
Subscribed |
| 6,550 |
| 2,104 |
| 35,739 |
| 25,523 |
| |
Distributions Reinvested |
| 14 |
| — |
| 3,954 |
| 739 |
| |
Redeemed |
| (4,029 | ) | (2,263 | ) | (18,149 | ) | (31,552 | ) | |
Net Increase (Decrease) in Net Assets Resulting from Capital Share Transactions |
| (3,857 | ) | (12,116 | ) | 28,684 |
| (34,237 | ) | |
Total Increase (Decrease) in Net Assets |
| 5,447 |
| (8,260 | ) | 38,345 |
| (15,050 | ) | |
Net Assets: |
|
|
|
|
|
|
|
|
| |
Beginning of Period |
| 61,316 |
| 69,576 |
| 166,127 |
| 181,177 |
| |
End of Period |
| $66,763 |
| $61,316 |
| $204,472 |
| $166,127 |
| |
Undistributed (Distributions in Excess of) Net Investment Income Included in End of Period Net Assets |
| $(7 | ) | $90 |
| $(11 | ) | $(10 | ) | |
(1) | Capital Share Transactions: |
|
|
|
|
|
|
|
|
|
| Class A: |
|
|
|
|
|
|
|
|
|
| Shares Subscribed |
| 605 |
| 492 |
| 1,448 |
| 2,070 |
|
| Shares Issued on Distributions Reinvested |
| 6 |
| 8 |
| 378 |
| 138 |
|
| Shares Redeemed |
| (1,128 | ) | (1,516 | ) | (1,192 | ) | (5,277 | ) |
| Net Increase (Decrease) in Class A Shares Outstanding |
| (517 | ) | (1,016 | ) | 634 |
| (3,069 | ) |
| Class B: |
|
|
|
|
|
|
|
|
|
| Shares Subscribed |
| 502 |
| 183 |
| 3,320 |
| 2,668 |
|
| Shares Issued on Distributions Reinvested |
| 1 |
| — |
| 354 |
| 75 |
|
| Shares Redeemed |
| (336 | ) | (195 | ) | (1,674 | ) | (3,349 | ) |
| Net Increase (Decrease) in Class B Shares Outstanding |
| 167 |
| (12 | ) | 2,000 |
| (606 | ) |
|
| The accompanying notes are an integral part of the financial statements. |
| 112 |
| 2005 Annual Report |
|
|
| December 31, 2005 |
Statements of Changes in Net Assets
|
| Small Company Growth |
| U.S. Large Cap Growth |
| |||||
|
| Portfolio |
| Portfolio |
| |||||
|
| Year Ended |
| Year Ended |
| Year Ended |
| Year Ended |
| |
|
| December 31, |
| December 31, |
| December 31, |
| December 31, |
| |
|
| 2005 |
| 2004 |
| 2005 |
| 2004 |
| |
|
| (000) |
| (000) |
| (000) |
| (000) |
| |
Increase (Decrease) in Net Assets |
|
|
|
|
|
|
|
|
| |
Operations: |
|
|
|
|
|
|
|
|
| |
Net Investment Income (Loss) |
| $(2,015 | ) | $(9,251 | ) | $662 |
| $4,225 |
| |
Net Realized Gain (Loss) |
| 177,923 |
| 94,642 |
| 50,227 |
| 77,504 |
| |
Net Change in Unrealized Appreciation (Depreciation) |
| 15,575 |
| 111,273 |
| 34,212 |
| (18,972 | ) | |
Net Increase (Decrease) in Net Assets Resulting from Operations |
| 191,483 |
| 196,664 |
| 85,101 |
| 62,757 |
| |
Distributions from and/or in Excess of: |
|
|
|
|
|
|
|
|
| |
Class A: |
|
|
|
|
|
|
|
|
| |
Net Investment Income |
| — |
| — |
| (1,531 | ) | (2,734 | ) | |
Net Realized Gain |
| (85,937 | ) | (19,248 | ) | — |
| — |
| |
Class B: |
|
|
|
|
|
|
|
|
| |
Net Investment Income |
| — |
| — |
| (87 | ) | (480 | ) | |
Net Realized Gain |
| (79,058 | ) | (21,671 | ) | — |
| — |
| |
Total Distributions |
| (164,995 | ) | (40,919 | ) | (1,618 | ) | (3,214 | ) | |
Capital Share Transactions:(1) |
|
|
|
|
|
|
|
|
| |
Class A: |
|
|
|
|
|
|
|
|
| |
Subscribed |
| 355,282 |
| 383,757 |
| 376,150 |
| 206,548 |
| |
Distributions Reinvested |
| 81,725 |
| 18,037 |
| 1,527 |
| 2,720 |
| |
Redeemed |
| (200,646 | ) | (121,266 | ) | (145,562 | ) | (289,148 | ) | |
Redemption Fees |
| @— |
| — |
| — |
| — |
| |
Class B: |
|
|
|
|
|
|
|
|
| |
Subscribed |
| 244,551 |
| 291,972 |
| 28,674 |
| 45,500 |
| |
Distributions Reinvested |
| 79,029 |
| 21,670 |
| 86 |
| 477 |
| |
Redeemed |
| (246,741 | ) | (168,240 | ) | (193,765 | ) | (57,939 | ) | |
Net Increase (Decrease) in Net Assets Resulting from Capital Share Transactions |
| 313,200 |
| 425,930 |
| 67,110 |
| (91,842 | ) | |
Total Increase (Decrease) in Net Assets |
| 339,688 |
| 581,675 |
| 150,593 |
| (32,299 | ) | |
Net Assets: |
|
|
|
|
|
|
|
|
| |
Beginning of Period |
| 1,365,009 |
| 783,334 |
| 756,990 |
| 789,289 |
| |
End of Period |
| $1,704,697 |
| $1,365,009 |
| $907,583 |
| $756,990 |
| |
Undistributed (Distributions in Excess of) Net Investment Income Included in End of Period Net Assets |
| $— |
| $— |
| $(44 | ) | $894 |
| |
Accumulated Net Investment Loss Included in End of Period Net Assets |
| (134 | ) | (134 | ) | — |
| — |
| |
(1) | Capital Share Transactions: |
|
|
|
|
|
|
|
|
|
| Class A: |
|
|
|
|
|
|
|
|
|
| Shares Subscribed |
| 26,705 |
| 33,511 |
| 20,312 |
| 13,069 |
|
| Shares Issued on Distributions Reinvested |
| 6,245 |
| 1,462 |
| 84 |
| 162 |
|
| Shares Redeemed |
| (15,501 | ) | (10,553 | ) | (8,468 | ) | (17,875 | ) |
| Net Increase (Decrease) in Class A Shares Outstanding |
| 17,449 |
| 24,420 |
| 11,928 |
| (4,644 | ) |
| Class B: |
|
|
|
|
|
|
|
|
|
| Shares Subscribed |
| 19,625 |
| 26,411 |
| 1,705 |
| 2,947 |
|
| Shares Issued on Distributions Reinvested |
| 6,321 |
| 1,826 |
| 5 |
| 29 |
|
| Shares Redeemed |
| (19,620 | ) | (15,258 | ) | (12,021 | ) | (3,644 | ) |
| Net Increase (Decrease) in Class B Shares Outstanding |
| 6,326 |
| 12,979 |
| (10,311 | ) | (668 | ) |
@ Amount is less than $500.
113 |
| The accompanying notes are an integral part of the financial statements. |
|
|
2005 Annual Report | |
|
|
December 31, 2005 | |
Statements of Changes in Net Assets
|
| U.S. Real Estate |
| Emerging Markets Debt |
| |||||||||
|
| Portfolio |
| Portfolio |
| |||||||||
|
| Year Ended |
| Year Ended |
| Year Ended |
| Year Ended |
| |||||
|
| December 31, |
| December 31, |
| December 31, |
| December 31, |
| |||||
|
| 2005 |
| 2004 |
| 2005 |
| 2004 |
| |||||
|
| (000) |
| (000) |
| (000) |
| (000) |
| |||||
Increase (Decrease) in Net Assets |
|
|
|
|
|
|
|
|
| |||||
Operations: |
|
|
|
|
|
|
|
|
| |||||
Net Investment Income (Loss) |
| $ | 22,655 |
| $ | 20,779 |
| $ | 5,248 |
| $ | 4,871 |
| |
Net Realized Gain (Loss) |
| 182,274 |
| 78,698 |
| 2,414 |
| 675 |
| |||||
Net Change in Unrealized Appreciation (Depreciation) |
| (6,011 | ) | 245,206 |
| 1,224 |
| (76 | ) | |||||
Net Increase (Decrease) in Net Assets Resulting from Operations |
| 198,918 |
| 344,683 |
| 8,886 |
| 5,470 |
| |||||
Distributions from and/or in excess of: |
|
|
|
|
|
|
|
|
| |||||
Class A: |
|
|
|
|
|
|
|
|
| |||||
Net Investment Income |
| (19,989 | ) | (20,112 | ) | (5,414 | ) | (5,246 | ) | |||||
Net Realized Gain |
| (155,774 | ) | (39,780 | ) | — |
| — |
| |||||
Class B: |
|
|
|
|
|
|
|
|
| |||||
Net Investment Income |
| (2,437 | ) | (1,863 | ) | (32 | ) | (26 | ) | |||||
Net Realized Gain |
| (20,941 | ) | (5,186 | ) | — |
| — |
| |||||
Total Distributions |
| (199,141 | ) | (66,941 | ) | (5,446 | ) | (5,272 | ) | |||||
Capital Share Transactions:(1) |
|
|
|
|
|
|
|
|
| |||||
Class A: |
|
|
|
|
|
|
|
|
| |||||
Subscribed |
| 344,057 |
| 272,597 |
| 31,778 |
| 47,055 |
| |||||
Distributions Reinvested |
| 168,982 |
| 56,387 |
| 2,943 |
| 3,506 |
| |||||
Redeemed |
| (398,651 | ) | (380,361 | ) | (26,950 | ) | (24,285 | ) | |||||
Redemption Fees |
| 8 |
| — |
| 1 |
| 2 |
| |||||
Class B: |
|
|
|
|
|
|
|
|
| |||||
Subscribed |
| 82,808 |
| 80,932 |
| 100 |
| — |
| |||||
Distributions Reinvested |
| 23,376 |
| 7,046 |
| 32 |
| 26 |
| |||||
Redeemed |
| (99,937 | ) | (35,142 | ) | — |
| (32 | ) | |||||
Net Increase (Decrease) in Net Assets Resulting from Capital Share Transactions |
| 120,643 |
| 1,459 |
| 7,904 |
| 26,272 |
| |||||
Total Increase (Decrease) in Net Assets |
| 120,420 |
| 279,201 |
| 11,344 |
| 26,470 |
| |||||
Net Assets: |
|
|
|
|
|
|
|
|
| |||||
Beginning of Period |
| 1,246,898 |
| 967,697 |
| 81,546 |
| 55,076 |
| |||||
End of Period |
| $ | 1,367,318 |
| $ | 1,246,898 |
| $ | 92,890 |
| $ | 81,546 |
| |
Undistributed (Distributions in Excess of) Net Investment Income Included in End of Period Net Assets |
| $ | 202 |
| $ | (21 | ) | $ | (316 | ) | $ | (503 | ) | |
(1) | Capital Share Transactions: |
|
|
|
|
|
|
|
|
| ||||
| Class A: |
|
|
|
|
|
|
|
|
| ||||
| Shares Subscribed |
| 14,289 |
| 13,971 |
| 8,143 |
| 12,890 |
| ||||
| Shares Issued on Distributions Reinvested |
| 7,119 |
| 2,587 |
| 764 |
| 964 |
| ||||
| Shares Redeemed |
| (17,037 | ) | (19,349 | ) | (7,310 | ) | (7,065 | ) | ||||
| Net Increase (Decrease) in Class A Shares Outstanding |
| 4,371 |
| (2,791 | ) | 1,597 |
| 6,789 |
| ||||
| Class B: |
|
|
|
|
|
|
|
|
| ||||
| Shares Subscribed |
| 3,507 |
| 4,029 |
| 25 |
| — |
| ||||
| Shares Issued on Distributions Reinvested |
| 992 |
| 322 |
| 8 |
| 7 |
| ||||
| Shares Redeemed |
| (4,182 | ) | (1,817 | ) | — |
| (9 | ) | ||||
| Net Increase (Decrease) in Class B Shares Outstanding |
| 317 |
| 2,534 |
| 33 |
| (2 | ) | ||||
|
| The accompanying notes are an integral part of the financial statements. |
| 114 |
| 2005 Annual Report |
|
|
| December 31, 2005 |
Statements of Changes in Net Assets
|
| Money Market |
| Municipal Money Market |
| |||||||||
|
| Portfolio |
| Portfolio |
| |||||||||
|
| Year Ended |
| Year Ended |
| Year Ended |
| Year Ended |
| |||||
|
| December 31, |
| December 31, |
| December 31, |
| December 31, |
| |||||
|
| 2005 |
| 2004 |
| 2005 |
| 2004 |
| |||||
|
| (000) |
| (000) |
| (000) |
| (000) |
| |||||
Increase (Decrease) in Net Assets |
|
|
|
|
|
|
|
|
| |||||
Operations: |
|
|
|
|
|
|
|
|
| |||||
Net Investment Income |
| $ | 12,800 |
| $ | 5,770 |
| $ | 8,129 |
| $ | 3,503 |
| |
Net Realized Gain (Loss) |
| — |
| @— |
| @— |
| @— |
| |||||
Net Increase (Decrease) in Net Assets Resulting from Operations |
| 12,800 |
| 5,770 |
| 8,129 |
| 3,503 |
| |||||
Distributions from and/or in Excess of: |
|
|
|
|
|
|
|
|
| |||||
Class A: |
|
|
|
|
|
|
|
|
| |||||
Net Investment Income |
| (12,800 | ) | (5,834 | ) | (8,129 | ) | (3,503 | ) | |||||
Capital Share Transactions: (1) |
|
|
|
|
|
|
|
|
| |||||
Class A: |
|
|
|
|
|
|
|
|
| |||||
Subscribed |
| 1,927,746 |
| 2,279,953 |
| 2,222,753 |
| 2,140,786 |
| |||||
Distributions Reinvested |
| 12,683 |
| 5,179 |
| 8,125 |
| 3,086 |
| |||||
Redeemed |
| (2,071,075 | ) | (2,533,601 | ) | (2,363,053 | ) | (2,206,105 | ) | |||||
Net Increase (Decrease) in Net Assets Resulting from Capital Share Transactions |
| (130,646 | ) | (248,469 | ) | (132,175 | ) | (62,233 | ) | |||||
Total Increase (Decrease) in Net Assets |
| (130,646 | ) | (248,533 | ) | (132,175 | ) | (62,233 | ) | |||||
Net Assets: |
|
|
|
|
|
|
|
|
| |||||
Beginning of Period |
| 546,866 |
| 795,399 |
| 449,318 |
| 511,551 |
| |||||
End of Period |
| $ | 416,220 |
| $ | 546,866 |
| $ | 317,143 |
| $ | 449,318 |
| |
Undistributed (Distributions in Excess of) Net Investment Income Included in End of Period Net Assets |
| $ | 34 |
| $ | 30 |
| $ | 21 |
| $ | 19 |
| |
(1) | Capital Share Transactions: |
|
|
|
|
|
|
|
|
| ||||
| Class A: |
|
|
|
|
|
|
|
|
| ||||
| Shares Subscribed |
| 1,927,742 |
| 2,279,952 |
| 2,222,753 |
| 2,140,786 |
| ||||
| Shares Issued on Distributions Reinvested |
| 12,683 |
| 5,179 |
| 8,125 |
| 3,086 |
| ||||
| Shares Redeemed |
| (2,071,071 | ) | (2,533,600 | ) | (2,363,053 | ) | (2,206,105 | ) | ||||
| Net Increase (Decrease) in Class A Shares Outstanding |
| (130,646 | ) | (248,469 | ) | (132,175 | ) | (62,233 | ) | ||||
@ Amount is less than $500.
115 |
| The accompanying notes are an integral part of the financial statements. |
|
|
2005 Annual Report | |
|
|
December 31, 2005 | |
Financial Highlights
Active International Allocation Portfolio
|
| Class A |
| |||||||||||||
|
| Year Ended December 31, |
| |||||||||||||
Selected Per Share Data and Ratios |
| 2005 |
| 2004 |
| 2003 |
| 2002 |
| 2001 |
| |||||
Net Asset Value, Beginning of Period |
| $ | 10.96 |
| $ | 9.58 |
| $ | 7.30 |
| $ | 8.65 |
| $ | 10.68 |
|
Income (Loss) from Investment Operations |
|
|
|
|
|
|
|
|
|
|
| |||||
Net Investment Income (Loss) |
| 0.21 | † | 0.13 | † | 0.13 | † | 0.13 | † | 0.12 |
| |||||
Net Realized and Unrealized Gain (Loss) on Investments |
| 1.40 |
| 1.46 |
| 2.32 |
| (1.26 | ) | (2.01 | ) | |||||
Total from Investment Operations |
| 1.61 |
| 1.59 |
| 2.45 |
| (1.13 | ) | (1.89 | ) | |||||
Distributions from and/or in Excess of: |
|
|
|
|
|
|
|
|
|
|
| |||||
Net Investment Income |
| (0.14 | ) | (0.21 | ) | (0.17 | ) | (0.22 | ) | (0.14 | ) | |||||
Net Realized Gain |
| — |
| — |
| — |
| — |
| (0.00 | )‡ | |||||
Total Distributions |
| (0.14 | ) | (0.21 | ) | (0.17 | ) | (0.22 | ) | (0.14 | ) | |||||
Redemption Fees |
| 0.00 | ‡ | — |
| — |
| — |
| — |
| |||||
Net Asset Value, End of Period |
| $ | 12.43 |
| $ | 10.96 |
| $ | 9.58 |
| $ | 7.30 |
| $ | 8.65 |
|
Total Return |
| 14.85 | % | 16.64 | % | 33.65 | % | (13.11 | )% | (17.63 | )% | |||||
Ratios and Supplemental Data: |
|
|
|
|
|
|
|
|
|
|
| |||||
Net Assets, End of Period (Thousands) |
| $ | 792,329 |
| $ | 580,851 |
| $ | 353,488 |
| $ | 249,742 |
| $ | 388,225 |
|
Ratio of Expenses to Average Net Assets(1) |
| 0.80 | % | 0.80 | % | 0.80 | % | 0.80 | % | 0.81 | % | |||||
Ratio of Expenses to Average Net Assets Excluding Bank Overdraft Expense |
| 0.80 | % | 0.80 | % | 0.80 | % | N/A |
| 0.80 | % | |||||
Ratio of Net Investment Income (Loss) to Average Net Assets (1) |
| 1.84 | % | 1.28 | % | 1.66 | % | 1.57 | % | 1.25 | % | |||||
Portfolio Turnover Rate |
| 24 | % | 24 | % | 55 | % | 42 | % | 36 | % | |||||
(1)Supplemental Information on the Ratios to Average Net Assets: |
|
|
|
|
|
|
|
|
|
|
| |||||
Ratios before expense limitation: |
|
|
|
|
|
|
|
|
|
|
| |||||
Expenses to Average Net Assets |
| 0.83 | % | 0.91 | % | 0.96 | % | 0.93 | % | 0.89 | % | |||||
Net Investment Income (Loss) to Average Net Assets |
| 1.81 | % | 1.18 | % | 1.50 | % | 1.44 | % | 1.17 | % | |||||
|
| Class B |
| |||||||||||||
|
| Year Ended December 31, |
| |||||||||||||
Selected Per Share Data and Ratios |
| 2005 |
| 2004 |
| 2003 |
| 2002 |
| 2001 |
| |||||
Net Asset Value, Beginning of Period |
| $ | 11.13 |
| $ | 9.72 |
| $ | 7.41 |
| $ | 8.77 |
| $ | 10.80 |
|
Income (Loss) from Investment Operations |
|
|
|
|
|
|
|
|
|
|
| |||||
Net Investment Income (Loss) |
| 0.19 | † | 0.10 | † | 0.12 | † | 0.11 | † | 0.13 |
| |||||
Net Realized and Unrealized Gain (Loss) on Investments |
| 1.43 |
| 1.35 |
| 2.33 |
| (1.27 | ) | (2.06 | ) | |||||
Total from Investment Operations |
| 1.62 |
| 1.45 |
| 2.45 |
| (1.16 | ) | (1.93 | ) | |||||
Distributions from and/or in Excess of: |
|
|
|
|
|
|
|
|
|
|
| |||||
Net Investment Income |
| (0.11 | ) | (0.17 | ) | (0.14 | ) | (0.20 | ) | (0.10 | ) | |||||
Net Realized Gain |
| — |
| — |
| — |
| — |
| (0.00 | ) ‡ | |||||
Total Distributions |
| (0.11 | ) | (0.17 | ) | (0.14 | ) | (0.20 | ) | (0.10 | ) | |||||
Redemption Fees |
| 0.00 | ‡ | 0.13 |
| — |
| — |
| — |
| |||||
Net Asset Value, End of Period |
| $ | 12.64 |
| $ | 11.13 |
| $ | 9.72 |
| $ | 7.41 |
| $ | 8.77 |
|
Total Return |
| 14.67 | % | 16.29 | % | 33.13 | % | (13.29 | )% | (17.81 | )% | |||||
Ratios and Supplemental Data: |
|
|
|
|
|
|
|
|
|
|
| |||||
Net Assets, End of Period (Thousands) |
| $ | 2,215 |
| $ | 2,623 |
| $ | 5,635 |
| $ | 8,418 |
| $ | 10,362 |
|
Ratio of Expenses to Average Net Assets (2) |
| 1.05 | % | 1.05 | % | 1.05 | % | 1.05 | % | 1.06 | % | |||||
Ratio of Expenses to Average Net Assets Excluding Bank Overdraft Expense |
| 1.05 | % | 1.05 | % | 1.05 | % | N/A |
| 1.05 | % | |||||
Ratio of Net Investment Income (Loss) to Average Net Assets (2) |
| 1.69 | % | 1.03 | % | 1.41 | % | 1.32 | % | 1.05 | % | |||||
Portfolio Turnover Rate |
| 24 | % | 24 | % | 55 | % | 42 | % | 36 | % | |||||
(2)Supplemental Information on the Ratios to Average Net Assets: |
|
|
|
|
|
|
|
|
|
|
| |||||
Ratios before expense limitation: |
|
|
|
|
|
|
|
|
|
|
| |||||
Expenses to Average Net Assets |
| 1.08 | % | 1.16 | % | 1.21 | % | 1.18 | % | 1.14 | % | |||||
Net Investment Income (Loss) to Average Net Assets |
| 1.66 | % | 0.92 | % | 1.25 | % | 1.19 | % | 0.97 | % | |||||
† Per share amount is based on average shares outstanding.
‡ Amount is less than $0.005 per share.
|
| The accompanying notes are an integral part of the financial statements. |
| 116 |
| 2005 Annual Report |
|
|
| December 31, 2005 |
Financial Highlights
Emerging Markets Portfolio
|
| Class A |
| |||||||||||||
|
| Year Ended December 31, |
| |||||||||||||
Selected Per Share Data and Ratios |
| 2005 |
| 2004 |
| 2003 |
| 2002 |
| 2001 |
| |||||
Net Asset Value, Beginning of Period |
| $ | 19.10 |
| $ | 15.52 |
| $ | 10.13 |
| $ | 10.81 |
| $ | 11.31 |
|
Income (Loss) from Investment Operations |
|
|
|
|
|
|
|
|
|
|
| |||||
Net Investment Income (Loss) |
| 0.25 | † | 0.19 | † | 0.14 | † | 0.04 | † | 0.05 |
| |||||
Net Realized and Unrealized Gain (Loss) on Investments |
| 6.36 |
| 3.54 |
| 5.44 |
| (0.71 | ) | (0.55 | ) | |||||
Total from Investment Operations |
| 6.61 |
| 3.73 |
| 5.58 |
| (0.67 | ) | (0.50 | ) | |||||
Distributions from and/or in Excess of: |
|
|
|
|
|
|
|
|
|
|
| |||||
Net Investment Income |
| (0.35 | ) | (0.15 | ) | (0.18 | ) | (0.01 | ) | — |
| |||||
Return of Capital |
| — |
| — |
| (0.01 | ) | — |
| — |
| |||||
Total Distributions |
| (0.35 | ) | (0.15 | ) | (0.19 | ) | (0.01 | ) | — |
| |||||
Redemption Fees |
| 0.00 | ‡ | 0.00‡ |
| 0.00‡ |
| — |
| — |
| |||||
Net Asset Value, End of Period |
| $ | 25.36 |
| $ | 19.10 |
| $ | 15.52 |
| $ | 10.13 |
| $ | 10.81 |
|
Total Return |
| 34.54 | % | 24.09 | % | 55.08 | % | (6.24% | ) | (4.42 | )% | |||||
Ratios and Supplemental Data: |
|
|
|
|
|
|
|
|
|
|
| |||||
Net Assets, End of Period (Thousands) |
| $ | 1,749,671 |
| $ | 1,249,299 |
| $ | 1,020,353 |
| $ | 657,203 |
| $ | 748,058 |
|
Ratio of Expenses to Average Net Assets |
| 1.41 | % | 1.52 | %^^ | 1.64 | % | 1.65 | % | 1.65 | % | |||||
Ratio of Expenses to Average Net Assets Excluding Capital Gain Country Tax Expense and Bank Overdraft Expense |
| 1.41 | % | 1.52 | % | 1.61 | % | 1.58 | % | N/A |
| |||||
Ratio of Net Investment Income (Loss) to Average Net Assets |
| 1.17 | % | 1.09 | % | 1.15 | % | 0.35 | % | 0.47 | % | |||||
Portfolio Turnover Rate |
| 59 | % | 73 | % | 92 | % | 91 | % | 93 | % | |||||
|
| Class B |
| |||||||||||||
|
| Year Ended December 31, |
| |||||||||||||
Selected Per Share Data and Ratios |
| 2005 |
| 2004 |
| 2003 |
| 2002 |
| 2001 |
| |||||
Net Asset Value, Beginning of Period |
| $ | 18.90 |
| $ | 15.36 |
| $ | 10.06 |
| $ | 10.73 |
| $ | 11.26 |
|
Income (Loss) from Investment Operations |
|
|
|
|
|
|
|
|
|
|
| |||||
Net Investment Income (Loss) |
| 0.19 | † | 0.15 | † | 0.11 | † | 0.01 | † | 0.03 |
| |||||
Net Realized and Unrealized Gain (Loss) on Investments |
| 6.26 |
| 3.49 |
| 5.35 |
| (0.68 | ) | (0.56 | ) | |||||
Total from Investment Operations |
| 6.45 |
| 3.64 |
| 5.46 |
| (0.67 | ) | (0.53 | ) | |||||
Distributions from and/or in Excess of: |
|
|
|
|
|
|
|
|
|
|
| |||||
Net Investment Income |
| (0.29 | ) | (0.11 | ) | (0.15 | ) | — |
| — |
| |||||
Return of Capital |
| — |
| — |
| (0.01 | ) | — |
| — |
| |||||
Total Distributions |
| (0.29 | ) | (0.11 | ) | (0.16 | ) | — |
| — |
| |||||
Redemption Fees |
| 0.01 |
| 0.01 |
| — |
| — |
| — |
| |||||
Net Asset Value, End of Period |
| $ | 25.07 |
| $ | 18.90 |
| $ | 15.36 |
| $ | 10.06 |
| $ | 10.73 |
|
Total Return |
| 34.17 | % | 23.84 | % | 54.31 | % | (6.24% | ) | (4.71 | )% | |||||
Ratios and Supplemental Data: |
|
|
|
|
|
|
|
|
|
|
| |||||
Net Assets, End of Period (Thousands) |
| $ | 103,482 |
| $ | 71,254 |
| $ | 42,046 |
| $ | 13,208 |
| $ | 14,456 |
|
Ratio of Expenses to Average Net Assets |
| 1.66 | % | 1.77 | %^^ | 1.89 | % | 1.90 | % | 1.90 | % | |||||
Ratio of Expenses to Average Net Assets Excluding Capital Gain Country Tax Expense and Bank Overdraft Expense |
| 1.66 | % | 1.77 | % | 1.86 | % | 1.83 | % | N/A |
| |||||
Ratio of Net Investment Income (Loss) to Average Net Assets |
| 0.90 | % | 0.89 | % | 0.90 | % | 0.10 | % | 0.22 | % | |||||
Portfolio Turnover Rate |
| 59 | % | 73 | % | 92 | % | 91 | % | 93 | % | |||||
† Per share amount is based on average shares outstanding.
‡ Amount is less than $0.005 per share.
^^ Effective November 1, 2004, the Adviser has agreed to limit the ratio of expenses to average net assets to the maximum ratio of 1.65% for Class A shares and 1.90% for Class B shares. Prior to November 1, 2004, these maximum ratios were 1.75% for Class A shares and 2.00% for Class B shares.
| The accompanying notes are an integral part of the financial statements. |
|
|
2005 Annual Report | |
|
|
December 31, 2005 | |
Financial Highlights
Global Franchise Portfolio
|
| Class A |
| |||||||||||||||
|
| Year Ended December 31, |
| Period from |
| |||||||||||||
|
|
|
|
|
|
|
|
|
| November 28, 2001^ |
| |||||||
Selected Per Share Data and Ratios |
| 2005 |
| 2004 |
| 2003 |
| 2002 |
| to December 31, 2001 |
| |||||||
Net Asset Value, Beginning of Period |
| $ | 15.12 |
| $ | 14.29 |
| $ | 11.29 |
| $ | 10.48 |
| $ | 10.00 |
| ||
Income (Loss) from Investment Operations |
|
|
|
|
|
|
|
|
|
|
| |||||||
Net Investment Income (Loss) |
| 0.26 | † | 0.27 | † | 0.23 | † | 0.17 | † | 0.01 |
| |||||||
Net Realized and Unrealized Gain (Loss) on Investments |
| 1.52 |
| 1.66 |
| 2.91 |
| 0.68 |
| 0.47 |
| |||||||
Total from Investment Operations |
| 1.78 |
| 1.93 |
| 3.14 |
| 0.85 |
| 0.48 |
| |||||||
Distributions from and/or in Excess of: |
|
|
|
|
|
|
|
|
|
|
| |||||||
Net Investment Income |
| (0.31 | ) | — |
| (0.03 | ) | — |
| — |
| |||||||
Net Realized Gain |
| (0.90 | ) | (1.13 | ) | (0.11 | ) | (0.04 | ) | — |
| |||||||
Total Distributions |
| (1.21 | ) | (1.13 | ) | (0.14 | ) | (0.04 | ) | — |
| |||||||
Redemption Fees |
| 0.00 | ‡ | 0.03 |
| 0.00 | ‡ | — |
| — |
| |||||||
Net Asset Value, End of Period |
| $ | 15.69 |
| $ | 15.12 |
| $ | 14.29 |
| $ | 11.29 |
| $ | 10.48 |
| ||
Total Return |
| 11.91 | % | 13.77 | % | 27.92 | % | 8.10 | % | 4.80 | %# | |||||||
Ratios and Supplemental Data: |
|
|
|
|
|
|
|
|
|
|
| |||||||
Net Assets, End of Period (Thousands) |
| $ | 85,018 |
| $ | 58,223 |
| $ | 79,756 |
| $ | 48,644 |
| $ | 10,595 |
| ||
Ratio of Expenses to Average Net Assets (1) |
| 1.00 | % | 1.00 | % | 1.00 | % | 1.00 | % | 1.00 | %* | |||||||
Ratio of Expenses to Average Net Assets Excluding Bank Overdraft Expense |
| 1.00 | % | N/A |
| N/A |
| N/A |
| N/A |
| |||||||
Ratio of Net Investment Income (Loss) to Average Net Assets (1) |
| 1.67 | % | 1.82 | % | 1.91 | % | 1.41 | % | 1.30 | %* | |||||||
Portfolio Turnover Rate |
| 19 | % | 21 | % | 32 | % | 62 | % | N/A |
| |||||||
(1) Supplemental Information on the Ratios to Average Net Assets: |
|
|
|
|
|
|
|
|
|
|
| |||||||
Ratios before expense limitation: |
|
|
|
|
|
|
|
|
|
|
| |||||||
Expenses to Average Net Assets |
| 1.07 | % | 1.16 | % | 1.23 | % | 1.28 | % | 16.47 | %* | |||||||
Net Investment Income (Loss) to Average Net Assets |
| 1.60 | % | 1.66 | % | 1.68 | % | 1.13 | % | (14.17 | ) %* | |||||||
|
| Class B |
| ||||||||||||||||
|
| Year Ended December 31, |
| Period from |
| ||||||||||||||
|
|
|
|
|
|
|
| November 28, |
| ||||||||||
Selected Per Share Data and Ratios |
| 2005 |
| 2004 |
| 2003 |
| 2002 |
| to December 31, 2001 |
| ||||||||
Net Asset Value, Beginning of Period |
| $ | 15.01 |
| $ | 14.22 |
| $ | 11.24 |
| $ | 10.46 |
| $ | 10.00 |
| |||
Income (Loss) from Investment Operations |
|
|
|
|
|
|
|
|
|
|
| ||||||||
Net Investment Income (Loss) |
| 0.24 | † | 0.22 | † | 0.22 | † | 0.11† |
| (0.09 | ) | ||||||||
Net Realized and Unrealized Gain (Loss) on Investments |
| 1.48 |
| 1.69 |
| 2.88 |
| 0.71 |
| 0.55 |
| ||||||||
Total from Investment Operations |
| 1.72 |
| 1.91 |
| 3.10 |
| 0.82 |
| 0.46 |
| ||||||||
Distributions from and/or in Excess of: |
|
|
|
|
|
|
|
|
|
|
| ||||||||
Net Investment Income |
| (0.27 | ) | — |
| (0.01 | ) | — |
| — |
| ||||||||
Net Realized Gain |
| (0.90 | ) | (1.13 | ) | (0.11 | ) | (0.04 | ) | — |
| ||||||||
Total Distributions |
| (1.17 | ) | (1.13 | ) | (0.12 | ) | (0.04 | ) | — |
| ||||||||
Redemption Fees |
| — |
| 0.01 |
| — |
| — |
| — |
| ||||||||
Net Asset Value, End of Period |
| $ | 15.56 |
| $ | 15.01 |
| $ | 14.22 |
| $ | 11.24 |
| $ | 10.46 |
| |||
Total Return |
| 11.53 | % | 13.56 | % | 27.62 | % | 7.82 | % | 4.60 | %# | ||||||||
Ratios and Supplemental Data: |
|
|
|
|
|
|
|
|
|
|
| ||||||||
Net Assets, End of Period (Thousands) |
| $ | 4,401 |
| $ | 3,941 |
| $ | 2,682 |
| $ | 1,427 |
| $ | 415 |
| |||
Ratio of Expenses to Average Net Assets(2) |
| 1.25 | % | 1.25 | % | 1.25 | % | 1.25 | % | 1.25 | %* | ||||||||
Ratio of Expenses to Average Net Assets Excluding Bank Overdraft Expense |
| 1.25 | % | N/A |
| N/A |
| N/A |
| N/A |
| ||||||||
Ratio of Net Investment Income (Loss) to Average Net Assets (2) |
| 1.52 | % | 1.47 | % | 1.66 | % | 1.16 | % | (13.29 | )%* | ||||||||
Portfolio Turnover Rate |
| 19 | % | 21 | % | 32 | % | 62 | % | N/A |
| ||||||||
(2)Supplemental Information on the Ratios to Average Net Assets: |
|
|
|
|
|
|
|
|
|
|
| ||||||||
Ratios before expense limitation: |
|
|
|
|
|
|
|
|
|
|
| ||||||||
Expenses to Average Net Assets |
| 1.32 | % | 1.41 | % | 1.48 | % | 1.53 | % | 16.72 | %* | ||||||||
Net Investment Income (Loss) to Average Net Assets |
| 1.45 | % | 1.31 | % | 1.43 | % | 0.88 | % | (21.62 | )%* | ||||||||
† Per share amount is based on average shares outstanding.
‡ Amount is less than $0.005 per share.
^ Commencement of Operations
# Not annualized
* Annualized
|
| The accompanying notes are an integral part of the financial statements. |
| 119 |
| 2005 Annual Report |
|
|
| December 31, 2005 |
Financial Highlights
Global Value Equity Portfolio
|
| Class A |
| |||||||||||||
|
| Year Ended December 31, |
| |||||||||||||
Selected Per Share Data and Ratios |
| 2005 |
| 2004 |
| 2003 |
| 2002 |
| 2001 |
| |||||
Net Asset Value, Beginning of Period |
| $ | 17.81 |
| $ | 15.84 |
| $ | 12.46 |
| $ | 15.45 |
| $ | 17.05 |
|
Income (Loss) from Investment Operations |
|
|
|
|
|
|
|
|
|
|
| |||||
Net Investment Income (Loss) |
| 0.31 | † | 0.22 | † | 0.19 | † | 0.15 | † | 0.13 |
| |||||
Net Realized and Unrealized Gain (Loss) on Investments |
| 0.72 |
| 2.02 |
| 3.42 |
| (2.82 | ) | (1.56 | ) | |||||
Total from Investment Operations |
| 1.03 |
| 2.24 |
| 3.61 |
| (2.67 | ) | (1.43 | ) | |||||
Distributions from and/or in Excess of: |
|
|
|
|
|
|
|
|
|
|
| |||||
Net Investment Income |
| (0.31 | ) | (0.22 | ) | (0.16 | ) | (0.20 | ) | (0.17 | ) | |||||
Net Realized Gain |
| (0.68 | ) | (0.05 | ) | (0.08 | ) | (0.12 | ) | — |
| |||||
Total Distributions |
| (0.99 | ) | (0.27 | ) | (0.24 | ) | (0.32 | ) | (0.17 | ) | |||||
Redemption Fees |
| 0.00 | ‡ | 0.00 | ‡ | 0.01 |
| — |
| — |
| |||||
Net Asset Value, End of Period |
| $ | 17.85 |
| $ | 17.81 |
| $ | 15.84 |
| $ | 12.46 |
| $ | 15.45 |
|
Total Return |
| 5.81 | % | 14.13 | % | 29.21 | % | (17.34 | )% | (8.36 | )% | |||||
Ratios and Supplemental Data: |
|
|
|
|
|
|
|
|
|
|
| |||||
Net Assets, End of Period (Thousands) |
| $ | 86,000 |
| $ | 68,505 |
| $ | 55,545 |
| $ | 34,297 |
| $ | 34,079 |
|
Ratio of Expenses to Average Net Assets (1) |
| 0.90 | % | 1.00 | % | 1.00 | % | 1.00 | % | 1.01 | % | |||||
Ratio of Expenses to Average Net Assets Excluding Bank Overdraft Expense |
| N/A |
| 1.00 | % | 1.00 | % | N/A |
| 1.00 | % | |||||
Ratio of Net Investment Income (Loss) to Average Net Assets (1) |
| 1.74 | % | 1.31 | % | 1.44 | % | 1.08 | % | 0.79 | % | |||||
Portfolio Turnover Rate |
| 29 | % | 30 | % | 53 | % | 42 | % | 51 | % | |||||
(1)Supplemental Information on the Ratios to Average Net Assets: |
|
|
|
|
|
|
|
|
|
|
| |||||
Ratios before expense limitation: |
|
|
|
|
|
|
|
|
|
|
| |||||
Expenses to Average Net Assets |
| N/A |
| 1.07 | % | 1.20 | % | 1.12 | % | 1.16 | % | |||||
Net Investment Income (Loss) to Average Net Assets |
| N/A |
| 1.24 | % | 1.24 | % | 0.96 | % | 0.64 | % | |||||
|
| Class B |
| |||||||||||||
|
| Year Ended December 31, |
| |||||||||||||
Selected Per Share Data and Ratios |
| 2005 |
| 2004 |
| 2003 |
| 2002 |
| 2001 |
| |||||
Net Asset Value, Beginning of Period |
| $ | 17.64 |
| $ | 15.70 |
| $ | 12.35 |
| $ | 15.33 |
| $ | 16.92 |
|
Income (Loss) from Investment Operations |
|
|
|
|
|
|
|
|
|
|
| |||||
Net Investment Income (Loss) |
| 0.27 | † | 0.17 | † | 0.16 | † | 0.12 | † | 0.13 |
| |||||
Net Realized and Unrealized Gain (Loss) on Investments |
| 0.71 |
| 2.00 |
| 3.40 |
| (2.82 | ) | (1.58 | ) | |||||
Total from Investment Operations |
| 0.98 |
| 2.17 |
| 3.56 |
| (2.70 | ) | (1.45 | ) | |||||
Distributions from and/or in Excess of: |
|
|
|
|
|
|
|
|
|
|
| |||||
Net Investment Income |
| (0.25 | ) | (0.18 | ) | (0.13 | ) | (0.16 | ) | (0.14 | ) | |||||
Net Realized Gain |
| (0.68 | ) | (0.05 | ) | (0.08 | ) | (0.12 | ) | — |
| |||||
Total Distributions |
| (0.93 | ) | (0.23 | ) | (0.21 | ) | (0.28 | ) | (0.14 | ) | |||||
Redemption Fees |
| 0.00 | ‡ | 0.00 | ‡ | — |
| — |
| — |
| |||||
Net Asset Value, End of Period |
| $ | 17.69 |
| $ | 17.64 |
| $ | 15.70 |
| $ | 12.35 |
| $ | 15.33 |
|
Total Return |
| 5.59 | % | 13.78 | % | 28.95 | % | (17.63 | )% | (8.58 | )% | |||||
Ratios and Supplemental Data: |
|
|
|
|
|
|
|
|
|
|
| |||||
Net Assets, End of Period (Thousands) |
| $ | 21,938 |
| $ | 30,598 |
| $ | 32,761 |
| $ | 26,866 |
| $ | 30,089 |
|
Ratio of Expenses to Average Net Assets (2) |
| 1.15 | % | 1.25 | % | 1.25 | % | 1.25 | % | 1.26 | % | |||||
Ratio of Expenses to Average Net Assets Excluding Bank Overdraft Expense |
| N/A |
| 1.25 | % | 1.25 | % | N/A |
| 1.25 | % | |||||
Ratio of Net Investment Income (Loss) to Average Net Assets (2) |
| 1.53 | % | 1.07 | % | 1.19 | % | 0.83 | % | 0.78 | % | |||||
Portfolio Turnover Rate |
| 29 | % | 30 | % | 53 | % | 42 | % | 51 | % | |||||
(2)Supplemental Information on the Ratios to Average Net Assets: |
|
|
|
|
|
|
|
|
|
|
| |||||
Ratios before expense limitation: |
|
|
|
|
|
|
|
|
|
|
| |||||
Expenses to Average Net Assets |
| N/A |
| 1.32 | % | 1.45 | % | 1.37 | % | 1.41 | % | |||||
Net Investment Income (Loss) to Average Net Assets |
| N/A |
| 0.99 | % | 0.99 | % | 0.71 | % | 0.64 | % | |||||
† Per share amount is based on average shares outstanding.
‡ Amount is less than $0.005 per share.
120 |
| The accompanying notes are an integral part of the financial statements. |
|
|
2005 Annual Report | |
|
|
December 31, 2005 | |
Financial Highlights
International Equity Portfolio
|
| Class A |
| |||||||||||||
|
| Year Ended December 31, |
| |||||||||||||
Selected Per Share Data and Ratios |
| 2005 |
| 2004 |
| 2003 |
| 2002 |
| 2001 |
| |||||
Net Asset Value, Beginning of Period |
| $ | 20.99 |
| $ | 19.06 |
| $ | 14.60 |
| $ | 15.59 |
| $ | 17.88 |
|
Income (Loss) from Investment Operations |
|
|
|
|
|
|
|
|
|
|
| |||||
Net Investment Income (Loss) |
| 0.43 | † | 0.30 | † | 0.24 | † | 0.19 | † | 0.25 |
| |||||
Net Realized and Unrealized Gain (Loss) on Investments |
| 0.93 |
| 3.50 |
| 4.54 |
| (0.82 | ) | (2.00 | ) | |||||
Total from Investment Operations |
| 1.36 |
| 3.80 |
| 4.78 |
| (0.63 | ) | (1.75 | ) | |||||
Distributions from and/or in Excess of: |
|
|
|
|
|
|
|
|
|
|
| |||||
Net Investment Income |
| (0.35 | ) | (0.37 | ) | (0.32 | ) | (0.33 | ) | (0.34 | ) | |||||
Net Realized Gain |
| (1.66 | ) | (1.50 | ) | — |
| (0.03 | ) | (0.20 | ) | |||||
Total Distributions |
| (2.01 | ) | (1.87 | ) | (0.32 | ) | (0.36 | ) | (0.54 | ) | |||||
Redemption Fees |
| 0.00 | ‡ | 0.00 | ‡ | 0.00 | ‡ | — |
| — |
| |||||
Net Asset Value, End of Period |
| $ | 20.34 |
| $ | 20.99 |
| $ | 19.06 |
| $ | 14.60 |
| $ | 15.59 |
|
Total Return |
| 6.45 | % | 19.96 | % | 32.82 | % | (4.02 | )% | (9.74 | )% | |||||
Ratios and Supplemental Data: |
|
|
|
|
|
|
|
|
|
|
| |||||
Net Assets, End of Period (Thousands) |
| $ | 6,704,732 |
| $ | 7,200,606 |
| $ | 5,657,941 |
| $ | 3,953,655 |
| $ | 4,004,817 |
|
Ratio of Expenses to Average Net Assets (1) |
| 0.93 | % | 0.98 | % | 1.00 | % | 1.00 | % | 1.00 | % | |||||
Ratio of Expenses to Average Net Assets Excluding Bank Overdraft Expense |
| 0.93 | % | N/A |
| N/A |
| N/A |
| N/A |
| |||||
Ratio of Net Investment Income (Loss) to Average Net Assets(1) |
| 2.04 | % | 1.48 | % | 1.48 | % | 1.24 | % | 1.35 | % | |||||
Portfolio Turnover Rate |
| 28 | % | 41 | % | 45 | % | 51 | % | 63 | % | |||||
(1) Supplemental Information on the Ratios to Average Net Assets: |
|
|
|
|
|
|
|
|
|
|
| |||||
Ratios before expense limitation: |
|
|
|
|
|
|
|
|
|
|
| |||||
Expenses to Average Net Assets |
| N/A |
| N/A |
| 1.02 | % | 1.00 | % | 1.01 | % | |||||
Net Investment Income (Loss) to Average Net Assets |
| N/A |
| N/A |
| 1.46 | % | 1.24 | % | 1.34 | % | |||||
|
| Class B |
|
| ||||||||||||
|
| Year Ended December 31, |
| |||||||||||||
Selected Per Share Data and Ratios |
| 2005 |
| 2004 |
| 2003 |
| 2002 |
| 2001 |
| |||||
Net Asset Value, Beginning of Period |
| $ | 20.85 |
| $ | 18.96 |
| $ | 14.53 |
| $ | 15.53 |
| $ | 17.81 |
|
Income (Loss) from Investment Operations |
|
|
|
|
|
|
|
|
|
|
| |||||
Net Investment Income (Loss) |
| 0.37 | † | 0.24 | † | 0.18 | † | 0.12 | † | 0.07 |
| |||||
Net Realized and Unrealized Gain (Loss) on Investments |
| 0.93 |
| 3.47 |
| 4.54 |
| (0.78 | ) | (1.83 | ) | |||||
Total from Investment Operations |
| 1.30 |
| 3.71 |
| 4.72 |
| (0.66 | ) | (1.76 | ) | |||||
Distributions from and/or in Excess of: |
|
|
|
|
|
|
|
|
|
|
| |||||
Net Investment Income |
| (0.30 | ) | (0.32 | ) | (0.29 | ) | (0.31 | ) | (0.32 | ) | |||||
Net Realized Gain |
| (1.66 | ) | (1.50 | ) | — |
| (0.03 | ) | (0.20 | ) | |||||
Total Distributions |
| (1.96 | ) | (1.82 | ) | (0.29 | ) | (0.34 | ) | (0.52 | ) | |||||
Redemption Fees |
| 0.00 | ‡ | 0.00 | ‡ | 0.00 | ‡ | — |
| — |
| |||||
Net Asset Value, End of Period |
| $ | 20.19 |
| $ | 20.85 |
| $ | 18.96 |
| $ | 14.53 |
| $ | 15.53 |
|
Total Return |
| 6.20 | % | 19.67 | % | 32.46 | % | (4.25 | )% | (9.83 | )% | |||||
Ratios and Supplemental Data: |
|
|
|
|
|
|
|
|
|
|
| |||||
Net Assets, End of Period (Thousands) |
| $ | 1,206,125 |
| $ | 1,073,278 |
| $ | 733,298 |
| $ | 439,422 |
| $ | 165,439 |
|
Ratio of Expenses to Average Net Assets (2) |
| 1.18 | % | 1.23 | % | 1.25 | % | 1.25 | % | 1.25 | % | |||||
Ratio of Expenses to Average Net Assets Excluding Bank Overdraft Expense |
| 1.18 | % | N/A |
| N/A |
| N/A |
| N/A |
| |||||
Ratio of Net Investment Income (Loss) to Average Net Assets (2) |
| 1.77 | % | 1.21 | % | 1.23 | % | 0.99 | % | 0.73 | % | |||||
Portfolio Turnover Rate |
| 28 | % | 41 | % | 45 | % | 51 | % | 63 | % | |||||
(2) Supplemental Information on the Ratios to Average Net Assets: |
|
|
|
|
|
|
|
|
|
|
| |||||
Ratios before expense limitation: |
|
|
|
|
|
|
|
|
|
|
| |||||
Expenses to Average Net Assets |
| N/A |
| N/A |
| 1.27 | % | 1.25 | % | 1.26 | % | |||||
Net Investment Income (Loss) to Average Net Assets |
| N/A |
| N/A |
| 1.21 | % | 0.99 | % | 0.72 | % | |||||
† Per share amount is based on average shares outstanding.
‡ Amount is less than $0.005 per share.
|
| The accompanying notes are an integral part of the financial statements. |
| 121 |
| 2005 Annual Report |
|
|
| December 31, 2005 |
Financial Highlights
International Growth Equity Portfolio
|
| Class A |
| |
|
| Period from |
| |
|
| December 27, 2005^ |
| |
Selected Per Share Data and Ratios |
| to December 31, 2005 |
| |
Net Asset Value, Beginning of Period |
| $ | 10.00 |
|
Income (Loss) from Investment Operations |
|
|
| |
Net Investment Income (Loss) |
| (0.00) | †‡ | |
Net Realized and Unrealized Gain (Loss) on Investments |
| (0.07 | ) | |
Total from Investment Operations |
| (0.07 | ) | |
Distributions from and/or in Excess of: |
|
|
| |
Net Investment Income |
| — |
| |
Net Realized Gain |
| — |
| |
Total Distributions |
| — |
| |
Redemption Fees |
| — |
| |
Net Asset Value, End of Period |
| $ | 9.93 |
|
Total Return |
| (0.70 | )%# | |
Ratios and Supplemental Data: |
|
|
| |
Net Assets, End of Period (Thousands) |
| $ | 4,864 |
|
Ratio of Expenses to Average Net Assets (1) |
| 1.00 | %* | |
Ratio of Net Investment Income (Loss) to Average Net Assets (1) |
| (0.86 | )%* | |
Portfolio Turnover Rate |
| 4 | %# | |
(1) Supplemental Information on the Ratios to Average Net Assets: |
|
|
| |
Ratios before expense limitation: |
|
|
| |
Expenses to Average Net Assets |
| 31.60 | %* | |
Net Investment Income (Loss) to Average Net Assets |
| (31.46 | )%* | |
|
| Class B |
| |
|
| Period from |
| |
|
| December 27, 2005^ |
| |
Selected Per Share Data and Ratios |
| to December 31, 2005 |
| |
Net Asset Value, Beginning of Period |
| $ | 10.00 |
|
Income (Loss) from Investment Operations |
|
|
| |
Net Investment Income (Loss) |
| (0.00) | †‡ | |
Net Realized and Unrealized Gain (Loss) on Investments |
| (0.07 | ) | |
Total from Investment Operations |
| (0.07 | ) | |
Distributions from and/or in Excess of: |
|
|
| |
Net Investment Income |
| — |
| |
Net Realized Gain |
| — |
| |
Total Distributions |
| — |
| |
Redemption Fees |
| — |
| |
Net Asset Value, End of Period |
| $ | 9.93 |
|
Total Return |
| (0.70 | )%# | |
Ratios and Supplemental Data: |
|
|
| |
Net Assets, End of Period (Thousands) |
| $ | 99 |
|
Ratio of Expenses to Average Net Assets (2) |
| 1.25 | %* | |
Ratio of Net Investment Income (Loss) to Average Net Assets (2) |
| (1.16 | )%* | |
Portfolio Turnover Rate |
| 4 | %# | |
(2) Supplemental Information on the Ratios to Average Net Assets: |
|
|
| |
Ratios before expense limitation: |
|
|
| |
Expenses to Average Net Assets |
| 31.85 | %* | |
Net Investment Income (Loss) to Average Net Assets |
| (31.76 | )%* | |
† Per share amount is based on average shares outstanding.
‡ Amount is less than $0.005 per share.
^ Commencement of Operations
# Not annualized
* Annualized
122 |
| The accompanying notes are an integral part of the financial statements. |
|
|
2005 Annual Report | |
|
|
December 31, 2005 | |
Financial Highlights
International Magnum Portfolio
|
| Class A |
| |||||||||||||
|
| Year Ended December 31, |
| |||||||||||||
Selected Per Share Data and Ratios |
| 2005 |
| 2004 |
| 2003 |
| 2002 |
| 2001 |
| |||||
Net Asset Value, Beginning of Period |
| $ | 11.83 |
| $ | 10.20 |
| $ | 8.04 |
| $ | 9.34 |
| $ | 11.56 |
|
Income (Loss) from Investment Operations |
|
|
|
|
|
|
|
|
|
|
| |||||
Net Investment Income (Loss) |
| 0.18 | † | 0.13 | † | 0.11 | † | 0.07 | † | 0.11 |
| |||||
Net Realized and Unrealized Gain (Loss) on Investments |
| 1.16 |
| 1.74 |
| 2.22 |
| (1.31 | ) | (2.27 | ) | |||||
Total from Investment Operations |
| 1.34 |
| 1.87 |
| 2.33 |
| (1.24 | ) | (2.16 | ) | |||||
Distributions from and/or in Excess of: |
|
|
|
|
|
|
|
|
|
|
| |||||
Net Investment Income |
| (0.16 | ) | (0.24 | ) | (0.17 | ) | (0.06 | ) | (0.06 | ) | |||||
Net Realized Gain |
| — |
| — |
| — |
| — |
| — |
| |||||
Total Distributions |
| (0.16 | ) | (0.24 | ) | (0.17 | ) | (0.06 | ) | (0.06 | ) | |||||
Redemption Fees |
| 0.00 | ‡ | — |
| — |
| — |
| — |
| |||||
Net Asset Value, End of Period |
| $ | 13.01 |
| $ | 11.83 |
| $ | 10.20 |
| $ | 8.04 |
| $ | 9.34 |
|
Total Return |
| 11.35 | % | 18.45 | % | 29.07 | % | (13.36 | )% | (18.71 | )% | |||||
Ratios and Supplemental Data: |
|
|
|
|
|
|
|
|
|
|
| |||||
Net Assets, End of Period (Thousands) |
| $ | 106,369 |
| $ | 94,162 |
| $ | 91,087 |
| $ | 68,275 |
| $ | 120,753 |
|
Ratio of Expenses to Average Net Assets (1) |
| 1.00 | % | 1.00 | % | 1.00 | % | 1.01 | % | 1.01 | % | |||||
Ratio of Expenses to Average Net Assets Excluding Bank Overdraft Expense |
| 1.00 | % | 1.00 | % | 1.00 | % | 1.00 | % | 1.00 | % | |||||
Ratio of Net Investment Income (Loss) to Average Net Assets (1) |
| 1.51 | % | 1.20 | % | 1.25 | % | 0.81 | % | 1.00 | % | |||||
Portfolio Turnover Rate |
| 32 | % | 49 | % | 53 | % | 59 | % | 44 | % | |||||
(1)Supplemental Information on the Ratios to Average Net Assets: |
|
|
|
|
|
|
|
|
|
|
| |||||
Ratios before expense limitation: |
|
|
|
|
|
|
|
|
|
|
| |||||
Expenses to Average Net Assets |
| 1.12 | % | 1.23 | % | 1.29 | % | 1.30 | % | 1.14 | % | |||||
Net Investment Income (Loss) to Average Net Assets |
| 1.39 | % | 0.96 | % | 0.96 | % | 0.52 | % | 0.87 | % | |||||
|
| Class B |
|
| ||||||||||||
|
| Year Ended December 31, |
| |||||||||||||
Selected Per Share Data and Ratios |
| 2005 |
| 2004 |
| 2003 |
| 2002 |
| 2001 |
| |||||
Net Asset Value, Beginning of Period |
| $ | 11.80 |
| $ | 10.18 |
| $ | 8.04 |
| $ | 9.32 |
| $ | 11.52 |
|
Income (Loss) from Investment Operations |
|
|
|
|
|
|
|
|
|
|
| |||||
Net Investment Income (Loss) |
| 0.15 | † | 0.11 | † | 0.10 | † | 0.06 | † | 0.01 |
| |||||
Net Realized and Unrealized Gain (Loss) on Investments |
| 1.15 |
| 1.70 |
| 2.18 |
| (1.31 | ) | (2.18 | ) | |||||
Total from Investment Operations |
| 1.30 |
| 1.81 |
| 2.28 |
| (1.25 | ) | (2.17 | ) | |||||
Distributions from and/or in Excess of: |
|
|
|
|
|
|
|
|
|
|
| |||||
Net Investment Income |
| (0.13 | ) | (0.22 | ) | (0.14 | ) | (0.03 | ) | (0.03 | ) | |||||
Net Realized Gain |
| — |
| — |
| — |
| — |
| — |
| |||||
Total Distributions |
| (0.13 | ) | (0.22 | ) | (0.14 | ) | (0.03 | ) | (0.03 | ) | |||||
Redemption Fees |
| 0.00 | ‡ | 0.03 |
| 0.00 | ‡ | — |
| — |
| |||||
Net Asset Value, End of Period |
| $ | 12.97 |
| $ | 11.80 |
| $ | 10.18 |
| $ | 8.04 |
| $ | 9.32 |
|
Total Return |
| 11.04 | % | 18.15 | % | 28.49 | % | (13.49 | )% | (18.87 | )% | |||||
Ratios and Supplemental Data: |
|
|
|
|
|
|
|
|
|
|
| |||||
Net Assets, End of Period (Thousands) |
| $ | 3,634 |
| $ | 2,605 |
| $ | 2,232 |
| $ | 6,644 |
| $ | 10,542 |
|
Ratio of Expenses to Average Net Assets (2) |
| 1.25 | % | 1.25 | % | 1.25 | % | 1.26 | % | 1.26 | % | |||||
Ratio of Expenses to Average Net Assets Excluding Bank Overdraft Expense |
| 1.25 | % | 1.25 | % | 1.25 | % | 1.25 | % | 1.25 | % | |||||
Ratio of Net Investment Income (Loss) to Average Net Assets(2) |
| 1.25 | % | 1.00 | % | 1.00 | % | 0.56 | % | 0.75 | % | |||||
Portfolio Turnover Rate |
| 32 | % | 49 | % | 53 | % | 59 | % | 44 | % | |||||
(2)Supplemental Information on the Ratios to Average Net Assets: |
|
|
|
|
|
|
|
|
|
|
| |||||
Ratios before expense limitation: |
|
|
|
|
|
|
|
|
|
|
| |||||
Expenses to Average Net Assets |
| 1.38 | % | 1.48 | % | 1.54 | % | 1.55 | % | 1.39 | % | |||||
Net Investment Income (Loss) to Average Net Assets |
| 1.12 | % | 0.77 | % | 0.71 | % | 0.27 | % | 0.62 | % | |||||
† Per share amount is based on average shares outstanding.
‡ Amount is less than $0.005 per share.
|
| The accompanying notes are an integral part of the financial statements. |
| 123 |
| 2005 Annual Report |
|
|
| December 31, 2005 |
Financial Highlights
International Real Estate Portfolio
|
| Class A |
| |||||||||||||
|
| Year Ended December 31, |
| |||||||||||||
Selected Per Share Data and Ratios |
| 2005 |
| 2004 |
| 2003 |
| 2002 |
| 2001 |
| |||||
Net Asset Value, Beginning of Period |
| $ | 21.95 |
| $ | 15.13 |
| $ | 10.93 |
| $ | 9.30 |
| $ | 10.38 |
|
Income (Loss) from Investment Operations |
|
|
|
|
|
|
|
|
|
|
| |||||
Net Investment Income (Loss) |
| 0.43 | † | 0.36 | † | 0.27 | † | 0.37 | † | 0.27 |
| |||||
Net Realized and Unrealized Gain (Loss) on Investments |
| 2.96 |
| 6.82 |
| 4.35 |
| 1.90 |
| (1.09 | ) | |||||
Total from Investment Operations |
| 3.39 |
| 7.18 |
| 4.62 |
| 2.27 |
| (0.82 | ) | |||||
Distributions from and/or in Excess of: |
|
|
|
|
|
|
|
|
|
|
| |||||
Net Investment Income |
| (0.35 | ) | (0.36 | ) | (0.42 | ) | (0.64 | ) | (0.26 | ) | |||||
Net Realized Gain |
| (1.36 | ) | — |
| — |
| — |
| — |
| |||||
Total Distributions |
| (1.71 | ) | (0.36 | ) | (0.42 | ) | (0.64 | ) | (0.26 | ) | |||||
Redemption Fees |
| 0.00 | ‡ | 0.00 | ‡ | — |
| — |
| — |
| |||||
Net Asset Value, End of Period |
| $ | 23.63 |
| $ | 21.95 |
| $ | 15.13 |
| $ | 10.93 |
| $ | 9.30 |
|
Total Return |
| 15.52 | % | 47.49 | % | 42.41 | % | 24.52 | % | (7.85 | )% | |||||
Ratios and Supplemental Data: |
|
|
|
|
|
|
|
|
|
|
| |||||
Net Assets, End of Period (Thousands) |
| $ | 250,511 |
| $ | 50,620 |
| $ | 22,184 |
| $ | 19,215 |
| $ | 13,826 |
|
Ratio of Expenses to Average Net Assets (1) |
| 1.00 | % | 1.00 | % | 1.00 | % | 1.00 | % | 1.01 | % | |||||
Ratio of Expenses to Average Net Assets Excluding Bank Overdraft Expense |
| 1.00 | % | 1.00 | % | 1.00 | % | N/A |
| 1.00 | % | |||||
Ratio of Net Investment Income (Loss) to Average Net Assets(1) |
| 1.88 | % | 2.05 | % | 2.23 | % | 3.37 | % | 2.30 | % | |||||
Portfolio Turnover Rate |
| 57 | % | 42 | % | 47 | % | 79 | % | 46 | % | |||||
(1)Supplemental Information on the Ratios to Average Net Assets: |
|
|
|
|
|
|
|
|
|
|
| |||||
Ratios before expense limitation: |
|
|
|
|
|
|
|
|
|
|
| |||||
Expenses to Average Net Assets |
| 1.11 | % | 1.38 | % | 1.49 | % | 1.56 | % | 1.53 | % | |||||
Net Investment Income (Loss) to Average Net Assets |
| 1.77 | % | 1.67 | % | 1.74 | % | 2.81 | % | 1.74 | % | |||||
|
| Class B |
| |||||||||||||
|
| Year Ended December 31, |
| |||||||||||||
Selected Per Share Data and Ratios |
| 2005 |
| 2004 |
| 2003 |
| 2002 |
| 2001 |
| |||||
Net Asset Value, Beginning of Period |
| $ | 22.04 |
| $ | 15.17 |
| $ | 10.96 |
| $ | 9.33 |
| $ | 10.41 |
|
Income (Loss) from Investment Operations |
|
|
|
|
|
|
|
|
|
|
| |||||
Net Investment Income (Loss) |
| 0.32 | † | 0.35 | † | 0.28 | † | 0.27 | † | 0.08 |
| |||||
Net Realized and Unrealized Gain (Loss) on Investments |
| 3.01 |
| 6.81 |
| 4.32 |
| 1.97 |
| (0.93 | ) | |||||
Total from Investment Operations |
| 3.33 |
| 7.16 |
| 4.60 |
| 2.24 |
| (0.85 | ) | |||||
Distributions from and/or in Excess of: |
|
|
|
|
|
|
|
|
|
|
| |||||
Net Investment Income |
| (0.33 | ) | (0.29 | ) | (0.39 | ) | (0.61 | ) | (0.23 | ) | |||||
Net Realized Gain |
| (1.36 | ) | — |
| — |
| — |
| — |
| |||||
Total Distributions |
| (1.69 | ) | (0.29 | ) | (0.39 | ) | (0.61 | ) | (0.23 | ) | |||||
Net Asset Value, End of Period |
| $ | 23.68 |
| $ | 22.04 |
| $ | 15.17 |
| $ | 10.96 |
| $ | 9.33 |
|
Total Return |
| 15.22 | % | 47.15 | % | 42.06 | % | 24.11 | % | (8.08 | )% | |||||
Ratios and Supplemental Data: |
|
|
|
|
|
|
|
|
|
|
| |||||
Net Assets, End of Period (Thousands) |
| $ | 8,674 |
| $ | 827 |
| $ | 915 |
| $ | 953 |
| $ | 1,687 |
|
Ratio of Expenses to Average Net Assets(2) |
| 1.25 | % | 1.25 | % | 1.25 | % | 1.25 | % | 1.26 | % | |||||
Ratio of Expenses to Average Net Assets Excluding Bank Overdraft Expense |
| 1.25 | % | 1.25 | % | 1.25 | % | N/A |
| 1.25 | % | |||||
Ratio of Net Investment Income (Loss) to Average Net Assets (2) |
| 1.34 | % | 2.03 | % | 1.98 | % | 3.12 | % | 1.53 | % | |||||
Portfolio Turnover Rate |
| 57 | % | 42 | % | 47 | % | 79 | % | 46 | % | |||||
(2)Supplemental Information on the Ratios to Average Net Assets: |
|
|
|
|
|
|
|
|
|
|
| |||||
Ratios before expense limitation: |
|
|
|
|
|
|
|
|
|
|
| |||||
Expenses to Average Net Assets |
| 1.45 | % | 1.66 | % | 1.74 | % | 1.81 | % | 1.78 | % | |||||
Net Investment Income (Loss) to Average Net Assets |
| 1.14 | % | 1.62 | % | 1.49 | % | 2.56 | % | 0.96 | % | |||||
† Per share amount is based on average shares outstanding.
‡ Amount is less than $0.005 per share.
124 |
| The accompanying notes are an integral part of the financial statements. |
|
|
2005 Annual Report | |
| |
December 31, 2005 | |
Financial Highlights
International Small Cap Portfolio
|
| Class A |
| ||||||||||||||
|
| Year Ended December 31, |
| ||||||||||||||
Selected Per Share Data and Ratios |
| 2005 |
| 2004 |
| 2003 |
| 2002 |
| 2001 |
| ||||||
Net Asset Value, Beginning of Period |
| $ | 25.11 |
| $ | 20.52 |
| $ | 14.21 |
| $ | 14.82 |
| $ | 16.30 |
| |
Income (Loss) from Investment Operations |
|
|
|
|
|
|
|
|
|
|
| ||||||
Net Investment Income (Loss) |
| 0.32 | † | 0.24 | † | 0.24 | † | 0.15 | † | 0.21 |
| ||||||
Net Realized and Unrealized Gain (Loss) on Investments ^^ |
| 2.89 |
| 6.59 |
| 6.61 |
| (0.59 | ) | (1.18 | ) | ||||||
Total from Investment Operations |
| 3.21 |
| 6.83 |
| 6.85 |
| (0.44 | ) | (0.97 | ) | ||||||
Distributions from and/or in Excess of: |
|
|
|
|
|
|
|
|
|
|
| ||||||
Net Investment Income |
| (0.47 | ) | (0.35 | ) | (0.23 | ) | (0.13 | ) | (0.27 | ) | ||||||
Net Realized Gain |
| (3.71 | ) | (1.89 | ) | (0.31 | ) | (0.04 | ) | (0.24 | ) | ||||||
Total Distributions |
| (4.18 | ) | (2.24 | ) | (0.54 | ) | (0.17 | ) | (0.51 | ) | ||||||
Redemption Fees |
| 0.00 | ‡ | 0.00 | ‡ | 0.00 | ‡ | — |
| — |
| ||||||
Transaction Fees |
| — |
| — |
| — |
| — |
| 0.00 | ‡ | ||||||
Net Asset Value, End of Period |
| $ | 24.14 |
| $ | 25.11 |
| $ | 20.52 |
| $ | 14.21 |
| $ | 14.82 |
| |
Total Return |
| 13.07 | % | 33.53 | % | 48.32 | % | (2.99 | )% | (5.88 | )% | ||||||
Ratios and Supplemental Data: |
|
|
|
|
|
|
|
|
|
|
| ||||||
Net Assets, End of Period (Thousands) |
| $ | 1,389,078 |
| $ | 1,276,083 |
| $ | 899,996 |
| $ | 440,124 |
| $ | 376,981 |
| |
Ratio of Expenses to Average Net Assets(1) |
| 1.10 | % | 1.15 | % | 1.15 | % | 1.15 | % | 1.15 | % | ||||||
Ratio of Expenses to Average Net Assets Excluding Bank Overdraft Expense |
| 1.10 | % | 1.15 | % | 1.15 | % | N/A |
| N/A |
| ||||||
Ratio of Net Investment Income (Loss) to Average Net Assets (1) |
| 1.22 | % | 1.04 | % | 1.40 | % | 1.00 | % | 1.38 | % | ||||||
Portfolio Turnover Rate |
| 47 | % | 38 | % | 38 | % | 34 | % | 39 | % | ||||||
(1)Supplemental Information on the Ratios to Average Net Assets: |
|
|
|
|
|
|
|
|
|
|
| ||||||
Ratios before expense limitation: |
|
|
|
|
|
|
|
|
|
|
| ||||||
Expenses to Average Net Assets |
| N/A |
| 1.16 | % | 1.20 | % | 1.19 | % | 1.19 | % | ||||||
Net Investment Income (Loss) to Average Net Assets |
| N/A |
| 1.03 | % | 1.35 | % | 0.96 | % | 1.34 | % | ||||||
† | Per share amount is based on average shares outstanding. | ||||||||||||||||
‡ | Amount is less than $0.005 per share. | ||||||||||||||||
^^ | Includes a 0.50% transaction fee on subscriptions and redemptions of capital shares for the year ended 2001. | ||||||||||||||||
| The accompanying notes are an integral part of the financial statements. | 125 |
| 2005 Annual Report |
|
|
| December 31, 2005 |
Financial Highlights
Focus Equity Portfolio
|
| Class A |
| |||||||||||||
|
| Year Ended December 31, |
| |||||||||||||
Selected Per Share Data and Ratios |
| 2005 |
| 2004 |
| 2003 |
| 2002 |
| 2001 |
| |||||
Net Asset Value, Beginning of Period |
| $ | 12.59 |
| $ | 11.79 |
| $ | 9.02 |
| $ | 12.67 |
| $ | 15.31 |
|
Income (Loss) from Investment Operations |
|
|
|
|
|
|
|
|
|
|
| |||||
Net Investment Income (Loss) |
| (0.03 | )† | 0.04 | † | 0.02 | † | 0.00 | †‡ | (0.03 | ) | |||||
Net Realized and Unrealized Gain (Loss) on Investments |
| 2.24 |
| 0.78 |
| 2.77 |
| (3.65 | ) | (2.28 | ) | |||||
Total from Investment Operations |
| 2.21 |
| 0.82 |
| 2.79 |
| (3.65 | ) | (2.31 | ) | |||||
Distributions from and/or in Excess of: |
|
|
|
|
|
|
|
|
|
|
| |||||
Net Investment Income |
| (0.02 | ) | (0.02 | ) | (0.02 | ) | — |
| — |
| |||||
Net Realized Gain |
| — |
| — |
| — |
| — |
| (0.33 | ) | |||||
Total Distributions |
| (0.02 | ) | (0.02 | ) | (0.02 | ) | — |
| (0.33 | ) | |||||
Net Asset Value, End of Period |
| $ | 14.78 |
| $ | 12.59 |
| $ | 11.79 |
| $ | 9.02 |
| $ | 12.67 |
|
Total Return |
| 17.60 | % | 7.00 | % | 30.99 | %§ | (28.81 | )% | (15.22 | )% | |||||
Ratios and Supplemental Data: |
|
|
|
|
|
|
|
|
|
|
| |||||
Net Assets, End of Period (Thousands) |
| $ | 54,321 |
| $ | 52,757 |
| $ | 61,420 |
| $ | 51,347 |
| $ | 85,204 |
|
Ratio of Expenses to Average Net Assets (1) |
| 0.91 | % | 1.00 | % | 1.00 | % | 1.00 | % | 1.01 | % | |||||
Ratio of Expenses to Average Net Assets Excluding Bank Overdraft Expense |
| 0.91 | % | 1.00 | % | 1.00 | % | N/A |
| 1.00 | % | |||||
Ratio of Net Investment Income (Loss) to Average Net Assets (1) |
| (0.27 | )% | 0.35 | % | 0.22 | % | 0.02 | % | (0.21 | )% | |||||
Portfolio Turnover Rate |
| 78 | % | 163 | % | 160 | % | 173 | % | 95 | % | |||||
(1)Supplemental Information on the Ratios to Average Net Assets: |
|
|
|
|
|
|
|
|
|
|
| |||||
Ratios before expense limitation: |
|
|
|
|
|
|
|
|
|
|
| |||||
Expenses to Average Net Assets |
| N/A |
| 1.11 | % | 1.14 | % | 1.09 | % | 1.08 | % | |||||
Net Investment Income (Loss) to Average Net Assets |
| N/A |
| 0.24 | % | 0.08 | % | (0.07 | )% | (0.28 | )% | |||||
|
| Class B |
| ||||||||||||||
|
| Year Ended December 31, |
| ||||||||||||||
Selected Per Share Data and Ratios |
| 2005 |
| 2004 |
| 2003 |
| 2002 |
| 2001 |
| ||||||
Net Asset Value, Beginning of Period |
| $ | 12.34 |
| $ | 11.57 |
| $ | 8.85 |
| $ | 12.45 |
| $ | 15.09 |
| |
Income (Loss) from Investment Operations |
|
|
|
|
|
|
|
|
|
|
| ||||||
Net Investment Income (Loss) |
| (0.06 | )† | 0.02 | † | (0.00 | )†‡ | (0.03 | )† | (0.07 | ) | ||||||
Net Realized and Unrealized Gain (Loss) on Investments |
| 2.19 |
| 0.75 |
| 2.72 |
| (3.57 | ) | (2.24 | ) | ||||||
Total from Investment Operations |
| 2.13 |
| 0.77 |
| 2.72 |
| (3.60 | ) | (2.31 | ) | ||||||
Distributions from and/or in Excess of: |
|
|
|
|
|
|
|
|
|
|
| ||||||
Net Investment Income |
| (0.02 | ) | — |
| — |
| — |
| — |
| ||||||
Net Realized Gain |
| — |
| — |
| — |
| — |
| (0.33 | ) | ||||||
Total Distributions |
| (0.02 | ) | — |
| — |
| — |
| (0.33 | ) | ||||||
Net Asset Value, End of Period |
| $ | 14.45 |
| $ | 12.34 |
| $ | 11.57 |
| $ | 8.85 |
| $ | 12.45 |
| |
Total Return |
| 17.30 | % | 6.75 | % | 30.62 | %§ | (28.92 | )% | (15.45 | )% | ||||||
Ratios and Supplemental Data: |
|
|
|
|
|
|
|
|
|
|
| ||||||
Net Assets, End of Period (Thousands) |
| $ | 12,442 |
| $ | 8,559 |
| $ | 8,156 |
| $ | 6,414 |
| $ | 13,143 |
| |
Ratio of Expenses to Average Net Assets(2) |
| 1.16 | % | 1.25 | % | 1.25 | % | 1.25 | % | 1.26 | % | ||||||
Ratio of Expenses to Average Net Assets Excluding Bank Overdraft Expense |
| 1.16 | % | 1.25 | % | 1.25 | % | N/A |
| 1.25 | % | ||||||
Ratio of Net Investment Income (Loss) to Average Net Assets(2) |
| (0.49 | )% | 0.18 | % | (0.03 | )% | (0.23 | )% | (0.45 | )% | ||||||
Portfolio Turnover Rate |
| 78 | % | 163 | % | 160 | % | 173 | % | 95 | % | ||||||
|
|
|
|
|
|
|
|
|
|
|
| ||||||
(2)Supplemental Information on the Ratios to Average Net Assets: |
|
|
|
|
|
|
|
|
|
|
| ||||||
Ratios before expense limitation: |
|
|
|
|
|
|
|
|
|
|
| ||||||
Expenses to Average Net Assets |
| N/A |
| 1.36 | % | 1.39 | % | 1.34 | % | 1.33 | % | ||||||
Net Investment Income (Loss) to Average Net Assets |
| N/A |
| 0.07 | % | (0.17 | )% | (0.32 | % | (0.53 | )% | ||||||
† | Per share amount is based on average shares outstanding. | ||||||||||||||||
‡ | Amount is less than $0.005 per share. | ||||||||||||||||
§ | In 2003, performance was positively impacted by approximately 5.64%, due to the receipt of proceeds from the settlement of class action suits involving, primarily, one of the Portfolio’s holdings. This was a one-time settlement, and as a result, the impact on the NAV and consequently the performance will not likely be repeated in the future. Had these settlements not occurred, the 2003 total return for Class A shares and Class B shares would have been approximately 25.35% and 24.98%, respectively. | ||||||||||||||||
126 | The accompanying notes are an integral part of the financial statements. |
|
2005 Annual Report | |
|
|
December 31, 2005 | |
Financial Highlights
Large Cap Relative Value Portfolio
|
| Class A |
| |||||||||||||
|
| Year Ended December 31, |
| |||||||||||||
Selected Per Share Data and Ratios |
| 2005 |
| 2004 |
| 2003 |
| 2002 |
| 2001 |
| |||||
Net Asset Value, Beginning of Period |
| $ | 10.52 |
| $ | 9.30 |
| $ | 7.21 |
| $ | 9.68 |
| $ | 10.32 |
|
Income (Loss) from Investment Operations |
|
|
|
|
|
|
|
|
|
|
| |||||
Net Investment Income (Loss)† |
| 0.15 |
| 0.12 |
| 0.13 |
| 0.14 |
| 0.15 |
| |||||
Net Realized and Unrealized Gain (Loss) on Investments |
| 0.90 |
| 1.23 |
| 2.09 |
| (2.47 | ) | (0.31 | ) | |||||
Total from Investment Operations |
| 1.05 |
| 1.35 |
| 2.22 |
| (2.33 | ) | (0.16 | ) | |||||
Distributions from and/or in Excess of: |
|
|
|
|
|
|
|
|
|
|
| |||||
Net Investment Income |
| (0.14 | ) | (0.13 | ) | (0.13 | ) | (0.14 | ) | (0.15 | ) | |||||
Net Realized Gain |
| (0.33 | ) | — |
| — |
| — |
| (0.33 | ) | |||||
Total Distributions |
| (0.47 | ) | (0.13 | ) | (0.13 | ) | (0.14 | ) | (0.48 | ) | |||||
Net Asset Value, End of Period |
| $ | 11.10 |
| $ | 10.52 |
| $ | 9.30 |
| $ | 7.21 |
| $ | 9.68 |
|
Total Return |
| 10.07 | % | 14.56 | % | 31.05 | % | (24.22 | )% | (1.55 | )% | |||||
Ratios and Supplemental Data: |
|
|
|
|
|
|
|
|
|
|
| |||||
Net Assets, End of Period (Thousands) |
| $ | 102,973 |
| $ | 90,938 |
| $ | 108,997 |
| $ | 76,452 |
| $ | 101,691 |
|
Ratio of Expenses to Average Net Assets(1) |
| 0.68 | % | 0.70 | % | 0.70 | % | 0.70 | % | 0.70 | % | |||||
Ratio of Expenses to Average Net Assets Excluding Bank Overdraft Expense |
| 0.68 | % | N/A |
| N/A |
| N/A |
| N/A |
| |||||
Ratio of Net Investment Income (Loss) to Average Net Assets (1) |
| 1.36 | % | 1.28 | % | 1.62 | % | 1.69 | % | 1.56 | % | |||||
Portfolio Turnover Rate |
| 46 | % | 84 | % | 130 | % | 45 | % | 50 | % | |||||
(1)Supplemental Information on the Ratios to Average Net Assets: |
|
|
|
|
|
|
|
|
|
|
| |||||
Ratios before expense limitation: |
|
|
|
|
|
|
|
|
|
|
| |||||
Expenses to Average Net Assets |
| N/A |
| 0.74 | % | 0.77 | % | 0.76 | % | 0.79 | % | |||||
Net Investment Income (Loss) to Average Net Assets |
| N/A |
| 1.24 | % | 1.55 | % | 1.63 | % | 1.47 | % | |||||
|
| Class B |
| ||||||||||||||||
|
| Year Ended December 31, |
| ||||||||||||||||
Selected Per Share Data and Ratios |
| 2005 |
| 2004 |
| 2003 |
| 2002 |
| 2001 |
| ||||||||
Net Asset Value, Beginning of Period |
| $ | 10.51 |
| $ | 9.31 |
| $ | 7.21 |
| $ | 9.67 |
| $ | 10.32 |
| |||
Income (Loss) from Investment Operations |
|
|
|
|
|
|
|
|
|
|
| ||||||||
Net Investment Income (Loss)† |
| 0.12 |
| 0.10 |
| 0.11 |
| 0.12 |
| 0.13 |
| ||||||||
Net Realized and Unrealized Gain (Loss) on Investments |
| 0.91 |
| 1.20 |
| 2.10 |
| (2.46 | ) | (0.32 | ) | ||||||||
Total from Investment Operations |
| 1.03 |
| 1.30 |
| 2.21 |
| (2.34 | ) | (0.19 | ) | ||||||||
Distributions from and/or in Excess of: |
|
|
|
|
|
|
|
|
|
|
| ||||||||
Net Investment Income |
| (0.12 | ) | (0.10 | ) | (0.11 | ) | (0.12 | ) | (0.13 | ) | ||||||||
Net Realized Gain |
| (0.33 | ) | — |
| — |
| — |
| (0.33 | ) | ||||||||
Total Distributions |
| (0.45 | ) | (0.10 | ) | (0.11 | ) | (0.12 | ) | (0.46 | ) | ||||||||
Net Asset Value, End of Period |
| $ | 11.09 |
| $ | 10.51 |
| $ | 9.31 |
| $ | 7.21 |
| $ | 9.67 |
| |||
Total Return |
| 9.81 | % | 14.07 | % | 30.86 | % | (24.32 | )% | (1.89 | )% | ||||||||
Ratios and Supplemental Data: |
|
|
|
|
|
|
|
|
|
|
| ||||||||
Net Assets, End of Period (Thousands) |
| $ | 101,499 |
| $ | 75,189 |
| $ | 72,180 |
| $ | 46,757 |
| $ | 24,597 |
| |||
Ratio of Expenses to Average Net Assets (2) |
| 0.93 | % | 0.95 | % | 0.95 | % | 0.95 | % | 0.95 | % | ||||||||
Ratio of Expenses to Average Net Assets Excluding Bank Overdraft Expense |
| 0.93 | % | N/A |
| N/A |
| N/A |
| N/A |
| ||||||||
Ratio of Net Investment Income (Loss) to Average Net Assets (2) |
| 1.10 | % | 1.05 | % | 1.37 | % | 1.44 | % | 1.25 | % | ||||||||
Portfolio Turnover Rate |
| 46 | % | 84 | % | 130 | % | 45 | % | 50 | % | ||||||||
(2)Supplemental Information on the Ratios to Average Net Assets: |
|
|
|
|
|
|
|
|
|
|
| ||||||||
Ratios before expense limitation: |
|
|
|
|
|
|
|
|
|
|
| ||||||||
Expenses to Average Net Assets |
| N/A |
| 0.99 | % | 1.02 | % | 1.01 | % | 1.04 | % | ||||||||
Net Investment Income (Loss) to Average Net Assets |
| N/A |
| 1.01 | % | 1.30 | % | 1.38 | % | 1.17 | % | ||||||||
† |
| Per share amount is based on average shares outstanding. |
| ||||||||||||||||
| The accompanying notes are an integral part of the financial statements. | 127 |
| 2005 Annual Report |
|
|
| December 31, 2005 |
Financial Highlights
Small Company Growth Portfolio
|
| Class A |
| ||||||||||||||
|
| Year Ended December 31, |
| ||||||||||||||
Selected Per Share Data and Ratios |
| 2005 |
| 2004 |
| 2003 |
| 2002 |
| 2001 |
| ||||||
Net Asset Value, Beginning of Period |
| $ | 12.50 |
| $ | 10.81 |
| $ | 7.50 |
| $ | 9.65 |
| $ | 10.99 |
| |
Income (Loss) from Investment Operations |
|
|
|
|
|
|
|
|
|
|
| ||||||
Net Investment Income (Loss) |
| (0.00 | )†‡ | (0.09 | )† | (0.09 | )† | (0.07 | )† | (0.06 | ) | ||||||
Net Realized and Unrealized Gain (Loss) on Investments |
| 1.72 |
| 2.16 |
| 3.40 |
| (2.08 | ) | (1.28 | ) | ||||||
Total from Investment Operations |
| 1.72 |
| 2.07 |
| 3.31 |
| (2.15 | ) | (1.34 | ) | ||||||
Distributions from and/or in Excess of: |
|
|
|
|
|
|
|
|
|
|
| ||||||
Net Realized Gain |
| (1.33 | ) | (0.38 | ) | — |
| — |
| (0.00 | )‡ | ||||||
Redemption Fees |
| 0.00 | ‡ | — |
| — |
| — |
| — |
| ||||||
Net Asset Value, End of Period |
| $ | 12.89 |
| $ | 12.50 |
| $ | 10.81 |
| $ | 7.50 |
| $ | 9.65 |
| |
Total Return |
| 13.55 | % | 19.17 | % | 44.13 | % | (22.28 | )% | (12.18 | )% | ||||||
Ratios and Supplemental Data: |
|
|
|
|
|
|
|
|
|
|
| ||||||
Net Assets, End of Period (Thousands) |
| $ | 896,204 |
| $ | 651,276 |
| $ | 299,198 |
| $ | 74,554 |
| $ | 82,300 |
| |
Ratio of Expenses to Average Net Assets (1) |
| 1.04 | % | 1.10 | % | 1.10 | % | 1.10 | % | 1.10 | % | ||||||
Ratio of Expenses to Average Net Assets Excluding Bank Overdraft Expense |
| 1.04 | % | N/A |
| N/A |
| N/A |
| N/A |
| ||||||
Ratio of Net Investment Income (Loss) to Average Net Assets(1) |
| (0.04 | )% | (0.79 | )% | (0.93 | )% | (0.82 | )% | (0.69 | )% | ||||||
Portfolio Turnover Rate |
| 73 | % | 111 | % | 160 | % | 133 | % | 144 | % | ||||||
(1)Supplemental Information on the Ratios to Average Net Assets: |
|
|
|
|
|
|
|
|
|
|
| ||||||
Ratios before expense limitation: |
|
|
|
|
|
|
|
|
|
|
| ||||||
Expenses to Average Net Assets |
| N/A |
| 1.16 | % | 1.26 | % | 1.22 | % | 1.25 | % | ||||||
Net Investment Income (Loss) to Average Net Assets |
| N/A |
| (0.85 | )% | (1.09 | )% | (0.94 | )% | (0.83 | )% | ||||||
|
| Class B |
| ||||||||||||||||
|
| Year Ended December 31, |
| ||||||||||||||||
Selected Per Share Data and Ratios |
| 2005 |
| 2004 |
| 2003 |
| 2002 |
| 2001 |
| ||||||||
Net Asset Value, Beginning of Period |
| $ | 12.02 |
| $ | 10.43 |
| $ | 7.26 |
| $ | 9.36 |
| $ | 10.68 |
| |||
Income (Loss) from Investment Operations |
|
|
|
|
|
|
|
|
|
|
| ||||||||
Net Investment Income (Loss) |
| (0.03 | )† | (0.11 | )† | (0.10 | )† | (0.09 | )† | (0.06 | ) | ||||||||
Net Realized and Unrealized Gain (Loss) on Investments |
| 1.65 |
| 2.08 |
| 3.27 |
| (2.01 | ) | (1.26 | ) | ||||||||
Total from Investment Operations |
| 1.62 |
| 1.97 |
| 3.17 |
| (2.10 | ) | (1.32 | ) | ||||||||
Distributions from and/or in Excess of: |
|
|
|
|
|
|
|
|
|
|
| ||||||||
Net Realized Gain |
| (1.33 | ) | (0.38 | ) | — |
| — |
| (0.00 | )‡ | ||||||||
Net Asset Value, End of Period |
| $ | 12.31 |
| $ | 12.02 |
| $ | 10.43 |
| $ | 7.26 |
| $ | 9.36 |
| |||
Total Return |
| 13.35 | % | 18.79 | % | 43.80 | % | (22.44 | )% | (12.35 | )% | ||||||||
Ratios and Supplemental Data: |
|
|
|
|
|
|
|
|
|
|
| ||||||||
Net Assets, End of Period (Thousands) |
| $ | 808,493 |
| $ | 713,733 |
| $ | 484,136 |
| $ | 215,899 |
| $ | 184,099 |
| |||
Ratio of Expenses to Average Net Assets (2) |
| 1.29 | % | 1.35 | % | 1.35 | % | 1.35 | % | 1.35 | % | ||||||||
Ratio of Expenses to Average Net Assets Excluding Bank Overdraft Expense |
| 1.29 | % | N/A |
| N/A |
| N/A |
| N/A |
| ||||||||
Ratio of Net Investment Income (Loss) to Average Net Assets (2) |
| (0.24 | )% | (1.02 | )% | (1.18 | )% | (1.07 | )% | (0.97 | )% | ||||||||
Portfolio Turnover Rate |
| 73 | % | 111 | % | 160 | % | 133 | % | 144 | % | ||||||||
(2)Supplemental Information on the Ratios to Average Net Assets: |
|
|
|
|
|
|
|
|
|
|
| ||||||||
Ratios before expense limitation: |
|
|
|
|
|
|
|
|
|
|
| ||||||||
Expenses to Average Net Assets |
| N/A |
| 1.41 | % | 1.51 | % | 1.47 | % | 1.50 | % | ||||||||
Net Investment Income (Loss) to Average Net Assets |
| N/A |
| (1.09 | )% | (1.34 | )% | (1.19 | )% | (1.12 | )% | ||||||||
† |
| Per share amount is based on average shares outstanding. |
| ||||||||||||||||
‡ |
| Amount is less than $0.005 per share. |
| ||||||||||||||||
128 | The accompanying notes are an integral part of the financial statements. |
|
2005 Annual Report | |
| |
December 31, 2005 | |
Financial Highlights
U.S. Large Cap Growth Portfolio
|
| Class A |
| |||||||||||||
|
| Year Ended December 31, |
| |||||||||||||
Selected Per Share Data and Ratios |
| 2005 |
| 2004 |
| 2003 |
| 2002 |
| 2001 |
| |||||
Net Asset Value, Beginning of Period |
| $ | 16.88 |
| $ | 15.74 |
| $ | 12.49 |
| $ | 17.29 |
| $ | 20.51 |
|
Income (Loss) from Investment Operations |
|
|
|
|
|
|
|
|
|
|
| |||||
Net Investment Income (Loss) |
| 0.02 | † | 0.09 | † | 0.05 | † | 0.03 | † | 0.01 |
| |||||
Net Realized and Unrealized Gain (Loss) on Investments |
| 2.63 |
| 1.13 |
| 3.25 |
| (4.80 | ) | (3.08 | ) | |||||
Total from Investment Operations |
| 2.65 |
| 1.22 |
| 3.30 |
| (4.77 | ) | (3.07 | ) | |||||
Distributions from and/or in Excess of: |
|
|
|
|
|
|
|
|
|
|
| |||||
Net Investment Income |
| (0.04 | ) | (0.08 | ) | (0.05 | ) | (0.03 | ) | — |
| |||||
Net Realized Gain |
| — |
| — |
| — |
| — |
| (0.15 | ) | |||||
Total Distributions |
| (0.04 | ) | (0.08 | ) | (0.05 | ) | (0.03 | ) | (0.15 | ) | |||||
Net Asset Value, End of Period |
| $ | 19.49 |
| $ | 16.88 |
| $ | 15.74 |
| $ | 12.49 |
| $ | 17.29 |
|
Total Return |
| 15.72 | % | 7.75 | % | 26.41 | %§ | (27.64 | )% | (14.97 | )% | |||||
Ratios and Supplemental Data: |
|
|
|
|
|
|
|
|
|
|
| |||||
Net Assets, End of Period (Thousands) |
| $ | 871,905 |
| $ | 554,097 |
| $ | 589,698 |
| $ | 432,207 |
| $ | 603,652 |
|
Ratio of Expenses to Average Net Assets (1) |
| 0.65 | % | 0.77 | % | 0.80 | % | 0.80 | % | 0.80 | % | |||||
Ratio of Expenses to Average Net Assets Excluding Bank Overdraft Expense |
| 0.65 | % | N/A |
| N/A |
| N/A |
| N/A |
| |||||
Ratio of Net Investment Income (Loss) to Average Net Assets(1) |
| 0.13 | % | 0.58 | % | 0.34 | % | 0.21 | % | 0.05 | % | |||||
Portfolio Turnover Rate |
| 106 | % | 179 | % | 131 | % | 143 | % | 94 | % | |||||
(1)Supplemental Information on the Ratios to Average Net Assets: |
|
|
|
|
|
|
|
|
|
|
| |||||
Ratios before expense limitation: |
|
|
|
|
|
|
|
|
|
|
| |||||
Expenses to Average Net Assets |
| N/A |
| N/A |
| 0.82 | % | 0.81 | % | 0.81 | % | |||||
Net Investment Income (Loss) to Average Net Assets |
| N/A |
| N/A |
| 0.32 | % | 0.21 | % | 0.06 | % | |||||
|
| Class B | ||||||||||||||||
|
| Year Ended December 31, | ||||||||||||||||
Selected Per Share Data and Ratios |
| 2005 |
| 2004 |
| 2003 |
| 2002 |
| 2001 |
| |||||||
Net Asset Value, Beginning of Period |
| $ | 16.67 |
| $ | 15.55 |
| $ | 12.34 |
| $ | 17.08 |
| $ | 20.32 |
| ||
Income (Loss) from Investment Operations |
|
|
|
|
|
|
|
|
|
|
| |||||||
Net Investment Income (Loss) |
| (0.03 | )† | 0.05 | † | 0.01 | † | (0.00 | )†‡ | (0.04 | ) | |||||||
Net Realized and Unrealized Gain (Loss) on Investments |
| 2.60 |
| 1.11 |
| 3.21 |
| (4.74 | ) | (3.05 | ) | |||||||
Total from Investment Operations |
| 2.57 |
| 1.16 |
| 3.22 |
| (4.74 | ) | (3.09 | ) | |||||||
Distributions from and/or in Excess of: |
|
|
|
|
|
|
|
|
|
|
| |||||||
Net Investment Income |
| (0.03 | ) | (0.04 | ) | (0.01 | ) | — |
| — |
| |||||||
Net Realized Gain |
| — |
| — |
| — |
| — |
| (0.15 | ) | |||||||
Total Distributions |
| (0.03 | ) | (0.04 | ) | (0.01 | ) | — |
| (0.15 | ) | |||||||
Net Asset Value, End of Period |
| $ | 19.21 |
| $ | 16.67 |
| $ | 15.55 |
| $ | 12.34 |
| $ | 17.08 |
| ||
Total Return |
| 15.41 | % | 7.45 | % | 26.13 | %§ | (27.75 | )% | (15.26 | )% | |||||||
Ratios and Supplemental Data: |
|
|
|
|
|
|
|
|
|
|
| |||||||
Net Assets, End of Period (Thousands) |
| $ | 35,678 |
| $ | 202,893 |
| $ | 199,591 |
| $ | 156,501 |
| $ | 223,646 |
| ||
Ratio of Expenses to Average Net Assets(2) |
| 0.90 | % | 1.02 | % | 1.05 | % | 1.05 | % | 1.05 | % | |||||||
Ratio of Expenses to Average Net Assets Excluding Bank Overdraft Expense |
| 0.90 | % | N/A |
| N/A |
| N/A |
| N/A |
| |||||||
Ratio of Net Investment Income (Loss) to Average Net Assets (2) |
| (0.17 | )% | 0.33 | % | 0.09 | % | (0.04 | )% | (0.22 | )% | |||||||
Portfolio Turnover Rate |
| 106 | % | 179 | % | 131 | % | 143 | % | 94 | % | |||||||
(2) Supplemental Information on the Ratios to Average Net Assets: |
|
|
|
|
|
|
|
|
|
|
| |||||||
Ratios before expense limitation: |
|
|
|
|
|
|
|
|
|
|
| |||||||
Expenses to Average Net Assets |
| N/A |
| N/A |
| 1.07 | % | 1.06 | % | 1.06 | % | |||||||
Net Investment Income (Loss) to Average Net Assets |
| N/A |
| N/A |
| 0.07 | % | (0.04 | )% | (0.22 | )% | |||||||
† | Per share amount is based on average shares outstanding. | |||||||||||||||||
‡ | Amount is less than $0.005 per share. | |||||||||||||||||
§ | In 2003, performance was positively impacted by approximately 1.34%, due to the receipt of proceeds from the settlement of class action suits involving, primarily, one of the Portfolio’s holdings. This was a one-time settlement, and as a result, the impact on the NAV and consequently the performance will not likely be repeated in the future. Had these settlements not occurred, the total return for Class A shares and Class B shares would have been approximately 25.07% and 24.79%, respectively. | |||||||||||||||||
| ||||||||||||||||||
| ||||||||||||||||||
| ||||||||||||||||||
| The accompanying notes are an integral part of the financial statements. | 129 |
| 2005 Annual Report |
|
|
| December 31, 2005 |
Financial Highlights
U.S. Real Estate Portfolio
|
| Class A |
| |||||||||||||
|
| Year Ended December 31, |
| |||||||||||||
Selected Per Share Data and Ratios |
| 2005 |
| 2004 |
| 2003 |
| 2002 |
| 2001 |
| |||||
Net Asset Value, Beginning of Period |
| $ | 23.21 |
| $ | 17.92 |
| $ | 13.55 |
| $ | 14.63 |
| $ | 14.50 |
|
Income (Loss) from Investment Operations |
|
|
|
|
|
|
|
|
|
|
| |||||
Net Investment Income (Loss) |
| 0.45 | † | 0.40 | † | 0.48 | † | 0.52 | † | 0.60 |
| |||||
Net Realized and Unrealized Gain (Loss) on Investments |
| 3.58 |
| 6.17 |
| 4.55 |
| (0.48 | ) | 0.71 |
| |||||
Total from Investment Operations |
| 4.03 |
| 6.57 |
| 5.03 |
| 0.04 |
| 1.31 |
| |||||
Distributions from and/or in Excess of: |
|
|
|
|
|
|
|
|
|
|
| |||||
Net Investment Income |
| (0.44 | ) | (0.42 | ) | (0.48 | ) | (0.52 | ) | (0.57 | ) | |||||
Net Realized Gain |
| (3.39 | ) | (0.86 | ) | (0.18 | ) | (0.60 | ) | (0.61 | ) | |||||
Total Distributions |
| (3.83 | ) | (1.28 | ) | (0.66 | ) | (1.12 | ) | (1.18 | ) | |||||
Net Asset Value, End of Period |
| $ | 23.41 |
| $ | 23.21 |
| $ | 17.92 |
| $ | 13.55 |
| $ | 14.63 |
|
Total Return |
| 17.66 | % | 37.28 | % | 37.61 | % | 0.18 | % | 9.27 | % | |||||
Ratios and Supplemental Data: |
|
|
|
|
|
|
|
|
|
|
| |||||
Net Assets, End of Period (Thousands) |
| $ | 1,209,668 |
| $ | 1,097,718 |
| $ | 897,551 |
| $ | 655,274 |
| $ | 696,871 |
|
Ratio of Expenses to Average Net Assets (1) |
| 0.89 | % | 0.97 | % | 1.00 | % | 0.99 | % | 1.00 | % | |||||
Ratio of Expenses to Average Net Assets Excluding Bank Overdraft Expense |
| 0.89 | % | N/A |
| N/A |
| N/A |
| N/A |
| |||||
Ratio of Net Investment Income (Loss) to Average Net Assets (1) |
| 1.87 | % | 2.02 | % | 3.08 | % | 3.49 | % | 4.19 | % | |||||
Portfolio Turnover Rate |
| 33 | % | 21 | % | 17 | % | 47 | % | 33 | % | |||||
(1) Supplemental Information on the Ratios to Average Net Assets: |
|
|
|
|
|
|
|
|
|
|
| |||||
Ratios before expense limitation: |
|
|
|
|
|
|
|
|
|
|
| |||||
Expenses to Average Net Assets |
| N/A |
| N/A |
| 1.01 | % | 0.99 | % | 1.01 | % | |||||
Net Investment Income (Loss) to Average Net Assets |
| N/A |
| N/A |
| 3.07 | % | 3.49 | % | 4.18 | % | |||||
|
| Class B |
| |||||||||||||||
|
| Year Ended December 31, |
| |||||||||||||||
Selected Per Share Data and Ratios |
| 2005 |
| 2004 |
| 2003 |
| 2002 |
| 2001 |
| |||||||
Net Asset Value, Beginning of Period |
| $ | 23.04 |
| $ | 17.80 |
| $ | 13.47 |
| $ | 14.55 |
| $ | 14.45 |
| ||
Income (Loss) from Investment Operations |
|
|
|
|
|
|
|
|
|
|
| |||||||
Net Investment Income (Loss) |
| 0.38 | † | 0.35 | † | 0.45 | † | 0.45 | † | 0.56 | † | |||||||
Net Realized and Unrealized Gain (Loss) on Investments |
| 3.56 |
| 6.13 |
| 4.50 |
| (0.45 | ) | 0.68 |
| |||||||
Total from Investment Operations |
| 3.94 |
| 6.48 |
| 4.95 |
| — |
| 1.24 |
| |||||||
Distributions from and/or in Excess of: |
|
|
|
|
|
|
|
|
|
|
| |||||||
Net Investment Income |
| (0.38 | ) | (0.38 | ) | (0.44 | ) | (0.48 | ) | (0.53 | ) | |||||||
Net Realized Gain |
| (3.39 | ) | (0.86 | ) | (0.18 | ) | (0.60 | ) | (0.61 | ) | |||||||
Total Distributions |
| (3.77 | ) | (1.24 | ) | (0.62 | ) | (1.08 | ) | (1.14 | ) | |||||||
Net Asset Value, End of Period |
| $ | 23.21 |
| $ | 23.04 |
| $ | 17.80 |
| $ | 13.47 |
| $ | 14.55 |
| ||
Total Return |
| 17.37 | % | 36.95 | % | 37.23 | % | (0.07 | )% | 8.78 | % | |||||||
Ratios and Supplemental Data: |
|
|
|
|
|
|
|
|
|
|
| |||||||
Net Assets, End of Period (Thousands) |
| $ | 157,650 |
| $ | 149,180 |
| $ | 70,146 |
| $ | 31,584 |
| $ | 23,198 |
| ||
Ratio of Expenses to Average Net Assets (2) |
| 1.14 | % | 1.22 | % | 1.25 | % | 1.24 | % | 1.25 | % | |||||||
Ratio of Expenses to Average Net Assets Excluding Bank Overdraft Expense |
| 1.14 | % | N/A |
| N/A |
| N/A |
| N/A |
| |||||||
Ratio of Net Investment Income (Loss) to Average Net Assets(2) |
| 1.60 | % | 1.76 | % | 2.83 | % | 3.24 | % | 3.96 | % | |||||||
Portfolio Turnover Rate |
| 33 | % | 21 | % | 17 | % | 47 | % | 33 | % | |||||||
(2) Supplemental Information on the Ratios to Average Net Assets: |
|
|
|
|
|
|
|
|
|
|
| |||||||
Ratios before expense limitation: |
|
|
|
|
|
|
|
|
|
|
| |||||||
Expenses to Average Net Assets |
| N/A |
| N/A |
| 1.26 | % | 1.24 | % | 1.26 | % | |||||||
Net Investment Income (Loss) to Average Net Assets |
| N/A |
| N/A |
| 2.82 | % | 3.24 | % | 3.95 | % | |||||||
† | Per share amount is based on average shares outstanding. |
| ||||||||||||||||
130 | The accompanying notes are an integral part of the financial statements. |
|
2005 Annual Report | |
| |
December 31, 2005 | |
Financial Highlights
Emerging Markets Debt Portfolio
|
| Class A |
| |||||||||||||
|
| Year Ended December 31, |
| |||||||||||||
Selected Per Share Data and Ratios |
| 2005 |
| 2004 |
| 2003 |
| 2002 |
| 2001 |
| |||||
Net Asset Value, Beginning of Period |
| $ | 3.64 |
| $ | 3.53 |
| $ | 2.95 |
| $ | 2.95 |
| $ | 2.88 |
|
Income (Loss) from Investment Operations |
|
|
|
|
|
|
|
|
|
|
| |||||
Net Investment Income |
| 0.27 | † | 0.26 | † | 0.25 | † | 0.27 | † | 0.21 |
| |||||
Net Realized and Unrealized Gain (Loss) on Investments |
| 0.19 |
| 0.10 |
| 0.59 |
| 0.06 |
| 0.09 |
| |||||
Total from Investment Operations |
| 0.46 |
| 0.36 |
| 0.84 |
| 0.33 |
| 0.30 |
| |||||
Distributions from and/or in Excess of: |
|
|
|
|
|
|
|
|
|
|
| |||||
Net Investment Income |
| (0.23 | ) | (0.25 | ) | (0.26 | ) | (0.33 | ) | (0.23 | ) | |||||
Redemption Fees |
| 0.00 | ‡ | 0.00 | ‡ | — |
| — |
| — |
| |||||
Net Asset Value, End of Period |
| $ | 3.87 |
| $ | 3.64 |
| $ | 3.53 |
| $ | 2.95 |
| $ | 2.95 |
|
Total Return |
| 12.78 | % | 10.07 | % | 28.46 | % | 11.29 | % | 10.57 | % | |||||
Ratios and Supplemental Data: |
|
|
|
|
|
|
|
|
|
|
| |||||
Net Assets, End of Period (Thousands) |
| $ | 92,294 |
| $ | 81,109 |
| $ | 54,647 |
| $ | 48,769 |
| $ | 52,561 |
|
Ratio of Expenses to Average Net Assets(1) |
| 1.01 | % | 1.04 | %^^ | 1.16 | % | 1.06 | % | 1.13 | % | |||||
Ratio of Expenses to Average Net Assets Excluding Bank Overdraft Expense |
| 1.00 | % | 1.04 | % | 1.13 | % | N/A |
| N/A |
| |||||
Ratio of Net Investment Income to Average Net Assets(1) |
| 7.02 | % | 7.33 | % | 7.48 | % | 8.79 | % | 8.22 | % | |||||
Portfolio Turnover Rate |
| 84 | % | 151 | % | 216 | % | 157 | % | 316 | % | |||||
(1) Supplemental Information on the Ratios to Average Net Assets: |
|
|
|
|
|
|
|
|
|
|
| |||||
Ratios before expense limitation: |
|
|
|
|
|
|
|
|
|
|
| |||||
Expenses to Average Net Assets |
| N/A |
| 1.07 | % | N/A |
| N/A |
| N/A |
| |||||
Net Investment Income (Loss) to Average Net Assets |
| N/A |
| 7.30 | % | N/A |
| N/A |
| N/A |
| |||||
|
| Class B |
| |||||||||||||||
|
| Year Ended December 31, |
| |||||||||||||||
Selected Per Share Data and Ratios |
| 2005 |
| 2004 |
| 2003 |
| 2002 |
| 2001 |
| |||||||
Net Asset Value, Beginning of Period |
| $ | 3.72 |
| $ | 3.60 |
| $ | 3.00 |
| $ | 3.01 |
| $ | 2.92 |
| ||
Income (Loss) from Investment Operations |
|
|
|
|
|
|
|
|
|
|
| |||||||
Net Investment Income |
| 0.26 | † | 0.26 | † | 0.25 | † | 0.26 | † | 0.30 |
| |||||||
Net Realized and Unrealized Gain (Loss) on Investments |
| 0.21 |
| 0.10 |
| 0.60 |
| 0.05 |
| 0.02 |
| |||||||
Total from Investment Operations |
| 0.47 |
| 0.36 |
| 0.85 |
| 0.31 |
| 0.32 |
| |||||||
Distributions from and/or in Excess of: |
|
|
|
|
|
|
|
|
|
|
| |||||||
Net Investment Income |
| (0.23 | ) | (0.24 | ) | (0.25 | ) | (0.32 | ) | (0.23 | ) | |||||||
Net Asset Value, End of Period |
| $ | 3.96 |
| $ | 3.72 |
| $ | 3.60 |
| $ | 3.00 |
| $ | 3.01 |
| ||
Total Return |
| 12.54 | % | 9.90 | % | 28.34 | % | 10.34 | % | 10.50 | % | |||||||
Ratios and Supplemental Data: |
|
|
|
|
|
|
|
|
|
|
| |||||||
Net Assets, End of Period (Thousands) |
| $ | 596 |
| $ | 437 |
| $ | 429 |
| $ | 343 |
| $ | 429 |
| ||
Ratio of Expenses to Average Net Assets(2) |
| 1.26 | % | 1.29 | %^^ | 1.41 | % | 1.31 | % | 1.38 | % | |||||||
Ratio of Expenses to Average Net Assets Excluding Bank Overdraft Expense |
| 1.25 | % | 1.29 | % | 1.38 | % | N/A |
| N/A |
| |||||||
Ratio of Net Investment Income to Average Net Assets(2) |
| 6.70 | % | 7.07 | % | 7.23 | % | 8.54 | % | 7.97 | % | |||||||
Portfolio Turnover Rate |
| 84 | % | 151 | % | 216 | % | 157 | % | 316 | % | |||||||
(2) Supplemental Information on the Ratios to Average Net Assets: |
|
|
|
|
|
|
|
|
|
|
| |||||||
Ratios before expense limitation: |
|
|
|
|
|
|
|
|
|
|
| |||||||
Expenses to Average Net Assets |
| N/A |
| 1.32 | % | N/A |
| N/A |
| N/A |
| |||||||
Net Investment Income (Loss) to Average Net Assets |
| N/A |
| 7.04 | % | N/A |
| N/A |
| N/A |
| |||||||
† |
| Per share amount is based on average shares outstanding. | ||||||||||||||||
‡ |
| Amount is less than $0.005 per share. | ||||||||||||||||
^^ |
| Effective May 1, 2004, the Adviser has agreed to limit the ratio of expenses to average net assets to the maximum ratio of 1.00% for Class A shares and 1.25% for Class B shares. Prior to May 1, 2004, these maximum ratios were 1.75% for Class A shares and 2.00% for Class B shares. | ||||||||||||||||
| The accompanying notes are an integral part of the financial statements. | 131 |
| 2005 Annual Report |
|
|
| December 31, 2005 |
Financial Highlights
Money Market Portfolio
|
| Class A |
| |||||||||||||
|
| Year Ended December 31, |
| |||||||||||||
Selected Per Share Data and Ratios |
| 2005 |
| 2004 |
| 2003 |
| 2002 |
| 2001 |
| |||||
Net Asset Value, Beginning of Period |
| $ | 1.000 |
| $ | 1.000 |
| $ | 1.000 |
| $ | 1.000 |
| $ | 1.000 |
|
Income (Loss) from Investment Operations |
|
|
|
|
|
|
|
|
|
|
| |||||
Net Investment Income |
| 0.029 |
| 0.009 |
| 0.007 | † | 0.013 |
| 0.038 |
| |||||
Distributions from and/or in Excess of: |
|
|
|
|
|
|
|
|
|
|
| |||||
Net Investment Income |
| (0.029 | ) | (0.009 | ) | (0.007 | ) | (0.013 | ) | (0.038 | ) | |||||
Net Asset Value, End of Period |
| $ | 1.000 |
| $ | 1.000 |
| $ | 1.000 |
| $ | 1.000 |
| $ | 1.000 |
|
Total Return |
| 2.89 | % | 0.93 | % | 0.64 | % | 1.30 | % | 3.82 | % | |||||
Ratios and Supplemental Data: |
|
|
|
|
|
|
|
|
|
|
| |||||
Net Assets, End of Period (Thousands) |
| $ | 416,220 |
| $ | 546,866 |
| $ | 795,399 |
| $ | 1,369,935 |
| $ | 2,706,283 |
|
Ratio of Expenses to Average Net Assets |
| 0.41 | % | 0.47 | % | 0.51 | % | 0.48 | % | 0.48 | % | |||||
Ratio of Expenses to Average Net Assets Excluding Bank Overdraft Expense |
| 0.41 | % | N/A |
| N/A |
| N/A |
| N/A |
| |||||
Ratio of Net Investment Income to Average Net Assets |
| 2.81 | % | 0.87 | % | 0.69 | % | 1.32 | % | 3.90 | % | |||||
Municipal Money Market Portfolio
|
| Class A |
| ||||||||||||||||
|
| Year Ended December 31, |
| ||||||||||||||||
Selected Per Share Data and Ratios |
| 2005 |
| 2004 |
| 2003 |
| 2002 |
| 2001 |
| ||||||||
Net Asset Value, Beginning of Period |
| $ | 1.000 |
| $ | 1.000 |
| $ | 1.000 |
| $ | 1.000 |
| $ | 1.000 |
| |||
Income (Loss) from Investment Operations |
|
|
|
|
|
|
|
|
|
|
| ||||||||
Net Investment Income |
| 0.020 |
| 0.008 |
| 0.005† |
| 0.009 |
| 0.022 |
| ||||||||
Distributions from and/or in Excess of: |
|
|
|
|
|
|
|
|
|
|
| ||||||||
Net Investment Income |
| (0.020 | ) | (0.008 | ) | (0.005 | ) | (0.009 | ) | (0.022 | ) | ||||||||
Net Asset Value, End of Period |
| $ | 1.000 |
| $ | 1.000 |
| $ | 1.000 |
| $ | 1.000 |
| $ | 1.000 |
| |||
Total Return |
| 2.07 | % | 0.75 | % | 0.50 | % | 0.90 | % | 2.23 | % | ||||||||
Ratios and Supplemental Data: |
|
|
|
|
|
|
|
|
|
|
| ||||||||
Net Assets, End of Period (Thousands) |
| $ | 317,143 |
| $ | 449,318 |
| $ | 511,551 |
| $ | 910,426 |
| $ | 1,346,818 |
| |||
Ratio of Expenses to Average Net Assets |
| 0.40 | % | 0.48 | % | 0.50 | % | 0.48 | % | 0.49 | % | ||||||||
Ratio of Expenses to Average Net Assets Excluding Bank Overdraft Expense |
| 0.40 | % | N/A |
| N/A |
| N/A |
| N/A |
| ||||||||
Ratio of Net Investment Income to Average Net Assets |
| 2.00 | % | 0.74 | % | 0.54 | % | 0.90 | % | 2.25 | % | ||||||||
† |
| Per share amount is based on average shares outstanding. |
| ||||||||||||||||
132 | The accompanying notes are an integral part of the financial statements. |
|
2005 Annual Report | |
| |
December 31, 2005 | |
Notes to Financial Statements
Morgan Stanley Institutional Fund, Inc. (the “Fund”) is registered under the Investment Company Act of 1940 (the “1940 Act”), as amended, as an open-end management investment company. The Fund is comprised of seventeen separate, active, diversified and non-diversified portfolios (individually referred to as a “Portfolio”, collectively as the “Portfolios”). Each Portfolio (with the exception of the International Small Cap, Money Market and Municipal Money Market Portfolios) offers two classes of shares - Class A and Class B. Both classes of shares have identical voting rights (except that shareholders of a Class have exclusive voting rights regarding any matter relating solely to that Class of shares), dividend, liquidation and other rights. Effective August 25, 2005, the European Real Estate Portfolio changed its name to theInternational Real Estate Portfolio. Effective November 1, 2005, the Equity Growth Portfolio and the Value Equity Portfolio changed their names to the U.S. Large Cap Growth Portfolio and the Large Cap Relative Value Portfolio, respectively. Effective December 27, 2005, the International Growth Equity Portfolio commenced operations.
For detailed descriptions of the investment objectives of each of the Portfolios and other related information, please refer to the Prospectuses of the Fund. Generally, the investment objective of the domestic and international equity portfolios is to seek capital appreciation by investing in equity and equity related securities. The investment objective of the international fixed income portfolio is primarily to seek a high total return consistent with preservation of capital. Generally, the investment objective of the money market portfolios is to seek current income and preserve capital.
The Global Franchise Portfolio will suspend offering of shares to new investors when assets in the Portfolio reach $100 million. The International Equity Portfolio and International Small Cap Portfolio are currently closed to new investors. However, these three Portfolios will continue to offer shares as follows: (1) through certain retirement plan accounts, (2) to clients of registered investment advisors who currently offer shares of the Portfolios in their discretionary asset allocation programs, (3) through certain endowments and foundations, (4) to clients of family office practices where shares of the Portfolios are held by family members of such clients, (5) to directors and trustees of the Morgan Stanley Funds, (6) to Morgan Stanley and its affiliates and their employees, and (7) to benefit plans sponsored by Morgan Stanley and its affiliates. The Portfolios will continue to offer shares of the Portfolios to existing shareholders and may recommence offering shares of the Portfolios to other new investors in the future.
A. Accounting Policies: The following significant accounting policies are in conformity with U.S. generally accepted accounting principles. Such policies are consistently followed by the Fund in the preparation of the financial statements. U.S. generally accepted accounting principles may require management to make estimates and assumptions that affect the reported amounts and disclosures in the financial statements. Actual results may differ from those estimates.
1. Security Valuation: Securities listed on a foreign exchange are valued at their closing price. Unlisted securities and listed securities not traded on the valuation date for which market quotations are readily available are valued at the mean between the current bid and asked prices obtained from reputable brokers. Equity securities listed on a U.S. exchange are valued at the latest quoted sales price on the valuation date. Equity securities listed or traded on NASDAQ, for which market quotations are available, are valued at the NASDAQ Official Closing Price. Bonds and other fixed income securities may be valued according to the broadest and most representative market. In addition, bonds and other fixed income securities may be valued on the basis of prices provided by a pricing service. The prices provided by a pricing service take into account broker dealer market price quotations for institutional size trading in similar groups of securities, security quality, maturity, coupon and other security characteristics as well as any developments related to the specific securities. Debt securities purchased with remaining maturities of 60 days or less are valued at amortized cost, if it approximates value. Securities owned by the Money Market and Municipal Money Market Portfolios are stated at amortized cost, which approximates market value.
All other securities and investments for which market values are not readily available, including restricted securities, and those securities for which it is inappropriate to determine prices in accordance with the aforementioned procedures, are valued at fair value as determined in good faith under procedures adopted by the Board of Directors, although the actual calculations may be done by others. Factors considered in making this determination may include, but are not limited to, information obtained by contacting the issuer, analysts, or the appropriate stock exchange (for exchange-traded securities), analysis of the issuer’s financial statements or other available documents and, if necessary, available information concerning other securities in similar circumstances.
Most foreign markets close before the New York Stock Exchange (NYSE). Occasionally, developments that could affect the closing prices of securities and other assets may occur between the times at which valuations of such securities are determined (that is, close of the foreign market on which the securities trade) and the close of
133
| 2005 Annual Report |
|
|
| December 31, 2005 |
Notes to Financial Statements (cont’d)
business on the NYSE. If these developments are expected to materially affect the value of the securities, the valuations may be adjusted to reflect the estimated fair value as of the close of the NYSE, as determined in good faith under procedures established by the Board of Directors.
2. Repurchase Agreements: The Portfolios may enter into repurchase agreements under which a Portfolio lends excess cash and takes possession of securities with an agreement that the counterparty will repurchase such securities. In connection with transactions in repurchase agreements, a bank as custodian for the Fund takes possession of the underlying securities which are held as collateral, with a market value at least equal to the amount of the repurchase transaction, including principal and accrued interest. To the extent that any repurchase transaction exceeds one business day, the value of the collateral is marked-to-market on a daily basis to determine the adequacy of the collateral. In the event of default on the obligation to repurchase, the Fund has the right to liquidate the collateral and apply the proceeds in satisfaction of the obligation. In the event of default or bankruptcy by the counterparty to the agreement, realization and/or retention of the collateral or proceeds may be subject to legal proceedings. The Portfolios, along with other affiliated investment companies, may utilize a joint trading account for the purpose of entering into repurchase agreements.
3. Foreign Currency Translation and Foreign Investments: The books and records of the Fund are maintained in U.S. dollars. Foreign currency amounts are translated into U.S. dollars at the mean of the bid and asked prices of such currencies against U.S. dollars last quoted by a major bank, prior to the close of the NYSE, as follows:
• investments, other assets and liabilities-at the prevailing rates of exchange on the valuation date;
• investment transactions, investment income and expenses-at the prevailing rates of exchange on the dates of such transactions.
Although the net assets of the Fund are presented at the foreign exchange rates and market values at the close of the period, the Fund does not isolate that portion of the results of operations arising as a result of changes in the foreign exchange rates from the fluctuations arising from changes in the market prices of the securities held at period end. Similarly, the Fund does not isolate the effect of changes in foreign exchange rates from the fluctuations arising from changes in the market prices of securities sold during the period. Accordingly, realized and unrealized foreign currency gains (losses) on investments in securities are included in the reported net realized and unrealized gains (losses) on investment transactions and balances. However, pursuant to U.S. Federal income tax regulations, gains and losses from certain foreign currency transactions and the foreign currency portion of gains and losses realized on sales and maturities of foreign denominated debt securities are treated as ordinary income for U.S. Federal income tax purposes.
Net realized gains (losses) on foreign currency transactions represent net foreign exchange gains (losses) from foreign currency exchange contracts, disposition of foreign currencies, currency gains or losses realized between the trade and settlement dates on securities transactions, and the difference between the amount of investment income and foreign taxes recorded on the Fund’s books and the U.S. dollar equivalent amounts actually received or paid. Net unrealized currency gains (losses) from valuing foreign currency denominated assets and liabilities at period end exchange rates are reflected as a component of unrealized appreciation (depreciation) on the Statements of Assets and Liabilities. The change in net unrealized currency gains (losses) for the period is reflected on the Statements of Operations.
Foreign security and currency transactions may involve certain considerations and risks not typically associated with those of U.S. dollar denominated transactions as a result of, among other factors, fluctuations of exchange rates in relation to the U.S. dollar, the possibility of lower levels of government supervision and regulation of foreign securities markets and the possibility of political or economic instability.
Prior governmental approval for foreign investments may be required under certain circumstances in some countries, and the extent of foreign investments in domestic companies may be subject to limitation in other countries. Foreign ownership limitations also may be imposed by the charters of individual companies to prevent, among other concerns, violations of foreign investment limitations. As a result, an additional class of shares (identified as “Foreign” in the Portfolio of Investments) may be created and offered for investment. The “local” and “foreign shares” market values may differ. In the absence of trading of the foreign shares in such markets, the Fund values the foreign shares at the closing exchange price of the local shares. Such securities, if any, are identified as fair valued on the Portfolio of Investments.
4. Foreign Currency Exchange Contracts: Certain Portfolios may enter into foreign currency exchange contracts generally to attempt to protect securities and related
134
2005 Annual Report | |
| |
December 31, 2005 | |
Notes to Financial Statements (cont’d)
receivables and payables against changes in future foreign currency exchange rates and, in certain situations, to gain exposure to foreign currencies. A foreign currency exchange contract is an agreement between two parties to buy or sell currency at a set price on a future date. The market value of the contract will fluctuate with changes in currency exchange rates. The contract is marked-to-market daily and the change in market value is recorded by the Portfolios as unrealized gain or loss. The Portfolios record realized gains or losses when the contract is closed equal to the difference between the value of the contract at the time it was opened and the value at the time it was closed. Credit risk may arise upon entering into these contracts from the potential inability of counterparts to meet the terms of their contracts and is generally limited to the amount of the unrealized gains on the contracts, if any, at the date of default. Risks may also arise from unanticipated movements in the value of a foreign currency relative to the U.S. dollar.
5. Loan Agreements: Certain Portfolios may invest in fixed and floating rate loans (“Loans”) arranged through private negotiations between an issuer of sovereign debt obligations and one or more financial institutions (“Lenders”) deemed to be creditworthy by the investment adviser. A Portfolio’s investments in Loans may be in the form of participation in Loans (“Participation”) or assignments of all or a portion of Loans (“Assignments”) from third parties. A Portfolio’s investment in a Participation typically results in the Portfolio having a contractual relationship with only the Lender and not with the borrower. The Portfolios have the right to receive payments of principal, interest and any fees to which it is entitled only upon receipt by the Lender of the payments from the borrower. The Portfolios generally have no right to enforce compliance by the borrower under the terms of the loan agreement. As a result, the Portfolio may be subject to the credit risk of both the borrower and the Lender that is selling the Participation and any intermediaries between the Lender and the Portfolio. When a Portfolio purchases Assignments from Lenders, it typically acquires direct rights against the borrower on the Loan. Because Assignments are arranged through private negotiations between potential assignees and potential assignors, the rights and obligations acquired by the Portfolio as the purchaser of an Assignment may differ from, and be more limited than, those held by the assigning Lender.
6. Short Sales: Certain Portfolios may sell securities short.A short sale is a transaction in which a Portfolio sells securities it may or may not own, but has borrowed, in anticipation of a decline in the market price of the securities. The Portfolio is obligated to replace the borrowed securities at the market price at the time of replacement. The Portfolio may have to pay a premium to borrow the securities as well as pay any dividends or interest payable on the securities until they are replaced. Dividends and interest payable on such securities sold short are included in dividend expense and interest expense, respectively, in the Statements of Operations. A Portfolio’s obligation to replace the securities borrowed in connection with a short sale will generally be secured by collateral deposited with the broker that consists of cash, U.S. government securities or other liquid, high grade debt obligations. In addition, the Portfolio will either designate on the Portfolio’s records or place in a segregated account with its Custodian an amount of cash, U.S. government securities or other liquid high grade debt obligations equal to the difference, if any, between (1) the market value of the securities sold at the time they were sold short and (2) cash, U.S. government securities or other liquid high grade debt obligations deposited as collateral with the broker in connection with the short sale. Short sales by the Portfolios involve certain risks and special considerations. Possible losses from short sales differ from losses that could be incurred from the purchase of a security, because losses from short sales may be unlimited, whereas losses from purchases cannot exceed the total amount invested.
7. Securities Lending: Certain Portfolios may lend securities to qualified financial institutions, such as broker-dealers, to earn additional income. Any increase ordecrease in the fair value of the securities loaned that might occur and any interest earned or dividends declared on those securities during the term of the loan would remain in the Portfolio. Portfolios that lend securities receive cash or securities as collateral in an amount equal to or exceeding 100% of the current fair value of the loaned securities. The collateral is marked to market daily, by the securities lending agent, to ensure that a minimum of 100% collateral coverage is maintained.
Based on pre-established guidelines, the securities lending agent invests any cash collateral that is received in high-qualityshort-term investments. Securities lending income is generated from the earnings on the invested collateral and borrowing fees, less any rebates owed to the borrowers and compensation to the lending agent, and is included in the Portfolios’ Statements of Operations in interest income. Risks in securities lending transactions are that a borrower may not provide additional collateral when required or return the securities when due, and that the value of the short-term investments will be less than the
135
| 2005 Annual Report |
|
|
| December 31, 2005 |
Notes to Financial Statements (cont’d)
amount of cash collateral plus any rebate that is required to be returned to the borrower.
The value of loaned securities and related collateral outstanding at December 31, 2005 are as follows:
|
| Value of |
|
|
|
|
| Loaned |
| Value of |
|
|
| Securities |
| Collateral |
|
Portfolio |
| (000) |
| (000) |
|
Active International Allocation |
| $ 61,520 |
| $ 65,097 |
|
Emerging Markets |
| 94,556 |
| 98,534 |
|
Global Value Equity |
| 4,875 |
| 5,083 |
|
International Equity |
| 509,480 |
| 540,416 |
|
International Magnum |
| 7,006 |
| 7,396 |
|
The following Portfolios had income from securities lending (after rebates to borrowers and fee paid to securities lending agent):
|
| Net Interest |
| |
|
| Earned by |
| |
|
| Portfolio |
| |
Portfolio |
| (000) |
| |
Active International Allocation |
| $ | 417 |
|
Emerging Markets |
| 541 |
| |
Global Value Equity |
| 26 |
| |
International Equity |
| 8,199 |
| |
International Magnum |
| 63 |
| |
8. Structured Securities: The Emerging Markets Debt Portfolio may invest in interests in entities organized and operated solely for the purpose of restructuring the investment characteristics of sovereign debt obligations. This type of restructuring involves the deposit with or purchase by an entity of specified instruments and the issuance by that entity of one or more classes of securities (“Structured Securities”) backed by, or representing interests in, the underlying instruments. Structured Securities generally will expose the Portfolio to credit risks of the underlying instruments as well as of the issuer of the structured security. Structured securities are typically sold in private placement transactions with no active trading market. Investments in Structured Securities may be more volatile than their underlying instruments; however, any loss is limited to the amount of the original investment.
9. Futures: Certain Portfolios may purchase and sell futures contracts. Futures contracts provide for the sale by one party and purchase by another party of a specified amount of a specified security, index, instrument or basket of instruments. Futures contracts (secured by cash, government securities or other high grade liquid investments deposited with brokers or custodians as “initial margin”) are valued based upon their quoted daily settlement prices; changes in initial settlement value (represented by cash paid to or received from brokers as “variation margin”) are accounted for as unrealized appreciation (depreciation).
When futures contracts are closed, the difference between the opening value at the date the contract was entered into and the value at closing is recorded as a realized gain or loss in the Statements of Operations. Due from (to) broker includes both initial margin and variation margin, as stated in the Statements of Assets and Liabilities.
Certain Portfolios may use futures contracts in order to manage their exposure to the stock and bond markets, to hedge against unfavorable changes in the value of securities or to remain fully invested and to reduce transaction costs. Futures contracts involve market risk in excess of the amounts recognized in the Statements of Assets and Liabilities. Risks arise from the possible movements in security values underlying these instruments. The change in value of futures contracts primarily corresponds with the value of their underlying instruments, which may not correlate with the change in value of hedged investments.
10. Purchased and Written Options: Certain Portfolios may write covered call and put options on portfolio securities and other financial instruments. Premiums are received and are recorded as liabilities. The liabilities are subsequently adjusted to reflect the current value of the options written. Premiums received from writing options which expire are treated as realized gains. Premiums received from writing options which are exercised or are closed are added to or offset against the proceeds or amount paid on the transaction to determine the net realized gain or loss. By writing a covered call option, a Portfolio, in exchange for the premium, foregoes the opportunity for capital appreciation above the exercise price should the market price of the underlying security increase. By writing a put option, a Portfolio, in exchange for the premium, accepts the risk of having to purchase a security at an exercise price that is above the current market price.
Certain Portfolios may purchase call and put options on their portfolio securities or other financial instruments. Each Portfolio may purchase call options to protect against an increase in the price of the security or financial instrument it anticipates purchasing. Each Portfolio may purchase put options on securities which it holds or other financial instruments to protect against a decline in the value of the security or financial instrument or to close out covered written put positions. Risks may arise from an imperfect correlation between the change in market value of the securities held by the Portfolio and the prices of options relating to the securities purchased or sold by the Portfolio and from the possible lack of a liquid secondary market for an option. The maximum exposure to
136
2005 Annual Report | |
| |
December 31, 2005 | |
Notes to Financial Statements (cont’d)
loss for any purchased option is limited to the premium initially paid for the option.
11. Unfunded Commitments: Subject to the terms of a Subscription Agreement between the U.S. Real Estate Portfolio and BRCP REIT LLC I, the Portfolio has made a subscription commitment of $7,000,000 for which it will receive 7,000,000 shares of common stock. As of December 31, 2005, BRCP REIT LLC I has drawn down $4,616,681 which represents 66.0% of the commitment.
Subject to the terms of a Subscription Agreement between the U.S. Real Estate Portfolio and Keystone Industrial Fund, L.P., the Portfolio has made a subscription commitment of $7,500,000 for which it will receive 7,500,000 shares of common stock. As of December 31, 2005, Keystone Industrial Fund, L.P. has drawn down $25,068, which represents 0.3% of the commitment.
Subject to the terms of a Subscription Agreement between the U.S. Real Estate Portfolio and Cabot 2 Industrial Value Fund, L.P., the Portfolio has made a subscription commitment of $7,500,000 for which it will receive 15,000 shares of common stock. As of December 31, 2005, Cabot 2 Industrial Value Fund, L.P. has drawn down $500,000, which represents 6.67% of the commitment.
12. Redemption Fees: The following redemption fees are designed to protect each Portfolio and its shareholders from the effects of short-term trading. Through August 28, 2005, shares of the Active International Allocation, Emerging Markets, Global Franchise, Global Value Equity, International Equity, International Magnum, International Real Estate, International Small Cap and Emerging Markets Debt Portfolios redeemed within 60 days of purchase may be subject to a 2% redemption fee.
Effective August 29, 2005 (December 27, 2005 for the International Growth Equity Portfolio), the Board of Directors of the Fund approved the following: Shares of the Active International Allocation, Emerging Markets, Global Franchise, Global Value Equity, International Equity, International Growth Equity, International Magnum, International Real Estate, International Small Cap, Small Company Growth, U.S. Real Estate and Emerging Markets Debt Portfolios redeemed within 30 days of purchase may be subject to a 2% redemption fee. Shares of Focus Equity, Large Cap Relative Value and U.S. Large Cap Growth Portfolios redeemed within 7 days of purchase may be subject to a 2% redemption fee. These fees, if any, are included on the Statements of Changes in Net Assets.
13. Restricted Securities: Certain Portfolios may invest in unregistered or otherwise restricted securities. The term restricted securities refers to securities that are unregistered or are held by control persons of the issuer and securities that are subject to contractual restrictions on their resale. As a result, restricted securities may be more difficult to value and the Portfolio may have difficulty disposing of such assets either in a timely manner or for a reasonable price. In order to dispose of an unregistered security, the Portfolio, where it has contractual rights to do so, may have to cause such security to be registered. A considerable period may elapse between the time the decision is made to sell the security and the time the security is registered so that the Fund could sell it. Contractual restrictions on the resale of securities vary in length and scope and are generally the result of a negotiation between the issuer and acquiror of the securities. The Portfolio would, in either case, bear market risks during that period.
14. Other: Security transactions are accounted for on the date the securities are purchased or sold. Realized gains and losses on the sale of investment securities are determined on the specific identified cost basis. Dividend income and distributions are recorded on the ex-dividend date (except for certain foreign dividends which may be recorded as soon as the Fund is informed of such dividends) net of applicable withholding taxes. Interest income is recognized on the accrual basis except where collection is in doubt. Discounts and premiums on securities purchased are amortized according to the effective yield method over their respective lives. Most expenses of the Fund can be directly attributed to a particular Portfolio. Expenses which cannot be directly attributed are apportioned among the Portfolios based upon relative net assets. Income, expenses (other than class specific expenses) and realized and unrealized gains or losses are allocated to each class of shares based upon their relative net assets. Dividends to the shareholders of the Money Market and the Municipal Money Market Portfolios are accrued daily and are distributed on or about the 15th of each month.
The U.S. Real Estate Portfolio owns shares of real estate investment trusts (“REITs”) which report information on the source of their distributions annually. A portion of distributions received from REITs during the year is estimated to be a return of capital and is recorded as a reduction of their cost.
B. Investment Advisory Fees: Morgan Stanley Investment Management Inc. (the “Adviser” or “MS Investment Management”), a wholly-owned subsidiary of Morgan Stanley, provides the Fund with investment advisory services under the
137
| 2005 Annual Report |
|
|
| December 31, 2005 |
Notes to Financial Statements (cont’d)
terms of an Investment Advisory Agreement (the “Agreement”) at the annual rates of the average daily net assets indicated below. MS Investment Management has voluntarily agreed to waive fees payable to it and to reimburse the Portfolios for certain expenses, after giving effect to custody fee offsets, if necessary, if the total annual operating expenses, excluding bank overdraft, certain foreign taxes and extraordinary expenses as defined, expressed as a percentage of average daily net assets, exceed the maximum ratios indicated as follows:
|
|
|
|
|
| Maximum |
| |||||
|
|
|
|
|
| Expense Ratio |
| |||||
|
| Average Daily |
| Advisory |
|
|
|
|
| |||
Portfolio |
| Net Assets |
| Fee |
| Class A |
| Class B |
| |||
Active International |
|
|
|
|
|
|
|
|
| |||
Allocation |
| first $1.0 billion |
| 0.65 | % |
| 0.80 | % |
| 1.05 | % |
|
|
| over $1.0 billion |
| 0.60 |
|
|
|
|
|
|
|
|
Emerging Markets |
| first $500 million |
| 1.25 |
|
| 1.65 |
|
| 1.90 |
|
|
|
| next $500 million |
| 1.20 |
|
|
|
|
|
|
|
|
|
| next $1.5 billion |
| 1.15 |
|
|
|
|
|
|
|
|
|
| over $2.5 billion |
| 1.00 |
|
|
|
|
|
|
|
|
Global Franchise |
| first $500 million |
| 0.80 |
|
| 1.00 |
|
| 1.25 |
|
|
|
| next $500 million |
| 0.75 |
|
|
|
|
|
|
|
|
|
| over $1.0 billion |
| 0.70 |
|
|
|
|
|
|
|
|
Global Value Equity |
| first $1.0 billion |
| 0.67 |
|
| 1.00 |
|
| 1.25 |
|
|
|
| next $500 million |
| 0.645 |
|
|
|
|
|
|
|
|
|
| next $1.0 billion |
| 0.62 |
|
|
|
|
|
|
|
|
|
| next $1.0 billion |
| 0.595 |
|
|
|
|
|
|
|
|
|
| next $1.0 billion |
| 0.57 |
|
|
|
|
|
|
|
|
|
| over $4.5 billion |
| 0.545 |
|
|
|
|
|
|
|
|
International Equity |
| first $10 billion |
| 0.80 |
|
| 1.00 |
|
| 1.25 |
|
|
|
| over $10 billion |
| 0.75 |
|
|
|
|
|
|
|
|
International Growth |
| first $1.0 billion |
| 0.75 |
|
| 1.00 |
|
| 1.25 |
|
|
Equity |
| over $1.0 billion |
| 0.70 |
|
|
|
|
|
|
|
|
International Magnum |
| first $500 million |
| 0.80 |
|
| 1.00 |
|
| 1.25 |
|
|
|
| next $500 million |
| 0.75 |
|
|
|
|
|
|
|
|
|
| over $1.0 billion |
| 0.70 |
|
|
|
|
|
|
|
|
International Real Estate |
|
|
| 0.80 |
|
| 1.00 |
|
| 1.25 |
|
|
International Small Cap |
| first $1.5 billion |
| 0.95 |
|
| 1.15 |
|
| N/A |
|
|
|
| over $1.5 billion |
| 0.90 |
|
|
|
|
|
|
|
|
Focus Equity |
| first $1.0 billion |
| 0.50 |
|
| 1.00 |
|
| 1.25 |
|
|
|
| next $1.0 billion |
| 0.45 |
|
|
|
|
|
|
|
|
|
| next $1.0 billion |
| 0.40 |
|
|
|
|
|
|
|
|
|
| over $3.0 billion |
| 0.35 |
|
|
|
|
|
|
|
|
Large Cap Relative |
| first $150 million |
| 0.50 |
|
| 0.70 |
|
| 0.95 |
|
|
Value |
| next $100 million |
| 0.45 |
|
|
|
|
|
|
|
|
|
| next $100 million |
| 0.40 |
|
|
|
|
|
|
|
|
|
| over $350 million |
| 0.35 |
|
|
|
|
|
|
|
|
Small Company Growth |
| first $1.0 billion |
| 0.92 |
|
| 1.10 |
|
| 1.35 |
|
|
|
| next $500 million |
| 0.85 |
|
|
|
|
|
|
|
|
|
| over $1.5 billion |
| 0.80 |
|
|
|
|
|
|
|
|
U.S. Large Cap Growth |
| first $1.0 billion |
| 0.50 |
|
| 0.80 |
|
| 1.05 |
|
|
|
| next $1.0 billion |
| 0.45 |
|
|
|
|
|
|
|
|
|
| next $1.0 billion |
| 0.40 |
|
|
|
|
|
|
|
|
|
| over $3.0 billion |
| 0.35 |
|
|
|
|
|
|
|
|
U.S. Real Estate |
| first $500 million |
| 0.80 |
|
| 1.00 |
|
| 1.25 |
|
|
|
| next $500 million |
| 0.75 |
|
|
|
|
|
|
|
|
|
| over $1.0 billion |
| 0.70 |
|
|
|
|
|
|
|
|
Emerging Markets Debt |
| first $500 million |
| 0.75 |
|
| 1.00 |
|
| 1.25 |
|
|
|
| next $500 million |
| 0.70 |
|
|
|
|
|
|
|
|
|
| over $1.0 billion |
| 0.65 |
|
|
|
|
|
|
|
|
Money Market |
|
|
| 0.30 |
|
| 0.55 |
|
| N/A |
|
|
Municipal Money Market |
|
|
| 0.30 |
|
| 0.57 |
|
| N/A |
|
|
The table above reflects the current investment advisory fees and maximum expense ratios for the Portfolios effective June 1, 2005. Prior to June 1, 2005, the investment advisory fees for some Portfolios were as follows:
|
| Average Daily Net |
| Advisory |
| |
Portfolio |
| Assets |
| Fee |
| |
Active International Allocation |
|
|
| 0.65 | % |
|
International Equity |
|
|
| 0.80 |
|
|
International Small Cap |
|
|
| 0.95 |
|
|
Focus Equity |
|
|
| 0.80 |
|
|
Small Company Growth |
| first $1.0 billion |
| 0.92 |
|
|
|
| over $1.0 billion |
| 0.85 |
|
|
Fee waivers and/or expense reimbursements are voluntary and may be commenced or terminated at any time. For the year ended December 31, 2005, the Portfolios had advisory fees waived and/or certain expenses reimbursed as follows:
|
| Advisory Fees |
| |
|
| Waived |
| |
Portfolio |
| (000) |
| |
Active International Allocation |
| $ | 192 |
|
Global Franchise |
| 54 |
| |
International Growth Equity |
| 17 |
| |
International Magnum |
| 122 |
| |
International Real Estate |
| 148 |
| |
The Adviser has entered into Sub-Advisory Agreements with Morgan Stanley Investment Advisors Inc., Morgan Stanley Investment Management Limited, Morgan Stanley Asset & Investment Trust Management Co., Limited and Morgan Stanley Investment Management Company (each a “Sub- Adviser”), all wholly-owned subsidiaries of Morgan Stanley. The Sub-Advisers, subject to the control and supervision of the Fund, its officers, Directors and the Adviser, and in accordance with the investment objectives, policies and restrictions of the Portfolios, make certain day-to-day investment decisions for certain Portfolios and place certain of the Portfolios’ purchase and sales orders. The Adviser pays the Sub-Advisers on a monthly basis a portion of the net advisory fees the Adviser receives from the Portfolios which receive these services.
C. Administration Fees: MS Investment Management (the “Administrator”) also provides the Fund with administrative services pursuant to an administration agreement for a monthly fee, which on an annual basis equals 0.08% of the average daily net assets of each non-money market Portfolio and 0.05% of the average daily net assets of each money market Portfolio. Under an agreement between the Administrator and J.P. Morgan Investor Services Co. (“JPMIS”), a corporate affiliate of JPMorgan Chase Bank, N.A., JPMIS provides certain administrative services to the Fund. For such services, the Administrator pays JPMIS a portion of the fee the
138
2005 Annual Report | |
| |
December 31, 2005 | |
Notes to Financial Statements (cont’d)
Administrator receives from the Fund. An employee of JPMIS is an officer of the Fund. Administration costs (including out-ofpocket expenses) incurred in the ordinary course of providing services under the administration agreement, except pricing services and extraordinary expenses, are covered under the administration fee. Transfer Agency expenses will be borne by the Fund. In addition, the Fund incurs local administration fees in connection with doing business in certain emerging market countries.
D. Distribution Fees: Morgan Stanley Distribution, Inc. (“MSDI” or the “Distributor”), a wholly-owned subsidiary of the Adviser, serves as the Distributor of the Fund and provides Class B shareholders of the applicable Portfolios with distribution services pursuant to a Distribution Plan (the “Plan”) in accordance with Rule 12b-1 under the 1940 Act. The distribution fee is an asset-based fee to compensate the Distributor for distribution efforts and/or servicing of accounts. Under the Plan, each Portfolio is authorized to pay the Distributor a distribution fee, which is accrued daily and paid monthly, at an annual rate of 0.25% of the Class B shares’ average daily net assets. Prior to May 1, 2005, the distribution fee was paid on a quarterly basis. The Distributor may voluntarily waive from time to time all or any portion of its distribution fee. Prior to April 29, 2005, Morgan Stanley & Co., Incorporated, a wholly-owned subsidiary of Morgan Stanley and an affiliate of MS Investment Management served as the distributor under the same terms as discussed above.
E. Custodian Fees: JPMorgan Chase Bank, N.A. (the “Custodian”) serves as Custodian for the Fund in accordance with a custodian agreement. The Custodian holds cash, securities, and other assets of the Fund as required by the 1940 Act.
The Fund has entered into an arrangement with its Custodian whereby credits realized on uninvested cash balances were used to offset a portion of each applicable Portfolio’s expenses. These custodian credits are shown as “Expense Offset” on the Statements of Operations.
F. Purchases and Sales: During the year ended December 31, 2005, purchases and sales of investment securities, other than long-term U.S. Government securities and short-term investments, were:
|
| Purchases |
| Sales |
| ||
Portfolio |
| (000) |
| (000) |
| ||
Active International Allocation |
| $ | 287,285 |
| $ | 129,020 |
|
Emerging Markets |
| 969,326 |
| 850,752 |
| ||
Global Franchise |
| 34,553 |
| 14,131 |
| ||
Global Value Equity |
| 34,098 |
| 28,997 |
| ||
International Equity |
| 2,237,094 |
| 2,905,773 |
| ||
International Growth Equity |
| 5,018 |
| 93 |
| ||
International Magnum |
| 29,069 |
| 29,275 |
| ||
International Real Estate |
| 254,844 |
| 71,932 |
| ||
|
| Purchases |
| Sales |
| ||
Portfolio |
| (000) |
| (000) |
| ||
International Small Cap |
| $ | 627,829 |
| $ | 715,807 |
|
Focus Equity |
| 45,025 |
| 51,435 |
| ||
Large Cap Relative Value |
| 101,258 |
| 80,111 |
| ||
Small Company Growth |
| 1,182,450 |
| 1,064,247 |
| ||
U.S. Large Cap Growth |
| 775,768 |
| 729,217 |
| ||
U.S. Real Estate |
| 402,450 |
| 447,858 |
| ||
Emerging Markets Debt |
| 69,069 |
| 60,722 |
| ||
Included in the aforementioned transactions are purchases with other Morgan Stanley Portfolios as follows:
|
| Affiliated Purchases |
|
Portfolio |
| (000) |
|
U.S. Large Cap Growth |
| $ 203,687 |
|
U.S. Real Estate |
| 49,646 |
|
There were no purchases and sales of long-term U.S. Government securities for the year ended December 31, 2005.
During the year ended December 31, 2005, the following Portfolios paid brokerage commissions to Morgan Stanley & Co., an affiliated broker/dealer:
|
| Brokerage |
| ||
|
| Commissions |
| ||
Portfolio |
| (000) |
| ||
Emerging Markets |
| $ | 29 |
| |
Focus Equity |
|
| 2 |
| |
Small Company Growth |
|
| 1 |
| |
U.S. Large Cap Growth |
|
| 7 |
| |
U.S. Real Estate |
|
| 1 |
| |
Additionally, during the year ended December 31, 2005, Emerging Markets Portfolio paid $10,000 brokerage commissions to China International Capital Corporation (Hong Kong) Limited (CICC), an affiliated broker/dealer.
G. Federal Income Taxes: It is each Portfolio’s intention to qualify as a regulated investment company and distribute all of its taxable and tax-exempt income. Accordingly, no provision for Federal income taxes is required in the financial statements.
A Portfolio may be subject to taxes imposed by countries in which it invests. Such taxes are generally based on income and/or capital gains earned or repatriated. Taxes are accrued based on net investment income, net realized gains and net unrealized appreciation as income and/or capital gains are earned. Taxes may also be based on the movement of foreign currency and are accrued based on the value of investments denominated in such currency.
The tax character of distributions paid may differ from the character of distributions shown on the Statements of Changes in Net Assets due to short-term capital gains being treated as ordinary income for tax purposes. The Municipal Money Market Portfolio’s ordinary income distributions
139
| 2005 Annual Report |
|
|
| December 31, 2005 |
Notes to Financial Statements (cont’d)
shown below include tax-exempt as well as taxable components.
The tax character of distributions paid during 2005 and 2004 were as follows:
|
| 2005 Distributions |
| 2004 Distributions |
| ||||||||
|
| Paid From: |
| Paid From: |
| ||||||||
|
| Ordinary |
| Long-term |
| Ordinary |
| Long-term |
| ||||
|
| Income |
| Capital Gain |
| Income |
| Capital Gain |
| ||||
Portfolio |
| (000) |
| (000) |
| (000) |
| (000) |
| ||||
Active International Allocation |
| $ | 8,215 |
| $ | — |
| $ | 10,343 |
| $ | — |
|
Emerging Markets |
| 25,099 |
| — |
| 9,929 |
| — |
| ||||
Global Franchise |
| 1,929 |
| 4,585 |
| 973 |
| 3,259 |
| ||||
Global Value Equity |
| 2,100 |
| 3,639 |
| 1,126 |
| 272 |
| ||||
International Equity |
| 179,447 |
| 537,969 |
| 231,683 |
| 446,239 |
| ||||
International Magnum |
| 1,286 |
| — |
| 1,928 |
| — |
| ||||
International Real Estate |
| 7,106 |
| 10,170 |
| 832 |
| — |
| ||||
International Small Cap |
| 37,511 |
| 176,515 |
| 37,896 |
| 68,519 |
| ||||
Focus Equity |
| 98 |
| — |
| 103 |
| — |
| ||||
Large Cap Relative Value |
| 2,275 |
| 5,946 |
| 2,112 |
| — |
| ||||
Small Company Growth |
| 50,209 |
| 114,786 |
| — |
| 40,919 |
| ||||
U.S. Large Cap Growth |
| 1,618 |
| — |
| 3,214 |
| — |
| ||||
U.S. Real Estate |
| 30,891 |
| 168,250 |
| 25,591 |
| 41,350 |
| ||||
Emerging Markets Debt |
| 5,446 |
| — |
| 5,272 |
| — |
| ||||
Money Market |
| 12,797 |
| 3 |
| 5,834 |
| — |
| ||||
Municipal Money Market |
| 8,127 |
| 2 |
| 3,503 |
| — |
| ||||
The amount and character of income and gains to be distributed are determined in accordance with income tax regulations which may differ from U.S. generally accepted accounting principles. These book/tax differences are either considered temporary or permanent in nature.
Temporary differences are generally due to differing book and tax treatments for the timing of the recognition of gains and losses on certain investment transactions and the timing and the deductibility of certain expenses.
Permanent differences, primarily due to REIT adjustments, gain (loss) on in-kind redemptions, foreign currency transactions, defaulted bonds, paydown adjustments and gains on certain equity securities designated as issued by “passive foreign investment companies,” resulted in the following reclassifications among the Portfolios’ components of net assets at December 31, 2005:
|
| Accumulated |
|
|
|
|
| |||
|
| Undistributed |
|
|
|
|
| |||
|
| (Distributions in |
|
|
|
|
| |||
|
| Excess of) Net |
| Accumulated |
|
|
| |||
|
| Investment |
| Net Realized |
|
|
| |||
|
| Income (Loss) |
| Gain (Loss) |
| Paid-in Capital |
| |||
Portfolio |
| (000) |
| (000) |
| (000) |
| |||
Active International Allocation |
| $ | (6,727 | ) | $ | 6,727 |
| $ | — |
|
Emerging Markets |
| 558 |
| 74 |
| (632 | ) | |||
Global Franchise |
| 92 |
| (92 | ) | — |
| |||
Global Value Equity |
| (42 | ) | 42 |
| — |
| |||
International Equity |
| (38,323 | ) | (21,122 | ) | 59,445 |
| |||
International Growth Equity |
| — |
| — |
| — |
| |||
International Magnum |
| (468 | ) | 476 |
| (8 | ) | |||
International Real Estate |
| 744 |
| (744 | ) | — |
| |||
|
| Accumulated |
|
|
|
|
| |||
|
| Undistributed |
|
|
|
|
| |||
|
| (Distributions in |
|
|
|
|
| |||
|
| Excess of) Net |
| Accumulated |
|
|
| |||
|
| Investment |
| Net Realized |
|
|
| |||
|
| Income (Loss) |
| Gain (Loss) |
| Paid-in Capital |
| |||
Portfolio |
| (000) |
| (000) |
| (000) |
| |||
International Small Cap |
| $ | 2,991 |
| $ | (2,991 | ) | $ | — |
|
Focus Equity |
| 175 |
| — |
| (175 | ) | |||
Large Cap Relative Value |
| 2 |
| (2 | ) | — |
| |||
Small Company Growth |
| 2,015 |
| (2,015 | ) | — |
| |||
U.S. Large Cap Growth |
| 18 |
| (7,775 | ) | 7,757 |
| |||
U.S. Real Estate |
| (6 | ) | 6 |
| — |
| |||
Emerging Markets Debt |
| 385 |
| (368 | ) | (17 | ) | |||
Money Market |
| 4 |
| (4 | ) | — |
| |||
Municipal Money Market |
| 2 |
| (2 | ) | — |
| |||
At December 31, 2005, the components of distributable earnings on a tax basis were as follows:
|
|
|
| Undistributed |
| ||
|
| Undistributed |
| Long-term |
| ||
|
| Ordinary Income |
| Capital Gain |
| ||
Portfolio |
| (000) |
| (000) |
| ||
Emerging Markets |
| $ | — |
| $ | 16,226 |
|
Global Franchise |
| 874 |
| 22 |
| ||
Global Value Equity |
| 76 |
| 1,225 |
| ||
International Real Estate |
| 2,402 |
| 2,260 |
| ||
International Small Cap |
| 11,939 |
| 50,582 |
| ||
Large Cap Relative Value |
| — |
| 4,369 |
| ||
Small Company Growth |
| — |
| 11,545 |
| ||
U.S. Real Estate |
| 1,499 |
| 41,550 |
| ||
Money Market |
| 132 |
| — |
| ||
Municipal Money Market |
| 76 |
| — |
| ||
Any Portfolios not shown above had no distributable earnings on a tax basis at December 31, 2005. The undistributed ordinary income for the Municipal Money Market represents tax-exempt income.
At December 31, 2005, cost, unrealized appreciation, unrealized depreciation, and net unrealized appreciation (depreciation) for U.S. Federal income tax purposes of the investments of each of the Portfolios were:
|
|
|
|
|
|
|
| Net |
| ||||
|
|
|
|
|
| Deprecia- |
| Appreciation |
| ||||
|
| Cost |
| Appreciation |
| tion |
| (Depreciation) |
| ||||
Portfolio |
| (000) |
| (000) |
| (000) |
| (000) |
| ||||
Active International Allocation |
| $ | 735,053 |
| $ | 128,375 |
| $ | (11,368 | ) | $ | 117,007 |
|
Emerging Markets |
| 1,472,131 |
| 547,963 |
| (51,400 | ) | 496,563 |
| ||||
Global Franchise |
| 69,328 |
| 21,717 |
| (2,050 | ) | 19,667 |
| ||||
Global Value Equity |
| 99,824 |
| 16,042 |
| (2,254 | ) | 13,788 |
| ||||
International Equity |
| 7,003,987 |
| 1,347,481 |
| (58,698 | ) | 1,288,783 |
| ||||
International Growth Equity |
| 4,924 |
| 13 |
| (46 | ) | (33 | ) | ||||
International Magnum |
| 99,894 |
| 18,778 |
| (2,340 | ) | 16,438 |
| ||||
International Real Estate |
| 238,895 |
| 18,919 |
| (2,108 | ) | 16,811 |
| ||||
International Small Cap |
| 1,123,996 |
| 302,395 |
| (29,646 | ) | 272,749 |
| ||||
Focus Equity |
| 54,786 |
| 13,339 |
| (1,653 | ) | 11,686 |
| ||||
Large Cap Relative Value |
| 186,936 |
| 22,065 |
| (3,739 | ) | 18,326 |
| ||||
Small Company Growth |
| 1,493,237 |
| 304,932 |
| (72,224 | ) | 232,708 |
| ||||
U.S. Large Cap Growth |
| 796,838 |
| 122,596 |
| (13,128 | ) | 109,468 |
| ||||
U.S. Real Estate |
| 892,154 |
| 470,573 |
| (6,443 | ) | 464,130 |
| ||||
140
2005 Annual Report | |
| |
December 31, 2005 | |
Notes to Financial Statements (cont’d)
|
|
|
|
|
|
|
| Net |
| ||||
|
|
|
|
|
| Deprecia- |
| Appreciation |
| ||||
|
| Cost |
| Appreciation |
| tion |
| (Depreciation) |
| ||||
Portfolio |
| (000) |
| (000) |
| (000) |
| (000) |
| ||||
Emerging Markets Debt |
| $ | 88,502 |
| $ | 5,409 |
| $ | (1,670) |
| $ | 3,739 |
|
Money Market |
| 417,171 |
| — |
| — |
| — |
| ||||
Municipal Money Market |
| 316,701 |
| — |
| — |
| — |
| ||||
At December 31, 2005, the following Portfolios had available capital loss carryforwards to offset future net capital gains, to the extent provided by regulations, through the indicated expiration dates:
Expiration Date December 31, (000) |
| ||||||||||||||||||||||||
Portfolio |
| 2006 |
| 2007 |
| 2008 |
| 2009 |
| 2010 |
| 2011 |
| 2012 |
| Total |
| ||||||||
Active |
|
|
|
|
|
|
|
|
|
|
|
|
|
|
|
|
| ||||||||
International |
| $ | — |
| $ | — |
| $ | — |
| $ | — |
| $ | 28,460 |
| $ | 25,582 |
| $ | — |
| $ | 54,042 |
|
Allocation |
|
|
|
|
|
|
|
|
|
|
|
|
|
|
|
|
| ||||||||
International |
|
|
|
|
|
|
|
|
|
|
|
|
|
|
|
|
| ||||||||
Magnum |
| — |
| — |
| — |
| — |
| 980 |
| 2,376 |
| — |
| 3,356 |
| ||||||||
Focus Equity |
| — |
| — |
| — |
| 7,298 |
| 21,111 |
| — |
| 296 |
| 28,705 |
| ||||||||
Small Company |
|
|
|
|
|
|
|
|
|
|
|
|
|
|
|
|
| ||||||||
Growth* |
| — |
| — |
| — |
| 6,427 |
| 18,090 |
| — |
| — |
| 24,517 |
| ||||||||
U.S. Large Cap |
|
|
|
|
|
|
|
|
|
|
|
|
|
|
|
|
| ||||||||
Growth |
| — |
| — |
| — |
| — |
| 51,387 |
| 22,406 |
| — |
| 73,793 |
| ||||||||
Emerging |
|
|
|
|
|
|
|
|
|
|
|
|
|
|
|
|
| ||||||||
Markets Debt |
| 73,361 |
| 9,761 |
| — |
| 778 |
| — |
| — |
| — |
| 83,900 |
| ||||||||
|
|
|
|
|
|
|
|
|
|
|
|
|
|
|
|
|
| ||||||||
*Capital loss carryover from target fund. |
|
|
|
|
|
|
|
|
|
|
| ||||||||||||||
The amounts reflected in the capital loss carryforward table above for the Small Company Growth Portfolio represent capital loss carryforward acquired from MSIFT Small Cap Growth Portfolio after limitations pursuant to Internal Revenue Code, Section 383.
During the year ended December 31, 2005, the following Portfolios utilized capital loss carryforwards for U.S. Federal income tax purposes of approximately:
|
| Capital Loss |
| |
|
| Carry forward |
| |
|
| Utilized |
| |
Portfolio |
| (000) |
| |
Active International Allocation |
| $ | 37,952 |
|
Emerging Markets |
| 211,939 |
| |
International Magnum |
| 9,029 |
| |
International Real Estate |
| 298 |
| |
Focus Equity |
| 2,897 |
| |
Large Cap Relative Value |
| 4,493 |
| |
Small Company Growth |
| 5,561 |
| |
U.S. Large Cap Growth |
| 35,173 |
| |
Emerging Markets Debt |
| 1,995 |
| |
The Small Company Growth Portfolio utilized approximately $5,561,000 of capital losses acquired from MSIFT Small Cap Growth Portfolio for federal tax purposes during the year ended December 31, 2005.
To the extent that capital loss carryovers are used to offset any future capital gains realized during the carryover period as provided by U.S. Federal income tax regulations, no capital gains tax liability will be incurred by a Portfolio for gains realized and not distributed. To the extent that capital gains are offset, such gains will not be distributed to the shareholders.
Net capital, passive investment company (PFIC), and currency losses incurred after October 31, and within the taxable year are deemed to arise on the first day of the Portfolio’s next taxable year. For the year ended December 31, 2005, the Portfoliodeferred to January 3, 2006 for U.S. Federal income tax purposes, post-October capital, PFIC and currency losses as indicated:
|
| Capital |
| Currency |
|
|
| Losses |
| Losses |
|
Portfolio |
| (000) |
| (000) |
|
Active International Allocation |
| $ — |
| $1,932 |
|
Emerging Markets |
| — |
| 3,081 |
|
Global Value Equity |
| — |
| 2 |
|
International Growth Equity |
| @— |
| 1 |
|
International Magnum |
| 2 |
| 227 |
|
International Real Estate |
| — |
| @— |
|
International Small Cap |
| — |
| 51 |
|
U.S. Real Estate |
| — |
| 3 |
|
Emerging Markets Debt |
| — |
| 8 |
|
For the year ended December 31, 2005, the International Equity Portfolio and U.S. Large Cap Growth Portfolio realized gains from in-kind redemptions of $105,351,000 and $8,386,000, respectively. The gains are not taxable income to the Portfolios.
H. Contractual Obligations: The Fund enters into contracts that contain a variety of indemnifications. The Fund’s maximum exposure under these arrangements is unknown. However, the Fund has not had prior claims or losses pursuant to these contracts and expects the risk of loss to be remote.
I. Other: The net assets of certain Portfolios include foreign denominated securities and currency. Changes in currency exchange rates will affect the U.S. dollar value of and investment income from such securities. Further, at times certain of the Portfolios’ investments are concentrated in a limited number of countries and regions. This concentration may further increase the risk of the Portfolio.
The Emerging Markets Debt Portfolio holds a significant portion of its investments in securities which are traded by a small number of market makers who may also be utilized by the Portfolio to provide pricing information used to value such investments. The amounts realized upon disposition of these securities may differ from the value reflected on the Statements of Assets and Liabilities.
Settlement and registration of foreign securities transactions may be subject to significant risks not normally associated with investments in the United States. In certain markets, including Russia, ownership of shares is defined according to
141
| 2005 Annual Report |
|
|
| December 31, 2005 |
Notes to Financial Statements (cont’d)
entries in the issuer’s share register. In Russia, currently no central registration system exists and the share registrars may not be subject to effective state supervision. It is possible that a Portfolio could lose its share registration through fraud, negligence or even mere oversight. In addition, shares being delivered for sales and cash being paid for purchases may be delivered before the exchange is complete. This may subject the Portfolio to further risk of loss in the event of a counterparty’s failure to complete the transaction.
A portion of the securities of the Municipal Money Market Portfolio are insured by certain companies specializing in the insurance of municipal debt obligations. At December 31, 2005, approximately 21.7% of the net assets of the Municipal Money Market Portfolio are covered by such insurance. The insurers and their obligations are as follows:
|
| Percentage of |
| |
Insurer |
| Net Assets |
| |
FSA |
| 8.6 | % |
|
FGIC |
| 4.2 |
|
|
AMBAC |
| 4.1 |
|
|
MBIA |
| 2.7 |
|
|
Radian |
| 1.3 |
|
|
FHA |
| 0.8 |
|
|
At December 31, 2005, certain Portfolios had otherwise unaffiliated record owners of 10% or greater. Investment activities of these shareholders could have a material impact on these Portfolios.
These Portfolios and the aggregate percentage of such owners were as follows:
|
| Percentage of Ownership |
| ||
|
|
|
|
|
|
Portfolio |
| Class A |
| Class B |
|
Active International Allocation |
| 67.4 | % | 76.8 | % |
Emerging Markets |
| 18.3 |
| 94.7 |
|
Global Franchise |
| 37.6 |
| — |
|
Global Value Equity |
| 82.8 |
| 96.1 |
|
International Equity |
| — |
| 75.1 |
|
International Growth Equity |
| 100.0 |
| 100.0 |
|
International Magnum |
| 96.8 |
| 86.9 |
|
International Real Estate |
| 44.4 |
| 86.7 |
|
International Small Cap |
| 30.1 |
| N/A |
|
Focus Equity |
| 75.2 |
| 68.3 |
|
Large Cap Relative Value |
| 84.9 |
| 99.2 |
|
Small Company Growth |
| 34.2 |
| 56.7 |
|
U.S. Large Cap Growth |
| 85.6 |
| 77.9 |
|
U.S. Real Estate |
| 60.7 |
| 77.3 |
|
Emerging Markets Debt |
| 90.0 |
| 97.4 |
|
142
2005 Annual Report | |
| |
December 31, 2005 | |
Report of Independent Registered Public Accounting Firm
To the Shareholders and Board of Directors of
Morgan Stanley Institutional Fund, Inc.
We have audited the accompanying statements of assets and liabilities, including the portfolios of investments, of the Morgan Stanley Institutional Fund, Inc. (the “Fund”) (comprising, respectively, the Active International Allocation Portfolio, EmergingMarkets Portfolio, Global Franchise Portfolio, Global Value Equity Portfolio, International Equity Portfolio, International Growth Equity Portfolio, International Magnum Portfolio, International Real Estate Portfolio, International Small Cap Portfolio, Focus Equity Portfolio, Large Cap Relative Value Portfolio, Small Company Growth Portfolio, U.S. Large Cap Growth Portfolio, U.S. Real Estate Portfolio, Emerging Markets Debt Portfolio, Money Market Portfolio and Municipal Money Market Portfolio), as of December 31, 2005, and the related statements of operations, the statements of changes in net assets, and the financial highlights for each of the periods indicated therein. These financial statements and financial highlights are the responsibility of the Fund’s management. Our responsibility is to express an opinion on these financial statements and financial highlights based on our audits.
We conducted our audits in accordance with the standards of the Public Company Accounting Oversight Board (United States). Those standards require that we plan and perform the audit to obtain reasonable assurance about whether the financial statements and financial highlights are free of material misstatement. We were not engaged to perform an audit of the Fund’s internal control over financial reporting. Our audits included consideration of internal control over financial reporting as a basis for designing audit procedures that are appropriate in the circumstances, but not for the purpose of expressing an opinion on the effectiveness of the Fund’s internal control over financial reporting. Accordingly, we express no such opinion. An audit also includes examining, on a test basis, evidence supporting the amounts and disclosures in the financial statements and financial highlights, assessing the accounting principles used and significant estimates made by management, and evaluating the overall financial statement presentation. Our procedures included confirmation of securities owned as of December 31, 2005, by correspondence with the custodian and brokers, or by other appropriate auditing procedures where replies from brokers were not received. We believe that our audits provide a reasonable basis for our opinion.
In our opinion, the financial statements and financial highlights referred to above present fairly, in all material respects, the financial position of each of the aforementioned portfolios constituting the Morgan Stanley Institutional Fund, Inc. at December 31, 2005, the results of their operations, the changes in their net assets, and the financial highlights for each of the periods indicated therein, in conformity with U.S. generally accepted accounting principles.

Boston, Massachusetts
February 13, 2006
143
| 2005 Annual Report |
|
|
| December 31, 2005 |
Federal Income Tax Information (unaudited)
For the year ended December 31, 2005, the percentage of dividends paid that qualify for the 70% dividend received deduction for corporate shareholders for the Global Franchise, Global Value Equity, Focus Equity, Large Cap Relative Value, Small Company Growth, U.S. Large Cap Growth and U.S. Real Estate Portfolios are 20.0%, 59.0%, 99.7%, 100.0%, 27.0%, 100.0% and 3.8%, respectively.
For the year ended December 31, 2005, the percentage of income earned from direct U.S. Treasury Obligations for the Money Market Portfolio is 3.4%.
For the year ended December 31, 2005, the percentage of exempt interest dividends paid by the Municipal Money Market Portfolio is 99.9%.
For the year ended December 31, 2005, the following Portfolios intend to pass through foreign tax credits and have derived gross income from sources within foreign countries amounting to:
|
| Foreign |
| Foreign |
|
|
| Tax Credit |
| Source |
|
|
| Pass-Through |
| Income |
|
Portfolio |
| (000) |
| (000) |
|
Emerging Markets |
| $1,407 |
| $32,665 |
|
Global Franchise |
| 77 |
| 1,623 |
|
Global Value Equity |
| 57 |
| 1,433 |
|
International Real Estate |
| 189 |
| 3,950 |
|
International Small Cap |
| 2,122 |
| 32,838 |
|
|
|
|
|
|
|
*Amounts based on October 31 tax year end. |
|
|
| ||
Each applicable Portfolio hereby designates the following amount as long-term capital gain dividends for the purpose of the dividend paid deduction on its federal tax return:
|
| Long-term |
|
|
| Capital Gain - 20% |
|
Portfolio |
| (000) |
|
Global Franchise Global Value Equity International Equity International Real Estate Large Cap Relative Value International Small Cap Small Company Growth U.S. Real Estate Municipal Money Market Money Market |
| $ 4,585 3,639 537,969 10,170 5,946 176,515 114,786 168,250 2 3 |
|
144
2005 Annual Report | |
| |
December 31, 2005 | |
Federal Income Tax Information (unaudited) (cont’d)
For the year ended December 31, 2005, qualified dividend income for each applicable Portfolio totaled:
|
| Qualifying |
|
|
| Dividend |
|
|
| Income |
|
Portfolio |
| (000) |
|
Active International Allocation Emerging Markets Focus Equity Global Franchise Global Value Equity International Equity International Magnum International Real Estate International Small Cap Large Cap Relative Value Small Company Growth U.S. Large Cap Growth |
| $4,152 21,596 98 1,979 2,146 113,605 873 1,507 24,796 2,277 13,759 1,618 |
|
For the year ended December 31, 2005, qualified interest income for each applicable Portfolio totaled:
|
| Qualifying |
|
|
| Interest |
|
|
| Income |
|
Portfolio |
| (000) |
|
Money Market |
| $ 12,136 |
|
Municipal Money Market |
| 8,129 |
|
145
| 2005 Annual Report |
|
|
| December 31, 2005 |
Director and Officer Information (unaudited)
Independent Directors:
Name, Age and Address of |
| Position(s) |
| Term of Office |
|
|
| Numberof |
|
|
|
Director |
| Registrant |
| Time Served* |
| Principal Occupation(s) During Past 5 Years |
| Director** |
| Other Directorships Held by Director | |
Michael Bozic (64) c/o Kramer Levin Naftalis & Frankel LLP Counsel to the Independent Directors 1177 Avenue of the Americas New York, NY 10036 |
| Director |
| Director since July 2003 |
| Private investor; Director or Trustee of the Retail Funds (since April 1994) and the Institutional Funds (since July 2003); formerly Vice Chairman of Kmart Corporation (December 1998-October 2000), Chairman and Chief Executive Officer of Levitz Furniture Corporation (November 1995-November 1998) and President and Chief Executive Officer of Hills Department Stores (May 1991-July 1995); formerly variously Chairman, Chief Executive Officer, President and Chief Operating Officer (1987-1991) of the Sears Merchandise Group of Sears Roebuck & Co. |
| 197 |
| Director of various business organizations. |
|
|
|
|
|
|
|
|
|
|
|
|
|
Edwin J. Garn (73) 1031 N. Chartwell Court Salt Lake City, UT 84103 |
| Director |
| Director since July 2003 |
| Consultant: Director or Trustee of the Retail Funds (since January 1993) and the Institutional Funds (since July 2003); member of the Utah Regional Advisory Board of Pacific Corp. (utility company); formerly Managing Director of Summit Ventures LLC (2000 - 2004) (lobbying and consulting firm); United States Senator (R- Utah) (1974-1992) and Chairman, Senate Banking Committee (1980-1986), Mayor of Salt Lake City, Utah (1971-1974), Astronaut, Space Shuttle Discovery (April 12-19, 1985), and Vice Chairman, Huntsman Corporation (chemical company). |
| 197 |
| Director of Franklin Covey (time management systems), BMW Bank of North America, Inc. (industrial loan corporation), Escrow Bank USA (industrial loan corporation), United Space Alliance (joint venture between Lockheed Martin and The Boeing Company) and Nuskin Asia Pacific (multi-level marketing); member of the board of various civic and charitable organizations. |
|
|
|
|
|
|
|
|
|
|
|
|
|
Wayne E. Hedien (71) c/o Kramer Levin Naftalis & Frankel LLP Counsel to the Independent Directors 1177 Avenue of the Americas New York, NY 10036 |
| Director |
| Director since July 2003 |
| Retired; Director or Trustee of the Retail Funds (since September 1997) and the Institutional Funds (since July 2003); formerly associated with the Allstate Companies (1966-1994), most recently as Chairman of The Allstate Corporation (March 1993-December 1994) and Chairman and Chief Executive Officer of its wholly-owned subsidiary, Allstate Insurance Company (July 1989-December 1994). |
| 197 |
| Director of the PMI Group Inc. (private mortgage insurance); Director and Vice Chairman of The Field Museum of Natural History; director of various other business and charitable organizations. |
|
|
|
|
|
|
|
|
|
|
|
|
|
Dr. Manuel H. Johnson (56) c/o Johnson Smick Group Inc. 888 16th Street, NW Suite 740 Washington, D.C. 20006 |
| Director |
| Director since July 2003 |
| Senior Partner, Johnson Smick International, Inc., a consulting firm; Chairman of the Audit Committee and Director or Trustee of the Retail Funds (since July 1991) and the Institutional Funds (since July 2003); Co-Chairman and a founder of the Group of Seven Council (G7C), an international economic commission; formerly Vice Chairman of the Board of Governors of the Federal Reserve System and Assistant Secretary of the U.S. Treasury. |
| 197 |
| Director of NVR, Inc. (home construction); Director of KFX Energy; Director of RBS Greenwich Capital Holdings (financial holdings company). |
|
|
|
|
|
|
|
|
|
|
|
|
|
Joseph J. Kearns (63) c/o Kearns & Associates LLC PMB754 23852 Pacific Coast Highway Malibu, CA 90265 |
| Director |
| Director since August 1994 |
| President, Kearns & Associates LLC (investment consulting); Deputy Chairman of the Audit Committee and Director or Trustee of the Retail Funds (since July 2003) and the Institutional Funds (since August 1994); previously Chairman of the Audit Committee of the Institutional Funds (October 2001-July 2003); formerly CFO of the J. Paul Getty Trust. |
| 198 |
| Director of Electro Rent Corporation (equipment leasing), The Ford Family Foundation and the UCLA Foundation. |
|
|
|
|
|
|
|
|
|
|
|
|
|
Michael E. Nugent (69) c/o Triumph Capital, L.P. 445 Park Avenue New York, NY 10022 |
| Director |
| Director since July 2001 |
| General Partner of Triumph Capital, L.P., a private investment partnership; Chairman of the Insurance Committee and Director or Trustee of the Retail Funds (since July 1991) and the Institutional Funds (since July 2001); formerly Vice President, Bankers Trust Company and BT Capital Corporation (1984-1988). |
| 197 |
| None. |
|
|
|
|
|
|
|
|
|
|
|
|
|
Fergus Reid (73) c/o Lumelite Plastics Corporation 85 Charles Coleman Blvd. Pawling, NY 12564 |
| Director |
| Director since June 1992 |
| Chairman of Lumelite Plastics Corporation; Chairman of the Governance Committee and Director or Trustee of the Retail Funds (since July 2003) and the Institutional Funds (since June 1992). |
| 198 |
| Trustee and Director of certain investment companies in the J.P. Morgan Funds complex managed by J.P. Morgan Investment Management Inc. |
|
146
2005 Annual Report | |
| |
December 31, 2005 | |
Director and Officer Information (cont’d)
Interested Directors:
|
|
|
|
|
|
|
| Number of |
|
|
|
|
|
|
|
|
|
|
| Portfolios in |
|
|
|
|
| Position(s) |
| Term of Office |
|
|
| Fund Complex |
|
|
|
Name, Age and Address of |
| Held with |
| and Length of |
|
|
| Overseen by |
|
|
|
Director |
| Registrant |
| Time Served* |
| Principal Occupation(s) During Past 5 Years |
| Director** |
| Other Directorships Held by Director |
|
Charles A. Fiumefreddo (72) c/o Morgan Stanley Trust Harborside Financial Center Plaza Two Jersey City, NJ 07311 |
| Chairman of the Board and Director |
| Chairman of the Board and Director since July 2003 |
| Chairman and Director or Trustee of the Retail Funds (since July 1991) and the Institutional Funds (since July 2003); formerly Chief Executive Officer of the Retail Funds (until September 2002). |
| 197 |
| None. |
|
|
|
|
|
|
|
|
|
|
|
|
|
James F. Higgins (57) c/o Morgan Stanley Trust Harborside Financial Center Plaza Two Jersey City, NJ 07311 |
| Director |
| Director since July 2003 |
| Director or Trustee of the Retail Funds (since June 2000) and the Institutional Funds (since July 2003); Senior Advisor of Morgan Stanley (since August 2000); Director of Morgan Stanley Distributors Inc. and Dean Witter Realty Inc.; previously President and Chief Operating Officer of the Private Client Group of Morgan Stanley (May 1999-August 2000), and President and Chief Operating Officer of Individual Securities of Morgan Stanley (February 1997-May 1999). |
| 197 |
| Director of AXA Financial, Inc. and The Equitable Life Assurance Society of the United States (financial services). |
|
* This is the earliest date the Director began serving the Institutional Funds. Each Director serves an indefinite term, until his or her successor is elected.
** The Fund Complex includes all funds advised by Morgan Stanley Investment Management Inc. and funds that have an investment advisor that is an affiliated entity of Morgan Stanley Investment Management Inc. (including, but not limited to, Morgan Stanley Investments LP and Morgan Stanley Investment Advisors Inc.).
Additional information about the Fund’s Directors can be found in the Fund’s Statement of Additional Information (SAI). The SAI may be obtained without charge upon request, by calling the Fund at 1-800-548-7786 or by accessing the Morgan Stanley Investment Management’s website at www.morganstanley.com/im. You may also retrieve this information on-line at the Securities and Exchange Commission’s web site at www.sec.gov.
147
| 2005 Annual Report |
|
|
| December 31, 2005 |
Director and Officer Information (cont’d)
Officers:
Name, Age and Address of Executive Officer |
| Position(s) Held with Registrant |
| Term of Office and Length of Time Served* |
| Principal Occupation(s) During Past 5 Years |
|
Ronald E. Robison (66) |
| President and Principal Executive Officer |
| President (since September 2005) and Principal Executive Officer (since July 2003) |
| President (since September 2005) and Principal Executive Officer of funds in the Fund Complex (since May 2003); Managing Director of Morgan Stanley & Co. Incorporated and Morgan Stanley; Managing Director and Director of Morgan Stanley Investment Management Inc., Morgan Stanley Distribution Inc. and Morgan Stanley Distributors Inc.; Managing Director, Chief Administrative Officer and Director of Morgan Stanley Investment Advisors Inc. and Morgan Stanley Services Company Inc.; Chief Executive Officer and Director of Morgan Stanley Trust; Director of Morgan Stanley SICAV (since May 2005); President (since September 2005) and Principal Executive Officer (since May 2003) of the Van Kampen Funds; previously Executive Vice President (July 2003 - September 2005) of funds in the Fund Complex and the Van Kampen Funds. He was also previously President and Director of the Institutional Funds (March 2001 - July 2003), Chief Global Operations Officer of Morgan Stanley Investment Management Inc. and Chief Executive Officer and Chairman of Van Kampen Investor Services. |
|
|
|
|
|
|
|
|
|
J. David Germany (51) |
| Vice President
|
| Vice President since February 2006
|
| Managing Director and Chief Investment Officer - Global Fixed Income of Morgan Stanley Investment Management Inc., Morgan Stanley Investment Advisors Inc., and Van Kampen Asset Management. Managing Director and Director of Morgan Stanley Investment Management Ltd. Vice President (since February 2006) of the Morgan Stanley Retail Funds and Morgan Stanley Institutional Funds. |
|
|
|
|
|
|
|
|
|
Dennis F. Shea (52) |
| Vice President |
| Vice President since February 2006 |
| Managing Director and Chief Investment Officer - Global Equity of Morgan Stanley Investment Management Inc., Morgan Stanley Investment Advisors Inc., and Van Kampen Asset Management. Vice(since February 2006) of the Morgan Stanley Retail Funds and Morgan Stanley Institutional Funds. Previously, Managing Director and Director of Global Equity Research at Morgan Stanley. |
|
|
|
|
|
|
|
|
|
Barry Fink (50) Morgan Stanley Investment Management Inc. 1221 Avenue of the Americas New York, NY 10020 |
| Vice President |
| Vice President since July 2003
|
| General Counsel (since May 2000) and Managing Director (since December 2000) of Morgan Stanley Investment Management Inc.; Managing Director (since December 2000) of Morgan Stanley Investment Advisors Inc. and Morgan Stanley Services Company Inc.; Vice President of the Retail Funds; Assistant Secretary of Morgan Stanley DW Inc.; Vice President of the Institutional Funds (since July 2003); Managing Director, Secretary and Director of Morgan Stanley Distributors Inc.; previously Secretary of the Retail Funds and General Counsel (February 1997- April 2004) of the Retail Funds; previously Secretary (1997-2006) and Director (1997-2005) of Morgan Stanley Investment Advisors Inc. and Morgan Stanley Services Company Inc.; and Secretary and Director of Morgan Stanley Distributors Inc. (1997-2005). |
|
|
|
|
|
|
|
|
|
Amy R. Doberman (43) Morgan Stanley Investment Management Inc. 1221 Avenue of the Americas New York, NY 10020 |
| Vice President |
| Vice President since July 2004 |
| Managing Director and General Counsel, U.S. Investment Management; Managing Director (since July 2004) and Secretary (since February 2006) of Morgan Stanley Investment Management Inc. and Morgan Stanley Investment Advisors Inc., Managing Director and Secretary of Morgan Stanley Distributors Inc.(since February 2006); Managing Director (since February 2005) and Secretary (since February 2006) of Morgan Stanley Services Company Inc.; Vice President of the Institutional and Retail Funds (since July 2004); various positions with the Van Kampen Funds and certain of their service providers; previously, Managing Director and General Counsel — Americas, UBS Global Asset Management (July 2000-July 2004). |
|
|
|
|
|
|
|
|
|
Carsten Otto (42) Morgan Stanley Investment Management Inc. 1221 Avenue of the Americas New York, NY 10020 |
| Chief Compliance Officer |
| Chief Compliance Officer since 2004 |
| Managing Director and U.S. Director of Compliance for Morgan Stanley Investment Management (since October 2004); Managing Director of Morgan Stanley Investment Advisors Inc. and Morgan Stanley Investment Management Inc.; formerly Assistant Secretary and Assistant General Counsel of the Morgan Stanley Retail Funds. |
|
|
|
|
|
|
|
|
|
Stefanie V. Chang (39) Morgan Stanley Investment Management Inc. 1221 Avenue of the Americas New York, NY 10020 |
| Vice President |
| Vice President since December 1997 |
| Executive Director of Morgan Stanley & Co. Incorporated, Morgan Stanley Investment Management Inc. and Morgan Stanley Investment Advisors Inc.; Vice President of the Institutional Funds (since December 1997) and the Retail Funds (since July 2003); various positions with the Van Kampen Funds; formerly practiced law with the New York law firm of Rogers & Wells (now Clifford Chance US LLP). |
|
|
|
|
|
|
|
|
|
James W. Garrett (37) Morgan Stanley Investment Management Inc. 1221 Avenue of the Americas New York, NY 10020 |
| Treasurer and Chief Financial Officer |
| Treasurer since February 2002; Chief Financial Officer since July 2003 |
| Executive Director of Morgan Stanley & Co. Incorporated and Morgan Stanley Investment Management Inc.; Treasurer and Chief Financial Officer of the Institutional Funds; previously with PriceWaterhouse LLP (now PriceWaterhouseCoopers LLP). |
|
|
|
|
|
|
|
|
|
Michael J. Leary (40) J.P. Morgan Investor Services Co. 73 Tremont Street Boston, MA 02108 |
| Assistant Treasurer |
| Assistant Treasurer since March 2003 |
| Director and Vice President of Fund Administration, JPMorgan Investor Services Co. (formerly Chase Global Funds Services Company); formerly Audit Manager at Ernst & Young LLP. |
|
|
|
|
|
|
|
|
|
Mary E. Mullin (38) Morgan Stanley Investment Management Inc. 1221 Avenue of the Americas New York, NY 10020 |
| Secretary |
| Secretary since June 1999 |
| Executive Director of Morgan Stanley & Co. Incorporated, Morgan Stanley Investment Management Inc. and Morgan Stanley Investment Advisors Inc.; Secretary of the Institutional Funds and (since July 2003) the Retail Funds; formerly practiced law with the New York law firms of McDermott, Will & Emery and Skadden, Arps, Slate, Meagher & Flom LLP. |
|
* This is the date the Officer began servin g the Institutional Funds. Each Officer serves an indefinite term, until his or her successor is elected.
148
2005 Annual Report | |
| |
December 31, 2005 | |
Investment Adviser and Administrator
Morgan Stanley Investment Management Inc.
1221 Avenue of the Americas
New York, NY 10020
Distributor
Morgan Stanley Distribution, Inc.
One Tower Bridge
100 Front Street, Suite 1100
West Conshohocken, PA 19428-2899
Custodian
JPMorgan Chase Bank, N.A.
270 Park Avenue
New York, NY 10017
Legal Counsel
Clifford Chance US LLP
31 West 52nd Street
New York, NY 10019
Independent Registered Public Accounting Firm
Ernst & Young LLP
200 Clarendon Street
Boston, MA 02116-5072
Reporting to Shareholders
Each Morgan Stanley fund provides a complete schedule of portfolio holdings in its semi-annual and annual reports within 60 days of the end of the fund’ssecond and fourth fiscal quarters by filing the schedule electronically with the Securities and Exchange Commission (SEC). The semi-annual reports are filed on Form N-CSRS and the annual reports are filed on Form N-CSR. Morgan Stanley also delivers the semi-annual and annual reports to fund shareholders and makes these reports available on its public website, www.morganstanley.com. Each Morgan Stanley fund also files a complete schedule of portfolio holdings with the SEC for the fund’s first and third fiscal quarters on Form N-Q. Morgan Stanley does not deliver the reports for the first and third fiscal quarters to shareholders, nor are the reports posted to the Morgan Stanley public website. You may, however, obtain the Form N-Q filings (as well as the Form N-CSR and N-CSRS filings) by accessing the SEC’s website, www.sec.gov. You may also review and copy them at the SEC’s Public Reference Room in Washington, DC. Information on the operation of the SEC’s Public Reference Room may be obtained by calling the SEC at 1(800) SEC-0330. You can also request copies of these materials, upon payment of a duplicating fee, by electronic request at the SEC’s email address (publicinfo@sec.gov) or by writing the Public Reference section of the SEC, Washington, DC 20549-0102.
Proxy Voting Policies and Procedures and Proxy Voting Record
You may obtain a copy of the Fund’s Proxy Voting Policy and Procedures without charge, upon request, by calling toll free
1-800-281-2715 or by visiting our website at www.morganstanley.com/im. It is also available on the Securities and Exchange Commission’s website at http://www.sec.gov.
You may obtain information regarding how the Fund voted proxies relating to portfolio securities during the most recent twelve-month period ended June 30 by calling 1-800-281-2715. This information is also available on the Securities and Exchange Commission’s website at http://www.sec.gov.
149
Printed in U.S.A.
This Report has been prepared for shareholders and may be distributed to
others only if preceded or accompanied by a current prospectus.
Morgan Stanley Investment Management Inc.
1221 Avenue of the Americas
New York, NY 10020
MSIF: (800) 548-7786
© 2006 Morgan Stanley

IS06-00151P-Y12/05
Item 2. Code of Ethics.
(a) The Fund has adopted a code of ethics (the “Code of Ethics”) that applies to its principal executive officer, principal financial officer, principal accounting officer or controller, or persons performing similar functions, regardless of whether these individuals are employed by the Fund or a third party.
(b) No information need be disclosed pursuant to this paragraph.
(c) The Fund has amended its Code of Ethics during the period covered by the shareholder report presented in Item 1 hereto to delete from the end of the following paragraph on page 2 of the Code the phrase “to the detriment of the Fund.”:
“Each Covered Officer must not use his personal influence or personal relationship improperly to influence investment decisions or financial reporting by the Fund whereby the Covered Officer would benefit personally (directly or indirectly).”
Additionally, Exhibit B was amended to remove Mitchell M. Merin as a covered officer.
(d) Not applicable.
(e) Not applicable.
(f)
(1) The Fund’s Code of Ethics is attached hereto as Exhibit 12 A.
(2) Not applicable.
(3) Not applicable.
Item 3. Audit Committee Financial Expert.
The Fund’s Board of Trustees/Directors has determined that it has two “audit committee financial experts” serving on its audit committee, each of whom are “independent” Trustees/Directors: Dr. Manuel H. Johnson and Joseph J. Kearns. Under applicable securities laws, a person who is determined to be an audit committee financial expert will not be deemed an “expert” for any purpose, including without limitation for the purposes of Section 11 of the Securities Act of 1933, as a result of being designated or identified as an audit committee financial expert. The designation or identification of a person as an audit committee financial expert does not impose on such person any duties, obligations, or liabilities that are greater than the duties, obligations, and liabilities imposed on such person as a member of the audit committee and Board of Trustees/Directors in the absence of such designation or identification.
Item 4. Principal Accountant Fees and Services.
(a)(b)(c)(d) and (g). Based on fees billed for the periods shown:
2005
|
| Registrant |
| Covered Entities(1) |
| ||
Audit Fees |
| $ | 484,334 |
| N/A |
| |
|
|
|
|
|
| ||
Non-Audit Fees |
|
|
|
|
| ||
Audit-Related Fees |
| $ |
| $ | 235,000 | (2) | |
Tax Fees. |
| $ | 45,938 | (3) | $ | 52,799 | (4) |
All Other Fees |
| $ |
| $ | 956,268 | (5) | |
Total Non-Audit Fees. |
| $ | 45,938 |
| $ | 1,244,067 |
|
|
|
|
|
|
| ||
Total |
| $ | 530,272 |
| $ | 1,244,067 |
|
2004
|
| Registrant |
| Covered Entities(1) |
| ||
Audit Fees |
| $ | 461,270 |
| N/A |
| |
|
|
|
|
|
| ||
Non-Audit Fees |
|
|
|
|
| ||
Audit-Related Fees |
| $ |
| $ | 115,000 | (2) | |
Tax Fees |
| $ | 43,750 | (3) | $ | 100,829 | (6) |
All Other Fees |
| $ |
| $ | 60,985 | (7) | |
Total Non-Audit Fees |
| $ | 43,750 |
| $ | 276,814 |
|
|
|
|
|
|
| ||
Total |
| $ | 505,020 |
| $ | 276,814 |
|
N/A- Not applicable, as not required by Item 4.
(1) Covered Entities include the Adviser (excluding sub-advisors) and any entity controlling, controlled by or under common control with the Adviser that provides ongoing services to the Registrant.
(2) Audit-Related Fees represent assurance and related services provide d that are reasonably related to the performance of the audit of the financial statements of the Covered Entities and funds advised by the Adviser or its affiliates, specifically attestation services provided in connection with a SAS 70 Report.
(3) Tax Fees represent tax advice and compliance services provided in connection with the review of the Registrant’s tax returns.
(4) Tax Fees represent tax advice services provided to Covered Entities, including research and identification of PFIC
entities.
(5) All Other Fees represent attestation services provided in connection with performance presentation standards and a compliance review project performed.
(6) Tax Fees represent tax advice services provided to Covered Entities, including assistance in obtaining a private letter ruling and the research and identification of PFIC entities.
(7) All Other Fees represent attestation services provided in connection with performance presentation standards.
(e)(1) The audit committee’s pre-approval policies and procedures are as follows:
APPENDIX A
AUDIT COMMITTEE
AUDIT AND NON-AUDIT SERVICES
PRE-APPROVAL POLICY AND PROCEDURES
OF THE
MORGAN STANLEY RETAIL AND INSTITUTIONAL FUNDS
AS ADOPTED AND AMENDED JULY 23, 2004,(1)
1. Statement of Principles
The Audit Committee of the Board is required to review and, in its sole discretion, pre-approve all Covered Services to be provided by the Independent Auditors to the Fund and Covered Entities in order to assure that services performed by the Independent Auditors do not impair the auditor’s independence from the Fund.
The SEC has issued rules specifying the types of services that an independent auditor may not provide to its audit client, as well as the audit committee’s administration of the engagement of the independent auditor. The SEC’s rules establish two different approaches to pre-approving services, which the SEC considers to be equally valid. Proposed services either: may be pre-approved without consideration of specific case-by-case services by the Audit Committee (“general pre-approval”); or require the specific pre-approval of the Audit Committee or its delegate (“specific pre-approval”). The Audit Committee believes that the combination of these two approaches in this Policy will result in an effective and efficient procedure to pre-approve services performed by the Independent Auditors. As set forth in this Policy, unless a type of service has received general pre-approval, it will require specific pre-approval by the Audit Committee (or by any member of the Audit Committee to which pre-approval authority has been delegated) if it is to be provided by the Independent Auditors. Any proposed services exceeding
(1) This Audit Committee Audit and Non-Audit Services Pre-Approval Policy and Procedures (the “Policy”), adopted as of the date above, supersedes and replaces all prior versions that may have been adopted from time to time.
pre-approved cost levels or budgeted amounts will also require specific pre-approval by the Audit Committee.
The appendices to this Policy describe the Audit, Audit-related, Tax and All Other services that have the general pre-approval of the Audit Committee. The term of any general pre-approval is 12 months from the date of pre-approval, unless the Audit Committee considers and provides a different period and states otherwise. The Audit Committee will annually review and pre-approve the services that may be provided by the Independent Auditors without obtaining specific pre-approval from the Audit Committee. The Audit Committee will add to or subtract from the list of general pre-approved services from time to time, based on subsequent determinations.
The purpose of this Policy is to set forth the policy and procedures by which the Audit Committee intends to fulfill its responsibilities. It does not delegate the Audit Committee’s responsibilities to pre-approve services performed by the Independent Auditors to management.
The Fund’s Independent Auditors have reviewed this Policy and believes that implementation of the Policy will not adversely affect the Independent Auditors’ independence.
2. Delegation
As provided in the Act and the SEC’s rules, the Audit Committee may delegate either type of pre-approval authority to one or more of its members. The member to whom such authority is delegated must report, for informational purposes only, any pre-approval decisions to the Audit Committee at its next scheduled meeting.
3. Audit Services
The annual Audit services engagement terms and fees are subject to the specific pre-approval of the Audit Committee. Audit services include the annual financial statement audit and other procedures required to be performed by the Independent Auditors to be able to form an opinion on the Fund’s financial statements. These other procedures include information systems and procedural reviews and testing performed in order to understand and place reliance on the systems of internal control, and consultations relating to the audit. The Audit Committee will approve, if necessary, any changes in terms, conditions and fees resulting from changes in audit scope, Fund structure or other items.
In addition to the annual Audit services engagement approved by the Audit Committee, the Audit Committee may grant general pre-approval to other Audit services, which are those services that only the Independent Auditors reasonably can provide. Other Audit services may include statutory audits and services associated with SEC registration statements (on Forms N-1A, N-2, N-3, N-4, etc.), periodic reports and other documents filed with the SEC or other documents issued in connection with securities offerings.
The Audit Committee has pre-approved the Audit services in Appendix B.1. All other Audit services not listed in Appendix B.1 must be specifically pre-approved by the Audit Committee (or by any member of the Audit Committee to which pre-approval has been delegated).
4. Audit-related Services
Audit-related services are assurance and related services that are reasonably related to the performance of the audit or review of the Fund’s financial statements and, to the extent they are Covered Services, the Covered Entities or that are traditionally performed by the Independent Auditors. Because the Audit Committee believes that the provision of Audit-related services does not impair the independence of the auditor and is consistent with the SEC’s rules on auditor independence, the Audit Committee may grant general pre-approval to Audit-related services. Audit-related services include, among others, accounting consultations related to accounting, financial reporting or disclosure matters not classified as “Audit services”; assistance with understanding and implementing new accounting and financial reporting guidance from rulemaking authorities; agreed-upon or expanded audit procedures related to accounting and/or billing records required to respond to or comply with financial, accounting or regulatory reporting matters; and assistance with internal control reporting requirements under Forms N-SAR and/or N-CSR.
The Audit Committee has pre-approved the Audit-related services in Appendix B.2. All other Audit-related services not listed in Appendix B.2 must be specifically pre-approved by the Audit Committee (or by any member of the Audit Committee to which pre-approval has been delegated).
5. Tax Services
The Audit Committee believes that the Independent Auditors can provide Tax services to the Fund and, to the extent they are Covered Services, the Covered Entities, such as tax compliance, tax planning and tax advice without impairing the auditor’s independence, and the SEC has stated that the Independent Auditors may provide such services.
Pursuant to the preceding paragraph, the Audit Committee has pre-approved the Tax Services in Appendix B.3. All Tax services in Appendix B.3 must be specifically pre-approved by the Audit Committee (or by any member of the Audit Committee to which pre-approval has been delegated).
6. All Other Services
The Audit Committee believes, based on the SEC’s rules prohibiting the Independent Auditors from providing specific non-audit services, that other types of non-audit services are permitted. Accordingly, the Audit Committee believes it may grant general pre-approval to those permissible non-audit services classified as All Other services that it believes are routine and recurring services, would not impair the independence of the auditor and are consistent with the SEC’s rules on auditor independence.
The Audit Committee has pre-approved the All Other services in Appendix B.4. Permissible All Other services not listed in Appendix B.4 must be specifically pre-approved by the Audit Committee (or by any member of the Audit Committee to which pre-approval has been delegated).
7. Pre-Approval Fee Levels or Budgeted Amounts
Pre-approval fee levels or budgeted amounts for all services to be provided by the Independent Auditors will be established annually by the Audit Committee. Any proposed services exceeding these levels or amounts will require specific pre-approval by the Audit Committee. The Audit Committee is mindful of the overall relationship of fees for audit and non-audit services in determining whether to pre-approve any such services.
8. Procedures
All requests or applications for services to be provided by the Independent Auditors that do not require specific approval by the Audit Committee will be submitted to the Fund’s Chief Financial Officer and must include a detailed description of the services to be rendered. The Fund’s Chief Financial Officer will determine whether such services are included within the list of services that have received the general pre-approval of the Audit Committee. The Audit Committee will be informed on a timely basis of any such services rendered by the Independent Auditors. Requests or applications to provide services that require specific approval by the Audit Committee will be submitted to the Audit Committee by both the Independent Auditors and the Fund’s Chief Financial Officer, and must include a joint statement as to whether, in their view, the request or application is consistent with the SEC’s rules on auditor independence.
The Audit Committee has designated the Fund’s Chief Financial Officer to monitor the performance of all services provided by the Independent Auditors and to determine whether such services are in compliance with this Policy. The Fund’s Chief Financial Officer will report to the Audit Committee on a periodic basis on the results of its monitoring. Both the Fund’s Chief Financial Officer and management will immediately report to the chairman of the Audit Committee any breach of this Policy that comes to the attention of the Fund’s Chief Financial Officer or any member of management.
9. Additional Requirements
The Audit Committee has determined to take additional measures on an annual basis to meet its responsibility to oversee the work of the Independent Auditors and to assure the auditor’s independence from the Fund, such as reviewing a formal written statement from the Independent Auditors delineating all relationships between the Independent Auditors and the Fund, consistent with Independence Standards Board No. 1, and discussing with the Independent Auditors its methods and procedures for ensuring independence.
10. Covered Entities
Covered Entities include the Fund’s investment adviser(s) and any entity controlling, controlled by or under common control with the Fund’s investment adviser(s) that provides ongoing services to the Fund(s). Beginning with non-audit service contracts entered into on or after May 6, 2003, the Fund’s audit committee must pre-approve non-audit services provided not only to the Fund but also to the Covered Entities if the engagements relate directly to the operations and financial reporting of the Fund. This list of Covered Entities would include:
Morgan Stanley Retail Funds
Morgan Stanley Investment Advisors Inc.
Morgan Stanley & Co. Incorporated
Morgan Stanley DW Inc.
Morgan Stanley Investment Management Inc.
Morgan Stanley Investment Management Limited
Morgan Stanley Investment Management Private Limited
Morgan Stanley Asset & Investment Trust Management Co., Limited
Morgan Stanley Investment Management Company
Van Kampen Asset Management
Morgan Stanley Services Company, Inc.
Morgan Stanley Distributors Inc.
Morgan Stanley Trust FSB
Morgan Stanley Institutional Funds
Morgan Stanley Investment Management Inc.
Morgan Stanley Investment Advisors Inc.
Morgan Stanley Investment Management Limited
Morgan Stanley Investment Management Private Limited
Morgan Stanley Asset & Investment Trust Management Co., Limited
Morgan Stanley Investment Management Company
Morgan Stanley & Co. Incorporated
Morgan Stanley Distribution, Inc.
Morgan Stanley AIP GP LP
Morgan Stanley Alternative Investment Partners LP
(e)(2) Beginning with non-audit service contracts entered into on or after May 6, 2003, the audit committee also is required to pre-approve services to Covered Entities to the extent that the services are determined to have a direct impact on the operations or financial reporting of the Registrant. 100% of such services were pre-approved by the audit committee pursuant to the Audit Committee’s pre-approval policies and procedures (attached hereto).
(f) Not applicable.
(g) See table above.
(h) The audit committee of the Board of Trustees/Directors has considered whether the provision of services other than audit services performed by the auditors to the Registrant and Covered Entities is compatible with maintaining the auditors’ independence in performing audit services.
Item 5. Audit Committee of Listed Registrants.
(a) The Fund has a separately-designated standing audit committee established in accordance with Section 3(a)(58)(A) of the Exchange Act whose members are: Michael Bozic, Edwin J. Garn, Wayne E. Hedien, Manual H. Johnson, Joseph J. Kearns, Michael Nugent and Fergus Reid.
(b) Not applicable.
Item 6. Schedule of Investments
Refer to Item 1.
Item 7. Disclosure of Proxy Voting Policies and Procedures for Closed-End Management Investment Companies.
Applicable only to reports filed by closed-end funds.
Item 8. Portfolio Managers of Closed-End Management Investment Companies
Applicable only to reports filed by closed-end funds.
Item 9. Closed-End Fund Repurchases
Applicable only to reports filed by closed-end funds.
Item 10. Submission of Matters to a Vote of Security Holders
Not applicable.
Item 11. Controls and Procedures
(a) The Fund’s principal executive officer and principal financial officer have concluded that the Fund’s disclosure controls and procedures are sufficient to ensure that information required to be disclosed by the Fund in this Form N-CSR was recorded, processed, summarized and reported within the time periods specified in the Securities and Exchange Commission’s rules and forms, based upon such officers’ evaluation of these controls and procedures as of a date within 90 days of the filing date of the report.
(b) There were no changes in the registrant’s internal control over financial reporting that occurred during the registrant’s most recent fiscal half-year (the registrant’s second fiscal half-year in the case of an annual report) that has materially affected, or is reasonably likely to materially affect, the registrant’s internal control over financial reporting.
Item 12. Exhibits
(a) The Code of Ethics for Principal Executive and Senior Financial Officers is attached hereto.
(b) A separate certification for each principal executive officer and principal financial officer of the registrant are attached hereto as part of EX-99.CERT.
SIGNATURES
Pursuant to the requirements of the Securities Exchange Act of 1934 and the Investment Company Act of 1940, the registrant has duly caused this report to be signed on its behalf by the undersigned, thereunto duly authorized.
(Registrant) | Morgan Stanley Institutional Fund, Inc. | ||
| |||
By: | /s/ Ronald E. Robison | ||
Name: | Ronald E. Robison | ||
Title: | Principal Executive Officer | ||
Date: | February 9, 2006 | ||
Pursuant to the requirements of the Securities Exchange Act of 1934 and the Investment Company Act of 1940, this report has been signed by the following persons on behalf of the registrant and in the capacities and on the dates indicated.
By: | /s/ Ronald E. Robison | |
Name: | Ronald E. Robison | |
Title: | Principal Executive Officer | |
Date: | February 9, 2006 | |
By: | /s/ James W. Garrett | |
Name: | James W. Garrett | |
Title: | Principal Financial Officer | |
Date: | February 9, 2006 | |