UNITED STATES
SECURITIES AND EXCHANGE COMMISSION
Washington, D.C. 20549
FORM N-CSR
CERTIFIED SHAREHOLDER REPORT OF REGISTERED
MANAGEMENT INVESTMENT COMPANIES
Investment Company Act file number | 811-05624 |
|
Morgan Stanley Institutional Fund, Inc. |
(Exact name of registrant as specified in charter) |
|
522 Fifth Avenue New York, NY | | 10036 |
(Address of principal executive offices) | | (Zip code) |
|
Ronald E. Robison
522 Fifth Avenue New York, New York 10036 |
(Name and address of agent for service) |
|
Registrant’s telephone number, including area code: | 1-800-221-6726 | |
|
Date of fiscal year end: | 12/31 | |
|
Date of reporting period: | 12/31/07 | |
| | | | | | | | |
Form N-CSR is to be used by management investment companies to file reports with the Commission not later than 10 days after the transmission to stockholders of any report that is required to be transmitted to stockholders under Rule 30e-1 under the Investment Company Act of 1940 (17 CFR 270.30e-1). The Commission may use the information provided on Form N-CSR in its regulatory, disclosure review, inspection, and policymaking roles.
A registrant is required to disclose the information specified by Form N-CSR, and the Commission will make this information public. A registrant is not required to respond to the collection of information contained in Form N-CSR unless the Form displays a currently valid Office of Management and Budget (“OMB”) control number. Please direct comments concerning the accuracy of the information collection burden estimate and any suggestions for reducing the burden to Secretary, Securities and Exchange Commission, 450 Fifth Street, NW, Washington, DC 20549-0609. The OMB has reviewed this collection of information under the clearance requirements of 44 U.S.C. Section 3507.
ITEM 1. REPORTS TO STOCKHOLDERS.
The Fund’s annual report transmitted to shareholders pursuant to Rule 30e-1 under the Investment Company Act of 1940 is as follows:

| 2007 Annual Report |
|
December 31, 2007 |
Morgan Stanley Institutional Fund, Inc.
Global and International Equity Portfolios | U.S. Real Estate |
| U.S. Small/Mid Cap Value |
Active International Allocation | |
Emerging Markets | Fixed Income Portfolio |
Global Franchise | |
Global Real Estate | Emerging Markets Debt |
Global Value Equity | |
International Equity | |
International Growth Active Extension | |
International Growth Equity | |
International Magnum | |
International Real Estate | |
International Small Cap | |
| |
U.S. Equity Portfolios | |
| |
Disciplined Large Cap Value Active Extension | |
Focus Equity | |
Large Cap Relative Value | |
Small Company Growth | |
Systematic Active Large Cap Core | |
Systematic Active Small Cap Core | |
Systematic Active Small Cap Growth | |
Systematic Active Small Cap Value | |
Systematic Large Cap Core Active Extension | |
U.S. Large Cap Growth | |
| 2007 Annual Report |
| |
| December 31, 2007 |
Table of Contents
Shareholder’s Letter | 3 |
Performance Summary | 4 |
Investment Overview and Portfolios of Investments Global and International Equity Portfolios: | |
Active International Allocation | 6 |
Emerging Markets | 23 |
Global Franchise | 30 |
Global Real Estate | 34 |
Global Value Equity | 41 |
International Equity | 46 |
International Growth Active Extension | 52 |
International Growth Equity | 58 |
International Magnum | 63 |
International Real Estate | 70 |
International Small Cap | 76 |
U.S. Equity Portfolios: | |
Disciplined Large Cap Value Active Extension | 81 |
Focus Equity | 88 |
Large Cap Relative Value | 92 |
Small Company Growth | 97 |
Systematic Active Large Cap Core | 102 |
Systematic Active Small Cap Core | 109 |
Systematic Active Small Cap Growth | 118 |
Systematic Active Small Cap Value | 126 |
Systematic Large Cap Core Active Extension | 135 |
U.S. Large Cap Growth | 143 |
U.S. Real Estate | 147 |
U.S. Small/Mid Cap Value | 153 |
Fixed Income Portfolio: | |
Emerging Markets Debt | 158 |
Statements of Assets and Liabilities | 163 |
Statements of Operations | 175 |
Statements of Changes in Net Assets | 180 |
Statements of Cash Flows | 192 |
Financial Highlights | 193 |
Notes to Financial Statements | 218 |
Report of Independent Registered | |
Public Accounting Firm | 231 |
Federal Income Tax Information | 232 |
U.S. Privacy Policy | 234 |
Director and Officer Information | 236 |
This report is authorized for distribution only when preceded or accompanied by prospectuses of the Morgan Stanley Institutional Fund, Inc. To receive a prospectus and/or SAI, which contains more complete information such as investment objectives, charges, expenses, policies for voting proxies, risk considerations, and describes in detail each of the Portfolio’s investment policies to the prospective investor, please call 1-(800)-548-7786. Please read the prospectuses carefully before you invest or send money. Additionally, you can access portfolio information including performance, characteristics, and investment team commentary through Morgan Stanley Investment Management’s website: www.morganstanley.com/msim.
Market forecasts provided in this report may not necessarily come to pass. There is no guarrantee that any sectors mentioned will continue to perform as discussed herein or that securities in such sectors will be held by the Fund in the future. There is no assurance that a Fund will achieve its investment objective. Funds are subject to market risk, which is the possibility that market values of securities owned by the Fund will decline and, therefore, the value of the Fund’s shares may be less than what you paid for them. Accordingly, you can lose money investing in Funds. Please see the prospectus for more complete information on investment risks.
(This Page has been left blank intentionally.)
| 2007 Annual Report |
| |
| December 31, 2007 |
Shareholder’s Letter
Dear Shareholders:
We are pleased to present to you the Fund’s Annual Report for the year ended December 31, 2007. Our Fund currently offers 24 portfolios providing investors with a full array of global and domestic equity and fixed-income products. The Fund’s portfolios, together with the portfolios of the Morgan Stanley Institutional Fund Trust, provide investors with a means to help them meet specific investment needs and to allocate their investments among equities (e.g., value and growth; small, medium, and large capitalization) and fixed income (e.g., short, medium, and long duration; investment grade and high yield).
Sincerely,

Ronald E. Robison
President and Principal Executive Officer
January 2008
2007 Annual Report | |
| |
December 31, 2007 | |
Performance Summary
| | Inception Dates | | | | One Year
Total Return | | |
| | Class A | | Class B | | Class A | | Class B | | Comparable
Indices | |
Global and International Equity Portfolios: | | | | | | | | | | | | |
Active International Allocation | | 1/17/92 | | 1/2/96 | | 15.30 | % | 14.95 | % | 11.17 | % | (1) |
Emerging Markets | | 9/25/92 | | 1/2/96 | | 41.56 | | 41.20 | | 39.39 | | (2) |
Global Franchise | | 11/28/01 | | 11/28/01 | | 9.58 | | 9.26 | | 9.04 | | (3) |
Global Real Estate | | 8/30/06 | | 8/30/06 | | (7.87 | ) | (8.15 | ) | (7.06 | ) | (4) |
Global Value Equity | | 7/15/92 | | 1/2/96 | | 6.65 | | 6.37 | | 9.04 | | (3) |
International Equity | | 8/4/89 | | 1/2/96 | | 9.84 | | 9.52 | | 11.17 | | (1) |
International Growth Active Extension† | | 7/31/07 | | 7/31/07 | | — | | — | | — | | (1) |
International Growth Equity | | 12/27/05 | | 12/27/05 | | 15.22 | | 15.03 | | 11.17 | | (1) |
International Magnum | | 3/15/96 | | 3/15/96 | | 14.77 | | 14.47 | | 11.17 | | (1) |
International Real Estate | | 10/1/97 | | 10/1/97 | | (17.59 | ) | (17.76 | ) | (17.88 | ) | (5) |
International Small Cap | | 12/15/92 | | — | | (3.22 | ) | — | | 1.45 | | (6) |
U.S. Equity Portfolios: | | | | | | | | | | | | |
Disciplined Large Cap Value Active Extension†† | | 5/31/07 | | 5/31/07 | | — | | — | | — | | (7) |
Focus Equity | | 3/8/95 | | 1/2/96 | | 24.02 | | 23.70 | | 11.81 | | (8) |
Large Cap Relative Value | | 1/31/90 | | 1/2/96 | | 2.90 | | 2.72 | | (0.17 | ) | (7) |
Small Company Growth | | 11/1/89 | | 1/2/96 | | 3.04 | | 2.81 | | 7.05 | | (9) |
Systematic Active Large Cap Core | | 4/28/06 | | 4/28/06 | | 6.07 | | 5.81 | | 5.49 | | (10) |
Systematic Active Small Cap Core | | 4/28/06 | | 4/28/06 | | (8.35 | ) | (8.49 | ) | (1.57 | ) | (11) |
Systematic Active Small Cap Growth | | 4/28/06 | | 4/28/06 | | 0.82 | | 0.50 | | 7.05 | | (9) |
Systematic Active Small Cap Value | | 4/28/06 | | 4/28/06 | | (14.78 | ) | (15.03 | ) | (9.78 | ) | (12) |
Systematic Large Cap Core Active Extension†† | | 5/31/07 | | 5/31/07 | | — | | — | | — | | (10) |
U.S. Large Cap Growth | | 4/2/91 | | 1/2/96 | | 22.29 | | 21.93 | | 11.81 | | (8) |
U.S. Real Estate | | 2/24/95 | | 1/2/96 | | (16.63 | ) | (16.80 | ) | (15.69 | ) | (13) |
U.S. Small/Mid Cap Value††† | | 9/27/07 | | 9/27/07 | | — | | — | | — | | (14) |
Fixed Income Portfolio: | | | | | | | | | | | | |
Emerging Markets Debt | | 2/1/94 | | 1/2/96 | | 4.68 | | 4.29 | | 6.84 | | (15) |
† | Performance figures are cumulative since inception as the Portfolio commenced operations on July 31, 2007. |
| |
†† | Performance figures are cumulative since inception as the Portfolios commenced operations on May 31, 2007. |
| |
††† | Performance figures are cumulative since inception as the Portfolio commenced operations on September 27, 2007. |
| 2007 Annual Report |
| |
| December 31, 2007 |
Performance Summary (cont’d)
Five Year
Average Annual Total Return | | | | Ten Year
Average Annual Total Return | | | Since Inception
Average Annual Total Return | | |
Class A | | Class B | | Comparable
Indices | | | | | Class A | | Class B | | Comparable
Indices | | | | Class A | | Comparable
Indices -
Class A | | Class B | | Comparable
Indices -
Class B | | | |
20.75 | % | 20.40 | % | 21.59 | % | | (1) | | 9.14 | % | 8.88 | % | 8.66 | % | | (1) | 8.97 | % | 8.40 | % | 8.87 | % | 7.85 | % | | (1) |
38.26 | | 37.88 | | 37.02 | | | (2) | | 15.44 | | 15.13 | | 14.30 | | | (2) | 13.58 | | 12.35 | | 13.32 | | 11.12 | | | (2) |
16.76 | | 16.46 | | 16.96 | | | (3) | | — | | — | | — | | | (3) | 15.92 | | 9.97 | | 15.59 | | 9.97 | | | (3) |
— | | — | | — | | | (4) | | — | | — | | — | | | (4) | 5.91 | | 6.48 | | 5.60 | | 6.48 | | | (4) |
15.10 | | 14.81 | | 16.96 | | | (3) | | 7.38 | | 7.09 | | 7.00 | | | (3) | 11.69 | | 9.32 | | 9.55 | | 8.20 | | | (3) |
17.93 | | 17.63 | | 21.59 | | | (1) | | 11.57 | | 11.32 | | 8.66 | | | (1) | 11.86 | | 6.43 | | 12.09 | | 7.85 | | | (1) |
— | | — | | — | | | (1) | | — | | — | | — | | | (1) | 6.60 | | 1.89 | | 6.50 | | 1.89 | | | (1) |
— | | — | | — | | | (1) | | — | | — | | — | | | (1) | 20.85 | | 18.16 | | 20.55 | | 18.16 | | | (1) |
19.63 | | 19.27 | | 21.59 | | | (1) | | 7.54 | | 7.27 | | 8.66 | | | (1) | 7.66 | | 8.02 | | 7.37 | | 8.02 | | | (1) |
25.56 | | 25.26 | | 26.15 | | | (5) | | 15.46 | | 15.17 | | 14.84 | | | (5) | 14.51 | | 13.41 | | 14.23 | | 13.41 | | | (5) |
20.99 | | — | | 26.37 | | | (6) | | 12.79 | | — | | 11.11 | | | (6) | 12.82 | | 7.89 | | — | | — | | | (6) |
| | | | | | | | | | | | | | | | | | | | | | | | | | |
— | | — | | — | | | (7) | | — | | — | | — | | | (7) | (13.93 | ) | (8.22 | ) | (14.06 | ) | (8.22 | ) | | (7) |
15.98 | | 15.68 | | 12.11 | | | (8) | | 6.58 | | 6.33 | | 3.83 | | | (8) | 13.41 | | 9.03 | | 10.82 | | 7.27 | | | (8) |
14.70 | | 14.40 | | 14.63 | | | (7) | | 7.82 | | 7.56 | | 7.68 | | | (7) | 10.90 | | 12.03 | | 10.07 | | 10.81 | | | (7) |
17.59 | | 17.30 | | 16.50 | | | (9) | | 13.63 | | 13.34 | | 4.32 | | | (9) | 12.85 | | 7.65 | | 12.31 | | 5.57 | | | (9) |
— | | — | | — | | | (10) | | — | | — | | — | | | (10) | 8.35 | | 9.07 | | 8.09 | | 9.07 | | | (10) |
— | | — | | — | | | (11) | | — | | — | | — | | | (11) | (5.30 | ) | 1.35 | | (5.48 | ) | 1.35 | | | (11) |
— | | — | | — | | | (9) | | — | | — | | — | | | (9) | (0.83 | ) | 3.77 | | (1.09 | ) | 3.77 | | | (9) |
— | | — | | — | | | (12) | | — | | — | | — | | | (12) | (6.79 | ) | (1.26 | ) | (7.03 | ) | (1.26 | ) | | (12) |
— | | — | | — | | | (10) | | — | | — | | — | | | (10) | (4.09 | ) | (3.01 | ) | (4.20 | ) | (3.01 | ) | | (10) |
14.94 | | 14.65 | | 12.11 | | | (8) | | 6.13 | | 5.87 | | 3.83 | | | (8) | 11.17 | | 8.92 | | 9.62 | | 7.27 | | | (8) |
20.81 | | 20.51 | | 18.17 | | | (13) | | 12.18 | | 11.89 | | 10.49 | | | (13) | 16.09 | | 13.47 | | 15.10 | | 13.17 | | | (13) |
— | | — | | — | | | (14) | | — | | — | | — | | | (14) | (5.21 | ) | (7.58 | ) | (5.31 | ) | (7.58 | ) | | (14) |
| | | | | | | | | | | | | | | | | | | | | | | | | | |
13.22 | | 12.89 | | 12.79 | | | (15) | | 7.92 | | 7.64 | | 10.15 | | | (15) | 10.85 | | 10.62 | | 11.42 | | 12.09 | | | (15) |
Performance data quoted assumes that all dividends and distributions, if any, were reinvested and represents past performance, which is no guarantee of future results. Current performance may be lower or higher than the figures shown. For the most recent month-end performance figures, please visit www.morganstanley.com/msim or call 1-800-548-7786. Investment returns and principal value will fluctuate and fund shares, when redeemed, may be worth more or less than their original cost.
Indices:
(1) | | MSCI EAFE (Europe, Australasia, and Far East) |
(2) | | MSCI Emerging Markets Net |
(3) | | MSCI World |
(4) | | FTSE EPRA/NAREIT Global Real Estate (Net) |
(5) | | FTSE EPRA/NAREIT Global ex-North America Real Estate (80% Europe/20% Asia) |
(6) | | MSCI EAFE Small Cap Total Return |
(7) | | Russell 1000® Value |
(8) | | Russell 1000® Growth |
(9) | | Russell 2000® Growth |
(10) | | S&P 500® |
(11) | | Russell 2000® |
(12) | | Russell 2000® Value |
(13) | | FTSE NAREIT Equity REIT |
(14) | | Russell 2500® Value |
(15) | | J.P. Morgan EMBI Global Bond Index/J.P. Morgan GBI-EM Global Diversified Bond Index |
2007 Annual Report
December 31, 2007
Investment Overview (unaudited)
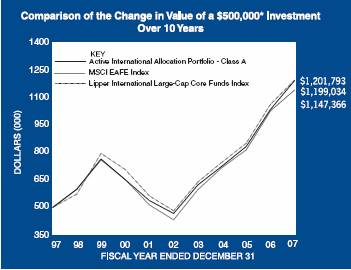
Active International Allocation Portfolio
* Minimum Investment
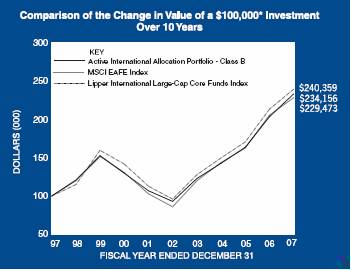
In accordance with SEC regulations, Portfolio’s performance shown assumes that all recurring fees (including management fees) were deducted and all dividends and distributions were reinvested. The performance of Class B shares will vary from the Class A shares based upon its different inception date and will be negatively impacted by additional fees assessed to this class.
Performance Compared to the Morgan Stanley Capital International (MSCI) EAFE Index(1) and the Lipper International Large-Cap Core Funds Index(2)
| | Total Returns(3) | |
| | | | Average Annual | |
| | One
Year | | Five
Years | | Ten
Years | | Since
Inception(6) | |
Portfolio – Class A (4) | | 15.30 | % | 20.75 | % | 9.14 | % | 8.97 | % |
MSCI EAFE Index | | 11.17 | | 21.59 | | 8.66 | | 8.40 | |
Lipper International Large-Cap | | | | | | | | | |
Core Funds Index | | 12.51 | | 20.03 | | 9.17 | | 10.01 | |
Portfolio – Class B (5) | | 14.95 | | 20.40 | | 8.88 | | 8.87 | |
MSCI EAFE Index | | 11.17 | | 21.59 | | 8.66 | | 7.85 | |
Lipper International Large-Cap | | | | | | | | | |
Core Funds Index | | 12.51 | | 20.03 | | 9.17 | | 9.60 | |
Performance data quoted represents past performance, which is no guarantee of future results, and current performance may be lower or higher than the figures shown. Performance assumes that all dividends and distributions, if any, were reinvested. For the most recent month-end performance figures, please visit www.morganstanley.com/msim. Investment return and principal value will fluctuate so that Portfolio shares, when redeemed, may be worth more or less than their original cost. Total returns do not reflect the deduction of taxes that a shareholder would pay on Portfolio distributions or the redemption of Portfolio shares.
(1) | The Morgan Stanley Capital International (MSCI) EAFE Index (Europe, Australasia, Far East) is a free float-adjusted market capitalization index that is designed to measure developed market equity performance, excluding the U.S. & Canada. The term “free float” represents the portion of shares outstanding that are deemed to be available for purchase in the public equity markets by investors. The MSCI EAFE Index consists of the following 21 developed market country indices: Australia, Austria, Belgium, Denmark, Finland, France, Germany, Greece, Hong Kong, Ireland, Italy, Japan, the Netherlands, New Zealand, Norway, Portugal, Singapore, Spain, Sweden, Switzerland and the United Kingdom. The Index is unmanaged and its returns do not include any sales charges or fees. Such costs would lower performance. It is not possible to invest directly in an index. |
(2) | The Lipper International Large-Cap Core Funds Index is an equally weighted performance index of the largest qualifying funds (based on net assets) in the Lipper International Large-Cap Core Funds classification. The Index, which is adjusted for capital gains distributions and income dividends, is unmanaged and should not be considered an investment. There are currently 30 funds represented in this Index. As of the date of this report, the Portfolio is in the Lipper International Large-Cap Core Funds classification. |
(3) | Total returns for the Portfolio reflect fees waived and expenses reimbursed, if applicable, by the Adviser. Without such waivers and reimbursements, total returns would have been lower. Fee waivers and/or expense reimbursements are voluntary and the Adviser reserves the right to commence or terminate any waiver and/or reimbursement at any time. |
(4) | Commenced operations on January 17, 1992 |
(5) | Commenced operations on January 2, 1996 |
(6) | For comparative purposes, average annual since inception returns listed for the Indexes refer to the inception date or initial offering of the respective share class of the Portfolio, not the inception of the Index. |
The Active International Allocation Portfolio (the “Portfolio”) seeks long-term capital appreciation by investing primarily, in accordance with country and sector weightings determined by the Adviser, in equity securities of non-U.S. issuers which, in the aggregate, attempt to replicate broad market indices.
6
2007 Annual Report
December 31, 2007
Investment Overview (cont’d)
Active International Allocation Portfolio
Foreign investing involves certain risks, including currency fluctuations and controls, restrictions on foreign investments, less governmental supervision and regulation, less liquidity and the potential for market volatility and political instability. The risks of investing in emerging-market countries are greater than the risks generally associated with foreign investments.
Performance
For the year ended December 31, 2007, the Portfolio had a total return based on net asset value and reinvestment of distributions per share of 15.30%, net of fees, for Class A shares and 14.95%, net of fees, for Class B shares. The Portfolio’s Class A and Class B shares outperformed against their benchmark, the Morgan Stanley Capital International (MSCI) EAFE Index (the “Index”) which returned 11.17%.
Factors Affecting Performance
· | For the 12-month period ended December 31, 2007, the Index returned 11.17% in U.S. dollar terms and 3.5% in local currency terms. Asia ex-Japan (up 30.7% in U.S. dollar terms) led performance, followed by Europe ex-U.K. (up 16.7%). Japan (down 4.2%) was the only major market with a negative return during the period, and the U.S. market had a modestly positive gain (up 5.4%). The emerging markets again outperformed the developed regions, appreciating 39.4%. All major currencies gained against the U.S. dollar, with the Australian dollar and Euro rising 11.4% and 10.9%, respectively. The Japanese yen showed greater strength in the second half of the year, to finish the year up 6.7% versus the U.S. dollar. The British pound rose a modest 1.7% relative to the U.S. dollar. |
· | In the U.S., consensus estimates for fourth quarter gross domestic product (GDP) now average around 1.1%, and we expect the estimates to continue falling, given the broad-based weakening across the U.S. economy and with the housing sector especially fragile. New housing starts fell to a cycle low that has not been seen since 1995, and house prices continued to decline. The Institute of Supply Management (ISM) Manufacturing survey fell to 47.7, indicating falling manufacturing output. Job creation also stalled in December, although November’s non-farm payroll figure was revised upward. More worrisome was the increase in the unemployment rate to 5%, but its magnitude may have been partially influenced by a five-year revision to the base figure. Inflationary pressures remained elevated at year end. However, inflation is a lagging indicator, and we believe it should not be a problem if the U.S. enters a recession. |
· | European economic growth (excluding the U.K.) generally deteriorated as the year progressed, but ticked upward at year end. Inflationary pressures mounted due to energy and food price increases, and given these strong inflation readings, the European Central Bank (ECB) remained hawkish going into the new year. European financials are feeling the negative impact of the U.S. subprime problems and credit slump – but Europe only experienced pockets of housing overinvestment (notably in Ireland and Spain). The U.K. housing sector has been an issue – not due to overinvestment, but rather because of sharp price rises from greater demand than supply. House prices are falling again there, as is the pound sterling. This is negative in the medium term, but a weaker currency and looser monetary and fiscal conditions could set up the U.K. economy nicely for a rebound by second half of 2008. |
· | The Japanese economy was weak overall during the year. Housing starts have recovered from their lows and construction expectations are moving up. While real income growth is flat to down, Japan’s unemployment rate fell again and headline inflation rose. We believe this should be a positive for Japan, but caution is warranted as core inflation is still negative. Japanese equities were the worst performing major market in the year, although the yen has rebounded from its previous lows. We believe relative equity valuations have been getting more and more compelling here. |
· | The Portfolio’s returns were aided by the allocations to Germany, Hong Kong, Singapore and the emerging markets. The Portfolio was underweight financials throughout the year, which was additive to performance. However, underexposure to Australia and the U.K. detracted from performance, as did the above- Index allocation to Japan earlier in the year. |
Management Strategies
· | Global equities faced increasing headwinds in the fourth quarter of 2007, which continue to buffet markets in early 2008. The subprime mortgage crisis clearly spread to other areas of the financial markets (prime mortgages, asset backed paper, other collateralized debt obligations, and equity financings) and mindboggling write-offs were announced by many firms. The authorities have responded, but with less conviction than the markets crave – and credit spreads have remained wide. |
· | Heated discussion continues as to whether or not the U.S. is in (or entering) a recession or in a mid-cycle slowdown. While seemingly pedantic, this is an important distinction. In general, a recession would mean rising unemployment, sharp earnings drops and a |
7
2007 Annual Report
December 31, 2007
Investment Overview (cont’d)
Active International Allocation Portfolio
| negative global stock market bias. In this scenario, the emerging markets would correct. A mid-cycle slowdown, on the other hand, would bring sideways employment and mildly negative to flat earnings, followed by economic resurgence and global equities moving decisively up out of their multi-month trading range. |
· | While we remain in the mid-cycle slowdown camp, we are admittedly worried by recent poor stock market action, continued financial distress, falling earnings and poor economic numbers. Positive offsets to this are good corporate and consumer balance sheets/wealth, still- decent disposable income growth, and very low real bond yields combined with (hopefully more) prospective rate cuts. |
· | We have positioned the Portfolio more defensively, as we have been doing for the past couple of quarters. We trimmed our emerging market and cyclical positions, have added some to defensive sectors and have raised cash to about 5% of the Portfolio. With the exception of global financial and retailing sectors, we do not think a significant slowdown has been priced in. We remain watchful. |
Expense Examples
As a shareholder of the Portfolio, you may incur two types of costs: (1) transactional costs, including redemption fees; (2) ongoing costs, including management fees, shareholder servicing fees (in the case of Class B); and other Portfolio expenses. These examples are intended to help you understand your ongoing costs (in dollars) of investing in the Portfolio and to compare these costs with the ongoing costs of investing in other mutual funds.
The examples are based on an investment of $1,000 invested at the beginning of the six-month period ended December 31, 2007 and held for the entire six-month period.
Actual Expenses
The first line of the tables below provides information about actual account values and actual expenses. You may use the information in this line, together with the amount you invested, to estimate the expenses that you paid over the period. Simply divide your account value by $1,000 (for example, an $8,600 account value divided by $1,000 = 8.6), then multiply the result by the number in the first line under the heading entitled “Expenses Paid During Period” to estimate the expenses you paid on your account during this period.
Please note that “Expenses Paid During Period” are grossed up to reflect Portfolio expenses prior to the effect of Expense Offset (See Note E in the Notes to Financial Statements). Therefore, the annualized net expense ratios may differ from the ratio of the expenses to average net assets shown in the Financial Highlights.
Hypothetical Example for Comparison Purposes
The second line of the tables below provides information about hypothetical account values and hypothetical expenses based on the Portfolio’s actual expense ratio and an assumed rate of return of 5% per year before expenses, which is not the Portfolio’s actual return. The hypothetical account values and expenses may not be used to estimate the actual ending account balance or expenses you paid for the period. You may use this information to compare the ongoing costs of investing in the Portfolio and other funds. To do so, compare this 5% hypothetical example with the 5% hypothetical examples that appear in the shareholder reports of the other funds.
Please note that the expenses shown in the table are meant to highlight your ongoing costs only and do not reflect any transactional costs, such as redemption fees. Therefore, the second line of the table is useful in comparing ongoing costs only, and will not help you determine the relative total costs of owning different funds. In addition, if these transactional costs were included, your costs would have been higher.
| | Beginning
Account Value
July 1, 2007 | | Ending Account
Value
December 31,
2007 | | Expenses Paid
During Period*
July 1, 2007 —
December 31,
2007 | |
Class A | | | | | | | |
Actual | | $1,000.00 | | $1,020.60 | | $4.07 | |
Hypothetical (5% average annual return before expenses) | | 1,000.00 | | 1,021.17 | | 4.08 | |
| | | | | | | |
Class B | | | | | | | |
Actual | | 1,000.00 | | 1,018.80 | | 5.34 | |
Hypothetical (5% average annual return before expenses) | | 1,000.00 | | 1,019.91 | | 5.35 | |
* Expenses are equal to Class A and Class B annualized net expense ratios of 0.80% and 1.05%, respectively, multiplied by the average account value over the period, multiplied by 184/365 (to reflect the one-half year period).
8
2007 Annual Report
December 31, 2007
Investment Overview (cont’d)
Active International Allocation Portfolio
Graphic Presentation of Portfolio Holdings
The following graph depicts the Portfolio’s holdings by industry and/or security type, as a percentage of total investments.
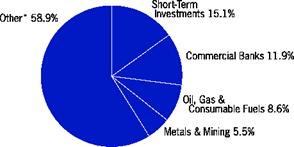
* Industries which do not appear in the above graph, as well as those which represent less than 5% of total investments, if applicable, are included in the category labeled “Other”.
9
2007 Annual Report
December 31, 2007
Portfolio of Investments
Active International Allocation Portfolio
| | | | Value | |
| | Shares | | (000) | |
Common Stocks (90.9%) | | | | | |
Australia (3.3%) | | | | | |
AGL Energy Ltd. | | 14,942 | | $ 174 | |
Alumina Ltd. | | 91,525 | | 507 | |
Amcor Ltd. | | 71,068 | | 430 | |
AMP Ltd. | | 42,736 | | 372 | |
Ansell Ltd. | | 5,679 | | 60 | |
Asciano Group | | (c)12,151 | | 74 | |
Australia & New Zealand Banking Group Ltd. | | (c)46,465 | | 1,114 | |
BHP Billiton Ltd. | | 249,722 | | 8,757 | |
BlueScope Steel Ltd. | | (c)62,766 | | 529 | |
Boral Ltd. | | 47,082 | | 252 | |
Brambles Ltd. | | 31,812 | | 321 | |
Caltex Australia Ltd. | | 29,853 | | 505 | |
Coca-Cola Amatil Ltd. | | 17,210 | | 143 | |
Commonwealth Bank of Australia | | (c)38,394 | | 1,983 | |
CSL Ltd. | | 8,526 | | 271 | |
CSR Ltd. | | (c)77,935 | | 212 | |
Fairfax Media Ltd. | | (c)32,240 | | 132 | |
Foster’s Group Ltd. | | 65,602 | | 377 | |
Insurance Australia Group Ltd. | | (c)54,613 | | 197 | |
James Hardie Industries N.V. | | 37,648 | | 212 | |
Leighton Holdings Ltd. | | (c)7,115 | | 379 | |
Lend Lease Corp., Ltd. | | 13,618 | | 206 | |
Macquarie Group Ltd. | | (c)6,715 | | 445 | |
Macquarie Infrastructure Group | | 74,866 | | 198 | |
National Australia Bank Ltd. | | 51,258 | | 1,691 | |
Newcrest Mining Ltd. | | 26,212 | | 755 | |
OneSteel Ltd. | | 44,821 | | 241 | |
Orica Ltd. | | 23,038 | | 640 | |
Origin Energy Ltd. | | 213,888 | | 1,657 | |
PaperlinX Ltd. | | 36,382 | | 85 | |
QBE Insurance Group Ltd. | | 22,311 | | 650 | |
Rio Tinto Ltd. | | (c)22,901 | | 2,674 | |
Santos Ltd. | | 157,070 | | 1,949 | |
Sonic Healthcare Ltd. | | 5,616 | | 82 | |
Stockland REIT | | 1,074 | | 8 | |
Suncorp-Metway Ltd. | | (c)17,718 | | 262 | |
Symbion Health Ltd. | | 28,935 | | 101 | |
TABCORP Holdings Ltd. | | 13,036 | | 169 | |
Telstra Corp., Ltd. | | 69,366 | | 285 | |
Toll Holdings Ltd. | | 12,293 | | 123 | |
Transurban Group | | (c)24,712 | | 148 | |
Wesfarmers Ltd., Class P | | (a)4,906 | | 175 | |
Wesfarmers Ltd. | | (c)12,365 | | 438 | |
Westpac Banking Corp. | | 54,298 | | 1,323 | |
Woodside Petroleum Ltd. | | 87,804 | | 3,862 | |
Woolworths Ltd. | | 33,517 | | 995 | |
| | | | 36,163 | |
Austria (0.8%) | | | | | |
Andritz AG | | 3,900 | | 234 | |
Boehler - Uddeholm AG | | 2,303 | | 232 | |
Erste Bank der Oesterreichischen Sparkassen AG | | 8,250 | | 586 | |
Flughafen Wien AG | | 1,465 | | 169 | |
IMMOFINANZ AG | | (c)36,096 | | 364 | |
Mayr-Melnhof Karton AG | | 1,194 | | $ 129 | |
Meinl European Land Ltd. | | (a)11,846 | | 164 | |
OMV AG | | 33,891 | | 2,727 | |
Raiffeisen International Bank Holding AG | | 5,402 | | 814 | |
Telekom Austria AG | | 50,283 | | 1,393 | |
Verbund-Oesterreichische Elektrizitaetswirtschafts AG, Class A | | 10,670 | | 743 | |
Voestalpine AG | | 10,008 | | 717 | |
Wiener Staedtische Allgemeine Versicherung AG | | 2,862 | | 230 | |
Wienerberger AG | | 7,967 | | 440 | |
| | | | 8,942 | |
Belgium (0.7%) | | | | | |
AGFA-Gevaert N.V. | | 4,251 | | 65 | |
Bekaert S.A. | | 539 | | 72 | |
Belgacom S.A. | | 7,474 | | 367 | |
Dexia S.A. | | 60,615 | | 1,523 | |
Fortis | | 68,182 | | 1,772 | |
InBev N.V. | | 16,863 | | 1,391 | |
KBC Group N.V. | | 8,355 | | 1,167 | |
Solvay S.A., Class A | | 3,603 | | 502 | |
UCB S.A. | | 6,548 | | 295 | |
Umicore | | 1,532 | | 378 | |
| | | | 7,532 | |
Brazil (1.8%) | | | | | |
All America Latina Logistica S.A. | | 86,400 | | 1,107 | |
Aracruz Celulose S.A., Class B (Preference) | | 16,145 | | 120 | |
Banco Bradesco S.A. (Preference) | | 32,725 | | 1,047 | |
Banco do Brasil S.A. | | 69,100 | | 1,165 | |
Banco Itau Holding Financeira S.A. (Preference) | | 63,527 | | 1,645 | |
Brasil Telecom Participacoes S.A. (Preference) | | 8,591 | | 128 | |
Centrias Eletricas Brasilieras, Class B (Preference) | | 8,147 | | 104 | |
Cia Brasileira de Distribuicao Grupo Pao de Acucar ADR (Preference) | | 500 | | 18 | |
Cia de Bebidas das Americas | | 2,415 | | 166 | |
Cia de Bebidas das Americas (Preference) | | 2,539 | | 181 | |
Cia Energetica de Minas Gerias (Preference) | | 10,763 | | 198 | |
Cia Siderurgica Nacional S.A. | | 2,976 | | 267 | |
Cia Vale do Rio Doce, Class A (Preference) | | 91,102 | | 2,554 | |
Contax Participacoes S.A. (Preference) | | 491 | | 14 | |
Cyrela Brazil Realty S.A. | | 42,900 | | 574 | |
Cyrela Commercial Properties S.A. Empreendimentos e Participacoes | | (a)8,580 | | 58 | |
Embratel Participacoes S.A. (Preference) | | 7,170,555 | | 27 | |
Empresa Brasileira de Aeronautica S.A. | | 19,596 | | 223 | |
Gerdau S.A. (Preference) | | 11,731 | | 340 | |
Gol Linhas Aereas Inteligentes S.A. ADR | | (c)39,200 | | 973 | |
Klabin S.A. (Preference) | | 26,365 | | 97 | |
Lojas Renner S.A. | | 29,100 | | 582 | |
Perdigao S.A. | | 41,900 | | 1,025 | |
Petroleo Brasileiro S.A. (Preference) | | 79,975 | | 3,864 | |
Sadia S.A. (Preference) | | 174,759 | | 998 | |
Souza Cruz S.A. | | 3,876 | | 104 | |
Tele Norte Leste Participacoes S.A. (Preference) | | 13,121 | | 253 | |
Unibanco Uniao de Bancos Brasileiros S.A. GDR | | (c)8,150 | | 1,138 | |
10 | The accompanying notes are an integral part of the financial statements. |
2007 Annual Report
December 31, 2007
Portfolio of Investments (cont’d)
Active International Allocation Portfolio
| | | | Value | |
| | Shares | | (000) | |
Brazil (cont’d) | | | | | |
Usiminas Siderurgicas de Minas Gerias S.A., Class A (Preference) | | 5,601 | | $ 253 | |
Vivo Participacoes S.A. (Preference) | | 15,829 | | 87 | |
Votorantim Celulose e Papel S.A. (Preference) | | 3,048 | | 91 | |
| | | | 19,401 | |
Colombia (0.1%) | | | | | |
BanColombia S.A. ADR | | (c)16,100 | | 548 | |
Denmark (0.6%) | | | | | |
AP Moller - Maersk A/S | | 74 | | 784 | |
Danske Bank A/S | | 46,745 | | 1,812 | |
DSV A/S | | 11,750 | | 255 | |
GN Store Nord | | (a)67,329 | | 526 | |
Novo-Nordisk A/S, Class B | | 28,460 | | 1,858 | |
Novozymes A/S, Class B | | 2,864 | | 323 | |
Vestas Wind Systems A/S | | (a)10,650 | | 1,139 | |
| | | | 6,697 | |
Finland (1.5%) | | | | | |
Cargotec Corp., Class B | | (c)2,604 | | 120 | |
Fortum Oyj | | 16,886 | | 756 | |
Kesko Oyj, Class B | | 5,410 | | 297 | |
Kone Oyj, Class B | | (c)5,208 | | 362 | |
Metso Oyj | | (c)20,949 | | 1,130 | |
Neste Oil Oyj | | (c)8,252 | | 289 | |
Nokia Oyj | | 267,836 | | 10,313 | |
Outokumpu Oyj | | (c)15,450 | | 471 | |
Rautaruukki Oyj | | 6,293 | | 268 | |
Sampo Oyj, Class A | | 21,019 | | 550 | |
Stora Enso Oyj, Class R | | 41,550 | | 617 | |
TietoEnator Oyj | | 12,781 | | 285 | |
UPM-Kymmene Oyj | | 36,167 | | 724 | |
Uponor Oyj | | 2,904 | | 72 | |
Wartsila Oyj, Class B | | 4,034 | | 305 | |
| | | | 16,559 | |
France (8.2%) | | | | | |
Accor S.A. | | 17,180 | | 1,363 | |
Air Liquide | | (c)17,786 | | 2,635 | |
Alcatel - Lucent | | 116,127 | | 844 | |
Alstom | | 21,368 | | 4,541 | |
ArcelorMittal | | 59,440 | | 4,570 | |
Arkema | | (a)2,887 | | 188 | |
Atos Origin S.A. | | (a)1,889 | | 97 | |
AXA S.A. | | 76,954 | | 3,064 | |
BNP Paribas | | 56,928 | | 6,119 | |
Bouygues | | 18,764 | | 1,556 | |
Business Objects S.A. | | (a)(c)5,580 | | 340 | |
Cap Gemini S.A. | | 15,920 | | 989 | |
Carrefour S.A. | | (c)31,579 | | 2,448 | |
Casino Guichard Perrachon S.A. | | 4,458 | | 485 | |
Cie de Saint - Gobain | | 18,247 | | 1,729 | |
Cie Generale d’Optique Essilor International S.A. | | 21,786 | | 1,387 | |
CNP Assurances | | 4,936 | | 640 | |
Compagnie Generale des Establissements Michelin, Class B | | (c)4,696 | | 538 | |
Credit Agricole S.A. | | (c)28,577 | | 959 | |
Dassault Systemes S.A. | | 5,148 | | $ 303 | |
European Aeronautic Defense & Space Co. N.V. | | (c)14,611 | | 464 | |
France Telecom S.A. | | (c)98,884 | | 3,549 | |
Gecina S.A. REIT | | 2,351 | | 369 | |
Groupe Danone | | (c)27,890 | | 2,492 | |
Hermes International | | 3,740 | | 476 | |
Imerys S.A. | | 2,205 | | 181 | |
Klepierre REIT | | 5,946 | | 302 | |
L’Oreal S.A. | | 12,076 | | 1,724 | |
Lafarge S.A. | | (c)15,530 | | 2,811 | |
Lagardere S.C.A. | | (c)8,523 | | 636 | |
LVMH Moet Hennessy Louis Vuitton S.A. | | (c)21,401 | | 2,572 | |
Neopost S.A. | | 3,273 | | 336 | |
Pernod-Ricard S.A. | | 1,304 | | 300 | |
Peugeot S.A. | | (c)5,348 | | 402 | |
PPR | | 2,823 | | 451 | |
Publicis Groupe | | (c)4,217 | | 164 | |
Renault S.A. | | (c)5,505 | | 772 | |
Safran S.A. | | (c)4,910 | | 100 | |
Sanofi-Aventis S.A. | | (c)56,814 | | 5,193 | |
Schneider Electric S.A. | | (c)20,308 | | 2,715 | |
Societe BIC S.A. | | 1,627 | | 116 | |
Societe Generale | | (c)23,415 | | 3,346 | |
Societe Television Francaise 1 | | 11,185 | | 298 | |
Sodexho Alliance S.A. | | (c)9,509 | | 583 | |
STMicroelectronics N.V. | | 49,380 | | 703 | |
Suez S.A. | | (c)31,273 | | 2,120 | |
Suez S.A. | | 2,940 | | 198 | |
Technip S.A. | | 7,405 | | 586 | |
Thales S.A. | | 6,720 | | 398 | |
Thomson | | 10,855 | | 153 | |
Total S.A. | | (c)159,524 | | 13,239 | |
Unibail-Rodamco REIT | | (c)2,618 | | 570 | |
Valeo S.A. | | 5,295 | | 217 | |
Vallourec | | 2,536 | | 683 | |
Veolia Environnement | | (c)34,946 | | 3,174 | |
Vinci S.A. | | (c)16,860 | | 1,239 | |
Vivendi | | 39,320 | | 1,792 | |
Zodiac S.A. | | (a)631 | | 40 | |
| | | | 90,259 | |
Germany (7.0%) | | | | | |
Adidas AG | | 16,450 | | 1,225 | |
Allianz SE (Registered) | | 21,656 | | 4,632 | |
Altana AG | | 3,752 | | 91 | |
Arcandor AG | | (a)4,851 | | 115 | |
BASF AG | | 27,879 | | 4,120 | |
Bayer AG | | 41,596 | | 3,793 | |
Beiersdorf AG | | 8,080 | | 624 | |
Celesio AG | | (c)6,488 | | 400 | |
Commerzbank AG | | 42,694 | | 1,616 | |
Continental AG | | 7,896 | | 1,024 | |
DaimlerChrysler AG | | 49,424 | | 4,787 | |
Deutsche Bank AG (Registered) | | 15,036 | | 1,945 | |
Deutsche Boerse AG | | (c)12,506 | | 2,468 | |
Deutsche Lufthansa AG (Registered) | | 13,860 | | 367 | |
Deutsche Post AG (Registered) | | 43,545 | | 1,488 | |
The accompanying notes are an integral part of the financial statements. | 11 |
2007 Annual Report
December 31, 2007
Portfolio of Investments (cont’d)
Active International Allocation Portfolio
| | | | Value | |
| | Shares | | (000) | |
Germany (cont’d) | | | | | |
Deutsche Postbank AG | | 3,517 | | $ 311 | |
Deutsche Telekom AG | | (c)191,355 | | 4,185 | |
E.ON AG | | 43,979 | | 9,338 | |
Fresenius Medical Care AG | | 15,577 | | 833 | |
Heidelberger Druckmaschinen AG | | (c)3,177 | | 106 | |
Henkel KGaA (Non-Voting Shares) | | 11,107 | | 623 | |
Hochtief AG | | 3,367 | | 448 | |
Hypo Real Estate Holding AG | | 13,469 | | 701 | |
Infineon Technologies AG | | (a)35,063 | | 410 | |
Linde AG | | 7,963 | | 1,049 | |
MAN AG | | 9,453 | | 1,555 | |
Merck KGaA | | 3,771 | | 484 | |
Metro AG | | 19,246 | | 1,606 | |
Muenchener Rueckversicherungs AG (Registered) | | 10,932 | | 2,113 | |
Porsche Automobil Holding SE (Non-Voting Shares) | | 900 | | 1,814 | |
Puma AG Rudolf Dassler Sport | | 768 | | 305 | |
Qiagen N.V. | | (a)(c)8,326 | | 179 | |
RWE AG | | (c)28,097 | | 3,937 | |
RWE AG (Non-Voting Shares) | | 2,201 | | 267 | |
SAP AG | | 106,235 | | 5,489 | |
Siemens AG (Registered) | | 48,828 | | 7,666 | |
Suedzucker AG | | (c)28,507 | | 671 | |
ThyssenKrupp AG | | 22,130 | | 1,235 | |
TUI AG | | (a)(c)12,933 | | 359 | |
Volkswagen AG | | 9,553 | | 2,173 | |
Volkswagen AG (Non-Voting Shares) | | 5,703 | | 828 | |
| | | | 77,380 | |
Greece (0.7%) | | | | | |
Alpha Bank A.E. | | 38,383 | | 1,401 | |
EFG Eurobank Ergasias S.A. | | 24,405 | | 862 | |
National Bank of Greece S.A. | | 42,490 | | 2,927 | |
OPAP S.A. | | 12,910 | | 515 | |
Piraeus Bank S.A. | | 37,600 | | 1,465 | |
Titan Cement Co., S.A. | | 3,950 | | 180 | |
| | | | 7,350 | |
Hong Kong (2.9%) | | | | | |
Agile Property Holdings Ltd. | | 291,280 | | 523 | |
Air China Ltd., Class H | | 131,000 | | 191 | |
Aluminum Corp. of China Ltd., Class H | | 132,000 | | 269 | |
Angang Steel Co. Ltd., Class H | | 6,000 | | 16 | |
Anhui Conch Cement Co., Ltd., Class H | | 2,000 | | 17 | |
Anhui Expressway Co., Class H | | 369,000 | | 341 | |
Bank of China Ltd., Class H | | (c)686,000 | | 327 | |
Bank of Communications Co., Ltd., Class H | | 452,000 | | 618 | |
Bank of East Asia Ltd. | | 73,263 | | 496 | |
BOC Hong Kong Holdings Ltd. | | 168,000 | | 464 | |
Cathay Pacific Airways Ltd. | | 48,000 | | 125 | |
Chaoda Modern Agriculture | | 170,100 | | 153 | |
Cheung Kong Holdings Ltd. | | 70,000 | | 1,276 | |
Cheung Kong Infrastructure Holdings Ltd. | | (c)26,000 | | 97 | |
China Communications Construction Co. Ltd., Class H | | 319,000 | | 823 | |
China Construction Bank, Class H | | 1,684,835 | | 1,413 | |
China Cosco Holdings Co. Ltd., Class H | | 115,450 | | $ 315 | |
China Infrastructure Machinery Holdings Ltd. | | 224,000 | | 352 | |
China Life Insurance Co., Ltd. | | 225,000 | | 1,145 | |
China Petroleum & Chemical Corp., Class H | | 528,000 | | 785 | |
China Resources Enterprise | | 102,000 | | 434 | |
China Resources Land Ltd. | | 145,000 | | 316 | |
China Shenhua Energy Co., Ltd. | | 106,500 | | 632 | |
China Shipping Development Co., Ltd., Class H | | 51,891 | | 135 | |
China Telecom Corp., Ltd., Class H | | 502,000 | | 392 | |
China Travel International Investment Hong Kong Ltd. | | 768,000 | | 499 | |
China Water Affairs Group Ltd. | | (a)(c)1,731,741 | | 1,062 | |
Chow Sang Sang Holdings | | 57,438 | | 99 | |
CLP Holdings Ltd. | | 78,811 | | 536 | |
COSCO Pacific Ltd. | | 152,000 | | 402 | |
Datang International Power Generation Co., Ltd., Class H | | 118,000 | | 103 | |
Dongfeng Motor Group Co., Ltd. | | 80,324 | | 56 | |
Esprit Holdings Ltd. | | 43,800 | | 644 | |
Guangdong Investment Ltd. | | 1,456,000 | | 819 | |
Guangzhou R&F Properties Co., Ltd., Class H | | 33,200 | | 117 | |
Hang Lung Properties Ltd. | | 234,500 | | 1,049 | |
Hang Seng Bank Ltd. | | (c32,600 | ) | 667 | |
Henderson Land Development Co., Ltd. | | 34,000 | | 315 | |
Hong Kong & China Gas Co., Ltd. | | 190,424 | | 580 | |
Hong Kong Exchanges & Clearing Ltd. | | 48,500 | | 1,364 | |
HongKong Electric Holdings Ltd. | | 63,500 | | 364 | |
Hopewell Highway Infrastructure Ltd. | | (c)343,231 | | 294 | |
Hopewell Holdings Ltd. | | 30,000 | | 138 | |
Huaneng Power International, Inc., Class H | | 130,000 | | 136 | |
Hutchison Telecommunications International, Ltd. | | (c)64,000 | | 96 | |
Hutchison Whampoa Ltd. | | 96,282 | | 1,083 | |
Hysan Development Co., Ltd. | | 31,732 | | 90 | |
Jiangxi Copper Co., Ltd., Class H | | 46,000 | | 112 | |
Johnson Electric Holdings Ltd. | | (c)73,063 | | 40 | |
Kerry Properties Ltd. | | 20,215 | | 161 | |
Kingboard Chemical Holdings Ltd. | | 32,000 | | 189 | |
Li & Fung Ltd. | | 235,757 | | 942 | |
Li Ning Co. Ltd. | | 94,000 | | 345 | |
Link REIT (The) | | 77,539 | | 168 | |
MTR Corp. | | 66,687 | | 243 | |
New World China Land Ltd. | | (c)271,600 | | 242 | |
New World Development Ltd. | | 109,563 | | 385 | |
NWS Holdings Ltd. | | 130,592 | | 414 | |
PCCW Ltd. | | 171,490 | | 101 | |
PetroChina Co., Ltd., Class H | | 496,000 | | 875 | |
Ping An Insurance Group Co. of China Ltd., Class H | | 41,000 | | 435 | |
Prime Success International Group Ltd. | | 321,200 | | 237 | |
Rexcapital Financial Holdings Ltd. | | (a)891,948 | | 169 | |
Shanghai Electric Group Co., Ltd., Class H | | 26,000 | | 22 | |
Shangri-La Asia Ltd. | | 48,636 | | 151 | |
Sino Land Co. | | 56,197 | | 197 | |
Sinofert Holdings Ltd. | | (c)916,000 | | 849 | |
Sinopec Shangai Petrochemical Co., Ltd., Class H | | 32,000 | | 20 | |
12 | The accompanying notes are an integral part of the financial statements. |
| 2007 Annual Report |
| |
| December 31, 2007 |
Portfolio of Investments (cont’d)
Active International Allocation Portfolio
| | | | Value | |
| | Shares | | (000) | |
Hong Kong (cont’d) | | | | | |
Sun Hung Kai Properties Ltd. | | 89,500 | | $ 1,883 | |
Swire Pacific Ltd., Class A | | 42,000 | | 575 | |
Techtronic Industries Co. | | 42,500 | | 42 | |
Television Broadcasts Ltd. | | 14,000 | | 84 | |
Wasion Meters Group Ltd. | | 186,379 | | 111 | |
Wharf Holdings Ltd. | | 56,662 | | 292 | |
Yanzhou Coal Mining Co., Ltd., Class H | | 72,000 | | 140 | |
Yue Yuen Industrial Holdings Ltd. | | (c)27,500 | | 98 | |
Zhejiang Expressway Co., Ltd. | | 18,000 | | 28 | |
Zijin Mining Group Co., Ltd. | | 123,500 | | 189 | |
| | | | 31,907 | |
India (1.5%) | | | | | |
ABB Ltd. | | 3,735 | | 143 | |
ACC Ltd. | | 1,409 | | 36 | |
Axis Bank Ltd. | | 5,400 | | 133 | |
Bajaj Auto Ltd. | | 1,485 | | 99 | |
Bharat Forge Ltd. | | 4,739 | | 42 | |
Bharat Heavy Electricals Ltd. | | 26,557 | | 1,734 | |
Bharti Airtel Ltd. | | (a)40,943 | | 1,029 | |
Cipla Ltd. | | 8,807 | | 47 | |
Dish TV India Ltd. | | (a)8,026 | | 21 | |
Dr. Reddy's Laboratories Ltd. | | 4,849 | | 90 | |
GAIL India Ltd. | | 12,345 | | 169 | |
GlaxoSmithKline Pharmaceuticals Ltd. | | 898 | | 23 | |
Glenmark Pharmaceuticals Ltd. | | 5,851 | | 88 | |
Grasim Industries Ltd. | | (d)1,671 | | 157 | |
HDFC Bank Ltd. | | 16,278 | | 710 | |
Hero Honda Motors Ltd. | | 3,953 | | 70 | |
Hindalco Industries Ltd. | | 25,800 | | 139 | |
Hindustan Lever Ltd. | | 39,177 | | 212 | |
Housing Development Finance Corp. | | 8,718 | | 631 | |
I-Flex Solutions Ltd. | | (a)867 | | 33 | |
ICICI Bank Ltd. | | 29,787 | | 932 | |
ICICI Bank Ltd. ADR | | (c)5,600 | | 344 | |
Infosys Technologies Ltd. | | 18,793 | | 839 | |
ITC Ltd. | | 52,100 | | 277 | |
IVRCL Infrastructures & Projects Ltd. | | 73,900 | | 1,039 | |
Larsen & Toubro Ltd. | | 4,922 | | 518 | |
Mahanagar Telephone Nigam Ltd. | | 9,050 | | 44 | |
Mahindra & Mahindra Ltd. | | 4,939 | | 108 | |
Maruti Suzuki India Ltd. | | 3,345 | | 84 | |
Oil & Natural Gas Corp., Ltd. | | 11,554 | | 360 | |
Ranbaxy Laboratories Ltd. | | 7,151 | | 77 | |
Reliance Communications Ltd. | | 61,700 | | 1,164 | |
Reliance Energy Ltd. | | 2,888 | | 156 | |
Reliance Industries Ltd. | | 30,673 | | 2,241 | |
Satyam Computer Services Ltd. | | 22,065 | | 252 | |
Sun Pharma Advanced Research Co., Ltd. | | (a)1,644 | | 7 | |
Sun Pharmaceutical Industries Ltd. | | 2,255 | | 69 | |
Tata Consultancy Services Ltd. | | 6,104 | | 166 | |
Tata Motors Ltd. | | 9,131 | | 171 | |
Tata Steel Ltd. | | (d)6,392 | | 153 | |
Unitech Ltd. | | 147,912 | | 1,828 | |
Wipro Ltd. | | 9,530 | | 127 | |
Wire and Wireless India Ltd. | | (a)3,588 | | 9 | |
Zee Entertainment Enterprises Ltd. | | 9,845 | | $ 82 | |
Zee News Ltd. | | (a)(d)3,244 | | 7 | |
| | | | 16,660 | |
Indonesia (0.5%) | | | | | |
Astra International Tbk PT | | 258,000 | | 743 | |
Bank Central Asia Tbk PT | | 1,960,500 | | 1,508 | |
Bank Mandiri Persero Tbk PT | | 856,500 | | 316 | |
Bank Rakyat Indonesia Tbk PT | | 536,500 | | 419 | |
Bumi Resources Tbk PT | | 1,867,500 | | 1,178 | |
United Tractors Tbk PT | | 1,323,000 | | 1,522 | |
| | | | 5,686 | |
Italy (1.2%) | | | | | |
Alleanza Assicurazioni S.p.A. | | 2,521 | | 32 | |
Assicurazioni Generali S.p.A. | | 66,961 | | 3,002 | |
Atlantia S.p.A. | | 3,681 | | 139 | |
Autogrill S.p.A. | | 1,797 | | 30 | |
Banca Monte dei Paschi di Siena S.p.A. | | (c)2,336 | | 12 | |
Banca Popolare di Milano Scarl | | 695 | | 9 | |
Banco Popolare Scarl | | (a)3,074 | | 68 | |
Benetton Group S.p.A. | | 456 | | 8 | |
Bulgari S.p.A. | | 24,753 | | 345 | |
Enel S.p.A. | | 9,815 | | 116 | |
ENI S.p.A. | | 60,164 | | 2,192 | |
Fiat S.p.A. | | 3,080 | | 79 | |
Finmeccanica S.p.A. | | 3,429 | | 109 | |
Intesa San Paolo S.p.A. | | 291,793 | | 2,289 | |
Intesa San Paolo S.p.A. RNC | | 2,270 | | 16 | |
Italcementi S.p.A. | | 370 | | 8 | |
Luxottica Group S.p.A. | | (c)1,328 | | 42 | |
Mediaset S.p.A. | | 7,072 | | 71 | |
Mediobanca S.p.A. | | 6,639 | | 136 | |
Mediolanum S.p.A. | | 611 | | 5 | |
Pirelli & C S.p.A. | | (a)27,686 | | 30 | |
Seat Pagine Gialle S.p.A. | | (c)13,264 | | 5 | |
Snam Rete Gas S.p.A. | | (c)1,548 | | 10 | |
Telecom Italia S.p.A., Class S | | 118,151 | | 366 | |
Telecom Italia S.p.A. RNC | | 67,652 | | 159 | |
Tiscali S.p.A. | | (a)(c)935 | | 3 | |
UniCredito Italiano S.p.A. | | 455,445 | | 3,791 | |
Unione di Banche Italiane SCPA | | 20,600 | | 567 | |
| | | | 13,639 | |
Japan (19.2%) | | | | | |
77 Bank Ltd. (The) | | 79,000 | | 493 | |
Acom Co., Ltd. | | 1,980 | | 40 | |
Advantest Corp. | | (c)18,190 | | 512 | |
Aeon Co., Ltd. | | 38,900 | | 568 | |
Aeon Credit Service Co., Ltd. | | (c)2,300 | | 34 | |
Aiful Corp. | | (c)1,750 | | 31 | |
Ajinomoto Co., Inc. | | 62,400 | | 706 | |
Alps Electric Co., Ltd. | | (c)13,900 | | 180 | |
Amada Co., Ltd. | | 25,000 | | 220 | |
Asahi Breweries Ltd. | | 18,900 | | 320 | |
Asahi Glass Co., Ltd. | | 108,800 | | 1,443 | |
Asahi Kasei Corp. | | (c)102,000 | | 680 | |
Asatsu - DK, Inc. | | (c)3,300 | | 92 | |
The accompanying notes are an integral part of the financial statements. | 13 |
2007 Annual Report |
| |
December 31, 2007 |
Portfolio of Investments (cont’d)
Active International Allocation Portfolio
| | | | Value | |
| | Shares | | (000) | |
Japan (cont’d) | | | | | |
Astellas Pharma, Inc. | | 39,700 | | $ 1,732 | |
Bank of Kyoto Ltd. (The) | | 26,000 | | 307 | |
Bank of Yokohama Ltd. (The) | | 180,000 | | 1,273 | |
Benesse Corp. | | 5,100 | | 217 | |
Bridgestone Corp. | | 77,400 | | 1,363 | |
Canon, Inc. | | 81,800 | | 3,737 | |
Casio Computer Co., Ltd. | | 33,300 | | 388 | |
Central Japan Railway Co. | | 128 | | 1,089 | |
Chiba Bank Ltd. (The) | | 75,000 | | 608 | |
Chiyoda Corp. | | (c)18,000 | | 206 | |
Chubu Electric Power Co., Inc. | | (c)41,900 | | 1,094 | |
Chugai Pharmaceutical Co., Ltd. | | 20,907 | | 299 | |
Citizen Holdings Co., Ltd. | | (c)28,400 | | 276 | |
Coca-Cola West Holdings Co., Ltd. | | (c)700 | | 16 | |
COMSYS Holdings Corp. | | 16,000 | | 131 | |
Credit Saison Co., Ltd. | | 4,600 | | 126 | |
CSK Holdings Corp. | | 6,200 | | 201 | |
Dai Nippon Printing Co., Ltd. | | 37,600 | | 548 | |
Daicel Chemical Industries Ltd. | | (c)13,000 | | 78 | |
Daiichi Sankyo Co., Ltd. | | 54,000 | | 1,659 | |
Daikin Industries Ltd. | | (c)15,700 | | 877 | |
Dainippon Ink & Chemicals, Inc. | | (c)54,000 | | 270 | |
Daito Trust Construction Co., Ltd. | | 14,000 | | 777 | |
Daiwa House Industry Co., Ltd. | | (c)72,600 | | 934 | |
Daiwa Securities Group, Inc. | | 144,000 | | 1,327 | |
Denki Kagaku Kogyo KK | | 36,000 | | 155 | |
Denso Corp. | | 55,550 | | 2,258 | |
Dowa Holdings Co., Ltd. | | 49,000 | | 345 | |
East Japan Railway Co. | | 314 | | 2,578 | |
Ebara Corp. | | (c)29,800 | | 102 | |
Eisai Co., Ltd. | | 18,602 | | 733 | |
FamilyMart Co., Ltd. | | 5,100 | | 159 | |
Fanuc Ltd. | | 16,400 | | 1,600 | |
Fast Retailing Co., Ltd. | | (a)(c)7,700 | | 548 | |
Fuji Electric Holdings Co., Ltd. | | (c)15,000 | | 52 | |
Fuji Soft, Inc. | | 3,000 | | 47 | |
Fuji Television Network, Inc. | | 31 | | 51 | |
FUJIFILM Holdings Corp. | | 38,900 | | 1,649 | |
Fujikura Ltd. | | 22,000 | | 112 | |
Fujitsu Ltd. | | 147,200 | | 985 | |
Fukuoka Financial Group, Inc. | | 105,000 | | 626 | |
Furukawa Electric Co., Ltd. | | 52,800 | | 204 | |
H2O Retailing Corp. | | (c)9,000 | | 70 | |
Hirose Electric Co., Ltd. | | (c)2,300 | | 266 | |
Hitachi Construction Machinery Co., Ltd. | | 2,700 | | 81 | |
Hitachi Ltd. | | (c)266,000 | | 1,949 | |
Hokkaido Electric Power Co., Inc. | | 8,400 | | 182 | |
Hokuhoku Financial Group, Inc. | | 202,000 | | 580 | |
Honda Motor Co., Ltd. | | 132,004 | | 4,364 | |
Hoya Corp. | | 32,900 | | 1,050 | |
Ibiden Co., Ltd. | | 9,700 | | 670 | |
IHI Corp. | | (c)92,000 | | 191 | |
Index Holdings, Inc. | | (c)94 | | 28 | |
Inpex Holdings, Inc. | | 39 | | 420 | |
Isetan Co., Ltd. | | (c)15,900 | | 215 | |
Ito En Ltd. | | (c)2,100 | | $ 40 | |
Ito En Ltd. (Preference) | | 630 | | 9 | |
Itochu Corp. | | 146,000 | | 1,419 | |
Itochu Techno - Solutions Corp. | | 2,500 | | 84 | |
J Front Retailing Co., Ltd. | | (a)33,000 | | 290 | |
Japan Airlines Corp. | | (a)(c)77,000 | | 175 | |
Japan Real Estate Investment Corp. REIT | | (c)69 | | 853 | |
Japan Retail Fund Investment Corp. REIT | | (c)64 | | 451 | |
Japan Tobacco, Inc. | | 332 | | 1,969 | |
JFE Holdings, Inc. | | 31,800 | | 1,602 | |
JGC Corp. | | 23,000 | | 395 | |
Joyo Bank Ltd. (The) | | 141,000 | | 786 | |
JS Group Corp. | | (c)21,700 | | 348 | |
JSR Corp. | | 12,800 | | 331 | |
Kajima Corp. | | 112,400 | | 368 | |
Kamigumi Co., Ltd. | | (c)1,000 | | 7 | |
Kaneka Corp. | | 21,000 | | 174 | |
Kansai Electric Power Co., Inc. (The) | | (c)59,800 | | 1,395 | |
Kao Corp. | | 50,000 | | 1,504 | |
Kawasaki Heavy Industries Ltd. | | 92,000 | | 271 | |
Kawasaki Kisen Kaisha Ltd. | | (c)5,000 | | 49 | |
Keihin Electric Express Railway Co., Ltd. | | (c)33,000 | | 202 | |
Keio Corp. | | 20,000 | | 121 | |
Keyence Corp. | | 2,900 | | 710 | |
Kikkoman Corp. | | (c)10,000 | | 138 | |
Kinden Corp. | | 1,000 | | 8 | |
Kintetsu Corp. | | (c)146,200 | | 453 | |
Kirin Brewery Co., Ltd. | | (c)47,400 | | 695 | |
Kobe Steel Ltd. | | 164,000 | | 532 | |
Kokuyo Co., Ltd. | | (c)5,700 | | 51 | |
Komatsu Ltd. | | 95,700 | | 2,588 | |
Konami Corp. | | 8,600 | | 281 | |
Konica Minolta Holdings, Inc. | | 36,500 | | 642 | |
Kubota Corp. | | 131,000 | | 897 | |
Kuraray Co., Ltd. | | 29,500 | | 356 | |
Kurita Water Industries Ltd. | | (c)19,900 | | 605 | |
Kyocera Corp. | | 13,000 | | 1,137 | |
Kyowa Hakko Kogyo Co., Ltd. | | (c)23,028 | | 245 | |
Kyushu Electric Power Co., Inc. | | 26,100 | | 643 | |
Lawson, Inc. | | 4,800 | | 170 | |
Leopalace21 Corp. | | 15,100 | | 405 | |
Mabuchi Motor Co., Ltd. | | 2,300 | | 139 | |
Marubeni Corp. | | 266,000 | | 1,868 | |
Marui Co., Ltd. | | (c)35,500 | | 351 | |
Matsui Securities Co., Ltd. | | (c)14,400 | | 113 | |
Matsushita Electric Industrial Co., Ltd. | | 175,000 | | 3,580 | |
Matsushita Electric Works Ltd. | | 27,000 | | 299 | |
Meiji Dairies Corp. | | (c)17,000 | | 87 | |
Meiji Seika Kaisha Ltd. | | (c)19,000 | | 81 | |
Meitec Corp. | | (c)2,300 | | 69 | |
Millea Holdings, Inc. | | 64,352 | | 2,175 | |
Minebea Co., Ltd. | | 32,000 | | 205 | |
Mitsubishi Chemical Holdings Corp. | | 75,000 | | 575 | |
Mitsubishi Corp. | | 129,800 | | 3,536 | |
Mitsubishi Electric Corp. | | 185,800 | | 1,919 | |
Mitsubishi Estate Co., Ltd. | | 139,000 | | 3,332 | |
14 | The accompanying notes are an integral part of the financial statements. |
| 2007 Annual Report |
| |
| December 31, 2007 |
Portfolio of Investments (cont’d)
Active International Allocation Portfolio
| | | | Value | |
| | Shares | | (000) | |
Japan (cont’d) | | | | | |
Mitsubishi Heavy Industries Ltd. | | 314,000 | | $ 1,344 | |
Mitsubishi Logistics Corp. | | (c)7,000 | | 79 | |
Mitsubishi Materials Corp. | | 160,000 | | 680 | |
Mitsubishi Rayon Co., Ltd. | | 42,000 | | 203 | |
Mitsubishi UFJ Financial Group, Inc. | | 848,380 | | 7,897 | |
Mitsui & Co., Ltd. | | 156,800 | | 3,327 | |
Mitsui Chemicals, Inc. | | 42,000 | | 275 | |
Mitsui Fudosan Co., Ltd. | | 99,400 | | 2,148 | |
Mitsui Mining & Smelting Co., Ltd. | | (c)95,000 | | 380 | |
Mitsui OSK Lines Ltd. | | (c)14,000 | | 178 | |
Mitsui Sumitomo Insurance Co., Ltd. | | 108,000 | | 1,054 | |
Mitsui Trust Holdings, Inc. | | 59,545 | | 462 | |
Mitsukoshi Ltd. | | (c)32,000 | | 145 | |
Mizuho Financial Group, Inc. | | 1,036 | | 4,915 | |
Murata Manufacturing Co., Ltd. | | 16,100 | | 936 | |
Namco Bandai Holdings, Inc. | | (c)2,400 | | 38 | |
NEC Corp. | | 159,400 | | 736 | |
NEC Electronics Corp. | | (a)(c)4,800 | | 115 | |
Net One Systems Co., Ltd. | | (c)50 | | 56 | |
NGK Insulators Ltd. | | (c)33,600 | | 907 | |
NGK Spark Plug Co., Ltd. | | (c)20,000 | | 349 | |
Nidec Corp. | | (c)8,600 | | 638 | |
Nikon Corp. | | (c)26,000 | | 887 | |
Nintendo Co., Ltd. | | 6,300 | | 3,825 | |
Nippon Building Fund, Inc. REIT | | 83 | | 1,162 | |
Nippon Electric Glass Co., Ltd. | | 24,500 | | 398 | |
Nippon Express Co., Ltd. | | 77,800 | | 398 | |
Nippon Meat Packers, Inc. | | 18,600 | | 187 | |
Nippon Mining Holdings, Inc. | | 43,000 | | 276 | |
Nippon Oil Corp. | | 133,800 | | 1,090 | |
Nippon Paper Group, Inc. | | 69 | | 207 | |
Nippon Sheet Glass Co., Ltd. | | (c)37,000 | | 186 | |
Nippon Steel Corp. | | (c)415,000 | | 2,556 | |
Nippon Telegraph & Telephone Corp. | | 243 | | 1,203 | |
Nippon Yusen KK | | 98,000 | | 780 | |
Nishi-Nippon Bank Ltd. (The) | | 55,000 | | 136 | |
Nissan Chemical Industries Ltd. | | 11,000 | | 143 | |
Nissan Motor Co., Ltd. | | 196,100 | | 2,123 | |
Nisshin Seifun Group, Inc. | | 12,500 | | 125 | |
Nisshinbo Industries, Inc. | | (c)6,000 | | 73 | |
Nissin Food Products Co., Ltd. | | (c)6,400 | | 207 | |
Nitto Denko Corp. | | 17,700 | | 935 | |
Nomura Holdings, Inc. | | 207,100 | | 3,462 | |
Nomura Research Institute Ltd. | | 10,900 | | 358 | |
NSK Ltd. | | (c)62,000 | | 644 | |
NTN Corp. | | 44,000 | | 381 | |
NTT Data Corp. | | (c)121 | | 539 | |
NTT DoCoMo, Inc. | | 331 | | 548 | |
Obayashi Corp. | | 76,000 | | 383 | |
Obic Co., Ltd. | | 710 | | 131 | |
OJI Paper Co., Ltd. | | (c)95,400 | | 468 | |
Oki Electric Industry Co., Ltd. | | (a)(c)44,000 | | 69 | |
Okumura Corp. | | (c)21,000 | | 101 | |
Olympus Corp. | | (c)11,000 | | 451 | |
Omron Corp. | | 17,800 | | 421 | |
Onward Kashiyama Co., Ltd. | | (c)17,000 | | $ 174 | |
Oracle Corp. Japan | | (c)2,900 | | 128 | |
Oriental Land Co., Ltd. | | (c)5,600 | | 338 | |
Osaka Gas Co., Ltd. | | 155,600 | | 613 | |
Pioneer Corp. | | (c)14,654 | | 132 | |
Promise Co., Ltd. | | (c)2,350 | | 58 | |
Resona Holdings, Inc. | | (c)504 | | 922 | |
Ricoh Co., Ltd. | | 52,000 | | 956 | |
Rohm Co., Ltd. | | 13,100 | | 1,140 | |
Sanken Electric Co., Ltd. | | (c)14,000 | | 74 | |
Sanyo Electric Co., Ltd. | | (a)146,000 | | 202 | |
Sapporo Holdings Ltd. | | (c)10,000 | | 80 | |
SBI E*Trade Securities Co., Ltd. | | (c)191 | | 180 | |
Secom Co., Ltd. | | 14,500 | | 794 | |
Seiko Epson Corp. | | (c)9,700 | | 211 | |
Sekisui Chemical Co., Ltd. | | (c)44,000 | | 297 | |
Sekisui House Ltd. | | (c)87,600 | | 949 | |
Seven & I Holdings Co., Ltd. | | 64,000 | | 1,861 | |
Sharp Corp. | | (c)72,200 | | 1,293 | |
Shimachu Co., Ltd. | | (c)5,500 | | 156 | |
Shimamura Co., Ltd. | | 2,100 | | 177 | |
Shimano, Inc. | | (c)8,600 | | 310 | |
Shimizu Corp. | | 80,600 | | 351 | |
Shin-Etsu Chemical Co., Ltd. | | 33,696 | | 2,107 | |
Shinko Securities Co., Ltd. | | 52,000 | | 216 | |
Shinsei Bank Ltd. | | (c)172,000 | | 632 | |
Shionogi & Co., Ltd. | | (c)22,000 | | 388 | |
Shiseido Co., Ltd. | | 31,000 | | 734 | |
Shizuoka Bank Ltd. (The) | | 64,000 | | 704 | |
Showa Denko KK | | 54,000 | | 194 | |
Showa Shell Sekiyu KK | | 14,500 | | 161 | |
SMC Corp. | | 5,700 | | 678 | |
Softbank Corp. | | (c)80,700 | | 1,661 | |
Sompo Japan Insurance, Inc. | | 73,000 | | 658 | |
Sony Corp. | | 61,597 | | 3,343 | |
Stanley Electric Co., Ltd. | | 6,000 | | 149 | |
Sumitomo Bakelite Co., Ltd. | | 11,000 | | 66 | |
Sumitomo Chemical Co., Ltd. | | 116,600 | | 1,037 | |
Sumitomo Corp. | | (c)95,100 | | 1,354 | |
Sumitomo Electric Industries Ltd. | | (c)59,400 | | 946 | |
Sumitomo Heavy Industries Ltd. | | (c)38,000 | | 349 | |
Sumitomo Metal Industries Ltd. | | 247,000 | | 1,141 | |
Sumitomo Metal Mining Co., Ltd. | | (c)89,800 | | 1,538 | |
Sumitomo Mitsui Financial Group, Inc. | | 496 | | 3,691 | |
Sumitomo Realty & Development Co., Ltd. | | (c)43,000 | | 1,058 | |
Sumitomo Trust & Banking Co., Ltd. (The) | | 138,000 | | 919 | |
T&D Holdings, Inc. | | 20,250 | | 1,048 | |
Taiheiyo Cement Corp. | | (c)53,000 | | 127 | |
Taisei Corp. | | (c)109,000 | | 294 | |
Taisho Pharmaceutical Co., Ltd. | | (c)1 1,441 | | 220 | |
Taiyo Yuden Co., Ltd. | | (c)7,000 | | 113 | |
Takara Holdings, Inc. | | (c)6,000 | | 36 | |
Takashimaya Co., Ltd. | | (c)32,000 | | 386 | |
Takeda Pharmaceutical Co., Ltd. | | 65,600 | | 3,835 | |
Takefuji Corp. | | (c)3,010 | | 72 | |
TDK Corp. | | 10,000 | | 742 | |
The accompanying notes are an integral part of the financial statements. | 15 |
2007 Annual Report |
| |
December 31, 2007 |
Portfolio of Investments (cont’d)
Active International Allocation Portfolio
| | | | Value | |
| | Shares | | (000) | |
Japan (cont’d) | | | | | |
Teijin Ltd. | | 73,400 | | $ 314 | |
Terumo Corp. | | 17,100 | | 901 | |
THK Co., Ltd. | | 3,400 | | 69 | |
TIS, Inc. | | (c)2,904 | | 50 | |
Tobu Railway Co., Ltd. | | (c)79,400 | | 371 | |
Toho Co., Ltd. | | (c)6,300 | | 141 | |
Tohoku Electric Power Co., Inc. | | 35,200 | | 793 | |
Tokyo Broadcasting System, Inc. | | 9,000 | | 193 | |
Tokyo Electric Power Co., Inc. (The) | | 87,400 | | 2,264 | |
Tokyo Electron Ltd. | | 19,900 | | 1,216 | |
Tokyo Gas Co., Ltd. | | (c)182,600 | | 853 | |
Tokyo Tatemono Co., Ltd. | | (c)33,000 | | 311 | |
Tokyu Corp. | | 88,400 | | 583 | |
TonenGeneral Sekiyu KK | | (c)29,000 | | 286 | |
Toppan Printing Co., Ltd. | | (c)36,600 | | 361 | |
Toray Industries, Inc. | | (c)102,100 | | 793 | |
Toshiba Corp. | | (c)272,000 | | 2,028 | |
Tosoh Corp. | | 40,000 | | 172 | |
Toto Ltd. | | (c)43,600 | | 344 | |
Toyo Seikan Kaisha Ltd. | | 16,400 | | 290 | |
Toyoba Co., Ltd. | | 5,000 | | 10 | |
Toyoda Gosei Co., Ltd. | | (c)800 | | 28 | |
Toyota Industries Corp. | | 8,150 | | 332 | |
Toyota Motor Corp. | | 213,400 | | 11,486 | |
Trend Micro, Inc. | | (a)9,200 | | 330 | |
Unicharm Corp. | | (c)3,400 | | 214 | |
Uniden Corp. | | (c)5,000 | | 29 | |
UNY Co., Ltd. | | 10,000 | | 85 | |
Ushio, Inc. | | (c)3,500 | | 77 | |
USS Co., Ltd. | | 2,700 | | 168 | |
Wacoal Holdings Corp. | | (c)6,000 | | 78 | |
West Japan Railway Co. | | 33 | | 163 | |
Yahoo! Japan Corp. | | 1,439 | | 642 | |
Yakult Honsha Co., Ltd. | | (c)8,700 | | 201 | |
Yamada Denki Co., Ltd. | | 9,620 | | 1,095 | |
Yamaha Corp. | | 8,800 | | 201 | |
Yamaha Motor Co., Ltd. | | 2,700 | | 65 | |
Yamato Holdings Co., Ltd. | | (c)23,000 | | 332 | |
Yamazaki Baking Co., Ltd. | | (c)8,000 | | 78 | |
Yokogawa Electric Corp. | | (c)16,900 | | 185 | |
| | | | 210,690 | |
Malaysia (0.2%) | | | | | |
IJM Corp. Bhd | | 303,900 | | 787 | |
IOI Corp. Bhd | | 267,300 | | 621 | |
Kuala Lumpur Kepong Bhd | | 60,800 | | 318 | |
| | | | 1,726 | |
Mexico (0.2%) | | | | | |
Corp. GEO S.A.B. de C.V. | | (a)91,400 | | 263 | |
Desarrolladora Homex S.A.B. de C.V. ADR | | (a)(c)8,600 | | 425 | |
Grupo Financiero Banorte S.A.B. de C.V., Class O | | 232,400 | | 961 | |
Urbi Desarrollos Urbanos S.A. de C.V. | | (a)46,400 | | 160 | |
Wal-Mart de Mexico S.A.B. de C.V., Class V | | 163,200 | | 569 | |
| | | | 2,378 | |
Netherlands (2.6%) | | | | | |
Aegon N.V. | | (c)140,227 | | $ 2,460 | |
Akzo Nobel N.V. | | 15,671 | | 1,248 | |
ASML Holding N.V. | | (a)30,941 | | 978 | |
Corio N.V. REIT | | 4,462 | | 359 | |
Fugro N.V. CVA | | 3,443 | | 264 | |
Hagemeyer N.V. | | (c)4,613 | | 31 | |
Heineken N.V. | | 66,985 | | 4,314 | |
ING Groep N.V. CVA | | 85,155 | | 3,324 | |
Koninklijke DSM N.V. | | 8,803 | | 412 | |
Koninklijke Philips Electronics N.V. | | 56,394 | | 2,444 | |
OCE N.V. | | 8,354 | | 150 | |
Reed Elsevier N.V. | | (c)39,386 | | 781 | |
Royal KPN N.V. | | 117,591 | | 2,127 | |
Royal Numico N.V. | | 9,003 | | 724 | |
SBM Offshore N.V. | | 8,260 | | 259 | |
TNT N.V. | | 59,756 | | 2,487 | |
Unilever N.V. CVA | | 148,457 | | 5,435 | |
Wereldhave N.V. REIT | | 1,818 | | 198 | |
Wolters Kluwer N.V. | | (c)21,906 | | 716 | |
| | | | 28,711 | |
New Zealand (0.0%) | | | | | |
Telecom Corp. of New Zealand Ltd. | | (c)19,672 | | 66 | |
Norway (1.7%) | | | | | |
Acergy S.A. | | (c)26,400 | | 582 | |
Aker Kvaerner ASA | | 37,660 | | 993 | |
DNB NOR ASA | | 24,024 | | 364 | |
Norsk Hydro ASA | | 55,145 | | 780 | |
Norske Skogindustrier ASA | | (c)12,100 | | 99 | |
Ocean Rig ASA | | (a)(c)13,600 | | 98 | |
Orkla ASA | | 52,500 | | 1,011 | |
Prosafe SE | | (c)23,040 | | 397 | |
Renewable Energy Corp. A/S | | (a)13,900 | | 695 | |
SeaDrill Ltd. | | (a)47,400 | | 1,141 | |
StatoilHydro ASA | | 269,546 | | 8,334 | |
Tandberg ASA | | 14,060 | | 290 | |
Telenor ASA | | (a)48,800 | | 1,154 | |
TGS Nopec Geophysical Co. ASA | | (a)(c)26,200 | | 356 | |
Yara International ASA | | (c)58,377 | | 2,681 | |
| | | | 18,975 | |
Philippines (0.6%) | | | | | |
Ayala Corp. | | 50,300 | | 680 | |
Ayala Land, Inc. | | 3,746,651 | | 1,294 | |
Banco de Oro - EPCI, Inc. | | 309,055 | | 449 | |
Bank of the Philippine Islands | | 438,860 | | 647 | |
Globe Telecom, Inc. | | 10,400 | | 395 | |
Manila Electric Co. | | 176,500 | | 349 | |
Megaworld Corp. | | 3,479,000 | | 316 | |
Metropolitan Bank and Trust | | 153,200 | | 202 | |
Philippines Long Distance Telephone Co. | | 19,370 | | 1,483 | |
PNOC Energy Development Corp. | | 2,359,550 | | 372 | |
SM Investments Corp. | | 56,710 | | 463 | |
SM Prime Holdings, Inc. | | 1,431,000 | | 352 | |
| | | | 7,002 | |
16 | The accompanying notes are an integral part of the financial statements. |
| 2007 Annual Report |
| |
| December 31, 2007 |
Portfolio of Investments (cont’d)
Active International Allocation Portfolio
| | | | Value | |
| | Shares | | (000) | |
Poland (0.6%) | | | | | |
Agora S.A. | | 5,609 | | $ 126 | |
Bank BPH S.A. | | 1,394 | | 59 | |
Bank Pekao S.A. | | 23,721 | | 2,168 | |
Bank Zachodni WBK S.A. | | 3,886 | | 393 | |
Grupa Kety S.A. | | 163 | | 10 | |
KGHM Polska Miedz S.A. | | 19,397 | | 826 | |
Polski Koncern Naftowy Orlen | | (a)45,510 | | 951 | |
Powszechna Kasa Oszczednosci Bank Polski S.A. | | 56,862 | | 1,217 | |
Prokom Software S.A. | | 1,723 | | 93 | |
Telekomunikacja Polska S.A. | | 105,261 | | 959 | |
| | | | 6,802 | |
Portugal (0.2%) | | | | | |
Banco Comercial Portugues S.A. (Registered) | | (c)121,871 | | 517 | |
Brisa — Auto Estradas de Portugal S.A. | | (c)23,604 | | 346 | |
Energias de Portugal S.A. | | 24,260 | | 158 | |
Portugal Telecom SGPS S.A. (Registered) | | 44,891 | | 583 | |
PT Multimedia Servicos de Telecomunicacoes e Multimedia SGPS S.A. | | 17,166 | | 239 | |
| | | | 1,843 | |
Russia (1.8%) | | | | | |
LUKOIL ADR | | (c)27,780 | | 2,385 | |
MMC Norilsk Nickel ADR | | 11,136 | | 2,993 | |
Mobile Telesystems OJSC ADR | | 15,600 | | 1,588 | |
Novolipetsk Steel OJSC GDR | | 11,500 | | 456 | |
OAO Gazprom ADR | | 74,960 | | 4,221 | |
OAO Gazprom ADR | | 16,337 | | 920 | |
OGK-5 Holding | | 298,628 | | 52 | |
Polyus Gold Co. ADR | | (c)9,300 | | 427 | |
Sberbank GDR | | (a)1,135 | | 621 | |
Severstal GDR | | 22,600 | | 514 | |
Surgutneftegaz ADR | | (c)12,800 | | 779 | |
Surgutneftegaz ADR (Preference) | | 6,200 | | 402 | |
Tatneft GDR | | 5,900 | | 708 | |
TGK-5 Holding | | 9,856,375 | | 9 | |
Unified Energy System GDR | | (a)7,250 | | 942 | |
Vimpel-Communications ADR | | 41,000 | | 1,706 | |
Wimm-Bill-Dann Foods OJSC ADR | | 5,600 | | 734 | |
| | | | 19,457 | |
Singapore (2.1%) | | | | | |
Ascendas REIT | | 158,000 | | 269 | |
CapitaLand Ltd. | | (c)193,000 | | 830 | |
CapitaMall Trust REIT | | 140,500 | | 334 | |
Chartered Semiconductor Manufacturing Ltd. | | (a)(c)227,000 | | 152 | |
City Developments Ltd. | | (c)85,719 | | 835 | |
ComfortDelgro Corp., Ltd. | | 304,477 | | 383 | |
Cosco Corp. Singapore Ltd. | | 132,000 | | 519 | |
Creative Technology Ltd. | | (c)13,267 | | 58 | |
DBS Group Holdings Ltd. | | 171,612 | | 2,432 | |
Fraser & Neave, Ltd. | | 204,000 | | 826 | |
Hyflux Ltd. | | (c)95,000 | | 209 | |
Jardine Cycle & Carriage Ltd. | | 27,034 | | 403 | |
K-REIT Asia | | 9,200 | | 14 | |
Keppel Corp. Ltd. | | 174,000 | | 1,558 | |
Keppel Land Ltd. | | 57,000 | | $ 287 | |
Neptune Orient Lines Ltd. | | (c)113,000 | | 304 | |
Olam International Ltd. | | 160,000 | | 314 | |
Oversea-Chinese Banking Corp. | | 387,712 | | 2,237 | |
Parkway Holdings Ltd. | | 100,000 | | 272 | |
Raffles Education Corp., Ltd. | | 26,431 | | 56 | |
SembCorp Industries Ltd. | | 133,183 | | 532 | |
SembCorp Marine Ltd. | | 126,000 | | 351 | |
Singapore Airlines Ltd. | | 84,000 | | 1,005 | |
Singapore Exchange Ltd. | | (c)123,539 | | 1,129 | |
Singapore Land Ltd. | | 37,000 | | 203 | |
Singapore Post Ltd. | | 243,000 | | 189 | |
Singapore Press Holdings Ltd. | | 244,028 | | 761 | |
Singapore Technologies Engineering Ltd. | | (c)214,296 | | 555 | |
Singapore Telecommunications Ltd. | | 1,127,015 | | 3,093 | |
United Overseas Bank Ltd. | | 178,389 | | 2,469 | |
UOL Group Ltd. | | 98,189 | | 306 | |
Venture Corp., Ltd. | | 41,444 | | 363 | |
| | | | 23,248 | |
South Korea (0.5%) | | | | | |
Daelim Industrial Co. | | (a)350 | | 66 | |
Daewoo Engineering & Construction Co., Ltd. | | (a)2,534 | | 66 | |
Daewoo Securities Co., Ltd. | | 3,700 | | 119 | |
Daewoo Shipbuilding & Marine Engineering Co., Ltd. | | (a)1,650 | | 91 | |
GS Engineering & Construction Corp. | | (a)640 | | 105 | |
Hana Financial Group, Inc. | | 1,570 | | 85 | |
Hyundai Development Co. | | (a)870 | | 85 | |
Hyundai Engineering & Construction Co., Ltd. | | (a)970 | | 90 | |
Hyundai Heavy Industries | | (a)470 | | 219 | |
Hyundai Mipo Dockyard | | (a)170 | | 51 | |
Hyundai Mobis | | (a)630 | | 58 | |
Hyundai Motor Co. | | (a)1,980 | | 151 | |
Hyundai Steel Co. | | (a)720 | | 60 | |
Kookmin Bank | | (a)3,450 | | 254 | |
Korea Electric Power Corp. | | (a)3,230 | | 136 | |
Korea Exchange Bank | | (a)7,990 | | 123 | |
KT Corp. | | 1,980 | | 103 | |
KT&G Corp. | | (a)1,490 | | 127 | |
LG Chem Ltd. | | (a)1,090 | | 104 | |
LG Electronics, Inc. | | (a)1,110 | | 117 | |
LG.Philips LCD Co., Ltd. | | (a)1,150 | | 61 | |
Lotte Shopping Co., Ltd. | | (a)200 | | 88 | |
NHN Corp. | | (a)565 | | 134 | |
POSCO | | 732 | | 443 | |
S-Oil Corp. | | 1,000 | | 84 | |
Samsung Corp. | | (a)2,090 | | 159 | |
Samsung Electro-Mechanics Co., Ltd. | | (a)1,060 | | 55 | |
Samsung Electronics Co., Ltd. | | 1,348 | | 792 | |
Samsung Electronics Co., Ltd. (Preference) | | 216 | | 98 | |
Samsung Engineering Co., Ltd. | | (a)640 | | 63 | |
Samsung Fire & Marine Insurance Co., Ltd. | | 490 | | 132 | |
Samsung Heavy Industries Co., Ltd. | | (a)2,580 | | 109 | |
Samsung Securities Co., Ltd. | | 1,620 | | 154 | |
Samsung Techwin Co., Ltd. | | (a)960 | | 42 | |
Shinhan Financial Group Co., Ltd. | | (a)3,930 | | 225 | |
The accompanying notes are an integral part of the financial statements. | 17 |
2007 Annual Report | |
| |
December 31, 2007 | |
Portfolio of Investments (cont’d)
Active International Allocation Portfolio
| | | | Value | |
| | Shares | | (000) | |
South Korea (cont’d) | | | | | |
Shinsegae Co., Ltd. | | (a)223 | | $ 172 | |
SK Holdings Co., Ltd. | | (a)280 | | 59 | |
SK Energy Co., Ltd. | | (a)770 | | 148 | |
| | | | 5,228 | |
Spain (2.8%) | | | | | |
Abertis Infraestructuras S.A. | | (c)22,215 | | 712 | |
Acerinox S.A. | | (c)13,440 | | 328 | |
Altadis S.A. | | 19,021 | | 1,382 | |
Antena 3 de Television S.A. | | (c)6,882 | | 105 | |
Banco Bilbao Vizcaya Argentaria S.A. | | 134,005 | | 3,291 | |
Banco Popular Espanol S.A. | | (c)37,309 | | 630 | |
Banco Santander S.A. | | 250,129 | | 5,404 | |
Cintra Concesiones de Infraestructuras de Transporte S.A. | | 10,671 | | 160 | |
Gamesa Corp. Tecnologica S.A. | | 12,793 | | 592 | |
Gas Natural SDG S.A. | | (c)21,191 | | 1,234 | |
Iberdrola S.A. | | 124,444 | | 1,884 | |
Inditex S.A. | | 11,867 | | 721 | |
Indra Sistemas S.A. | | 3,324 | | 89 | |
Metrovacesa S.A. | | 1,164 | | 139 | |
Repsol YPF S.A. | | 55,394 | | 1,975 | |
Sociedad General de Aguas de Barcelona S.A., Class A | | 4,072 | | 164 | |
Telefonica S.A. | | 364,822 | | 11,790 | |
Union Fenosa S.A. | | 3,021 | | 203 | |
| | | | 30,803 | |
Sweden (2.4%) | | | | | |
Alfa Laval AB | | 1,250 | | 70 | |
Assa Abloy AB, Class B | | (c)20,477 | | 407 | |
Atlas Copco AB, Class A | | 217,296 | | 3,208 | |
Atlas Copco AB, Class B | | 24,594 | | 332 | |
Ssab Svenskt Stal AB, Class A | | (c)12,150 | | 326 | |
Electrolux AB, Class B | | (c)12,800 | | 213 | |
Eniro AB | | 7,721 | | 69 | |
Fabege AB | | 5,031 | | 51 | |
Getinge AB, Class B | | (c)33,047 | | 883 | |
Hennes & Mauritz AB, Class B | | 20,050 | | 1,212 | |
Holmen AB, Class B | | (c)3,400 | | 125 | |
Husqvarna AB, Class A | | (c)3,839 | | 45 | |
Husqvarna AB, Class B | | 12,800 | | 151 | |
Modern Times Group AB, Class B | | (c)3,337 | | 233 | |
Nordea Bank AB | | 189,644 | | 3,146 | |
Sandvik AB | | 214,090 | | 3,639 | |
Scania AB, Class B | | 26,400 | | 624 | |
Securitas Systems AB, Class B | | (c)800 | | 3 | |
Securitas AB, Class B | | (c)800 | | 11 | |
Securitas Direct AB, Class B | | (a)800 | | 3 | |
Skandinaviska Enskilda Banken AB, Class A | | 31,616 | | 800 | |
Skanska AB, Class B | | 20,351 | | 380 | |
SKF AB, Class B | | (c)19,264 | | 323 | |
Svenska Cellulosa AB, Class B | | 38,766 | | 682 | |
Svenska Handelsbanken, Class A | | 53,011 | | 1,681 | |
Swedish Match AB | | 33,083 | | 787 | |
Tele2 AB, Class B | | 9,624 | | 191 | |
Telefonaktiebolaget LM Ericsson, Class B | | 1,351,959 | | 3,161 | |
TeliaSonera AB | | 100,987 | | $ 939 | |
Volvo AB, Class A | | 29,975 | | 494 | |
Volvo AB, Class B | | 145,025 | | 2,404 | |
Wihlborgs Fastigheter AB | | 1,320 | | 23 | |
| | | | 26,616 | |
Switzerland (5.7%) | | | | | |
ABB Ltd. ADR | | 47,500 | | 1,368 | |
ABB Ltd. (Registered) | | 121,224 | | 3,495 | |
Ciba Specialty Chemicals AG (Registered) | | 3,932 | | 181 | |
Clariant AG (Registered) | | (a)13,237 | | 122 | |
Compagnie Financiere Richemont S.A., Class A | | 73,421 | | 5,009 | |
Credit Suisse Group (Registered) | | 40,338 | | 2,425 | |
Geberit AG (Registered) | | 2,430 | | 331 | |
Givaudan S.A. (Registered) | | 412 | | 396 | |
Holcim Ltd. (Registered) | | 19,256 | | 2,046 | |
Kudelski S.A. | | 3,786 | | 74 | |
Kuehne & Nagel International AG (Registered) | | 1,755 | | 167 | |
Logitech International S.A. (Registered) | | (a)16,843 | | 612 | |
Lonza Group AG (Registered) | | 2,230 | | 268 | |
Micronas Semiconductor Holding AG (Registered) | | (a)2,362 | | 23 | |
Nestle S.A. (Registered) | | 32,318 | | 14,809 | |
Nobel Biocare Holding AG | | 5,853 | | 1,548 | |
Novartis AG (Registered) | | 131,617 | | 7,170 | |
OC Oerlikon Corp. AG (Registered) | | (a)461 | | 192 | |
Roche Holding AG (Genusschein) | | 39,567 | | 6,816 | |
Schindler Holding AG | | 4,210 | | 269 | |
Straumann Holding AG | | 2,665 | | 732 | |
Sulzer AG (Registered) | | 39 | | 57 | |
Swatch Group AG | | 3,443 | | 201 | |
Swatch Group AG, Class B | | 8,636 | | 2,589 | |
Swiss Reinsurance (Registered) | | 31,714 | | 2,225 | |
Swisscom AG (Registered) | | 1,337 | | 519 | |
Syngenta AG (Registered) | | 13,347 | | 3,387 | |
Synthes, Inc. | | 12,406 | | 1,533 | |
UBS AG (Registered) | | 60,249 | | 2,798 | |
Zurich Financial Services AG (Registered) | | 3,391 | | 998 | |
| | | | 62,360 | |
Thailand (0.1%) | | | | | |
Banpu Public Co., Ltd. | | 56,700 | | 663 | |
Turkey (1.4%) | | | | | |
Akbank T.A.S. | | 272,067 | | 2,012 | |
Aksigorta A.S. | | 45,067 | | 265 | |
Anadolu Efes Biracilik ve Malt Sanayii A.S. | | 62,863 | | 745 | |
Arcelik | | 35,471 | | 246 | |
Dogan Sirketler Grubu Holdings | | (a)145,912 | | 275 | |
Dogan Yayin Holding | | (a)67,770 | | 273 | |
Eregli Demir ve Celik Fabrikalari T.A.S. | | 106,473 | | 933 | |
Ford Otomotiv Sanayi A.S. | | 40,214 | | 414 | |
Haci Omer Sabanci Holding A.S. | | 128,900 | | 708 | |
KOC Holding A.S. | | (a)111,653 | | 603 | |
Migros Turk T.A.S. | | 26,508 | | 515 | |
Tupras-Turkie Petrol Rafinerileri A.S. | | 33,576 | | 979 | |
Turk Sise ve Cam Fabrikalari A.S. | | 126,329 | | 254 | |
Turkcell Iletisim Hizmetleri A.S. | | 139,323 | | 1,526 | |
18 | The accompanying notes are an integral part of the financial statements. |
| 2007 Annual Report |
| |
| December 31, 2007 |
Portfolio of Investments (cont’d)
Active International Allocation Portfolio
| | | | Value | |
| | Shares | | (000) | |
Turkey (cont’d) | | | | | |
Turkiye Garanti Bankasi A.S. | | 251,842 | | $ | 2,247 | |
Turkiye Is Bankasi, Class C | | 340,601 | | 2,127 | |
Turkiye Vakiflar Bankasi Tao, Class D | | 206,613 | | 727 | |
Yapi ve Kredi Bankasi A.S. | | (a)170,749 | | 599 | |
| | | | 15,448 | |
United Kingdom (18.0%) | | | | | |
3I Group plc | | 34,680 | | 689 | |
Aegis Group plc | | 45,188 | | 104 | |
Amec plc | | 15,693 | | 260 | |
Anglo American plc | | 125,180 | | 7,586 | |
ARM Holdings plc | | 97,286 | | 238 | |
Arriva plc | | 7,994 | | 125 | |
AstraZeneca plc | | 84,424 | | 3,628 | |
Aviva plc | | 216,574 | | 2,877 | |
BAE Systems plc | | 223,581 | | 2,190 | |
Balfour Beatty plc | | 33,319 | | 327 | |
Barclays plc | | 376,548 | | 3,814 | |
Barratt Developments plc | | 10,060 | | 92 | |
BBA Aviation plc | | 29,049 | | 118 | |
Berkeley Group Holdings plc | | (a)4,737 | | 128 | |
BG Group plc | | 230,050 | | 5,297 | |
BHP Billiton plc | | (c)201,134 | | 6,195 | |
Biffa plc | | 32,703 | | 214 | |
BP plc | | 1,258,197 | | 15,387 | |
British Airways plc | | (a)38,150 | | 233 | |
British American Tobacco plc | | 118,943 | | 4,684 | |
British Land Co. plc REIT | | 23,539 | | 439 | |
British Sky Broadcasting plc | | 98,100 | | 1,203 | |
BT Group plc | | 576,332 | | 3,110 | |
Bunzl plc | | 27,898 | | 391 | |
Burberry Group plc | | 48,823 | | 550 | |
Cadbury Schweppes plc | | 122,237 | | 1,524 | |
Capita Group plc | | 7,802 | | 109 | |
Carnival plc | | 13,876 | | 609 | |
Centrica plc | | 184,716 | | 1,313 | |
Close Brothers Group plc | | 16,573 | | 311 | |
Cobham plc | | 78,283 | | 324 | |
Compass Group plc | | 167,416 | | 1,021 | |
CSR plc | | (a)9,333 | | 111 | |
Daily Mail & General Trust, Class A | | 17,441 | | 171 | |
Diageo plc | | 226,477 | | 4,848 | |
DSG International plc | | 77,930 | | 152 | |
Electrocomponents plc | | 52,439 | | 216 | |
Emap plc | | 12,142 | | 221 | |
Enterprise Inns plc | | 56,558 | | 545 | |
Experian Group Ltd. | | 33,018 | | 262 | |
Fiberweb plc | | 17,302 | | 13 | |
Firstgroup plc | | 26,030 | | 420 | |
FKI plc | | 7,577 | | 9 | |
Friends Provident plc | | 165,978 | | 537 | |
Galiform plc | | (a)6,439 | | 12 | |
GKN plc | | 27,325 | | 152 | |
GlaxoSmithKline plc | | 317,025 | | 8,045 | |
Group 4 Securicor plc | | 13,896 | | 67 | |
Hammerson plc REIT | | 12,932 | | 263 | |
Hays plc | | 19,415 | | $ | 44 | |
HBOS plc | | 235,429 | | 3,414 | |
Home Retail Group plc | | 33,004 | | 212 | |
HSBC Holdings plc | | 598,012 | | 10,031 | |
ICAP plc | | 4,863 | | 70 | |
IMI plc | | 30,958 | | 240 | |
Imperial Tobacco Group plc | | 54,520 | | 2,968 | |
Intercontinental Hotels Group plc | | 27,651 | | 483 | |
International Personal Finance plc | | 3,113 | | 12 | |
International Power plc | | 17,046 | | 153 | |
Invensys plc | | (a)13,017 | | 58 | |
ITV plc | | 338,573 | | 572 | |
J. Sainsbury plc | | 82,787 | | 697 | |
Johnson Matthey plc | | 27,266 | | 1,015 | |
Kelda Group plc | | 28,714 | | 618 | |
Kesa Electricals plc | | 11,073 | | 51 | |
Kingfisher plc | | 47,091 | | 136 | |
Ladbrokes plc | | 45,479 | | 290 | |
Land Securities Group plc REIT | | 21,050 | | 626 | |
Legal & General Group plc | | 558,854 | | 1,446 | |
Liberty International plc REIT | | 11,276 | | 240 | |
Lloyds TSB Group plc | | 397,316 | | 3,705 | |
LogicaCMG plc | | 68,948 | | 161 | |
London Stock Exchange plc | | 2,799 | | 110 | |
Man Group plc | | 113,077 | | 1,301 | |
Marks & Spencer Group plc | | 67,228 | | 745 | |
Meggitt plc | | 35,372 | | 233 | |
Misys plc | | 35,640 | | 130 | |
Mitchells & Butlers plc | | 37,375 | | 313 | |
Mondi Ltd. | | 15,516 | | 148 | |
Mondi plc | | 38,791 | | 325 | |
National Express Group plc | | 8,059 | | 197 | |
National Grid plc | | 208,740 | | 3,451 | |
Next plc | | 10,558 | | 339 | |
Pearson plc | | 44,419 | | 645 | |
Persimmon plc | | 11,329 | | 180 | |
Provident Financial plc | | 1,556 | | 26 | |
Prudential plc | | 159,993 | | 2,249 | |
Punch Taverns plc | | 20,050 | | 303 | |
Reckitt Benckiser Group plc | | 68,984 | | 3,985 | |
Reed Elsevier plc | | 70,114 | | 943 | |
Rentokil Initial plc | | 22,066 | | 53 | |
Resolution plc | | 2,420 | | 34 | |
Reuters Group plc | | 82,342 | | 1,039 | |
Rexam plc | | 35,525 | | 294 | |
Rio Tinto plc | | 93,712 | | 9,818 | |
Rolls-Royce Group plc | | (a)119,190 | | 1,288 | |
Rolls-Royce Group plc, Class B | | 4,816,671 | | 11 | |
Royal Bank of Scotland Group plc | | 581,112 | | 5,224 | |
Royal Dutch Shell plc, Class A | | 256,322 | | 10,798 | |
Royal Dutch Shell plc, Class B | | 179,108 | | 7,491 | |
SABMiller plc | | 74,348 | | 2,092 | |
Sage Group plc | | 116,443 | | 530 | |
Schroders plc | | 4,749 | | 122 | |
Scottish & Newcastle plc | | 16,660 | | 245 | |
Scottish & Southern Energy plc | | 65,754 | | 2,136 | |
The accompanying notes are an integral part of the financial statements. | 19 |
2007 Annual Report | |
| |
December 31, 2007 | |
Portfolio of Investments (cont’d)
Active International Allocation Portfolio
| | | | Value |
| | Shares | | (000) |
United Kingdom (cont’d) | | | | |
Segro plc REIT | | 17,100 | | $ 159 |
Serco Group plc | | 5,648 | | 52 |
Severn Trent plc | | 21,832 | | 660 |
Signet Group plc | | 62,585 | | 86 |
Smith & Nephew plc | | 149,103 | | 1,714 |
Smiths Group plc | | 25,847 | | 518 |
Stagecoach Group plc | | 20,194 | | 113 |
Tate & Lyle plc | | 42,628 | | 374 |
Taylor Wimpey plc | | 47,484 | | 190 |
Tesco plc | | 465,421 | | 4,395 |
TI Automotive Ltd., Class A | | (a)(d)(l)1,505 | | — |
Tomkins plc | | 66,611 | | 235 |
Unilever plc | | 80,414 | | 3,016 |
United Business Media plc | | 14,172 | | 182 |
United Utilities plc | | 15,318 | | 229 |
Vodafone Group plc | | 3,578,860 | | 13,338 |
Whitbread plc | | 15,655 | | 434 |
William Hill plc | | 32,757 | | 340 |
Wolseley plc | | 39,504 | | 579 |
WPP Group plc | | 134,008 | | 1,716 |
Xstrata plc | | 62,671 | | 4,413 |
Yell Group plc | | 35,425 | | 281 |
| | | | 198,198 |
Total Common Stocks (Cost $744,823) | | | | 998,937 |
| | | | |
| | No. of | | |
| | Rights | | |
Right (0.0%) | | | | |
Japan (0.0%) | | | | |
Dowa Mining Co., Ltd., expiring 1/29/10 (Cost $@—) | | (a)49,000 | | @— |
| | | | |
| | Face | | |
| | Amount | | |
| | (000) | | |
Short-Term Investments (16.2%) | | | | |
Short-Term Debt Securities held as Collateral on Loaned Securities (9.7%) | | | | |
Alliance & Leicester plc, | | | | |
5.26%, 9/2/08 | | $ (h)3,187 | | 3,187 |
Bancaja, | | | | |
5.35%, 8/12/08 | | 1,593 | | 1,593 |
Bank of New York Co., Inc., | | | | |
5.24%, 8/8/08 | | (h)1,593 | | 1,593 |
BASF AG, | | | | |
5.18%, 8/19/08 | | (h)1,593 | | 1,593 |
BNP Paribas plc, | | | | |
4.90%, 5/19/08 | | (h)3,187 | | 3,187 |
CAM US Finance S.A. Unipersonal, | | | | |
5.24%, 7/25/08 | | (h)6,372 | | 6,372 |
Canadian Imperial Bank of Commerce, New York, | | | | |
4.42%, 7/28/08 | | (h)3,187 | | 3,187 |
CC USA, Inc., | | | | |
3.89%, 1/28/08 | | (h)1,593 | | 1,593 |
CIT Group Holdings, | | | | |
5.23%, 6/18/08 | | $ (h)5,736 | | $ 5,736 |
Citigroup Global Markets Holdings, Inc., | | | | |
4.51%, 1/2/08 | | 21,722 | | 21,722 |
Credit Suisse First Boston, New York, | | | | |
4.32%, 3/14/08 | | (h)3,187 | | 3,187 |
First Tennessee Bank, | | | | |
5.05%, 8/15/08 | | (h)1,593 | | 1,593 |
5.06%, 8/15/08 | | (h)6,373 | | 6,373 |
Goldman Sachs Group, Inc., | | | | |
4.62%, 2/13/09 | | (h)2,995 | | 2,995 |
5.10%, 9/12/08 | | (h)1,593 | | 1,593 |
HSBC Finance Corp., | | | | |
5.26%, 8/5/08 | | (h)1,593 | | 1,593 |
IBM Corp., | | | | |
5.27%, 9/8/08 | | (h)6,373 | | 6,373 |
Lehman Brothers, Inc., | | | | |
4.49%, 1/2/08 | | 2,717 | | 2,717 |
Macquarie Bank Ltd., | | | | |
4.95%, 8/20/08 | | (h)3,187 | | 3,187 |
Metropolitan Life Global Funding, | | | | |
4.89%, 8/21/08 | | (h)4,780 | | 4,780 |
National Bank of Canada, | | | | |
5.21%, 4/2/08 | | (h)6,372 | | 6,372 |
National Rural Utilities Cooperative Finance Corp., | | | | |
5.24%, 9/2/08 | | (h)6,372 | | 6,372 |
Nationwide Building Society, | | | | |
4.92%, 7/28/08 | | (h)3,696 | | 3,696 |
Unicredito Italiano Bank (Ireland) plc, | | | | |
5.04%, 8/14/08 | | (h)3,505 | | 3,505 |
5.26%, 8/8/08 | | (h)2,231 | | 2,231 |
| | | | 106,330 |
| | | | |
| | Shares | | |
Investment Company (6.5%) | | | | |
Morgan Stanley Institutional Liquidity Money Market Portfolio — Institutional Class | | (o)71,487,516 | | 71,488 |
Total Short-Term Investments (Cost $177,818) | | | | 177,818 |
Total Investments (107.1%) (Cost $922,641) — including $101,774 of Securities Loaned | | | | (v)1,176,755 |
Liabilities in Excess of Other Assets (-7.1%) | | | | (77,735) |
Net Assets (100%) | | | | $1,099,020 |
(a) | Non-income producing security. |
(c) | All or a portion of security on loan at December 31, 2007. |
(d) | Securities were valued at fair value — At December 31, 2007, the Portfolio held approximately $317,000 of fair valued securities, representing less than 0.05% of net assets. |
(h) | Variable/Floating Rate Security — Interest rate changes on these instruments are based on changes in a designated base rate. The rates shown are those in effect on December 31, 2007. |
(l) | Security has been deemed illiquid at December 31, 2007. |
20 | The accompanying notes are an integral part of the financial statements. |
| 2007 Annual Report |
| |
| December 31, 2007 |
Portfolio of Investments (cont’d)
Active International Allocation Portfolio
(o) | | See Note F within the Notes to Financial Statements regarding investment in Morgan Stanley Institutional Liquidity Money Market Portfolio — Institutional Class. |
(v) | | The approximate market value and percentage of the investments, $986,524,000 and 83.8%, respectively, represent the securities that have been fair valued under the fair valuation policy for international investments as described in Note A within the Notes to Financial Statements. |
ADR | | American Depositary Receipt |
CVA | | Certificaten Van Aandelen |
GDR | | Global Depositary Receipt |
REIT | | Real Estate Investment Trust |
RNC | | Non-Convertible Savings Shares |
@ | | Value is less than $500. |
Foreign Currency Exchange Contract Information:
The Portfolio had the following foreign currency exchange contract(s) open at period end:
Currency
to
Deliver
(000) | | Value
(000) | | Settlement
Date | | In
Exchange
For
(000) | | Value
(000) | | Net
Unrealized
Appreciation
(Depreciation)
(000) | |
EUR | 72 | | $ | 105 | | | 1/2/08 | | USD | 105 | | $ | 105 | | | $ @— | | |
EUR | 191 | | | 279 | | | 1/2/08 | | USD | 279 | | | 279 | | | @— | | |
EUR | 448 | | | 655 | | | 1/3/08 | | USD | 655 | | | 655 | | | @— | | |
EUR | 2,544 | | | 3,723 | | | 3/13/08 | | USD | 3,743 | | | 3,743 | | | 20 | | |
EUR | 7,089 | | | 10,371 | | | 3/13/08 | | USD | 10,425 | | | 10,425 | | | 54 | | |
GBP | 38 | | | 76 | | | 1/2/08 | | USD | 76 | | | 76 | | | @— | | |
GBP | 13 | | | 25 | | | 3/13/08 | | USD | 26 | | | 26 | | | 1 | | |
GBP | 2,285 | | | 4,541 | | | 3/13/08 | | USD | 4,645 | | | 4,645 | | | 104 | | |
GBP | 1,221 | | | 2,426 | | | 3/13/08 | | USD | 2,483 | | | 2,483 | | | 57 | | |
HKD | 81 | | | 10 | | | 1/2/08 | | USD | 10 | | | 10 | | | @— | | |
HKD | 254,210 | | | 32,688 | | | 3/13/08 | | USD | 32,712 | | | 32,712 | | | 24 | | |
JPY | 8,324,831 | | | 75,091 | | | 3/13/08 | | USD | 75,204 | | | 75,204 | | | 113 | | |
JPY | 394,749 | | | 3,561 | | | 3/13/08 | | USD | 3,568 | | | 3,568 | | | 7 | | |
JPY | 742,833 | | | 6,700 | | | 3/13/08 | | USD | 6,716 | | | 6,716 | | | 16 | | |
JPY | 1,706,290 | | | 15,391 | | | 3/13/08 | | USD | 15,040 | | | 15,040 | | | (351 | ) | |
SEK | 4,258 | | | 659 | | | 3/13/08 | | USD | 665 | | | 665 | | | 6 | | |
SGD | 12 | | | 8 | | | 1/2/08 | | USD | 8 | | | 8 | | | @— | | |
USD | 24,212 | | | 24,212 | | | 3/13/08 | | AUD | 27,420 | | | 23,975 | | | (237 | ) | |
USD | 10,456 | | | 10,456 | | | 3/13/08 | | EUR | 7,108 | | | 10,400 | | | (56 | ) | |
USD | 14,896 | | | 14,896 | | | 3/13/08 | | EUR | 10,126 | | | 14,815 | | | (81 | ) | |
USD | 15,077 | | | 15,077 | | | 3/13/08 | | EUR | 10,247 | | | 14,992 | | | (85 | ) | |
USD | 19,474 | | | 19,474 | | | 3/13/08 | | EUR | 13,245 | | | 19,379 | | | (95 | ) | |
USD | 6,735 | | | 6,735 | | | 3/13/08 | | EUR | 4,579 | | | 6,699 | | | (36 | ) | |
USD | 40,107 | | | 40,107 | | | 3/13/08 | | EUR | 27,815 | | | 40,695 | | | 588 | | |
USD | 5,954 | | | 5,954 | | | 3/13/08 | | EUR | 4,047 | | | 5,920 | | | (34 | ) | |
USD | 1,128 | | | 1,128 | | | 3/13/08 | | GBP | 555 | | | 1,103 | | | (25 | ) | |
USD | 16,634 | | | 16,634 | | | 3/13/08 | | GBP | 8,186 | | | 16,265 | | | (369 | ) | |
USD | 3,333 | | | 3,333 | | | 3/13/08 | | GBP | 1,640 | | | 3,258 | | | (75 | ) | |
USD | 3,065 | | | 3,065 | | | 3/13/08 | | HKD | 23,820 | | | 3,063 | | | (2 | ) | |
USD | 24,685 | | | 24,685 | | | 3/13/08 | | JPY | 2,733,098 | | | 24,653 | | | (32 | ) | |
USD | 10,827 | | | 10,827 | | | 3/13/08 | | JPY | 1,197,280 | | | 10,799 | | | (28 | ) | |
USD | 27,366 | | | 27,366 | | | 3/13/08 | | JPY | 3,028,464 | | | 27,317 | | | (49 | ) | |
USD | 309 | | | 309 | | | 3/13/08 | | JPY | 34,157 | | | 308 | | | (1 | ) | |
USD | 12,339 | | | 12,339 | | | 3/13/08 | | JPY | 1,364,559 | | | 12,309 | | | (30 | ) | |
USD | 2,536 | | | 2,536 | | | 3/13/08 | | JPY | 284,758 | | | 2,568 | | | 32 | | |
USD | 1,441 | | | 1,441 | | | 3/13/08 | | SEK | 9,225 | | | 1,428 | | | (13 | ) | |
| | | | $ 396,883 | | | | | | | | | $ 396,306 | | | $ (577 | ) | |
| | | | | | | | | | | | | | | | | | | |
AUD | — | Australian Dollar |
EUR | — | Euro |
GBP | — | British Pound |
HKD | — | Hong Kong Dollar |
JPY | — | Japanese Yen |
SEK | — | Swedish Krona |
SGD | — | Singapore Dollar |
USD | — | United States Dollar |
The accompanying notes are an integral part of the financial statements. | 21 |
2007 Annual Report | |
| |
December 31, 2007 | |
Portfolio of Investments (cont’d)
Active International Allocation Portfolio
The Portfolio had the following futures contract(s) open at period end:
| | Number
of
Contracts | | Value
(000) | | Expiration
Date | | Net
Unrealized
Appreciation
(Depreciation)
(000) | |
Long: | | | | | | | | | | |
SPI 200 | | | | $19,090 | | | Mar-08 | | $ 475 | | |
(Australia) | | | 137 | | | | | | | | | |
CAC 40 Index | | | | | | | | | | | | |
(France) | | | 108 | | 8,875 | | | Jan-08 | | 153 | | |
DAX Index | | | | | | | | | | | | |
(Germany) | | | 116 | | 34,532 | | | Mar-08 | | 520 | | |
Hang Seng Index | | | | | | | | | | | | |
(Hong Kong) | | | 115 | | 20,582 | | | Jan-08 | | (227) | | |
MSCI Index | | | | | | | | | | | | |
(Singapore) | | | 65 | | 3,841 | | | Jan-08 | | 17 | | |
MSCI Index | | | | | | | | | | | | |
(Taiwan) | | | 300 | | 10,005 | | | Jan-08 | | 430 | | |
Short: | | | | | | | | | | | | |
TOPIX Index | | | | | | | | | | | | |
(Japan) | | | 87 | | 11,448 | | | Mar-08 | | 787 | | |
| | | | | | | | $2,155 | | |
| | | | | | | | | | |
| | | | | | | | | | | | | |
22 | The accompanying notes are an integral part of the financial statements. |
2007 Annual Report |
|
December 31, 2007 |
Investment Overview (unaudited)
Emerging Markets Portfolio
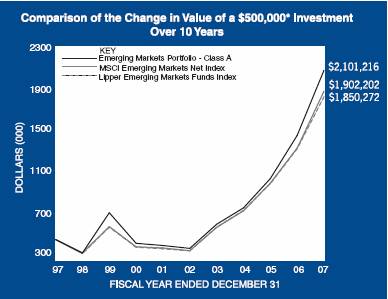
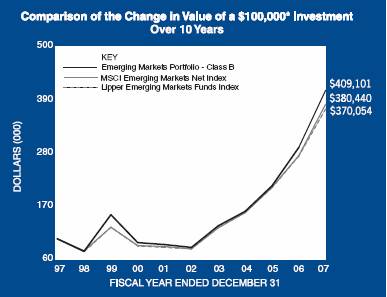
* Minimum Investment
In accordance with SEC regulations, Portfolio’s performance shown assumes that all recurring fees (including management fees) were deducted and all dividends and distributions were reinvested. The performance of Class B shares will vary from the Class A shares based upon its different inception date and will be negatively impacted by additional fees assessed to this class.
Performance Compared to the Morgan Stanley Capital International (MSCI) Emerging Markets Net Index(1) and the Lipper Emerging Markets Funds Index(2)
| | | Total Returns(3) |
| | | | Average Annual |
| | One | | Five | | Ten | | Since |
| | Year | | Years | | Years | | Inception(6) |
| | | | | | | | |
Portfolio – Class A (4) | | 41.56 | % | | 38.26 | % | | 15.44 | % | | 13.58 | % |
MSCI Emerging Markets Net Index | | 39.39 | | | 37.02 | | | 14.30 | | | 12.35 | |
Lipper Emerging Markets Funds Index | | 36.26 | | | 36.33 | | | 13.98 | | | — | |
| | | | | | | | | | | | |
Portfolio – Class B (5) | | 41.20 | | | 37.88 | | | 15.13 | | | 13.32 | |
MSCI Emerging Markets Net Index | | 39.39 | | | 37.02 | | | 14.30 | | | 11.12 | |
Lipper Emerging Markets Funds Index | | 36.26 | | | 36.33 | | | 13.98 | | | 11.51 | |
Performance data quoted represents past performance, which is no guarantee of future results, and current performance may be lower or higher than the figures shown. Performance assumes that all dividends and distributions, if any, were reinvested. For the most recent month-end performance figures, please visit www.morganstanley.com/msim. Investment return and principal value will fluctuate so that Portfolio shares, when redeemed, may be worth more or less than their original cost. Total returns do not
reflect the deduction of taxes that a shareholder would pay on Portfolio distributions or the redemption of Portfolio shares.
(1) | The MSCI Emerging Markets Net Index is a free float-adjusted market capitalization index that is designed to measure equity market performance in the global emerging markets. The term “free float” represents the portion of shares outstanding that are deemed to be available for purchase in the public equity markets by investors. The MSCI Emerging Markets Net Index consists of the following 25 emerging market country indices: Argentina, Brazil, Chile, China, Colombia, Czech Republic, Egypt, Hungary, India, Indonesia, Israel, Jordan, Korea, Malaysia, Mexico, Morocco, Pakistan, Peru, Philippines, Poland, Russia, South Africa, Taiwan, Thailand and Turkey. This series approximates the minimum possible dividend reinvestment. The dividend is reinvested after deduction of withholding tax, applying the rate to non-resident individuals who do not benefit from double taxation treaties. The Index is unmanaged and its returns do not include any sales charges or fees. Such costs would lower performance. It is not possible to invest directly in an index. |
(2) | The Lipper Emerging Markets Funds Index is an equally weighted performance index of the largest qualifying funds (based on net assets) in the Lipper Emerging Markets Funds classification. The Index, which is adjusted for capital gains distributions and income dividends, is unmanaged and should not be considered an investment. There are currently 30 funds represented in this Index. As of the date of this report, the Portfolio is in the Lipper Emerging Markets Funds classification. |
(3) | Total returns for the Portfolio reflect fees waived and expenses reimbursed, if applicable, by the Adviser. Without such waivers and reimbursements, total returns would have been lower. Fee waivers and/or expense reimbursements are voluntary and the Adviser reserves the right to commence or terminate any waiver and/or reimbursement at any time. |
(4) | Commenced operations on September 25, 1992 |
(5) | Commenced operations on January 2, 1996 |
(6) | For comparative purposes, average annual since inception returns listed for the Indexes refer to the inception date or initial offering of the respective share class of the Portfolio, not the inception of the Index. |
The Emerging Markets Portfolio (the “Portfolio”) seeks long-term capital appreciation by investing primarily in growth-oriented equity securities of issuers in emerging market countries. Foreign investing involves certain risks, including
23
2007 Annual Report |
|
December 31, 2007 |
Investment Overview (cont’d)
Emerging Markets Portfolio
currency fluctuations and controls, restrictions on foreign investments, less governmental supervision and regulation, less liquidity and the potential for market volatility and political instability. In addition, investing in emerging markets may involve a relative higher degree of volatility.
Performance
For the year ended December 31, 2007, the Portfolio had a total return based on net asset value and reinvestment of distributions per share of 41.56%, net of fees, for the Class A shares and 41.20%, net of fees, for the Class B shares. The Portfolio’s Class A and Class B shares outperformed against its benchmark the Morgan Stanley Capital International (MSCI) Emerging Markets Net Index (the “Index”) which returned 39.39%.
Factors Affecting Performance
· Emerging markets equities posted their fifth consecutive calendar year of double-digit returns in 2007. The Index returned 39.4% for the year, following returns of 32.2% in 2006, 34% in 2005, 25.6% in 2004 and 55.8% in 2003. Moreover, the emerging markets continued their outperformance over the developed markets for the seventh consecutive year. In 2007, the emerging markets beat the S&P 500® Index by 33 percentage points and developed international markets (as measured by the MSCI Europe, Australasia and Far East Index) by 28 percentage points.
· The strong year of performance occurred despite an increase in global risk aversion and two sharp sell-offs in February and August. Throughout the year, growing concern over a U.S. credit crisis and increased risk aversion continued to cause volatility in the markets. Argentina, down 4.0%, was the only country in the Index to post a negative return for the year. Latin America, up 50.4%, was the best performing region as Peru (+94.4%), Brazil (+79.5%), Chile (+23.1%), Colombia (+ 15.0%) and Mexico (+12.2%) all posted double-digit returns. Asia was up 41.1%, led by India (+73.1%), China (+66.2%) and Indonesia (+54.2%). All markets were also positive in the Emerging Europe, Middle East and Africa region, up 28.5%. The top performer in the region was Turkey (+74.1%), followed by Egypt (+58.4%), the Czech Republic (+55.3%), Morocco (+47.7%) and Israel (+39.2).
· Overall, country allocation and stock selection contributed favorably to performance. Stock selection in China and Russia were the strongest contributors to performance. Other significant contributors included stock selection in South Africa, Morocco and Korea. An underweight allocation to Taiwan and an overweight allocation to China and Turkey also helped performance.
· Conversely, an overweight allocation to Mexico and stock selection in the country hurt performance. Stock selection in Brazil, Egypt and the Czech Republic also detracted from performance.
Management Strategies
· During the year, we shifted from an overweight to an underweight allocation to the Latin America region, owing to reduced positions in Mexico and Brazil. In Mexico, we sold our entire position in the media sector given changes in the regulatory environment. The government introduced several laws that may hurt the competitiveness and earnings growth potential of media companies. While we remain positive on the long-term outlook for Brazil, as its equity market has been a strong performer, it faces some short-term risks. In our view, the chief risk could come from an inflation outlook that could potentially halt interest rate reductions.
· We reduced the Portfolio’s underweight in the Asia region by adding to Korea and China. We maintain our conviction that the robust economic growth, productivity gains, improving corporate governance and positive company earnings revisions in China support allocation to the country in a long-term portfolio. In Korea, we expect economic growth to reaccelerate going into 2008. Exports and investments remain the pillars of strength there, while we also believe momentum in local consumption is likely to materialize.
· The Portfolio’s overweight allocations are in India, China, Poland, Turkey and Russia, and we remain underweight Taiwan, South Korea, Israel and Malaysia.
· Even with the credit difficulties and consumer slowdown in the U.S., we remain positive on the long-term economic outlook for emerging markets, as their base of growth is becoming more solidly supported by local consumer expansion and increased investment and government infrastructure spending. According to JP Morgan research, emerging market economies in the five-year period through 2007 will account for nearly half of the incremental growth in global gross domestic product versus the U.S. contribution of just 16.7% in the same period.
· Overall, earnings growth is weakening globally, but in our view remains relatively strong in many emerging markets. That said, inflation is beginning to climb in
24
2007 Annual Report |
|
December 31, 2007 |
Investment Overview (cont’d)
Emerging Markets Portfolio
certain emerging market economies, as energy costs, higher food prices and rising domestic demand place upward pressure on overall inflation. In this environment, we believe the key to maintaining outperformance is to make strong country allocation decisions and to select companies with long-term growth potential that tend to do best in the latter stages of a bull market. Broadly speaking, we believe emerging markets should continue to advance, but more volatility is likely. Risks to emerging market equities include a resurgence of sustained inflation—particularly in China—a recession in the U.S., a sharp fall in commodities prices or a major rise in risk aversion.
Expense Examples
As a shareholder of the Portfolio, you may incur two types of costs: (1) transactional costs, including redemption fees; (2) ongoing costs, including management fees, shareholder servicing fees (in the case of Class B); and other Portfolio expenses. These examples are intended to help you understand your ongoing costs (in dollars) of investing in the Portfolio and to compare these costs with the ongoing costs of investing in other mutual funds.
The examples are based on an investment of $1,000 invested at the beginning of the six-month period ended December 31, 2007 and held for the entire six-month period.
Actual Expenses
The first line of the tables below provides information about actual account values and actual expenses. You may use the information in this line, together with the amount you invested, to estimate the expenses that you paid over the period. Simply divide your account value by $1,000 (for example, an $8,600 account value divided by $1,000 = 8.6), then multiply the result by the number in the first line under the heading entitled “Expenses Paid During Period” to estimate the expenses you paid on your account during this period.
Please note that “Expenses Paid During Period” are grossed up to reflect Portfolio expenses prior to the effect of Expense Offset (See Note E in the Notes to Financial Statements). Therefore, the annualized net expense ratios may differ from the ratio of the expenses to average net assets shown in the Financial Highlights.
Hypothetical Example for Comparison Purposes
The second line of the tables below provides information about hypothetical account values and hypothetical expenses based on the Portfolio’s actual expense ratio and an assumed rate of return of 5% per year before expenses, which is not the Portfolio’s actual return. The hypothetical account values and expenses may not be used to estimate the actual ending account balance or expenses you paid for the period. You may use this information to compare the ongoing costs of investing in the Portfolio and other funds. To do so, compare this 5% hypothetical example with the 5% hypothetical examples that appear in the shareholder reports of the other funds.
Please note that the expenses shown in the table are meant to highlight your ongoing costs only and do not reflect any transactional costs, such as redemption fees. Therefore, the second line of the table is useful in comparing ongoing costs only, and will not help you
determine the relative total costs of owning different funds. In addition, if these transactional costs were included, your costs would have been higher.
| | Beginning Account Value
July 1, 2007 | | Ending Account Value December 31, 2007 | | Expenses Paid During Period* July 1, 2007 — December 31, 2007 |
Class A | | | | | | |
Actual | | $1,000.00 | | $1,206.40 | | $7.40 |
Hypothetical (5% average annual return before expenses) | | 1,000.00 | | 1,018.50 | | 6.77 |
| | | | | | |
Class B | | | | | | |
Actual | | 1,000.00 | | 1,204.80 | | 8.78 |
Hypothetical (5% average annual return before expenses) | | 1,000.00 | | 1,017.24 | | 8.03 |
* | Expenses are equal to Class A and Class B annualized net expense ratios of 1.33% and 1.58%, respectively, multiplied by the average account value over the period, multiplied by 184/365 (to reflect the one-half year period). |
Graphic Presentation of Portfolio Holdings
The following graph depicts the Portfolio’s holdings by industry and/or security type, as a percentage of total investments.
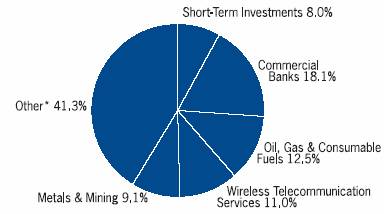
* | Industries which do not appear in the above graph, as well as those which represent less than 5% of total investments, if applicable, are included in the category labeled “Other”. |
25
2007 Annual Report |
|
December 31, 2007 |
Portfolio of Investments
Emerging Markets Portfolio
| | | | Value | |
| | Shares | | (000) | |
Common Stocks (98.0%) | | | | | |
Argentina (0.8%) | | | | | |
Tenaris S.A. ADR | | (c)658,738 | | $ | 29,465 | |
Austria (0.7%) | | | | | |
Raiffeisen International Bank Holding AG | | (c)166,764 | | 25,126 | |
Brazil (12.5%) | | | | | |
All America Latina Logistica S.A. | | 1,203,952 | | 15,422 | |
Banco do Brasil S.A. | | 985,304 | | 16,610 | |
Banco Itau Holding Financeira S.A. (Preference) | | 688,664 | | 17,839 | |
Banco Itau Holding Financeira S.A. ADR | | (c)659,999 | | 17,068 | |
Banco Nacional S.A. (Preference) | | (a)(d)(l)295,998,880 | | — | |
Cia Energetica de Sao Paulo, Class B (Preference) | | (a)339,058 | | 8,163 | |
Cia Siderurgica Nacional S.A. | | 279,470 | | 25,040 | |
CVRD ADR | | (c)4,182,919 | | 117,038 | |
CVRD, Class A (Preference) | | 56,084 | | 1,572 | |
Cyrela Brazil Realty S.A. | | 1,282,373 | | 17,156 | |
Gerdau S.A. ADR | | (c)235,772 | | 6,840 | |
Gerdau S.A. (Preference) | | 329,650 | | 9,555 | |
Investimentos Itau S.A. (Preference) | | 1,650,022 | | 10,769 | |
NET Servicos de Comunicacao S.A. (Preference) | | (a)1,058,372 | | 12,685 | |
Petroleo Brasileiro S.A. ADR | | (c)775,877 | | 74,655 | |
Petroleo Brasileiro S.A. ADR | | 130,015 | | 14,983 | |
Petroleo Brasileiro S.A. (Preference) | | 509,136 | | 24,600 | |
Unibanco - Uniao de Bancos Brasileiros S.A. | | 377,442 | | 5,266 | |
Unibanco - Uniao de Bancos Brasileiros S.A. GDR | | 296,287 | | 41,373 | |
Usinas Siderurgicas de Minas Gerais S.A., Class A (Preference) | | 1 | | @— | |
| | | | 436,634 | |
China/Hong Kong (17.9%) | | | | | |
Bank of China Ltd., Class H | | (c)60,237,000 | | 28,700 | |
Belle International Holdings Ltd. | | 1,324,000 | | 1,985 | |
BYD Electronic International Co., Ltd. | | (a)7,157,500 | | 13,861 | |
China Coal Energy Co. | | 18,765,000 | | 57,653 | |
China Communications Construction Co. Ltd., Class H | | (c)11,108,000 | | 28,645 | |
China Construction Bank Corp., Class H | | (c)69,680,000 | | 58,443 | |
China COSCO Holdings Co., Ltd., Class H | | (c)12,937,500 | | 35,301 | |
China Mobile Ltd. | | (c)5,989,500 | | 103,794 | |
China Overseas Land & Investment Ltd. | | 1,688,000 | | 3,461 | |
China Petroleum & Chemical Corp., Class H | | 29,410,000 | | 43,742 | |
China Resources Power Holdings Co. | | 7,599,000 | | 25,799 | |
COSCO Pacific Ltd. | | (c)5,662,000 | | 14,958 | |
Datang International Power Generation Co., Ltd., Class H | | (c)9,852,000 | | 8,622 | |
Dongfeng Motor Group Co., Ltd., Class H | | (c)31,091,000 | | $ | 21,699 | |
GOME Electrical Appliances Holdings Ltd. | | (c)15,365,000 | | 38,862 | |
Harbin Power Equipment, Class H | | 10,294,000 | | 32,680 | |
Industrial & Commercial Bank of China, Class H | | (c)61,982,000 | | 44,057 | |
Maanshan Iron & Steel, Class H | | (c)25,131,000 | | 16,364 | |
Ping An Insurance Group Co. of China Ltd., Class H | | (c)2,422,000 | | 25,693 | |
Shanghai Industrial Holdings Ltd. | | (c)4,775,000 | | 20,588 | |
Sino-Ocean Land Holdings Ltd. | | (a)382,000 | | 468 | |
| | | | 625,375 | |
Czech Republic (1.2%) | | | | | |
Central European Media Enterprises Ltd. | | (a)(c)255,800 | | 29,668 | |
Komercni Banka A/S | | 57,400 | | 13,796 | |
| | | | 43,464 | |
Egypt (0.7%) | | | | | |
El Sewedy Cables Holding Co. | | (a)1,053,592 | | 22,639 | |
India (10.5%) | | | | | |
Aban Offshore Ltd. | | 149,100 | | 18,699 | |
ABB Ltd. India | | 670,410 | | 25,648 | |
Axis Bank Ltd. | | 1,107,400 | | 27,216 | |
Bharat Heavy Electricals Ltd. | | 469,790 | | 30,682 | |
Bharti Airtel Ltd. | | (a)673,773 | | 16,935 | |
Deccan Chronicle Holdings Ltd. | | 2,099,120 | | 11,566 | |
Glenmark Pharmaceuticals Ltd. | | 1,259,400 | | 19,013 | |
GVK Power & Infrastructure Ltd. | | (a)553,344 | | 11,204 | |
HCL Technologies Ltd. | | 1,425,900 | | 11,888 | |
HDFC Bank Ltd. | | 552,900 | | 24,115 | |
HDFC Bank Ltd. ADR | | 166,800 | | 21,759 | |
Housing Development Finance Corp. | | 209,000 | | 15,121 | |
India Cements Ltd. | | 1,140,692 | | 8,948 | |
Infosys Technologies Ltd. | | 407,772 | | 18,209 | |
Maruti Suzuki India Ltd. | | 501,500 | | 12,575 | |
Praj Industries Ltd. | | 1,116,500 | | 6,791 | |
Reliance Communications Ltd. | | 760,500 | | 14,345 | |
Reliance Industries Ltd. | | 589,700 | | 43,089 | |
Steel Authority of India Ltd. | | 1,552,500 | | 11,141 | |
Television Eighteen India Ltd. | | (d)335,100 | | 4,706 | |
Zee Entertainment Enterprises Ltd. | | 1,576,000 | | 13,048 | |
| | | | 366,698 | |
Indonesia (3.6%) | | | | | |
Astra International Tbk PT | | 6,492,000 | | 18,690 | |
Bank Central Asia Tbk PT | | 15,423,500 | | 11,868 | |
Bank Mandiri Persero Tbk PT | | 11,645,500 | | 4,293 | |
Bank Rakyat Indonesia | | 14,337,500 | | 11,187 | |
Bumi Resources Tbk PT | | 53,764,500 | | 33,928 | |
International Nickel Indonesia Tbk PT | | 1,577,000 | | 16,044 | |
Tambang Batubara Bukit Asam Tbk PT | | 7,723,500 | | 9,766 | |
Telekomunikasi Indonesia Tbk PT | | 17,873,000 | | 19,327 | |
| | | | 125,103 | |
26 | The accompanying notes are an integral part of the financial statements. |
2007 Annual Report |
|
December 31, 2007 |
Portfolio of Investments (cont’d)
Emerging Markets Portfolio
| | | | Value |
| | Shares | | (000) |
Luxembourg (0.6%) | | | | | |
Millicom International Cellular S.A. | | (a)162,803 | | $ | 19,201 |
Malaysia (0.5%) | | | | |
Hap Seng Plantations Holdings Bhd | | (a)549,000 | | 528 |
IOI Corp. Bhd | | 7,825,150 | | 18,179 |
| | | | 18,707 |
Mexico (4.9%) | | | | |
America Movil S.A.B. de C.V., Class L ADR | | 1,351,962 | | 82,997 |
Corp. GEO S.A.B. de C.V. | | (a)(c)2,675,314 | | 7,697 |
Empresas ICA S.A.B. de C.V. | | (a)(c)1,303,400 | | 8,597 |
Grupo Financiero Banorte S.A.B. de C.V., Class O | | 5,628,800 | | 23,259 |
Grupo Mexico S.A.B. de C.V., Class B | | 1,380,100 | | 8,674 |
Urbi Desarrollos Urbanos S.A. de C.V | | (a)2,727,600 | | 9,422 |
Wal-Mart de Mexico S.A.B. de C.V. ADR | | (c)303,243 | | 10,572 |
Wal-Mart de Mexico S.A.B. de C.V., Series V | | (c)6,117,538 | | 21,327 |
| | | | 172,545 |
Oman (0.9%) | | | | |
Bank Muscat SAOG | | 4,136,032 | | 20,627 |
Bank Muscat SAOG GDR (Registered) | | 453,854 | | 10,098 |
| | | | 30,725 |
Philippines (0.7%) | | | | |
Ayala Corp. | | 562,332 | | 7,605 |
Philippines Long Distance Telephone Co. | | 98,530 | | 7,544 |
PNOC Energy Development Corp. | | 54,721,500 | | 8,621 |
| | | | 23,770 |
Poland (3.5%) | | | | |
Bank Handlowy w Warszawie S.A. | | 245,743 | | 9,908 |
Bank Millennium S.A. | | 4,172,252 | | 19,535 |
Bank Pekao S.A. | | 328,220 | | 30,001 |
Bank Zachodni WBK S.A. | | 162,215 | | 16,414 |
Budimex S.A. | | (a)139,357 | | 5,187 |
Getin Holding S.A. | | (a)517,640 | | 3,053 |
PBG S.A. | | (a)31,821 | | 3,938 |
Polimex Mostostal S.A. | | 1,763 | | 6,071 |
Polski Koncern Naftowy Orlen | | (a)283,000 | | 5,915 |
TVN S.A. | | 2,285,484 | | 23,147 |
| | | | 123,169 |
Qatar (0.5%) | | | | |
Commercial Bank of Qatar | | 365,793 | | 18,588 |
Russia (13.0%) | | | | |
Alliance Cellulose Ltd. | | (a)(d)(l)592,359 | | — |
CTC Media, Inc. | | (a)(c)953,078 | | 28,783 |
Eurasia Drilling Co., Ltd. GDR | | (a)(e)650,153 | | 17,717 |
Evraz Group S.A. GDR | | 291,963 | | 22,614 |
Mechel ADR | | (c)259,761 | | 25,233 |
Mobile Telesystems OJSC ADR | | (c)326,732 | | 33,258 |
OAO Gazprom ADR | | 1,015,000 | | 57,156 |
OAO Gazprom ADR | | (c)1,680,287 | | 94,620 |
Sberbank | | 11,429,548 | | 47,408 |
Sberbank GDR | | (a)48,533 | | $ | 26,548 |
Severstal GDR | | 830,667 | | 18,881 |
TMK OAO GDR | | (c)(e)418,338 | | 18,793 |
TMK OAO GDR (Registered) | | (c)87,355 | | 3,924 |
Vimpel-Communications ADR | | (c)930,423 | | 38,706 |
Wimm-Bill-Dann Foods OJSC ADR | | (c)158,437 | | 20,762 |
| | | | 454,403 |
South Africa (5.3%) | | | | |
Allied Electronics Corp., Ltd. (Preference) | | (a)(c)1,419,524 | | 8,931 |
Barloworld Ltd. | | 462,254 | | 7,279 |
Freeworld Coatings Ltd. | | (a)462,254 | | 714 |
Group Five Ltd. | | 1,810,600 | | 14,557 |
Kumba Resources Ltd. | | 1,315,900 | | 19,842 |
Mittal Steel South Africa Ltd. | | 1,333,426 | | 26,615 |
MTN Group Ltd. | | 3,719,752 | | 69,669 |
Murray & Roberts Holdings Ltd. | | 1,541,736 | | 22,973 |
Raubex Group Ltd. | | 1,999,000 | | 13,893 |
Standard Bank Group Ltd. | | 74,100 | | 1,084 |
| | | | 185,557 |
South Korea (11.6%) | | | | |
Amorepacific Corp. | | (a)11,236 | | 8,465 |
Cheil Communications, Inc. | | (a)39,455 | | 11,868 |
Cheil Industries, Inc. | | (a)152,317 | | 8,397 |
Doosan Infracore Co., Ltd. | | (a)286,153 | | 8,993 |
GS Engineering & Construction Corp. | | (a)105,904 | | 17,365 |
Hite Brewery Co., Ltd. | | (a)74,318 | | 11,280 |
Hyundai Heavy Industries | | (a)65,269 | | 30,374 |
Hyundai Mipo Dockyard | | (a)64,972 | | 19,647 |
Hyundai Motor Co. | | (a)268,720 | | 20,481 |
Korean Air Lines Co., Ltd. | | (a)151,892 | | 12,279 |
LG Chem Ltd. | | (a)164,160 | | 15,647 |
LG Electronics, Inc. | | (a)201,669 | | 21,239 |
LG Philips LCD Co. Ltd. | | (a)550,545 | | 29,124 |
NHN Corp. | | (a)109,161 | | 25,879 |
Orion Corp. | | (a)23,314 | | 6,185 |
POSCO | | 27,130 | | 16,420 |
Samsung Electronics Co., Ltd. | | 43,141 | | 25,357 |
Samsung Electronics Co., Ltd. (Preference) | | 38,506 | | 17,462 |
Samsung Fire & Marine Insurance Co., Ltd. | | 72,400 | | 19,519 |
Shinhan Financial Group Co., Ltd. | | (a)409,004 | | 23,467 |
SK Energy Co., Ltd. | | (a)51,670 | | 9,939 |
SSCP Co., Ltd. | | (a)275,813 | | 9,260 |
STX Pan Ocean Co., Ltd. | | (a)(c)8,309,000 | | 20,751 |
Woongjin Coway Co., Ltd. | | (a)565,042 | | 18,204 |
| | | | 407,602 |
Taiwan (5.0%) | | | | |
Asustek Computer, Inc. | | 4,980,494 | | 14,850 |
AU Optronics Corp. | | 27,279,481 | | 52,703 |
Epistar Corp. | | 3,075,000 | | 13,094 |
Formosa Plastics Corp. | | 9,956,000 | | 27,801 |
Foxconn Technology Co., Ltd. | | 1,728,400 | | 13,945 |
The accompanying notes are an integral part of the financial statements. | 27 |
2007 Annual Report |
|
December 31, 2007 |
Portfolio of Investments (cont’d)
Emerging Markets Portfolio
| | | | Value |
| | Shares | | (000) |
Taiwan (cont’d) | | | | | |
InnoLux Display Corp. | | 1,740,000 | | $ | 5,835 |
InnoLux Display Corp. GDR | | (a)784,588 | | 5,335 |
MediaTek, Inc. | | 150,905 | | 1,942 |
Siliconware Precision Industries Co. | | 4,570,000 | | 8,133 |
Taiwan Cement Corp. | | 11,200,000 | | 15,385 |
Tripod Technology Corp. | | 508,315 | | 1,824 |
TXC Corp. | | 1,033,757 | | 1,807 |
Yang Ming Marine Transport Corp. | | 17,901,402 | | 13,740 |
| | | | 176,394 |
Turkey (3.6%) | | | | |
Akcansa Cimento A/S | | 978,945 | | 5,922 |
Aksigorta A/S | | 1,645,543 | | 9,661 |
KOC Holding A/S | | (a)1,496,678 | | 8,080 |
Tekfen Holding A/S | | (a)752,000 | | 4,138 |
Turkcell Iletisim Hizmet A/S | | 2,394,175 | | 26,229 |
Turkcell Iletisim Hizmet A/S ADR | | 42,500 | | 1,172 |
Turkiye Garanti Bankasi A/S | | 3,308,186 | | 29,513 |
Turkiye Halk Bankasi A/S | | (a)1,307,560 | | 13,560 |
Turkiye Is Bankasi, Class A | | 850,647 | | 5,311 |
Yapi ve Kredi Bankasi A/S | | (a)6,261,904 | | 21,967 |
| | | | 125,553 |
Total Common Stocks (Cost $2,373,561) | | | | 3,430,718 |
Investment Company (0.8%) | | | | |
India (0.8%) | | | | |
Morgan Stanley Growth Fund | | | | |
(Cost $3,415) | | (a)(o)17,282,900 | | 28,374 |
| | Face
Amount
(000) | | |
Short-Term Investments (8.5%) | | | | |
Short-Term Debt Securities held as Collateral on Loaned Securities (7.5%) | | | | |
Alliance & Leicester plc, | | | | |
5.26%, 9/2/08 | | $ | (h)7,895 | | 7,895 |
Bancaja, | | | | |
5.35%, 8/12/08 | | 3,947 | | 3,947 |
Bank of New York Co., Inc., | | | | |
5.24%, 8/8/08 | | (h)3,947 | | 3,947 |
BASF AG, | | | | |
5.18%, 8/19/08 | | (h)3,947 | | 3,947 |
BNP Paribas plc, | | | | |
4.90%, 5/19/08 | | (h)7,895 | | 7,895 |
CAM US Finance S.A. Unipersonal, | | | | |
5.24%, 7/25/08 | | (h)15,790 | | 15,790 |
Canadian Imperial Bank of | | | | |
Commerce, New York, | | | | |
4.42%, 7/28/08 | | (h)7,895 | | 7,895 |
CC USA, Inc., | | | | |
3.89%, 1/28/08 | | (h)3,946 | | 3,946 |
CIT Group Holdings, | | | | |
5.23%, 6/18/08 | | (h)14,211 | | 14,211 |
Citigroup Global Markets Holdings, Inc., | | | | |
4.51%, 1/2/08 | | 53,818 | | 53,818 |
Credit Suisse First Boston, New York, | | | | |
4.32%, 3/14/08 | | $ | (h)7,895 | | $ | 7,895 |
First Tennessee Bank, | | | | |
5.05%, 8/15/08 | | (h)3,947 | | 3,947 |
5.06%, 8/15/08 | | (h)15,789 | | 15,789 |
Goldman Sachs Group, Inc., | | | | |
4.62%, 2/13/09 | | (h)7,421 | | 7,421 |
5.10%, 9/12/08 | | (h)3,947 | | 3,947 |
HSBC Finance Corp., | | | | |
5.26%, 8/5/08 | | (h)3,947 | | 3,947 |
IBM Corp., | | | | |
5.27%, 9/8/08 | | (h)15,790 | | 15,790 |
Lehman Brothers, Inc., | | | | |
4.49%, 1/2/08 | | 6,733 | | 6,733 |
Macquarie Bank Ltd., | | | | |
4.95%, 8/20/08 | | (h)7,895 | | 7,895 |
Metropolitan Life Global Funding, | | | | |
4.89%, 8/21/08 | | (h)11,842 | | 11,842 |
National Bank of Canada, | | | | |
5.21%, 4/2/08 | | (h)15,788 | | 15,788 |
National Rural Utilities Cooperative Finance Corp., | | | | |
5.24%, 9/2/08 | | (h)15,790 | | 15,790 |
Nationwide Building Society, | | | | |
4.92%, 7/28/08 | | (h)9,158 | | 9,158 |
Unicredito Italiano Bank (Ireland) plc, | | | | |
5.04%, 8/14/08 | | (h)8,684 | | 8,684 |
5.26%, 8/8/08 | | (h)5,526 | | 5,526 |
| | | | 263,443 |
| | Shares | | |
Investment Company (1.0%) | | | | |
Morgan Stanley Institutional Liquidity Money Market Portfolio — Institutional Class | | (o)35,567,570 | | 35,567 |
Total Short-Term Investments (Cost $299,010) | | | | 299,010 |
Total Investments (107.3%) (Cost $2,675,986) — including $252,057 of Securities Loaned | | | | (v) 3,758,102 |
Liabilities in Excess of Other Assets (-7.3%) | | | | (255,138) |
Net Assets (100%) | | | | $ | 3,502,964 |
| | | | | | | | |
(a) | Non-income producing security. |
(c) | All or a portion of security on loan at December 31, 2007. |
(d) | Securities were valued at fair value — At December 31, 2007, the Portfolio held approximately $4,706,000 of fair valued securities, representing 0.1% of net assets. |
(e) | 144A Security — Certain conditions for public sale may exist. Unless otherwise noted, these securities are deemed to be liquid. |
(h) | Variable/Floating Rate Security — Interest rate changes on these instruments are based on changes in a designated base rate. The rates shown are those in effect on December 31, 2007. |
(l) | Security has been deemed illiquid at December 31, 2007. |
(o) | See Note F within the Notes to Financial Statements regarding investment in Morgan Stanley Growth Fund and Morgan Stanley Institutional Liquidity Money Market Portfolio — Institutional Class. |
28 | The accompanying notes are an integral part of the financial statements. |
2007 Annual Report |
|
December 31, 2007 |
Portfolio of Investments (cont’d)
Emerging Markets Portfolio
(v) | The approximate market value and percentage of the investments, $2,766,583,000 and 73.6%, respectively, represent the securities that have been fair valued under the fair valuation policy for international investments as described in Note A within the Notes to Financial Statements. |
@ | Value is less than $500. |
ADR | American Depositary Receipt |
GDR | Global Depositary Receipt |
| |
Foreign Currency Exchange Contract Information:
The Portfolio had the following foreign currency exchange contract(s) open at period end:
Currency
to
Deliver
(000) | | Value
(000) | | Settlement
Date | | In
Exchange
For
(000) | | Value
(000) | | Net
Unrealized
Appreciation
(Depreciation)
(000) | |
BRL | 5,451 | | | $ 3,062 | | | 1/2/08 | | USD | 3,049 | | | $ 3,049 | | | $ (13 | ) | |
BRL | 339 | | | 190 | | | 1/3/08 | | USD | 191 | | | 191 | | | 1 | | |
HKD | 723 | | | 93 | | | 1/2/08 | | USD | 93 | | | 93 | | | @— | | |
HKD | 687 | | | 88 | | | 1/3/08 | | USD | 88 | | | 88 | | | @— | | |
MXN | 3,127 | | | 286 | | | 1/2/08 | | USD | 287 | | | 287 | | | 1 | | |
MXN | 5,182 | | | 475 | | | 1/3/08 | | USD | 475 | | | 475 | | | @— | | |
PLN | 2,215 | | | 900 | | | 1/2/08 | | USD | 896 | | | 896 | | | (4 | ) | |
PLN | 581 | | | 237 | | | 1/3/08 | | USD | 238 | | | 238 | | | 1 | | |
TRY | 810 | | | 691 | | | 1/2/08 | | USD | 690 | | | 690 | | | (1 | ) | |
USD | 333 | | | 333 | | | 1/3/08 | | SGD | 482 | | | 334 | | | 1 | | |
USD | 361 | | | 361 | | | 1/3/08 | | TRY | 422 | | | 360 | | | (1 | ) | |
USD | 281 | | | 281 | | | 1/3/08 | | ZAR | 1,958 | | | 287 | | | 6 | | |
USD | 251 | | | 251 | | | 1/8/08 | | ZAR | 1,720 | | | 252 | | | 1 | | |
ZAR | 20,729 | | | 3,033 | | | 1/2/08 | | USD | 2,944 | | | 2,944 | | | (89 | ) | |
ZAR | 5,937 | | | 869 | | | 1/3/08 | | USD | 850 | | | 850 | | | (19 | ) | |
ZAR | 9,721 | | | 1,422 | | | 1/4/08 | | USD | 1,412 | | | 1,412 | | | (10 | ) | |
ZAR | 7,755 | | | 1,134 | | | 1/7/08 | | USD | 1,134 | | | 1,134 | | | @— | | |
| | | | $13,706 | | | | | | | | | $13,580 | | | $(126 | ) | |
| | | | | | | | | | | | | | | | | | | |
BRL | — | Brazilian Real |
HKD | — | Hong Kong Dollar |
MXN | — | Mexican Peso |
PLN | — | Polish Zloty |
SGD | — | Singapore Dollar |
TRY | — | Turkish Lira |
USD | — | United States Dollar |
ZAR | — | South African Rand |
The accompanying notes are an integral part of the financial statements. | 29 |
2007 Annual Report | |
| |
December 31, 2007 | |
Investment Overview (unaudited)
Global Franchise Portfolio
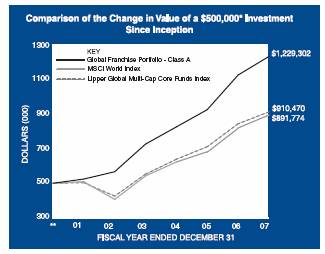
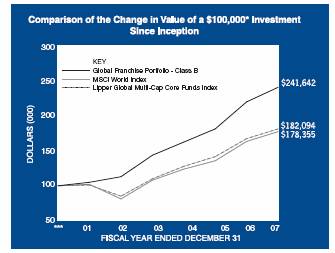
* | Minimum Investment |
** | Commenced operations on November 28, 2001 |
In accordance with SEC regulations, Portfolio’s performance shown assumes that all recurring fees (including management fees) were deducted and all dividends and distributions were reinvested. The performance of Class B shares will vary from the Class A shares and will be negatively impacted by additional fees assessed to this class.
Performance Compared to the Morgan Stanley Capital International (MSCI) World Index(1) and the Lipper Global Multi-Cap Core Funds Index(2)
| | Total Returns(3) | |
| | | | | Average Annual | |
| | One | | Five | | Since | |
| | Year | | Years | | Inception(5) | |
| | | | | | | |
Portfolio – Class A (4) | | 9.58 | % | 16.76 | % | 15.92 | % |
MSCI World Index | | 9.04 | | 16.96 | | 9.97 | |
Lipper Global Multi-Cap Core Funds Index | | 8.20 | | 16.43 | | 10.34 | |
| | | | | | | |
Portfolio – Class B (4) | | 9.26 | | 16.46 | | 15.59 | |
MSCI World Index | | 9.04 | | 16.96 | | 9.97 | |
Lipper Global Multi-Cap Core Funds Index | | 8.20 | | 16.43 | | 10.34 | |
| | | | | | | | |
Performance data quoted represents past performance, which is no guarantee of future results, and current performance may be lower or higher than the figures shown. Performance assumes that all dividends and distributions, if any, were reinvested. For the most recent month-end performance figures, please visit www.morganstanley.com/msim. Investment return and principal value will fluctuate so that Portfolio shares, when redeemed, may be worth more or less than their original cost. Total returns do not reflect the deduction of taxes that a shareholder would pay on Portfolio distributions or the redemption of Portfolio shares.
(1) | | The Morgan Stanley Capital International (MSCI) World Index is a free float-adjusted market capitalization index that is designed to measure global developed market equity performance. The term “free float” represents the portion of shares outstanding that are deemed to be available for purchase in the public equity markets by investors. The MSCI World Index consists of the following 23 developed market country indices: Australia, Austria, Belgium, Canada, Denmark, Finland, France, Germany, Greece, Hong Kong, Ireland, Italy, Japan, Netherlands, New Zealand, Norway, Portugal, Singapore, Spain, Sweden, Switzerland, the United Kingdom and the United States. The Index is unmanaged and its returns do not include any sales charges or fees. Such costs would lower performance. It is not possible to invest directly in an index. |
(2) | | The Lipper Global Multi-Cap Core Funds Index is an equally weighted performance index of the largest qualifying funds (based on net assets) in the Lipper Global Multi-Cap Core Funds classification. The Index, which is adjusted for capital gains distributions and income dividends, is unmanaged and should not be considered an investment. There are currently 30 funds represented in this Index. As of the date of this report, the Portfolio is in the Lipper Global Multi-Cap Core Funds classification. |
(3) | | Total returns for the Portfolio reflect fees waived and expenses reimbursed, if applicable, by the Adviser. Without such waivers and reimbursements, total returns would have been lower. Fee waivers and/or expense reimbursements are voluntary and the Adviser reserves the right to commence or terminate any waiver and/or reimbursement at any time. |
(4) | | Commenced operations on November 28, 2001 |
(5) | | For comparative purposes, average annual since inception returns listed for the Indexes refer to the inception date or initial offering of the respective share class of the Portfolio, not the inception of the Index. |
The Global Franchise Portfolio (the “Portfolio”) seeks longterm capital appreciation by investing primarily in equity securities of issuers located throughout the world, that it believes have, among other things, resilient business franchises and growth potential. This Portfolio’s concentration of its assets in a smaller number of companies may subject it to greater investment risk than a portfolio with a larger number
30
| 2007 Annual Report |
| |
| December 31, 2007 |
Investment Overview (cont’d)
Global Franchise Portfolio
of companies. Foreign investing involves certain risks, including currency fluctuations and controls, restrictions on foreign investments, less governmental supervision and regulation, less liquidity and the potential for market volatility and political instability.
Performance
For the year ended December 31, 2007, the Portfolio had a total return based on net asset value and reinvestment of distributions per share of 9.58%, net of fees, for the Class A shares and 9.26%, net of fees, for the Class B shares. The Portfolio’s Class A and Class B shares outperformed against its benchmark the Morgan Stanley Capital International (MSCI) World Index (the “Index”) which returned 9.04%.
Factors Affecting Performance
· | | The Index was driven by strong performance in the materials, energy and telecommunication services sectors. Over the same period, the three worst performing sectors in the Index were financials, consumer discretionary and health care. Of these, our investment philosophy prevents us from owning companies within the energy and telecommunication services sectors, and most of the companies within the materials and financials sector. |
| | |
· | | In all market environments, we pursue a strategy that is driven by finding companies of exceptional quality at compelling value. We manage a concentrated portfolio, as only a relatively small number of companies meet our stringent quality and valuation criteria. Because of this concentration, and the fact that we do not use benchmarks as a portfolio construction tool, our strategy has a low correlation to the Index. As a result, the Portfolio’s short-term performance does not follow that of the markets. |
| | |
· | | The three stocks that contributed the most to absolute performance were British American Tobacco, Imperial Tobacco and Cadbury Schweppes. The stocks that detracted most from absolute returns were C&C Group, Harley-Davidson and Experian Group. |
Management Strategies
· | | During the year we have initiated positions in six new stocks: C&C Group, Career Education, Experian, Moody’s, Numico and Weight Watchers; and sold out of Altadis, Danone, GCap Media, The New York Times, Numico, SMG and Torstar. |
| | |
· | | We continue to seek investment opportunities in companies with strong business franchises protected by a dominant intangible asset. Additionally, we demand sound management, substantial free cash flow and growth potential. We invest in these high quality companies only when we can identify compelling value as measured by a current free cash flow yield in excess of the risk-free bond yield. We seek to deliver attractive returns while minimizing business and valuation risk. Our goal is for the Portfolio to outperform broadly-based benchmarks over the long term with less than average volatility. The information contained in this overview regarding specific securities is for informational purposes only and should not be construed as a recommendation to purchase or sell the securities mentioned. |
Expense Examples
As a shareholder of the Portfolio, you may incur two types of costs: (1) transactional costs, including redemption fees; (2) ongoing costs, including management fees, shareholder servicing fees (in the case of Class B); and other Portfolio expenses. These examples are intended to help you understand your ongoing costs (in dollars) of investing in the Portfolio and to compare these costs with the ongoing costs of investing in other mutual funds.
The examples are based on an investment of $1,000 invested at the beginning of the six-month period ended December 31, 2007 and held for the entire six-month period.
Actual Expenses
The first line of the tables below provides information about actual account values and actual expenses. You may use the information in this line, together with the amount you invested, to estimate the expenses that you paid over the period. Simply divide your account value by $1,000 (for example, an $8,600 account value divided by $1,000 = 8.6), then multiply the result by the number in the first line under the heading entitled “Expenses Paid During Period” to estimate the expenses you paid on your account during this period.
Please note that “Expenses Paid During Period” are grossed up to reflect Portfolio expenses prior to the effect of Expense Offset (See Note E in the Notes to Financial Statements). Therefore, the annualized net expense ratios may differ from the ratio of the expenses to average net assets shown in the Financial Highlights.
Hypothetical Example for Comparison Purposes
The second line of the tables below provides information about hypothetical account values and hypothetical expenses based on the Portfolio’s actual expense ratio and an assumed rate of return of 5% per year before expenses, which is not the Portfolio’s actual return. The hypothetical account values and expenses may not be used to estimate the actual ending account balance or expenses you paid for the period. You may use this information to compare the ongoing costs of investing in the Portfolio and other funds. To do so, compare this 5%
31
2007 Annual Report | |
| |
December 31, 2007 | |
Investment Overview (cont’d)
Global Franchise Portfolio
hypothetical example with the 5% hypothetical examples that appear in the shareholder reports of the other funds.
Please note that the expenses shown in the table are meant to highlight your ongoing costs only and do not reflect any transactional costs, such as redemption fees. Therefore, the second line of the table is useful in comparing ongoing costs only, and will not help you determine the relative total costs of owning different funds. In addition, if these transactional costs were included, your costs would have been higher.
| | Beginning
Account Value | | Ending Account
Value
December 31, | | Expenses Paid
During Period*
July 1, 2007 —
December 31, | |
| | July 1, 2007 | | 2007 | | 2007 | |
Class A | | | | | | | |
Actual | | $1,000.00 | | $1,003.20 | | $5.15 | |
Hypothetical (5% average annual return before expenses) | | 1,000.00 | | 1,020.06 | | 5.19 | |
| | | | | | | |
Class B | | | | | | | |
Actual | | 1,000.00 | | 1,001.10 | | 6.46 | |
Hypothetical (5% average annual return before expenses) | | 1,000.00 | | 1,018.75 | | 6.51 | |
* | Expenses are equal to Class A and Class B annualized net expense ratios of 1.02% and 1.28%, respectively, multiplied by the average account value over the period, multiplied by 184/365 (to reflect the one-half year period). |
Graphic Presentation of Portfolio Holdings
The following graph depicts the Portfolio’s holdings by industry and/or security type, as a percentage of total investments.
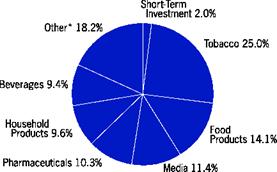
* | Industries which do not appear in the above graph, as well as those which represent less than 5% of total investments, if applicable, are included in the category labeled “Other”. |
32
| 2007 Annual Report |
| |
| December 31, 2007 |
Portfolio of Investments
Global Franchise Portfolio
| | Shares | | Value
(000) |
Common Stocks (97.7%) | | | | |
Finland (3.6%) | | | | |
Kone Oyj, Class B | | 59,684 | | $ 4,148 |
France (5.6%) | | | | |
Pernod-Ricard S.A. | | 14,216 | | 3,274 |
Sanofi-Aventis S.A. | | 35,499 | | 3,245 |
| | | | 6,519 |
Ireland (1.8%) | | | | |
C&C Group plc | | 352,455 | | 2,106 |
Japan (2.5%) | | | | |
Kao Corp. | | 96,000 | | 2,889 |
Netherlands (8.4%) | | | | |
Reed Elsevier N.V. | | 242,204 | | 4,805 |
Wolters Kluwer N.V. | | 153,002 | | 4,999 |
| | | | 9,804 |
Sweden (4.4%) | | | | |
Swedish Match AB | | 217,667 | | 5,179 |
Switzerland (5.0%) | | | | |
Nestle S.A. (Registered) | | 7,136 | | 3,270 |
Novartis AG (Registered) | | 46,100 | | 2,511 |
| | | | 5,781 |
United Kingdom (39.7%) | | | | |
British American Tobacco plc | | 278,261 | | 10,957 |
Cadbury Schweppes plc | | 453,542 | | 5,654 |
Diageo plc | | 135,303 | | 2,896 |
Experian Group Ltd. | | 358,029 | | 2,845 |
GlaxoSmithKline plc | | 123,015 | | 3,122 |
Imperial Tobacco Group plc | | 134,407 | | 7,318 |
Reckitt Benckiser plc | | 97,614 | | 5,639 |
Unilever plc | | 116,971 | | 4,387 |
WPP Group plc | | 267,391 | | 3,423 |
| | | | 46,241 |
United States (26.7%) | | | | |
Altria Group, Inc. | | 74,298 | | 5,615 |
Brown-Forman Corp., Class B | | 36,474 | | 2,703 |
Career Education Corp. | | (a)82,155 | | 2,065 |
Fortune Brands, Inc. | | 42,817 | | 3,098 |
Harley-Davidson, Inc. | | 48,622 | | 2,271 |
Kellogg Co. | | 58,125 | | 3,047 |
Kimberly-Clark Corp. | | 36,988 | | 2,565 |
Moody’s Corp. | | 46,571 | | 1,663 |
Pfizer, Inc. | | 136,333 | | 3,099 |
Scotts Miracle-Gro Co. (The), Class A | | 61,251 | | 2,292 |
Weight Watchers International, Inc. | | 60,370 | | 2,728 |
| | | | 31,146 |
Total Common Stocks (Cost $86,750) | | | | 113,813 |
Short-Term Investment (2.0%) | | | | |
Investment Company (2.0%) | | | | |
Morgan Stanley Institutional Liquidity Government Portfolio
— Institutional Class (Cost $2,268) | | (o)2,268,328 | | $ 2,268 |
Total Investments (99.7%) (Cost $89,018) | | | | (v) 116,081 |
Other Assets in Excess of Liabilities (0.3%) | | | | 381 |
Net Assets (100%) | | | | $116,462 |
(a) | | Non-income producing security. | |
(o) | | See Note F within the Notes to Financial Statements regarding investment in Morgan Stanley Institutional Liquidity Government Portfolio — Institutional Class. |
(v) | | The approximate market value and percentage of the investments, $82,666,000 and 71.2%, respectively, represent the securities that have been fair valued under the fair valuation policy for international investments as described in Note A within the Notes to Financial Statements. |
Foreign Currency Exchange Contract Information:
The Portfolio had the following foreign currency exchange contract(s) open at period end:
Currency
to
Deliver
(000) | | Value
(000) | | Settlement
Date | | In
Exchange
For
(000) | | Value
(000) | | Net
Unrealized
Gain (Loss)
(000) | |
GBP | 10,650 | | | $21,187 | | | 1/24/08 | | USD | 21,571 | | | $21,571 | | | | $ 384 | | |
| | | | | | | | | | | |
| | | | | | | | | | | | | | | | | | | |
GBP — British Pound
USD — United States Dollar
The accompanying notes are an integral part of the financial statements. | | 33 |
2007 Annual Report | |
| |
December 31, 2007 | |
Investment Overview (unaudited)
Global Real Estate Portfolio
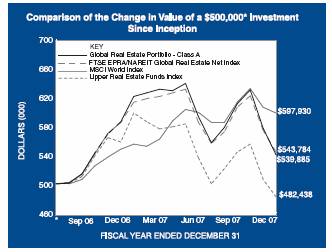
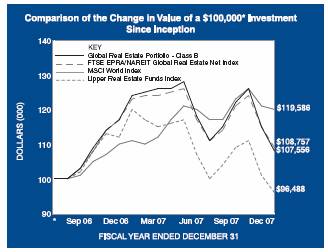
* | Minimum Investment |
** | Commenced operations on August 30, 2006 |
In accordance with SEC regulations, Portfolio’s performance shown assumes that all recurring fees (including management fees) were deducted and all dividends and distributions were reinvested. The performance of Class B shares will vary from the Class A shares and will be negatively impacted by additional fees assessed to this class.
Performance Compared to the FTSE EPRA/NAREIT Global Real Estate Net Index(1), the Morgan Stanley Capital International (MSCI) World Index(2) and the Lipper Real Estate Funds Index(3)
| | Total Returns(4) | | |
| | Average Annual | | |
| | One | | Since | |
| | Year | | Inception | (6) |
| | | | | |
Portfolio – Class A (5) | | (7.87 | )% | | 5.91 | % |
FTSE EPRA/NAREIT Global Real Estate Net Index | | (7.06 | ) | | 6.48 | |
MSCI World Index | | 9.04 | | | 14.31 | |
Lipper Real Estate Funds Index | | (13.50 | ) | | (2.64 | ) |
| | | | | | |
Portfolio – Class B (5) | | (8.15 | ) | | 5.60 | |
FTSE EPRA/NAREIT Global Real Estate Net Index | | (7.06 | ) | | 6.48 | |
MSCI World Index | | 9.04 | | | 14.31 | |
Lipper Real Estate Funds Index | | (13.50 | ) | | (2.64 | ) |
| | | | | | | | |
Performance data quoted represents past performance, which is no guarantee of future results, and current performance may be lower or higher than the figures shown. Performance assumes that all dividends and distributions, if any, were reinvested. For the most recent month-end performance figures, please visit www.morganstanley.com/msim. Investment return and principal value will fluctuate so that Portfolio shares, when redeemed, may be worth more or less than their original cost. Total returns do not reflect the deduction of taxes that a shareholder would pay on Portfolio distributions or the redemption of Portfolio shares.
(1) | | The FTSE EPRA/NAREIT Global Real Estate Net Index is a market capitalization weighted index designed to reflect the stock performance of companies engaged in the North American, European and Asian real estate markets. The performance of the Index is listed in U.S. dollars and assumes reinvestment of net dividends. “Net dividends” reflects a reduction in dividends after taking into account withholding of taxes by certain foreign countries represented in the Index. The Index is unmanaged and its returns do not include any sales charges or fees. Such costs would lower performance. It is not possible to invest directly in an index. |
(2) | | The Morgan Stanley Capital International (MSCI) World Index is a free float-adjusted market capitalization index that is designed to measure global developed market equity performance. The term “free float” represents the portion of shares outstanding that are deemed to be available for purchase in the public equity markets by investors. The MSCI World Index consists of the following 23 developed market country indices: Australia, Austria, Belgium, Canada, Denmark, Finland, France, Germany, Greece, Hong Kong, Ireland, Italy, Japan, Netherlands, New Zealand, Norway, Portugal, Singapore, Spain, Sweden, Switzerland, the United Kingdom and the United States. The Index is unmanaged and its returns do not include any sales charges or fees. Such costs would lower performance. It is not possible to invest directly in an index. |
(3) | | The Lipper Real Estate Funds Index is an equally weighted performance index of the largest qualifying funds (based on net assets) in the Lipper Real Estate Funds classification. The Index, which is adjusted for capital gains distributions and income dividends, is unmanaged and should not be considered an investment. There are currently 30 funds represented in this Index. As of the date of this report, the Portfolio is in the Lipper Real Estate Funds classification. |
(4) | | Total returns for the Portfolio reflect fees waived and expenses reimbursed, if applicable, by the Adviser. Without such waivers and reimbursements, total returns would have been lower. Fee waivers and/or expense reimbursements are voluntary and the Adviser reserves the right to commence or terminate any waiver and/or reimbursement at any time. |
(5) | | Commenced operations on August 30, 2006 |
34
| 2007 Annual Report |
| |
| December 31, 2007 |
Investment Overview (cont’d)
Global Real Estate Portfolio
(6) | | For comparative purposes, cumulative since inception returns listed for the Indexes refer to the inception date or initial offering of the respective share class of the Portfolio, not the inception of the Index. |
The Global Real Estate Portfolio (the “Portfolio”) seeks to provide current income and capital appreciation by investing primarily in equity securities of companies in the real estate industry located throughout the world, including real estate operating companies, real estate investment trusts and similar entities established outside the U.S. (foreign real estate companies). Foreign investing involves certain risks, including currency fluctuations and controls, restrictions on foreign investments, less governmental supervision and regulation, less liquidity and the potential for market volatility and political instability. The risks of investing in emerging-market countries are greater than the risks generally associated with foreign investments. In addition to the general risks associated with real-estate investment, REIT investing entails other risks, such as credit and interest-rate risk.
Performance
For the year ended December 31, 2007, the Portfolio had a total return based on net asset value and reinvestment of distributions per share of -7.87% for the Class A shares, net of fees, and -8.15% for the Class B shares. The Portfolio’s Class A and Class B shares underperformed against its benchmarks, the FTSE EPRA/NAREIT Global Real Estate Net Index (the “Index”) which returned -7.06% and the MSCI World Index which returned 9.04%.
Factors Affecting Performance
· | | At the end of the period, the Portfolio was overweight the Asian listed property sector and underweight both the European and U.S. listed property sectors. Global allocation among the three regions contributed to performance. |
| | |
· | | The Portfolio’s underperformance relative to the Index was driven by positioning within its European and U.S. portfolios, although we generated outperformance within the Asian portfolio. |
| | |
· | | In Europe, we believed there were prospects for declines in asset values for stocks on the Continent, which were trading at a discount to current NAVs. In contrast, we believed there was significant potential upside in the U.K., where the stocks were trading at discounted valuations that appeared too wide, even after adjusting for the prospective declines in asset values. In addition, a number of the major property companies in the U.K. continued to repurchase shares as a result of the wide disparity between share prices and the private market value of their portfolios. As a result, within Europe, the Portfolio was overweight the U.K. and underweight the Continent. |
| | |
· | | The Portfolio’s stock selection within and overweight to the U.K. hampered returns during the period. Stock selection in Sweden and an underweighted position in Germany contributed to returns. |
| | |
· | | The Portfolio was underweight the U.S., as we believe the market faces prospects for declines in underlying asset values as a result of continued tightening of credit in the debt markets and prospects for a weaker economy. Within the U.S. portfolio, performance was hurt by stock selection within and an underweight to the health care sector, as well as an underweight to the industrial sector. Stock selection in the office sector and an overweight to the hotel sector also hampered returns. On a more positive note, stock selection within and an overweight to the mall sector contributed to returns, as well as stock selection in the shopping center sector. |
| | |
· | | We believe the Asian listed property sector will continue to benefit from improving underlying asset values and property fundamentals, and as a result overweighted Asia in the Portfolio. The overweight position was dominated by Japanese and Hong Kong real estate operating companies (REOCs). In Japan, the REOCs ended the year trading at significant discounts to NAV, as the share prices do not appear to appropriately reflect the prospect for several years of continued strong NAV growth. In Hong Kong, the REOCs experienced very strong share price improvements during the year and ended the year trading at modest premiums, reflecting market expectations for continued strong NAV growth. We continue to prefer the Asian REOCs, as we believe these companies continue to offer better value relative to the REITs and possess the ability to engage in value- added opportunities such as the development of new assets and redevelopment of existing assets, as opposed to the Asian REITs, which are externally managed vehicles and limited to property ownership. |
| | |
· | | The Portfolio’s returns benefited from stock selection within and an underweight to the Australian Listed Property Trust (LPT) sector, which experienced significant share price declines in late 2007 and ended the year trading in-line with unadjusted NAVs, which do not appear to reflect prospects for declines in asset values, particularly for those companies with offshore exposure. The Portfolio also benefited from an overweight to Hong Kong, while stock selection in Japan detracted from returns. |
35
2007 Annual Report | |
| |
December 31, 2007 | |
Investment Overview (cont’d)
Global Real Estate Portfolio
· | | While we continue to expect several years of strong NAV growth in Asia, there has been a noticeable change in sentiment toward REITs in the U.S. and Europe, where current share prices appear to reflect expectations for prospective declines in private real estate values, which may be due to (i) a slowdown in the weight and pace of capital being deployed to real estate, (ii) a weaker outlook for further cash flow growth or (iii) higher required return expectations and risk premiums for real estate. It is important to note that real estate securities were vulnerable to some profit-taking and portfolio rebalancing after years of very strong performance, even without any material declines in underlying real asset values. Thus, selling pressure from non-dedicated equity investors and mutual fund redemptions in dedicated REIT portfolios should not be surprising given recent concerns over possible declines in asset values and several years of significant outperformance versus the broader equity market. |
| | |
· | | However, we believe that longer term investors will remain committed to maintaining a strategic allocation to the sector due to its expected returns and the diversification benefits from its lack of meaningful correlation to other asset classes. |
Management Strategies
· | | The global Portfolio is comprised of three regional portfolios with a global allocation which weights each of the three major regions (U.S., Europe and Asia) based on our view of the relative attractiveness of each region in terms of underlying real estate fundamentals and public market valuations. |
| | |
· | | Moreover, each of the regional portfolios reflects our core investment philosophy as a real estate value investor, which results in the ownership of stocks that we believe provide the best valuation relative to their underlying real estate values, while maintaining portfolio diversification. |
· | | Our company specific research leads us to specific preferences for sub-segments within each of the property sectors and countries. |
Expense Examples
As a shareholder of the Portfolio, you may incur two types of costs: (1) transactional costs, including redemption fees; (2) ongoing costs, including management fees, shareholder servicing fees (in the case of Class B); and other Portfolio expenses. These examples are intended to help you understand your ongoing costs (in dollars) of investing in the Portfolio and to compare these costs with the ongoing costs of investing in other mutual funds.
The examples are based on an investment of $1,000 invested at the beginning of the six-month period ended December 31, 2007 and held for the entire six-month period.
Actual Expenses
The first line of the tables below provides information about actual account values and actual expenses. You may use the information in this line, together with the amount you invested, to estimate the expenses that you paid over the period. Simply divide your account value by $1,000 (for example, an $8,600 account value divided by $1,000 = 8.6), then multiply the result by the number in the first line under the heading entitled “Expenses Paid During Period” to estimate the expenses you paid on your account during this period.
Please note that “Expenses Paid During Period” are grossed up to reflect Portfolio expenses prior to the effect of Expense Offset (See Note E in the Notes to Financial Statements). Therefore, the annualized net expense ratios may differ from the ratio of the expenses to average net assets shown in the Financial Highlights.
Hypothetical Example for Comparison Purposes
The second line of the tables below provides information about hypothetical account values and hypothetical expenses based on the Portfolio’s actual expense ratio and an assumed rate of return of 5% per year before expenses, which is not the Portfolio’s actual return. The hypothetical account values and expenses may not be used to estimate the actual ending account balance or expenses you paid for the period. You may use this information to compare the ongoing costs of investing in the Portfolio and other funds. To do so, compare this 5% hypothetical example with the 5% hypothetical examples that appear in the shareholder reports of the other funds.
36
| 2007 Annual Report |
| |
| December 31, 2007 |
Investment Overview (cont’d)
Global Real Estate Portfolio
Please note that the expenses shown in the table are meant to highlight your ongoing costs only and do not reflect any transactional costs, such as redemption fees. Therefore, the second line of the table is useful in comparing ongoing costs only, and will not help you determine the relative total costs of owning different funds. In addition, if these transactional costs were included, your costs would have been higher.
| | Beginning
Account Value | | Ending Account
Value
December 31, | | Expenses Paid
During Period*
July 1, 2007—
December 31, | |
| | July 1, 2007 | | 2007 | | 2007 | |
Class A | | | | | | | |
Actual | | $1,000.00 | | $910.30 | | $4.86 | |
Hypothetical (5% average annual return before expenses) | | 1,000.00 | | 1,020.11 | | 5.14 | |
Class B | | | | | | | |
Actual | | 1,000.00 | | 909.00 | | 6.11 | |
Hypothetical (5% average annual return before expenses) | | 1,000.00 | | 1,018.80 | | 6.46 | |
* Expenses are equal to Class A and Class B annualized net expense ratios of 1.01% and 1.27%, respectively, multiplied by the average account value over the period, multiplied by 184/365 (to reflect the one-half year period).
Graphic Presentation of Portfolio Holdings
The following graph depicts the Portfolio’s holdings by industry and/or security type, as a percentage of total investments.
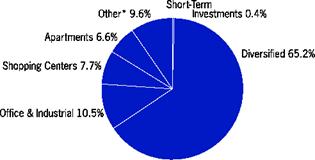
* Industries which do not appear in the above graph, as well as those which represent less than 5% of total investments, if applicable, are included in the category labeled “Other”.
37
2007 Annual Report
December 31, 2007
Portfolio of Investments
Global Real Estate Portfolio
| | | | Value | |
| | Shares | | (000) | |
Common Stocks (95.8%) | | | | | |
Australia (9.6%) | | | | | |
Centro Properties Group REIT | | 737,418 | | $ 649 | |
CFS Retail Property Trust REIT | | 1,331,108 | | 2,727 | |
DB RREEF Trust REIT | | 2,174,900 | | 3,805 | |
Goodman Group REIT | | 1,185,386 | | 5,101 | |
GPT Group REIT | | 1,559,423 | | 5,505 | |
ING Industrial Fund REIT | | 375,300 | | 834 | |
Macquarie CountryWide Trust REIT | | 614,000 | | 886 | |
Mirvac Group REIT | | 599,071 | | 3,150 | |
Stockland REIT | | 1,236,800 | | 9,104 | |
Westfield Group REIT | | 1,649,315 | | 30,220 | |
| | | | 61,981 | |
Austria (0.6%) | | | | | |
CA Immobilien Anlagen AG | | (a)10,383 | | 231 | |
Conwert Immobilien Invest AG | | (a)54,593 | | 962 | |
IMMOFINANZ AG | | 240,900 | | 2,428 | |
| | | | 3,621 | |
Canada (0.1%) | | | | | |
RioCan REIT | | 37,700 | | 834 | |
Finland (0.4%) | | | | | |
Sponda Oyj | | 215,990 | | 2,567 | |
France (3.5%) | | | | | |
Fonciere Des Regions REIT | | 11,548 | | 1,454 | |
Gecina S.A. REIT | | 10,411 | | 1,632 | |
Klepierre REIT | | 60,599 | | 3,077 | |
Silic REIT | | 12,757 | | 1,863 | |
Unibail-Rodamco REIT | | 67,526 | | 14,698 | |
| | | | 22,724 | |
Germany (0.5%) | | | | | |
Alstria Office AG REIT | | (a)161,587 | | 2,422 | |
IVG Immobilien AG | | 33,218 | | 1,124 | |
| | | | 3,546 | |
Hong Kong (16.9%) | | | | | |
China Overseas Land & Investment Ltd. | | 3,299,000 | | 6,765 | |
China Resources Land Ltd. | | 754,000 | | 1,644 | |
Guangzhou R&F Properties Co., Ltd., Class H | | 2,308,100 | | 8,125 | |
Hang Lung Properties Ltd. | | 547,000 | | 2,446 | |
Henderson Land Development Co., Ltd. | | 1,070,000 | | 9,918 | |
Hongkong Land Holdings Ltd. | | 2,638,000 | | 12,950 | |
Hysan Development Co., Ltd. | | 1,745,430 | | 4,945 | |
Kerry Properties Ltd. | | 1,163,627 | | 9,280 | |
KWG Property Holding Ltd. | | (a)1,252,000 | | 1,830 | |
New World China Land Ltd. | | 3,842,000 | | 3,429 | |
New World Development Ltd. | | 3,193,629 | | 11,210 | |
Sino Land Co. | | 244,000 | | 856 | |
Sun Hung Kai Properties Ltd. | | 1,694,000 | | 35,637 | |
| | | | 109,035 | |
Italy (0.5%) | | | | | |
Aedes S.p.A. | | 24,224 | | 123 | |
Beni Stabili S.p.A. | | 1,533,467 | | 1,660 | |
Risanamento S.p.A. | | (a)259,951 | | 1,397 | |
| | | | 3,180 | |
Japan (14.2%) | | | | | |
Daibiru Corp. | | 43,300 | | $ 464 | |
Goldcrest Co., Ltd. | | 59,450 | | 1,770 | |
Japan Real Estate Investment Corp. REIT | | 322 | | 3,980 | |
KK DaVinci Advisors | | (a)2,040 | | 1,794 | |
Mitsubishi Estate Co., Ltd. | | 1,182,000 | | 28,334 | |
Mitsui Fudosan Co., Ltd. | | 992,000 | | 21,439 | |
Mori Trust Sogo, Inc. REIT | | 72 | | 765 | |
Nippon Building Fund, Inc. REIT | | 407 | | 5,698 | |
Nomura Real Estate Office Fund, Inc. REIT | | 151 | | 1,420 | |
NTT Urban Development Corp. | | 1,884 | | 3,001 | |
Sumitomo Realty & Development Co., Ltd. | | 757,000 | | 18,619 | |
TOC Co., Ltd. | | 70,500 | | 535 | |
Tokyo Tatemono Co., Ltd. | | 210,000 | | 1,977 | |
Tokyu Land Corp. | | 248,000 | | 2,122 | |
| | | | 91,918 | |
Netherlands (1.2%) | | | | | |
Corio N.V. REIT | | 19,111 | | 1,538 | |
Eurocommercial Properties N.V. CVA REIT | | 38,458 | | 1,974 | |
ProLogis European Properties | | 188,930 | | 2,741 | |
Vastned Retail N.V. REIT | | 1,273 | | 122 | |
Wereldhave N.V. REIT | | 11,078 | | 1,205 | |
| | | | 7,580 | |
Singapore (3.5%) | | | | | |
CapitaLand Ltd. | | 1,137,000 | | 4,889 | |
CapitaMall Trust REIT | | 1,079,000 | | 2,566 | |
CapitaRetail China Trust REIT | | (a)708,100 | | 1,051 | |
Macquarie MEAG Prime REIT | | 3,545,000 | | 2,702 | |
Suntec REIT | | 855,500 | | 1,016 | |
United Industrial Corp., Ltd. | | 4,920,000 | | 9,370 | |
Wheelock Properties S Ltd. | | 872,000 | | 1,289 | |
| | | | 22,883 | |
Sweden (0.7%) | | | | | |
Castellum AB | | 138,084 | | 1,418 | |
Hufvudstaden AB, Class A | | 296,196 | | 2,815 | |
| | | | 4,233 | |
Switzerland (0.2%) | | | | | |
PSP Swiss Property AG (Registered) | | (a)28,545 | | 1,436 | |
United Kingdom (9.9%) | | | | | |
Big Yellow Group plc REIT | | 181,556 | | 1,570 | |
British Land Co. plc REIT | | 603,513 | | 11,249 | |
Brixton plc REIT | | 557,327 | | 3,242 | |
Capital & Regional plc | | 303,876 | | 2,391 | |
Derwent London plc REIT | | 128,709 | | 3,592 | |
Grainger plc | | 289,685 | | 2,003 | |
Great Portland Estates plc REIT | | 299,035 | | 2,834 | |
Hammerson plc REIT | | 321,470 | | 6,539 | |
Invista Foundation Property Trust Ltd. | | 158,279 | | 255 | |
Land Securities Group plc REIT | | 384,361 | | 11,430 | |
Liberty International plc REIT | | 192,149 | | 4,089 | |
Mapeley Ltd. | | 8,299 | | 249 | |
Millennium & Copthorne Hotels plc | | 145,360 | | 1,173 | |
Minerva plc | | (a)820,179 | | 2,173 | |
Quintain Estates & Development plc | | 214,106 | | 2,175 | |
38 | | The accompanying notes are an integral part of the financial statements. |
| 2007 Annual Report |
| |
| December 31, 2007 |
Portfolio of Investments (cont’d)
Global Real Estate Portfolio
| | | | Value | |
| | Shares | | (000) | |
United Kingdom (cont’d) | | | | | |
Safestore Holdings Ltd. | | 184,389 | | $ 636 | |
Segro plc REIT | | 575,114 | | 5,340 | |
Shaftesbury plc REIT | | 177,770 | | 1,764 | |
Unite Group plc | | 173,709 | | 1,216 | |
| | | | 63,920 | |
United States (34.0%) | | | | | |
Acadia Realty Trust REIT | | 73,537 | | 1,883 | |
AMB Property Corp. REIT | | 75,558 | | 4,349 | |
Assisted Living Concepts, Inc., Class A | | (a)288,690 | | 2,165 | |
AvalonBay Communities, Inc. REIT | | 117,773 | | 11,087 | |
Boston Properties, Inc. REIT | | (c)140,255 | | 12,877 | |
Brandywine Realty Trust REIT | | 137,724 | | 2,469 | |
BRE Properties, Inc. REIT | | 55,190 | | 2,237 | |
Brookfield Properties Corp. | | 625,913 | | 12,049 | |
Camden Property Trust REIT | | 62,603 | | 3,014 | |
Cedar Shopping Centers, Inc. REIT | | 32,656 | | 334 | |
Cogdell Spencer, Inc. REIT | | 4,720 | | 75 | |
DCT Industrial Trust, Inc. REIT | | 94,175 | | 877 | |
Developers Diversified Realty Corp. REIT | | 25,710 | | 985 | |
DiamondRock Hospitality Co. REIT | | 45,070 | | 675 | |
Duke Realty Corp. REIT | | 202,935 | | 5,293 | |
Equity Lifestyle Properties, Inc. REIT | | (a)(c)66,636 | | 3,044 | |
Equity One, Inc. REIT | | 7,465 | | 172 | |
Equity Residential Property Trust REIT | | 453,431 | | 16,537 | |
Essex Property Trust, Inc. REIT | | 32,086 | | 3,128 | |
Exeter Industrial Value Fund LP | | (d)200,000 | | 200 | |
Federal Realty Investment Trust REIT | | 51,752 | | 4,251 | |
Forest City Enterprises, Inc., Class A | | (c)125,256 | | 5,566 | |
General Growth Properties, Inc. REIT | | 87,746 | | 3,613 | |
GMH Communities Trust REIT | | 79,930 | | 441 | |
Healthcare Realty Trust, Inc. REIT | | 208,220 | | 5,287 | |
Hersha Hospitality Trust REIT | | (c)85,136 | | 809 | |
Host Hotels & Resorts, Inc. REIT | | 755,954 | | 12,882 | |
Kilroy Realty Corp. REIT | | (c)18,365 | | 1,009 | |
LaSalle Hotel Properties REIT | | 15,330 | | 489 | |
Liberty Property Trust REIT | | (c)198,554 | | 5,720 | |
Macerich Co. (The) REIT | | 96,531 | | 6,860 | |
Mack-Cali Realty Corp. REIT | | 210,025 | | 7,141 | |
Morgans Hotel Group Co. | | (a)(c)116,881 | | 2,254 | |
Parkway Properties, Inc. REIT | | 1,162 | | 43 | |
Post Properties, Inc. REIT | | (c)151,261 | | 5,312 | |
ProLogis REIT | | 67,197 | | 4,259 | |
PS Business Parks, Inc. REIT | | 22,983 | | 1,208 | |
Public Storage REIT | | 80,658 | | 5,921 | |
Ramco-Gershenson Properties Trust REIT | | 33,055 | | 706 | |
Regency Centers Corp. REIT | | (c)101,415 | | 6,540 | |
Senior Housing Properties Trust REIT | | 157,191 | | 3,565 | |
Simon Property Group, Inc. REIT | | 247,343 | | 21,484 | |
SL Green Realty Corp. REIT | | (c)40,458 | | 3,781 | |
Sovran Self Storage, Inc. REIT | | (c)49,659 | | 1,991 | |
Starwood Hotels & Resorts Worldwide, Inc. | | 281,422 | | 12,391 | |
Strategic Hotels & Resorts, Inc. REIT | | 193,338 | | 3,235 | |
Sunstone Hotel Investors, Inc. REIT | | 20 | | @— | |
Taubman Centers, Inc. REIT | | 23,986 | | 1,180 | |
U-Store-It Trust REIT | | 15,090 | | $ 138 | |
Universal Health Reality Income Trust REIT | | 4,887 | | 173 | |
Ventas, Inc. REIT | | 6,410 | | 290 | |
Vornado Realty Trust REIT | | 85,190 | | 7,493 | |
Weingarten Realty Investors REIT | | 2,220 | | 70 | |
| | | | 219,552 | |
Total Common Stocks (Cost $689,694) | | | | 619,010 | |
| | Face | | | |
| | Amount | | | |
| | (000) | | | |
| | | | | |
Short-Term Investments (0.4%) | | | | | |
Short-Term Debt Securities held as Collateral on Loaned Securities (0.4%) | | | | | |
Alliance & Leicester plc, | | | | | |
5.26%, 9/2/08 | | $ (h)79 | | 79 | |
Bancaja, | | | | | |
5.35%, 8/12/08 | | 39 | | 39 | |
Bank of New York Co., Inc., | | | | | |
5.24%, 8/8/08 | | (h)39 | | 39 | |
BASF AG, | | | | | |
5.18%, 8/19/08 | | (h)39 | | 39 | |
BNP Paribas plc, | | | | | |
4.90%, 5/19/08 | | (h)79 | | 79 | |
CAM US Finance S.A. Unipersonal, | | | | | |
5.24%, 7/25/08 | | (h)158 | | 158 | |
Canadian Imperial Bank of Commerce, New York, | | | | | |
4.42%, 7/28/08 | | (h)79 | | 79 | |
CC USA, Inc., | | | | | |
3.89%, 1/28/08 | | (h)39 | | 39 | |
CIT Group Holdings, | | | | | |
5.23%, 6/18/08 | | (h)142 | | 142 | |
Citigroup Global Markets Holdings, Inc., | | | | | |
4.51%, 1/2/08 | | 538 | | 538 | |
Credit Suisse First Boston, New York, | | | | | |
4.32%, 3/14/08 | | (h)79 | | 79 | |
First Tennessee Bank, | | | | | |
5.05%, 8/15/08 | | (h)39 | | 39 | |
5.06%, 8/15/08 | | (h)158 | | 158 | |
Goldman Sachs Group, Inc., | | | | | |
4.62%, 2/13/09 | | (h)74 | | 74 | |
5.10%, 9/12/08 | | (h)39 | | 39 | |
HSBC Finance Corp., | | | | | |
5.26%, 8/5/08 | | (h)39 | | 39 | |
IBM Corp., | | | | | |
5.27%, 9/8/08 | | (h)158 | | 158 | |
Lehman Brothers, Inc., | | | | | |
4.49%, 1/2/08 | | 67 | | 67 | |
Macquarie Bank Ltd., | | | | | |
4.95%, 8/20/08 | | (h)79 | | 79 | |
Metropolitan Life Global Funding, | | | | | |
4.89%, 8/21/08 | | (h)118 | | 118 | |
National Bank of Canada, | | | | | |
5.21%, 4/2/08 | | (h)158 | | 158 | |
National Rural Utilities Cooperative Finance Corp., | | | | | |
5.24%, 9/2/08 | | (h)158 | | 158 | |
The accompanying notes are an integral part of the financial statements. | | 39 |
2007 Annual Report
December 31, 2007
Portfolio of Investments (cont’d)
Global Real Estate Portfolio
| | Face | | | |
| | Amount | | Value | |
| | (000) | | (000) | |
Short-Term Debt Securities held as Collateral on Loaned Securities (cont’d) | | | | | |
Nationwide Building Society, | | | | | |
4.92%, 7/28/08 | | $ (h)92 | | $ | 92 | |
Unicredito Italiano Bank (Ireland) plc, | | | | | |
5.04%, 8/14/08 | | (h)87 | | 87 | |
5.26%, 8/8/08 | | (h)55 | | 55 | |
Total Short-Term Investments (Cost $2,631) | | | | 2,631 | |
Total Investments (96.2%) (Cost $692,325) — including $2,594 of Securities Loaned | | | | (v) 621,641 | |
Other Assets in Excess of Liabilities (3.8%) | | | | 24,283 | |
Net Assets (100%) | | | | $ | 645,924 | |
(a) | Non-income producing security. |
(c) | All or a portion of security on loan at December 31, 2007. |
(d) | Security was valued at fair value — At December 31, 2007, the Portfolio held a fair valued security valued at approximately $200,000, representing less than 0.05% of net assets. |
(h) | Variable/Floating Rate Security — Interest rate changes on these instruments are based on changes in a designated base rates. The rates shown are those in effect on December 31, 2007. |
(v) | The approximate market value and percentage of the investments, $398,624,000 and 64.1%, respectively, represent the securities that have been fair valued under the fair valuation policy for international investments as described in Note A within the Notes to Financial Statements. |
CVA | Certificaten Van Aandelen |
REIT | Real Estate Investment Trust |
Foreign Currency Exchange Contract Information:
The Portfolio had the following foreign currency exchange contract(s) open at period end:
Currency
to
Deliver
(000) | | Value
(000) | | Settlement
Date | | In
Exchange
For
(000) | | Value
(000) | | Net
Unrealized
Appreciation
(Depreciation)
(000) | |
AUD | | 362 | | | $ 318 | | | 1/2/08 | | USD | | 317 | | | $ 317 | | | | $ (1) | | |
AUD | | 1,190 | | | 1,045 | | | 1/3/08 | | USD | | 1,046 | | | 1,046 | | | | 1 | | |
GBP | | 88 | | | 175 | | | 1/3/08 | | EUR | | 119 | | | 175 | | | | @— | | |
GBP | | 339 | | | 675 | | | 1/4/08 | | EUR | | 461 | | | 675 | | | | @— | | |
HKD | | 3,886 | | | 498 | | | 1/2/08 | | USD | | 498 | | | 498 | | | | @— | | |
HKD | | 12,552 | | | 1,610 | | | 1/3/08 | | USD | | 1,609 | | | 1,609 | | | | (1) | | |
JPY | | 53,630 | | | 480 | | | 1/7/08 | | USD | | 471 | | | 471 | | | | (9) | | |
JPY | | 174,604 | | | 1,563 | | | 1/8/08 | | USD | | 1,558 | | | 1,558 | | | | (5) | | |
SGD | | 172 | | | 119 | | | 1/2/08 | | USD | | 118 | | | 118 | | | | (1) | | |
SGD | | 375 | | | 260 | | | 1/3/08 | | USD | | 259 | | | 259 | | | | (1) | | |
USD | | 210 | | | 210 | | | 1/2/08 | | EUR | | 142 | | | 208 | | | | (2) | | |
| | | | | $ 6,953 | | | | | | | | | | $ 6,934 | | | | $ (19) | | |
AUD | — Australian Dollar |
EUR | — Euro |
GBP | — British Pound |
HKD | — Hong Kong Dollar |
JPY | — Japanese Yen |
SGD | — Singapore Dollar |
USD | — United States Dollar |
@ | Value is less than $500. |
40 | The accompanying notes are an integral part of the financial statements. |
2007 Annual Report
December 31, 2007
Investment Overview (unaudited)
Global Value Equity Portfolio
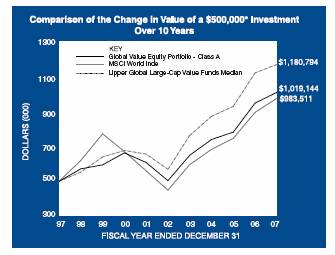
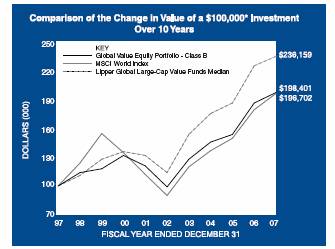
* Minimum Investment
In accordance with SEC regulations, Portfolio’s performance shown assumes that all recurring fees (including management fees) were deducted and all dividends and distributions were reinvested. The performance of Class B shares will vary from the Class A shares based upon its different inception date and will be negatively impacted by additional fees assessed to this class.
Performance Compared to the Morgan Stanley Capital International (MSCI) World Index(1) and the Lipper Global Large-Cap Value Funds Median(2)
| | Total Returns(3) | |
| | | | Average Annual |
| | One | | Five | | Ten | | Since |
| | Year | | Years | | Years | | Inception(6) |
| | | | | | | | | |
Portfolio – Class A (4) | | 6.65 | % | 15.10 | % | 7.38 | % | 11.69 | % |
MSCI World Index | | 9.04 | | 16.96 | | 7.00 | | 9.32 | |
Lipper Global Large-Cap Value Funds Median | | 4.34 | | 15.66 | | 8.97 | | — | |
| | | | | | | | | |
Portfolio – Class B (5) | | 6.37 | | 14.81 | | 7.09 | | 9.55 | |
MSCI World Index | | 9.04 | | 16.96 | | 7.00 | | 8.20 | |
Lipper Global Large-Cap Value Funds Median | | 4.34 | | 15.66 | | 8.97 | | 10.53 | |
Performance data quoted represents past performance, which is no guarantee of future results, and current performance may be lower or higher than the figures shown. Performance assumes that all dividends and distributions, if any, were reinvested. For the most recent month-end performance figures, please visit www.morganstanley.com/msim. Investment return and principal value will fluctuate so that Portfolio shares, when redeemed, may be worth more or less than their original cost. Total returns do not reflect the deduction of taxes that a shareholder would pay on Portfolio distributions or the redemption of Portfolio shares.
(1) The Morgan Stanley Capital International (MSCI) World Index is a free float-adjusted market capitalization index that is designed to measure global developed market equity performance. The term “free float” represents the portion of shares outstanding that are deemed to be available for purchase in the public equity markets by investors. The MSCI World Index consists of the following 23 developed market country indices: Australia, Austria, Belgium, Canada, Denmark, Finland, France, Germany, Greece, Hong Kong, Ireland, Italy, Japan, Netherlands, New Zealand, Norway, Portugal, Singapore, Spain, Sweden,
Switzerland, the United Kingdom and the United States. The Index is unmanaged and its returns do not include any sales charges or fees. Such costs would lower performance. It is not possible to invest directly in an index. |
(2) The Lipper Global Large-Cap Value Funds Median tracks the performance of all funds in the Lipper Global Large-Cap Value Funds classification. The Median, which is adjusted for capital gains distributions and income dividends, is unmanaged and should not be considered an investment.
(3) Total returns for the Portfolio reflect fees waived and expenses reimbursed, if applicable, by the Adviser. Without such waivers and reimbursements, total returns would have been lower. Fee waivers and/or expense reimbursements are voluntary and the Adviser reserves the right to commence or terminate any waiver and/or reimbursement at any time.
(4) Commenced operations on July 15, 1992
(5) Commenced operations on January 2, 1996
(6) For comparative purposes, average annual since inception returns listed for the Indexes refer to the inception date or initial offering of the respective share class of the Portfolio, not the inception of the Index.
The Global Value Equity Portfolio (the “Portfolio”) seeks long-term capital appreciation by investing primarily in equity securities of issuers throughout the world, including U.S. issuers. Foreign investing involves certain risks, including currency fluctuations and controls, restrictions on foreign investments, less governmental supervision and regulation, less
41
2007 Annual Report
December 31, 2007
Investment Overview (cont’d)
Global Value Equity Portfolio
liquidity and the potential for market volatility and political instability.
Performance
For the year ended December 31, 2007, the Portfolio had a total return based on net asset value and reinvestment of distributions per share of 6.65%, net of fees, for Class A shares and 6.37%, net of fees, for Class B shares. The Portfolio’s Class A and Class B shares underperformed against its benchmark, the Morgan Stanley Capital International (MSCI) World Index (the “Index”) which returned 9.04%.
Factors Affecting Performance
· The past year has been a difficult one for equity markets. Global economies were hit by significant credit losses, which led to increasingly tight liquidity, problems in the subprime mortgage sector and a declining U.S. housing market. Global equity markets have recently become dominated by sharp rises in a narrowing group of stocks displaying both earnings and price momentum. Outperformance has been largely concentrated in stocks connected to strength in commodity markets and China, as investors have sought refuge from a deteriorating outlook for the U.S. financial and consumer segments.
· The Portfolio underperformed its Index for the period primarily due to weakness in the financials, materials and health care sectors. Stocks within the financials sector sold off strongly in the second half of the year as investor concerns regarding the credit markets increased and holdings within the banks and diversified financials segments steeply declined as part of the broader sell-off in the financials sector. While stocks in the materials sector continued to be supported by high demand in emerging markets and the Portfolio’s holdings within this sector performed well, the Portfolio was underweight in the sector and, on valuation grounds, did not hold some of the stronger performing Index stocks. The Portfolio’s overweight allocation to the health care sector also hindered relative returns through the lackluster performance of pharmaceuticals stocks. In response, adjustments were made within the pharmaceutical segment of the Portfolio to overweight those stocks which are believed to have attractive earnings potential and are less likely to be impacted by the expiration of key patents.
· Despite these detractors, there were several areas that benefited relative performance. The Portfolio achieved strong gains within the consumer staples sector. Here, an overweight allocation and holdings within the food, beverage and tobacco group delivered positive returns. In the consumer discretionary sector, investment in the media segment greatly added to overall performance. Moreover, the Portfolio’s investments within the automobiles and components group helped relative returns. Select diversified holdings within the telecommunication services sector also produced strong returns, with both European and U.S. names delivering positive performance.
Management Strategies
· As of the close of the period, the Portfolio remained defensively positioned. We continued to hold key overweight positions in the cash generative consumer staples sector – which is dominated by food, beverage and tobacco stocks. While adjustments were made to the stock positioning within the pharmaceutical sector, the overweight position was maintained, and the positions held in this sector are well diversified geographically. Conversely, the Portfolio held an underweight allocation in the more cyclical sectors, including a significant underweight in industrials, particularly in European capital goods stocks. We were also underweighted in the materials sector as well as in the information technology sector, with holdings concentrated in the hardware and equipment group.
· We have carefully reviewed the Portfolio’s positioning within the financials sector, and are underweight relative to the Index. At the end of the period, the Portfolio was overweight the insurance group, underweight in diversified financials, and approximately market-weight in banks. Within the banks group, we have an overweight allocation in European banks as we believe they offer better value than the U.S. banks, where we remain underweight.
· In these volatile market conditions, we believe that adhering to our highly disciplined and established investment process is very important. We continue to focus on identifying investment opportunities which meet our valuation criteria as we believe that this is the key to achieving outperformance over the longer term.
Expense Examples
As a shareholder of the Portfolio, you may incur two types of costs: (1) transactional costs, including redemption fees; (2) ongoing costs, including management fees, shareholder servicing fees (in the case of Class B); and other Portfolio expenses. These examples are intended to help you understand your ongoing costs (in dollars) of investing in the Portfolio and to compare these costs with the ongoing costs of investing in other mutual funds.
The examples are based on an investment of $1,000 invested at the beginning of the six-month period ended December 31, 2007 and held for the entire six-month period.
42
2007 Annual Report
December 31, 2007
Investment Overview (cont’d)
Global Value Equity Portfolio
Actual Expenses
The first line of the tables below provides information about actual account values and actual expenses. You may use the information in this line, together with the amount you invested, to estimate the expenses that you paid over the period. Simply divide your account value by $1,000 (for example, an $8,600 account value divided by $1,000 = 8.6), then multiply the result by the number in the first line under the heading entitled “Expenses Paid During Period” to estimate the expenses you paid on your account during this period.
Please note that “Expenses Paid During Period” are grossed up to reflect Portfolio expenses prior to the effect of Expense Offset (See Note E in the Notes to Financial Statements). Therefore, the annualized net expense ratios may differ from the ratio of the expenses to average net assets shown in the Financial Highlights.
Hypothetical Example for Comparison Purposes
The second line of the tables below provides information about hypothetical account values and hypothetical expenses based on the Portfolio’s actual expense ratio and an assumed rate of return of 5% per year before expenses, which is not the Portfolio’s actual return. The hypothetical account values and expenses may not be used to estimate the actual ending account balance or expenses you paid for the period. You may use this information to compare the ongoing costs of investing in the Portfolio and other funds. To do so, compare this 5% hypothetical example with the 5% hypothetical examples that appear in the shareholder reports of the other funds.
Please note that the expenses shown in the table are meant to highlight your ongoing costs only and do not reflect any transactional costs, such as redemption fees. Therefore, the second line of the table is useful in comparing ongoing costs only, and will not help you determine the relative total costs of owning different funds. In addition, if these transactional costs were included, your costs would have been higher.
| | Beginning
Account Value
July 1,2007 | | Ending
Account Value
December 31,
2007 | | Expenses Paid
During Period*
July 1, 2007 —
December 31,
2007 | |
Class A | | | | | | | |
Actual | | $ 1,000.00 | | $ 969.70 | | $ 4.27 | |
Hypothetical (5% average annual return before expenses) | | 1,000.00 | | 1,020.87 | | 4.38 | |
| | | | | | | |
Class B | | | | | | | |
Actual | | 1,000.00 | | 968.50 | | 5.51 | |
Hypothetical (5% average annual return before expenses) | | 1,000.00 | | 1,019.61 | | 5.65 | |
* | Expenses are equal to Class A and Class B annualized net expense ratios of 0.86% and 1.11%, respectively, multiplied by the average account value over the period, multiplied by 184/365 (to reflect the one-half year period). |
| | | | | | | | |
Graphic Presentation of Portfolio Holdings
The following graph depicts the Portfolio’s holdings by industry and/or security type, as a percentage of total investments.
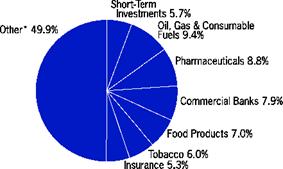
* | Industries which do not appear in the above graph, as well as those which represent less than 5% of total investments, if applicable, are included in the category labeled “Other”. |
43
2007 Annual Report
December 31, 2007
Portfolio of Investments
Global Value Equity Portfolio
| | | | Value | |
| | Shares | | (000) | |
Common Stocks (98.7%) | | | | | |
Australia (2.4%) | | | | | |
Boral Ltd. | | 68,861 | | $ | 369 | |
Foster’s Group Ltd. | | 91,018 | | 522 | |
Goodman Fielder Ltd. | | (c)792,118 | | 1,314 | |
| | | | 2,205 | |
France (7.6%) | | 21,773 | | 2,341 | |
BNP Paribas S.A. | | (c)10,614 | | 1,921 | |
Lafarge S.A. | | 11,830 | | 1,081 | |
Sanofi-Aventis S.A. | | (c)18,223 | | 1,512 | |
Total S.A. | | | | 6,855 | |
Germany (3.0%) | | | | | |
Bayerische Motoren Werke AG | | 15,869 | | 980 | |
Daimler AG | | 17,852 | | 1,729 | |
| | | | 2,709 | |
Ireland (2.1%) | | | | | |
Bank of Ireland | | 40,503 | | 601 | |
Kerry Group plc, Class A | | 40,764 | | 1,288 | |
| | | | 1,889 | |
Italy (1.1%) | | | | | |
ENI S.p.A. | | 28,134 | | 1,025 | |
Japan (10.2%) | | | | | |
Astellas Pharma, Inc. | | 15,100 | | 659 | |
Canon, Inc. | | 20,700 | | 946 | |
Kao Corp. | | 44,000 | | 1,324 | |
Keihin Corp. | | 73,400 | | 1,312 | |
Kuraray Co., Ltd. | | 36,000 | | 435 | |
Mitsui Sumitomo Insurance Co., Ltd. | | 61,000 | | 595 | |
Nissan Motor Co., Ltd. | | (c)94,000 | | 1,018 | |
Sankyo Co. | | 24,400 | | 1,131 | |
Sumitomo Electric Industries Ltd. | | (c)65,100 | | 1,037 | |
Takeda Pharmaceutical Co., Ltd. | | 12,800 | | 748 | |
| | | | 9,205 | |
Netherlands (4.7%) | | | | | |
Aegon N.V. | | 72,044 | | 1,264 | |
Koninklijke Philips Electronics N.V. | | 10,774 | | 467 | |
Unilever N.V. CVA | | 46,846 | | 1,715 | |
Wolters Kluwer N.V. | | 23,941 | | 782 | |
| | | | 4,228 | |
Norway (1.4%) | | | | | |
StatoilHydro ASA | | 41,321 | | 1,278 | |
Singapore (0.8%) | | | | | |
ComfortDelgro Corp., Ltd. | | 567,000 | | 713 | |
South Korea (0.9%) | | | | | |
SK Telecom Co., Ltd. ADR | | (c)27,035 | | 807 | |
Spain (4.0%) | | | | | |
Banco Bilbao Vizcaya Argentaria S.A. | | 58,370 | | 1,434 | |
Telefonica S.A. | | 67,302 | | 2,175 | |
| | | | 3,609 | |
Sweden (1.0%) | | | | | |
Telefonaktiebolaget LM Ericsson, Class B | | 403,318 | | 943 | |
Switzerland (3.1%) | | | | | |
Novartis AG (Registered) | | 32,213 | | $ | 1,755 | |
Syngenta AG (Registered) | | 1,855 | | 471 | |
UBS AG (Registered) | | 12,713 | | 590 | |
| | | | 2,816 | |
Taiwan (0.7%) | | | | | |
Chunghwa Telecom Co., Ltd. ADR | | (c)29,537 | | 624 | |
United Kingdom (20.3%) | | | | | |
Barclays plc | | 186,034 | | 1,884 | |
Cadbury Schweppes plc | | 186,721 | | 2,328 | |
GlaxoSmithKline plc | | 34,683 | | 880 | |
Imperial Tobacco Group plc | | 43,882 | | 2,389 | |
Old Mutual plc | | 314,834 | | 1,044 | |
Reed Elsevier plc | | 88,128 | | 1,186 | |
Rolls-Royce Group plc | | (a)92,707 | | 1,002 | |
Rolls-Royce Group plc, B Shares | | 5,391,986 | | 12 | |
Royal Bank of Scotland Group plc | | 137,649 | | 1,238 | |
Royal Dutch Shell plc ADR | | 21,817 | | 1,837 | |
Vodafone Group plc | | 296,286 | | 1,104 | |
WM Morrison Supermarkets plc | | 272,576 | | 1,758 | |
WPP Group plc | | 126,100 | | 1,614 | |
| | | | 18,276 | |
United States (35.4%) | | | | | |
Alcoa, Inc. | | 18,925 | | 692 | |
Altria Group, Inc. | | 43,299 | | 3,273 | |
American Electric Power Co., Inc. | | 10,665 | | 497 | |
American International Group, Inc. | | 16,774 | | 978 | |
Arrow Electronics, Inc. | | (a)25,487 | | 1,001 | |
AT&T, Inc. | | 14,301 | | 594 | |
Bank of New York/Mellon Corp. (The) | | 29,562 | | 1,441 | |
Chevron Corp. | | 20,308 | | 1,895 | |
Citigroup, Inc. | | 32,216 | | 948 | |
Covidien Ltd. | | (c)22,021 | | 975 | |
Dominion Resources, Inc. | | 16,784 | | 796 | |
EMC Corp. | | (a)62,146 | | 1,152 | |
Freddie Mac | | 28,686 | | 977 | |
Hewlett-Packard Co. | | 21,487 | | 1,085 | |
Illinois Tool Works, Inc. | | (c)16,963 | | 908 | |
Ingersoll Rand Co., Ltd. Class A | | (c)19,530 | | 908 | |
International Business Machines Corp. | | 20,217 | | 2,185 | |
Marsh & McClennan Cos., Inc. | | 43,610 | | 1,154 | |
Merrill Lynch & Co., Inc. | | 20,548 | | 1,103 | |
Peabody Energy Corp. | | 21,559 | | 1,329 | |
Pfizer, Inc. | | 29,596 | | 673 | |
Schering-Plough Corp. | | 33,767 | | 900 | |
Tyco International Ltd. | | (c)21,884 | | 868 | |
UnitedHealth Group, Inc. | | (c)35,924 | | 2,091 | |
Verizon Communications, Inc. | | 20,858 | | 911 | |
Viacom, Inc., Class B | | (a)(c)9,551 | | 419 | |
Weyerhauser Co. | | 6,233 | | 460 | |
Wyeth | | 38,210 | | 1,689 | |
| | | | 31,902 | |
Total Common Stocks (Cost $68,874) | | | | 89,084 | |
44 | The accompanying notes are an integral part of the financial statements. |
2007 Annual Report
December 31, 2007
Portfolio of Investments (cont’d)
Global Value Equity Portfolio
| | | | Value | |
| | Shares | | (000) | |
Investment Company (0.3%) | | | | | |
iShares MSCI World Index Fund (Cost $273) | | 8,061 | | $ | 271 | |
| | | | | |
| | Face
Amount
(000) | | | |
Short-Term Investments (6.0%) | | | | | |
Short-Term Debt Securities held as Collateral on Loaned Securities (5.1%) | | | | | |
Alliance & Leicester plc, | | | | | |
5.26%, 9/2/08 | | $ | (h)138 | | 138 | |
Bancaja, | | | | | |
5.35%, 8/12/08 | | 69 | | 69 | |
Bank of New York Co., Inc., | | | | | |
5.24%, 8/8/08 | | (h)69 | | 69 | |
BASF AG, | | | | | |
5.18%, 8/19/08 | | (h)69 | | 69 | |
BNP Paribas plc, | | | | | |
4.90%, 5/19/08 | | (h)138 | | 138 | |
CAM US Finance S.A. Unipersonal, | | | | | |
5.24%, 7/25/08 | | (h)276 | | 276 | |
Canadian Imperial Bank of Commerce, New York,
4.42%, 7/28/08 | | (h)138 | | 138 | |
CC USA, Inc., | | | | | |
3.89%, 1/28/08 | | (h)69 | | 69 | |
CIT Group Holdings, | | | | | |
5.23%, 6/18/08 | | (h)248 | | 248 | |
Citigroup Global Markets Holdings, Inc., | | | | | |
4.51%, 1/2/08 | | 940 | | 940 | |
Credit Suisse First Boston, New York, | | | | | |
4.32%, 3/14/08 | | (h)138 | | 138 | |
First Tennessee Bank, | | | | | |
5.05%, 8/15/08 | | (h)69 | | 69 | |
5.06%, 8/15/08 | | (h)276 | | 276 | |
Goldman Sachs Group, Inc., | | | | | |
4.62%, 2/13/09 | | (h)130 | | 130 | |
5.10%, 9/12/08 | | (h)69 | | 69 | |
HSBC Finance Corp., | | | | | |
5.26%, 8/5/08 | | (h)69 | | 69 | |
IBM Corp., | | | | | |
5.27%, 9/8/08 | | (h)276 | | 276 | |
Lehman Brothers, Inc., | | | | | |
4.49%, 1/2/08 | | 117 | | 117 | |
Macquarie Bank Ltd., | | | | | |
4.95%, 8/20/08 | | (h)138 | | 138 | |
Metropolitan Life Global Funding, | | | | | |
4.89%, 8/21/08 | | (h)207 | | 207 | |
National Bank of Canada, | | | | | |
5.21%, 4/2/08 | | (h)276 | | 276 | |
National Rural Utilities Cooperative Finance Corp., | | | | | |
5.24%, 9/2/08 | | (h)276 | | 276 | |
Nationwide Building Society, | | | | | |
4.92%, 7/28/08 | | (h)160 | | 160 | |
Unicredito Italiano Bank (Ireland) plc, | | | | | |
5.04%, 8/14/08 | | (h)152 | | 152 | |
5.26%, 8/8/08 | | (h)97 | | 97 | |
| | | | 4,604 | |
| | | | | | | |
| | | | Value | |
| | Shares | | (000) | |
Investment Company (0.9%) | | | | | |
Morgan Stanley Institutional Liquidity Money Market Portfolio — Institutional Class | | (o)783,195 | | $ | 783 | |
Total Short-Term Investments (Cost $5,387) | | | | 5,387 | |
Total Investments (105.0%) (Cost $74,534) — including $4,408 of Securities Loaned | | | | (v) 94,742 | |
Liabilities in Excess of Other Assets (-5.0%) | | | | (4,508) | |
Net Assets (100%) | | | | $ | 90,234 | |
(a) Non-income producing security.
(c) All or a portion of security on loan at December 31, 2007.
(h) Variable/Floating Rate Security — Interest rate changes on these instruments are based on changes in a designated rate. The rates shown are those in effect on December 31, 2007.
(o) See Note F within the Notes to Financial Statements regarding investment in Morgan Stanley Institutional Liquidity Money Market Portfolio — Institutional Class.
(v) The approximate market value and percentage of the investments, $54,186,000 and 57.2%, respectively, represent the securities that have been fair valued under the fair valuation policy for international investments as described in Note A within the Notes to Financial Statements.
ADR American Depositary Receipt
CVA Certificaten Van Aandelen
Foreign Currency Exchange Contract Information: |
The Portfolio had the following foreign currency exchange contract(s) open at period end:
Currency
to
Deliver
(000) | | Value
(000) | | Settlement
Date | | In
Exchange
For
(000) | | Value
(000) | | Net
Unrealized
Appreciation
(Depreciation)
(000) | |
GBP | 2,050 | | | | $4,073 | | | 3/12/08 | | USD | 4,172 | | | $4,172 | | | | $99 | | |
| | | | | | | | | | | | | | | | | | | | |
GBP | — | British Pound |
USD | — | United States Dollar |
The accompanying notes are an integral part of the financial statements. | 45 |
2007 Annual Report |
|
December 31, 2007 |
Investment Overview (unaudited)
International Equity Portfolio
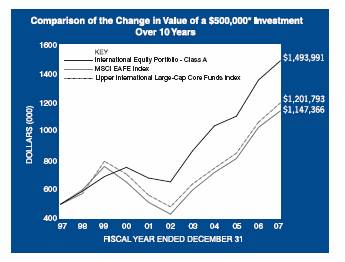
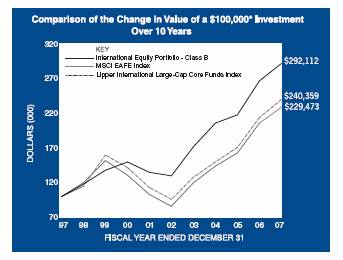
* Minimum Investment
In accordance with SEC regulations, Portfolio’s performance shown assumes that all recurring fees (including management fees) were deducted and all dividends and distributions were reinvested. The performance of Class B shares will vary from the Class A shares based upon its different inception date and will be negatively impacted by additional fees assessed to this class.
Performance Compared to the Morgan Stanley Capital International (MSCI) EAFE Index(1) and the Lipper International Large-Cap Core Funds Index(2)
| | Total Returns(3) | |
| | | | Average Annual | |
| | One | | Five | | Ten | | Since | |
| | Year | | Years | | Years | | Inception(6) | |
| | | | | | | | | |
Portfolio – Class A (4) | | 9.84 | % | 17.93 | % | 11.57 | % | 11.86 | % |
MSCI EAFE Index | | 11.17 | | 21.59 | | 8.66 | | 6.43 | |
Lipper International Large-Cap Core Funds Index | | 12.51 | | 20.03 | | 9.17 | | 9.26 | |
| | | | | | | | | |
Portfolio – Class B (5) | | 9.52 | | 17.63 | | 11.32 | | 12.09 | |
MSCI EAFE Index | | 11.17 | | 21.59 | | 8.66 | | 7.85 | |
Lipper International Large-Cap Core Funds Index | | 12.51 | | 20.03 | | 9.17 | | 9.60 | |
| | | | | | | | | | | |
Performance data quoted represents past performance, which is no guarantee of future results, and current performance may be lower or higher than the figures shown. Performance assumes that all dividends and distributions, if any, were reinvested. For the most recent month-end performance figures, please visit www.morganstanley.com/msim. Investment return and principal value will fluctuate so that Portfolio shares, when redeemed, may be worth more or less than their original cost. Total returns do not reflect the deduction of taxes that a shareholder would pay on Portfolio distributions or the redemption of Portfolio shares.
(1) The Morgan Stanley Capital International (MSCI) EAFE Index (Europe, Australasia, Far East) is a free float-adjusted market capitalization index that is designed to measure developed market equity performance, excluding the U.S. & Canada. The term “free float” represents the portion of shares outstanding that are deemed to be available for purchase in the public equity markets by investors. The MSCI EAFE Index consists of the following 21 developed market country indices: Australia, Austria,
Belgium, Denmark, Finland, France, Germany, Greece, Hong Kong, Ireland, Italy, Japan, the Netherlands, New Zealand, Norway, Portugal, Singapore, Spain, Sweden, Switzerland and the United Kingdom. The Index is unmanaged and its returns do not include any sales charges or fees. Such costs would lower performance. It is not possible to invest directly in an index. |
(2) The Lipper International Large-Cap Core Funds Index is an equally weighted performance index of the largest qualifying funds (based on net assets) in the Lipper International Large-Cap Core Funds classification. The Index, which is adjusted for capital gains distributions and income dividends, is unmanaged and should not be considered an investment. There are currently 30 funds represented in this Index. As of the date of this report, the Portfolio is in the Lipper International Large-Cap Core Funds classification.
(3) Total returns for the Portfolio reflect fees waived and expenses reimbursed, if applicable, by the Adviser. Without such waivers and/or reimbursements, total returns would have been lower. Fee waivers and/or expense reimbursements are voluntary and the Adviser reserves the right to commence or terminate any waiver and/or reimbursement at any time.
(4) Commenced operations on August 4, 1989
(5) Commenced operations on January 2, 1996
(6) For comparative purposes, average annual since inception returns listed for the Indexes refer to the inception date or initial offering of the respective share class of the Portfolio, not the inception of the Index.
The International Equity Portfolio (the “Portfolio”) seeks long-term capital appreciation by investing primarily in equity securities of non-U.S. issuers. Foreign investing involves certain risks, including currency fluctuations and controls,
46
| 2007 Annual Report |
| |
| December 31, 2007 |
Investment Overview (cont’d)
International Equity Portfolio
restrictions on foreign investments, less governmental supervision and regulation, less liquidity and the potential for market volatility and political instability. The risks of investing in emerging-market countries are greater than the risks generally associated with foreign investments.
Performance
For the year ended December 31, 2007, the Portfolio had a total return based on net asset value and reinvestment of distributions per share of 9.84% net of fees, for Class A shares and 9.52%, net of fees, for Class B shares. The Portfolio’s Class A and Class B shares underperformed against its benchmark, the Morgan Stanley Capital International (MSCI) EAFE Index (the “Index”) which returned 11.17%.
Factors Affecting Performance
· The Index fell by 2.3% in December, bringing the quarterly return to -1.8%, and reducing the Index return to 11.2% for 2007. The depreciation of the U.S. dollar was responsible for most of these gains as the Index rose just 3.5% in local currency terms for the year, in what became an increasingly schizophrenic and volatile trading environment. U.S. dollar depreciation was concentrated in the final four months of the year as credit concerns emerged and left the U.S. dollar down 10.9% against the Euro and 6.7% against the Yen for the year as a whole. Within the EAFE countries, there was considerable variation in market returns, from despondency in Japan (-4.2% USD), to elation in Hong Kong (+42%). Among European markets there was also considerable variation (Germany +35.2%, France + 13.2%, Italy +6.1% and Ireland -20%). Those markets with large exposures to financials, such as Italy or Ireland, did poorly, whereas markets with significant exposures to capital goods and material stocks, such as Germany, did well. The performance of Hong Kong’s market was a barometer for the continued strong demand and economic growth among the emerging markets, and also reflected its proximity to the group’s most dynamic constituent, China.
· Conversely, Japan’s performance was due to homegrown weakness, but anomalous in so far as there is no contagion from Western credit markets in either its financial system or its economy.
· The polarity in performance is even clearer when surveying by sector. The materials sector rose 32% in U.S. dollar terms for the year. Capital goods rose 22%, energy was up 22%, and utilities (which are to some degree an oil proxy) rose 24%. Conversely, banks fell 3.4% and retail declined 0.4% over the year.
Telecommunications (+28%) and consumer staples (+24%) also rose due to their defensive characteristics.
Management Strategies
· The Portfolio enjoyed bursts of strong relative performance during the few periods of market stress, and outperformed modestly in the schizophrenic final quarter. The Portfolio finished the year behind the Index for 2007 despite our prognosis relating to western credit markets and consequent major underweight allocation to western financial stocks. While this position did boost relative performance, several factors weighed against us. The first and most important was the continued momentum in cyclicals and our underweight to this sector. We have been concerned about valuations here for some time but the market has not shared our concerns, and these stocks performed best in 2007. The second factor was the exceptionally poor performance of Japan as a whole, and of Japanese financials in particular, where we are overweight versus the Index. Third was stock selection in the technology sector. We believe our valuation disagreements with the market could be a source of outperformance.
· We believe that equity markets have shrugged off credit market concerns in a most extraordinary and unsustainable way. Western economies – not just subprime borrowers in the U.S. – have lived off lending practices driven by the insatiable appetites of the structured debt markets for years. These markets are now shut and we are seeing considerable funding shortfalls emerge in the real economy; for companies (especially many banks and those in real estate) and individuals (a substantial margin of consumers in the U.S., U.K., Spain and Ireland) whose past activity has resulted in massive indebtedness. We believe that this will result in a major slowdown, yet the valuation of most cyclical stocks in the West are saying just the opposite. The pricing of profits as if they were at the bottom rather than the peak of the cycle is a phenomenon we find widespread – outside of Japan. In isolated areas where bear markets are well established, such as U.K. property, U.K. retail, U.K. housebuilding and in Spanish property, we are investigating high quality companies that have been sold off as potential new investment opportunities. We haven’t seen bear markets like these for many years and are excited as they often provide the best new ideas. These ideas add to an already large position in a “forgotten” bear market – Japan. Today we believe Japan equity is attractively valued: 45% of TOPIX stocks sell below book value, and the dividend yield of the TOPIX index exceeds the
47
| 2007 Annual Report |
| |
| December 31, 2007 |
Investment Overview (cont’d)
International Equity Portfolio
bond yield. Critically, the Japanese have generally not engaged in western credit practices either domestically or abroad and therefore as a financial sector and as an economy are not directly exposed to its unwinding. Elsewhere in Japan we find cyclicals de-rated, defensives attractively valued and, new management practices that are moving Japan, albeit slowly, to a much more shareholder-oriented stance. Consequently the Portfolio has a 24% allocation to Japan, its highest ever in both absolute and relative terms.
· Our largest positions in the Portfolio remain those with highly predictable free cash flow streams in dependable market positions with what we believe to be excellent management and valuations that still look attractive relative to bonds. We have held some of these for a long period but believe they will remain rewarding compounders over the long term, an attribute lacking elsewhere in an expensive, fragile market.
Expense Examples
As a shareholder of the Portfolio, you may incur two types of costs: (1) transactional costs, including redemption fees; (2) ongoing costs, including management fees, shareholder servicing fees (in the case of Class B); and other Portfolio expenses. These examples are intended to help you understand your ongoing costs (in dollars) of investing in the Portfolio and to compare these costs with the ongoing costs of investing in other mutual funds.
The examples are based on an investment of $1,000 invested at the beginning of the six-month period ended December 31, 2007 and held for the entire six-month period.
Actual Expenses
The first line of the tables below provides information about actual account values and actual expenses. You may use the information in this line, together with the amount you invested, to estimate the expenses that you paid over the period. Simply divide your account value by $1,000 (for example, an $8,600 account value divided by $1,000 = 8.6), then multiply the result by the number in the first line under the heading entitled “Expenses Paid During Period” to estimate the expenses you paid on your account during this period.
Please note that “Expenses Paid During Period” are grossed up to reflect Portfolio expenses prior to the effect of Expense Offset (See Note E in the Notes to Financial Statements). Therefore, the annualized net expense ratios may differ from the ratio of the expenses to average net assets shown in the Financial Highlights.
Hypothetical Example for Comparison Purposes
The second line of the tables below provides information about hypothetical account values and hypothetical expenses based on the Portfolio’s actual expense ratio and an assumed rate of return of 5% per year before expenses, which is not the Portfolio’s actual return. The hypothetical account values and expenses may not be used to estimate the actual ending account balance or expenses you paid for the period. You may use this information to compare the ongoing costs of investing in the Portfolio and other funds. To do so, compare this 5% hypothetical example with the 5% hypothetical examples that appear in the shareholder reports of the other funds.
Please note that the expenses shown in the table are meant to highlight your ongoing costs only and do not reflect any transactional costs, such as redemption fees. Therefore, the second line of the table is useful in comparing ongoing costs only, and will not help you determine the relative total costs of owning different funds. In addition, if these transactional costs were included, your costs would have been higher.
| | Beginning Account Value July 1, 2007 | Ending
Account Value December 31, 2007 | Expenses Paid During Period* July 1, 2007 —
December 31,
2007 | |
Class A | | | | | | | |
Actual | | $1,000.00 | | $ 995.80 | | $4.63 | |
Hypothetical (5% average annual return before expenses) | | 1,000.00 | | 1,020.57 | | 4.69 | |
| | | | | | | |
Class B | | | | | | | |
Actual | | 1,000.00 | | 994.30 | | 5.88 | |
Hypothetical (5% average annual return before expenses) | | 1,000.00 | | 1,019.31 | | 5.96 | |
| | | | | | | | | |
* | Expenses are equal to Class A and Class B annualized net expense ratios of 0.92% and 1.17%, respectively, multiplied by the average account value over the period, multiplied by 184/365 (to reflect the one-half year period). |
48
| 2007 Annual Report |
| |
| December 31, 2007 |
Investment Overview (cont’d)
International Equity Portfolio
Graphic Presentation of Portfolio Holdings
The following graph depicts the Portfolio’s holdings by industry and/or security type, as a percentage of total investments.
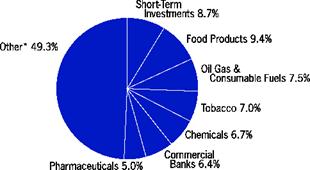
* Industries which do not appear in the above graph, as well as those which represent less than 5% of total investments, if applicable, are included in the category labeled “Other”.
49
2007 Annual Report |
|
December 31, 2007 |
Portfolio of Investments
International Equity Portfolio
| | | | Value |
| | Shares | | (000) |
Common Stocks (99.1%) | | | | |
Australia (1.7%) | | | | |
Foster's Group Ltd. | | 8,153,757 | | $ | 46,792 |
Orica Ltd. | | (c)658,945 | | 18,298 |
Santos Ltd. | | 2,976,309 | | 36,940 |
| | | | 102,030 |
Austria (0.8%) | | | | |
Telekom Austria AG | | 1,808,117 | | 50,108 |
Belgium (2.5%) | | | | |
Fortis | | 3,185,452 | | 83,122 |
Fortis Strip VVPR | | (a)694,410 | | 10 |
KBC Groep N.V. | | 521,576 | | 72,846 |
| | | | 155,978 |
Canada (0.7%) | | | | |
EnCana Corp. | | 661,087 | | 45,213 |
France (5.8%) | | | | |
ArcelorMittal | | (c)448,765 | | 34,506 |
BNP Paribas | | 436,090 | | 46,877 |
France Telecom S.A. | | (c)946,163 | | 33,955 |
Lafarge S.A. | | 206,484 | | 37,377 |
Legrand S.A. | | (c)2,346,378 | | 79,698 |
Total S.A. | | (c)1,512,232 | | 125,500 |
| | | | 357,913 |
Germany (8.8%) | | | | |
Bayer AG | | (c)1,343,965 | | 122,535 |
Bayerische Motoren Werke AG | | 1,077,974 | | 66,566 |
Daimler AG | | 721,995 | | 69,934 |
E.ON AG | | 335,034 | | 71,136 |
Porsche Automobil Holding SE (Non-Voting Shares) | | 39,330 | | 79,258 |
RWE AG | | (c)946,045 | | 132,569 |
| | | | 541,998 |
Greece (1.1%) | | | | |
OPAP S.A. | | 1,721,820 | | 68,744 |
Ireland (1.0%) | | | | |
CRH plc | | 1,764,254 | | 61,256 |
Italy (2.6%) | | | | |
ENI S.p.A. | | 2,562,401 | | 93,366 |
UniCredito Italiano S.p.A. | | 7,993,709 | | 66,527 |
| | | | 159,893 |
Japan (24.5%) | | | | |
Asatsu-DK, Inc. | | (c)741,485 | | 20,639 |
Astellas Pharma, Inc. | | 1,696,800 | | 74,027 |
Canon, Inc. | | (c)1,167,500 | | 53,344 |
Central Japan Railway Co. | | 2,986 | | 25,401 |
Chiba Bank Ltd. (The) | | 4,160,000 | | 33,704 |
Fukuoka Financial Group, Inc. | | 6,003,000 | | 35,804 |
Hoya Corp. | | (c)1,321,600 | | 42,179 |
JSR Corp. | | (c)1,294,200 | | 33,479 |
Kao Corp. | | 4,205,000 | | 126,530 |
Keyence Corp. | | (c)450,400 | | 110,339 |
Kyocera Corp. | | 364,300 | | 31,876 |
Mitsubishi Electric Corp. | | 5,125,000 | | 52,930 |
Mitsubishi Estate Co., Ltd. | | 1,359,000 | | $ | 32,576 |
Mitsui Sumitomo Insurance Co., Ltd. | | 10,102,000 | | 98,600 |
NGK Spark Plug Co., Ltd. | | (c)1,880,000 | | 32,820 |
Nitto Denko Corp. | | (c)1,242,400 | | 65,595 |
NTT DoCoMo, Inc. | | 56,095 | | 92,942 |
Omron Corp. | | 2,045,000 | | 48,404 |
Oriental Land Co., Ltd. | | (c)1,028,700 | | 62,093 |
Rohm Co., Ltd. | | 381,900 | | 33,240 |
Sega Sammy Holdings, Inc. | | (c)1,496,300 | | 18,680 |
Shinsei Bank Ltd. | | (c)10,570,000 | | 38,860 |
Sumitomo Mitsui Financial Group, Inc. | | (c)17,650 | | 131,336 |
T&D Holdings, Inc. | | (c)2,125,450 | | 110,014 |
Taiyo Nippon Sanso Corp. | | (c)5,375,000 | | 50,222 |
Teijin Ltd. | | 9,909,000 | | 42,355 |
| | | | 1,497,989 |
Netherlands (5.8%) | | | | |
Akzo Nobel N.V. | | 943,679 | | 75,149 |
CSM N.V. | | (c)1,538,660 | | 51,817 |
ING Groep N.V. CVA | | 1,910,264 | | 74,562 |
Unilever N.V. CVA | | 4,194,501 | | 153,572 |
| | | | 355,100 |
Norway (0.4%) | | | | |
StatoilHydro ASA | | 715,103 | | 22,110 |
Spain (2.1%) | | | | |
Telefonica S.A. | | (c)3,925,960 | | 126,876 |
Sweden (1.4%) | | | | |
Telefonaktiebolaget LM Ericsson, Class B | | 36,615,687 | | 85,606 |
Switzerland (9.5%) | | | | |
Givaudan S.A. (Registered) | | 36,021 | | 34,609 |
Holcim Ltd. (Registered) | | 1,221,923 | | 129,834 |
Nestle S.A. (Registered) | | 468,057 | | 214,470 |
Novartis AG (Registered) | | 1,873,039 | | 102,040 |
Roche Holding AG (Genusschein) | | 483,317 | | 83,252 |
UBS AG (Registered) | | 351,654 | | 16,331 |
| | | | 580,536 |
United Kingdom (30.4%) | | | | |
AstraZeneca plc | | 655,979 | | 28,186 |
BHP Billiton plc | | 1,747,957 | | 53,841 |
BP plc | | 8,115,190 | | 99,245 |
British American Tobacco plc | | 6,016,751 | | 236,922 |
British Land Co. plc REIT | | 1,573,050 | | 29,321 |
Cadbury Schweppes plc | | 16,409,745 | | 204,555 |
Drax Group plc | | 4,984,243 | | 59,611 |
GlaxoSmithKline plc | | 1,839,751 | | 46,687 |
Hays plc | | 38,062,709 | | 87,008 |
Imperial Tobacco Group plc | | 4,207,351 | | 229,066 |
Intercontinental Hotels Group plc | | 3,297,802 | | 57,561 |
Johnston Press plc | | 1,985,334 | | 10,767 |
Ladbrokes plc | | 12,722,738 | | 81,255 |
Lonmin plc | | 284,079 | | 17,527 |
National Grid plc | | 3,666,874 | | 60,625 |
Reckitt Benckiser plc | | 2,057,630 | | 118,867 |
Reed Elsevier plc | | 7,630,622 | | 102,669 |
Royal Dutch Shell plc, Class A | | 1,856,273 | | 78,026 |
50 | The accompanying notes are an integral part of the financial statements. |
| 2007 Annual Report |
| |
| December, 31 2007 |
Portfolio of Investments (cont’d)
International Equity Portfolio
| | | | Value |
| | Shares | | (000) |
Scottish & Southern Energy plc | | 1,666,771 | | $ | 54,141 |
Smiths Group plc | | 3,707,206 | | 74,315 |
Vodafone Group plc | | 34,690,518 | | 129,292 |
| | | | 1,859,487 |
Total Common Stocks (Cost $4,821,389) | | | | 6,070,837 |
| | Face | | |
| | Amount | | |
| | (000) | | |
Short-Term Investments (9.4%) | | | | |
Short-Term Debt Securities held as Collateral on Loaned Securities (7.6%) | | | | |
Alliance & Leicester plc, | | | | |
5.26%, 9/2/08 | | $ | (h)14,035 | | 14,035 |
Bancaja, | | | | |
5.35%, 8/12/08 | | 7,017 | | 7,017 |
Bank of New York Co., Inc., | | | | |
5.24%, 8/8/08 | | (h)7,017 | | 7,017 |
BASF AG, | | | | |
5.18%, 8/19/08 | | (h)7,017 | | 7,017 |
BNP Paribas plc, | | | | |
4.90%, 5/19/08 | | (h)14,035 | | 14,035 |
CAM US Finance S.A. Unipersonal, | | | | |
5.24%, 7/25/08 | | (h)28,070 | | 28,070 |
Canadian Imperial Bank of Commerce, New York, | | | | |
4.42%, 7/28/08 | | (h)14,035 | | 14,035 |
CC USA, Inc., | | | | |
3.89%, 1/28/08 | | (h)7,014 | | 7,014 |
CIT Group Holdings, | | | | |
5.23%, 6/18/08 | | (h)25,263 | | 25,263 |
Citigroup Global Markets Holdings, Inc., | | | | |
4.51%, 1/2/08 | | 95,674 | | 95,674 |
Credit Suisse First Boston, New York, | | | | |
4.32%, 3/14/08 | | (h)14,035 | | 14,035 |
First Tennessee Bank, | | | | |
5.05%, 8/15/08 | | (h)7,017 | | 7,017 |
5.06%, 8/15/08 | | (h)28,068 | | 28,068 |
Goldman Sachs Group, Inc., | | | | |
4.62%, 2/13/09 | | (h)13,193 | | 13,193 |
5.10%, 9/12/08 | | (h)7,017 | | 7,017 |
HSBC Finance Corp., | | | | |
5.26%, 8/5/08 | | (h)7,017 | | 7,017 |
IBM Corp., | | | | |
5.27%, 9/8/08 | | (h)28,069 | | 28,069 |
Lehman Brothers, Inc., | | | | |
4.49%, 1/2/08 | | 11,969 | | 11,969 |
Macquarie Bank Ltd., | | | | |
4.95%, 8/20/08 | | (h)14,035 | | 14,035 |
Metropolitan Life Global Funding, | | | | |
4.89%, 8/21/08 | | (h)21,052 | | 21,052 |
National Bank of Canada, | | | | |
5.21%, 4/2/08 | | (h)28,067 | | 28,067 |
National Rural Utilities Cooperative Finance Corp., | | | | |
5.24%, 9/2/08 | | (h)28,069 | | 28,069 |
| | | | | |
| | Face | | |
| | Amount | | Value |
| | (000) | | (000) |
Nationwide Building Society, | | | | |
4.92%, 7/28/08 | | $ | (h)16,280 | | $ | 16,280 |
Unicredito Italiano Bank (Ireland) plc, | | | | |
5.04%, 8/14/08 | | (h)15,439 | | 15,439 |
5.26%, 8/8/08 | | (h)9,824 | | 9,824 |
| | | | 468,328 |
| | | | | | |
| | Shares | | |
Investment Company (1.8%) | | | | |
Morgan Stanley Institutional Liquidity | | | | |
Money Market Portfolio | | | | |
— Institutional Class | | (o)108,256,406 | | 108,256 |
Total Short-Term Investments (Cost $576,584) | | | | 576,584 |
Total Investments (108.5%) (Cost $5,397,973) — including $448,800 of Securities Loaned | | | | (v) 6,647,421 |
Liabilities in Excess of Other Assets (-8.5%) | | | | (522,019) |
Net Assets (100%) | | | | $ 6,125,402 |
(a) | | Non-income producing security. |
(c) | | All or portion of security on loan at December 31, 2007. |
(h) | | Variable/Floating Rate Security — Interest rate changes on these instruments are based on changes in a designated base rate. The rates shown are those in effect on December 31, 2007. |
(o) | | See Note F within the Notes to Financial Statements regarding investment in Morgan Stanley Institutional Liquidity Money Market Portfolio -— Institutional Class. |
(v) | | The approximate market value and percentage of the investments, $6,025,623,000 and 90.6%, respectively, represent the securities that have been fair valued under the fair valuation policy for international investments as described in Note A within the Notes to Financial Statements. |
CVA | | Certificaten Van Aandelen |
REIT | | Real Estate Investment Trust |
| | |
Foreign Currency Exchange Contract Information:
The Portfolio had the following foreign currency exchange contract(s) open at period end:
Currency
to
Deliver
(000) | | Value
(000) | | Settlement
Date | | In
Exchange
For
(000) | | Value
(000) | | Net
Unrealized
Appreciation
(Depreciation)
(000) | |
EUR | 49 | | | $ 72 | | | 1/2/08 | | USD | 72 | | | $ 72 | | | | $ @ | — | |
EUR | 1,131 | | | 1,654 | | | 1/2/08 | | USD | 1,664 | | | 1,664 | | | | 10 | | |
NOK | 1,322 | | | 243 | | | 1/2/08 | | USD | 237 | | | 237 | | | | (6 | ) | |
SEK | 1,139 | | | 176 | | | 1/2/08 | | USD | 173 | | | 173 | | | | (3 | ) | |
| | | | $2,145 | | | | | | | | | $2,146 | | | | $ 1 | | |
EUR | — Euro |
NOK | — Norwegian Krone |
SEK | — Swedish Krona |
USD | — United States Dollar |
@ | Value is less than $500. |
The accompanying notes are an integral part of the financial statements. | 51 |
2007 Annual Report | |
| |
December 31, 2007 | |
Investment Overview (unaudited)
International Growth Active Extension Portfolio
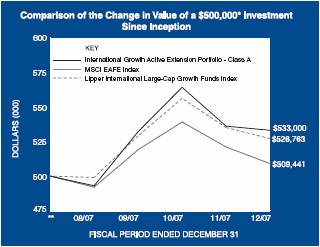
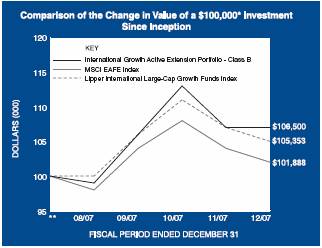
* Minimum Investment
** Commenced operations on July 31, 2007
In accordance with SEC regulations, Portfolio’s performance shown assumes that all recurring fees (including management fees) were deducted and all dividends and distributions were reinvested. The performance of Class B shares will vary from the Class A shares and will be negatively impacted by additional fees assessed to this class.
Performance Compared to the Morgan Stanley Capital International (MSCI) EAFE Index(1) and the Lipper International Large-Cap Growth Funds Index(2)
| | Total Returns | (3) |
| | | Cumulative | |
| | Since | |
| | Inception | (5) |
| | | |
Portfolio – Class A (4) | | 6.60 | % |
MSCI EAFE Index | | 1.89 | |
Lipper International Large-Cap Growth Funds Index | | 5.35 | |
| | | |
Portfolio – Class B (4) | | 6.50 | |
MSCI EAFE Index | | 1.89 | |
Lipper International Large-Cap Growth Funds Index | | 5.35 | |
| | | | |
Performance data quoted represents past performance, which is no guarantee of future results, and current performance may be lower or higher than the figures shown. Performance assumes that all dividends and distributions, if any, were reinvested. For the most recent month-end performance figures, please visit www.morganstanley.com/msim. Investment return and principal value will fluctuate so that Portfolio shares, when redeemed, may be worth more or less than their original cost. Total returns do not reflect the deduction of taxes that a shareholder would pay on Portfolio distributions or the redemption of Portfolio shares.
(1) | | The MSCI EAFE Index (Europe, Australasia, Far East) is a free float-adjusted market capitalization index that is designed to measure developed market equity performance, excluding the U.S. & Canada. The term “free float” represents the portion of shares outstanding that are deemed to be available for purhcase in the public equity markets by investors. The MSCI EAFE Index consists of the following 21 developed market country indices: Australia, Austria, Belgium, Denmark, Finland, France, Germany, Greece, Hong Kong, Ireland, Italy, Japan, the Netherlands, New Zealand, Norway, Portugal, Singapore, Spain, Sweden, Switzerland and the United Kingdom. The Index is unmanaged and its returns do not include any sales charges or fees. Such costs would lower performance. It is not possible to invest directly in an index. |
(2) | | The Lipper International Large-Cap Growth Funds Index is an equally weighted performance index of the largest qualifying funds (based on net assets) in the Lipper International Large-Cap Growth Funds classification. The Index, which is adjusted for capital gains distributions and income dividends, is unmanaged and should not be considered an investment. There are currently 10 funds represented in this Index. As of the date of this report, the Portfolio is in the Lipper International Large-Cap Growth Funds classification. |
(3) | | Total returns for the Portfolio reflect fees waived and expenses reimbursed, if applicable, by the Adviser. Without such waivers and reimbursements, total returns would have been lower. Fee waivers and/or expense reimbursements are voluntary and the Adviser reserves the right to commence or terminate any waiver and/or reimbursement at any time. |
(4) | | Commenced operations on July 31, 2007 |
(5) | | For comparative purposes, cumulative since inception returns listed for the Indexes refer to the inception date or initial offering of the respective share class of the Portfolio, not the inception of the Index. |
The International Growth Active Extension Portfolio (the “Portfolio”) seeks long-term capital appreciation with a secondary objective of income. The Adviser seeks to construct a diversified portfolio primarily consisting of equity securities of issuers located in countries other than the United States using a quantitative security selection model and fundamental
52
| 2007 Annual Report |
| |
| December 31, 2007 |
Investment Overview (cont’d)
International Growth Active Extension Portfolio
analysis. In addition to purchasing equity securities (i.e., taking long positions), the Adviser attempts to identify stocks that it believes will underperform relative to the average stock in the MSCI EAFE Index and will sell these securities short on behalf of the Portfolio.
Investments in foreign markets entail special risks such as currency, political, economic, and market risks. The risks of investing in emerging-market countries are greater than the risks generally associated with foreign investments. Short sales expose the Portfolio to the risk that it will be required to cover its short positions at a time when securities have appreciated in value, thus resulting in a loss to the portfolio. Leverage may cause the Portfolio’s net asset value to be more volatile than if it had not been leveraged because leverage tends to magnify the effect of any increases or decreases in the value of Portfolio’s securities. The Portfolio cannot assure you that the use of leverage will result in a higher return on your investment.
Performance
For the period from July 31, 2007 (commencement of operations) to December 31, 2007, the Portfolio had a total return based on net asset value and reinvestment of distributions per share of 6.60%, net of fees, for Class A shares and 6.50%, net of fees, for Class B shares. The Portfolio’s Class A and Class B shares outperformed against its benchmark, the MSCI EAFE Index (the “Index”) which returned 1.89% for the same period.
Factors Affecting Performance
· | Performance in the international equity markets in 2007 was quite volatile, fueled by tightening credit markets globally, slowing corporate earnings growth and a fragile U.S. economy. Despite the uncertain market conditions, most major international equity market indices (excluding Japan) outpaced U.S. returns in U.S. dollar terms - the MSCI EAFE Index posted a total return of 11.2% vs. 5.5% for the S&P 500® Index in 2007. |
| |
· | After the sharp sell-off in July and August, driven primarily by global credit market concerns, international equity markets recovered during September and appeared to stabilize as investors moved away from the increasingly risky financial sector and into more defensive sectors such as consumer staples and utilities. Additionally, investors in foreign shares benefited from the decision by the Federal Reserve to lower the target federal funds rate in September, October, and December after two years of rate tightening, which caused continued weakness in the U.S. dollar. The U.S. dollar lost 9.6% versus the Euro, declined 6.4% versus the Japanese Yen and weakened 1.4% versus the British Pound for the year. |
| |
· | Since its inception on July 31, 2007, the Portfolio outperformed the Index. The Portfolio’s strong relative performance was due to security selections in the Asia/ Pacific ex-Japan region and the emerging markets. In Asia/Pacific ex-Japan region, returns were driven by investment in a mining company and an oil rig manufacturer. Both holdings greatly benefitted from robust global economic growth and surging demand for oil and other commodities, and reported record earnings in 2007. |
| |
· | Within emerging markets, one of the Portfolio’s top performers was a Beijing-based department store chain that witnessed an exponential rise in profits during the year from increased Chinese consumer spending. In the European region, a short position in a global telecommunications equipment firm significantly added to the Portfolio’s performance. |
| |
· | On a sector basis, for the period, the Portfolio outperformed the Index in eight out of ten sectors, led by the outsized gains in the utilities and industrials sector. Rising power prices amongst utility providers in Germany and the U.K. benefitted relative returns, and a short position in a Spanish building company also helped. |
| |
· | Conversely, a company-specific event in the information technology sector diminished relative returns, and an underweight allocation to the materials sectors along with a limited exposure to steel companies also hindered performance. |
Management Strategies
· | | While the initial impact of the subprime crisis was directly on the U.S. economy, the surprise of 2007 was the subsequent global scale of the credit shock. Given the continued weakness in the U.S. housing market, declining consumer spending, and diminishing corporate earnings, economic growth in the Euro-zone and Japan may slow as Europe’s financial services sector and Japanese banks face further potential write-downs on their debt holdings tied to the U.S. subprime mortgage market. |
| | |
· | | We believe the Asia Pacific ex-Japan region and the emerging markets are in potentially better shape to weather current financial difficulties. Many governments of these regions have been paying off public debt, are running budget and/or current account surpluses and have strong foreign exchange reserves. According to the Financial Times, emerging markets as a group are a net creditor to the U.S. Based on International Monetary Fund (IMF) estimates, emerging markets already accounted for 47% of the global GDP growth in 2007. As certain parts of the world decouple from the U.S. economy, we will continue to emphasize building diversified portfolios across regions. |
53
2007 Annual Report | |
| |
December 31, 2007 | |
Investment Overview (cont’d)
International Growth Active Extension Portfolio
· | | Additionally, 2007 was the first year in the past eight years that the MSCI EAFE Growth Index outperformed the broad-based MSCI EAFE Index. As continued higher borrowing costs translate into higher costs of capital which could slow spending, we believe corporate earnings growth will slow globally. With earnings growth becoming more scarce, we think investors may continue to focus on higher quality growth companies,with lower leverage and strong balance sheets which already comprise our portfolio. We believe that the Portfolio is well positioned for the potential global economic slowdown |
Expense Examples
As a shareholder of the Portfolio, you may incur two types of costs: (1) transactional costs, including redemption fees; (2) ongoing costs, including management fees, shareholder servicing fees (in the case of Class B); and other Portfolio expenses. These examples are intended to help you understand your ongoing costs (in dollars) of investing in the Portfolio and to compare these costs with the ongoing costs of investing in other mutual funds.
The examples are based on an investment of $1,000 invested at the beginning of the six-month period ended December 31, 2007 and held for the entire six-month period.
Actual Expenses
The first line of the tables below provides information about actual account values and actual expenses. You may use the information in this line, together with the amount you invested, to estimate the expenses that you paid over the period. Simply divide your account value by $1,000 (for example, an $8,600 account value divided by $1,000 = 8.6), then multiply the result by the number in the first line under the heading entitled “Expenses Paid During Period” to estimate the expenses you paid on your account during this period.
Please note that both classes within the Portfolio commenced operations on July 31, 2007, however, expenses did not begin accruing until August 1, 2007; therefore, ‘‘Actual Expenses Paid During Period” reflect activity from August 1, 2007 through December 31, 2007.
Please note that “Expenses Paid During Period” are grossed up to reflect Portfolio expenses prior to the effect of Expense Offset (See Note E in the Notes to Financial Statements). Therefore, the annualized net expense ratios may differ from the ratio of the expenses to average net assets shown in the Financial Highlights.
Hypothetical Example for Comparison Purposes
The second line of the tables below provides information about hypothetical account values and hypothetical expenses based on the Portfolio’s actual expense ratio and an assumed rate of return of 5% per year before expenses, which is not the Portfolio’s actual return. The hypothetical account values and expenses may not be used to estimate the actual ending account balance or expenses you paid for the period. You may use this information to compare the ongoing costs of investing in the Portfolio and other funds. To do so, compare this 5% hypothetical example with the 5% hypothetical examples that appear in the shareholder reports of the other funds.
Please note that while the Portfolio commenced operations on July 31, 2007, the “Hypothetical Expenses Paid During the Period” reflect projected activity for the full six month period for the purposes of comparability. This projection assumes that the annualized expense ratio for the period was in effect during the period from July 1, 2007 through December 31, 2007.
Please note that the expenses shown in the table are meant to highlight your ongoing costs only and do not reflect any transactional costs, such as redemption fees. Therefore, the second line of the table is useful in comparing ongoing costs only, and will not help you determine the relative total costs of owning different funds. In addition, if these transactional costs were included, your costs would have been higher.
| | Beginning
Account Value* | | Ending
Account Value
December 31,
2007 | | Expenses Paid
During Period*
August 1, 2007
— December
31, 2007 | |
Class A | | | | | | | |
Actual | | $1,000.00 | | $1,066.00 | | $ | 9.48 | |
Hypothetical (5% average annual return before expenses) | | 1,000.00 | | 1,014.17 | | | 11.12 | |
| | | | | | | | |
Class B | | | | | | | | |
Actual | | 1,000.00 | | 1,065.00 | | | 10.56 | |
Hypothetical (5% average annual return before expenses) | | 1,000.00 | | 1,012.91 | | | 12.38 | |
* Expenses are equal to Class A and Class B annualized net expense ratios of 2.19% and 2.44%, respectively, multiplied by the average account value over the period, multiplied by 153/365 (to reflect the actual days in the period for the actual example) and multiplied by 184/365 (to reflect the one-half year period).
Graphic Presentation of Portfolio Holdings
The following graph depicts the Portfolio’s holdings by industry and/or security type, as a percentage of total investments.

* Industries which do not appear in the above graph, as well as those which represent less than 5% of total investments, if applicable, are included in the category labeled “Other”.
54
| 2007 Annual Report |
| |
| December 31, 2007 |
Portfolio of Investments
International Growth Active Extension Portfolio
| | | | Value |
| | Shares | | (000) |
Long Positions (125.4%) | | | | |
Common Stocks (125.4%) | | | | |
Australia (1.9%) | | | | |
BHP Billiton Ltd. | | (q)5,872 | | $ 206 |
Austria (5.5%) | | | | |
Andritz AG | | (q)3,153 | | 189 |
Erste Bank der Oesterreichischen Sparkassen AG | | (q)3,152 | | 224 |
Wiener Staedtische Allgemeine Versicherung AG | | 2,193 | | 177 |
| | | | 590 |
Canada (3.1%) | | | | |
EnCana Corp. | | (q)2,500 | | 171 |
Research In Motion Ltd. | | (a)1,400 | | 159 |
| | | | 330 |
Egypt (1.7%) | | | | |
Orascom Construction Industries GDR | | 886 | | 184 |
Finland 5.9%) | | | | |
Fortum Oyj | | (q)6,157 | | 276 |
Kone Oyj, Class B | | (q)3,069 | | 213 |
Neste Oil Oyj | | (q)3,978 | | 139 |
| | | | 628 |
France (12.9%) | | | | |
AXA S.A. | | (q)5,570 | | 222 |
BNP Paribas | | (q)1,618 | | 174 |
Cie Generale d'Optique Essilor International S.A. | | (q)3,423 | | 218 |
LVMH Moet Hennessy Louis Vuitton S.A. | | (q)1,184 | | 142 |
Schneider Electric S.A. | | (q)1,331 | | 178 |
Total S.A. | | (q)3,677 | | 305 |
Vallourec | | 517 | | 139 |
| | | | 1,378 |
Germany (11.6%) | | | | |
Bayer AG | | 2,081 | | 190 |
Celesio AG | | 2,672 | | 165 |
Continental AG | | 1,649 | | 214 |
E.ON AG | | 1,650 | | 350 |
SAP AG | | 2,704 | | 140 |
SGL Carbon AG | | (a)3,301 | | 177 |
| | | | 1,236 |
Greece (5.4%) | | | | |
Coca-Cola Hellenic Bottling Co. S.A. | | 6,760 | | 292 |
National Bank of Greece S.A. | | 4,055 | | 279 |
| | | | 571 |
Hong Kong (9.5%) | | | | |
Bank of East Asia Ltd. | | 30,400 | | 206 |
China Resources Power Holdings Co. | | 52,000 | | 176 |
CNOOC Ltd. | | 103,000 | | 173 |
Esprit Holdings Ltd. | | 13,600 | | 200 |
Lee & Man Paper Manufacturing Ltd. | | 13,200 | | 58 |
Parkson Retail Group Ltd. | | 16,500 | | 197 |
| | | | 1,010 |
India (2.0%) | | | | |
ICICI Bank Ltd. ADR | | (q)3,500 | | 215 |
Ireland (2.8%) | | | | |
Allied Irish Banks plc | | (q)7,728 | | 177 |
CRH plc | | (q)3,539 | | $ 123 |
| | | | 300 |
Israel (1.7%) | | | | |
Teva Pharmaceutical Industries Ltd. ADR | | (q)3,800 | | 177 |
Japan (17.0%) | | | | |
Canon, Inc. | | (q)3,300 | | 151 |
Daikin Industries Ltd. | | 4,000 | | 223 |
Daiwa Securities Group, Inc. | | (q)12,000 | | 110 |
Kobe Steel Ltd. | | (q)44,000 | | 143 |
Komatsu Ltd. | | 6,300 | | 170 |
Sharp Corp. | | (q)8,000 | | 143 |
Shin-Etsu Chemical Co., Ltd. | | (q)2,000 | | 125 |
Sony Corp. | | (q)3,000 | | 163 |
Sumitomo Realty & Development Co, Ltd. | | (q)6,000 | | 148 |
Terumo Corp. | | (q)3,300 | | 174 |
Toray Industries, Inc. | | (q)18,000 | | 140 |
Toyota Motor Corp. | | (q)2,300 | | 124 |
| | | | 1,814 |
Luxembourg (1.8%) | | | | |
Millicom International Cellular S.A. | | (a)(q)1,600 | | 189 |
Mexico (3.2%) | | | | |
America Movil S.A.B. de C.V., Class L ADR | | (q)2,800 | | 172 |
Wal-Mart de Mexico S.A.B. de C.V. ADR | | (q)4,700 | | 164 |
| | | | 336 |
Netherlands (1.6%) | | | | |
Reed Elsevier N.V. | | 8,351 | | 166 |
Norway (2.8%) | | | | |
Telenor ASA | | (a)(q)8,581 | | 203 |
TGS Nopec Geophysical Co. ASA | | (a)(q)7,122 | | 96 |
| | | | 299 |
Portugal (2.5%) | | | | |
Banco Espirito Santo S.A. (Registered) | | 12,105 | | 264 |
Singapore (3.7%) | | | | |
DBS Group Holdings Ltd. | | 13,000 | | 184 |
Keppel Corp. Ltd. | | 24,000 | | 215 |
| | | | 399 |
Spain (1.6%) | | | | |
Banco Santander S.A. | | 8,039 | | 174 |
Sweden (2.7%) | | | | |
Getinge AB, Class B | | (q)10,788 | | 288 |
Switzerland (10.7%) | | | | |
ABB Ltd. (Registered) | | (q)9,689 | | 279 |
EFG International (Registered) | | (q)4,380 | | 177 |
Nestle S.A. (Registered) | | (q)609 | | 279 |
Novartis AG (Registered) | | (q)2,212 | | 120 |
Roche Holding AG (Genusschein) | | (q)767 | | 132 |
SGS S.A. (Registered) | | (q)129 | | 152 |
| | | | 1,139 |
Taiwan (1.4%) | | | | |
Delta Electronics, Inc. | | 44,000 | | 149 |
United Kingdom (12.4%) | | | | |
Barclays plc | | (q)12,525 | | 127 |
Capita Group plc | | 11,145 | | 156 |
The accompanying notes are an integral part of the financial statements. | 55 |
2007 Annual Report | |
| |
December 31, 2007 | |
Portfolio of Investments (cont’d)
International Growth Active Extension Portfolio
| | | | Value |
| | Shares | | (000) |
United Kingdom (cont’d) | | | | |
Prudential plc | | (q)14,166 | | $ 199 |
Reckitt Benckiser Group plc | | 3,333 | | 193 |
SABMiller plc | | (q)6,022 | | 169 |
Standard Chartered plc | | 5,112 | | 186 |
Tesco plc | | (q)31,286 | | 295 |
| | | | 1,325 |
Total Common Stocks (Cost $12,807) | | | | 13,367 |
| | No of | | |
| | Warrants | | |
Warrant (1.8%) | | | | |
India (1.8%) | | | | |
Bharti Airtel Ltd., expiring 3/31/11 (Cost $181) | | (a)7,900 | | 196 |
| | Shares | | |
Short-Term Investment (0.4%) | | | | |
Investment Company (0.4%) | | | | |
Morgan Stanley Institutional Liquidity | | | | |
Money Market Portfolio
— Institutional Class (Cost $43) | | (o)42,936 | | 43 |
Total Investments (127.6%) (Cost $13,031) | | | | (v) 13,606 |
Liabilities in Excess of Other Assets (-27.6%) | | | | (2,947) |
Net Assets (100%) | | | | $ 10,659 |
Short Positions (29.3%)* | | | | |
Common Stocks (22.8%) | | | | |
Australia (1.7%) | | | | |
BlueScope Steel Ltd. | | 11,054 | | 93 |
Tatts Group Ltd. | | 24,358 | | 85 |
| | | | 178 |
Belgium (0.9%) | | | | |
UCB S.A. | | 2,133 | | 96 |
Canada (0.9%) | | | | |
Loblaw Cos. Ltd | | 2,778 | | 96 |
France (1.6%) | | | | |
Alcatel-Lucent | | 9,292 | | 68 |
Credit Agricole S.A. | | 3,102 | | 104 |
| | | | 172 |
Germany (1.1%) | | | | |
Fraport AG Frankfurt Airport Services Worldwide | | 1,444 | | 113 |
Ireland (0.7%) | | | | |
Bank of Ireland | | 5,104 | | 75 |
Italy (1.1%) | | | | |
Mediaset S.p.A. | | 11,816 | | 119 |
Japan (4.9%) | | | | |
Dai Nippon Printing Co., Ltd. | | 7,000 | | 102 |
Fast Retailing Co., Ltd. | | 1,600 | | 114 |
NTT DoCoMo, Inc. | | 79 | | 131 |
Ono Pharmaceutical Co., Ltd. | | 2,100 | | 98 |
Sompo Japan Insurance, Inc. | | 9,000 | | 81 |
| | | | 526 |
Mexico (2.0%) | | | | |
Grupo Carso S.A.B. de C.V., Class A1 | | 28,400 | | $ 107 |
Grupo Modelo S.A.B. de C.V., Class C | | 23,300 | | 111 |
| | | | 218 |
Spain (2.8%) | | | | |
Grupo Ferrovial S.A. | | 1,117 | | 78 |
Repsol YPF S.A. | | 3,480 | | 124 |
Zardoya Otis S.A. | | 3,250 | | 92 |
| | | | 294 |
Sweden (1.2%) | | | | |
Svenska Handelsbanken AB, Class A | | 4,194 | | 133 |
United Kingdom (3.9%) | | | | |
Cadbury Schweppes plc | | 8,705 | | 108 |
GlaxoSmithKline plc | | 4,047 | | 103 |
HSBC Holdings plc | | 6,897 | | 116 |
ITV plc | | 49,020 | | 83 |
| | | | 410 |
Total Common Stocks (Cost $2,616) | | | | 2,430 |
Investment Companies (6.5%) | | | | |
iShares MSCI EAFE Growth Index Fund | | 4,100 | | 319 |
iShares MSCI EAFE Index Fund | | 4,797 | | 376 |
Total Investment Companies (Cost $695) | | | | 695 |
Total Short Positions (29.3%) (Cost $3,311) | | | | 3,125 |
* | | Percentages are based on Net Assets. |
(a) | | Non-income producing security. |
(o) | | See Note F within the Notes to Financial Statements regarding investment in Morgan Stanley Institutional Liquidity Money Market Portfolio — Institutional Class. |
(q) | | Securities are pledged with a broker as collateral for short sales. |
(v) | | The approximate market value and percentage of the investments, $12,133,000 and 89.2%, respectively, represent the securities that have been fair valued under the fair valuation policy for international investments as described in Note A within the Notes to Financial Statements. |
ADR | | American Depositary Receipt |
GDR | | Global Depositary Receipt |
56 | The accompanying notes are an integral part of the financial statements. |
| 2007 Annual Report |
| |
| December 31, 2007 |
Portfolio of Investments (cont’d)
International Growth Active Extension Portfolio
Foreign Currency Exchange Contract Information:
The Portfolio had the following foreign currency exchange contract(s) open at period end:
| | | | | | | | | | Net |
Currency | | | | | | In | | | | Unrealized |
to | | | | | | Exchange | | | | Appreciation |
Deliver | | Value | | | Settlement | | For | | Value | | (Depreciation) |
(000) | | (000) | | | Date | | (000) | | (000) | | (000) |
EUR | 76 | | $111 | | | 1/2/08 | | USD | 109 | | $109 | | $(2 | ) |
EUR | 12 | | 17 | | | 1/2/08 | | USD | 17 | | 17 | | @— | |
EUR | 3 | | 4 | | | 1/2/08 | | USD | 4 | | 4 | | @— | |
EUR | 27 | | 40 | | | 1/3/08 | | USD | 40 | | 40 | | @— | |
USD | 36 | | 36 | | | 1/3/08 | | GBP | 18 | | 36 | | @— | |
USD | 1 | | 1 | | | 1/7/08 | | GBP | 1 | | 1 | | @— | |
USD | 1 | | 1 | | | 1/10/08 | | GBP | 1 | | 1 | | @— | |
USD | 12 | | 12 | | | 1/2/08 | | HKD | 91 | | 12 | | @— | |
USD | 6 | | | 6 | | | 1/3/08 | | HKD | 44 | | | 6 | | | @— | |
| | | $228 | | | | | | | | $226 | | | $(2 | ) |
| | | | | | | | | | | |
| | | | | | | | | | | | | | | | | | |
EUR | — | Euro |
GBP | — | British Pound |
HKD | — | Hong Kong Dollar |
USD | — | United States Dollar |
@ | Value is less than $500. |
The accompanying notes are an integral part of the financial statements. | 57 |
2007 Annual Report
December 31, 2007
Investment Overview (unaudited)
International Growth Equity Portfolio
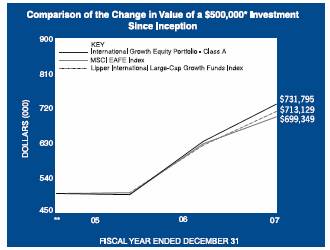
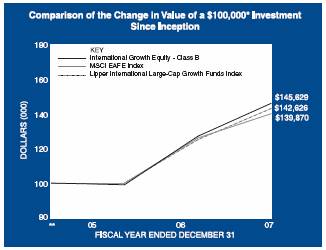
* Minimum Investment
** Commenced operations on December 27, 2005
In accordance with SEC regulations, Portfolio’s performance shown assumes that all recurring fees (including management fees) were deducted and all dividends and distributions were reinvested. The performance of Class B shares will vary from the Class A shares and will be negatively impacted by additional fees assessed to this class.
Performance Compared to the Morgan Stanley Capital International (MSCI) EAFE Index(1) and the Lipper International Large-Cap Growth Funds Index(2)
| | Total Returns(3) |
| | | | Average |
| | | | Annual |
| | One | | Since | |
| | Year | | Inception | (5) |
| | | | | |
Portfolio – Class A (4) | | 15.22 | % | 20.85 | % |
MSCI EAFE Index | | 11.17 | | 18.16 | |
Lipper International Large-Cap Growth Funds Index | | 14.15 | | 19.32 | |
| | | | | |
Portfolio – Class B (4) | | 15.03 | | 20.55 | |
MSCI EAFE Index | | 11.17 | | 18.16 | |
Lipper International Large-Cap Growth Funds Index | | 14.15 | | 19.32 | |
Performance data quoted represents past performance, which is no guarantee of future results, and current performance may be lower or higher than the figures shown. Performance assumes that all dividends and distributions, if any, were reinvested. For the most recent month-end performance figures, please visit www.morganstanley.com/msim. Investment return and principal value will fluctuate so that Portfolio shares, when redeemed, may be worth more or less than their original cost. Total returns do not reflect the deduction of taxes that a shareholder would pay on Portfolio distributions or the redemption of Portfolio shares.
(1) The Morgan Stanley Capital International (MSCI) EAFE Index (Europe, Australasia, Far East) is a free float-adjusted market capitalization index that is designed to measure developed market equity performance, excluding the U.S. & Canada. The term “free float” represents the portion of shares outstanding that are deemed to be available for purchase in the public equity markets by investors. The MSCI EAFE Index consists of the following 21 developed market country indices: Australia, Austria, Belgium,
Denmark, Finland, France, Germany, Greece, Hong Kong, Ireland, Italy, Japan, the Netherlands, New Zealand, Norway, Portugal, Singapore, Spain, Sweden, Switzerland and the United Kingdom. The Index is unmanaged and its returns do not include any sales charges or fees. Such costs would lower performance. It is not possible to invest directly in an index.
(2) The Lipper International Large-Cap Growth Funds Index is an equally weighted performance index of the largest qualifying funds (based on net assets) in the Lipper International Large-Cap Growth Funds classification. The Index, which is adjusted for capital gains distributions and income distributions, is unmanaged and should not be considered an investment. There are currently 10 funds represented in this Index. As of the date of this report, the Portfolio is in the Lipper International Large-Cap Growth Funds classification.
(3) Total returns for the Portfolio reflect fees waived and expenses reimbursed, if applicable, by the Adviser. Without such waivers and reimbursements, total returns would have been lower. Fee waivers and/or expense reimbursements are voluntary and the Adviser reserves the right to commence or terminate any waiver and/or reimbursement at any time.
(4) Commenced operations on December 27, 2005
(5) For comparative purposes, average annual since inception returns listed for the Indexes refer to the inception date or initial offering of the respective share class of the Portfolio, not the inception of the Indexes.
The International Growth Equity Portfolio (the “Portfolio”) seeks long-term capital appreciation, with a secondary objective of income by investing primarily in a diversified portfolio of equity securities of issuers located in countries other than the U.S. Foreign investing involves certain risks,
58
2007 Annual Report
December 31, 2007
Investment Overview (cont’d)
International Growth Equity Portfolio
including currency fluctuations and controls, restrictions on foreign investments, less governmental supervision and regulation, less liquidity and the potential for market volatility and political instability. The risks of investing in emerging- market countries are greater than the risks generally associated with foreign investments.
Performance
For the year ended December 31, 2007, the Portfolio had a total return based on net asset value and reinvestment of distributions per share of 15.22%, net of fees, for Class A shares and 15.03%, net of fees, for Class B shares. The Portfolio’s Class A and Class B shares outperformed against its benchmark, the Morgan Stanley Capital International (MSCI) EAFE Index (the “Index”) which returned 11.17%.
Factors Affecting Performance
· Performance in the international equity markets in 2007 was quite volatile, fueled by tightening credit markets globally, slowing corporate earnings growth and a fragile U.S. economy. Despite the uncertain market conditions, most major international equity market indices (excluding Japan) outpaced U.S. returns in U.S. dollar terms – the MSCI EAFE Index posted a total return of 11.2% vs. 5.5% for the S&P 500® Index in 2007.
· After the sharp sell-off in July and August, driven primarily by global credit market concerns, international equity markets recovered during September and appeared to stabilize as investors moved away from the increasingly risky financial sector into more defensive sectors such as consumer staples and utilities. Additionally, investors in foreign shares benefited from the decision by the Federal Reserve to lower the target federal funds rate in September, October, and December after two years of rate tightening, which caused continued weakness in the U.S. dollar. The U.S. dollar lost 9.6% versus the Euro, declined 6.4% versus the Japanese Yen and weakened 1.4% versus the British Pound for the year.
· For the 12-month period, the Portfolio outperformed the Index due to security selections in the Asia/Pacific ex- Japan region and in emerging markets. The Portfolio’s strong relative performance in the Asia/Pacific ex-Japan region was driven by investment in a mining company and an oil rig manufacturer. Both holdings greatly benefitted from robust global economic growth and surging demand for oil and other commodities, and reported record earnings in 2007.
· Within the emerging markets, the Portfolio’s top two performers were an electricity generator, which benefited from soaring demand for electricity accompanying China’s economic growth, and a retail group that witnessed an exponential rise in profits during the year from increased Chinese consumer spending.
· The Portfolio underperformed in Europe due to an overweight in Ireland. After seeing its economy expand by three times the Euro-area average in the past decade, Ireland’s economy quickly cooled as its real estate market weakened during the second half of the year. The Portfolio’s holdings in the Irish banks suffered as increased borrowing costs slowed property demand and subsequent loan growth.
· On a sector basis, for the year, the Portfolio outperformed the Index in eight out of ten sectors, led by the outsized gains in the utilities and industrials sector. Conversely, stock selection in the information technology sector diminished relative returns, and an underweight allocation to the materials sectors together with a limited exposure to steel companies also hindered performance.
Management Strategies
· While the initial impact of the subprime crisis was directly on the U.S. economy, the surprise of 2007 was the subsequent global scale of the credit shock. Given the continued weakness in the U.S. housing market, declining consumer spending and uncertain corporate earnings, economic growth in the Euro-zone and Japan may slow as Europe’s financial services sector and Japanese banks face further potential write-downs on their debt holdings tied to the U.S. subprime mortgage market.
· We believe the Asia Pacific ex-Japan region and the emerging markets are in potentially better shape to weather current financial difficulties. Many governments of these regions have been paying off public debt, are running budget and/or current account surpluses and have strong foreign exchange reserves. According to the Financial Times, emerging markets as a group are a net creditor to the U.S. Based on International Monetary Fund (IMF) estimates, emerging markets already accounted for 47% of the global Gross Domestic Product growth in 2007. As certain parts of the world decouple from the U.S. economy, we will continue to emphasize building diversified portfolios across regions.
· Additionally, 2007 was the first year in the past eight years that the MSCI EAFE Growth Index outperformed the broad-based MSCI EAFE Index. As continued higher borrowing costs translate into higher costs of capital which could slow spending, we believe corporate earnings growth will slow globally. With earnings growth becoming more scarce, we think investors may continue
59
2007 Annual Report
December 31, 2007
Investment Overview (cont’d)
International Growth Equity Portfolio
to focus on higher quality growth companies, with lower leverage and strong balance sheets which already comprise our portfolio. We believe that the Portfolio is well positioned for the potential global economic slowdown.
Expense Examples
As a shareholder of the Portfolio, you may incur two types of costs: (1) transactional costs, including redemption fees; (2) ongoing costs, including management fees, shareholder servicing fees (in the case of Class B); and other Portfolio expenses. These examples are intended to help you understand your ongoing costs (in dollars) of investing in the Portfolio and to compare these costs with the ongoing costs of investing in other mutual funds.
The examples are based on an investment of $1,000 invested at the beginning of the six-month period ended December 31, 2007 and held for the entire six-month period.
Actual Expenses
The first line of the tables below provides information about actual account values and actual expenses. You may use the information in this line, together with the amount you invested, to estimate the expenses that you paid over the period. Simply divide your account value by $1,000 (for example, an $8,600 account value divided by $1,000 = 8.6), then multiply the result by the number in the first line under the heading entitled “Expenses Paid During Period” to estimate the expenses you paid on your account during this period.
Please note that “Expenses Paid During Period” are grossed up to reflect Portfolio expenses prior to the effect of Expense Offset (See Note E in the Notes to Financial Statements). Therefore, the annualized net expense ratios may differ from the ratio of the expenses to average net assets shown in the Financial Highlights.
Hypothetical Example for Comparison Purposes
The second line of the tables below provides information about hypothetical account values and hypothetical expenses based on the Portfolio’s actual expense ratio and an assumed rate of return of 5% per year before expenses, which is not the Portfolio’s actual return. The hypothetical account values and expenses may not be used to estimate the actual ending account balance or expenses you paid for the period. You may use this information to compare the ongoing costs of investing in the Portfolio and other funds. To do so, compare this 5% hypothetical example with the 5% hypothetical examples that appear in the shareholder reports of the other funds.
Please note that the expenses shown in the table are meant to highlight your ongoing costs only and do not reflect any transactional costs, such as redemption fees. Therefore, the second line of the table is useful in comparing ongoing costs only, and will not help you determine the relative total costs of owning different funds. In addition, if these transactional costs were included, your costs would have been higher.
| | Beginning Account Value | | Ending Account
Value
December 31, | | Expenses Paid During Period*
July 1, 2007 — December 31, | |
| | July 1, 2007 | | 2007 | | 2007 | |
Class A | | | | | | | |
Actual | | $1,000.00 | | $1,036.60 | | $5.13 | |
Hypothetical (5% average annual return before expenses) | | 1,000.00 | | 1,020.16 | | 5.09 | |
| | | | | | | |
Class B | | | | | | | |
Actual | | 1,000.00 | | 1,035.70 | | 6.41 | |
Hypothetical (5% average annual return before expenses) | | 1,000.00 | | 1,018.90 | | 6.36 | |
* Expenses are equal to Class A and Class B annualized net expense ratios of 1.00% and 1.25%, respectively, multiplied by the average account value over the period, multiplied by 184/365 (to reflect the one-half year period).
Graphic Presentation of Portfolio Holdings
The following graph depicts the Portfolio’s holdings by industry and/or security type, as a percentage of total investments.
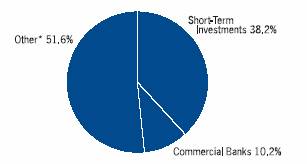
* Industries which do not appear in the above graph, as well as those which represent less than 5% of total investments, if applicable, are included in the category labeled “Other”.
60
2007 Annual Report
December 31, 2007
Portfolio of Investments
International Growth Equity Portfolio
| | | | Value | |
| | Shares | | (000) | |
Common Stocks (97.8%) | | | | | |
Australia (1.5%) | | | | | |
BHP Billiton Ltd. | | (c)9,793 | | $ | 343 | |
Austria (4.3%) | | | | | |
Andritz AG | | 5,346 | | 320 | |
Erste Bank der Oesterreichischen Sparkassen AG | | 5,344 | | 380 | |
Wiener Staedtische Allgemeine Versicherung AG | | 3,678 | | 296 | |
| | | | 996 | |
Canada (2.3%) | | | | | |
EnCana Corp. | | 4,075 | | 278 | |
Research In Motion Ltd. | | (a)2,300 | | 261 | |
| | | | 539 | |
Egypt (1.4%) | | | | | |
Orascom Construction Industries GDR | | 1,496 | | 310 | |
Finland (4.4%) | | | | | |
Fortum Oyj | | 9,531 | | 427 | |
Kone Oyj, Class B | | 5,203 | | 362 | |
Neste Oil Oyj | | 6,741 | | 236 | |
| | | | 1,025 | |
France (10.1%) | | | | | |
AXA S.A. | | 9,443 | | 376 | |
BNP Paribas | | 2,745 | | 295 | |
Cie Generale d’Optique Essilor International S.A. | | 5,804 | | 369 | |
LVMH Moet Hennessy Louis Vuitton S.A. | | 2,011 | | 242 | |
Schneider Electric S.A. | | 2,258 | | 302 | |
Total S.A. | | 6,202 | | 515 | |
Vallourec | | 878 | | 236 | |
| | | | 2,335 | |
Germany (9.0%) | | | | | |
Bayer AG | | (c)3,486 | | 318 | |
Celesio AG | | (c)4,533 | | 280 | |
Continental AG | | 2,737 | | 355 | |
E.ON AG | | 2,772 | | 588 | |
SAP AG | | 4,592 | | 237 | |
SGL Carbon AG | | (a)5,638 | | 303 | |
| | | | 2,081 | |
Greece (4.1%) | | | | | |
Coca-Cola Hellenic Bottling Co. S.A. | | 10,647 | | 459 | |
National Bank of Greece S.A. | | 6,873 | | 474 | |
| | | | 933 | |
Hong Kong (7.1%) | | | | | |
Bank of East Asia Ltd. | | 51,600 | | 350 | |
China Resources Power Holdings Co. | | 86,000 | | 292 | |
CNOOC Ltd. | | 174,700 | | 293 | |
Esprit Holdings Ltd. | | 22,700 | | 334 | |
Lee & Man Paper Manufacturing Ltd. | | 12,300 | | 54 | |
Parkson Retail Group Ltd. | | 27,000 | | 322 | |
| | | | 1,645 | |
India (3.0%) | | | | | |
Bharti Airtel Ltd. | | (a)13,029 | | 327 | |
ICICI Bank Ltd. ADR | | 5,900 | | $ | 363 | |
| | | | 690 | |
Ireland (2.2%) | | | | | |
Allied Irish Banks plc | | 12,890 | | 296 | |
CRH plc | | 6,008 | | 209 | |
| | | | 505 | |
Israel (1.3%) | | | | | |
Teva Pharmaceutical Industries Ltd. ADR | | 6,300 | | 293 | |
Japan (13.0%) | | | | | |
Canon, Inc. | | 5,500 | | 251 | |
Daikin Industries Ltd. | | (c)6,100 | | 340 | |
Daiwa Securities Group, Inc. | | 20,000 | | 184 | |
Kobe Steel Ltd. | | 63,000 | | 204 | |
Komatsu Ltd. | | 10,500 | | 284 | |
Sharp Corp. | | 14,000 | | 251 | |
Shin-Etsu Chemical Co., Ltd. | | 3,400 | | 213 | |
Sony Corp. | | 4,900 | | 266 | |
Sumitomo Realty & Development Co., Ltd. | | 10,000 | | 246 | |
Terumo Corp. | | 5,600 | | 295 | |
Toray Industries, Inc. | | 31,000 | | 241 | |
Toyota Motor Corp. | | 3,900 | | 210 | |
| | | | 2,985 | |
Luxembourg (1.4%) | | | | | |
Millicom International Cellular S.A. | | (a)2,700 | | 318 | |
Mexico (2.4%) | | | | | |
America Movil S.A.B. de C.V., Class L ADR | | 4,600 | | 283 | |
Wal-Mart de Mexico S.A.B. de C.V. ADR | | 7,979 | | 278 | |
| | | | 561 | |
Netherlands (1.2%) | | | | | |
Reed Elsevier N.V. | | (c)13,929 | | 276 | |
Norway (2.2%) | | | | | |
Telenor ASA | | (a)14,237 | | 337 | |
TGS Nopec Geophysical Co. ASA | | (a)12,091 | | 164 | |
| | | | 501 | |
Portugal (1.9%) | | | | | |
Banco Espirito Santo S.A. (Registered) | | 20,278 | | 443 | |
Singapore (2.9%) | | | | | |
DBS Group Holdings Ltd. | | 21,000 | | 298 | |
Keppel Corp., Ltd. | | 41,000 | | 367 | |
| | | | 665 | |
Spain (1.3%) | | | | | |
Banco Santander S.A. | | 13,408 | | 290 | |
Sweden (2.1%) | | | | | |
Getinge AB, Class B | | (c)18,071 | | 483 | |
Switzerland (8.1%) | | | | | |
ABB Ltd. (Registered) | | 16,071 | | 463 | |
EFG International (Registered) | | (c)7,311 | | 295 | |
Nestle S.A. (Registered) | | 932 | | 427 | |
Novartis AG (Registered) | | 3,759 | | 205 | |
Roche Holding AG (Genusschein) | | 1,303 | | 224 | |
SGS S.A. (Registered) | | 219 | | 258 | |
| | | | 1,872 | |
The accompanying notes are an integral part of the financial statements. | 61 |
2007 Annual Report
December 31, 2007
Portfolio of Investments (cont’d)
International Growth Equity Portfolio
| | Shares | | Value (000) |
Taiwan (1.1%) | | | | |
Delta Electronics, Inc. GDR | | 77,000 | | $ | 262 |
United Kingdom (9.5%) | | | | |
Barclays plc | | 21,255 | | 215 |
Capita Group plc | | 18,913 | | 264 |
Prudential plc | | 23,679 | | 333 |
Reckitt Benckiser plc | | 5,656 | | 327 |
SABMiller plc | | 10,222 | | 288 |
Standard Chartered plc | | 8,558 | | 311 |
Tesco plc | | 48,553 | | 458 |
| | | | 2,196 |
Total Common Stocks (Cost $20,698) | | | | 22,547 |
| | Face | | |
| | Amount | | |
| | (000) | | |
Short-Term Investments (60.4%) | | | | |
Short-Term Debt Securities held as Collateral on Loaned Securities (2.7%) | | | | |
Alliance & Leicester plc, | | | | |
5.26%, 9/2/08 | | $ | (h)18 | | 18 |
Bancaja, | | | | |
5.35%, 8/12/08 | | 9 | | 9 |
Bank of New York Co., Inc., | | | | |
5.24%, 8/8/08 | | (h)9 | | 9 |
BASF AG, | | | | |
5.18%, 8/19/08 | | (h)9 | | 9 |
BNP Paribas plc, | | | | |
4.90%, 5/19/08 | | (h)18 | | 18 |
CAM US Finance S.A. Unipersonal, | | | | |
5.24%, 7/25/08 | | (h)37 | | 37 |
Canadian Imperial Bank of Commerce, New York, | | | | |
4.42%, 7/28/08 | | (h)18 | | 18 |
CC USA, Inc., | | | | |
3.89%, 1/28/08 | | (h)9 | | 9 |
CIT Group Holdings, | | | | |
5.23%, 6/18/08 | | (h)33 | | 33 |
Citigroup Global Markets Holdings, Inc., | | | | |
4.51%, 1/2/08 | | 125 | | 125 |
Credit Suisse First Boston, New York, | | | | |
4.32%, 3/14/08 | | (h)18 | | 18 |
First Tennessee Bank, | | | | |
5.05%, 8/15/08 | | (h)9 | | 9 |
5.06%, 8/15/08 | | (h)37 | | 37 |
Goldman Sachs Group, Inc., | | | | |
4.62%, 2/13/09 | | (h)17 | | 17 |
5.10%, 9/12/08 | | (h)9 | | 9 |
HSBC Finance Corp., | | | | |
5.26%, 8/5/08 | | (h)9 | | 9 |
IBM Corp., | | | | |
5.27%, 9/8/08 | | (h)37 | | 37 |
Lehman Brothers, Inc., | | | | |
4.49%, 1/2/08 | | 16 | | 16 |
Macquarie Bank Ltd., | | | | |
4.95%, 8/20/08 | | (h)18 | | 18 |
Metropolitan Life Global Funding, | | | | |
4.89%, 8/21/08 | | $ | (h)27 | | $ | 27 |
National Bank of Canada, | | | | |
5.21%, 4/2/08 | | (h)37 | | 37 |
National Rural Utilities Cooperative Finance Corp., | | | | |
5.24%, 9/2/08 | | (h)37 | | 37 |
Nationwide Building Society, | | | | |
4.92%, 7/28/08 | | (h)21 | | 21 |
Unicredito Italiano Bank (Ireland) plc, | | | | |
5.04%, 8/14/08 | | (h)20 | | 20 |
5.26%, 8/8/08 | | (h)13 | | 13 |
| | | | 610 |
| | Shares | | |
Investment Company (57.7%) | | | | |
Morgan Stanley Institutional Liquidity Money Market Portfolio — Institutional Class | | (o)13,310,632 | | 13,311 |
Total Short-Term Investments (Cost $13,921) | | | | 13,921 |
Total Investments (158.2%) (Cost $34,619) — including $580 of Securities Loaned | | | | (v) | 36,468 |
Liabilities in Excess of Other Assets (-58.2%) | | | | (13,414) |
Net Assets (100%) | | | | $ | 23,054 |
| | | | | | | | |
(a) | | Non-income producing security. |
(c) | | All or portion of security on loan at December 31, 2007. |
(h) | | Variable/Floating Rate Security — Interest rate changes on these instruments are based on changes in a designated base rate. The rates shown are those in effect on December 31, 2007. |
(o) | | See Note F within the Notes to Financial Statements regarding investment in Morgan Stanley Institutional Liquidity Money Market Portfolio — Institutional Class. |
(v) | | The approximate market value and percentage of the investments, $20,163,000 and 55.3%, respectively, represent the securities that have been fair valued under the fair valuation policy for international investments as described in Note A within the Notes to Financial Statements. |
ADR | | American Depositary Receipt |
CVA | | Certificaten Van Aandelen |
GDR | | Global Depositary Receipt |
Foreign Currency Exchange Contract Information:
The Portfolio had the following foreign currency exchange contract(s) open at period end:
| | | | | Net |
Currency | | | In | | Unrealized |
to | | | Exchange | | Appreciation |
Deliver | Value | Settlement | For | Value | (Depreciation) |
(000) | (000) | Date | (000) | (000) | (000) |
USD | 187 | | $ 187 | | 1/2/08 | CAD | 183 | | $ 186 | | | $ (1) | |
| | | | | | | | | |
CAD | — | Canadian Dollar |
USD | — | United States Dollar |
| | | | | | | | | | | | | | |
62 | The accompanying notes are an integral part of the financial statements. |
2007 Annual Report
December 31, 2007
Investment Overview (unaudited)
International Magnum Portfolio
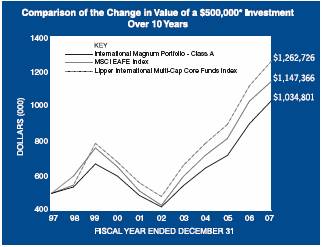
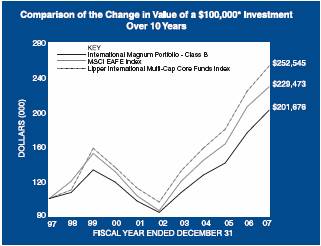
* Minimum Investment
In accordance with SEC regulations, Portfolio’s performance shown assumes that all recurring fees (including management fees) were deducted and all dividends and distributions were reinvested. The performance of Class B shares will vary from the Class A shares and will be negatively impacted by additional fees assessed to this class.
Performance Compared to the Morgan Stanley Capital International (MSCI) EAFE Index(1) and the Lipper International Multi-Cap Core Funds Index(2)
| | Total Returns(3) |
| | | | Average Annual |
| | One | | Five | | Ten | | Since | |
| | Year | | Years | | Years | | Inception | (5) |
| | | | | | | | | |
Portfolio – Class A (4) | | 14.77 | % | 19.63 | % | 7.54 | % | 7.66 | % |
MSCI EAFE Index | | 11.17 | | 21.59 | | 8.66 | | 8.02 | |
Lipper International Multi-Cap Core Funds Index | | 12.61 | | 21.23 | | 9.71 | | 10.03 | |
| | | | | | | | | |
Portfolio – Class B (4) | | 14.47 | | 19.27 | | 7.27 | | 7.37 | |
MSCI EAFE Index | | 11.17 | | 21.59 | | 8.66 | | 8.02 | |
Lipper International Multi-Cap Core Funds Index | | 12.61 | | 21.23 | | 9.71 | | 10.03 | |
Performance data quoted represents past performance, which is no guarantee of future results, and current performance may be lower or higher than the figures shown. Performance assumes that all dividends and distributions, if any, were reinvested. For the most recent month-end performance figures, please visit www.morganstanley.com/msim. Investment return and principal value will fluctuate so that Portfolio shares, when redeemed, may be worth more or less than their original cost. Total returns do not reflect the deduction of taxes that a shareholder would pay on Portfolio distributions or the redemption of Portfolio shares.
(1) The Morgan Stanley Capital International (MSCI) EAFE Index (Europe, Australasia, Far East) is a free float-adjusted market capitalization index that is designed to measure developed market equity performance, excluding the U.S. & Canada. The term “free float” represents the portion of shares outstanding that are deemed to be available for purchase in the public equity markets by investors. The MSCI EAFE Index consists of the following 21 developed market country indices: Australia, Austria, Belgium, Denmark, Finland, France, Germany, Greece, Hong Kong, Ireland, Italy, Japan, the Netherlands, New Zealand, Norway, Portugal, Singapore, Spain, Sweden, Switzerland and the United Kingdom. The Index is unmanaged and its returns do not include any sales charges or fees. Such costs would lower performance. It is not possible to invest directly in an index.
(2) The Lipper International Multi-Cap Core Funds Index is an equally weighted performance index of the largest qualifying funds (based on net assets) in the Lipper International Multi-Cap Core Funds classification. The Index, which is adjusted for capital gains distributions and income dividends, is unmanaged and should not be considered an investment. There are currently 30 funds represented in this Index. As of the date of this report, the Portfolio is in the Lipper International Multi-Cap Core Funds classification.
(3) Total returns for the Portfolio reflect fees waived and expenses reimbursed, if applicable, by the Adviser. Without such waivers and/or reimbursements, total returns would have been lower. Fee waivers and/or expense reimbursements are voluntary and the Adviser reserves the right to commence or terminate any waiver and/or reimbursement at any time.
(4) Commenced operations on March 15, 1996
(5) For comparative purposes, average annual since inception returns listed for the Indexes refer to the inception date or initial offering of the respective share class of the Portfolio, not the inception of the Index.
The International Magnum Portfolio (the “Portfolio”) seeks long-term capital appreciation by investing primarily in equity securities of non-U.S. issuers domiciled in EAFE countries. Foreign investing involves certain risks, including currency fluctuations and controls, restrictions on foreign investments,
2007 Annual Report |
|
December 31, 2007 |
Investment Overview (cont’d)
International Magnum Portfolio
less governmental supervision and regulation, less liquidity and the potential for market volatility and political instability.
Performance
For the year ended December 31, 2007, the Portfolio had a total return based on net asset value and reinvestment of distributions per share of 14.77%, net of fees, for the Class A shares and 14.47%, net of fees, for the Class B shares. The Portfolio’s Class A and Class B shares outperformed against its benchmark, the Morgan Stanley Capital International (MSCI) EAFE Index (the “Index”) which returned 11.17%.
Factors Affecting Performance
· In general, financial markets worldwide advanced during the 12 months ended December 31, 2007. However, with the widely anticipated economic slowdown in the U.S., it is still not fully clear how this will ultimately impact the global picture.
· In the second half of 2007, evidence of a mid-cycle slowdown in the U.S. began to surface. Although a pickup in third quarter Gross Domestic Product growth was better than expected, investor optimism quickly dissipated following news that the ISM Index: Manufacturing (the Institute of Supply Management’s survey of purchasing executives at roughly 300 industrial companies), which peaked at 56 in June 2007, fell to 47.7 in December (below 50 signals contraction). In contrast, the ISM Services Non Manufacturing Index did not drop as much as the ISM Index: Manufacturing. The ISM Services Non Manufacturing Index returned 53.9 in December, down somewhat from its peak of 60.7 in June 2007.
· Moreover, the worsening U.S. housing market and the subsequent crisis in the subprime mortgage market caused credit to significantly tighten as liquidity decreased. Corporate profits, which were generally robust in the first half of the year, decreased sharply later in the year, and the domestic unemployed rate surged to 5% in December.
· However, a prevailing trend over much of the period was the apparent decoupling of the U.S. markets with the rest of the world. Asia and emerging markets were resilient and showed impressive growth rates. The U.S. dollar declined, whereas the Euro and the emerging market currencies rallied. The MSCI World Index returned 5.2% in local currency and 9.0% in dollar terms. The MSCI U.S. Index returned 5.4% and the MSCI EAFE markets returned 3.5% in local currency and 11.2% in dollar terms. MSCI Japan Index was the clear outlier, declining -10.1% in local terms and -4.2% in dollar terms.
· The Portfolio’s outperformance is primarily attributed to the overweight allocation favoring the Asia Pacific ex-Japan and the emerging markets regions.
· Currency management also added to results. Furthermore, security selection within Asia Pacific ex-Japan, Europe and Japan significantly contributed to performance. In contrast, notable detractors included the Portfolio’s underweight allocation to Europe.
Management Strategies
· At the beginning of 2007, we believed we would see an end to the trend of “value” outperformance and a rotation into more growth-oriented industries. Therefore, during the first quarter of 2007, we implemented a strategic shift in the Portfolio by adding an explicit allocation to international growth securities.
· As a result, the Portfolio is slightly overweight growth securities. The style allocation shift turned profitable during the second half of the year, as investors began to focus on higher-quality, less-leveraged companies with strong balance sheets. Given our emphasis on building diversified portfolios across regions and investing in higher-quality growth companies, we believe the Portfolio is well positioned for the ensuing market rotation and potential global economic slowdown.
· Regionally, the Portfolio is underweight Europe, Japan and Asia, and is overweight in emerging markets. We believe that valuations remain expensive for European companies given that we expect reduced growth in the region in the face of headwinds from stresses in the liquidity and credit markets, as well as the ongoing deterioration of the U.S. housing market. The Japanese economy also appears sluggish with stagnating wages and slower consumer spending. On the other hand, emerging markets continue to show impressive growth rates; however, we believe valuations are stretched in some of these countries.
· On a sector basis, we are maintaining the Portfolio’s overweight to the health care and industrials sectors, and an underweight allocation to the financials, energy, materials and utilities sectors. We also maintain an overweight to cash to help buffer the market volatility.
64
| 2007 Annual Report |
| |
| December 31, 2007 |
Investment Overview (cont’d)
International Magnum Portfolio
Expense Examples
As a shareholder of the Portfolio, you may incur two types of costs: (1) transactional costs, including redemption fees; (2) ongoing costs, including management fees, shareholder servicing fees (in the case of Class B); and other Portfolio expenses. These examples are intended to help you understand your ongoing costs (in dollars) of investing in the Portfolio and to compare these costs with the ongoing costs of investing in other mutual funds.
The examples are based on an investment of $1,000 invested at the beginning of the six-month period ended December 31, 2007 and held for the entire six-month period.
Actual Expenses
The first line of the tables below provides information about actual account values and actual expenses. You may use the information in this line, together with the amount you invested, to estimate the expenses that you paid over the period. Simply divide your account value by $1,000 (for example, an $8,600 account value divided by $1,000 = 8.6), then multiply the result by the number in the first line under the heading entitled “Expenses Paid During Period” to estimate the expenses you paid on your account during this period.
Please note that “Expenses Paid During Period” are grossed up to reflect Portfolio expenses prior to the effect of Expense Offset (See Note E in the Notes to Financial Statements). Therefore, the annualized net expense ratios may differ from the ratio of the expenses to average net assets shown in the Financial Highlights.
Hypothetical Example for Comparison Purposes
The second line of the tables below provides information about hypothetical account values and hypothetical expenses based on the Portfolio’s actual expense ratio and an assumed rate of return of 5% per year before expenses, which is not the Portfolio’s actual return. The hypothetical account values and expenses may not be used to estimate the actual ending account balance or expenses you paid for the period. You may use this information to compare the ongoing costs of investing in the Portfolio and other funds. To do so, compare this 5% hypothetical example with the 5% hypothetical examples that appear in the shareholder reports of the other funds.
Please note that the expenses shown in the table are meant to highlight your ongoing costs only and do not reflect any transactional costs, such as redemption fees. Therefore, the second line of the table is useful in comparing ongoing costs only, and will not help you determine the relative total costs of owning different funds. In addition, if these transactional costs were included, your costs would have been higher.
| | Beginning
Account Value | | Ending Account
Value
December 31, | | Expenses Paid
During Period*
July 1, 2007 —
December 31, | |
| | July 1, 2007 | | 2007 | | 2007 | |
Class A | | | | | | | |
Actual | | $1,000.00 | | $1,023.90 | | $5.05 | |
Hypothetical (5% average annual return before expenses) | | 1,000.00 | | 1,020.21 | | 5.04 | |
| | | | | | | |
Class B | | | | | | | |
Actual | | 1,000.00 | | 1,022.80 | | 6.32 | |
Hypothetical (5% average annual return before expenses) | | 1,000.00 | | 1,018.95 | | 6.31 | |
* Expenses are equal to Class A and Class B annualized net expense ratios of 0.99% and 1.24%, respectively, multiplied by the average account value over the period, multiplied by 184/365 (to reflect the one-half year period).
Graphic Presentation of Portfolio Holdings
The following graph depicts the Portfolio’s holdings by industry and/or security type, as a percentage of total investments.
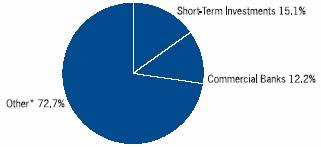
* Industries which do not appear in the above graph, as well as those which represent less than 5% of total investments, if applicable, are included in the category labeled “Other”.
65
2007 Annual Report |
|
December 31, 2007 |
Portfolio of Investments
International Magnum Portfolio
| | Shares | | Value
(000) | |
Common Stocks (94.0%) | | | | | |
Australia (3.9%) | | | | | |
Australia & New Zealand Banking Group Ltd. | | (c)16,008 | | $ | 384 | |
BHP Billiton Ltd. | | (c)58,490 | | 2,051 | |
QBE Insurance Group Ltd. | | 15,350 | | 447 | |
Rio Tinto Ltd. | | (c)10,500 | | 1,226 | |
Tatts Group | | 97,200 | | 340 | |
Wesfarmers Ltd. | | 12,950 | | 459 | |
Westpac Banking Corp. | | 17,900 | | 436 | |
| | | | 5,343 | |
Austria (2.6%) | | | | | |
Andritz AG | | 16,359 | | 981 | |
Erste Bank der Oesterreichischen Sparkassen AG | | 16,351 | | 1,162 | |
Telekom Austria AG | | 16,426 | | 455 | |
Wiener Staedtische Versicherung AG | | 11,237 | | 905 | |
| | | | 3,503 | |
Belgium (0.4%) | | | | | |
Umicore | | 2,120 | | 523 | |
Canada (1.2%) | | | | | |
EnCana Corp. | | 12,600 | | 862 | |
Research In Motion Ltd. | | (a)7,100 | | 805 | |
| | | | 1,667 | |
Egypt (0.7%) | | | | | |
Orascom Construction Industries GDR | | 4,652 | | 965 | |
Finland (2.3%) | | | | | |
Fortum Oyj | | 29,162 | | 1,305 | |
Kone Oyj, Class B | | (c)15,922 | | 1,106 | |
Neste Oil Oyj | | (c)20,632 | | 724 | |
| | | | 3,135 | |
France (9.1%) | | | | | |
AXA S.A. | | 28,895 | | 1,150 | |
BNP Paribas | | (c)15,868 | | 1,706 | |
Cie Generale d’Optique Essilor International S.A. | | 17,760 | | 1,130 | |
Electricite De France | | 6,777 | | 803 | |
Lafarge S.A. | | 4,366 | | 790 | |
LVMH Moet Hennessy Louis Vuitton S.A. | | 6,154 | | 740 | |
Renault S.A. | | 3,796 | | 533 | |
Sanofi-Aventis S.A. | | 8,130 | | 743 | |
Schneider Electric S.A. | | (c)11,951 | | 1,598 | |
Suez S.A. | | 12,726 | | 863 | |
Total S.A. | | 18,979 | | 1,575 | |
Vallourec | | (c)2,687 | | 723 | |
| | | | 12,354 | |
Germany (8.6%) | | | | | |
Allianz AG (Registered) | | 3,828 | | 819 | |
Bayer AG | | 18,252 | | 1,664 | |
Bayerische Motoren Werke AG | | 8,667 | | 535 | |
Celesio AG | | (c)13,871 | | 855 | |
Commerzbank AG | | 14,647 | | 554 | |
Continental AG | | 8,467 | | 1,098 | |
E.ON AG | | 8,482 | | $ | 1,801 | |
MAN AG | | 4,638 | | 763 | |
Muenchener Rueckversicherungs AG (Registered) | | 4,206 | | 813 | |
SAP AG | | 14,051 | | 726 | |
SGL Carbon AG | | (a)(c)17,253 | | 928 | |
Siemens AG (Registered) | | 7,613 | | 1,195 | |
| | | | 11,751 | |
Greece (3.1%) | | | | | |
Coca-Cola Hellenic Bottling Co. S.A. | | 32,578 | | 1,405 | |
EFG Eurobank Ergasias S.A. | | 16,193 | | 572 | |
National Bank of Greece S.A. | | 32,444 | | 2,235 | |
| | | | 4,212 | |
Hong Kong (5.4%) | | | | | |
Bank of East Asia Ltd. | | 158,200 | | 1,072 | |
Cheung Kong Holdings Ltd. | | 26,000 | | 474 | |
China Resources Power Holdings Co. | | 266,000 | | 903 | |
CNOOC Ltd. | | 533,000 | | 895 | |
Esprit Holdings Ltd. | | 97,800 | | 1,437 | |
Great Eagle Holdings Ltd. | | 94,000 | | 347 | |
Lee & Man Paper Manufacturing Ltd. | | 67,700 | | 296 | |
MTR Corp., Ltd. | | 123,500 | | 450 | |
New World Development Ltd. | | 132,000 | | 463 | |
Parkson Retail Group Ltd. | | 84,200 | | 1,005 | |
| | | | 7,342 | |
India (1.6%) | | | | | |
Bharti Airtel Ltd. | | (a)39,868 | | 1,002 | |
ICICI Bank Ltd. ADR | | 18,000 | | 1,107 | |
| | | | 2,109 | |
Ireland (1.1%) | | | | | |
Allied Irish Banks plc | | 39,752 | | 914 | |
CRH plc | | 18,385 | | 638 | |
| | | | 1,552 | |
Israel (0.7%) | | | | | |
Teva Pharmaceutical Industries Ltd. ADR | | 19,400 | | 902 | |
Italy (1.2%) | | | | | |
ENI S.p.A. | | 22,508 | | 820 | |
UniCredito Italiano S.p.A. | | 92,849 | | 773 | |
| | | | 1,593 | |
Japan (17.0%) | | | | | |
Amada Co., Ltd. | | 19,000 | | 168 | |
Astellas Pharma, Inc. | | 7,100 | | 310 | |
Canon, Inc. | | 26,200 | | 1,197 | |
Casio Computer Co., Ltd. | | 14,000 | | 163 | |
Dai Nippon Printing Co., Ltd. | | 13,000 | | 189 | |
Daicel Chemical Industries Ltd. | | (c)28,000 | | 167 | |
Daifuku Co., Ltd. | | (c)14,000 | | 199 | |
Daiichi Sankyo Co., Ltd. | | 11,100 | | 341 | |
Daikin Industries Ltd. | | (c)27,000 | | 1,507 | |
Daiwa Securities Group, Inc. | | 62,000 | | 571 | |
Denki Kagaku Kogyo KK | | 45,000 | | 194 | |
East Japan Railway Co. | | (c)28 | | 230 | |
FamilyMart Co., Ltd. | | 6,600 | | 206 | |
Fuji Machine Manufacturing Co., Ltd. | | 3,200 | | 69 | |
66 | The accompanying notes are an integral part of the financial statements. |
| 2007 Annual Report |
| |
| December 31, 2007 |
Portfolio of Investments (cont’d)
International Magnum Portfolio
| | Shares | | Value
(000) | |
Japan (cont’d) | | | | | |
FUJIFILM Holdings Corp. | | 7,100 | | $ | 301 | |
Fujitec Co., Ltd. | | (c)11,000 | | 64 | |
Fujitsu Ltd. | | 45,000 | | 301 | |
Furukawa Electric Co., Ltd. | | 41,000 | | 159 | |
Hitachi Capital Corp. | | (c)9,000 | | 115 | |
Hitachi High-Technologies Corp. | | (c)3,900 | | 85 | |
Hitachi Ltd. | | 40,000 | | 293 | |
House Foods Corp. | | 4,600 | | 77 | |
Kaneka Corp. | | 21,000 | | 174 | |
Kobe Steel Ltd. | | 193,000 | | 626 | |
Komatsu Ltd. | | 32,100 | | 868 | |
Kurita Water Industries Ltd. | | (c)7,300 | | 222 | |
Kyocera Corp. | | 3,000 | | 263 | |
Kyudenko Corp. | | 7,000 | | 36 | |
Lintec Corp. | | (c)5,500 | | 94 | |
Maeda Road Construction Co., Ltd. | | (c)5,000 | | 40 | |
Marubeni Corp. | | 16,000 | | 112 | |
Matsushita Electric Industrial Co., Ltd. | | 19,000 | | 389 | |
Minebea Co., Ltd. | | (c)24,000 | | 153 | |
Mitsubishi Chemical Holdings Corp. | | 29,000 | | 222 | |
Mitsubishi Corp. | | 16,800 | | 458 | |
Mitsubishi Heavy Industries Ltd. | | 61,000 | | 261 | |
Mitsui Mining & Smelting Co., Ltd. | | (c)37,000 | | 148 | |
Mitsumi Electric Co., Ltd. | | 8,900 | | 297 | |
Nagase & Co., Ltd. | | (c)7,000 | | 73 | |
NEC Corp. | | (c)49,000 | | 226 | |
Nifco, Inc. | | (c)6,400 | | 149 | |
Nintendo Co., Ltd. | | 1,200 | | 729 | |
Nippon Meat Packers, Inc. | | 10,000 | | 101 | |
Nippon Sheet Glass Co., Ltd. | | (c)20,000 | | 101 | |
Nippon Steel Corp. | | (c)21,000 | | 129 | |
Nippon Telegraph & Telephone Corp. | | 30 | | 148 | |
Nissan Motor Co., Ltd. | | 34,300 | | 371 | |
Nissha Printing Co., Ltd. | | (c)2,000 | | 79 | |
Nisshinbo Industries, Inc. | | (c)10,000 | | 122 | |
Obayashi Corp. | | 27,000 | | 136 | |
Ono Pharmaceutical Co., Ltd. | | 4,200 | | 196 | |
Ricoh Co., Ltd. | | 17,000 | | 313 | |
Rinnai Corp. | | 1,400 | | 46 | |
Rohm Co., Ltd. | | 2,500 | | 218 | |
Ryosan Co., Ltd. | | 4,400 | | 108 | |
Sanki Engineering Co., Ltd. | | (c)5,000 | | 30 | |
Sanwa Holdings Corp. | | (c)17,000 | | 84 | |
Sekisui Chemical Co., Ltd. | | 26,000 | | 175 | |
Sekisui House Ltd. | | (c)13,000 | | 141 | |
Sharp Corp. | | (c)41,000 | | 735 | |
Shin-Etsu Chemical Co., Ltd. | | 10,300 | | 644 | |
Shin-Etsu Polymer Co., Ltd. | | (c)10,800 | | 77 | |
Sony Corp. | | 20,600 | | 1,118 | |
Sumitomo Realty & Development Co., Ltd. | | (c)29,000 | | 713 | |
Suzuki Motor Corp. | | 10,600 | | 319 | |
TDK Corp. | | 3,600 | | 267 | |
Teijin Ltd. | | 36,000 | | 154 | |
Terumo Corp. | | 17,000 | | 896 | |
Toho Co., Ltd. | | (c)4,100 | | 92 | |
Tokyo Electric Power Co., Inc. | | 3,500 | | $ | 91 | |
Toray Industries, Inc. | | (c)94,000 | | 730 | |
Toshiba Corp. | | (c)57,000 | | 425 | |
Toyo Ink Manufacturing Co., Ltd. | | (c)17,000 | | 58 | |
Toyoda Gosei Co., Ltd. | | (c)2,700 | | 95 | |
Toyota Motor Corp. | | 19,700 | | 1,060 | |
Tsubakimoto Chain Co. | | 23,000 | | 129 | |
Yamaha Corp. | | 10,900 | | 249 | |
Yamaha Motor Co., Ltd. | | (c)8,900 | | 216 | |
| | | | 23,012 | |
Luxembourg (0.7%) | | | | | |
Millicom International Cellular S.A. | | (a)8,200 | | 967 | |
Mexico (1.3%) | | | | | |
America Movil S.A.B. de C.V., Class L ADR | | 14,035 | | 862 | |
Wal-Mart de Mexico S.A.B. de C.V. ADR | | 24,300 | | 847 | |
| | | | 1,709 | |
Netherlands (0.8%) | | | | | |
TNT N.V. | | 11,975 | | 498 | |
Wolters Kluwer N.V. | | 16,356 | | 535 | |
| | | | 1,033 | |
Norway (1.6%) | | | | | |
Telenor ASA | | (a)68,763 | | 1,626 | |
TGS Nopec Geophysical Co. ASA | | (a)(c)36,996 | | 502 | |
| | | | 2,128 | |
Portugal (1.0%) | | | | | |
Banco Espirito Santo S.A. (Registered) | | 62,047 | | 1,355 | |
Singapore (2.3%) | | | | | |
CapitaCommercial Trust REIT | | 42,040 | | 71 | |
CapitaLand Ltd. | | (c)97,000 | | 417 | |
City Developments Ltd. | | 35,000 | | 341 | |
DBS Group Holdings Ltd. | | 65,000 | | 921 | |
Keppel Corp. Ltd. | | 125,000 | | 1,119 | |
Oversea-Chinese Banking Corp. | | 35,000 | | 202 | |
| | | | 3,071 | |
Spain (2.1%) | | | | | |
Banco Bilbao Vizcaya Argentaria S.A. | | 33,094 | | 813 | |
Banco Santander S.A. | | 41,350 | | 893 | |
Telefonica S.A. | | 34,140 | | 1,103 | |
| | | | 2,809 | |
Sweden (1.5%) | | | | | |
Getinge AB, Class B | | (c)55,294 | | 1,477 | |
Sandvik AB | | 33,968 | | 577 | |
| | | | 2,054 | |
Switzerland (8.5%) | | | | | |
ABB Ltd. (Registered) | | 49,734 | | 1,434 | |
Compagnie Financiere Richemont S.A.,Class A | | 10,606 | | 723 | |
EFG International (Registered) | | 22,369 | | 902 | |
Nestle S.A. (Registered) | | 6,059 | | 2,776 | |
Nobel Biocare Holding AG | | 1,481 | | 392 | |
Novartis AG (Registered) | | 29,791 | | 1,623 | |
Roche Holding AG (Genusschein) | | 9,154 | | 1,577 | |
SGS S.A. (Registered) | | 669 | | 788 | |
The accompanying notes are an integral part of the financial statements. | 67 |
2007 Annual Report |
|
December 31, 2007 |
Portfolio of Investments (cont’d)
International Magnum Portfolio
| | Shares | | Value
(000) | |
Switzerland (cont’d) | | | | | |
UBS AG (Registered) | | 15,067 | | $ | 700 | |
Zurich Financial Services AG (Registered) | | 2,083 | | 613 | |
| | | | 11,528 | |
Taiwan (0.6%) | | | | | |
Delta Electronics, Inc. | | 235,000 | | 798 | |
United Kingdom (14.7%) | | | | | |
Anglo American plc | | 12,190 | | 739 | |
BAE Systems plc | | 70,641 | | 692 | |
Barclays plc | | 115,847 | | 1,173 | |
BG Group plc | | 32,627 | | 751 | |
British American Tobacco plc | | 20,845 | | 821 | |
Capita Group plc | | 57,871 | | 809 | |
GlaxoSmithKline plc | | 34,696 | | 880 | |
HSBC Holdings plc | | 64,087 | | 1,075 | |
Imperial Tobacco Group plc | | 12,336 | | 671 | |
Man Group plc | | 36,326 | | 418 | |
Prudential plc | | 112,024 | | 1,575 | |
Reckitt Benckiser Group plc | | 17,305 | | 1,000 | |
Reed Elsevier plc | | 98,696 | | 1,328 | |
Rolls-Royce Group plc | | (a)51,354 | | 555 | |
Rolls-Royce Group, Class B | | 2,126,413 | | 5 | |
Royal Dutch Shell plc, Class A | | 40,778 | | 1,718 | |
SABMiller plc | | 31,279 | | 880 | |
Standard Chartered plc | | 26,187 | | 951 | |
Tesco plc | | 238,156 | | 2,249 | |
Vodafone Group plc | | 309,561 | | 1,154 | |
WM Morrison Supermarkets plc | | 77,320 | | 499 | |
| | | | 19,943 | |
Total Common Stocks (Cost $99,177) | | | | 127,358 | |
Preferred Stock (0.3%) | | | | | |
Germany (0.3%) | | | | | |
Fresenius SE (Cost $373) | | 4,607 | | 383 | |
| | Face | | | |
| | Amount | | | |
| | (000) | | | |
Short-Term Investments (16.8%) | | | | | |
Short-Term Debt Securities held as Collateral on Loaned Securities (11.8%) | | | | | |
Alliance & Leicester plc, | | | | | |
5.26%, 9/2/08 | | $ | (h)479 | | 479 | |
Bancaja, | | | | | |
5.35%, 8/12/08 | | 239 | | 239 | |
Bank of New York Co., Inc., | | | | | |
5.24%, 8/8/08 | | (h)239 | | 239 | |
BASF AG, | | | | | |
5.18%, 8/19/08 | | (h)239 | | 239 | |
BNP Paribas plc, | | | | | |
4.90%, 5/19/08 | | (h)479 | | 479 | |
CAM US Finance S.A. Unipersonal, | | | | | |
5.24%, 7/25/08 | | (h)958 | | 958 | |
Canadian Imperial Bank of Commerce, New York, | | | | | |
4.42%, 7/28/08 | | (h)479 | | 479 | |
CC USA, Inc., | | | | | |
3.89%, 1/28/08 | | $ | (h)239 | | | $ | 239 | |
CIT Group Holdings, | | | | | |
5.23%, 6/18/08 | | (h)862 | | 862 | |
Citigroup Global Markets Holdings, Inc., | | | | | |
4.51%, 1/2/08 | | 3,265 | | 3,265 | |
Credit Suisse First Boston, New York, | | | | | |
4.32%, 3/14/08 | | (h)479 | | 479 | |
First Tennessee Bank, | | | | | |
5.05%, 8/15/08 | | (h)239 | | 239 | |
5.06%, 8/15/08 | | (h)958 | | 958 | |
Goldman Sachs Group, Inc., | | | | | |
4.62%, 2/13/09 | | (h)450 | | 450 | |
5.10%, 9/12/08 | | (h)240 | | 240 | |
HSBC Finance Corp., | | | | | |
5.26%, 8/5/08 | | (h)239 | | 239 | |
IBM Corp., | | | | | |
5.27%, 9/8/08 | | (h)958 | | 958 | |
Lehman Brothers, Inc., | | | | | |
4.49%, 1/2/08 | | 408 | | 408 | |
Macquarie Bank Ltd., | | | | | |
4.95%, 8/20/08 | | (h)479 | | 479 | |
Metropolitan Life Global Funding, | | | | | |
4.89%, 8/21/08 | | (h)718 | | 718 | |
National Bank of Canada, | | | | | |
5.21%, 4/2/08 | | (h)958 | | 958 | |
National Rural Utilities Cooperative Finance Corp., | | | | | |
5.24%, 9/2/08 | | (h)958 | | 958 | |
Nationwide Building Society, | | | | | |
4.92%, 7/28/08 | | (h)556 | | 556 | |
Unicredito Italiano Bank (Ireland) plc, | | | | | |
5.04%, 8/14/08 | | (h)527 | | 527 | |
5.26%, 8/8/08 | | (h)335 | | 335 | |
| | | | 15,980 | |
| | Shares | | | |
Investment Company (5.0%) | | | | | |
Morgan Stanley Institutional Liquidity Money Market Portfolio — Institutional Class | | (o)6,786,232 | | 6,786 | |
Total Short-Term Investments (Cost $22,766) | | | | 22,766 | |
Total Investments (111.1%) (Cost $122,316) — including $15,270 of Securities Loaned | | | | (v) 150,507 | |
Liabilities in Excess of Other Assets (-11.1%) | | | | (15,026) | |
Net Assets (100%) | | | | $ 135,481 | |
| | | | | | | | |
(a) | Non-income producing security. |
(c) | All or portion of security on loan at December 31, 2007. |
(h) | Variable/Floating Rate Security — Interest rate changes on these instruments are based on changes in a designated base rate. The rates shown are those in effect on December 31, 2007. |
(o) | See Note F within the Notes to Financial Statements regarding investment in Morgan Stanley Institutional Liquidity Money Market Portfolio — Institutional Class. |
68 | The accompanying notes are an integral part of the financial statements. |
| 2007 Annual Report |
| |
| December 31, 2007 |
Portfolio of Investments (cont’d)
International Magnum Portfolio
(v) | The approximate market value and percentage of the investments, $120,424,000 and 80.0%, respectively, represent the securities that have been fair valued under the fair valuation policy for international investments as described in Note A within the Notes to Financial Statements. |
ADR | American Depositary Receipt |
GDR | Global Depositary Receipt |
REIT | Real Estate Investment Trust |
Foreign Currency Exchange Contract Information: | |
| |
The Portfolio had the following foreign currency exchange contract(s) open at period end: | |
Currency
to
Deliver
(000) | | Value
(000) | | Settlement
Date | | In
Exchange
For
(000) | | Value
(000) | | Net
Unrealized
Appreciation
(Depreciation)
(000) | |
AUD | | 1,562 | | $ 1,366 | | 3/13/08 | | USD | | 1,365 | | $ 1,365 | | $(1 | ) |
EUR | | 61 | | 89 | | 1/2/08 | | USD | | 89 | | 89 | | @— | |
EUR | | 372 | | 544 | | 1/2/08 | | USD | | 536 | | 536 | | (8 | ) |
EUR | | 141 | | 206 | | 1/3/08 | | USD | | 208 | | 208 | | 2 | |
EUR | | 6 | | 10 | | 3/13/08 | | USD | | 10 | | 10 | | @— | |
EUR | | 1,687 | | 2,468 | | 3/13/08 | | USD | | 2,482 | | 2,482 | | 14 | |
GBP | | 278 | | 553 | | 3/13/08 | | USD | | 566 | | 566 | | 13 | |
GBP | | 458 | | 911 | | 3/13/08 | | USD | | 932 | | 932 | | 21 | |
GBP | | 478 | | 949 | | 3/13/08 | | USD | | 971 | | 971 | | 22 | |
GBP | | 1,199 | | 2,382 | | 3/13/08 | | USD | | 2,436 | | 2,436 | | 54 | |
JPY | | 23,700 | | 214 | | 3/13/08 | | USD | | 214 | | 214 | | @— | |
JPY | | 192,458 | | 1,736 | | 3/13/08 | | USD | | 1,752 | | 1,752 | | 16 | |
USD | | 188 | | 188 | | 3/13/08 | | AUD | | 213 | | 186 | | (2 | ) |
USD | | 253 | | 253 | | 3/13/08 | | AUD | | 287 | | 251 | | (2 | ) |
USD | | 426 | | 426 | | 3/13/08 | | AUD | | 483 | | 422 | | (4 | ) |
USD | | 3,381 | | 3,381 | | 3/13/08 | | AUD | | 3,829 | | 3,348 | | (33 | ) |
USD | | 32 | | 32 | | 1/3/08 | | EUR | | 22 | | 32 | | @— | |
USD | | 188 | | 188 | | 3/13/08 | | EUR | | 128 | | 187 | | (1 | ) |
USD | | 338 | | 338 | | 3/13/08 | | EUR | | 230 | | 336 | | (2 | ) |
USD | | 1,084 | | 1,084 | | 3/13/08 | | EUR | | 737 | | 1,079 | | (5 | ) |
USD | | 876 | | 876 | | 3/13/08 | | EUR | | 596 | | 871 | | (5 | ) |
USD | | 4,516 | | 4,516 | | 3/13/08 | | EUR | | 3,071 | | 4,492 | | (24 | ) |
USD | | 176 | | 176 | | 1/3/08 | | GBP | | 88 | | 175 | | (1 | ) |
USD | | 6,877 | | 6,877 | | 3/13/08 | | GBP | | 3,384 | | 6,723 | | (154 | ) |
USD | | 10,495 | | 10,495 | | 3/13/08 | | GBP | | 5,167 | | 10,266 | | (229 | ) |
USD | | 67 | | 67 | | 1/2/08 | | HKD | | 526 | | 67 | | @— | |
USD | | 29 | | 29 | | 1/3/08 | | HKD | | 223 | | 29 | | @— | |
USD | | 544 | | 544 | | 3/13/08 | | JPY | | 60,217 | | 543 | | (1 | ) |
USD | | 587 | | 587 | | 3/13/08 | | JPY | | 64,987 | | 586 | | (1 | ) |
USD | | 1,617 | | 1,617 | | 3/13/08 | | JPY | | 178,858 | | 1,613 | | (4 | ) |
USD | | 3,528 | | | 3,528 | | 3/13/08 | | JPY | | 390,064 | | | 3,519 | | | (9 | ) |
| | | | | $46,630 | | | | | | | | | $46,286 | | | $(344 | ) |
| | | | | | | | | | | | | | | | | | |
| | | | | | | | | | | | | | | | | | | | |
AUD — Australian Dollar | |
EUR — Euro | |
GBP — British Pound | |
HKD — Hong Kong Dollar | |
JPY — Japanese Yen | |
USD — United States Dollar | |
@ | Value is less than $500. | |
| | |
The accompanying notes are an integral part of the financial statements. | 69 |
2007 Annual Report | |
| |
December 31, 2007 | |
Investment Overview (unaudited)
International Real Estate Portfolio
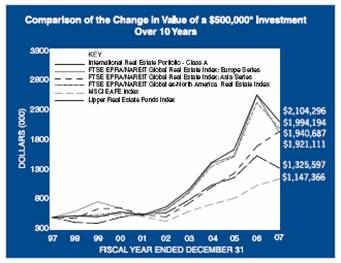
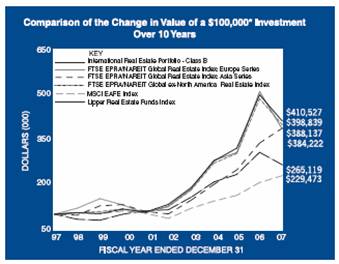
* Minimum Investment
In accordance with SEC regulations, Portfolio’s performance shown assumes that all recurring fees (including management fees) were deducted and all dividends and distributions were reinvested. The performance of Class B shares will vary from the Class A shares and will be negatively impacted by additional fees assessed to this class.
Performance Compared to the FTSE EPRA/NAREIT Global Real Estate Index: Europe Series(1), the FTSE EPRA/NAREIT Global Real Estate Index: Asia Series(2), FTSE EPRA/NAREIT Global ex-North America Real Estate Index (80% Europe/20% Asia)(3), Morgan Stanley Capital International (MSCI) EAFE Index(4) and the Lipper Real Estate Funds Index(5)
| Total Returns(6) | |
| | | | Average Annual | |
| | One | | Five | | Ten | | Since | |
| | Year | | Years | | Years | | Inception(8) | |
Portfolio – Class A (7) | | (1 7.59 | )% | 25.56 | % | 15.46 | % | 14.51 | % |
FTSE EPRA/NAREIT Global Real Estate Index: Europe Series | | (24.70 | ) | 24.78 | | 14.41 | | 13.81 | |
FTSE EPRA/NAREIT Global Real Estate Index: Asia Series | | 14.78 | | 30.86 | | 14.52 | | 9.41 | |
FTSE EPRA/NAREIT Global ex-North America Real Estate Index (80% Europe/20% Asia) | | (17.88 | ) | 26.15 | | 14.84 | | 13.41 | |
MSCI EAFE Index | | 11.17 | | 21.59 | | 8.66 | | 7.55 | |
Lipper Real Estate Funds Index | | (13.50 | ) | 18.27 | | 10.24 | | 9.90 | |
Portfolio – Class B (7) | | (17.76 | ) | 25.26 | | 15.17 | | 14.23 | |
| | | | | | | | | |
FTSE EPRA/NAREIT Global Real Estate Index: Europe Series | | (24.70 | ) | 24.78 | | 14.41 | | 13.81 | |
FTSE EPRA/NAREIT Global Real Estate Index: Asia Series | | 14.78 | | 30.86 | | 14.52 | | 9.41 | |
FTSE EPRA/NAREIT Global ex-North America Real Estate Index (80% Europe/20% Asia) | | (17.88 | ) | 26.15 | | 14.84 | | 13.41 | |
MSCI EAFE Index | | 11.17 | | 21.59 | | 8.66 | | 7.55 | |
Lipper Real Estate Funds Index | | (13.50 | ) | 18.27 | | 10.24 | | 9.90 | |
Performance data quoted represents past performance, which is no guarantee of future results, and current performance may be lower or higher than the figures shown. Performance assumes that all dividends and distributions, if any, were reinvested. For the most recent month-end performance figures, please visit www.morganstanley.com/msim. Investment return and principal value will fluctuate so that Portfolio shares, when redeemed, may be worth more or less than their original cost. Total returns do not reflect the deduction of taxes that a shareholder would pay on Portfolio distributions or the redemption of Portfolio shares.
(1) | The FTSE EPRA/NAREIT Global Real Estate Index: Europe Series is the European component of the FTSE EPRA/NAREIT Global Real Estate Index, which is a market capitalization weighted index designed to reflect the stock performance of companies engaged in the North American, European and Asian real estate markets. The performance of the Index is listed in U.S. dollars and assumes reinvestment of net dividends for periods after 1/31/2005 (gross returns used prior to 1/31/2005). “Net Dividends” reflects a reduction in dividends after taking into account withholding of taxes by certain foreign countries represented in the Index. The Index is unmanaged and its returns do not include any sales charges or fees. Such costs would lower performance. It is not possible to invest directly in an index. |
(2) | The FTSE EPRA/NAREIT Global Real Estate Index: Asia Series is the Asian component of the FTSE EPRA/NAREIT Global Real Estate Index, which is a market capitalization weighted index designed to reflect the stock performance of companies engaged in the North American, European and Asian real estate |
70
| 2007 Annual Report |
| |
| December 31, 2007 |
Investment Overview (cont’d)
International Real Estate Portfolio
| markets. The performance of the Index is listed in U.S. dollars and assumes reinvestment of net dividends for periods after 1/31/2005 (gross returns used prior to 1/31/2005). “Net Dividends” reflects a reduction in dividends after taking into account withholding of taxes by certain foreign countries represented in the Index. The Index is unmanaged and its returns do not include any sales charges or fees. Such costs would lower performance. It is not possible to invest directly in an index. |
(3) | The FTSE EPRA/NAREIT Global ex-North America Real Estate Index (80% Europe/20% Asia) is a customized benchmark, 80% of which consists of the performance of the FTSE EPRA/NAREIT Europe Series and 20% of which consists of the performance of the FTSE EPRA/NAREIT Asia Series. These series are components of the FTSE EPRA/NAREIT Global Real Estate Index which is a market capitalization weighted index designed to reflect the stock performance of companies engaged in the North American, European and Asian real estate markets. The performance of the Index is listed in U.S. dollars and assumes reinvestment of net dividends for periods after 1/31/2005 (gross returns used prior to 1/31/2005). “Net Dividends” reflects a reduction in dividends after taking into account withholding of taxes by certain foreign countries represented in the Index. The Index is rebalanced on a monthly basis. The Index is unmanaged and its returns do not include any sales charges or fees. Such costs would lower performance. It is not possible to invest directly in an index. |
(4) | The Morgan Stanley Capital International (MSCI) EAFE Index (Europe, Australasia, Far East) is a free float-adjusted market capitalization index that is designed to measure developed market equity performance, excluding the U.S. & Canada. The term “free float” represents the portion of shares outstanding that are deemed to be available for purchase in the public equity markets by investors. The MSCI EAFE Index consists of the following 21 developed market country indices: Australia, Austria, Belgium, Denmark, Finland, France, Germany, Greece, Hong Kong, Ireland, Italy, Japan, the Netherlands, New Zealand, Norway, Portugal, Singapore, Spain, Sweden, Switzerland and the United Kingdom. The Index is unmanaged and its returns do not include any sales charges or fees. Such costs would lower performance. It is not possible to invest directly in an index. |
(5) | The Lipper Real Estate Funds Index is an equally weighted performance index of the largest qualifying funds (based on net assets) in the Lipper Real Estate Funds classification. The Index, which is adjusted for capital gains distributions and income dividends, is unmanaged and should not be considered an investment. There are currently 30 funds represented in this Index. As of the date of this report, the Portfolio is in the Lipper Real Estate Funds classification. |
(6) | Total returns for the Portfolio reflect fees waived and expenses reimbursed, if applicable, by the Adviser. Without such waivers and reimbursements, total returns would have been lower. Fee waivers and/or expense reimbursements are voluntary and the Adviser reserves the right to commence or terminate any waiver and/or reimbursement at any time. |
(7) | Commenced operations on October 1, 1997 |
(8) | For comparative purposes, average annual since inception returns listed for the Indexes refer to the inception date or initial offering of the respective share class of the Portfolio, not the inception of the Index. |
The International Real Estate Portfolio (the “Portfolio”) seeks to provide current income and long-term capital appreciation by investing primarily in equity securities of companies in the real estate industry located throughout the world (excluding the United States and Canada). Foreign investing involves certain risks, including currency fluctuations and controls, restrictions on foreign investments, less governmental supervision and regulation, less liquidity and the potential for market volatility and political instability. The risks of investing in emerging-market countries are greater than the risks generally associated with foreign investments. In addition to the general risks associated with real-estate investment, REIT investing entails other risks, such as credit and interest-rate risk.
Performance
For the year ended December 31, 2007, the Portfolio had a total return based on net asset value and reinvestment of distributions per share of -17.59%, net of fees, for Class A shares and -17.76%, net of fees, for Class B shares. The Portfolio’s Class A and Class B shares outperformed against the FTSE EPRA /NAREIT Global Real Estate Index: Europe Series which returned -24.70%, underperformed against the FTSE EPRA/NAREIT Global Real Estate Index: Asia Series which returned 14.78%, outperformed against the FTSE EPRA/NAREIT Global ex-North America Real Estate Index (80% Europe/20% Asia) which returned -17.88% and underperformed against the MSCI EAFE Index which returned 11.17%.
Factors Affecting Performance
· The Portfolio’s overweight in Asia, particularly in Japan and Hong Kong, had a positive impact on relative performance versus the Index. Within Asia, an underweight in Australia was also positive as was stock selection in that market. These gains were more than offset, however, by a negative contribution from stock selection in Japan.
· In Europe, country underweights in Austria and Germany had a positive impact on relative performance, but this was offset by a detraction from an overweight in the United Kingdom and underweights in Poland and the Netherlands. Stock selection was positive in Sweden, the Netherlands and Germany, but negatively affected performance in the United Kingdom.
· In 2007, returns from property stocks in Asia were strong, and real estate securities outperformed the general equity markets in this region. The strong performance in Asia can be attributed to improving real estate values and continued investor attraction to Asian real estate.
· Property stocks in Europe showed significant declines during 2007, as investors became increasingly cautious about the impact of the credit crisis on real estate fundamentals. Tenant demand in Europe’s major office markets was strong in the first nine months of 2007, with most markets showing signs that leasing activity should exceed the record levels of 2006. Vacancy rates fell in all major cities, which resulted in positive rental growth across Europe. Occupier demand is expected to slow as economic growth decelerates, but low vacancies and modest development activity should dampen this effect, keeping rental growth positive.
71
2007 Annual Report | |
| |
December 31, 2007 | |
Investment Overview (cont’d)
International Real Estate Portfolio
· The most significant impact of the credit crunch on European real estate has been in the real estate investment market, rather than in the occupational market. Following the credit crisis, buyers have significantly slowed their activity due to limited availability of credit and uncertainty regarding the future direction of real estate values, resulting in a standstill in transactional activity. We expect that the combination of higher borrowing costs, tighter lending standards, and higher return requirements due to higher risk premiums are likely to translate into higher property yields and a downward re-pricing of assets in Europe, and the key question should center on the magnitude of the yield shift.
· Fundamentals in the office markets in Japan, Hong Kong and Singapore remained very attractive, despite the recent financial turmoil. All three countries experienced healthy rental growth in 2007 and given the limited new supply (especially in Japan and Singapore), appear poised to deliver continued rental growth into 2008. The Asian investment markets also remained healthy and appear unaffected by the credit crisis, with liquidity still strong and no investor expectations for higher property yields or a prospective decline in asset values.
· In the public markets the European real estate securities sector traded at a 17% discount to NAV at the end of the period, the biggest discount since January 2004. While Asia on the whole performed more strongly than Europe, improving real estate fundamentals are still not being fully priced into the Asian market, which was trading close to NAV at the end of the period.
Management Strategies
· We maintained our core investment philosophy as a real estate value investor. This results in our ownership of stocks in regions which we believe provide the best valuation relative to their underlying real estate values and growth prospects.
· As of the close of the period, the Portfolio remained overweight in Asia, which we believe combines improving real estate fundamentals with more attractive securities valuations compared to the European market. Within Asia, we prefer the Japanese and Hong Kong markets.
· In Europe, we added to positions in the United Kingdom during the year, thereby increasing the Portfolio’s overweight. We partly closed our underweight in Germany following that market’s underperformance during the year. We also took profits in Switzerland during the second half of the period, and as a result, moved from an overweighted position to an underweighted position. The Portfolio also included underweights in Austria and Belgium, and an overweight in Italy.
Expense Examples
As a shareholder of the Portfolio, you may incur two types of costs: (1) transactional costs, including redemption fees; (2) ongoing costs, including management fees, shareholder servicing fees (in the case of Class B); and other Portfolio expenses. These examples are intended to help you understand your ongoing costs (in dollars) of investing in the Portfolio and to compare these costs with the ongoing costs of investing in other mutual funds.
The examples are based on an investment of $1,000 invested at the beginning of the six-month period ended December 31, 2007 and held for the entire six-month period.
Actual Expenses
The first line of the tables below provides information about actual account values and actual expenses. You may use the information in this line, together with the amount you invested, to estimate the expenses that you paid over the period. Simply divide your account value by $1,000 (for example, an $8,600 account value divided by $1,000 = 8.6), then multiply the result by the number in the first line under the heading entitled “Expenses Paid During Period” to estimate the expenses you paid on your account during this period.
Please note that “Expenses Paid During Period” are grossed up to reflect Portfolio expenses prior to the effect of Expense Offset (See Note E in the Notes to Financial Statements). Therefore, the annualized net expense ratios may differ from the ratio of the expenses to average net assets shown in the Financial Highlights.
Hypothetical Example for Comparison Purposes
The second line of the tables below provides information about hypothetical account values and hypothetical expenses based on the Portfolio’s actual expense ratio and an assumed rate of return of 5% per year before expenses, which is not the Portfolio’s actual return. The hypothetical account values and expenses may not be used to estimate the actual ending account balance or expenses you paid for the period. You may use this information to compare the ongoing costs of investing in the Portfolio and other funds. To do so, compare this 5% hypothetical example with the 5% hypothetical examples that appear in the shareholder reports of the other funds.
Please note that the expenses shown in the table are meant to highlight your ongoing costs only and do not reflect any
72
| 2007 Annual Report |
| |
| December 31, 2007 |
Investment Overview (cont’d)
International Real Estate Portfolio
transactional costs, such as redemption fees. Therefore, the second line of the table is useful in comparing ongoing costs only, and will not help you determine the relative total costs of owning different funds. In addition, if these transactional costs were included, your costs would have been higher.
| | Beginning
Account Value | | Ending Account
Value
December 31, | | Expenses Paid
During Period*
July 1, 2007 —
December 31, | |
| | July 1, 2007 | | 2007 | | 2007 | |
Class A | | | | | | | |
Actual | | $1,000.00 | | $ | 854.00 | | | $ | 4.44 | |
Hypothetical (5% average annual return before expenses) | | 1,000.00 | | 1,020.42 | | 4.84 | |
| | | | | | | |
Class B | | | | | | | |
Actual | | 1,000.00 | | 853.20 | | 5.61 | |
Hypothetical (5% average annual return before expenses) | | 1,000.00 | | 1,019.16 | | 6.11 | |
| | | | | | | | | | |
* Expenses are equal to Class A and Class B annualized net expense ratios of 0.95% and 1.20%, respectively, multiplied by the average account value over the period, multiplied by 184/365 (to reflect the one-half year period).
Graphic Presentation of Portfolio Holdings
The following graph depicts the Portfolio’s holdings by industry and/or security type, as a percentage of total investments.
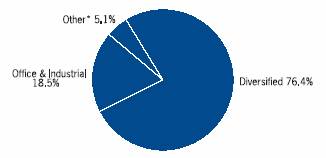
* Industries which do not appear in the above graph, as well as those which represent less than 5% of total investments, if applicable, are included in the category labeled “Other”.
73
2007 Annual Report | |
| |
December 31, 2007 | |
Portfolio of Investments
International Real Estate Portfolio
| | | | Value | |
| | Shares | | (000) | |
Common Stocks (101.5%) | | | | | |
Australia (5.8%) | | | | | |
Centro Properties Group REIT | | 782,158 | | $ | 688 | |
CFS Retail Property Trust REIT | | 1,421,423 | | 2,912 | |
DB RREEF Trust REIT | | 2,509,987 | | 4,391 | |
Goodman Group REIT | | 1,230,858 | | 5,297 | |
GPT Group REIT | | 1,665,213 | | 5,879 | |
ING Industrial Fund REIT | | 389,700 | | 866 | |
Macquarie CountryWide Trust REIT | | 637,300 | | 920 | |
Mirvac Group REIT | | 621,959 | | 3,270 | |
Stockland REIT | | 1,321,454 | | 9,727 | |
Westfield Group REIT | | 1,759,108 | | 32,232 | |
| | | | 66,182 | |
Austria (2.5%) | | | | | |
CA Immobilien Anlagen AG | | (a)52,627 | | 1,170 | |
Conwert Immobilien Invest AG | | (a)465,953 | | 8,214 | |
IMMOFINANZ AG | | 1,921,187 | | 19,359 | |
| | | | 28,743 | |
Finland (1.7%) | | | | | |
Sponda Oyj | | 1,672,189 | | 19,870 | |
France (15.2%) | | | | | |
Fonciere Des Regions REIT | | 89,569 | | 11,276 | |
Gecina S.A. REIT | | 69,970 | | 10,970 | |
Klepierre REIT | | 509,841 | | 25,886 | |
Silic REIT | | 91,459 | | 13,354 | |
Unibail-Rodamco REIT | | 523,398 | | 113,930 | |
| | | | 175,416 | |
Germany (2.4%) | | | | | |
Alstria Office AG REIT | | (a)1,254,325 | | 18,802 | |
IVG Immobilien AG | | 276,748 | | 9,366 | |
| | | | 28,168 | |
Hong Kong (10.0%) | | | | | |
China Overseas Land & Investment Ltd. | | 3,468,000 | | 7,111 | |
China Resources Land Ltd. | | 950,000 | | 2,072 | |
Guangzhou R&F Properties Co., Ltd., Class H | | 2,386,200 | | 8,400 | |
Hang Lung Properties Ltd. | | 556,000 | | 2,486 | |
Henderson Land Development Co., Ltd. | | 1,192,000 | | 11,049 | |
Hongkong Land Holdings Ltd. | | 2,824,000 | | 13,863 | |
Hysan Development Co., Ltd. | | 1,946,580 | | 5,515 | |
Kerry Properties Ltd. | | 1,146,653 | | 9,145 | |
KWG Property Holding Ltd. | | (a)1,075,000 | | 1,571 | |
New World China Land Ltd. | | 4,190,400 | | 3,740 | |
New World Development Ltd. | | 3,347,256 | | 11,749 | |
Sino Land Co. | | 212,000 | | 744 | |
Sun Hung Kai Properties Ltd. | | 1,798,000 | | 37,825 | |
| | | | 115,270 | |
Italy (2.1%) | | | | | |
Aedes S.p.A. | | 265,964 | | 1,346 | |
Beni Stabili S.p.A. | | 10,095,082 | | 10,932 | |
Risanamento S.p.A. | | (a)2,131,871 | | 11,459 | |
| | | | 23,737 | |
Japan (8.7%) | | | | | |
Daibiru Corp. | | 55,800 | | $ | 598 | |
Goldcrest Co., Ltd. | | 61,560 | | 1,833 | |
Japan Real Estate Investment Corp. REIT | | 338 | | 4,178 | |
KK DaVinci Advisors | | (a)2,866 | | 2,521 | |
Mitsubishi Estate Co., Ltd. | | 1,234,000 | | 29,580 | |
Mitsui Fudosan Co., Ltd. | | 1,079,000 | | 23,319 | |
Mori Trust Sogo Reit, Inc. REIT | | 48 | | 510 | |
Nippon Building Fund, Inc. REIT | | 490 | | 6,860 | |
Nomura Real Estate Office Fund, Inc. REIT | | 199 | | 1,872 | |
NTT Urban Development Corp. | | 2,467 | | 3,929 | |
Sumitomo Realty & Development Co., Ltd. | | 770,000 | | 18,939 | |
TOC Co., Ltd. | | 86,000 | | 653 | |
Tokyo Tatemono Co., Ltd. | | 231,000 | | 2,174 | |
Tokyu Land Corp. | | 340,000 | | 2,910 | |
| | | | 99,876 | |
Netherlands (5.6%) | | | | | |
Corio N.V. REIT | | 182,022 | | 14,651 | |
Eurocommercial Properties N.V. CVA REIT | | 372,422 | | 19,120 | |
ProLogis European Properties | | 1,574,080 | | 22,834 | |
Wereldhave N.V. REIT | | 69,195 | | 7,528 | |
| | | | 64,133 | |
Singapore (2.3%) | | | | | |
CapitaLand Ltd. | | 1,191,000 | | 5,121 | |
CapitaMall Trust REIT | | 1,264,000 | | 3,006 | |
CapitaRetail China Trust | | (a)884,500 | | 1,312 | |
Macquarie MEAG Prime REIT | | 4,428,000 | | 3,375 | |
Suntec REIT | | 1,230,000 | | 1,460 | |
United Industrial Corp., Ltd. | | 5,167,000 | | 9,841 | |
Wheelock Properties S Ltd. | | 1,364,000 | | 2,016 | |
| | | | 26,131 | |
Sweden (2.9%) | | | | | |
Castellum AB | | 1,102,156 | | 11,315 | |
Hufvudstaden AB, Class A | | 2,307,413 | | 21,929 | |
| | | | 33,244 | |
Switzerland (0.9%) | | | | | |
PSP Swiss Property AG (Registered) | | (a)214,267 | | 10,781 | |
United Kingdom (41.4%) | | | | | |
Big Yellow Group plc REIT | | 1,073,314 | | 9,282 | |
British Land Co. plc REIT | | 4,625,210 | | 86,213 | |
Brixton plc REIT | | 4,052,173 | | 23,568 | |
Capital & Regional plc | | 2,145,768 | | 16,885 | |
Derwent London plc REIT | | 1,036,266 | | 28,921 | |
Grainger plc | | 2,208,105 | | 15,266 | |
Great Portland Estates plc REIT | | 2,658,706 | | 25,196 | |
Hammerson plc REIT | | 2,492,805 | | 50,706 | |
Invista Foundation Property Trust Ltd. | | 1,162,464 | | 1,876 | |
Land Securities Group plc REIT | | 2,992,679 | | 88,993 | |
Liberty International plc REIT | | 1,468,202 | | 31,246 | |
Mapeley Ltd. | | 81,690 | | 2,447 | |
Minerva plc | | (a)3,518,870 | | 9,322 | |
Quintain Estates & Development plc | | 1,582,926 | | 16,083 | |
Safestore Holdings Ltd. | | 784,510 | | 2,707 | |
Segro plc REIT | | 4,489,306 | | 41,686 | |
| | | | | | | |
74 | The accompanying notes are an integral part of the financial statements. | |
| 2007 Annual Report |
| |
| December 31, 2007 |
Portfolio of Investments (cont’d)
International Real Estate Portfolio
| | Shares | | Value
(000) | |
United Kingdom (cont’d) | | | | | |
Shaftsbury plc REIT | | 1,550,933 | | | $ | 15,387 | |
Unite Group plc | | 1,438,673 | | 10,070 | |
Warner Estate Holdings plc REIT | | 30,359 | | 217 | |
| | | | 476,071 | |
Total Common Stocks (Cost $1,328,193) | | | | 1,167,622 | |
Total Investments (101.5%) (Cost $1,328,193) | | | | (v) | 1,167,622 | |
Liabilities in Excess of Other Assets (-1.5%) | | | | (16,804) | |
Net Assets (100%) | | | | $1,150,818 | |
| | | | | | | | |
(a) Non-income producing security.
(v) The approximate market value and percentage of the investments,$1,168,000 and 100.0%, respectively, represent the securities that have been fair valued under the fair valuation policy for international investments as described in Note A within the Notes to Financial Statements.
CVA Certificaten Van Aandelen
REIT Real Estate Investment Trust
Foreign Currency Exchange Contract Information: |
The Portfolio had the following foreign currency exchange contract(s) open at period end:
Currency
to
Deliver
(000) | | Value
(000) | | Settlement
Date | | In
Exchange
For
(000) | | Value
(000) | | Net
Unrealized
Gain (Loss)
(000) | |
AUD | 554 | | | $ | 487 | | | 1/2/08 | | USD | 484 | | | $ | 484 | | | $ (3) | | |
HKD | 5,781 | | | 741 | | | 1/2/08 | | USD | 741 | | | 741 | | | @— | | |
JPY | 8,865 | | | 79 | | | 1/4/08 | | USD | 78 | | | 78 | | | (1) | | |
JPY | 83,391 | | | 746 | | | 1/7/08 | | USD | 732 | | | 732 | | | (14) | | |
SGD | 298 | | | 208 | | | 1/2/08 | | USD | 207 | | | 207 | | | (1) | | |
SGD | 71 | | | 50 | | | 1/3/08 | | USD | 49 | | | 49 | | | | (1) | | |
| | | | | $2,311 | | | | | | | | | $2,291 | | | | $(20) | | |
| | | | | | | | | | | | | | | | | | |
| | | | | | | | | | | | | | | | | | | | | | |
AUD — Australian Dollar
HKD — Hong Kong Dollar
JPY — Japanese Yen
SGD — Singapore Dollar
USD — United States Dollar
@ Value is less than $500.
| The accompanying notes are an integral part of the financial statements. | 75 |
2007 Annual Report
December 31, 2007
Investment Overview (unaudited)
International Small Cap Portfolio
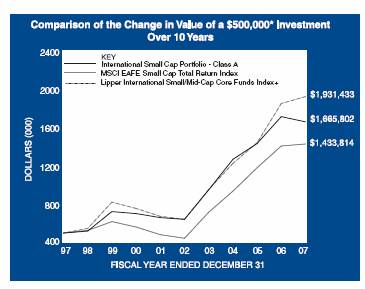
* | Minimum Investment |
| |
+ | The Lipper International Small/Mid-Cap Core Funds Index commenced operations on March 31, 2002. Performance data prior to December 31, 2002 is from the Lipper International Small/Mid-Cap Core Funds Average. |
| |
In accordance with SEC regulations, Portfolio performance shown assumes that all recurring fees (including management fees) were deducted and all dividends and distributions were reinvested. |
Performance Compared to the Morgan Stanley Capital International (MSCI) EAFE Small Cap Total Return Index(1) and the Lipper International Small/Mid-Cap Core Funds Index(2)
| | Total Returns(3) | |
| | | | Average Annual |
| | One
Year | | Five
Years | | Ten
Years | | Since
Inception(5) | |
Portfolio – Class A (4) | | (3.22 | )% | | 20.99 | % | | 12.79 | % | | 12.82 | % | |
MSCI EAFE Small Cap Total Return Index | | 1.45 | | | 26.37 | | | 11.11 | | | 7.89 | | |
Lipper International Small/Mid-Cap Core Funds Index | | 3.90 | | | 24.52 | | | 14.47 | | | — | | |
Performance data quoted represents past performance, which is no guarantee of future results, and current performance may be lower or higher than the figures shown. Performance assumes that all dividends and distributions, if any, were reinvested. For the most recent month-end performance figures, please visit www.morganstanley.com/msim. Investment return and principal value will fluctuate so that Portfolio shares, when redeemed, may be worth more or less than their original cost. Total returns do not reflect the deduction of taxes that a shareholder would pay on Portfolio distributions or the redemption of Portfolio shares.
(1) | The Morgan Stanley Capital International (MSCI) EAFE Small Cap Total Return Index is an unmanaged, market value weighted average of the performance of over 900 securities of companies listed on the stock exchanges of countries in Europe, Australasia and the Far East, including price performance and income from dividend payments. The Index is unmanaged and its returns do not include any sales charges or fees. Such costs would lower performance. It is not possible to invest directly in an index. |
(2) | The Lipper International Small/Mid-Cap Core Funds Index is an equally weighted performance index of the largest qualifying funds (based on net assets) in the Lipper International Small/Mid-Cap Core Funds classification. The Index, which is adjusted for capital gains distributions and income dividends, is unmanaged and should not be considered an investment. There are currently 10 funds represented in this Index. As of the date of this report, the Portfolio is in the Lipper International Small/Mid-Cap Core Funds classification. |
(3) | Total returns for the Portfolio reflect fees waived and expenses reimbursed, if applicable, by the Adviser. Without such waivers and reimbursements, total returns would have been lower. Fee waivers and/or expense reimbursements are voluntary and the Adviser reserves the right to commence or terminate any waiver and/or reimbursement at any time. |
(4) | Commenced operations on December 15, 1992 |
(5) | For comparative purposes, average annual since inception returns listed for the Indexes refer to the inception date or initial offering of the respective share class of the Portfolio, not the inception of the Index. |
The International Small Cap Portfolio (the “Portfolio”) seeks long-term capital appreciation by investing primarily in equity securities of small non-U.S. companies. Investments in small sized corporations are more vulnerable to financial risks and other risks than larger corporations and may involve a higher degree of price volatility than investments in the general equity markets. Foreign investing involves certain risks, including currency fluctuations and controls, restrictions on foreign investments, less governmental supervision and regulation, less liquidity and the potential for market volatility and political instability. The risks of investing in emerging- market countries are greater than the risks generally associated with foreign investments.
Performance
For the year ended December 31, 2007, the Portfolio had a total return based on net asset value and reinvestment of distributions per share of -3.22%, net of fees, The Portfolio underperformed against its benchmark, the Morgan Stanley Capital International (MSCI) EAFE Small Cap Total Return Index (the “Index”) which returned 1.45%.
Factors Affecting Performance
· | The Index ended the year up 1.5%, but it was a tale of two halves with increased volatility creating a dramatic shift in conditions. In the first half, the Index posted a return of 11.6% on globally robust merger and acquisition (M&A) activity, strong corporate earnings, and an abundance of liquidity, coupled with generally positive economic news. In the second half of the year, the Index retracted much of the gain, as data confirmed that real estate in the U.S. and some parts of Europe had deteriorated, retail sales softened, credit standards tightened and inflation increased on the back of higher commodity prices. |
| |
· | The underlying currencies of the Index also saw some marked movement in 2007, with the U.S. dollar hitting record lows against the Euro and a 26-year low against the U.K. pound. The Yen was weak most of the year but strengthened mid-year as the carry trade unwound. The Australian and Canadian dollars strengthened in the last |
76
2007 Annual Report
December 31, 2007
Investment Overview (cont’d)
International Small Cap Portfolio
| quarter of the year. In U.S. dollar terms, the Index gained a modest 1.5% for the year versus a decline of 5.6% in local currency terms. |
| |
· | On a sector basis, the first half of the year saw the utilities sector as the best performing sector, as investors favored opportunities in alternative energy and fuel (wind/solar). The industrials and materials sectors led the market as companies there benefited from global demand. However, financials lagged, rising a modest 5.7% in the first half of the year, as prospects for the real estate industry became more subdued and the news on subprime default was emerging. In the second half of the year, all sectors declined, but the defensive sectors – including consumer staples, health care and utilities – proved slightly more resilient. The financials, industrials and materials sectors underperformed the Index, declining 13%, 10.9% and 10.6%, respectively. Telecommunications was the worst performer, down 16%. |
Management Strategies
· | The Portfolio underperformed the Index for the year, in part because the Portfolio’s more defensive structure failed to fully keep up with the rising market in the first six months and also lagged in the fourth quarter of the year, despite generating outperformance in the third quarter. |
| |
· | For the full year, the Portfolio’s sector allocations – specifically, an overweight to consumer staples and under-weights to materials and financials – were a positive contributor. However, stock selection in information technology, consumer discretionary and financials detracted from performance. |
| |
· | The information technology sector was weak throughout 2007 as the industry faced consolidation, cost restructuring and a delay in new products. The Portfolio’s stock selection was the most significant contributor to underperformance, primarily due to its holdings in hardware and semiconductor companies. Nonetheless, the strength of the franchises in the Portfolio is unquestionable, in our view; the stocks we hold each have strong balance sheets and we believe their valuations are strikingly cheap. |
| |
· | Stock selection in the consumer discretionary sector across a broad group of companies in retail, media and autos added value in the first half. However, in the second half, stock selection was weak both from positions not held in the Portfolio and current holdings. In particular, a position in a U.K. nightclub operator sold off sharply due to its exposure to the U.K. consumer. The Portfolio’s holding in a Norwegian media company declined on concerns about higher capital expenditures and a disappointing recent earnings announcement. Finally, the Portfolio’s holding in an Australian retail company was weaker, despite a generally positive outlook for the company by management. All are stocks we believe continue to offer attractive value. |
| |
· | Within the financial sector, stock selection and underweight positions in the real estate and the banking sectors added value, but gains were offset by stock selection in diversified financials, which included both European and Japanese holdings. Over the year, we continually evaluated the positions (consumer finance, leasing and real estate service companies) and believe they continue to offer compelling value. |
| |
· | Conversely, stock selection in a broad range of health care companies, including equipment, services and drugs, benefited the Portfolio. In general, these companies benefited from higher sales and expansion in their core businesses. |
| |
· | The overweight to consumer staples added value, but stock selection was a detractor. A broad group of companies, primarily in the U.K., rose as the value characteristics, high margins and lower book values appealed to both corporate and private investors. In addition, many companies completed restructuring and added to their product mix, which commanded higher end prices. However, one U.K. branded consumer staples company came under pressure as investors worried about its ability to pass on higher costs. |
| |
· | Industrials were a detractor for the full year, as the Portfolio’s holdings did not participate in the rally in the first half of the year. However, as the market weakened in the second half, the companies we held that have less cyclical businesses and with good valuation support declined less. |
| |
· | We are extremely disappointed with the Portfolio’s performance; however, we have strong conviction in the Portfolio’s current holdings. If market conditions are now turning and the momentum and liquidity that have driven many stock valuations to full, if not extended levels, is now waning, we believe the Portfolio’s defensive characteristics, quality bias and strong valuation support should position it well. |
Expense Examples
As a shareholder of the Portfolio, you may incur two types of costs: (1) transactional costs, including redemption fees; (2) ongoing costs, including management fees and other Portfolio expenses. These examples are intended to help you understand
77
2007 Annual Report
December 31, 2007
Investment Overview (cont’d)
International Small Cap Portfolio
your ongoing costs (in dollars) of investing in the Portfolio and to compare these costs with the ongoing costs of investing in other mutual funds.
The examples are based on an investment of $1,000 invested at the beginning of the six-month period ended December 31, 2007 and held for the entire six-month period.
Actual Expenses
The first line of the tables below provides information about actual account values and actual expenses. You may use the information in this line, together with the amount you invested, to estimate the expenses that you paid over the period. Simply divide your account value by $1,000 (for example, an $8,600 account value divided by $1,000 = 8.6), then multiply the result by the number in the first line under the heading entitled “Expenses Paid During Period” to estimate the expenses you paid on your account during this period.
Please note that “Expenses Paid During Period” are grossed up to reflect Portfolio expenses prior to the effect of Expense Offset (See Note E in the Notes to Financial Statements). Therefore, the annualized net expense ratios may differ from the ratio of the expenses to average net assets shown in the Financial Highlights.
Hypothetical Example for Comparison Purposes
The second line of the tables below provides information about hypothetical account values and hypothetical expenses based on the Portfolio’s actual expense ratio and an assumed rate of return of 5% per year before expenses, which is not the Portfolio’s actual return. The hypothetical account values and expenses may not be used to estimate the actual ending account balance or expenses you paid for the period. You may use this information to compare the ongoing costs of investing in the Portfolio and other funds. To do so, compare this 5% hypothetical example with the 5% hypothetical examples that appear in the shareholder reports of the other funds.
Please note that the expenses shown in the table are meant to highlight your ongoing costs only and do not reflect any transactional costs, such as redemption fees. Therefore, the second line of the table is useful in comparing ongoing costs only, and will not help you determine the relative total costs of owning different funds. In addition, if these transactional costs were included, your costs would have been higher.
| | Beginning Account Value July 1, 2007 | | Ending Account
Value December 31,
2007 | | Expenses Paid
During Period*
December 31, —
2007 |
Class A | | | | | | |
Actual | | $1,000.00 | | $890.50 | | $5.24 |
Hypothetical (5% average annual | | | | | | |
return before expenses) | | 1,000.00 | | 1,019.66 | | 5.60 |
* | Expenses are equal to Class A annualized net expense ratios of 1.10%, multiplied by the average account value over the period, multiplied by 184/365 (to reflect the one-half year period). |
Graphic Presentation of Portfolio Holdings
The following graph depicts the Portfolio’s holdings by industry and/or security type, as a percentage of total investments.
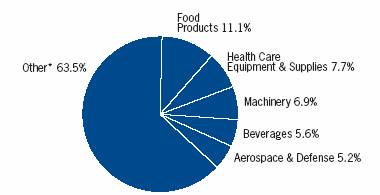
* | Industries which do not appear in the above graph, as well as those which represent less than 5% of total investments, if applicable, are included in the category labeled “Other”. |
78
2007 Annual Report
December 31, 2007
Portfolio of Investments
International Small Cap Portfolio
| | Shares | | Value
(000) | |
Common Stocks (98.3%)
Australia (6.0%) Goodman Fielder Ltd. | | 6,985,939 | | $ 11,591 | |
Infomedia Ltd. | | 10,849,874 | | 5,124 | |
MYOB Ltd. | | 7,285,574 | | 9,273 | |
Pacific Brands Ltd. | | 5,881,780 | | 16,753 | |
Ramsay Health Care Ltd. | | 508,092 | | 4,874 | |
| | | | 47,615 | |
Austria (1.0%)
Zumtobel AG | | 211,886 | | 7,606 | |
Belgium (2.2%)
Omega Pharma S.A. | | 251,374 | | 17,437 | |
Denmark (2.6%) | | | | | |
Carlsberg A/S, Class B | | 77,435 | | 9,315 | |
Danisco A/S | | 163,483 | | 11,552 | |
| | | | 20,867 | |
Finland (3.1%) | | | | | |
Cargotec Corp., Class B | | 159,005 | | 7,310 | |
Elisa Oyj | | 226,848 | | 6,922 | |
HKScan Oyj | | 299,028 | | 6,113 | |
YIT Oyj | | 209,893 | | 4,536 | |
| | | | 24,881 | |
France (6.5%)
Bull S.A. | | (a)1,024,801 | | 5,653 | |
GL Trade S.A. | | 157,681 | | 7,100 | |
Icade | | 54,960 | | 8,194 | |
Ipsen S.A. | | 190,860 | | 11,481 | |
Nexans S.A. | | 30,072 | | 3,724 | |
Saft Groupe S.A. | | 202,436 | | 9,082 | |
Zodiac S.A. | | (a)102,329 | | 6,508 | |
| | | | 51,742 | |
Germany (3.9%) | | | | | |
K&S AG | | 18,620 | | 4,392 | |
MTU Aero Engines Holding AG | | 285,614 | | 16,585 | |
Sartorius AG (Non-Voting Shares) | | 252,774 | | 9,962 | |
SCS Standard Computersysteme AG | | (a)(d)(i)(l)21,289 | | — | |
| | | | 30,939 | |
Hong Kong (0.6%) | | | | | |
Solomon Systech International Ltd. | | 56,705,900 | | 4,770 | |
Ireland (4.5%) | | | | | |
DCC plc | | 174,381 | | 4,896 | |
Glanbia plc | | 2,410,129 | | 16,310 | |
Kerry Group plc, Class A | | 455,726 | | 14,404 | |
| | | | 35,610 | |
Italy (6.7%) | | | | | |
Banca CR Firenze | | 732,551 | | 7,068 | |
Buzzi Unicem S.p.A. | | 220,391 | | 6,048 | |
Davide Campari-Milano S.p.A. | | 1,929,916 | | 18,374 | |
Interpump S.p.A. | | 720,350 | | 7,381 | |
Prysmian S.p.A | | (a)267,227 | | 6,543 | |
SAES Getters S.p.A. | | 143,847 | | 4,309 | |
Sogefi S.p.A. | | 483,698 | | 3,844 | |
| | | | 53,567 | |
Japan (27.8%) | | | | | |
Aplus Co., Ltd. | | (a)3,970,300 | | $ 3,155 | |
Arealink Co., Ltd. | | 1,139 | | 373 | |
Ariake Japan Co., Ltd. | | 1,280,100 | | 22,895 | |
Atrium Co., Ltd. | | 126,500 | | 2,604 | |
Doutor Nichires Holdings Co., Ltd. | | (a)917,300 | | 4,737 | |
Fuyo General Lease Co., Ltd. | | 234,200 | | 6,174 | |
Hikari Tsushin, Inc. | | 513,100 | | 17,399 | |
Jaccs Co., Ltd. | | 938,000 | | 2,112 | |
Japan Securities Finance Co., Ltd. | | 1,500,100 | | 13,087 | |
Mabuchi Motor Co., Ltd. | | 183,000 | | 11,049 | |
Mars Engineering Corp. | | 555,900 | | 6,376 | |
Milbon Co., Ltd. | | 338,900 | | 7,965 | |
Miraca Holdings, Inc. | | 247,000 | | 5,909 | |
Miraial Co., Ltd. | | 172,200 | | 4,868 | |
Nakanishi, Inc. | | 88,700 | | 11,465 | |
Nihon Micro Coating Co., Ltd. | | 399,500 | | 920 | |
Nihon Trim Co., Ltd. | | 140,850 | | 3,786 | |
Okinawa Cellular Telephone Co. | | 2,079 | | 4,564 | |
Okinawa Electric Power Co., Inc. (The) | | 229,300 | | 10,662 | |
Osaki Engineering Co., Ltd. | | 843 | | 1,467 | |
Rengo Co., Ltd. | | 385,000 | | 2,509 | |
Shinkawa Ltd. | | 497,400 | | 7,622 | |
Snow Brand Milk Products Co., Ltd. | | 1,201,000 | | 3,934 | |
Sokkia Co., Ltd. | | 729,000 | | 4,181 | |
Sun Frontier Fudousan Co., Ltd. | | 2,289 | | 3,520 | |
Takuma Co., Ltd. | | 735,000 | | 2,961 | |
Toei Animation Co., Ltd. | | 402,000 | | 8,737 | |
Tsumura & Co. | | 887,500 | | 17,478 | |
V Technology Co., Ltd. | | 1,176 | | 3,225 | |
Wacom Co., Ltd. | | 2,009 | | 4,188 | |
Yachiyo Bank Ltd. | | 2,570 | | 9,451 | |
Yamaichi Electronics Co., Ltd. | | 433,400 | | 1,669 | |
| | | | 221,042 | |
Netherlands (2.3%) | | | | | |
Advanced Metallurgical Group N.V. | | (a)127,493 | | 9,490 | |
Wavin N.V. | | 658,806 | | 8,715 | |
| | | | 18,205 | |
New Zealand (1.0%) | | | | | |
Fisher & Paykel Healthcare Corp., Ltd. | | 1,377,380 | | 3,694 | |
Warehouse Group Ltd. | | 957,797 | | 4,196 | |
| | | | 7,890 | |
Norway (5.8%) | | | | | |
Fred Olsen Energy ASA | | 154,146 | | 8,404 | |
Pronova BioPharma AS | | (a)1,778,185 | | 7,177 | |
Revus Energy ASA | | (a)547,210 | | 7,924 | |
Schibsted ASA | | 344,994 | | 14,739 | |
TGS Nopec Geophysical Co., ASA | | (a)465,047 | | 6,313 | |
Veidekke ASA | | 215,628 | | 2,003 | |
| | | | 46,560 | |
Spain (0.5%) | | | | | |
Miquel y Costas & Miquel S.A. | | 178,758 | | 3,848 | |
Sweden (4.7%) | | 923,241 | | 9,426 | |
Billerud AB | | | | | |
| | | | | | | | |
The accompanying notes are an integral part of the financial statements. | 79 |
2007 Annual Report
December 31, 2007
Portfolio of Investments (cont’d)
International Small Cap Portfolio
| | Shares | | Value
(000) | |
Sweden (cont’d) | | | | | |
Elekta AB, Class B | | 493,300 | | $ 8,156 | |
Eniro AB | | 364,590 | | 3,258 | |
Micronic Laser Systems AB | | (a)816,463 | | 4,038 | |
Saab AB, Class B | | 625,300 | | 12,428 | |
| | | | 37,306 | |
Switzerland (5.8%) | | | | | |
Bucher Industries AG (Registered) | | 36,788 | | 8,411 | |
Galenica AG (Registered) | | 17,493 | | 7,598 | |
Kaba Holding AG, Class B | | 26,613 | | 8,320 | |
LEM Holding SA (Registered) | | 14,499 | | 4,100 | |
Medisize Holding AG | | 56,070 | | 3,960 | |
Schindler Holding AG | | 78,924 | | 5,045 | |
Sia Abrasives Holding AG (Registered) | | 16,443 | | 5,795 | |
Zehnder Group AG, Class B | | 2,028 | | 3,366 | |
| | | | 46,595 | |
United Kingdom (13.3%) | | | | | |
Ark Therapeutics Group plc | | (a)2,378,983 | | 4,434 | |
Britvic plc | | 2,404,904 | | 16,482 | |
Cattles plc | | 694,042 | | 4,059 | |
IMI plc | | 969,959 | | 7,531 | |
Luminar Group Holdings plc | | 1,476,685 | | 12,588 | |
Meggitt plc | | 750,876 | | 4,942 | |
Premier Foods plc | | 4,794,264 | | 19,398 | |
Rotork plc | | 289,435 | | 5,540 | |
Spirax-Sarco Engineering plc | | 337,221 | | 5,861 | |
William Hill plc | | 801,723 | | 8,315 | |
Wincanton plc | | 2,320,375 | | 17,031 | |
| | | | 106,181 | |
Total Common Stocks (Cost $727,180) | | | | 782,661 | |
Total Investments (98.3%) (Cost $727,180) | | | | (v)782,661 | |
Other Assets in Excess of Liabilities (1.7%) | | | | 13,389 | |
Net Assets (100%) | | | | $796,050 | |
(a) | | Non-income producing security |
(d) | | Securities were valued at fair value — At December 31, 2007, the Portfolio held a fair valued security, valued at less than $500, representing less than 0.05% of net assets. |
| |
(i) | | Restricted security valued at fair value and not registered under the Securities Act of 1933. SCS Standard Computersysteme AG was acquired 4/04 and has a current cost basis of $0. At December 31, 2007, this security had a market value of $0, representing 0.0% of net assets. |
| |
(l) | | Security has been deemed illiquid at December 31, 2007. |
(v) | | The approximate market value and percentage of the investments, $782,661,000 and 100.0%, respectively, represent the securities that have been fair valued under the fair valuation policy for international investments as described in Note A within the Notes to Financial Statements. |
| |
@ | | Value is less than $500. |
Foreign Currency Exchange Contract Information:
The Portfolio had the following foreign currency exchange contract(s) open at period end:
Currency
to
Deliver
(000) | | Value
(000) | | Settlement
Date | | In
Exchange
For
(000) | | Value
(000) | | Net
Unrealized
Appreciation
(Depreciation)
(000) | |
AUD | 65 | | | $ 57 | | | 1/2/08 | | USD | 57 | | | $ 57 | | | $@— | | |
AUD | 564 | | | 495 | | | 1/3/08 | | USD | 495 | | | 495 | | | @— | | |
CHF | 317 | | | 280 | | | 1/3/08 | | USD | 280 | | | 280 | | | @— | | |
CHF | 2,194 | | | 1,938 | | | 1/3/08 | | USD | 1,951 | | | 1,951 | | | 13 | | |
DKK | 9,148 | | | 1,794 | | | 1/2/08 | | USD | 1,765 | | | 1,765 | | | (29 | ) | |
DKK | 699 | | | 137 | | | 1/2/08 | | USD | 138 | | | 138 | | | 1 | | |
DKK | 4,993 | | | 979 | | | 1/3/08 | | USD | 984 | | | 984 | | | 5 | | |
EUR | 1,786 | | | 2,611 | | | 1/2/08 | | USD | 2,570 | | | 2,570 | | | (41 | ) | |
EUR | 247 | | | 361 | | | 1/2/08 | | USD | 358 | | | 358 | | | (3 | ) | |
EUR | 460 | | | 673 | | | 1/2/08 | | USD | 662 | | | 662 | | | (11 | ) | |
EUR | 1,637 | | | 2,393 | | | 1/2/08 | | USD | 2,406 | | | 2,406 | | | 13 | | |
EUR | 1,698 | | | 2,482 | | | 1/2/08 | | USD | 2,500 | | | 2,500 | | | 18 | | |
EUR | 1,658 | | | 2,424 | | | 1/3/08 | | USD | 2,436 | | | 2,436 | | | 12 | | |
GBP | 851 | | | 1,694 | | | 1/2/08 | | USD | 1,702 | | | 1,702 | | | 8 | | |
HKD | 1,240 | | | 159 | | | 1/2/08 | | USD | 159 | | | 159 | | | @— | | |
JPY | 15,257 | | | 137 | | | 1/7/08 | | USD | 134 | | | 134 | | | (3 | ) | |
JPY | 651,703 | | | 5,836 | | | 1/7/08 | | USD | 5,766 | | | 5,766 | | | (70 | ) | |
JPY | 575,838 | | | 5,158 | | | 1/8/08 | | USD | 5,146 | | | 5,146 | | | (12 | ) | |
NOK | 8,339 | | | 1,536 | | | 1/2/08 | | USD | 1,497 | | | 1,497 | | | (39 | ) | |
NOK | 4,193 | | | 772 | | | 1/2/08 | | USD | 753 | | | 753 | | | (19 | ) | |
NOK | 1,464 | | | 269 | | | 1/2/08 | | USD | 270 | | | 270 | | | 1 | | |
NOK | 4,417 | | | 814 | | | 1/3/08 | | USD | 814 | | | 814 | | | @— | | |
NOK | 16,015 | | | 2,950 | | | 1/4/08 | | USD | 2,959 | | | 2,959 | | | 9 | | |
NZD | 18 | | | 14 | | | 1/3/08 | | USD | 14 | | | 14 | | | @— | | |
NZD | 156 | | | 120 | | | 1/4/08 | | USD | 121 | | | 121 | | | 1 | | |
SEK | 18,137 | | | 2,806 | | | 1/2/08 | | USD | 2,756 | | | 2,756 | | | (50 | ) | |
SEK | 4,694 | | | 726 | | | 1/2/08 | | USD | 733 | | | 733 | | | 7 | | |
SEK | 7,220 | | | 1,117 | | | 1/3/08 | | USD | 1,122 | | | 1,122 | | | | 5 | | |
| | | | $40,732 | | | | | | | | | $40,548 | | | | $(184 | ) | |
| | | | | | | | | | | | | | | | | | |
| | | | | | | | | | | | | | | | | | | | |
AUD | — | Australian Dollar |
CHF | — | Swiss Franc |
DKK | — | Danish Krona |
EUR | — | Euro |
GBP | — | British Pound |
HKD | — | Hong Kong Dollar |
JPY | — | Japanese Yen |
NOK | — | Norwegian Krone |
NZD | — | New Zealand Dollar |
SEK | — | Swedish Krona |
USD | — | United States Dollar |
80 | The accompanying notes are an integral part of the financial statements. |
2007 Annual Report
December 31, 2007
Investment Overview (unaudited)
Disciplined Large Cap Value Active Extension Portfolio
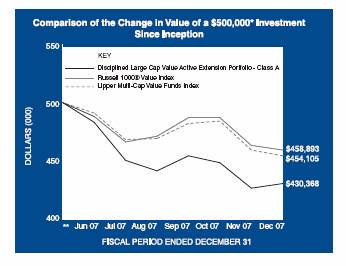
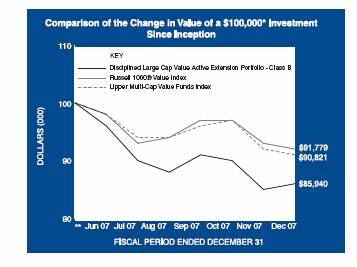
* Minimum Investment
** Commenced operations on May 31, 2007
In accordance with SEC regulations, Portfolio’s performance shown assumes that all recurring fees (including management fees) were deducted and all dividends and distributions were reinvested. The performance of Class B shares will vary from the Class A shares and will be negatively impacted by additional fees assessed to this class.
Performance Compared to the Russell 1000® Value Index(1) and the Lipper Multi-Cap Value Funds Index(2)
| | Total Returns(3) | |
| | Cumulative | |
| | Since | |
| | Inception(5) | |
| | | |
Portfolio – Class A (4) | | (13.93 | )% | |
Russell 1000® Value Index | | (8.22 | ) | |
Lipper Multi-Cap Value Funds Index | | (9.18 | ) | |
| | | | |
Portfolio – Class B (4) | | (14.06 | ) | |
Russell 1000® Value Index | | (8.22 | ) | |
Lipper Multi-Cap Value Funds Index | | (9.18 | ) | |
Performance data quoted represents past performance, which is no guarantee of future results, and current performance may be lower or higher than the figures shown. Performance assumes that all dividends and distributions, if any, were reinvested. For the most recent month-end performance figures, please visit www.morganstanley.com/msim. Investment return and principal value will fluctuate so that Portfolio shares, when redeemed, may be worth more or less than their original cost. Total returns do not reflect the deduction of taxes that a shareholder would pay on Portfolio distributions or the redemption of Portfolio shares.
(1) | | The Russell 1000® Value Index measures the performance of those companies in the Russell 1000® Index with lower price-to-book ratios and lower forecasted growth values. The Index is unmanaged and its returns do not include any sales charges or fees. Such costs would lower performance. It is not possible to invest directly in an index. |
(2) | | The Lipper Multi-Cap Value Funds Index is an equally weighted performance index of the largest qualifying funds (based on net assets) in the Lipper Multi-Cap Value Funds classification. The Index, which is adjusted for capital gains distributions and income dividends, is unmanaged and should not be considered an investment. There are currently 30 funds represented in this Index. As of the date of this report, the Portfolio is in the Lipper Multi-Cap Value Funds classification. |
(3) | | Total returns for the Portfolio reflect fees waived and expenses reimbursed, if applicable, by the Adviser. Without such waivers and reimbursements, total returns would have been lower. Fee waivers and/or expense reimbursements are voluntary and the Adviser reserves the right to commence or terminate any waiver and/or reimbursement at any time. |
(4) | | Commenced operations on May 31, 2007 |
(5) | | For comparative purposes, cumulative since inception returns listed for the Indexes refer to the inception date or initial offering of the respective share class of the Portfolio, not the inception of the Index. |
The Disciplined Large Cap Value Active Extension Portfolio (the “Portfolio”) seeks long-term capital appreciation by investing primarily in equity securities of large capitalization companies. The Adviser seeks to construct a diversified portfolio primarily consisting of undervalued, large capitalization equity securities using quantitative security selection models that attempt to identify securities that are undervalued, have attractive operating attributes and improving market price behaviors. The Portfolio primarily invests in common stocks but may also invest in preferred stocks, convertible securities and warrants. In addition to purchasing equity securities (i.e., taking long positions), the Adviser attempts to identify stocks in the Adviser’s large
2007 Annual Report
December 31, 2007
Investment Overview (cont’d)
Disciplined Large Cap Value Active Extension Portfolio
capitalization universe that it believes will underperform relative to the average stock in the universe and will sell these securities short on behalf of the Portfolio. Short sales expose the Portfolio to the risk that it will be required to cover its short positions at a time when securities have appreciated in value, thus resulting in a loss to the portfolio. Leverage may cause the Portfolio’s net asset value to be more volatile than if it had not been leveraged because leverage tends to magnify the effect of any increases or decreases in the value of Portfolio’s securities. The Portfolio cannot assure you that the use of leverage will result in a higher return on your investment.
Performance
For the period from May 31, 2007 (commencement of operations) to December 31, 2007, the Portfolio had a total return based on net asset value and reinvestment of distributions per share of -13.93%, net of fees, for Class A shares and -14.06%, net of fees, for Class B shares. The Portfolio’s Class A and Class B shares underperformed against its benchmark, the Russell 1000® Value Index (the “Index”) which returned -8.22% for the same period.
Factors Affecting Performance
· Although the broad stock market advanced during the year, value stocks overall significantly lagged behind their growth counterparts. Over the period, investors favored larger companies perceived to have better potential of sustainable above-average growth in a volatile economic environment impacted by a deteriorating housing market, declining consumer spending, high oil prices and uncertainty surrounding future corporate profitability.
· The Portfolio’s quantitative stock selection models are based on valuation, operating and trading (12-month momentum) factors. Against the market backdrop in which value underperformed growth, the Portfolio’s active exposure to valuation factors such as relatively higher book-to-price and trailing earnings yield hindered overall performance relative to the Index for the period from May 31, 2007 (the Portfolio’s inception) through December 31, 2007.
· The largest detractor from relative returns came from security selection within the financials sector. Here, the Portfolio’s long positions in banks unfortunately overshadowed the benefits gained from its short positions. Further dampening performance were individual stock positions within the consumer staples sector, predominately on the long side.
· In contrast, the models’ emphasis on stocks with attractive long-term price momentum (measured over a 12-month period) contributed to the Portfolio’s relative performance. Stocks with good long-term price momentum benefited in this recent market environment, where market participants tended to react strongly to news, thereby creating short-term price volatility.
· The information technology sector had the largest positive impact on relative returns, primarily due to favorable short positions. Furthermore, the Portfolio’s long holdings in the health care sector also added to relative performance, especially those within the health care equipment and services industry group.
Management Strategies
· In actively managing the portfolio, we apply a bottom-up, quantitative approach. The process for identifying securities to hold long and to short encompasses proprietary, robust quantitative models of valuation (including price relative to trailing earnings), operating (including change in shares outstanding) and momentum (including growth rate in twelve-month price) factors.
· We use history as a guide to the future—historical testing is an essential part of our research process. The models we use are designed to favor long-term trends and be less reactive to short-term fluctuations.
· At the close of the period, energy and industrials represented the largest sector overweights in the Portfolio while health care and financials represented the largest sector underweights.
Expense Examples
As a shareholder of the Portfolio, you may incur two types of costs: (1) transactional costs, including redemption fees; (2) ongoing costs, including management fees, shareholder servicing fees (in the case of Class B); and other Portfolio expenses. These examples are intended to help you understand your ongoing costs (in dollars) of investing in the Portfolio and to compare these costs with the ongoing costs of investing in other mutual funds.
The examples are based on an investment of $1,000 invested at the beginning of the six-month period ended December 31, 2007 and held for the entire six-month period.
Actual Expenses
The first line of the tables below provides information about actual account values and actual expenses. You may use the information in this line, together with the amount you invested, to estimate the expenses that you paid over the period. Simply divide your account value by $1,000 (for example, an $8,600 account value divided by $1,000 = 8.6),
82
2007 Annual Report
December 31, 2007
Investment Overview (cont’d)
Disciplined Large Cap Value Active Extension Portfolio
then multiply the result by the number in the first line under the heading entitled “Expenses Paid During Period” to estimate the expenses you paid on your account during this period.
Please note that “Expenses Paid During Period” are grossed up to reflect Portfolio expenses prior to the effect of Expense Offset (See Note E in the Notes to Financial Statements). Therefore, the annualized net expense ratios may differ from the ratio of the expenses to average net assets shown in the Financial Highlights.
Hypothetical Example for Comparison Purposes
The second line of the tables below provides information about hypothetical account values and hypothetical expenses based on the Portfolio’s actual expense ratio and an assumed rate of return of 5% per year before expenses, which is not the Portfolio’s actual return. The hypothetical account values and expenses may not be used to estimate the actual ending account balance or expenses you paid for the period. You may use this information to compare the ongoing costs of investing in the Portfolio and other funds. To do so, compare this 5% hypothetical example with the 5% hypothetical examples that appear in the shareholder reports of the other funds.
Please note that the expenses shown in the table are meant to highlight your ongoing costs only and do not reflect any transactional costs, such as redemption fees. Therefore, the second line of the table is useful in comparing ongoing costs only, and will not help you determine the relative total costs of owning different funds. In addition, if these transactional costs were included, your costs would have been higher.
| | Beginning
Account Value
July 1, 2007 | | Ending
Account Value
December 31,
2007 | | Expenses Paid
During Period*
July 1, 2007 — December 31,
2007 | |
Class A | | | | | | | |
Actual | | $1,000.00 | | $ 892.00 | | $10.83 | |
Hypothetical (5% average annual return before expenses) | | 1,000.00 | | 1,013.76 | | 11.52 | |
| | | | | | | |
Class B | | | | | | | |
Actual | | 1,000.00 | | 892.40 | | 11.83 | |
Hypothetical (5% average annual return before expenses) | | 1,000.00 | | 1,012.70 | | 12.58 | |
* | Expenses are equal to Class A and Class B annualized net expense ratios of 2.27% and 2.48%, respectively, multiplied by the average account value over the period, multiplied by 184/365 (to reflect the one-half year period). |
| | | | | | | | |
Graphic Presentation of Portfolio Holdings
The following graph depicts the Portfolio’s holdings by industry and/or security type, as a percentage of total investments.
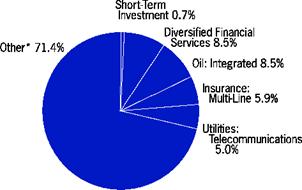
* | Industries which do not appear in the above graph, as well as those which represent less than 5% of total investments, if applicable, are included in the category labeled “Other”. |
83
2007 Annual Report
December 31, 2007
Portfolio of Investments
Disciplined Large Cap Value Active Extension
| | Shares | | Value
(000) |
Long Positions (126.1%) | | | | |
Common Stocks (126.1%) | | | | |
Aerospace (2.5%) | | | | |
Northrop Grumman Corp. | | (q)1,572 | | $ | 124 |
Raytheon Co. | | (q)1,752 | | 106 |
| | | | 230 |
Auto Trucks & Parts (1.0%) | | | | |
Paccar, Inc. | | (q)1,703 | | 93 |
Banks: Outside New York City (6.1%) | | | | |
City National Corp. | | (q)1,501 | | 89 |
Comerica, Inc. | | (q)2,049 | | 89 |
National City Corp. | | (q)4,446 | | 73 |
Northern Trust Corp. | | 1,232 | | 95 |
Popular, Inc. | | (q)5,338 | | 57 |
U.S. Bancorp | | 135 | | 4 |
UnionBanCal Corp. | | 1,829 | | 89 |
Wells Fargo & Co. | | (q)2,321 | | 70 |
| | | | 566 |
Beverages: Brewers (Wineries) (0.7%) | | | | |
Molson Coors Brewing Co., Class B | | (q)1,328 | | 69 |
Beverages: Soft Drinks (1.2%) | | | | |
Coca-Cola Enterprises, Inc. | | 4,107 | | 107 |
Biotechnology Research & Production (1.1%) | | | | |
Charles River Laboratories International, Inc. | | (a)(q)1,544 | | 102 |
Cable Television Services (1.6%) | | | | |
Liberty Global, Inc., Class A | | (a)828 | | 32 |
Liberty Media Corp. - Capital, Class A | | (a)973 | | 113 |
| | | | 145 |
Chemicals (3.4%) | | | | |
Dow Chemical Co. (The) | | (q)3,474 | | 137 |
Eastman Chemical Co. | | (q)1,562 | | 95 |
Lubrizol Corp. | | (q)1,567 | | 85 |
| | | | 317 |
Communications & Media (1.3%) | | | | |
CBS Corp., Class B | | (q)4,305 | | 117 |
Time Warner, Inc. | | 158 | | 3 |
| | | | 120 |
Communications Technology (1.1%) | | | | |
Embarq Corp. | | 2,041 | | 101 |
Computer Services Software & Systems (1.4%) | | | | |
Computer Sciences Corp. | | (a)1,802 | | 89 |
Juniper Networks, Inc. | | (a)741 | | 24 |
Lexmark International, Inc., Class A | | (a)(q)592 | | 21 |
| | | | 134 |
Computer Technology (2.4%) | | | | |
Hewlett-Packard Co. | | (q)1,820 | | 92 |
International Business Machines Corp. | | (q)1,207 | | 130 |
| | | | 222 |
Containers & Packaging: Metal & Glass (1.1%) | | | | |
Owens-Illinois, Inc. | | (a)(q)1 ,981 | | 98 |
Cosmetics (1.0%) | | | | |
Alberto-Culver Co. | | 3,915 | | 96 |
Diversified Financial Services (10.8%) | | | | |
Bank of America Corp. | | (q)4,277 | | $ | 177 |
Bank of New York/Mellon Corp. (The) | | (q)2,879 | | 140 |
Citigroup, Inc. | | (q)8,553 | | 252 |
Goldman Sachs Group, Inc. (The) | | (q)645 | | 139 |
JPMorgan Chase & Co. | | (q)2,887 | | 126 |
Merrill Lynch & Co., Inc. | | (q)2,378 | | 128 |
Wachovia Corp. | | (q)994 | | 38 |
| | | | 1,000 |
Drugs & Pharmaceuticals (2.6%) | | | | |
Johnson & Johnson | | (q)1,369 | | 91 |
Pfizer, Inc. | | (q)6,664 | | 152 |
| | | | 243 |
Electrical Equipment & Components (1.0%) | | | | |
Energizer Holdings, Inc. | | (a)(q)836 | | 94 |
Electronics: Semi-Conductors/Components (1.8%) | | | | |
Arrow Electronics, Inc. | | (a)(q)2,487 | | 98 |
Intersil Corp., Class A | | 2,774 | | 68 |
| | | | 166 |
Energy Equipment (0.8%) | | | | |
Ensco International, Inc. | | (q)1,294 | | 77 |
Energy — Miscellaneous (2.8%) | | | | |
Devon Energy Corp. | | (q)1,583 | | 141 |
Occidental Petroleum Corp. | | 204 | | 16 |
Valero Energy Corp. | | (q)1,532 | | 107 |
| | | | 264 |
Financial — Miscellaneous (3.0%) | | | | |
Axis Capital Holdings, Ltd. | | 733 | | 29 |
Countrywide Financial Corp. | | (q)5,371 | | 48 |
Fannie Mae | | (q)794 | | 32 |
MGIC Investment Corp. | | (q)2,980 | | 67 |
PartnerRe, Ltd. | | 364 | | 30 |
PMI Group, Inc. (The) | | (q)2,902 | | 38 |
Radian Group, Inc. | | (q)3,110 | | 36 |
| | | | 280 |
Foods (2.6%) | | | | |
JM Smucker Co. (The) | | 1,875 | | 96 |
Kraft Foods, Inc., Class A | | 94 | | 3 |
Seaboard Corp. | | (q)46 | | 68 |
Tyson Foods, Inc., Class A | | (q)5,069 | | 78 |
| | | | 245 |
Forest Products (1.0%) | | | | |
Plum Creek Timber Co., Inc. REIT | | 2,062 | | 95 |
Health Care Services (2.1%) | | | | |
Aetna, Inc. | | 1,752 | | 101 |
Coventry Health Care, Inc. | | (a)1,630 | | 97 |
| | | | 198 |
Homebuilding (2.5%) | | | | |
KB Home | | (q)2,781 | | 60 |
MDC Holdings, Inc. | | 2,438 | | 91 |
NVR, Inc. | | (a)(q)147 | | 77 |
| | | | 228 |
84 | The accompanying notes are an integral part of the financial statements. |
2007 Annual Report
2007 Annual Report
December 31, 2007
Portfolio of Investments (cont’d)
Disciplined Large Cap Value Active Extension
| | Shares | | Value
(000) |
Insurance: Life (2.0%) | | | | |
Cigna Corp. | | (q)1,715 | | $ | 92 |
Nationwide Financial Services | | (q)1,978 | | 89 |
| | | | 181 |
Insurance: Multi-Line (7.5%) | | | | |
American International Group, Inc. | | (q)1,475 | | 86 |
American National Insurance Co. | | (q)168 | | 20 |
Assurant, Inc. | | 1,595 | | 107 |
Hartford Financial Services Group, Inc. (The) | | 1,400 | | 122 |
Loews Corp. | | (q)2,527 | | 127 |
MetLife, Inc. | | (q)2,108 | | 130 |
Unitrin, Inc. | | (q)2,095 | | 101 |
| | | | 693 |
Insurance: Property & Casualty (2.9%) | | | | |
Fidelity National Financial, Inc., Class A | | (a)5,038 | | 73 |
Safeco Corp. | | (q)1,778 | | 99 |
Transatlantic Holdings, Inc. | | 1,290 | | 94 |
| | | | 266 |
Investment Management Companies (2.6%) | | | | |
Ameriprise Financial, Inc. | | (q)1,856 | | 102 |
Lehman Brothers Holdings, Inc. | | (q)2,180 | | 143 |
| | | | 245 |
Leisure Equipment & Products (0.6%) | | | | |
Brunswick Corp. | | 3,125 | | 53 |
Machinery & Engineering (0.5%) | | | | |
AGCO Corp. | | (a)(q)710 | | 48 |
Machinery: Engines (1.0%) | | | | |
Cummins, Inc. | | (q)721 | | 92 |
Manufacturing (2.3%) | | | | |
Eaton Corp. | | (q)1,163 | | 113 |
SPX Corp. | | (q)962 | | 99 |
| | | | 212 |
Multi-Sector Companies (6.3%) | | | | |
General Electric Co. | | (q)10,111 | | 375 |
Honeywell International, Inc. | | (q)1,780 | | 109 |
Tyco International, Ltd. | | (q)2,540 | | 101 |
| | | | 585 |
Office Furniture & Business Equipment (1.2%) | | | | |
Xerox Corp. | | (q)6,634 | | 107 |
Oil: Integrated (15.2%) | | | | |
Chevron Corp. | | (q)3,842 | | 359 |
ConocoPhillips | | (q)2,794 | | 247 |
ExxonMobil Corp. | | (q)6,922 | | 648 |
Marathon Oil Corp. | | 2,490 | | 151 |
| | | | 1,405 |
Paints & Coatings (0.9%) | | | | |
Sherwin Williams Co. (The) | | 1,400 | | 81 |
Production Technology Equipment (0.6%) | | | | |
Novellus Systems, Inc. | | (a)(q)2,006 | | 55 |
Publishing: Newspapers (1.1%) | | | | |
Gannett Co., Inc. | | (q)2,582 | | 101 |
Real Estate Investment Trusts (REIT) (1.2%) | | | | |
Colonial Properties Trust REIT | | 1,009 | | $ | 23 |
HRPT Properties Trust REIT | | 11,800 | | 91 |
| | | | 114 |
Retail (1.8%) | | | | |
Dollar Tree Stores, Inc. | | (a)(q)2,621 | | 68 |
Expedia, Inc. | | (a)(q)3,106 | | 98 |
McDonald’s Corp. | | 65 | | 4 |
| | | | 170 |
Services: Commercial (2.2%) | | | | |
Avis Budget Group, Inc. | | (a)(q)4,427 | | 57 |
Convergys Corp. | | (a)(q)2,719 | | 45 |
Hewitt Associates, Inc., Class A | | (a)(q)2,537 | | 97 |
| | | | 199 |
Soaps & Household Chemicals (1.2%) | | | | |
Procter & Gamble Co. | | (q)1,564 | | 115 |
Textile Apparel Manufacturers (0.8%) | | | | |
Jones Apparel Group, Inc. | | (q)4,638 | | 74 |
Textile Products (1.0%) | | | | |
Mohawk Industries, Inc. | | (a)(q)1,219 | | 91 |
Tobacco (1.3%) | | | | |
Altria Group, Inc. | | (q)288 | | 22 |
Loews Corp. - Carolina Group | | 1,147 | | 98 |
| | | | 120 |
Transportation — Miscellaneous (1.1%) | | | | |
Overseas Shipholding Group, Inc. | | 1,415 | | 105 |
Truckers (0.2%) | | | | |
YRC Worldwide, Inc. | | (a)(q)983 | | 17 |
Utilities: Electrical (5.7%) | | | | |
Alliant Energy Corp. | | (q)2,379 | | 97 |
DTE Energy Co. | | (q)2,080 | | 91 |
FirstEnergy Corp. | | (q)521 | | 38 |
Pepco Holdings, Inc. | | (q)3,505 | | 103 |
PG&E Corp. | | (q)2,491 | | 107 |
TECO Energy, Inc. | | (q)5,609 | | 97 |
| | | | 533 |
Utilities — Miscellaneous (1.7%) | | | | |
Dynegy, Inc., Class A | | (a)9,399 | | 67 |
Reliant Energy, Inc. | | (a)(q)3,564 | | 94 |
| | | | 161 |
Utilities: Telecommunications (6.3%) | | | | |
AT&T, Inc. | | (q)6,306 | | 262 |
CenturyTel, Inc. | | (q)2,354 | | 98 |
Telephone & Data Systems, Inc. | | (q)1,526 | | 95 |
Verizon Communications, Inc. | | (q)2,959 | | 129 |
| | | | 584 |
Total Common Stocks (Cost $12,491) | | | | 11,697 |
Short-Term Investment (0.9%) | | | | |
Investment Company (0.9%) | | | | |
Morgan Stanley Institutional Liquidity Money Market Portfolio — Institutional Class (Cost $83) | | (o)83,379 | | 83 |
The accompanying notes are an integral part of the financial statements. | 85 |
2007 Annual Report
December 31, 2007
Portfolio of Investments (cont’d)
Disciplined Large Cap Value Active Extension
| | | | Value
(000) |
Total Investments (127.0%) (Cost $12,574) | | | | $ | 11,780 |
Liabilities in Excess of Other Assets (-27.0%) | | | | (2,501) |
Net Assets (100%) | | | | $ | 9,279 |
| | Shares | | |
Short Positions (28.6%)* | | | | |
Common Stocks (28.6%) | | | | |
Advertising Agencies (1.4%) | | | | |
Interpublic Group of Cos., Inc. | | (a)7,670 | | 62 |
R.H. Donnelley Corp. | | (a)1,726 | | 63 |
| | | | 125 |
Banks: Outside New York City (2.1%) | | | | |
Bancorpsouth, Inc. | | 2,715 | | 64 |
Cullen/Frost Bankers, Inc. | | 1,242 | | 63 |
First Horizon National Corp. | | 680 | | 12 |
Fulton Financial Corp. | | 5,291 | | 60 |
| | | | 199 |
Biotechnology Research & Production (1.1%) | | | | |
Amgen, Inc. | | (a)824 | | 38 |
Applera Corp. - Applied Biosystems Group | | 1,888 | | 64 |
| | | | 102 |
Chemicals (0.7%) | | | | |
Cabot Corp. | | 1,981 | | 66 |
Communications & Media (1.5%) | | | | |
News Corp, Inc., Class A | | 2,369 | | 48 |
Regal Entertainment Group, Class A | | 3,520 | | 64 |
Walt Disney Co. (The) | | 693 | | 22 |
| | | | 134 |
Communications Technology (0.7%) | | | | |
JDS Uniphase Corp. | | (a)4,976 | | 66 |
Computer Services Software & Systems (1.9%) | | | | |
QLogic Corp. | | (a)4,647 | | 66 |
Unisys Corp. | | (a)11,949 | | 57 |
Virgin Media, Inc. | | 3,113 | | 53 |
| | | | 176 |
Computer Technology (0.5%) | | | | |
Sun Microsystems, Inc. | | (a)2,588 | | 47 |
Consumer Staples — Miscellaneous (0.8%) | | | | |
Clorox Co. | | 1,082 | | 71 |
Electrical & Electronics (0.7%) | | | | |
Molex, Inc. | | 2,461 | | 67 |
Electronics: Semi-Conductors/Components (2.1%) | | | | |
Advanced Micro Devices, Inc. | | (a)5,077 | | 38 |
Atmel Corp. | | (a)15,074 | | 65 |
Integrated Device Technology, Inc. | | (a)4,755 | | 54 |
Micron Technology, Inc. | | (a)5,103 | | 37 |
| | | | 194 |
Finance Companies (0.8%) | | | | |
People’s United Financial, Inc. | | 4,114 | | 73 |
Foods (0.7%) | | | | |
McCormick & Co., Inc. | | 1,778 | | 67 |
Health Care Facilities (0.6%) | | | | |
Brookdale Senior Living, Inc. | | 2,033 | | 58 |
Health Care Providers & Services (0.1%) | | | | |
Tenet Healthcare Corp. | | (a)1,109 | | $ | 6 |
Insurance: Property & Casualty (0.1%) | | | | |
Wesco Financial Corp. | | 18 | | 7 |
Investment Management Companies (1.3%) | | | | |
Allied Capital Corp. | | 2,407 | | 52 |
Investment Technology Group, Inc. | | (a)1,527 | | 72 |
| | | | 124 |
Machine Tools (0.7%) | | | | |
Snap-On, Inc. | | 1,380 | | 67 |
Medical & Dental Instruments & Supplies (0.3%) | | | | |
Boston Scientific Corp. | | (a)2,066 | | 24 |
Real Estate Investment Trusts (REIT) (3.6%) | | | | |
BRE Properties, Inc. REIT | | 95 | | 4 |
CBL & Associates Properties, Inc. REIT | | 1,456 | | 35 |
Douglas Emmett, Inc. REIT | | 401 | | 9 |
Essex Property Trust, Inc. REIT | | 126 | | 12 |
Federal Realty Investments Trust REIT | | 572 | | 47 |
Health Care, Inc. REIT | | 1,155 | | 52 |
Hospitality Properties Trust REIT | | 1,742 | | 56 |
Host Hotels & Resorts, Inc. REIT | | 1,882 | | 32 |
Regency Centers Corp. REIT | | 397 | | 25 |
Taubman Centers, Inc. REIT | | 1,262 | | 62 |
| | | | 334 |
Retail (1.2%) | | | | |
Liberty Media Corp. - Interactive, Class A | | (a)(q)3,176 | | 61 |
Rite Aid Corp. | | (a)18,020 | | 50 |
| | | | 111 |
Savings & Loan (1.4%) | | | | |
Capitol Federal Financial | | 2,127 | | 66 |
Sovereign Bancorp, Inc. | | 5,232 | | 60 |
| | | | 126 |
Services: Commercial (1.1%) | | | | |
Cintas Corp. | | 1,317 | | 44 |
Hertz Global Holdings, Inc. | | (a)3,871 | | 62 |
| | | | 106 |
Utilities: Cable TV & Radio (1.1%) | | | | |
Cablevision Systems Corp. | | (a)2,559 | | 63 |
Comcast Corp., Class A | | (a)2,377 | | 43 |
| | | | 106 |
Utilities: Electrical (0.7%) | | | | |
Hawaiian Electric Industries, Inc. | | 2,881 | | 66 |
Utilities: Gas Pipelines (0.7%) | | | | |
UGI Corp. | | 2,424 | | 66 |
Utilities: Water (0.7%) | | | | |
Aqua America, Inc. | | 2,930 | | 62 |
Total Short Positions (Cost $2,977) | | | | $ | 2,650 |
86 | The accompanying notes are an integral part of the financial statements. | |
2007 Annual Report
December 31, 2007
Portfolio of Investments (cont’d)
Disciplined Large Cap Value Active Extension
* Percentages are based on Net Assets.
(a) Non-income producing security.
(o) See Note F within the Notes to Financial Statements regarding investment in Morgan Stanley Institutional Liquidity Money Market Portfolio — Institutional Class.
(q) Securities are pledged with a broker as collateral for short sales.
REIT Real Estate Investment Trust
| The accompanying notes are an integral part of the financial statements. | 87 |
2007 Annual Report
December 31, 2007
Investment Overview (unaudited)
Focus Equity Portfolio
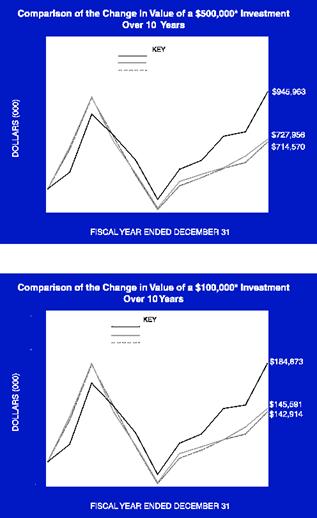
* Minimum Investment
In accordance with SEC regulations, Portfolio’s performance shown assumes that all recurring fees (including management fees) were deducted and all dividends and distributions were reinvested. The performance of Class B shares will vary from the Class A shares based upon its different inception date and will be negatively impacted by additional fees assessed to this class.
Performance Compared to the Russell 1000® Growth Index(1) and the Lipper Large-Cap Growth Funds Index(2)
| | | Total Returns(3) | |
| | | | Average Annual | |
| | One
Year | | Five
Years | | Ten
Years | | Since
Inception(6) | |
Portfolio – Class A (4) | | 24.02 | % | 15.98 | % | 6.58 | % | 13.41 | % |
Russell 1000® Growth Index | | 11.81 | | 12.11 | | 3.83 | | 9.03 | |
Lipper Large-Cap Growth Funds Index | | 14.97 | | 12.06 | | 3.64 | | 8.54 | |
| | | | | | | | | |
Portfolio – Class B (5) | | 23.70 | | 15.68 | | 6.33 | | 10.82 | |
Russell 1000® Growth Index | | 11.81 | | 12.11 | | 3.83 | | 7.27 | |
Lipper Large-Cap Growth Funds Index | | 14.97 | | 12.06 | | 3.64 | | 6.77 | |
| | | | | | | | | | |
Performance data quoted represents past performance, which is no guarantee of future results, and current performance may be lower or higher than the figures shown. Performance assumes that all dividends and distributions, if any, were reinvested. For the most recent month-end performance figures, please visit www.morganstanley.com/msim. Investment return and principal value will fluctuate so that Portfolio shares, when redeemed, may be worth more or less than their original cost. Total returns do not reflect the deduction of taxes that a shareholder would pay on Portfolio distributions or the redemption of Portfolio shares.
(1) The Russell 1000® Growth Index measures the performance of those Russell 1000® Index companies with higher price-to-book ratios and higher forecasted growth values. The Russell 1000® Index measures the performance of the 1,000 largest companies in the Russell 3000® Index. The Russell 3000® Index measures the performance of the 3,000 largest U.S. companies based on total market capitalization. The Index is unmanaged and its returns do not include any sales charges or fees. Such costs would lower performance. It is not possible to invest directly in an index.
(2) The Lipper Large-Cap Growth Funds Index is an equally weighted performance index of the largest qualifying funds (based on net assets) in the Lipper Large-Cap Growth Funds classification. The Index, which is adjusted for capital gains distributions and income dividends, is unmanaged and should not be considered an investment. There are currently 30 funds represented in this Index. As of the date of this report, the Portfolio is in the Lipper Large-Cap Growth Funds classification.
(3) Total returns for the Portfolio reflect fees waived and expenses reimbursed, if applicable, by the Adviser. Without such waivers and reimbursements, total returns would have been lower. Fee waivers and/or expense reimbursements are voluntary and the Adviser reserves the right to commence or terminate any waiver and/or reimbursement at any time.
(4) Commenced operations on March 8, 1995
(5) Commenced operations on January 2, 1996
(6) For comparative purposes, average annual since inception returns listed for the Indexes refer to the inception date or initial offering of the respective share class of the Portfolio, not the inception of the Index.
The Focus Equity Portfolio (the “Portfolio”) seeks capital appreciation by investing primarily in growth-oriented equity securities of large capitalization companies. The Portfolio’s concentration of its assets in a small number of issuers will subject it to greater risks.
Performance
For the year ended December 31, 2007, the Portfolio had a total return based on net asset value per share of 24.02%, net of fees, for Class A shares and 23.70%, net of fees, for Class B shares. The Portfolio’s Class A and Class B shares outperformed against its benchmark, the Russell 1000® Growth Index (the “Index”) which returned 11.81%.
Factors Affecting Performance
· The broad equity market made a modest gain for the12-month period ended December 31, 2007, despite experiencing a decline in the second half of the year. During the summer, the subprime mortgage market suffered a complete collapse under the weight of rising loan defaults and home foreclosures. As a result, credit significantly tightened, liquidity decreased and consumer spending declined, particularly as gasoline prices once again surged upward. In response to this
88
| 2007 Annual Report |
| |
| December 31, 2007 |
Investment Overview (cont’d)
Focus Equity Portfolio
rising volatility, the Federal Reserve began a series of cuts to the target federal funds rate and the discount rate. Although each announced rate reduction temporarily boosted investor sentiment, the broad market declined in the fourth quarter, reflecting investors’ concerns about the health of the financial markets in the coming year.
· In this environment, the market demonstrated a preference for growth equities over value equities, as well as for large- and mid-capitalization stocks.
· For the 12-month period, the Portfolio’s outperformance was driven by stock selection, while sector allocations detracted. It should be noted that sector allocations are a result of bottom-up stock selection and are not intentional top-down decisions.
· The technology sector had the largest positive impact on performance for the period. Here, stock selection in the communications technology and computer technology sectors greatly added to relative returns, and offset the negative influence of an underweight allocation.
· In the materials and processing sector, an overweight allocation together with a single holding in an agricultural fishing and ranching company significantly helped performance. Additionally, security selection in the consumer discretionary sector was advantageous. Favorable investment in retail, consumer electronics, and hotel/motel companies more than made up for the negative effect of the sector’s overweight position.
· In contrast, the financial services sector had the most unfavorable impact on performance due to security selection. Selection in financial data processing companies and a single holding in a financial information services company were the primary detractors.
· The Portfolio’s zero exposure to the consumer staples sector was also disadvantageous to performance, as was an underweight allocation in the producer durables sector.
Management Strategies
· It is our goal to hold a portfolio of high quality growth stocks we believe will perform well regardless of the market environment. We continue to favor companies that have some uniqueness or dynamic competitive advantage in their business model, with a high quality stream of cash flow and the ability to redeploy capital at a high rate of return.
· At the close of the period, consumer discretionary represented the largest sector weight and overweight in the Portfolio, followed by the multi-industry and financial services sectors. The multi-industry sector (which includes conglomerates) was overweight versus the Index, and the financial services sector was weighted in-line with the Index.
Expense Examples
As a shareholder of the Portfolio, you may incur two types of costs: (1) transactional costs, including redemption fees; (2) ongoing costs, including management fees, shareholder servicing fees (in the case of Class B); and other Portfolio expenses. These examples are intended to help you understand your ongoing costs (in dollars) of investing in the Portfolio and to compare these costs with the ongoing costs of investing in other mutual funds.
The examples are based on an investment of $1,000 invested at the beginning of the six-month period ended December 31, 2007 and held for the entire six-month period.
Actual Expenses
The first line of the tables below provides information about actual account values and actual expenses. You may use the information in this line, together with the amount you invested, to estimate the expenses that you paid over the period. Simply divide your account value by $1,000 (for example, an $8,600 account value divided by $1,000 = 8.6), then multiply the result by the number in the first line under the heading entitled “Expenses Paid During Period” to estimate the expenses you paid on your account during this period.
Please note that “Expenses Paid During Period” are grossed up to reflect Portfolio expenses prior to the effect of Expense Offset (See Note E in the Notes to Financial Statements). Therefore, the annualized net expense ratios may differ from the ratio of the expenses to average net assets shown in the Financial Highlights.
Hypothetical Example for Comparison Purposes
The second line of the tables below provides information about hypothetical account values and hypothetical expenses based on the Portfolio’s actual expense ratio and an assumed rate of return of 5% per year before expenses, which is not the Portfolio’s actual return. The hypothetical account values and expenses may not be used to estimate the actual ending account balance or expenses you paid for the period. You may use this information to compare the ongoing costs of investing in the Portfolio and other funds. To do so, compare this 5% hypothetical example with the 5% hypothetical examples that appear in the shareholder reports of the other funds.
Please note that the expenses shown in the table are meant to highlight your ongoing costs only and do not reflect any
89
2007 Annual Report
December 31, 2007
Investment Overview (cont’d)
Focus Equity Portfolio
transactional costs, such as redemption fees. Therefore, the second line of the table is useful in comparing ongoing costs only, and will not help you determine the relative total costs of owning different funds. In addition, if these transactional costs were included, your costs would have been higher.
| | Beginning
Account Value | | Ending Account
Value
December 31, | | Expenses Paid
During Period*
July 1, 2007 —
December 31, | |
| | July 1, 2007 | | 2007 | | 2007 | |
Class A | | | | | | | |
Actual | | $1,000.00 | | $1,117.40 | | $5.34 | |
Hypothetical (5% average annual return before expenses) | | 1,000.00 | | 1,020.16 | | 5.09 | |
| | | | | | | |
Class B | | | | | | | |
Actual | | 1,000.00 | | 1,115.70 | | 6.67 | |
Hypothetical (5% average annual return before expenses) | | 1,000.00 | | 1,018.90 | | 6.36 | |
*Expenses are equal to Class A and Class B annualized net expense ratios of 1.00% and 1.25%, respectively, multiplied by the average account value over the period, multiplied by 184/365 (to reflect the one-half year period).
Graphic Presentation of Portfolio Holdings
The following graph depicts the Portfolio’s holdings by industry and/or security type, as a percentage of total investments.
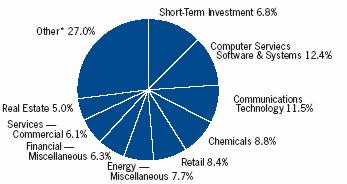
* Industries which do not appear in the above graph, as well as those which represent less than 5% of total investments, if applicable, are included in the category labeled “Other”.
90
| 2007 Annual Report |
| |
| December 31, 2007 |
Portfolio of Investments
Focus Equity Portfolio
| | Shares | | Value
(000) | |
Common Stocks (93.6%) | | | | | |
Air Transport (1.9%) | | | | | |
Expeditors International Washington, Inc. | | 7,266 | | $ 325 | |
Building: Cement (2.9%) | | | | | |
Cemex S.A.B. de C.V. ADR | | (a)18,674 | | 483 | |
Casinos & Gambling (3.9%) | | | | | |
Wynn Resorts Ltd. | | 5,901 | | 662 | |
Chemicals (8.8%) | | | | | |
Monsanto Co. | | 13,187 | | 1,473 | |
Communications Technology (11.5%) | | | | | |
America Movil S.A.B. de C.V., Class L ADR | | 11,692 | | 718 | |
Cisco Systems, Inc. | | (a)15,006 | | 406 | |
Research In Motion Ltd. | | (a)7,161 | | 812 | |
| | | | 1,936 | |
Computer Services Software & Systems (12.4%) | | | | | |
Baidu.com ADR | | (a)1,104 | | 431 | |
Google, Inc., Class A | | (a)1,959 | | 1,354 | |
Tencent Holdings Ltd. | | 40,000 | | 298 | |
| | | | 2,083 | |
Computer Technology (3.8%) | | | | | |
Apple, Inc. | | (a)3,237 | | 641 | |
Diversified Financial Services (3.0%) | | | | | |
CME Group, Inc. | | 745 | | 511 | |
Energy — Miscellaneous (7.8%) | | | | | |
Ultra Petroleum Corp. | | (a)18,201 | | 1,301 | |
Financial — Miscellaneous (6.3%) | | | | | |
American Express Co. | | 10,442 | | 543 | |
Berkshire Hathaway, Inc., Class B | | (a)108 | | 512 | |
| | | | 1,055 | |
Insurance: Multi-Line (3.9%) | | | | | |
Loews Corp. | | 12,955 | | 652 | |
Real Estate (5.0%) | | | | | |
Brookfield Asset Management, Inc., Class A | | 23,590 | | 841 | |
Restaurants (2.9%) | | | | | |
Starbucks Corp. | | (a)23,482 | | 481 | |
Retail (8.5%) | | | | | |
Abercrombie & Fitch Co. | | 5,117 | | 409 | |
Amazon.com, Inc. | | (a)10,884 | | 1,008 | |
| | | | 1,417 | |
Services: Commercial (6.2%) | | | | | |
Corporate Executive Board Co. | | 4,379 | | 263 | |
eBay, Inc. | | (a)23,250 | | 772 | |
| | | | 1,035 | |
Shipping (2.6%) | | | | | |
C.H. Robinson Worldwide, Inc. | | 7,915 | | 428 | |
Wholesalers (2.2%) | | | | | |
Li & Fung Ltd. | | 92,000 | | 368 | |
Total Common Stocks (Cost $12,362) | | | | 15,692 | |
Short-Term Investment (6.8%) | | | | | |
Investment Company (6.8%) | | | | | |
Morgan Stanley Institutional Liquidity Money Market Portfolio | | | | | |
— Institutional Class (Cost $1,147) | | (o)1,147,002 | | $ 1,147 | |
Total Investments (100.4%) (Cost $13,509) | | | | (v)16,839 | |
Liabilities in Excess of Other Assets (-0.4%) | | | | (74) | |
Net Assets (100%) | | | | $16,765 | |
| | |
(a) | | Non-income producing security. |
(o) | | See Note F within the Notes to Financial Statements regarding investment in Morgan Stanley Institutional Liquidity Money Market Portfolio — Institutional Class. |
(v) | | The approximate market value and percentage of the investments, $666,000 and 4.0%, respectively, represent the securities that have been fair valued under the fair valuation policy for international investments as described in Note A within the Notes to Financial Statements. |
ADR | | American Depositary Receipt |
| | | | | | | |
The accompanying notes are an integral part of the financial statements. | 91 |
2007 Annual Report
December 31, 2007
Investment Overview (unaudited)
Large Cap Relative Value Portfolio
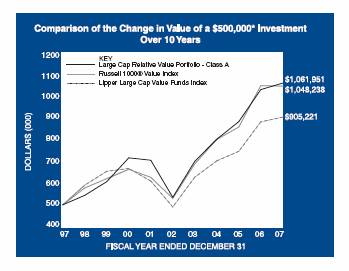

* Minimum Investment
In accordance with SEC regulations, Portfolio’s performance shown assumes that all recurring fees (including management fees) were deducted and all dividends and distributions were reinvested. The performance of Class B shares will vary from the Class A shares based upon its different inception date and will be negatively impacted by additional fees assessed to this class.
Performance Compared to the Russell 1000® Value Index(1) and the Lipper Large-Cap Value Funds Index(2)
| | Total Returns(3) | |
| | | | Average Annual | |
| | One | | Five | | Ten | | Since | |
| | Year | | Years | | Years | | Inception(6) | |
| | | | | | | | | |
Portfolio – Class A (4) | | 2.90 | % | 14.70 | % | 7.82 | % | 10.90 | % |
Russell 1000® Value Index | | (0.17 | ) | 14.63 | | 7.68 | | 12.03 | |
Lipper Large-Cap Value Funds Index | | 2.46 | | 13.04 | | 6.12 | | 10.72 | |
| | | | | | | | | |
Portfolio – Class B (5) | | 2.72 | | 14.40 | | 7.56 | | 10.07 | |
Russell 1000® Value Index | | (0.17 | ) | 14.63 | | 7.68 | | 10.81 | |
Lipper Large-Cap Value Funds Index | | 2.46 | | 13.04 | | 6.12 | | 8.96 | |
Performance data quoted represents past performance, which is no guarantee of future results, and current performance may be lower or higher than the figures shown. Performance assumes that all dividends and distributions, if any, were reinvested. For the most recent month-end performance figures, please visit www.morganstanley.com/msim. Investment return and principal value will fluctuate so that Portfolio shares, when redeemed, may be worth more or less than their original cost. Total returns do not reflect the deduction of taxes that a shareholder would pay on Portfolio distributions or the redemption of Portfolio shares.
(1) | The Russell 1000® Value Index measures the performance of those companies in the Russell 1000® Index with lower price-to-book ratios and lower forecasted growth values. The Index is unmanaged and its returns do not include any sales charges or fees. Such costs would lower performance. It is not possible to invest directly in an index. |
(2) | The Lipper Large-Cap Value Funds Index is an equally weighted performance index of the largest qualifying funds (based on net assets) in the Lipper Large-Cap Value Funds classification. The Index, which is adjusted for capital gains distributions and income dividends, is unmanaged and should not be considered an investment. There are currently 30 funds represented in this Index. As of the date of this report, the Portfolio is in the Lipper Large-Cap Value Funds classification. |
(3) | Total returns for the Portfolio reflect fees waived and expenses reimbursed, if applicable, by the Adviser. Without such waivers and reimbursements, total returns would have been lower. Fee waivers and/or expense reimbursements are voluntary and the Adviser reserves the right to commence or terminate any waiver and/or reimbursement at any time. |
(4) | Commenced operations on January 31, 1990 |
(5) | Commenced operations on January 2, 1996 |
(6) | For comparative purposes, average annual since inception returns listed for the Indexes refer to the inception date or initial offering of the respective share class of the Portfolio, not the inception of the Index. |
The Large Cap Relative Value Portfolio (the “Portfolio”) seeks high total return by investing primarily in equity securities that the Advisor believes to be undervalued relative to the stock market in general at the time of purchase. Investments in foreign markets entail special risks such as currency, political, economic, and market risks.
Performance
For the year ended December 31, 2007, the Portfolio had a total return based on net asset value and reinvestment of distributions per share of 2.90%, net of fees, for Class A shares and 2.72%, net of fees, for Class B shares. The Portfolio’s Class A and Class B shares outperformed against its
92
2007 Annual Report
December 31, 2007
Investment Overview (cont’d)
Large Cap Relative Value Portfolio
benchmark, the Russell 1000® Value Index (the “Index”) which returned -0.17%.
Factors Affecting Performance
· The broad stock market had a modest gain for the year; however, value stocks lagged the broad average. Investors began to favor growth stocks, as economic and market outlooks were dampened by high oil prices, diminished consumer spending, a weak housing market, and concerns about corporate profitability.
· Relative to the Index, the Portfolio benefited primarily from an underweight to the financial sector (although we note that all sector weights are a result of our bottom-up stock selection process and are not intentional top-down allocations). Through limited exposures to regional banks and diversified financial companies, and no holdings in real estate investment trusts, the Portfolio had minimal exposure to the damage caused by the subprime mortgage collapse.
· The materials sector also bolstered relative performance, but this was primarily due to a single holding which generates a larger share of its business in the health care sector than in the materials sector.
· An overweight in the consumer staples sector contributed positively to relative returns as well.
· Detractors from performance included an underweight in the energy sector.
· Stock selection in the technology sector was another area of weakness, due to holdings in hardware and equipment, software and services, and semiconductor companies.
Management Strategies
· We continue to seek value stocks using our bottom-up security selection process. We look for undervalued companies that offer a potential catalyst for change. Such catalysts could be new company management, growth or consolidation within an industry or sector, or new products.
Expense Examples
As a shareholder of the Portfolio, you may incur two types of costs: (1) transactional costs, including redemption fees; (2) ongoing costs, including management fees, shareholder servicing fees (in the case of Class B); and other Portfolio expenses. These examples are intended to help you understand your ongoing costs (in dollars) of investing in the Portfolio and to compare these costs with the ongoing costs of investing in other mutual funds.
The examples are based on an investment of $1,000 invested at the beginning of the six-month period ended December 31, 2007 and held for the entire six-month period.
Actual Expenses
The first line of the tables below provides information about actual account values and actual expenses. You may use the information in this line, together with the amount you invested, to estimate the expenses that you paid over the period. Simply divide your account value by $1,000 (for example, an $8,600 account value divided by $1,000 = 8.6), then multiply the result by the number in the first line under the heading entitled “Expenses Paid During Period” to estimate the expenses you paid on your account during this period.
Please note that “Expenses Paid During Period” are grossed up to reflect Portfolio expenses prior to the effect of Expense Offset (See Note E in the Notes to Financial Statements). Therefore, the annualized net expense ratios may differ from the ratio of the expenses to average net assets shown in the Financial Highlights.
Hypothetical Example for Comparison Purposes
The second line of the tables below provides information about hypothetical account values and hypothetical expenses based on the Portfolio’s actual expense ratio and an assumed rate of return of 5% per year before expenses, which is not the Portfolio’s actual return. The hypothetical account values and expenses may not be used to estimate the actual ending account balance or expenses you paid for the period. You may use this information to compare the ongoing costs of investing in the Portfolio and other funds. To do so, compare this 5% hypothetical example with the 5% hypothetical examples that appear in the shareholder reports of the other funds.
Please note that the expenses shown in the table are meant to highlight your ongoing costs only and do not reflect any transactional costs, such as redemption fees. Therefore, the second line of the table is useful in comparing ongoing costs only, and will not help you determine the relative total costs of owning different funds. In addition, if these transactional costs were included, your costs would have been higher.
93
2007 Annual Report
December 31, 2007
Investment Overview (cont’d)
Large Cap Relative Value Portfolio
| | Beginning
Account Value | | Ending Account
Value
December 31, | | Expenses Paid
During Period*
July 1, 2007 —December 31, |
| | July 1, 2007 | | 2007 | | 2007 |
Class A | | | | | | |
Actual | | $1,000.00 | | $ 956.60 | | $3.25 |
Hypothetical (5% average annual return before expenses) | | 1,000.00 | | 1,021.88 | | 3.36 |
| | | | | | |
Class B | | | | | | |
Actual | | 1,000.00 | | 955.50 | | 4.49 |
Hypothetical (5% average annual return before expenses) | | 1,000.00 | | 1,020.62 | | 4.63 |
* Expenses are equal to Class A and Class B annualized net expense ratios of 0.66% and 0.91%, respectively, multiplied by the average account value over the period, multiplied by 184/365 (to reflect the one-half year period).
Graphic Presentation of Portfolio Holdings
The following graph depicts the Portfolio’s holdings by industry and/or security type, as a percentage of total investments.

* Industries which do not appear in the above graph, as well as those which represent less than 5% of total investments, if applicable, are included in the category labeled “Other”.
94
2007 Annual Report
December 31, 2007
Portfolio of Investments
Large Cap Relative Value Portfolio
| | | | Value |
| | Shares | | (000) |
Common Stocks (98.1%) | | | | |
Aerospace (1.6%) | | | | |
Raytheon Co. | | 73,450 | | $ 4,458 |
Automobiles (0.5%) | | | | |
Honda Motor Co., Ltd. ADR | | 43,630 | | 1,446 |
Banks: Outside New York City (1.0%) | | | | |
PNC Financial Services Group, Inc. | | 41,710 | | 2,738 |
Beverages: Soft Drinks (1.9%) | | | | |
Coca Cola Co. (The) | | 89,230 | | 5,476 |
Chemicals (4.4%) | | | | |
Bayer AG ADR | | 121,910 | | 11,117 |
E.I. Du Pont de Nemours & Co. | | 35,730 | | 1,575 |
| | | | 12,692 |
Communications & Media (4.9%) | | | | |
Time Warner, Inc. | | 427,649 | | 7,060 |
Viacom, Inc., Class B | | (a)158,146 | | 6,946 |
| | | | 14,006 |
Communications Technology (2.2%) | | | | |
Alcatel-Lucent ADR | | 433,650 | | 3,174 |
Cisco Systems, Inc. | | (a)63,260 | | 1,713 |
Embarq Corp. | | 31,416 | | 1,556 |
| | | | 6,443 |
Computer Services Software & Systems (0.9%) | | | | |
Oracle Corp. | | (a)36,300 | | 820 |
Symantec Corp. | | (a)104,430 | | 1,685 |
| | | | 2,505 |
Computer Technology (1.3%) | | | | |
EMC Corp. | | (a)35,800 | | 663 |
Hewlett-Packard Co. | | 63,679 | | 3,215 |
| | | | 3,878 |
Consumer Electronics (1.5%) | | | | |
Sony Corp. ADR | | 14,300 | | 777 |
Yahoo!, Inc. | | (a)152,418 | | 3,545 |
| | | | 4,322 |
Consumer Staples — Miscellaneous (0.6%) | | | | |
Kimberly-Clark Corp. | | 23,130 | | 1,604 |
Cosmetics (0.6%) | | | | |
Estee Lauder Co., Inc. (The) | | 39,060 | | 1,703 |
Diversified Financial Services (5.8%) | | | | |
Bank of America Corp. | | 61,059 | | 2,519 |
Citigroup, Inc. | | 118,454 | | 3,487 |
JPMorgan Chase & Co. | | 199,184 | | 8,694 |
Merrill Lynch & Co., Inc. | | 34,677 | | 1,862 |
| | | | 16,562 |
Drugs & Pharmaceuticals (14.0%) | | | | |
Abbott Laboratories | | 142,520 | | 8,003 |
Bristol-Myers Squibb Co. | | 225,000 | | 5,967 |
Eli Lilly & Co. | | 92,790 | | 4,954 |
Novartis AG ADR | | 52,920 | | 2,874 |
Pfizer, Inc. | | 49,990 | | 1,136 |
Roche Holding AG ADR | | 42,600 | | 3,680 |
Schering-Plough Corp. | | 320,510 | | 8,538 |
Wyeth | | 114,820 | | $ 5,074 |
| | | | 40,226 |
Electronics: Instruments Gauges & Meters (0.5%) | | | | |
Applera Corp. - Applied Biosystems Group | | 42,600 | | 1,445 |
Electronics: Semi-Conductors/Components (1.8%) | | | | |
Intel Corp. | | 153,991 | | 4,105 |
Micron Technology, Inc. | | (a)164,920 | | 1,196 |
| | | | 5,301 |
Energy Equipment (1.6%) | | | | |
Schlumberger Ltd. | | 46,570 | | 4,581 |
Energy — Miscellaneous (2.2%) | | | | |
Devon Energy Corp. | | 14,980 | | 1,332 |
Occidental Petroleum Corp. | | 65,300 | | 5,027 |
| | | | 6,359 |
Financial — Miscellaneous (3.5%) | | | | |
Freddie Mac | | 95,496 | | 3,254 |
Marsh & McLennan Cos., Inc. | | 251,265 | | 6,651 |
| | | | 9,905 |
Foods (5.4%) | | | | |
Cadbury Schweppes plc ADR | | 88,660 | | 4,377 |
ConAgra Foods, Inc. | | 66,470 | | 1,581 |
Kraft Foods, Inc. | | 112,528 | | 3,672 |
Unilever N.V. | | 158,210 | | 5,769 |
| | | | 15,399 |
Insurance: Life (0.3%) | | | | |
Cigna Corp. | | 18,690 | | 1,004 |
Insurance: Multi-Line (1.5%) | | | | |
Aegon N.V. (Registered) | | 77,950 | | 1,367 |
Hartford Financial Services Group, Inc. | | 34,970 | | 3,049 |
| | | | 4,416 |
Insurance: Property & Casualty (3.4%) | | | | |
Chubb Corp. | | 88,970 | | 4,856 |
Travelers Cos., Inc. (The) | | 93,705 | | 5,041 |
| | | | 9,897 |
Investment Management Companies (0.4%) | | | | |
Lehman Brothers Holdings, Inc. | | 15,902 | | 1,041 |
Manufacturing (3.3%) | | | | |
Siemens AG ADR | | 45,360 | | 7,138 |
Tyco International, Ltd. | | 60,155 | | 2,385 |
| | | | 9,523 |
Materials & Processing — Miscellaneous (1.6%) | | | | |
Newmont Mining Corp. | | 91,950 | | 4,490 |
Medical & Dental Instruments & Supplies (1.3%) | | | | |
Boston Scientific Corp. | | (a)145,310 | | 1,690 |
Covidien Ltd. | | 48,145 | | 2,132 |
| | | | 3,822 |
Multi-Sector Companies (2.3%) | | | | |
General Electric Co. | | 175,870 | | 6,520 |
Oil: Integrated (5.6%) | | | | |
ConocoPhillips | | 58,840 | | 5,195 |
ExxonMobil Corp. | | 41,620 | | 3,899 |
Marathon Oil Corp. | | 15,000 | | 913 |
| The accompanying notes are an integral part of the financial statements. | 95 |
2007 Annual Report
December 31, 2007
Portfolio of Investments (cont’d)
Large Cap Relative Value Portfolio
| | | | Value |
| | Shares | | (000) |
Royal Dutch Shell plc ADR | | 74,070 | | $ 6,237 |
| | | | 16,244 |
Restaurants (0.5%) | | | | |
Starbucks Corp. | | (a)67,800 | | 1,388 |
Retail (4.9%) | | | | |
Home Depot, Inc. (The) | | 51,050 | | 1,375 |
McDonald’s Corp. | | 26,680 | | 1,572 |
Office Depot, Inc. | | (a)91,298 | | 1,270 |
Rite Aid Corp. | | (a)212,940 | | 594 |
Wal-Mart Stores, Inc. | | 195,170 | | 9,277 |
| | | | 14,088 |
Securities Brokerage & Services (2.2%) | | | | |
Bear Stearns Cos., Inc. (The) | | 33,301 | | 2,939 |
Charles Schwab Corp. (The) | | 128,032 | | 3,271 |
| | | | 6,210 |
Soaps & Household Chemicals (1.2%) | | | | |
Procter & Gamble Co. | | 48,020 | | 3,526 |
Tobacco (1.5%) | | | | |
Altria Group, Inc. | | 58,430 | | 4,416 |
Utilities: Cable TV & Radio (0.7%) | | | | |
Comcast Corp., Class A | | (a)102,723 | | 1,876 |
Utilities: Electrical (6.0%) | | | | |
American Electric Power Co., Inc. | | 131,290 | | 6,113 |
Entergy Corp. | | 60,092 | | 7,182 |
FirstEnergy Corp. | | 53,760 | | 3,889 |
| | | | 17,184 |
Utilities: Gas Pipelines (0.7%) | | | | |
Williams Cos., Inc. | | 56,600 | | 2,025 |
Utilities: Telecommunications (4.5%) | | | | |
France Telecom S.A. ADR | | 90,930 | | 3,240 |
Sprint Nextel Corp. | | 92,409 | | 1,213 |
Verizon Communications, Inc. | | 195,639 | | 8,548 |
| | | | 13,001 |
Total Common Stocks (Cost $248,521) | | | | 281,720 |
Investment Company (1.0%) | | | | |
iShares MSCI Japan Index Fund (Cost $2,976) | | 204,080 | | 2,712 |
Short-Term Investment (1.7%) | | | | |
Investment Company (1.7%) | | | | |
Morgan Stanley Institutional Liquidity Money Market Portfolio
— Institutional Class (Cost $4,943) | | (o)4,942,781 | | 4,943 |
Total Investments (100.8%) (Cost $256,440) | | | | 289,375 |
Liabilities in Excess of Other Assets (-0.8%) | | | | (2,304) |
Net Assets (100%) | | | | $ 287,071 |
(a) | | Non-income producing security. |
(o) | | See Note F within the Notes to Financial Statements regarding investment in Morgan Stanley Institutional Liquidity Money Market Portfolio — Institutional Class. |
ADR | | American Depositary Receipt |
96 | The accompanying notes are an integral part of the financial statements. | |
2007 Annual Report | |
| |
December 31, 2007 | |
Investment Overview (unaudited)
Small Company Growth Portfolio
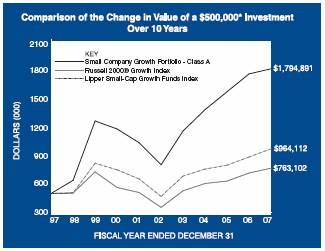
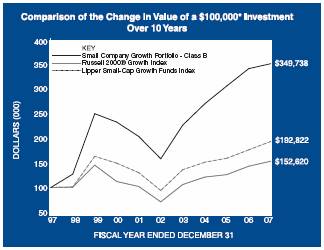
* Minimum Investment
In accordance with SEC regulations, Portfolio’s performance shown assumes that all recurring fees (including management fees) were deducted and all dividends and distributions were reinvested. The performance of Class B shares will vary from the Class A shares based upon its different inception date and will be negatively impacted by additional fees assessed to this class.
Performance Compared to the Russell 2000® Growth Index(1) and the Lipper Small-Cap Growth Funds Index(2)
| | Total Returns(3) | |
| | | | Average Annual | |
| | One
Year | | Five
Years | | Ten
Years | | Since
Inception | (6) |
| | | | | | | | | |
Portfolio – Class A (4) | | 3.04 | % | 17.59 | % | 13.63 | % | 12.85 | % |
Russell 2000® Growth Index | | 7.05 | | 16.50 | | 4.32 | | 7.65 | |
Lipper Small-Cap Growth Funds Index | | 9.68 | | 15.44 | | 6.79 | | 10.40 | |
| | | | | | | | | |
Portfolio – Class B (5) | | 2.81 | | 17.30 | | 13.34 | | 12.31 | |
Russell 2000® Growth Index | | 7.05 | | 16.50 | | 4.32 | | 5.57 | |
Lipper Small-Cap Growth Funds Index | | 9.68 | | 15.44 | | 6.79 | | 8.00 | |
Performance data quoted represents past performance, which is no guarantee of future results, and current performance may be lower or higher than the figures shown. Performance assumes that all dividends and distributions, if any, were reinvested. For the most recent month-end performance figures, please visit www.morganstanley.com/msim. Investment return and principal value will fluctuate so that Portfolio shares, when redeemed, may be worth more or less than their original cost. Total returns do not reflect the deduction of taxes that a shareholder would pay on Portfolio distributions or the redemption of Portfolio shares.
(1) The Russell 2000® Growth Index measures the performance of those Russell 2000® Index companies with higher price-to-book ratios and higher forecasted growth values. The Index is unmanaged and its returns do not include any sales charges or fees. Such costs would lower performance. It is not possible to invest directly in an index.
(2) The Lipper Small-Cap Growth Funds Index is an equally weighted performance index of the largest qualifying funds (based on net assets) in the Lipper Small-Cap Growth Funds classification. The Index, which is adjusted for capital gains distributions and income dividends, is unmanaged and should not be considered an investment. There are currently 30 funds represented
in this Index. As of the date of this report, the Portfolio is in the Lipper Small-Cap Growth Funds classification. |
(3) Total returns for the Portfolio reflect fees waived and expenses reimbursed, if applicable, by the Adviser. Without such waivers and expense reimbursements, total returns would have been lower. Fee waivers and/or expense reimbursements are voluntary and the Adviser reserves the right to commence or terminate any waiver and/or reimbursement at any time.
(4) Commenced operations on November 1, 1989
(5) Commenced operations on January 2, 1996
(6) For comparative purposes, average annual since inception returns listed for the Indexes refer to the inception date or initial offering of the respective share class of the Portfolio, not the inception of the Index.
The Small Company Growth Portfolio (the “Portfolio”) seeks long-term capital appreciation by investing primarily in growth-oriented equity securities of small capitalization companies. Investments in small sized corporations are more vulnerable to financial risks and other risks than larger corporations and may involve a higher degree of price volatility than investments in the general equity markets.
97
2007 Annual Report | |
| |
December 31, 2007 | |
Investment Overview (cont’d)
Small Company Growth Portfolio
Performance
For the year ended December 31, 2007, the Portfolio had a total return based on net asset value and reinvestment of distributions per share of 3.04%, net of fees, for Class A shares and 2.8 1%, net of fees, for Class B shares. The Portfolio’s Class A and Class B shares underperformed against its benchmark, the Russell 2000® Growth Index (the “Index”) which returned 7.05%.
Factors Affecting Performance
· The broad equity market made a modest gain for the 12-month period ended December 31, 2007, despite experiencing a decline in the second half of the year. During the summer, the subprime mortgage market suffered a complete collapse under the weight of rising loan defaults and home foreclosures. As a result, credit significantly tightened as liquidity decreased, and consumers became far more cautious in their expenditures, particularly as gasoline prices once again surged upward.
· In response to this rising volatility, the Federal Reserve began a series of cuts to the target federal funds rate and the discount rate. Although each announced rate reduction temporarily boosted investor sentiment, the broad market declined in the fourth quarter, reflecting investors’ concerns about the health of the financial markets in the coming year.
· In this environment, the market demonstrated a preference for growth equities over value equities; however, small capitalization stocks lagged the broad market as investors sought the relatively more stable earnings potential of larger-cap companies.
· For the 12-month period, the Portfolio’s underperformance was due to sector allocations, although security selection overall helped to mitigate overall performance. It should be noted that sector allocations are a result of bottom-up stock selection and are not intentional top-down decisions.
· In the consumer discretionary sector, stock selection together with a large overweight allocation had the largest negative effect on performance. Here, restaurants, consumer electronics, entertainment and leisure time holdings detracted from relative returns, and offset gains made by investments in the education services and retail segments.
· Security selection in the materials and processing sector also hindered relative returns. A single holding in a construction company hurt performance, as did the Portfolio’s avoidance of fertilizer companies and diversified materials and processing firms. Additionally, an underweight position in the health care sector adversely affected overall performance.
· However, there were several areas of strength for the Portfolio. The financial services sector offered the greatest contribution to performance due to stock selection, particularly in financial information services firms and real estate investment trusts (REITs).
· In the autos and transportation sector, investment in a transportation and logistics company, together with a sector underweight, further boosted relative returns. Moreover, the Portfolio’s positioning in the technology sector was advantageous to overall performance.
Management Strategies
· It is our goal to hold a portfolio of high-quality growth stocks we believe will perform well regardless of the market environment. We continue to favor companies that have some uniqueness or a dynamic competitive advantage in their business model, with a high quality stream of cash flow and the ability to redeploy capital at a high rate of return.
· At the close of the period, consumer discretionary represented the largest sector weight and overweight in the Portfolio, followed by the financial services and technology sectors. The financial services sector was overweight versus the Index, and the technology sector was underweight.
Expense Examples
As a shareholder of the Portfolio, you may incur two types of costs: (1) transactional costs, including redemption fees; (2) ongoing costs, including management fees, shareholder servicing fees (in the case of Class B); and other Portfolio expenses. These examples are intended to help you understand your ongoing costs (in dollars) of investing in the Portfolio and to compare these costs with the ongoing costs of investing in other mutual funds.
The examples are based on an investment of $1,000 invested at the beginning of the six-month period ended December 31, 2007 and held for the entire six-month period.
Actual Expenses
The first line of the tables below provides information about actual account values and actual expenses. You may use the information in this line, together with the amount you invested, to estimate the expenses that you paid over the period. Simply divide your account value by $1,000 (for example, an $8,600 account value divided by $1,000 = 8.6), then multiply the result by the number in the first line under the heading entitled “Expenses Paid During Period” to
98
2007 Annual Report | |
| |
December 31, 2007 | |
Investment Overview (cont’d)
Small Company Growth Portfolio
estimate the expenses you paid on your account during this period.
Please note that “Expenses Paid During Period” are grossed up to reflect Portfolio expenses prior to the effect of Expense Offset (See Note E in the Notes to Financial Statements). Therefore, the annualized net expense ratios may differ from the ratio of the expenses to average net assets shown in the Financial Highlights.
Hypothetical Example for Comparison Purposes
The second line of the tables below provides information about hypothetical account values and hypothetical expenses based on the Portfolio’s actual expense ratio and an assumed rate of return of 5% per year before expenses, which is not the Portfolio’s actual return. The hypothetical account values and expenses may not be used to estimate the actual ending account balance or expenses you paid for the period. You may use this information to compare the ongoing costs of investing in the Portfolio and other funds. To do so, compare this 5% hypothetical example with the 5% hypothetical examples that appear in the shareholder reports of the other funds.
Please note that the expenses shown in the table are meant to highlight your ongoing costs only and do not reflect any transactional costs, such as redemption fees. Therefore, the second line of the table is useful in comparing ongoing costs only, and will not help you determine the relative total costs of owning different funds. In addition, if these transactional costs were included, your costs would have been higher.
| | Beginning
Account Value | | Ending Account
Value
December 31, | | Expenses Paid
During Period*
July 1, 2007 —
December 31, |
| | July 1, 2007 | | 2007 | | 2007 |
Class A | | | | | | |
Actual | | $1,000.00 | | $ 972.70 | | $4.97 |
Hypothetical (5% average annual return before expenses) | | 1,000.00 | | 1,020.16 | | 5.09 |
| | | | | | |
Class B | | | | | | |
Actual | | 1,000.00 | | 971.90 | | 6.21 |
Hypothetical (5% average annual return before expenses) | | 1,000.00 | | 1,018.90 | | 6.36 |
* Expenses are equal to Class A and Class B annualized net expense ratios of 1.00% and 1.25%, respectively, multiplied by the average account value over the period, multiplied by 184/365 (to reflect the one-half year period).
Graphic Presentation of Portfolio Holdings
The following graph depicts the Portfolio’s holdings by industry and/or security type, as a percentage of total investments.
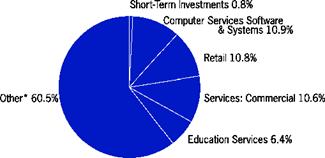
* Industries which do not appear in the above graph, as well as those which represent less than 5% of total investments, if applicable, are included in the category labeled “Other”.
99
2007 Annual Report | |
| |
December 31, 2007 | |
Portfolio of Investments
Small Company Growth Portfolio
| | | | Value |
| | Shares | | (000) |
Common Stocks (99.2%) | | | | |
Aluminum (1.7%) | | | | |
Kaiser Aluminum Corp. | | 384,956 | | $ 30,596 |
Biotechnology Research & Production (4.0%) | | | | |
Alnylam Pharmaceuticals, Inc. | | (a)963,471 | | 28,018 |
Illumina, Inc. | | (a)775,359 | | 45,948 |
| | | | 73,966 |
Building: Cement (4.7%) | | | | |
Eagle Materials, Inc. | | 1,456,692 | | 51,684 |
Texas Industries, Inc. | | 488,717 | | 34,259 |
| | | | 85,943 |
Casinos & Gambling (0.2%) | | | | |
Lakes Entertainment, Inc. | | (a)613,119 | | 4,249 |
Commercial Information Services (1.4%) | | | | |
Viad Corp. | | 816,789 | | 25,794 |
Communications & Media (0.7%) | | | | |
CKX, Inc. | | (a)1,117,557 | | 13,411 |
Communications Technology (1.9%) | | | | |
Gmarket, Inc. ADR | | (a)743,870 | | 18,522 |
GSI Commerce, Inc. | | (a)793,738 | | 15,478 |
| | | | 34,000 |
Computer Services Software & Systems (11.0%) | | | | |
Bankrate, Inc. | | (a)351,912 | | 16,923 |
Blackboard, Inc. | | (a)753,873 | | 30,343 |
comScore, Inc. | | (a)453,065 | | 14,784 |
Equinix, Inc. | | (a)359,228 | | 36,307 |
Forrester Research, Inc. | | (a)1,071,769 | | 30,031 |
IHS, Inc., Class A | | (a)441,442 | | 26,734 |
Longtop Financial Technologies Ltd. ADR | | (a)1,163,963 | | 27,563 |
NetSuite, Inc. | | (a)476,767 | | 18,680 |
| | | | 201,365 |
Consumer Electronics (1.0%) | | | | |
CNET Networks, Inc. | | (a)1,939,946 | | 17,731 |
Consumer Staples — Miscellaneous (1.1%) | | | | |
Peet’s Coffee & Tea, Inc. | | (a)678,664 | | 19,729 |
Diversified Financial Services (0.9%) | | | | |
Information Services Group, Inc. | | (a)2,539,066 | | 17,393 |
Education Services (6.4%) | | | | |
Ambassadors Group, Inc. | | 1,092,345 | | 20,001 |
American Public Education, Inc. | | (a)455,647 | | 19,037 |
Strayer Education, Inc. | | 465,392 | | 79,386 |
| | | | 118,424 |
Electronics: Semi-Conductors/Components (1.3%) | | | | |
Tessera Technologies, Inc. | | (a)566,661 | | 23,573 |
Electronics: Technology (2.5%) | | | | |
Cogent Communications Group, Inc. | | (a)1,932,042 | | 45,809 |
Engineering & Contracting Services (2.4%) | | | | |
Grupo Aeroportuario del Pacifico S.A. de C.V. ADR | | 982,302 | | 43,840 |
Entertainment (2.9%) | | | | |
Vail Resorts, Inc. | | (a)980,265 | | 52,748 |
Financial — Miscellaneous (2.9%) | | | | |
Interactive Data Corp. | | 1,617,731 | | 53,401 |
Homebuilding (2.1%) | | | | |
Gafisa S.A. ADR | | (a)1,052,022 | | $ 39,398 |
Hotel/Motel (2.4%) | | | | |
Gaylord Entertainment Co. | | (a)1,085,650 | | 43,936 |
Insurance: Multi-Line (0.7%) | | | | |
Greenlight Capital Re Ltd., Class A | | (a)611,487 | | 12,713 |
Investment Management Companies (3.2%) | | | | |
Greenhill & Co., Inc. | | 827,760 | | 55,030 |
Pzena Investment Management, Inc., Class A | | 305,000 | | 3,477 |
| | | | 58,507 |
Leisure Time (2.6%) | | | | |
Aruze Corp. | | 940,900 | | 35,756 |
Premier Exhibitions, Inc. | | (a)1,091,963 | | 11,946 |
| | | | 47,702 |
Machinery: Industrial/Specialty (1.5%) | | | | |
Middleby Corp. | | (a)368,084 | | 28,203 |
Medical & Dental Instruments & Supplies (3.6%) | | | | |
Techne Corp. | | (a)1,003,832 | | 66,303 |
Oil: Crude Producers (2.1%) | | | | |
Carrizo Oil & Gas, Inc. | | (a)398,938 | | 21,842 |
GMX Resources, Inc. | | (a)515,901 | | 16,653 |
| | | | 38,495 |
Printing & Copying Services (1.5%) | | | | |
VistaPrint Ltd. | | (a)649,907 | | 27,849 |
Publishing — Miscellaneous (4.4%) | | | | |
Morningstar, Inc. | | (a)1,030,732 | | 80,139 |
Real Estate Investment Trusts (REIT) (0.5%) | | | | |
Consolidated-Tomoka Land Co. | | 137,806 | | 8,638 |
Restaurants (2.5%) | | | | |
BJ’s Restaurants, Inc. | | (a)1,114,800 | | 18,127 |
P.F. Chang’s China Bistro, Inc. | | (a)1,223,955 | | 27,955 |
| | | | 46,082 |
Retail (10.8%) | | | | |
AFC Enterprises, Inc. | | (a)1,552,798 | | 17,578 |
American Apparel, Inc. | | (a)1,780,614 | | 26,709 |
Blue Nile, Inc. | | (a)1,149,201 | | 78,215 |
Citi Trends, Inc. | | (a)920,097 | | 14,206 |
Ctrip.com International Ltd. ADR | | 505,880 | | 29,073 |
Dena Co., Ltd. | | 2,988 | | 14,322 |
Lululemon Athletica, Inc. | | (a)412,005 | | 19,517 |
| | | | 199,620 |
Services: Commercial (10.6%) | | | | |
Advisory Board Co. (The) | | (a)985,839 | | 63,281 |
Ambassadors International, Inc. | | 635,342 | | 9,263 |
Arbitron, Inc. | | 371,953 | | 15,462 |
Corporate Executive Board Co. | | 448,883 | | 26,978 |
CoStar Group, Inc. | | (a)1,026,052 | | 48,481 |
Macquarie Infrastructure Co. LLC | | 791,516 | | 32,080 |
| | | | 195,545 |
Shoes (1.0%) | | | | |
Iconix Brand Group, Inc. | | (a)892,691 | | 17,550 |
100 | The accompanying notes are an integral part of the financial statements. | |
2007 Annual Report | |
| |
December 31, 2007 | |
Portfolio of Investments (cont’d)
Small Company Growth Portfolio
| | | | Value |
| | Shares | | (000) |
Technology — Miscellaneous (0.7%) | | | | |
Housevalues, Inc. | | (a)1,073,753 | | $ 3,328 |
Rediff.com India Ltd. ADR | | (a)860,468 | | 9,388 |
| | | | 12,716 |
Toys (1.4%) | | | | |
Marvel Entertainment, Inc. | | (a)938,501 | | 25,067 |
Transportation — Miscellaneous (0.6%) | | | | |
Integrated Distribution Services Group Ltd. | | 3,785,000 | | 11,491 |
Total Common Stocks (Cost $1,555,585) | | | | 1,821,926 |
Preferred Stock (0.4%) | | | | |
Biotechnology Research & Production (0.4%) | | | | |
Microbia, Inc., Series F (Convertible) | | | | |
(Cost $7,581) | | (d)(l)1,212,976 | | 7,581 |
Short-Term Investment (0.8%) | | | | |
Investment Company (0.8%) | | | | |
Morgan Stanley Institutional Liquidity Money Market Portfolio — Institutional Class (Cost $13,933) | | (o)13,933,171 | | 13,933 |
Total Investments (100.4%) (Cost $1,577,099) | | | | (v)1,843,440 |
Liabilities in Excess of Other Assets (-0.4%) | | | | (7,418) |
Net Assets (100%) | | | | $1,836,022 |
(a) | | Non-income producing security. |
(d) | | Security was valued at fair value — At December 31, 2007, the Portfolio held approximately $7,581,000 of fair valued securities, representing 0.4% of net assets. |
(l) | | Security has been deemed illiquid at December 31, 2007. |
(o) | | See Note F within the Notes to Financial Statements regarding investment in Morgan Stanley Institutional Liquidity Market Portfolio — Institutional Class. |
(v) | | The approximate market value and percentage of the investments, $61,569,000 and 3.3%, respectively, represent the securities that have been fair valued under the fair valuation policy for international investments as described in Note A within the Notes to Financial Statements. |
ADR | | American Depositary Receipt |
| The accompanying notes are an integral part of the financial statements. | 101 |
2007 Annual Report
December 31, 2007
Investment Overview (unaudited)
Systematic Active Large Cap Core Portfolio
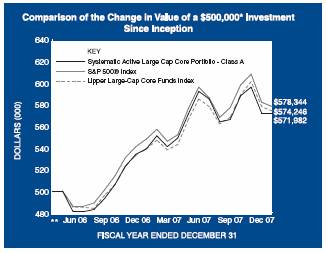
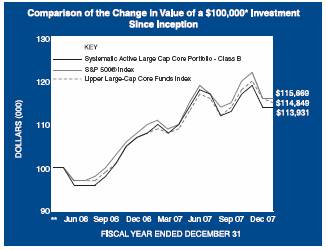
* | Minimum Investment |
* * | Commenced operations on April 28, 2006 |
In accordance with SEC regulations, Portfolio’s performance shown assumes that all recurring fees (including management fees) were deducted and all dividends and distributions were reinvested. The performance of Class B shares will vary from the Class A shares and will be negatively impacted by additional fees assessed to this class.
Performance Compared to the S&P 500® Index(1) and the Lipper Large-Cap Core Funds Index(2)
| | Total Returns(2) |
| | Average Annual |
| | One
Year | | Since
Inception(5) | |
| | | | | |
Portfolio – Class A (4) | | 6.07 | % | 8.35 | % |
S&P 500® Index | | 5.49 | | 9.07 | |
Lipper Large-Cap Core Funds Index | | 6.63 | | 8.61 | |
| | | | | |
Portfolio – Class B (4) | | 5.81 | | 8.09 | |
S&P 500® Index | | 5.49 | | 9.07 | |
Lipper Large-Cap Core Funds Index | | 6.63 | | 8.61 | |
Performance data quoted represents past performance, which is no guarantee of future results, and current performance may be lower or higher than the figures shown. Performance assumes that all dividends and distributions, if any, were reinvested. For the most recent month-end performance figures, please visit www.morganstanley.com/msim. Investment return and principal value will fluctuate so that Portfolio shares, when redeemed, may be worth more or less than their original cost. Total returns do not reflect the deduction of taxes that a shareholder would pay on Portfolio distributions or the redemption of Portfolio shares.
(1) The S&P 500® Index is a capitalization-weighted index of 500 stocks. The Index is designed to measure performance of the broad domestic economy through changes in the aggregate market value of 500 stocks representing all major industries. The Index is unmanaged and its returns do not include any sales charges or fees. Such costs would lower performance. It is not possible to invest directly in an index.
(2) The Lipper Large-Cap Core Funds Index is an equally weighted performance index of the largest qualifying funds (based on net
assets) in the Lipper Large-Cap Core Funds classification. The Index, which is adjusted for capital gains distributions and income dividends, is unmanaged and should not be considered an investment. There are currently 30 funds represented in this Index. As of the date of this report, the Portfolio is in the Lipper Large-Cap Core Funds classification. |
(3) Total returns for the Portfolio reflect fees waived and expenses reimbursed, if applicable, by the Adviser. Without such waivers and reimbursements, total returns would have been lower. Fee waivers and/or expense reimbursements are voluntary and the Adviser reserves the right to commence or terminate any waiver and/or reimbursement at any time.
(4) Commenced operations on April 28, 2006
(5) For comparative purposes, average since inception returns listed for the Indexes refer to the inception date or initial offering of the respective share class of the Portfolio, not the inception of the Index.
The Systematic Active Large Cap Core Portfolio (the “Portfolio”) seeks long-term capital appreciation by investing primarily in equity securities of large capitalization companies.
Performance
For the year ended December 31, 2007, the Portfolio had a total return based on net asset value and reinvestment of distributions per share of 6.07%, net of fees, for Class A shares and 5.81%, net of fees, for Class B shares. The Portfolio’s Class A and Class B shares outperformed against its benchmark, the S&P 500® Index (the “Index”) which returned 5.49%.
102
2007 Annual Report
December 31, 2007
Investment Overview (cont’d)
Systematic Active Large Cap Core Portfolio
Factors Affecting Performance
· The 12 months ended December 31, 2007 were characterized by pronounced volatility in stock prices, largely driven by credit market woes and deteriorating economic outlooks. By the third quarter, evidence mounted that the subprime market’s troubles spilled into the credit market and the broader economy. A tightening in credit standards, mortgage lender bankruptcies and hedge fund implosions were followed by multi-billion dollar losses reported at several large financial institutions in the fourth quarter. At the same time, a cross current of unfavorable data buffeted the market, indicating a languishing housing market, declining consumer spending, rising oil prices and negative year-over-year corporate profit growth. Although the market rallied each time the Federal Reserve’s (the “Fed”) reduced the target federal funds rate, skepticism quickly returned as investors worried that the Fed’s ability to steer the economy away from recession would be limited by rising inflation pressures. Fourth quarter corporate earnings expectations were dismal, with only the largest multi-national companies expected to generate growth. In this environment, large-cap equities outperformed small-caps, and growth beat value for the year overall.
· Based on total returns, the Portfolio’s best performing sectors were materials, energy and telecommunication services. The consumer discretionary and financials sectors were the only sectors in the Portfolio with negative returns for the period.
· In terms of contribution to the Portfolio’s overall absolute return, the materials and consumer discretionary sectors were the most additive to performance. In materials, the Portfolio’s exposure to metals and mining stocks benefited from a favorable backdrop of a weak U.S. dollar, rising commodity prices for metals and industry consolidation. Positive performance in the consumer discretionary sector stemmed largely from the Portfolio’s holdings in a fast food chain with good earnings throughout the year and a travel services provider that advanced on strong sales. Additionally within the sector, we avoided investment in two home improvement retailers that declined significantly amid the weakening housing market.
· Detractors from overall absolute return were primarily in the technology and financials sectors. The Portfolio maintained a below-Index weight in a number of strong-performing technology stocks. In the financials sector, weak performance came from a wide range of holdings, due to their exposure to capital markets, mortgage lending or mortgage loan insurance, and/or investments in subprime mortgage backed securities.
· Relative outperformance was driven by the energy sector, which more than offset the relative underperformance of the financials sector.
Management Strategies
· We believe that we can enhance returns by employing a quantitative model that uses multiple, independent factors to examine the fundamentals of a company. We further believe that our quantitative efforts in combination with our fundamental analysis can exploit market inefficiencies.
· We employ a quantitative approach to stock selection utilizing a proprietary quantitative model. The model is driven by rigorous fundamental and quantitative research that screens a universe of large-capitalization companies. The model employs three quantitative screens based on the following primary inputs: earnings expectations, price trends and relative valuations. Individual securities and industries are ranked within each sector by the most effective combination of these disciplines based on the current phase of the economic cycle. We then decide whether to buy, sell or hold a security based on its fundamental analysis and the results of this model-driven approach.
· Accordingly, the stock selection process yielded overweight positions in the consumer discretionary and health care sectors; underweight positions in the consumer staples, energy, financials, industrials, telecommunication services and utilities sectors; and market-weight positions in the technology and materials sectors.
Expense Examples
As a shareholder of the Portfolio, you may incur two types of costs: (1) transactional costs, including redemption fees; (2) ongoing costs, including management fees, shareholder servicing fees (in the case of Class B); and other Portfolio expenses. These examples are intended to help you understand your ongoing costs (in dollars) of investing in the Portfolio and to compare these costs with the ongoing costs of investing in other mutual funds.
The examples are based on an investment of $1,000 invested at the beginning of the six-month period ended December 31, 2007 and held for the entire six-month period.
Actual Expenses
The first line of the tables below provides information about actual account values and actual expenses. You may use the information in this line, together with the amount you
103
2007 Annual Report
December 31, 2007
Investment Overview (cont’d)
Systematic Active Large Cap Core Portfolio
invested, to estimate the expenses that you paid over the period. Simply divide your account value by $1,000 (for example, an $8,600 account value divided by $1,000 = 8.6), then multiply the result by the number in the first line under the heading entitled “Expenses Paid During Period” to estimate the expenses you paid on your account during this period.
Please note that “Expenses Paid During Period” are grossed up to reflect Portfolio expenses prior to the effect of Expense Offset (See Note E in the Notes to Financial Statements). Therefore, the annualized net expense ratios may differ from the ratio of the expenses to average net assets shown in the Financial Highlights.
Hypothetical Example for Comparison Purposes
The second line of the tables below provides information about hypothetical account values and hypothetical expenses based on the Portfolio’s actual expense ratio and an assumed rate of return of 5% per year before expenses, which is not the Portfolio’s actual return. The hypothetical account values and expenses may not be used to estimate the actual ending account balance or expenses you paid for the period. You may use this information to compare the ongoing costs of investing in the Portfolio and other funds. To do so, compare this 5% hypothetical example with the 5% hypothetical examples that appear in the shareholder reports of the other funds.
Please note that the expenses shown in the table are meant to highlight your ongoing costs only and do not reflect any transactional costs, such as redemption fees. Therefore, the second line of the table is useful in comparing ongoing costs only, and will not help you determine the relative total costs of owning different funds. In addition, if these transactional costs were included, your costs would have been higher.
| | | | | | Expenses Paid | |
| | | | Ending Account | | | During Period* | |
| | Beginning | | | Value | | | July 1, 2007 — | |
| | Account Value | | | December 31, | | | December 31, | |
| | July 1, 2007 | | | 2007 | | | 2007 | |
Class A | | | | | | |
Actual | | $1,000.00 | | $978.40 | | $3.09 |
Hypothetical (5% average annual return before expenses) | | 1,000.00 | | 1,022.08 | | 3.16 |
| | | | | | |
Class B | | | | | | |
Actual | | 1,000.00 | | 977.70 | | 4.34 |
Hypothetical (5% average annual return before expenses) | | 1,000.00 | | 1,020.82 | | 4.43 |
* Expenses are equal to Class A and Class B annualized net expense ratios of 0.62% and 0.87%, respectively, multiplied by the average account value over the period, multiplied by 184/365 (to reflect the one-half year period). |
Graphic Presentation of Portfolio Holdings
The following graph depicts the Portfolio’s holdings by industry and/or security type, as a percentage of total investments.
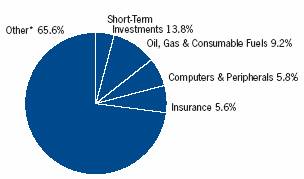
* Industries which do not appear in the above graph, as well as those which represent less than 5% of total investments, if applicable, are included in the category labeled “Other”.
104
2007 Annual Report
December 31, 2007
Portfolio of Investments
Systematic Active Large Cap Core Portfolio
| | | | Value |
| | Shares | | (000) |
Common Stocks (96.6%) | | | | |
Aerospace & Defense (5.0%) | | | | |
BE Aerospace, Inc. | | (a)(c)767 | | $ 41 |
Boeing Co. (The) | | 368 | | 32 |
DRS Technologies, Inc. | | (c)448 | | 24 |
General Dynamics Corp. | | 566 | | 50 |
Honeywell International, Inc. | | 543 | | 34 |
L-3 Communications Holdings, Inc. | | 295 | | 31 |
Lockheed Martin Corp. | | 406 | | 43 |
Northrop Grumman Corp. | | 653 | | 51 |
Raytheon Co. | | 373 | | 23 |
| | | | 329 |
Airlines (0.4%) | | | | |
AMR Corp. | | (a)837 | | 12 |
US Airways Group, Inc. | | (a)(c)823 | | 12 |
| | | | 24 |
Auto Components (0.7%) | | | | |
Autoliv, Inc. | | 413 | | 22 |
BorgWarner, Inc. | | 496 | | 24 |
| | | | 46 |
Beverages (1.3%) | | | | |
Molson Coors Brewing Co., Class B | | 585 | | 30 |
Pepsi Bottling Group, Inc. | | 763 | | 30 |
PepsiAmericas, Inc. | | 737 | | 25 |
| | | | 85 |
Biotechnology (2.0%) | | | | |
Genzyme Corp. | | (a)605 | | 45 |
Gilead Sciences, Inc. | | (a)1,337 | | 62 |
Invitrogen Corp. | | (a)248 | | 23 |
| | | | 130 |
Capital Markets (3.7%) | | | | |
Bear Stearns Cos, Inc. (The) | | 141 | | 12 |
E*Trade Financial Corp. | | (a)(c)1,887 | | 7 |
Goldman Sachs Group, Inc. | | 503 | | 108 |
Lehman Brothers Holdings, Inc. | | 1,056 | | 69 |
Merrill Lynch & Co., Inc. | | 869 | | 47 |
| | | | 243 |
Chemicals (2.0%) | | | | |
FMC Corp. | | (c)528 | | 29 |
Monsanto Co. | | 488 | | 55 |
Thermo Fisher Scientific, Inc. | | (a)802 | | 46 |
Tronox, Inc., Class B | | (c)20 | | @— |
| | | | 130 |
Commercial Banks (0.3%) | | | | |
Wells Fargo & Co. | | 636 | | 19 |
Commercial Services & Supplies (0.2%) | | | | |
Monster Worldwide, Inc. | | (a)390 | | 13 |
Communications Equipment (2.1%) | | | | |
Ciena Corp. | | (a)(c)697 | | 24 |
Cisco Systems, Inc. | | (a)1,644 | | 44 |
F5 Networks, Inc. | | (a)(c)464 | | 13 |
Garmin Ltd. | | 129 | | 13 |
NII Holdings, Inc. | | (a)272 | | 13 |
QLogic Corp. | | (a)888 | | $ 13 |
Qualcomm, Inc. | | 459 | | 18 |
| | | | 138 |
Computers & Peripherals (6.5%) | | | | |
Apple, Inc. | | (a)550 | | 109 |
Cognizant Tech Solutions Corp., Class A | | (a)367 | | 12 |
Dell, Inc. | | (a)1,288 | | 32 |
Diebold, Inc. | | 428 | | 12 |
Hewlett-Packard Co. | | 2,789 | | 141 |
International Business Machines Corp. | | 1,053 | | 114 |
Network Appliance, Inc. | | (a)508 | | 13 |
| | | | 433 |
Construction & Engineering (0.6%) | | | | |
Jacobs Engineering Group, Inc. | | (a)385 | | 37 |
Consumer Finance (0.8%) | | | | |
American Express Co. | | 431 | | 22 |
AmeriCredit Corp. | | (a)(c)1,179 | | 15 |
First Marblehead Corp (The) | | (c)1,140 | | 18 |
| | | | 55 |
Diversified Financial Services (3.0%) | | | | |
Bank of America Corp. | | 1,096 | | 45 |
CIT Group, Inc. | | 965 | | 23 |
Citigroup, Inc. | | 2,356 | | 69 |
JPMorgan Chase & Co. | | 816 | | 36 |
Nasdaq Stock Market, Inc. (The) | | (a)574 | | 29 |
| | | | 202 |
Diversified Telecommunication Services (2.7%) | | | | |
American Tower Corp., Class A | | (a)308 | | 13 |
AT&T, Inc. | | 2,892 | | 120 |
Verizon Communications, Inc. | | 1,115 | | 49 |
| | | | 182 |
Electric Utilities (0.8%) | | | | |
Exelon Corp. | | 641 | | 52 |
Electrical Equipment (0.3%) | | | | |
General Cable Corp. | | (a)(c)297 | | 22 |
Electronic Equipment & Instruments (0.8%) | | | | |
Amphenol Corp., Class A | | 595 | | 27 |
Gamestop Corp., Class A | | (a)207 | | 13 |
Jabil Circuit, Inc. | | 698 | | 11 |
| | | | 51 |
Energy (0.2%) | | | | |
Sunpower Corp., Class A | | (a)(c)97 | | 13 |
Energy Equipment & Services (2.8%) | | | | |
Energen Corp. | | 397 | | 26 |
Halliburton Co. | | 432 | | 16 |
National-Oilwell Varco, Inc. | | (a)568 | | 42 |
Pride International, Inc. | | (a)408 | | 14 |
Superior Energy Services, Inc. | | (a)1,187 | | 41 |
Transocean, Inc. | | 330 | | 47 |
| | | | 186 |
Food & Staples Retailing (2.0%) | | | | |
Costco Wholesale Corp. | | 605 | | 42 |
| The accompanying notes are an integral part of the financial statements. | 105 |
2007 Annual Report
December 31, 2007
Portfolio of Investments (cont’d)
Systematic Active Large Cap Core Portfolio
| | | | Value |
| | Shares | | (000) |
Food & Staples Retailing (cont’d) | | | | |
CVS/Caremark Corp. | | 2,372 | | $ 94 |
| | | | 136 |
Food Products (0.4%) | | | | |
Archer-Daniels-Midland Co. | | 592 | | 27 |
Gas Utilities (0.5%) | | | | |
Questar Corp. | | 569 | | 31 |
Health Care Equipment & Supplies (0.2%) | | | | |
HLTH Corp. | | (a)971 | | 13 |
Health Care Providers & Services (4.7%) | | | | |
Aetna, Inc. | | 783 | | 45 |
Davita, Inc. | | (a)430 | | 24 |
Express Scripts, Inc. | | (a)498 | | 37 |
Humana, Inc. | | (a)464 | | 35 |
McKesson Corp. | | 629 | | 41 |
Medco Health Solutions, Inc. | | (a)346 | | 35 |
Quest Diagnostics, Inc. | | (c)926 | | 49 |
WebMD Health Corp., Class A | | (a)(c)325 | | 13 |
Wellpoint Health Networks, Inc. | | (a)397 | | 35 |
| | | | 314 |
Hotels, Restaurants & Leisure (2.7%) | | | | |
Burger King Holdings, Inc. | | (c)975 | | 28 |
Harrah’s Entertainment, Inc. | | 257 | | 23 |
Las Vegas Sands Corp. | | (a)116 | | 12 |
McDonald’s Corp. | | 1,568 | | 92 |
Starbucks Corp. | | (a)626 | | 13 |
Wynn Resorts Ltd. | | 110 | | 12 |
| | | | 180 |
Household Durables (0.9%) | | | | |
Lennar Corp., Class A | | (c)751 | | 13 |
Pulte Homes, Inc. | | 1,255 | | 13 |
Tempur-Pedic International, Inc. | | (c)1,199 | | 32 |
| | | | 58 |
Household Products (1.0%) | | | | |
Energizer Holdings, Inc. | | (a)(c)238 | | 27 |
Kimberly-Clark Corp. | | 554 | | 38 |
| | | | 65 |
Independent Power Producers & Energy Traders (0.3%) | | | | |
AES Corp. (The) | | (a)1,019 | | 22 |
Industrial Conglomerates (1.3%) | | | | |
General Electric Co. | | 2,029 | | 75 |
UTi Worldwide, Inc. | | 654 | | 13 |
| | | | 88 |
IInformation Technology Services (0.4%) | | | | |
Global Payments, Inc. | | (c)541 | | 25 |
Insurance (6.2%) | | | | |
AMBAC Financial Group, Inc. | | (c)946 | | 24 |
American Financial Group, Inc. | | 795 | | 23 |
American International Group, Inc. | | 783 | | 46 |
Chubb Corp. | | 710 | | 39 |
CNA Financial Corp. | | 1,145 | | 39 |
Hartford Financial Services Group, Inc. | | 625 | | 54 |
Loews Corp. | | 903 | | 45 |
MBIA, Inc. | | (c)628 | | $ 12 |
Metlife, Inc. | | 718 | | 44 |
Philadelphia Consolidated Holding Corp. | | (a)(c)585 | | 23 |
Prudential Financial, Inc. | | 335 | | 31 |
Travelers Cos., Inc. (The) | | 609 | | 33 |
| | | | 413 |
Internet & Catalog Retail (0.9%) | | | | |
Amazon.Com, Inc. | | (a)141 | | 13 |
Coldwater Creek, Inc. | | (a)(c)1,909 | | 13 |
Expedia, Inc. | | (a)976 | | 31 |
| | | | 57 |
Internet Software & Services (2.7%) | | | | |
Akamai Technologies, Inc. | | (a)358 | | 12 |
eBay, Inc. | | (a)1,151 | | 38 |
Google, Inc., Class A | | (a)91 | | 63 |
McAfee, Inc. | | (a)1,422 | | 53 |
NutriSystem, Inc. | | (a)(c)468 | | 13 |
| | | | 179 |
Machinery (2.5%) | | | | |
AGCO Corp. | | (a)489 | | 33 |
Deere & Co. | | 872 | | 81 |
Joy Global, Inc. | | 619 | | 41 |
The Manitowoc Company, Inc. | | 269 | | 13 |
| | | | 168 |
Media (1.0%) | | | | |
DIRECTV Group, Inc. (The) | | (a)1,254 | | 29 |
Walt Disney Co. (The) | | 730 | | 24 |
Warner Music Group Corp. | | (c)2,072 | | 12 |
| | | | 65 |
Metals & Mining (2.1%) | | | | |
Alcoa, Inc. | | 319 | | 12 |
Freeport-McMoran Copper & Gold, Inc. | | 209 | | 21 |
Rio Tinto plc ADR | | 83 | | 35 |
Southern Copper Corp. | | (c)326 | | 34 |
United States Steel Corp. | | 302 | | 37 |
| | | | 139 |
Multiline Retail (0.2%) | | | | |
J.C. Penney Co., Inc. | | 293 | | 13 |
Oil, Gas & Consumable Fuels (10.3%) | | | | |
Anadarko Petroleum Corp. | | 342 | | 22 |
Chevron Corp. | | 908 | | 85 |
ConocoPhillips | | 1,428 | | 126 |
ENSCO International, Inc. | | 223 | | 13 |
Exxon Mobil Corp. | | 2,142 | | 201 |
Frontier Oil Corp. | | 308 | | 12 |
Helix Energy Solutions Group, Inc. | | (a)314 | | 13 |
Hess Corp. | | 355 | | 36 |
Marathon Oil Corp. | | 972 | | 59 |
Overseas Shipholding Group, Inc. | | 576 | | 43 |
Spectra Energy Corp. | | 473 | | 12 |
Valero Energy Corp. | | 907 | | 64 |
| | | | 686 |
106 | The accompanying notes are an integral part of the financial statements. | |
2007 Annual Report
December 31, 2007
Portfolio of Investments (cont’d)
Systematic Active Large Cap Core Portfolio
| | | | Value |
| | Shares | | (000) |
Personal Products (0.2%) | | | | |
Bare Escentuals, Inc. | | (a)(c)510 | | $ 12 |
Pharmaceuticals (3.0%) | | | | |
APP Pharmaceuticals, Inc. | | (a)(c)1,234 | | 13 |
Johnson & Johnson | | 544 | | 36 |
Merck & Co., Inc. | | 1,795 | | 104 |
Sepracor, Inc. | | (a)501 | | 13 |
Teva Pharmaceutical Industries Ltd. ADR | | (c)773 | | 36 |
| | | | 202 |
Road & Rail (1.8%) | | | | |
Avis Budget Group, Inc. | | (a)978 | | 13 |
Burlington North Santa Fe Corp. | | 385 | | 32 |
CSX Corp. | | 680 | | 30 |
Union Pacific Corp. | | 360 | | 45 |
| | | | 120 |
Semiconductors & Semiconductor Equipment (3.3%) | | | | |
Cypress Semiconductor Corp. | | (a)1,082 | | 39 |
Integrated Device Technology, Inc. | | (a)1,116 | | 12 |
Intel Corp. | | 2,799 | | 74 |
LSI Corp. | | (a)2,383 | | 13 |
MEMC Electronic Materials, Inc. | | (a)595 | | 53 |
Micron Technology, Inc. | | (a)1,621 | | 12 |
Texas Instruments, Inc. | | 478 | | 16 |
| | | | 219 |
Software (3.5%) | | | | |
Electronic Arts, Inc. | | (a)217 | | 13 |
Microsoft Corp. | | 2,718 | | 97 |
Oracle Corp. | | (a)2,529 | | 57 |
Salesforce.com, Inc. | | (a)666 | | 41 |
Symantec Corp. | | (a)781 | | 13 |
VMware, Inc., Class A | | (a)(c)141 | | 12 |
| | | | 233 |
Specialty Retail (0.6%) | | | | |
American Eagle Outfitters, Inc. | | 1 | | @— |
Chico’s FAS, Inc. | | (a)(c)1,308 | | 12 |
Office Depot, Inc. | | (a)953 | | 13 |
OfficeMax, Inc. | | 603 | | 13 |
| | | | 38 |
Textiles, Apparel & Luxury Goods (1.9%) | | | | |
Coach, Inc. | | (a)401 | | 12 |
CROCS, Inc. | | (a)(c)307 | | 11 |
Guess?, Inc. | | 321 | | 12 |
Jones Apparel Group, Inc. | | 779 | | 13 |
Liz Claiborne, Inc. | | 594 | | 12 |
Nike, Inc., Class B | | 608 | | 39 |
Polo Ralph Lauren Corp. | | 232 | | 15 |
Urban Outfitters, Inc. | | (a)(c)480 | | 13 |
| | | | 127 |
Thrifts & Mortgage Finance (2.2%) | | | | |
Countrywide Financial Corp. | | (c)2,614 | | 23 |
Fannie Mae | | 360 | | 15 |
Freddie Mac | | 406 | | 14 |
MGIC Investment Corp. | | (c)1,422 | | 32 |
PMI Group, Inc. (The) | | (c)969 | | 13 |
Radian Group, Inc. | | (c)2,943 | | $ 34 |
Sovereign Bancorp, Inc. | | 1,084 | | 12 |
Washington Mutual, Inc. | | (c)456 | | 6 |
| | | | 149 |
Tobacco (3.6%) | | | | |
Altria Group, Inc. | | 1,965 | | 148 |
Loews Corp. - Carolina Group | | 1,075 | | 92 |
| | | | 240 |
Total Common Stocks (Cost $5,691) | | | | 6,409 |
| | Face | | |
| | Amount | | |
| | (000) | | |
Short-Term Investments (15.4%) | | | | |
Short-Term Debt Securities held as Collateral on Loaned Securities (11.2%) | | | | |
Alliance & Leicester plc, | | | | |
5.26%, 9/2/08 | | $ (h)22 | | 22 |
Bancaja, | | | | |
5.35%, 8/12/08 | | 11 | | 11 |
Bank of New York Co., Inc., | | | | |
5.24%, 8/8/08 | | (h)11 | | 11 |
BASF AG, | | | | |
5.18%, 8/19/08 | | (h)11 | | 11 |
BNP Paribas plc, | | | | |
4.90%, 5/19/08 | | (h)22 | | 22 |
CAM US Finance S.A. Unipersonal, | | | | |
5.24%, 7/25/08 | | (h)45 | | 45 |
Canadian Imperial Bank of Commerce, New York, | | | | |
4.42%, 7/28/08 | | (h)22 | | 22 |
CC USA, Inc., | | | | |
3.89%, 1/28/08 | | (h)11 | | 11 |
CIT Group Holdings, | | | | |
5.23%, 6/18/08 | | (h)40 | | 40 |
Citigroup Global Markets Holdings, Inc., | | | | |
4.51%, 1/2/08 | | 152 | | 152 |
Credit Suisse First Boston, New York, | | | | |
4.32%, 3/14/08 | | (h)22 | | 22 |
First Tennessee Bank, | | �� | | |
5.05%, 8/15/08 | | (h)11 | | 11 |
5.06%, 8/15/08 | | (h)45 | | 45 |
Goldman Sachs Group, Inc., | | | | |
4.62%, 2/13/09 | | (h)21 | | 21 |
5.10%, 9/12/08 | | (h)11 | | 11 |
HSBC Finance Corp., | | | | |
5.26%, 8/5/08 | | (h)11 | | 11 |
IBM Corp., | | | | |
5.27%, 9/8/08 | | (h)45 | | 45 |
Lehman Brothers, Inc., | | | | |
4.49%, 1/2/08 | | 19 | | 19 |
Macquarie Bank Ltd., | | | | |
4.95%, 8/20/08 | | (h)22 | | 22 |
Metropolitan Life Global Funding, | | | | |
4.89%, 8/21/08 | | (h)33 | | 33 |
National Bank of Canada, | | | | |
5.21%, 4/2/08 | | (h)45 | | 45 |
| The accompanying notes are an integral part of the financial statements. | 107 |
2007 Annual Report
December 31, 2007
Portfolio of Investments (cont’d)
Systematic Active Large Cap Core Portfolio
| | Face | | |
| | Amount | | Value |
| | (000) | | (000) |
Short-Term Debt Securities held as Collateral on Loaned Securities (cont’d) | | | | |
National Rural Utilities Cooperative Finance Corp., | | | | |
5.24%, 9/2/08 | | $ (h)45 | | $ | 45 |
Nationwide Building Society, | | | | |
4.92%, 7/28/08 | | (h)26 | | 26 |
Unicredito Italiano Bank (Ireland) plc, | | | | |
5.04%, 8/14/08 | | (h)24 | | 24 |
5.26%, 8/8/08 | | (h)16 | | 16 |
| | | | 743 |
| | Shares | | |
Investment Company (4.2%) | | | | |
Morgan Stanley Institutional Liquidity Money Market Portfolio
— Institutional Class | | (o)279,630 | | 280 |
Total Short Term Investments (Cost $1,023) | | | | 1,023 |
Total Investments (112.0%) (Cost $6,714) including $724 of Securities Loaned | | | | 7,432 |
Liabilities in Excess of Other Assets (-12.0%) | | | | (796) |
Net Assets (100%) | | | | $ | 6,636 |
(a) | Non-income producing security. |
(c) | All or portion of security on loan at December 31, 2007. |
(h) | Variable/Floating rate security — Interest rate changes on these instruments are based on changes in a designated rate. The rates shown are those in effect on December 31, 2007. |
(o) | See Note F within the Notes to Financial Statements regarding investment in Morgan Stanley Institutional Liquidity Money Market Portfolio — Institutional Class. |
@ | Value is less than $500. |
ADR | American Depositary Receipt |
Futures Contracts:
The Portfolio had the following futures contract(s) open at period end:
| | Number
of
Contracts | | Value
(000) | | Expiration
Date | | Net
Unrealized
Appreciation
(Depreciation)
(000) |
Long: | | | | | | | | |
E-Mini S&P 500 (United States) | | 4 | | $295 | | Mar-08 | | | $@— | |
| | | | | | | | |
108 | The accompanying notes are an integral part of the financial statements. | |
2007 Annual Report
December 31, 2007
Investment Overview (unaudited)
Systematic Active Small Cap Core Portfolio
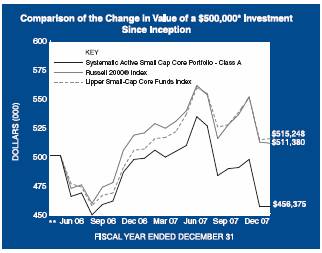
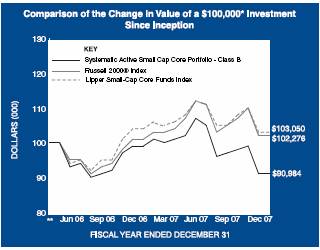
* | Minimum Investment |
* * | Commenced operations on April 28, 2006 |
In accordance with SEC regulations, Portfolio’s performance shown assumes that all recurring fees (including management fees) were deducted and all dividends and distributions were reinvested. The performance of Class B shares will vary from the Class A shares and will be negatively impacted by additional fees assessed to this class.
Performance Compared to the Russell 2000® Index(1) and the Lipper Small-Cap Core Funds Index(2)
| | Total Returns(3) | |
| | | Average Annual |
| | | One | | Since |
| | Year | | Inception(5) |
| | | | | |
Portfolio – Class A (4) | | (8.35) | % | (5.30 | )% |
Russell 2000® Index | | (1.57 | ) | 1.35 | |
Lipper Small-Cap Core Funds Index | | 1.92 | | 1.81 | |
| | | | | |
Portfolio – Class B (4) | | (8.49 | ) | (5.48 | ) |
Russell 2000® Index | | (1.57 | ) | 1.35 | |
Lipper Small-Cap Core Funds Index | | 1.92 | | 1.81 | |
| | | | | | | |
Performance data quoted represents past performance, which is no guarantee of future results, and current performance may be lower or higher than the figures shown. Performance assumes that all dividends and distributions, if any, were reinvested. For the most recent month-end performance figures, please visit www.morganstanley.com/msim. Investment return and principal value will fluctuate so that Portfolio shares, when redeemed, may be worth more or less than their original cost. Total returns do not reflect the deduction of taxes that a shareholder would pay on Portfolio distributions or the redemption of Portfolio shares.
(1) | The Russell 2000® Index is constructed to provide a comprehensive and unbiased small-cap barometer and is completely reconstituted annually to ensure larger stocks do not distort the performance and characteristics of the true small-cap opportunity set. The Russell 2000® includes the smallest 2000 securities in the Russell 3000®. The Index is unmanaged and its returns do not include any sales charges or fees. Such costs would lower performance. It is not possible to invest directly in an index. |
(2) | The Lipper Small-Cap Core Funds Index is an equally weighted performance index of the largest qualifying funds (based on net assets) in the Lipper Small-Cap Core Funds classification. The Index, which is adjusted for capital gains distributions and income dividends, is unmanaged and should not be considered an investment. There are currently 30 funds represented in this Index. As of the date of this report, the Portfolio is in the Lipper Small-Cap Core Funds classification. |
(3) | Total returns for the Portfolio reflect fees waived and expenses reimbursed, if applicable, by the Adviser. Without such waivers and reimbursements, total returns would have been lower. Fee waivers and/or expense reimbursements are voluntary and the Adviser reserves the right to commence or terminate any waiver and/or reimbursement at any time. |
(4) | Commenced operations on April 28, 2006 |
(5) | For comparative purposes, average since inception returns listed for the Indexes refer to the inception date or initial offering of the respective share class of the Portfolio, not the inception of the Index. |
The Systematic Active Small Cap Core Portfolio (the “Portfolio”) seeks long-term capital appreciation by investing primarily in equity securities of small capitalization companies. Investments in small sized corporations are more vulnerable to financial risks and other risks than larger corporations and may involve a higher degree of price volatility than investments in the general equity markets.
109
2007 Annual Report | |
| |
December 31, 2007 | |
Investment Overview (cont’d)
Systematic Active Small Cap Core Portfolio
Performance
For the year ended December 31, 2007, the Portfolio had a total return based on net asset value and reinvestment of distributions per share of -8.35%, net of fees, for Class A shares and -8.49%, net of fees, for Class B shares. The Portfolio’s Class A and Class B shares underperformed against its benchmark, the Russell 2000®Index (the “Index”) which returned - -1.57%.
Factors Affecting Performance
· The 12 months ended December 31, 2007 were characterized by pronounced volatility in stock prices, largely driven by credit market woes and deteriorating economic outlooks. By the third quarter, evidence mounted that the subprime market’s troubles spilled into the credit market and the broader economy. A tightening in credit standards, mortgage lender bankruptcies and hedge fund implosions were followed by multi-billion dollar losses reported at several large financial institutions in the fourth quarter. At the same time, a cross current of unfavorable data buffeted the market, indicating a languishing housing market, declining consumer spending, rising oil prices and negative year-over-year corporate profit growth. Although the market rallied each time the Federal Reserve’s (the “Fed”) reduced the target federal funds rate, skepticism quickly returned as investors worried that the Fed’s ability to steer the economy away from recession would be limited by rising inflation pressures. Fourth quarter corporate earnings expectations were dismal, with only the largest multi-national companies expected to generate growth. In this environment, large-cap equities outperformed small-caps, and growth beat value for the year overall.
· Based on total returns, the Portfolio’s best performing sectors were telecommunication services, health care and energy. Financials and consumer discretionary were the weakest sector performers for the Portfolio during the period.
· The largest detractors from the Portfolio’s overall absolute return were the industrials and consumer discretionary sectors. Within the industrials sector, exposure to an airline stock hurt performance, owing to the company’s weak earnings, and several temporary employment services providers hampered performance as the outlook for labor trends languished. Consumer discretionary holdings that had a negative influence on return included several specialty retailers, a resort and planned communities developer/operator, and an auto components manufacturer.
· In contrast, the health care sector contributed positively to the Portfolio’s overall absolute return. Holdings in a generic drug manufacturer and a diagnostic devices maker performed well, due to the companies’ strong earnings during the period.
· The Portfolio’s relative underperformance was driven primarily by the consumer discretionary and financials sectors.
Management Strategies
· We believe that we can enhance returns by employing a quantitative model that uses multiple, independent factors to examine the fundamentals of a company. We further believe that our quantitative efforts in combination with our fundamental analysis can exploit market inefficiencies.
· We employ a quantitative approach to stock selection utilizing a proprietary quantitative model. The model is driven by rigorous fundamental and quantitative research that screens a universe of small capitalization companies. The model employs three quantitative screens based on the following primary inputs – earnings expectations, price trends and relative valuations. Individual securities and industries are ranked within each sector by the most effective combination of these disciplines based on the current phase of the economic cycle. We then decide whether to buy, sell or hold a security based on its fundamental analysis and the results of this model-driven approach.
· Accordingly, the stock selection process yielded an overweight position in the utilities sector; underweight positions in the consumer discretionary, technology, financials and industrials sectors; and market-weight positions in the energy, health care, materials, telecommunication services and consumer staples sectors.
Expense Examples
As a shareholder of the Portfolio, you may incur two types of costs: (1) transactional costs, including redemption fees; (2) ongoing costs, including management fees, shareholder servicing fees (in the case of Class B); and other Portfolio expenses. These examples are intended to help you understand your ongoing costs (in dollars) of investing in the Portfolio and to compare these costs with the ongoing costs of investing in other mutual funds.
The examples are based on an investment of $1,000 invested at the beginning of the six-month period ended December 31, 2007 and held for the entire six-month period.
110
2007 Annual Report
December 31, 2007
Investment Overview (cont’d)
Systematic Active Small Cap Core Portfolio
Actual Expenses
The first line of the tables below provides information about actual account values and actual expenses. You may use the information in this line, together with the amount you invested, to estimate the expenses that you paid over the period. Simply divide your account value by $1,000 (for example, an $8,600 account value divided by $1,000 = 8.6), then multiply the result by the number in the first line under the heading entitled “Expenses Paid During Period” to estimate the expenses you paid on your account during this period.
Please note that “Expenses Paid During Period” are grossed up to reflect Portfolio expenses prior to the effect of Expense Offset (See Note E in the Notes to Financial Statements). Therefore, the annualized net expense ratios may differ from the ratio of the expenses to average net assets shown in the Financial Highlights.
Hypothetical Example for Comparison Purposes
The second line of the tables below provides information about hypothetical account values and hypothetical expenses based on the Portfolio’s actual expense ratio and an assumed rate of return of 5% per year before expenses, which is not the Portfolio’s actual return. The hypothetical account values and expenses may not be used to estimate the actual ending account balance or expenses you paid for the period. You may use this information to compare the ongoing costs of investing in the Portfolio and other funds. To do so, compare this 5% hypothetical example with the 5% hypothetical examples that appear in the shareholder reports of the other funds.
Please note that the expenses shown in the table are meant to highlight your ongoing costs only and do not reflect any transactional costs, such as redemption fees. Therefore, the second line of the table is useful in comparing ongoing costs only, and will not help you determine the relative total costs of owning different funds. In addition, if these transactional costs were included, your costs would have been higher.
| | Beginning
Account Value
July 1, 2007 | | | Ending
Account Value
December 31,
2007 | | | Expenses Paid
During Period*
July 1, 2007—December 31,
2007 | |
Class A | | | | | | |
Actual | | $1,000.00 | | $ | 868.40 | | $4.80 |
Hypothetical (5% average annual return before expenses) | | 1,000.00 | | 1,020.06 | | 5.19 |
| | | | | | |
Class B | | | | | | |
Actual | | 1,000.00 | | 867.90 | | 6.31 |
Hypothetical (5% average annual return before expenses) | | 1,000.00 | | 1,018.45 | | 6.82 |
* | Expenses are equal to Class A and Class B annualized net expense ratios of 1.02% and 1.34%, respectively, multiplied by the average account value over the period, multiplied by 184/365 (to reflect the one-half year period). |
| | | | | | | | | | | |
Graphic Presentation of Portfolio Holdings
The following graph depicts the Portfolio’s holdings by industry and/or security type, as a percentage of total investments.
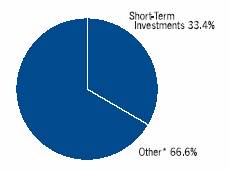
* Industries which do not appear in the above graph, as well as those which represent less than 5% of total investments, if applicable, are included in the category labeled “Other”.
111
2007 Annual Report | |
| |
December 31, 2007 | |
Portfolio of Investments
Systematic Active Small Cap Core Portfolio
| | Shares | | Value
(000) |
Common Stocks (89.2%) | | | | |
Advertising Agencies (0.4%) | | | | |
InVentiv Health, Inc. | | (a)753 | | $ | 23 |
Aerospace (0.8%) | | | | |
AAR Corp. | | (a)(c)931 | | 35 |
MTC Technologies, Inc. | | (a)(c)491 | | 12 |
| | | | 47 |
Air Transport (1.9%) | | | | |
Alaska Air Group, Inc. | | (a)(c)1,387 | | 35 |
Bristow Group, Inc. | | (a)536 | | 30 |
ExpressJet Holdings, Inc. | | (a)3,122 | | 8 |
Republic Airways Holdings, Inc. | | (a)795 | | 15 |
Skywest, Inc. | | 882 | | 24 |
| | | | 112 |
Auto Parts: After Market (0.1%) | | | | |
Commercial Vehicle Group, Inc. | | (a)515 | | 7 |
Auto Parts: Original Equipment (0.1%) | | | | |
Noble International, Ltd. | | (c)304 | | 5 |
Auto, Trucks & Parts (0.7%) | | | | |
American Axle & Manufacturing Holdings, Inc. | | 1,987 | | 37 |
Miller Industries, Inc. | | (a)562 | | 8 |
| | | | 45 |
Automobiles (0.3%) | | | | |
Force Protection, Inc. | | (a)1,619 | | 7 |
Wabash National Corp. | | 1,020 | | 8 |
| | | | 15 |
Banks: New York City (0.6%) | | | | |
Community Bank System, Inc. | | (c)1,170 | | 23 |
Signature Bank/NY | | (a)308 | | 10 |
| | | | 33 |
Banks: Outside New York City (5.2%) | | | | |
1st Source Corp. | | (c)342 | | 6 |
BankFinancial Corp. | | (c)1,550 | | 24 |
Boston Private Financial Holdings, Inc. | | (c)1,220 | | 33 |
Capital Bancorp Ltd. | | 393 | | 8 |
Centennial Bank Holdings, Inc. | | (a)(c)3,568 | | 21 |
First Bancorp/Puerto Rico | | (c)4,444 | | 32 |
First Community Bancorp, Inc./CA | | (c)940 | | 39 |
Franklin Bank Corp./Houston TX | | (a)1,824 | | 8 |
Freemont General Corp. | | (a)2,006 | | 7 |
Hanmi Financial Corp. | | 913 | | 8 |
Imperial Capital Bancorp, Inc. | | 556 | | 10 |
Independent Bank Corp./MI | | 820 | | 8 |
Irwin Financial Corp. | | 1,049 | | 8 |
Midwest Banc Holdings, Inc. | | 629 | | 8 |
Oriental Financial Group | | 1,652 | | 22 |
Security Bank Corp./GA | | 853 | | 8 |
Sun Bancorp, Inc./NJ | | (a)(c)664 | | 10 |
Susquehanna Bancshares, Inc. | | (c)982 | | 18 |
Umpqua Holdings Corp. | | (c)1,952 | | 30 |
| | | | 308 |
Biotechnology Research & Production (3.6%) | | | | |
Albany Molecular Research, Inc. | | (a)1,867 | | 27 |
American Oriental Bioengineering, Inc. | | (a)684 | | $ | 8 |
Applera Corp. - Celera Group | | (a)656 | | 10 |
Cubist Pharmaceuticals, Inc. | | (a)366 | | 7 |
Idenix Pharmaceuticals, Inc. | | (a)2,913 | | 8 |
InterMune, Inc. | | (a)583 | | 8 |
Kendle International, Inc. | | (a)(c)907 | | 44 |
MannKind Corp. | | (a)974 | | 8 |
Martek Biosciences Corp. | | (a)(c)862 | | 26 |
Momenta Pharmaceuticals, Inc. | | (a)1,063 | | 8 |
Nabi Biopharmaceuticals | | (a)(c)5,787 | | 21 |
Nastech Pharmaceutical, Inc. | | (a)1,966 | | 7 |
Neurocrine Biosciences, Inc. | | (a)1,734 | | 8 |
Omrix Biopharmaceuticals, Inc. | | (a)226 | | 8 |
Protalix BioTherapeutics, Inc. | | (a)2,365 | | 7 |
Vanda Pharmaceuticals, Inc. | | (a)1,149 | | 8 |
| | | | 213 |
Building: Cement (0.1%) | | | | |
US Concrete, Inc. | | (a)2,302 | | 8 |
Building — Miscellaneous (0.3%) | | | | |
Builders Firstsource, Inc. | | (a)1,093 | | 8 |
Trex Co., Inc. | | (a)895 | | 7 |
| | | | 15 |
Building: Plumbing & Heating (0.2%) | | | | |
Aaon, Inc. | | 512 | | 10 |
Building Materials (0.4%) | | | | |
NCI Building Systems, Inc. | | (a)(c)626 | | 17 |
PGT, Inc. | | (a)1,616 | | 8 |
| | | | 25 |
Business & Consumer Discretionary — Miscellaneous (0.3%) | | | | |
Core-Mark Holding Co., Inc. | | (a)(c)529 | | 15 |
Casinos & Gambling (0.0%) | | | | |
Magna Entertainment Corp. | | (a)1,095 | | 1 |
Chemicals (2.4%) | | | | |
Arch Chemicals, Inc. | | 570 | | 21 |
Georgia Gulf Corp. | | 1,131 | | 8 |
HB Fuller | | 443 | | 10 |
Landec Corp. | | (a)773 | | 10 |
PolyOne Corp. | | (a)6,251 | | 41 |
Spartech Corp. | | (c)1,518 | | 22 |
Stepan Co. | | (c)216 | | 7 |
Symyx Technologies, Inc. | | (a)959 | | 7 |
Tronox, Inc., Class B | | 920 | | 8 |
Zep, Inc. | | (a)379 | | 5 |
| | | | 139 |
Commercial Information Services (0.3%) | | | | |
CMGI, Inc. | | (a)1,394 | | 18 |
Communications & Media (0.1%) | | | | |
Westwood One, Inc. | | 3,884 | | 8 |
Communications Technology (2.7%) | | | | |
3Com Corp. | | (a)8,755 | | 39 |
Black Box Corp. | | 684 | | 25 |
Cbeyond, Inc. | | (a)(c)828 | | 32 |
| | | | | | |
112 | The accompanying notes are an integral part of the financial statements. | |
2007 Annual Report
December 31, 2007
Portfolio of Investments (cont’d)
Systematic Active Small Cap Core Portfolio
| | | | Value |
| | Shares | | (000) |
Communications Technology (cont’d) | | | | |
CommScope, Inc. | | (a)154 | | $ | 8 |
MasTec, Inc. | | (a)(c)1,335 | | 14 |
Network Equipment Technologies | | (a)937 | | 8 |
Novatel Wireless, Inc. | | (a)482 | | 8 |
Optium Corp. | | (a)1,024 | | 8 |
Utstarcom, Inc. | | (a)(c)6,013 | | 16 |
| | | | 158 |
Computer Services Software & Systems (5.5%) | | | | |
American Reprographics Co. | | (a)470 | | 7 |
Anixter International, Inc. | | (a)(c)668 | | 42 |
Ariba, Inc. | | (a)(c)4,504 | | 50 |
CACI International, Inc., Class A | | (a)428 | | 19 |
Chordiant Software, Inc. | | (a)913 | | 8 |
COMSYS IT Partners, Inc. | | (a)(c)476 | | 8 |
iGate Corp. | | (a)907 | | 8 |
JDA Software Group, Inc. | | (a)2,167 | | 44 |
Mantech International Corp., Class A | | (a)481 | | 21 |
Mentor Graphics Corp. | | (a)925 | | 10 |
Midway Games, Inc. | | (a)2,808 | | 8 |
Move, Inc. | | (a)3,186 | | 8 |
Openwave Systems, Inc. | | 5,820 | | 15 |
Packeteer, Inc. | | (a)1,284 | | 8 |
Perot Systems Corp. | | (a)2,979 | | 40 |
Schawk, Inc. | | 676 | | 11 |
SourceForge, Inc. | | (a)3,350 | | 7 |
Sykes Enterprises, Inc. | | (a)421 | | 8 |
| | | | 322 |
Computer Technology (0.9%) | | | | |
Imation Corp. | | (c)947 | | 20 |
Isilon Systems, Inc. | | (a)1,561 | | 8 |
Rackable Systems, Inc. | | (a)803 | | 8 |
Synaptics, Inc. | | (a)189 | | 8 |
Zoran Corp. | | (a)349 | | 8 |
| | | | 52 |
Construction (0.3%) | | | | |
Dycom Industries, Inc. | | (a)(c)701 | | 19 |
Consumer Electronics (0.8%) | | | | |
Earthlink, Inc. | | (a)(c)4,666 | | 33 |
InterNap Network Services Corp. | | (a)904 | | 7 |
ipass, Inc. | | (a)1,735 | | 7 |
| | | | 47 |
Containers & Packaging: Paper & Plastic (0.2%) | | | | |
Graphic Packaging Corp. | | (a)(c)2,766 | | 10 |
Consumer Staples — Miscellaneous (1.0%) | | | | |
American Greetings Corp. Class A | | (c)1,626 | | 33 |
Prestige Brands Holdings, Inc. | | (a)3,020 | | 23 |
| | | | 56 |
Diversifed (0.3%) | | | | |
Hudson Highland Group, Inc. | | (a)989 | | 8 |
Beacon Roofing Supply, Inc. | | (a)918 | | 8 |
| | | | 16 |
Diversified Financial Services (0.8%) | | | | |
CompuCredit Corp. | | (a)813 | | 8 |
Clayton Holdings, Inc. | | (a)1,719 | | $ | 9 |
First Niagara Financial Group, Inc. | | 2,564 | | 31 |
| | | | 48 |
Drug & Grocery Store Chains (0.1%) | | | | |
Winn-Dixie Stores, Inc. | | (a)464 | | 8 |
Drugs & Pharmaceuticals (3.7%) | | | | |
Emergent Biosolutions, Inc. | | (a)1,510 | | 8 |
KV Pharmaceutical Co. | | (a)271 | | 8 |
Medarex, Inc. | | (a)(c)1,863 | | 19 |
Nektar Therapeutics | | (a)1,177 | | 8 |
Obagi Medical Products, Inc. | | (a)425 | | 8 |
OSI Pharmaceuticals, Inc. | | (a)1,275 | | 62 |
Penwest Pharmaceuticals Co. | | (a)1,320 | | 8 |
Perrigo Co. | | 2,099 | | 74 |
Quidel Corp. | | (a)399 | | 8 |
Santarus, Inc. | | (a)3,098 | | 8 |
Trubion Pharmaceuticals, Inc. | | (a)749 | | 7 |
| | | | 218 |
Electrical Equipment & Components (1.1%) | | | | |
Belden, Inc. | | 231 | | 10 |
Greatbatch, Inc. | | (a)512 | | 10 |
Power-One, Inc. | | (a)1,908 | | 8 |
RF Micro Devices, Inc. | | (a)(c)6,837 | | 39 |
| | | | 67 |
Electronics (0.2%) | | | | |
Multi-Fineline Electronix, Inc. | | (a)499 | | 9 |
Electronics: Instruments Gauges & Meters (0.1%) | | | | |
Measurement Specialties, Inc. | | (a)355 | | 8 |
Electronics: Medical Systems (0.5%) | | | | |
Cynosure, Inc. - Class A | | (a)295 | | 8 |
Hologic, Inc. | | (a)(c)359 | | 24 |
| | | | 32 |
Electronics: Semi-Conductors/Components (3.0%) | | | | |
Anadigics, Inc. | | (a)663 | | 8 |
Genesis Microchip, Inc. | | (a)(c)1,056 | | 9 |
IXYS Corp. | | (a)1,404 | | 11 |
Microsemi Corp. | | (a)350 | | 8 |
ON Semiconductor Corp. | | (a)875 | | 8 |
Plexus Corp. | | (a)(c)991 | | 26 |
Powerwave Technologies, Inc. | | (a)(c)1,592 | | 6 |
Rogers Corp. | | (a)(c)462 | | 20 |
Silicon Image, Inc. | | (a)1,693 | | 8 |
Silicon Storage Technology, Inc. | | (a)(c)8,973 | | 27 |
Skyworks Solutions, Inc. | | (a)(c)2,520 | | 21 |
Spansion, Inc. | | (a)1,956 | | 8 |
Syntax-Brillian Corp. | | (a)2,576 | | 8 |
Trident Microsystems, Inc. | | (a)1,271 | | 8 |
| | | | 176 |
Electronics: Technology (1.1%) | | | | |
Checkpoint Systems, Inc. | | (a)928 | | 24 |
Innovative Solutions & Support, Inc. | | (a)837 | | 8 |
Omnivision Technologies, Inc. | | (a)(c)1,779 | | 28 |
Zygo Corp. | | (a)(c)542 | | 6 |
| | | | 66 |
| | | | | | |
| The accompanying notes are an integral part of the financial statements. | 113 |
2007 Annual Report | |
| |
December 31, 2007 | |
Portfolio of Investments (cont’d)
Systematic Active Small Cap Core Portfolio
| | | | Value |
| | Shares | | (000) |
Energy — Miscellaneous (3.0%) | | | | |
Alon USA Energy, Inc. | | 1,575 | | $ | 43 |
Atwood Oceanics, Inc. | | (a)102 | | 10 |
Bois d’Arc Energy, Inc. | | (a)523 | | 10 |
Callon Petroleum Co. | | (a)675 | | 12 |
Energy Partners Ltd. | | (a)645 | | 8 |
GeoMet, Inc. | | (a)1,495 | | 8 |
Harvest Natural Resources, Inc. | | (a)(c)877 | | 11 |
Helix Energy Solutions Group, Inc. | | (a)253 | | 10 |
Mariner Energy, Inc. | | (a)805 | | 18 |
Pacific Ethanol, Inc. | | (a)906 | | 7 |
Pioneer Drilling Co. | | (a)(c)1,345 | | 16 |
Swift Energy Co. | | (a)418 | | 18 |
Verenium Corp. | | (a)1,504 | | 8 |
| | | | 179 |
Energy Equipment (0.6%) | | | | |
Exterran Holdings, Inc. | | (a)327 | | 27 |
Geokinetics, Inc. | | (a)411 | | 8 |
| | | | 35 |
Engineering & Contracting Services (0.1%) | | | | |
Integrated Electric Services | | (a)414 | | 8 |
Entertainment (1.1%) | | | | |
Bluegreen Corp. | | (a)(c)3,561 | | 26 |
Carmike Cinemas, Inc. | | 1,252 | | 9 |
Take-Two Interactive Software, Inc. | | (a)(c)1,594 | | 29 |
| | | | 64 |
Financial — Miscellaneous (1.9%) | | | | |
Advanta Corp., Class B | | 978 | | 8 |
Assured Guaranty Ltd. | | 400 | | 10 |
Global Cash Access Holding, Inc. | | (a)1,237 | | 8 |
Imergent, Inc. | | 728 | | 8 |
Ocwen Financial Corp. | | (a)1,406 | | 8 |
Odyssey Re Holdings Corp. | | (c)559 | | 21 |
Platinum Underwriters Holdings, Ltd. | | 659 | | 23 |
RAM Holdings Ltd. | | (a)1,558 | | 8 |
Security Capital Group, Inc. | | 1,971 | | 8 |
Triad Guaranty, Inc. | | (a)785 | | 8 |
| | | | 110 |
Forest Products (0.2%) | | | | |
Universal Forest Products, Inc. | | (c)297 | | 9 |
Health Care Facilities (0.1%) | | | | |
Sun Healthcare Group, Inc. | | (a)449 | | 8 |
Health Care Management Services (0.3%) | | | | |
Eclipsys Corp. | | (a)303 | | 8 |
Omnicell, Inc. | | (a)289 | | 8 |
| | | | 16 |
Health Care Services (0.6%) | | | | |
Amedisys, Inc. | | (a)159 | | 8 |
Bio-Reference Labs, Inc. | | (a)(c)515 | | 17 |
Hythiam, Inc. | | (a)2,798 | | 8 |
| | | | 33 |
Homebuilding (0.9%) | | | | |
Amrep Corp. | | 259 | | $ | 8 |
Beazer Homes USA, Inc. | | 1,098 | | 8 |
Hovnanian Enterprises, Inc. | | (a)1,146 | | 8 |
M/I Homes, Inc. | | 772 | | 8 |
Meritage Homes Corp. | | (a)525 | | 8 |
WCI Communities, Inc. | | (a)(c)3,101 | | 12 |
| | | | 52 |
Hotel/Motel (0.6%) | | | | |
Lodgian, Inc. | | (a)(c)3,381 | | 38 |
Household Furnishings (0.3%) | | | | |
American Woodmark Corp. | | 400 | | 7 |
La-Z-Boy, Inc. | | (c)1,115 | | 9 |
Lifetime Brands, Inc. | | (c)228 | | 3 |
| | | | 19 |
Identification Control & Filter Devices (0.1%) | | | | |
Asyst Technology Corp. | | (a)2,462 | | 8 |
Industrial Products (0.7%) | | | | |
Castle (A.M.) & Co. | | (c)892 | | 24 |
Mueller Industries, Inc. | | 710 | | 21 |
| | | | 45 |
Insurance: Life (0.9%) | | | | |
Presidential Life Corp. | | 2,065 | | 36 |
Stancorp Financial Group | | 207 | | 10 |
Universal American Financial Corp. | | (a)308 | | 8 |
| | | | 54 |
Insurance: Multi-Line (0.3%) | | | | |
Corvel Corp. | | (a)338 | | 8 |
Max Re Capital Ltd. | | 369 | | 10 |
| | | | 18 |
Insurance: Property & Casualty (2.1%) | | | | |
Commerce Group, Inc. | | (c)1,430 | | 51 |
First Acceptance Corp. | | (a)1,872 | | 8 |
IPC Holdings Ltd. | | 407 | | 12 |
Landamerica Financial Group | | 233 | | 8 |
Meadowbrook Insurance Group | | (a)1,082 | | 10 |
Selective Insurance Group | | (c)962 | | 22 |
Tower Group, Inc. | | 314 | | 11 |
| | | | 122 |
Investment Management Companies (1.6%) | | | | |
Apollo Investment Corp. | | (c)2,473 | | 42 |
Cowen Group, Inc. | | (a)779 | | 7 |
Friedman Billings Ramsey Group, Inc. | | 8,428 | | 27 |
Gladstone Capital Corp. | | 248 | | 4 |
Labranche & Co. | | (a)1,515 | | 8 |
W. P. Stewart & Co., Ltd. | | 1,606 | | 8 |
| | | | 96 |
Leisure Time (0.5%) | | | | |
Nautilus Group, Inc. | | 1,533 | | 8 |
Premier Exhibitions, Inc. | | (a)707 | | 8 |
Steinway Musical Instruments | | (c)142 | | 4 |
West Marine, Inc. | | (a)865 | | 8 |
| | | | 28 |
114 | The accompanying notes are an integral part of the financial statements. | |
2007 Annual Report
December 31, 2007
Portfolio of Investments (cont’d)
Systematic Active Small Cap Core Portfolio
| | | | Value |
| | Shares | | (000) |
Machine Tools (0.6%) | | | | |
Regal-Beloit Corp. | | (c)791 | | $ | 36 |
Machinery & Engineering (0.7%) | | | | |
Applied Industrial Technologies, Inc. | | (c)1,090 | | 32 |
DXP Enterprises, Inc. | | (a)165 | | 8 |
| | | | 40 |
Machinery: Engines (0.7%) | | | | |
Briggs & Stratton Corp. | | (c)1,830 | | 41 |
Machinery: Industrial/Specialty (0.1%) | | | | |
Kennametal, Inc. | | 268 | | 10 |
Machinery: Oil Well Equipment & Services (1.0%) | | | | |
Lufkin Industries, Inc. | | 637 | | 37 |
Oil States International, Inc. | | (a)774 | | 26 |
| | | | 63 |
Manufactured Housing (0.1%) | | | | |
Skyline Corp. | | 288 | | 8 |
Manufacturing (0.9%) | | | | |
Acuity Brands, Inc. | | 529 | | 24 |
Ameron International Corp. | | (c)208 | | 19 |
Griffon Corp. | | (a)611 | | 8 |
| | | | 51 |
Materials & Processing — Miscellaneous (0.2%) | | | | |
USEC, Inc. | | (a)(c)1,526 | | 14 |
Medical & Dental Instruments & Supplies (1.3%) | | | | |
Inverness Medical Innovations, Inc. | | (a)604 | | 34 |
Orthofix International N.V. | | (a)133 | | 7 |
STERIS Corp. | | 1,024 | | 29 |
Vital Sign | | 152 | | 8 |
| | | | 78 |
Metal Fabricating (0.2%) | | | | |
Encore Wire Corp. | | (c)556 | | 9 |
Office Furniture & Business Equipment (1.0%) | | | | |
Herman Miller, Inc. | | 775 | | 25 |
Ikon Office Solutions, Inc. | | (c)2,348 | | 31 |
| | | | 56 |
Oil: Crude Producers (1.2%) | | | | |
Edge Petroleum Corp. | | (a)(c)1,886 | | 11 |
Stone Energy Corp. | | (a)1,215 | | 57 |
| | | | 68 |
Paper (1.0%) | | | | |
AbitibiBowater, Inc. | | (c)1,311 | | 27 |
Chesapeake Corp. | | 1,411 | | 7 |
Rock-Tenn Co. | | 866 | | 22 |
| | | | 56 |
Pollution Control & Environmental Services (0.1%) | | | | |
Aventine Renewable Energy Holdings, Inc. | | (a)617 | | 8 |
Printing & Copying Services (0.1%) | | | | |
VistaPrint Ltd. | | (a)182 | | 8 |
Production Technology Equipment (0.6%) | | | | |
Credence Systems Corp. | | (a)(c)11,340 | | 27 |
Mattson Technology, Inc. | | (a)923 | | $ | 8 |
| | | | 35 |
Publishing — Miscellaneous (0.4%) | | | | |
Scholastic Corp. | | (a)776 | | 27 |
Real Estate Investment Trusts (REIT) (4.8%) | | | | |
Alesco Financial, Inc. | | 2,380 | | 8 |
American Financial Realty Trust | | (a)4,960 | | 40 |
Anthracite Capital, Inc. | | (c)1,057 | | 8 |
BioMed Realty Trust, Inc. | | (c)1,290 | | 30 |
CBRE Realty Finance, Inc. | | 1,374 | | 7 |
Deerfield Capital Corp. | | (c)2,663 | | 21 |
Equity One, Inc. | | (c)1,030 | | 24 |
Lexington Realty Trust | | (c)2,446 | | 35 |
Novastar Financial, Inc. | | (a)2,602 | | 7 |
Pennsylvania Real Estate Investment Trust | | (c)1,182 | | 35 |
RAIT Investment Trust | | (c)1,868 | | 16 |
Realty Income Corp. | | (c)1,505 | | 41 |
Tarragon Corp. | | (a)(c)850 | | 1 |
U-Store-It Trust | | 844 | | 8 |
| | | | 281 |
Restaurants (1.1%) | | | | |
Bob Evans Farms, Inc. | | (c)1,406 | | 38 |
O’Charleys, Inc. | | (c)699 | | 10 |
Jamba, Inc. | | (a)2,065 | | 8 |
Ruby Tuesday, Inc. | | 817 | | 8 |
| | | | 64 |
Retail (5.1%) | | | | |
Bon-Ton Stores, Inc. (The) | | (c)1,039 | | 10 |
Borders Group, Inc. | | (c)2,501 | | 27 |
Brown Shoe Co., Inc. | | 267 | | 4 |
Cabela’s, Inc., Class A | | (a)(c)1,868 | | 28 |
Casual Male Retail Group, Inc. | | (a)1,464 | | 8 |
Cato Corp. (The), Class A | | (c)1,674 | | 26 |
Charming Shoppes, Inc. | | (a)(c)4,436 | | 24 |
Citi Trends, Inc. | | (a)498 | | 8 |
Collective Brands, Inc. | | (a)1,743 | | 30 |
Conn’s, Inc. | | (a)(c)573 | | 10 |
CSK Auto Corp. | | (a)1,623 | | 8 |
Jo-Ann Stores, Inc. | | (a)229 | | 3 |
Krispy Kreme Doughnuts, Inc. | | (a)2,470 | | 8 |
Lawson Products, Inc. | | 228 | | 9 |
Pantry, Inc. (The) | | (a)(c)642 | | 17 |
Regis Corp. | | 1,058 | | 29 |
Retail Ventures, Inc. | | (a)1,473 | | 7 |
Rush Enterprises, Inc. | | (a)295 | | 5 |
Stein Mart, Inc. | | (c)3,047 | | 14 |
Tuesday Morning Corp. | | 1,564 | | 8 |
World Fuel Services Corp. | | 477 | | 14 |
| | | | 297 |
Savings & Loan (1.1%) | | | | |
BankAtlantic Bancorp, Inc., Class A | | 1,824 | | 7 |
Bankunited Financial Corp. | | 1,143 | | 8 |
Downey Financial Corp. | | 248 | | 8 |
Flagstar Bancorp, Inc. | | (c)1,039 | | 7 |
NewAlliance Bancshares, Inc. | | (c)1,976 | | 23 |
| | | | | | |
| The accompanying notes are an integral part of the financial statements. | 115 |
2007 Annual Report | |
| |
December 31, 2007 | |
Portfolio of Investments (cont’d)
Systematic Active Small Cap Core Portfolio
| | | | Value |
| | Shares | | (000) |
Savings & Loan (cont’d) | | | | |
PFF Bancorp, Inc. | | 657 | | $ | 8 |
United Community Financial Corp. | | (c)645 | | 4 |
| | | | 65 |
Services: Commercial (4.7%) | | | | |
Ambassadors International, Inc. | | 573 | | 8 |
AMN Healthcare Services, Inc. | | (a)(c)666 | | 12 |
BearingPoint, Inc. | | (a)(c)6,395 | | 18 |
Gevity HR, Inc. | | 965 | | 7 |
ICT Group, Inc. | | (a)654 | | 8 |
Kelly Services, Inc., Class A | | 1,354 | | 25 |
Kforce, Inc. | | (a)(c)3,710 | | 36 |
Live Nation, Inc. | | (a)2,398 | | 35 |
MPS Group, Inc. | | (a)1,177 | | 13 |
Perficient, Inc. | | (a)487 | | 8 |
PHH Corp. | | (a)1,094 | | 19 |
Providence Service Corp. (The) | | (a)278 | | 8 |
RSC Holdings, Inc. | | (a)823 | | 10 |
Source Information Management Co. | | (a)2,720 | | 8 |
Travelzoo, Inc. | | (a)558 | | 8 |
TrueBlue, Inc. | | (a)(c)1,055 | | 15 |
Volt Information Sciences, Inc. | | (a)1,737 | | 31 |
Walter Industries Corp. | | 287 | | 10 |
| | | | 279 |
Shipping (0.1%) | | | | |
American Commercial Lines | | (a)467 | | 7 |
Shoes (0.1%) | | | | |
Shoe Carnival, Inc. | | (a)(c)333 | | 5 |
Steel (0.7%) | | | | |
Esmark, Inc. | | (a)(c)609 | | 8 |
Schnitzer Steel Industries, Inc. | | (c)443 | | 31 |
| | | | 39 |
Textile Apparel Manufacturers (0.9%) | | | | |
Heelys, Inc. | | (a)1,116 | | 8 |
Kellwood Co. | | (c)604 | | 10 |
Warnaco Group, Inc. (The) | | (a)997 | | 34 |
| | | | 52 |
Textile Products (0.2%) | | | | |
Interface, Inc. | | 633 | | 10 |
Tobacco (0.1%) | | | | |
Alliance One International, Inc. | | (a)(c)1,377 | | 6 |
Transportation — Miscellaneous (1.1%) | | | | |
General Maritime Corp. | | 424 | | 10 |
Pacer International, Inc. | | 2,166 | | 32 |
Saia, Inc. | | (a)1,110 | | 15 |
Celadon Group, Inc. | | (a)858 | | 8 |
| | | | 65 |
Truckers (0.3%) | | | | |
Arkansas Best Corp. | | (c)237 | | 5 |
Old Dominion Freight Line, Inc. | | (a)(c)592 | | 14 |
| | | | 19 |
Utilities: Electrical (1.0%) | | | | |
PNM Resources, Inc. | | (c)1,852 | | 40 |
Unisource Energy Corp. | | 592 | | $ | 18 |
| | | | 58 |
Utilities: Telecommunications (0.2%) | | | | |
North Pittsburgh Systems, Inc. | | 422 | | 10 |
Wholesale & International Trade (0.7%) | | | | |
Central European Distribution Corp. | | (a)(c)740 | | 43 |
Wholesalers (0.8%) | | | | |
BlueLinx Holdings, Inc. | | (c)2,688 | | 11 |
Building Material Holding Corp. | | (c)1,821 | | 10 |
United Stationers, Inc. | | (a)592 | | 27 |
| | | | 48 |
Total Common Stocks (Cost $6,106) | | | | 5,257 |
| | Face | | |
| | Amount | | |
| | (000) | | |
Short-Term Investments (44.8%) | | | | |
Short-Term Debt Securities held as Collateral on Loaned Securities (32.6%) | | | | |
Alliance & Leicester plc, | | | | |
5.26%, 9/2/08 | | $ | (h)57 | | 57 |
Bancaja, | | | | |
5.35%, 8/12/08 | | 29 | | 29 |
Bank of New York Co., Inc., | | | | |
5.24%, 8/8/08 | | (h)29 | | 29 |
BASF AG, | | | | |
5.18%, 8/19/08 | | (h)29 | | 29 |
BNP Paribas plc, | | | | |
4.90%, 5/19/08 | | (h)57 | | 57 |
CAM US Finance S.A. Unipersonal, | | | | |
5.24%, 7/25/08 | | (h)115 | | 115 |
Canadian Imperial Bank of Commerce, New York, | | | | |
4.42%, 7/28/08 | | (h)57 | | 57 |
CC USA, Inc., | | | | |
3.89%, 1/28/08 | | (h)29 | | 29 |
CIT Group Holdings, | | | | |
5.23%, 6/18/08 | | (h)104 | | 104 |
Citigroup Global Markets Holdings, Inc., | | | | |
4.51%, 1/2/08 | | 392 | | 392 |
Credit Suisse First Boston, New York, | | | | |
4.32%, 3/14/08 | | (h)57 | | 57 |
First Tennessee Bank, | | | | |
5.05%, 8/15/08 | | (h)29 | | 29 |
5.06%, 8/15/08 | | (h)115 | | 115 |
Goldman Sachs Group, Inc., | | | | |
4.62%, 2/13/09 | | (h)54 | | 54 |
5.10%, 9/12/08 | | (h)29 | | 29 |
HSBC Finance Corp., | | | | |
5.26%, 8/5/08 | | (h)29 | | 29 |
IBM Corp., | | | | |
5.27%, 9/8/08 | | (h)115 | | 115 |
Lehman Brothers, Inc., | | | | |
4.49%, 1/2/08 | | 49 | | 49 |
Macquarie Bank Ltd., | | | | |
4.95%, 8/20/08 | | (h)57 | | 57 |
Metropolitan Life Global Funding, | | | | |
4.89%, 8/21/08 | | (h)86 | | 86 |
| | | | | | |
116 | The accompanying notes are an integral part of the financial statements. | |
2007 Annual Report
December 31, 2007
Portfolio of Investments (cont’d)
Systematic Active Small Cap Core Portfolio
| | Face | | |
| | Amount | | Value |
| | (000) | | (000) |
Short-Term Debt Securities held as Collateral on Loaned Securities (cont’d) | | | | |
National Bank of Canada, | | | | |
5.21%, 4/2/08 | | $ | (h)115 | | $ | 115 |
National Rural Utilities Cooperative Finance Corp., | | | | |
5.24%, 9/2/08 | | (h)115 | | 115 |
Nationwide Building Society, | | | | |
4.92%, 7/28/08 | | (h)67 | | 67 |
Unicredito Italiano Bank (Ireland) plc, | | | | |
5.04%, 8/14/08 | | (h)64 | | 64 |
5.26%, 8/8/08 | | (h)40 | | 40 |
| | | | 1,919 |
| | Shares | | |
Investment Company (12.2%) | | | | |
Morgan Stanley Institutional Liquidity | | | | |
Money Market Portfolio — Institutional Class | | (o)716,637 | | 717 |
Total Short-Term Investments (Cost $2,636) | | | | 2,636 |
Total Investments (134.0%) (Cost $8,742) — including $1,826 of Securities Loaned | | | | (v)7,893 |
Liabilities in Excess of Other Assets (-34.0%) | | | | (2,001) |
Net Assets (100%) | | | | $5,892 |
| | | | | | |
(a) | | Non-income producing security. |
(c) | | All or a portion of security on loan at December 31, 2007. |
(h) | | Variable/Floating Rate Security — Interest rate changes on these instruments are based on changes in a designated base rate. The rates shown are those in effect on December 31, 2007. |
(o) | | See Note F within the Notes to Financial Statements regarding investment in Morgan Stanley Institutional Liquidity Money Market Portfolio — Institutional Class. |
(v) | | The approximate market value and percentage of the investments, $11,000 and 0.1%, respectively, represent the securities that have been fair valued under the fair valuation policy for international investments as described in Note A within the Notes to Financial Statements. |
REIT | | Real Estate Investment Trust |
Futures Contracts: | | | | | | | | | |
The Portfolio had the following futures contract(s) open at period end: | |
| |
| | | | | | | | Net | |
| | | | | | | | Unrealized | |
| | Number | | | | �� | | Appreciation | |
| | of | | Value | | Expiration | | (Depreciation) | |
| | Contracts | | (000) | | Date | | (000) | |
Long: | | | | | | | | | |
E-Mini Russell 2000 | | 4 | | $309 | | Mar-08 | | | $7 | | |
| | | | | | | | | |
| | | | | | | | | | | |
| The accompanying notes are an integral part of the financial statements. | 117 |
2007 Annual Report
2007 Annual Report | |
| |
December 31, 2007 | |
Investment Overview (unaudited)
Systematic Active Small Cap Growth Portfolio
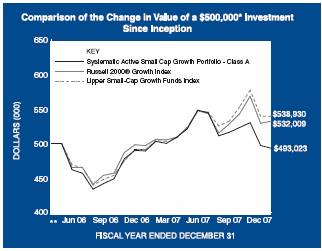
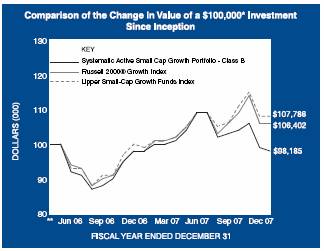
* Minimum Investment
* * Commenced operations on April 28, 2006
In accordance with SEC regulations, Portfolio’s performance shown assumes that all recurring fees (including management fees) were deducted and all dividends and distributions were reinvested. The performance of Class B shares will vary from the Class A shares and will be negatively impacted by additional fees assessed to this class.
Performance Compared to the Russell 2000® Growth Index(1) and the Lipper Small-Cap Growth Funds Index(2)
| | Total Returns(3) | |
| | Average Annual | |
| | One | | Since | |
| | Year | | Inception(5) | |
Portfolio – Class A (4) | | 0.82 | % | (0.83 | )% |
Russell 2000® Growth Index | | 7.05 | | 3.77 | |
Lipper Small-Cap Growth Funds Index | | 9.68 | | 4.57 | |
| | | | | |
Portfolio – Class B (4) | | 0.50 | | (1.09 | ) |
Russell 2000® Growth Index | | 7.05 | | 3.77 | |
Lipper Small-Cap Growth Funds Index | | 9.68 | | 4.57 | |
| | | | | | | | |
Performance data quoted represents past performance, which is no guarantee of future results, and current performance may be lower or higher than the figures shown. Performance assumes that all dividends and distributions, if any, were reinvested. For the most recent month-end performance figures, please visit www.morganstanley.com/msim. Investment return and principal value will fluctuate so that Portfolio shares, when redeemed, may be worth more or less than their original cost. Total returns do not reflect the deduction of taxes that a shareholder would pay on Portfolio distributions or the redemption of Portfolio shares.
(1) | | The Russell 2000® Growth Index measures the performance of those Russell 2000® companies with higher price-to-book ratios and higher forecasted growth values. The Index is unmanaged and its returns do not include any sales charges or fees. Such costs would lower performance. It is not possible to invest directly in an index. |
(2) | | The Lipper Small-Cap Growth Funds Index is an equally weighted performance index of the largest qualifying funds (based on net assets) in the Lipper Small-Cap Growth Funds classification. The Index, which is adjusted for capital gains distributions and income dividends, is unmanaged and should not be considered an investment. There are currently 30 funds represented in this Index. As of the date of this report, the Portfolio is in the Lipper Small-Cap Growth Funds classification. |
(3) | | Total returns for the Portfolio reflect fees waived and expenses reimbursed, if applicable, by the Adviser. Without such waivers and reimbursements, total returns would have been lower. Fee waivers and/or expense reimbursements are voluntary and the Adviser reserves the right to commence or terminate any waiver and/or reimbursement at any time. |
(4) | | Commenced operations on April 28, 2006 |
(5) | | For comparative purposes, average since inception returns listed for the Indexes refer to the inception date or initial offering of the respective share class of the Portfolio, not the inception of the Index. |
The Systematic Active Small Cap Growth Portfolio (the “Portfolio”) seeks long-term capital appreciation by investing primarily in growth-oriented equity securities of small capitalization companies. Investments in small sized corporations are more vulnerable to financial risks and other risks than larger corporations and may involve a higher degree of price volatility than investments in the general equity markets.
Performance
For the year ended December 31, 2007, the Portfolio had a total return based on net asset value and reinvestment of distributions per share of 0.82%, net of fees, for Class A shares
118
| 2007 Annual Report |
| |
| December 31, 2007 |
Investment Overview (cont’d)
Systematic Active Small Cap Growth Portfolio
and 0.50%, net of fees, for Class B shares. The Portfolio’s Class A and Class B shares underperformed against its benchmark, the Russell 2000® Growth Index (the “Index”) which returned 7.05%.
Factors Affecting Performance
· The 12 months ended December 31, 2007 were characterized by pronounced volatility in stock prices, largely driven by credit market woes and deteriorating economic outlooks. By the third quarter, evidence mounted that the subprime market’s troubles spilled into the credit market and the broader economy. A tightening in credit standards, mortgage lender bankruptcies and hedge fund implosions were followed by multi-billion dollar losses reported at several large financial institutions in the fourth quarter. At the same time, a cross current of unfavorable data buffeted the market, indicating a languishing housing market, declining consumer spending, rising oil prices and negative year-over-year corporate profit growth. Although the market rallied each time the Federal Reserve’s (the “Fed”) reduced the target federal funds rate, skepticism quickly returned as investors worried that the Fed’s ability to steer the economy away from recession would be limited by rising inflation pressures. Fourth quarter corporate earnings expectations were dismal, with only the largest multi-national companies expected to generate growth. In this environment, large-cap equities outperformed small-caps, and growth beat value for the year overall.
· Based on total returns, the Portfolio’s best performing sectors were materials, health care and telecommunication services. Financials and consumer discretionary were the weakest sector performers for the Portfolio during the period.
· The largest detractors from the Portfolio’s overall absolute return were the consumer discretionary and financials sectors. In the consumer discretionary sector, several specialty retail holdings lagged as declining retail sales hurt profits for these companies. Limited exposure to a restaurant stock that advanced strongly following its spin-off also dampened the overall sector’s contribution to returns. In the financials sector, weak performance came from a wide range of holdings, due to their exposure to the deteriorating real estate market and concerns about the credit market.
· In contrast, the health care sector contributed positively to the Portfolio’s overall absolute return. Holdings in a generic drug manufacturer and a diagnostic devices maker performed well, owing to these companies’ strong earnings during the period. Strong performance also came from a company that acquires and develops hematology and oncology treatments, which rallied twice during the year: first, on news of favorable drug trial results and later on an announced acquisition by a biotechnology company.
· The Portfolio’s relative underperformance was driven primarily by the consumer discretionary and financials sectors.
Management Strategies
· We believe that we can enhance returns by employing a quantitative model that uses multiple, independent factors to examine the fundamentals of a company. We further believe that our quantitative efforts in combination with our fundamental analysis can exploit market inefficiencies.
· We employ a quantitative approach to stock selection utilizing a proprietary quantitative model. The model is driven by rigorous fundamental and quantitative research that screens a universe of small capitalization companies. The model employs three quantitative screens based on the following primary inputs – earnings expectations, price trends and relative valuations. Individual securities and industries are ranked within each sector by the most effective combination of these disciplines based on the current phase of the economic cycle. We then decide whether to buy, sell or hold a security based on its fundamental analysis and the results of this model-driven approach.
· Accordingly, the stock selection process yielded an overweight position in the consumer staples sector; underweight positions in the consumer discretionary, health care and technology sectors; and market-weight positions in the energy, financials, industrials, materials and telecommunication services sectors. The Portfolio had a zero weighting in the utilities sector.
Expense Examples
As a shareholder of the Portfolio, you may incur two types of costs: (1) transactional costs, including redemption fees; (2) ongoing costs, including management fees, shareholder servicing fees (in the case of Class B); and other Portfolio expenses. These examples are intended to help you understand your ongoing costs (in dollars) of investing in the Portfolio and to compare these costs with the ongoing costs of investing in other mutual funds.
The examples are based on an investment of $1,000 invested at the beginning of the six-month period ended December 31, 2007 and held for the entire six-month period.
119
2007 Annual Report | |
| |
December 31, 2007 | |
Investment Overview (cont’d)
Systematic Active Small Cap Growth Portfolio
Actual Expenses
The first line of the tables below provides information about actual account values and actual expenses. You may use the information in this line, together with the amount you invested, to estimate the expenses that you paid over the period. Simply divide your account value by $1,000 (for example, an $8,600 account value divided by $1,000 = 8.6), then multiply the result by the number in the first line under the heading entitled “Expenses Paid During Period” to estimate the expenses you paid on your account during this period.
Please note that “Expenses Paid During Period” are grossed up to reflect Portfolio expenses prior to the effect of Expense Offset (See Note E in the Notes to Financial Statements). Therefore, the annualized net expense ratios may differ from the ratio of the expenses to average net assets shown in the Financial Highlights.
Hypothetical Example for Comparison Purposes
The second line of the tables below provides information about hypothetical account values and hypothetical expenses based on the Portfolio’s actual expense ratio and an assumed rate of return of 5% per year before expenses, which is not the Portfolio’s actual return. The hypothetical account values and expenses may not be used to estimate the actual ending account balance or expenses you paid for the period. You may use this information to compare the ongoing costs of investing in the Portfolio and other funds. To do so, compare this 5% hypothetical example with the 5% hypothetical examples that appear in the shareholder reports of the other funds.
Please note that the expenses shown in the table are meant to highlight your ongoing costs only and do not reflect any transactional costs, such as redemption fees. Therefore, the second line of the table is useful in comparing ongoing costs only, and will not help you determine the relative total costs of owning different funds. In addition, if these transactional costs were included, your costs would have been higher.
| | Beginning
Account Value July 1, 2007 | | Ending Account
Value
December 31,
2007 | | Expenses Paid
During Period*
July 1, 2007 —
December 31,
2007 | |
Class A | | | | | | | |
Actual | | $ | 1,000.00 | | $ | 906.30 | | $ | 5.24 | |
Hypothetical (5% average annual return before expenses) | | 1,000.00 | | 1,019.71 | | 5.55 | |
| | | | | | | |
Class B | | | | | | | |
Actual | | 1,000.00 | | 904.90 | | 6.43 | |
Hypothetical (5% average annual return before expenses) | | 1,000.00 | | 1,018.45 | | 6.82 | |
| | | | | | | | | | |
* Expenses are equal to Class A and Class B annualized net expense ratios of 1.09% and 1.34%, respectively, multiplied by the average account value over the period, multiplied by 184/365 (to reflect the one-half year period).
Graphic Presentation of Portfolio Holdings
The following graph depicts the Portfolio’s holdings by industry and/or security type, as a percentage of total investments.
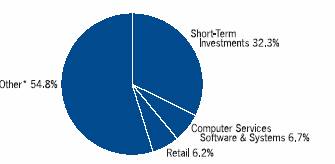
* Industries which do not appear in the above graph, as well as those which represent less than 5% of total investments, if applicable, are included in the category labeled “Other”.
120
| 2007 Annual Report |
| |
| December 31, 2007 |
Portfolio of Investments
Systematic Active Small Cap Growth Portfolio
| | | | Value |
| | Shares | | (000) |
Common Stocks (90.6%) | | | | |
Aerospace (1.7%) | | | | |
AAR Corp. | | (a)1,213 | | $ | 46 |
Esterline Technologies Corp. | | (a)1,266 | | 66 |
| | | | 112 |
Air Transport (0.3%) | | | | |
Alaska Air Group, Inc. | | (a)(c)505 | | 13 |
ExpressJet Holdings, Inc. | | (a)(c)1,786 | | 4 |
| | | | 17 |
Auto Parts: Original Equipment (0.1%) | | | | |
Noble International Ltd. | | (c)310 | | 5 |
Auto, Trucks & Parts (0.3%) | | | | |
Accuride Corp. | | (a)(c)991 | | 8 |
Amerigon, Inc. | | (a)563 | | 12 |
| | | | 20 |
Automobiles (0.2%) | | | | |
Navistar International Corp. | | (a)252 | | 14 |
Banks: Outside New York City (1.5%) | | | | |
Cascade Bancorp | | 1,169 | | 16 |
International Bancshares Corp. | | (c)1,762 | | 37 |
Superior Bancorp | | (a)2,924 | | 16 |
Western Alliance Bancorp | | (a)923 | | 17 |
Wintrust Financial Corp. | | (c)320 | | 11 |
| | | | 97 |
Biotechnology Research & Production (1.9%) | | | | |
Idenix Pharmaceuticals, Inc. | | (a)(c)2,308 | | 6 |
Kendle International, Inc. | | (a)966 | | 48 |
Lexicon Pharmaceuticals, Inc. | | (a)6,985 | | 21 |
Qiagen N.V. | | (a)(c)1,529 | | 32 |
Telik, Inc. | | (a)(c)4,839 | | 17 |
| | | | 124 |
Building Materials (0.5%) | | | | |
NCI Building Systems, Inc. | | (a)(c)659 | | 19 |
PGT, Inc. | | (a)3,559 | | 17 |
| | | | 36 |
Building — Miscellaneous (0.3%) | | | | |
Trex Co., Inc. | | (a)1,990 | | 17 |
Casinos & Gambling (0.7%) | | | | |
MTR Gaming Group, Inc. | | (a)(c)611 | | 4 |
Pinnacle Entertainment, Inc. | | (a)1,173 | | 27 |
Shuffle Master, Inc. | | (a)974 | | 12 |
| | | | 43 |
Chemicals (1.5%) | | | | |
Arch Chemicals, Inc. | | 410 | | 15 |
Hercules, Inc. | | 3,129 | | 61 |
Olin Corp. | | 714 | | 14 |
Zep, Inc. | | (a)541 | | 7 |
| | | | 97 |
Coal (1.0%) | | | | |
Alpha Natural Resources, Inc. | | (a)(c)1,393 | | 45 |
International Coal Group, Inc. | | (a)3,085 | | 17 |
Westmoreland Coal Co. | | (a)(c)166 | | $ | 2 |
| | | | 64 |
Commercial Information Services (0.2%) | | | | |
infoUSA, Inc. | | (c)1,377 | | 12 |
Communications & Media (0.2%) | | | | |
Martha Stewart Living Omnimedia, Inc., Class A | | (a)1,272 | | 12 |
Communications Technology (2.7%) | | | | |
Cbeyond, Inc. | | (a)(c)935 | | 36 |
CSG System International, Inc. | | (a)1,156 | | 17 |
Optium Corp. | | (a)2,288 | | 18 |
RealNetworks, Inc. | | (a)(c)4,551 | | 28 |
SAVVIS, Inc. | | (a)(c)574 | | 16 |
Smith Micro Software, Inc. | | (a)2,017 | | 17 |
Standard Micosystems Corp. | | (a)(c)572 | | 22 |
Tekelec | | (a)(c)1,001 | | 13 |
Utstarcom, Inc. | | (a)(c)3,139 | | 9 |
| | | | 176 |
Computer Services Software & Systems (8.9%) | | | | |
American Reprographics Co. | | (a)1,046 | | 17 |
Anixter International, Inc. | | (a)(c)524 | | 33 |
Bankrate, Inc. | | (a)367 | | 18 |
BluePhoenix Solutions Ltd. | | (a)993 | | 18 |
Brocade Communications Systems, Inc. | | (a)1,693 | | 12 |
CACI International, Inc., Class A | | (a)704 | | 31 |
COMSYS IT Partners, Inc. | | (a)(c)491 | | 8 |
Cray, Inc. | | (a)2,859 | | 17 |
Cybersource Corp. | | (a)951 | | 17 |
iGate Corp. | | (a)2,680 | | 23 |
Interactive Intelligence, Inc. | | (a)639 | | 17 |
JDA Software Group, Inc. | | (a)1,750 | | 36 |
Lionbridge Technologies | | (a)4,881 | | 17 |
Manhattan Associates, Inc. | | (a)1,993 | | 52 |
Mantech International Corp., Class A | | (a)393 | | 17 |
Mercury Computer Systems, Inc. | | (a)(c)531 | | 9 |
Midway Games, Inc. | | (a)6,024 | | 17 |
Ness Technologies, Inc. | | (a)(c)3,361 | | 31 |
Packeteer, Inc. | | (a)2,788 | | 17 |
Progress Software Corp. | | (a)1,434 | | 48 |
Schawk, Inc. | | (c)663 | | 10 |
SRA International, Inc., Class A | | (a)1,447 | | 43 |
Vignette Corp. | | (a)(c)2,683 | | 39 |
Wind River Systems, Inc. | | (a)4,552 | | 41 |
| | | | 588 |
Computer Technology (0.7%) | | | | |
Isilon Systems, Inc. | | (a)3,497 | | 18 |
Rackable Systems, Inc. | | (a)1,737 | | 17 |
Radisys Corp. | | (a)(c)807 | | 11 |
| | | | 46 |
Construction (0.2%) | | | | |
Granite Construction, Inc. | | 439 | | 16 |
Consumer Electronics (0.7%) | | | | |
InterNap Network Services Corp. | | (a)1,972 | | 17 |
ipass, Inc. | | (a)(c)6,968 | | 28 |
| | | | 45 |
| The accompanying notes are an integral part of the financial statements. | 121 |
2007 Annual Report | |
| |
December 31, 2007 | |
Portfolio of Investments (cont’d)
Systematic Active Small Cap Growth Portfolio
| | | | Value |
| | Shares | | (000) |
Consumer Products (0.2%) | | | | |
NutriSystem, Inc. | | (a)431 | | $ | 12 |
Consumer Staples — Miscellaneous (0.3%) | | | | |
AACO Brands Corp. | | (a)(c)573 | | 9 |
Jarden Corp. | | (a)343 | | 8 |
| | | | 17 |
Containers & Packaging: Paper & Plastic (0.9%) | | | | |
Silgan Holdings, Inc. | | 1,109 | | 58 |
Diversified (0.9%) | | | | |
Beacon Roofing Supply, Inc. | | (a)2,023 | | 17 |
Hudson Highland Group, Inc. | | (a)(c)4,835 | | 41 |
| | | | 58 |
Diversified Financial Services (1.2%) | | | | |
Clayton Holdings Inc | | (a)3,311 | | 17 |
Grubb & Ellis Co. | | 2,788 | | 18 |
Knight Capital Group, Inc., Class A | | (a)3,295 | | 47 |
| | | | 82 |
Drug & Grocery Store Chains (0.2%) | | | | |
Casey’s General Stores, Inc. | | (c)449 | | 13 |
Drugs & Pharmaceuticals (5.9%) | | | | |
Alkermes, Inc. | | (a)739 | | 11 |
Medicis Pharmaceuticals, Class A | | (c)916 | | 24 |
Nektar Therapeutics | | (a)2,599 | | 17 |
Obagi Medical Products, Inc. | | (a)649 | | 12 |
OSI Pharmaceuticals, Inc. | | (a)(c)1,843 | | 89 |
Perrigo Co. | | 2,533 | | 89 |
Pharmion Corp. | | (a)(c)1,406 | | 88 |
Salix Pharmaceuticals Ltd. | | (a)(c)3,893 | | 31 |
Valeant Pharmaceuticals International | | (a)(c)2,320 | | 28 |
| | | | 389 |
Education Services (0.7%) | | | | |
Corinthian Colleges, Inc. | | (a)2,827 | | 43 |
Electrical & Electronics (0.3%) | | | | |
TTM Technologies, Inc. | | (a)(c)1,781 | | 21 |
Electrical Equipment & Components (0.4%) | | | | |
RF Micro Devices, Inc. | | (a)(c)5,126 | | 29 |
Electronics (0.4%) | | | | |
Avid Technology, Inc. | | (a)(c)411 | | 11 |
Cypress Semiconductor Corp. | | (a)464 | | 17 |
| | | | 28 |
Electronics: Instruments Gauges & Meters (0.2%) | | | | |
Watts Water Technologies, Inc., Class A | | 372 | | 11 |
Electronics: Medical Systems (2.3%) | | | | |
Bruker BioSciences Corp. | | (a)(c)4,896 | | 65 |
Candela Corp. | | (a)(c)4,452 | | 25 |
Cynosure, Inc., Class A | | (a)432 | | 11 |
Natus Medical, Inc. | | (a)621 | | 12 |
TomoTherapy, Inc. | | (a)944 | | 19 |
Zoll Medical Corp. | | (a)726 | | 19 |
| | | | 151 |
Electronics: Semi-Conductors/Components (4.3%) | | | | |
Amkor Technology, Inc. | | (a)(c)3,582 | | 31 |
Benchmark Electronics, Inc. | | (a)(c)1,653 | | 29 |
DSP Group, Inc. | | (a)1,382 | | 17 |
Genesis Microchip, Inc. | | (a)(c)1,471 | | $ | 13 |
Ikanos Communications, Inc. | | (a)1,986 | | 11 |
IXYS Corp. | | (a)1,022 | | 8 |
Monolithic Power Systems, Inc. | | (a)815 | | 18 |
ON Semiconductor Corp. | | (a)(c)5,689 | | 50 |
Photon Dynamics, Inc. | | (a)(c)316 | | 3 |
Plexus Corp. | | (a)1,188 | | 31 |
Silicon Image, Inc. | | (a)3,617 | | 16 |
Skyworks Solutions, Inc. | | (a)(c)4,436 | | 38 |
Trident Microsystems, Inc. | | (a)2,801 | | 18 |
| | | | 283 |
Electronics: Technology (0.7%) | | | | |
Omnivision Technologies, Inc. | | (a)(c)2,204 | | 35 |
Secure Computing Corp. | | (a)1,367 | | 13 |
| | | | 48 |
Energy — Miscellaneous (1.9%) | | | | |
Alon USA Energy, Inc. | | (c)1,210 | | 33 |
Energy Partners Ltd. | | (a)(c)707 | | 8 |
Grey Wolf, Inc. | | (a)(c)5,913 | | 32 |
Helix Energy Solutions Group, Inc. | | (a)360 | | 15 |
Mariner Energy, Inc. | | (a)(c)1,141 | | 26 |
Swift Energy Co. | | (a)315 | | 14 |
| | | | 128 |
Entertainment (0.6%) | | | | |
Take-Two Interactive Software, Inc. | | (a)(c)2,245 | | 41 |
Finance Companies (0.3%) | | | | |
NewStar Financial, Inc. | | (a)2,001 | | 17 |
Financial Data Processing Services & Systems (0.5%) | | | | |
CompuCredit Corp. | | (a)1,702 | | 17 |
Online Resources Corp. | | (a)1,509 | | 18 |
| | | | 35 |
Financial — Miscellaneous (1.9%) | | | | |
Advanta Corp., Class B | | (c)3,580 | | 29 |
Credit Acceptance Corp. | | (a)861 | | 18 |
First Cash Financial Services, Inc. | | (a)1,142 | | 17 |
Global Cash Access Holdings, Inc. | | (a)2,775 | | 17 |
Harris & Harris Group, Inc. | | (a)1,285 | | 11 |
MoneyGram International, Inc. | | 1,131 | | 17 |
Nelnet, Inc., Class A | | 1,351 | | 17 |
| | | | 126 |
Forest Products (0.2%) | | | | |
Universal Forest Products, Inc. | | (c)379 | | 11 |
Health Care Facilities (1.3%) | | | | |
IRIS International, Inc. | | (a)592 | | 12 |
LCA-Vision, Inc. | | 568 | | 11 |
Psychiatric Solutions, Inc. | | (a)1,825 | | 59 |
VistaCare, Inc., Class A | | (a)(c)527 | | 4 |
| | | | 86 |
Health Care Management Services (0.6%) | | | | |
American Dental Partners, Inc. | | (a)3,263 | | 33 |
Centene Corp. | | (a)(c)253 | | 7 |
| | | | 40 |
122 | The accompanying notes are an integral part of the financial statements. | |
| 2007 Annual Report |
| |
| December 31, 2007 |
Portfolio of Investments (cont’d)
Systematic Active Small Cap Growth Portfolio
| | | | Value |
| | Shares | | (000) |
Health Care — Miscellaneous (0.1%) | | | | |
NBTY, Inc. | | (a)365 | | $ | 10 |
Health Care Services (1.4%) | | | | |
Amedisys, Inc. | | (a)(c)922 | | 45 |
Matria Healthcare, Inc. | | (a)(c)728 | | 17 |
Sunrise Senior Living, Inc. | | (a)(c)979 | | 30 |
| | | | 92 |
Homebuilding (0.7%) | | | | |
Brookfield Homes Corp. | | (c)1,128 | | 18 |
Gafisa S.A. ADR | | (a)322 | | 12 |
M/I Homes, Inc. | | (c)1,514 | | 16 |
| | | | 46 |
Hotel/Motel (0.2%) | | | | |
Home Inns & Hotels Management, Inc. ADR | | (a)337 | | 12 |
Household Furnishings (0.4%) | | | | |
American Woodmark Corp. | | (c)919 | | 17 |
Select Comfort Corp. | | (a)1,592 | | 11 |
| | | | 28 |
Industrial Products (0.7%) | | | �� | |
Castle (A.M.) & Co. | | (c)1,340 | | 37 |
Mueller Industries, Inc. | | 419 | | 12 |
| | | | 49 |
Insurance: Multi-Line (0.1%) | | | | |
Corvel Corp. | | (a)(c)276 | | 6 |
Investment Management Companies (0.7%) | | | | |
Evercore Partners, Inc., Class A | | 831 | | 18 |
Jefferies Group, Inc. | | 539 | | 12 |
US Global Investors, Inc., Class A | | 964 | | 16 |
| | | | 46 |
Leisure Time (0.3%) | | | | |
Premier Exhibitions, Inc. | | (a)1,040 | | 11 |
Town Sports International Holdings, Inc. | | (a)1,213 | | 12 |
| | | | 23 |
Machine Tools (0.2%) | | | | |
Regal-Beloit Corp. | | (c)304 | | 14 |
Machinery & Engineering (0.6%) | | | | |
Applied Industrial Technologies, Inc. | | (c)1,278 | | 37 |
Machinery: Construction & Handling (0.7%) | | | | |
Astec Industries, Inc. | | (a)1,326 | | 49 |
Machinery: Industrial/Specialty (0.3%) | | | | |
Columbus McKinnon Corp./NY | | (a)528 | | 17 |
Machinery: Oil Well Equipment & Services (1.3%) | | | | |
Complete Production Services, Inc. | | (a)2,298 | | 41 |
Gulf Island Fabrication, Inc. | | 366 | | 12 |
Oil States International, Inc. | | (a)350 | | 12 |
W-H Energy Services, Inc. | | (a)394 | | 22 |
| | | | 87 |
Machinery: Specialty (0.5%) | | | | |
Semitool, Inc. | | (a)(c)3,578 | | 31 |
Manufactured Housing (0.6%) | | | | |
Palm Harbor Homes, Inc. | | (a)(c)679 | | 7 |
Winnebago Industries, Inc. | | (c)1,456 | | $ | 31 |
| | | | 38 |
Manufacturing (2.2%) | | | | |
Actuant Corp., Class A | | (c)1,960 | | 67 |
Acuity Brands, Inc. | | (c)553 | | 25 |
Barnes Group, Inc. | | (c)1,206 | | 40 |
Smith (A.O.) Corp. | | (c)355 | | 12 |
| | | | 144 |
Medical & Dental Instruments & Supplies (3.7%) | | | | |
BioMimetic Therapeutics, Inc. | | (a)658 | | 12 |
Cutera, Inc. | | (a)753 | | 12 |
Inverness Medical Innovations, Inc. | | (a)816 | | 46 |
Lifecell Corp. | | (a)(c)1,954 | | 84 |
NuVasive, Inc. | | (a)285 | | 11 |
Somanetics Corp. | | (a)521 | | 12 |
Sonic Innovations, Inc. | | (a)(c)2,454 | | 19 |
Spectranetics Corp. | | (a)753 | | 12 |
West Pharmacetical Services | | 842 | | 34 |
| | | | 242 |
Medical Services (0.6%) | | | | |
Parexel International Corp. | | (a)(c)816 | | 39 |
Metal Fabricating (0.1%) | | | | |
Superior Essex, Inc. | | (a)392 | | 9 |
Metals & Minerals — Miscellaneous (0.4%) | | | | |
Brush Engineered Materials, Inc. | | (a)(c)704 | | 26 |
Office Furniture & Business Equipment (0.7%) | | | | |
Herman Miller, Inc. | | 1,237 | | 40 |
Kimball International, Inc., Class B | | 640 | | 9 |
| | | | 49 |
Offshore Drilling (0.1%) | | | | |
Hercules Offshore, Inc. | | (a)(c)231 | | 5 |
Oil: Crude Producers (1.0%) | | | | |
PetroHawk Energy Corp. | | (a)3,789 | | 66 |
Printing & Copying Services (0.3%) | | | | |
Consolidated Graphics, Inc. | | (a)459 | | 22 |
Production Technology Equipment (0.4%) | | | | |
Mattson Technology, Inc. | | (a)(c)3,320 | | 28 |
Real Estate Investment Trusts (REIT) (2.4%) | | | | |
Alexandria Real Estate Equities, Inc. | | 357 | | 36 |
Eastgroup Properties, Inc. | | (c)1,150 | | 48 |
Glimcher Realty Trust | | 1,174 | | 17 |
Kite Realty Group Trust | | (c)752 | | 12 |
Mid-America Apartment Communities, Inc. | | 510 | | 22 |
National Health Investors, Inc. | | (c)912 | | 25 |
| | | | 160 |
Restaurants (1.3%) | | | | |
BJ’s Restaurants, Inc. | | (a)707 | | 12 |
Jack In The Box, Inc. | | (a)1,284 | | 33 |
Ruby Tuesday, Inc. | | (c)3,910 | | 38 |
| | | | 83 |
Retail (8.3%) | | | | |
America’s Car-Mart, Inc. | | (a)(c)1,166 | | 14 |
Bon-Ton Stores, Inc. (The) | | 1,686 | | 16 |
| The accompanying notes are an integral part of the financial statements. | 123 |
2007 Annual Report | |
| |
December 31, 2007 | |
Portfolio of Investments (cont’d)
Systematic Active Small Cap Growth Portfolio
| | Shares | | Value
(000) |
Retail (cont’d) | | | | |
Brown Shoe Co., Inc. | | 1,576 | | $ | 24 |
Build-A-Bear Workshop, Inc. | | (a)(c)559 | | 8 |
Casual Male Retail Group, Inc. | | (a)2,253 | | 12 |
Central Garden & Pet Co. | | (a)(c)688 | | 4 |
Charlotte Russe Holding, Inc. | | (a)743 | | 12 |
Charming Shoppes, Inc. | | (a)(c)3,456 | | 19 |
Childrens Place Retail Stores, Inc. (The) | | (a)(c)1,617 | | 42 |
Citi Trends, Inc. | | (a)721 | | 11 |
CKE Restaurants, Inc. | | (c)2,464 | | 32 |
Collective Brands, Inc. | | (a)1,844 | | 32 |
Conn’s, Inc. | | (a)(c)879 | | 15 |
CSK Auto Corp. | | (a)2,522 | | 13 |
Ctrip.com International Ltd. ADR | | 207 | | 12 |
Dress Barn, Inc. | | (a)(c)870 | | 11 |
DSW, Inc., Class A | | (a)690 | | 13 |
HOT Topic, Inc. | | (a)2,066 | | 12 |
Jo-Ann Stores, Inc. | | (a)920 | | 12 |
MarineMax, Inc. | | (a)(c)447 | | 7 |
Morton’s Restaurant Group, Inc. | | (a)(c)2,054 | | 19 |
New York & Co., Inc. | | (a)(c)3,530 | | 22 |
Pantry, Inc. (The) | | (a)(c)1,175 | | 31 |
Priceline.com, Inc. | | (a)(c)1,000 | | 115 |
Retail Ventures, Inc. | | (a)2,496 | | 13 |
Triarc Companies, Inc., Class B | | 1,208 | | 10 |
World Fuel Services Corp. | | (c)644 | | 19 |
| | | | 550 |
Savings & Loan (0.2%) | | | | |
NewAlliance Bancshares, Inc. | | (c)1,424 | | 16 |
Securities Brokerage & Services (0.3%) | | | | |
Penson Worldwide, Inc. | | (a)1,227 | | 18 |
Services: Commercial (4.9%) | | | | |
Aaron Rents, Inc. | | (c)1,116 | | 21 |
Ambassadors International, Inc. | | 831 | | 12 |
AMN Healthcare Services, Inc. | | (a)(c)1,862 | | 32 |
Barrett Business Services | | (c)289 | | 5 |
Gevity HR, Inc. | | 2,014 | | 15 |
Global Sources Ltd. | | (a)381 | | 11 |
ICT Group, Inc. | | (a)1,491 | | 18 |
Kelly Services, Inc., Class A | | 1,565 | | 29 |
Kforce.com, Inc. | | (a)(c)3,857 | | 38 |
Live Nation, Inc. | | (a)(c)2,316 | | 34 |
MPS Group, Inc. | | (a)1,638 | | 18 |
Spherion Corp. | | (a)5,333 | | 39 |
Travelzoo, Inc. | | (a)1,245 | | 17 |
TrueBlue, Inc. | | (a)(c)2,454 | | 36 |
| | | | 325 |
Shipping (0.2%) | | | | |
American Commercial Lines, Inc. | | (a)706 | | 11 |
Shoes (0.2%) | | | | |
Shoe Carnival, Inc. | | (a)807 | | 11 |
Steel (0.3%) | | | | |
AK Steel Holding Corp. | | (a)445 | | 21 |
Telecommunications Equipment (1.0%) | | | | |
Arris Group, Inc. | | (a)4,155 | | 41 |
Symmetricom, Inc. | | (a)(c)4,577 | | $ | 22 | |
| | | | 63 | |
Textile Apparel Manufacturers (1.0%) | | | | | |
Quicksilver, Inc. | | (a)(c)3,028 | | 26 | |
Warnaco Group, Inc. (The) | | (a)1,146 | | 40 | |
| | | | 66 | |
Toys (0.1%) | | | | | |
Leapfrog Enterprises, Inc. | | (a)(c)1,169 | | 8 | |
Transportation — Miscellaneous (1.0%) | | | | | |
Celadon Group Inc. | | (a)1,960 | | 18 | |
Genco Shipping & Trading Ltd | | 219 | | 12 | |
Dynamex, Inc. | | (a)(c)273 | | 8 | |
Greenbrier Companies, Inc. | | (c)361 | | 8 | |
Pacer International, Inc. | | 1,110 | | 16 | |
| | | | 62 | |
Truckers (0.2%) | | | | | |
Old Dominion Freight Line, Inc. | | (a)(c)609 | | 14 | |
Utilities: Telecommunications (0.4%) | | | | | |
Centennial Communications Corp. | | (a)2,919 | | 27 | |
Wholesale & International Trade (0.6%) | | | | | |
Central European Distribution Corp. | | (a)(c)716 | | 42 | |
Wholesalers (0.1%) | | | | | |
WESCO International, Inc. | | (a)232 | | 9 | |
Total Common Stocks (Cost $6,384) | | | | 5,969 | |
| | Face | | | |
| | Amount | | | |
| | (000) | | | |
Short-Term Investments (43.2%) | | | | | |
Short-Term Debt Securities held as Collateral on Loaned Securities (30.0%) | | | |
Alliance & Leicester plc, | | | |
5.26%, 9/2/08 | | $ | (h)59 | | 59 | |
Bancaja, | | | | | |
5.35%, 8/12/08 | | 30 | | 30 | |
Bank of New York Co., Inc., | | | | | |
5.24%, 8/8/08 | | (h)30 | | 30 | |
BASF AG, | | | | | |
5.18%, 8/19/08 | | (h)30 | | 30 | |
BNP Paribas plc, | | | | | |
4.90%, 5/19/08 | | (h)59 | | 59 | |
CAM US Finance S.A. Unipersonal, | | | | | |
5.24%, 7/25/08 | | (h)118 | | 118 | |
Canadian Imperial Bank of Commerce, New York, | | | | | |
4.42%, 7/28/08 | | (h)59 | | 59 | |
CC USA, Inc., | | | | | |
3.89%, 1/28/08 | | (h)30 | | 30 | |
CIT Group Holdings, | | | | | |
5.23%, 6/18/08 | | (h)106 | | 106 | |
Citigroup Global Markets Holdings, Inc., | | | | | |
4.51%, 1/2/08 | | 403 | | 403 | |
Credit Suisse First Boston, New York, | | | | | |
4.32%, 3/14/08 | | (h)59 | | 59 | |
First Tennessee Bank, | | | | | |
5.05%, 8/15/08 | | (h)30 | | 30 | |
5.06%, 8/15/08 | | (h)118 | | 118 | |
| | | | | | | | | | | | | | |
124 | The accompanying notes are an integral part of the financial statements. | |
| 2007 Annual Report |
| |
| December 31, 2007 |
Portfolio of Investments (cont’d)
Systematic Active Small Cap Growth Portfolio
| | Face Amount
(000) | | Value
(000) |
Short-Term Debt Securities held as Collateral on Loaned Securities (cont’d) | | |
Goldman Sachs Group, Inc., | | |
4.62%, 2/13/09 | | $ | (h)56 | | $ | 56 |
5.10%, 9/12/08 | | (h)30 | | 30 |
HSBC Finance Corp., | | | | |
5.26%, 8/5/08 | | (h)30 | | 30 |
IBM Corp., | | | | |
5.27%, 9/8/08 | | (h)118 | | 118 |
Lehman Brothers, Inc., | | | | |
4.49%, 1/2/08 | | 50 | | 50 |
Macquarie Bank Ltd., | | | | |
4.95%, 8/20/08 | | (h)59 | | 59 |
Metropolitan Life Global Funding, | | | | |
4.89%, 8/21/08 | | (h)89 | | 89 |
National Bank of Canada, | | | | |
5.21%, 4/2/08 | | (h)118 | | 118 |
National Rural Utilities Cooperative Finance Corp., | | | | |
5.24%, 9/2/08 | | (h)118 | | 118 |
Nationwide Building Society, | | | | |
4.92%, 7/28/08 | | (h)69 | | 69 |
Unicredito Italiano Bank (Ireland) plc, | | | | |
5.04%, 8/14/08 | | (h)65 | | 65 |
5.26%, 8/8/08 | | (h)41 | | 41 |
| | | | 1,974 |
Investment Company (13.2%) | | | | |
Morgan Stanley Institutional Liquidity | | | | |
Money Market Portfolio —
Institutional Class | | (o)870,379 | | 870 |
Total Short-Term Investments (Cost $2,844) | | | | 2,844 |
Total Investments (133.8%) (Cost $9,228) —
Including $1,898 of Securities Loaned | | | | 8,813 |
Liabilities in Excess of Other Assets (-33.8%) | | | | (2,227) |
Net Assets (100%) | | | | $6,586 |
| | | | | | | |
(a) | Non-income producing security. |
(c) | All or a portion of security on loan at December 31, 2007. |
(h) | Variable/Floating Rate Security — Interest rate changes on these instruments are based on changes in a designated base rate. The rates shown are those in effect on December 31, 2007. |
(o) | See Note F within the Notes to Financial Statements regarding investment in Morgan Stanley Institutional Liquidity Money Market Portfolio — Institutional Class. |
ADR | American Depositary Receipt |
REIT | Real Estate Investment Trust |
Futures Contracts: | | | | | | | | |
The Portfolio had the following futures contract(s) open at period end: | | | | |
| | | | | | | | Net
Unrealized |
| | Number | | | | | | Appreciation |
| | of | | Value | | Expiration | | (Depreciation) |
| | Contracts | | (000) | | Date | | (000) |
Long: | | | | | | | | | | |
E-Mini Russell 2000 | | 6 | | $ 463 | | Mar-08 | | | $10 | |
| | | | | | | | | | |
| | | | | | | | | | | | | | | | | | |
| The accompanying notes are an integral part of the financial statements. | 125 |
2007 Annual Report | |
| |
December 31, 2007 | |
Investment Overview (unaudited)
Systematic Active Small Cap Value Portfolio
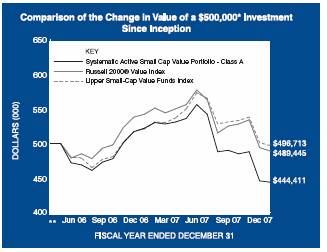
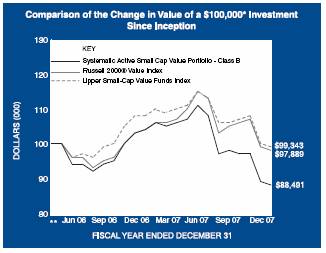
* Minimum Investment
* * Commenced operations on April 28, 2006
In accordance with SEC regulations, Portfolio’s performance shown assumes that all recurring fees (including management fees) were deducted and all dividends and distributions were reinvested. The performance of Class B shares will vary from the Class A shares and will be negatively impacted by additional fees assessed to this class.
Performance Compared to the Russell 2000® Value Index(1) and the Lipper Small-Cap Value Funds Index(2)
| | Total Returns(3) |
| | | Average Annual |
| | One
Year | Since
Inception(5) |
| | | | | |
Portfolio – Class A (4) | | (14.78 | )% | (6.79 | )% |
Russell 2000® Value Index | | (9.78 | ) | (1.26 | ) |
Lipper Small-Cap Value Funds Index | | (4.57 | ) | (0.39 | ) |
| | | | | |
Portfolio – Class B (4) | | (15.03 | ) | (7.03 | ) |
Russell 2000® Value Index | | (9.78 | ) | (1.26 | ) |
Lipper Small-Cap Value Funds Index | | (4.57 | ) | (0.39 | ) |
| | | | | | |
Performance data quoted represents past performance, which is no guarantee of future results, and current performance may be lower or higher than the figures shown. Performance assumes that all dividends and distributions, if any, were reinvested. For the most recent month-end performance figures, please visit www.morganstanley.com/msim. Investment return and principal value will fluctuate so that Portfolio shares, when redeemed, may be worth more or less than their original cost. Total returns do not reflect the deduction of taxes that a shareholder would pay on Portfolio distributions or the redemption of Portfolio shares.
(1) | | The Russell 2000® Value Index measures the performance of those companies in the Russell 2000® Index with lower price-to-book ratios and lower forecasted growth values. The Index is unmanaged and its returns do not include any sales charges or fees. Such costs would lower performance. It is not possible to invest directly in an index. |
(2) | | The Lipper Small-Cap Value Funds Index is an equally weighted performance index of the largest qualifying funds (based on net assets) in the Lipper Small-Cap Value Funds classification. The Index, which is adjusted for capital gains distributions and income dividends, is unmanaged and should not be considered an investment. There are currently 30 funds represented in this Index. As of the date of this report, the Portfolio is in the Lipper Small-Cap Value Funds classification. |
(3) | | Total returns for the Portfolio reflect fees waived and expenses reimbursed, if applicable, by the Adviser. Without such waivers and reimbursements, total returns would have been lower. Fee waivers and/or expense reimbursements are voluntary and the Adviser reserves the right to commence or terminate any waiver and/or reimbursement at any time. |
(4) | | Commenced operations on April 28, 2006 |
(5) | | For comparative purposes, average since inception returns listed for the Indexes refer to the inception date or initial offering of the respective share class of the Portfolio, not the inception of the Index. |
The Systematic Active Small Cap Value Portfolio (the “Portfolio”) seeks long-term capital appreciation by investing primarily in valued-oriented equity securities of small capitalization companies. Investments in small sized corporations are more vulnerable to financial risks and other risks than larger corporations and may involve a higher degree of price volatility than investments in the general equity markets.
Performance
For the year ended December 31, 2007, the Portfolio had a total return based on net asset value and reinvestment of
126
| 2007 Annual Report |
| |
| December 31, 2007 |
Investment Overview (cont’d)
Systematic Active Small Cap Value Portfolio
distributions per share of -14.78%, net of fees, for Class A shares and -15.03%, net of fees, for Class B shares. The Portfolio’s Class A and Class B shares underperformed against its benchmark, the Russell 2000® Value Index (the “Index”) which returned -9.78%.
Factors Affecting Performance
· The 12 months ended December 31, 2007 were characterized by pronounced volatility in stock prices, largely driven by credit market woes and deteriorating economic outlooks. By the third quarter, evidence mounted that the subprime market’s troubles spilled into the credit market and the broader economy. A tightening in credit standards, mortgage lender bankruptcies and hedge fund implosions were followed by multi-billion dollar losses reported at several large financial institutions in the fourth quarter. At the same time, a cross current of unfavorable data buffeted the market, indicating a languishing housing market, declining consumer spending, rising oil prices and negative year-over-year corporate profit growth. Although the market rallied each time the Federal Reserve’s (the “Fed”) reduced the target federal funds rate, skepticism quickly returned as investors worried that the Fed’s ability to steer the economy away from recession would be limited by rising inflation pressures. Fourth quarter corporate earnings expectations were dismal, with only the largest multi-national companies expected to generate growth. In this environment, large- cap equities outperformed small-caps, and growth beat value for the year overall.
· Based on total returns, the Portfolio’s best performing sectors were telecommunication services and health care. Financials and consumer discretionary were the weakest sector performers for the Portfolio during the period.
· The primary detractors from the Portfolio’s overall absolute return were the consumer discretionary and financials sectors. In the consumer discretionary sector, the Portfolio’s exposure to homebuilders and real estate- related companies hampered relative performance. In the financials sector, poor performance came from a wide range of holdings, due to their exposure to capital markets, mortgage lending or mortgage loan insurance, and/or investments in subprime mortgage backed securities.
· In contrast, the health care sector contributed positively to the Portfolio’s overall absolute return. Holdings in a generic drug manufacturer and a diagnostic devices maker performed well, owing to these companies’ strong earnings during the period.
· The Portfolio’s relative underperformance was driven by the consumer discretionary and financials sectors.
Management Strategies
· We believe that we can enhance returns by employing a quantitative model that uses multiple, independent factors to examine the fundamentals of a company. We further believe that our quantitative efforts in combination with our fundamental analysis can exploit market inefficiencies.
· We employ a quantitative approach to stock selection utilizing a proprietary quantitative model. The model is driven by rigorous fundamental and quantitative research that screens a universe of small capitalization companies. The model employs three quantitative screens based on the following primary inputs – earnings expectations, price trends and relative valuations. Individual securities and industries are ranked within each sector by the most effective combination of these disciplines based on the current phase of the economic cycle. We then decide whether to buy, sell or hold a security based on its fundamental analysis and the results of this model-driven approach.
· Accordingly, the stock selection process yielded an overweight positions in the health care and utilities sectors; underweight positions in the consumer discretionary, consumer staples, industrials, technology, materials and telecommunication services sectors; and market-weight positions in the energy and financials sectors.
Expense Examples
As a shareholder of the Portfolio, you may incur two types of costs: (1) transactional costs, including redemption fees; (2) ongoing costs, including management fees, shareholder servicing fees (in the case of Class B); and other Portfolio expenses. These examples are intended to help you understand your ongoing costs (in dollars) of investing in the Portfolio and to compare these costs with the ongoing costs of investing in other mutual funds.
The examples are based on an investment of $1,000 invested at the beginning of the six-month period ended December 31, 2007 and held for the entire six-month period.
Actual Expenses
The first line of the tables below provides information about actual account values and actual expenses. You may use the information in this line, together with the amount you invested, to estimate the expenses that you paid over the period. Simply divide your account value by $1,000 (for example, an $8,600 account value divided by $1,000 = 8.6),
127
2007 Annual Report | |
| |
December 31, 2007 | |
Investment Overview (cont’d)
Systematic Active Small Cap Value Portfolio
then multiply the result by the number in the first line under the heading entitled “Expenses Paid During Period” to estimate the expenses you paid on your account during this period.
Please note that “Expenses Paid During Period” are grossed up to reflect Portfolio expenses prior to the effect of Expense Offset (See Note E in the Notes to Financial Statements). Therefore, the annualized net expense ratios may differ from the ratio of the expenses to average net assets shown in the Financial Highlights.
Hypothetical Example for Comparison Purposes
The second line of the tables below provides information about hypothetical account values and hypothetical expenses based on the Portfolio’s actual expense ratio and an assumed rate of return of 5% per year before expenses, which is not the Portfolio’s actual return. The hypothetical account values and expenses may not be used to estimate the actual ending account balance or expenses you paid for the period. You may use this information to compare the ongoing costs of investing in the Portfolio and other funds. To do so, compare this 5% hypothetical example with the 5% hypothetical examples that appear in the shareholder reports of the other funds.
Please note that the expenses shown in the table are meant to highlight your ongoing costs only and do not reflect any transactional costs, such as redemption fees. Therefore, the second line of the table is useful in comparing ongoing costs only, and will not help you determine the relative total costs of owning different funds. In addition, if these transactional costs were included, your costs would have been higher.
| | | | | | Expenses Paid | | |
| | | | Ending | | | During Period* | | |
| | Beginning | | | Account Value | | | July 1, 2007 — | | |
| | Account Value | | | December 31, | | | December 31, | | |
| | July 1, 2007 | | | 2007 | | | 2007 | | |
Class A | | | | | | | |
Actual | | $1,000.00 | | $ 820.50 | | $5.00 | |
Hypothetical (5% average annual return before expenses) | | 1,000.00 | | 1,019.71 | | 5.55 | |
| | | | | | | |
Class B | | | | | | | |
Actual | | 1,000.00 | | 819.70 | | 6.15 | |
Hypothetical (5% average annual return before expenses) | | 1,000.00 | | 1,018.45 | | 6.82 | |
* Expenses are equal to Class A and Class B annualized net expense ratios of 1.09% and 1.34%, respectively, multiplied by the average account value over the period, multiplied by 184/365 (to reflect the one-half year period).
Graphic Presentation of Portfolio Holdings
The following graph depicts the Portfolio’s holdings by industry and/or security type, as a percentage of total investments.
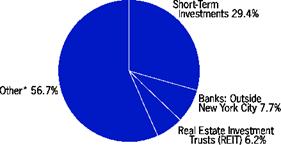
* | Industries which do not appear in the above graph, as well as those which represent less than 5% of total investments, if applicable, are included in the category labeled “Other”. |
128
| 2007 Annual Report |
| |
| December 31, 2007 |
Portfolio of Investments
Systematic Active Small Cap Value Portfolio
| | | | Value | |
| | Shares | | (000) | |
Common Stocks (94.5%) | | | | | |
Aerospace & Defense (0.2%) | | | | | |
Esterline Technologies Corp. | | (a)202 | | $ | 10 | |
Air Transport (1.2%) | | | | | |
Continental Airlines, Inc., Class B | | (a)507 | | 11 | |
ExpressJet Holdings, Inc. | | (a)3,148 | | 8 | |
PHI, Inc. | | (a)(c)1,056 | | 33 | |
Republic Airways Holdings, Inc. | | (a)795 | | 15 | |
| | | | 67 | |
Auto Parts: After Market (0.1%) | | | | | |
Commercial Vehicle Group, Inc. | | (a)553 | | 8 | |
Auto, Trucks & Parts (0.3%) | | | | | |
Modine Manufacturing Co. | | 695 | | 11 | |
Visteon Corp. | | (a)1,813 | | 8 | |
| | | | 19 | |
Automobiles (0.4%) | | | | | |
Navistar International Corp. | | (a)249 | | 13 | |
Wabash National Corp. | | 1,028 | | 8 | |
| | | | 21 | |
Banks: New York City (0.2%) | | | | | |
Signature Bank | | (a)311 | | 11 | |
Banks: Outside New York City (10.3%) | | | | | |
1st Source Corp. | | (c)614 | | 11 | |
Bancorp, Inc. | | (a)593 | | 8 | |
Banner Corp. | | (c)446 | | 13 | |
Cadence Financial Corp. | | (c)124 | | 2 | |
Capitol Bancorp Ltd. | | 529 | | 11 | |
Cascade Bancorp | | 560 | | 8 | |
Centennial Bank Holdings, Inc. | | (a)(c)4,353 | | 25 | |
Central Pacific Financial Corp. | | 2,125 | | 39 | |
Chemical Financial Corp. | | (c)1,388 | | 33 | |
Citizens First Bancorp, Inc. | | 1,103 | | 13 | |
First Bancorp | | (c)5,311 | | 39 | |
First Citizens BancShares, Inc., Class A | | 77 | | 11 | |
First Community Bancorp, Inc. | | (c)748 | | 31 | |
First Merchants Corp. | | (c)635 | | 14 | |
Franklin Bank Corp. | | (a)(c)3,113 | | 13 | |
Freemont General Corp. | | (a)(c)4,800 | | 17 | |
GB&T Bancshares, Inc. | | 1,892 | | 18 | |
Green Bankshares, Inc. | | 419 | | 8 | |
Hanmi Financial Corp. | | 1,227 | | 11 | |
Imperial Capital Bancorp, Inc. | | (c)711 | | 13 | |
Independent Bank Corp. | | 1,103 | | 10 | |
Irwin Financial Corp. | | (c)3,298 | | 24 | |
Macatawa Bank Corp. | | 895 | | 8 | |
MainSource Financial Group, Inc. | | (c)426 | | 7 | |
MBT Financial Corp. | | (c)326 | | 3 | |
Provident Bancshares Corp. | | (c)1,115 | | 24 | |
Royal Bancshares of Pennsylvania | | 875 | | 9 | |
Seacoast Banking Corporation of Florida | | 761 | | 8 | |
Security Bank Corp. | | (c)1,354 | | 12 | |
Simmons First National Corp., Class A | | (c)857 | | 23 | |
South Financial Group, Inc. (The) | | (c)787 | | 12 | |
Sun Bancorp, Inc. | | (a)(c)677 | | 11 | |
Susquehanna Bancshares, Inc. | | (c)2,522 | | 46 | |
Umpqua Holdings Corp. | | (c)1,192 | | $ | 18 | |
United Community Banks, Inc. | | 495 | | 8 | |
W Holding Co., Inc. | | (c)5,667 | | 7 | |
| | | | 568 | |
Biotechnology Research & Production (1.7%) | | | | | |
MannKind Corp. | | (a)982 | | 8 | |
Martek Biosciences Corp. | | (a)(c)1,269 | | 38 | |
Momenta Pharmaceuticals, Inc. | | (a)1,072 | | 8 | |
Neurocrine Biosciences, Inc. | | (a)1,748 | | 8 | |
Omrix Biopharmaceuticals, Inc. | | (a)303 | | 10 | |
PharmaNet Development Group, Inc. | | (a)(c)536 | | 21 | |
| | | | 93 | |
Building Materials (0.1%) | | | | | |
PGT, Inc. | | (a)1,629 | | 8 | |
Building — Miscellaneous (0.3%) | | | | | |
Builders FirstSource, Inc. | | (a)1,102 | | 8 | |
Trex Co., Inc. | | (a)902 | | 8 | |
| | | | 16 | |
Casinos & Gambling (0.1%) | | | | | |
Shuffle Master, Inc. | | (a)663 | | 8 | |
Chemicals (3.8%) | | | | | |
A. Schulman, Inc. | | 2,096 | | 45 | |
Albemarle Corp. | | 249 | | 10 | |
Cabot Microelectronics Corp. | | (a)284 | | 10 | |
Georgia Gulf Corp. | | (c)2,675 | | 18 | |
Minerals Technologies, Inc. | | 154 | | 10 | |
Olin Corp. | | 799 | | 16 | |
PolyOne Corp. | | (a)(c)3,368 | | 22 | |
Rockwood Holdings, Inc. | | (a)1,837 | | 61 | |
Symyx Technologies, Inc | | (a)1,289 | | 10 | |
Zep, Inc. | | (a)266 | | 4 | |
| | | | 206 | |
Coal (1.5%) | | | | | |
International Coal Group, Inc. | | (a)9,038 | | 48 | |
Massey Energy Co. | | 890 | | 32 | |
| | | | 80 | |
Communications & Media (0.1%) | | | | | |
Westwood One, Inc. | | 3,915 | | 8 | |
Communications Technology (1.5%) | | | | | |
Black Box Corp. | | 831 | | 30 | |
CommScope, Inc. | | (a)206 | | 10 | |
Ditech Networks, Inc. | | (a)2,235 | | 8 | |
Foundry Networks, Inc. | | (a)587 | | 10 | |
Optium Corp. | | (a)1,032 | | 8 | |
Utstarcom, Inc. | | (a)(c)6,453 | | 18 | |
| | | | 84 | |
Computer Services Software & Systems (2.7%) | | | | | |
Anixter International, Inc. | | (a)(c)254 | | 16 | |
Borland Software Corp. | | (a)(c)2,803 | | 8 | |
Internet Capital Group, Inc. | | (a)880 | | 10 | |
JDA Software Group, Inc. | | (a)1,357 | | 28 | |
Lawson Software | | (a)1,018 | | 10 | |
| | | | | | | |
The accompanying notes are an integral part of the financial statements. | 129 |
2007 Annual Report | |
| |
December 31, 2007 | |
Portfolio of Investments (cont’d)
Systematic Active Small Cap Value Portfolio
| | Shares | | Value
(000) | |
Computer Services Software & Systems (cont’d) | | | | | |
Openwave Systems, Inc. | | 2,958 | | $ | 8 | |
Perot Systems Corp., Class A | | (a)3,768 | | 51 | |
Schawk, Inc. | | 1,162 | | 18 | |
| | | | 149 | |
Computer Technology (1.1%) | | | | | |
Hutchinson Technology, Inc. | | (a)242 | | 6 | |
Imation Corp. | | (c)1,323 | | 28 | |
Palm, Inc. | | (c)2,657 | | 17 | |
Quantum Corp. | | (a)616 | | 2 | |
Rackable Systems, Inc. | | (a)809 | | 8 | |
| | | | 61 | |
Consumer Electronics (0.4%) | | | | | |
Earthlink, Inc. | | (a)1,477 | | 11 | |
Infospace, Inc. | | 555 | | 10 | |
| | | | 21 | |
Consumer Staples — Miscellaneous (0.4%) | | | | | |
Spectrum Brands, Inc. | | (a)1,936 | | 10 | |
Jarden Corp. | | (a)398 | | 9 | |
| | | | 19 | |
Diversified (0.4%) | | | | | |
Hudson Highland Group, Inc. | | (a)(c)1,695 | | 14 | |
Beacon Roofing Supply, Inc. | | (a)925 | | 8 | |
| | | | 22 | |
Diversified Financial Services (0.6%) | | | | | |
Clayton Holdings, Inc. | | (a)2,311 | | 12 | |
Knight Capital Group, Inc., Class A | | (a)1,503 | | 22 | |
| | | | 34 | |
Drug & Grocery Store Chains (0.6%) | | | | | |
Casey’s General Stores, Inc. | | 1,097 | | 33 | |
Drugs & Pharmaceuticals (1.4%) | | | | | |
Noven Pharmaceuticals, Inc. | | (a)548 | | 8 | |
Perrigo Co. | | 1,928 | | 67 | |
| | | | 75 | |
Electrical Equipment & Components (0.4%) | | | | | |
Belden, Inc. | | 233 | | 10 | |
Genlyte Group, Inc. | | (a)110 | | 11 | |
| | | | 21 | |
Electronics (0.8%) | | | | | |
Avid Technology, Inc. | | (a)(c)1,021 | | 29 | |
Methode Electonics, Inc. | | 268 | | 4 | |
OSI Systems, Inc. | | (a)403 | | 11 | |
| | | | 44 | |
Electronics: Instruments Gauges & Meters (0.2%) | | | | | |
PerkinElmer, Inc. | | (a)401 | | 10 | |
Electronics: Medical Systems (0.4%) | | | | | |
Analogic Corp. | | 151 | | 10 | |
Zoll Medical Corp. | | (a)396 | | 11 | |
| | | | 21 | |
Electronics: Semi-Conductors/Components (3.4%) | | | | | |
Benchmark Electronics, Inc. | | (a)2,332 | | 41 | |
Conexant Systems, Inc. | | (a)(c)27,031 | | 22 | |
Cubic Corp. | | (c)604 | | $ | 24 | |
Genesis Microchip, Inc. | | (a)785 | | 7 | |
Microsemi Corp. | | (a)471 | | 10 | |
Powerwave Technologies, Inc. | | (a)(c)2,758 | | 11 | |
Silicon Image, Inc. | | (a)1,707 | | 8 | |
Silicon Storage Technology | | (a)(c)6,691 | | 20 | |
Spansion Inc., Class A | | (a)1,972 | | 8 | |
Syntax-Brillian Corp. | | (a)2,597 | | 8 | |
Technitrol, Inc. | | 874 | | 25 | |
| | | | 184 | |
Electronics: Technology (0.9%) | | | | | |
Checkpoint Systems, Inc. | | (a)1,550 | | 40 | |
Cogent Communications Group, Inc. | | (a)(c)513 | | 12 | |
| | | | 52 | |
Energy — Miscellaneous (1.8%) | | | | | |
Callon Petroleum Co. | | (a)3,541 | | 59 | |
Crosstex Energy, Inc. | | 277 | | 10 | |
Energy Partners Ltd. | | (a)867 | | 11 | |
GeoMet, Inc. | | (a)2,010 | | 10 | |
Pacific Ethanol, Inc. | | (a)1,218 | | 10 | |
| | | | 100 | |
Energy Equipment (0.4%) | | | | | |
Allis-Chalmers Energy, Inc. | | (a)696 | | 10 | |
Superior Energy Services, Inc. | | (a)305 | | 11 | |
| | | | 21 | |
Engineering & Contracting Services (0.9%) | | | | | |
Emcor Group, Inc. | | (a)1,980 | | 47 | |
Entertainment (1.3%) | | | | | |
Bluegreen Corp. | | (a)(c)3,238 | | 23 | |
Carmike Cinemas | | 2,157 | | 16 | |
Six Flags, Inc. | | (a)3,820 | | 8 | |
Take-Two Interactive Software, Inc. | | (a)(c)1,387 | | 25 | |
| | | | 72 | |
Equipment — Miscellaneous (0.2%) | | | | | |
Helix Energy Solutions Group, Inc. | | (a)255 | | 11 | |
Finance Companies (0.3%) | | | | | |
MCG Capital Corp. | | (c)944 | | 11 | |
NewStar Financial, Inc. | | (a)897 | | 7 | |
| | | | 18 | |
Financial — Miscellaneous (3.4%) | | | | | |
Advanta Corp., Class B | | (c)2,217 | | 18 | |
Aspen Insurance Holdings, Ltd. | | 1,271 | | 37 | |
CBIZ, Inc. | | (a)1,079 | | 11 | |
Deluxe Corp. | | 1,115 | | 37 | |
Endurance Specialty Holdings Ltd. | | (c)620 | | 26 | |
Global Cash Access Holdings | | (a)1,247 | | 8 | |
Nelnet, Inc., Class A | | 809 | | 10 | |
Ocwen Financial Corp. | | (a)1,890 | | 10 | |
RAM Holdings Ltd. | | (a)2,094 | | 10 | |
Security Capital Assurance Ltd. | | 2,649 | | 10 | |
Triad Guaranty, Inc. | | (a)1,055 | | 10 | |
| | | | 187 | |
| | | | | | | |
130 | The accompanying notes are an integral part of the financial statements. |
| 2007 Annual Report |
| |
| December 31, 2007 |
Portfolio of Investments (cont’d)
Systematic Active Small Cap Value Portfolio
| | | | Value | |
| | Shares | | (000) | |
Financial Data Processing Services & Systems (0.4%) | | | | | |
CompuCredit Corp. | | (a)1,093 | | $ | 11 | |
ExlService Holdings, Inc. | | (a)461 | | 11 | |
| | | | 22 | |
Foods (0.4%) | | | | | |
Del Monte Foods Co. | | 1,201 | | 11 | |
Ralcorp Holdings, Inc. | | (a)158 | | 10 | |
| | | | 21 | |
Health Care Management Services (0.1%) | | | | | |
American Dental Partners, Inc. | | (a)787 | | 8 | |
Health Care Services (1.2%) | | | | | |
AMERIGROUP Corp. | | (a)1,084 | | 40 | |
Emeritus Corp. | | (a)424 | | 11 | |
Odyssey HealthCare, Inc. | | (a)1,210 | | 13 | |
| | | | 64 | |
Homebuilding (1.9%) | | | | | |
Amrep Corp. | | 262 | | 8 | |
Beazer Homes USA, Inc. | | (c)1,938 | | 14 | |
Brookfield Homes Corp. | | 499 | | 8 | |
Hovnanian Enterprises, Inc., Class A | | (a)3,150 | | 23 | |
M/I Homes, Inc. | | 779 | | 8 | |
Meritage Homes Corp. | | (a)(c)1,466 | | 21 | |
Orleans Homebuilders, Inc. | | (c)295 | | 1 | |
Standard Pacific Corp. | | 2,392 | | 8 | |
TOUSA, Inc. | | (a)(c)297 | | @— | |
WCI Communities, Inc. | | (a)(c)3,296 | | 13 | |
| | | | 104 | |
Household Furnishings (0.6%) | | | | | |
American Woodmark Corp. | | 403 | | 7 | |
La-Z-Boy, Inc. | | (c)2,447 | | 19 | |
Select Comfort Corp. | | (a)1,100 | | 8 | |
| | | | 34 | |
Identification Control & Filter Devices (0.1%) | | | | | |
Asyst Technologies, Inc. | | (a)2,482 | | 8 | |
Industrial Products (1.2%) | | | | | |
Castle (A.M.) & Co. | | (c)1,070 | | 29 | |
Commercial Metals Co. | | 406 | | 12 | |
Mueller Industries, Inc. | | 943 | | 27 | |
| | | | 68 | |
Insurance: Life (0.2%) | | | | | |
American Equity Investment Life Holding Co. | | (c)123 | | 1 | |
Conseco, Inc. | | (a)669 | | 8 | |
| | | | 9 | |
Insurance: Multi-Line (0.3%) | | | | | |
Hanover Insurance Group, Inc. (The) | | 298 | | 14 | |
Insurance: Property & Casualty (0.8%) | | | | | |
First Acceptance Corp. | | (a)2,516 | | 11 | |
First Mercury Financial Corp. | | (a)442 | | 11 | |
LandAmerica Financial Group, Inc. | | (c)735 | | 24 | |
| | | | 46 | |
Investment Management Companies (3.3%) | | | | | |
Apollo Investment Corp. | | (c)3,350 | | 57 | |
Cowen Group, Inc. | | (a)785 | | 8 | |
Friedman Billings Ramsey Group, Inc., Class A | | (c)7,781 | | $ | 24 | |
Investment Technology Group, Inc. | | (a)221 | | 11 | |
KKR Financial Holdings LLC | | 599 | | 8 | |
National Financial Partners Corp. | | 226 | | 10 | |
Piper Jaffray Cos. | | (a)(c)710 | | 33 | |
SWS Group, Inc. | | 608 | | 8 | |
W.P. Stewart & Co Limited | | 2,159 | | 11 | |
Waddell & Reed Financial, Inc. | | 285 | | 10 | |
| | | | 180 | |
Leisure Time (0.1%) | | | | | |
Nautilus, Inc. | | 1,546 | | 8 | |
Machine Tools (0.6%) | | | | | |
Regal-Beloit Corp. | | (c)749 | | 34 | |
Machinery: Engines (0.7%) | | | | | |
Briggs & Stratton Corp. | | (c)1,813 | | 41 | |
Machinery: Industrial/Specialty (0.2%) | | | | | |
Kadant, Inc. | | (a)336 | | 10 | |
Machinery: Oil Well Equipment & Services (0.1%) | | | | | |
Parker Drilling Co. | | (a)(c)985 | | 7 | |
Manufacturing (1.2%) | | | | | |
Actuant Corp., Class A | | 303 | | 10 | |
Griffon Corp. | | (a)2,019 | | 25 | |
Koppers Holdings, Inc. | | 610 | | 27 | |
Standex International Corp. | | 213 | | 4 | |
| | | | 66 | |
Materials & Processing — Miscellaneous (0.2%) | | | | | |
USEC, Inc. | | (a)1,162 | | 10 | |
Medical & Dental Instruments & Supplies (1.2%) | | | | | |
Inverness Medical Innovations, Inc. | | (a)797 | | 46 | |
Orthofix International N.V. | | (a)178 | | 10 | |
Wright Medical Group, Inc. | | (a)355 | | 10 | |
| | | | 66 | |
Metal Fabricating (0.3%) | | | | | |
Superior Essex, Inc. | | (a)704 | | 17 | |
Milling: Fruit & Grain Processing (0.2%) | | | | | |
MGP Ingredients, Inc. | | 1,093 | | 10 | |
Multi-Sector Companies (0.6%) | | | | | |
Kaman Corp. | | 924 | | 34 | |
Office Furniture & Business Equipment (0.7%) | | | | | |
IKON Office Solutions, Inc. | | (c)2,869 | | 37 | |
Oil: Crude Producers (2.0%) | | | | | |
Bronco Drilling Co., Inc. | | (a)(c)2,582 | | 39 | |
Cimarex Energy Co. | | 286 | | 12 | |
Comstock Resources, Inc. | | (a)301 | | 10 | |
Edge Petroleum Corp. | | (a)1,735 | | 10 | |
Frontier Oil Corp. | | 255 | | 10 | |
Stone Energy Corp. | | (a)629 | | 30 | |
| | | | 111 | |
Paper (1.3%) | | | | | |
AbitibiBowater, Inc. | | (c)853 | | 18 | |
Caraustar Industries, Inc. | | (a)(c)4,172 | | 13 | |
Chesapeake Corp. | | 3,143 | | 16 | |
Rock-Tenn Co., Class A | | 1,045 | | 26 | |
| | | | 73 | |
The accompanying notes are an integral part of the financial statements. | 131 |
2007 Annual Report | |
| |
December 31, 2007 | |
Portfolio of Investments (cont’d)
Systematic Active Small Cap Value Portfolio
| | | | Value | |
| | Shares | | (000) | |
Pollution Control & Environmental Services (1.1%) | | | | | |
Aventine Renewable Energy Holdings, Inc. | | (a)830 | | $ | 11 | |
Metal Management, Inc. | | (c)1,089 | | 49 | |
| | | | 60 | |
Production Technology Equipment (0.5%) | | | | | |
Photronics, Inc. | | (a)(c)2,197 | | 27 | |
Publishing: Newspapers (0.3%) | | | | | |
Lee Enterprises, Inc. | | 541 | | 8 | |
Sun-Times Media Group, Inc. | | (a)3,407 | | 7 | |
| | | | 15 | |
Radio & TV Broadcasters (0.3%) | | | | | |
Radio One, Inc., Class D | | (a)3,392 | | 8 | |
Valuevision Media, Inc., Class A | | (a)1,267 | | 8 | |
| | | | 16 | |
Railroad Equipment (0.1%) | | | | | |
Freightcar America, Inc. | | (c)187 | | 7 | |
Real Estate (0.1%) | | | | | |
Avatar Holdings, Inc. | | (a)199 | | 8 | |
Real Estate Investment Trusts (REIT) (8.3%) | | | | | |
Alesco Financial, Inc. REIT | | 3,199 | | 10 | |
American Financial Realty Trust REIT | | 4,675 | | 37 | |
Anworth Mortgage Asset Corp. REIT | | 1,472 | | 12 | |
Ashford Hospitality Trust, Inc. REIT | | 1,190 | | 9 | |
CBRE Realty Finance, Inc. REIT | | 1,847 | | 10 | |
Crystal River Capital, Inc. REIT | | (c)1,354 | | 19 | |
Deerfield Capital Corp. REIT | | (c)2,824 | | 23 | |
Entertainment Properties Trust REIT | | 1,109 | | 52 | |
First Industrial Realty Trust REIT | | (c)894 | | 31 | |
GMH Communities Trust REIT | | 4,103 | | 23 | |
Healthcare Realty Trust, Inc. REIT | | (c)1,443 | | 37 | |
Lexington Realty Trust REIT | | (c)2,929 | | 43 | |
Luminent Mortgage Capital, Inc. REIT | | (c)4,340 | | 3 | |
National Retail Properties REIT | | (c)2,061 | | 48 | |
Newcastle Investment Corp. REIT | | 802 | | 10 | |
Novastar Financial, Inc. REIT | | (a)3,497 | | 10 | |
Pennsylvania Real Estate Investment Trust REIT | | (c)1,182 | | 35 | |
RAIT Investment Trust REIT | | (c)1,279 | | 11 | |
Resource Capital Corp. REIT | | (c)2,019 | | 19 | |
Tarragon Corp. | | (a)5,282 | | 8 | |
U-Store-It Trust REIT | | 850 | | 8 | |
| | | | 458 | |
Rental & Leasing Services: Consumer (0.4%) | | | | | |
Dollar Thrifty Automotive Group | | (a)(c)715 | | 17 | |
Rent-A-Center, Inc. | | (a)531 | | 8 | |
| | | | 25 | |
Restaurants (0.9%) | | | | | |
Bob Evans Farms, Inc. | | (c)943 | | 25 | |
Jamba, Inc. | | (a)2,082 | | 8 | |
McCormick & Schmick’s Seafood Restaurants, Inc. | | (a)656 | | 8 | |
Ruby Tuesday, Inc. | | 824 | | 8 | |
| | | | 49 | |
Retail (5.6%) | | | | | |
AC Moore Arts & Crafts, Inc. | | (a)(c)959 | | 13 | |
Bon-Ton Stores, Inc. (The) | | (c)1,749 | | 17 | |
Borders Group, Inc. | | (c)2,443 | | $ | 26 | |
Cache, Inc. | | (a)793 | | 7 | |
Casual Male Retail Group, Inc. | | (a)1,476 | | 8 | |
Central Garden & Pet Co. | | (a)(c)2,934 | | 17 | |
Central Garden & Pet Co., Class A | | (a)2,162 | | 12 | |
Charming Shoppes, Inc. | | (a)(c)3,465 | | 19 | |
Childrens Place Retail Stores, Inc. (The) | | (a)305 | | 8 | |
Conn’s, Inc. | | (a)(c)533 | | 9 | |
CSK Auto Corp. | | (a)1,636 | | 8 | |
Group 1 Automotive, Inc. | | 331 | | 8 | |
HOT Topic, Inc. | | (a)1,361 | | 8 | |
Landry’s Seafood Restaurants | | (c)1,828 | | 36 | |
Lithia Motors, Inc., Class A | | 590 | | 8 | |
MarineMax, Inc. | | (a)(c)534 | | 8 | |
Pantry, Inc. (The) | | (a)(c)832 | | 22 | |
Stein Mart, Inc. | | (c)4,662 | | 22 | |
Triarc Companies, Inc., Class B | | 864 | | 7 | |
Tuesday Morning Corp. | | 1,577 | | 8 | |
Wet Seal, Inc. (The), Class A | | (a)3,320 | | 8 | |
World Fuel Services Corp. | | 362 | | 10 | |
Zale Corp. | | (a)(c)1,095 | | 18 | |
| | | | 307 | |
Savings & Loan (2.8%) | | | | | |
BankAtlantic Bancorp, Inc., Class A | | 2,451 | | 10 | |
BankUnited Financial Corp., Class A | | 1,536 | | 11 | |
Berkshire Hills Bancorp, Inc. | | 147 | | 4 | |
BFC Financial Corp., Class A | | (a)1,004 | | 1 | |
Brookline Bancorp, Inc. | | (c)2,628 | | 26 | |
Downey Financial Corp. | | (c)989 | | 31 | |
Flagstar Bancorp, Inc. | | (c)2,695 | | 19 | |
NewAlliance Bancshares, Inc. | | (c)2,343 | | 27 | |
PFF Bancorp, Inc. | | 883 | | 11 | |
United Community Financial Corp. | | 1,954 | | 11 | |
| | | | 151 | |
Securities Brokerage & Services (0.1%) | | | | | |
Penson Worldwide, Inc. | | (a)573 | | 8 | |
Services: Commercial (2.8%) | | | | | |
Ambassadors International, Inc. | | 578 | | 8 | |
Autobytel, Inc. | | (a)1,160 | | 3 | |
BearingPoint, Inc. | | (a)2,790 | | 8 | |
Corrections Corp. Of America | | (a)360 | | 11 | |
Gevity HR, Inc. | | 972 | | 7 | |
ICT Group, Inc. | | (a)660 | | 8 | |
Kelly Services, Inc., Class A | | 953 | | 18 | |
Live Nation, Inc. | | (a)(c)1,619 | | 24 | |
Maximus, Inc. | | (c)515 | | 20 | |
MPS Group, Inc. | | (a)2,000 | | 22 | |
Source Interlink Cos., Inc. | | (a)(c)5,312 | | 15 | |
Volt Information Sciences, Inc. | | (a)432 | | 8 | |
| | | | 152 | |
Shoes (0.3%) | | | | | |
Finish Line, Class A | | (c)1,487 | | 4 | |
Shoe Carnival, Inc. | | (a)(c)1,070 | | 15 | |
| | | | 19 | |
| | | | | | | |
132 | The accompanying notes are an integral part of the financial statements. |
| 2007 Annual Report |
| |
| December 31, 2007 |
Portfolio of Investments (cont’d)
Systematic Active Small Cap Value Portfolio
| | | | Value | |
| | Shares | | (000) | |
Steel (0.3%) | | | | | |
Esmark, Inc. | | (a)(c)421 | | $ | 6 | |
Shiloh Industries, Inc. | | (a)1,219 | | 12 | |
| | | | 18 | |
Technology — Miscellaneous (0.2%) | | | | | |
L-1 Identity Solutions, Inc. | | (a)575 | | 10 | |
Textile Apparel Manufacturers (0.8%) | | | | | |
Kellwood Co. | | (c)1,899 | | 32 | |
Oxford Industries, Inc. | | (c)171 | | 4 | |
Perry Ellis International, Inc. | | (a)429 | | 7 | |
| | | | 43 | |
Tobacco (0.1%) | | | | | |
Alliance One International, Inc. | | (a)(c)1,252 | | 5 | |
Transportation — Miscellaneous (0.4%) | | | | | |
Pacer International, Inc. | | 531 | | 8 | |
Saia, Inc. | | (a)994 | | 13 | |
| | | | 21 | |
Truckers (0.3%) | | | | | |
PAM Transportation Services | | (a)267 | | 4 | |
YRC Worldwide, Inc. | | (a)(c)772 | | 13 | |
| | | | 17 | |
Utilities: Electrical (2.1%) | | | | | |
CH Energy Group, Inc. | | (c)503 | | 23 | |
El Paso Electric Co. | | (a)1,312 | | 34 | |
Empire District Electric Co. (The) | | (c)266 | | 6 | |
PNM Resources, Inc. | | 1,790 | | 38 | |
Unisource Energy Corp. | | 415 | | 13 | |
| | | | 114 | |
Utilities: Gas Distributors (0.9%) | | | | | |
Laclede Group, Inc. (The) | | (c)698 | | 24 | |
NorthWestern Corp. | | 860 | | 25 | |
| | | | 49 | |
Utilities: Telecommunications (0.9%) | | | | | |
Rural Cellular Corp., Class A | | (a)1,066 | | 47 | |
Wholesale & International Trade (0.2%) | | | | | |
Central European Distribution Corp. | | (a)177 | | 10 | |
Wholesalers (1.0%) | | | | | |
BlueLinx Holdings, Inc. | | (c)2,766 | | 11 | |
Building Material Holding Corp. | | (c)2,602 | | 14 | |
United Stationers, Inc. | | (a)603 | | 28 | |
| | | | 53 | |
Total Common Stocks (Cost $6,531) | | | | 5,200 | |
| | Face | | | |
| | Amount
(000) | | | |
Short-Term Investments (39.3%) | | | | | |
Short-Term Debt Securities held as Collateral on Loaned Securities (34.7%) | | | | | |
Alliance & Leicester plc, | | | | | |
5.26%, 9/2/08 | | $ | (h)57 | | 57 | |
Bancaja, | | | | | |
5.35%, 8/12/08 | | 29 | | 29 | |
| | | | | | | |
| | | | Value | |
| | Shares | | (000) | |
Bank of New York Co., Inc., | | | | | |
5.24%, 8/8/08 | | $ | (h)29 | | $ | 29 | |
BASF AG, | | | | | |
5.18%, 8/19/08 | | (h)29 | | 29 | |
BNP Paribas plc, | | | | | |
4.90%, 5/19/08 | | (h)57 | | 57 | |
CAM US Finance S.A. Unipersonal, | | | | | |
5.24%, 7/25/08 | | (h)114 | | 114 | |
Canadian Imperial Bank of Commerce, New York, | | | | | |
4.42%, 7/28/08 | | (h)57 | | 57 | |
CC USA, Inc., | | | | | |
3.89%, 1/28/08 | | (h)29 | | 29 | |
CIT Group Holdings, | | | | | |
5.23%, 6/18/08 | | (h)103 | | 103 | |
Citigroup Global Markets Holdings, Inc., | | | | | |
4.51%, 1/2/08 | | 390 | | 390 | |
Credit Suisse First Boston, New York, | | | | | |
4.32%, 3/14/08 | | (h)57 | | 57 | |
First Tennessee Bank, | | | | | |
5.05%, 8/15/08 | | (h)29 | | 29 | |
5.06%, 8/15/08 | | (h)115 | | 115 | |
Goldman Sachs Group, Inc., | | | | | |
4.62%, 2/13/09 | | (h)54 | | 54 | |
5.10%, 9/12/08 | | (h)29 | | 29 | |
HSBC Finance Corp., | | | | | |
5.26%, 8/5/08 | | (h)29 | | 29 | |
IBM Corp., | | | | | |
5.27%, 9/8/08 | | (h)114 | | 114 | |
Lehman Brothers, Inc., | | | | | |
4.49%, 1/2/08 | | 49 | | 49 | |
Macquarie Bank Ltd., | | | | | |
4.95%, 8/20/08 | | (h)57 | | 57 | |
Metropolitan Life Global Funding, | | | | | |
4.89%, 8/21/08 | | (h)86 | | 86 | |
National Bank of Canada, | | | | | |
5.21%, 4/2/08 | | (h)115 | | 115 | |
National Rural Utilities Cooperative Finance Corp., | | | | | |
5.24%, 9/2/08 | | (h)114 | | 114 | |
Nationwide Building Society, | | | | | |
4.92%, 7/28/08 | | (h)66 | | 66 | |
Unicredito Italiano Bank (Ireland) plc, | | | | | |
5.04%, 8/14/08 | | (h)63 | | 63 | |
5.26%, 8/8/08 | | (h)40 | | 40 | |
| | | | 1,911 | |
| | Shares | | | |
Investment Company (4.6%) | | | | | |
Morgan Stanley Institutional Liquidity | | | | | |
Money Market Portfolio - Institutional Class | | (o)249,800 | | 250 | |
Total Short-Term Investments (Cost $2,161) | | | | 2,161 | |
Total Investments (133.8%) (Cost $8,692) | | | | | |
— including $1,802 of Securities Loaned | | | | 7,361 | |
Liabilities in Excess of Other Assets (-33.8%) | | | | (1,861) | |
Net Assets (100%) | | | | $ | 5,500 | |
| | | | | | | |
| The accompanying notes are an integral part of the financial statements. | 133 |
2007 Annual Report | |
| |
December 31, 2007 | |
Portfolio of Investments (cont’d)
Systematic Active Small Cap Value Portfolio
(a) | Non-income producing security. |
(c) | All or a portion of security on loan at December 31,2007. |
(h) | Variable/Floating Rate Security — Interest rate changes on these instruments are based on changes in a designated base rate. The rates shown are those in effect on December 31, 2007. |
(o) | See Note F within the Notes to Financial Statements regarding investment in Morgan Stanley Institutional Liquidity Money Market Portfolio — Institutional Class. |
@ | Value is less than $500 |
REIT | Real Estate Investment Trust |
The Portfolio had the following futures contract(s) open at period end: | |
| | Number
of
Contracts | | Value
(000) | | Expiration
Date | | Net
Unrealized
Appreciation
(Depreciation)
(000) | |
Long: | | | | | | | | | |
E-Mini Russell 2000 | | 3 | | $ 232 | | Mar-08 | | | $ | 5 | | |
| | | | | | | | | |
| | | | | | | | | | | | |
134 | The accompanying notes are an integral part of the financial statements. |
2007 Annual Report
December 31, 2007
Investment Overview (unaudited)
Systematic Large Cap Core Active Extension Portfolio
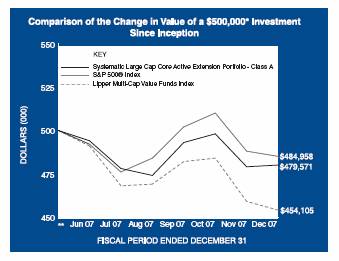
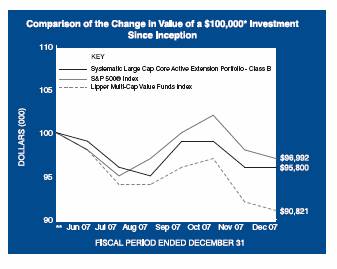
* Minimum Investment
** Commenced operations on May 31, 2007
In accordance with SEC regulations, Portfolio’s performance shown assumes that all recurring fees (including management fees) were deducted and all dividends and distributions were reinvested. The performance of Class B shares will vary from the Class A shares and will be negatively impacted by additional fees assessed to this class.
Performance Compared to the S&P 500® Index(1) and the Lipper Multi-Cap Value Funds Index(2)
| | Total Returns | (3) |
| | Cumulative |
| | Since | |
| | Inception | (5) |
| | | |
Portfolio – Class A (4) | | (4.09 | )% |
S&P 500® Index | | (3.01 | ) |
Lipper Multi-Cap Value Funds Index | | (9.18 | ) |
| | | |
Portfolio – Class B (4) | | (4.20 | ) |
S&P 500® Index | | (3.01 | ) |
Lipper Multi-Cap Value Funds Index | | (9.18 | ) |
Performance data quoted represents past performance, which is no guarantee of future results, and current performance may be lower or higher than the figures shown. Performance assumes that all dividends and distributions, if any, were reinvested. For the most recent month-end performance figures, please visit www.morganstanley.com/msim. Investment return and principal value will fluctuate so that Portfolio shares, when redeemed, may be worth more or less than their original cost. Total returns do not reflect the deduction of taxes that a shareholder would pay on Portfolio distributions or the redemption of Portfolio shares.
(1) | | The S&P 500® Index is a capitalization-weighted index of 500 stocks. The index is designed to measure performance of the broad domestic economy through changes in the aggregate market value of 500 stocks representing all major industries. The Index is unmanaged and its returns do not include any sales charges or fees. Such costs would lower performance. It is not possible to invest directly in an index. |
(2) | | The Lipper Multi-Cap Value Funds Index is an equally weighted performance index of the largest qualifying funds (based on net assets) in the Lipper Multi-Cap Value Funds classification. The Index, which is adjusted for capital gains distributions and income dividends, is unmanaged and should not be considered an investment. There are currently 30 funds represented in this Index. As of the date of this report, the Portfolio is in the Lipper Multi-Cap Value Funds classification. |
(3) | | Total returns for the Portfolio reflect fees waived and expenses reimbursed, if applicable, by the Adviser. Without such waivers and reimbursements, total returns would have been lower. Fee waivers and/or expense reimbursements are voluntary and the Adviser reserves the right to commence or terminate any waiver and/or reimbursement at any time. |
(4) | | Commenced operations on May 31, 2007 |
(5) | | For comparative purposes, cumulative since inception returns listed for the Indexes refer to the inception date or initial offering of the respective share class of the Portfolio, not the inception of the Index. |
The Systematic Large Cap Core Active Extension Portfolio (the “Portfolio”) seeks long-term capital appreciation by investing primarily in equity securities of large capitalization companies. The Adviser seeks to construct a diversified portfolio of large capitalization equity securities using a quantitative security selection model. The Portfolio primarily invests in common stocks but may also invest in preferred stocks, convertible securities and warrants. In addition to purchasing equity securities (i.e., taking long positions), the Adviser attempts to identify stocks in the Adviser’s large capitalization universe that it believes will underperform
135
2007 Annual Report
December 31, 2007
Investment Overview (cont’d)
Systematic Large Cap Core Active Extension Portfolio
relative to the average stock in the universe and will sell these securities short on behalf of the Portfolio.
Short sales expose the Portfolio to the risk that it will be required to cover its short positions at a time when securities have appreciated in value, thus resulting in loss to the portfolio. Leverage may cause the Portfolio’s net asset value to be more volatile than if it had not been leveraged because leverage tends to magnify the effect of any increases or decreases in the value of Portfolio’s securities. The Portfolio cannot assure you that the use of leverage will result in a higher return on your investment.
Performance
For the period from May 31, 2007 (commencement of operations) to December 31, 2007, the Portfolio had a total return based on net asset value and reinvestment of distributions per share of -4.09%, net of fees, for Class A shares and -4.20%, net of fees, for Class B shares. The Portfolio’s Class A and Class B shares underperformed against its benchmark, the S&P 500®Index (the “Index”) which returned -3.01% for the same period.
Factors Affecting Performance
· For the seven-month period ended December 31, 2007, the broad market finished lower after exhibiting considerable volatility. In June and July, evidence mounted that the subprime mortgage market’s troubles had spilled into the credit market and the broader economy. A tightening in credit standards, mortgage lender bankruptcies and hedge fund implosions were followed by multi-billion dollar losses reported at several large financial institutions in the fourth quarter. At the same time, a cross current of unfavorable data buffeted the market, indicating a languishing housing market, declining consumer spending, rising oil prices and negative year-over-year corporate profit growth. Although the market rallied each time the Federal Reserve (the “Fed”) reduced the target federal funds rate, skepticism quickly returned as investors worried that the Fed’s ability to steer the economy away from recession would be limited by rising inflation pressures. Fourth quarter corporate earnings expectations were dismal, with only the largest multi-national companies expected to generate growth. In this environment, large-cap equities outperformed small-caps, and growth beat value for the seven-month period.
· On a sector basis, the technology sector had the highest total return in the Portfolio and was also the top contributing sector to the Portfolio’s overall absolute return. Within the sector, the Portfolio benefited from both long and short positions, although short positions were particularly additive to performance. In fact, six of the top 10 performing technology positions were short positions.
· Conversely, the financial sector had the lowest return among market sectors and was also the largest detractor from the Portfolio’s overall absolute return. Weak performance came from a wide range of holdings, due to their exposure to capital markets, mortgage lending or mortgage loan insurance, and/or investments in subprime mortgage backed securities.
· In aggregate, short positions were additive to performance during the period, while long positions detracted from performance.
· Relative to the Index, the Portfolio’s underperformance was driven primarily by the financials sector. However, the consumer discretionary sector was a positive contributor on a relative basis.
Management Strategies
· We employ a quantitative approach to stock selection utilizing a proprietary quantitative model. The model is driven by rigorous quantitative and fundamental research that screens a universe of large capitalization companies based on the following primary inputs: earnings expectations, price trends and relative valuations. Individual securities and industries are ranked within each sector by the most effective combination of these disciplines based on the current phase of the economic cycle. We then decide whether to buy, sell or hold a security based on its fundamental analysis and the results of this model-driven approach. Using this quantitative security selection methodology, we will purchase (i.e., take long positions) in equity securities of companies that we believe offer attractive return potential and sell short securities that we believe will underperform.
· Accordingly, our process yielded relative overweights in the consumer discretionary, health care and technology sectors; neutral weights in the consumer staples, energy, industrials and materials sectors; and underweights in the financials, utilities and telecommunication services sectors.
Expense Examples
As a shareholder of the Portfolio, you may incur two types of costs: (1) transactional costs, including redemption fees; (2) ongoing costs, including management fees, shareholder servicing fees (in the case of Class B); and other Portfolio expenses. These examples are intended to help you understand your ongoing costs (in dollars) of investing in the Portfolio
136
2007 Annual Report
December 31, 2007
Investment Overview (cont’d)
Systematic Large Cap Core Active Extension Portfolio
and to compare these costs with the ongoing costs of investing in other mutual funds.
The examples are based on an investment of $1,000 invested at the beginning of the six-month period ended December 31, 2007 and held for the entire six-month period.
Actual Expenses
The first line of the tables below provides information about actual account values and actual expenses. You may use the information in this line, together with the amount you invested, to estimate the expenses that you paid over the period. Simply divide your account value by $1,000 (for example, an $8,600 account value divided by $1,000 = 8.6), then multiply the result by the number in the first line under the heading entitled “Expenses Paid During Period” to estimate the expenses you paid on your account during this period.
Please note that “Expenses Paid During Period” are grossed up to reflect Portfolio expenses prior to the effect of Expense Offset (See Note E in the Notes to Financial Statements). Therefore, the annualized net expense ratios may differ from the ratio of the expenses to average net assets shown in the Financial Highlights.
Hypothetical Example for Comparison Purposes
The second line of the tables below provides information about hypothetical account values and hypothetical expenses based on the Portfolio’s actual expense ratio and an assumed rate of return of 5% per year before expenses, which is not the Portfolio’s actual return. The hypothetical account values and expenses may not be used to estimate the actual ending account balance or expenses you paid for the period. You may use this information to compare the ongoing costs of investing in the Portfolio and other funds. To do so, compare this 5% hypothetical example with the 5% hypothetical examples that appear in the shareholder reports of the other funds.
Please note that the expenses shown in the table are meant to highlight your ongoing costs only and do not reflect any transactional costs, such as redemption fees. Therefore, the second line of the table is useful in comparing ongoing costs only, and will not help you determine the relative total costs of owning different funds. In addition, if these transactional costs were included, your costs would have been higher.
| | Beginning
Account Value
July 1, 2007 | | Ending
Account Value
December 31,
2007 | | Expenses Paid
During Period*
July 1, 2007 —
December 31,
2007 |
Class A | | | | | | |
Actual | | $1,000.00 | | $ 970.80 | | $ 9.39 |
Hypothetical (5% average annual return before expenses) | | 1,000.00 | | 1,015.68 | | 9.60 |
| | | | | | |
Class B | | | | | | |
Actual | | 1,000.00 | | 969.60 | | 10.57 |
Hypothetical (5% average annual return before expenses) | | 1,000.00 | | 1,014.47 | | 10.82 |
* Expenses are equal to Class A and Class B annualized net expense ratios of 1.89% and 2.13%, respectively, multiplied by the average account value over the period, multiplied by 184/365 (to reflect the one-half year period).
Graphic Presentation of Portfolio Holdings
The following graph depicts the Portfolio’s holdings by industry and/or security type, as a percentage of total investments.
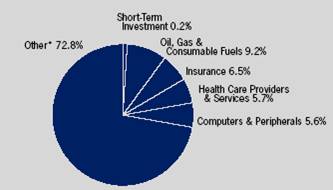
* Industries which do not appear in the above graph, as well as those which represent less than 5% of total investments, if applicable, are included in the category labeled “Other”.
137
2007 Annual Report
December 31, 2007
Portfolio of Investments
Systematic Large Cap Core Active Extension Portfolio
| | | | Value |
| | Shares | | (000) |
Long Positions (128.9%) | | | | |
Common Stocks (128.7%) | | | | |
Aerospace & Defense (5.1%) | | | | |
BE Aerospace, Inc. | | (a)1,112 | | $ 59 |
Boeing Co. | | (q)559 | | 49 |
DRS Technologies, Inc. | | 640 | | 35 |
General Dynamics Corp. | | (q)853 | | 76 |
Honeywell International, Inc. | | (q)823 | | 50 |
L-3 Communications Holdings, Inc. | | (q)420 | | 44 |
Lockheed Martin Corp. | | (q)615 | | 65 |
Northrop Grumman Corp. | | (q)976 | | 77 |
Raytheon Co. | | (q)565 | | 34 |
| | | | 489 |
Airlines (0.5%) | | | | |
AMR Corp. | | (a)1,398 | | 20 |
Mesa Air Group, Inc. | | (a)(q)3,711 | | 11 |
US Airways Group, Inc. | | (a)1,316 | | 19 |
| | | | 50 |
Auto Components (0.9%) | | | | |
ArvinMeritor, Inc. | | (q)1,603 | | 19 |
Autoliv, Inc. | | 589 | | 31 |
BorgWarner, Inc. | | (q)706 | | 34 |
| | | | 84 |
Beverages (1.7%) | | | | |
Molson Coors Brewing Co., Class B | | 835 | | 43 |
Pepsi Bottling Group, Inc. | | (q)1,089 | | 43 |
PepsiAmericas, Inc. | | (q)2,361 | | 79 |
| | | | 165 |
Biotechnology (2.7%) | | | | |
Amgen, Inc. | | (a)(q)532 | | 25 |
Charles River Laboratories International, Inc. | | (a)740 | | 49 |
Genzyme Corp. | | (a)(q)863 | | 64 |
Gilead Sciences, Inc. | | (a)(q)1,979 | | 91 |
Invitrogen Corp. | | (a)(q)371 | | 34 |
| | | | 263 |
Capital Markets (4.4%) | | | | |
Bear Stearns Cos, Inc. (The) | | 226 | | 20 |
E*Trade Financial Corp. | | (a)(q)4,096 | | 15 |
Goldman Sachs Group, Inc. (The) | | (q)763 | | 164 |
Investment Technology Group, Inc. | | (a)(q)743 | | 35 |
Lehman Brothers Holdings, Inc. | | (q)1,592 | | 104 |
Merrill Lynch & Co., Inc. | | (q)1,328 | | 71 |
Piper Jaffray Co. | | (a)(q)448 | | 21 |
| | | | 430 |
Chemicals (1.7%) | | | | |
FMC Corp. | | (q)799 | | 43 |
Monsanto Co. | | (q)732 | | 82 |
OM Group, Inc. | | (a)(q)643 | | 37 |
| | | | 162 |
Commercial Banks (1.2%) | | | | |
Bank of America Corp. | | 1,654 | | 68 |
Cascade Bancorp | | (q)1,337 | | 19 |
Wells Fargo & Co. | | (q)964 | | $ 29 |
| | | | 116 |
Commercial Services & Supplies (1.1%) | | | | |
Kelly Services, Inc., Class A | | (q)907 | | 17 |
Monster Worldwide, Inc. | | (a)597 | | 19 |
School Specialty, Inc. | | (a)1,360 | | 47 |
United Stationers, Inc. | | (a)(q)508 | | 24 |
| | | | 107 |
Communications Equipment (3.3%) | | | | |
Arris Group, Inc. | | (a)(q)2,483 | | 25 |
Ciena Corp. | | (a)995 | | 34 |
Cisco Systems, Inc. | | (a)(q)2,480 | | 67 |
F5 Networks, Inc. | | (a)677 | | 19 |
Garmin Ltd. | | 195 | | 19 |
Harris Corp. | | 774 | | 48 |
JDS Uniphase Corp. | | (a)(q)3,058 | | 41 |
NII Holdings, Inc. | | (a)410 | | 20 |
QLogic Corp. | | (a)1,394 | | 20 |
Qualcomm, Inc. | | (q)696 | | 27 |
| | | | 320 |
Computers & Peripherals (7.3%) | | | | |
Apple, Inc. | | (a)(q)805 | | 159 |
Cognizant Technology Solutions Corp., Class A | | (a)568 | | 19 |
Dell, Inc. | | (a)(q)1,840 | | 45 |
Diebold, Inc. | | 678 | | 20 |
Hewlett-Packard Co. | | (q)4,229 | | 214 |
International Business Machines Corp. | | (q)1,589 | | 172 |
Network Appliance, Inc. | | (a)777 | | 19 |
Western Digital Corp. | | (a)1,808 | | 55 |
| | | | 703 |
Construction & Engineering (1.2%) | | | | |
Jacobs Engineering Group, Inc. | | (a)549 | | 52 |
Shaw Group, Inc. (The) | | (a)(q)472 | | 29 |
URS Corp. | | (a)(q)675 | | 37 |
| | | | 118 |
Consumer Finance (0.8%) | | | | |
American Express Co. | | (q)654 | | 34 |
AmeriCredit Corp. | | (a)1,529 | | 20 |
First Marblehead Corp (The) | | 1,266 | | 19 |
| | | | 73 |
Diversified Financial Services (2.4%) | | | | |
CIT Group, Inc. | | (q)1,433 | | 35 |
Citigroup, Inc. | | (q)3,578 | | 105 |
JPMorgan Chase & Co. | | (q)1,239 | | 54 |
Nasdaq Stock Market, Inc. (The) | | (a)(q)872 | | 43 |
| | | | 237 |
Diversified Telecommunication Services (2.9%) | | | | |
American Tower Corp., Class A | | (a)465 | | 20 |
AT&T, Inc. | | (q)4,386 | | 182 |
Verizon Communications, Inc. | | (q)1,691 | | 74 |
| | | | 276 |
Electric Utilities (1.2%) | | | | |
Exelon Corp. | | (q)966 | | 79 |
138 | The accompanying notes are an integral part of the financial statements. |
2007 Annual Report
December 31, 2007
Portfolio of Investments (cont’d)
Systematic Large Cap Core Active Extension Portfolio
| | | | Value |
| | Shares | | (000) |
Electric Utilities (cont’d) | | | | |
Sierra Pacific Resources | | (q)2,145 | | $ 36 |
| | | | 115 |
Electrical Equipment (0.3%) | | | | |
General Cable Corp. | | (a)(q)448 | | 33 |
Electronic Equipment & Instruments (2.7%) | | | | |
Amphenol Corp., Class A | | 849 | | 40 |
Arrow Electronics, Inc. | | (a)(q)995 | | 39 |
Benchmark Electronics, Inc. | | (a)(q)1,361 | | 24 |
Circuit City Stores, Inc. | | 4,539 | | 19 |
Gamestop Corp., Class A | | (a)313 | | 20 |
Jabil Circuit, Inc. | | 1,321 | | 20 |
LoJack Corp. | | (a)(q)1,803 | | 30 |
Plexus Corp. | | (a)(q)1,719 | | 45 |
Vishay Intertechnology, Inc. | | (a)(q)2,286 | | 26 |
| | | | 263 |
Energy Equipment & Services (3.4%) | | | | |
Energen Corp. | | 567 | | 36 |
Halliburton Co. | | 656 | | 25 |
National Oilwell Varco, Inc. | | (a)(q)855 | | 63 |
Pride International, Inc. | | (a)(q)1,587 | | 54 |
Sunpower Corp., Class A | | (a)145 | | 19 |
Superior Energy Services | | (a)(q)1,802 | | 62 |
Transocean, Inc. | | (q)498 | | 71 |
| | | | 330 |
Food & Staples Retailing (2.4%) | | | | |
Costco Wholesale Corp. | | 863 | | 60 |
CVS Caremark Corp. | | (q)3,517 | | 140 |
Longs Drug Stores Corp. | | (q)798 | | 37 |
| | | | 237 |
Food Products (1.1%) | | | | |
Archer-Daniels-Midland Co. | | 847 | | 39 |
NutriSystem, Inc. | | (a)692 | | 19 |
Ralcorp Holdings, Inc. | | (a)765 | | 47 |
| | | | 105 |
Gas Utilities (0.5%) | | | | |
Questar Corp. | | 811 | | 44 |
Health Care Equipment & Supplies (2.0%) | | | | |
Conmed Corp. | | (a)(q)1,034 | | 24 |
Dionex Corp. | | (a)(q)563 | | 47 |
HLTH Corp. | | (a)1,432 | | 19 |
Hologic, Inc. | | (a)(q)449 | | 31 |
Millipore Corp. | | (a)580 | | 42 |
Varian, Inc. | | (a)(q)512 | | 33 |
| | | | 196 |
Health Care Providers & Services (7.3%) | | | | |
Aetna, Inc. | | (q)1,533 | | 88 |
Centene Corp. | | (a)(q)1,316 | | 36 |
Community Health Systems, Inc. | | (a)(q)741 | | 27 |
Covance, Inc. | | (a)557 | | 48 |
DaVita, Inc. | | (a)613 | | 35 |
Express Scripts, Inc. | | (a)(q)984 | | 72 |
Humana, Inc. | | (a)(q)701 | | 53 |
LifePoint Hospitals, Inc. | | (a)(q)753 | | 22 |
McKesson Corp. | | (q)948 | | $ 62 |
Medco Health Solutions, Inc. | | (a)(q)479 | | 49 |
Molina Healthcare, Inc. | | (a)1,182 | | 46 |
Quest Diagnostics, Inc. | | (q)1,404 | | 74 |
Universal Health Services, Inc., Class B | | (q)477 | | 24 |
WebMD Health Corp., Class A | | (a)476 | | 20 |
Wellpoint, Inc. | | (a)(q)603 | | 53 |
| | | | 709 |
Hotels Restaurants & Leisure (4.0%) | | | | |
Burger King Holdings, Inc. | | (q)1,392 | | 40 |
Darden Restaurants, Inc. | | (q)1,107 | | 31 |
Harrah’s Entertainment, Inc. | | (q)389 | | 34 |
Las Vegas Sands Corp. | | (a)184 | | 19 |
McDonald’s Corp. | | (q)2,377 | | 140 |
Monarch Casino & Resort, Inc. | | (a)(q)1,781 | | 43 |
Red Robin Gourmet Burgers, Inc. | | (a)(q)1,294 | | 41 |
Starbucks Corp. | | (a)970 | | 20 |
Wynn Resorts Ltd. | | 170 | | 19 |
| | | | 387 |
Household Durables (1.2%) | | | | |
Furniture Brands International, Inc. | | 1,601 | | 16 |
La-Z-Boy, Inc. | | (q)2,049 | | 16 |
Lennar Corp., Class A | | 1,145 | | 21 |
Pulte Homes, Inc. | | 1,906 | | 20 |
Tempur-Pedic International, Inc. | | (q)1,818 | | 47 |
| | | | 120 |
Household Products (1.4%) | | | | |
Church & Dwight Co., Inc. | | 697 | | 38 |
Energizer Holdings, Inc. | | (a)(q)361 | | 40 |
Kimberly-Clark Corp. | | 791 | | 55 |
| | | | 133 |
Independent Power Producers & Energy Traders (0.3%) | | | | |
AES Corp. (The) | | (a)(q)1,545 | | 33 |
Industrial Conglomerates (1.4%) | | | | |
General Electric Co. | | (q)3,061 | | 114 |
UTi Worldwide, Inc. | | 992 | | 19 |
| | | | 133 |
Information Technology Services (1.4%) | | | | |
BMC Software, Inc. | | (a)1,485 | | 53 |
Global Payments, Inc. | | 773 | | 36 |
Wright Express Corp. | | (a)1,204 | | 43 |
| | | | 132 |
Insurance (8.4%) | | | | |
ACE Ltd. | | (q)976 | | 60 |
AMBAC Financial Group, Inc. | | (q)1,485 | | 38 |
American Financial Group, Inc. | | (q)1,204 | | 35 |
American International Group, Inc. | | (q)1,186 | | 69 |
Chubb Corp. | | (q)1,077 | | 59 |
CNA Financial Corp. | | (q)1,727 | | 58 |
Delphi Financial Group, Inc. | | (q)708 | | 25 |
Hartford Financial Services Group, Inc. | | (q)942 | | 82 |
HCC Insurance Holdings, Inc. | | (q)1,834 | | 53 |
Loews Corp. | | (q)1,370 | | 69 |
MBIA, Inc. | | 1,026 | | 19 |
The accompanying notes are an integral part of the financial statements. | 139 |
2007 Annual Report
December 31, 2007
Portfolio of Investments (cont’d)
Systematic Large Cap Core Active Extension Portfolio
| | | | Value |
| | Shares | | (000) |
Insurance (cont’d) | | | | |
MetLife, Inc. | | (q)1,089 | | $ 67 |
Philadelphia Consolidated Holding Co. | | (a)(q)888 | | 35 |
Prudential Financial, Inc. | | (q)508 | | 47 |
Unum Group | | (q)2,309 | | 55 |
XL Capital Ltd., Class A | | (q)743 | | 38 |
| | | | 809 |
Internet & Catalog Retail (0.9%) | | | | |
Amazon.com, Inc. | | (a)207 | | 19 |
Coldwater Creek, Inc. | | (a)2,875 | | 19 |
Expedia, Inc. | | (a)(q)1,410 | | 45 |
| | | | 83 |
Internet Software & Services (3.3%) | | | | |
Akamai Technologies, Inc. | | (a)551 | | 19 |
eBay, Inc. | | (a)(q)1,745 | | 58 |
Google, Inc., Class A | | (a)132 | | 91 |
McAfee, Inc. | | (a)(q)2,106 | | 79 |
MIVA, Inc. | | (a)(q)7,173 | | 14 |
Salesforce.com, Inc. | | (a)975 | | 61 |
| | | | 322 |
Machinery (3.5%) | | | | |
AGCO Corp. | | (a)(q)738 | | 50 |
Briggs & Stratton Corp. | | (q)995 | | 22 |
Deere & Co. | | (q)1,324 | | 123 |
Joy Global, Inc. | | (q)921 | | 61 |
Manitowoc Co., Inc. (The) | | 396 | | 19 |
Parker Hannifin Corp. | | 371 | | 28 |
Timken Co. | | (q)993 | | 33 |
| | | | 336 |
Manufacturing (0.5%) | | | | |
Matthews International Corp. | | 1,107 | | 52 |
Media (1.3%) | | | | |
DIRECTV Group, Inc. (The) | | (a)(q)1,792 | | 41 |
Viacom, Inc., Class B | | (a)699 | | 31 |
Walt Disney Co. (The) | | (q)1,102 | | 35 |
Warner Music Group Corp. | | 3,233 | | 20 |
| | | | 127 |
Metals & Mining (2.5%) | | | | |
Alcoa, Inc. | | (q)484 | | 18 |
Commercial Metals Co. | | (q)1,064 | | 31 |
Freeport-McMoRan Copper & Gold, Inc. | | (q)317 | | 32 |
Rio Tinto plc ADR | | 125 | | 53 |
Southern Copper Corp. | | (q)494 | | 52 |
United States Steel Corp. | | (q)458 | | 55 |
| | | | 241 |
Multi-Utilities (0.5%) | | | | |
Public Service Enterprise Group, Inc. | | (q)459 | | 45 |
Multiline Retail (0.5%) | | | | |
J.C. Penney Co., Inc. | | 458 | | 20 |
Saks, Inc. | | (a)(q)1,482 | | 31 |
| | | | 51 |
Oil, Gas & Consumable Fuels (11.9%) | | | | |
Anadarko Petroleum Corp. | | (q)518 | | $ 34 |
Chevron Corp. | | (q)1,376 | | 128 |
Cimarex Energy Co. | | (q)804 | | 34 |
ConocoPhillips | | (q)2,165 | | 191 |
ENSCO International, Inc. | | 326 | | 20 |
Exxon Mobil Corp. | | (q)3,248 | | 304 |
Forest Oil Corp. | | (a)(q)907 | | 46 |
Frontier Oil Corp. | | 472 | | 19 |
Helix Energy Solutions Group, Inc. | | (a)472 | | 20 |
Hess Corp. | | (q)539 | | 54 |
Marathon Oil Corp. | | (q)1,473 | | 90 |
Oneok, Inc. | | (q)755 | | 34 |
Overseas Shipholding Group | | (q)874 | | 65 |
Spectra Energy Corp. | | 718 | | 19 |
Valero Energy Corp. | | (q)1,376 | | 96 |
| | | | 1,154 |
Personal Products (0.2%) | | | | |
Bare Escentuals, Inc. | | (a)810 | | 20 |
Pharmaceuticals (5.6%) | | | | |
APP Pharmaceuticals, Inc. | | (a)1,900 | | 20 |
Johnson & Johnson | | (q)821 | | 55 |
Merck & Co., Inc. | | (q)2,722 | | 158 |
Par Pharmaceutical Co., Inc. | | (a)(q)1,171 | | 28 |
Perrigo Co. | | 1,566 | | 55 |
PharmaNet Development Group, Inc. | | (a)(q)1,183 | | 46 |
Sepracor, Inc. | | (a)736 | | 19 |
Teva Pharmaceutical Industries Ltd. ADR | | (q)1,172 | | 55 |
Thermo Fisher Scientific, Inc. | | (a)(q)1,225 | | 71 |
Watson Pharmaceuticals, Inc. | | (a)(q)1,300 | | 35 |
| | | | 542 |
Real Estate (0.4%) | | | | |
Jones Lang LaSalle, Inc. | | (q)524 | | 37 |
Road & Rail (1.8%) | | | | |
Avis Budget Group, Inc. | | (a)1,538 | | 20 |
Burlington Northern Santa Fe Corp. | | (q)585 | | 49 |
CSX Corp. | | (q)1,031 | | 45 |
Union Pacific Corp. | | (q)512 | | 64 |
| | | | 178 |
Semiconductors & Semiconductor Equipment (4.4%) | | | | |
Cypress Semiconductor Corp. | | (a)1,565 | | 56 |
Integrated Device Technology, Inc. | | (a)1,727 | | 20 |
Intel Corp. | | (q)4,140 | | 110 |
International Rectifier Corp. | | (a)(q)1,128 | | 38 |
LSI Corp. | | (a)3,723 | | 20 |
MEMC Electronic Materials, Inc. | | (a)(q)1,549 | | 137 |
Micron Technology, Inc. | | (a)2,716 | | 20 |
Texas Instruments, Inc. | | (q)731 | | 25 |
| | | | 426 |
Software (3.6%) | | | | |
Electronic Arts, Inc. | | (a)336 | | 20 |
Microsoft Corp. | | (q)4,122 | | 147 |
Oracle Corp. | | (a)(q)6,195 | | 140 |
Symantec Corp. | | (a)1,203 | | 19 |
140 | The accompanying notes are an integral part of the financial statements. |
2007 Annual Report
December 31, 2007
Portfolio of Investments (cont’d)
Systematic Large Cap Core Active Extension Portfolio
| | | | Value |
| | Shares | | (000) |
Software (cont’d) | | | | |
VMware, Inc., Class A | | (a)236 | | $ 20 |
| | | | 346 |
Specialty Retail (2.1%) | | | | |
Aeropostale, Inc. | | (a)(q)1,640 | | 43 |
Chico’s FAS, Inc. | | (a)2,162 | | 20 |
Foot Locker, Inc. | | (q)1,384 | | 19 |
Jo-Ann Stores, Inc. | | (a)(q)1,185 | | 15 |
Office Depot, Inc. | | (a)1,428 | | 20 |
Officemax, Inc. | | (q)1,624 | | 34 |
Sherwin-Williams Co. (The) | | (q)823 | | 48 |
| | | | 199 |
Textiles, Apparel & Luxury Goods (2.2%) | | | | |
Coach, Inc. | | (a)645 | | 20 |
CROCS, Inc. | | (a)514 | | 19 |
Guess?, Inc. | | 494 | | 19 |
Jones Apparel Group, Inc. | | 1,205 | | 19 |
Kellwood Co. | | (q)909 | | 15 |
Liz Claiborne, Inc. | | 961 | | 19 |
Nike, Inc., Class B | | (q)922 | | 59 |
Polo Ralph Lauren Corp. | | (q)351 | | 22 |
Urban Outfitters, Inc. | | (a)727 | | 20 |
| | | | 212 |
Thrifts & Mortgage Finance (2.3%) | | | | |
Countrywide Financial Corp. | | (q)3,959 | | 35 |
Fannie Mae | | 512 | | 21 |
Freddie Mac | | 600 | | 21 |
MGIC Investment Corp. | | 2,202 | | 49 |
PMI Group, Inc. (The) | | 1,495 | | 20 |
Radian Group, Inc. | | (q)4,329 | | 51 |
Sovereign Bancorp, Inc. | | 1,760 | | 20 |
Washington Mutual, Inc. | | (q)692 | | 9 |
| | | | 226 |
Tobacco (3.7%) | | | | |
Altria Group, Inc. | | (q)2,942 | | 223 |
Loews Corp. - Carolina Group | | (q)1,622 | | 138 |
| | | | 361 |
Trading Companies & Distributors (1.0%) | | | | |
Applied Industrial Technologies, Inc. | | (q)1,167 | | 34 |
Kaman Corp. | | (q)1,206 | | 44 |
United Rentals, Inc. | | (a)(q)1,026 | | 19 |
| | | | 97 |
Wireless Telecommunication Services (0.3%) | | | | |
Telephone & Data Systems, Inc. | | 495 | | 31 |
Total Common Stocks (Cost $12,759) | | | | 12,458 |
Short-Term Investment (0.2%) | | | | |
Investment Company (0.2%) | | | | |
Morgan Stanley Institutional Liquidity | | | | |
Money Market Portfolio | | | | |
— Institutional Class (Cost $20) | | (o)19,645 | | $ 20 |
Total Investments (128.9%) (Cost $12,779) | | | | 12,478 |
Liabilities in Excess of Other Assets (-28.9%) | | | | (2,800) |
Net Assets (100%) | | | | $ 9,678 |
Short Positions (29.2%)* | | | | |
Common Stocks (29.2%) | | | | |
Advertising (0.3%) | | | | |
Harte-Hanks, Inc. | | 1,759 | | 30 |
Air Freight & Logistics (0.7%) | | | | |
Expeditors International Washington, Inc. | | 621 | | 28 |
Forward Air Corp. | | 1,157 | | 36 |
| | | | 64 |
Airlines (0.4%) | | | | |
JetBlue Airways Corp. | | (a)6,859 | | 40 |
Biotechnology (1.2%) | | | | |
Affymetrix, Inc. | | (a)2,325 | | 54 |
Vertex Pharmaceuticals, Inc. | | (a)2,527 | | 59 |
| | | | 113 |
Commercial Banks (2.1%) | | | | |
First Midwest Bancorp, Inc. | | 756 | | 23 |
Glacier Bancorp, Inc. | | 2,332 | | 44 |
PrivateBancorp, Inc. | | 1,238 | | 40 |
Sterling Bancorp | | 2,428 | | 33 |
United Bankshares, Inc. | | 783 | | 22 |
Westamerica Bancorporation | | 580 | | 26 |
Wilshire Bancorp, Inc. | | 1,659 | | 13 |
| | | | 201 |
Commercial Services & Supplies (0.2%) | | | | |
Corporate Executive Board Co. | | 366 | | 22 |
Computers & Peripherals (0.4%) | | | | |
Sun Microsystems, Inc. | | (a)1,990 | | 36 |
Construction & Engineering (0.3%) | | | | |
Insituform Technologies, Inc. | | (a)1,872 | | 28 |
Construction Materials (0.3%) | | | | |
Headwaters, Inc. | | (a)2,062 | | 24 |
Containers & Packaging (0.3%) | | | | |
Bemis Co., Inc. | | 1,210 | | 33 |
Diversified Consumer Services (0.6%) | | | | |
Coinstar, Inc. | | (a)1,614 | | 45 |
CPI Corp. | | 544 | | 13 |
| | | | 58 |
Electric Utilities (0.4%) | | | | |
Hawaiian Electric Industries, Inc. | | 1,649 | | 38 |
Electronic Equipment & Instruments (1.2%) | | | | |
Agilysys, Inc. | | 2,831 | | 43 |
Coherent, Inc. | | (a)1,312 | | 32 |
Itron, Inc. | | (a)443 | | 43 |
| | | | 118 |
The accompanying notes are an integral part of the financial statements. | 141 |
2007 Annual Report
December 31, 2007
Portfolio of Investments (cont’d)
Systematic Large Cap Core Active Extension Portfolio
| | | | Value |
| | Shares | | (000) |
Energy Equipment & Services (0.4%) | | | | |
Dril-Quip, Inc. | | (a)746 | | $ 42 |
Food & Staples Retailing (0.5%) | | | | |
United Natural Foods, Inc. | | 1,465 | | 47 |
Food Products (1.5%) | | | | |
Hershey Co. (The) | | 1,210 | | 48 |
J&J Snack Foods Corp. | | (a)1,158 | | 36 |
Tootsie Roll Industries, Inc. | | 2,127 | | 58 |
| | | | 142 |
Gas Utilities (1.2%) | | | | |
AGL Resources, Inc. | | 1,287 | | 48 |
Equitable Resources, Inc. | | 658 | | 35 |
Piedmont Natural Gas Co. | | 1,103 | | 29 |
| | | | 112 |
Health Care Equipment & Supplies (1.8%) | | | | |
ICU Medical, Inc. | | (a)1,001 | | 36 |
Integra LifeScience Holdings Corp. | | (a)1,137 | | 48 |
Kensey Nash Corp. | | (a)1,612 | | 48 |
Palomar Medical Technologies, Inc. | | (a)2,541 | | 39 |
| | | | 171 |
Health Care Providers & Services (1.6%) | | | | |
Allscripts Healthcare Solutions, Inc. | | (a)2,711 | | 53 |
Cardinal Health, Inc. | | 653 | | 38 |
Cross Country Healthcare, Inc. | | (a)2,289 | | 32 |
Tenet Healthcare Corp. | | (a)5,781 | | 29 |
| | | | 152 |
Hotels Restaurants & Leisure (0.2%) | | | | |
Ihop Corp. | | 503 | | 18 |
Information Technology Services (0.4%) | | | | |
Fidelity National Information Services, Inc. | | 1,022 | | 43 |
Insurance (1.1%) | | | | |
Brown & Brown, Inc. | | 991 | | 23 |
Marsh & McClennan Cos., Inc. | | 1,216 | | 32 |
Stewart Information Services Corp. | | 1,794 | | 47 |
| | | | 102 |
Internet & Catalog Retail (0.4%) | | | | |
IAC/InterActiveCorp. | | (a)1,449 | | 39 |
Internet Software & Services (0.2%) | | | | |
Websense, Inc. | | (a)1,222 | | 21 |
Leisure Equipment & Products (1.0%) | | | | |
Arctic Cat, Inc. | | 4,054 | | 48 |
Eastman Kodak Co. | | 1,998 | | 44 |
| | | | 92 |
Machinery (0.3%) | | | | |
Federal Signal Corp. | | 2,522 | | 28 |
Media (0.6%) | | | | |
Entercom Communications Corp., Class A | | 1,888 | | 26 |
Interpublic Group of Cos., Inc. | | (a)4,287 | | 35 |
| | | | 61 |
Multi-Utilities (0.3%) | | | | |
OGE Energy Corp. | | 742 | | 27 |
Office Electronics (0.2%) | | | | |
Zebra Technologies Corp. | | (a)701 | | 24 |
Oil, Gas & Consumable Fuels (0.8%) | | | | |
Penn Virginia Corp. | | 1,018 | | $ 44 |
Plains Exploration & Production Co. | | (a)619 | | 34 |
| | | | 78 |
Paper & Forest Products (0.9%) | | | | |
Glatfelter | | 2,965 | | 45 |
Louisiana-Pacific Corp. | | 3,362 | | 46 |
| | | | 91 |
Pharmaceuticals (0.8%) | | | | |
Allergan, Inc. | | 646 | | 41 |
Mylan, Inc. | | 2,749 | | 39 |
| | | | 80 |
Real Estate (2.1%) | | | | |
AvalonBay Communities, Inc. REIT | | 309 | | 29 |
Developers Diversified Realty Corp. REIT | | 764 | | 29 |
Essex Property Trust, Inc. REIT | | 215 | | 21 |
Highwoods Properties, Inc. REIT | | 1,609 | | 47 |
Inland Real Estate Corp. REIT | | 1,481 | | 21 |
PS Business Parks, Inc. REIT | | 627 | | 33 |
UDR, Inc. REIT | | 1,334 | | 27 |
| | | | 207 |
Road & Rail (1.0%) | | | | |
Heartland Express, Inc. | | 2,368 | | 34 |
Knight Transportation, Inc. | | 2,174 | | 32 |
Landstar System, Inc. | | 828 | | 35 |
| | | | 101 |
Semiconductors & Semiconductor Equipment (1.7%) | | | | |
Altera Corp. | | 2,044 | | 39 |
Axcelis Technologies, Inc. | | (a)6,351 | | 29 |
Broadcom Corp., Class A | | (a)1,320 | | 35 |
Lattice Semiconductor Corp. | | (a)7,630 | | 25 |
Linear Technology Corp. | | 1,254 | | 40 |
| | | | 168 |
Software (0.5%) | | | | |
ACI Worldwide, Inc. | | (a)864 | | 16 |
Sonic Solutions, Inc. | | (a)3,165 | | 33 |
| | | | 49 |
Specialty Retail (0.7%) | | | | |
Hibbett Sports, Inc. | | (a)3,443 | | 69 |
Textiles, Apparel & Luxury Goods (0.6%) | | | | |
K-Swiss, Inc., Class A | | (a)3,346 | | 61 |
Total Short Positions (Proceeds $3,077) | | | | $ 2,830 |
* | | Percentages are based on Net Assets. |
(a) | | Non-income producing security. |
(o) | | See Note F within the Notes to Financial Statements regarding investment in Morgan Stanley Institutional Liquidity Money Market Portfolio — Institutional Class. |
(q) | | Securities are pledged with a broker as collateral for short sales. |
ADR | | American Depositary Receipt |
REIT | | Real Estate Investment Trust |
142 | The accompanying notes are an integral part of the financial statements. |
| 2007 Annual Report |
| |
| December 31, 2007 |
Investment Overview (unaudited)
U.S. Large Cap Growth Portfolio
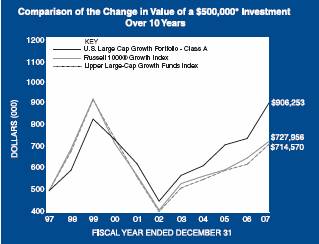
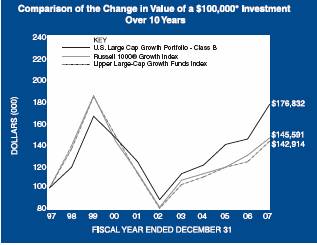
* Minimum Investment
In accordance with SEC regulations, Portfolio’s performance shown assumes that all recurring fees (including management fees) were deducted and all dividends and distributions were reinvested. The performance of Class B shares will vary from the Class A shares based upon its different inception date and will be negatively impacted by additional fees assessed to this class.
Performance Compared to the Russell 1000® Growth Index(1) and the Lipper Large-Cap Growth Funds Index(2)
| | Total Returns(3) | |
| | | | Average Annual | |
| | One | | Five | | Ten | | Since | |
| | Year | | Years | | Years | | Inception(6) | |
Portfolio – Class A (4) | | 22.29 | % | 14.94 | % | 6.13 | % | 11.17 | % |
Russell 1000® Growth Index | | 11.81 | | 12.11 | | 3.83 | | 8.92 | |
Lipper Large-Cap Growth Funds Index | | 14.97 | | 12.06 | | 3.64 | | 8.68 | |
| | | | | | | | | |
Portfolio – Class B (5) | | 21.93 | | 14.65 | | 5.87 | | 9.62 | |
Russell 1000® Growth Index | | 11.81 | | 12.11 | | 3.83 | | 7.27 | |
Lipper Large-Cap Growth Funds Index | | 14.97 | | 12.06 | | 3.64 | | 6.77 | |
Performance data quoted represents past performance, which is no guarantee of future results, and current performance may be lower or higher than the figures shown. Performance assumes that all dividends and distributions, if any, were reinvested. For the most recent month-end performance figures, please visit www.morganstanley.com/msim. Investment return and principal value will fluctuate so that Portfolio shares, when redeemed, may be worth more or less than their original cost. Total returns do not reflect the deduction of taxes that a shareholder would pay on Portfolio distributions or the redemption of Portfolio shares.
(1) | The Russell 1000® Growth Index measures the performance of those Russell 1000® Index companies with higher price-to-book ratios and higher forecasted growth values. The Russell 1000® Index measures the performance of the 1,000 largest companies in the Russell 3000® Index. The Russell 3000® Index measures the performance of the 3,000 largest U.S. companies based on total market capitalization. The Index is unmanaged and its returns do not include any sales charges or fees. Such costs would lower performance. It is not possible to invest directly in an index. |
(2) | The Lipper Large-Cap Growth Funds Index is an equally weighted performance index of the largest qualifying funds (based on net assets) in the Lipper Large-Cap Growth Funds classification. The Index, which is adjusted for capital gains distributions and income dividends, is unmanaged and should not be considered an investment. There are currently 30 funds represented in this Index. As of the date of this report, the Portfolio is in the Lipper Large-Cap Growth Funds classification. |
(3) | Total returns for the Portfolio reflect fees waived and expenses reimbursed, if applicable, by the Adviser. Without such waivers and reimbursements, total returns would have been lower. Fee waivers and/or expense reimbursements are voluntary and the Adviser reserves the right to commence or terminate any waiver and/or reimbursement at any time. |
(4) | Commenced operations on April 2, 1991 |
(5) | Commenced operations on January 2, 1996 |
(6) | For comparative purposes, average annual since inception returns listed for the Indexes refer to the inception date or initial offering of the respective share class of the Portfolio, not the inception of the Index. |
143
2007 Annual Report | |
| |
December 31, 2007 | |
Investment Overview (cont’d)
U.S. Large Cap Growth Portfolio
The U.S. Large Cap Growth Portfolio (the “Portfolio”) seeks long-term capital appreciation by investing primarily in growth-oriented equity securities of large capitalization companies.
Performance
For the year ended December 31, 2007, the Portfolio had a total return based on net asset value and reinvestment of distributions per share of 22.29%, net of fees, for Class A shares and 21.93%, net of fees, for Class B shares. The Portfolio’s Class A and Class B shares outperformed against its benchmark, the Russell 1000® Growth Index (the “Index”) which returned 11.81%.
Factors Affecting Performance
· The broad equity market made a modest gain for the 12-month period ended December 31, 2007, despite experiencing a decline in the second half of the year. During the summer, the subprime mortgage market suffered a complete collapse under the weight of rising loan defaults and home foreclosures. As a result, credit significantly tightened as liquidity decreased, and consumers became far more cautious in their expenditures, particularly as gasoline prices once again surged upward.
· In response to this rising volatility, the Federal Reserve began a series of cuts to the target federal funds rate and the discount rate. Although each announced rate reduction temporarily boosted investor sentiment, the broad market declined in the fourth quarter, reflecting investors’ concerns about the health of the financial markets in the coming year.
· In this environment, the market demonstrated a preference for growth equities over value equities, as well as for large- and mid-capitalization stocks.
· For the 12-month period, the Portfolio’s outperformance was driven by stock selection, while sector allocations modestly detracted. Sector allocations are a result of bottom-up stock selection and are not intentional top-down decisions; thus the major contributors to performance on a sector basis were primarily driven by stock selection.
· The technology sector had the largest positive impact on performance for the period. Here, stock selection in the communications technology and computer technology sectors greatly added to relative returns, which offset the negative effect caused by an underweight allocation.
· In the materials and processing sector, an overweight allocation together with a single holding in an agricultural fishing and ranching company significantly helped performance. Additionally, security selection in the consumer discretionary sector was advantageous. Favorable investment in retail, consumer electronics, and hotel/motel companies more than made up for the negative influence of a large sector overweight.
· In contrast, the financial services sector had the most unfavorable impact on performance due to security selection, particularly in financial information services companies.
· In the consumer staples sector, an underweight allocation greatly overshadowed gains made through good stock picking. Furthermore, the Portfolio’s lack of investment in the integrated oils sector considerably dampened relative returns.
Management Strategies
· It is our goal to hold a portfolio of high quality growth stocks we believe will perform well regardless of the market environment. We continue to favor companies that have some uniqueness or dynamic competitive advantage in their business model, with a high quality stream of cash flow and the ability to redeploy capital at a high rate of return.
· At the close of the period, consumer discretionary represented the largest sector weight and overweight in the Portfolio, followed by the financial services and materials and processing sectors. The financial services sector was modestly underweight versus the Index, and the materials and processing sector was overweight in relation to the Index.
Expense Examples
As a shareholder of the Portfolio, you may incur two types of costs: (1) transactional costs, including redemption fees; (2) ongoing costs, including management fees, shareholder servicing fees (in the case of Class B); and other Portfolio expenses. These examples are intended to help you understand your ongoing costs (in dollars) of investing in the Portfolio and to compare these costs with the ongoing costs of investing in other mutual funds.
The examples are based on an investment of $1,000 invested at the beginning of the six-month period ended December 31, 2007 and held for the entire six-month period.
Actual Expenses
The first line of the tables below provides information about actual account values and actual expenses. You may use the information in this line, together with the amount you invested, to estimate the expenses that you paid over the period. Simply divide your account value by $1,000 (for example, an $8,600 account value divided by $1,000 = 8.6),
144
| 2007 Annual Report |
| |
| December 31, 2007 |
Investment Overview (cont’d)
U.S. Large Cap Growth Portfolio
then multiply the result by the number in the first line under the heading entitled “Expenses Paid During Period” to estimate the expenses you paid on your account during this period.
Please note that “Expenses Paid During Period” are grossed up to reflect Portfolio expenses prior to the effect of Expense Offset (See Note E in the Notes to Financial Statements). Therefore, the annualized net expense ratios may differ from the ratio of the expenses to average net assets shown in the Financial Highlights.
Hypothetical Example for Comparison Purposes
The second line of the tables below provides information about hypothetical account values and hypothetical expenses based on the Portfolio’s actual expense ratio and an assumed rate of return of 5% per year before expenses, which is not the Portfolio’s actual return. The hypothetical account values and expenses may not be used to estimate the actual ending account balance or expenses you paid for the period. You may use this information to compare the ongoing costs of investing in the Portfolio and other funds. To do so, compare this 5% hypothetical example with the 5% hypothetical examples that appear in the shareholder reports of the other funds.
Please note that the expenses shown in the table are meant to highlight your ongoing costs only and do not reflect any transactional costs, such as redemption fees. Therefore, the second line of the table is useful in comparing ongoing costs only, and will not help you determine the relative total costs of owning different funds. In addition, if these transactional costs were included, your costs would have been higher.
| | Beginning
Account Value | | Ending Account
Value
December 31, | | Expenses Paid
During Period*
July 1, 2007 —
December 31, | |
| | July 1, 2007 | | 2007 | | 2007 | |
Class A | | | | | | | |
Actual | | $1,000.00 | | $1,113.70 | | $3.25 | |
Hypothetical (5% average annual return before expenses) | | 1,000.00 | | 1,022.13 | | 3.11 | |
| | | | | | | |
Class B | | | | | | | |
Actual | | 1,000.00 | | 1,111.70 | | 4.58 | |
Hypothetical (5% average annual return before expenses) | | 1,000.00 | | 1,020.87 | | 4.38 | |
* Expenses are equal to Class A and Class B annualized net expense ratios of 0.61% and 0.86%, respectively, multiplied by the average account value over the period, multiplied by 184/365 (to reflect the one-half year period).
Graphic Presentation of Portfolio Holdings
The following graph depicts the Portfolio’s holdings by industry and/or security type, as a percentage of total investments.
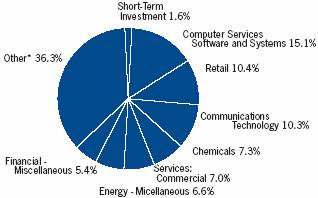
* Industries which do not appear in the above graph, as well as those which represent less than 5% of total investments, if applicable, are included in the category labeled “Other”.
145
2007 Annual Report | |
| |
December 31, 2007 | |
Portfolio of Investments
U.S. Large Cap Growth Portfolio
| | | | Value |
| | Shares | | (000) |
Common Stocks (94.4 %) | | | | |
Advertising Agencies (0.9%) | | | | |
Monster Worldwide, Inc. | | (a)441,085 | | $ 14,291 |
Air Transport (1.3%) | | | | |
Expeditors International Washington, Inc. | | 469,440 | | 20,974 |
Biotechnology Research & Production (0.8%) | | | | |
Illumina, Inc. | | (a)213,976 | | 12,680 |
Building: Cement (3.3%) | | | | |
Cemex S.A.B de C.V. ADR | | (a)1,102,216 | | 28,492 |
Martin Marietta Materials, Inc. | | 173,020 | | 22,943 |
| | | | 51,435 |
Casinos & Gambling (3.3%) | | | | |
Wynn Resorts Ltd. | | 457,289 | | 51,276 |
Chemicals (7.1%) | | | | |
Monsanto Co. | | 1,007,786 | | 112,560 |
Communications Technology (10.0%) | | | | |
America Movil S.A.B. de C.V., Class L ADR | | 733,897 | | 45,054 |
China Mobile Ltd. ADR | | 248,385 | | 21,577 |
Cisco Systems, Inc. | | (a)1,092,089 | | 29,563 |
Research In Motion Ltd. | | (a)540,026 | | 61,239 |
| | | | 157,433 |
Computer Services Software & Systems (14.8%) | | | | |
Baidu.com ADR | | (a)71,579 | | 27,944 |
Google, Inc., Class A | | (a)166,656 | | 115,239 |
Mastercard Inc., Class A | | 116,078 | | 24,980 |
Tencent Holdings Ltd. | | 2,648,400 | | 19,725 |
VMware, Inc., Class A | | (a)255,988 | | 21,757 |
Yahoo!, Inc. | | (a)970,164 | | 22,566 |
| | | | 232,211 |
Computer Technology (3.1%) | | | | |
Apple, Inc. | | (a)245,013 | | 48,532 |
Seagate Technology, Inc. | | (d)(l)186,100 | | @— |
| | | | 48,532 |
Diversified Financial Services(2.1%) | | | | |
CME Group, Inc. | | 49,317 | | 33,831 |
Drugs & Pharmaceuticals (0.6%) | | | | |
Gen-Probe, Inc. | | (a)162,989 | | 10,257 |
Energy — Miscellaneous (6.4%) | | | | |
Southwestern Energy Co. | | (a)414,520 | | 23,097 |
Ultra Petroleum Corp. | | (a)1,094,586 | | 78,263 |
| | | | 101,360 |
Financial — Miscellaneous (5.3%) | | | | |
American Express Co. | | 785,102 | | 40,841 |
Berkshire Hathaway, Inc., Class B | | (a)8,964 | | 42,453 |
| | | | 83,294 |
Health Care Services (0.9%) | | | | |
Stericycle, Inc. | | (a)226,833 | | 13,474 |
Insurance: Multi-Line (2.6%) | | | | |
Loews Corp. | | 805,798 | | 40,564 |
Investment Management Companies (1.1%) | | | | |
Franklin Resources, Inc. | | 148,131 | | 16,951 |
Real Estate Investment Trusts (REIT) (4.5%) | | | | |
Brookfield Asset Management, Inc., Class A | | 1,994,956 | | $ 71,160 |
Restaurants (2.3%) | | | | |
Starbucks Corp. | | (a)1,747,383 | | 35,769 |
Retail (10.2%) | | | | |
Abercrombie & Fitch Co. | | 365,480 | | 29,227 |
Amazon.com, Inc. | | (a)917,979 | | 85,042 |
Costco Wholesale Corp. | | 326,577 | | 22,782 |
Sears Holdings Corp. | | (a)225,637 | | 23,026 |
| | | | 160,077 |
Services: Commercial (6.8%) | | | | |
China Merchants Holdings International Co., Ltd. | | 3,464,000 | | 21,139 |
Corporate Executive Board Co. | | 361,836 | | 21,746 |
eBay, Inc. | | (a)1,936,198 | | 64,262 |
| | | | 107,147 |
Shipping (1.8%) | | | | |
C.H. Robinson Worldwide, Inc. | | 531,349 | | 28,757 |
Steel (1.0%) | | | | |
Nucor Corp. | | 254,234 | | 15,056 |
Textile Apparel Manufacturers(1.5)% | | | | |
Coach, Inc. | | (a)752,708 | | 23,018 |
Utilities: Water (0.9%) | | | | |
Veolia Environnement ADR | | 160,943 | | 14,643 |
Wholesalers (1.8%) | | | | |
Li & Fung Ltd. | | 7,096,000 | | 28,356 |
Total Common Stocks (Cost $1,167,363) | | | | 1,485,106 |
Investment Company (1.5%) | | | | |
Aeroplan Income Fund (Cost $23,018) | | 989,701 | | 23,766 |
Short-Term Investment (1.6%) | | | | |
Investment Company (1.6%) | | | | |
Morgan Stanley Institutional Liquidity | | | | |
Money Market Portfolio | | | | |
— Institutional Class (Cost $24,808) | | (o)24,808,335 | | 24,808 |
Total Investments (97.5%) (Cost $1,215,189) | | (v)1,533,680 |
Other Assets in Excess of Liabilities (2.5%) | | | | 39,903 |
Net Assets (100%) | | | | $1,573,583 |
(a) Non-income producing security.
(d) Security was valued at fair value — At December 31, 2007, the Portfolio held a fair valued security, valued at less than $500, representing less than 0.05% of net assets.
(l) Security has been deemed illiquid at December 31, 2007.
(o) See Note F within the Notes to Financial Statements regarding investment in Morgan Stanley Institutional Liquidity Money Market Portfolio — Institutional Class.
(v) The approximate market value and percentage of the investments, $69,220,000 and 4.5%, respectively, represent the securities that have been fair valued under the fair valuation policy for international investments as described in Note A within the Notes to Financial Statements.
@ Value is less than $500.
ADR American Depositary Receipt
146 | The accompanying notes are an integral part of the financial statements. | |
2007 Annual Report
December 31, 2007
Investment Overview (unaudited)
U.S. Real Estate Portfolio
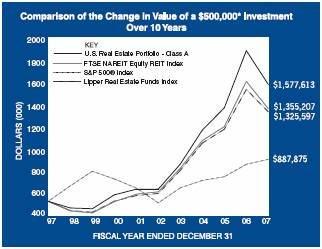
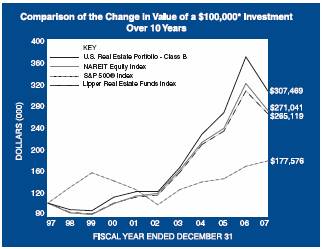
* Minimum Investment
In accordance with SEC regulations, Portfolio’s performance shown assumes that all recurring fees (including management fees) were deducted and all dividends and distributions were reinvested. The performance of Class B shares will vary from the Class A shares based upon its different inception date and will be negatively impacted by additional fees assessed to this class.
Performance Compared to the FTSE NAREIT Equity REIT Index(1), the S&P 500® Index(2) and the Lipper Real Estate Funds Index(3)
| | Total Returns(4) |
| | | | Average Annual | |
| | One | | Five | | Ten | | Since | |
| | Year | | Years | | Years | | Inception(7) | |
| | | | | | | | | |
Portfolio – Class A (5) | | (16.63 | )% | 20.81 | % | 12.18 | % | 16.09 | % |
FTSE NAREIT Equity REIT Index | | (15.69 | ) | 18.17 | | 10.49 | | 13.47 | |
S&P 500® Index | | 5.49 | | 12.83 | | 5.91 | | 10.85 | |
Lipper Real Estate Funds Index | | (13.50 | ) | 18.27 | | 10.24 | | — | |
| | | | | | | | | |
Portfolio – Class B (6) | | (16.80 | ) | 20.51 | | 11.89 | | 15.10 | |
FTSE NAREIT Equity REIT Index | | (15.69 | ) | 18.17 | | 10.49 | | 13.17 | |
S&P 500® Index | | 5.49 | | 12.83 | | 5.91 | | 9.25 | |
Lipper Real Estate Funds Index | | (13.50 | ) | 18.27 | | 10.24 | | 12.73 | |
Performance data quoted represents past performance, which is no guarantee of future results, and current performance may be lower or higher than the figures shown. Performance assumes that all dividends and distributions, if any, were reinvested. For the most recent month-end performance figures, please visit www.morganstanley.com/msim. Investment return and principal value will fluctuate so that Portfolio shares, when redeemed, may be worth more or less than their original cost. Total returns do not reflect the deduction of taxes that a shareholder would pay on Portfolio distributions or the redemption of Portfolio shares.
(1) The FTSE NAREIT Equity REIT Index is an unmanaged market weighted index of tax qualified REITs listed on the New York Stock Exchange, American Stock Exchange and the NASDAQ National Market System, including dividends. The Index is unmanaged and its returns do not include any sales charges or fees. Such costs would lower performance. It is not possible to invest directly in an index.
(2) The S&P 500® Index is a capitalization-weighted index of 500 stocks. The index is designed to measure performance of the broad domestic economy through changes in the aggregate market value of 500 stocks representing all major industries. The Index is unmanaged and its returns do not include any sales charges or fees. Such costs would lower performance. It is not possible to invest directly in an index.
(3) The Lipper Real Estate Funds Index is an equally weighted performance index of the largest qualifying funds (based on net assets) in the Lipper Real Estate Funds classification. The Index, which is adjusted for capital gains distributions and income dividends, is unmanaged and should not be considered an investment. There are currently 30 funds represented in this Index. As of the date of this report, the Portfolio is in the Lipper Real Estate Funds classification.
(4) Total returns for the Portfolio reflect fees waived and expenses reimbursed, if applicable, by the Adviser. Without such waivers and reimbursements, total returns would have been lower. Fee waivers and/or expense reimbursements are voluntary and the Adviser reserves the right to commence or terminate any waiver and/or reimbursement at any time.
(5) Commenced operations on February 24, 1995
(6) Commenced operations on January 2, 1996
(7) For comparative purposes, average annual since inception returns listed for the Indexes refer to the inception date or initial offering of the respective share class of the Portfolio, not the inception of the Index.
The U.S. Real Estate Portfolio (the “Portfolio”) seeks to provide above average current income and long-term capital appreciation by investing primarily in equity securities of companies in the U.S. real estate industry, including real estate investment trusts (“REITs”). The Portfolio’s concentration in
147
2007 Annual Report
December 31, 2007
Investment Overview (cont’d)
U.S. Real Estate Portfolio
the real estate sector makes it subject to greater risk and volatility than other portfolios that are more diversified, and the value of its shares may be substantially affected by economic events in the real estate industry. In addition to the general risks associated with real-estate investment, REIT investing entails other risks, such as credit and interest-rate risk.
Performance
For the year ended December 31, 2007, the Portfolio had a total return based on net asset value and reinvestment of distributions per share of -16.63%, net of fees, for Class A shares and -16.80%, net of fees, for Class B shares. The Portfolio’s Class A and Class B shares underperformed against its benchmarks, the FTSE NAREIT Equity REIT Index (the “Index”) which returned -15.69% and the S&P 500 ®Index which returned 5.49%.
Factors Affecting Performance
• This was a highly volatile year for the real estate investment trust (REIT) sector. REITs rallied strongly in January and through mid-February, peaking with a gain of more than 13%, primarily due to transactional evidence of continued strong underlying asset value growth, take-private activity and related speculation for additional take-private activity. The sector subsequently posted modest declines and then suffered significant weakness in the May to July period as the credit crisis emerged and it became clear that asset values had peaked and that financing for take-private and other highly leveraged transactions was no longer available. Given a lack of transaction activity, declines in REIT share prices appeared to reflect an attempt by the public markets to predict the magnitude of the prospective declines in underlying asset values. REITs rallied briefly from mid-August to mid-October, but reversed course in the final months of the year as the credit crisis continued to worsen and investors began to adjust their expectations for asset values downward.
• The period featured significant dispersion of returns. The key theme appeared to be investors estimating the impact on growth in cash flows of the various real estate sectors as a result of a weaker economy and a change in the financing environment. Generally, this resulted in sectors with assets with shorter-term leases underperforming those sectors with assets with longer- term leases that were viewed as more defensive on a relative basis. Among the three major sectors, the apartment stocks significantly underperformed, office stocks underperformed and retail stocks performed in-line with the Index.
• The apartment sector suffered large declines due to continued concerns with regard to the weakness in the economy. As the sector features short-term leases, investors expect this sector to be the first of the major sectors to be impacted by a slowdown in demand. In addition, investors were concerned with regard to the new competitive rental supply from homes and condominiums. In contrast, advocates for the sector noted the incremental benefit to demand from a dramatically lower propensity to purchase homes versus renting and pointed to the significant discounted share prices relative to underlying values for the majority of the stocks.
• The office sector underperformed despite the longer- term nature of their leases. Investors were concerned that the impact of the subprime crisis on finance and mortgage related firms could negatively impact tenant demand. There was also some concern that property prices could face the most significant declines in this sector as property values appeared to be bolstered to the greatest degree by activity from highly leveraged investors. The mixed office-industrial REITs posted the weakest performance of any sector over the period as these companies have significant exposure to suburban office markets and investors appear to be concerned that they will not be able to post earnings growth due to projections for a stagnation of rental growth in these markets.
• The retail sector performed in-line with the Index despite concerns with regard to a slowdown in consumer spending. The malls performed in-line and the strip shopping centers modestly underperformed the Index, with the shopping centers modestly underperforming the malls as the companies disappointed investors with weaker than expected earnings growth projections for 2008, primarily due to their external activities.
• Among the smaller sectors, the lodging and storage REITs significantly underperformed and the health care and industrial REITs significantly outperformed the Index.
• The Portfolio underperformed the Index for the period. Bottom-up stock selection was favorable but sector allocation detracted from performance. Stock selection was especially strong in the hotel, mall, shopping center and apartment sectors; this was partially offset by stock selection in the office sector. From a top-down perspective, the Portfolio benefited from the underweight to the mixed office-industrial sector; this was offset by the underweight to the health care and industrial sectors and the overweight to the hotel sector.
148
2007 Annual Report
December 31, 2007
Investment Overview (cont’d)
U.S. Real Estate Portfolio
Management Strategies
• We have maintained our core investment philosophy as a real estate value investor. This results in the ownership of stocks whose share prices in our view provide real estate exposure at the best valuation relative to their underlying real estate values. Given the continued shift in investor sentiment toward sectors perceived as more defensive, we believe that valuations for a number of stocks in sectors perceived as less defensive have become even more attractive on a relative basis versus other sectors as well as versus underlying asset values, as share prices for these stocks appear to have more than priced in any prospective decline in underlying fundamentals and asset values. Our company specific research leads us to an overweighting in the Portfolio to a group of companies that are focused in the ownership of upscale urban hotels, apartments, and office properties and an underweighting to companies concentrated in the ownership of strip shopping centers, industrial properties and health care assets.
• We believe that over the medium and long-term, the best indicator for REIT valuations is private real estate values, although there may be periods when the performance of the equity or debt markets may influence short-term funds flows to the sector. While it is likely that investors may increase the required return and risk premium on real estate investments, we believe that longer-term investors will remain committed to maintaining a strategic allocation to the sector due to its potential returns and the diversification benefits from its lack of meaningful correlation to other asset classes.
Expense Examples
As a shareholder of the Portfolio, you may incur two types of costs: (1) transactional costs, including redemption fees; (2) ongoing costs, including management fees, shareholder servicing fees (in the case of Class B); and other Portfolio expenses. These examples are intended to help you understand your ongoing costs (in dollars) of investing in the Portfolio and to compare these costs with the ongoing costs of investing in other mutual funds.
The examples are based on an investment of $1,000 invested at the beginning of the six-month period ended December 31, 2007 and held for the entire six-month period.
Actual Expenses
The first line of the tables below provides information about actual account values and actual expenses. You may use the information in this line, together with the amount you invested, to estimate the expenses that you paid over the period. Simply divide your account value by $1,000 (for example, an $8,600 account value divided by $1,000 = 8.6), then multiply the result by the number in the first line under the heading entitled “Expenses Paid During Period” to estimate the expenses you paid on your account during this period.
Please note that “Expenses Paid During Period” are grossed up to reflect Portfolio expenses prior to the effect of Expense Offset (See Note E in the Notes to Financial Statements). Therefore, the annualized net expense ratios may differ from the ratio of the expenses to average net assets shown in the Financial Highlights.
Hypothetical Example for Comparison Purposes
The second line of the tables below provides information about hypothetical account values and hypothetical expenses based on the Portfolio’s actual expense ratio and an assumed rate of return of 5% per year before expenses, which is not the Portfolio’s actual return. The hypothetical account values and expenses may not be used to estimate the actual ending account balance or expenses you paid for the period. You may use this information to compare the ongoing costs of investing in the Portfolio and other funds. To do so, compare this 5% hypothetical example with the 5% hypothetical examples that appear in the shareholder reports of the other funds.
Please note that the expenses shown in the table are meant to highlight your ongoing costs only and do not reflect any transactional costs, such as redemption fees. Therefore, the second line of the table is useful in comparing ongoing costs only, and will not help you determine the relative total costs of owning different funds. In addition, if these transactional costs were included, your costs would have been higher.
| | Beginning Account Value
July 1, 2007 | | Ending Account
Value
December 31,
2007 | | Expenses Paid
During Period *
July 1, 2007 —
December 31,
2007 | |
Class A | | | | | | | |
Actual | | $1,000.00 | | $ 859.20 | | $4.41 | |
Hypothetical (5% average annual return before expenses) | | 1,000.00 | | 1,020.47 | | 4.79 | |
| | | | | | | |
Class B | | | | | | | |
Actual | | 1,000.00 | | 858.60 | | 5.57 | |
Hypothetical (5% average annual return before expenses) | | 1,000.00 | | 1,019.21 | | 6.06 | |
* Expenses are equal to Class A and Class B annualized net expense ratios of 0.94% and 1.19%, respectively, multiplied by the average account value over the period, multiplied by 184/365 (to reflect the one-half year period).
149
2007 Annual Report
December��31, 2007
Investment Overview (cont’d)
U.S. Real Estate Portfolio
Graphic Presentation of Portfolio Holdings
The following graph depicts the Portfolio’s holdings by industry and/or security type, as a percentage of total investments.
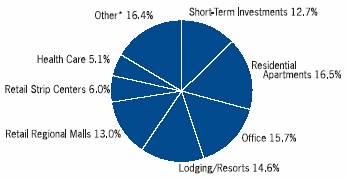
* Industries which do not appear in the above graph, as well as those which represent less than 5% of total investments, if applicable, are included in the category labeled “Other”.
150
2007 Annual Report
December 31, 2007
Portfolio of Investments
U.S. Real Estate Portfolio
| | | | Value |
| | Shares | | (000) |
Common Stocks (98.8%) | | | | |
Diversified (5.1%) | | | | |
Forest City Enterprises, Inc., Class A | | (c)336,771 | | $ 14,966 |
Vornado Realty Trust REIT | | 457,260 | | 40,216 |
| | | | 55,182 |
Health Care (5.7%) | | | | |
Assisted Living Concepts, Inc., Class A | | (a)(c)1,134,750 | | 8,511 |
Cogdell Spencer, Inc. REIT | | 135,380 | | 2,156 |
Healthcare Realty Trust, Inc. REIT | | (c)948,560 | | 24,084 |
Senior Housing Properties Trust REIT | | (c)1,076,809 | | 24,422 |
Universal Health Reality Income Trust REIT | | (c)85,468 | | 3,029 |
| | | | 62,202 |
Industrial (4.3%) | | | | |
AMB Property Corp. REIT | | 260,202 | | 14,977 |
Cabot Industrial Value Fund, LP | | (d)(i)(l)6,667 | | 3,334 |
DCT Industrial Trust, Inc. REIT | | 291,540 | | 2,714 |
Exeter Industrial Value Fund LP | | 850,000 | | 850 |
Keystone Industrial Fund, LP | | (d)(i)(l)6,000,000 | | 5,703 |
Prologis REIT | | (c)302,398 | | 19,166 |
| | | | 46,744 |
Land (0.1%) | | | | |
Plum Creek Timber Co., Inc. REIT | | (c)13,359 | | 615 |
Lodging/Resorts (16.6%) | | | | |
Hersha Hospitality Trust REIT | | (c)837,365 | | 7,955 |
Host Hotels & Resorts, Inc. REIT | | (c)4,239,302 | | 72,238 |
Millennium & Copthorne Hotels plc | | 847,650 | | 6,842 |
Morgans Hotel Group Co. | | (a)(c)745,614 | | 14,375 |
Starwood Hotels & Resorts Worldwide, Inc. | | 1,130,632 | | 49,782 |
Strategic Hotels & Resorts, Inc. REIT | | (c)1,700,989 | | 28,457 |
| | | | 179,649 |
Office (17.8%) | | | | |
Beacon Capital Partners, Inc. | | (a)(d)(i)(l)335,100 | | 79 |
Boston Properties, Inc. REIT | | (c)692,881 | | 63,614 |
Brandywine Realty Trust REIT | | 1,152,649 | | 20,667 |
BRCP REIT I, LLC | | (a)(d)(i)(l)5,934,197 | | 3,275 |
BRCP REIT II, LLC | | (a)(d)(i)(l)5,586,430 | | 5,586 |
Brookfield Properties Corp. | | 2,966,312 | | 57,102 |
Mack-Cali Realty Corp. REIT | | (c)960,568 | | 32,659 |
Parkway Properties, Inc. REIT | | (c)13,304 | | 492 |
SL Green Realty Corp. REIT | | (c)101,043 | | 9,443 |
| | | | 192,917 |
Office/Industrial (4.0%) | | | | |
Duke Realty Corp. REIT | | (c)680,306 | | 17,742 |
Liberty Property Trust REIT | | (c)761,360 | | 21,935 |
PS Business Parks, Inc. REIT | | (c)59,372 | | 3,120 |
| | | | 42,797 |
Residential Apartments (18.7%) | | | | |
Atlantic Gulf Communities Corp. | | (a(d)(i)(l)140,284 | | — |
AvalonBay Communities, Inc. REIT | | (c)539,966 | | 50,832 |
BRE Properties, Inc. REIT | | (c)147,933 | | 5,996 |
Camden Property Trust REIT | | (c)367,971 | | 17,718 |
Equity Residential Properties Trust REIT | | 2,322,766 | | $ 84,711 |
Essex Property Trust, Inc. REIT | | (c)176,240 | | 17,182 |
GMH Communities Trust REIT | | (c)475,205 | | 2,623 |
Post Properties, Inc. REIT | | (c)667,382 | | 23,439 |
| | | | 202,501 |
Residential Manufactured Homes (1.7%) | | | | |
Equity Lifestyle Properties, Inc. REIT | | (c)406,109 | | 18,547 |
Retail Regional Malls (14.7%) | | | | |
General Growth Properties, Inc. REIT | | 259,045 | | 10,667 |
Macerich Co. (The) REIT | | (c)560,382 | | 39,821 |
Simon Property Group, Inc. REIT | | (c)1,179,054 | | 102,413 |
Taubman Centers, Inc. REIT | | (c)136,728 | | 6,726 |
| | | | 159,627 |
Retail Strip Centers (6.8%) | | | | |
Acadia Realty Trust REIT | | (c)333,423 | | 8,539 |
BPP Liquidating Trust REIT | | (a)(d)(l)113,290 | | 6 |
Cedar Shopping Centers, Inc. REIT | | (c)236,944 | | 2,424 |
Developers Diversified Realty Corp. REIT | | (c)115,940 | | 4,439 |
Equity One, Inc. REIT | | (c)22,217 | | 512 |
Federal Realty Investment Trust REIT | | (c)158,428 | | 13,015 |
Ramco-Gershenson Properties Trust REIT | | (c)134,955 | | 2,884 |
Regency Centers Corp. REIT | | (c)641,282 | | 41,356 |
Weingarten Realty Investors REIT | | (c)13,050 | | 410 |
| | | | 73,585 |
Self Storage (3.3%) | | | | |
Public Storage, Inc. REIT | | 338,918 | | 24,880 |
Sovran Self Storage, Inc. REIT | | (c)258,902 | | 10,382 |
U-Store-It Trust REIT | | (c)87,010 | | 797 |
| | | | 36,059 |
Total Common Stocks (Cost $1,029,405) | | | | 1,070,425 |
Preferred Stocks (0.0%) | | | | |
Residential Apartments (0.0%) | | | | |
Atlantic Gulf Communities Corp., Series B | | (a)(d)(i)(l)107,021 | | — |
Atlantic Gulf Communities Corp., Series B (Convertible) | | (a)(d)(i)(l)75,765 | | — |
Total Preferred Stocks (Cost $1,828) | | | | — |
| | Face | | |
| | Amount | | |
| | (000) | | |
Short-Term Investments (14.4%) | | |
Short-Term Debt Securities held as Collateral on Loaned Securities (14.4%) | | |
Alliance & Leicester plc, | | | | |
5.26%, 9/2/08 | | $ | (h)4,674 | | 4,674 |
Bancaja, | | | | |
5.35%, 8/12/08 | | 2,337 | | 2,337 |
Bank of New York Co., Inc., | | | | |
5.24%, 8/8/08 | | (h)2,337 | | 2,337 |
BASF AG, | | | | |
5.18%, 8/19/08 | | (h)2,337 | | 2,337 |
BNP Paribas plc, | | | | |
4.90%, 5/19/08 | | (h)4,674 | | 4,674 |
CAM US Finance S.A. Unipersonal, | | | | |
5.24%, 7/25/08 | | (h)9,348 | | 9,348 |
| | | | | |
| The accompanying notes are an integral part of the financial statements. | 151 |
2007 Annual Report
December 31, 2007
Portfolio of Investments (cont’d)
U.S. Real Estate Portfolio
| | Face | | |
| | Amount | | Value |
| | (000) | | (000) |
Short-Term Debt Securities held as Collateral on Loaned Securities (cont’d) | | |
Canadian Imperial Bank of Commerce, New York, | | | | |
4.42%, 7/28/08 | | $ | (h)4,674 | | $ | 4,674 |
CC USA, Inc., | | | | |
3.89%, 1/28/08 | | (h)2,336 | | 2,336 |
CIT Group Holdings, | | | | |
5.23%, 6/18/08 | | (h)8,413 | | 8,413 |
Citigroup Global Markets Holdings, Inc., | | | | |
4.51%, 1/2/08 | | 31,861 | | 31,861 |
Credit Suisse First Boston, New York, | | | | |
4.32%, 3/14/08 | | (h)4,674 | | 4,674 |
First Tennessee Bank, | | | | |
5.05%, 8/15/08 | | (h)2,337 | | 2,337 |
5.06%, 8/15/08 | | (h)9,347 | | 9,347 |
Goldman Sachs Group, Inc., | | | | |
4.62%, 2/13/09 | | (h)4,393 | | 4,393 |
5.10%, 9/12/08 | | (h)2,337 | | 2,337 |
HSBC Finance Corp., | | | | |
5.26%, 8/5/08 | | (h)2,337 | | 2,337 |
IBM Corp., | | | | |
5.27%, 9/8/08 | | (h)9,348 | | 9,348 |
Lehman Brothers, Inc., | | | | |
4.49%, 1/2/08 | | 3,986 | | 3,986 |
Macquarie Bank Ltd., | | | | |
4.95%, 8/20/08 | | (h)4,674 | | 4,674 |
Metropolitan Life Global Funding, | | | | |
4.89%, 8/21/08 | | (h)7,011 | | 7,011 |
National Bank of Canada, | | | | |
5.21%, 4/2/08 | | (h)9,347 | | 9,347 |
National Rural Utilities Cooperative Finance Corp., | | | | |
5.24%, 9/2/08 | | (h)9,348 | | 9,348 |
Nationwide Building Society, | | | | |
4.92%, 7/28/08 | | (h)5,421 | | 5,421 |
Unicredito Italiano Bank (Ireland) plc, | | | | |
5.04%, 8/14/08 | | (h)5,141 | | 5,141 |
5.26%, 8/8/08 | | (h)3,272 | | 3,272 |
Total Short-Term Investments (Cost $155,964) | | | | 155,964 |
Total Investments (113.2%) (Cost $1,187,197) — | | | | |
including $153,417 of Securities Loaned | | | | (v) 1,226,389 |
Liabilities in Excess of Other Assets (-13.2%) | | | | (142,992) |
Net Assets (100%) | | | | $1,083,397 |
| | | | | | |
(a) | Non-income producing security. |
(c) | All or a portion of security on loan at December 31, 2007. |
(d) | Security was valued at fair value — At December 31, 2007, the Portfolio held approximately $17,983,000 of fair valued securities, representing 1.7% of net assets. |
(h) | Variable/Floating Rate Security — Interest rate changes on these instruments are based on changes in a designated base rate. The rates shown are those in effect on December 31, 2007. |
(i) | Restricted security valued at fair value and not registered under the Securities Act of 1933. Atlantic Gulf Communities Corp. was acquired 6/97 and has a current cost basis of $790,000. Atlantic Gulf Communities Corp., Series B Preferred was acquired 2/00 and has a current cost basis of $758,000. Atlantic Gulf Communities Corp., Series B Preferred was acquired 6/97 and has a current cost basis of $1,070,000. Beacon Capital Partners, Inc. was acquired 3/98 and has a current cost basis of $1,010,000. BRCP REIT I, LLC was acquired 5/03 - 11/06 and has a current cost basis of $3,987,000. BRCP REIT II, LLC was acquired 10/06 - 6/07 and has a current cost basis of $4,875,000. Cabot Industrial Value Fund, LP was acquired 11/05 - 6/07 and has a current cost basis of 2,501,000. Keystone Industries Fund, LP was acquired 10/05 - 5/07 and has a current cost basis of $4,694,000. At December 31, 2007, these securities had an aggregate market value of $16,610,000 representing 1.6% of net assets. |
(l) | Security has been deemed illiquid at December 31, 2007. |
(v) | The approximate market value and percentage of the investments, $6,842,000 and 0.6%, respectively, represent the securities that have been fair valued under the fair valuation policy for international investments as described in Note A within the Notes to Financial Statements. |
@ | Value is less than $500. |
REIT | Real Estate Investment Trust |
152 | The accompanying notes are an integral part of the financial statements. | |
2007 Annual Report
December 31, 2007
Investment Overview (unaudited)
U.S. Small/Mid Cap Value Portfolio
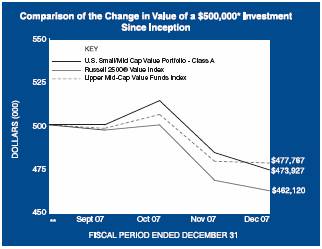
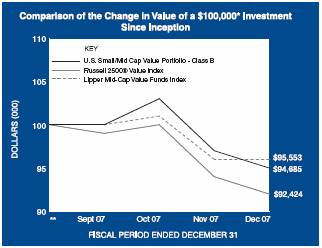
* Minimum Investment
* * Commenced operations on September 27, 2007
In accordance with SEC regulations, Portfolio’s performance shown assumes that all recurring fees (including management fees) were deducted and all dividends and distributions were reinvested. The performance of Class B shares will vary from the Class A shares and will be negatively impacted by additional fees assessed to this class.
Performance Compared to the Russell 2500® Value Index(1) and the Lipper Mid-Cap Value Funds Index(2)
| | Total Returns(3) |
| | Cumulative |
| | Since |
| | Inception(5) |
| | | |
Portfolio – Class A (4) | | (5.21 | )% |
Russell 2500® Value Index | | (7.58 | ) |
Lipper Mid-Cap Value Funds Index | | (4.45 | ) |
| | | |
Portfolio – Class B (4) | | (5.31 | ) |
Russell 2500® Value Index | | (7.58 | ) |
Lipper Mid-Cap Value Funds Index | | (4.45 | ) |
Performance data quoted represents past performance, which is no guarantee of future results, and current performance may be lower or higher than the figures shown. Performance assumes that all dividends and distributions, if any, were reinvested. For the most recent month-end performance figures, please visit www.morganstanley.com/msim. Investment return and principal value will fluctuate so that Portfolio shares, when redeemed, may be worth more or less than their original cost. Total returns do not reflect the deduction of taxes that a shareholder would pay on Portfolio distributions or the redemption of Portfolio shares.
(1) The Russell 2500® Value Index measures the performance of those companies in the Russell 2500® Index with lower price-to-book ratios and lower forecasted growth values. The Index is unmanaged and its returns do not include any sales charges or fees. Such costs would lower performance. It is not possible to invest directly in an index.
(2) The Lipper Mid-Cap Value Funds Index is an equally weighted performance index of the largest qualifying funds (based on net assets) in the Lipper Mid-Cap Value Funds classification. The Index, which is adjusted for capital gains distributions and income dividends, is unmanaged and should not be considered an investment. There are currently 30 funds represented in this Index. As of the date of this report, the Portfolio is in the Lipper Mid-Cap Value Funds classification.
(3) Total returns for the Portfolio reflect fees waived and expenses reimbursed, if applicable, by the Adviser. Without such waivers and reimbursements, total returns would have been lower. Fee waivers and/or expense reimbursements are voluntary and the Adviser reserves the right to commence or terminate any waiver and/or reimbursement at any time.
(4) Commenced operations on September 27, 2007
(5) For comparative purposes, cumulative since inception returns listed for the Indexes refer to the inception date or initial offering of the respective share class of the Portfolio, not the inception of the Index.
U.S. Small/Mid Cap Value Portfolio (the “Portfolio”) seeks long-term capital appreciation by investing primarily in common stocks and other equity securities, including convertible securities, of small- and mid-size companies that the Adviser believes are undervalued relative to the marketplace or to similar companies. Stocks of small and medium-sized companies entail special risks, such as limited product lines, markets, and financial resources, and greater market volatility than securities of larger, more-established companies. In addition to the risks associated with common stocks, investments in convertible securities are subject to the risks associated with fixed-income securities, namely credit, price and interest-rate risks.
153
2007 Annual Report | |
|
December 31, 2007 |
Investment Overview (cont’d)
U.S. Small/Mid Cap Value Portfolio
Performance
For the period from September 27, 2007 (commencement of operations) to December 31, 2007, the Portfolio had a total return based on net asset value and reinvestment of distributions per share of -5.21%, net of fees, for Class A shares and -5.31%, net of fees, for Class B shares. The Portfolio’s Class A and Class B shares outperformed against its benchmark, the Russell 2500® Value Index (the “Index”) which returned -7.58% for the same period.
Factors Affecting Performance
· During the period from inception through December 31, 2007, U.S. equities experienced significant volatility, ending the period lower. Although the S&P 500® Index hit a record high early in the fourth quarter, stocks subsequently came under considerable pressure. Third-quarter Gross Domestic Product was better than expected, and later revised higher, yet consumer confidence and spending data fell, the housing market continued to weaken, oil prices reached record highs, and many commodity prices rose. Revived inflation concerns caused some speculation that the Federal Reserve’s hands could be tied in terms of potential future rate cuts. Moreover, a number of large financial institutions reported significant write-downs related to mortgages and other debt obligations. Broadly speaking, third-quarter corporate earnings declined, with many analysts pessimistic about the outlook for fourth-quarter earnings. With credit markets remaining tight and the dollar continuing to weaken, investor fears of a possible recession seemed to intensify.
· In this period, small cap stocks lagged the broad market averages, although absolute returns were negative for indexes across the capitalization spectrum. Value stocks also underperformed growth stocks during the period. The Index’s performance was driven by the energy, health care and utilities sectors. The consumer discretionary, autos and transportation, financial services, and technology sectors had the largest declines in the Index.
· In terms of the Portfolio’s performance, stock selection within the financial services sector was among the largest positive contributors to relative performance. Strong performance from holdings in insurance stocks and a financial data processing services and systems stock - combined with minimal exposure to banks, real estate investment trusts (REITs), and savings and loans - -drove gains.
· Strong stock selection in the materials and processing sector and the technology sector also added value.
· Along with positive stock selection, an underweight in the financial services sector was favorable for relative performance, as was an overweight in the producer durables sector.
· The leading detractors from relative returns during the period included stock selection in the health care sector, in which holdings of health care services related stocks performed poorly. An underweight in the utilities sector and an overweight in the consumer discretionary sector further hampered relative gains.
Management Strategies
· Our bottom-up, value-driven stock selection process resulted in significant underweights in the utilities sector and the financial services sector, especially banks and REITs (though insurance and reinsurance represented overweights), along with no exposure to the autos and transportation sector. The largest relative overweights in the Portfolio included the producer durables sector, mainly in aerospace, office supplies, and telecom equipment; and the consumer discretionary sector, especially business services and commercial printing. At the Portfolio’s inception our stock selection yielded a slightly overweight position in the technology sector, which we gradually increased by the close of the period.
Expense Examples
As a shareholder of the Portfolio, you may incur two types of costs: (1) transactional costs, including redemption fees; (2) ongoing costs, including management fees, shareholder servicing fees (in the case of Class B); and other Portfolio expenses. These examples are intended to help you understand your ongoing costs (in dollars) of investing in the Portfolio and to compare these costs with the ongoing costs of investing in other mutual funds.
The examples are based on an investment of $1,000 invested at the beginning of the six-month period ended December 31, 2007 and held for the entire six-month period.
Actual Expenses
The first line of the tables below provides information about actual account values and actual expenses. You may use the information in this line, together with the amount you invested, to estimate the expenses that you paid over the period. Simply divide your account value by $1,000 (for example, an $8,600 account value divided by $1,000 = 8.6), then multiply the result by the number in the first line under the heading entitled “Expenses Paid During Period” to estimate the expenses you paid on your account during this period.
154
| 2007 Annual Report |
|
December 31, 2007 |
Investment Overview (cont’d)
U.S. Small/Mid Cap Value Portfolio
Please note that both classes within the Portfolio commenced operations on September 27, 2007, however, expenses did not begin accruing until September 28, 2007; therefore, ‘‘Actual Expenses Paid During Period” reflect activity from September 28, 2007 through December 31, 2007.
Please note that “Expenses Paid During Period” are grossed up to reflect Portfolio expenses prior to the effect of Expense Offset (See Note E in the Notes to Financial Statements). Therefore, the annualized net expense ratios may differ from the ratio of the expenses to average net assets shown in the Financial Highlights.
Hypothetical Example for Comparison Purposes
The second line of the tables below provides information about hypothetical account values and hypothetical expenses based on the Portfolio’s actual expense ratio and an assumed rate of return of 5% per year before expenses, which is not the Portfolio’s actual return. The hypothetical account values and expenses may not be used to estimate the actual ending account balance or expenses you paid for the period. You may use this information to compare the ongoing costs of investing in the Portfolio and other funds. To do so, compare this 5% hypothetical example with the 5% hypothetical examples that appear in the shareholder reports of the other funds.
Please note that while the Portfolio commenced operations on September 27, 2007, the “Hypothetical Expenses Paid During the Period” reflect projected activity for the full six month period for the purposes of comparability. This projection assumes that the annualized expense ratio for the period was in effect during the period from July 1, 2007 through December 31, 2007.
Please note that the expenses shown in the table are meant to highlight your ongoing costs only and do not reflect any transactional costs, such as redemption fees. Therefore, the second line of the table is useful in comparing ongoing costs only, and will not help you determine the relative total costs of owning different funds. In addition, if these transactional costs were included, your costs would have been higher.
| | Beginning
Account Value* | | Ending
Account Value
December 31,
2007 | | Expenses Paid
During Period*
September 28,
2007 —
December 31,
2007 | |
Class A | | | | | | | |
Actual | | $1,000.00 | | $ 947.90 | | $3.30 | |
Hypothetical (5% average annual return before expenses) | | 1,000.00 | | 1,018.65 | | 6.61 | |
| | | | | | | |
Class B | | | | | | | |
Actual | | 1,000.00 | | 946.90 | | 3.93 | |
Hypothetical (5% average annual return before expenses) | | 1,000.00 | | 1,017.39 | | 7.88 | |
* Expenses are equal to Class A and Class B annualized net expense ratios of 1.30% and 1.55%, respectively, multiplied by the average account value over the period, multiplied by 95/365 (to reflect the actual days in the period for the actual example) and multiplied by 184/365 (to reflect the one-half year period).
Graphic Presentation of Portfolio Holdings
The following graph depicts the Portfolio’s holdings by industry and/or security type, as a percentage of total investments.
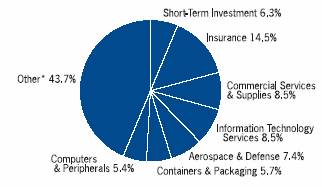
* Industries which do not appear in the above graph, as well as those which represent less than 5% of total investments, if applicable, are included in the category labeled “Other”.
155
2007 Annual Report | |
|
December 31, 2007 |
Portfolio of Investments
U.S. Small/Mid Cap Value Portfolio
| | | | Value |
| | Shares | | (000) |
Common Stocks (92.7%) | | | | |
Aerospace & Defense (7.4%) | | | | |
Alliant Techsystems, Inc. | | (a)4,000 | | $ 455 |
DRS Technologies, Inc. | | 5,600 | | 304 |
Goodrich Corp. | | 5,700 | | 403 |
Spirit Aerosystems Holdings, Inc., Class A | | (a)9,800 | | 338 |
| | | | 1,500 |
Beverages (1.7%) | | | | |
Molson Coors Brewing Co., Class B | | 6,800 | | 351 |
Chemicals (3.9%) | | | | |
Agrium, Inc. | | 4,000 | | 289 |
Cytec Industries, Inc. | | 4,800 | | 295 |
Scotts Miracle-Gro Co. (The), Class A | | 5,400 | | 202 |
| | | | 786 |
Commercial Services & Supplies (8.6%) | | | | |
ACCO Brands Corp. | | (a)32,900 | | 527 |
Brink’s Co. (The) | | 8,500 | | 508 |
Cenveo, Inc. | | (a)20,200 | | 353 |
RR Donnelley & Sons Co. | | 9,300 | | 351 |
| | | | 1,739 |
Computers & Peripherals (5.4%) | | | | |
Electronics for Imaging | | (a)18,100 | | 407 |
MSC.Software Corp. | | (a)24,300 | | 315 |
Teradata Corp. | | (a)13,600 | | 373 |
| | | | 1,095 |
Containers & Packaging (5.7%) | | | | |
Owens-Illinois, Inc. | | (a)6,100 | | 302 |
Pactiv Corp. | | (a)15,300 | | 407 |
Smurfit-Stone Container Corp. | | (a)42,400 | | 448 |
| | | | 1,157 |
Diversified Telecommunication Services (1.6%) | | | | |
CenturyTel, Inc. | | 7,600 | | 315 |
Electric Utilities (0.5%) | | | | |
PNM Resources, Inc. | | 4,600 | | 99 |
Electrical Equipment (4.7%) | | | | |
Acuity Brands, Inc. | | 4,600 | | 207 |
Belden, Inc. | | 11,700 | | 521 |
General Cable Corp. | | (a)2,900 | | 212 |
| | | | 940 |
Energy Equipment & Services (2.4%) | | | | |
Exterran Holdings, Inc. | | (a)3,800 | | 311 |
Superior Energy Services | | (a)5,200 | | 179 |
| | | | 490 |
Food Products (2.7%) | | | | |
Corn Products International, Inc. | | 15,100 | | 555 |
Gas Utilities (1.7%) | | | | |
UGI Corp. | | 12,900 | | 352 |
Health Care Providers & Services (4.0%) | | | | |
Apria Healthcare Group, Inc. | | (a)8,700 | | 188 |
IMS Health, Inc. | | 13,900 | | 320 |
PerkinElmer, Inc. | | 11,700 | | 304 |
| | | | 812 |
Hotels Restaurants & Leisure (1.0%) | | | | |
AFC Enterprises | | (a)17,200 | | $ | 195 |
Household Durables (2.2%) | | | | |
Snap-On, Inc. | | 9,000 | | 434 |
Information Technology Services (8.5%) | | | | |
Broadridge Financial Solutions, Inc. | | 25,100 | | 563 |
Computer Sciences Corp. | | (a)6,100 | | 302 |
MAXIMUS, Inc. | | 22,200 | | 857 |
Metavante Technologies, Inc. | | (a)1 | | @— |
| | | | 1,722 |
Insurance (14.6%) | | | | |
Assurant, Inc. | | 10,000 | | 669 |
Conseco, Inc. | | (a)41,600 | | 523 |
Everest Re Group Ltd. | | 3,500 | | 351 |
Hanover Insurance Group, Inc. (The) | | 9,659 | | 442 |
Markel Corp. | | (a)800 | | 393 |
Reinsurance Group of America, Inc. | | 5,900 | | 310 |
White Mountains Insurance Group Ltd. | | 500 | | 257 |
| | | | 2,945 |
Machinery (1.2%) | | | | |
Kennametal, Inc. | | 6,200 | | 235 |
Media (0.7%) | | | | |
Sinclair Broadcast Group, Inc., Class A | | 17,500 | | 144 |
Office Electronics (1.8%) | | | | |
Zebra Technologies Corp. | | (a)10,400 | | 361 |
Oil, Gas & Consumable Fuels (1.6%) | | | | |
Pioneer Natural Resources Co. | | 6,800 | | 332 |
Paper & Forest Products (1.4%) | | | | |
MeadWestvaco Corp. | | 9,200 | | 288 |
Pharmaceuticals (1.6%) | | | | |
Barr Laboratories, Inc. | | (a)6,000 | ) | 319 |
Real Estate (1.5%) | | | | |
Host Hotels & Resorts, Inc. REIT | | 17,400 | | 296 |
Road & Rail (1.0%) | | | | |
Avis Budget Group, Inc. | | (a)15,500 | | 202 |
Software (1.6%) | | | | |
Amdocs Ltd. | | (a)9,500 | | 327 |
Specialty Retail (1.1%) | | | | |
PetSmart, Inc. | | 9,700 | | 228 |
Textiles, Apparel & Luxury Goods (2.1%) | | | | |
Hanesbrands, Inc. | | (a)15,200 | | 413 |
Thrifts & Mortgage Finance (0.5%) | | | | |
TFS Financial Corp. | | (a)8,600 | | 103 |
Total Common Stocks (Cost $19,831) | | | | 18,735 |
| | | | |
| | Face | | |
| | Amount | | |
| | (000) | | |
Fixed Income Security (1.8%) | | | | |
Industrials (1.8%) | | | | |
Invitrogen Corp. (Convertible), | | | | |
1.50%, 2/15/24 | | | | |
(Cost $329) | | $ | 333 | | 353 |
| | | | | | |
156 | The accompanying notes are an integral part of the financial statements. |
2007 Annual Report
December 31, 2007
Portfolio of Investments (cont’d)
U.S. Small/Mid Cap Value Portfolio
| | | | Value |
| | Shares | | (000) |
Short-Term Investment (6.3%) | | | | |
Investment Company (6.3%) | | | | |
Morgan Stanley Institutional Liquidity | | | | |
Money Market Portfolio | | | | |
— Institutional Class (Cost $1,278) | | (o)1,278,267 | | $ | 1,278 |
Total Investments (100.8%) (Cost $21,438) | | | | 20,366 |
Liabilities in Excess of Other Assets (-0.8%) | | | | (159) |
Net Assets (100%) | | | | $ | 20,207 |
(a) | Non-income producing security. |
(o) | See Note F within the Notes to Financial Statements regarding investment in Morgan Stanley Institutional Liquidity Money Market Portfolio — Institutional Class. |
@ | Value is less than $500. |
REIT | Real Estate Investment Trust |
The accompanying notes are an integral part of the financial statements. | 157 |
2007 Annual Report | |
| |
December 31, 2007 | |
Investment Overview (unaudited)
Emerging Markets Debt Portfolio
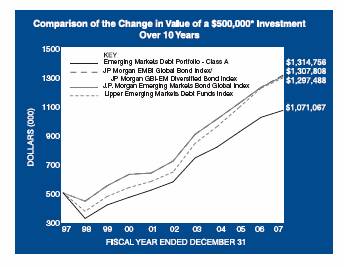
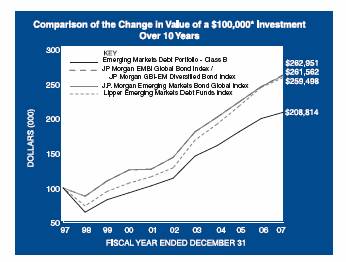
* Minimum Investment
In accordance with SEC regulations, Portfolio’s performance shown assumes that all recurring fees (including management fees) were deducted and all dividends and distributions were reinvested. The performance of Class B shares will vary from the Class A shares based upon its different inception date and will be negatively impacted by additional fees assessed to this class.
Performance Compared to the J.P. Morgan EMBI Global Bond Index/J.P. Morgan GBI-EM Diversified Bond Index(1) , J.P. Morgan Emerging Markets Bond Global Index(2) and the Lipper Emerging Markets Debt Funds Index(3)
| | Total Returns(4) |
| | | | Average Annual |
| | One
Year | | Five
Years | | Ten
Years | | Since
Inception | (7) |
Portfolio – Class A (5) | | 4.68 | % | | 13.22 | % | | 7.92 | % | 10.85 | % | |
J.P. Morgan EMBI Global Bond Index/ | | | | | | | | | | | | |
J.P. Morgan GBI-EM Diversified Bond Index | | 6.84 | | | 12.79 | | | 10.15 | | 10.62 | | |
J.P. Morgan Emerging Markets Bond Global Index | | 6.28 | | | 12.67 | | | 10.09 | | 10.58 | | |
Lipper Emerging Markets Debt Funds Index | | 5.88 | | | 15.04 | | | 10.01 | | — | | |
| | | | | | | | | | | | |
Portfolio – Class B (6) | | 4.29 | | | 12.89 | | | 7.64 | | 11.42 | | |
J.P. Morgan EMBI Global Bond Index/ | | | | | | | | | | | | |
J.P. Morgan GBI-EM Diversified Bond Index | | 6.84 | | | 12.79 | | | 10.15 | | 12.09 | | |
J.P. Morgan Emerging Markets Bond Global Index | | 6.28 | | | 12.67 | | | 10.09 | | 12.05 | | |
Lipper Emerging Markets Debt Funds Index | | 5.88 | | | 15.04 | | | 10.01 | | 12.53 | | |
Performance data quoted represents past performance, which is no guarantee of future results, and current performance may be lower or higher than the figures shown. Performance assumes that all dividends and distributions, if any, were reinvested. For the most recent month-end performance figures, please visit www.morganstanley.com/msim. Investment return and principal value will fluctuate so that Portfolio shares, when redeemed, may be worth more or less than their original cost. Total returns do not reflect the deduction of taxes that a shareholder would pay on Portfolio distributions or the redemption of Portfolio shares.
(1) | J.P. Morgan EMBI Global Bond Index/J.P. Morgan GBI-EM Diversified Bond Index is a custom index represented by performance of the J.P. Morgan EMBI Global Bond Index (which tracks the performance U.S. dollar - denominated debt instruments issued by emerging markets) for periods from the Portfolio’s inception to September 30, 2007 and the J.P. Morgan GBI-EM Diversified Bond Index (which tracks local currency government bonds issued by emerging markets) for periods thereafter. The J.P. Morgan EMBI Global Bond Index was changed to the J.P. Morgan GBI-EM Diversified Bond Index on October 1, 2007 to more accurately reflect the Portfolio’s amended investible universe effective October 1, 2007 to invest in emerging market debt securities that are denominated in local currencies. The Index is unmanaged and its returns do not include any sales charges or fees. Such costs would lower performance. It is not possible to invest directly in an index. |
(2) | The J.P. Morgan Emerging Markets Bond Global Index (“J.P. Morgan EMBI Global Bond Index”) tracks total returns for U.S. dollar - denominated debt instruments issued by emerging market sovereign and quasi - sovereign entities, including Brady Bonds, loans, Eurobonds and local market instruments for over 30 emerging market countries. The Index is unmanaged and its returns do not include any sales charges or fees. Such costs would lower performance. It is not possible to invest directly in an index. |
(3) | The Lipper Emerging Markets Debt Funds Index is an equally weighted performance index of the largest qualifying funds (based on net assets) in the Lipper Emerging Markets Debt Funds classification. The Index, which is adjusted for capital gains distributions and income dividends, is unmanaged and should not |
158
| 2007 Annual Report |
| |
| December 31, 2007 |
Investment Overview (cont’d)
Emerging Markets Debt Portfolio
be considered an investment. There are currently 10 funds represented in this Index. As of the date of this report, the Portfolio is in the Lipper Emerging Markets Debt Funds classification.
(4) Total returns for the Portfolio reflect fees waived and expenses reimbursed, if applicable, by the Adviser. Without such waivers and reimbursements, total returns would have been lower. Fee waivers and/or expense reimbursements are voluntary and the Adviser reserves the right to commence or terminate any waiver and/or reimbursement at any time.
(5) Commenced operations on February 1, 1994
(6) Commenced operations on January 2, 1996
(7) For comparative purposes, average annual since inception returns listed for the Indexes refer to the inception date or initial offering of the respective share class of the Portfolio, not the inception of the Index.
The Emerging Markets Debt Portfolio (the “Portfolio”) seeks high total return by investing primarily in fixed income securities of government and government-related issuers and, to a lesser extent, of corporate issuers in emerging market countries. Foreign investing involves certain risks, including currency fluctuations and controls, restrictions on foreign investments, less governmental supervision and regulation, less liquidity and the potential for market volatility and political instability. In addition, investing in emerging markets may involve a relatively higher degree of volatility. Fixed income securities are subject to credit and interest-rate risk. Credit risk refers to the ability of an issuer to make timely payments of interest and principal. Interest-rate risk refers to fluctuations in the value of a fixed-income security resulting from changes in the general level of interest rates. In a declining interest-rate environment, the portfolio may generate less income. In a rising interest-rate environment, bond prices fall.
Performance
For the year ended December 31, 2007, the Portfolio had a total return based on net asset value and reinvestment of distributions per
share of 4.68%, net of fees, for Class A shares and 4.29%, net of fees, for Class B shares. The Portfolio’s Class A and Class B shares underperformed against its benchmarks, the J.P. Morgan EMBI Global Bond Index/J.P. Morgan GBI-EM Diversified Bond Index, which returned 6.84%, and the J.P. Morgan Emerging Markets Bond Global Index, which returned 6.28%.
Factors Affecting Performance
· Although emerging market economies were generally insulated from the credit and liquidity crisis emanating from the U.S., yield spreads of U.S. dollar denominated emerging market bonds moved wider, ending the period 84 basis points higher than at the start of the year. Nonetheless, emerging market debt (“EMD”) performed quite strongly for the one-year period, with performance of local currency far outpacing that of external debt in emerging economies.
· Economic growth across the EMD universe remained strong, with growth rates exceeding 7%. Emerging market currencies rallied against the U.S. dollar as the prospect of slower economic growth and lower interest rates in the U.S. put considerable pressure on the dollar. As a result, local currency denominated debt enjoyed strong returns.
· An emphasis on local currency denominated securities in the Portfolio was additive to performance. An underweight in Pakistani debt was also beneficial as ongoing political strife in the country hurt bond performance. Security selection in Venezuela also helped boost returns.
· Detractors from performance in the Portfolio included overweights in Russian quasi-sovereign bonds and Argentine domestic bonds.
Management Strategies
· The Portfolio favored local currency denominated securities in Brazil, Mexico, Turkey, and a few other smaller countries. We saw significant value in local currency denominated EMD securities relative to U.S. dollar denominated debt.
· Later in the year, we focused on countries with strong liquidity positions or countries less dependent on international capital markets for financing.
· Effective the fourth quarter of 2007, the Portfolio’s investment focus shifted from external (U.S. dollar denominated) debt to local currency debt. In our view, the local currency market offers greater relative value for a variety of reasons. Unlike in the external debt market, valuations in local currency debt have generally lagged fundamental macroeconomic improvements in the emerging market countries. Local EMD markets also offer the potential for currency gains as well as greater relative diversification due to their low correlation with equity and other fixed income asset classes. Local emerging market returns are more subject to local macroeconomic and policy outcomes and therefore, are less prone to contagion. To reflect the Portfolio’s change in focus, its benchmark has changed to the J.P. Morgan GBI-EM Global Diversified Bond Index.
Expense Examples
As a shareholder of the Portfolio, you may incur two types of costs: (1) transactional costs, including redemption fees; (2) ongoing costs, including management fees, shareholder servicing fees (in the case of Class B); and other Portfolio expenses. These examples are intended to help you understand your ongoing costs (in dollars) of investing in the Portfolio
159
2007 Annual Report | |
| |
December 31, 2007 | |
Investment Overview (cont’d)
Emerging Markets Debt Portfolio
and to compare these costs with the ongoing costs of investing in other mutual funds.
The examples are based on an investment of $1,000 invested at the beginning of the six-month period ended December 31, 2007 and held for the entire six-month period.
Actual Expenses
The first line of the tables below provides information about actual account values and actual expenses. You may use the information in this line, together with the amount you invested, to estimate the expenses that you paid over the period. Simply divide your account value by $1,000 (for example, an $8,600 account value divided by $1,000 = 8.6), then multiply the result by the number in the first line under the heading entitled “Expenses Paid During Period” to estimate the expenses you paid on your account during this period.
Please note that “Expenses Paid During Period” are grossed up to reflect Portfolio expenses prior to the effect of Expense Offset (See Note E in the Notes to Financial Statements). Therefore, the annualized net expense ratios may differ from the ratio of the expenses to average net assets shown in the Financial Highlights.
Hypothetical Example for Comparison Purposes
The second line of the tables below provides information about hypothetical account values and hypothetical expenses based on the Portfolio’s actual expense ratio and an assumed rate of return of 5% per year before expenses, which is not the Portfolio’s actual return. The hypothetical account values and expenses may not be used to estimate the actual ending account balance or expenses you paid for the period. You may use this information to compare the ongoing costs of investing in the Portfolio and other funds. To do so, compare this 5% hypothetical example with the 5% hypothetical examples that appear in the shareholder reports of the other funds.
Please note that the expenses shown in the table are meant to highlight your ongoing costs only and do not reflect any transactional costs, such as redemption fees. Therefore, the second line of the table is useful in comparing ongoing costs only, and will not help you determine the relative total costs of owning different funds. In addition, if these transactional costs were included, your costs would have been higher.
| | Beginning
Account Value
July 1, 2007 | | | Ending
Account Value
December 31,
2007 | | | Expenses Paid
During Period*
July 1, 2007 —
December 31,
2007 | | |
Class A | | | | | | | |
Actual | | $1,000.00 | | $1,018.70 | | $4.83 | |
Hypothetical (5% average annual return before expenses) | | 1,000.00 | | 1,020.42 | | 4.84 | |
| | | | | | | |
Class B | | | | | | | |
Actual | | 1,000.00 | | 1,018.00 | | 6.21 | |
Hypothetical (5% average annual return before expenses) | | 1,000.00 | | 1,019.06 | | 6.21 | |
* | Expenses are equal to Class A and Class B annualized net expense ratios of 0.95% and 1.22%, respectively, multiplied by the average account value over the period, multiplied by 184/365 (to reflect the one-half year period). |
Graphic Presentation of Portfolio Holdings
The following graph depicts the Portfolio’s holdings by industry and/or security type, as a percentage of total investments.
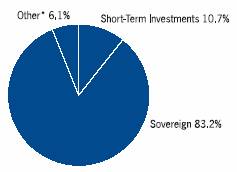
* | Industries which do not appear in the above graph, as well as those which represent less than 5% of total investments, if applicable, are included in the category labeled “Other”. |
160
| 2007 Annual Report |
| |
| December 31, 2007 |
Portfolio of Investments
Emerging Markets Debt Portfolio
| | | Face | | | |
| | | Amount | | Value | |
| | | (000) | | (000) | |
Debt Instruments (93.8%) | | | | | | | |
Argentina (5.6%) | | | | | | | |
Sovereign (5.6%) | | | | | | | |
Republic of Argentina, | | | | | | | |
1.32%, 12/15/35 | | $ | (d)(h) 298 | | $ 34 | | |
1.38%, 12/15/35 | | ARS | (h)16,231 | | 458 | | |
5.83%, 12/31/33 | | $ | 5,000 | | 1,874 | | |
8.28%, 12/31/33 | | | (d)119 | | 114 | | |
Republic of Argentina (Linked Variable Rate), | | | | | | | |
41.43%, (expired maturity) | | | (b)1,120 | | 528 | | |
| | | | | 3,008 | | |
Brazil (16.0%) | | | | | | | |
Corporate (1.0%) | | | | | | | |
Banco ABN Amro Real S.A., | | | | | | | |
16.20%, 2/22/10 | | BRL | 890 | | 540 | | |
Sovereign (15.0%) | | | | | | | |
Citigroup, Inc., Nota do Tesouro Nacional | | | | | | | |
Credit Linked Notes, | | | | | | | |
6.00%, 5/18/09 | | | 800 | | 1,087 | | |
Federative Republic of Brazil, | | | | | | | |
10.00%, 1/1/14 | | | 11,600 | | 6,036 | | |
JPMorgan Chase & Co., Nota do Tesouro | | | | | | | |
Nacional Credit Linked Notes, | | | | | | | |
10.00%, 1/1/12 | | | 1,710 | | 922 | | |
| | | | | 8,045 | | |
| | | | | 8,585 | | |
Colombia (3.4%) | | | | | | | |
Sovereign (3.4%) | | | | | | | |
Republic of Colombia, | | | | | | | |
12.00%, 10/22/15 | | COP | 3,300,000 | | 1,832 | | |
Egypt (3.9%) | | | | | | | |
Sovereign (3.9%) | | | | | | | |
Arab Republic of Egypt, | | | | | | | |
8.75%, 7/18/12 | | EGP | (e)11,120 | | 2,078 | | |
Hungary (11.9%) | | | | | | | |
Sovereign (11.9%) | | | | | | | |
Republic of Hungary, | | | | | | | |
6.25%, 8/24/10 | | HUF | 103,500 | | 581 | | |
6.75%, 4/12/10 | | | 445,000 | | 2,533 | | |
6.75%, 2/24/17 | | | 110,960 | | 626 | | |
7.25%, 6/12/12 | | | 468,000 | | 2,689 | | |
| | | | | 6,429 | | |
Indonesia (13.7%) | | | | | | | |
Sovereign (13.7%) | | | | | | | |
Barclays Bank plc, Republic of Indonesia | | | | | | | |
Government Bonds Credit Linked Notes, | | | | | | | |
10.00%, 7/15/17 | | IDR | 20,000,000 | | 2,252 | | |
Citigroup, Inc., Republic of Indonesia | | | | | | | |
Government Bonds Credit Linked Notes, | | | | | | | |
10.00%, 7/15/17 | | $ | 882 | | 831 | | |
Credit Suisse, Republic of Indonesia | | | | | | | |
Government Bonds Credit Linked Notes, | | | | | | | |
10.00%, 7/15/17 | | IDR | 20,000,000 | | $ 2,151 | | |
UBS AG, Republic of Indonesia | | | | | | | |
Government Credit Linked Notes, | | | | | | | |
10.00%, 7/15/17 | | $ | 20,000,000 | | 2,151 | | |
| | | | | 7,385 | | |
Malaysia (1.9%) | | | | | | | |
Sovereign (1.9%) | | | | | | | |
Government of Malaysia, | | | | | | | |
3.76%, 4/28/11 | | MYR | 3,437 | | 1,045 | | |
Mexico (12.3%) | | | | | | | |
Sovereign (12.3%) | | | | | | | |
Mexican Bonos, | | | | | | | |
8.00%, 12/17/15 | | MXN | 43,580 | | 3,955 | | |
9.50%, 12/18/14 | | | 19,630 | | 1,934 | | |
10.00%, 12/5/24 | | | 7,058 | | 753 | | |
| | | | | 6,642 | | |
Nigeria (1.9%) | | | | | | | |
Corporate (1.9%) | | | | | | | |
Shell Petroleum Development Co., | | | | | | | |
Credit Linked Notes, | | | | | | | |
Zero Coupon, 2/25/08 | | $ | 992 | | 999 | | |
Peru (3.7%) | | | | | | | |
Sovereign (3.7%) | | | | | | | |
Republic of Peru, | | | | | | | |
12.25%, 8/10/11 | | PEN | 4,980 | | 1,993 | | |
Russia (1.0%) | | | | | | | |
Corporate (1.0%) | | | | | | | |
JPMorgan Chase & Co. | | | | | | | |
7.00%, 6/28/17 | | RUB | 14,000 | | 530 | | |
South Africa (9.6%) | | | | | | | |
Corporate (2.4%) | | | | | | | |
International Finance Corp., | | | | | | | |
11.00%, 7/1/09 | | ZAR | 8,760 | | 1,280 | | |
Sovereign (7.2%) | | | | | | | |
Republic of South Africa, | | | | | | | |
13.00%, 8/31/10 | | | (c)24,580 | | 3,896 | | |
| | | | | 5,176 | | |
Turkey (8.9%) | | | | | | | |
Sovereign (8.9%) | | | | | | | |
Republic of Turkey, | | | | | | | |
Zero Coupon, 8/5/09 | | TRY | 7,150 | | 4,780 | | |
Total Debt Instruments (Cost $51,177) | | | | | 50,482 | | |
| | | No.of | | | | |
| | | Warrants | | | | |
Warrants (0.2%) | | | | | | | |
Venezuela (0.2%) | | | | | | | |
Republic of Venezuela, Oil-Linked | | | | | | | |
Payment Obligation, sexpiring 4/15/20 | | | (a)(d)2,700 | | 101 | | |
Total Warrants (Cost $ —) | | | | | 101 | | |
The accompanying notes are an integral part of the financial statements. | 161 |
2007 Annual Report | |
| |
December 31, 2007 | |
Portfolio of Investments (cont’d)
Emerging Markets Debt Portfolio
| | Face | | | |
| | Amount | | | Value |
| | (000 | ) | | (000) |
Short-Term Investments (11.3%) | | | | | |
Short-Term Debt Securities held as Collateral on Loaned Securities (7.8%) | | | | | |
Alliance & Leicester plc, | | | | | |
5.26%, 9/2/08 | $ | (h)125 | | $ | 125 |
Bancaja, | | | | | |
5.35%, 8/12/08 | | 63 | | | 63 |
Bank of New York Co., Inc., | | | | | |
5.24%, 8/8/08 | | (h)63 | | | 63 |
BASF AG, | | | | | |
5.18%, 8/19/08 | | (h)63 | | | 63 |
BNP Paribas plc, | | | | | |
4.90%, 5/19/08 | | (h)125 | | | 125 |
CAM US Finance S.A. Unipersonal, | | | | | |
5.24%, 7/25/08 | | (h)251 | | | 251 |
Canadian Imperial Bank of Commerce, New York, | | | | | |
4.42%, 7/28/08 | | (h)126 | | | 126 |
CC USA, Inc., | | | | | |
3.89%, 1/28/08 | | (h)63 | | | 63 |
CIT Group Holdings, | | | | | |
5.23%, 6/18/08 | | (h)226 | | | 226 |
Citigroup Global Markets Holdings, Inc., | | | | | |
4.51%, 1/2/08 | | 856 | | | 856 |
Credit Suisse First Boston, New York, | | | | | |
4.32%, 3/14/08 | | (h)126 | | | 126 |
First Tennessee Bank, | | | | | |
5.05%, 8/15/08 | | (h)63 | | | 63 |
5.06%, 8/15/08 | | (h)251 | | | 251 |
Goldman Sachs Group, Inc., | | | | | |
4.62%, 2/13/09 | | (h)118 | | | 118 |
5.10%, 9/12/08 | | (h)63 | | | 63 |
HSBC Finance Corp., | | | | | |
5.26%, 8/5/08 | | (h)63 | | | 63 |
IBM Corp., | | | | | |
5.27%, 9/8/08 | | (h)251 | | | 251 |
Lehman Brothers, Inc., | | | | | |
4.49%, 1/2/08 | | 107 | | | 107 |
Macquarie Bank Ltd., | | | | | |
4.95%, 8/20/08 | | (h)126 | | | 126 |
Metropolitan Life Global Funding, | | | | | |
4.89%, 8/21/08 | | (h)188 | | | 188 |
National Bank of Canada, | | | | | |
5.21%, 4/2/08 | | (h)251 | | | 251 |
National Rural Utilities Cooperative Finance Corp., | | | | | |
5.24%, 9/2/08 | | (h)251 | | | 251 |
Nationwide Building Society, | | | | | |
4.92%, 7/28/08 | | (h)146 | | | 146 |
Unicredito Italiano Bank (Ireland) plc, | | | | | |
5.04%, 8/14/08 | | (h)138 | | | 138 |
5.26%, 8/8/08 | | (h)88 | | | 88 |
| | | | | 4,191 |
| | | | | |
| | | | | Value |
| | Shares | | | (000) |
Investment Company (3.5%) | | | | | |
Morgan Stanley Institutional Liquidity | | | | | |
Money Market Portfolio | | | | | |
— Institutional Class | | (o)1,887,153 | | $ | 1,887 |
Total Short-Term Investments (Cost $6,078) | | | | | 6,078 |
Total Investments (105.3%) (Cost $57,255) | | | | | |
— including $4,055 of Securities Loaned | | | | | 56,661 |
Liabilities in Excess of Other Assets (-5.3%) | | | | | (2,831) |
Net Assets (100%) | | | | $ | 53,830 |
| | | | | | |
(a) | Non-income producing security. |
(b) | Issuer is in default. |
(c) | All or portion of security on loan at December 31, 2007. |
(d) | Securities were valued at fair value — At December 31, 2007, the Portfolio held approximately $249,000 of fair valued securities, representing less than 0.5% of net assets. |
|
(e) | 144A security — Certain conditions for public sale may exist. |
(h) | Variable/Floating Rate Security — Interest rate changes on these instruments are based on changes in a designated base rate. The rates shown are those in effect on December 31, 2007. |
|
(o) | See Note F within the Notes to Financial Statements regarding investment in Morgan Stanley Institutional Liquidity Money Market Portfolio — Institutional Class. |
|
ARS | Argentina Peso |
BRL | Brazilian Real |
COP | Colombian Peso |
EGP | Egypt Pound |
HUF | Hungarian Forint |
IDR | Indonesian Rupiah |
MYR | Malaysian Ringgit |
MXN | Mexican Peso |
PEN | Peruvian Sol |
RUB | Russian Ruble |
TRY | Turkish Lira |
ZAR | South African Rand |
| |
Foreign Currency Exchange Contract Information: |
|
The Portfolio had the following foreign currency exchange contract(s) open at period end: |
| |
| | | | | | | | | | Net | |
Currency | | | | | | In | | | | Unrealized | |
to | | | | | | Exchange | | | | Appreciation | |
Deliver | | Value | | Settlement | | For | | Value | | (Depreciation) | |
(000) | | (000) | | Date | | (000) | | (000) | | (000) | |
USD | 1,005 | | | $1,005 | | | | 12/01/08 | | | AED | 3,589 | | | | $1,000 | | | | $ (5) | | |
USD | 4,242 | | | 4,242 | | | | 6/11/08 | | | EUR | 2,892 | | | | 4,230 | | | | (12) | | |
USD | 4,242 | | | 4,242 | | | | 6/11/08 | | | EUR | 2,895 | | | | 4,235 | | | | (7) | | |
| | | $9,489 | | | | | | | | | | $9,465 | | | | $(24) | | |
| | | | | | | | | | | |
| | | | | | | | | | | | | | | | | | | | | | | |
AED — United Arab Emirates Dirham |
EUR — Euro |
USD — United States Dollar |
162 | The accompanying notes are an integral part of the financial statements. |
2007 Annual Report
December 31, 2007
Statements of Assets and Liabilities
| | Active
International
Allocation
Portfolio
(000) | | Emerging
Markets
Portfolio
(000) | | Global Franchise
Portfolio
(000) | | Global
Real Estate
Portfolio
(000) | |
Assets: | | | | | | | | | |
Investments in Securities of Unaffiliated Issuers, at Cost: | | $ | 851,153 | | $ | 2,637,004 | | $ | 86,750 | | $ | 692,325 | |
Investment(s) in Securities of Affiliated Issuer(s), at Cost: | | | 71,488 | | | 38,982 | | | 2,268 | | | — | |
Total Investments in Securities, at Cost: | | | 922,641 | | | 2,675,986 | | | 89,018 | | | 692,325 | |
Foreign Currency, at Cost: | | | 2,106 | | | 7,403 | | | 58 | | | 191 | |
Investments in Securities of Unaffiliated Issuers, at Value:(1) | | | 1,105,267 | | | 3,694,161 | | | 113,813 | | | 621,641 | |
Investment(s) in Securities of Affiliated Issuer(s), at Value: | | | 71,488 | | | 63,941 | | | 2,268 | | | — | |
Total Investments in Securities, at Value: | | | 1,176,755 | | | 3,758,102 | | | 116,081 | | | 621,641 | |
Foreign Currency, at Value: | | | 2,089 | | | 7,417 | | | 59 | | | 192 | |
Cash | | | 352 | | | 1,784 | | | — | | | — | |
Due from Administrator | | | — | | | 318 | | | — | | | — | |
Due from Broker | | | 23,386 | | | — | | | — | | | — | |
Receivable for Portfolio Shares Sold | | | 862 | | | 6,955 | | | — | | | 21,299 | |
Receivable for Investments Sold | | | 4,031 | | | 31,642 | | | — | | | 9,215 | |
Unrealized Appreciation on Foreign Currency Exchange Contracts | | | 1,022 | | | 11 | | | 384 | | | 1 | |
Foreign Withholding Tax Reclaim Receivable | | | 105 | | | 1,141 | | | 86 | | | 51 | |
Receivable from Affiliate(s) | | | 15 | | | 10 | | | 1 | | | 6 | |
Dividends Receivable | | | 951 | | | 2,493 | | | 132 | | | 3,319 | |
Interest Receivable | | | 344 | | | 147 | | | 6 | | | 66 | |
Other Assets | | | 16 | | | 43 | | | 2 | | | 6 | |
Total Assets | | | 1,209,928 | | | 3,810,063 | | �� | 116,751 | | | 655,796 | |
Liabilities: | | | | | | | | | | | | | |
Collateral on Securities Loaned, at Value: | | | 106,330 | | | 263,443 | | | — | | | 2,631 | |
Unrealized Depreciation on Foreign Currency Exchange Contracts | | | 1,599 | | | 137 | | | — | | | 20 | |
Payable for Investments Purchased | | | 10 | | | 24,232 | | | — | | | 737 | |
Payable for Portfolio Shares Redeemed | | | 363 | | | 2,392 | | | — | | | 2,208 | |
Payable for Investment Advisory Fees | | | 1,821 | | | 10,045 | | | 236 | | | 1,376 | |
Bank Overdraft | | | — | | | — | | | — | | | 2,752 | |
Payable for Administration Fees | | | 76 | | | 239 | | | 8 | | | 45 | |
Payable for Custodian Fees | | | 124 | | | 886 | | | 14 | | | 61 | |
Payable for Directors’ Fees and Expenses | | | 15 | | | 61 | | | @— | | | @— | |
Deferred Capital Gain Country Tax | | | 443 | | | 5,337 | | | — | | | — | |
Payable for Shareholder Servicing Fees — Class B | | | 1 | | | 38 | | | 1 | | | 3 | |
Other Liabilities | | | 126 | | | 289 | | | 30 | | | 39 | |
Total Liabilities | | | 110,908 | | | 307,099 | | | 289 | | | 9,872 | |
Net Assets | | $ | 1,099,020 | | $ | 3,502,964 | | $ | 116,462 | | $ | 645,924 | |
Net Assets Consist Of: | | | | | | | | | | | | | |
Paid-in Capital | | $ | 812,144 | | $ | 2,330,258 | | $ | 87,080 | | $ | 733,151 | |
Undistributed (Distributions in Excess of) Net Investment Income | | | (2,542 | ) | | (24,956 | ) | | 525 | | | (13,261 | ) |
Accumulated Net Realized Gain (Loss) | | | 34,227 | | | 120,783 | | | 1,396 | | | (3,296 | ) |
Unrealized Appreciation (Depreciation) on: | | | | | | | | | | | | | |
Investments | | | 253,674 | * | | 1,076,769 | * | | 27,063 | | | (70,684 | ) |
Foreign Currency Exchange Contracts and Translations | | | (639 | ) | | 110 | | | 398 | | | 14 | |
Futures Contracts | | | 2,156 | | | — | | | — | | | — | |
Net Assets | | $ | 1,099,020 | | $ | 3,502,964 | | $ | 116,462 | | $ | 645,924 | |
| The accompanying notes are an integral part of the financial statements. | 163 |
2007 Annual Report | |
| |
December 31, 2007 | |
Statements of Assets and Liabilities
| | Active
International
Allocation
Portfolio | | Emerging
Markets
Portfolio | | Global
Franchise
Portfolio | | Global
Real Estate
Portfolio | |
| | (000) | | (000) | | (000) | | (000) | |
CLASS A: | | | | | | | | | | |
Net Assets | | $ | 1,093,735 | | $ | 3,323,130 | | $ | 110,135 | | $ | 632,737 | |
Shares Outstanding $0.001 par value shares of beneficial interest (500,000,000 shares authorized) (not in 000’s) | | | 68,720,141 | | | 97,672,429 | | | 6,628,283 | | | 63,036,988 | |
Net Asset Value, Offering and Redemption Price Per Share | | $ | 15.92 | | $ | 34.02 | | $ | 16.62 | | $ | 10.04 | |
CLASS B: | | | | | | | | | | | | | |
Net Assets | | $ | 5,285 | | $ | 179,834 | | $ | 6,327 | | $ | 13,187 | |
Shares Outstanding $0.001 par value shares of beneficial interest (500,000,000 shares authorized) (not in 000’s) | | | 326,161 | | | 5,373,836 | | | 384,962 | | | 1,316,749 | |
Net Asset Value, Offering and Redemption Price Per Share | | $ | 16.20 | | $ | 33.46 | | $ | 16.44 | | $ | 10.02 | |
(1) Including: | | | | | | | | | | | | | |
Securities on Loan, at Value: | | $ | 101,774 | | $ | 252,057 | | $ | — | | $ | 2,594 | |
@ Amount is less than $500. |
* Net of $440 and $5,347 Deferred Capital Gain Country Tax on unrealized appreciation in Active International Allocation and Emerging Markets, respectively. |
164 | The accompanying notes are an integral part of the financial statements. | |
2007 Annual Report
December 31, 2007
Statements of Assets and Liabilities
| | Global Value
Equity
Portfolio
(000) | | International
Equity
Portfolio
(000) | | International
Growth Active Extension
Portfolio
(000) | | International
Growth Equity
Portfolio
(000) | |
Assets: | | | | | | | | | |
Investments in Securities of Unaffiliated Issuers, at Cost: | | $ | 73,751 | | | $ | 5,289,717 | | $ | 12,988 | | | $ | 21,308 | | |
Investment in Security of Affiliated Issuer: | | | 783 | | | | 108,256 | | | 43 | | | | 13,311 | | |
Total Investments in Securities, at Cost: | | | 74,534 | | | | 5,397,973 | | | 13,031 | | | | 34,619 | | |
Foreign Currency, at Cost: | | | 96 | | | | 1,878 | | | 21 | | | | 219 | | |
Investments in Securities of Unaffiliated Issuers, at Value:(1) | | | 93,959 | | | | 6,539,165 | | | 13,563 | | | | 23,157 | | |
Investment in Security of Affiliated Issuer, at Value: | | | 783 | | | | 108,256 | | | 43 | | | | 13,311 | | |
Total Investments in Securities, at Value: | | | 94,742 | | | | 6,647,421 | | | 13,606 | | | | 36,468 | | |
Foreign Currency, at Value: | | | 98 | | | | 1,872 | | | 21 | | | | 219 | | |
Due from Advisor | | | — | | | | — | | | 12 | | | | 20 | | |
Due from Administrator | | | — | | | | 155 | | | — | | | | — | | |
Receivable for Portfolio Shares Sold | | | 1 | | | | 5,558 | | | — | | | | — | | |
Receivable for Investments Sold | | | 9 | | | | 492 | | | 255 | | | | 251 | | |
Unrealized Appreciation on Foreign Currency Exchange Contracts | | | 99 | | | | 10 | | | @— | | | | — | | |
Foreign Withholding Tax Reclaim Receivable | | | 10 | | | | 673 | | | — | | | | 5 | | |
Receivable from Affiliate | | | @— | | | | 38 | | | @— | | | | @— | | |
Dividends Receivable | | | 102 | | | | 4,050 | | | 5 | | | | 2 | | |
Interest Receivable | | | 3 | | | | 476 | | | 1 | | | | 8 | | |
Other Assets | | | 2 | | | | 109 | | | @— | | | | 1 | | |
Total Assets | | | 95,066 | | | | 6,660,854 | | | 13,900 | | | | 36,974 | | |
Liabilities: | | | | | | | | | | | | | | | | |
Collateral on Securities Loaned, at Value: | | | 4,604 | | | | 468,328 | | | — | | | | 610 | | |
Unrealized Depreciation on Foreign Currency Exchange Contracts | | | — | | | | 9 | | | 2 | | | | 1 | | |
Payable for Investments Purchased | | | 11 | | | | — | | | 83 | | | | 13,075 | | |
Bank Overdraft | | | — | | | | 42 | | | 4 | | | | 203 | | |
Payable for Portfolio Shares Redeemed | | | 1 | | | | 51,875 | | | — | | | | — | | |
Payable for Investment Advisory Fees | | | 155 | | | | 13,191 | | | — | | | | — | | |
Payable for Administration Fees | | | 6 | | | | 432 | | | 1 | | | | 1 | | |
Payable for Custodian Fees | | | 8 | | | | 494 | | | 5 | | | | 5 | | |
Payable for Directors’ Fees and Expenses | | | 8 | | | | 174 | | | — | | | | @— | | |
Payable for Shareholder Servicing Fees — Class B | | | 5 | | | | 227 | | | @— | | | | @— | | |
Payable for Dividend Income on Short Positions | | | — | | | | — | | | 9 | | | | — | | |
Securities Sold Short, at Value (Proceeds $3,311) | | | — | | | | — | | | 3,125 | | | | — | | |
Deferred Capital Gain Country Tax | | | — | | | | — | | | — | | | | 1 | | |
Other Liabilities | | | 34 | | | | 680 | | | 12 | | | | 24 | | |
Total Liabilities | | | 4,832 | | | | 535,452 | | | 3,241 | | | | 13,920 | | |
Net Assets | | $ | 90,234 | | | $ | 6,125,402 | | $ | 10,659 | | | $ | 23,054 | | |
Net Assets Consist Of: | | | | | | | | | | | | | | | | |
Paid-in Capital | | $ | 70,076 | | | $ | 4,751,752 | | $ | 9,986 | | | $ | 20,957 | | |
Undistributed (Distributions in Excess of) Net Investment Income | | | 58 | | | | (3,623 | ) | | — | | | | — | | |
Accumulated Net Investment Loss | | | — | | | | — | | | (3 | ) | | | — | | |
Accumulated Net Realized Gain (Loss) | | | (209 | ) | | | 127,872 | | | (85 | ) | | | 267 | | |
Unrealized Appreciation (Depreciation) on: | | | | | | | | | | | | | | | | |
Investments | | | 20,208 | | | | 1,249,448 | | | 575 | | | | 1,849 | * | |
Foreign Currency Exchange Contracts and Translations | | | 101 | | | | (47 | ) | | @— | | | | (19 | ) | |
Securities Sold Short | | | — | | | | — | | | 186 | | | | — | | |
Net Assets | | $ | 90,234 | | | $ | 6,125,402 | | $ | 10,659 | | | $ | 23,054 | | |
| The accompanying notes are an integral part of the financial statements. | 165 |
2007 Annual Report
December 31, 2007
Statements of Assets and Liabilities
| | Global Value
Equity
Portfolio
(000) | | International
Equity
Portfolio
(000) | | International
Growth Active Extension
Portfolio
(000) | | International
Growth Equity
Portfolio
(000) | |
CLASS A: | | | | | | | | | |
Net Assets | | $ | 66,035 | | $ | 5,105,807 | | $ | 10,553 | | | $ | 22,523 | | |
Shares Outstanding $0.001 par value shares of beneficial interest (500,000,000 shares authorized) (not in 000’s) | | | 3,730,674 | | | 269,926,698 | | | 990,000 | | | | 1,636,603 | | |
Net Asset Value, Offering and Redemption Price Per Share | | $ | 17.70 | | $ | 18.92 | | $ | 10.66 | | | $ | 13.76 | | |
CLASS B: | | | | | | | | | | | | | | | |
Net Assets | | $ | 24,199 | | $ | 1,019,595 | | $ | 106 | | | $ | 531 | | |
Shares Outstanding $0.001 par value shares of beneficial interest (500,000,000 shares authorized) (not in 000’s) | | | 1,384,000 | | | 54,447,607 | | | 10,000 | | | | 38,535 | | |
Net Asset Value, Offering and Redemption Price Per Share | | $ | 17.48 | | $ | 18.73 | | $ | 10.65 | | | $ | 13.78 | | |
(1) Including: | | | | | | | | | | | | | | | |
Securities on Loan, at Value: | | $ | 4,408 | | $ | 448,800 | | $ | — | | | $ | 580 | | |
@ Amount is less than $500. | |
* Net of $1 Deferred Capital Gain Country Tax on unrealized depreciation in International Growth Equity. | |
166 | The accompanying notes are an integral part of the financial statements. | |
2007 Annual Report
December 31, 2007
Statements of Assets and Liabilities
| | International
Magnum
Portfolio
(000) | | International
Real Estate
Portfolio
(000) | | International
Small Cap
Portfolio
(000) | | Disciplined
Large Cap Value
Active Extension
Portfolio
(000) | |
Assets: | | | | | | | |
Investments in Securities of Unaffiliated Issuers, at Cost: | | $ | 115,530 | | $ | 1,328,193 | | $ | 727,180 | | $ | 12,491 | | |
Investment in Security of Affiliated Issuer, at Cost: | | | 6,786 | | | — | | | — | | | 83 | | |
Total Investments in Securities, at Cost: | | | 122,316 | | | 1,328,193 | | | 727,180 | | | 12,574 | | |
Foreign Currency, at Cost: | | | 231 | | | 110 | | | 85 | | | — | | |
Investments in Securities of Unaffiliated Issuers, at Value: | | | 143,721 | | | 1,167,622 | | | 782,661 | | | 11,697 | | |
Investment in Security of Affiliated Issuer, at Value: | | | 6,786 | | | — | | | — | | | 83 | | |
Total Investments in Securities, at Value: | | | 150,507 | | | 1,167,622 | | | 782,661 | | | 11,780 | | |
Foreign Currency, at Value: | | | 235 | | | 110 | | | 86 | | | — | | |
Cash | | | — | | | — | | | — | | | 150 | | |
Due from Advisor | | | — | | | — | | | — | | | 10 | | |
Due from Broker | | | 230 | | | — | | | — | | | — | | |
Receivable for Portfolio Shares Sold | | | 160 | | | 4,907 | | | 314 | | | — | | |
Receivable for Investments Sold | | | 1,297 | | | 3,186 | | | 41,651 | | | — | | |
Unrealized Appreciation on Foreign Currency Exchange Contracts | | | 142 | | | — | | | 93 | | | — | | |
Foreign Withholding Tax Reclaim Receivable | | | 34 | | | 500 | | | 830 | | | — | | |
Receivable from Affiliate | | | 2 | | | 4 | | | 2 | | | @— | | |
Dividends Receivable | | | 63 | | | 2,501 | | | 1,680 | | | 17 | | |
Interest Receivable | | | 30 | | | 11 | | | 57 | | | @— | | |
Other Assets | | | 2 | | | 24 | | | 20 | | | — | | |
Total Assets | | | 152,702 | | | 1,178,865 | | | 827,394 | | | 11,957 | | |
Liabilities: | | | | | | | | | | | | | | |
Collateral on Securities Loaned, at Value: | | | 15,980 | | | — | | | — | | | — | | |
Unrealized Depreciation on Foreign Currency Exchange Contracts | | | 486 | | | 20 | | | 277 | | | — | | |
Payable for Investments Purchased | | | 419 | | | — | | | 517 | | | — | | |
Payable for Portfolio Shares Redeemed | | | 18 | | | 12,078 | | | 8,066 | | | — | | |
Bank Overdraft | | | — | | | 12,606 | | | 19,706 | | | — | | |
Payable for Investment Advisory Fees | | | 244 | | | 2,964 | | | 2,428 | | | — | | |
Payable for Administration Fees | | | 9 | | | 88 | | | 62 | | | 1 | | |
Payable for Custodian Fees | | | 23 | | | 136 | | | 127 | | | 4 | | |
Payable for Directors’ Fees and Expenses | | | 8 | | | 1 | | | 15 | | | @— | | |
Payable for Shareholder Servicing Fees — Class B | | | @— | | | 22 | | | — | | | @— | | |
Deferred Capital Gain Country Tax | | | 1 | | | — | | | — | | | — | | |
Payable for Dividend Income on Short Positions | | | — | | | — | | | — | | | 6 | | |
Securities Sold Short, at Value (Proceeds $2,977) | | | — | | | — | | | — | | | 2,650 | | |
Other Liabilities | | | 33 | | | 132 | | | 146 | | | 17 | | |
Total Liabilities | | | 17,221 | | | 28,047 | | | 31,344 | | | 2,678 | | |
Net Assets | | $ | 135,481 | | $ | 1,150,818 | | $ | 796,050 | | $ | 9,279 | | |
Net Assets Consist Of: | | | | | | | | | | | | | | |
Paid-in Capital | | $ | 105,489 | | $ | 1,352,072 | | $ | 715,906 | | $ | 9,999 | | |
Undistributed (Distributions in Excess of) Net Investment Income | | | (237 | ) | | (34,483 | ) | | (144 | ) | | — | | |
Accumulated Net Realized Gain (Loss) | | | 2,366 | | | (6,174 | ) | | 24,575 | | | (253 | ) | |
Unrealized Appreciation (Depreciation) on: | | | | | | | | | | | | | | |
Investments | | | 28,191 | * | | (160,571 | ) | | 55,481 | | | (794 | ) | |
Foreign Currency Exchange Contracts and Translations | | | (328 | ) | | (26 | ) | | 232 | | | — | | |
Securities Sold Short | | | — | | | — | | | — | | | 327 | | |
Net Assets | | $ | 135,481 | | $ | 1,150,818 | | $ | 796,050 | | $ | 9,279 | | |
| | | | | | | | | | | | | | | | | |
| The accompanying notes are an integral part of the financial statements. | 167 |
2007 Annual Report | |
| |
December 31, 2007 | |
Statements of Assets and Liabilities
| | International
Magnum
Portfolio
(000) | | International
Real Estate
Portfolio
(000) | | International
Small Cap
Portfolio
(000) | | Disciplined
Large Cap Value
Active Extension
Portfolio
(000) | |
CLASS A: | | | | | | | | | |
Net Assets | | $ | 133,077 | | $ | 1,053,018 | | $ | 796,050 | | $ | 9,193 | | |
Shares Outstanding $0.001 par value shares of beneficial interest (500,000,000 shares authorized) (not in 000’s) | | | 8,950,001 | | | 41,616,700 | | | 46,594,911 | | | 1,071,395 | | |
Net Asset Value, Offering and Redemption Price Per Share | | $ | 14.87 | | $ | 25.30 | | $ | 17.08 | | $ | 8.58 | | |
CLASS B: | | | | | | | | | | | | | | |
Net Assets | | $ | 2,404 | | $ | 97,800 | | $ | — | | $ | 86 | | |
Shares Outstanding $0.001 par value shares of beneficial interest (500,000,000 shares authorized) (not in 000’s) | | | 162,230 | | | 3,861,661 | | | — | | | 10,000 | | |
Net Asset Value, Offering and Redemption Price Per Share | | $ | 14.82 | | $ | 25.33 | | $ | — | | $ | 8.58 | | |
(1) Including: | | | | | | | | | | | | | | |
Securities on Loan, at Value: | | $ | 15,270 | | $ | — | | $ | — | | $ | — | | |
@ Amount is less than $500. | | | | | | | | | |
* Net of $@ Deferred Capital Gain Country Tax on unrealized depreciation in International Magnum. | |
| | | | | | | | | | | | | | | | | |
168 | The accompanying notes are an integral part of the financial statements. | |
2007 Annual Report
December 31, 2007
Statements of Assets and Liabilities
| | Focus
Equity
Portfolio
(000) | | Large Cap
Relative Value
Portfolio
(000) | | Small
Company
Growth
Portfolio
(000) | | Systematic
Active Large
Cap Core
Portfolio
(000) | |
Assets: | | | | | | | | |
Investments in Securities of Unaffiliated Issuers, at Cost: | | $ | 12,362 | | $ | 251,497 | | $ | 1,563,166 | | $ | 6,434 | | |
Investment in Security of Affiliated Issuer, at Cost: | | | 1,147 | | | 4,943 | | | 13,933 | | | 280 | | |
Total Investments in Securities, at Cost: | | | 13,509 | | | 256,440 | | | 1,577,099 | | | 6,714 | | |
Foreign Currency, at Cost: | | | 19 | | | — | | | 1 | | | — | | |
Investments in Securities of Unaffiliated Issuers, at Value:(1) | | | 15,692 | | | 284,432 | | | 1,829,507 | | | 7,152 | | |
Investment in Security of Affiliated Issuer, at Value: | | | 1,147 | | | 4,943 | | | 13,933 | | | 280 | | |
Total Investments in Securities, at Value: | | | 16,839 | | | 289,375 | | | 1,843,440 | | | 7,432 | | |
Foreign Currency, at Value: | | | 19 | | | — | | | 1 | | | — | | |
Cash | | | 18 | | | @— | | | — | | | — | | |
Receivable for Portfolio Shares Sold | | | 1 | | | 11 | | | 19,279 | | | — | | |
Receivable from Affiliate | | | @— | | | 2 | | | 15 | | | @— | | |
Dividends Receivable | | | 2 | | | 324 | | | 1,326 | | | 6 | | |
Interest Receivable | | | 5 | | | 22 | | | 148 | | | 2 | | |
Other Assets | | | @— | | | 5 | | | 31 | | | @— | | |
Total Assets | | | 16,884 | | | 289,739 | | | 1,864,240 | | | 7,440 | | |
Liabilities: | | | | | | | | | | | | | | |
Collateral on Securities Loaned, at Value: | | | — | | | — | | | — | | | 743 | | |
Due to Broker | | | — | | | — | | | — | | | 2 | | |
Payable for Investments Purchased | | | 69 | | | 215 | | | — | | | — | | |
Payable for Portfolio Shares Redeemed | | | @— | | | 1,985 | | | 23,299 | | | — | | |
Payable for Investment Advisory Fees | | | 17 | | | 360 | | | 4,253 | | | 36 | | |
Payable for Administration Fees | | | 1 | | | 20 | | | 127 | | | 1 | | |
Payable for Custodian Fees | | | 2 | | | 9 | | | 12 | | | 1 | | |
Payable for Directors’ Fees and Expenses | | | 7 | | | 18 | | | 10 | | | @— | | |
Payable for Shareholder Servicing Fees — Class B | | | 1 | | | 11 | | | 157 | | | @— | | |
Other Liabilities | | | 22 | | | 50 | | | 360 | | | 21 | | |
Total Liabilities | | | 119 | | | 2,668 | | | 28,218 | | | 804 | | |
Net Assets | | $ | 16,765 | | $ | 287,071 | | $ | 1,836,022 | | $ | 6,636 | | |
Net Assets Consist Of: | | | | | | | | | | | | | | |
Paid-in Capital | | $ | 29,928 | | $ | 302,146 | | $ | 1,585,454 | | $ | 5,970 | | |
Undistributed (Distributions in Excess of) Net Investment Income | | | (9 | ) | | (21 | ) | | — | | | 15 | | |
Accumulated Net Investment Loss | | | — | | | — | | | (22 | ) | | — | | |
Accumulated Net Realized Gain (Loss) | | | (16,484 | ) | | (47,989 | ) | | (15,751 | ) | | (67 | ) | |
Unrealized Appreciation (Depreciation) on: | | | | | | | | | | | | | | |
Investments | | | 3,330 | | | 32,935 | | | 266,341 | | | 718 | | |
Foreign Currency Exchange Contracts and Translations | | | @— | | | — | | | @— | | | — | | |
Futures Contracts | | | — | | | — | | | — | | | @— | | |
Net Assets | | $ | 16,765 | | $ | 287,071 | | $ | 1,836,022 | | $ | 6,636 | | |
| | | | | | | | | | | | | | | |
| The accompanying notes are an integral part of the financial statements. | 169 |
2007 Annual Report | |
| |
December 31, 2007 | |
Statements of Assets and Liabilities
| | Focus
Equity
Portfolio
(000) | | Large Cap
Relative Value
Portfolio
(000) | | Small
Company
Growth
Portfolio
(000) | | Systematic
Active Large
Cap Core
Portfolio
(000) | |
CLASS A: | | | | | | | | |
Net Assets | | $ | 13,852 | | $ | 236,784 | | $ | 1,137,839 | | $ | 6,525 | | |
Shares Outstanding $0.001 par value shares of beneficial interest (500,000,000 shares authorized) (not in 000’s) | | | 736,442 | | | 19,962,716 | | | 86,719,049 | | | 590,000 | | |
Net Asset Value, Offering and Redemption Price Per Share | | $ | 18.81 | | $ | 11.86 | | $ | 13.12 | | $ | 11.06 | | |
CLASS B: | | | | | | | | | | | | | | |
Net Assets | | $ | 2,913 | | $ | 50,287 | | $ | 698,183 | | $ | 111 | | |
Shares Outstanding $0.001 par value shares of beneficial interest (500,000,000 shares authorized) (not in 000’s) | | | 158,974 | | | 4,243,242 | | | 56,355,156 | | | 10,000 | | |
Net Asset Value, Offering and Redemption Price Per Share | | $ | 18.32 | | $ | 11.85 | | $ | 12.39 | | $ | 11.06 | | |
(1) Including: | | | | | | | | | | | | | | |
Securities on Loan, at Value: | | $ | — | | $ | — | | $ | — | | $ | 724 | | |
@ Amount is less than $500. | | | | | | | | | | | | | | |
| | | | | | | | | | | | | | | |
170 | The accompanying notes are an integral part of the financial statements. | |
| 2007 Annual Report |
| |
| December 31, 2007 |
Statements of Assets and Liabilities
| | Systematic
Active Small
Cap Core
Portfolio
(000) | | Systematic
Active Small
Cap Growth
Portfolio
(000) | | Systematic
Active Small
Cap Value
Portfolio
(000) | | Systematic
Large Cap Core
Active Extension
Portfolio
(000) | |
Assets: | | | | | | | | | | |
Investments in Securities of Unaffiliated Issuers, at Cost: | | $ 8,025 | | $ 8,358 | | $ 8,442 | | $ 12,759 | | |
Investment in Security of Affiliated Issuer, at Cost: | | 717 | | 870 | | 250 | | 20 | | |
Total Investment in Securities, at Cost: | | 8,742 | | 9,228 | | 8,692 | | 12,779 | | |
Investments in Securities of Unaffiliated Issuers, at Value:(1) | | 7,176 | | 7,943 | | 7,111 | | 12,458 | | |
Investment in Security of Affiliated Issuer, at Value | | 717 | | 870 | | 250 | | 20 | | |
Total Investments in Securities, at Value: | | 7,893 | | 8,813 | | 7,361 | | 12,478 | | |
Cash | | 54 | | — | | 81 | | 35 | | |
Due from Adviser | | — | | — | | — | | 9 | | |
Receivable for Investments Sold | | 1,384 | | 1,329 | | 1,553 | | 1,595 | | |
Receivable from Affiliate | | @— | | @— | | @— | | @— | | |
Dividends Receivable | | 15 | | 4 | | 20 | | 10 | | |
Interest Receivable | | 3 | | 4 | | 2 | | @— | | |
Other Assets | | @— | | @— | | @— | | — | | |
Total Assets | | 9,349 | | 10,150 | | 9,017 | | 14,127 | | |
Liabilities: | | | | | | | | | | |
Collateral on Securities Loaned, at Value: | | 1,919 | | 1,974 | | 1,911 | | — | | |
Due to Broker | | @— | | 1 | | @— | | — | | |
Payable for Investments Purchased | | 1,479 | | 1,528 | | 1,547 | | 1,596 | | |
Payable for Investment Advisory Fees | | 37 | | 37 | | 36 | | — | | |
Payable for Administration Fees | | @— | | @— | | @— | | 1 | | |
Payable for Custodian Fees | | 2 | | 2 | | 2 | | 3 | | |
Payable for Directors’ Fees and Expenses | | @— | | @— | | @— | | @— | | |
Payable for Shareholder Servicing Fees — Class B | | @— | | @— | | @— | | @— | | |
Payable for Dividend Income on Short Positions | | — | | — | | — | | 3 | | |
Payable for Securities Sold Short, at Value (Proceeds $3,077) | | — | | — | | — | | 2,830 | | |
Other Liabilities | | 21 | | 22 | | 21 | | 16 | | |
Total Liabilities | | 3,458 | | 3,564 | | 3,517 | | 4,449 | | |
Net Assets | | $ 5,891 | | $ 6,586 | | $ 5,500 | | $ 9,678 | | |
Net Assets Consist Of: | | | | | | | | | | |
Paid-in Capital | | $ 6,605 | | $ 6,921 | | $ 6,710 | | $ 9,999 | | |
Undistributed (Distributions in Excess of) Net Investment Income | | 3 | | — | | 1 | | — | | |
Accumulated Net Realized Gain (Loss) | | 125 | | 70 | | 115 | | (267) | | |
Unrealized Appreciation (Depreciation) on: | | | | | | | | | | |
Investments | | (849 | ) | (415 | ) | (1,331 | ) | (301) | | |
Futures Contracts | | 7 | | 10 | | 5 | | — | | |
Securities Sold Short | | — | | — | | — | | 247 | | |
Net Assets | | $ 5,891 | | $ 6,586 | | $ 5,500 | | $ 9,678 | | |
The accompanying notes are an integral part of the financial statements. | 171 |
2007 Annual Report | |
| |
December 31, 2007 | |
Statements of Assets and Liabilities
| | Systematic
Active Small
Cap Core
Portfolio
(000) | | Systematic
Active Small
Cap Growth
Portfolio
(000) | | Systematic
Active Small
Cap Value
Portfolio
(000) | | Systematic
Large Cap Core
Active Extension
Portfolio
(000) | |
CLASS A: | | | | | | | | | | |
Net Assets | | $ | 5,801 | | $ | 6,491 | | $ | 5,418 | | $ | 9,582 | | | |
Shares Outstanding $0.001 par value shares of beneficial interest (500,000,000 shares authorized) (not in 000’s) | | | 650,000 | | | 682,592 | | | 660,000 | | | 998,647 | | | |
Net Asset Value, Offering and Redemption Price Per Share | | $ | 8.93 | | $ | 9.51 | | $ | 8.21 | | $ | 9.59 | | | |
CLASS B: | | | | | | | | | | | | | | | |
Net Assets | | $ | 90 | | $ | 95 | | $ | 82 | | $ | 96 | | | |
Shares Outstanding $0.001 par value shares of beneficial interest (500,000,000 shares authorized) (not in 000’s) | | | 10,000 | | | 10,000 | | | 10,000 | | | 10,000 | | | |
Net Asset Value, Offering and Redemption Price Per Share | | $ | 8.93 | | $ | 9.48 | | $ | 8.21 | | $ | 9.58 | | | |
(1) Including: | | | | | | | | | | | | | | | |
Securities on Loan, at Value: | | $ | 1,826 | | $ | 1,898 | | $ | 1,802 | | $ | — | | | |
@ Amount is less than $500. | | | | | | | | | | |
172 | The accompanying notes are an integral part of the financial statements. | |
| 2007 Annual Report |
| |
| December 31, 2007 |
Statements of Assets and Liabilities
| | U.S. Large
Cap Growth
Portfolio
(000) | | U.S. Real
Estate
Portfolio
(000) | | U.S. Small/
Mid Cap Value
Portfolio
(000) | | Emerging
Markets Debt
Portfolio
(000) | |
Assets: | | | | | | | | | | |
Investments in Securities of Unaffiliated Issuers, at Cost: | | $ 1,190,381 | | $ 1,187,197 | | $ 20,160 | | $ 55,368 | | |
Investments in Security of Affiliated Issuer, at Cost: | | 24,808 | | — | | 1,278 | | 1,887 | | |
Total Investments in Securities, at Cost: | | 1,215,189 | | 1,187,197 | | 21,438 | | 57,255 | | |
Foreign Currency, at Cost: | | 3 | | 65 | | — | | 13 | | |
Investments in Securities of Unaffiliated Issuers, at Value:(1) | | 1,508,872 | | 1,226,389 | | 19,088 | | 54,774 | | |
Investments in Security of Affiliated Issuer, at Value: | | 24,808 | | — | | 1,278 | | 1,887 | | |
Total Investments in Securities, at Value: | | 1,533,680 | | 1,226,389 | | 20,366 | | 56,661 | | |
Foreign Currency, at Value: | | 3 | | 66 | | — | | 16 | | |
Cash | | — | | — | | — | | 2 | | |
Due from Broker | | — | | — | | — | | @— | | |
Receivable for Portfolio Shares Sold | | 163,479 | | 1,572 | | @— | | — | | |
Receivable for Investments Sold | | 18,193 | | 21,679 | | 152 | | — | | |
Receivable from Affiliate | | 6 | | 8 | | @— | | 1 | | |
Dividends Receivable | | 312 | | 11,712 | | 16 | | — | | |
Interest Receivable | | 71 | | 15 | | 8 | | 1,224 | | |
Other Assets | | 19 | | 30 | | 21 | | 3 | | |
Total Assets | | 1,715,763 | | 1,261,471 | | 20,563 | | 57,907 | | |
Liabilities: | | | | | | | | | | |
Collateral on Securities Loaned, at Value: | | — | | 155,964 | | — | | 4,191 | | |
Payable for Investments Purchased | | 139,766 | | 2,510 | | 307 | | — | | |
Payable for Portfolio Shares Redeemed | | 375 | | 6,256 | | — | | 33 | | |
Unrealized Depreciation on Foreign Currency Exchange Contracts | | — | | — | | — | | 24 | | |
Bank Overdraft | | — | | 10,436 | | — | | — | | |
Payable for Investment Advisory Fees | | 1,717 | | 2,533 | | 34 | | 52 | | |
Payable for Administration Fees | | 96 | | 81 | | 1 | | 4 | | |
Payable for Custodian Fees | | 12 | | 16 | | @— | | 4 | | |
Payable for Directors’ Fees and Expenses | | 40 | | 18 | | @— | | 6 | | |
Payable for Shareholder Servicing Fees — Class B | | 35 | | 38 | | @— | | @— | | |
Other Liabilities | | 139 | | 222 | | 14 | | 37 | | |
Total Liabilities | | 142,180 | | 178,074 | | 356 | | 4,351 | | |
Net Assets | | $ 1,573,583 | | $ 1,083,397 | | $ 20,207 | | $ 53,556 | | |
Net Assets Consist Of: | | | | | | | | | | |
Paid-in Capital | | $ 1,254,353 | | $ 976,791 | | $ 21,308 | | $ 55,237 | | |
Undistributed (Distributions in Excess of) Net Investment Income | | (23 | ) | 1,114 | | 6 | | (270 | ) | |
Accumulated Net Realized Gain (Loss) | | 762 | | 66,299 | | (35 | ) | (801 | ) | |
Unrealized Appreciation (Depreciation) on: | | | | | | | | | | |
Investments | | 318,491 | | 39,192 | | (1,072 | ) | (594 | ) | |
Foreign Currency Exchange Contracts and Translations | | @— | | 1 | | — | | (16 | ) | |
Net Assets | | $ 1,573,583 | | $ 1,083,397 | | $ 20,207 | | $ 53,556 | | |
The accompanying notes are an integral part of the financial statements. | 173 |
2007 Annual Report | |
| |
December 31, 2007 | |
Statements of Assets and Liabilities
| | U.S. Large
Cap Growth
Portfolio
(000) | | U.S. Real
Estate
Portfolio
(000) | | U.S. Small/
Mid Cap Value
Portfolio
(000) | | Emerging
Markets Debt
Portfolio
(000) | |
CLASS A: | | | | | | | | | | | |
Net Assets | | $ | 1,406,866 | | $ | 911,819 | | $ | 20,112 | | $ | 52,686 | | |
Shares Outstanding $0.001† par value shares of beneficial interest (500,000,000 shares authorized) (not in 000’s) | | | 56,989,730 | | | 57,877,384 | | | 2,123,164 | | | 4,592,506 | | |
Net Asset Value, Offering and Redemption Price Per Share | | $ | 24.69 | | $ | 15.75 | | $ | 9.47 | | $ | 11.47 | | |
CLASS B: | | | | | | | | | | | | | | |
Net Assets | | $ | 166,717 | | $ | 171,578 | | $ | 95 | | $ | 870 | | |
Shares Outstanding $0.001† par value shares of beneficial interest (500,000,000 shares authorized) (not in 000’s) | | | 6,870,057 | | | 11,049,932 | | | 10,000 | | | 73,896 | | |
Net Asset Value, Offering and Redemption Price Per Share | | $ | 24.27 | | $ | 15.53 | | $ | 9.47 | | $ | 11.77 | | |
(1) Including: | | | | | | | | | | | | | | |
Securities on Loan, at Value: | | $ | — | | $ | 153,417 | | $ | — | | $ | 4,055 | | |
@ Amount is less than $500. | | | | | |
† $0.003 par value shares of beneficial interest for Emerging Markets Debt Portfolio. | | | | |
174 | The accompanying notes are an integral part of the financial statements. | |
| 2007 Annual Report |
| |
| December 31, 2007 |
Statements of Operations
For the Year Ended December 31, 2007
| | Active
International
Allocation
Portfolio
(000) | Emerging
Markets
Portfolio
(000) | Global
Franchise
Portfolio
(000) | Global
Real Estate
Portfolio
(000) | | Global
Value Equity
Portfolio
(000) | |
Investment Income: | | | | | | | | | | | | |
Dividends from Securities of Unaffiliated Issuers | | $ 26,064 | | $ 46,526 | | $ 4,129 | | $ 11,452 | | $ 2,537 | | |
Dividends from Securities of Affiliated Issuer(s) | | 1,748 | | 1,566 | | 94 | | 618 | | 25 | | |
Interest from Securities of Unaffiliated Issuers | | 3,316 | | 1,928 | | 78 | | 145 | | 92 | | |
Less: Foreign Taxes Withheld | | (2,023 | ) | (2,692 | ) | (224 | ) | (624 | ) | (109 | ) | |
Total Investment Income | | 29,105 | | 47,328 | | 4,077 | | 11,591 | | 2,545 | | |
Expenses: | | | | | | | | | | | | |
Investment Advisory Fees (Note B) | | 6,904 | | 33,441 | | 1,056 | | 3,833 | | 683 | | |
Administration Fees (Note C) | | 854 | | 2,317 | | 106 | | 361 | | 82 | | |
Custodian Fees (Note E) | | 357 | | 2,443 | | 37 | | 155 | | 34 | | |
Directors’ Fees and Expenses | | 19 | | 51 | | 3 | | 6 | | 4 | | |
Professional Fees | | 73 | | 180 | | 36 | | 85 | | 37 | | |
Shareholder Reporting Fees | | 191 | | 369 | | 10 | | 47 | | 22 | | |
Shareholder Servicing Fees — Class B
(Note D) | | 10 | | 355 | | 13 | | 16 | | 65 | | |
Transfer Agency Fees | | 12 | | 27 | | 8 | | 13 | | 9 | | |
Registration Fees | | 41 | | 112 | | 28 | | 93 | | 27 | | |
Other Expenses | | 133 | | 144 | | 15 | | 19 | | 23 | | |
Expenses Before Bank Overdraft Expense | | 8,594 | | 39,439 | | 1,312 | | 4,628 | | 986 | | |
Bank Overdraft Expense | | 1 | | 15 | | 15 | | 4 | | 2 | | |
Total Expenses | | 8,595 | | 39,454 | | 1,327 | | 4,632 | | 988 | | |
Voluntary Waiver of Investment Advisory Fees (Note B) | | (42 | ) | — | | — | | — | | — | | |
Rebate from Morgan Stanley Affiliated Cash Sweep (Note F) | | (36 | ) | (33 | ) | (2 | ) | (13 | ) | (1 | ) | |
Expense Offset (Note E) | | (4 | ) | (25 | ) | (1 | ) | (9 | ) | @— | | |
Net Expenses | | 8,513 | | 39,396 | | 1,324 | | 4,610 | | 987 | | |
Net Investment Income (Loss) | | 20,592 | | 7,932 | | 2,753 | | 6,981 | | 1,558 | | |
Realized Gain (Loss): | | | | | | | | | | | | |
Investments Sold | | 112,232 | * | 667,526 | * | 16,899 | | 12,072 | | 15,288 | | |
Foreign Currency Transactions | | 9,788 | | (9,286 | ) | (1,547 | ) | (77 | ) | (126 | ) | |
Futures Contracts | | 2,978 | | — | | — | | — | | — | | |
Net Realized Gain (Loss) | | 124,998 | | 658,240 | | 15,352 | | 11,995 | | 15,162 | | |
Change in Unrealized Appreciation (Depreciation): | | | | | | | | | | | | |
Investments | | 5,093 | ** | 326,011 | ** | (7,682 | ) | (96,792 | ) | (10,231 | ) | |
Foreign Currency Exchange Contracts and Translations | | (2,464 | ) | 2,382 | | 1,085 | | 21 | | 75 | | |
Futures Contracts | | (128 | ) | — | | — | | — | | — | | |
Net Change in Unrealized Appreciation (Depreciation) | | 2,501 | | 328,393 | | (6,597 | ) | (96,771 | ) | (10,156 | ) | |
Total Net Realized Gain (Loss) and Change in Unrealized Appreciation (Depreciation) | | 127,499 | | 986,633 | | 8,755 | | (84,776 | ) | 5,006 | | |
Net Increase (Decrease) in Net Assets Resulting from Operations | | $148,091 | | $994,565 | | $11,508 | | $(77,795 | ) | $ 6,564 | | |
| | | | | | | | | | | | | |
@ Amount is less than $500.
* Net of Capital Gain Country Tax of $207 and $106 for Active International Allocation and Emerging Markets, respectively.
* * Net of increase in Deferred Capital Gain Country Tax Accrual on unrealized appreciation of $440 and $4,432 for Active International Allocation and Emerging Markets, respectively.
| The accompanying notes are an integral part of the financial statements. | 175 |
2007 Annual Report | |
| |
December 31, 2007 | |
Statements of Operations
For the Year Ended December 31, 2007
| | International
Equity
Portfolio
(000) | | International
Growth Active
Extension^
Portfolio
(000) | International
Growth
Equity
Portfolio
(000) | International
Magnum
Portfolio
(000) | International
Real Estate
Portfolio
(000) | |
Investment Income: | | | | | | | | | | | | |
Dividends from Securities of Unaffiliated Issuers | | $ 201,500 | | $ 73 | | $ 160 | | $ 2,766 | | $ 49,450 | | |
Dividends from Security of Affiliated Issuer | | 4,917 | | 4 | | 9 | | 292 | | 1,053 | | |
Interest from Securities of Unaffiliated Issuers | | 10,549 | | @— | | 1 | | 153 | | 1,187 | | |
Less: Foreign Taxes Withheld | | (14,961 | ) | (6 | ) | (14 | ) | (234 | ) | (4,341 | ) | |
Total Investment Income | | 202,005 | | 71 | | 156 | | 2,977 | | 47,349 | | |
Expenses: | | | | | | | | | | | | |
Investment Advisory Fees
(Note B) | | 55,758 | | 50 | | 61 | | 1,044 | | 12,508 | | |
Administration Fees (Note C) | | 5,576 | | 3 | | 7 | | 104 | | 1,251 | | |
Custodian Fees (Note E) | | 1,385 | | 10 | | 15 | | 67 | | 417 | | |
Directors’ Fees and Expenses | | 140 | | — | | @— | | 4 | | 23 | | |
Professional Fees | | 313 | | 23 | | 66 | | 34 | | 62 | | |
Shareholder Reporting Fees | | 726 | | 22 | | 6 | | 27 | | 281 | | |
Shareholder Servicing Fees— Class B (Note D) | | 2,881 | | @— | | 1 | | 6 | | 280 | | |
Registration Fees | | 111 | | 14 | | 26 | | 32 | | 74 | | |
Transfer Agency Fees | | 55 | | 3 | | 6 | | 8 | | 1 | | |
Other Expenses | | 676 | | 1 | | 9 | | 26 | | 117 | | |
Expenses Before Bank Overdraft Expense, Dividend Expense on Short Positions and Stock Loan Fee | | 67,621 | | 126 | | 197 | | 1,352 | | 15,014 | | |
Bank Overdraft Expense | | 1 | | 1 | | @— | | 2 | | 4 | | |
Dividend Expense on Short Positions | | — | | 29 | | — | | — | | — | | |
Stock Loan Fee | | — | | 10 | | — | | — | | — | | |
Total Expenses | | 67,622 | | 166 | | 197 | | 1,354 | | 15,018 | | |
Voluntary Waiver of Investment Advisory Fees (Note B) | | — | | (50 | ) | (61 | ) | (42 | ) | — | | |
Expenses Reimbursed by Adviser (Note B) | | — | | (21 | ) | (54 | ) | — | | — | | |
Rebate from Morgan Stanley Affiliated Cash Sweep
(Note F) | | (103 | ) | @— | | @— | | (6 | ) | (21 | ) | |
Expense Offset (Note E) | | (12 | ) | (1 | ) | @— | | @— | | (8 | ) | |
Net Expenses | | 67,507 | | 94 | | 82 | | 1,306 | | 14,989 | | |
Net Investment Income (Loss) | | 134,498 | | (23 | ) | 74 | | 1,671 | | 32,360 | | |
Realized Gain (Loss): | | | | | | | | | | | | |
Investments Sold | | 882,153 | | (84 | ) | 541 | * | 9,641 | * | 90,374 | | |
Foreign Currency Transactions | | (10,212 | ) | 5 | | (4 | ) | 1,392 | | 351 | | |
Futures Contracts | | — | | — | | — | | (895 | ) | — | | |
Net Realized Gain (Loss) | | 871,941 | | (79 | ) | 537 | | 10,138 | | 90,725 | | |
Change in Unrealized Appreciation (Depreciation): | | | | | | | | | | | | |
Investments | | (348,130 | ) | 575 | | 503 | ** | 5,926 | ** | (433,885 | ) | |
Foreign Currency Exchange Contracts and Translations | | 7,300 | | @— | | (19 | ) | (277 | ) | (38 | ) | |
Securities Sold Short | | — | | 186 | | — | | — | | — | | |
Net Change in Unrealized Appreciation (Depreciation) | | (340,830 | ) | 761 | | 484 | | 5,649 | | (433,923 | ) | |
Total Net Realized Gain (Loss) and Change in Unrealized Appreciation (Depreciation) | | 531,111 | | 682 | | 1,021 | | 15,787 | | (343,198 | ) | |
Net Increase (Decrease) in Net Assets Resulting from Operations | | $ 665,609 | | $ 659 | | $ 1,095 | | $ 17,458 | | $(310,838 | ) | |
^ | | For the period from July 31, 2007 (commencement of operations) to December 31, 2007. |
@ | | Amount is less than $500. |
* | | Net of Capital Gain Country Tax of $1 and $16 for International Growth Equity and International Magnum, respectively. |
* * | | Net of increase in Deferred Capital Gain Country Tax Accrual on unrealized depreciation of $1 and $@ for International Growth Equity and International Magnum, respectively. |
| | | | | | | | | | | | | | | |
176 | The accompanying notes are an integral part of the financial statements. | |
| 2007 Annual Report |
| |
| December 31, 2007 |
Statements of Operations
For the Year Ended December 31, 2007
| | International
Small Cap
Portfolio
(000) | | Disciplined
Large Cap Value
Active Extension
Portfolio^
(000) | Focus
Equity
Portfolio
(000) | | Large Cap
Relative
Value
Portfolio
(000) | | Small
Company
Growth
Portfolio
(000) | |
Investment Income: | | | | | | | | | | | | |
Dividends from Securities of Unaffiliated Issuers | | $ 28,741 | | $ 94 | | $ 154 | | $ 6,541 | | $ 10,705 | | |
Dividends from Security of Affiliated Issuer | | 456 | | 6 | | 20 | | 479 | | 1,487 | | |
Interest from Securities of Unaffiliated Issuers | | 270 | | 2 | | 6 | | 223 | | 436 | | |
Less: Foreign Taxes Withheld | | (2,538 | ) | — | | (8 | ) | — | | (22 | ) | |
Total Investment Income | | 26,929 | | 102 | | 172 | | 7,243 | | 12,606 | | |
Expenses: | | | | | | | | | | | | |
Investment Advisory Fees (Note B) | | 11,690 | | 39 | | 74 | | 1,416 | | 16,828 | | |
Administration Fees (Note C) | | 985 | | 3 | | 12 | | 243 | | 1,538 | | |
Custodian Fees (Note E) | | 345 | | 8 | | 9 | | 25 | | 49 | | |
Directors’ Fees and Expenses | | 23 | | @— | | 2 | | 8 | | 31 | | |
Professional Fees | | 91 | | 25 | | 26 | | 34 | | 92 | | |
Shareholder Reporting Fees | | 155 | | 3 | | 8 | | 68 | | 488 | | |
Shareholder Servicing Fees — Class B (Note D) | | — | | @— | | 6 | | 157 | | 2,077 | | |
Transfer Agency Fees | | 18 | | 4 | | 9 | | 16 | | 61 | | |
Registration Fees | | 30 | | 14 | | 21 | | 48 | | 90 | | |
Other Expenses | | 99 | | 2 | | 7 | | 186 | | 229 | | |
Expenses Before Bank Overdraft Expense, Dividend Expense on Short Positions and Stock Loan Fee | | 13,436 | | 98 | | 174 | | 2,201 | | 21,483 | | |
Bank Overdraft Expense | | 12 | | 1 | | @— | | @— | | 14 | | |
Dividend Expense on Short Positions | | — | | 22 | | — | | — | | — | | |
Stock Loan Fee | | — | | 5 | | — | | — | | — | | |
Total Expenses | | 13,448 | | 126 | | 174 | | 2,201 | | 21,497 | | |
Voluntary Waiver of Investment Advisory Fees (Note B) | | — | | (39 | ) | (19 | ) | — | | — | | |
Expenses Reimbursed by Adviser
(Note B) | | — | | (11 | ) | — | | — | | — | | |
Rebate from Morgan Stanley Affiliated Cash Sweep (Note F) | | (9 | ) | @— | | (1 | ) | (10 | ) | (32 | ) | |
Expense Offset (Note E) | | (3 | ) | (1 | ) | @— | | @— | | (8 | ) | |
Net Expenses | | 13,436 | | 75 | | 154 | | 2,191 | | 21,457 | | |
Net Investment Income (Loss) | | 13,493 | | 27 | | 18 | | 5,052 | | (8,851 | ) | |
Realized Gain (Loss): | | | | | | | | | | | | |
Investments Sold | | 225,338 | | (252 | ) | 1,075 | | 11,824 | | 67,129 | | |
Foreign Currency Transactions | | 897 | | — | | 2 | | — | | (25 | ) | |
Futures Contracts | | — | | — | | — | | — | | — | | |
Net Realized Gain (Loss) | | 226,235 | | (252 | ) | 1,077 | | 11,824 | | 67,104 | | |
Change in Unrealized Appreciation (Depreciation): | | | | | | | | | | | | |
Investments | | (254,423 | ) | (794 | ) | 2,043 | | (9,583 | ) | (504 | ) | |
Foreign Currency Exchange Contracts and Translations | | 150 | | — | | @— | | — | | @— | | |
Securities Sold Short | | — | | 327 | | — | | — | | — | | |
Net Change in Unrealized Appreciation (Depreciation) | | (254,273 | ) | (467 | ) | 2,043 | | (9,583 | ) | (504 | ) | |
Total Net Realized Gain (Loss) and Change in Unrealized Appreciation (Depreciation) | | (28,038 | ) | (719 | ) | 3,120 | | 2,241 | | 66,600 | | |
Net Increase (Decrease) in Net Assets Resulting from Operations | | $ (14,545 | ) | $ (692 | ) | $3,138 | | $ 7,293 | | $57,749 | | |
^ For the period from May 31, 2007 (commencement of operations) to December 31, 2007.
@ Amount is less than $500.
The accompanying notes are an integral part of the financial statements.
177
2007 Annual Report | |
| |
December 31, 2007 | |
Statements of Operations
For the Year Ended December 31, 2007
| | Systematic
Active Large
Cap Core
Portfolio
(000) | | Systematic
Active Small
Cap Core
Portfolio
(000) | | Systematic
Active Small
Cap Growth
Portfolio
(000) | | Systematic
Active Small
Cap Value
Portfolio
(000) | | Systematic
Large Cap Core
Active Extension
Portfolio^
(000) | |
Investment Income: | | | | | | | | | | | | | | | | |
Dividends from Securities of Unaffiliated Issuers | | $ | 94 | | | $ | 94 | | | $ | 47 | | | $ | 154 | | | $ | 59 | | |
Dividends from Security of Affiliated Issuer | | 17 | | | 18 | | | 26 | | | 15 | | | 6 | | |
Interest from Securities of Unaffiliated Issuers | | 8 | | | 13 | | | 14 | | | 13 | | | — | | |
Less: Foreign Taxes Withheld | | @— | | | — | | | — | | | @— | | | @— | | |
Total Investment Income | | 119 | | | 125 | | | 87 | | | 182 | | | 65 | | |
Expenses: | | | | | | | | | | | | | | | | |
Investment Advisory Fees (Note B) | | 24 | | | 49 | | | 53 | | | 51 | | | 41 | | |
Administration Fees (Note C) | | 6 | | | 5 | | | 6 | | | 5 | | | 3 | | |
Custodian Fees (Note E) | | 7 | | | 5 | | | 5 | | | 6 | | | 6 | | |
Directors’ Fees and Expenses | | @— | | | @— | | | @— | | | @— | | | @— | | |
Professional Fees | | 29 | | | 30 | | | 30 | | | 30 | | | 25 | | |
Shareholder Reporting Fees | | (16 | )† | | (10 | )† | | (9 | )† | | (10 | )† | | 2 | | |
Registration Fees | | 24 | | | 24 | | | 24 | | | 24 | | | 14 | | |
Shareholder Servicing Fees — Class B (Note D) | | @— | | | @— | | | @— | | | @— | | | @— | | |
Transfer Agency Fees | | 6 | | | 6 | | | 6 | | | 6 | | | 5 | | |
Other Expenses | | 6 | | | 6 | | | 6 | | | 6 | | | 1 | | |
Expenses Before Bank Overdraft Expense, Dividend Expense on Short Positions and Stock Loan Fee | | 86 | | | 115 | | | 121 | | | 118 | | | 97 | | |
Bank Overdraft Expense | | — | | | @— | | | @— | | | @— | | | 1 | | |
Dividend Expense on Short Positions | | — | | | — | | | — | | | — | | | 13 | | |
Stock Loan Fee | | — | | | — | | | — | | | — | | | 4 | | |
Total Expenses | | 86 | | | 115 | | | 121 | | | 118 | | | 115 | | |
Voluntary Waiver of Investment Advisory Fees (Note B) | | (24 | ) | | (43 | ) | | (42 | ) | | (44 | ) | | (41 | ) | |
Expenses Reimbursed by Adviser (Note B) | | (18 | ) | | — | | | — | | | — | | | (7 | ) | |
Rebate from Morgan Stanley Affiliated Cash Sweep (Note F) | | @— | | | @— | | | (1 | ) | | @— | | | @— | | |
Expense Offset (Note E) | | (3 | ) | | @— | | | @— | | | @— | | | (1 | ) | |
Net Expenses | | 41 | | | 72 | | | 78 | | | 74 | | | 66 | | |
Net Investment Income (Loss) | | 78 | | | 53 | | | 9 | | | 108 | | | (1 | ) | |
Realized Gain (Loss): | | | | | | | | | | | | | | | | |
Investments Sold | | 52 | | | 401 | | | 548 | | | 471 | | | (266 | ) | |
Futures Contracts | | (5 | ) | | (42 | ) | | (59 | ) | | (32 | ) | | — | | |
Net Realized Gain (Loss) | | 47 | | | 359 | | | 489 | | | 439 | | | (266 | ) | |
Change in Unrealized Appreciation (Depreciation): | | | | | | | | | | | | | | | | |
Investments | | 269 | | | (970 | ) | | (448 | ) | | (1,581 | ) | | (301 | ) | |
Futures Contracts | | @— | | | 8 | | | 10 | | | 5 | | | — | | |
Securities Sold Short | | — | | | — | | | — | | | — | | | 247 | | |
Net Change in Unrealized Appreciation (Depreciation) | | 269 | | | (962 | ) | | (438 | ) | | (1,576 | ) | | (54 | ) | |
Total Net Realized Gain (Loss) and Change in Unrealized Appreciation (Depreciation) | | 316 | | | (603 | ) | | 51 | | | (1,137 | ) | | (320 | ) | |
Net Increase (Decrease) in Net Assets Resulting from Operations | | $ | 394 | | | $ | (550 | ) | | $ | 60 | | | $ | (1,029 | ) | | $ | (321 | ) | |
^ | | For the period from May 31, 2007 (commencement of operations) to December 31, 2007. |
@ | | Amount is less than $500. |
† | | The Portfolio commenced operations in 2006. The contra expense amounts are due to a prior year overaccrual. Amounts shown include a true up for year one estimated expenses. |
178 | The accompanying notes are an integral part of the financial statements. | |
| 2007 Annual Report |
| |
| December 31, 2007 |
Statements of Operations
For the Year Ended December 31, 2007
| |
U.S. Large
Cap Growth
Portfolio
(000)
| | | U.S. Real
Estate
Portfolio
(000) | | U.S. Small/
Mid Cap
Value
Portfolio^
(000) | | Emerging
Markets Debt
Portfolio
(000) | |
Investment Income: | | | | | | | | | | | |
Dividends from Securities of Unaffiliated Issuers | | $ 12,871 | | | $ 34,671 | | $ 43 | | $ — | | |
Dividends from Security of Affiliated Issuer | | 550 | | | 770 | | 28 | | 83 | | |
Interest from Securities of Unaffiliated Issuers | | 297 | | | 900 | | 1 | | 3,621 | | |
Less: Foreign Taxes Withheld | | (335 | ) | | (165 | ) | @— | | — | | |
Total Investment Income | | 13,383 | | | 36,176 | | 72 | | 3,704 | | |
Expenses: | | | | | | | | | | | |
Investment Advisory Fees (Note B) | | 6,061 | | | 12,639 | | 35 | | 414 | | |
Administration Fees (Note C) | | 988 | | | 1,359 | | 4 | | 44 | | |
Custodian Fees (Note E) | | 38 | | | 50 | | @— | | 17 | | |
Directors’ Fees and Expenses | | 26 | | | 31 | | @— | | 2 | | |
Professional Fees | | 67 | | | 91 | | 23 | | 43 | | |
Shareholder Reporting Fees | | 291 | | | 525 | | 4 | | 42 | | |
Shareholder Servicing Fees — Class B (Note D) | | 245 | | | 628 | | @— | | 2 | | |
Registration Fees | | 52 | | | 43 | | @— | | 39 | | |
Transfer Agency Fees | | 18 | | | 52 | | 2 | | 8 | | |
Country Tax Expense# | | — | | | — | | — | | 24 | | |
Other Expenses | | 130 | | | 184 | | @— | | 9 | | |
Expenses Before Bank Overdraft and Investment Related Expenses | | 7,916 | | | 15,602 | | 68 | | 644 | | |
Bank Overdraft Expense | | 4 | | | 61 | | — | | 23 | | |
Investment Related Expenses | | — | | | 258 | | — | | — | | |
Total Expenses | | 7,920 | | | 15,921 | | 68 | | 667 | | |
Voluntary Waiver of Investment Advisory Fees (Note B) | | — | | | — | | — | | (148 | ) | |
Expenses Reimbursed by Adviser (Note B) | | — | | | — | | — | | — | | |
Rebate from Morgan Stanley Affiliated Cash Sweep (Note F) | | (12 | ) | | (16 | ) | (1 | ) | (2 | ) | |
Expense Offset (Note E) | | (5 | ) | | (12 | ) | — | | (1 | ) | |
Net Expenses | | 7,903 | | | 15,893 | | 67 | | 516 | | |
Net Investment Income (Loss) | | 5,480 | | | 20,283 | | 5 | | 3,188 | | |
Realized Gain (Loss): | | | | | | | | | | | |
Investments Sold | | 72,084 | | | 420,572 | | (17 | ) | 3,782 | | |
Foreign Currency Transactions | | (37 | ) | | 57 | | — | | 322 | | |
Options Written | | — | | | — | | — | | 332 | | |
Futures Contracts | | — | | | — | | — | | 1 | | |
Net Realized Gain (Loss) | | 72,047 | | | 420,629 | | (17 | ) | 4,437 | | |
Change in Unrealized Appreciation (Depreciation): | | | | | | | | | | | |
Investments | | 166,291 | | | (693,157 | ) | (1,072 | ) | (5,701 | ) | |
Foreign Currency Exchange Contracts and Translations | | @— | | | 1 | | — | | (18 | ) | |
Futures Contracts | | — | | | — | | — | | @— | | |
Net Change in Unrealized Appreciation (Depreciation) | | 166,291 | | | (693,156 | ) | (1,072 | ) | (5,719 | ) | |
Total Net Realized Gain (Loss) and Change in Unrealized Appreciation (Depreciation) | | 238,338 | | | (272,527 | ) | (1,089 | ) | (1,282 | ) | |
Net Increase (Decrease) in Net Assets Resulting from Operations | | $243,818 | | | $(252,244 | ) | $(1,084 | ) | $ 1,906 | | |
| | | | | | | | | | | | |
^ | | For the period from September 27, 2007 (commencement of operations) to December 31, 2007. |
@ | | Amount is less than $500. |
# | | CPMF (Provisional Contribution on Financial Transactions) is a Brazilian federal tax imposed on certain banking transactions and account withdrawals. The Tax is charged based on the value of the transaction. |
| The accompanying notes are an integral part of the financial statements. | 179 |
2007 Annual Report | |
| |
December 31, 2007 | |
Statements of Changes in Net Assets
| | Active
International Allocation
Portfolio | | Emerging Markets
Portfolio | |
| | Year Ended
December 31,
2007
(000) | | Year Ended
December 31,
2006
(000) | | Year Ended
December 31,
2007
(000) | | Year Ended
December 31,
2006
(000) | |
Increase (Decrease) in Net Assets | | | | | | | | | | |
Operations: | | | | | | | | | | |
Net Investment Income (Loss) | | $ | 20,592 | | $ | 17,545 | | $ | 7,932 | | $ | 12,943 | | |
Net Realized Gain (Loss) | | 124,998 | | 48,028 | | 658,240 | | 407,354 | | |
Net Change in Unrealized Appreciation (Depreciation) | | 2,501 | | 126,792 | | 328,393 | | 244,555 | | |
Net Increase (Decrease) in Net Assets Resulting from Operations | | 148,091 | | 192,365 | | 994,565 | | 664,852 | | |
Distributions from and/or in Excess of: | | | | | | | | | | |
Class A: | | | | | | | | | | |
Net Investment Income | | (34,919 | ) | (22,355 | ) | (10,445 | ) | (19,320 | ) | |
Net Realized Gain | | (58,076 | ) | — | | (571,529 | ) | (344,280 | ) | |
Class B: | | | | | | | | | | |
Net Investment Income | | (149 | ) | (70 | ) | (208 | ) | (740 | ) | |
Net Realized Gain | | (273 | ) | — | | (30,744 | ) | (19,457 | ) | |
Total Distributions | | (93,417 | ) | (22,425 | ) | (612,926 | ) | (383,797 | ) | |
Capital Share Transactions:(1) | | | | | | | | | | |
Class A: | | | | | | | | | | |
Subscribed | | 172,124 | | 187,571 | | 660,992 | | 592,680 | | |
Distributions Reinvested | | 77,571 | | 18,880 | | 569,830 | | 352,736 | | |
Redeemed | | (177,984 | ) | (200,465 | ) | (557,714 | ) | (680,751 | ) | |
Redemption Fees | | 3 | | 3 | | 434 | | 339 | | |
Class B: | | | | | | | | | | |
Subscribed | | 3,372 | | 6,914 | | 81,605 | | 113,026 | | |
Distributions Reinvested | | 422 | | 70 | | 30,914 | | 20,035 | | |
Redeemed | | (2,096 | ) | (6,523 | ) | (74,740 | ) | (122,311 | ) | |
Redemption Fees | | @— | | @— | | 19 | | 23 | | |
Net Increase (Decrease) in Net Assets Resulting from Capital Share Transactions | | 73,412 | | 6,450 | | 711,340 | | 275,777 | | |
Total Increase (Decrease) in Net Assets | | 128,086 | | 176,390 | | 1,092,979 | | 556,832 | | |
Net Assets: | | | | | | | | | | |
Beginning of Period | | 970,934 | | 794,544 | | 2,409,985 | | 1,853,153 | | |
End of Period | | $ | 1,099,020 | | $ | 970,934 | | $ | 3,502,964 | | $ | 2,409,985 | | |
Undistributed (Distributions in Excess of) Net Investment Income Included in End of Period Net Assets | | $ | (2,542 | ) | $ | 775 | | $ | (24,956 | ) | $ | (14,608 | ) | |
(1) Capital Share Transactions: | | | | | | | | | | |
Class A: | | | | | | | | | | |
Shares Subscribed | | 10,505 | | 13,737 | | 19,285 | | 20,344 | | |
Shares Issued on Distributions Reinvested | | 5,006 | | 1,261 | | 17,164 | | 12,457 | | |
Shares Redeemed | | (10,838 | ) | (14,670 | ) | (16,736 | ) | (23,842 | ) | |
Net Increase (Decrease) in Class A Shares Outstanding | | 4,673 | | 328 | | 19,713 | | 8,959 | | |
Class B: | | | | | | | | | | |
Shares Subscribed | | 193 | | 514 | | 2,355 | | 3,784 | | |
Shares Issued on Distributions Reinvested | | 27 | | 4 | | 950 | | 717 | | |
Shares Redeemed | | (126 | ) | (461 | ) | (2,305 | ) | (4,254 | ) | |
Net Increase (Decrease) in Class B Shares Outstanding | | 94 | | 57 | | 1,000 | | 247 | | |
| | | | | | | | | | | | | | | | | | | |
@ Amount is less than $500.
180 | The accompanying notes are an integral part of the financial statements. | |
| 2007 Annual Report |
| |
| December 31, 2007 |
Statements of Changes in Net Assets
| | Global Franchise
Portfolio | | Global Real Estate
Portfolio | |
| | Year Ended
December 31,
2007
(000) | | Year Ended
December 31,
2006
(000) | | Year Ended
December 31,
2007
(000) | | Period Ended
December 31,
2006^
(000) | |
Increase (Decrease) in Net Assets | | | | | | | | | | |
Operations: | | | | | | | | | | |
Net Investment Income (Loss) | | $ 2,753 | | $ 2,168 | | $ 6,981 | | $ 873 | | |
Net Realized Gain (Loss) | | 15,352 | | 8,205 | | 11,995 | | 1,210 | | |
Net Change in Unrealized Appreciation (Depreciation) | | (6,597 | ) | 13,638 | | (96,771 | ) | 26,101 | | |
Net Increase (Decrease) in Net Assets Resulting from Operations | | 11,508 | | 24,011 | | (77,795 | ) | 28,184 | | |
Distributions from and/or in Excess of: | | | | | | | | | | |
Class A: | | | | | | | | | | |
Net Investment Income | | (870 | ) | (898 | ) | (21,830 | ) | (2,292 | ) | |
Net Realized Gain | | (17,250 | ) | (6,479 | ) | (12,446 | ) | (438 | ) | |
Class B: | | | | | | | | | | |
Net Investment Income | | (39 | ) | (19 | ) | (398 | ) | (1 | ) | |
Net Realized Gain | | (940 | ) | (205 | ) | (256 | ) | @— | | |
Total Distributions | | (19,099 | ) | (7,601 | ) | (34,930 | ) | (2,731 | ) | |
Capital Share Transactions:(1) | | | | | | | | | | |
Class A: | | | | | | | | | | |
Subscribed | | 4,659 | | 51,389 | | 665,106 | | 218,187 | | |
Distributions Reinvested | | 17,953 | | 7,255 | | 32,111 | | 2,728 | | |
Redeemed | | (33,859 | ) | (30,984 | ) | (193,108 | ) | (7,708 | ) | |
Redemption Fees | | — | | 4 | | 18 | | 3 | | |
Class B: | | | | | | | | | | |
Subscribed | | 3,728 | | 453 | | 22,603 | | 100 | | |
Distributions Reinvested | | 862 | | 181 | | 638 | | — | | |
Redeemed | | (1,859 | ) | (1,558 | ) | (7,482 | ) | — | | |
Redemption Fees | | — | | @— | | @— | | @— | | |
Net Increase (Decrease) in Net Assets Resulting from Capital Share Transactions | | (8,516 | ) | 26,740 | | 519,886 | | 213,310 | | |
Total Increase (Decrease) in Net Assets | | (16,107 | ) | 43,150 | | 407,161 | | 238,763 | | |
Net Assets: | | | | | | | | | | |
Beginning of Period | | 132,569 | | 89,419 | | 238,763 | | — | | |
End of Period | | $116,462 | | $ 132,569 | | $ 645,924 | | $ 238,763 | | |
Undistributed (Distributions in Excess of) Net Investment Income Included in End of Period Net Assets | | $ 525 | | $ 228 | | $ (13,261 | ) | $ (1,309 | ) | |
(1) Capital Share Transactions: | | | | | | | | | | |
Class A: | | | | | | | | | | |
Shares Subscribed | | 242 | | 3,123 | | 55,916 | | 21,098 | | |
Shares Issued on Distributions Reinvested | | 1,063 | | 409 | | 3,196 | | 241 | | |
Shares Redeemed | | (1,821 | ) | (1,808 | ) | (16,713 | ) | (701 | ) | |
Net Increase (Decrease) in Class A Shares Outstanding | | (516 | ) | 1,724 | | 42,399 | | 20,638 | | |
Class B: | | | | | | | | | | |
Shares Subscribed | | 198 | | 26 | | 1,903 | | 10 | | |
Shares Issued on Distributions Reinvested | | 52 | | 10 | | 64 | | — | | |
Shares Redeemed | | (97 | ) | (87 | ) | (660 | ) | — | | |
Net Increase (Decrease) in Class B Shares Outstanding | | 153 | | (51 | ) | 1,307 | | 10 | | |
| | | | | | | | | | | | | | | |
^ | Global Real Estate Portfolio commenced operations on August 30, 2006. |
@ | Amount is less than $500. |
| The accompanying notes are an integral part of the financial statements. | 181 |
2007 Annual Report | |
| |
December 31, 2007 | |
Statements of Changes in Net Assets
| | Global Value Equity
Portfolio | | International Equity
Portfolio | |
| | Year Ended
December 31,
2007
(000) | | Year Ended
December 31,
2006
(000) | | Year Ended
December 31,
2007
(000) | | Year Ended
December 31,
2006
(000) | |
Increase (Decrease) in Net Assets | | | | | | | | | | |
Operations: | | | | | | | | | | |
Net Investment Income (Loss) | | $ 1,558 | | $ 1,918 | | $ 134,498 | | $ 212,224 | | |
Net Realized Gain (Loss) | | 15,162 | | 6,732 | | 871,941 | | 1,034,579 | | |
Net Change in Unrealized Appreciation (Depreciation) | | (10,156 | ) | 14,322 | | (340,830 | ) | 264,694 | | |
Net Increase (Decrease) in Net Assets Resulting from Operations | | 6,564 | | 22,972 | | 665,609 | | 1,511,497 | | |
Distributions from and/or in Excess of: | | | | | | | | | | |
Class A: | | | | | | | | | | |
Net Investment Income | | (1,044 | ) | (1,618 | ) | (105,722 | ) | (144,056 | ) | |
Net Realized Gain | | (10,780 | ) | (4,953 | ) | (731,331 | ) | (917,867 | ) | |
Class B: | | | | | | | | | | |
Net Investment Income | | (322 | ) | (386 | ) | (18,724 | ) | (25,432 | ) | |
Net Realized Gain | | (3,997 | ) | (1,352 | ) | (149,480 | ) | (181,273 | ) | |
Total Distributions | | (16,143 | ) | (8,309 | ) | (1,005,257 | ) | (1,268,628 | ) | |
Capital Share Transactions:(1) | | | | | | | | | | |
Class A: | | | | | | | | | | |
Subscribed | | 3,698 | | 12,229 | | 746,973 | | 787,978 | | |
Distributions Reinvested | | 11,789 | | 6,534 | | 780,820 | | 967,612 | | |
Redeemed | | (43,789 | ) | (15,405 | ) | (2,044,329 | ) | (2,767,428 | ) | |
Redemption Fees | | 6 | | 25 | | 256 | | 266 | | |
Class B: | | | | | | | | | | |
Subscribed | | 4,116 | | 4,567 | | 321,010 | | 365,342 | | |
Distributions Reinvested | | 4,319 | | 1,739 | | 168,106 | | 206,433 | | |
Redeemed | | (9,264 | ) | (3,360 | ) | (561,568 | ) | (660,276 | ) | |
Redemption Fees | | 2 | | 6 | | 54 | | 75 | | |
Net Increase (Decrease) in Net Assets Resulting from Capital Share Transactions | | (29,123 | ) | 6,335 | | (588,678 | ) | (1,099,998 | ) | |
Total Increase (Decrease) in Net Assets | | (38,702 | ) | 20,998 | | (928,326 | ) | (857,129 | ) | |
Net Assets: | | | | | | | | | | |
Beginning of Period | | 128,936 | | 107,938 | | 7,053,728 | | 7,910,857 | | |
End of Period | | $ 90,234 | | $128,936 | | $6,125,402 | | $ 7,053,728 | | |
Undistributed (Distributions in Excess of) Net Investment Income Included in End of Period Net Assets | | $ 58 | | $ (32 | ) | $ (3,623 | ) | $ (4,528 | ) | |
(1) Capital Share Transactions: | | | | | | | | | | |
Class A: | | | | | | | | | | |
Shares Subscribed | | 173 | | 653 | | 34,520 | | 35,254 | | |
Shares Issued on Distributions Reinvested | | 671 | | 329 | | 42,066 | | 47,109 | | |
Shares Redeemed | | (2,112 | ) | (800 | ) | (93,380 | ) | (125,261 | ) | |
Net Increase (Decrease) in Class A Shares Outstanding | | (1,268 | ) | 182 | | (16,794 | ) | (42,898 | ) | |
Class B: | | | | | | | | | | |
Shares Subscribed | | 194 | | 238 | | 14,903 | | 16,542 | | |
Shares Issued on Distributions Reinvested | | 248 | | 89 | | 9,151 | | 10,139 | | |
Shares Redeemed | | (445 | ) | (180 | ) | (26,119 | ) | (29,904 | ) | |
Net Increase (Decrease) in Class B Shares Outstanding | | (3 | ) | 147 | | (2,065 | ) | (3,223 | ) | |
| | | | | | | | | | | | | | | |
182 | The accompanying notes are an integral part of the financial statements. | |
| 2007 Annual Report |
| |
| December 31, 2007 |
Statements of Changes in Net Assets
| | International Growth
Active
Extension Portfolio | | International Growth Equity
Portfolio | |
| | Period Ended
December 31,
2007^
(000) | | Year Ended
December 31,
2007
(000) | | Year Ended
December 31,
2006
(000) | |
Increase (Decrease) in Net Assets | | | | | | | | |
Operations: | | | | | | | | |
Net Investment Income (Loss) | | $ (23 | ) | $ 74 | | $ 53 | | |
Net Realized Gain (Loss) | | (79 | ) | 537 | | 75 | | |
Net Change in Unrealized Appreciation (Depreciation) | | 761 | | 484 | | 1,382 | | |
Net Increase (Decrease) in Net Assets Resulting from Operations | | 659 | | 1,095 | | 1,510 | | |
Distributions from and/or in Excess of: | | | | �� | | | | |
Class A: | | | | | | | | |
Net Investment Income | | — | | (63 | ) | (49 | ) | |
Net Realized Gain | | — | | (301 | ) | (32 | ) | |
Class B: | | | | | | | | |
Net Investment Income | | — | | (3 | ) | (1 | ) | |
Net Realized Gain | | — | | (20 | ) | (2 | ) | |
Total Distributions | | — | | (387 | ) | (84 | ) | |
Capital Share Transactions:(1) | | | | | | | | |
Class A: | | | | | | | | |
Subscribed | | — | | 15,122 | | 613 | | |
Distributions Reinvested | | — | | 36 | | 8 | | |
Redeemed | | — | | (60 | ) | (30 | ) | |
Redemption Fees | | — | | — | | — | | |
Class B: | | | | | | | | |
Subscribed | | — | | 153 | | 630 | | |
Distributions Reinvested | | — | | 17 | | 2 | | |
Redeemed | | — | | — | | (534 | ) | |
Redemption Fees | | — | | — | | — | | |
Net Increase (Decrease) in Net Assets Resulting from Capital Share Transactions | | — | | 15,268 | | 689 | | |
Total Increase (Decrease) in Net Assets | | 659 | | 15,976 | | 2,115 | | |
Net Assets: | | | | | | | | |
Beginning of Period | | 10,000 | | 7,078 | | 4,963 | | |
End of Period | | $ 10,659 | | $ 23,054 | | $ 7,078 | | |
Undistributed (Distributions in Excess of) Net Investment Income Included in End of Period Net Assets | | $ (3 | ) | $ — | | $ (4 | ) | |
(1) Capital Share Transactions: | | | | | | | | |
Class A: | | | | | | | | |
Shares Subscribed | | 990 | | 1,100 | | 50 | | |
Shares Issued on Distributions Reinvested | | — | | 3 | | 1 | | |
Shares Redeemed | | — | | (4 | ) | (2 | ) | |
Net Increase (Decrease) in Class A Shares Outstanding | | 990 | | 1,099 | | 49 | | |
Class B: | | | | | | | | |
Shares Subscribed | | 10 | | 12 | | 59 | | |
Shares Issued on Distributions Reinvested | | — | | 1 | | @— | | |
Shares Redeemed | | — | | — | | (43 | ) | |
Net Increase (Decrease) in Class B Shares Outstanding | | 10 | | 13 | | 16 | | |
| | | | | | | | | | | |
@ | Amount is less than 500 shares. |
^ | International Growth Active Extension commenced operations on July 31, 2007. |
| The accompanying notes are an integral part of the financial statements. | 183 |
2007 Annual Report |
|
December 31, 2007 |
Statements of Changes in Net Assets
2007 Annual Report
| | International Magnum
Portfolio | | International Real Estate
Portfolio | |
| | Year Ended
December 31,
2007
(000) | | Year Ended
December 31,
2006
(000) | | Year Ended
December 31,
2007
(000) | | Year Ended
December 31,
2006
(000) | |
Increase (Decrease) in Net Assets | | | | | | | | | |
Operations: | | | | | | | | | |
Net Investment Income (Loss) | | $ | 1,671 | | | $ | 1,539 | | | $ | 32,360 | | | $ | 7,224 | | |
Net Realized Gain (Loss) | | 10,138 | | | 20,620 | | | 90,725 | | | 42,502 | | |
Net Change in Unrealized Appreciation (Depreciation) | | 5,649 | | | 4,315 | | | (433,923 | ) | | 254,627 | | |
Net Increase (Decrease) in Net Assets Resulting from Operations | | 17,458 | | | 26,474 | | | (310,838 | ) | | 304,353 | | |
Distributions from and/or in Excess of: | | | | | | | | | | | | | |
Class A: | | | | | | | | | | | | | |
Net Investment Income | | (3,494 | ) | | (2,641 | ) | | (75,854 | ) | | (25,151 | ) | |
Net Realized Gain | | (6,693 | ) | | (13,710 | ) | | (67,563 | ) | | (31,595 | ) | |
Class B: | | | | | | | | | | | | | |
Net Investment Income | | (57 | ) | | (36 | ) | | (5,828 | ) | | (1,958 | ) | |
Net Realized Gain | | (121 | ) | | (206 | ) | | (5,753 | ) | | (2,513 | ) | |
Total Distributions | | (10,365 | ) | | (16,593 | ) | | (154,998 | ) | | (61,217 | ) | |
Capital Share Transactions:(1) | | | | | | | | | | | | | |
Class A: | | | | | | | | | | | | | |
Subscribed | | 23,285 | | | 25,211 | | | 936,214 | | | 680,101 | | |
Distributions Reinvested | | 10,133 | | | 16,307 | | | 97,520 | | | 46,370 | | |
Redeemed | | (23,786 | ) | | (41,092 | ) | | (675,327 | ) | | (81,039 | ) | |
Redemption Fees | | @— | | | 2 | | | 48 | | | 20 | | |
Class B: | | | | | | | | | | | | | |
Subscribed | | 1,279 | | | 934 | | | 107,694 | | | 85,871 | | |
Distributions Reinvested | | 178 | | | 240 | | | 11,447 | | | 4,408 | | |
Redeemed | | (921 | ) | | (3,266 | ) | | (84,467 | ) | | (14,534 | ) | |
Redemption Fees | | @— | | | @— | | | 5 | | | 2 | | |
Net Increase (Decrease) in Net Assets Resulting from Capital Share Transactions | | 10,168 | | | (1,664 | ) | | 393,134 | | | 721,199 | | |
Total Increase (Decrease) in Net Assets | | 17,261 | | | 8,217 | | | (72,702 | ) | | 964,335 | | |
Net Assets: | | | | | | | | | | | | | |
Beginning of Period | | 118,220 | | | 110,003 | | | 1,223,520 | | | 259,185 | | |
End of Period | | $ | 135,481 | | | $ | 118,220 | | | $ | 1,150,818 | | | $ | 1,223,520 | | |
Undistributed (Distributions in Excess of) Net Investment Income Included in End of Period Net Assets | | $ | (237 | ) | | $ | 123 | | | $ | (34,483 | ) | | $ | (14,871 | ) | |
(1) | Capital Share Transactions: | | | | | | | | | | | | | |
Class A: | | | | | | | | | | | | | |
Shares Subscribed | | 1,533 | | | 1,768 | | | 27,636 | | | 22,996 | | |
Shares Issued on Distributions Reinvested | | 700 | | | 1,169 | | | 3,730 | | | 1,397 | | |
Shares Redeemed | | (1,569 | ) | | (2,829 | ) | | (22,070 | ) | | (2,674 | ) | |
Net Increase (Decrease) in Class A Shares Outstanding | | 664 | | | 108 | | | 9,296 | | | 21,719 | | |
Class B: | | | | | | | | | | | | | |
Shares Subscribed | | 85 | | | 66 | | | 3,292 | | | 2,783 | | |
Shares Issued on Distributions Reinvested | | 12 | | | 17 | | | 441 | | | 132 | | |
Shares Redeemed | | (62 | ) | | (236 | ) | | (2,683 | ) | | (469 | ) | |
Net Increase (Decrease) in Class B Shares Outstanding | | 35 | | | (153 | ) | | 1,050 | | | 2,446 | | |
| | | | | | | | | | | | | | | | | | |
@ Amount is less than $500.
184 | The accompanying notes are an integral part of the financial statements. |
| 2007 Annual Report |
| |
| December 31, 2007 |
Statements of Changes in Net Assets
| | International Small Cap
Portfolio | | Disciplined Large Cap
Value Active Extension
Portfolio | |
| | Year Ended
December 31,
2007
(000) | | Year Ended
December 31,
2006
(000) | | Period Ended
December 31, 2007^
(000) | |
Increase (Decrease) in Net Assets | | | | | | | |
Operations: | | | | | | | |
Net Investment Income (Loss) | | $ 13,493 | | | $ 17,507 | | | $ 27 | | |
Net Realized Gain (Loss) | | 226,235 | | | 204,321 | | | (252 | ) | |
Net Change in Unrealized Appreciation (Depreciation) | | (254,273 | ) | | 22,196 | | | (467 | ) | |
Net Increase (Decrease) in Net Assets Resulting from Operations | | (14,545 | ) | | 244,024 | | | (692 | ) | |
Distributions from and/or in Excess of: | | | | | | | | | | |
Class A: | | | | | | | | | | |
Net Investment Income | | (10,502 | ) | | (20,542 | ) | | (29 | ) | |
Net Realized Gain | | (223,789 | ) | | (229,672 | ) | | — | | |
Class B: | | | | | | | | | | |
Net Investment Income | | — | | | — | | | @— | | |
Net Realized Gain | | — | | | — | | | — | | |
Total Distributions | | (234,291 | ) | | (250,214 | ) | | (29 | ) | |
Capital Share Transactions:(1) | | | | | | | | | | |
Class A: | | | | | | | | | | |
Subscribed | | 93,078 | | | 154,461 | | | 5,000 | | |
Distributions Reinvested | | 208,756 | | | 228,241 | | | — | | |
Redeemed | | (569,019 | ) | | (453,530 | ) | | — | | |
Redemption Fees | | 7 | | | 4 | | | — | | |
Class B: | | | | | | | | | | |
Subscribed | | — | | | — | | | — | | |
Distributions Reinvested | | — | | | — | | | — | | |
Redeemed | | — | | | — | | | — | | |
Redemption Fees | | — | | | — | | | — | | |
Net Increase (Decrease) in Net Assets Resulting from Capital Share Transactions | | (267,178 | ) | | (70,824 | ) | | 5,000 | | |
Total Increase (Decrease) in Net Assets | | (516,014 | ) | | (77,014 | ) | | 4,279 | | |
Net Assets: | | | | | | | | | | |
Beginning of Period | | 1,312,064 | | | 1,389,078 | | | 5,000 | | |
End of Period | | $ 796,050 | | | $1,312,064 | | | $ 9,279 | | |
Undistributed (Distributions in Excess of) Net Investment Income Included in End of Period Net Assets | | $ (144 | ) | | $ (5,572 | ) | | $ — | | |
(1) | Capital Share Transactions: | | | | | | | | | | |
Class A: | | | | | | | | | | |
Shares Subscribed | | 3,786 | | | 5,989 | | | 1,071 | | |
Shares Issued on Distributions Reinvested | | 12,028 | | | 9,545 | | | — | | |
Shares Redeemed | | (24,536 | ) | | (17,759 | ) | | — | | |
Net Increase (Decrease) in Class A Shares Outstanding | | (8,722 | ) | | (2,225 | ) | | 1,071 | | |
Class B: | | | | | | | | | | |
Shares Subscribed | | — | | | — | | | 10 | | |
Shares Issued on Distributions Reinvested | | — | | | — | | | — | | |
Shares Redeemed | | — | | | — | | | — | | |
Net Increase (Decrease) in Class B Shares Outstanding | | — | | | — | | | 10 | | |
^ | Disciplined Large Cap Value Active Extension commenced operations on May 31, 2007. | |
@ Amount is less than $500. | |
| | | | | | | | | | | | | | |
| The accompanying notes are an integral part of the financial statements. | 185 |
2007 Annual Report |
|
December 31, 2007 |
Statements of Changes in Net Assets
| | Focus Equity
Portfolio | | Large Cap Relative Value
Portfolio | |
| | Year Ended
December 31,
2007
(000) | | Year Ended
December 31,
2006
(000) | | Year Ended
December 31,
2007
(000) | | Year Ended
December 31,
2006
(000) | |
Increase (Decrease) in Net Assets | | | | | | | | | |
Operations: | | | | | | | | | |
Net Investment Income (Loss) | | $ | 18 | | | $ | (157 | ) | | $ | 5,052 | | | $ | 3,883 | | |
Net Realized Gain (Loss) | | 1,077 | | | 11,170 | | | 11,824 | | | 13,797 | | |
Net Change in Unrealized Appreciation (Depreciation) | | 2,043 | | | (10,424 | ) | | (9,583 | ) | | 18,703 | | |
Net Increase (Decrease) in Net Assets Resulting from Operations | | 3,138 | | | 589 | | | 7,293 | | | 36,383 | | |
Distributions from and/or in Excess of: | | | | | | | | | | | | | |
Class A: | | | | | | | | | | | | | |
Net Investment Income | | (22 | ) | | — | | | (4,158 | ) | | (3,061 | ) | |
Net Realized Gain | | — | | | — | | | (9,556 | ) | | (8,593 | ) | |
Class B: | | | | | | | | | | | | | |
Net Investment Income | | — | | | — | | | (891 | ) | | (886 | ) | |
Net Realized Gain | | — | | | — | | | (2,283 | ) | | (2,670 | ) | |
Total Distributions | | (22 | ) | | — | | | (16,888 | ) | | (15,210 | ) | |
Capital Share Transactions:(1) | | | | | | | | | | | | | |
Class A: | | | | | | | | | | | | | |
Subscribed | | 2,269 | | | 8,415 | | | 67,425 | | | 94,848 | | |
Issued on Portfolio Merger | | — | | | — | | | — | | | 66,823 | | |
Distributions Reinvested | | 21 | | | — | | | 13,663 | | | 11,599 | | |
Redeemed | | (3,443 | ) | | (51,735 | ) | | (47,813 | ) | | (78,180 | ) | |
Redemption Fees | | @— | | | @— | | | 12 | | | 2 | | |
Class B: | | | | | | | | | | | | | |
Subscribed | | 776 | | | 4,977 | | | 8,087 | | | 5,886 | | |
Distributions Reinvested | | — | | | — | | | 3,161 | | | 3,542 | | |
Redeemed | | (707 | ) | | (14,276 | ) | | (23,076 | ) | | (54,962 | ) | |
Redemption Fees | | @— | | | @— | | | 3 | | | 1 | | |
Net Increase (Decrease) in Net Assets Resulting from Capital Share Transactions | | (1,084 | ) | | (52,619 | ) | | 21,462 | | | 49,559 | | |
Total Increase (Decrease) in Net Assets | | 2,032 | | | (52,030 | ) | | 11,867 | | | 70,732 | | |
Net Assets: | | | | | | | | | | | | | |
Beginning of Period | | 14,733 | | | 66,763 | | | 275,204 | | | 204,472 | | |
End of Period | | $ | 16,765 | | | $ | 14,733 | | | $ | 287,071 | | | $ | 275,204 | | |
Undistributed (Distributions in Excess of) Net Investment Income Included in End of Period Net Assets | | $ | (9 | ) | | $ | — | | | $ | (21 | ) | | $ | (21 | ) | |
Accumulated Net Investment Loss Included in End of Period Net Assets | | — | | | (7 | ) | | — | | | — | | |
(1) | Capital Share Transactions: | | | | | | | | | | | | | |
Class A: | | | | | | | | | | | | | |
Shares Subscribed | | 123 | | | 565 | | | 5,313 | | | 8,191 | | |
Shares Issued on Portfolio Merger | | — | | | — | | | — | | | 5,706 | | |
Shares Issued on Distributions Reinvested | | 1 | | | — | | | 1,112 | | | 986 | | |
Shares Redeemed | | (205 | ) | | (3,422 | ) | | (3,838 | ) | | (6,786 | ) | |
Net Increase (Decrease) in Class A Shares Outstanding | | (81 | ) | | (2,857 | ) | | 2,587 | | | 8,097 | | |
Class B: | | | | | | | | | | | | | |
Shares Subscribed | | 44 | | | 337 | | | 648 | | | 579 | | |
Shares Issued on Distributions Reinvested | | — | | | — | | | 256 | | | 302 | | |
Shares Redeemed | | (42 | ) | | (1,041 | ) | | (1,857 | ) | | (4,836 | ) | |
Net Increase (Decrease) in Class B Shares Outstanding | | 2 | | | (704 | ) | | (953 | ) | | (3,955 | ) | |
@ | Amount is less than $500. | | | | | | | | | | | | | |
| | | | | | | | | | | | | | | | | | | |
186 | The accompanying notes are an integral part of the financial statements. | |
| 2007 Annual Report |
| |
| December 31, 2007 |
Statements of Changes in Net Assets
| |
Small Company Growth
Portfolio
| | Systematic Active
Large Cap Core
Portfolio | |
| | Year Ended
December 31,
2007
(000) | | Year Ended
December 31,
2006
(000) | | Year Ended
December 31,
2007
(000) | | Period Ended
December 31,
2006^
(000) | |
Increase (Decrease) in Net Assets | | | | | | | | | |
Operations: | | | | | | | | | |
Net Investment Income (Loss) | | $ (8,851 | ) | | $ (12,827 | ) | | $ 78 | | | $ 50 | | |
Net Realized Gain (Loss) | | 67,104 | | | 169,063 | | | 47 | | | (34 | ) | |
Net Change in Unrealized Appreciation (Depreciation) | | (504 | ) | | 29,319 | | | 269 | | | 449 | | |
Net Increase (Decrease) in Net Assets Resulting from Operations | | 57,749 | | | 185,555 | | | 394 | | | 465 | | |
Distributions from and/or in Excess of: | | | | | | | | | | | | | |
Class A: | | | | | | | | | | | | | |
Net Investment Income | | — | | | — | | | (65 | ) | | (50 | ) | |
Net Realized Gain | | (48,432 | ) | | (79,237 | ) | | (91 | ) | | — | | |
Return of Capital | | — | | | — | | | (14 | ) | | — | | |
Class B: | | | | | | | | | | | | | |
Net Investment Income | | — | | | — | | | (1 | ) | | (@— | ) | |
Net Realized Gain | | (34,374 | ) | | (69,508 | ) | | (2 | ) | | — | | |
Return of Capital | | — | | | — | | | (@— | ) | | — | | |
Total Distributions | | (82,806 | ) | | (148,745 | ) | | (173 | ) | | (50 | ) | |
Capital Share Transactions:(1) | | | | | | | | | | | | | |
Class A: | | | | | | | | | | | | | |
Subscribed | | 316,184 | | | 296,952 | | | @— | | | 5,900 | | |
Distributions Reinvested | | 46,288 | | | 74,528 | | | — | | | — | | |
Redeemed | | (234,892 | ) | | (261,098 | ) | | (@— | ) | | — | | |
Redemption Fees | | 67 | | | 55 | | | — | | | — | | |
Class B: | | | | | | | | | | | | | |
Subscribed | | 122,392 | | | 228,726 | | | — | | | 100 | | |
Distributions Reinvested | | 34,371 | | | 69,484 | | | — | | | — | | |
Redeemed | | (308,689 | ) | | (264,904 | ) | | — | | | — | | |
Redemption Fees | | 53 | | | 55 | | | — | | | — | | |
Net Increase (Decrease) in Net Assets Resulting from Capital Share Transactions | | (24,226 | ) | | 143,798 | | | @— | | | 6,000 | | |
Total Increase (Decrease) in Net Assets | | (49,283 | ) | | 180,608 | | | 221 | | | 6,415 | | |
Net Assets: | | | | | | | | | | | | | |
Beginning of Period | | 1,885,305 | | | 1,704,697 | | | 6,415 | | | — | | |
End of Period | | $1,836,022 | | | $1,885,305 | | | $6,636 | | | $6,415 | | |
Undistributed (Distributions in Excess of) Net Investment Income Included in End of Period Net Assets | | $ | — | | | $ — | | | $ 15 | | | $ 2 | | |
Accumulated Net Investment Loss Included in End of Period Net Assets | | (22 | ) | | (14 | ) | | — | | | — | | |
(1) | Capital Share Transactions: | | | | | | | | | | | | | |
Class A: | | | | | | | | | | | | | |
Shares Subscribed | | 22,899 | | | 21,757 | | | @— | | | 590 | | |
Shares Issued on Distributions Reinvested | | 3,507 | | | 5,644 | | | — | | | — | | |
Shares Redeemed | | (16,936 | ) | | (19,704 | ) | | (@— | ) | | — | | �� |
Net Increase (Decrease) in Class A Shares Outstanding | | 9,470 | | | 7,697 | | | @— | | | 590 | | |
Class B: | | | | | | | | | | | | | |
Shares Subscribed | | 9,315 | | | 17,495 | | | — | | | 10 | | |
Shares Issued on Distributions Reinvested | | 2,751 | | | 5,542 | | | — | | | — | | |
Shares Redeemed | | (23,606 | ) | | (20,843 | ) | | — | | | — | | |
Net Increase (Decrease) in Class B Shares Outstanding | | (11,540 | ) | | 2,194 | | | — | | | 10 | | |
^ | Systematic Active Large Cap Core Portfolio commenced operations on April 28, 2006. |
@ Amount is less than $500 or 500 shares. |
| | | | | | | | | | | | | | | | |
| The accompanying notes are an integral part of the financial statements. | 187 |
2007 Annual Report |
|
December 31, 2007 |
Statements of Changes in Net Assets
| | Systematic Active
Small Cap Core
Portfolio | | Systematic Active
Small Cap Growth
Portfolio | |
| | Year Ended
December 31,
2007
(000) | | Year Ended
December 31,
2006 ^
(000) | | Year Ended
December 31,
2007
(000) | | Period Ended
December 31,
2006 ^
(000) | |
Increase (Decrease) in Net Assets | | | | | | | | | |
Operations: | | | | | | | | | |
Net Investment Income (Loss) | | $ 53 | | | $ 19 | | | $ 9 | | | $ (6 | ) | |
Net Realized Gain (Loss) | | 359 | | | (166 | ) | | 489 | | | (183 | ) | |
Net Change in Unrealized Appreciation (Depreciation) | | (962 | ) | | 120 | | | (438 | ) | | 33 | | |
Net Increase (Decrease) in Net Assets Resulting from Operations | | (550 | ) | | (27 | ) | | 60 | | | (156 | ) | |
Distributions from and/or in excess of: | | | | | | | | | | | | | |
Class A: | | | | | | | | | | | | | |
Net Investment Income | | (35 | ) | | (19 | ) | | (8 | ) | | — | | |
Net Realized Gain | | (77 | ) | | — | | | (233 | ) | | — | | |
Class B: | | | | | | | | | | | | | |
Net Investment Income | | (@— | ) | | (@— | ) | | — | | | — | | |
Net Realized Gain | | (1 | ) | | — | | | (3 | ) | | — | | |
Total Distributions | | (113 | ) | | (19 | ) | | (244 | ) | | — | | |
Capital Share Transactions:(1) | | | | | | | | | | | | | |
Class A: | | | | | | | | | | | | | |
Subscribed | | @— | | | 6,500 | | | 25 | | | 6,800 | | |
Distributions Reinvested | | — | | | — | | | 1 | | | — | | |
Redeemed | | (@— | ) | | — | | | (@— | ) | | — | | |
Redemption Fees | | — | | | — | | | — | | | — | | |
Class B: | | | | | | | | | | | | | |
Subscribed | | @— | | | 100 | | | — | | | 100 | | |
Distributions Reinvested | | — | | | — | | | — | | | — | | |
Redeemed | | — | | | — | | | — | | | — | | |
Redemption Fees | | — | | | — | | | — | | | — | | |
Net Increase (Decrease) in Net Assets Resulting from Capital Share Transactions | | @— | | | 6,600 | | | 26 | | | 6,900 | | |
Total Increase (Decrease) in Net Assets | | (663 | ) | | 6,554 | | | (158 | ) | | 6,744 | | |
Net Assets: | | | | | | | | | | | | | |
Beginning of Period | | 6,554 | | | — | | | 6,744 | | | — | | |
End of Period | | $5,891 | | | $6,554 | | | $6,586 | | | $6,744 | | |
Undistributed (Distributions in Excess of) Net Investment Income Included in End of Period Net Assets | | $ 3 | | | $ 2 | | | $ — | | | $ — | | |
(1) | Capital Share Transactions: | | | | | | | | | | | | | |
Class A: | | | | | | | | | | | | | |
Shares Subscribed | | @— | | | 650 | | | 3 | | | 680 | | |
Shares Issued on Distributions Reinvested | | — | | | — | | | @— | | | — | | |
Shares Redeemed | | (@— | ) | | — | | | (@— | ) | | — | | |
Net Increase (Decrease) in Class A Shares Outstanding | | — | | | 650 | | | 3 | | | 680 | | |
Class B: | | | | | | | | | | | | | |
Shares Subscribed | | — | | | 10 | | | — | | | 10 | | |
Shares Issued on Distributions Reinvested | | — | | | — | | | — | | | — | | |
Shares Redeemed | | — | | | — | | | — | | | — | | |
Net Increase (Decrease) in Class B Shares Outstanding | | — | | | 10 | | | — | | | 10 | | |
^ | Systematic Active Small Cap Core and Systematic Active Small Cap Growth Portfolios commenced operations on April 28, 2006. | |
@ Amount is less than $500 or 500 shares. | | | | | | | | | |
| | | | | | | | | | | | | | | | | | | | | | | |
188 | The accompanying notes are an integral part of the financial statements. | |
| 2007 Annual Report |
| |
| December 31, 2007 |
Statements of Changes in Net Assets
| | Systematic Active
Small Cap Value
Portfolio | | Systematic Large Cap
Core Active Extension
Portfolio | |
| | Year Ended
December 31,
2007
(000) | | Period Ended
December 31,
2006 ^
(000) | | Period Ended
December 31, 2007^
(000) | |
Increase (Decrease) in Net Assets | | | | | | | |
Operations: | | | | | | | |
Net Investment Income (Loss) | | $ | 108 | | | $ | 40 | | $ | (1 | ) | |
Net Realized Gain (Loss) | | 439 | | | (5) | | (266 | ) | |
Net Change in Unrealized Appreciation (Depreciation) | | (1,576) | | | 250 | | (54 | ) | |
Net Increase (Decrease) in Net Assets Resulting from Operations | | (1,029) | | | 285 | | (321 | ) | |
Distributions from and/or in Excess of: | | | | | | | | | |
Class A: | | | | | | | | | |
Net Investment Income | | (84 | ) | | (39) | | (1 | ) | |
Net Realized Gain | | (326 | ) | | — | | — | | |
Class B: | | | | | | | | | |
Net Investment Income | | (1 | ) | | (1) | | — | | |
Net Realized Gain | | (5 | ) | | — | | — | | |
Total Distributions | | (416) | | | (40) | | (1 | ) | |
Capital Share Transactions:(1) | | | | | | | | | |
Class A: | | | | | | | | | |
Subscribed | | @— | | | 6,600 | | 5,000 | | |
Distributions Reinvested | | — | | | — | | — | | |
Redeemed | | (@— | ) | | — | | — | | |
Redemption Fees | | — | | | — | | — | | |
Class B: | | | | | | | | | |
Subscribed | | @— | | | 100 | | — | | |
Distributions Reinvested | | — | | | — | | — | | |
Redeemed | | — | | | — | | — | | |
Redemption Fees | | — | | | — | | — | | |
Net Increase (Decrease) in Net Assets Resulting from Capital Share Transactions | | @— | | | 6,700 | | 5,000 | | |
Total Increase (Decrease) in Net Assets | | (1,445 | ) | | 6,945 | | 4,678 | | |
Net Assets: | | | | | | | | | |
Beginning of Period | | 6,945 | | | — | | 5,000 | | |
End of Period | | $ | 5,500 | | | $ | 6,945 | | $ | 9,678 | | |
Undistributed (Distributions in Excess of) Net Investment Income Included in End of Period Net Assets | | $ | 1 | | | $ | 2 | | $ | — | | |
(1) | Capital Share Transactions: | | | | | | | | | |
Class A: | | | | | | | | | |
Shares Subscribed | | @— | | | 660 | | 999 | | |
Shares Issued on Distributions Reinvested | | — | | | — | | — | | |
Shares Redeemed | | (@—) | | | — | | — | | |
Net Increase (Decrease) in Class A Shares Outstanding | | @— | | | 660 | | 999 | | |
Class B: | | | | | | | | | |
Shares Subscribed | | — | | | 10 | | 10 | | |
Shares Issued on Distributions Reinvested | | — | | | — | | — | | |
Shares Redeemed | | — | | | — | | — | | |
Net Increase (Decrease) in Class B Shares Outstanding | | — | | | 10 | | 10 | | |
^ | Systematic Active Small Cap Value Portfolio and Systematic Large Cap Core Active Extension Portfolio commenced operations on April 28, 2006 and May 31, 2007, respectively. |
@ | Amount is less than $500 or 500 shares. |
| | | | | | | | | | | | | |
| The accompanying notes are an integral part of the financial statements. | 189 |
2007 Annual Report |
|
December 31, 2007 |
Statements of Changes in Net Assets
| | U.S. Large Cap Growth
Portfolio | | U.S. Real Estate
Portfolio | |
| | Year Ended
December 31,
2007
(000) | | Year Ended
December 31,
2006
(000) | | Year Ended
December 31,
2007
(000) | | Year Ended
December 31,
2006
(000) | |
Increase (Decrease) in Net Assets | | | | | | | | | |
Operations: | | | | | | | | | | | | | |
Net Investment Income (Loss) | | $ | 5,480 | | | $ | 160 | | | $ | 20,283 | | | $ | 25,097 | | |
Net Realized Gain (Loss) | | 72,047 | | | 4,322 | | | 420,629 | | | 242,781 | | |
Net Change in Unrealized Appreciation (Depreciation) | | 166,291 | | | 40,881 | | | (693,156 | ) | | 266,069 | | |
Net Increase (Decrease) in Net Assets Resulting from Operations | | 243,818 | | | 45,363 | | | (252,244 | ) | | 533,947 | | |
Distributions from and/or in Excess of: | | | | | | | | | | | | | |
Class A: | | | | | | | | | | | | | |
Net Investment Income | | (4,987 | ) | | (184 | ) | | (24,407 | ) | | (25,711 | ) | |
Net Realized Gain | | — | | | — | | | (322,942 | ) | | (186,870 | ) | |
Class B: | | | | | | | | | | | | | |
Net Investment Income | | (436 | ) | | — | | | (3,761 | ) | | (3,370 | ) | |
Net Realized Gain | | — | | | — | | | (58,276 | ) | | (29,839 | ) | |
Total Distributions | | (5,423 | ) | | (184 | ) | | (409,386 | ) | | (245,790 | ) | |
Capital Share Transactions:(1) | | | | | | | | | | | | | |
Class A: | | | | | | | | | | | | | |
Subscribed | | 365,245 | | | 333,417 | | | 358,040 | | | 529,570 | | |
Distributions Reinvested | | 4,984 | | | 184 | | | 340,743 | | | 204,975 | | |
Redeemed | | (196,520 | ) | | (234,697 | ) | | (863,055 | ) | | (563,233 | ) | |
Redemption Fees | | 3 | | | 16 | | | 61 | | | 35 | | |
Class B: | | | | | | | | | | | | | |
Subscribed | | 113,572 | | | 38,689 | | | 111,307 | | | 101,776 | | |
Distributions Reinvested | | 435 | | | — | | | 62,036 | | | 33,205 | | |
Redeemed | | (22,637 | ) | | (20,266 | ) | | (168,578 | ) | | (57,345 | ) | |
Redemption Fees | | @— | | | 1 | | | 10 | | | 5 | | |
Net Increase (Decrease) in Net Assets Resulting from Capital Share Transactions | | 265,082 | | | 117,344 | | | (159,436 | ) | | 248,988 | | |
Total Increase (Decrease) in Net Assets | | 503,477 | | | 162,523 | | | (821,066 | ) | | 537,145 | | |
Net Assets: | | | | | | | | | | | | | |
Beginning of Period | | 1,070,106 | | | 907,583 | | | 1,904,463 | | | 1,367,318 | | |
End of Period | | $ | 1,573,583 | | | $ | 1,070,106 | | | $ | 1,083,397 | | | $ | 1,904,463 | | |
Undistributed (Distributions in Excess of) Net Investment Income Included in End of Period Net Assets | | $ | (23 | ) | | $ | (43 | ) | | $ | 1,114 | | | $ | (2,899 | ) | |
(1) Capital Share Transactions†: | | | | | | | | | | | | | |
Class A: | | | | | | | | | | | | | |
Shares Subscribed | | 15,536 | | | 17,611 | | | 12,926 | | | 19,517 | | |
Shares Issued on Distributions Reinvested | | 205 | | | 9 | | | 20,310 | | | 7,480 | | |
Shares Redeemed | | (8,673 | ) | | (12,445 | ) | | (33,292 | ) | | (20,735 | ) | |
Net Increase (Decrease) in Class A Shares Outstanding | | 7,068 | | | 5,175 | | | (56 | ) | | 6,262 | | |
Class B: | | | | | | | | | | | | | |
Shares Subscribed | | 4,978 | | | 2,118 | | | 3,955 | | | 3,751 | | |
Shares Issued on Distributions Reinvested | | 18 | | | — | | | 3,756 | | | 1,221 | | |
Shares Redeemed | | (1,018 | ) | | (1,083 | ) | | (6,266 | ) | | (2,158 | ) | |
Net Increase (Decrease) in Class B Shares Outstanding | | 3,978 | | | 1,035 | | | 1,445 | | | 2,814 | | |
| | | | | | | | | | | | | | | | | | | | | |
@ Amount is less than $500.
190 | The accompanying notes are an integral part of the financial statements. |
2007 Annual Report |
|
December 31, 2007 |
Statements of Changes in Net Assets
| | U.S. Small/Mid Cap Value
Portfolio | | Emerging Markets Debt
Portfolio | |
| | Year Ended
December 31,^
2007
(000) | | Year Ended
December 31,
2007
(000) | | Year Ended
December 31,
2006
(000) | |
Increase (Decrease) in Net Assets | | | | | | | |
Operations: | | | | | | | |
Net Investment Income (Loss) | | $ | 5 | | $ | 3,188 | | $ | 5,222 | |
Net Realized Gain (Loss) | | (17 | ) | 4,437 | | 1,962 | |
Net Change in Unrealized Appreciation (Depreciation) | | (1,072 | ) | (5,719) | | 1,089 | |
Net Increase (Decrease) in Net Assets Resulting from Operations | | (1,084 | ) | 1,906 | | 8,273 | |
Distributions from and/or in Excess of: | | | | | | | |
Class A: | | | | | | | |
Net Investment Income | | — | | (4,215 | ) | (5,931 | ) |
Net Realized Gain | | (18 | ) | — | | — | |
Class B: | | | | | | | |
Net Investment Income | | — | | (68 | ) | (37 | ) |
Net Realized Gain | | (@— | ) | — | | — | |
Total Distributions | | (18 | ) | (4,283 | ) | (5,968 | ) |
Capital Share Transactions:(1) | | | | | | | |
Class A: | | | | | | | |
Subscribed | | 1,326 | | 17,784 | | 10,023 | |
Distributions Reinvested | | 1 | | 4,205 | | 3,531 | |
Redeemed | | (18 | ) | (48,197 | ) | (26,920 | ) |
Redemption Fees | | — | | 14 | | 1 | |
Class B: | | | | | | | |
Subscribed | | — | | 423 | | 19 | |
Distributions Reinvested | | — | | 68 | | 37 | |
Redeemed | | — | | (141 | ) | (109 | ) |
Redemption Fees | | — | | @— | | @— | |
Net Increase (Decrease) in Net Assets Resulting from Capital Share Transactions | | 1,309 | | (25,844 | ) | (13,418 | ) |
Total Increase (Decrease) in Net Assets | | 207 | | (28,221 | ) | (11,113 | ) |
Net Assets: | | | | | | | |
Beginning of Period | | 20,000 | | 81,777 | | 92,890 | |
End of Period | | $ | 20,207 | | $ | 53,556 | | $ | 81,777 | |
Undistributed (Distributions in Excess of) Net Investment Income Included in End of Period Net Assets | | $ | 6 | | $ | (270 | ) | $ | (1,051 | ) |
(1) Capital Share Transactions†: | | | | | | | |
Class A: | | | | | | | |
Shares Subscribed | | 2,125 | | 1,441 | | 855 | |
Shares Issued on Distributions Reinvested | | @— | | 371 | | 295 | |
Shares Redeemed | | (2 | ) | (3,993 | ) | (2,333 | ) |
Net Increase (Decrease) in Class A Shares Outstanding | | 2,123 | | (2,181 | ) | (1,183 | ) |
Class B: | | | | | | | |
Shares Subscribed | | 10 | | 33 | | 2 | |
Shares Issued on Distributions Reinvested | | — | | 6 | | 3 | |
Shares Redeemed | | — | | (11 | ) | (9 | ) |
Net Increase (Decrease) in Class B Shares Outstanding | | 10 | | 28 | | (4 | ) |
| | | | | | | | | | | | | | | | | | | | |
^ U.S. Small/Mid Cap Value Portfolio commenced operations on September 27, 2007.
† Capital share transactions prior to March 17, 2006 for the Emerging Markets Debt Portfolio have been restated to reflect the effect of a reverse stock split as described in the Notes to Financial Statements.
@ Amount is less than $500 or 500 shares.
The accompanying notes are an integral part of the financial statements. | 191 |
2007 Annual Report
December 31, 2007
Statements of Cash Flows
| | International
Growth
Active
Extension
Portfolio†
(000) | | Disciplined
Large Cap
Value Active
Extension
Portfolio††
(000) | | Systematic
Large Cap
Core Active
Extension
Portfolio††
(000) | |
Cash Flows From Operating Activities: | | | | | | | |
Proceeds from Sales and Maturities of Investments | | $ 2,365 | | $ 3,392 | | $ 1,502 | |
Purchases of Investments | | (15,652 | ) | (16,135 | ) | (14,535 | ) |
Proceeds from Securities Sold Short | | 4,409 | | 5,410 | | 3,645 | |
Covers of Securities Sold Short | | (1,098 | ) | (2,433 | ) | (568 | ) |
Net (Increase) Decrease in Short-Term Investments | | (43 | ) | (83 | ) | (20 | ) |
Net (Increase) Decrease in Cash Overdrafts | | 4 | | — | | — | |
Net (Increase) Decrease in Foreign Currency Holdings | | (21 | ) | — | | — | |
Net Realized Gain (Loss) on Foreign Currency Transactions | | 5 | | — | | — | |
Net Investment Income | | (23 | ) | 27 | | (1 | ) |
Adjustment to Reconcile Net Investment Income to Net Cash Provided by Operating Activities: | | | | | | | |
Net (Increase) Decrease in Receivables Related to Operations | | (6 | ) | (27 | ) | (10 | ) |
Net Increase (Decrease) in Payables Related to Operations | | 60 | | 28 | | 23 | |
Net Cash Provided (Used) in Operating Activities | | (10,000 | ) | (9,821 | ) | (9,964 | ) |
Cash Flows from Financing Activities: | | | | | | | |
Proceeds from Portfolio Shares Sold | | 10,000 | | 10,000 | | 10,000 | |
Cash Dividends and Distributions Paid | | — | | (29 | ) | (1 | ) |
Net Cash Received (Paid) in Financing Activities | | 10,000 | | 9,971 | | 9,999 | |
Net Increase (Decrease) in Cash | | — | | 150 | | 35 | |
Cash at Beginning of Period | | — | | — | | — | |
Cash at End of Period | | $ — | | $ 150 | | $ 35 | |
| | | | | | | |
Supplemental Disclosure of Cash Flow Information: | | | | | | | |
Interest Paid on Short Positions during the Period | | 20 | | 16 | | 12 | |
† For the Period from July 31, 2007 (commencement of operations) to December 31, 2007.
†† For the Period from May 31, 2007 (commencement of operations) to December 31, 2007.
192 | The accompanying notes are an integral part of the financial statements. |
2007 Annual Report |
|
December 31, 2007 |
Financial Highlights
Active International Allocation Portfolio
| | Class A | |
| | Year Ended December 31, | |
Selected Per Share Data and Ratios | | 2007 | | 2006 | | 2005 | | 2004 | | 2003 | |
Net Asset Value, Beginning of Period | | $ 15.10 | | $ 12.43 | | $ 10.96 | | $ 9.58 | | $ 7.30 | |
Income (Loss) from Investment Operations | | | | | | | | | | | |
Net Investment Income (Loss)† | | 0.30 | | 0.27 | | 0.21 | | 0.13 | | 0.13 | |
Net Realized and Unrealized Gain (Loss) on Investments | | 1.96 | | 2.75 | | 1.40 | | 1.46 | | 2.32 | |
Total from Investment Operations | | 2.26 | | 3.02 | | 1.61 | | 1.59 | | 2.45 | |
Distributions from and/or in Excess of: | | | | | | | | | | | |
Net Investment Income | | (0.54 | ) | (0.35 | ) | (0.14 | ) | (0.21 | ) | (0.17 | ) |
Net Realized Gain | | (0.90 | ) | — | | — | | — | | — | |
Total Distributions | | (1.44 | ) | (0.35 | ) | (0.14 | ) | (0.21 | ) | (0.17 | ) |
Redemption Fees | | 0.00 | ‡ | 0.00 | ‡ | 0.00 | ‡ | — | | — | |
Net Asset Value, End of Period | | $ 15.92 | | $ 15.10 | | $ 12.43 | | $ 10.96 | | $ 9.58 | |
Total Return++ | | 15.30 | % | 24.34 | % | 14.85 | % | 16.64 | % | 33.65 | % |
Ratios and Supplemental Data: | | | | | | | | | | | |
Net Assets, End of Period (Thousands) | | $1,093,735 | | $967,361 | | $792,329 | | $580,851 | | $353,488 | |
Ratio of Expenses to Average Net Assets (1) | | 0.80 | %+ | 0.80 | % | 0.80 | % | 0.80 | % | 0.80 | % |
Ratio of Expenses to Average Net Assets Excluding Bank Overdraft Expense | | 0.80 | %+ | 0.80 | % | 0.80 | % | 0.80 | % | 0.80 | % |
Ratio of Net Investment Income (Loss) to Average Net Assets(1) | | 1.93 | %+ | 1.99 | % | 1.84 | % | 1.28 | % | 1.66 | % |
Portfolio Turnover Rate | | 28 | % | 16 | % | 24 | % | 24 | % | 55 | % |
(1) Supplemental Information on the Ratios to Average Net Assets: | | | | | | | | | | | |
Ratios before expense limitation: | | | | | | | | | | | |
Expenses to Average Net Assets | | 0.81 | %+ | 0.82 | % | 0.83 | % | 0.91 | % | 0.96 | % |
Net Investment Income (Loss) to Average Net Assets | | 1.92 | %+ | 1.97 | % | 1.81 | % | 1.18 | % | 1.50 | % |
| | | |
| | Class B | |
| | Year Ended December 31, | |
Selected Per Share Data and Ratios | | 2007 | | 2006 | | 2005 | | 2004 | | 2003 | |
Net Asset Value, Beginning of Period | | $ 15.36 | | $ 12.64 | | $ 11.13 | | $ 9.72 | | $ 7.41 | |
Income (Loss) from Investment Operations | | | | | | | | | | | |
Net Investment Income (Loss)† | | 0.24 | | 0.22 | | 0.19 | | 0.10 | | 0.12 | |
Net Realized and Unrealized Gain (Loss) on Investments | | 2.01 | | 2.81 | | 1.43 | | 1.35 | | 2.33 | |
Total from Investment Operations | | 2.25 | | 3.03 | | 1.62 | | 1.45 | | 2.45 | |
Distributions from and/or in Excess of: | | | | | | | | | | | |
Net Investment Income | | (0.51 | ) | (0.31 | ) | (0.11 | ) | (0.17 | ) | (0.14 | ) |
Net Realized Gain | | (0.90 | ) | — | | — | | — | | — | |
Total Distributions | | (1.41 | ) | (0.31 | ) | (0.11 | ) | (0.17 | ) | (0.14 | ) |
Redemption Fees | | 0.00 | ‡ | 0.00 | ‡ | 0.00 | ‡ | 0.13 | | — | |
Net Asset Value, End of Period | | $ 16.20 | | $ 15.36 | | $ 12.64 | | $ 11.13 | | $ 9.72 | |
Total Return++ | | 14.95 | % | 23.95 | % | 14.67 | % | 16.29 | % | 33.13 | % |
Ratios and Supplemental Data: | | | | | | | | | | | |
Net Assets, End of Period (Thousands) | | $ 5,285 | | $ 3,573 | | $ 2,215 | | $ 2,623 | | $ 5,635 | |
Ratio of Expenses to Average Net Assets (2) | | 1.05 | %+ | 1.05 | % | 1.05 | % | 1.05 | % | 1.05 | % |
Ratio of Expenses to Average Net Assets Excluding Bank Overdraft Expense | | 1.05 | %+ | 1.05 | % | 1.05 | % | 1.05 | % | 1.05 | % |
Ratio of Net Investment Income (Loss) to Average Net Assets (2) | | 1.52 | %+ | 1.61 | % | 1.69 | % | 1.03 | % | 1.41 | % |
Portfolio Turnover Rate | | 28 | % | 16 | % | 24 | % | 24 | % | 55 | % |
(2) Supplemental Information on the Ratios to Average Net Assets: | | | | | | | | | | | |
Ratios before expense limitation: | | | | | | | | | | | |
Expenses to Average Net Assets | | 1.06 | %+ | 1.07 | % | 1.08 | % | 1.16 | % | 1.21 | % |
Net Investment Income (Loss) to Average Net Assets | | 1.51 | %+ | 1.59 | % | 1.66 | % | 0.92 | % | 1.25 | % |
| | | | | | | | | | | | | | | | | | | | |
† Per share amount is based on average shares outstanding.
‡ Amount is less than $0.005 per share.
+ Reflects rebate of certain Portfolio expenses in connection with the investments in Morgan Stanley Institutional Liquidity Money Market Portfolio — Institutional Class during the period. As a result of such rebate, the expenses as a percentage of its net assets were effected by less than 0.005%.
++ Calculated based on the net asset value as of the last business day of the period.
The accompanying notes are an integral part of the financial statements. | 193 |
2007 Annual Report
December 31, 2007
Financial Highlights
Emerging Markets Portfolio
| | Class A | |
| | Year Ended December 31, | |
Selected Per Share Data and Ratios | | 2007 | | 2006 | | 2005 | | 2004 | | 2003 | |
Net Asset Value, Beginning of Period | | $ 29.29 | | $ 25.36 | | $ 19.10 | | $ 15.52 | | $ 10.13 | |
Income (Loss) from Investment Operations | | | | | | | | | | | |
Net Investment Income (Loss)† | | 0.10 | | 0.18 | | 0.25 | | 0.19 | | 0.14 | |
Net Realized and Unrealized Gain (Loss) on Investments | | 11.76 | | 9.22 | | 6.36 | | 3.54 | | 5.44 | |
Total from Investment Operations | | 11.86 | | 9.40 | | 6.61 | | 3.73 | | 5.58 | |
Distributions from and/or in Excess of: | | | | | | | | | | | |
Net Investment Income | | (0.13 | ) | (0.29 | ) | (0.35 | ) | (0.15 | ) | (0.18 | ) |
Net Realized Gain | | (7.01 | ) | (5.18 | ) | — | | — | | — | |
Return of Capital | | — | | — | | — | | — | | (0.01 | ) |
Total Distributions | | (7.14 | ) | (5.47 | ) | (0.35 | ) | (0.15 | ) | (0.19 | ) |
Redemption Fees | | 0.01 | | 0.00 | ‡ | 0.00 | ‡ | 0.00 | ‡ | 0.00 | ‡ |
Net Asset Value, End of Period | | $ 34.02 | | $ 29.29 | | $ 25.36 | | $ 19.10 | | $ 15.52 | |
Total Return++ | | 41.56 | % | 38.00 | % | 34.54 | % | 24.09 | % | 55.08 | % |
Ratios and Supplemental Data: | | | | | | | | | | | |
Net Assets, End of Period (Thousands) | | $3,323,130 | | $2,283,535 | | $1,749,671 | | $1,249,299 | | $1,020,353 | |
Ratio of Expenses to Average Net Assets | | 1.35 | %+ | 1.40 | % | 1.41 | % | 1.52 | %^^ | 1.64 | % |
Ratio of Expenses to Average Net Assets Excluding Bank Overdraft Expense | | 1.35 | %+ | 1.40 | % | 1.41 | % | 1.52 | % | 1.61 | % |
Ratio of Net Investment Income (Loss) to Average Net Assets | | 0.28 | %+ | 0.62 | % | 1.17 | % | 1.09 | % | 1.15 | % |
Portfolio Turnover Rate | | 101 | % | 82 | % | 59 | % | 73 | % | 92 | % |
| | | |
| | Class B | |
| | Year Ended December 31, | |
Selected Per Share Data and Ratios | | 2007 | | 2006 | | 2005 | | 2004 | | 2003 | |
Net Asset Value, Beginning of Period | | $ 28.91 | | $ 25.07 | | $ 18.90 | | $ 15.36 | | $ 10.06 | |
Income (Loss) from Investment Operations | | | | | | | | | | | |
Net Investment Income (Loss)† | | 0.01 | | 0.13 | | 0.19 | | 0.15 | | 0.11 | |
Net Realized and Unrealized Gain (Loss) on Investments | | 11.60 | | 9.09 | | 6.26 | | 3.49 | | 5.35 | |
Total from Investment Operations | | 11.61 | | 9.22 | | 6.45 | | 3.64 | | 5.46 | |
Distributions from and/or in Excess of: | | | | | | | | | | | |
Net Investment Income | | (0.05 | ) | (0.20 | ) | (0.29 | ) | (0.11 | ) | (0.15 | ) |
Net Realized Gain | | (7.01 | ) | (5.18 | ) | — | | — | | — | |
Return of Capital | | — | | — | | — | | — | | (0.01 | ) |
Total Distributions | | (7.06 | ) | (5.38 | ) | (0.29 | ) | (0.11 | ) | (0.16 | ) |
Redemption Fees | | 0.00 | ‡ | 0.00 | ‡ | 0.01 | | 0.01 | | — | |
Net Asset Value, End of Period | | $ 33.46 | | $ 28.91 | | $ 25.07 | | $ 18.90 | | $ 15.36 | |
Total Return++ | | 41.20 | % | 37.65 | % | 34.17 | % | 23.84 | % | 54.31 | % |
Ratios and Supplemental Data: | | | | | | | | | | | |
Net Assets, End of Period (Thousands) | | $ 179,834 | | $ 126,450 | | $ 103,482 | | $ 71,254 | | $ 42,046 | |
Ratio of Expenses to Average Net Assets | | 1.60 | %+ | 1.65 | % | 1.66 | % | 1.77 | %^^ | 1.89 | % |
Ratio of Expenses to Average Net Assets Excluding Bank Overdraft Expense | | 1.60 | %+ | 1.65 | % | 1.66 | % | 1.77 | % | 1.86 | % |
Ratio of Net Investment Income (Loss) to Average Net Assets | | 0.02 | %+ | 0.47 | % | 0.90 | % | 0.89 | % | 0.90 | % |
Portfolio Turnover Rate | | 101 | % | 82 | % | 59 | % | 73 | % | 92 | % |
† | Per share amount is based on average shares outstanding. |
‡ | Amount is less than $0.005 per share. |
+ | Reflects rebate of certain Portfolio expenses in connection with the investments in Morgan Stanley Institutional Liquidity Money Market Portfolio — Institutional Class during the period. As a result of such rebate, the expenses as a percentage of its net assets were effected by less than 0.005%. |
++ | Calculated based on the net asset value as of the last business day of the period. |
^^ | Effective November 1, 2004, the Adviser has voluntarily agreed to limit the ratio of expenses to average net assets to the maximum ratio of 1.65% for Class A and 1.90% for Class B shares. Prior to November 1, 2004, the maximum ratios were 1.75% for Class A and 2.00% for Class B shares. |
| | | | | | | | | | | | | | |
194 | The accompanying notes are an integral part of the financial statements. |
2007 Annual Report
December 31, 2007
Financial Highlights
Global Franchise Portfolio
| | Class A | |
| | Year Ended December 31, | |
Selected Per Share Data and Ratios | | 2007 | | 2006 | | 2005 | | 2004 | | 2003 | |
Net Asset Value, Beginning of Period | | $ | 17.98 | | $ | 15.69 | | $ | 15.12 | | $ | 14.29 | | $ | 11.29 | |
Income (Loss) from Investment Operations | | | | | | | | | | | |
Net Investment Income (Loss)† | | 0.40 | | 0.30 | | 0.26 | | 0.27 | | 0.23 | |
Net Realized and Unrealized Gain (Loss) on Investments | | 1.30 | | 3.07 | | 1.52 | | 1.66 | | 2.91 | |
Total from Investment Operations | | 1.70 | | 3.37 | | 1.78 | | 1.93 | | 3.14 | |
Distributions from and/or in Excess of: | | | | | | | | | | | |
Net Investment Income | | (0.15 | ) | (0.13 | ) | (0.31 | ) | — | | (0.03 | ) |
Net Realized Gain | | (2.91 | ) | (0.95 | ) | (0.90 | ) | (1.13 | ) | (0.11 | ) |
Total Distributions | | (3.06 | ) | (1.08 | ) | (1.21 | ) | (1.13 | ) | (0.14 | ) |
Redemption Fees | | — | | 0.00 | ‡ | 0.00 | ‡ | 0.03 | | 0.00 | ‡ |
Net Asset Value, End of Period | | $ | 16.62 | | $ | 17.98 | | $ | 15.69 | | $ | 15.12 | | $ | 14.29 | |
Total Return++ | | 9.58 | % | 21.60 | % | 11.91 | % | 13.77 | % | 27.92 | % |
Ratios and Supplemental Data: | | | | | | | | | | | |
Net Assets, End of Period (Thousands) | | $ | 110,135 | | $ | 128,434 | | $ | 85,018 | | $ | 58,223 | | $ | 79,756 | |
Ratio of Expenses to Average Net Assets (1) | | 0.99 | %+ | 1.00 | % | 1.00 | % | 1.00 | % | 1.00 | % |
Ratio of Expenses to Average Net Assets Excluding Bank Overdraft Expense | | 0.98 | %+ | 1.00 | % | 1.00 | % | N/A | | N/A | |
Ratio of Net Investment Income (Loss) to Average Net Assets (1) | | 2.10 | %+ | 1.74 | % | 1.67 | % | 1.82 | % | 1.91 | % |
Portfolio Turnover Rate | | 22 | % | 35 | % | 19 | % | 21 | % | 32 | % |
(1) Supplemental Information on the Ratios to Average Net Assets: | | | | | | | | | | | |
Ratios before expense limitation: | | | | | | | | | | | |
Expenses to Average Net Assets | | N/A | | 1.01 | % | 1.07 | % | 1.16 | % | 1.23 | % |
Net Investment Income (Loss) to Average Net Assets | | N/A | | 1.73 | % | 1.60 | % | 1.66 | % | 1.68 | % |
| | | |
| | Class B | |
| | Year Ended December 31, | |
Selected Per Share Data and Ratios | | 2007 | | 2006 | | 2005 | | 2004 | | 2003 | |
Net Asset Value, Beginning of Period | | $ | 17.82 | | $ | 15.56 | | $ | 15.01 | | $ | 14.22 | | $ | 11.24 | |
Income (Loss) from Investment Operations | | | | | | | | | | | |
Net Investment Income (Loss)† | | 0.30 | | 0.24 | | 0.24 | | 0.22 | | 0.22 | |
Net Realized and Unrealized Gain (Loss) on Investments | | 1.34 | | 3.04 | | 1.48 | | 1.69 | | 2.88 | |
Total from Investment Operations | | 1.64 | | 3.28 | | 1.72 | | 1.91 | | 3.10 | |
Distributions from and/or in Excess of: | | | | | | | | | | | |
Net Investment Income | | (0.11 | ) | (0.07 | ) | (0.27 | ) | — | | (0.01 | ) |
Net Realized Gain | | (2.91 | ) | (0.95 | ) | (0.90 | ) | (1.13 | ) | (0.11 | ) |
Total Distributions | | (3.02 | ) | (1.02 | ) | (1.17 | ) | (1.13 | ) | (0.12 | ) |
Redemption Fees | | — | | 0.00 | ‡ | — | | 0.01 | | — | |
Net Asset Value, End of Period | | $ | 16.44 | | $ | 17.82 | | $ | 15.56 | | $ | 15.01 | | $ | 14.22 | |
Total Return++ | | 9.26 | % | 21.31 | % | 11.53 | % | 13.56 | % | 27.62 | % |
Ratios and Supplemental Data: | | | | | | | | | | | |
Net Assets, End of Period (Thousands) | | $ | 6,327 | | $ | 4,135 | | $ | 4,401 | | $ | 3,941 | | $ | 2,682 | |
Ratio of Expenses to Average Net Assets (2) | | 1.24 | %+ | 1.25 | % | 1.25 | % | 1.25 | % | 1.25 | % |
Ratio of Expenses to Average Net Assets Excluding Bank Overdraft Expense | | 1.23 | %+ | 1.25 | % | 1.25 | % | N/A | | N/A | |
Ratio of Net Investment Income (Loss) to Average Net Assets (2) | | 1.62 | %+ | 1.43 | % | 1.52 | % | 1.47 | % | 1.66 | % |
Portfolio Turnover Rate | | 22 | % | 35 | % | 19 | % | 21 | % | 32 | % |
(2) Supplemental Information on the Ratios to Average Net Assets: | | | | | | | | | | | |
Ratios before expense limitation: | | | | | | | | | | | |
Expenses to Average Net Assets | | N/A | | 1.26 | % | 1.32 | % | 1.41 | % | 1.48 | % |
Net Investment Income (Loss) to Average Net Assets | | N/A | | 1.42 | % | 1.45 | % | 1.31 | % | 1.43 | % |
† | Per share amount is based on average shares outstanding. |
‡ | Amount is less than $0.005 per share. |
+ | Reflects rebate of certain Portfolio expenses in connection with the investments in Morgan Stanley Institutional Liquidity Money Market Portfolio — Institutional Class during the period. As a result of such rebate, the expenses as a percentage of its net assets were effected by less than 0.005%. |
++ | Calculated based on the net asset value as of the last business day of the period. |
| | | | | | | | | | | | | | | | | | | | | | |
The accompanying notes are an integral part of the financial statements. | 195 |
2007 Annual Report
December 31, 2007
Financial Highlights
Global Real Estate Portfolio
| | Class A |
| | Year Ended | Period from |
| | December 31, | August 30, 2006^ |
Selected Per Share Data and Ratios | | 2007 | to December 31, 2006 |
Net Asset Value, Beginning of Period | | $ | 11.56 | | $ | 10.00 | |
Income (Loss) from Investment Operations | | | | | |
Net Investment Income (Loss)† | | 0.18 | | 0.06 | |
Net Realized and Unrealized Gain (Loss) on Investments | | (1.09 | ) | 1.66 | |
Total from Investment Operations | | (0.91 | ) | 1.72 | |
Distributions from and/or in Excess of: | | | | | |
Net Investment Income | | (0.40 | ) | (0.13 | ) |
Net Realized Gain | | (0.21 | ) | (0.03 | ) |
Total Distributions | | (0.61 | ) | (0.16 | ) |
Redemption Fees | | 0.00 | ‡ | 0.00 | ‡ |
Net Asset Value, End of Period | | $ | 10.04 | | $ | 11.56 | |
Total Return++ | | (7.87 | )% | 17.20 | %# |
Ratios and Supplemental Data: | | | | | |
Net Assets, End of Period (Thousands) | | $ | 632,737 | | $ | 238,647 | |
Ratio of Expenses to Average Net Assets (1) | | 1.02 | %+ | 1.05 | %* |
Ratio of Expenses to Average Net Assets Excluding Bank Overdraft Expense | | 1.02 | %+ | — | |
Ratio of Net Investment Income (Loss) to Average Net Assets (1) | | 1.55 | %+ | 1.53 | %* |
Portfolio Turnover Rate | | 39 | % | 4 | %# |
(1)Supplemental Information on the Ratios to Average Net Assets: | | | | | |
Ratios before expense limitation: | | | | | |
Expenses to Average Net Assets | | N/A | | 1.15 | %* |
Net Investment Income (Loss) to Average Net Assets | | N/A | | 1.43 | %* |
| | Class B |
| | Year Ended | | Period from |
| | December 31, | | August 30, 2006^ |
Selected Per Share Data and Ratios | | 2007 | | to December 31, 2006 |
Net Asset Value, Beginning of Period | | $ | 11.56 | | $ | 10.00 | |
Income (Loss) from Investment Operations | | | | | |
Net Investment Income (Loss)† | | 0.16 | | 0.04 | |
Net Realized and Unrealized Gain (Loss) on Investments | | (1.11 | ) | 1.67 | |
Total from Investment Operations | | (0.95 | ) | 1.71 | |
Distributions from and/or in Excess of: | | | | | |
Net Investment Income | | (0.38 | ) | (0.12 | ) |
Net Realized Gain | | (0.21 | ) | (0.03 | ) |
Total Distributions | | (0.59 | ) | (0.15 | ) |
Redemption Fees | | 0.00 | ‡ | 0.00 | ‡ |
Net Asset Value, End of Period | | $ | 10.02 | | $ | 11.56 | |
Total Return++ | | (8.15 | )% | 17.11 | %# |
Ratios and Supplemental Data: | | | | | |
Net Assets, End of Period (Thousands) | | $ | 13,187 | | $ | 116 | |
Ratio of Expenses to Average Net Assets (2) | | 1.27 | %+ | 1.30 | %* |
Ratio of Expenses to Average Net Assets Excluding Bank Overdraft Expense | | 1.27 | %+ | — | |
Ratio of Net Investment Income (Loss) to Average Net Assets (2) | | 1.39 | %+ | 1.07 | %* |
Portfolio Turnover Rate | | 39 | % | 4 | %# |
(2)Supplemental Information on the Ratios to Average Net Assets: | | | | | |
Ratios before expense limitation: | | | | | |
Expenses to Average Net Assets | | N/A | | 1.41 | %* |
Net Investment Income (Loss) to Average Net Assets | | N/A | | 0.96 | %* |
^ Commencement of Operations
† Per share amount is based on average shares outstanding.
‡ Amount is less than $0.005 per share.
# Not Annualized
* Annualized
+ Reflects rebate of certain Portfolio expenses in connection with the investments in Morgan Stanley Institutional Liquidity Money Market Portfolio — Institutional Class during the period. As a result of such rebate, the expenses as a percentage of its net assets were effected by less than 0.005%.
++ Calculated based on the net asset value as of the last business day of the period.
196 | The accompanying notes are an integral part of the financial statements. |
2007 Annual Report
December 31, 2007
Financial Highlights
Global Value Equity Portfolio
| | Class A | |
| | Year Ended December 31, | |
Selected Per Share Data and Ratios | | 2007 | | 2006 | | 2005 | | 2004 | | 2003 | |
Net Asset Value, Beginning of Period | | $ | 20.24 | | $ | 17.85 | | $ | 17.81 | | $ | 15.84 | | $ | 12.46 | |
Income (Loss) from Investment Operations | | | | | | | | | | | |
Net Investment Income (Loss)† | | 0.33 | | 0.33 | | 0.31 | | 0.22 | | 0.19 | |
Net Realized and Unrealized Gain (Loss) on Investments | | 0.96 | | 3.44 | | 0.72 | | 2.02 | | 3.42 | |
Total from Investment Operations | | 1.29 | | 3.77 | | 1.03 | | 2.24 | | 3.61 | |
Distributions from and/or in Excess of: | | | | | | | | | | | |
Net Investment Income | | (0.34 | ) | (0.34 | ) | (0.31 | ) | (0.22 | ) | (0.16 | ) |
Net Realized Gain | | (3.49 | ) | (1.05 | ) | (0.68 | ) | (0.05 | ) | (0.08 | ) |
Total Distributions | | (3.83 | ) | (1.39 | ) | (0.99 | ) | (0.27 | ) | (0.24 | ) |
Redemption Fees | | 0.00 | ‡ | 0.01 | | 0.00 | ‡ | 0.00 | ‡ | 0.01 | |
Net Asset Value, End of Period | | $ | 17.70 | | $ | 20.24 | | $ | 17.85 | | $ | 17.81 | | $ | 15.84 | |
Total Return++ | | 6.65 | % | 21.40 | % | 5.81 | % | 14.13 | % | 29.21 | % |
Ratios and Supplemental Data: | | | | | | | | | | | |
Net Assets, End of Period (Thousands) | | $ | 66,035 | | $ | 101,163 | | $ | 86,000 | | $ | 68,505 | | $ | 55,545 | |
Ratio of Expenses to Average Net Assets (1) | | 0.90 | %+ | 0.91 | % | 0.90 | % | 1.00 | % | 1.00 | % |
Ratio of Expenses to Average Net Assets Excluding Bank Overdraft Expense | | 0.90 | %+ | N/A | | N/A | | 1.00 | % | 1.00 | % |
Ratio of Net Investment Income (Loss) to Average Net Assets (1) | | 1.58 | %+ | 1.71 | % | 1.74 | % | 1.31 | % | 1.44 | % |
Portfolio Turnover Rate | | 31 | % | 29 | % | 29 | % | 30 | % | 53 | % |
(1)Supplemental Information on the Ratios to Average Net Assets: | | | | | | | | | | | |
Ratios before expense limitation: | | | | | | | | | | | |
Expenses to Average Net Assets | | N/A | | N/A | | N/A | | 1.07 | % | 1.20 | % |
Net Investment Income (Loss) to Average Net Assets | | N/A | | N/A | | N/A | | 1.24 | % | 1.24 | % |
| | Class B | |
| | Year Ended December 31, | |
Selected Per Share Data and Ratios | | 2007 | | 2006 | | 2005 | | 2004 | | 2003 | |
Net Asset Value, Beginning of Period | | $ | 20.03 | | $ | 17.69 | | $ | 17.64 | | $ | 15.70 | | $ | 12.35 | |
Income (Loss) from Investment Operations | | | | | | | | | | | |
Net Investment Income (Loss)† | | 0.29 | | 0.28 | | 0.27 | | 0.17 | | 0.16 | |
Net Realized and Unrealized Gain (Loss) on Investments | | 0.93 | | 3.40 | | 0.71 | | 2.00 | | 3.40 | |
Total from Investment Operations | | 1.22 | | 3.68 | | 0.98 | | 2.17 | | 3.56 | |
Distributions from and/or in Excess of: | | | | | | | | | | | |
Net Investment Income | | (0.28 | ) | (0.29 | ) | (0.25 | ) | (0.18 | ) | (0.13 | ) |
Net Realized Gain | | (3.49 | ) | (1.05 | ) | (0.68 | ) | (0.05 | ) | (0.08 | ) |
Total Distributions | | (3.77 | ) | (1.34 | ) | (0.93 | ) | (0.23 | ) | (0.21 | ) |
Redemption Fees | | 0.00 | ‡ | 0.00 | ‡ | 0.00 | ‡ | 0.00 | ‡ | — | |
Net Asset Value, End of Period | | $ | 17.48 | | $ | 20.03 | | $ | 17.69 | | $ | 17.64 | | $ | 15.70 | |
Total Return++ | | 6.37 | % | 21.05 | % | 5.59 | % | 13.78 | % | 28.95 | % |
Ratios and Supplemental Data: | | | | | | | | | | | |
Net Assets, End of Period (Thousands) | | $ | 24,199 | | $ | 27,773 | | $ | 21,938 | | $ | 30,598 | | $ | 32,761 | |
Ratio of Expenses to Average Net Assets (2) | | 1.15 | %+ | 1.16 | % | 1.15 | % | 1.25 | % | 1.25 | % |
Ratio of Expenses to Average Net Assets Excluding Bank Overdraft Expense | | 1.15 | %+ | N/A | | N/A | | 1.25 | % | 1.25 | % |
Ratio of Net Investment Income (Loss) to Average Net Assets (2) | | 1.36 | %+ | 1.47 | % | 1.53 | % | 1.07 | % | 1.19 | % |
Portfolio Turnover Rate | | 31 | % | 29 | % | 29 | % | 30 | % | 53 | % |
(2)Supplemental Information on the Ratios to Average Net Assets: | | | | | | | | | | | |
Ratios before expense limitation: | | | | | | | | | | | |
Expenses to Average Net Assets | | N/A | | N/A | | N/A | | 1.32 | % | 1.45 | % |
Net Investment Income (Loss) to Average Net Assets | | N/A | | N/A | | N/A | | 0.99 | % | 0.99 | % |
† Per share amount is based on average shares outstanding.
‡ Amount is less than $0.005 per share.
+ Reflects rebate of certain Portfolio expenses in connection with the investments in Morgan Stanley Institutional Liquidity Money Market Portfolio — Institutional Class during the period. As a result of such rebate, the expenses as a percentage of its net assets were effected by less than 0.005%.
++ Calculated based on the net asset value as of the last business day of the period.
The accompanying notes are an integral part of the financial statements. | 197 |
2007 Annual Report
December 31, 2007
nual Report
Financial Highlights
port
International Equity Portfolio
| | Class A | |
| | Year Ended December 31, | |
Selected Per Share Data and Ratios | | 2007 | | 2006 | | 2005 | | 2004 | | 2003 | |
Net Asset Value, Beginning of Period | | $ | 20.58 | | $ | 20.34 | | $ | 20.99 | | $ | 19.06 | | $ | 14.60 | |
Income (Loss) from Investment Operations | | | | | | | | | | | |
Net Investment Income (Loss)† | | 0.43 | | 0.64 | | 0.43 | | 0.30 | | 0.24 | |
Net Realized and Unrealized Gain (Loss) on Investments | | 1.53 | | 3.93 | | 0.93 | | 3.50 | | 4.54 | |
Total from Investment Operations | | 1.96 | | 4.57 | | 1.36 | | 3.80 | | 4.78 | |
Distributions from and/or in Excess of: | | | | | | | | | | | |
Net Investment Income | | (0.46 | ) | (0.59 | ) | (0.35 | ) | (0.37 | ) | (0.32 | ) |
Net Realized Gain | | (3.16 | ) | (3.74 | ) | (1.66 | ) | (1.50 | ) | — | |
Total Distributions | | (3.62 | ) | (4.33 | ) | (2.01 | ) | (1.87 | ) | (0.32 | ) |
Redemption Fees | | 0.00 | ‡ | 0.00 | ‡ | 0.00 | ‡ | 0.00 | ‡ | 0.00 | ‡ |
Net Asset Value, End of Period | | $ | 18.92 | | $ | 20.58 | | $ | 20.34 | | $ | 20.99 | | $ | 19.06 | |
Total Return++ | | 9.84 | % | 22.50 | % | 6.45 | % | 19.96 | % | 32.82 | % |
Ratios and Supplemental Data: | | | | | | | | | | | |
Net Assets, End of Period (Thousands) | | $ | 5,105,807 | | $ | 5,900,906 | | $ | 6,704,732 | | $ | 7,200,606 | | $ | 5,657,941 | |
Ratio of Expenses to Average Net Assets (1) | | 0.93 | %+ | 0.94 | % | 0.93 | % | 0.98 | % | 1.00 | % |
Ratio of Expenses to Average Net Assets Excluding Bank Overdraft Expense | | 0.93 | %+ | 0.94 | % | 0.93 | % | N/A | | N/A | |
Ratio of Net Investment Income (Loss) to Average Net Assets (1) | | 1.97 | %+ | 2.88 | % | 2.04 | % | 1.48 | % | 1.48 | % |
Portfolio Turnover Rate | | 31 | % | 38 | % | 28 | % | 41 | % | 45 | % |
(1)Supplemental Information on the Ratios to Average Net Assets: | | | | | | | | | | | |
Ratios before expense limitation: | | | | | | | | | | | |
Expenses to Average Net Assets | | N/A | | N/A | | N/A | | N/A | | 1.02 | % |
Net Investment Income (Loss) to Average Net Assets | | N/A | | N/A | | N/A | | N/A | | 1.46 | % |
| | | | | | | | | | | | | | | | | |
| | Class B | |
| | Year Ended December 31, | |
Selected Per Share Data and Ratios | | 2007 | | 2006 | | 2005 | | 2004 | | 2003 | |
Net Asset Value, Beginning of Period | | $ | 20.40 | | $ | 20.19 | | $ | 20.85 | | $ | 18.96 | | $ | 14.53 | |
Income (Loss) from Investment Operations | | | | | | | | | | | |
Net Investment Income (Loss)† | | 0.37 | | 0.60 | | 0.37 | | 0.24 | | 0.18 | |
Net Realized and Unrealized Gain (Loss) on Investments | | 1.52 | | 3.87 | | 0.93 | | 3.47 | | 4.54 | |
Total from Investment Operations | | 1.89 | | 4.47 | | 1.30 | | 3.71 | | 4.72 | |
Distributions from and/or in Excess of: | | | | | | | | | | | |
Net Investment Income | | (0.40 | ) | (0.52 | ) | (0.30 | ) | (0.32 | ) | (0.29 | ) |
Net Realized Gain | | (3.16 | ) | (3.74 | ) | (1.66 | ) | (1.50 | ) | — | |
Total Distributions | | (3.56 | ) | (4.26 | ) | (1.96 | ) | (1.82 | ) | (0.29 | ) |
Redemption Fees | | 0.00 | ‡ | 0.00 | ‡ | 0.00 | ‡ | 0.00 | ‡ | 0.00 | ‡ |
Net Asset Value, End of Period | | $ | 18.73 | | $ | 20.40 | | $ | 20.19 | | $ | 20.85 | | $ | 18.96 | |
Total Return++ | | 9.52 | % | 22.21 | % | 6.20 | % | 19.67 | % | 32.46 | % |
Ratios and Supplemental Data: | | | | | | | | | | | |
Net Assets, End of Period (Thousands) | | $ | 1,019,595 | | $ | 1,152,822 | | $ | 1,206,125 | | $ | 1,073,278 | | $ | 733,298 | |
Ratio of Expenses to Average Net Assets (2) | | 1.18 | %+ | 1.19 | % | 1.18 | % | 1.23 | % | 1.25 | % |
Ratio of Expenses to Average Net Assets Excluding Bank Overdraft Expense | | 1.18 | %+ | 1.19 | % | 1.18 | % | N/A | | N/A | |
Ratio of Net Investment Income (Loss) to Average Net Assets (2) | | 1.71 | %+ | 2.71 | % | 1.77 | % | 1.21 | % | 1.23 | % |
Portfolio Turnover Rate | | 31 | % | 38 | % | 28 | % | 41 | % | 45 | % |
(2)Supplemental Information on the Ratios to Average Net Assets: | | | | | | | | | | | |
Ratios before expense limitation: | | | | | | | | | | | |
Expenses to Average Net Assets | | N/A | | N/A | | N/A | | N/A | | 1.27 | % |
Net Investment Income (Loss) to Average Net Assets | | N/A | | N/A | | N/A | | N/A | | 1.21 | % |
† Per share amount is based on average shares outstanding.
‡ Amount is less than $0.005 per share.
+ Reflects rebate of certain Portfolio expenses in connection with the investments in Morgan Stanley Institutional Liquidity Money Market Portfolio — Institutional Class during the period. As a result of such rebate, the expenses as a percentage of its net assets were effected by less than 0.005%.
++ Calculated based on the net asset value as of the last business day of the period.
198 | The accomapanying notes are an integral part of the financial statements. |
2007 Annual Report
December 31, 2007
Financial Highlights
International Growth Active Extension Portfolio
| | Class A |
| | Period from |
| | July 31, 2007^ |
Selected Per Share Data and Ratios | | to December 31, 2007 |
Net Asset Value, Beginning of Period | | $ | 10.00 | |
Income (Loss) from Investment Operations | | | |
Net Investment Income (Loss)† | | (0.02 | ) |
Net Realized and Unrealized Gain (Loss) on Investments | | 0.68 | |
Total from Investment Operations | | 0.66 | |
Distributions from and /or in Excess of: | | | |
Net Investment Income | | — | |
Net Asset Value, End of Period | | $ | 10.66 | |
Total Return++ | | 6.60 | %# |
Ratios and Supplemental Data: | | | |
Net Assets, End of Period (Thousands) | | $ | 10,553 | |
Ratio of Expenses to Average Net Assets (1) | | 2.17 | %*+ |
Ratio of Expenses to Average Net Assets Excluding Bank Overdraft Expense, Dividend Expense on Short Positions and Stock Loan Fee | | 1.25 | %*+ |
Ratio of Net Investment Income (Loss) to Average Net Assets (1) | | (0.52 | )%*+ |
Portfolio Turnover Rate | | 20 | %# |
(1)Supplemental Information on the Ratios to Average Net Assets: | | | |
Ratios before expense limitation: | | | |
Expenses to Average Net Assets | | 3.84 | %*+ |
Net Investment Income (Loss) to Average Net Assets | | (2.19 | )%*+ |
| | | |
| | Class B |
| | Period from |
| | July 31, 2007^ |
Selected Per Share Data and Ratios | | to December 31, 2007 |
Net Asset Value, Beginning of Period | | $ | 10.00 | |
Income (Loss) from Investment Operations | | | |
Net Investment Income (Loss)† | | (0.03 | ) |
Net Realized and Unrealized Gain (Loss) on Investments | | 0.68 | |
Total from Investment Operations | | 0.65 | |
Distributions from and /or in Excess of: | | | |
Net Investment Income | | — | |
Net Asset Value, End of Period | | $ | 10.65 | |
Total Return++ | | 6.50 | %# |
Ratios and Supplemental Data: | | | |
Net Assets, End of Period (Thousands) | | $ | 106 | |
Ratio of Expenses to Average Net Assets (2) | | 2.42 | %*+ |
Ratio of Expenses to Average Net Assets Excluding Bank Overdraft Expense, Dividend Expense on Short Positions and Stock Loan Fee | | 1.50 | %*+ |
Ratio of Net Investment Income (Loss) to Average Net Assets (2) | | (0.77 | )%*+ |
Portfolio Turnover Rate | | 20 | %# |
(2)Supplemental Information on the Ratios to Average Net Assets: | | | |
Ratios before expense limitation: | | | |
Expenses to Average Net Assets | | 4.09 | %*+ |
Net Investment Income (Loss) to Average Net Assets | | (2.44 | )%*+ |
| | | | | |
^ Commencement of Operations
† Per share amount is based on average shares outstanding.
# Not Annualized
* Annualized
+ Reflects rebate of certain Portfolio expenses in connection with the investments in Morgan Stanley Institutional Liquidity Money Market Portfolio — Institutional Class during the period. As a result of such rebate, the expenses as a percentage of its net assets were effected by less than 0.005%.
++ Calculated based on the net asset value as of the last business day of the period.
The accompanying notes are an integral part of the financial statements. | 199 |
2007 Annual Report |
|
December 31, 2007 |
Financial Highlights
International Growth Equity Portfolio
| | Class A |
| | | | | | Period from
December 27, 2005^ |
| | Year Ended December 31, |
Selected Per Share Data and Ratios | | 2007 | | 2006 | | to December 31, 2005 |
Net Asset Value, Beginning of Period | | $ | 12.55 | | $ | 9.93 | | $ | 10.00 | |
Income (Loss) from Investment Operations | | | | | | | |
Net Investment Income (Loss)† | | 0.13 | | 0.10 | | (0.00 | )‡ |
Net Realized and Unrealized Gain (Loss) on Investments | | 1.75 | | 2.67 | | (0.07 | ) |
Total from Investment Operations | | 1.88 | | 2.77 | | (0.07 | ) |
Distributions from and/or in Excess of: | | | | | | | |
Net Investment Income | | (0.12 | ) | (0.09 | ) | — | |
Net Realized Gain | | (0.55 | ) | (0.06 | ) | — | |
Total Distributions | | (0.67 | ) | (0.15 | ) | — | |
Net Asset Value, End of Period | | $ | 13.76 | | $ | 12.55 | | $ | 9.93 | |
Total Return++ | | 15.22 | % | 27.92 | % | (0.70 | )%# |
Ratios and Supplemental Data: | | | | | | | |
Net Assets, End of Period (Thousands) | | $ | 22,523 | | $ | 6,753 | | $ | 4,864 | |
Ratio of Expenses to Average Net Assets (1) | | 1.00 | %+ | 1.01 | % | 1.00 | %* |
Ratio of Expenses to Average Net Assets Excluding Bank Overdraft Expense | | 1.00 | %+ | 1.00 | % | — | |
Ratio of Net Investment Income (Loss) to Average Net Assets (1) | | 0.94 | %+ | 0.89 | % | (0.86 | )%* |
Portfolio Turnover Rate | | 32 | % | 24 | % | 4 | %# |
(1)Supplemental Information on the Ratios to Average Net Assets: | | | | | | | |
Ratios before expense limitation: | | | | | | | |
Expenses to Average Net Assets | | 2.42 | %+ | 2.74 | % | 31.60 | %* |
Net Investment Income (Loss) to Average Net Assets | | (0.48 | )%+ | (0.84 | )% | (31.46 | )%* |
| | | | | | | |
| | Class B |
| | | | | | Period from |
| | Year Ended December 31, | December 27, 2005^ to December 31, 2005 |
Selected Per Share Data and Ratios | | 2007 | | 2006 | |
Net Asset Value, Beginning of Period | | $ | 12.56 | | $ | 9.93 | | $ | 10.00 | |
Income (Loss) from Investment Operations | | | | | | | |
Net Investment Income (Loss)† | | 0.10 | | 0.09 | | (0.00 | )‡ |
Net Realized and Unrealized Gain (Loss) on Investments | | 1.76 | | 2.64 | | (0.07 | ) |
Total from Investment Operations | | 1.86 | | 2.73 | | (0.07 | ) |
Distributions from and/or in Excess of: | | | | | | | |
Net Investment Income | | (0.09 | ) | (0.04 | ) | — | |
Net Realized Gain | | (0.55 | ) | (0.06 | ) | — | |
Total Distributions | | (0.64 | ) | (0.10 | ) | — | |
Net Asset Value, End of Period | | $ | 13.78 | | $ | 12.56 | | $ | 9.93 | |
Total Return++ | | 15.03 | % | 27.49 | % | (0.70 | )%# |
Ratios and Supplemental Data: | | | | | | | |
Net Assets, End of Period (Thousands) | | $ | 531 | | $ | 325 | | $ | 99 | |
Ratio of Expenses to Average Net Assets (2) | | 1.25 | %+ | 1.27 | % | 1.25 | %* |
Ratio of Expenses to Average Net Assets Excluding Bank Overdraft Expense | | 1.25 | %+ | 1.25 | % | — | |
Ratio of Net Investment Income (Loss) to Average Net Assets (2) | | 0.70 | %+ | 0.78 | % | (1.16 | )%* |
Portfolio Turnover Rate | | 32 | % | 24 | % | 4 | %# |
(2)Supplemental Information on the Ratios to Average Net Assets: | | | | | | | |
Ratios before expense limitation: | | | | | | | |
Expenses to Average Net Assets | | 2.67 | %+ | 3.07 | % | 31.85 | %* |
Net Investment Income (Loss) to Average Net Assets | | (0.72 | )%+ | (1.02 | )% | (31.76 | )%* |
| | | | | | | | | | | |
^ Commencement of Operations
† Per share amount is based on average shares outstanding.
‡ Amount is less than $0.005 per share.
# Not Annualized
* Annualized
+ Reflects rebate of certain Portfolio expenses in connection with the investments in Morgan Stanley Institutional Liquidity Money Market Portfolio — Institutional Class during the period. As a result of such rebate, the expenses as a percentage of its net assets were effected by less than 0.005%.
++ Calculated based on the net asset value as of the last business day of the period.
200 | The accompanying notes are an integral part of the financial statements. |
| 2007 Annual Report |
|
December 31, 2007 |
Financial Highlights
International Magnum Portfolio
| | Class A | |
| | Year Ended December 31, | |
Selected Per Share Data and Ratios | | 2007 | | 2006 | | 2005 | | 2004 | | 2003 | |
Net Asset Value, Beginning of Period | | $ | 14.05 | | $ | 13.01 | | $ | 11.83 | | $ | 10.20 | | $ | 8.04 | |
Income (Loss) from Investment Operations | | | | | | | | | | | |
Net Investment Income (Loss)† | | 0.20 | | 0.20 | | 0.18 | | 0.13 | | 0.11 | |
Net Realized and Unrealized Gain (Loss) on Investments | | 1.84 | | 3.08 | | 1.16 | | 1.74 | | 2.22 | |
Total from Investment Operations | | 2.04 | | 3.28 | | 1.34 | | 1.87 | | 2.33 | |
Distributions from and/or in Excess of: | | | | | | | | | | | |
Net Investment Income | | (0.42 | ) | (0.36 | ) | (0.16 | ) | (0.24 | ) | (0.17 | ) |
Net Realized Gain | | (0.80 | ) | (1.88 | ) | — | | — | | — | |
Total Distributions | | (1.22 | ) | (2.24 | ) | (0.16 | ) | (0.24 | ) | (0.17 | ) |
Redemption Fees | | 0.00 | ‡ | 0.00 | ‡ | 0.00 | ‡ | — | | — | |
Net Asset Value, End of Period | | $ | 14.87 | | $ | 14.05 | | $ | 13.01 | | $ | 11.83 | | $ | 10.20 | |
Total Return++ | | 14.77 | % | 25.39 | % | 11.35 | % | 18.45 | % | 29.07 | % |
Ratios and Supplemental Data: | | | | | | | | | | | |
Net Assets, End of Period (Thousands) | | $ | 133,077 | | $ | 116,443 | | $ | 106,369 | | $ | 94,162 | | $ | 91,087 | |
Ratio of Expenses to Average Net Assets (1) | | 1.00 | %+ | 1.00 | % | 1.00 | % | 1.00 | % | 1.00 | % |
Ratio of Expenses to Average Net Assets Excluding Bank Overdraft Expense | | 1.00 | %+ | 1.00 | % | 1.00 | % | 1.00 | % | 1.00 | % |
Ratio of Net Investment Income (Loss) to Average Net Assets (1) | | 1.28 | %+ | 1.37 | % | 1.51 | % | 1.20 | % | 1.25 | % |
Portfolio Turnover Rate | | 39 | % | 81 | % | 32 | % | 49 | % | 53 | % |
(1)Supplemental Information on the Ratios to Average Net Assets: | | | | | | | | | | | |
Ratios before expense limitation: | | | | | | | | | | | |
Expenses to Average Net Assets | | 1.03 | %+ | 1.11 | % | 1.12 | % | 1.23 | % | 1.29 | % |
Net Investment Income (Loss) to Average Net Assets | | 1.25 | %+ | 1.26 | % | 1.39 | % | 0.96 | % | 0.96 | % |
| | | | | | | | | | | |
| | Class B | |
| | Year Ended December 31, | |
Selected Per Share Data and Ratios | | 2007 | | 2006 | | 2005 | | 2004 | | 2003 | |
Net Asset Value, Beginning of Period | | $ | 14.01 | | $ | 12.97 | | $ | 11.80 | | $ | 10.18 | | $ | 8.04 | |
Income (Loss) from Investment Operations | | | | | | | | | | | |
Net Investment Income (Loss)† | | 0.16 | | 0.18 | | 0.15 | | 0.11 | | 0.10 | |
Net Realized and Unrealized Gain (Loss) on Investments | | 1.83 | | 3.06 | | 1.15 | | 1.70 | | 2.18 | |
Total from Investment Operations | | 1.99 | | 3.24 | | 1.30 | | 1.81 | | 2.28 | |
Distributions from and/or in Excess of: | | | | | | | | | | | |
Net Investment Income | | (0.38 | ) | (0.32 | ) | (0.13 | ) | (0.22 | ) | (0.14 | ) |
Net Realized Gain | | (0.80 | ) | (1.88 | ) | — | | — | | — | |
Total Distributions | | (1.18 | ) | (2.20 | ) | (0.13 | ) | (0.22 | ) | (0.14 | ) |
Redemption Fees | | 0.00 | ‡ | 0.00 | ‡ | 0.00 | ‡ | 0.03 | | 0.00 | ‡ |
Net Asset Value, End of Period | | $ | 14.82 | | $ | 14.01 | | $ | 12.97 | | $ | 11.80 | | $ | 10.18 | |
Total Return++ | | 14.47 | % | 25.10 | % | 11.04 | % | 18.15 | % | 28.49 | % |
Ratios and Supplemental Data: | | | | | | | | | | | |
Net Assets, End of Period (Thousands) | | $ | 2,404 | | $ | 1,777 | | $ | 3,634 | | $ | 2,605 | | $ | 2,232 | |
Ratio of Expenses to Average Net Assets (2) | | 1.25 | %+ | 1.25 | % | 1.25 | % | 1.25 | % | 1.25 | % |
Ratio of Expenses to Average Net Assets Excluding Bank Overdraft Expense | | 1.25 | %+ | 1.25 | % | 1.25 | % | 1.25 | % | 1.25 | % |
Ratio of Net Investment Income (Loss) to Average Net Assets(2) | | 1.08 | %+ | 1.27 | % | 1.25 | % | 1.00 | % | 1.00 | % |
Portfolio Turnover Rate | | 39 | % | 81 | % | 32 | % | 49 | % | 53 | % |
(2)Supplemental Information on the Ratios to Average Net Assets: | | | | | | | | | | | |
Ratios before expense limitation: | | | | | | | | | | | |
Expenses to Average Net Assets | | 1.28 | %+ | 1.35 | % | 1.38 | % | 1.48 | % | 1.54 | % |
Net Investment Income (Loss) to Average Net Assets | | 1.05 | %+ | 1.17 | % | 1.12 | % | 0.77 | % | 0.71 | % |
† Per share amount is based on average shares outstanding.
‡ Amount is less than $0.005 per share.
+ Reflects rebate of certain Portfolio expenses in connection with the investments in Morgan Stanley Institutional Liquidity Money Market Portfolio — Institutional Class during the period. As a result of such rebate, the expenses as a percentage of its net assets were effected by less than 0.005%.
++ Calculated based on the net asset value as of the last business day of the period.
The accompanying notes are an integral part of the financial statements. | 201 |
2007 Annual Report
December 31, 2007
Financial Highlights
International Real Estate Portfolio
| | Class A |
| | Year Ended December 31, |
Selected Per Share Data and Ratios | | 2007 | | 2006 | | 2005 | | 2004 | | 2003 | |
Net Asset Value, Beginning of Period | | $ 34.82 | | $ 23.63 | | $ 21.95 | | $ 15.13 | | $ 10.93 | |
Income (Loss) from Investment Operations | | | | | | | | | | | |
Net Investment Income (Loss)† | | 0.69 | | 0.35 | | 0.43 | | 0.36 | | 0.27 | |
Net Realized and Unrealized Gain (Loss) on Investments | | (6.79 | ) | 12.78 | | 2.96 | | 6.82 | | 4.35 | |
Total from Investment Operations | | (6.10 | ) | 13.13 | | 3.39 | | 7.18 | | 4.62 | |
Distributions from and/or in Excess of: | | | | | | | | | | | |
Net Investment Income | | (1.77 | ) | (0.85 | ) | (0.35 | ) | (0.36 | ) | (0.42 | ) |
Net Realized Gain | | (1.65 | ) | (1.09 | ) | (1.36 | ) | — | | — | |
Total Distributions | | (3.42 | ) | (1.94 | ) | (1.71 | ) | (0.36 | ) | (0.42 | ) |
Redemption Fees | | 0.00 | ‡ | 0.00 | ‡ | 0.00 | ‡ | 0.00 | ‡ | — | |
Net Asset Value, End of Period | | $ 25.30 | | $ 34.82 | | $ 23.63 | | $ 21.95 | | $ 15.13 | |
Total Return++ | | (17.59 | )% | 56.06 | % | 15.52 | % | 47.49 | % | 42.41 | % |
Ratios and Supplemental Data: | | | | | | | | | | | |
Net Assets, End of Period (Thousands) | | $1,053,018 | | $1,125,569 | | $250,511 | | $50,620 | | $22,184 | |
Ratio of Expenses to Average Net Assets (1) | | 0.94 | %+ | 0.95 | % | 1.00 | % | 1.00 | % | 1.00 | % |
Ratio of Expenses to Average Net Assets Excluding Bank Overdraft Expense | | 0.94 | %+ | 0.95 | % | 1.00 | % | 1.00 | % | 1.00 | % |
Ratio of Net Investment Income (Loss) to Average Net Assets (1) | | 2.10 | %+ | 1.19 | % | 1.88 | % | 2.05 | % | 2.23 | % |
Portfolio Turnover Rate | | 55 | % | 36 | % | 57 | % | 42 | % | 47 | % |
(1) Supplemental Information on the Ratios to Average Net Assets: | | | | | | | | | | | |
Ratios before expense limitation: | | | | | | | | | | | |
Expenses to Average Net Assets | | N/A | | N/A | | 1.11 | % | 1.38 | % | 1.49 | % |
Net Investment Income (Loss) to Average Net Assets | | N/A | | N/A | | 1.77 | % | 1.67 | % | 1.74 | % |
| | Class B |
| | Year Ended December 31, |
Selected Per Share Data and Ratios | | 2007 | | 2006 | | 2005 | | 2004 | | 2003 | |
Net Asset Value, Beginning of Period | | $ 34.83 | | $ 23.68 | | $ 22.04 | | $ 15.17 | | $ 10.96 | |
Income (Loss) from Investment Operations | | | | | | | | | | | |
Net Investment Income (Loss)† | | 0.58 | | 0.29 | | 0.32 | | 0.35 | | 0.28 | |
Net Realized and Unrealized Gain (Loss) on Investments | | (6.74 | ) | 12.77 | | 3.01 | | 6.81 | | 4.32 | |
Total from Investment Operations | | (6.16 | ) | 13.06 | | 3.33 | | 7.16 | | 4.60 | |
Distributions from and/or in Excess of: | | | | | | | | | | | |
Net Investment Income | | (1.69 | ) | (0.82 | ) | (0.33 | ) | (0.29 | ) | (0.39 | ) |
Net Realized Gain | | (1.65 | ) | (1.09 | ) | (1.36 | ) | — | | — | |
Total Distributions | | (3.34 | ) | (1.91 | ) | (1.69 | ) | (0.29 | ) | (0.39 | ) |
Redemption Fees | | 0.00 | ‡ | 0.00 | ‡ | — | | — | | — | |
Net Asset Value, End of Period | | $ 25.33 | | $ 34.83 | | $ 23.68 | | $ 22.04 | | $ 15.17 | |
Total Return++ | | (17.76 | )% | 55.69 | % | 15.22 | % | 47.15 | % | 42.06 | % |
Ratios and Supplemental Data: | | | | | | | | | | | |
Net Assets, End of Period (Thousands) | | $ 97,800 | | $ 97,951 | | $ 8,674 | | $ 827 | | $ 915 | |
Ratio of Expenses to Average Net Assets (2) | | 1.19 | %+ | 1.20 | % | 1.25 | % | 1.25 | % | 1.25 | % |
Ratio of Expenses to Average Net Assets Excluding Bank Overdraft Expense | | 1.19 | %+ | 1.20 | % | 1.25 | % | 1.25 | % | 1.25 | % |
Ratio of Net Investment Income (Loss) to Average Net Assets (2) | | 1.76 | %+ | 0.94 | % | 1.34 | % | 2.03 | % | 1.98 | % |
Portfolio Turnover Rate | | 55 | % | 36 | % | 57 | % | 42 | % | 47 | % |
(2) Supplemental Information on the Ratios to Average Net Assets: | | | | | | | | | | | |
Ratios before expense limitation: | | | | | | | | | | | |
Expenses to Average Net Assets | | N/A | | N/A | | 1.45 | % | 1.66 | % | 1.74 | % |
Net Investment Income (Loss) to Average Net Assets | | N/A | | N/A | | 1.14 | % | 1.62 | % | 1.49 | % |
† Per share amount is based on average shares outstanding.
‡ Amount is less than $0.005 per share.
+ Reflects rebate of certain Portfolio expenses in connection with the investments in Morgan Stanley Institutional Liquidity Money Market Portfolio — Institutional Class during the period. As a result of such rebate, the expenses as a percentage of its net assets were effected by less than 0.005%.
++ Calculated based on the net asset value as of the last business day of the period.
202 | The accompanying notes are an integral part of the financial statements. |
| 2007 Annual Report |
| |
| December 31, 2007 |
Financial Highlights
International Small Cap Portfolio
| | Class A |
| | Year Ended December 31, |
Selected Per Share Data and Ratios | | 2007 | | 2006 | | 2005 | | 2004 | | 2003 | |
Net Asset Value, Beginning of Period | | $ 23.72 | | $ 24.14 | | $ 25.11 | | $ 20.52 | | $ 14.21 | |
Income (Loss) from Investment Operations | | | | | | | | | | | |
Net Investment Income (Loss)† | | 0.27 | | 0.32 | | 0.32 | | 0.24 | | 0.24 | |
Net Realized and Unrealized Gain (Loss) on Investments | | (1.11 | ) | 4.27 | | 2.89 | | 6.59 | | 6.61 | |
Total from Investment Operations | | (0.84 | ) | 4.59 | | 3.21 | | 6.83 | | 6.85 | |
Distributions from and/or in Excess of: | | | | | | | | | | | |
Net Investment Income | | (0.27 | ) | (0.41 | ) | (0.47 | ) | (0.35 | ) | (0.23 | ) |
Net Realized Gain | | (5.53 | ) | (4.60 | ) | (3.71 | ) | (1.89 | ) | (0.31 | ) |
Total Distributions | | (5.80 | ) | (5.01 | ) | (4.18 | ) | (2.24 | ) | (0.54 | ) |
Redemption Fees | | 0.00 | ‡ | 0.00 | ‡ | 0.00 | ‡ | 0.00 | ‡ | 0.00 | ‡ |
Net Asset Value, End of Period | | $ 17.08 | | $ 23.72 | | $ 24.14 | | $ 25.11 | | $ 20.52 | |
Total Return++ | | (3.22 | )% | 19.61 | % | 13.07 | % | 33.53 | % | 48.32 | % |
Ratios and Supplemental Data: | | | | | | | | | | | |
Net Assets, End of Period (Thousands) | | $796,050 | | $1,312,064 | | $1,389,078 | | $1,276,083 | | $899,996 | |
Ratio of Expenses to Average Net Assets (1) | | 1.09 | %+ | 1.10 | % | 1.10 | % | 1.15 | % | 1.15 | % |
Ratio of Expenses to Average Net Assets Excluding Bank Overdraft Expense | | 1.09 | %+ | 1.10 | % | 1.10 | % | 1.15 | % | 1.15 | % |
Ratio of Net Investment Income (Loss) to Average Net Assets (1) | | 1.10 | %+ | 1.25 | % | 1.22 | % | 1.04 | % | 1.40 | % |
Portfolio Turnover Rate | | 53 | % | 40 | % | 47 | % | 38 | % | 38 | % |
(1) Supplemental Information on the Ratios to Average Net Assets: | | | | | | | | | | | |
Ratios before expense limitation: | | | | | | | | | | | |
Expenses to Average Net Assets | | N/A | | N/A | | N/A | | 1.16 | % | 1.20 | % |
Net Investment Income (Loss) to Average Net Assets | | N/A | | N/A | | N/A | | 1.03 | % | 1.35 | % |
† Per share amount is based on average shares outstanding.
‡ Amount is less than $0.005 per share.
+ Reflects rebate of certain Portfolio expenses in connection with the investments in Morgan Stanley Institutional Liquidity Money Market Portfolio — Institutional Class during the period. As a result of such rebate, the expenses as a percentage of its net assets were effected by less than 0.005%.
++ Calculated based on the net asset value as of the last business day of the period.
The accompanying notes are an integral part of the financial statements. | 203 |
2007 Annual Report
December 31, 2007
Financial Highlights
Disciplined Large Cap Value Active Extension Portfolio
| | Class A |
| | Period from |
| | May 31, 2007^ |
Selected Per Share Data and Ratios | | to December 31, 2007 |
Net Asset Value, Beginning of Period | | $10.00 | |
Income (Loss) from Investment Operations | | | |
Net Investment Income (Loss)† | | 0.04 | |
Net Realized and Unrealized Gain (Loss) on Investments | | (1.43 | ) |
Total from Investment Operations | | (1.39 | ) |
Distributions from and /or in Excess of: | | | |
Net Investment Income | | (0.03 | ) |
Net Asset Value, End of Period | | $ 8.58 | |
Total Return++ | | (13.93 | )%# |
Ratios and Supplemental Data: | | | |
Net Assets, End of Period (Thousands) | | $9,193 | |
Ratio of Expenses to Average Net Assets (1) | | 2.18 | %*+ |
Ratio of Expenses to Average Net Assets Excluding Bank Overdraft Expense, Dividend Expense on Short Positions and Stock Loan Fee | | 1.35 | %*+ |
Ratio of Net Investment Income (Loss) to Average Net Assets (1) | | 0.83 | %*+ |
Portfolio Turnover Rate | | 46 | %# |
(1) Supplemental Information on the Ratios to Average Net Assets: | | | |
Ratios before expense limitation: | | | |
Expenses to Average Net Assets | | 3.66 | %*+ |
Net Investment Income (Loss) to Average Net Assets | | (0.65 | )%*+ |
| | Class B |
| | Period from |
| | May 31, 2007^ |
Selected Per Share Data and Ratios | | to December 31, 2007 |
Net Asset Value, Beginning of Period | | $10.00 | |
Income (Loss) from Investment Operations | | | |
Net Investment Income (Loss)† | | 0.03 | |
Net Realized and Unrealized Gain (Loss) on Investments | | (1.44 | ) |
Total from Investment Operations | | (1.41 | ) |
Distributions from and /or in Excess of: | | | |
Net Investment Income | | (0.01 | ) |
Net Asset Value, End of Period | | $ 8.58 | |
Total Return++ | | (14.06 | )%# |
Ratios and Supplemental Data: | | | |
Net Assets, End of Period (Thousands) | | $ 86 | |
Ratio of Expenses to Average Net Assets (2) | | 2.37 | %*+ |
Ratio of Expenses to Average Net Assets Excluding Bank Overdraft Expense, Dividend Expense on Short Positions and Stock Loan Fee | | 1.60 | %*+ |
Ratio of Net Investment Income (Loss) to Average Net Assets (2) | | 0.52 | %*+ |
Portfolio Turnover Rate | | 46 | %# |
(2) Supplemental Information on the Ratios to Average Net Assets: | | | |
Ratios before expense limitation: | | | |
Expenses to Average Net Assets | | 3.86 | %*+ |
Net Investment Income (Loss) to Average Net Assets | | (0.97 | )%*+ |
^ Commencement of operations.
† Per share amount is based on average shares outstanding.
# Not Annualized
* Annualized
+ Reflects rebate of certain Portfolio expenses in connection with the investments in Morgan Stanley Institutional Liquidity Money Market Portfolio — Institutional Class during the period. As a result of such rebate, the expenses as a percentage of its net assets were effected by less than 0.005%.
++ Calculated based on the net asset value as of the last business day of the period.
204 | The accompanying notes are an integral part of the financial statements. |
| 2007 Annual Report |
| |
| December 31, 2007 |
Financial Highlights
Focus Equity Portfolio
| | Class A |
| | Year Ended December 31, |
Selected Per Share Data and Ratios | | 2007 | | 2006 | | 2005 | | 2004 | | 2003 | |
Net Asset Value, Beginning of Period | | $ 15.19 | | $ 14.78 | | $ 12.59 | | $ 11.79 | | $ 9.02 | |
Income (Loss) from Investment Operations | | | | | | | | | | | |
Net Investment Income (Loss)† | | 0.03 | | (0.03 | ) | (0.03 | ) | 0.04 | | 0.02 | |
Net Realized and Unrealized Gain (Loss) on Investments | | 3.62 | | 0.44 | | 2.24 | | 0.78 | | 2.77 | |
Total from Investment Operations | | 3.65 | | 0.41 | | 2.21 | | 0.82 | | 2.79 | |
Distributions from and/or in Excess of: | | | | | | | | | | | |
Net Investment Income | | (0.03 | ) | — | | (0.02 | ) | (0.02 | ) | (0.02 | ) |
Redemption Fees | | 0.00 | ‡ | 0.00 | ‡ | — | | — | | — | |
Net Asset Value, End of Period | | $ 18.81 | | $ 15.19 | | $ 14.78 | | $ 12.59 | | $ 11.79 | |
Total Return++ | | 24.02 | % | 2.77 | % | 17.60 | % | 7.00 | % | 30.99 | %§ |
Ratios and Supplemental Data: | | | | | | | | | | | |
Net Assets, End of Period (Thousands) | | $13,852 | | $12,416 | | $54,321 | | $52,757 | | $61,420 | |
Ratio of Expenses to Average Net Assets (1) | | 1.00 | %+ | 0.79 | % | 0.91 | % | 1.00 | % | 1.00 | % |
Ratio of Expenses to Average Net Assets Excluding Bank Overdraft Expense | | 1.00 | %+ | 0.79 | % | 0.91 | % | 1.00 | % | 1.00 | % |
Ratio of Net Investment Income (Loss) to Average Net Assets (1) | | 0.16 | % | (0.23 | )% | (0.27 | )% | 0.35 | % | 0.22 | % |
Portfolio Turnover Rate | | 57 | % | 76 | % | 78 | % | 163 | % | 160 | % |
(1) Supplemental Information on the Ratios to Average Net Assets: | | | | | | | | | | | |
Ratios before expense limitation: | | | | | | | | | | | |
Expenses to Average Net Assets | | 1.13 | %+ | N/A | | N/A | | 1.11 | % | 1.14 | % |
Net Investment Income (Loss) to Average Net Assets | | 0.03 | %+ | N/A | | N/A | | 0.24 | % | 0.08 | % |
| | Class B |
| | Year Ended December 31, |
Selected Per Share Data and Ratios | | 2007 | | 2006 | | 2005 | | 2004 | | 2003 | |
Net Asset Value, Beginning of Period | | $ 14.81 | | $ 14.45 | | $ 12.34 | | $ 11.57 | | $ 8.85 | |
Income (Loss) from Investment Operations | | | | | | | | | | | |
Net Investment Income (Loss)† | | (0.01 | ) | (0.06 | ) | (0.06 | ) | 0.02 | | (0.00 | )‡ |
Net Realized and Unrealized Gain (Loss) on Investments | | 3.52 | | 0.42 | | 2.19 | | 0.75 | | 2.72 | |
Total from Investment Operations | | 3.51 | | 0.36 | | 2.13 | | 0.77 | | 2.72 | |
Distributions from and/or in Excess of: | | | | | | | | | | | |
Net Investment Income | | — | | — | | (0.02 | ) | — | | — | |
Redemption Fees | | 0.00 | ‡ | 0.00 | ‡ | — | | — | | — | |
Net Asset Value, End of Period | | $ 18.32 | | $ 14.81 | | $ 14.45 | | $ 12.34 | | $ 11.57 | |
Total Return++ | | 23.70 | % | 2.49 | % | 17.30 | % | 6.75 | % | 30.62 | %§ |
Ratios and Supplemental Data: | | | | | | | | | | | |
Net Assets, End of Period (Thousands) | | $ 2,913 | | $ 2,317 | | $12,442 | | $ 8,559 | | $ 8,156 | |
Ratio of Expenses to Average Net Assets (2) | | 1.25 | %+ | 1.04 | % | 1.16 | % | 1.25 | % | 1.25 | % |
Ratio of Expenses to Average Net Assets Excluding Bank Overdraft Expense | | 1.25 | %+ | 1.04 | % | 1.16 | % | 1.25 | % | 1.25 | % |
Ratio of Net Investment Income (Loss) to Average Net Assets (2) | | (0.07 | )% | (0.45 | )% | (0.49 | )% | 0.18 | % | (0.03 | )% |
Portfolio Turnover Rate | | 57 | % | 76 | % | 78 | % | 163 | % | 160 | % |
(2) Supplemental Information on the Ratios to Average Net Assets: | | | | | | | | | | | |
Ratios before expense limitation: | | | | | | | | | | | |
Expenses to Average Net Assets | | 1.38 | %+ | N/A | | N/A | | 1.36 | % | 1.39 | % |
Net Investment Income (Loss) to Average Net Assets | | (0.20 | )%+ | N/A | | N/A | | 0.07 | % | (0.17 | )% |
† Per share amount is based on average shares outstanding.
‡ Amount is less than $0.005 per share.
§ In 2003, performance was positively impacted by approximately 5.64%, due to the receipt of proceeds from the settlement of class action suits involving, primarily, one of the Portfolio’s holdings. This was a one-time settlement, and as a result, the impact on the NAV and consequently the performance will not likely be repeated in the future. Had these settlements not occurred, the 2003 total return for Class A shares and Class B shares would have been approximately 25.35% and 24.98%, respectively.
+ Reflects rebate of certain Portfolio expenses in connection with the investments in Morgan Stanley Institutional Liquidity Money Market Portfolio — Institutional Class during the period. As a result of such rebate, the expenses as a percentage of its net assets were effected by less than 0.005%.
++ Calculated based on the net asset value as of the last business day of the period.
The accompanying notes are an integral part of the financial statements. | 205 |
2007 Annual Report
December 31, 2007
Financial Highlights
Large Cap Relative Value Portfolio
| | Class A |
| | Year Ended December 31, |
Selected Per Share Data and Ratios | | 2007 | | 2006 | | 2005 | | 2004 | | 2003 | |
Net Asset Value, Beginning of Period | | $ 12.20 | | $ 11.10 | | $ 10.52 | | $ 9.30 | | $ 7.21 | |
Income (Loss) from Investment Operations | | | | | | | | | | | |
Net Investment Income (Loss)† | | 0.21 | | 0.20 | | 0.15 | | 0.12 | | 0.13 | |
Net Realized and Unrealized Gain (Loss) on Investments | | 0.16 | | 1.62 | | 0.90 | | 1.23 | | 2.09 | |
Total from Investment Operations | | 0.37 | | 1.82 | | 1.05 | | 1.35 | | 2.22 | |
Distributions from and/or in Excess of: | | | | | | | | | | | |
Net Investment Income | | (0.22 | ) | (0.20 | ) | (0.14 | ) | (0.13 | ) | (0.13 | ) |
Net Realized Gain | | (0.49 | ) | (0.52 | ) | (0.33 | ) | — | | — | |
Total Distributions | | (0.71 | ) | (0.72 | ) | (0.47 | ) | (0.13 | ) | (0.13 | ) |
Redemption Fees | | 0.00 | ‡ | 0.00 | ‡ | — | | — | | — | |
Net Asset Value, End of Period | | $ 11.86 | | $ 12.20 | | $ 11.10 | | $ 10.52 | | $ 9.30 | |
Total Return++ | | 2.90 | % | 16.74 | % | 10.07 | % | 14.56 | % | 31.05 | % |
Ratios and Supplemental Data: | | | | | | | | | | | |
Net Assets, End of Period (Thousands) | | $236,784 | | $211,904 | | $102,973 | | $90,938 | | $108,997 | |
Ratio of Expenses to Average Net Assets (1) | | 0.67 | %+ | 0.68 | % | 0.68 | % | 0.70 | % | 0.70 | % |
Ratio of Expenses to Average Net Assets Excluding Bank Overdraft Expense | | 0.67 | %+ | 0.68 | % | 0.68 | % | N/A | | N/A | |
Ratio of Net Investment Income (Loss) to Average Net Assets (1) | | 1.71 | %+ | 1.71 | % | 1.36 | % | 1.28 | % | 1.62 | % |
Portfolio Turnover Rate | | 31 | % | 33 | % | 46 | % | 84 | % | 130 | % |
(1) Supplemental Information on the Ratios to Average Net Assets: | | | | | | | | | | | |
Ratios before expense limitation: | | | | | | | | | | | |
Expenses to Average Net Assets | | N/A | | N/A | | N/A | | 0.74 | % | 0.77 | % |
Net Investment Income (Loss) to Average Net Assets | | N/A | | N/A | | N/A | | 1.24 | % | 1.55 | % |
| | Class B |
| | Year Ended December 31, |
Selected Per Share Data and Ratios | | 2007 | | 2006 | | 2005 | | 2004 | | 2003 | |
Net Asset Value, Beginning of Period | | $ 12.18 | | $ 11.09 | | $ 10.51 | | $ 9.31 | | $ 7.21 | |
Income (Loss) from Investment Operations | | | | | | | | | | | |
Net Investment Income (Loss)† | | 0.19 | | 0.17 | | 0.12 | | 0.10 | | 0.11 | |
Net Realized and Unrealized Gain (Loss) on Investments | | 0.15 | | 1.61 | | 0.91 | | 1.20 | | 2.10 | |
Total from Investment Operations | | 0.34 | | 1.78 | | 1.03 | | 1.30 | | 2.21 | |
Distributions from and/or in Excess of: | | | | | | | | | | | |
Net Investment Income | | (0.18 | ) | (0.17 | ) | (0.12 | ) | (0.10 | ) | (0.11 | ) |
Net Realized Gain | | (0.49 | ) | (0.52 | ) | (0.33 | ) | — | | — | |
Total Distributions | | (0.67 | ) | (0.69 | ) | (0.45 | ) | (0.10 | ) | (0.11 | ) |
Redemption Fees | | 0.00 | ‡ | 0.00 | ‡ | — | | — | | — | |
Net Asset Value, End of Period | | $ 11.85 | | $ 12.18 | | $ 11.09 | | $ 10.51 | | $ 9.31 | |
Total Return++ | | 2.72 | % | 16.38 | % | 9.81 | % | 14.07 | % | 30.86 | % |
Ratios and Supplemental Data: | | | | | | | | | | | |
Net Assets, End of Period (Thousands) | | $ 50,287 | | $ 63,300 | | $ 101,499 | | $ 75,189 | | $ 72,180 | |
Ratio of Expenses to Average Net Assets (2) | | 0.92 | %+ | 0.93 | % | 0.93 | % | 0.95 | % | 0.95 | % |
Ratio of Expenses to Average Net Assets Excluding Bank Overdraft Expense | | 0.92 | %+ | 0.93 | % | 0.93 | % | N/A | | N/A | |
Ratio of Net Investment Income (Loss) to Average Net Assets (2) | | 1.48 | %+ | 1.44 | % | 1.10 | % | 1.05 | % | 1.37 | % |
Portfolio Turnover Rate | | 31 | % | 33 | % | 46 | % | 84 | % | 130 | % |
(2) Supplemental Information on the Ratios to Average Net Assets: | | | | | | | | | | | |
Ratios before expense limitation: | | | | | | | | | | | |
Expenses to Average Net Assets | | N/A | | N/A | | N/A | | 0.99 | % | 1.02 | % |
Net Investment Income (Loss) to Average Net Assets | | N/A | | N/A | | N/A | | 1.01 | % | 1.30 | % |
† Per share amount is based on average shares outstanding.
‡ Amount is less than $0.005 per share.
+ Reflects rebate of certain Portfolio expenses in connection with the investments in Morgan Stanley Institutional Liquidity Money Market Portfolio — Institutional Class during the period. As a result of such rebate, the expenses as a percentage of its net assets were effected by less than 0.005%.
++ Calculated based on the net asset value as of the last business day of the period.
206 | The accompanying notes are an integral part of the financial statements. |
2007 Annual Report
December 31, 2007
Financial Highlights
Small Company Growth Portfolio
| | Class A | |
| | Year Ended December 31, | |
Selected Per Share Data and Ratios | | 2007 | | 2006 | | 2005 | | 2004 | | 2003 | |
Net Asset Value, Beginning of Period | | $ 13.31 | | $ 12.89 | | $ 12.50 | | $ 10.81 | | $ 7.50 | |
Income (Loss) from Investment Operations | | | | | | | | | | | |
Net Investment Income (Loss)† | | (0.05 | ) | (0.08 | ) | (0.00 | )‡ | (0.09 | ) | (0.09 | ) |
Net Realized and Unrealized Gain (Loss) on Investments | | 0.45 | | 1.59 | | 1.72 | | 2.16 | | 3.40 | |
Total from Investment Operations | | 0.40 | | 1.51 | | 1.72 | | 2.07 | | 3.31 | |
Distributions from and/or in Excess of: | | | | | | | | | | | |
Net Realized Gain | | (0.59 | ) | (1.09 | ) | (1.33 | ) | (0.38 | ) | — | |
Redemption Fees | | 0.00 | ‡ | 0.00 | ‡ | 0.00 | ‡ | — | | — | |
Net Asset Value, End of Period | | $ 13.12 | | $ 13.31 | | $ 12.89 | | $ 12.50 | | $ 10.81 | |
Total Return++ | | 3.04 | % | 11.90 | % | 13.55 | % | 19.17 | % | 44.13 | % |
Ratios and Supplemental Data: | | | | | | | | | | | |
Net Assets, End of Period (Thousands) | | $1,137,839 | | $1,028,030 | | $896,204 | | $651,276 | | $299,198 | |
Ratio of Expenses to Average Net Assets (1) | | 1.01 | %+ | 1.01 | % | 1.04 | % | 1.10 | % | 1.10 | % |
Ratio of Expenses to Average Net Assets Excluding Bank Overdraft Expense | | 1.01 | %+ | 1.01 | % | 1.04 | % | N/A | | N/A | |
Ratio of Net Investment Income (Loss) to Average Net Assets (1) | | (0.35 | )%+ | (0.56 | )% | (0.04 | )% | (0.79 | )% | (0.93 | )% |
Portfolio Turnover Rate | | 50 | % | 76 | % | 73 | % | 111 | % | 160 | % |
(1) Supplemental Information on the Ratios to Average Net Assets: | | | | | | | | | | | |
Ratios before expense limitation: | | | | | | | | | | | |
Expenses to Average Net Assets | | N/A | | N/A | | N/A | | 1.16 | % | 1.26 | % |
Net Investment Income (Loss) to Average Net Assets | | N/A | | N/A | | N/A | | (0.85 | )% | (1.09 | )% |
| | Class B | |
| | Year Ended December 31, | |
Selected Per Share Data and Ratios | | 2007 | | 2006 | | 2005 | | 2004 | | 2003 | |
Net Asset Value, Beginning of Period | | $ 12.63 | | $ 12.31 | | $ 12.02 | | $ 10.43 | | $ 7.26 | |
Income (Loss) from Investment Operations | | | | | | | | | | | |
Net Investment Income (Loss)† | | (0.08 | ) | (0.10 | ) | (0.03 | ) | (0.11 | ) | (0.10 | ) |
Net Realized and Unrealized Gain (Loss) on Investments | | 0.43 | | 1.51 | | 1.65 | | 2.08 | | 3.27 | |
Total from Investment Operations | | 0.35 | | 1.41 | | 1.62 | | 1.97 | | 3.17 | |
Distributions from and/or in Excess of: | | | | | | | | | | | |
Net Realized Gain | | (0.59 | ) | (1.09 | ) | (1.33 | ) | (0.38 | ) | — | |
Redemption Fees | | 0.00 | ‡ | 0.00 | ‡ | — | | — | | — | |
Net Asset Value, End of Period | | $ 12.39 | | $ 12.63 | | $ 12.31 | | $ 12.02 | | $ 10.43 | |
Total Return++ | | 2.81 | % | 11.55 | % | 13.35 | % | 18.79 | % | 43.80 | % |
Ratios and Supplemental Data: | | | | | | | | | | | |
Net Assets, End of Period (Thousands) | | $ 698,183 | | $ 857,275 | | $ 808,493 | | $ 713,733 | | $ 484,136 | |
Ratio of Expenses to Average Net Assets (2) | | 1.26 | %+ | 1.26 | % | 1.29 | % | 1.35 | % | 1.35 | % |
Ratio of Expenses to Average Net Assets Excluding Bank Overdraft Expense | | 1.26 | %+ | 1.26 | % | 1.29 | % | N/A | | N/A | |
Ratio of Net Investment Income (Loss) to Average Net Assets (2) | | (0.61 | )%+ | (0.81 | )% | (0.24 | )% | (1.02 | )% | (1.18 | )% |
Portfolio Turnover Rate | | 50 | % | 76 | % | 73 | % | 111 | % | 160 | % |
(2) Supplemental Information on the Ratios to Average Net Assets: | | | | | | | | | | | |
Ratios before expense limitation: | | | | | | | | | | | |
Expenses to Average Net Assets | | N/A | | N/A | | N/A | | 1.41 | % | 1.51 | % |
Net Investment Income (Loss) to Average Net Assets | | N/A | | N/A | | N/A | | (1.09 | )% | (1.34 | )% |
† Per share amount is based on average shares outstanding.
‡ Amount is less than $0.005 per share.
+ Reflects rebate of certain Portfolio expenses in connection with the investments in Morgan Stanley Institutional Liquidity Money Market Portfolio — Institutional Class during the period. As a result of such rebate, the expenses as a percentage of its net assets were effected by less than 0.005%.
++ Calculated based on the net asset value as of the last business day of the period.
The accompanying notes are an integral part of the financial statements. | 207 |
2007 Annual Report
December 31, 2007
Financial Highlights
Systematic Active Large Cap Core Portfolio
| | Class A |
Selected Per Share Data and Ratios | | Year Ended
December 31,
2007 | Period from
April 28, 2006^ to
December 31, 2006 |
Net Asset Value, Beginning of Period | | $ 10.69 | | $ 10.00 | |
Income (Loss) from Investment Operations | | | | | |
Net Investment Income (Loss)† | | 0.13 | | 0.08 | |
Net Realized and Unrealized Gain (Loss) on Investments | | 0.52 | | 0.69 | |
Total from Investment Operations | | 0.65 | | 0.77 | |
Distributions from and/or in Excess of: | | | | | |
Net Investment Income | | (0.11 | ) | (0.08 | ) |
Net Realized Gain | | (0.15 | ) | — | |
Return of Capital | | (0.02 | ) | — | |
Total Distributions | | (0.28 | ) | (0.08 | ) |
Net Asset Value, End of Period | | $ 11.06 | | $ 10.69 | |
Total Return++ | | 6.07 | % | 7.85 | %# |
Ratios and Supplemental Data: | | | | | |
Net Assets, End of Period (Thousands) | | $ 6,525 | | $ 6,308 | |
Ratio of Expenses to Average Net Assets (1) | | 0.60 | %+ | 0.60 | %* |
Ratio of Net Investment Income (Loss) to Average Net Assets (1) | | 1.16 | %+ | 1.25 | %* |
Portfolio Turnover Rate | | 62 | % | 55 | %# |
(1) Supplemental Information on the Ratios to Average Net Assets: | | | | | |
Ratios before expense limitation: | | | | | |
Expenses to Average Net Assets | | 1.26 | %+ | 2.17 | %* |
Net Investment Income (Loss) to Average Net Assets | | 0.50 | %+ | (0.32 | )%* |
| | | |
| | Class B |
Selected Per Share Data and Ratios | | Year Ended
December 31,
2007 | Period from
April 28, 2006^ to
December 31, 2006 |
Net Asset Value, Beginning of Period | | $ 10.69 | | $ 10.00 | |
Income (Loss) from Investment Operations | | | | | |
Net Investment Income (Loss)† | | 0.10 | | 0.07 | |
Net Realized and Unrealized Gain (Loss) on Investments | | 0.53 | | 0.69 | |
Total from Investment Operations | | 0.63 | | 0.76 | |
Distributions from and/or in Excess of: | | | | | |
Net Investment Income | | (0.09 | ) | (0.07 | ) |
Net Realized Gain | | (0.15 | ) | — | |
Return of Capital | | (0.02 | ) | — | |
Total Distributions | | (0.26 | ) | (0.07 | ) |
Net Asset Value, End of Period | | $ 11.06 | | $ 10.69 | |
Total Return++ | | 5.81 | % | 7.68 | %# |
Ratios and Supplemental Data: | | | | | |
Net Assets, End of Period (Thousands) | | $ 111 | | $ 107 | |
Ratio of Expenses to Average Net Assets (2) | | 0.85 | %+ | 0.85 | %* |
Ratio of Net Investment Income (Loss) to Average Net Assets (2) | | 0.91 | %+ | 1.00 | %* |
Portfolio Turnover Rate | | 62 | % | 55 | %# |
(2) Supplemental Information on the Ratios to Average Net Assets: | | | | | |
Ratios before expense limitation: | | | | | |
Expenses to Average Net Assets | | 1.51 | %+ | 2.42 | %* |
Net Investment Income (Loss) to Average Net Assets | | 0.25 | %+ | (0.57 | )%* |
† | | Per share amount is based on average shares outstanding. |
^ | | Commencement of operations |
+ | | Reflects rebate of certain Portfolio expenses in connection with the investments in Morgan Stanley Institutional Liquidity Money Market Portfolio — Institutional Class during the period. As a result of such rebate, the expenses as a percentage of its nets assets were effected by 0.01%. |
++ | | Calculated based on the net asset value as of the last business day of the period. |
| | | | | | | |
208 | The accompanying notes are an integral part of the financial statements. |
2007 Annual Report
December 31, 2007
Financial Highlights
Systematic Active Small Cap Core Portfolio
| | Class A |
Selected Per Share Data and Ratios | | Year Ended
December 31,
2007 | Period from
April 28, 2006^ to
December 31, 2006 |
Net Asset Value, Beginning of Period | | $ 9.93 | | $10.00 | |
Income (Loss) from Investment Operations | | | | | |
Net Investment Income (Loss)† | | 0.08 | | 0.03 | |
Net Realized and Unrealized Gain (Loss) on Investments | | (0.91 | ) | (0.07 | ) |
Total from Investment Operations | | (0.83 | ) | (0.04 | ) |
Distributions from and/or in Excess of: | | | | | |
Net Investment Income | | (0.05 | ) | (0.03 | ) |
Net Realized Gain | | (0.12 | ) | — | |
Total Distributions | | (0.17 | ) | (0.03 | ) |
Net Asset Value, End of Period | | $ 8.93 | | $ 9.93 | |
Total Return++ | | (8.35 | )% | (0.41 | )%# |
Ratios and Supplemental Data: | | | | | |
Net Assets, End of Period (Thousands) | | $5,801 | | $6,455 | |
Ratio of Expenses to Average Net Assets (1) | | 1.10 | %+ | 1.10 | %* |
Ratio of Expenses to Average Net Assets Excluding Bank Overdraft Expense | | 1.10 | %+ | N/A | |
Ratio of Net Investment Income (Loss) to Average Net Assets (1) | | 0.81 | %+ | 0.45 | %* |
Portfolio Turnover Rate | | 59 | % | 60 | %# |
(1) Supplemental Information on the Ratios to Average Net Assets: | | | | | |
Ratios before expense limitation: | | | | | |
Expenses to Average Net Assets | | 1.76 | %+ | 2.47 | %* |
Net Investment Income (Loss) to Average Net Assets | | 0.15 | %+ | (0.92 | )%* |
| | | | | |
| | Class B |
Selected Per Share Data and Ratios | | Year Ended
December 31,
2007 | Period from
April 28, 2006^ to
December 31, 2006 |
Net Asset Value, Beginning of Period | | $ 9.93 | | $ 10.00 | |
Income (Loss) from Investment Operations | | | | | |
Net Investment Income (Loss)† | | 0.06 | | 0.01 | |
Net Realized and Unrealized Gain (Loss) on Investments | | (0.91 | ) | (0.07 | ) |
Total from Investment Operations | | (0.85 | ) | (0.06 | ) |
Distributions from and/or in Excess of: | | | | | |
Net Investment Income | | (0.03 | ) | (0.01 | ) |
Net Realized Gain | | (0.12 | ) | — | |
Total Distributions | | (0.15 | ) | (0.01 | ) |
Net Asset Value, End of Period | | $ 8.93 | | $ 9.93 | |
Total Return++ | | (8.49 | )% | (0.57 | )%# |
Ratios and Supplemental Data: | | | | | |
Net Assets, End of Period (Thousands) | | $ 90 | | $ 99 | |
Ratio of Expenses to Average Net Assets (2) | | 1.35 | %+ | 1.35 | %* |
Ratio of Expenses to Average Net Assets Excluding Bank Overdraft Expense | | 1.35 | %+ | N/A | |
Ratio of Net Investment Income (Loss) to Average Net Assets (2) | | 0.56 | %+ | 0.20 | %* |
Portfolio Turnover Rate | | 59 | % | 60 | %# |
(2) Supplemental Information on the Ratios to Average Net Assets: | | | | | |
Ratios before expense limitation: | | | | | |
Expenses to Average Net Assets | | 2.01 | %+ | 2.72 | %* |
Net Investment Income (Loss) to Average Net Assets | | (0.10 | )%+ | (1.17 | )%* |
| | | | | | |
^ | Commencement of Operations |
† | Per share amount is based on average shares outstanding. |
# | Not Annualized |
* | Annualized |
+ | Reflects rebate of certain Portfolio expenses in connection with the investments in Morgan Stanley Institutional Liquidity Money Market Portfolio — Institutional Class during the period. As a result of such rebate, the expenses as a percentage of its net assets were effected by less than 0.005%. |
++ | Calculated based on the net asset value as of the last business day of the period. |
The accompanying notes are an integral part of the financial statements. | 209 |
2007 Annual Report
December 31, 2007
Financial Highlights
Systematic Active Small Cap Growth Portfolio
| | Class A |
Selected Per Share Data and Ratios | Year Ended
December 31,
2007 | Period from
April 28, 2006^ to
December 31, 2006 |
Net Asset Value, Beginning of Period | | $ 9.77 | | $10.00 | |
Income (Loss) from Investment Operations | | | | | |
Net Investment Income (Loss)† | | 0.01 | | (0.01 | ) |
Net Realized and Unrealized Gain (Loss) on Investments | | 0.08 | | (0.22 | ) |
Total from Investment Operations | | 0.09 | | (0.23 | ) |
Distributions from and/or in Excess of: | | | | | |
Net Investment Income | | (0.01 | ) | — | |
Net Realized Gain | | (0.34 | ) | — | |
Total Distributions | | (0.35 | ) | — | |
Net Asset Value, End of Period | | $ 9.51 | | $ 9.77 | |
Total Return++ | | 0.82 | % | (2.20 | )%# |
Ratios and Supplemental Data: | | | | | |
Net Assets, End of Period (Thousands) | | $6,491 | | $6,646 | |
Ratio of Expenses to Average Net Assets (1) | | 1.09 | %+ | 1.10 | %* |
Ratio of Expenses to Average Net Assets Excluding Bank Overdraft Expense | | 1.09 | %+ | N/A | |
Ratio of Net Investment Income (Loss) to Average Net Assets (1) | | 0.13 | %+ | (0.13 | )%* |
Portfolio Turnover Rate | | 56 | % | 76 | %# |
(1) Supplemental Information on the Ratios to Average Net Assets: | | | | | |
Ratios before expense limitation: | | | | | |
Expenses to Average Net Assets | | 1.69 | %+ | 2.46 | %* |
Net Investment Income (Loss) to Average Net Assets | | (0.47 | )%+ | (1.49 | )%* |
| | | | | |
| | Class B |
Selected Per Share Data and Ratios | | Year Ended
December 31,
2007 | Period from
April 28, 2006^ to
December 31, 2006 |
Net Asset Value, Beginning of Period | | $ 9.76 | | $10.00 | |
Income (Loss) from Investment Operations | | | | | |
Net Investment Income (Loss)† | | (0.01 | ) | (0.02 | ) |
Net Realized and Unrealized Gain (Loss) on Investments | | 0.07 | | (0.22 | ) |
Total from Investment Operations | | 0.06 | | (0.24 | ) |
Distributions from and/or in Excess of: | | | | | |
Net Investment Income | | — | | — | |
Net Realized Gain | | (0.34 | ) | — | |
Total Distributions | | (0.34 | ) | — | |
Net Asset Value, End of Period | | $ 9.48 | | $ 9.76 | |
Total Return++ | | 0.50 | % | (2.30 | )%# |
Ratios and Supplemental Data: | | | | | |
Net Assets, End of Period (Thousands) | | $ 95 | | $ 98 | |
Ratio of Expenses to Average Net Assets (2) | | 1.34 | %+ | 1.35 | %* |
Ratio of Expenses to Average Net Assets Excluding Bank Overdraft Expense | | 1.34 | %+ | N/A | |
Ratio of Net Investment Income (Loss) to Average Net Assets (2) | | (0.12 | )%+ | (0.38 | )%* |
Portfolio Turnover Rate | | 56 | % | 76 | %# |
(2) Supplemental Information on the Ratios to Average Net Assets: | | | | | |
Ratios before expense limitation: | | | | | |
Expenses to Average Net Assets | | 1.94 | %+ | 2.71 | %* |
Net Investment Income (Loss) to Average Net Assets | | (0.72 | )%+ | (1.74 | )%* |
| | | | | | | |
† | Per share amount is based on average shares outstanding. |
^ | Commencement of Operations |
# | Not Annualized |
* | Annualized |
+ | Reflects rebate of certain Portfolio expenses in connection with the investments in Morgan Stanley Institutional Liquidity Money Market Portfolio — Institutional Class during the period. As a result of such rebate, the expenses as a percentage of its net assets were effected by less than 0.005%. |
++ | Calculated based on the net asset value as of the last business day of the period. |
210 | The accompanying notes are an integral part of the financial statements. |
2007 Annual Report
December 31, 2007
Financial Highlights
Systematic Active Small Cap Value Portfolio
| | Class A |
Selected Per Share Data and Ratios | | Year Ended
December 31, 2007 | Period from
April 28, 2006^
to December 31, 2006 |
Net Asset Value, Beginning of Period | | $ 10.37 | | $10.00 | |
Income (Loss) from Investment Operations | | | | | |
Net Investment Income (Loss)† | | 0.16 | | 0.06 | |
Net Realized and Unrealized Gain (Loss) on Investments | | (1.70 | ) | 0.37 | |
Total from Investment Operations | | (1.54 | ) | 0.43 | |
Distributions from and/or in Excess of: | | | | | |
Net Investment Income | | (0.13 | ) | (0.06 | ) |
Net Realized Gain | | (0.49 | ) | — | |
Total Distributions | | (0.62 | ) | (0.06 | ) |
Net Asset Value, End of Period | | $ 8.21 | | $10.37 | |
Total Return++ | | (14.78 | )% | 4.30 | %# |
Ratios and Supplemental Data: | | | | | |
Net Assets, End of Period (Thousands) | | $ 5,418 | | $6,841 | |
Ratio of Expenses to Average Net Assets (1) | | 1.10 | %+ | 1.10 | %* |
Ratio of Expenses to Average Net Assets Excluding Bank Overdraft Expense | | 1.10 | %+ | N/A | |
Ratio of Net Investment Income (Loss) to Average Net Assets (1) | | 1.60 | %+ | 0.92 | %* |
Portfolio Turnover Rate | | 48 | % | 77 | %# |
(1) Supplemental Information on the Ratios to Average Net Assets: | | | | | |
Ratios before expense limitation: | | | | | |
Expenses to Average Net Assets | | 1.75 | %+ | 2.37 | %* |
Net Investment Income (Loss) to Average Net Assets | | 0.95 | %+ | (0.35 | )%* |
| | | | | |
| | Class B |
Selected Per Share Data and Ratios | | Year Ended
December 31, 2007 | Period from
April 28, 2006^
to December 31, 2006 |
Net Asset Value, Beginning of Period | | $ 10.36 | | $10.00 | |
Income (Loss) from Investment Operations | | | | | |
Net Investment Income (Loss)† | | 0.14 | | 0.04 | |
Net Realized and Unrealized Gain (Loss) on Investments | | (1.70 | ) | 0.36 | |
Total from Investment Operations | | (1.56 | ) | 0.40 | |
Distributions from and/or in Excess of: | | | | | |
Net Investment Income | | (0.10 | ) | (0.04 | ) |
Net Realized Gain | | (0.49 | ) | — | |
Total Distributions | | (0.59 | ) | (0.04 | ) |
Net Asset Value, End of Period | | $ 8.21 | | $10.36 | |
Total Return++ | | (15.03 | )% | 4.14 | %# |
Ratios and Supplemental Data: | | | | | |
Net Assets, End of Period (Thousands) | | $ 82 | | $ 104 | |
Ratio of Expenses to Average Net Assets (2) | | 1.35 | %+ | 1.35 | %* |
Ratio of Expenses to Average Net Assets Excluding Bank Overdraft Expense | | 1.35 | %+ | N/A | |
Ratio of Net Investment Income (Loss) to Average Net Assets (2) | | 1.35 | %+ | 0.67 | %* |
Portfolio Turnover Rate | | 48 | % | 77 | %# |
(2) Supplemental Information on the Ratios to Average Net Assets: | | | | | |
Ratios before expense limitation: | | | | | |
Expenses to Average Net Assets | | 2.00 | %+ | 2.62 | %* |
Net Investment Income (Loss) to Average Net Assets | | 0.70 | %+ | (0.60 | )%* |
^ | | Commencement of Operations |
† | | Per share amount is based on average shares outstanding. |
# | | Not Annualized |
+ | | Reflects rebate of certain Portfolio expenses in connection with the investments in Morgan Stanley Institutional Liquidity Money Market Portfolio — Institutional lass during the period. As a result of such rebate, the expenses as a percentage of its net assets were effected by less than 0.005%. |
++ | | Calculated based on the net asset value as of the last business day of the period. |
* | | Annualized |
| | | | | | | | |
The accompanying notes are an integral part of the financial statements. | 211 |
2007 Annual Report
December 31, 2007
Financial Highlights
Systematic Large Cap Core Active Extension Portfolio
| | Class A |
| | Period from |
| | May 31, 2007^ |
Selected Per Share Data and Ratios | | to December 31, 2007 |
Net Asset Value, Beginning of Period | | $10.00 | |
Income (Loss) from Investment Operations | | | |
Net Investment Income (Loss)† | | 0.00 | ‡ |
Net Realized and Unrealized Gain (Loss) on Investments | | (0.41 | ) |
Total from Investment Operations | | (0.41 | ) |
Net Asset Value, End of Period | | $ 9.59 | |
Total Return++ | | (4.09 | )%# |
Ratios and Supplemental Data: | | | |
Net Assets, End of Period (Thousands) | | $9,582 | |
Ratio of Expenses to Average Net Assets (1) | | 1.84 | %*+ |
Ratio of Expenses to Average Net Assets Excluding Bank Overdraft Expense, Dividend Expense on Short | | | |
Positions and Stock Loan Fee | | 1.35 | %*+ |
Ratio of Net Investment Income (Loss) to Average Net Assets (1) | | (0.02 | )%*+ |
Portfolio Turnover Rate | | 40 | %# |
(1) Supplemental Information on the Ratios to Average Net Assets: | | | |
Ratios before expense limitation: | | | |
Expenses to Average Net Assets | | 3.21 | %*+ |
Net Investment Income (Loss) to Average Net Assets | | (1.39 | )%*+ |
| | |
| | Class B |
| | Period from |
| | May 31, 2007^ |
Selected Per Share Data and Ratios | | to December 31, 2007 |
Net Asset Value, Beginning of Period | | $10.00 | |
Income (Loss) from Investment Operations | | | |
Net Investment Income (Loss)† | | (0.02 | ) |
Net Realized and Unrealized Gain (Loss) on Investments | | (0.40 | ) |
Total from Investment Operations | | (0.42 | ) |
Net Asset Value, End of Period | | $9.58 | |
Total Return++ | | (4.20 | )%# |
Ratios and Supplemental Data: | | | |
Net Assets, End of Period (Thousands) | | $ 96 | |
Ratio of Expenses to Average Net Assets (2) | | 2.07 | %*+ |
Ratio of Expenses to Average Net Assets Excluding Bank Overdraft Expense, Dividend Expense on Short Positions and Stock Loan Fee | | 1.60 | %*+ |
Ratio of Net Investment Income (Loss) to Average Net Assets (2) | | (0.29 | )%*+ |
Portfolio Turnover Rate | | 40 | %# |
(2) Supplemental Information on the Ratios to Average Net Assets: | | | |
Ratios before expense limitation: | | | |
Expenses to Average Net Assets | | 3.43 | %*+ |
Net Investment Income (Loss) to Average Net Assets | | (1.65 | )%*+ |
^ | Commencement of Operations |
† | Per share amount is based on average shares outstanding. |
‡ | Amount is less than $0.005 per share. |
# | Not Annualized |
* | Annualized |
+ | Reflects rebate of certain Portfolio expenses in connection with the investments in Morgan Stanley Institutional Liquidity Money Market Portfolio — Institutional Class during the period. As a result of such rebate, the expenses as a percentage of its net assets were effected by less than 0.005%. |
++ | Calculated based on the net asset value as of the last business day of the period. |
212 | The accompanying notes are an integral part of the financial statements. |
| 2007 Annual Report |
|
December 31, 2007 |
Financial Highlights
U.S. Large Cap Growth Portfolio
| | Class A | |
| | Year Ended December 31, | |
Selected Per Share Data and Ratios | | 2007 | | 2006 | | 2005 | | 2004 | | 2003 | |
Net Asset Value, Beginning of Period | | $ 20.28 | | $ 19.49 | | $ 16.88 | | $ 15.74 | | $ 12.49 | |
Income (Loss) from Investment Operations | | | | | | | | | | | |
Net Investment Income (Loss)† | | 0.10 | | 0.01 | | 0.02 | | 0.09 | | 0.05 | |
Net Realized and Unrealized Gain (Loss) on Investments | | 4.41 | | 0.78 | | 2.63 | | 1.13 | | 3.25 | |
Total from Investment Operations | | 4.51 | | 0.79 | | 2.65 | | 1.22 | | 3.30 | |
Distributions from and/or in Excess of: | | | | | | | | | | | |
Net Investment Income | | (0.10 | ) | (0.00 | )‡ | (0.04 | ) | (0.08 | ) | (0.05 | ) |
Redemption Fees | | 0.00 | ‡ | 0.00 | ‡ | — | | — | | — | |
Net Asset Value, End of Period | | $ 24.69 | | $ 20.28 | | $ 19.49 | | $ 16.88 | | $ 15.74 | |
Total Return++ | | 22.29 | % | 4.07 | % | 15.72 | % | 7.75 | % | 26.41 | %§ |
Ratios and Supplemental Data: | | | | | | | | | | | |
Net Assets, End of Period (Thousands) | | $1,406,866 | | $1,012,417 | | $871,905 | | $554,097 | | $589,698 | |
Ratio of Expenses to Average Net Assets (1) | | 0.62 | %+ | 0.63 | % | 0.65 | % | 0.77 | % | 0.80 | % |
Ratio of Expenses to Average Net Assets Excluding Bank Overdraft Expense | | 0.62 | %+ | 0.63 | % | 0.65 | % | N/A | | N/A | |
Ratio of Net Investment Income (Loss) to Average Net Assets (1) | | 0.46 | %+ | 0.03 | % | 0.13 | % | 0.58 | % | 0.34 | % |
Portfolio Turnover Rate | | 50 | % | 59 | % | 106 | % | 179 | % | 131 | % |
(1) Supplemental Information on the Ratios to Average Net Assets: | | | | | | | | | | | |
Ratios before expense limitation: | | | | | | | | | | | |
Expenses to Average Net Assets | | N/A | | N/A | | N/A | | N/A | | 0.82 | % |
Net Investment Income (Loss) to Average Net Assets | | N/A | | N/A | | N/A | | N/A | | 0.32 | % |
| | Class B | |
| | Year Ended December 31, | |
Selected Per Share Data and Ratios | | 2007 | | 2006 | | 2005 | | 2004 | | 2003 | |
Net Asset Value, Beginning of Period | | $ 19.95 | | $ 19.21 | | $ 16.67 | | $ 15.55 | | $ 12.34 | |
Income (Loss) from Investment Operations | | | | | | | | | | | |
Net Investment Income (Loss)† | | 0.05 | | (0.04 | ) | (0.03 | ) | 0.05 | | 0.01 | |
Net Realized and Unrealized Gain (Loss) on Investments | | 4.33 | | 0.78 | | 2.60 | | 1.11 | | 3.21 | |
Total from Investment Operations | | 4.38 | | 0.74 | | 2.57 | | 1.16 | | 3.22 | |
Distributions from and/or in Excess of: | | | | | | | | | | | |
Net Investment Income | | (0.06 | ) | — | | (0.03 | ) | (0.04 | ) | (0.01 | ) |
Redemption Fees | | 0.00 | ‡ | 0.00 | ‡ | — | | — | | — | |
Net Asset Value, End of Period | | $ 24.27 | | $ 19.95 | | $ 19.21 | | $ 16.67 | | $ 15.55 | |
Total Return++ | | 21.93 | % | 3.85 | % | 15.41 | % | 7.45 | % | 26.13 | %§ |
Ratios and Supplemental Data: | | | | | | | | | | | |
Net Assets, End of Period (Thousands) | | $ 166,717 | | $ 57,689 | | $ 35,678 | | $202,893 | | $199,591 | |
Ratio of Expenses to Average Net Assets (2) | | 0.87 | %+ | 0.88 | % | 0.90 | % | 1.02 | % | 1.05 | % |
Ratio of Expenses to Average Net Assets Excluding Bank Overdraft Expense | | 0.87 | %+ | 0.88 | % | 0.90 | % | N/A | | N/A | |
Ratio of Net Investment Income (Loss) to Average Net Assets (2) | | 0.24 | %+ | (0.23 | )% | (0.17 | )% | 0.33 | % | 0.09 | % |
Portfolio Turnover Rate | | 50 | % | 59 | % | 106 | % | 179 | % | 131 | % |
(2) Supplemental Information on the Ratios to Average Net Assets: | | | | | | | | | | | |
Ratios before expense limitation: | | | | | | | | | | | |
Expenses to Average Net Assets | | N/A | | N/A | | N/A | | N/A | | 1.07 | % |
Net Investment Income (Loss) to Average Net Assets | | N/A | | N/A | | N/A | | N/A | | 0.07 | % |
† Per share amount is based on average shares outstanding.
‡ Amount is less than $0.005 per share.
§ In 2003, performance was positively impacted by approximately 1.34%, due to the receipt of proceeds from the settlement of class action suits involving, primarily, one of the Portfolio’s holdings. This was a one-time settlement, and as a result, the impact on the NAV and consequently the performance will not likely be repeated in the future. Had these settlements not occurred, the total return for Class A shares and Class B shares would have been approximately 25.07% and 24.79% respectively.
+ Reflects rebate of certain Portfolio expenses in connection with the investments in Morgan Stanley Institutional Liquidity Money Market Portfolio — Institutional Class during the period. As a result of such rebate, the expenses as a percentage of its net assets were effected by less than 0.005%.
++ Calculated based on the net asset value as of the last business day of the period.
| The accompanying notes are an integral part of the financial statements. | 213 |
2007 Annual Report | |
| |
December 31, 2007 | |
Financial Highlights
U.S. Real Estate Portfolio
| | Class A | |
| | Year Ended December 31, | |
Selected Per Share Data and Ratios | | 2007 | | 2006 | | 2005 | | 2004 | | 2003 | |
Net Asset Value, Beginning of Period | | $ 28.24 | | $ 23.41 | | $ 23.21 | | $ 17.92 | | $ 13.55 | |
Income (Loss) from Investment Operations | | | | | | | | | | | |
Net Investment Income (Loss)† | | 0.33 | | 0.42 | | 0.45 | | 0.40 | | 0.48 | |
Net Realized and Unrealized Gain (Loss) on Investments | | (4.87 | ) | 8.44 | | 3.58 | | 6.17 | | 4.55 | |
Total from Investment Operations | | (4.54 | ) | 8.86 | | 4.03 | | 6.57 | | 5.03 | |
Distributions from and/or in Excess of: | | | | | | | | | | | |
Net Investment Income | | (0.50 | ) | (0.49 | ) | (0.44 | ) | (0.42 | ) | (0.48 | ) |
Net Realized Gain | | (7.45 | ) | (3.54 | ) | (3.39 | ) | (0.86 | ) | (0.18 | ) |
Total Distributions | | (7.95 | ) | (4.03 | ) | (3.83 | ) | (1.28 | ) | (0.66 | ) |
Redemption Fees | | 0.00 | ‡ | 0.00 | ‡ | — | | — | | — | |
Net Asset Value, End of Period | | $ 15.75 | | $ 28.24 | | $ 23.41 | | $ 23.21 | | $ 17.92 | |
Total Return++ | | (16.63 | )% | 38.85 | % | 17.66 | % | 37.28 | % | 37.61 | % |
Ratios and Supplemental Data: | | | | | | | | | | | |
Net Assets, End of Period (Thousands) | | $911,819 | | $1,635,926 | | $1,209,668 | | $1,097,718 | | $897,551 | |
Ratio of Expenses to Average Net Assets (1) | | 0.90 | %+ | 0.87 | % | 0.89 | % | 0.97 | % | 1.00 | % |
Ratio of Expenses to Average Net Assets Excluding Bank Overdraft and Investment Related Expenses | | 0.88 | %+ | 0.87 | % | 0.89 | % | N/A | | N/A | |
Ratio of Net Investment Income (Loss) to Average Net Assets (1) | | 1.23 | %+ | 1.55 | % | 1.87 | % | 2.02 | % | 3.08 | % |
Portfolio Turnover Rate | | 38 | % | 36 | % | 33 | % | 21 | % | 17 | % |
(1) Supplemental Information on the Ratios to Average Net Assets: | | | | | | | | | | | |
Ratios before expense limitation: | | | | | | | | | | | |
Expenses to Average Net Assets | | N/A | | N/A | | N/A | | N/A | | 1.01 | % |
Net Investment Income (Loss) to Average Net Assets | | N/A | | N/A | | N/A | | N/A | | 3.07 | % |
† Per share amount is based on average shares outstanding.
‡ Amount is less than $0.005 per share.
+ Reflects rebate of certain Portfolio expenses in connection with the investments in Morgan Stanley Institutional Liquidity Money Market Portfolio — Institutional Class during the period. As a result of such rebate, the expenses as a percentage of its net assets were effected by less than 0.005%.
++ Calculated based on the net asset value as of the last business day of the period.
214 | The accompanying notes are an integral part of the financial statements. | |
| 2007 Annual Report |
|
December 31, 2007 |
Financial Highlights
U.S. Real Estate Portfolio
| | Class B | |
| | Year Ended December 31, | |
Selected Per Share Data and Ratios | | 2007 | | 2006 | | 2005 | | 2004 | | 2003 | |
Net Asset Value, Beginning of Period | | $ 27.96 | | $ 23.21 | | $ 23.04 | | $ 17.80 | | $ 13.47 | |
Income (Loss) from Investment Operations | | | | | | | | | | | |
Net Investment Income (Loss)† | | 0.27 | | 0.37 | | 0.38 | | 0.35 | | 0.45 | |
Net Realized and Unrealized Gain (Loss) on Investments | | (4.82 | ) | 8.34 | | 3.56 | | 6.13 | | 4.50 | |
Total from Investment Operations | | (4.55 | ) | 8.71 | | 3.94 | | 6.48 | | 4.95 | |
Distributions from and/or in Excess of: | | | | | | | | | | | |
Net Investment Income | | (0.43 | ) | (0.42 | ) | (0.38 | ) | (0.38 | ) | (0.44 | ) |
Net Realized Gain | | (7.45 | ) | (3.54 | ) | (3.39 | ) | (0.86 | ) | (0.18 | ) |
Total Distributions | | (7.88 | ) | (3.96 | ) | (3.77 | ) | (1.24 | ) | (0.62 | ) |
Redemption Fees | | 0.00 | ‡ | 0.00 | ‡ | — | | — | | — | |
Net Asset Value, End of Period | | $ 15.53 | | $ 27.96 | | $ 23.21 | | $ 23.04 | | $ 17.80 | |
Total Return++ | | (16.80 | )% | 38.52 | % | 17.37 | % | 36.95 | % | 37.23 | % |
Ratios and Supplemental Data: | | | | | | | | | | | |
Net Assets, End of Period (Thousands) | | $ 171,578 | | $ 268,537 | | $ 157,650 | | $ 149,180 | | $ 70,146 | |
Ratio of Expenses to Average Net Assets (2) | | 1.15 | %+ | 1.12 | % | 1.14 | % | 1.22 | % | 1.25 | % |
Ratio of Expenses to Average Net Assets Excluding Bank Overdraft and Investment Related Expenses | | 1.13 | %+ | 1.12 | % | 1.14 | % | N/A | | N/A | |
Ratio of Net Investment Income (Loss) to Average Net
Assets (2) | | 1.02 | %+ | 1.37 | % | 1.60 | % | 1.76 | % | 2.83 | % |
Portfolio Turnover Rate | | 38 | % | 36 | % | 33 | % | 21 | % | 17 | % |
(2) Supplemental Information on the Ratios to Average Net Assets: | | | | | | | | | | | |
Ratios before expense limitation: | | | | | | | | | | | |
Expenses to Average Net Assets | | N/A | | N/A | | N/A | | N/A | | 1.26 | % |
Net Investment Income (Loss) to Average Net Assets | | N/A | | N/A | | N/A | | N/A | | 2.82 | % |
† Per share amount is based on average shares outstanding.
‡ Amount is less than $0.005 per share.
+ Reflects rebate of certain Portfolio expenses in connection with the investments in Morgan Stanley Institutional Liquidity Money Market Portfolio — Institutional Class during the period. As a result of such rebate, the expenses as a percentage of its net assets were effected by less than 0.005%.
++ Calculated based on the net asset value as of the last business day of the period.
| The accompanying notes are an integral part of the financial statements. | 215 |
2007 Annual Report | |
| |
December 31, 2007 | |
Financial Highlights
U.S. Small/Mid Cap Value Portfolio
| | Class A |
| | Period from |
| | September 27, 2007^ |
Selected Per Share Data and Ratios | | to December 31, 2007 |
Net Asset Value, Beginning of Period | | $ | 10.00 | |
Income (Loss) from Investment Operations | | | |
Net Investment Income (Loss)† | | (0.00 | )‡ |
Net Realized and Unrealized Gain (Loss) on Investments | | (0.52 | ) |
Total from Investment Operations | | (0.52 | ) |
Distributions from and /or in Excess of: | | | |
Net Realized Gain | | (0.01 | ) |
Net Asset Value, End of Period | | $ | 9.47 | |
Total Return++ | | (5.21 | )%# |
Ratios and Supplemental Data: | | | |
Net Assets, End of Period (Thousands) | | $ | 20,112 | |
Ratio of Expenses to Average Net Assets (1) | | 1.30 | %*+ |
Ratio of Net Investment Income (Loss) to Average Net Assets (1) | | 0.09 | %*+ |
Portfolio Turnover Rate | | 38 | %# |
(1) Supplemental Information on the Ratios to Average Net Assets: | | | |
Ratios before expense limitation: | | | |
Expenses to Average Net Assets | | N/A | |
Net Investment Income (Loss) to Average Net Assets | | N/A | |
| | Class B |
| | Period from |
| | September 27, 2007^ |
Selected Per Share Data and Ratios | | to December 31, 2007 |
Net Asset Value, Beginning of Period | | $ | 10.00 | |
Income (Loss) from Investment Operations | | | |
Net Investment Income (Loss)† | | (0.00 | )‡ |
Net Realized and Unrealized Gain (Loss) on Investments | | (0.52 | ) |
Total from Investment Operations | | (0.52 | ) |
Distributions from and /or in Excess of: | | | |
Net Realized Gain | | (0.01 | ) |
Net Asset Value, End of Period | | $ | 9.47 | |
Total Return++ | | (5.31 | )%# |
Ratios and Supplemental Data: | | | |
Net Assets, End of Period (Thousands) | | $ | 95 | |
Ratio of Expenses to Average Net Assets (2) | | 1.55 | %*+ |
Ratio of Net Investment Income (Loss) to Average Net Assets (2) | | (0.16 | )%*+ |
Portfolio Turnover Rate | | 38 | %# |
(2) Supplemental Information on the Ratios to Average Net Assets: | | | |
Ratios before expense limitation: | | | |
Expenses to Average Net Assets | | N/A | |
Net Investment Income (Loss) to Average Net Assets | | N/A | |
^ Commencement of Operations
† Per share amount is based on average shares outstanding.
‡ Amount is less than $0.005 per share.
# Not Annualized
* Annualized
+ Reflects rebate of certain Portfolio expenses in connection with the investments in Morgan Stanley Institutional Liquidity Money Market Portfolio — Institutional Class during the period. As a result of such rebate, the expenses as a percentage of its net assets were effected by 0.01%.
++ Calculated based on the net asset value as of the last business day of the period.
216 | The accompanying notes are an integral part of the financial statements. | |
| 2007 Annual Report |
|
December 31, 2007 |
Financial Highlights
Emerging Markets Debt Portfolio
| | Class A†† | |
| | Year Ended December 31, | |
Selected Per Share Data and Ratios | | 2007 | | 2006 | | 2005 | | 2004 | | 2003 | |
Net Asset Value, Beginning of Period | | $ 11.99 | | $ 11.61 | | $ 10.92 | | $ 10.59 | | $ 8.85 | |
Income (Loss) from Investment Operations | | | | | | | | | | | |
Net Investment Income† | | 0.71 | | 0.49 | | 0.81 | | 0.78 | | 0.75 | |
Net Realized and Unrealized Gain (Loss) on Investments | | (0.23 | ) | 0.80 | | 0.57 | | 0.30 | | 1.77 | |
Total from Investment Operations | | 0.48 | | 1.29 | | 1.38 | | 1.08 | | 2.52 | |
Distributions from and/or in Excess of: | | | | | | | | | | | |
Net Investment Income | | (1.00 | ) | (0.91 | ) | (0.69 | ) | (0.75 | ) | (0.78 | ) |
Redemption Fees | | 0.00 | ‡ | 0.00 | ‡ | 0.00 | ‡ | 0.00 | ‡ | — | |
Net Asset Value, End of Period | | $ 11.47 | | $ 11.99 | | $ 11.61 | | $ 10.92 | | $ 10.59 | |
Total Return++ | | 4.68 | % | 11.08 | % | 12.78 | % | 10.07 | % | 28.46 | % |
Ratios and Supplemental Data: | | | | | | | | | | | |
Net Assets, End of Period (Thousands) | | $52,686 | | $81,212 | | $92,294 | | $81,109 | | $54,647 | |
Ratio of Expenses to Average Net Assets(1) | | 0.93 | %#+ | 0.93 | %# | 1.01 | % | 1.04 | %# | 1.16 | % |
Ratio of Expenses to Average Net Assets Excluding Bank Overdraft Expense and Country Tax Expense | | 0.85 | %+ | 0.92 | % | 1.00 | % | 1.04 | % | 1.13 | % |
Ratio of Net Investment Income to Average Net Assets(1) | | 6.28 | %+ | 6.11 | % | 7.02 | % | 7.33 | % | 7.48 | % |
Portfolio Turnover Rate | | 155 | % | 55 | % | 84 | % | 151 | % | 216 | % |
(1) Supplemental Information on the Ratios to Average Net Assets: | | | | | | | | | | | |
Ratios before expense limitation: | | | | | | | | | | | |
Expenses to Average Net Assets | | 1.21 | %+ | 1.04 | % | N/A | | 1.07 | % | N/A | |
Net Investment Income (Loss) to Average Net Assets | | 6.00 | %+ | 6.00 | % | N/A | | 7.30 | % | N/A | |
| | Class B†† | |
| | Year Ended December 31, | |
Selected Per Share Data and Ratios | | 2007 | | 2006 | | 2005 | | 2004 | | 2003 | |
Net Asset Value, Beginning of Period | | $ 12.29 | | $ 11.85 | | $ 11.16 | | $ 10.80 | | $ 9.00 | |
Income (Loss) from Investment Operations | | | | | | | | | | | |
Net Investment Income† | | 0.69 | | 0.50 | | 0.78 | | 0.78 | | 0.75 | |
Net Realized and Unrealized Gain (Loss) on Investments | | (0.23 | ) | 0.81 | | 0.60 | | 0.30 | | 1.80 | |
Total from Investment Operations | | 0.46 | | 1.31 | | 1.38 | | 1.08 | | 2.55 | |
Distributions from and/or in Excess of: | | | | | | | | | | | |
Net Investment Income | | (0.98 | ) | (0.87 | ) | (0.69 | ) | (0.72 | ) | (0.75 | ) |
Redemption Fees | | 0.00 | ‡ | 0.00 | ‡ | — | | — | | — | |
Net Asset Value, End of Period | | $ 11.77 | | $ 12.29 | | $ 11.85 | | $ 11.16 | | $ 10.80 | |
Total Return++ | | 4.29 | % | 10.79 | % | 12.54 | % | 9.90 | % | 28.34 | % |
Ratios and Supplemental Data: | | | | | | | | | | | |
Net Assets, End of Period (Thousands) | | $ 870 | | $ 565 | | $ 596 | | $ 437 | | $ 429 | |
Ratio of Expenses to Average Net Assets(2) | | 1.20 | %#+ | 1.17 | %# | 1.26 | % | 1.29 | %# | 1.41 | % |
Ratio of Expenses to Average Net Assets Excluding Bank Overdraft Expense and Country Tax Expense | | 1.10 | %+ | 1.16 | % | 1.25 | % | 1.29 | % | 1.38 | % |
Ratio of Net Investment Income to Average Net Assets(2) | | 5.99 | %+ | 5.94 | % | 6.70 | % | 7.07 | % | 7.23 | % |
Portfolio Turnover Rate | | 155 | % | 55 | % | 84 | % | 151 | % | 216 | % |
(2) Supplemental Information on the Ratios to Average Net Assets: | | | | | | | | | | | |
Ratios before expense limitation: | | | | | | | | | | | |
Expenses to Average Net Assets | | 1.49 | %+ | 1.29 | % | N/A | | 1.32 | % | N/A | |
Net Investment Income (Loss) to Average Net Assets | | 5.71 | %+ | 5.82 | % | N/A | | 7.04 | % | N/A | |
†† On March 17, 2006, the Portfolio effected a reverse stock split as described in the Notes to Financial Statements. Per share data prior to this date has been restated to give effect to the reverse stock split.
† Per share amount is based on average shares outstanding.
‡ Amount is less than $0.005 per share.
# Effective June 1, 2006, the Adviser has voluntarily agreed to limit the ratio of expenses to average net assets to the maximum ratio of 0.85% for Class A shares and 1.10% for Class B shares. Prior to June 1, 2006, these maximum ratios were 1.00% for Class A shares and 1.25% for Class B shares. Prior to May 1, 2004, these maximum ratios were 1.75% for Class A shares and 2.00% for Class B shares.
+ Reflects rebate of certain Portfolio expenses in connection with the investments in Morgan Stanley Institutional Liquidity Money Market Portfolio — Institutional Class during the period. As a result of such rebate, the expenses as a percentage of its net assets were effected by less than 0.005%.
++ Calculated based on the net asset value as of the last business day of the period.
| The accompanying notes are an integral part of the financial statements. | 217 |
2007 Annual Report | |
|
December 31, 2007 |
Notes to Financial Statements
Morgan Stanley Institutional Fund, Inc. (the “Fund”) is registered under the Investment Company Act of 1940, as amended (the “1940 Act”), as an open-end management investment company. The Fund is comprised of twenty-four separate, active, diversified and non-diversified portfolios (individually referred to as a “Portfolio”, collectively as the “Portfolios”). Each Portfolio (with the exception of the International Small Cap Portfolio) offers two classes of shares - Class A and Class B. Effective January 2, 2008, Class A shares and Class B shares of the Portfolios will be changed to Class I shares and Class P shares, respectively. Both classes of shares have identical voting rights (except that shareholders of a Class have exclusive voting rights regarding any matter relating solely to that Class of shares), dividend, liquidation and other rights. Effective May 31, 2007, the Systematic Large Cap Core Active Extension and Disciplined Large Cap Value Active Extension Portfolios commenced operations. Effective July 31, 2007, the International Growth Active Extension Portfolio commenced operations. Effective September 27, 2007, the U.S. Small/Mid Cap Value Portfolio commenced operations.
For detailed descriptions of the investment objectives of each of the Portfolios and other related information, please refer to the Prospectuses of the Fund. Generally, the investment objective of the domestic and international equity portfolios is to seek capital appreciation by investing in equity and equity- related securities. The investment objective of the international fixed income portfolio is primarily to seek a high total return consistent with preservation of capital.
The Global Franchise, International Equity, International Real Estate, International Small Cap and U.S. Real Estate Portfolios are currently closed to new investors. However, these Portfolios will continue to offer shares as follows: (1) through certain retirement plan accounts, (2) to clients of registered investment advisors who currently offer shares of the Portfolios in their discretionary asset allocation programs, (3) through certain endowments and foundations, (4) to clients of family office practices where shares of the Portfolios are held by family members of such clients, (5) to directors and trustees of the Morgan Stanley Funds, (6) to Morgan Stanley and its affiliates and their employees, (7) to benefit plans sponsored by Morgan Stanley and its affiliates, and (8) through certain mutual fund wrap programs sponsored by affiliates of the Adviser. The Portfolios will continue to offer shares of the Portfolios to existing shareholders and may recommence offering shares of the Portfolios to other new investors in the future.
The Fund has suspended offering shares of the Small Company Growth Portfolio to new investors. The Fund will continue to offer shares of the Portfolio to existing shareholders. The Fund may recommence offering shares of the Portfolio to new investors in the future.
On April 28, 2006, the net assets of the Equity Portfolio’s (formerly, a Portfolio of Morgan Stanley Institutional Fund Trust) Institutional Class shares were merged into the Large Cap Relative Value Portfolio’s Class A shares through a tax-free exchange. In exchange for the $66,823,000 in net assets received, including $3,685,000 in unrealized appreciation, 5,706,469 Class A shares of the Large Cap Relative Value Portfolio were issued. Prior to the combination, the net assets of the Large Cap Relative Value Portfolio totaled $194,284,000. Immediately after the combination, the net assets of the Large Cap Relative Value Portfolio totaled $261,107,000.
A. Accounting Policies: The following significant accounting policies are in conformity with U.S. generally accepted accounting principles. Such policies are consistently followed by the Fund in the preparation of the financial statements. U.S. generally accepted accounting principles may require management to make estimates and assumptions that affect the reported amounts and disclosures in the financial statements. Actual results may differ from those estimates.
1. Security Valuation: Securities listed on a foreign exchange are valued at their closing price. Unlisted securities and listed securities not traded on the valuation date for which market quotations are readily available are valued at the mean between the current bid and asked prices obtained from reputable brokers. Equity securities listed on a U.S. exchange are valued at the latest quoted sales price on the valuation date. Equity securities listed or traded on NASDAQ, for which market quotations are available, are valued at the NASDAQ Official Closing Price. Bonds and other fixed income securities may be valued according to the broadest and most representative market. In addition, bonds and other fixed income securities may be valued on the basis of prices provided by a pricing service. The prices provided by a pricing service take into account broker dealer market price quotations for institutional size trading in similar groups of securities, security quality, maturity, coupon and other security characteristics as well as any developments related to the specific securities. Debt securities purchased with remaining maturities of 60 days or less are valued at amortized cost, if it approximates value.
All other securities and investments for which market values are not readily available, including restricted securities, and those securities for which it is inappropriate to determine prices in accordance with the aforementioned procedures, are valued at fair value as determined in good faith under procedures adopted by the Board of Directors,
218
| 2007 Annual Report |
|
December 31, 2007 |
Notes to Financial Statements (cont’d)
although the actual calculations may be done by others. Factors considered in making this determination may include, but are not limited to, information obtained by contacting the issuer, analysts, or the appropriate stock exchange (for exchange-traded securities), analysis of the issuer’s financial statements or other available documents and, if necessary, available information concerning other securities in similar circumstances.
Most foreign markets close before the New York Stock Exchange (NYSE). Occasionally, developments that could affect the closing prices of securities and other assets may occur between the times at which valuations of such securities are determined (that is, close of the foreign market on which the securities trade) and the close of business on the NYSE. If these developments are expected to materially affect the value of the securities, the valuations may be adjusted to reflect the estimated fair value as of the close of the NYSE, as determined in good faith under procedures established by the Board of Directors.
2. Repurchase Agreements: The Portfolios may enter into repurchase agreements under which a Portfolio lends excess cash and takes possession of securities with an agreement that the counterparty will repurchase such securities. In connection with transactions in repurchase agreements, a bank as custodian for the Fund takes possession of the underlying securities which are held as collateral, with a market value at least equal to the amount of the repurchase transaction, including principal and accrued interest. To the extent that any repurchase transaction exceeds one business day, the value of the collateral is marked-to-market on a daily basis to determine the adequacy of the collateral. In the event of default on the obligation to repurchase, the Fund has the right to liquidate the collateral and apply the proceeds in satisfaction of the obligation. In the event of default or bankruptcy by the counterparty to the agreement, realization and/or retention of the collateral or proceeds may be subject to legal proceedings. The Portfolios, along with other affiliated investment companies, may utilize a joint trading account for the purpose of entering into repurchase agreements.
At December 31, 2007, the Portfolios did not have any outstanding repurchase agreements.
3. Foreign Currency Translation and Foreign Investments: The books and records of the Fund are maintained in U.S. dollars. Foreign currency amounts are translated into U.S. dollars at the mean of the bid and asked prices of such currencies against U.S. dollars last quoted by a major bank, prior to the close of the NYSE, as follows:
· investments, other assets and liabilities-at the prevailing rates of exchange on the valuation date;
· investment transactions, investment income and expenses-at the prevailing rates of exchange on the dates of such transactions.
Although the net assets of the Fund are presented at the foreign exchange rates and market values at the close of the period, the Fund does not isolate that portion of the results of operations arising as a result of changes in the foreign exchange rates from the fluctuations arising from changes in the market prices of the securities held at period end. Similarly, the Fund does not isolate the effect of changes in foreign exchange rates from the fluctuations arising from changes in the market prices of securities sold during the period. Accordingly, realized and unrealized foreign currency gains (losses) on investments in securities are included in the reported net realized and unrealized gains (losses) on investment transactions and balances. However, pursuant to U.S. Federal income tax regulations, gains and losses from certain foreign currency transactions and the foreign currency portion of gains and losses realized on sales and maturities of foreign denominated debt securities are treated as ordinary income for U.S. Federal income tax purposes.
Net realized gains (losses) on foreign currency transactions represent net foreign exchange gains (losses) from foreign currency exchange contracts, disposition of foreign currencies, currency gains or losses realized between the trade and settlement dates on securities transactions, and the difference between the amount of investment income and foreign taxes recorded on the Fund’s books and the U.S. dollar equivalent amounts actually received or paid. Net unrealized currency gains (losses) from valuing foreign currency denominated assets and liabilities at period end exchange rates are reflected as a component of unrealized appreciation (depreciation) on the Statements of Assets and Liabilities. The change in net unrealized currency gains (losses) for the period is reflected on the Statements of Operations.
Foreign security and currency transactions may involve certain considerations and risks not typically associated with those of U.S. dollar denominated transactions as a result of, among other factors, fluctuations of exchange rates in relation to the U.S. dollar, the possibility of lower levels of government supervision and regulation of foreign securities markets and the possibility of political or economic instability.
219
2007 Annual Report | |
|
December 31, 2007 |
Notes to Financial Statements (cont’d)
Governmental approval for foreign investments may be required in advance of making an investment under certain circumstances in some countries, and the extent of foreign investments in domestic companies may be subject to limitation in other countries. Foreign ownership limitations also may be imposed by the charters of individual companies to prevent, among other concerns, violations of foreign investment limitations. As a result, an additional class of shares (identified as “Foreign” in the Portfolio of Investments) may be created and offered for investment. The “local” and “foreign shares” market values may differ. In the absence of trading of the foreign shares in such markets, the Fund values the foreign shares at the closing exchange price of the local shares. Such securities, if any, are identified as fair valued on the Portfolio of Investments.
4. Foreign Currency Exchange Contracts: Certain Portfolios may enter into foreign currency exchange contracts generally to attempt to protect securities and related receivables and payables against changes in future foreign currency exchange rates and, in certain situations, to gain exposure to foreign currencies. Certain Portfolios may also enter into cross currency hedges which involve the sale of one currency against the positive exposure to a different currency. Cross currency hedges may be used for hedging purposes or to establish an active exposure to the exchange rate between any two currencies. A foreign currency exchange contract is an agreement between two parties to buy or sell currency at a set price on a future date. The market value of the contract will fluctuate with changes in currency exchange rates. The contract is marked-to-market daily and the change in market value is recorded by the Portfolios as unrealized gain or loss. The Portfolios record realized gains or losses when the contract is closed equal to the difference between the value of the contract at the time it was opened and the value at the time it was closed. Credit risk may arise upon entering into these contracts from the potential inability of counterparts to meet the terms of their contracts and is generally limited to the amount of the unrealized gains on the contracts, if any, at the date of default. Risks may also arise from unanticipated movements in the value of a foreign currency relative to the U.S. dollar.
5. Loan Agreements: Certain Portfolios may invest in fixed and floating rate loans (“Loans”) arranged through private negotiations between an issuer of sovereign debt obligations and one or more financial institutions (“Lenders”) deemed to be creditworthy by the investment adviser. A Portfolio’s investments in Loans may be in the form of participation in Loans (“Participation”) or assignments of all or a portion of Loans (“Assignments”) from third parties. A Portfolio’s investment in a Participation typically results in the Portfolio having a contractual relationship with only the Lender and not with the borrower. The Portfolios have the right to receive payments of principal, interest and any fees to which it is entitled only upon receipt by the Lender of the payments from the borrower. The Portfolios generally have no right to enforce compliance by the borrower under the terms of the loan agreement. As a result, the Portfolio may be subject to the credit risk of both the borrower and the Lender that is selling the Participation and any intermediaries between the Lender and the Portfolio. When a Portfolio purchases Assignments from Lenders, it typically acquires direct rights against the borrower on the Loan. Because Assignments are arranged through private negotiations between potential assignees and potential assignors, the rights and obligations acquired by the Portfolio as the purchaser of an Assignment may differ from, and be more limited than, those held by the assigning Lender.
6. Short Sales: Certain Portfolios may sell securities short. A short sale is a transaction in which a Portfolio sells securities it may or may not own, but has borrowed, in anticipation of a decline in the market price of the securities. The Portfolio is obligated to replace the borrowed securities at the market price at the time of replacement. The Portfolio may have to pay a premium to borrow the securities as well as pay any dividends or interest payable on the securities until they are replaced. Dividends and interest payable on such securities sold short are included in dividend expense and interest expense, respectively, in the Statements of Operations. A Portfolio’s obligation to replace the securities borrowed in connection with a short sale will generally be secured by collateral deposited with the broker that consists of cash or other liquid securities. In addition, the Portfolio will either designate on the Portfolio’s records or place in a segregated account with its Custodian an amount of cash, U.S. government securities or other liquid high grade debt obligations equal to the difference, if any, between (1) the market value of the securities sold at the time they were sold short and (2) cash, U.S. government securities or other liquid high grade debt obligations deposited as collateral with the broker in connection with the short sale. Short sales by the Portfolios involve certain risks and special considerations. Possible losses from short sales differ from losses that could be incurred from the purchase of a security, because losses from short sales may be unlimited, whereas losses from purchases cannot exceed the total amount invested.
220
| 2007 Annual Report |
|
December 31, 2007 |
Notes to Financial Statements (cont’d)
7. Securities Lending: Certain Portfolios may lend securities to qualified financial institutions, such as broker- dealers, to earn additional income. Any increase or decrease in the fair value of the securities loaned that might occur and any interest earned or dividends declared on those securities during the term of the loan would remain in the Portfolio. Portfolios that lend securities receive cash or securities as collateral in an amount equal to or exceeding 100% of the current fair value of the loaned securities. The collateral is marked to market daily, by the securities lending agent, to ensure that a minimum of 100% collateral coverage is maintained.
Based on pre-established guidelines, the securities lending agent invests any cash collateral that is received in high- quality short-term investments. Securities lending income is generated from the earnings on the invested collateral and borrowing fees, less any rebates owed to the borrowers and compensation to the lending agent, and is included in the Portfolios’ Statements of Operations in interest income. Risks in securities lending transactions are that a borrower may not provide additional collateral when required or return the securities when due, and that the value of the short-term investments will be less than the amount of cash collateral plus any rebate that is required to be returned to the borrower.
The value of loaned securities and related collateral outstanding at December 31, 2007 are as follows:
Portfolio | | Value of
Loaned
Securities
(000) | | Value of
Collateral
(000) | |
Active International Allocation | | $101,774 | | $ 106,330 | |
Emerging Markets | | 252,057 | | 263,443 | |
Global Real Estate | | 2,594 | | 2,631 | |
Global Value Equity | | 4,408 | | 4,604 | |
International Equity | | 448,800 | | 468,328 | |
International Growth Equity | | 580 | | 610 | |
International Magnum | | 15,270 | | 15,980 | |
Systematic Active Large Cap Core | | 724 | | 743 | |
Systematic Active Small Cap Core | | 1,826 | | 1,919 | |
Systematic Active Small Cap Growth | | 1,898 | | 1,974 | |
Systematic Active Small Cap Value | | 1,802 | | 1,911 | |
U.S. Real Estate | | 153,417 | | 155,964 | |
Emerging Markets Debt | | 4,055 | | 4,191 | |
The following Portfolios had income from securities lending (after rebates to borrowers and fee paid to securities lending agent):
Portfolio | | Net Interest
Earned by
Portfolio
(000) | |
Active International Allocation | | $ | 1,172 | |
Emerging Markets | | 972 | |
Global Real Estate | | @— | |
Global Value Equity | | $ | 52 | |
International Equity | | 7,024 | |
International Growth Equity | | 1 | |
International Magnum | | 124 | |
Systematic Active Large Cap Core | | 2 | |
Systematic Active Small Cap Core | | 11 | |
Systematic Active Small Cap Growth | | 12 | |
Systematic Active Small Cap Value | | 12 | |
U.S. Real Estate | | 1 | |
Emerging Markets Debt | | 31 | |
@ Amount is less than $500. | | | |
8. Structured Securities: The Emerging Markets Debt Portfolio may invest in interests in entities organized and operated solely for the purpose of restructuring the investment characteristics of sovereign debt obligations. This type of restructuring involves the deposit with or purchase by an entity of specified instruments and the issuance by that entity of one or more classes of securities (“Structured Securities”) backed by, or representing interests in, the underlying instruments. Structured Securities generally will expose the Portfolio to credit risks of the underlying instruments as well as of the issuer of the structured security. Structured securities are typically sold in private placement transactions with no active trading market. Investments in Structured Securities may be more volatile than their underlying instruments; however, any loss is limited to the amount of the original investment.
9. �� Futures: Certain Portfolios may purchase and sell futures contracts. Futures contracts provide for the sale by one party and purchase by another party of a specified amount of a specified security, index, instrument or basket of instruments. Futures contracts (secured by cash, government securities or other high grade liquid investments deposited with brokers or custodians as “initial margin”) are valued based upon their quoted daily settlement prices; changes in initial settlement value (represented by cash paid to or received from brokers as “variation margin”) are accounted for as unrealized appreciation (depreciation). When futures contracts are closed, the difference between the opening value at the date the contract was entered into and the value at closing is recorded as a realized gain or loss in the Statements of Operations. Due from (to) broker includes both initial margin and variation margin, as stated in the Statements of Assets and Liabilities.
Certain Portfolios may use futures contracts in order to manage their exposure to the stock and bond markets, to hedge against unfavorable changes in the value of securities or to remain fully invested and to reduce transaction costs. Futures contracts involve market risk in excess of
221
2007 Annual Report | |
|
December 31, 2007 |
Notes to Financial Statements (cont’d)
the amounts recognized in the Statements of Assets and Liabilities. Risks arise from the possible movements in security values underlying these instruments. The change in value of futures contracts primarily corresponds with the value of their underlying instruments, which may not correlate with the change in value of hedged investments.
10. Purchased and Written Options: Certain Portfolios may write covered call and put options on portfolio securities and other financial instruments. Premiums are received and are recorded as liabilities. The liabilities are subsequently adjusted to reflect the current value of the options written. Premiums received from writing options which expire are treated as realized gains. Premiums received from writing options which are exercised or are closed are added to or offset against the proceeds or amount paid on the transaction to determine the net realized gain or loss. By writing a covered call option, a Portfolio, in exchange for the premium, foregoes the opportunity for capital appreciation above the exercise price should the market price of the underlying security increase. By writing a put option, a Portfolio, in exchange for the premium, accepts the risk of having to purchase a security at an exercise price that is above the current market price.
Certain Portfolios may purchase call and put options on their portfolio securities or other financial instruments. Each Portfolio may purchase call options to protect against an increase in the price of the security or financial instrument it anticipates purchasing. Each Portfolio may purchase put options on securities which it holds or other financial instruments to protect against a decline in the value of the security or financial instrument or to close out covered written put positions. Risks may arise from an imperfect correlation between the change in market value of the securities held by the Portfolio and the prices of options relating to the securities purchased or sold by the Portfolio and from the possible lack of a liquid secondary market for an option. The maximum exposure to loss for any purchased option is limited to the premium initially paid for the option.
Options written for the year ended December 31, 2007 were as follows:
Emerging Markets Debt Portfolio | | Total
Number of
Contracts
(000) | | Total
Premiums
Received
(000) |
Options Outstanding — January 1, 2007 | | — | | $ — |
Options Written | | 24,293 | | 609 |
Options Terminated in Closing Purchase
Transactions | | (24,293) | | (609) |
Options Outstanding — December 31, 2007 | | — | | $ — |
11. Unfunded Commitments: Subject to the terms of a Subscription Agreement between the U.S. Real Estate Portfolio and BRCP REIT I, LLC the Portfolio has made a subscription commitment of 7,000,000 for which it will receive 7,000,000 shares of common stock. As of December 31, 2007, BRCP REIT I, LLC has drawn down $5,934,000, which represents 84.8% of the commitment. In addition, the Portfolio received return of capital distributions totaling $1,114,000.
Subject to the terms of a Subscription Agreement between the U.S. Real Estate Portfolio and BRCP REIT II, LLC the Portfolio has made a subscription commitment of $9,000,000 for which it will receive 9,000,000 shares of common stock. As of December 31, 2007, BRCP REIT II, LLC has drawn down $5,586,000, which represents 62.1% of the commitment.
Subject to the terms of a Subscription Agreement between the Global Real Estate Portfolio and Exeter Industrial Value Fund LP the Portfolio has made a subscription commitment of $2,000,000 for which it will receive 2,000,000 shares of common stock. As of December 31, 2007, Exeter Industrial Value Fund LP has drawn down $200,000, which represents 10.0% of the commitment.
Subject to the terms of a Subscription Agreement between the U.S. Real Estate Portfolio and Exeter Industrial Value Fund LP the Portfolio has made a subscription commitment of $8,500,000 for which it will receive 8,500,000 shares of common stock. As of December 31, 2007, Exeter Industrial Value Fund LP has drawn down $850,000, which represents 10.0% of the commitment.
Subject to the terms of a Subscription Agreement between the U.S. Real Estate Portfolio and Keystone Industrial Fund, LP, the Portfolio has made a subscription commitment of $7,500,000 for which it will receive 7,500,000 shares of common stock. As of December 31, 2007, Keystone Industrial Fund, LP has drawn down $5,703,000, which represents 76.0% of the commitment. In addition, the Portfolio received return of capital distributions totaling $297,000.
Subject to the terms of a Subscription Agreement between the Global Real Estate Portfolio and Keystone Industrial Fund II, LP, the Portfolio has made a subscription commitment of $5,000,000 for which it will receive 5,000,000 shares of common stock. As of December 31, 2007, Keystone Industrial Fund II, LP has not drawn down on the commitment.
Subject to the terms of a Subscription Agreement between the U.S. Real Estate Portfolio and Keystone
222
| 2007 Annual Report |
|
December 31, 2007 |
Notes to Financial Statements (cont’d)
Industrial Fund II, LP, the Portfolio has made a subscription commitment of $10,000,000 for which it will receive 10,000,000 shares of common stock. As of December 31, 2007, Keystone Industrial Fund II, LP has not drawn down on the commitment.
Subject to the terms of a Subscription Agreement between the U.S. Real Estate Portfolio and Cabot Industrial Value Fund, LP, the Portfolio has made a subscription commitment of $7,500,000 for which it will receive 15,000 shares of common stock. As of December 31, 2007, Cabot Industrial Value Fund, LP has drawn down $3,334,000, which represents 44.4% of the commitment.
12. Redemption Fees: The following redemption fees are designed to protect each Portfolio and its shareholders from the effects of short-term trading. Shares of the Active International Allocation, Emerging Markets, Global Franchise, Global Real Estate, Global Value Equity, International Equity, International Growth Active Extension, International Growth Equity, International Magnum, International Real Estate, International Small Cap, Large Cap Relative Value, Small Company Growth, Systematic Active Small Cap Core, Systematic Active Small Cap Growth, Systematic Active Small Cap Value, U.S. Real Estate and Emerging Markets Debt Portfolios redeemed within 30 days of purchase may be subject to a 2% redemption fee. Shares of the Disciplined Large Cap Value Active Extension, Focus Equity, Systematic Active Large Cap Core, Systematic Large Cap Core Active Extension, U.S. Large Cap Growth and U.S. Small/Mid Cap Value Portfolios redeemed within 7 days of purchase may be subject to a 2% redemption fee. These fees, if any, are included on the Statements of Changes in Net Assets.
13. Restricted Securities: Certain Portfolios may invest in unregistered or otherwise restricted securities. The term restricted securities refers to securities that are unregistered or are held by control persons of the issuer and securities that are subject to contractual restrictions on their resale. As a result, restricted securities may be more difficult to value and the Portfolio may have difficulty disposing of such assets either in a timely manner or for a reasonable price. In order to dispose of an unregistered security, the Portfolio, where it has contractual rights to do so, may have to cause such security to be registered. A considerable period may elapse between the time the decision is made to sell the security and the time the security is registered so that the Portfolio could sell it. Contractual restrictions on the resale of securities vary in length and scope and are generally the result of a negotiation between the issuer and acquiror of the securities. The Portfolio would, in either case, bear market risks during that period.
14. New Accounting Pronouncement: In September 2006, Statement of Financial Accounting Standards No. 157, Fair Value Measurements (“SFAS 157”), was issued and is effective for fiscal years beginning after November 15, 2007. SFAS 157 defines fair value, establishes a framework for measuring fair value and expands disclosures about fair value measurements. As of December 31, 2007, the Adviser does not believe the adoption of SFAS 157 will impact the amounts reported in the financial statements, however, additional disclosures will be required about the inputs used to develop the measurements of fair value and the effect of certain measurements reported in the Statement of Operations for a fiscal period.
15. Other: Security transactions are accounted for on the date the securities are purchased or sold. Realized gains and losses on the sale of investment securities are determined on the specific identified cost basis. Dividend income and distributions are recorded on the ex-dividend date (except for certain foreign dividends which may be recorded as soon as the Fund is informed of such dividends) net of applicable withholding taxes. Interest income is recognized on the accrual basis except where collection is in doubt. Discounts and premiums on securities purchased are amortized according to the effective yield method over their respective lives. Most expenses of the Fund can be directly attributed to a particular Portfolio. Expenses which cannot be directly attributed are apportioned among the Portfolios based upon relative net assets or other appropriate measures. Income, expenses (other than class specific expenses) and realized and unrealized gains or losses are allocated to each class of shares based upon their relative net assets.
Certain Portfolios may own shares of real estate investment trusts (“REITs”) which report information on the source of their distributions annually. A portion of distributions received from REITs during the year is estimated to be a return of capital and is recorded as a reduction of their cost.
B. Investment Advisory Fees: Morgan Stanley Investment Management Inc. (the “Adviser” or “MS Investment Management”), a wholly-owned subsidiary of Morgan Stanley, provides the Fund with investment advisory services under the terms of an Investment Advisory Agreement (the “Agreement”) at the annual rates of the average daily net assets indicated below. MS Investment Management has voluntarily agreed to waive fees payable to it and to reimburse the Portfolios for certain expenses, after giving effect to custody fee offsets, if necessary, if the total annual operating expenses, excluding bank overdraft, certain foreign taxes and extraordinary expenses as
223
2007 Annual Report | |
|
December 31, 2007 |
Notes to Financial Statements (cont’d)
defined, expressed as a percentage of average daily net assets, exceed the maximum ratios indicated as follows:
| | | | | | Maximum | |
| | | | | | Expense Ratio | |
| | Average Daily | | Advisory | | | | | |
Portfolio | | Net Assets | | Fee | | Class A | | Class B | |
Active International Allocation | | | first $1.0 billion | | 0.65 | % | | 0.80 | % | | 1.05 | % | |
| | | over $1.0 billion | | 0.60 | | | | | | | | |
Emerging Markets | | | first $500 million | | 1.25 | | | 1.65 | | | 1.90 | | |
| | | next $500 million | | 1.20 | | | | | | | | |
| | | next $1.5 billion | | 1.15 | | | | | | | | |
| | | over $2.5 billion | | 1.00 | | | | | | | | |
Global Franchise | | | first $500 million | | 0.80 | | | 1.00 | | | 1.25 | | |
| | | next $500 million | | 0.75 | | | | | | | | |
| | | over $1.0 billion | | 0.70 | | | | | | | | |
Global Real Estate | | | | | 0.85 | | | 1.05 | | | 1.30 | | |
Global Value Equity | | | first $1.0 billion | | 0.67 | | | 1.00 | | | 1.25 | | |
| | | next $500 million | | 0.645 | | | | | | | | |
| | | next $1.0 billion | | 0.62 | | | | | | | | |
| | | next $1.0 billion | | 0.595 | | | | | | | | |
| | | next $1.0 billion | | 0.57 | | | | | | | | |
| | | over $4.5 billion | | 0.545 | | | | | | | | |
International Equity | | | first $10 billion | | 0.80 | | | 1.00 | | | 1.25 | | |
| | | over $10 billion | | 0.75 | | | | | | | | |
International Growth Active Extension | | | first $1.0 billion | | 1.15 | | | 1.25 | | | 1.50 | | |
| | | next $500 million | | 1.05 | | | | | | | | |
| | | over $1.5 billion | | 0.95 | | | | | | | | |
International Growth Equity | | | first $1.0 billion | | 0.75 | | | 1.00 | | | 1.25 | | |
| | | over $1.0 billion | | 0.70 | | | | | | | | |
International Magnum | | | first $500 million | | 0.80 | | | 1.00 | | | 1.25 | | |
| | | next $500 million | | 0.75 | | | | | | | | |
| | | over $1.0 billion | | 0.70 | | | | | | | | |
International Real Estate | | | | | 0.80 | | | 1.00 | | | 1.25 | | |
International Small Cap | | | first $1.5 billion | | 0.95 | | | 1.15 | | | N/A | | |
| | | over $1.5 billion | | 0.90 | | | | | | | | |
Disciplined Large Cap Value Active Extension | | | first $1.0 billion | | 1.15 | | | 1.35 | | | 1.60 | | |
| | | next $500 million | | 1.05 | | | | | | | | |
| | | over $1.5 billion | | 0.95 | | | | | | | | |
Focus Equity | | | first $1.0 billion | | 0.50 | | | 1.00 | | | 1.25 | | |
| | | next $1.0 billion | | 0.45 | | | | | | | | |
| | | next $1.0 billion | | 0.40 | | | | | | | | |
| | | over $3.0 billion | | 0.35 | | | | | | | | |
Large Cap Relative Value | | | first $150 million | | 0.50 | | | 0.70 | | | 0.95 | | |
| | | next $100 million | | 0.45 | | | | | | | | |
| | | next $100 million | | 0.40 | | | | | | | | |
| | | over $350 million | | 0.35 | | | | | | | | |
Small Company Growth | | | first $1.0 billion | | 0.92 | | | 1.10 | | | 1.35 | | |
| | | next $500 million | | 0.85 | | | | | | | | |
| | | over $1.5 billion | | 0.80 | | | | | | | | |
Systematic Active Large Cap Core | | | | | 0.35 | | | 0.60 | | | 0.85 | | |
Systematic Active Small Cap Core | | | | | 0.75 | | | 1.10 | | | 1.35 | | |
Systematic Active Small Cap Growth | | | | | 0.75 | | | 1.10 | | | 1.35 | | |
Systematic Active Small Cap Value | | | | | 0.75 | | | 1.10 | | | 1.35 | | |
Systematic Large Cap Core Active Extension | | | first $1.0 billion | | 1.15 | | | 1.35 | | | 1.60 | | |
| | | next $500 million | | 1.05 | | | | | | | | |
| | | over $1.5 billion | | 0.95 | | | | | | | | |
U.S. Large Cap Growth | | | first $1.0 billion | | 0.50 | % | | 0.80 | % | | 1.05 | % | |
| | | next $1.0 billion | | 0.45 | | | | | | | | |
| | | next $1.0 billion | | 0.40 | | | | | | | | |
| | | over $3.0 billion | | 0.35 | | | | | | | | |
U.S. Real Estate | | | first $500 million | | 0.80 | | | 1.00 | | | 1.25 | | |
| | | next $500 million | | 0.75 | | | | | | | | |
| | | over $1.0 billion | | 0.70 | | | | | | | | |
U.S. Small/Mid Cap Value | | | | | 0.67 | | | N/A | | | N/A | | |
Emerging Markets Debt | | | first $500 million | | 0.75 | | | 0.85 | | | 1.10 | | |
| | | next $500 million | | 0.70 | | | | | | | | |
| | | over $1.0 billion | | 0.65 | | | | | | | | |
Fee waivers and/or expense reimbursements are voluntary and may be commenced or terminated at any time. For the year ended December 31, 2007, the Portfolios had advisory fees waived and/or certain expenses reimbursed as follows:
Portfolio | | Advisory Fees
Waived and/or
Reimbursed
(000) | |
Active International Allocation | | $ 42 | |
International Growth Active Extension | | 104 | |
International Growth Equity | | 115 | |
International Magnum | | 42 | |
Disciplined Large Cap Value Active Extension | | 50 | |
Focus Equity | | 19 | |
Systematic Active Large Cap Core | | 42 | |
Systematic Active Small Cap Core | | 43 | |
Systematic Active Small Cap Growth | | 42 | |
Systematic Active Small Cap Value | | 44 | |
Systematic Large Cap Core Active Extension | | 48 | |
Emerging Markets Debt | | 148 | |
The Adviser has entered into Sub-Advisory Agreements with Morgan Stanley Investment Advisors Inc., Morgan Stanley Investment Management Limited, Morgan Stanley Asset & Investment Trust Management Co., Limited and Morgan Stanley Investment Management Company (each a “Sub- Adviser”), all wholly-owned subsidiaries of Morgan Stanley. The Sub-Advisers, subject to the control and supervision of the Fund, its officers, Directors and the Adviser, and in accordance with the investment objectives, policies and restrictions of the Portfolios, make certain day-to-day investment decisions for certain Portfolios and place certain of the Portfolios’ purchase and sales orders. The Adviser pays the Sub-Advisers on a monthly basis a portion of the net advisory fees the Adviser receives from the Portfolios which receive these services.
C. Administration Fees: MS Investment Management (the “Administrator”) also provides the Fund with administrative services pursuant to an administration agreement for a monthly fee, which on an annual basis equals 0.08% of the average daily net assets of each Portfolio. Under an agreement between the Administrator and JPMorgan Investor Services
224
| 2007 Annual Report |
|
December 31, 2007 |
Notes to Financial Statements (cont’d)
Co. (“JPMIS”), a corporate affiliate of JPMorgan Chase Bank, N.A., JPMIS provides certain administrative services to the Fund. For such services, the Administrator pays JPMIS a portion of the fee the Administrator receives from the Fund. Administration costs (including out-of-pocket expenses) incurred in the ordinary course of providing services under the administration agreement, except pricing services and extraordinary expenses, are covered under the administration fee. In addition, the Fund incurs local administration fees in connection with doing business in certain emerging market countries.
D. Shareholder Servicing Fees: Morgan Stanley Distribution, Inc. (“MSDI” or the “Distributor”), a wholly-owned subsidiary of the Adviser, serves as the Distributor of the Fund. Effective July 2, 2007, each Portfolio pays the Distributor a shareholder servicing fee, accrued daily and paid monthly, at an annual rate of 0.25% of the Portfolio’s average daily net assets attributable to Class B shares pursuant to a Shareholder Services Plan. The shareholder servicing fee is used to support the expenses associated with servicing and maintaining accounts. The Distributor may compensate other parties for providing shareholder support services to investors who purchase Class B shares.
Prior to July 1, 2007, MSDI served as the Distributor of the Fund and provided Class B shareholders of the applicable Portfolios with distribution services pursuant to a Distribution Plan in accordance with Rule 12b-1 under the 1940 Act. The Distribution Plan was terminated effective July 2, 2007.
E. Custodian Fees: JPMorgan Chase Bank, N.A. (the “Custodian”) serves as Custodian for the Fund in accordance with a custodian agreement. The Custodian holds cash, securities, and other assets of the Fund as required by the 1940 Act. The Fund has entered into an arrangement with its Custodian whereby credits realized on uninvested cash balances were used to offset a portion of each applicable Portfolio’s expenses. These custodian credits are shown as “Expense Offset” on the Statements of Operations.
F. Portfolio Investment Activity:
1. | Security Transactions: During the year ended December 31, 2007, purchases and sales of investment securities, other than long-term U.S. Government securities and short-term investments, were: |
Portfolio | | Purchases
(000) | | Sales
(000) |
Active International Allocation | | $ | 271,496 | | $ | 274,022 |
Emerging Markets | | 2,981,821 | | 2,890,586 |
Global Franchise | | 28,555 | | 51,885 |
Global Real Estate | | 643,394 | | 167,902 |
Global Value Equity | | 31,262 | | 73,735 |
International Equity | | 2,094,983 | | 3,446,257 |
International Growth Active Extension | | 15,735 | | 2,663 |
International Growth Equity | | 17,277 | | 2,847 |
International Magnum | | 47,796 | | 52,996 |
International Real Estate | | 1,168,131 | | 819,647 |
International Small Cap | | 633,540 | | 1,115,406 |
Disciplined Large Cap Value Active Extension | | 16,135 | | 3,393 |
Focus Equity | | 8,167 | | 10,363 |
Large Cap Relative Value | | 105,513 | | 89,503 |
Small Company Growth | | 942,602 | | 1,030,461 |
Systematic Active Large Cap Core | | 3,914 | | 3,918 |
Systematic Active Small Cap Core | | 3,692 | | 4,343 |
Systematic Active Small Cap Growth | | 3,674 | | 4,529 |
Systematic Active Small Cap Value | | 3,066 | | 3,659 |
Systematic Large Cap Core Active Extension | | 16,131 | | 3,106 |
U.S. Large Cap Growth | | 834,568 | | 612,868 |
U.S. Real Estate | | 625,839 | | 1,122,001 |
U.S. Small/Mid Cap Value | | 4,566 | | 3,573 |
Emerging Markets Debt | | 83,234 | | 110,441 |
| | | | | | |
There were no purchases and sales of long-term U.S. Government securities for the year ended December 31, 2007.
2. Transactions with Affiliates: The Portfolios invest in the Institutional Class of portfolios within the Morgan Stanley Institutional Liquidity Funds (the “Liquidity Funds”), open-end management investment companies managed by the Adviser.
A summary of the Portfolios’ transactions in the shares of the Liquidity Funds during the year ended December 31, 2007 is set forth below:
| | Market Value
December 31, 2006 | | Purchases
at Cost | | Sales
Proceeds | | Dividend
Income | | Market Value
December 31, 2007 | |
Portfolio | | (000) | | (000) | | (000) | | (000) | | (000) | |
Active International Allocation | | $ | — | | $ | 238,830 | | $ | 167,342 | | $ | 1,748 | | $ | 71,488 | |
Emerging Markets | | — | | 603,495 | | 567,928 | | 1,566 | | 35,567 | |
Global Franchise | | — | | 30,950 | | 28,682 | | 94 | | 2,268 | |
Global Real Estate | | — | | 366,553 | | 366,553 | | 618 | | — | |
Global Value Equity | | — | | 12,932 | | 12,149 | | 25 | | 783 | |
International Equity | | — | | 1,804,113 | | 1,695,857 | | 4,917 | | 108,256 | |
International Growth Active | | | | | | | | | | | |
Extension | | — | | 10,163 | | 10,120 | | 4 | | 43 | |
International Growth Equity | | — | | 15,646 | | 2,335 | | 9 | | 13,311 | |
International Magnum | | — | | 26,024 | | 19,238 | | 292 | | 6,786 | |
International Real Estate | | — | | 403,869 | | 403,869 | | 1,053 | | — | |
International Small Cap | | — | | 244,148 | | 244,148 | | 456 | | — | |
Disciplined Large Cap Value Active Extension | | — | | 10,607 | | 10,524 | | 6 | | 83 | |
Focus Equity | | — | | 5,815 | | 4,668 | | 20 | | 1,147 | |
Large Cap Relative Value | | — | | 84,150 | | 79,207 | | 479 | | 4,943 | |
| | | | | | | | | | | | | | | | |
225
2007 Annual Report | |
|
December 31, 2007 |
Notes to Financial Statements (cont’d)
A summary of the Portfolios’ transactions in the shares of the Liquidity Funds during the year ended December 31, 2007 is set forth below:
| | Market Value | | Purchases | | Sales | | Dividend | | Market Value | |
| | December 31, 2006 | | at Cost | | Proceeds | | Income | | December 31, 2007 | |
Portfolio | | (000) | | (000) | | (000) | | (000) | | (000) | |
Small Company Growth | | $ | — | | $ | 539,036 | | $ | 525,103 | | $ | 1,487 | | $ | 13,933 | |
Systematic Active Large Cap Core | | — | | 982 | | 702 | | 17 | | 280 | |
Systematic Active Small Cap Core | | — | | 1,128 | | 411 | | 18 | | 717 | |
Systematic Active Small Cap Growth | | — | | 1,487 | | 617 | | 24 | | 870 | |
Systematic Active Small Cap Value | | — | | 922 | | 672 | | 15 | | 250 | |
Systematic Large Cap Core Active Extension | | — | | 9,261 | | 9,241 | | 6 | | 20 | |
U.S. Large Cap Growth | | — | | 343,653 | | 318,845 | | 550 | | 24,808 | |
U.S. Real Estate | | — | | 301,853 | | 301,853 | | 770 | | — | |
U.S. Small /Mid Cap Value | | — | | 23,255 | | 21,977 | | 28 | | 1,278 | |
Emerging Markets Debt | | — | | 58,941 | | 57,054 | | 83 | | 1,887 | |
| | | | | | | | | | | | | | | | |
Investment Advisory fees paid by the Portfolios are reduced by an amount equal to their pro-rata share of the advisory and administration fees paid by the Liquidity Funds (“Rebate”). For the year ended December 31, 2007, advisory fees paid were reduced as follows:
| | Rebate | |
Portfolio | | (000) | |
| | | |
Active International Allocation | | $ 36 | |
Emerging Markets | | 33 | |
Global Franchise | | 2 | |
Global Real Estate | | 13 | |
Global Value Equity | | 1 | |
International Equity | | 103 | |
International Growth Active Extension | | @— | |
International Growth Equity | | @— | |
International Magnum | | 6 | |
International Real Estate | | 21 | |
International Small Cap | | 9 | |
Disciplined Large Cap Value Active Extension | | @— | |
Focus Equity | | 1 | |
Large Cap Relative Value | | 10 | |
Small Company Growth | | 32 | |
Systematic Active Large Cap Core | | @— | |
Systematic Active Small Cap Core | | @— | |
Systematic Active Small Cap Growth | | 1 | |
Systematic Active Small Cap Value | | @— | |
Systematic Large Cap Core Active Extension | | @— | |
U.S. Large Cap Growth | | 12 | |
U.S. Real Estate | | 16 | |
U.S. Small/Mid Cap Value | | 1 | |
Emerging Markets Debt | | 2 | |
@ Amount is less than $500.
The Emerging Markets Equity Portfolio invests in Morgan Stanley Growth Fund, a closed-end management investment company advised by an affiliate of the Adviser. The Morgan Stanley Growth Fund was acquired at a cost of $3,415,000.
A summary of the Portfolio’s transactions in shares of the affiliated issuer during the year ended December 31, 2007 is as follows:
Market Value | | | | | | | | Market Value | |
December 31, | | Purchases | | Sales | | Dividend | | December 31, | |
2006 | | at Cost | | Proceeds | | Income | | 2007 | |
(000) | | (000) | | (000) | | (000) | | (000) | |
$16,810 | | — | | — | | — | | $28,374 | |
During the year ended December 31, 2007, the following Portfolios paid brokerage commissions to Morgan Stanley & Co., an affiliated broker/dealer:
| | | | Brokerage | |
| | | | Commissions | |
Portfolio | | | | (000) | |
Emerging Markets | | | | $ | 5 | |
Focus Equity | | | | 2 | |
Global Real Estate | | | | 3 | |
Global Value Equity | | | | 1 | |
International Real Estate | | | | @— | |
Small Company Growth | | | | 3 | |
U.S. Large Cap Growth | | | | 53 | |
U.S. Real Estate | | | | 5 | |
U.S. Small/Mid Cap Value | | | | @— | |
| | | | | | |
@ Amount is less than $500.
Additionally, during the year ended December 31, 2007, Emerging Markets Portfolio paid approximately $40,000 in brokerage commissions to China International Capital Corporation (Hong Kong) Limited (CICC), an affiliated broker/dealer.
G. Federal Income Taxes: It is each Portfolio’s intention to qualify as a regulated investment company and distribute all of its taxable and tax-exempt income. Accordingly, no provision for Federal income taxes is required in the financial statements. Each Portfolio files tax returns with the U.S. Internal Revenue Service and various states. Generally, the tax authorities can examine all tax returns filed for the last three years.
A Portfolio may be subject to taxes imposed by countries in which it invests. Such taxes are generally based on income and/or capital gains earned or repatriated. Taxes are accrued based on net investment income, net realized gains and net
226
| 2007 Annual Report |
|
December 31, 2007 |
Notes to Financial Statements (cont’d)
unrealized appreciation as income and/or capital gains are earned. Taxes may also be based on the movement of foreign currency and are accrued based on the value of investments denominated in such currency.
The Portfolios adopted the provisions of the Financial Accounting Standards Board’s (“FASB”) Interpretation number 48 Accounting for Uncertainty in Income Taxes (the “Interpretation’’), on June 30, 2007. The Interpretation is to be applied to all open tax years as of the date of effectiveness. As of December 31, 2007, this did not result in an impact to the Portfolios’ financial statements.
The tax character of distributions paid may differ from the character of distributions shown on the Statements of Changes in Net Assets due to short-term capital gains being treated as ordinary income for tax purposes. The tax character of distributions paid during 2007 and 2006 were as follows:
| | 2007 | | 2006 | |
| | Distributions | | Distributions | |
| | Paid From: | | Paid From: | |
| | Ordinary | | Return of | | Long-term | | Ordinary | | Long-term | |
| | Income | | Capital | | Capital Gain | | Income | | Capital Gain | |
Portfolio | | (000) | | (000) | | (000) | | (000) | | (000) | |
Active International | | | | | | | | | | | |
Allocation | | $ 43,168 | | $ — | | $ 50,249 | | $ 22,425 | | $ — | |
Emerging Markets | | 111,228 | | — | | 501,698 | | 18,163 | | 365,634 | |
Global Franchise | | 1,348 | | — | | 17,751 | | 1,579 | | 6,022 | |
Global Real Estate | | 31,622 | | — | | 3,308 | | 2,647 | | 84 | |
Global Value Equity | | 2,759 | | — | | 13,384 | | 2,202 | | 6,107 | |
International Equity* | | 205,097 | | — | | 800,160 | | 217,756 | | 1,050,872 | |
International Growth | | | | | | | | | | | |
Active Extension | | — | | — | | — | | — | | — | |
International Growth | | | | | | | | | | | |
Equity | | 127 | | — | | 260 | | 84 | | — | |
International Magnum | | 4,349 | | — | | 6,016 | | 2,676 | | 13,917 | |
International Real | | | | | | | | | | | |
Estate | | 91,243 | | — | | 63,755 | | 43,788 | | 17,429 | |
International Small Cap | | 21,636 | | — | | 212,655 | | 36,378 | | 213,836 | |
Disciplined Large Cap | | | | | | | | | | | |
Value Active | | | | | | | | | | | |
Extension | | 29 | | — | | — | | — | | — | |
Focus Equity | | 22 | | — | | — | | — | | — | |
Large Cap Relative | | | | | | | | | | | |
Value | | 5,050 | | — | | 11,838 | | 3,869 | | 11,341 | |
Small Company Growth | | — | | — | | 82,806 | | — | | 148,745 | |
Systematic Active | | | | | | | | | | | |
Large Cap Core | | 104 | | 14 | | 55 | | 50 | | — | |
Systematic Active | | | | | | | | | | | |
Small Cap Core | | 102 | | — | | 11 | | 19 | | — | |
Systematic Active | | | | | | | | | | | |
Small Cap Growth | | 200 | | — | | 44 | | — | | — | |
Systematic Active | | | | | | | | | | | |
Small Cap Value | | 391 | | — | | 25 | | 40 | | — | |
Systematic Large Cap | | | | | | | | | | | |
Core Active | | | | | | | | | | | |
Extension | | 1 | | — | | — | | — | | — | |
U.S. Large Cap Growth | | 5,423 | | — | | — | | 184 | | — | |
U.S. Real Estate | | 69,511 | | — | | 339,875 | | 47,476 | | 198,314 | |
U.S. Small/Mid Cap | | | | | | | | | | | |
Value | | 18 | | — | | — | | — | | — | |
Emerging Markets Debt | | 4,283 | | — | | — | | 5,968 | | — | |
*Amounts based on October 31 tax year end.
The amount and character of income and gains to be distributed are determined in accordance with income tax regulations which may differ from U.S. generally accepted accounting principles. These book/tax differences are either considered temporary or permanent in nature.
Temporary differences are generally due to differing book and tax treatments for the timing of the recognition of gains (losses) on certain investment transactions and the timing and the deductibility of certain expenses.
Permanent differences, primarily due to differing treatments of gains (losses) related to REIT adjustments, foreign currency transactions, foreign futures and options transactions, short sales, defaulted bonds, paydown adjustments, return of capital from certain securities, expiring capital losses, distribution reclass, foreign taxes paid on capital gains, net operating losses, nondeductible expenses, certain equity securities designated as issued by “passive foreign investment companies” and excess distributions resulted in the following reclassifications among the Portfolios’ components of net assets at December 31, 2007:
| | Accumulated | | | | | |
| | Undistributed | | | | | |
| | (Distributions in | | | | | |
| | Excess of) Net | | Accumulated | | | |
| | Investment | | Net Realized | | Paid-in | |
| | Income (Loss) | | Gain (Loss) | | Capital | |
Portfolio | | (000) | | (000) | | (000) | |
Active International Allocation | | $11,159 | | $(11,159 | ) | $ — | |
Emerging Markets | | (7,627 | ) | 7,631 | | (4 | ) |
Global Franchise | | (1,547 | ) | 1,547 | | — | |
Global Real Estate | | 3,295 | | (3,254 | ) | (41 | ) |
Global Value Equity | | (102 | ) | 115 | | (13 | ) |
International Equity | | (9,147 | ) | 9,424 | | (277 | ) |
International Growth Active Extension | | 20 | | (6 | ) | (14 | ) |
International Growth Equity | | (4 | ) | 4 | | — | |
International Magnum | | 1,520 | | (1,520 | ) | — | |
International Real Estate | | 29,710 | | (29,710 | ) | @— | |
International Small Cap | | 2,437 | | (2,437 | ) | — | |
Disciplined Large Cap Value Active Extension | | 2 | | (1 | ) | (1 | ) |
Focus Equity | | 2 | | (2 | ) | — | |
Large Cap Relative Value | | (3 | ) | 11 | | (8 | ) |
Small Company Growth | | 8,843 | | 7,548 | | (16,391 | ) |
Systematic Active Large Cap Core | | 1 | | 13 | | (14 | ) |
Systematic Active Small Cap Core | | (17 | ) | 10 | | 7 | |
Systematic Active Small Cap Growth | | (1 | ) | @— | | 1 | |
Systematic Active Small Cap Value | | (24 | ) | 12 | | 12 | |
Systematic Large Cap Core Active Extension | | 2 | | (1 | ) | (1 | ) |
U.S. Large Cap Growth | | (37 | ) | 37 | | — | |
U.S. Real Estate | | 11,898 | | (12,855 | ) | 957 | |
U.S. Small/Mid Cap Value | | 1 | | — | | (1 | ) |
Emerging Markets Debt | | 1,876 | | 5,331 | | (7,207 | ) |
@ Amount is less than $500.
227
2007 Annual Report | |
|
December 31, 2007 |
Notes to Financial Statements (cont’d)
At December 31, 2007, the components of distributable earnings on a tax basis were as follows:
| | | | Undistributed | |
| | Undistributed | | Long-term | |
| | Ordinary Income | | Capital Gain | |
Portfolio | | (000) | | (000) | |
Active International Allocation | | $ | 980 | | $ | 40,186 | |
Emerging Markets | | 46,240 | | 78,079 | |
Global Franchise | | 910 | | 1,482 | |
Global Real Estate | | 194 | | 1,812 | |
Global Value Equity | | 241 | | 662 | |
International Growth Equity | | 9 | | 267 | |
International Magnum | | — | | 2,533 | |
International Real Estate | | 152 | | 5,252 | |
International Small Cap | | — | | 30,493 | |
Large Cap Relative Value | | 3 | | 1,219 | |
Systematic Active Small Cap Core | | 3 | | 132 | |
Systematic Active Small Cap Growth | | 17 | | 63 | |
Systematic Active Small Cap Value | | 1 | | 120 | |
U.S. Large Cap Growth | | 114 | | 1,427 | |
U.S. Real Estate | | 1,393 | | 66,270 | |
U.S. Small/Mid Cap Value | | 26 | | — | |
| | | | | | | |
Any Portfolios not shown above had no distributable earnings on a tax basis at December 31, 2007.
At December 31, 2007, cost, unrealized appreciation, unrealized depreciation, and net unrealized appreciation (depreciation) for U.S. Federal income tax purposes of the investments of each of the Portfolios were:
| | | | | | | | Net | |
| | | | | | | | Appreciation | |
| | Cost | | Appreciation | | Depreciation | | (Depreciation) | |
Portfolio | | (000) | | (000) | | (000) | | (000) | |
Active International | | | | | | | | | |
Allocation | | $ | 930,401 | | $ | 273,484 | | $ | (27,130 | ) | $ | 246,354 | |
Emerging Markets | | 2,704,478 | | 1,116,698 | | (63,074 | ) | 1,053,624 | |
Global Franchise | | 89,103 | | 32,012 | | (5,034 | ) | 26,978 | |
Global Real Estate | | 703,455 | | 25,109 | | (106,923 | ) | (81,814 | ) |
Global Value Equity | | 75,473 | | 22,011 | | (2,742 | ) | 19,269 | |
International Equity | | 5,435,768 | | 1,502,618 | | (290,965 | ) | 1,211,653 | |
International Growth | | | | | | | | | |
Active Extension | | 13,038 | | 1,070 | | (502 | ) | 568 | |
International Growth | | | | | | | | | |
Equity | | 34,621 | | 1,956 | | (109 | ) | 1,847 | |
International Magnum | | 122,523 | | 31,107 | | (3,123 | ) | 27,984 | |
International Real Estate | | 1,357,090 | | 47,649 | | (237,117 | ) | (189,468 | ) |
International Small Cap | | 733,098 | | 152,045 | | (102,482 | ) | 49,563 | |
Disciplined Large Cap | | | | | | | | | |
Value Active Extension | | 12,587 | | 299 | | (1,106 | ) | (807 | ) |
Focus Equity | | 13,510 | | 4,305 | | (976 | ) | 3,329 | |
Large Cap Relative Value | | 257,452 | | 51,513 | | (19,590 | ) | 31,923 | |
Small Company Growth | | 1,578,428 | | 415,873 | | (150,861 | ) | 265,012 | |
Systematic Active Large | | | | | | | | | |
Cap Core | | 6,714 | | 1,046 | | (328 | ) | 718 | |
Systematic Active Small | | | | | | | | | |
Cap Core | | 8,735 | | 343 | | (1,185 | ) | (842 | ) |
Systematic Active Small | | | | | | | | | |
Cap Growth | | 9,227 | | 692 | | (1,106 | ) | (414 | ) |
Systematic Active Small | | | | | | | | | |
Cap Value | | 8,691 | | 322 | | (1,652 | ) | (1,330 | ) |
Systematic Large Cap | | | | | | | | | |
Core Active Extension | | 12,810 | | 445 | | (777 | ) | (332 | ) |
U.S. Large Cap Growth | | 1,215,852 | | 387,620 | | (69,792 | ) | 317,828 | |
| | | | | | | | | | | | | |
| | | | | | | | Net | |
| | | | | | | | Appreciation | |
| | Cost | | Appreciation | | Depreciation | | (Depreciation) | |
Portfolio | | (000) | | (000) | | (000) | | (000) | |
U.S. Real Estate | | $ 1,187,399 | | $ 165,678 | | $ (126,688 | ) | $ 38,990 | |
U.S. Small/Mid Cap | | | | | | | | | |
Value | | 21,452 | | 566 | | (1,652 | ) | (1,086 | ) |
Emerging Markets Debt | | 57,515 | | 927 | | (1,781 | ) | (854 | ) |
At December 31, 2007, the following Portfolios had available capital loss carryforwards to offset future net capital gains, to the extent provided by regulations, through the indicated expiration dates:
Expiration Date December 31, (000)
Portfolio | | 2009 | | 2010 | | 2011 | | 2012 | | 2013 | | 2015 | | Total | |
International | | | | | | | | | | | | | | | |
Growth Active | | | | | | | | | | | | | | | |
Extension | | $ | — | | $ | — | | $ | — | | $ | — | | $ | — | | $ | 52 | | $ | 52 | |
Disciplined Large | | | | | | | | | | | | | | | |
Cap Value | | | | | | | | | | | | | | | |
Active | | | | | | | | | | | | | | | |
Extension | | — | | — | | — | | — | | — | | 162 | | 162 | |
Focus Equity | | — | | 15,905 | | — | | 296 | | — | | — | | 16,201 | |
Large Cap Relative Value* | | 16,091 | | 32,106 | | — | | — | | — | | — | | 48,197 | |
Small Company | | | | | | | | | | | | | | | |
Growth | | — | | 14,422 | | — | | — | | — | | — | | 14,422 | |
Systematic Large | | | | | | | | | | | | | | | |
Cap Core | | | | | | | | | | | | | | | |
Active | | | | | | | | | | | | | | | |
Extension | | — | | — | | — | | — | | — | | 31 | | 31 | |
Emerging | | | | | | | | | | | | | | | |
Markets Debt | | 778 | | — | | — | | — | | — | | — | | 778 | |
| | | | | | | | | | | | | | | | | | | | | | |
*Capital loss carryover from target fund.
The amounts reflected in the capital loss carryforward table for Large Cap Relative Value Portfolio represent capital loss carry- forward brought forward as a result of the Portfolio’s merger with the MSIFT Equity Portfolio. Based on certain provisions in the Internal Revenue Code, various limitations regarding the future utilization of these carryforwards may apply. This acquired capital loss carryforward is expected to expire between 2009-2010.
In addition, the amounts reflected in the capital loss carryforward table above for the Small Company Growth Portfolio represent capital loss carryforward acquired from MSIFT Small Cap Growth Portfolio after limitations pursuant to Internal Revenue Code, Section 383.
During the year ended December 31, 2007, the following Portfolios utilized capital loss carryforwards for U.S. Federal income tax purposes of approximately:
Portfolio | | Capital Loss
Carryforward
Utilized
(000) | |
Active International Allocation | | $14,711 | |
Focus Equity | | 1,359 | |
Large Cap Relative Value | | 2,838 | |
228
2007 Annual Report
December 31, 2007
Notes to Financial Statements (cont’d)
Portfolio | | Capital Loss
Carryforward
Utilized
(000) | |
Small Company Growth | | $ | 4,660 | |
Systematic Active Large Cap Core | | 33 | |
Systematic Active Small Cap Core | | 166 | |
Systematic Active Small Cap Growth | | 184 | |
Systematic Active Small Cap Value | | 5 | |
U.S. Large Cap Growth | | 66,874 | |
Emerging Markets Debt | | 4,217 | |
| | | | |
The Large Cap Relative Value Portfolio utilized approximately $2,838,000 of the capital losses acquired from MSIFT Equity Portfolio for federal tax purposes during the year ended December 31, 2007.
The Small Company Growth Portfolio utilized $4,660,000 of the capital losses acquired from MSIFT Small Cap Growth Portfolio for federal tax purposes during the year ended December 31, 2007.
During the year ended December 31, 2007, the Emerging Markets Debt Portfolio had expired capital loss carryforwards for U.S. Federal income tax purposes of approximately $5,544,000.
To the extent that capital loss carryovers are used to offset any future capital gains realized during the carryover period as provided by U.S. Federal income tax regulations, no capital gains tax liability will be incurred by a Portfolio for gains realized and not distributed. To the extent that capital gains are offset, such gains will not be distributed to the shareholders.
Net capital, passive investment company (“PFIC”), and currency losses incurred after October 31, and within the taxable year are deemed to arise on the first day of the Portfolio’s next taxable year. For the year ended December 31, 2007, the Portfolio deferred to January 2, 2008 for U.S. Federal income tax purposes, post-October capital, PFIC and currency losses as indicated:
Portfolio | | Capital
Losses
(000) | | Currency
Losses
(000) | | PFIC
Losses
(000) | |
Active International Allocation | | $— | | $1,851 | | $ — | |
Global Real Estate | | — | | 96 | | 7,350 | |
Global Value Equity | | — | | — | | 1 | |
International Growth Active Extension | | 26 | | 5 | | — | |
International Growth Equity | | — | | 6 | | — | |
International Magnum | | — | | 524 | | 7 | |
International Real Estate | | — | | — | | 17,172 | |
International Small Cap | | — | | 335 | | — | |
Disciplined Large Cap Value Active Extension | | 78 | | — | | — | |
Focus Equity | | 282 | | — | | — | |
Systematic Active Large Cap Core | | 66 | | — | | — | |
Systematic Large Cap Core Active Extension | | 204 | | — | | — | |
U.S. Large Cap Growth | | — | | 85 | | — | |
U.S. Real Estate | | — | | 19 | | — | |
U.S. Small/Mid Cap Value | | 41 | | — | | — | |
| | | | | | | |
@ Amount is less than $500. | | | | | | | |
H. Contractual Obligations: The Fund enters into contracts that contain a variety of indemnifications. The Fund’s maximum exposure under these arrangements is unknown. However, the Fund has not had prior claims or losses pursuant to these contracts and expects the risk of loss to be remote.
I. Other: The net assets of certain Portfolios include foreign denominated securities and currency. Changes in currency exchange rates will affect the U.S. dollar value of and investment income from such securities. Further, at times certain of the Portfolios’ investments are concentrated in a limited number of countries and regions. This concentration may further increase the risk of the Portfolio.
Global Real Estate, International Real Estate and U.S. Real Estate Portfolios invest a significant portion of their assets in securities of real estate investment trusts (REIT). The market’s perception of prospective declines in private real estate values and other financial assets may result in increased volatility of market prices that can negatively impact the valuation of certain issuers held by the Portfolios.
The Emerging Markets Debt Portfolio holds a significant portion of its investments in securities which are traded by a small number of market makers who may also be utilized by the Portfolio to provide pricing information used to value such investments. The amounts realized upon disposition of these securities may differ from the value reflected on the Statements of Assets and Liabilities.
Settlement and registration of foreign securities transactions may be subject to significant risks not normally associated with investments in the United States. In certain markets, including Russia, ownership of shares is defined according to entries in the issuer’s share register. In Russia, currently no central registration system exists and the share registrars may not be subject to effective state supervision. It is possible that a Portfolio could lose its share registration through fraud, negligence or even mere oversight. In addition, shares being delivered for sales and cash being paid for purchases may be delivered before the exchange is complete. This may subject the Portfolio to further risk of loss in the event of a counterparty’s failure to complete the transaction.
At December 31, 2007, certain Portfolios had otherwise unaffiliated record owners of 10% or greater. Investment activities of these shareholders could have a material impact on these Portfolios.
229
2007 Annual Report
December 31, 2007
Notes to Financial Statements (cont’d)
These Portfolios and the aggregate percentage of such owners were as follows:
| | Percentage of Ownership | |
Portfolio | | Class A | | Class B | |
Active International Allocation | | —% | | 35.7% | |
Emerging Markets | | 47.2 | | 91.7 | |
Global Franchise | | 63.7 | | — | |
Global Real Estate | | 40.3 | | 26.9 | |
Global Value Equity | | 63.2 | | 91.1 | |
International Equity | | — | | 83.8 | |
International Growth Active Extension | | — | | — | |
International Growth Equity | | 66.6 | | 22.0 | |
International Magnum | | 19.7 | | 82.0 | |
International Real Estate | | 39.1 | | 73.2 | |
International Small Cap | | 20.2 | | — | |
Disciplined Large Cap Value Active Extension | | — | | — | |
Focus Equity | | 10.1 | | 18.7 | |
Large Cap Relative Value | | 70.7 | | 96.5 | |
Small Company Growth | | 31.3 | | 57.4 | |
Systematic Active Large Cap Core | | — | | — | |
Systematic Active Small Cap Core | | — | | — | |
Systematic Active Small Cap Growth | | — | | — | |
Systematic Active Small Cap Value | | — | | — | |
Systematic Large Cap Core Active Extension | | — | | — | |
U.S. Large Cap Growth | | 18.1 | | 89.1 | |
U.S. Real Estate | | 28.5 | | 76.6 | |
U.S. Small/Mid Cap Value | | — | | — | |
Emerging Markets Debt | | 83.8 | | 35.4 | |
J. Reverse Stock Split: After the close of business on March 17, 2006, Emerging Markets Debt Portfolio effected a 1 for 3 reverse stock split for Class A and Class B shares of the Portfolio. All transactions in capital stock and per share data prior to March 18, 2006 have been restated to give effect to the reverse stock split. The reverse stock split had no impact on the overall value of a shareholder’s investment in the Portfolio.
K. Supplemental Proxy Information (unaudited): On January 25, 2007, a Special Meeting of Shareholders of the Global Franchise Portfolio (“Portfolio”) was held in order to vote on a proposal to change the Portfolio from a diversified fund to a non-diversified fund. The votes were as follows:
For | | Against | | Abstain | | BNV* | |
3,566,586 | | 27,417 | | 39,879 | | 0 | |
* Broker “non-votes” are shares held in street name for which the broker indicates that instructions have not been received from the beneficial owners or other persons entitled to vote and for which the broker does not have discretionary voting authority.
L. Subsequent Event: Effective January 2, 2008, all references to Class A shares and Class B shares of the Portfolios are changed to Class I shares and Class P shares, respectively. The Directors of the Fund also approved a change in the investment minimums for these classes. The minimum initial investments are $5,000,000 and $1,000,000 for Class I and Class P, respectively. The Directors of the Fund also approved adding Class H shares to Global Real Estate, International Growth Active Extension, Disciplined Large Cap Value Active Extension, Systematic Large Cap Core Active Extension and Emerging Markets Debt Portfolios.
230
2007 Annual Report
December 31, 2007
Report of Independent Registered Public Accounting Firm
To the Shareholders and Board of Directors of
Morgan Stanley Institutional Fund, Inc.
We have audited the accompanying statements of assets and liabilities, including the portfolios of investments, of the Morgan Stanley Institutional Fund, Inc. (the “Fund”) (comprising, respectively, the Active International Allocation Portfolio, Disciplined Large Cap Value Active Extension Portfolio, Emerging Markets Portfolio, Global Franchise Portfolio, Global Real Estate Portfolio, Global Value Equity Portfolio, International Equity Portfolio, International Growth Active Extension Portfolio, International Growth Equity Portfolio, International Magnum Portfolio, International Real Estate Portfolio, International Small Cap Portfolio, Focus Equity Portfolio, Large Cap Relative Value Portfolio, Small Company Growth Portfolio, Systematic Active Large Cap Core Portfolio, Systematic Active Small Cap Core Portfolio, Systematic Active Small Cap Growth Portfolio, Systematic Active Small Value Portfolio, Systematic Large Cap Core Active Extension Portfolio, U.S. Large Cap Growth Portfolio, U.S. Real Estate Portfolio, Emerging Markets Debt Portfolio, and U.S. Small/Mid Cap Value Portfolio), as of December 31, 2007, and the related statements of operations, the statements of changes in net assets, the statements of cash flows for the Disciplined Large Cap Value Active Extension Portfolio, International Growth Active Extension Portfolio and Systematic Large Cap Core Active Extension Portfolio, and the financial highlights for each of the periods indicated therein. These financial statements and financial highlights are the responsibility of the Fund’s management. Our responsibility is to express an opinion on these financial statements and financial highlights based on our audits.
We conducted our audits in accordance with the standards of the Public Company Accounting Oversight Board (United States). Those standards require that we plan and perform the audit to obtain reasonable assurance about whether the financial statements and financial highlights are free of material misstatement. We were not engaged to perform an audit of the Fund’s internal control over financial reporting. Our audits included consideration of internal control over financial reporting as a basis for designing audit procedures that are appropriate in the circumstances, but not for the purpose of expressing an opinion on the effectiveness of the Fund’s internal control over financial reporting. Accordingly, we express no such opinion. An audit also includes examining, on a test basis, evidence supporting the amounts and disclosures in the financial statements and financial highlights, assessing the accounting principles used and significant estimates made by management, and evaluating the overall financial statement presentation. Our procedures included confirmation of securities owned as of December 31, 2007, by correspondence with the custodian and brokers, or by other appropriate auditing procedures where replies from brokers were not received. We believe that our audits provide a reasonable basis for our opinion.
In our opinion, the financial statements and financial highlights referred to above present fairly, in all material respects, the financial position of each of the aforementioned portfolios constituting the Morgan Stanley Institutional Fund, Inc. at December 31, 2007, the results of their operations, the changes in their net assets, the cash flows for the aforementioned three portfolios and the financial highlights for each of the periods indicated therein, in conformity with U.S. generally accepted accounting principles.

Boston, Massachusetts
February 19, 2008
231
2007 Annual Report
December 31, 2007
Federal Income Tax Information: (unaudited)
For Federal income tax purposes, the following information is furnished with respect to the distributions paid by each applicable Portfolio during the taxable year ended December 31, 2007.
For corporate shareholders, the following percentages of dividends paid by each Portfolio qualified for the dividends received deduction. Additionally, the following percentages of each Portfolio’s dividends was attributable to qualifying U.S. Government obligations. (Please consult your tax advisor to determine if any portion of the dividends you received is exempt from state income tax.):
Portfolio | | Div. Received
Deduction % | | Qualifying U.S.
Govt. Income % | |
Global Franchise | | 70.7 | % | — | % |
Global Real Estate | | 1.1 | | — | |
Global Value Equity | | 25.8 | | — | |
Disciplined Large Cap Value Active Extension | | 100.0 | | — | |
Focus Equity | | 100.0 | | — | |
Large Cap Relative Value | | 100.0 | | — | |
Systematic Active Large Cap Core | | 90.4 | | — | |
Systematic Active Small Cap Core | | 55.9 | | — | |
Systematic Active Small Cap Growth | | 16.1 | | — | |
Systematic Active Small Cap Value | | 25.3 | | — | |
Systematic Large Cap Core Active Extension | | 100.0 | | — | |
U.S. Large Cap Growth | | 100.0 | | — | |
U.S. Real Estate | | 2.2 | | — | |
U.S. Small/Mid Cap Value | | 76.5 | | — | |
Each of the applicable Portfolios designated and paid the following amounts as a long-term capital gain distribution:
Portfolio | | Amount
(000) | |
Active International Allocation | | $ 50,249 | |
Emerging Markets | | 501,698 | |
Global Franchise | | 17,751 | |
Global Real Estate | | 3,308 | |
Global Value Equity | | 13,384 | |
International Equity | | 800,160 | |
International Growth Equity | | 260 | |
International Magnum | | 6,016 | |
International Real Estate | | 63,755 | |
International Small Cap | | 212,655 | |
Large Cap Relative Value | | 11,838 | |
Small Company Growth | | 82,806 | |
Systematic Active Large Cap Core | | 55 | |
Systematic Active Small Cap Core | | 11 | |
Systematic Active Small Cap Growth | | 44 | |
Systematic Active Small Cap Value | | 25 | |
U.S. Real Estate | | 339,875 | |
232
2007 Annual Report
December 31, 2007
Federal Income Tax Information: (cont’d)
For Federal income tax purposes, the following information is furnished with respect to the earnings of each applicable Portfolio for the taxable year ended December 31, 2007.
When distributed, certain earnings may be subject to a maximum tax rate of 15% as provided for the Jobs and Growth Tax Relief Reconciliation Act of 2003. Each of the applicable Portfolios designated up to the following maximum amounts as taxable at this lower rate:
Portfolio | | Amount
(000) | |
Active International Allocation | | $ 12,811 | | |
Emerging Markets | | 31,538 | | |
Global Franchise | | 1,453 | | |
Global Real Estate | | 1,863 | | |
Global Value Equity | | 2,094 | | |
International Equity | | 119,295 | | |
International Growth Equity | | 115 | | |
International Magnum | | 1,446 | | |
International Real Estate | | 34,367 | | |
International Small Cap | | 23,961 | | |
Disciplined Large Cap Value Active Extension | | 29 | | |
Focus Equity | | 21 | | |
Large Cap Relative Value | | 5,050 | | |
Systematic Active Large Cap Core | | 87 | | |
Systematic Active Small Cap Core | | 70 | | |
Systematic Active Small Cap Growth | | 17 | | |
Systematic Active Small Cap Value | | 91 | | |
Systematic Large Cap Core Active Extension | | 1 | | |
U.S. Large Cap Growth | | 5,422 | | |
U.S. Small/Mid Cap Value | | 18 | | |
The following Portfolios intend to pass through foreign tax credits and have derived net income from sources within foreign countries amounting to:
Portfolio | | Foreign Tax
Credits | | Net Foreign
Source Income |
Active International Allocation | | $ 346 | | $ 25,662 |
Emerging Markets | | 2,073 | | 46,529 |
Global Franchise | | 149 | | 2,610 |
Global Real Estate | | 152 | | 7,468 |
International Equity | | 2,965 | | 210,403 |
International Growth Equity | | 9 | | 162 |
International Magnum | | 23 | | 2,821 |
International Real Estate | | 1,808 | | 50,372 |
International Small Cap | | 2,220 | | 29,307 |
In January, each applicable Portfolio provides tax information to shareholders for the preceding calendar year.
233
2007 Annual Report |
|
December 31, 2007 |
An Important Notice Concerning Our U.S. Privacy Policy (unaudited)
POLICY CONCERNING CUSTOMER INFORMATION
Morgan Stanley Institutional Fund, Inc. (the “Fund”) is required by federal law to provide you with a copy of their Privacy Policy (the “Policy”) annually. The following Policy applies to current and former individual clients of the Fund. This Policy is not applicable to partnerships, corporations, trusts or other non individual clients or account holders. Please note that this Policy may be amended at any time, and that you will be informed of any changes to this Policy as required by law.
THE FUND RESPECTS YOUR PRIVACY
The Fund appreciates that you have provided your personal financial information and strive to maintain the privacy of such information. This Policy describes, and is designed to help you understand, what non-public personal information the Fund may collect about you, why the Fund collects it, and when the Fund may share it with others. Throughout this Policy, the non-public information that personally identifies you or your accounts is referred to as “personal information.”
1. WHAT PERSONAL INFORMATION DOES THE FUND COLLECT ABOUT YOU?
To serve you better and manage your investment, it is important that the Fund collects and maintains accurate information about you. The Fund obtains this information from applications and other forms you submit, from your dealings with the Fund, and from third parties and other sources.
For example:
· The Fund collects information such as your name, address, e-mail address, and telephone/fax numbers through applications and other forms you may submit.
· The Fund may obtain information about account balances, your use of account(s) and the types of products and services you prefer to receive through your dealings and transactions with the Fund and other sources.
· The Fund may collect background information from and through third-party vendors to verify representations you have made and to comply with various regulatory requirements.
2. WHEN DOES THE FUND DISCLOSE PERSONAL INFORMATION COLLECTED ABOUT YOU?
To provide you with the products and services you request, to serve you better and to manage your investment, the Fund may disclose personal information collected about you to affiliated companies and to non-affiliated third parties as required or permitted by law.
a. Information the Fund discloses to affiliated companies:
The Fund does not disclose personal information collected about you to affiliated companies except to enable them to provide services on their behalf or as otherwise required or permitted by law.
b. Information the Fund discloses to third parties:
The Fund does not disclose personal information collected about you to non-affiliated third parties except to enable them to provide services on the Fund’s behalf, to perform joint marketing agreements with other financial institutions, or as otherwise required or permitted by law. For example, some instances where the Fund may disclose information about you to non-affiliated third parties include: for servicing and processing transactions, to protect against fraud, for institutional risk control or to respond to judicial process. When the Fund shares personal information with these third parties, they are required to limit their use of personal information to the particular purpose for which it was shared and they are not allowed to share personal information with others except to fulfill that limited purpose.
234
| 2007 Annual Report |
| |
| December 31, 2007 |
An Important Notice Concerning Our U.S. Privacy Policy (cont’d)
3. HOW DOES THE FUND PROTECT THE SECURITY AND CONFIDENTIALITY OF PERSONAL INFORMATION COLLECTED ABOUT YOU?
The Fund and/or its service providers maintain physical, electronic and procedural security measures to help safeguard the personal information collected about you. The Fund and its service providers have internal policies governing the proper handling of client information. Third parties that provide support or marketing services on the Fund’s behalf may also receive personal information, and they are required to adhere to confidentiality standards with respect to such information.
If you have any questions regarding this Policy, please contact a Fund representative at (800) 548-7786.
© 2007 Morgan Stanley Institutional Fund, Inc. | |
235
2007 Annual Report |
|
December 31, 2007 |
Director and Officer Information (unaudited)
Independent Directors:
Name, Age and Address of Independent Director | | Position(s) Held
with Registrant | | Length of Time Served* | | Principal Occupation(s) During Past 5 Years | | Number of
Portfolios in
Fund Complex
Overseen by
Independent
Director** | | Other Directorships Held by Director |
Frank L. Bowman (63)
c/o Kramer Levin Naftalis &
Frankel LLP
Counsel to the Independent Directors 1177 Avenue of the Americas New York, NY 10036 | | Director | | Since August 2006 | | President and Chief Executive Officer, Nuclear Energy Institute (policy organization) (since February 2005); Director or Trustee of various Retail Funds and Institutional Funds (since August 2006); Chairperson of the Insurance Sub-Committee of the Insurance, Valuation and Compliance Committee (since February 2007); formerly, variously, Admiral in the U.S. Navy, Director of Naval Nuclear Propulsion Program and Deputy Administrator— Naval Reactors in the National Nuclear Security Administration at the U.S. Department of Energy (1996-2004). Honorary Knight Commander of the Most Excellent Order of the British Empire. | | 180 | | Director of the National Energy Foundation, the U.S. Energy Association, the American Council for Capital Formation and the Armed Services YMCA of the USA. |
| | | | | | | | | | |
Michael Bozic (66)
c/o Kramer Levin Naftalis &
Frankel LLP
Counsel to the Independent
Directors
1177 Avenue of the Americas
New York, NY 10036 | | Director | | Since
April
1994 | | Private Investor; Chairperson of the Insurance, Valuation and Compliance Committee (since October 2006); Director or Trustee of the Retail Funds (since April 1994) and the Institutional Funds (since July 2003); formerly, Chairperson of the Insurance Committee (July 2006- September 2006), Vice Chairman of Kmart Corporation (December 1998-October 2000), Chairman and Chief Executive Officer of Levitz Furniture Corporation (November 1995-November 1998) and President and Chief Executive Officer of Hills Department Stores (May 1991-July 1995); variously Chairman, Chief Executive Officer, President and Chief Operating Officer (1987-1991) of the Sears Merchandise Group of Sears Roebuck & Co. | | 182 | | Director of various business
organizations. |
| | | | | | | | | | |
Kathleen A. Dennis (54) c/o Kramer Levin Naftalis & Frankel LLP Counsel to the Independent Directors 1177 Avenue of the Americas New York, NY 10036 | | Director | | Since August 2006 | | President, Cedarwood Associates (mutual fund and investment management) (since July 2006); Chairperson of the Money Market and Alternatives Sub-Committee of the Investment Committee (since October 2006) and Director or Trustee of various Retail Funds and Institutional Funds (since August 2006); formerly, Senior Managing Director of Victory Capital Management (1993- 2006). | | 180 | | Director of various non-profit organizations. |
| | | | | | | | | | |
Dr. Manuel H. Johnson (58) c/o Johnson Smick Group, Inc. 888 16th Street, N.W. Suite 740 Washington, D.C. 20006 | | Director | | Since July 1991 | | Senior Partner, Johnson Smick International, Inc. (consulting firm); Chairperson of the Investment Committee (since October 2006) and Director or Trustee of the Retail Funds (since July 1991) and the Institutional Funds (since July 2003); Co-Chairman and a founder of the Group of Seven Council (G7C) international economic commission; formerly, Chairperson of the Audit Committee (July 1991-September 2006); Vice Chairman of the Board of Governors of the Federal Reserve System and Assistant Secretary of the U.S. Treasury. | | 182 | | Director of NVR, Inc. (home construction); Director of Evergreen Energy. |
| | | | | | | | | | |
Joseph J. Kearns (65) c/o Kearns & Associates LLC PMB754 23852 Pacific Coast Highway Malibu, CA 90265 | | Director | | Since August 1994 | | President, Kearns & Associates LLC (investment consulting); Chairperson of the Audit Committee (since October 2006) and Director or Trustee of the Retail Funds (since July 2003) and the Institutional Funds (since August 1994); formerly Deputy Chairperson of the Audit Committee (July 2003-September 2006) and Chairperson of the Audit Committee of the Institutional Funds (October 2001- July 2003); CFO of the J. Paul Getty Trust. | | 183 | | Director of Electro Rent Corporation (equipment leasing) and The Ford Family Foundation. |
236
| 2007 Annual Report |
| |
| December 31, 2007 |
Director and Officer Information (cont’d)
Independent Directors: (cont’d)
Name, Age and Address of Independent Director | | Position(s) Held with Registrant | | Length of Time Served* | | Principal Occupation(s) During Past 5 Years | | Number of
Portfolios in
Fund Complex
Overseen by
Independent
Director** | | Other Directorships Held by Director |
Michael F. Klein (49)
c/o Kramer Levin Naftalis &
Frankel LLP
Counsel to the
Independent Directors
1177 Avenue of the Americas New York, NY 10036 | | Director | | Since August 2006 | | Managing Director, Aetos Capital, LLC (since March 2000) and Co-President, Aetos Alternatives Management, LLC (since January 2004); Chairperson of the Fixed- Income Sub-Committee of the Investment Committee (since October 2006) and Director or Trustee of various Retail Funds and Institutional Funds (since August 2006); formerly, Managing Director, Morgan Stanley & Co., Inc. and Morgan Stanley Dean Witter Investment Management, President, Morgan Stanley Institutional Funds (June 1998-March 2000) and Principal, Morgan Stanley & Co., Inc. and Morgan Stanley Dean Witter Investment Management (August 1997-December 1999). | | 180 | | Director of certain investment funds managed or sponsored by Aetos Capital LLC; Director of Sanitized AG and Sanitized Marketing AG (specialty chemicals). |
| | | | | | | | | | |
Michael E. Nugent (71)
c/o Triumph Capital, L.P.
445 Park Avenue
New York, NY 10022 | | Chairman of the
Board and
Director | | Chairman of
the Boards
since July
2006 and
Trustee since
July 1991 | | General Partner of Triumph Capital, L.P. (private investment partnership); Chairman of the Boards of the Retail Funds and Institutional Funds (since July 2006); Director or Trustee of the Retail Funds (since July 1991) and the Institutional Funds (since July 2001); formerly, Chairperson of the Insurance Committee (until July 2006). | | 182 | | None. |
| | | | | | | | | | |
W. Allen Reed (60)
c/o Kramer Levin Naftalis &
Frankel LLP
Counsel to the
Independent Directors
1177 Avenue of the Americas
New York, NY 10036 | | Director | | Since
August
2006 | | Chairperson of the Equity Sub-Committee of the Investment Committee (since October 2006) and Director or Trustee of various Retail and Institutional Funds (since August 2006); formerly, President and CEO of General Motors Asset Management; Chairman and Chief Executive Officer of the GM Trust Bank and Corporate Vice President of General Motors Corporation (July 1994- December 2005). | | 180 | | Director of Temple-Inland Industries (packaging and forest products); Director of Legg Mason and Director of the Auburn University Foundation. |
| | | | | | | | | | |
Fergus Reid (75)
c/o Lumelite Plastics
Corporation
85 Charles Coleman Blvd.
Pawling, NY 12564 | | Director | | Since
June
1992 | | Chairman of Lumelite Plastics Corporation; Chairperson of the Governance Committee and Director or Trustee of the Retail Funds (since July 2003) and the Institutional Funds (since June 1992). | | 183 | | Trustee and Director of certain investment companies in the JPMorgan Funds complex managed by JPMorgan Investment Management Inc. |
237
2007 Annual Report |
|
December 31, 2007 |
Director and Officer Information (cont’d)
Interested Director:
Name, Age and Address of
Interested Director | | Position(s)
Held with
Registrant | | Term of Office
and Length of
Time Served* | | Principal Occupation(s) During Past 5 Years | | Number of
Portfolios in
Fund Complex
Overseen by
Interested
Director** | | Other Directorships Held by Director |
James F. Higgins (59)
c/o Morgan Stanley Trust
Harborside Financial Center
Plaza Two
Jersey City, NJ 07311 | | Director | | Since
June
2000 | | Director or Trustee of the Retail Funds (since June 2000) and the Institutional Funds (since July 2003); Senior Advisor of Morgan Stanley (since August 2000). | | 181 | | Director of AXA Financial, Inc. and The Equitable Life Assurance Society of the United States (financial services). |
* This is the earliest date the Director began serving the Retail Funds or Institutional Funds. Each Director serves an indefinite term, until his or her successor is elected.
** The Fund Complex includes all open-end and closed-end funds (including all of their portfolios) advised by the Adviser and any funds that have an investment adviser that is an affiliated person of the Adviser (including, but not limited to, Morgan Stanley Investment Management, Inc.).
Additional information about the Fund’s Directors can be found in the Fund’s Statement of Additional Information (SAI). The SAI may be obtained without charge upon request, by calling the Fund at 1-800-548-7786. You may also retrieve this information on-line at the Securities and Exchange Commission’s website at “http://www.sec.gov”.
238
| 2007 Annual Report |
| |
| December 31, 2007 |
Director and Officer Information (cont’d)
Executive Officers:
Name, Age and Address of Executive Officer | | Position(s)
Held with
Registrant | | Term of Office
and Length of
Time Served* | | Principal Occupation(s) During Past 5 Years |
| | | | | | |
Ronald E. Robison (68)
Morgan Stanley Investment Management Inc. 522 Fifth Avenue
New York, NY 10036 | | President and
Principal
Executive
Officer | | President since
September
2005 and
Principal
Executive
Officer since
May 2003 | | President (since September 2005) and Principal Executive Officer (since May 2003) of funds in the Fund Complex; President (since September 2005) and Principal Executive Officer (since May 2003) of the Van Kampen Funds; Managing Director, Director and/or Officer of the Adviser and various entities affiliated with the Adviser; Director of Morgan Stanley SICAV (since May 2004). Formerly, Executive Vice President (July 2003 to September 2005) of funds in the Fund Complex and the Van Kampen Funds; President and Director of the Institutional Funds (March 2001 to July 2003); Chief Global Operating Officer of the Adviser; Chief Administrative Officer of Morgan Stanley Investment Advisors Inc.; Chief Administrative Officer of Morgan Stanley Services Company Inc. |
| | | | | | |
J. David Germany (53)
Morgan Stanley Investment Management
Limited
20 Bank Street
Canary Wharf
London, England
E144AD | | Vice
President | | Since February
2006 | | Managing Director and (since December 2005) Chief Investment Officer—Global Fixed Income of Morgan Stanley Investment Management; Managing Director and Director of Morgan Stanley Investment Management Limited; Vice President of the Retail Funds and Institutional Funds (since February 2006). |
| | | | | | |
Dennis F. Shea (54)
Morgan Stanley Investment Management Inc.
522 Fifth Avenue
New York, NY 10036 | | Vice
President | | Since February
2006 | | Managing Director and (since February 2006) Chief Investment Officer—Global Equity of Morgan Stanley Investment Management; Vice President of the Retail Funds and Institutional Funds (since February 2006). Formerly, Managing Director and Director of Global Equity Research at Morgan Stanley. |
| | | | | | |
Amy R. Doberman (45)
Morgan Stanley Investment Management Inc.
522 Fifth Avenue
New York, NY 10036 | | Vice
President | | Since
July
2004 | | Managing Director and General Counsel, U.S. Investment Management of Morgan Stanley Investment Management (since July 2004); Vice President of the Retail Funds and Institutional Funds (since July 2004); Vice President of the Van Kampen Funds (since August 2004); Secretary (since February 2006) and Managing Director (since July 2004) of the Adviser and various entities affiliated with the Adviser. Formerly, Managing Director and General Counsel — Americas, UBS Global Asset Management (July 2000-July 2004). |
| | | | | | |
Carsten Otto (44)
Morgan Stanley Investment Management Inc.
522 Fifth Avenue
New York, NY 10036 | | Chief
Compliance
Officer | | Since
October
2004 | | Managing Director and Global Head of Compliance for Morgan Stanley Investment Management (since April 2007) and Chief Compliance Officer of Morgan Stanley Retail Funds and Institutional Funds (since October 2004). Formerly, U.S. Director of Compliance (October 2004 - April 2007) and Assistant Secretary and Assistant General Counsel of the Retail Funds. |
| | | | | | |
Stefanie V. Chang Yu (41)
Morgan Stanley Investment Management Inc.
522 Fifth Avenue
New York, NY 10036 | | Vice
President | | Since
December
1997 | | Managing Director of the Adviser and various entities affiliated with the Adviser; Vice President of the Retail Funds (since July 2002) and the Institutional Funds (since December 1997). Formerly, Secretary of various entities affiliated with the Adviser. |
| | | | | | |
Mary E. Mullin (40)
Morgan Stanley Investment Management Inc.
522 Fifth Avenue
New York, NY 10036 | | Secretary | | Since
June
1999 | | Executive Director of the Adviser and various entities affiliated with the Adviser; Secretary of the Retail Funds (since July 2003) and the Institutional Funds (since June 1999). |
| | | | | | |
James W. Garrett (39)
Morgan Stanley Investment Management Inc.
522 Fifth Avenue
New York, NY 10036 | | Treasurer and
Chief
Financial
Officer | | Treasurer since
February 2002
and Chief
Financial Officer
since July 2003 | | Head of Global Fund Administration; Managing Director of the Adviser and various entities affiliated with the Adviser; Treasurer and Chief Financial Officer of the Institutional Funds. |
| |
* | This is the earliest date the Officer began serving the Retail Funds or Institutional Funds. Each Officer serves an indefinite term, until his or her successor is elected. |
| | |
239
2007 Annual Report |
|
December 31, 2007 |
Investment Adviser and Administrator
Morgan Stanley Investment Management Inc.
522 Fifth Avenue
New York, NY 10036
Distributor
Morgan Stanley Distribution, Inc.
One Tower Bridge
100 Front Street, Suite 1100
West Conshohocken, PA 19428-2899
Custodian
JPMorgan Chase Bank, N.A.
270 Park Avenue
New York, NY 10017
Legal Counsel
Clifford Chance US LLP
31 West 52nd Street
New York, NY 10019-6131
Independent Registered Public Accounting Firm
Ernst & Young LLP
200 Clarendon Street
Boston, MA 02116-5072
Reporting to Shareholders
Each Morgan Stanley Fund provides a complete schedule of portfolio holdings in its semi-annual and annual reports within 60 days of the end of the Fund’s second and fourth fiscal quarters. The semi-annual reports and the annual reports are filed electronically with the Securities and Exchange Commission (SEC) on Form N-CSRS and Form N-CSR, respectively. Morgan Stanley also delivers the semi-annual and annual reports to Fund shareholders and makes these reports available on its public website, www.morganstanley.com. Each Morgan Stanley Fund also files a complete schedule of portfolio holdings with the SEC for the Fund’s first and third fiscal quarters on Form N-Q. Morgan Stanley does not deliver the reports for the first and third fiscal quarters to shareholders, nor are the reports posted to the Morgan Stanley public website. You may, however, obtain the Form N-Q filings (as well as the Form N-CSR and N-CSRS filings) by accessing the SEC’s website, http:/www.sec.gov. You may also review and copy them at the SEC’s public reference room in Washington, DC. Information on the operation of the SEC’s Public Reference Room may be obtained by calling the SEC at 1(800) SEC-0330. You can also request copies of these materials, upon payment of a duplicating fee, by electronic request at the SEC’s email address (publicinfo@sec.gov) or by writing the Public Reference section of the SEC, Washington, DC 20549-0102.
Proxy Voting Policies and Procedures and Proxy Voting Record
You may obtain a copy of the Fund’s Proxy Voting Policy and Procedures and information regarding how the Fund voted proxies relating to portfolio securities during the most recent twelve-month period ended June 30, without charge, upon request, by calling toll-free 1(800) 548-7786 or by visiting our website at www.morganstanley.com/msim. This information is also available on the SEC’s website at http://www.sec.gov.
This report is authorized for distribution only when preceded or accompanied by the prospectus of the Morgan Stanley Institutional Fund, Inc. which describes in detail each Investment Portfolio’s investment policies, risks, fees and expenses. Please read the prospectus carefully before you invest or send money. For additional information, including information regarding the investments comprising the Portfolio, please visit our website at www.morganstanley.com/msim or call 1(800) 548-7786.
240
Printed in U.S.A.
This Report has been prepared for shareholders and may be distributed to
others only if preceded or accompanied by a current prospectus.
Morgan Stanley Investment Management Inc.
522 Fifth Avenue
New York, NY 10036
MSIF: (800) 548-7786
© 2008 Morgan Stanley

| MSIFTANN IU08-00820P-Y12/07 |
Item 2. Code of Ethics.
(a) The Fund has adopted a code of ethics (the “Code of Ethics”) that applies to its principal executive officer, principal financial officer, principal accounting officer or controller, or persons performing similar functions, regardless of whether these individuals are employed by the Fund or a third party.
(b) No information need be disclosed pursuant to this paragraph.
(c) Not applicable.
(d) Not applicable.
(e) Not applicable.
(f)
(1) The Fund’s Code of Ethics is attached hereto as Exhibit 12 A.
(2) Not applicable.
(3) Not applicable.
Item 3. Audit Committee Financial Expert.
The Fund’s Board of Trustees has determined that Joseph J. Kearns, an “independent” Trustee, is an “audit committee financial expert” serving on its audit committee. Under applicable securities laws, a person who is determined to be an audit committee financial expert will not be deemed an “expert” for any purpose, including without limitation for the purposes of Section 11 of the Securities Act of 1933, as a result of being designated or identified as an audit committee financial expert. The designation or identification of a person as an audit committee financial expert does not impose on such person any duties, obligations, or liabilities that are greater than the duties, obligations, and liabilities imposed on such person as a member of the audit committee and Board of Trustees in the absence of such designation or identification.
Item 4. Principal Accountant Fees and Services.
(a)(b)(c)(d) and (g). Based on fees billed for the periods shown:
2007
| | Registrant | | Covered Entities(1) | |
Audit Fees | | $ | 724,100 | | N/A | |
| | | | | |
Non-Audit Fees | | | | | |
Audit-Related Fees | | $ | | $ | 731,800 | (2) |
Tax Fees | | $ | 71,650 | (3) | $ | 104,020 | (4) |
All Other Fees | | $ | | $ | 166,270 | (5) |
Total Non-Audit Fees | | $ | 71,650 | | $ | 1,002,090 | |
| | | | | |
Total | | $ | 795,750 | | $ | 1,002,090 | |
2006
| | Registrant | | Covered Entities(1) | |
Audit Fees | | $ | 627,000 | | N/A | |
| | | | | |
Non-Audit Fees | | | | | |
Audit-Related Fees | | $ | | $ | 756,000 | (2) |
Tax Fees | | $ | 68,000 | (3) | $ | 79,422 | (6) |
All Other Fees | | $ | | $ | 531,708 | (7) |
Total Non-Audit Fees | | $ | 68,000 | | $ | 1,367,130 | |
| | | | | |
Total | | $ | 695,000 | | $ | 1,367,130 | |
N/A- Not applicable, as not required by Item 4.
(1) Covered Entities include the Adviser (excluding sub-advisors) and any entity controlling, controlled by or under common control with the Adviser that provides ongoing services to the Registrant.
(2) Audit-Related Fees represent assurance and related services provided that are reasonably related to the performance of the audit of the financial statements of the Covered Enti ties and funds advised by the Adviser or its affiliates, specifically attestation services provided in connection with a SAS 70 Report.
(3) Tax Fees represent tax advice and compliance services provided in connection with the review of the Registrant’s tax returns.
(4) Tax Fees represent tax advice services provided to Covered Entities, including research and identification of PFIC Entities and consulting services for the Van Kampen Funds.
(5) All Other Fees represent attestation services provided in connection with performance presentation standards.
(6) Tax Fees represent tax advice services provided to Covered Entities, including research and identification of PFIC Entities.
(7) All Other Fees represent attestation servic es provided in connection with performance presentation standards and a compliance review project performed.
(e)(1) The audit committee’s pre-approval policies and procedures are as follows:
APPENDIX A
AUDIT COMMITTEE
AUDIT AND NON-AUDIT SERVICES
PRE-APPROVAL POLICY AND PROCEDURES
OF THE
MORGAN STANLEY RETAIL AND INSTITUTIONAL FUNDS
AS ADOPTED AND AMENDED JULY 23, 2004,(1)
1. Statement of Principles
The Audit Committee of the Board is required to review and, in its sole discretion, pre-approve all Covered Services to be provided by the Independent Auditors to the Fund and Covered Entities in order to assure that services performed by the Independent Auditors do not impair the auditor’s independence from the Fund.
The SEC has issued rules specifying the types of services that an independent auditor may not provide to its audit client, as well as the audit committee’s administration of the engagement of the independent auditor. The SEC’s rules establish two different approaches to pre-approving services, which the SEC considers to be equally valid. Proposed services either: may be pre-approved without consideration of specific case-by-case services by the Audit Committee (“general pre-approval”); or require the specific pre-approval of the Audit Committee or its delegate (“specific pre-approval”). The Audit Committee believes that the combination of these two approaches in this Policy will result in an effective and efficient procedure to pre-approve services performed by the Independent Auditors. As set forth in this Policy, unless a type of service has received general pre-approval, it will require specific pre-approval by the Audit Committee (or by any member of the Audit Committee to which pre-approval authority has been delegated) if it is to be provided by the Independent Auditors. Any proposed services exceeding
(1) This Audit Committee Audit and Non-Audit Services Pre-Approval Policy and Procedures (the “Policy”), adopted as of the date above, supersedes and replaces all prior versions that may have been adopted from time to time.
pre-approved cost levels or budgeted amounts will also require specific pre-approval by the Audit Committee.
The appendices to this Policy describe the Audit, Audit-related, Tax and All Other services that have the general pre-approval of the Audit Committee. The term of any general pre-approval is 12 months from the date of pre-approval, unless the Audit Committee considers and provides a different period and states otherwise. The Audit Committee will annually review and pre-approve the services that may be provided by the Independent Auditors without obtaining specific pre-approval from the Audit Committee. The Audit Committee will add to or subtract from the list of general pre-approved services from time to time, based on subsequent determinations.
The purpose of this Policy is to set forth the policy and procedures by which the Audit Committee intends to fulfill its responsibilities. It does not delegate the Audit Committee’s responsibilities to pre-approve services performed by the Independent Auditors to management.
The Fund’s Independent Auditors have reviewed this Policy and believes that implementation of the Policy will not adversely affect the Independent Auditors’ independence.
2. Delegation
As provided in the Act and the SEC’s rules, the Audit Committee may delegate either type of pre-approval authority to one or more of its members. The member to whom such authority is delegated must report, for informational purposes only, any pre-approval decisions to the Audit Committee at its next scheduled meeting.
3. Audit Services
The annual Audit services engagement terms and fees are subject to the specific pre-approval of the Audit Committee. Audit services include the annual financial statement audit and other procedures required to be performed by the Independent Auditors to be able to form an opinion on the Fund’s financial statements. These other procedures include information systems and procedural reviews and testing performed in order to understand and place reliance on the systems of internal control, and consultations relating to the audit. The Audit Committee will approve, if necessary, any changes in terms, conditions and fees resulting from changes in audit scope, Fund structure or other items.
In addition to the annual Audit services engagement approved by the Audit Committee, the Audit Committee may grant general pre-approval to other Audit services, which are those services that only the Independent Auditors reasonably can provide. Other Audit services may include statutory audits and services associated with SEC registration statements (on Forms N-1A, N-2, N-3, N-4, etc.), periodic reports and other documents filed with the SEC or other documents issued in connection with securities offerings.
The Audit Committee has pre-approved the Audit services in Appendix B.1. All other Audit services not listed in Appendix B.1 must be specifically pre-approved by the Audit Committee (or by any member of the Audit Committee to which pre-approval has been delegated).
4. Audit-related Services
Audit-related services are assurance and related services that are reasonably related to the performance of the audit or review of the Fund’s financial statements and, to the extent they are Covered Services, the Covered Entities or that are traditionally performed by the Independent Auditors. Because the Audit Committee believes that the provision of Audit-related services does not impair the independence of the auditor and is consistent with the SEC’s rules on auditor independence, the Audit Committee may grant general pre-approval to Audit-related services. Audit-related services include, among others, accounting consultations related to accounting, financial reporting or disclosure matters not classified as “Audit services”; assistance with understanding and implementing new accounting and financial reporting guidance from rulemaking authorities; agreed-upon or expanded audit procedures related to accounting and/or billing records required to respond to or comply with financial, accounting or regulatory reporting matters; and assistance with internal control reporting requirements under Forms N-SAR and/or N-CSR.
The Audit Committee has pre-approved the Audit-related services in Appendix B.2. All other Audit-related services not listed in Appendix B.2 must be specifically pre-approved by the Audit Committee (or by any member of the Audit Committee to which pre-approval has been delegated).
5. Tax Services
The Audit Committee believes that the Independent Auditors can provide Tax services to the Fund and, to the extent they are Covered Services, the Covered Entities, such as tax compliance, tax planning and tax advice without impairing the auditor’s independence, and the SEC has stated that the Independent Auditors may provide such services.
Pursuant to the preceding paragraph, the Audit Committee has pre-approved the Tax Services in Appendix B.3. All Tax services in Appendix B.3 must be specifically pre-approved by the Audit Committee (or by any member of the Audit Committee to which pre-approval has been delegated).
6. All Other Services
The Audit Committee believes, based on the SEC’s rules prohibiting the Independent Auditors from providing specific non-audit services, that other types of non-audit services are permitted. Accordingly, the Audit Committee believes it may grant general pre-approval to those permissible non-audit services classified as All Other services that it believes are routine and recurring services, would not impair the independence of the auditor and are consistent with the SEC’s rules on auditor independence.
The Audit Committee has pre-approved the All Other services in Appendix B.4. Permissible All Other services not listed in Appendix B.4 must be specifically pre-approved by the Audit Committee (or by any member of the Audit Committee to which pre-approval has been delegated).
7. Pre-Approval Fee Levels or Budgeted Amounts
Pre-approval fee levels or budgeted amounts for all services to be provided by the Independent Auditors will be established annually by the Audit Committee. Any proposed services exceeding these levels or amounts will require specific pre-approval by the Audit Committee. The Audit Committee is mindful of the overall relationship of fees for audit and non-audit services in determining whether to pre-approve any such services.
8. Procedures
All requests or applications for services to be provided by the Independent Auditors that do not require specific approval by the Audit Committee will be submitted to the Fund’s Chief Financial Officer and must include a detailed description of the services to be rendered. The Fund’s Chief Financial Officer will determine whether such services are included within the list of services that have received the general pre-approval of the Audit Committee. The Audit Committee will be informed on a timely basis of any such services rendered by the Independent Auditors. Requests or applications to provide services that require specific approval by the Audit Committee will be submitted to the Audit Committee by both the Independent Auditors and the Fund’s Chief Financial Officer, and must include a joint statement as to whether, in their view, the request or application is consistent with the SEC’s rules on auditor independence.
The Audit Committee has designated the Fund’s Chief Financial Officer to monitor the performance of all services provided by the Independent Auditors and to determine whether such services are in compliance with this Policy. The Fund’s Chief Financial Officer will report to the Audit Committee on a periodic basis on the results of its monitoring. Both the Fund’s Chief Financial Officer and management will immediately report to the chairman of the Audit Committee any breach of this Policy that comes to the attention of the Fund’s Chief Financial Officer or any member of management.
9. Additional Requirements
The Audit Committee has determined to take additional measures on an annual basis to meet its responsibility to oversee the work of the Independent Auditors and to assure the auditor’s independence from the Fund, such as reviewing a formal written statement from the Independent Auditors delineating all relationships between the Independent Auditors and the Fund, consistent with Independence Standards Board No. 1, and discussing with the Independent Auditors its methods and procedures for ensuring independence.
10. Covered Entities
Covered Entities include the Fund’s investment adviser(s) and any entity controlling, controlled by or under common control with the Fund’s investment adviser(s) that provides ongoing services to the Fund(s). Beginning with non-audit service contracts entered into on or after May 6, 2003, the Fund’s audit committee must pre-approve non-audit services provided not only to the Fund but also to the Covered Entities if the engagements relate directly to the operations and financial reporting of the Fund. This list of Covered Entities would include:
Morgan Stanley Retail Funds
Morgan Stanley Investment Advisors Inc.
Morgan Stanley & Co. Incorporated
Morgan Stanley DW Inc.
Morgan Stanley Investment Management Inc.
Morgan Stanley Investment Management Limited
Morgan Stanley Investment Management Private Limited
Morgan Stanley Asset & Investment Trust Management Co., Limited
Morgan Stanley Investment Management Company
Van Kampen Asset Management
Morgan Stanley Services Company, Inc.
Morgan Stanley Distributors Inc.
Morgan Stanley Trust FSB
Morgan Stanley Institutional Funds
Morgan Stanley Investment Management Inc.
Morgan Stanley Investment Advisors Inc.
Morgan Stanley Investment Management Limited
Morgan Stanley Investment Management Private Limited
Morgan Stanley Asset & Investment Trust Management Co., Limited
Morgan Stanley Investment Management Company
Morgan Stanley & Co. Incorporated
Morgan Stanley Distribution, Inc.
Morgan Stanley AIP GP LP
Morgan Stanley Alternative Investment Partners LP
(e)(2) Beginning with non-audit service contracts entered into on or after May 6, 2003, the audit committee also is required to pre-approve services to Covered Entities to the extent that the services are determined to have a direct impact on the operations or financial reporting of the Registrant. 100% of such services were pre-approved by the audit committee pursuant to the Audit Committee’s pre-approval policies and procedures (attached hereto).
(f) Not applicable.
(g) See table above.
(h) The audit committee of the Board of Trustees has considered whether the provision of services other than audit services performed by the auditors to the Registrant and Covered Entities is compatible with maintaining the auditors’ independence in performing audit services.
Item 5. Audit Committee of Listed Registrants.
(a) The Fund has a separately-designated standing audit committee established in accordance with Section 3(a)(58)(A) of the Exchange Act whose members are: Frank Joseph Kearns, Michael Nugent and Allen Reed.
(b) Not applicable.
Item 6. Schedule of Investments
Refer to Item 1.
Item 7. Disclosure of Proxy Voting Policies and Procedures for Closed-End Management Investment Companies.
Applicable only to reports filed by closed-end funds.
Item 8. Portfolio Managers of Closed-End Management Investment Companies
Applicable only to reports filed by closed-end funds.
Item 9. Closed-End Fund Repurchases
Applicable only to reports filed by closed-end funds.
Item 10. Submission of Matters to a Vote of Security Holders
Not applicable.
Item 11. Controls and Procedures
(a) The Fund’s principal executive officer and principal financial officer have concluded that the Fund’s disclosure controls and procedures are sufficient to ensure that information required to be disclosed by the Fund in this Form N-CSR was recorded, processed, summarized and reported within the time periods specified in the Securities and Exchange Commission’s rules and forms, based upon such officers’ evaluation of these controls and procedures as of a date within 90 days of the filing date of the report.
(b) There were no changes in the registrant’s internal control over financial reporting that occurred during the second fiscal quarter of the period covered by this report that has materially affected, or is reasonably likely to materially affect, the registrant’s internal control over financial reporting.
Item 12. Exhibits
(a) The Code of Ethics for Principal Executive and Senior Financial Officers is attached hereto.
(b) A separate certification for each principal executive officer and principal financial officer of the registrant are attached hereto as part of EX-99.CERT.
SIGNATURES
Pursuant to the requirements of the Securities Exchange Act of 1934 and the Investment Company Act of 1940, the registrant has duly caused this report to be signed on its behalf by the undersigned, thereunto duly authorized.
(Registrant) | Morgan Stanley Institutional Fund, Inc. | |
| |
By: | /s/ Ronald E. Robison | |
| |
Name: | Ronald E. Robison |
Title: | Principal Executive Officer |
Date: | February 15, 2008 |
| | | | | |
Pursuant to the requirements of the Securities Exchange Act of 1934 and the Investment Company Act of 1940, this report has been signed by the following persons on behalf of the registrant and in the capacities and on the dates indicated.
By: | /s/ Ronald E. Robison | |
| |
Name: | Ronald E. Robison |
Title: | Principal Executive Officer |
Date: | February 15, 2008 |
| | | | |
By: | /s/ James W. Garrett | |
| |
Name: | James W. Garrett |
Title: | Principal Financial Officer |
Date: | February 15, 2008 |
| | | | |