[ANNOTATED FORM N-CSR FOR ANNUAL REPORTS]
UNITED STATES
SECURITIES AND EXCHANGE COMMISSION
Washington, D.C. 20549
FORM N-CSR
CERTIFIED SHAREHOLDER REPORT OF REGISTERED
MANAGEMENT INVESTMENT COMPANIES
Investment Company Act file number | 811-05624 | |||||||
| ||||||||
Morgan Stanley Institutional Fund, Inc. | ||||||||
(Exact name of registrant as specified in charter) | ||||||||
| ||||||||
1221 Avenue of the Americas 5th Floor New York, NY |
| 10020 | ||||||
(Address of principal executive offices) |
| (Zip code) | ||||||
| ||||||||
Ronald E. Robison | ||||||||
(Name and address of agent for service) | ||||||||
| ||||||||
Registrant’s telephone number, including area code: | 1-800-221-6726 |
| ||||||
| ||||||||
Date of fiscal year end: | 12/31 |
| ||||||
| ||||||||
Date of reporting period: | 12/31/06 |
| ||||||
Form N-CSR is to be used by management investment companies to file reports with the Commission not later than 10 days after the transmission to stockholders of any report that is required to be transmitted to stockholders under Rule 30e-1 under the Investment Company Act of 1940 (17 CFR 270.30e-1). The Commission may use the information provided on Form N-CSR in its regulatory, disclosure review, inspection, and policymaking roles.
A registrant is required to disclose the information specified by Form N-CSR, and the Commission will make this information public. A registrant is not required to respond to the collection of information contained in Form N-CSR unless the Form displays a currently valid Office of Management and Budget (“OMB”) control number. Please direct comments concerning the accuracy of the information collection burden estimate and any suggestions for reducing the burden to Secretary, Securities and Exchange Commission, 450 Fifth Street, NW, Washington, DC 20549-0609. The OMB has reviewed this collection of information under the clearance requirements of 44 U.S.C. Section 3507.
ITEM 1. REPORTS TO STOCKHOLDERS.
The Fund’s annual report transmitted to shareholders pursuant to Rule 30e-1 under the Investment Company Act of 1940 is as follows:
| 2006 Annual Report |
|
|
| December 31, 2006 |
| |
Morgan Stanley Institutional Fund, Inc.
Global and International Equity Portfolios | Fixed Income Portfolio |
|
|
Active International Allocation | Emerging Markets Debt |
Emerging Markets |
|
Global Franchise |
|
Global Real Estate |
|
Global Value Equity |
|
International Equity |
|
International Growth Equity |
|
International Magnum |
|
International Real Estate |
|
International Small Cap |
|
|
|
U.S. Equity Portfolios |
|
|
|
Focus Equity |
|
Large Cap Relative Value |
|
Small Company Growth |
|
Systematic Active Large Cap Core |
|
Systematic Active Small Cap Core |
|
Systematic Active Small Cap Growth |
|
Systematic Active Small Cap Value |
|
U.S. Large Cap Growth |
|
U.S. Real Estate |
|
| 2006 Annual Report |
|
|
| December 31, 2006 |
Table of Contents
Shareholder’s Letter | 3 |
|
|
Performance Summary | 4 |
|
|
Investment Overview and Portfolios of Investments |
|
|
|
Global and International Equity Portfolios: |
|
|
|
Active International Allocation | 6 |
|
|
Emerging Markets | 21 |
|
|
Global Franchise | 28 |
|
|
Global Real Estate | 32 |
|
|
Global Value Equity | 38 |
|
|
International Equity | 43 |
|
|
International Growth Equity | 49 |
|
|
International Magnum | 54 |
|
|
International Real Estate | 61 |
|
|
International Small Cap | 67 |
|
|
U.S. Equity Portfolios: |
|
|
|
Focus Equity | 72 |
|
|
Large Cap Relative Value | 76 |
|
|
Small Company Growth | 81 |
|
|
Systematic Active Large Cap Core | 86 |
|
|
Systematic Active Small Cap Core | 93 |
|
|
Systematic Active Small Cap Growth | 101 |
|
|
Systematic Active Small Cap Value | 109 |
|
|
U.S. Large Cap Growth | 117 |
|
|
U.S. Real Estate | 121 |
|
|
Fixed Income Portfolio: |
|
|
|
Emerging Markets Debt | 126 |
|
|
Statements of Assets and Liabilities | 132 |
|
|
Statements of Operations | 137 |
|
|
Statements of Changes in Net Assets | 141 |
|
|
Financial Highlights | 151 |
|
|
Notes to Financial Statements | 171 |
|
|
Report of Independent Registered Public Accounting Firm | 183 |
|
|
Federal Tax Information | 184 |
|
|
Director and Officer Information | 186 |
This report is authorized for distribution only when preceded or accompanied by prospectuses of the Morgan Stanley Institutional Fund, Inc. To receive a prospectus and/or SAI, which contains more complete information such as investment objectives, charges, expenses, policies for voting proxies, risk considerations, and describes in detail each of the Portfolio’s investment policies to the prospective investor, please call 1-(800)-548-7786. Please read the prospectuses carefully before you invest or send money. Additionally, you can access portfolio information including performance, characteristics, and investment team commentary through Morgan Stanley Investment Management’s website: www.morganstanley.com/im.
1
(This Page has been left blank intentionally.)
2
| 2006 Annual Report |
|
|
| December 31, 2006 |
Shareholder’s Letter (unaudited)
Dear Shareholders:
We are pleased to present to you the Fund’s Annual Report for the year ended December 31, 2006. Our Fund currently offers 20 portfolios providing investors with a full array of global and domestic equity and fixed-income products. The Fund’s portfolios, together with the portfolios of the Morgan Stanley Institutional Fund Trust, provide investors with a means to help them meet specific investment needs and to allocate their investments among equities (e.g., value and growth; small, medium, and large capitalization) and fixed income (e.g., short, medium, and long duration; investment grade and high yield).
Sincerely,
|
|
Ronald E. Robison | |
President and Principal Executive Officer | |

January 2007
3
2006 Annual Report |
|
|
|
December 31, 2006 |
|
Performance Summary
|
| Inception Dates |
| One Year |
| ||||||
|
|
|
|
|
|
|
|
|
| Comparable |
|
|
| Class A |
| Class B |
| Class A |
| Class B |
| Indices |
|
Global and International Equity Portfolios: |
|
|
|
|
|
|
|
|
|
|
|
Active International Allocation |
| 1/17/92 |
| 1/2/96 |
| 24.34 | % | 23.95 | % | 26.34 | %(1) |
Emerging Markets |
| 9/25/92 |
| 1/2/96 |
| 38.00 |
| 37.65 |
| 32.17 | (2) |
Global Franchise |
| 11/28/01 |
| 11/28/01 |
| 21.60 |
| 21.31 |
| 20.07 | (3) |
Global Real Estate† |
| 8/30/06 |
| 8/30/06 |
| — |
| — |
| — | (4) |
Global Value Equity |
| 7/15/92 |
| 1/2/96 |
| 21.40 |
| 21.05 |
| 20.07 | (3) |
International Equity |
| 8/4/89 |
| 1/2/96 |
| 22.50 |
| 22.21 |
| 26.34 | (1) |
International Growth Equity |
| 12/27/05 |
| 12/27/05 |
| 27.92 |
| 27.49 |
| 26.34 | (1) |
International Magnum |
| 3/15/96 |
| 3/15/96 |
| 25.39 |
| 25.10 |
| 26.34 | (1) |
International Real Estate |
| 10/1/97 |
| 10/1/97 |
| 56.06 |
| 55.69 |
| 60.15 | (5) |
International Small Cap |
| 12/15/92 |
| — |
| 19.61 |
| — |
| 19.31 | (6) |
|
|
|
|
|
|
|
|
|
|
|
|
U.S. Equity Portfolios: |
|
|
|
|
|
|
|
|
|
|
|
Focus Equity |
| 3/8/95 |
| 1/2/96 |
| 2.77 |
| 2.49 |
| 9.07 | (7) |
Large Cap Relative Value |
| 1/31/90 |
| 1/2/96 |
| 16.74 |
| 16.38 |
| 22.25 | (8) |
Small Company Growth |
| 11/1/89 |
| 1/2/96 |
| 11.90 |
| 11.55 |
| 13.35 | (9) |
Systematic Active Large Cap Core†† |
| 4/28/06 |
| 4/28/06 |
| — |
| — |
| — | (10) |
Systematic Active Small Cap Core†† |
| 4/28/06 |
| 4/28/06 |
| — |
| — |
| — | (11) |
Systematic Active Small Cap Growth†† |
| 4/28/06 |
| 4/28/06 |
| — |
| — |
| — | (9) |
Systematic Active Small Cap Value†† |
| 4/28/06 |
| 4/28/06 |
| — |
| — |
| — | (12) |
U.S. Large Cap Growth |
| 4/2/91 |
| 1/2/96 |
| 4.07 |
| 3.85 |
| 9.07 | (7) |
U.S. Real Estate |
| 2/24/95 |
| 1/2/96 |
| 38.85 |
| 38.52 |
| 35.06 | (13) |
|
|
|
|
|
|
|
|
|
|
|
|
Fixed Income Portfolio: |
|
|
|
|
|
|
|
|
|
|
|
Emerging Markets Debt |
| 2/1/94 |
| 1/2/96 |
| 11.08 |
| 10.79 |
| 9.88 | (14) |
† Performance figures are cumulative since inception as the Portfolio commenced operations on August 30, 2006.
†† Performance figures are cumulative since inception as the Portfolios commenced operations on April 28, 2006.
4
| 2006 Annual Report |
|
|
| December 31, 2006 |
Performance Summary (cont’d)
Five Year |
|
|
| Ten Year |
|
|
| Since Inception |
|
|
| ||||||||||||||
Average Annual Total Return |
|
|
| Average Annual Total Return |
|
|
| Average Annual Total Return |
|
|
| ||||||||||||||
|
|
|
|
|
|
|
|
|
|
|
|
|
|
|
|
|
| Comparable |
|
|
| Comparable |
|
|
|
|
|
|
| Comparable |
|
|
|
|
|
|
| Comparable |
|
|
|
|
| Indices - |
|
|
| Indices - |
|
|
|
Class A |
| Class B |
| Indices |
|
|
| Class A |
| Class B |
| Indices |
|
|
| Class A |
| Class A |
| Class B |
| Class B |
|
|
|
|
|
|
|
|
|
|
|
|
|
|
|
|
|
|
|
|
|
|
|
|
|
|
|
|
|
14.10 | % | 13.79 | % | 14.98 | %(1) |
|
| 8.48 | % | 8.24 | % | 7.71 | %(1) |
|
| 8.56 | % | 8.22 | % | 8.33 | % | 7.55 | %(1) |
|
|
27.35 |
| 27.02 |
| 26.59 | (2) |
|
| 11.34 |
| 11.05 |
| 9.21 | (2) |
|
| 11.84 |
| 10.67 |
| 11.08 |
| 8.85 | (2) |
|
|
16.44 |
| 16.15 |
| 9.97 | (3) |
|
| — |
| — |
| — | (3) |
|
| 17.20 |
| 10.15 |
| 16.87 |
| 10.15 | (3) |
|
|
— |
| — |
| — | (4) |
|
| — |
| — |
| — | (4) |
|
| 17.20 |
| 17.01 |
| 17.11 |
| 17.01 | (4) |
|
|
9.38 |
| 9.09 |
| 9.97 | (3) |
|
| 8.99 |
| 8.69 |
| 7.64 | (3) |
|
| 12.05 |
| 9.34 |
| 9.84 |
| 8.12 | (3) |
|
|
14.80 |
| 14.54 |
| 14.98 | (1) |
|
| 11.98 |
| 11.72 |
| 7.71 | (1) |
|
| 11.97 |
| 6.17 |
| 12.33 |
| 7.55 | (1) |
|
|
— |
| — |
| — | (1) |
|
| — |
| — |
| — | (1) |
|
| 26.70 |
| 25.50 |
| 26.27 |
| 25.50 | (1) |
|
|
13.08 |
| 12.78 |
| 14.98 | (1) |
|
| 6.75 |
| 6.47 |
| 7.71 | (1) |
|
| 7.02 |
| 7.73 |
| 6.73 |
| 7.73 | (1) |
|
|
36.36 |
| 36.01 |
| 35.05 | (5) |
|
| — |
| — |
| — | (5) |
|
| 18.66 |
| 17.44 |
| 18.36 |
| 17.44 | (5) |
|
|
21.04 |
| — |
| 23.97 | (6) |
|
| 13.12 |
| — |
| 7.86 | (6) |
|
| 14.06 |
| 8.37 |
| — |
| — | (6) |
|
|
|
|
|
|
|
|
|
|
|
|
|
|
|
|
|
|
|
|
|
|
|
|
|
|
|
|
3.83 |
| 3.57 |
| 2.69 | (7) |
|
| 7.36 |
| 7.10 |
| 5.44 | (7) |
|
| 12.56 |
| 8.79 |
| 9.72 |
| 6.87 | (7) |
|
|
7.89 |
| 7.62 |
| 10.86 | (8) |
|
| 10.31 |
| 10.01 |
| 11.00 | (8) |
|
| 11.39 |
| 12.80 |
| 10.76 |
| 11.87 | (8) |
|
|
11.14 |
| 10.87 |
| 6.93 | (9) |
|
| 14.52 |
| 14.22 |
| 4.88 | (9) |
|
| 13.45 |
| 7.69 |
| 13.22 |
| 5.44 | (9) |
|
|
— |
| — |
| — | (10) |
|
| — |
| — |
| — | (10) |
|
| 7.85 |
| 9.65 |
| 7.68 |
| 9.65 | (10) |
|
|
— |
| — |
| — | (11) |
|
| — |
| — |
| — | (11) |
|
| (0.41 | ) | 3.90 |
| (0.57 | ) | 3.90 | (11) |
|
|
— |
| — |
| — | (9) |
|
| — |
| — |
| — | (9) |
|
| (2.20 | ) | (0.60 | ) | (2.30 | ) | (0.60 | )(9) |
|
|
— |
| — |
| — | (12) |
|
| — |
| — |
| — | (12) |
|
| 4.30 |
| 8.50 |
| 4.14 |
| 8.50 | (12) |
|
|
3.50 |
| 3.25 |
| 2.69 | (7) |
|
| 6.88 |
| 6.61 |
| 5.44 | (7) |
|
| 10.50 |
| 8.74 |
| 8.57 |
| 6.87 | (7) |
|
|
25.33 |
| 25.01 |
| 23.20 | (13) |
|
| 17.06 |
| 16.73 |
| 14.48 | (13) |
|
| 19.38 |
| 16.35 |
| 18.55 |
| 16.24 | (13) |
|
|
|
|
|
|
|
|
|
|
|
|
|
|
|
|
|
|
|
|
|
|
|
|
|
|
|
|
14.54 |
| 14.25 |
| 14.08 | (14) |
|
| 9.22 |
| 8.98 |
| 10.67 | (14) |
|
| 11.35 |
| 10.92 |
| 12.10 |
| 12.59 | (14) |
|
|
Performance data quoted assumes that all dividends and distributions, if any, were reinvested and represents past performance, which is no guarantee of future results. Current performance may be lower or higher than the figures shown. For the most recent month-end performance figures, please visit www.morganstanley.com/im or call 1-800-548-7786. Investment returns and principal value will fluctuate and fund shares, when redeemed, may be worth more or less than their original cost.
Indices:
(1) |
| MSCI EAFE (Europe, Australasia, and Far East) |
(2) |
| MSCI Emerging Markets Free Net |
(3) |
| MSCI World |
(4) |
| FTSE EPRA/NAREIT Global Real Estate (Net) |
(5) |
| FTSE EPRA/NAREIT Global Real Estate (80% Europe/20% Asia) |
(6) |
| MSCI EAFE Small Cap Total Return |
(7) |
| Russell 1000® Growth |
(8) |
| Russell 1000® Value |
(9) |
| Russell 2000® Growth |
(10) |
| S&P 500® |
(11) |
| Russell 2000® |
(12) |
| Russell 2000® Value |
(13) |
| FTSE NAREIT Equity REIT |
(14) |
| J.P. Morgan Emerging Markets Bond Global |
5
2006 Annual Report |
|
|
|
December 31, 2006 |
|
Investment Overview (unaudited)
Active International Allocation Portfolio
* Minimum Investment
In accordance with SEC regulations, Portfolio performance shown assumes that all recurring fees (including management fees) were deducted and all dividends and distributions were reinvested.
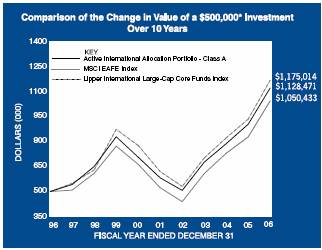
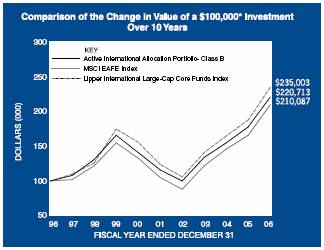
Performance Compared to the Morgan Stanley Capital International (MSCI) EAFE Index(1) and the Lipper International Large-Cap Core Funds Index(2)
|
| Total Returns(3) |
| ||||||
|
|
|
| Average Annual |
| ||||
|
| One |
| Five |
| Ten |
| Since |
|
|
| Year |
| Years |
| Years |
| Inception(6) |
|
Portfolio – Class A (4) |
| 24.34 | % | 14.10 | % | 8.48 | % | 8.56 | % |
MSCI EAFE Index |
| 26.34 |
| 14.98 |
| 7.71 |
| 8.22 |
|
Lipper International Large-Cap Core Funds Index |
| 25.11 |
| 13.60 |
| 8.92 |
| 9.84 |
|
|
|
|
|
|
|
|
|
|
|
Portfolio – Class B (5) |
| 23.95 |
| 13.79 |
| 8.24 |
| 8.33 |
|
MSCI EAFE Index |
| 26.34 |
| 14.98 |
| 7.71 |
| 7.55 |
|
Lipper International Large-Cap Core Funds Index |
| 25.11 |
| 13.60 |
| 8.92 |
| 9.34 |
|
Performance data quoted represents past performance, which is no guarantee of future results, and current performance may be lower or higher than the figures shown. Performance assumes that all dividends and distributions, if any, were reinvested. For the most recent month-end performance figures, please visit www.morganstanley.com/im. Investment return and principal value will fluctuate so that Portfolio shares, when redeemed, may be worth more or less than their original cost. Total returns do not reflect the deduction of taxes that a shareholder would pay on Portfolio distributions or the redemption of Portfolio shares.
(1) | The Morgan Stanley Capital International (MSCI) EAFE Index (Europe, Australasia, Far East) is a free float-adjusted market capitalization index that is designed to measure developed market equity performance, excluding the U.S. & Canada. The MSCI EAFE Index consists of the following 21 developed market country indices: Australia, Austria, Belgium, Denmark, Finland, France, Germany, Greece, Hong Kong, Ireland, Italy, Japan, the Netherlands, New Zealand, Norway, Portugal, Singapore, Spain, Sweden, Switzerland and the United Kingdom. The Index is unmanaged and its returns do not include any sales charges or fees. Such costs would lower performance. It is not possible to invest directly in an index. |
|
|
(2) | The Lipper International Large-Cap Core Funds Index is an equally weighted performance index of the largest qualifying funds (based on net assets) in the Lipper International Large-Cap Core Funds classification. The Index, which is adjusted for capital gains distributions and income dividends, is unmanaged and should not be considered an investment. There are currently 30 funds represented in this Index. As of the date of this report, the Portfolio is in the Lipper International Large-Cap Core Funds classification. |
|
|
(3) | Total returns for the Portfolio reflect fees waived and expenses reimbursed, if applicable, by the Adviser. Without such waivers and/or reimbursements, total returns would have been lower. Fee waivers and/or expense reimbursements are voluntary and the Adviser reserves the right to commence or terminate any waiver and/or reimbursement at any time. |
|
|
(4) | Commenced operations on January 17, 1992 |
|
|
(5) | Commenced operations on January 2, 1996 |
|
|
(6) | For comparative purposes, average annual since inception returns listed for the Indexes refer to the inception date or initial offering of the respective share class of the Portfolio, not the inception of the Index. |
The Active International Allocation Portfolio seeks long-term capital appreciation by investing primarily, in accordance with country and sector weightings determined by the Adviser, in equity securities of non-U.S. issuers which, in the aggregate, attempt to replicate broad market indices. Foreign investing involves certain risks, including currency fluctuations and controls, restrictions on foreign investments, less
6
| 2006 Annual Report |
|
|
| December 31, 2006 |
Investment Overview (cont’d)
Active International Allocation Portfolio
governmental supervision and regulation, less liquidity and the potential for market volatility and political instability.
Performance
For the year ended December 31, 2006, the Portfolio had a total return based on net asset value per share of 24.34%, net of fees, for Class A shares and 23.95%, net of fees, for Class B shares compared to 26.34% for the Morgan Stanley Capital International (MSCI) EAFE Index (the “Index”).
Factors Affecting Performance
• For international equity markets, 2006 had a nice start and finish, up 9.4% in the first quarter and up 10.4% in the fourth quarter, in U.S. dollar terms. However, the intervening six months were disappointing. The Index’s performance for these two middle quarters was 4.7%, but local currency strength camouflaged weak equity markets and the return in local currency terms for this period was flat.
• For the year as a whole, the Index gained 26.3% in 2006 led by Europe (up 33.7%), then Asia ex-Japan (up 32%) and finally, to cap a weak year, Japan (up 6%). In fact, most of Japan’s performance was delivered in the fourth quarter. The strength of local currencies heavily subsidized international market returns, with almost half coming from local currency appreciation. The euro gained 12% in 2006, the United Kingdom (U.K.). sterling rose 14%, and the Australian and Singapore dollars rose about 8%. Within Europe, Asia and the Far East (EAFE), only the Japanese yen did not rise against the U.S. dollar; it fell 1%.
• 2006 saw U.S. growth decelerate in the second half of the year as contractions in housing and auto production took significant chunks out of aggregate gross domestic product (GDP). Corporations also appear to have become more cautious on spending in recent months, possibly in anticipation of a consumer slowdown. However, contrary to bearish predictions, U.S. real personal consumption did not appear to be declining precipitously as growth continued to hover around 3%.
• Much of the rest of the world retained a robust pace of growth in 2006. Europe’s economies surprised on the upside throughout the year, as the engine of growth appeared to be in the process of transitioning from corporate expansion to a later-cycle consumer upswing. Emerging market economies, particularly China and India, also continued their impressive pace of structural growth. Japan was somewhat of a disappointment in 2006, as consumer spending has not accelerated as some observers expected.
• For the year, the Portfolio lagged the Index. Europe, in which the Portfolio held an underweight, significantly outperformed Japan during the period. Although Japan did outperform in the latter half of the fourth quarter, it was too little, too late. Furthermore, overweights to Hong Kong, Singapore and the emerging markets all contributed positively to the Portfolio’s performance but were not enough to offset the negative impacts of Europe and Japan.
Management Strategies
• Thus far, December data confirms that U.S. growth has slowed but does not appear to be falling apart. The manufacturing Purchasing Manager’s Index (PMI) rebounded a bit to 51.4, a figure indicating slight expansion, and jobless claims have hovered around 315,000 a week. Continued softness in the price of oil appears to be feeding through into better inflation data as both November core Consumer Price Index (CPI) and core Personal Consumption Expenditures (PCE) inflation came in below expectations. Core PCE now stands at 2.2% year-over-year. November housing starts ticked up from the previous month, fueling speculation that the decline in residential construction activity may be bottoming. However, the December National Association of Home Builders (NAHB) survey did post another decline.
• European data continues to be solid as December Economic and Monetary Union (EMU) manufacturing PMI came in at 56.5 with services PMI at 57.2. Both the December German Ifo “current assessment” and “expectations” measures came in above consensus, with the former hitting a new post-unification high. German unemployment also came in below expectations, hitting a new cycle low. The absolute decrease in unemployment was the largest decline since 1991. With the first quarter value-added tax (VAT) increase upon us, it will be interesting to see how much German growth contracts in response.
• In the U.K., housing prices continue to rebound with nationwide home prices up 10.5% year-over-year in December. December construction PMI was robust, although manufacturing PMI has begun to tail off a bit.
• The Japanese economy appears to be potentially stabilizing. The fourth quarter Tankan business survey was solid as capital investment plans continue to be upgraded and small and medium enterprises (SME) data was better than expected, indicating an expanding recovery base. November industrial production was decent, and it appears that consumer spending data has
7
2006 Annual Report |
|
|
|
December 31, 2006 |
|
Investment Overview (cont’d)
Active International Allocation Portfolio
been recovering in the fourth quarter. However, both the December Economy Watchers survey and the Shoko-Chukin small business survey were softer than expected. December manufacturing PMI also hit its lowest level since first quarter 2005.
• Equity market valuations look reasonable to us at this time. Relative to bonds and interest rates, equities globally appear to be at fair value, if no longer cheap, in our view. Earnings have probably peaked, but if growth and inflation stay moderate, we would look for expanding valuations in 2007. The strong market returns in the fourth quarter may have put the markets in overbought territory in the short-term (especially in parts of Asia), but we believe support remains given valuation levels, moderating oil prices and a stabilizing U.S. dollar.
Expense Examples
As a shareholder of the Portfolio, you may incur two types of costs: (1) transactional costs, including redemption fees; (2) ongoing costs, including management fees, distribution (12b-1) fees (in the case of Class B); and other Portfolio expenses. These examples are intended to help you understand your ongoing costs (in dollars) of investing in the Portfolio and to compare these costs with the ongoing costs of investing in other mutual funds.
The examples are based on an investment of $1,000 invested at the beginning of the six-month period ended December 31, 2006 and held for the entire six-month period.
Actual Expenses
The first line of the tables below provides information about actual account values and actual expenses. You may use the information in this line, together with the amount you invested, to estimate the expenses that you paid over the period. Simply divide your account value by $1,000 (for example, an $8,600 account value divided by $1,000 = 8.6), then multiply the result by the number in the first line under the heading entitled “Expenses Paid During Period” to estimate the expenses you paid on your account during this period.
Please note that “Expenses Paid During Period” are grossed up to reflect Portfolio expenses prior to the effect of Expense Offset (See Note E in the Notes to Financial Statements). Therefore, the annualized net expense ratios may differ from the ratio of the expenses to average net assets shown in the Financial Highlights.
Hypothetical Example for Comparison Purposes
The second line of the tables below provides information about hypothetical account values and hypothetical expenses based on the Portfolio’s actual expense ratio and an assumed rate of return of 5% per year before expenses, which is not the Portfolio’s actual return. The hypothetical account values and expenses may not be used to estimate the actual ending account balance or expenses you paid for the period. You may use this information to compare the ongoing costs of investing in the Portfolio and other funds. To do so, compare this 5% hypothetical example with the 5% hypothetical examples that appear in the shareholder reports of the other funds.
Please note that the expenses shown in the table are meant to highlight your ongoing costs only and do not reflect any transactional costs, such as redemption fees. Therefore, the second line of the table is useful in comparing ongoing costs only, and will not help you determine the relative total costs of owning different funds. In addition, if these transactional costs were included, your costs would have been higher.
|
| Beginning |
| Ending Account |
| Expenses Paid |
| |||
|
| Account Value |
| December 31, |
| December 31, |
| |||
|
| July 1,2006 |
| 2006 |
| 2006 |
| |||
Class A |
|
|
|
|
|
|
| |||
Actual |
| $ | 1,000.00 |
| $ | 1,142.30 |
| $ | 4.32 |
|
Hypothetical (5% average annual return |
| 1,000.00 |
| 1,021.17 |
| 4.08 |
| |||
|
|
|
|
|
|
|
| |||
Class B |
|
|
|
|
|
|
| |||
Actual |
| 1,000.00 |
| 1,141.10 |
| 5.67 |
| |||
Hypothetical (5% average annual return |
| 1,000.00 |
| 1,019.91 |
| 5.35 |
| |||
* Expenses are equal to Class A and Class B annualized net expense ratios of 0.80% and 1.05%, respectively, multiplied by the average account value over the period, multiplied by 184/365 (to reflect the one-half year period).
Graphic Presentation of Portfolio Holdings
The following graph depicts the Portfolio’s holdings by industry and/or security type, as a percentage of total investments.
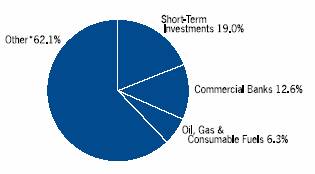
* Industries which do not appear in the above graph, as well as those which represent less than 5% of total investments, ifapplicable, are included in the category labeled “Other”.
January 2007
8
| 2006 Annual Report |
|
|
| December 31, 2006 |
Portfolio of Investments
Active International Allocation Portfolio
|
| Shares |
| Value |
| |
Common Stocks (90.9%) |
|
|
|
|
| |
Australia (2.9%) |
|
|
|
|
| |
AGL Energy Ltd. |
| (a)14,942 |
| $ | 191 |
|
Alinta Ltd. |
| (c)8,629 |
| 80 |
| |
Alumina Ltd. |
| 91,525 |
| 458 |
| |
Amcor Ltd. |
| 71,068 |
| 407 |
| |
AMP Ltd. |
| 42,736 |
| 341 |
| |
Ansell Ltd. |
| 5,679 |
| 50 |
| |
Australia & New Zealand Banking Group Ltd. |
| (c)46,465 |
| 1,035 |
| |
BHP Billiton Ltd. |
| 282,988 |
| 5,651 |
| |
BlueScope Steel Ltd. |
| 59,950 |
| 408 |
| |
Boral Ltd. |
| (c)47,082 |
| 284 |
| |
Brambles Industries Ltd. |
| (a)31,812 |
| 322 |
| |
Caltex Australia Ltd. |
| 29,853 |
| 542 |
| |
Coca-Cola Amatil Ltd. |
| 17,210 |
| 105 |
| |
Coles Myer Ltd. |
| (c)34,518 |
| 381 |
| |
Commonwealth Bank of Australia |
| 38,394 |
| 1,500 |
| |
CSL Ltd./Australia |
| 2,842 |
| 147 |
| |
CSR Ltd. |
| 76,379 |
| 226 |
| |
Foster’s Group Ltd. |
| 65,602 |
| 358 |
| |
Insurance Australia Group Ltd. |
| (c)54,613 |
| 274 |
| |
James Hardie Industries N.V. |
| (c)37,648 |
| 286 |
| |
John Fairfax Holdings Ltd. |
| (c)32,240 |
| 123 |
| |
Leighton Holdings Ltd. |
| (c)7,115 |
| 114 |
| |
Lend Lease Corp., Ltd. |
| (c)13,618 |
| 198 |
| |
Macquarie Bank Ltd. |
| 6,715 |
| 418 |
| |
Macquarie Infrastructure Group |
| 74,866 |
| 204 |
| |
Mayne Pharma Ltd. |
| (c)28,935 |
| 93 |
| |
National Australia Bank Ltd. |
| 51,258 |
| 1,635 |
| |
Newcrest Mining Ltd. |
| 26,212 |
| 545 |
| |
OneSteel Ltd. |
| (c)44,821 |
| 166 |
| |
Orica Ltd. |
| (c)22,596 |
| 433 |
| |
Origin Energy Ltd. |
| (c)213,888 |
| 1,396 |
| |
PaperlinX Ltd. |
| 36,382 |
| 113 |
| |
QBE Insurance Group Ltd. |
| 22,311 |
| 508 |
| |
Rinker Group Ltd. |
| (c)75,117 |
| 1,070 |
| |
Rio Tinto Ltd. |
| (c)24,545 |
| 1,440 |
| |
Santos Ltd. |
| (c)157,070 |
| 1,224 |
| |
Sonic Healthcare Ltd. |
| 5,616 |
| 66 |
| |
Stockland |
| 1,074 |
| 7 |
| |
Suncorp-Metway Ltd. |
| (c)17,718 |
| 285 |
| |
Sydney Roads Group |
| (c)24,955 |
| 26 |
| |
Symbion Health Ltd. |
| 28,935 |
| 87 |
| |
TABCORP Holdings Ltd. |
| 13,036 |
| 173 |
| |
Telstra Corp., Ltd. |
| 69,366 |
| 227 |
| |
Toll Holdings Ltd. |
| 12,151 |
| 175 |
| |
Transurban Group |
| (c)19,630 |
| 118 |
| |
Wesfarmers Ltd. |
| (c)12,074 |
| 358 |
| |
Westpac Banking Corp. |
| 54,298 |
| 1,039 |
| |
Woodside Petroleum Ltd. |
| (c)85,928 |
| 2,585 |
| |
Woolworths Ltd. |
| 33,259 |
| 627 |
| |
|
|
|
| 28,499 |
| |
Austria (1.0%) |
|
|
|
|
| |
Andritz AG |
| 975 |
| 212 |
| |
Bank Austria Creditanstalt AG |
| (c)2,955 |
| 467 |
| |
Boehler-Uddeholm AG |
| 4,948 |
| 347 |
| |
Erste Bank der Oesterreichischen Sparkassen AG |
| 25,742 |
| 1,974 |
| |
Flughafen Wien AG |
| 1,465 |
| 144 |
| |
IMMOFINANZ Immobilien Anlagen AG |
| (a)47,356 |
| 675 |
| |
Mayr-Melnhof Karton AG |
| 597 |
| 112 |
| |
Meinl European Land Ltd. |
| (a)15,541 |
| 399 |
| |
OMV AG |
| (c)22,741 |
| 1,291 |
| |
Raiffeisen International Bank Holding AG |
| 3,792 |
| 578 |
| |
Telekom Austria AG |
| 45,499 |
| 1,219 |
| |
Verbund-Oesterreichische Elektrizitaetswirtschafts AG, Class A |
| (c)10,670 |
| 569 |
| |
Voestalpine AG |
| 10,008 |
| 565 |
| |
Wiener Staedtische Allgemeine Versicherung AG |
| (c)3,115 |
| 219 |
| |
Wienerberger AG |
| 7,967 |
| 473 |
| |
|
|
|
| 9,244 |
| |
Belgium (0.9%) |
|
|
|
|
| |
AGFA-Gevaert N.V. |
| 4,251 |
| 109 |
| |
Bekaert S.A. |
| 539 |
| 67 |
| |
Belgacom S.A. |
| (c)6,763 |
| 298 |
| |
Dexia |
| 58,800 |
| 1,610 |
| |
Fortis |
| 90,067 |
| 3,843 |
| |
InBev N.V. |
| 3,651 |
| 241 |
| |
KBC Group N.V. |
| 8,105 |
| 994 |
| |
Solvay S.A., Class A |
| (c)4,197 |
| 644 |
| |
UCB S.A. |
| 6,911 |
| 474 |
| |
Umicore |
| 1,785 |
| 304 |
| |
|
|
|
| 8,584 |
| |
Brazil (1.3%) |
|
|
|
|
| |
AmBev |
| 241,555 |
| 107 |
| |
AmBev (Preference) |
| 1,200,781 |
| 592 |
| |
Aracruz Celulose S.A., Class B (Preference) |
| 31,988 |
| 197 |
| |
Arcelor Brasil S.A. |
| 5,404 |
| 106 |
| |
Banco Bradesco S.A. (Preference) |
| 29,000 |
| 1,174 |
| |
Banco Itau Holding Financeira S.A. (Preference) |
| 30,170 |
| 1,093 |
| |
Brasil Telecom Participacoes S.A. (Preference) |
| 16,991,044 |
| 146 |
| |
CEMIG S.A. (Preference) |
| 7,110,000 |
| 349 |
| |
Cia Brasileira de Distribuicao Grupo Pao de Acucar ADR (Preference) |
| (c)900 |
| 31 |
| |
Cia de Concessoes Rodoviarias |
| 18,000 |
| 243 |
| |
Cia Siderurgica Nacional S.A. |
| 5,976 |
| 180 |
| |
Contax Participacoes S.A. |
| 9,831 |
| 9 |
| |
CVRD, Class A (Preference) |
| 90,276 |
| 2,286 |
| |
Electrobras S.A., Class B (Preference) |
| 8,073,614 |
| 181 |
| |
Embratel Participacoes S.A. (Preference) |
| 7,843,216 |
| 26 |
| |
Empresa Brasileira De Aeronautica |
| 24,416 |
| 252 |
| |
Gerdau S.A. (Preference) |
| 23,250 |
| 380 |
| |
Gol Linhas Aereas Inteligentes S.A. ADR |
| (c)7,800 |
| 224 |
| |
Klabin S.A. (Preference) |
| 43,000 |
| 108 |
| |
Petrobras S.A. (Preference) |
| 158,500 |
| 3,694 |
| |
Sadia S.A. (Preference) |
| 34,500 |
| 116 |
| |
Souza Cruz S.A. |
| 5,800 |
| 103 |
| |
The accompanying notes are an integral part of the financial statements.
9
2006 Annual Report |
|
|
|
December 31, 2006 |
|
Portfolio of Investments (cont’d)
Active International Allocation Portfolio
|
| Shares |
| Value |
| |
Brazil (cont’d) |
|
|
|
|
| |
Tele Norte Leste Participacoes S.A. (Preference) |
| 20,831 |
| $ | 312 |
|
Unibanco ADR |
| (c)5,650 |
| 525 |
| |
Usiminas S.A., Class A (Preference) |
| 7,400 |
| 279 |
| |
Vivo Participacoes S.A. (Preference) |
| (a)31,339 |
| 128 |
| |
Votorantim Celulose e Papel S.A. (Preference) |
| 5,968 |
| 116 |
| |
|
|
|
| 12,957 |
| |
China (1.5%) |
|
|
|
|
| |
Air China Ltd., Class H |
| 289,000 |
| 156 |
| |
Aluminum Corp. of China Ltd., Class H |
| 294,000 |
| 272 |
| |
Angang New Steel Co. Ltd., Class H |
| 14,000 |
| 21 |
| |
Anhui Conch Cement Co., Ltd. |
| 6,000 |
| 20 |
| |
Anhui Expressway Co. |
| 506,000 |
| 409 |
| |
Bank of China Ltd. |
| (a)1,529,000 |
| 839 |
| |
Bank of Communications Co., Ltd. |
| 1,007,000 |
| 1,222 |
| |
China Construction Bank, Class H |
| (e)2,292,909 |
| 1,459 |
| |
China Life Insurance Co., Ltd. |
| 502,000 |
| 1,714 |
| |
China Mobile Hong Kong Ltd. |
| 166,500 |
| 1,438 |
| |
China Petroleum & Chemical Corp., Class H |
| 1,174,000 |
| 1,087 |
| |
China Shenhua Energy Co. |
| 237,500 |
| 572 |
| |
China Shipping Development Co., Ltd., Class H |
| 117,891 |
| 180 |
| |
China Telecom Corp., Ltd., Class H |
| 1,116,000 |
| 611 |
| |
Cosco Holdings |
| 223,000 |
| 145 |
| |
Datang International Power Generation Co., Ltd., Class H |
| (c)132,000 |
| 137 |
| |
Dongfeng Motor Group Co., Ltd. |
| (a)178,885 |
| 87 |
| |
Harbin Power Equipment |
| (c)318,000 |
| 365 |
| |
Hopewell Highway Infrastructure Ltd. |
| 329,231 |
| 282 |
| |
Huaneng Power International, Inc., Class H |
| 292,000 |
| 261 |
| |
Jiangxi Copper Co., Ltd., Class H |
| 103,000 |
| 105 |
| |
PetroChina Co., Ltd., Class H |
| 1,106,000 |
| 1,567 |
| |
PingAn Insurance Group Co. of China Ltd., Class H |
| 91,500 |
| 506 |
| |
Shanghai Electric Group Corp. |
| 60,000 |
| 25 |
| |
Sichuan Expressway Co., Ltd. |
| 850,000 |
| 163 |
| |
Sinopec Shangai Petrochemical Co., Ltd., Class H |
| 44,000 |
| 23 |
| |
Yanzhou Coal MiningCo., Ltd., Class H |
| 160,000 |
| 129 |
| |
Zhejiang Expressway Co., Ltd., Class H |
| 42,000 |
| 32 |
| |
Zijin Mining Group Co.,Ltd. |
| 222,000 |
| 155 |
| |
|
|
|
| 13,982 |
| |
Denmark (0.5%) |
|
|
|
|
| |
AP Moller - Maersk A/S |
| 74 |
| 697 |
| |
Danske Bank A/S |
| 45,345 |
| 2,015 |
| |
DSV A/S |
| 1,175 |
| 215 |
| |
GN Store Nord A/S |
| 21,800 |
| 322 |
| |
Novo-Nordisk A/S, Class B |
| 15,000 |
| 1,249 |
| |
Novozymes A/S, Class B |
| 3,314 |
| 285 |
| |
Vestas Wind Systems A/S |
| (a)10,650 |
| 450 |
| |
|
|
|
| 5,233 |
| |
Egypt (0.1%) |
|
|
|
|
| |
Orascom Telecom Holding SAE |
| 9,149 |
| 605 |
| |
Finland (0.9%) |
|
|
|
|
| |
Cargotec Corp., Class B |
| 2,604 |
| 145 |
| |
Fortum Oyj |
| 16,886 |
| 481 |
| |
KeskoOyj, Class B |
| 4,358 |
| 230 |
| |
KoneOyj, Class B |
| 5,208 |
| 295 |
| |
Metso Oyj |
| 7,730 |
| 390 |
| |
Neste Oil Oyj |
| 6,952 |
| 211 |
| |
Nokia Oyj |
| 178,915 |
| 3,656 |
| |
Outokumpu Oyj |
| (c)15,450 |
| 605 |
| |
Rautaruukki Oyj |
| 6,293 |
| 250 |
| |
Sampo Oyj, Class A |
| 22,919 |
| 614 |
| |
Stora Enso Oyj, Class R |
| 41,550 |
| 658 |
| |
TietoEnator Oyj |
| (c)10,536 |
| 340 |
| |
UPM-Kymmene Oyj |
| 36,167 |
| 913 |
| |
Uponor Oyj |
| (c)2,904 |
| 109 |
| |
Wartsila Oyj, Class B |
| 4,034 |
| 217 |
| |
|
|
|
| 9,114 |
| |
France (7.5%) |
|
|
|
|
| |
Accor S.A. |
| (c)18,464 |
| 1,431 |
| |
Alcatel S.A. |
| 87,177 |
| 1,254 |
| |
Alstom |
| (a)7,268 |
| 985 |
| |
Arkema |
| (a)3,363 |
| 173 |
| |
Atos OriginS.A. |
| (a)1,557 |
| 92 |
| |
AXA S.A. |
| 142,852 |
| 5,784 |
| |
BNP Paribas S.A. |
| 75,639 |
| 8,252 |
| |
Bouygues S.A. |
| (c)16,979 |
| 1,090 |
| |
Business Objects S.A. |
| (a)4,600 |
| 181 |
| |
Cap Gemini S.A. |
| 13,124 |
| 824 |
| |
Carrefour S.A. |
| (c)31,579 |
| 1,915 |
| |
Casino Guichard Perrachon S.A. |
| 3,591 |
| 334 |
| |
Cie de Saint-Gobain |
| 18,247 |
| 1,533 |
| |
Cie Generale d’Optique Essilor International S.A. |
| (c)3,527 |
| 379 |
| |
CNP Assurances |
| 5,372 |
| 600 |
| |
Credit Agricole S.A. |
| 34,585 |
| 1,455 |
| |
Dassault Systemes S.A. |
| 4,244 |
| 225 |
| |
European Aeronautic Defense & Space Co. N.V. |
| 14,611 |
| 503 |
| |
Euronext N.V. |
| 6,578 |
| 777 |
| |
France Telecom S.A. |
| (c)89,477 |
| 2,475 |
| |
Gecina S.A. REIT |
| 3,084 |
| 590 |
| |
Groupe Danone |
| (c)13,945 |
| 2,113 |
| |
Hermes International |
| 1,335 |
| 167 |
| |
Imerys S.A. |
| 2,205 |
| 196 |
| |
Klepierre REIT |
| 2,600 |
| 491 |
| |
L’Air Liquide S.A. |
| (c)8,028 |
| 1,907 |
| |
L’Oreal S.A. |
| 2,146 |
| 215 |
| |
Lafarge S.A. |
| (c)11,729 |
| 1,745 |
| |
Lagardere S.C.A. |
| (c)6,292 |
| 507 |
| |
LVMH Moet Hennessy Louis Vuitton S.A. |
| 10,888 |
| 1,149 |
| |
Michelin (CGDE), Class B |
| 4,696 |
| 450 |
| |
Mittal Steel Co., N.V. |
| 35,707 |
| 1,507 |
| |
Neopost S.A. |
| 2,457 |
| 309 |
| |
Pernod-Ricard S.A. |
| (c)1,088 |
| 250 |
| |
Peugeot S.A. |
| (c)5,348 |
| 354 |
| |
PPR S.A. |
| 2,823 |
| 422 |
| |
The accompanying notes are an integral part of the financial statements.
10
| 2006 Annual Report |
|
|
| December 31, 2006 |
Portfolio of Investments (cont’d)
Active International Allocation Portfolio
|
| Shares |
| Value |
| |
France (cont’d) |
|
|
|
|
| |
Publicis Groupe |
| 4,217 |
| $ | 178 |
|
Renault S.A. |
| (c)5,505 |
| 661 |
| |
Safran S.A. |
| (c)4,910 |
| 114 |
| |
Sanofi-Aventis S.A. |
| (c)59,968 |
| 5,537 |
| |
Schneider Electric S.A. |
| (c)13,164 |
| 1,461 |
| |
Societe BIC S.A. |
| 1,627 |
| 113 |
| |
Societe Generale |
| 29,834 |
| 5,065 |
| |
Societe Television Francaise 1 |
| (c)5,196 |
| 193 |
| |
Sodexho Alliance S.A. |
| 10,220 |
| 641 |
| |
Suez S.A. |
| (c)31,273 |
| 1,620 |
| |
Suez S.A. (London Shares) |
| 2,940 |
| 153 |
| |
Suez S.A. (VVPR-strip) |
| (a)2,940 |
| @— |
| |
Technip S.A. |
| (c)1,528 |
| 105 |
| |
Thales S.A. |
| (c)6,720 |
| 335 |
| |
Thomson |
| (c)10,855 |
| 212 |
| |
Total S.A. |
| (c)134,548 |
| 9,706 |
| |
Unibail REIT |
| (c)4,206 |
| 1,028 |
| |
Valeo S.A. |
| 5,295 |
| 220 |
| |
Veolia Environnement |
| (c)7,021 |
| 541 |
| |
Vinci S.A. |
| (c)8,430 |
| 1,077 |
| |
Vivendi Universal S.A. |
| (c)39,320 |
| 1,537 |
| |
Zodiac S.A. |
| (c)631 |
| 42 |
| |
|
|
|
| 73,173 |
| |
Germany (8.6%) |
|
|
|
|
| |
Adidas-Salomon AG |
| 19,444 |
| 968 |
| |
Allianz AG (Registered) |
| (c)36,412 |
| 7,439 |
| |
Altana AG |
| (c)6,726 |
| 417 |
| |
BASF AG |
| 50,110 |
| 4,885 |
| |
Bayer AG |
| 50,260 |
| 2,698 |
| |
Beiersdorf AG |
| 4,911 |
| 318 |
| |
Celesio AG |
| 7,538 |
| 404 |
| |
Commerzbank AG |
| (c)63,914 |
| 2,434 |
| |
Continental AG |
| 12,188 |
| 1,417 |
| |
Depfa Bank plc |
| 33,731 |
| 604 |
| |
DaimlerChrysler AG |
| 76,254 |
| 4,711 |
| |
Deutsche Bank AG (Registered) |
| 54,034 |
| 7,228 |
| |
Deutsche Boerse AG |
| 9,550 |
| 1,758 |
| |
Deutsche Lufthansa AG (Registered) |
| 21,401 |
| 589 |
| |
Deutsche Post AG (Registered) |
| (c)67,221 |
| 2,027 |
| |
Deutsche Postbank AG |
| 5,256 |
| 444 |
| |
Deutsche Telekom AG (Registered) |
| (c)267,209 |
| 4,882 |
| |
E. ON AG |
| (c)57,948 |
| 7,866 |
| |
Fresenius Medical Care AG |
| 6,009 |
| 801 |
| |
Heidelberger Druckmaschinen |
| 4,900 |
| 232 |
| |
Henkel KGaA (Non-Voting Shares) |
| 5,711 |
| 840 |
| |
Hochtief AG |
| 5,220 |
| 380 |
| |
Hypo Real Estate Holding AG |
| 12,650 |
| 797 |
| |
KarstadtQuelle AG |
| (a)(c)7,464 |
| 216 |
| |
Linde AG |
| 7,344 |
| 759 |
| |
MAN AG |
| 14,595 |
| 1,319 |
| |
Merck KGaA |
| 4,614 |
| 478 |
| |
Metro AG |
| 13,436 |
| 857 |
| |
Muenchener Rueckversicherungs AG (Registered) |
| 18,393 |
| 3,167 |
| |
Porsche AG (Non-Voting Shares) |
| 684 |
| 871 |
| |
Puma AG Rudolf Dassler Sport |
| 1,157 |
| 452 |
| |
Qiagen N.V |
| (a)(c)12,827 |
| 197 |
| |
RWE AG |
| 38,790 |
| 4,276 |
| |
RWE AG (Non-Voting Shares) |
| 3,400 |
| 323 |
| |
SAP AG |
| (c)83,316 |
| 4,428 |
| |
Siemens AG (Registered) |
| 75,394 |
| 7,478 |
| |
Suedzucker AG |
| (c)6,971 |
| 169 |
| |
ThyssenKrupp AG |
| 34,153 |
| 1,609 |
| |
TUI AG |
| (c)21,483 |
| 429 |
| |
Volkswagen AG |
| (c)14,729 |
| 1,670 |
| |
Volkswagen AG (Non-Voting Shares) |
| 8,799 |
| 657 |
| |
|
|
|
| 83,494 |
| |
Greece (0.3%) |
|
|
|
|
| |
Alpha Bank A.E. |
| 19,483 |
| 589 |
| |
EFG Eurobank Ergasias S.A. |
| 9,250 |
| 335 |
| |
National Bank of Greece S.A. |
| 18,033 |
| 831 |
| |
OPAP S.A. |
| 12,910 |
| 499 |
| |
Titan Cement Co., S.A. |
| 3,950 |
| 215 |
| |
|
|
|
| 2,469 |
| |
Hong Kong (3.2%) |
|
|
|
|
| |
Bank of East Asia Ltd. |
| (c)228,342 |
| 1,293 |
| |
BOC Hong Kong Holdings Ltd. |
| 542,500 |
| 1,472 |
| |
Cathay Pacific Airways Ltd. |
| (c)154,000 |
| 380 |
| |
Cheung Kong Holdings Ltd. |
| 226,000 |
| 2,782 |
| |
Cheung Kong Infrastructure Holdings Ltd. |
| (c)84,000 |
| 261 |
| |
China National Building Material Co., Ltd. |
| 425,400 |
| 276 |
| |
China Water Affairs Group Ltd. |
| (a)(c)470,000 |
| 180 |
| |
CLP Holdings Ltd. |
| 258,300 |
| 1,909 |
| |
Esprit Holdings Ltd. |
| 141,500 |
| 1,580 |
| |
Guangdong Investments, Ltd. |
| 836,000 |
| 377 |
| |
Guangzhou R&F Properties Co., Ltd. |
| 73,600 |
| 159 |
| |
Hang Lung Properties Ltd. |
| (c)282,000 |
| 707 |
| |
Hang Seng Bank Ltd. |
| (c)105,400 |
| 1,440 |
| |
Henderson Land Development Co., Ltd. |
| (c)109,000 |
| 610 |
| |
Hong Kong & China Gas Co., Ltd. |
| (c)560,079 |
| 1,260 |
| |
Hong Kong Exchanges & Clearing Ltd. |
| 157,000 |
| 1,726 |
| |
HongKong Electric Holdings Ltd. |
| (c)205,500 |
| 1,007 |
| |
Hopewell Holdings Ltd. |
| 95,000 |
| 333 |
| |
Hutchison Telecommunications International, Ltd. |
| (a)207,000 |
| 522 |
| |
Hutchison Whampoa Ltd. |
| 310,200 |
| 3,153 |
| |
Hysan Development Co., Ltd. |
| 99,909 |
| 261 |
| |
Johnson Electric Holdings Ltd. |
| 235,500 |
| 161 |
| |
Kerry Properties Ltd. |
| 63,809 |
| 298 |
| |
Kingboard ChemicalHoldings Ltd. |
| 103,500 |
| 407 |
| |
Li & Fung Ltd. |
| 271,700 |
| 845 |
| |
Link REIT(The) |
| 246,000 |
| 506 |
| |
MTR Corp. |
| (c)211,825 |
| 533 |
| |
New World Development Ltd. |
| 348,209 |
| 701 |
| |
NWS Holdings Ltd. |
| 83,936 |
| 192 |
| |
PCCW Ltd. |
| 552,411 |
| 336 |
| |
Shangri-La Asia Ltd. |
| 156,424 |
| 403 |
| |
Sino Land Co. |
| (c)180,948 |
| 422 |
| |
Sun Hung Kai Properties Ltd. |
| 193,000 |
| 2,217 |
| |
Swire Pacific Ltd., Class A |
| 135,000 |
| 1,450 |
| |
Techtronic Industries Co. |
| 137,500 |
| 178 |
| |
The accompanying notes are an integral part of the financial statements.
11
2006 Annual Report |
|
|
|
December 31, 2006 |
|
Portfolio of Investments (cont’d)
Active International Allocation Portfolio
|
| Shares |
| Value |
| |
Hong Kong (cont’d) |
|
|
|
|
| |
Television Broadcasts Ltd. |
| 43,000 |
| $ | 263 |
|
Wasion Meters Group Ltd. |
| 186,379 |
| 66 |
| |
Wharf Holdings Ltd. |
| 183,600 |
| 679 |
| |
Yue Yuen Industrial Holdings Ltd. |
| 88,500 |
| 281 |
| |
|
|
|
| 31,626 |
| |
India (0.6%) |
|
|
|
|
| |
ABB Ltd. India |
| 538 |
| 45 |
| |
ACC Ltd. |
| 1,027 |
| 25 |
| |
Bajaj Auto Ltd. |
| 1,077 |
| 64 |
| |
Bharat Forge Company, Ltd. |
| 3,455 |
| 28 |
| |
Bharat Heavy Electricals Corp. |
| 2,347 |
| 122 |
| |
Bharti Airtel Ltd. |
| (a)80,148 |
| 1,175 |
| |
Cipla Ltd/India |
| 6,421 |
| 36 |
| |
Dr. Reddy’s Laboratories Ltd. |
| 3,530 |
| 65 |
| |
GAIL India Ltd. |
| 9,000 |
| 53 |
| |
GlaxoSmithKline Pharmaceuticals Ltd. |
| 655 |
| 17 |
| |
Glenmark Pharmaceuticals Ltd. |
| 2,133 |
| 29 |
| |
Grasim Industries Ltd. |
| 1,271 |
| 80 |
| |
Gujarat Ambuja Cements, Ltd. |
| 17,500 |
| 56 |
| |
HDFC Bank Ltd. |
| 6,706 |
| 162 |
| |
Hero Honda Motors Ltd. |
| 2,862 |
| 49 |
| |
Hindalco Industries Ltd. |
| 18,800 |
| 74 |
| |
Hindustan Lever Ltd. |
| 28,350 |
| 139 |
| |
Housing Development Finance Corp. |
| 6,335 |
| 233 |
| |
I-Flex Solutions Ltd. |
| 632 |
| 28 |
| |
ICICI Bank, Ltd. |
| 21,715 |
| 437 |
| |
Infosys Technologies Ltd. |
| 13,700 |
| 694 |
| |
ITC Ltd. |
| 38,000 |
| 151 |
| |
Larsen & Toubro Limited |
| 3,588 |
| 117 |
| |
Mahanagar Telephone Nigam Ltd. |
| 6,597 |
| 21 |
| |
Mahindra & Mahindra Ltd. |
| 3,597 |
| 74 |
| |
Maruti Udyog Ltd. |
| 2,439 |
| 51 |
| |
Oil & Natural Gas Corp., Ltd. |
| 8,423 |
| 166 |
| |
Ranbaxy Laboratories Ltd. |
| 5,213 |
| 46 |
| |
Reliance Communication Ltd. |
| (a)23,700 |
| 253 |
| |
Reliance Energy Ltd. |
| 2,101 |
| 25 |
| |
Reliance Industries Ltd. |
| 22,361 |
| 642 |
| |
Satyam Computer Services Ltd. |
| 16,086 |
| 176 |
| |
Sun Pharmaceutical Ltd. |
| 1,644 |
| 37 |
| |
Tata Consultancy Services Ltd. |
| 4,450 |
| 123 |
| |
Tata Motors Ltd. |
| 6,657 |
| 135 |
| |
Tata Steel Ltd. |
| 4,632 |
| 50 |
| |
UTI Bank Ltd. |
| 3,900 |
| 41 |
| |
Wipro Ltd. |
| 6,944 |
| 95 |
| |
Zee News Ltd. |
| (d)(l)3,588 |
| 3 |
| |
Zee Telefilms Ltd. |
| 7,177 |
| 48 |
| |
Wire & Wireless Ltd. |
| (d)(l)3,244 |
| 2 |
| |
|
|
|
| 5,867 |
| |
Indonesia (0.1%) |
|
|
|
|
| |
Telekomunikasi Indonesia Tbk PT |
| 1,003,500 |
| 1,127 |
| |
Ireland (0.1%) |
|
|
|
|
| |
Allied Irish Banks plc |
| 16,500 |
| 493 |
| |
Bank of Ireland |
| 8,600 |
| 198 |
| |
|
|
|
| 691 |
| |
Italy (1.0%) |
|
|
|
|
| |
Alleanza Assicurazioni S.p.A. |
| (c)2,521 |
| 34 |
| |
Assicurazioni Generali S.p.A. |
| 4,265 |
| 187 |
| |
Autogrill S.p.A. |
| 1,797 |
| 33 |
| |
Autostrade S.p.A. |
| 3,681 |
| 106 |
| |
Banca Fideuram S.p.A. |
| 813 |
| 5 |
| |
Banca Intesa S.p.A. |
| 162,256 |
| 1,253 |
| |
Banca Intesa S.p.A. RNC |
| 2,270 |
| 17 |
| |
Banca Monte dei Paschi di Siena S.p.A. |
| 2,336 |
| 15 |
| |
Banca Popolare di Milano Scrl |
| 695 |
| 12 |
| |
Banche Popolari Unite Scrl |
| 19,983 |
| 549 |
| |
BancoPopolare di Verona e Novara Scrl |
| (c)2,982 |
| 86 |
| |
Benetton Group S.p.A. |
| 456 |
| 9 |
| |
Capitalia S.p.A. |
| 41,777 |
| 395 |
| |
Enel S.p.A. |
| (c)9,815 |
| 101 |
| |
ENI S.p.A. |
| 50,744 |
| 1,707 |
| |
Fiat S.p.A. |
| (a)3,080 |
| 59 |
| |
Finmeccanica S.p.A. |
| 3,429 |
| 93 |
| |
Italcementi S.p.A. |
| 370 |
| 10 |
| |
Luxottica Group S.p.A. |
| 1,328 |
| 41 |
| |
Mediaset S.p.A. |
| 3,285 |
| 39 |
| |
Mediobanca S.p.A. |
| 11,378 |
| 269 |
| |
Mediolanum S.p.A. |
| 611 |
| 5 |
| |
Pirelli & C S.p.A. |
| 27,686 |
| 28 |
| |
Sanpaolo IMI S.p.A. |
| 38,781 |
| 901 |
| |
Seat Pagine Gialle S.p.A. |
| (c)13,264 |
| 8 |
| |
Snam Rete Gas S.p.A. |
| (c)1,548 |
| 9 |
| |
Telecom Italia S.p.A. |
| (c)106,911 |
| 323 |
| |
TelecomItalia S.p.A. RNC |
| (c)61,216 |
| 155 |
| |
Tiscali S.p.A. |
| (a)(c)935 |
| 3 |
| |
UniCredito Italiano S.p.A. |
| 395,020 |
| 3,462 |
| |
|
|
|
| 9,914 |
| |
Japan (23.0%) |
|
|
|
|
| |
77 Bank Ltd. (The) |
| (c)64,000 |
| 406 |
| |
Acom Co.,Ltd. |
| 1,980 |
| 67 |
| |
Advantest Corp. |
| (c)18,290 |
| 1,048 |
| |
Aeon Co., Ltd. |
| 39,200 |
| 848 |
| |
Aeon Credit Service Co., Ltd. |
| (c)2,300 |
| 44 |
| |
Aiful Corp. |
| 1,750 |
| 49 |
| |
Ajinomoto Co., Inc. |
| (c)62,400 |
| 825 |
| |
Alps Electric Co., Ltd. |
| (c)13,700 |
| 149 |
| |
Amada Co., Ltd. |
| 26,000 |
| 276 |
| |
Asahi Breweries Ltd. |
| (c)33,600 |
| 538 |
| |
Asahi Glass Co., Ltd. |
| (c)108,800 |
| 1,307 |
| |
Asahi Kasei Corp. |
| 103,000 |
| 674 |
| |
Asatsu-DK, Inc. |
| 3,400 |
| 108 |
| |
Astellas Pharma, Inc. |
| 42,700 |
| 1,941 |
| |
Bank of Fukuoka Ltd. (The) |
| (c)86,000 |
| 627 |
| |
Bank of Kyoto Ltd (The) |
| (c)22,000 |
| 205 |
| |
Bank of Yokohama Ltd. (The) |
| 146,000 |
| 1,143 |
| |
Benesse Corp. |
| (c)5,000 |
| 190 |
| |
Bridgestone Corp. |
| (c)84,000 |
| 1,874 |
| |
Canon, Inc. |
| (c)82,400 |
| 4,639 |
| |
Casio Computer Co., Ltd. |
| (c)33,600 |
| 762 |
| |
Central Japan Railway Co. |
| 124 |
| 1,282 |
| |
Chiba Bank Ltd. (The) |
| 61,000 |
| 516 |
| |
The accompanying notes are an integral part of the financial statements.
12
| 2006 Annual Report |
|
|
| December 31, 2006 |
Portfolio of Investments (cont’d)
Active International Allocation Portfolio
|
| Shares |
| Value |
| |
Japan (cont’d) |
|
|
|
|
| |
Chiyoda Corp. |
| 18,000 |
| $ | 352 |
|
Chubu Electric Power Co., Inc. |
| 42,200 |
| 1,262 |
| |
Chugai Pharmaceutical Co., Ltd. |
| 22,507 |
| 464 |
| |
Citizen Watch Co., Ltd. |
| (c)28,700 |
| 220 |
| |
Coca-Cola West Japan Co., Ltd. |
| 1,300 |
| 30 |
| |
COMSYS Holdings Corp. |
| 15,000 |
| 166 |
| |
Credit Saison Co., Ltd. |
| 4,400 |
| 152 |
| |
CSK Holdings Corp. |
| (c)7,200 |
| 307 |
| |
Dai Nippon Printing Co., Ltd. |
| 37,600 |
| 581 |
| |
Daicel Chemical Industries Ltd. |
| (c)12,000 |
| 85 |
| |
Daiichi Sankyo Co., Ltd. |
| 58,300 |
| 1,822 |
| |
Daikin Industries Ltd. |
| (c)15,800 |
| 550 |
| |
Daimaru, Inc. |
| 24,000 |
| 325 |
| |
Dainippon Ink & Chemicals, Inc. |
| 53,000 |
| 207 |
| |
Daito Trust Construction Co., Ltd. |
| 14,100 |
| 647 |
| |
Daiwa House Industry Co., Ltd. |
| (c)73,600 |
| 1,280 |
| |
Daiwa Securities Group, Inc. |
| 102,000 |
| 1,144 |
| |
Denki Kagaku Kogyo K.K. |
| 36,000 |
| 150 |
| |
Denso Corp. |
| 60,250 |
| 2,390 |
| |
Dowa Mining Co., Ltd. |
| 49,000 |
| 419 |
| |
E*Trade Securities Co., Ltd. |
| (c)132 |
| 125 |
| |
East Japan Railway Co. |
| 302 |
| 2,017 |
| |
Ebara Corp. |
| (c)30,800 |
| 118 |
| |
Eisai Co., Ltd. |
| 20,002 |
| 1,099 |
| |
FamilyMart Co., Ltd. |
| 4,900 |
| 133 |
| |
Fanuc Ltd. |
| 16,600 |
| 1,635 |
| |
Fast Retailing Co.,Ltd. |
| 7,700 |
| 735 |
| |
Fuji Electric Holdings Co., Ltd. |
| 15,000 |
| 81 |
| |
Fuji Soft ABC, Inc. |
| 3,400 |
| 81 |
| |
Fuji Television Network, Inc. |
| 31 |
| 71 |
| |
Fujifilm Holdings Corp. |
| 39,100 |
| 1,607 |
| |
Fujikura Ltd. |
| 22,000 |
| 194 |
| |
Fujitsu Ltd. |
| 148,200 |
| 1,163 |
| |
Furukawa Electric Co., Ltd. |
| 53,800 |
| 338 |
| |
Hankyu Department Stores, Inc. |
| 9,000 |
| 75 |
| |
Hirose Electric Co., Ltd. |
| 2,400 |
| 272 |
| |
Hitachi Construction Machinery Co., Ltd. |
| 2,800 |
| 75 |
| |
Hitachi Ltd. |
| 269,000 |
| 1,677 |
| |
Hitachi Plant Technologies Ltd. |
| 60,000 |
| 320 |
| |
Hokkaido Electric Power Co., Inc. |
| 8,200 |
| 209 |
| |
Hokuhoku Financial Group, Inc. |
| 165,000 |
| 605 |
| |
Honda Motor Co., Ltd. |
| 168,804 |
| 6,667 |
| |
Hoya Corp. |
| 33,200 |
| 1,294 |
| |
Ibiden Co., Ltd. |
| 9,800 |
| 494 |
| |
Index Corp. |
| (c)94 |
| 55 |
| |
Inpex Holdings Inc. |
| (a)39 |
| 321 |
| |
Isetan Co., Ltd. |
| 16,100 |
| 291 |
| |
Ishikawajima-Harima Heavy Industries Co., Ltd. |
| (c)93,000 |
| 315 |
| |
Ito En Ltd. |
| (c)3,800 |
| 116 |
| |
Itochu Corp. |
| 123,000 |
| 1,010 |
| |
Itochu Techno-Science Corp. |
| 3,000 |
| 160 |
| |
Japan Airlines Corp. |
| (a)(c)79,000 |
| 141 |
| |
Japan Real Estate Investment Corp. REIT |
| 53 |
| 570 |
| |
Japan Retail Fund Investment Corp. REIT |
| 48 |
| 391 |
| |
Japan Tobacco, Inc. |
| 335 |
| 1,619 |
| |
JFE Holdings, Inc. |
| (c)32,000 |
| 1,648 |
| |
JGC Corp. |
| (c)24,000 |
| 412 |
| |
Joyo Bank Ltd. (The) |
| (c)115,000 |
| 635 |
| |
JS Group Corp. |
| 21,900 |
| 461 |
| |
JSR Corp. |
| 12,900 |
| 334 |
| |
Kajima Corp. |
| 113,400 |
| 497 |
| |
Kamigumi Co., Ltd. |
| 1,000 |
| 8 |
| |
Kaneka Corp. |
| 21,000 |
| 191 |
| |
Kansai Electric Power Co., Inc. (The) |
| 60,200 |
| 1,624 |
| |
Kao Corp. |
| 50,000 |
| 1,349 |
| |
Kawasaki Heavy Industries Ltd. |
| (c)183,000 |
| 687 |
| |
Kawasaki Kisen Kaisha Ltd. |
| (c)5,000 |
| 39 |
| |
Keihin Electric Express Railway Co., Ltd. |
| (c)32,000 |
| 220 |
| |
Keio Corp. |
| 19,000 |
| 123 |
| |
Keyence Corp. |
| 3,000 |
| 743 |
| |
Kikkoman Corp. |
| (c)10,000 |
| 121 |
| |
Kinden Corp. |
| 1,000 |
| 8 |
| |
Kintetsu Corp. |
| (c)140,200 |
| 409 |
| |
Kirin Brewery Co., Ltd. |
| (c)83,400 |
| 1,311 |
| |
Kobe Steel Ltd. |
| 166,000 |
| 569 |
| |
Kokuyo Co., Ltd. |
| 5,700 |
| 90 |
| |
Komatsu Ltd. |
| 96,400 |
| 1,956 |
| |
Konami Corp. |
| (c)10,000 |
| 303 |
| |
Konica Minolta Holdings, Inc. |
| (a)37,000 |
| 522 |
| |
Kubota Corp. |
| 132,000 |
| 1,222 |
| |
Kuraray Co., Ltd. |
| (c)29,500 |
| 348 |
| |
Kurita Water Industries Ltd. |
| 5,800 |
| 125 |
| |
Kyocera Corp. |
| 13,100 |
| 1,235 |
| |
Kyowa Hakko Kogyo Co., Ltd. |
| 26,028 |
| 223 |
| |
Kyushu Electric Power Co., Inc. |
| 26,400 |
| 697 |
| |
Lawson, Inc. |
| (c)4,700 |
| 168 |
| |
Leopalace21 Corp. |
| 10,800 |
| 345 |
| |
Mabuchi Motor Co., Ltd. |
| 2,300 |
| 137 |
| |
Marubeni Corp. |
| 120,000 |
| 609 |
| |
Marui Co., Ltd. |
| 35,800 |
| 418 |
| |
Matsui Securities Co., Ltd. |
| (c)10,100 |
| 77 |
| |
Matsushita Electric Industrial Co., Ltd. |
| 176,000 |
| 3,512 |
| |
Matsushita Electric Works Ltd. |
| (c)28,000 |
| 324 |
| |
Meiji Dairies Corp. |
| (c)16,000 |
| 126 |
| |
Meiji Seika Kaisha Ltd. |
| 19,000 |
| 91 |
| |
Meitec Corp. |
| (c)2,400 |
| 73 |
| |
Millea Holdings, Inc. |
| 61,500 |
| 2,171 |
| |
Minebea Co., Ltd. |
| 33,000 |
| 231 |
| |
Mitsubishi Chemical Holdings Corp. |
| 73,500 |
| 463 |
| |
Mitsubishi Corp. |
| 109,700 |
| 2,065 |
| |
Mitsubishi ElectricCorp. |
| 186,800 |
| 1,705 |
| |
Mitsubishi Estate Co., Ltd. |
| (c)99,000 |
| 2,562 |
| |
Mitsubishi Heavy Industries Ltd. |
| 316,000 |
| 1,437 |
| |
Mitsubishi Logistics Corp. |
| 7,000 |
| 109 |
| |
Mitsubishi Materials Corp. |
| (c)161,000 |
| 605 |
| |
Mitsubishi Rayon Co., Ltd. |
| 42,000 |
| 282 |
| |
Mitsubishi UFJ FinancialGroup, Inc |
| 662 |
| 8,177 |
| |
Mitsubishi UFJ Securities Co. |
| 21,000 |
| 233 |
| |
Mitsui & Co., Ltd. |
| 132,800 |
| 1,986 |
| |
The accompanying notes are an integral part of the financial statements.
13
2006 Annual Report |
|
|
|
December 31, 2006 |
|
Portfolio of Investments (cont’d)
Active International Allocation Portfolio
|
| Shares |
| Value |
| |
Japan (cont’d) |
|
|
|
|
| |
Mitsui Chemicals, Inc. |
| 42,000 |
| $ | 323 |
|
Mitsui Fudosan Co., Ltd. |
| (c)71,400 |
| 1,743 |
| |
Mitsui Mining & Smelting Co., Ltd. |
| 96,000 |
| 481 |
| |
Mitsui OSK Lines Ltd. |
| 13,000 |
| 128 |
| |
Mitsui Sumitomo Insurance Co., Ltd. |
| 102,000 |
| 1,116 |
| |
Mitsui Trust Holdings, Inc. |
| 48,545 |
| 557 |
| |
Mitsukoshi Ltd. |
| 32,000 |
| 150 |
| |
Miura Co., Ltd. |
| 7,000 |
| 178 |
| |
Mizuho Financial Group, Inc. |
| 844 |
| 6,028 |
| |
Murata Manufacturing Co., Ltd. |
| (c)16,200 |
| 1,096 |
| |
Namco Bandai Holdings, Inc. |
| (c)2,400 |
| 35 |
| |
NEC Corp. |
| 160,400 |
| 767 |
| |
NEC Electronics Corp. |
| (a)(c)4,600 |
| 135 |
| |
Net One Systems Co., Ltd. |
| (c)58 |
| 77 |
| |
NGK Insulators Ltd. |
| (c)34,600 |
| 534 |
| |
NGK Spark Plug Co., Ltd. |
| (c)21,000 |
| 395 |
| |
Nidec Corp. |
| (c)8,700 |
| 673 |
| |
Nikko CordialCorp. |
| 69,000 |
| 791 |
| |
Nikon Corp. |
| (c)27,000 |
| 592 |
| |
Nintendo Co., Ltd. |
| (c)10,900 |
| 2,830 |
| |
Nippon Building Fund, Inc. REIT |
| (c)63 |
| 836 |
| |
Nippon Electric Glass Co., Ltd. |
| 17,000 |
| 357 |
| |
Nippon Express Co., Ltd. |
| 74,800 |
| 409 |
| |
Nippon Meat Packers, Inc. |
| 18,600 |
| 203 |
| |
Nippon Mining Holdings, Inc. |
| 43,500 |
| 313 |
| |
Nippon Oil Corp. |
| 134,800 |
| 902 |
| |
Nippon Paper Group, Inc. |
| 70 |
| 264 |
| |
Nippon Sheet Glass Co., Ltd. |
| (c)37,000 |
| 173 |
| |
Nippon Steel Corp. |
| 418,000 |
| 2,403 |
| |
Nippon Telegraph & Telephone Corp. |
| 255 |
| 1,256 |
| |
Nippon Yusen Kabushiki Kaisha |
| 99,000 |
| 724 |
| |
Nishi-Nippon Bank Ltd (The) |
| 44,000 |
| 189 |
| |
Nissan Chemical Industries Ltd. |
| (c)11,000 |
| 137 |
| |
Nissan Motor Co., Ltd. |
| 250,900 |
| 3,021 |
| |
Nisshin Seifun Group, Inc. |
| 12,500 |
| 129 |
| |
Nisshinbo Industries, Inc. |
| 6,000 |
| 62 |
| |
Nissin Food Products Co., Ltd. |
| (c)6,500 |
| 241 |
| |
Nitto Denko Corp. |
| 17,800 |
| 891 |
| |
Nomura Holdings, Inc. |
| 147,200 |
| 2,777 |
| |
Nomura Research Institute Ltd. |
| 2,500 |
| 363 |
| |
NSK Ltd. |
| 62,000 |
| 611 |
| |
NTN Corp. |
| 44,000 |
| 395 |
| |
NTT Data Corp. |
| (c)140 |
| 701 |
| |
NTT Do CoMo,Inc. |
| 334 |
| 528 |
| |
Obayashi Corp. |
| 77,000 |
| 500 |
| |
Obic Co., Ltd. |
| 800 |
| 166 |
| |
OJI Paper Co., Ltd. |
| 96,400 |
| 512 |
| |
Oki Electric Industry Co., Ltd. |
| (c)44,000 |
| 98 |
| |
Okumura Corp. |
| 21,000 |
| 104 |
| |
Olympus Corp. |
| 11,000 |
| 346 |
| |
Omron Corp. |
| 17,900 |
| 508 |
| |
Onward Kashiyama Co., Ltd. |
| (c)16,000 |
| 204 |
| |
Oracle Corp. Japan |
| (c)3,500 |
| 162 |
| |
Oriental Land Co., Ltd. |
| (c)5,700 |
| 298 |
| |
Osaka Gas Co., Ltd. |
| 155,600 |
| 579 |
| |
Pioneer Corp. |
| 14,454 |
| 198 |
| |
Promise Co.,Ltd. |
| (c)2,350 |
| 73 |
| |
Resona Holdings, Inc. |
| (c)411 |
| 1,122 |
| |
Ricoh Co., Ltd. |
| 52,000 |
| 1,062 |
| |
Rohm Co., Ltd. |
| (c)13,200 |
| 1,314 |
| |
Sanken Electric Co., Ltd. |
| 13,000 |
| 160 |
| |
Sanyo Electric Co., Ltd. |
| (a)(c)148,000 |
| 188 |
| |
Sapporo Holdings Ltd. |
| (c)17,000 |
| 97 |
| |
Secom Co., Ltd. |
| 14,600 |
| 757 |
| |
Seiko Epson Corp. |
| (c)9,800 |
| 238 |
| |
Sekisui Chemical Co., Ltd. |
| 44,000 |
| 351 |
| |
Sekisui House Ltd. |
| 87,600 |
| 1,276 |
| |
Seven & I Holdings Co., Ltd. |
| 64,000 |
| 1,990 |
| |
Sharp Corp. |
| 73,200 |
| 1,261 |
| |
Shimachu Co., Ltd. |
| (c)5,300 |
| 154 |
| |
Shimamura Co., Ltd. |
| 2,000 |
| 230 |
| |
Shimano, Inc. |
| 8,600 |
| 249 |
| |
Shimizu Corp. |
| 81,600 |
| 408 |
| |
Shin-Etsu Chemical Co., Ltd. |
| 33,896 |
| 2,270 |
| |
Shinko Securities Co. |
| (c)36,000 |
| 140 |
| |
Shinsei Bank Ltd. |
| 140,000 |
| 824 |
| |
Shionogi & Co., Ltd. |
| (c)24,000 |
| 472 |
| |
Shiseido Co., Ltd. |
| 32,000 |
| 694 |
| |
Shizuoka Bank Ltd. (The) |
| (c)52,000 |
| 516 |
| |
Showa Denko K.K. |
| (c)55,000 |
| 211 |
| |
Showa Shell Sekiyu K.K. |
| (c)14,300 |
| 160 |
| |
SMC Corp. |
| 5,800 |
| 823 |
| |
Softbank Corp. |
| (c)81,200 |
| 1,580 |
| |
Sompo Japan Insurance, Inc. |
| 70,000 |
| 856 |
| |
Sony Corp. |
| 62,097 |
| 2,661 |
| |
Stanley Electric Co., Ltd. |
| 6,300 |
| 126 |
| |
Sumitomo Bakelite Co., Ltd. |
| 11,000 |
| 76 |
| |
Sumitomo Chemical Co., Ltd. |
| 117,600 |
| 912 |
| |
Sumitomo Corp. |
| (c)80,400 |
| 1,203 |
| |
Sumitomo Electric Industries Ltd. |
| (c)59,800 |
| 935 |
| |
Sumitomo Heavy Industries Ltd. |
| 38,000 |
| 399 |
| |
Sumitomo Metal Industries Ltd. |
| 248,000 |
| 1,077 |
| |
Sumitomo Metal Mining Co., Ltd. |
| 90,800 |
| 1,165 |
| |
Sumitomo Mitsui Financial Group,Inc. |
| (c)405 |
| 4,152 |
| |
Sumitomo Realty & Development Co., Ltd. |
| 32,000 |
| 1,027 |
| |
Sumitomo Trust & Banking Co., Ltd. (The) |
| 113,000 |
| 1,185 |
| |
T&D Holdings, Inc. |
| 19,350 |
| 1,280 |
| |
Taiheiyo Cement Corp. |
| (c)52,000 |
| 204 |
| |
Taisei Corp. |
| (c)110,000 |
| 336 |
| |
Taisho Pharmaceutical Co., Ltd. |
| (c)12,441 |
| 226 |
| |
Taiyo Yuden Co., Ltd. |
| (c)7,000 |
| 124 |
| |
Takara Holdings, Inc. |
| (c)10,000 |
| 64 |
| |
Takashimaya Co., Ltd. |
| (c)33,000 |
| 466 |
| |
Takeda Pharmaceutical Co., Ltd. |
| 70,800 |
| 4,861 |
| |
Takefuji Corp. |
| (c)3,010 |
| 119 |
| |
TDK Corp. |
| 10,100 |
| 803 |
| |
Teijin Ltd. |
| 74,400 |
| 458 |
| |
Terumo Corp. |
| 17,300 |
| 680 |
| |
THK Co., Ltd. |
| 3,400 |
| 88 |
| |
TIS, Inc. |
| 3,304 |
| 78 |
| |
Tobu Railway Co., Ltd. |
| (c)76,400 |
| 369 |
| |
The accompanying notes are an integral part of the financial statements.
14
| 2006 Annual Report |
|
|
| December 31, 2006 |
Portfolio of Investments (cont’d)
Active International Allocation Portfolio
|
| Shares |
| Value |
| |
Japan (cont’d) |
|
|
|
|
| |
Toho Co., Ltd. |
| (c)6,000 |
| $ | 108 |
|
Tohoku Electric Power Co., Inc. |
| 35,500 |
| 887 |
| |
Tokyo Broadcasting System, Inc. |
| 9,500 |
| 317 |
| |
Tokyo Electric Power Co., Inc. (The) |
| 88,000 |
| 2,847 |
| |
Tokyo Electron Ltd. |
| 20,000 |
| 1,576 |
| |
Tokyo Gas Co., Ltd. |
| (c)183,600 |
| 977 |
| |
Tokyo Tatemono Co., Ltd. |
| 24,000 |
| 267 |
| |
Tokyu Corp. |
| (c)85,400 |
| 547 |
| |
TonenGeneral Sekiyu K.K. |
| (c)29,000 |
| 287 |
| |
Toppan Printing Co., Ltd. |
| (c)36,600 |
| 404 |
| |
Toray Industries, Inc. |
| 103,100 |
| 773 |
| |
Toshiba Corp. |
| (c)230,000 |
| 1,498 |
| |
Tosoh Corp. |
| 40,000 |
| 177 |
| |
Toto Ltd. |
| (c)43,600 |
| 437 |
| |
Toyo Seikan Kaisha Ltd. |
| (c)16,600 |
| 275 |
| |
Toyoba Co., Ltd. |
| 5,000 |
| 15 |
| |
Toyoda Gosei Co., Ltd. |
| 800 |
| 19 |
| |
Toyota Industries Corp. |
| (c)8,850 |
| 407 |
| |
Toyota Motor Corp. |
| 272,800 |
| 18,247 |
| |
Trend Micro, Inc. |
| (a)(c)10,700 |
| 314 |
| |
Uni-Charm Corp. |
| (c)3,500 |
| 208 |
| |
Uniden Corp. |
| 5,000 |
| 34 |
| |
UNY Co., Ltd. |
| (c)10,000 |
| 130 |
| |
Ushio, Inc. |
| (c)3,500 |
| 72 |
| |
USS Co., Ltd. |
| 2,730 |
| 178 |
| |
Wacoal Holdings Corp. |
| (c)6,000 |
| 82 |
| |
West Japan Railway Co. |
| 31 |
| 133 |
| |
Yahoo! Japan Corp. |
| (c)1,666 |
| 664 |
| |
Yakult Honsha Co., Ltd. |
| (c)8,800 |
| 253 |
| |
Yamada Denki Co., Ltd. |
| (c)9,700 |
| 823 |
| |
Yamaha Corp. |
| 8,600 |
| 182 |
| |
Yamaha Motor Co., Ltd. |
| 3,500 |
| 110 |
| |
Yamato Holdings Co., Ltd. |
| (c)24,000 |
| 369 |
| |
Yamazaki Baking Co., Ltd. |
| (c)8,000 |
| 78 |
| |
Yokogawa ElectricCorp. |
| (c)17,100 |
| 271 |
| |
|
|
|
| 222,866 |
| |
Malaysia (0.0%) |
|
|
|
|
| |
IJM Corp. Bhd |
| 108,900 |
| 227 |
| |
Mexico (1.6%) |
|
|
|
|
| |
Alfa S.A. de C.V., Class A |
| 34,500 |
| 230 |
| |
America Movil S.A. de C.V. |
| 2,357,300 |
| 5,315 |
| |
Cemex S.A. de C.V. |
| (a)600,800 |
| 2,036 |
| |
Coca-Cola Femsa S.A. de C.V. |
| 14,500 |
| 55 |
| |
Corp. GEO S.A. de C.V. |
| (a)39,700 |
| 199 |
| |
Fomento Economico Mexicano S.A. de C.V. |
| 65,600 |
| 761 |
| |
Grupo Carso S.A. de C.V., Class A1 |
| 77,700 |
| 288 |
| |
Grupo Financiero Banorte S.A. de C.V., Class O |
| 138,100 |
| 540 |
| |
Grupo Mexico S.A. de C.V., Class B |
| 109,200 |
| 400 |
| |
Grupo Modelo S.A., Class C |
| 54,400 |
| 301 |
| |
Grupo Televisa S.A. |
| 217,900 |
| 1,180 |
| |
Telefonos de Mexico S.A. de C.V. |
| 1,252,500 |
| 1,776 |
| |
Urbi Desarrollos Urbanos S.A. de C.V. |
| (a)39,000 |
| 141 |
| |
Kimberly-Clarkde Mexico S.A. de C.V., Class A |
| 51,500 |
| 238 |
| |
Wal-Mart de Mexico S.A. de C.V., Series V |
| 378,800 |
| 1,667 |
| |
|
|
|
| 15,127 |
| |
Netherlands (3.0%) |
|
|
|
|
| |
ABN AMRO Holding N.V. |
| 132,491 |
| 4,259 |
| |
Aegon N.V. |
| 144,246 |
| 2,750 |
| |
Akzo Nobel N.V. |
| 18,256 |
| 1,114 |
| |
Corio N.V. REIT |
| 5,854 |
| 478 |
| |
Hagemeyer N.V. |
| (a)4,613 |
| 23 |
| |
Heineken N.V. |
| 48,272 |
| 2,296 |
| |
ING Groep N.V. CVA |
| 126,199 |
| 5,595 |
| |
Koninklijke KPN NV |
| 106,404 |
| 494 |
| |
Koninklijke Philips Electronics N.V. |
| 56,394 |
| 2,127 |
| |
OCE N.V. |
| (c)6,272 |
| 103 |
| |
Reed Elsevier N.V. |
| 29,077 |
| 496 |
| |
Rodamco Europe N.V. |
| 4,805 |
| 639 |
| |
Royal KPN N.V. |
| 106,404 |
| 1,513 |
| |
Royal Numico N.V. |
| (c)8,957 |
| 482 |
| |
TNT N.V. |
| 46,071 |
| 1,981 |
| |
Unilever N.V. CVA |
| 147,160 |
| 4,021 |
| |
Wereldhave N.V. REIT |
| 2,385 |
| 318 |
| |
Wolters Kluwer N.V. CVA |
| 15,747 |
| 453 |
| |
|
|
|
| 29,142 |
| |
New Zealand (0.0%) |
|
|
|
|
| |
TelecomCorp. of New Zealand Ltd. |
| (c)20,517 |
| 70 |
| |
Norway (0.5%) |
|
|
|
|
| |
DNB NOR ASA |
| 23,299 |
| 331 |
| |
Norsk Hydro A S |
| 46,495 |
| 1,443 |
| |
Norske Skogindustrier ASA |
| 12,100 |
| 208 |
| |
Orkla ASA |
| (c)10,500 |
| 594 |
| |
Statoil ASA |
| (c)38,450 |
| 1,019 |
| |
Tandberg ASA |
| (c)10,600 |
| 160 |
| |
Tandberg Television ASA |
| (a)(c)5,400 |
| 68 |
| |
Telenor ASA |
| 44,200 |
| 831 |
| |
Yara International ASA |
| 14,819 |
| 337 |
| |
|
|
|
| 4,991 |
| |
Philippines (0.1%) |
|
|
|
|
| |
Philippines Long Distance Telephone Co. |
| 17,275 |
| 898 |
| |
Poland (0.5%) |
|
|
|
|
| |
Agora S.A. |
| 5,609 |
| 71 |
| |
Bank BPH |
| 1,394 |
| 445 |
| |
Bank Pekao S.A. |
| 11,930 |
| 932 |
| |
Bank ZachodniWBK S.A. |
| 3,886 |
| 301 |
| |
Grupa Kety S.A. |
| 163 |
| 11 |
| |
KGHM Polska Miedz S.A. |
| 19,397 |
| 595 |
| |
Polski Koncern Naftowy Orlen |
| 45,510 |
| 748 |
| |
Powszechna Kasa Oszczednosci Bank |
|
|
|
|
| |
Polski S.A. |
| 56,862 |
| 920 |
| |
Prokom SoftwareS.A. |
| 1,723 |
| 81 |
| |
Telekomunikacja Polska S.A. |
| 105,261 |
| 890 |
| |
|
|
|
| 4,994 |
| |
The accompanying notes are an integral part of the financial statements.
15
2006 Annual Report |
|
|
|
December 31, 2006 |
|
Portfolio of Investments (cont’d)
Active International Allocation Portfolio
|
| Shares |
| Value |
| |
Portugal (0.1%) |
|
|
|
|
| |
Banco Comercial Portugues S.A. (Registered) |
| 118,222 |
| $ | 437 |
|
Brisa-Auto Estradas de Portugal S.A. |
| (c)23,604 |
| 294 |
| |
Energias de Portugal S.A. |
| 24,260 |
| 123 |
| |
Portugal Telecom SGPS S.A. (Registered) |
| 40,620 |
| 528 |
| |
PT Multimedia SGPS S.A. |
| 1,488 |
| 19 |
| |
|
|
|
| 1,401 |
| |
Russia (1.0%) |
|
|
|
|
| |
LUKOIL ADR |
| 19,380 |
| 1,694 |
| |
MMC Norilsk Nickel ADR |
| (c)10,348 |
| 1,635 |
| |
Mobile Telesystems ADR |
| (c)10,900 |
| 547 |
| |
OAO Gazprom ADR (Registered) |
| 16,337 |
| 752 |
| |
OAO Gazprom ADR (Registered) |
| 47,481 |
| 2,186 |
| |
Polyus Gold Co. |
| (a)6,500 |
| 320 |
| |
Surgutneftegaz ADR |
| (c)8,900 |
| 685 |
| |
Surgutneftegaz ADR (Preference) |
| 4,300 |
| 482 |
| |
Tatneft GDR |
| 4,100 |
| 390 |
| |
Unified Energy System GDR |
| 5,050 |
| 553 |
| |
Vimpel-Communications ADR |
| (a)5,700 |
| 450 |
| |
|
|
|
| 9,694 |
| |
Singapore (2.0%) |
|
|
|
|
| |
Ascendas REIT |
| 158,000 |
| 275 |
| |
CapitaLand Ltd. |
| 193,000 |
| 780 |
| |
CapitaMall Trust REIT |
| 140,500 |
| 267 |
| |
Chartered Semiconductor Manufacturing Ltd. |
| (a)(c)227,000 |
| 189 |
| |
City Developments Ltd. |
| 85,719 |
| 710 |
| |
ComfortDelgro Corp., Ltd. |
| 304,477 |
| 320 |
| |
Cosco Corp Singapore |
| 132,000 |
| 198 |
| |
Creative Technology Ltd. |
| 13,267 |
| 88 |
| |
DBS Group Holdings Ltd. |
| 171,612 |
| 2,529 |
| |
Fraser & Neave, Ltd. |
| 204,000 |
| 599 |
| |
Jardine Cycle & Carriage Ltd. |
| 27,034 |
| 261 |
| |
K-REIT Asia |
| 9,200 |
| 15 |
| |
Keppel Corp., Ltd. |
| 87,000 |
| 998 |
| |
Keppel Land Ltd. |
| 57,000 |
| 256 |
| |
Neptune Orient Lines Ltd. |
| (c)113,000 |
| 154 |
| |
Overseas-Chinese Banking Corp. |
| 387,712 |
| 1,946 |
| |
Parkway Holdings Ltd. |
| 100,000 |
| 205 |
| |
SembCorp Industries Ltd. |
| 133,183 |
| 333 |
| |
SembCorp Marine Ltd. |
| 90,000 |
| 200 |
| |
Singapore Airlines Ltd. |
| 90,000 |
| 1,027 |
| |
Singapore Exchange Ltd. |
| 123,539 |
| 459 |
| |
Singapore Land Ltd. |
| 37,000 |
| 208 |
| |
Singapore Post Ltd. |
| 243,000 |
| 173 |
| |
Singapore Press Holdings Ltd. |
| 244,028 |
| 681 |
| |
Singapore Technologies Engineering Ltd. |
| 214,296 |
| 430 |
| |
Singapore Telecommunications Ltd. |
| 1,641,015 |
| 3,509 |
| |
STATS ChipPAC Ltd. |
| (a)218,000 |
| 166 |
| |
United Overseas Bank Ltd. |
| 178,389 |
| 2,256 |
| |
United Overseas Land Ltd. (London Shares) |
| 98,189 |
| 278 |
| |
Venture Corp., Ltd. |
| 41,444 |
| 365 |
| |
|
|
|
| 19,875 |
| |
South Africa(0.1%) |
|
|
|
|
| |
MTN Group Ltd. |
| 116,299 |
| 1,415 |
| |
South Korea (0.4%) |
|
|
|
|
| |
Doosan Heavy Industries and Construction Co., Ltd. |
| (a)15,360 |
| 731 |
| |
Samsung Electronics Co., Ltd. |
| 4,265 |
| 2,811 |
| |
|
|
|
| 3,542 |
| |
Spain (2.7%) |
|
|
|
|
| |
Abertis Infraestructuras S.A. |
| (c)22,215 |
| 660 |
| |
Acciona S.A. |
| 1,995 |
| 372 |
| |
Acerinox S.A. |
| (c)13,440 |
| 409 |
| |
ACS S.A. |
| 15,386 |
| 867 |
| |
Altadis S.A. |
| 14,776 |
| 773 |
| |
Antena 3 de Television S.A. |
| 3,133 |
| 74 |
| |
Banco Bilbao Vizcaya Argentaria S.A. |
| 129,993 |
| 3,130 |
| |
Banco Popular Espanol S.A. |
| (c)36,192 |
| 656 |
| |
Banco Santander Central Hispano S.A. |
| 242,641 |
| 4,529 |
| |
Cintra Concesiones de Infraestructuras de Transporte S.A. |
| 10,671 |
| 179 |
| |
Endesa S.A. |
| (c)33,521 |
| 1,585 |
| |
Fomentode Construcciones y Contratas S.A. |
| 2,184 |
| 223 |
| |
Gas Natural SDG S.A. |
| (c)48,101 |
| 1,904 |
| |
Grupo Ferrovial S.A. |
| (c)3,504 |
| 342 |
| |
Iberdrola S.A. |
| (c)28,390 |
| 1,241 |
| |
Inditex S.A. |
| (c)11,867 |
| 639 |
| |
Indra Sistemas S.A. |
| 2,740 |
| 67 |
| |
Metrovacesa S.A. |
| (c)1,527 |
| 259 |
| |
Repsol YPF S.A. |
| (c)46,721 |
| 1,616 |
| |
Sacyr Vallehermoso S.A. |
| (c)4,896 |
| 291 |
| |
Sociedad Generalde Aguas de Barcelona S.A., Class A |
| 9,242 |
| 339 |
| |
Telefonica S.A. |
| (c)255,206 |
| 5,431 |
| |
Union Fenosa S.A. |
| (c)6,857 |
| 339 |
| |
|
|
|
| 25,925 |
| |
Sweden (2.0%) |
|
|
|
|
| |
Alfa Laval AB |
| 1,250 |
| 56 |
| |
Assa Abloy AB, Class B |
| (c)20,477 |
| 446 |
| |
Atlas Copco AB, Class A |
| (c)12,297 |
| 399 |
| |
Atlas Copco AB, Class B |
| 19,798 |
| 665 |
| |
Eisai Co., Ltd. |
| 12,150 |
| 288 |
| |
Electrolux AB, Class B |
| (a)(c)12,800 |
| 256 |
| |
Eniro AB |
| 5,700 |
| 75 |
| |
Faberge AB |
| (c)3,300 |
| 88 |
| |
Getinge AB, Class B |
| 10,700 |
| 240 |
| |
Hennes & Mauritz AB, Class B |
| 20,050 |
| 1,013 |
| |
Holmen AB, Class B |
| (c)3,400 |
| 148 |
| |
Husqvarna AB |
| (a)12,800 |
| 200 |
| |
Modern Times Group, Class B |
| (a)(c)1,550 |
| 102 |
| |
Nordea Bank AB |
| 183,944 |
| 2,835 |
| |
Sandvik AB |
| 61,090 |
| 888 |
| |
Scania AB, Class B |
| (c)6,600 |
| 464 |
| |
Securitas Systems AB |
| (a)800 |
| 3 |
| |
Securitas AB, Class B |
| (c)800 |
| 12 |
| |
Securitas Direct AB |
| (a)800 |
| 3 |
| |
Skandinaviska Enskilda Banken AB, Class A |
| (c)30,666 |
| 974 |
| |
The accompanying notes are an integral part of the financial statements.
16
| 2006 Annual Report |
|
|
| December 31, 2006 |
Portfolio of Investments (cont’d)
Active International Allocation Portfolio
|
| Shares |
| Value |
| |
Sweden (cont’d) |
|
|
|
|
| |
Skanska AB, Class B |
| 20,351 |
| $ | 401 |
|
SKF AB, Class B |
| 19,264 |
| 356 |
| |
Svenska Cellulosa AB, Class B |
| 12,922 |
| 675 |
| |
Svenska Handelsbanken, Class A |
| 51,436 |
| 1,555 |
| |
Swedish Match AB |
| 25,700 |
| 481 |
| |
Tele2 AB, Class B |
| (c)8,724 |
| 127 |
| |
Telefonaktiebolaget LM Ericsson, Class B |
| 1,014,842 |
| 4,099 |
| |
TeliaSonera AB |
| 91,487 |
| 752 |
| |
Volvo AB, Class A |
| 5,995 |
| 426 |
| |
Volvo AB, Class B |
| 13,485 |
| 929 |
| |
Wihlborgs Fastigheter |
| 1,320 |
| 28 |
| |
|
|
|
| 18,984 |
| |
Switzerland (5.5%) |
|
|
|
|
| |
ABB Ltd. (Registered) |
| (c)144,894 |
| 2,598 |
| |
Ciba Specialty Chemicals AG (Registered) |
| 4,581 |
| 305 |
| |
Clariant AG (Registered) |
| (a)15,421 |
| 231 |
| |
Compagnie Financiere Richemont AG, Class A |
| 26,082 |
| 1,520 |
| |
Credit Suisse Group (Registered) |
| 54,307 |
| 3,799 |
| |
Geberit AG (Registered) |
| 243 |
| 374 |
| |
Givaudan (Registered) |
| 480 |
| 444 |
| |
Holcim Ltd. (Registered) |
| 13,545 |
| 1,242 |
| |
Kudelski S.A. |
| (c)2,842 |
| 107 |
| |
Logitech InternationalS.A. |
| (a)12,644 |
| 365 |
| |
Lonza Group AG (Registered) |
| 2,598 |
| 224 |
| |
Nestle S.A. (Registered) |
| 31,006 |
| 11,018 |
| |
Nobel Biocare Holding AG |
| 1,895 |
| 560 |
| |
Novartis AG (Registered) |
| 138,923 |
| 8,009 |
| |
Roche Holding AG (Genusschein) |
| 41,764 |
| 7,489 |
| |
Schindler Holding AG |
| 4,210 |
| 265 |
| |
Serono S.A., Class B |
| 317 |
| 285 |
| |
Straumann Holding AG |
| (c)863 |
| 209 |
| |
Sulzer AG (Registered) |
| 39 |
| 44 |
| |
Swatch Group AG (Registered) |
| 3,443 |
| 154 |
| |
Swatch Group AG, Class B |
| 1,678 |
| 371 |
| |
Swiss Reinsurance (Registered) |
| 5,092 |
| 433 |
| |
Swisscom AG (Registered) |
| 1,210 |
| 458 |
| |
Syngenta AG |
| (a)7,286 |
| 1,356 |
| |
Synthes, Inc. |
| 4,017 |
| 479 |
| |
UBS AG (Registered) |
| 157,830 |
| 9,592 |
| |
Zurich Financial Services AG (Registered) |
| 3,696 |
| 995 |
| |
|
|
|
| 52,926 |
| |
Turkey (0.8%) |
|
|
|
|
| |
Akbank T.A.S. |
| 179,421 |
| 1,090 |
| |
Anadolu Efes Biracilik ve Malt Sanayii A.S. |
| 4,184 |
| 129 |
| |
Arcelik A.S. |
| 36,423 |
| 215 |
| |
Dogan Sirketler Grubu Holdings A.S. |
| 156,226 |
| 246 |
| |
Dogan Yayin Holding A.S. |
| (a)45,949 |
| 162 |
| |
Eregli Demir ve Celik Fabrikalari T.A.S. |
| 82,790 |
| 526 |
| |
Ford Otomotiv Sanayi A.S. |
| 21,644 |
| 174 |
| |
Haci Omer Sabanci Holding A.S. |
| 128,341 |
| 503 |
| |
Hurriyet Gazetecilik ve Matbaacilik A.S. |
| 26,363 |
| 70 |
| |
Koc Holding A.S. |
| (a)67,095 |
| 261 |
| |
Migros Turk TAS |
| (a)28,713 |
| 371 |
| |
Trakya Cam Sanayi A.S. |
| 11,575 |
| 32 |
| |
Tupras-Turkie Petrol Rafinerileri A.S. |
| 25,390 |
| 434 |
| |
Turk Hava Yollari Anonim Ortakligi A.S. |
| (a)9,337 |
| 40 |
| |
Turk Sise ve Cam Fabrikalari A.S. |
| (a)26,914 |
| 95 |
| |
Turkcell Iletisim Hizmetleri A.S. |
| 335,254 |
| 1,694 |
| |
Turkiye Garanti Bankasi A.S., Class C |
| 226,607 |
| 749 |
| |
Turkiye Is Bankasi |
| 220,070 |
| 1,011 |
| |
Yapi ve Kredi Bankasi A.S. |
| (a)183,972 |
| 320 |
| |
|
|
|
| 8,122 |
| |
United Kingdom (17.1%) |
|
|
|
|
| |
3I Group plc |
| 13,108 |
| 259 |
| |
Aegis Group plc |
| 45,188 |
| 124 |
| |
Amec plc |
| 15,693 |
| 130 |
| |
Amvescap plc |
| 19,221 |
| 224 |
| |
Anglo American plc |
| 106,739 |
| 5,206 |
| |
Arriva plc |
| 7,994 |
| 120 |
| |
AstraZeneca plc |
| 120,367 |
| 6,467 |
| |
Aviva plc |
| 188,523 |
| 3,034 |
| |
BAE Systems plc |
| 223,581 |
| 1,864 |
| |
Balfour Beatty plc |
| 33,319 |
| 289 |
| |
Barclays plc |
| 365,068 |
| 5,218 |
| |
Barratt Developments plc |
| 10,060 |
| 243 |
| |
BBA Group PLC |
| 29,049 |
| 156 |
| |
Bellway plc |
| 4,519 |
| 137 |
| |
Berkeley Group Holdings plc |
| (a)4,737 |
| 159 |
| |
BG Group plc |
| 205,569 |
| 2,789 |
| |
BHP Billiton plc |
| (c)197,584 |
| 3,615 |
| |
Biffa PLC |
| 32,703 |
| 197 |
| |
Boots Group PLC |
| 34,428 |
| 565 |
| |
BP plc |
| 1,123,412 |
| 12,483 |
| |
British Airways plc |
| (a)38,150 |
| 394 |
| |
British American Tobacco plc |
| 82,361 |
| 2,304 |
| |
British Land Co. plc |
| 23,539 |
| 790 |
| |
British Sky Broadcasting plc |
| 45,571 |
| 466 |
| |
BT Group plc |
| 504,558 |
| 2,979 |
| |
Bunzl plc |
| 27,898 |
| 343 |
| |
Burberry Group plc |
| 11,691 |
| 148 |
| |
Cadbury Schweppes plc |
| 122,237 |
| 1,308 |
| |
Capita Group plc |
| 8,063 |
| 96 |
| |
Carnival plc |
| 14,913 |
| 756 |
| |
Centrica plc |
| 184,716 |
| 1,282 |
| |
Close Bros Group plc |
| 1,586 |
| 32 |
| |
Cobham plc |
| 78,283 |
| 297 |
| |
Compass Group plc |
| 179,925 |
| 1,022 |
| |
Corus Group plc |
| 55,520 |
| 577 |
| |
Daily Mail& General Trust, Class A |
| 12,876 |
| 181 |
| |
Diageo plc |
| 199,287 |
| 3,912 |
| |
DSG International plc |
| 77,930 |
| 292 |
| |
Electrocomponents plc |
| 39,366 |
| 226 |
| |
Emap plc |
| 8,964 |
| 142 |
| |
EMI Group plc |
| 33,919 |
| 176 |
| |
Enterprise Inns plc |
| 30,392 |
| 805 |
| |
Experian Group Ltd. |
| 33,018 |
| 388 |
| |
Fiberweb plc |
| (a)9,102 |
| 37 |
| |
Firstgroup plc |
| 26,030 |
| 293 |
| |
FKI plc |
| 7,577 |
| 15 |
| |
The accompanying notes are an integral part of the financial statements.
17
2006 Annual Report |
|
|
|
December 31, 2006 |
|
Portfolio of Investments (cont’d)
Active International Allocation Portfolio
|
| Shares |
| Value |
| |
United Kingdom (cont’d) |
|
|
|
|
| |
Friends Provident plc |
| 144,480 |
| $ | 614 |
|
GKN plc |
| 27,325 |
| 149 |
| |
GlaxoSmithKline plc |
| 411,816 |
| 10,837 |
| |
Group 4 Securicor plc |
| 13,896 |
| 51 |
| |
Hammerson plc |
| 12,932 |
| 399 |
| |
Hanson plc |
| 46,008 |
| 694 |
| |
Hays plc |
| 19,415 |
| 61 |
| |
HBOS plc |
| 228,247 |
| 5,059 |
| |
Home Retail Group |
| 33,004 |
| 265 |
| |
HSBC Holdings plc |
| 322,576 |
| 5,880 |
| |
ICAP plc |
| 5,916 |
| 55 |
| |
IMI plc |
| 30,958 |
| 307 |
| |
Imperial ChemicalIndustries plc |
| 75,789 |
| 671 |
| |
Imperial Tobacco Group plc |
| 34,960 |
| 1,376 |
| |
Intercontinental Hotels Group plc |
| 35,446 |
| 876 |
| |
International Power plc |
| 17,046 |
| 127 |
| |
Invensys PLC |
| (a)13,017 |
| 70 |
| |
ITV plc |
| 157,279 |
| 328 |
| |
Johnson Matthey plc |
| 14,011 |
| 387 |
| |
Kelda Group plc |
| 37,329 |
| 677 |
| |
Kesa Electricals plc |
| 11,073 |
| 74 |
| |
Kingfisher plc |
| 47,091 |
| 220 |
| |
Ladbrokes plc |
| 48,955 |
| 401 |
| |
Land Securities Group plc |
| 21,050 |
| 957 |
| |
Legal & General Group plc |
| 479,706 |
| 1,479 |
| |
Liberty International plc |
| 11,276 |
| 308 |
| |
Lloyds TSB Group plc |
| 385,174 |
| 4,310 |
| |
Logica CMG plc |
| 56,838 |
| 207 |
| |
London Stock Exchange plc |
| 2,616 |
| 67 |
| |
Man Group Plc |
| 41,515 |
| 425 |
| |
Marks & Spencer Group plc |
| 67,228 |
| 944 |
| |
Meggitt plc |
| 35,372 |
| 215 |
| |
MFI Furniture plc |
| (a)6,439 |
| 17 |
| |
Misys plc |
| 29,380 |
| 124 |
| |
Mitchells & Butlers PLC |
| 37,375 |
| 520 |
| |
National Express Group plc |
| 8,059 |
| 178 |
| |
National Grid plc |
| 208,740 |
| 3,012 |
| |
Next plc |
| 10,558 |
| 372 |
| |
Pearson plc |
| 32,793 |
| 495 |
| |
Persimmon plc |
| 11,329 |
| 338 |
| |
Provident Financial Group plc |
| 3,113 |
| 43 |
| |
Prudential plc |
| 138,095 |
| 1,891 |
| |
Punch Taverns plc |
| 21,548 |
| 540 |
| |
Reckitt Benckiser plc |
| 60,597 |
| 2,769 |
| |
Reed Elsevier plc |
| 51,762 |
| 568 |
| |
Rentokil Initial plc |
| 22,066 |
| 72 |
| |
Resolution plc |
| 2,420 |
| 30 |
| |
Reuters Group plc |
| 60,790 |
| 530 |
| |
Rexam plc |
| 35,525 |
| 366 |
| |
Rio Tinto plc |
| 82,366 |
| 4,383 |
| |
Rolls-Royce Group plc |
| (a)117,755 |
| 1,032 |
| |
Royal Bank of Scotland Group plc |
| 174,421 |
| 6,806 |
| |
Royal Dutch Shell plc, Class A |
| 228,907 |
| 8,000 |
| |
Royal Dutch Shell plc, Class B |
| 159,926 |
| 5,605 |
| |
SAB Miller plc |
| 25,428 |
| 585 |
| |
Sage Group plc |
| 95,991 |
| 509 |
| |
Sainsbury (J) plc |
| 66,692 |
| 534 |
| |
Schroders plc |
| 1,515 |
| 33 |
| |
Scottish & Newcastle plc |
| 12,006 |
| 132 |
| |
Scottish & Southern Energy plc |
| 65,754 |
| 2,001 |
| |
Scottish Power plc |
| 113,028 |
| 1,655 |
| |
Serco Group plc |
| 5,648 |
| 42 |
| |
Severn Trent |
| 21,832 |
| 628 |
| |
Signet Group plc |
| 62,585 |
| 145 |
| |
Slough Estates plc |
| 18,525 |
| 285 |
| |
Smith & Nephew plc |
| 48,277 |
| 504 |
| |
Smiths Group plc |
| 38,771 |
| 753 |
| |
Stagecoach Group plc |
| 31,414 |
| 94 |
| |
Tate & Lyle plc |
| 42,628 |
| 641 |
| |
Taylor Woodrow plc |
| 24,602 |
| 205 |
| |
Tesco plc |
| 374,938 |
| 2,970 |
| |
TI Automotive Ltd., Class A |
| (a)(d)(l)1,505 |
| @— |
| |
Tomkins plc |
| 66,611 |
| 321 |
| |
Unilever plc |
| 80,414 |
| 2,248 |
| |
United Business Media plc |
| 11,663 |
| 158 |
| |
United Utilities plc |
| 15,318 |
| 234 |
| |
Vodafone Group plc |
| 3,238,391 |
| 8,972 |
| |
Whitbread PLC |
| 18,862 |
| 619 |
| |
William Hill plc |
| 35,205 |
| 436 |
| |
Wimpey George plc |
| 16,446 |
| 180 |
| |
Wolseley plc |
| 39,504 |
| 954 |
| |
WPP Group plc |
| 40,150 |
| 543 |
| |
Xstrata plc |
| 19,094 |
| 953 |
| |
Yell Group plc |
| 26,153 |
| 292 |
| |
|
|
|
| 166,347 |
| |
Total Common Stocks (Cost $634,544) |
|
|
| 883,125 |
| |
|
| No. of |
|
|
|
Rights (0.0%) |
|
|
|
|
|
Japan (0.0%) |
|
|
|
|
|
Dowa MiningCo., Ltd., expiring 1/29/10 |
| 49,000 |
| @— |
|
|
| Face |
|
|
| |
Short-Term Investments (21.4%) |
|
|
|
|
| |
Short-Term Debt Securities held as Collateral on Loaned Securities (13.2%) |
|
|
|
|
| |
Alliance & Leicester plc, |
|
|
|
|
| |
5.36%, 1/8/07 |
| $ | (h)4,145 |
| 4,145 |
|
Bancaja, 5.37%, 1/19/07 |
| (h)2,073 |
| 2,073 |
| |
Bank of America Corp., 5.32%, 1/2/07 |
| (h)6,633 |
| 6,633 |
| |
Bank of New York Co., Inc., |
|
|
|
|
| |
5.34%, 1/10/07 |
| (h)2,073 |
| 2,073 |
| |
Bear Stearns & Co., Inc., |
|
|
|
|
| |
5.37%, 1/2/07 |
| (h)2,487 |
| 2,487 |
| |
5.38%, 1/2/07 |
| (h)1,658 |
| 1,658 |
| |
5.39%, 1/16/07 |
| (h)4,145 |
| 4,145 |
| |
BNP Paribas plc, |
|
|
|
|
| |
5.35%, 2/20/07 |
| (h)4,145 |
| 4,145 |
| |
CIC, New York, |
|
|
|
|
| |
5.33%, 1/3/07 |
| (h)2,902 |
| 2,902 |
| |
The accompanying notes are an integral part of the financial statements.
18
| 2006 Annual Report |
|
|
| December 31, 2006 |
Portfolio of Investments (cont’d)
Active International Allocation Portfolio
|
| Face |
| Value |
| ||
Short-Term Debt Securities held as Collateral on Loaned Securities (cont’d) |
|
|
|
|
| ||
5.34%, 1/2/07 |
| $ | (h)4,146 |
| $ | 4,146 |
|
Dekabank Deutsche Girozentrale, |
|
|
|
|
| ||
5.39%, 1/19/07 |
| (h)4,228 |
| 4,228 |
| ||
Deutsche Bank Securities, Inc., |
|
|
|
|
| ||
5.33%, 1/2/07 |
| 13,303 |
| 13,303 |
| ||
Dexia Bank, New York, |
|
|
|
|
| ||
5.33%, 1/2/07 |
| (h)4,145 |
| 4,145 |
| ||
Gemini Securitization Corp., |
|
|
|
|
| ||
5.34%, 1/2/07 |
| 2,071 |
| 2,071 |
| ||
Goldman Sachs Group, Inc., |
|
|
|
|
| ||
5.40%, 1/16/07 |
| (h)2,073 |
| 2,073 |
| ||
5.42%, 1/2/07 |
| (h)3,897 |
| 3,897 |
| ||
HSBC Finance Corp., 5.34%, 1/8/07 |
| (h)2,073 |
| 2,073 |
| ||
Liberty Lighthouse U.S. Capital, |
|
|
|
|
| ||
5.33%, 1/2/07 |
| (h)2,073 |
| 2,073 |
| ||
Manufacturers & Traders, |
|
|
|
|
| ||
5.33%, 1/16/07 |
| (h)2,487 |
| 2,487 |
| ||
Merrill Lynch & Co., |
|
|
|
|
| ||
5.35%, 1/26/07 |
| (h)2,179 |
| 2,179 |
| ||
Mitsubishi UFJ Financial Group, |
|
|
|
|
| ||
5.33%, 1/2/07 |
| (h)2,073 |
| 2,073 |
| ||
Natexis Banques Populaires, New York, |
|
|
|
|
| ||
5.34%, 1/2/07 |
| (h)4,146 |
| 4,146 |
| ||
5.35%, 1/2/07 |
| (h)2,073 |
| 2,073 |
| ||
National City Bank Cleveland, |
|
|
|
|
| ||
5.32%, 1/2/07 |
| (h)6,012 |
| 6,012 |
| ||
National Rural Utilities Cooperative |
|
|
|
|
| ||
Finance Corp., |
|
|
|
|
| ||
5.34%, 1/2/07 |
| (h)8,291 |
| 8,291 |
| ||
Nationwide Building Society, |
|
|
|
|
| ||
5.44%, 3/28/07 |
| (h)4,809 |
| 4,809 |
| ||
Nordea Bank, New York, |
|
|
|
|
| ||
5.31%, 1/2/07 |
| (h)6,219 |
| 6,219 |
| ||
Rhein-Main Securitisation Ltd., |
|
|
|
|
| ||
5.33%, 1/18/07 |
| 1,957 |
| 1,957 |
| ||
Skandi, New York, |
|
|
|
|
| ||
5.34%, 1/9/07 |
| (h)4,146 |
| 4,146 |
| ||
SLM Corp., 5.36%, 1/22/07 |
| (h)4,146 |
| 4,146 |
| ||
Toronto Dominion, New York, |
|
|
|
|
| ||
5.32%, 5/29/07 |
| (h)4,146 |
| 4,146 |
| ||
Tulip Funding, 5.36%, 1/16/07 |
| 2,277 |
| 2,277 |
| ||
Unicredito ItalianoBank (Ireland) plc, |
|
|
|
|
| ||
5.36%, 1/9/07 |
| (h)2,901 |
| 2,901 |
| ||
World Savings Bank FSB, |
|
|
|
|
| ||
5.35%, 1/19/07 |
| (h)1,409 |
| 1,409 |
| ||
|
|
|
| 127,541 |
| ||
Repurchase Agreement (8.2%) |
|
|
|
|
| ||
J.P. Morgan Securities, Inc., 5.20%, |
| (f)79,856 |
| 79,856 |
| ||
Total Short-Term Investments (Cost $207,397) |
|
|
| 207,397 |
| ||
Total Investments (112.3%) (Cost $841,941) |
|
|
| 1,090,522 |
| ||
Liabilities in Excess of Other Assets (-12.3%) |
|
|
| (119,588) |
| ||
Net Assets(100%) |
|
|
| $ | 970,934 |
| |
(a) |
| Non-income producing security. |
|
|
|
(c) |
| All or portion of security on loan at December 31, 2006. |
|
|
|
(d) |
| Securities were valued at fair value — At December 31, 2006, the Portfolio held $5,000 of fair valued securities, representing less than 0.05% of net assets. |
|
|
|
(e) |
| 144A security — certain conditions for public sale may exist. Unless otherwise noted, these securities are deemed to be liquid. |
|
|
|
(f) |
| Represents the Portfolio’s undivided interest in a joint repurchase agreement which has a total value of $1,856,998,000. The repurchase agreement was fully collateralized by U.S. government agency securities at the date of this Portfolio of Investments as follows: Federal Farm Credit Bank, 0.00% to 7.43%, due 1/16/07 to 10/23/35; Federal Home Loan Bank, 0.00% to 7.38%, due 1/3/07 to 6/5/28; Federal Home Loan Mortgage Corp., 0.00% to 6.75%, due 1/2/07 to 7/15/32; Federal National Mortgage Association, 0.00% to 8.20%, due 1/12/07 to 11/15/30; Tennessee Valley Authority, 5.38% to 6.75%, due 11/13/08 to 4/1/36, which had a total value of $1,894,142,869. The investment in the repurchase agreement is through participation in a joint account with affiliated parties pursuant to exemptive relief received by the Portfolio from the SEC. |
|
|
|
(h) |
| Variable/Floating Rate Security— interest rate changes on these instruments are based on changes in a designated base rate. The rates shown are those in effect on December 31, 2006. |
|
|
|
(l) |
| Security has been deemed illiquid at December 31, 2006. |
|
|
|
@ |
| Face Amount/Value is less than $500. |
|
|
|
ADR |
| American Depositary Receipts |
|
|
|
CVA |
| Certificaten Van Aandelen |
|
|
|
GDR |
| Global Depositary Receipts |
|
|
|
REIT |
| Real Estate Investment Trust |
|
|
|
RNC |
| Non-Convertible Savings Shares |
Foreign Currency Exchange Contract Information:
The Portfolio had the following foreign currency exchange contract(s) open at
period end:
|
|
|
|
|
|
|
|
|
|
|
| Net |
| ||||||
to |
|
|
|
|
|
|
| Exchange |
|
|
| Appreciation |
| ||||||
Deliver |
| Value |
|
|
| For |
| Value |
| (Depreciation) |
| ||||||||
(000) |
| (000) |
|
| (000) |
| (000) |
| (000) |
| |||||||||
EUR |
| 51,587 |
| $ | 68,313 |
| 3/14/07 |
| USD | 68,408 |
| $ | 68,408 |
| $ | 95 |
| ||
GBP |
| 3,173 |
| 6,214 |
| 3/14/07 |
| USD | 6,239 |
| 6,239 |
| 25 |
| |||||
HKD |
| 291,215 |
| 37,506 |
| 2/16/07 |
| USD | 37,545 |
| 37,545 |
| 39 |
| |||||
JPY |
| 5,343,420 |
| 45,160 |
| 2/16/07 |
| USD | 45,963 |
| 45,963 |
| 803 |
| |||||
JPY |
| 656,125 |
| 5,563 |
| 3/14/07 |
| USD | 5,651 |
| 5,651 |
| 88 |
| |||||
USD |
| 19,427 |
| 19,427 |
| 2/16/07 |
| AUD | 25,431 |
| 20,052 |
| 625 |
| |||||
USD |
| 49,012 |
| 49,012 |
| 2/16/07 |
| EUR | 38,090 |
| 50,385 |
| 1,373 |
| |||||
USD |
| 54,240 |
| 54,240 |
| 3/14/07 |
| EUR | 40,874 |
| 54,127 |
| (113 | ) | |||||
USD |
| 57,388 |
| 57,388 |
| 3/14/07 |
| GBP | 29,180 |
| 57,148 |
| (240 | ) | |||||
USD |
| 9,083 |
| 9,083 |
| 2/16/07 |
| HKD | 70,454 |
| 9,073 |
| (10 | ) | |||||
USD |
| 29,660 |
| 29,660 |
| 2/16/07 |
| JPY | 3,445,560 |
| 29,120 |
| (540 | ) | |||||
USD |
| 18,675 |
| 18,675 |
| 3/14/07 |
| JPY | 2,165,155 |
| 18,359 |
| (316 | ) | |||||
USD |
| 3,538 |
| 3,538 |
| 3/14/07 |
| SEK | 24,065 |
| 3,530 |
| (8 | ) | |||||
USD |
| 1,402 |
| 1,402 |
| 1/02/07 |
| ZAR | 9,755 |
| 1,391 |
| (11 | ) | |||||
|
|
|
| $ | 405,181 |
|
|
|
|
|
|
|
| $ | 406,991 |
| $ | 1,810 |
|
The accompanying notes are an integral part of the financial statements.
19
2006 Annual Report |
|
| |
December 31, 2006 |
|
Portfolio of Investments (cont’d)
Active International Allocation Portfolio
— Australian Dollar | |
EUR | — Euro |
GBP | — British Pound |
HKD | — Hong KongDollar |
JPY | — Japanese Yen |
SEK | — Swedish Krona |
USD | — United States Dollar |
ZAR | — South African Rand |
Futures Contracts:
The Portfolio had the following futures contract(s) open at period end:
|
|
|
|
|
|
|
| Net |
| ||
|
|
|
|
|
|
|
| Unrealized |
| ||
|
| Number |
|
|
|
|
| Appreciation |
| ||
|
| of |
| Value |
| Expiration |
| (Depreciation) |
| ||
|
| Contracts |
| (000) |
| Date |
| (000) |
| ||
Long: |
|
|
|
|
|
|
|
|
| ||
|
|
|
|
|
|
|
|
|
| ||
CAC 40 Index |
| 178 |
| 13,081 |
| Jan-07 |
| $ | 83 |
| |
DAX Index |
| 76 |
| 16,685 |
| Mar-07 |
| 96 |
| ||
FTSE 100 Index |
| 74 |
| 9,006 |
| Mar-07 |
| (105 | ) | ||
Hang Seng Index |
| 65 |
| 8,364 |
| Jan-07 |
| 301 |
| ||
Nikkei 225 Index |
| 63 |
| 9,143 |
| Mar-07 |
| 479 |
| ||
OMX 30 Index |
| 273 |
| 4,600 |
| Jan-07 |
| 64 |
| ||
SPI 200 |
| 37 |
| $ | 4,122 |
| Mar-07 |
| 53 |
| |
TOPIX Index |
| 198 |
| 27,993 |
| Mar-07 |
| 1,313 |
| ||
|
|
|
|
|
|
|
| $ | 2,284 |
| |
The accompanying notes are an integral part of the financial statements.
20
| 2006 Annual Report |
|
|
| December 31, 2006 |
| |
Investment Overview (unaudited) | |
Emerging Markets Portfolio
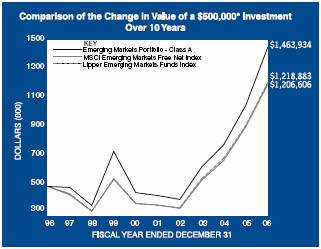
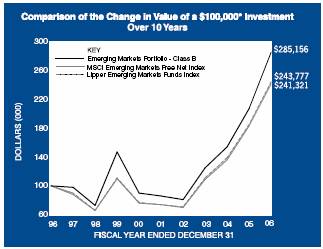
* Minimum Investment
In accordance with SEC regulations, Portfolio performance shown assumes that all recurring fees (including management fees) were deducted and all dividends and distributions were reinvested.
Performance Compared to the Morgan Stanley
Capital International (MSCI) Emerging Markets
Free Net Index(1) and the Lipper Emerging Markets
Funds Index(2)
|
| Total Returns(3) |
| ||||||
|
|
|
| Average Annual |
| ||||
|
| One |
| Five |
| Ten |
| Since |
|
|
| Year |
| Years |
| Years |
| Inception(6) |
|
Portfolio – Class A (4) |
| 38.00 | % | 27.35 | % | 11.34 | % | 11.84 | % |
MSCI Emerging Markets Free Net Index |
| 32.17 |
| 26.59 |
| 9.21 |
| 10.67 |
|
Lipper Emerging Markets Funds Index |
| 32.07 |
| 26.94 |
| 9.32 |
| — |
|
|
|
|
|
|
|
|
|
|
|
Portfolio – Class B (5) |
| 37.65 |
| 27.02 |
| 11.05 |
| 11.08 |
|
MSCI Emerging Markets Free Net Index |
| 32.17 |
| 26.59 |
| 9.21 |
| 8.85 |
|
Lipper Emerging Markets Funds Index |
| 32.07 |
| 26.94 |
| 9.32 |
| 9.49 |
|
Performance data quoted represents past performance, which is no guarantee of future results, and current performance may be lower or higher than the figures shown. Performance assumes that all dividends and distributions, if any, were reinvested. For the most recent month-end performance figures, please visit www.morganstanley.com/im. Investment return and principal value will fluctuate so that Portfolio shares, when redeemed, may be worth more or less than their original cost. Total returns do not reflect the deduction of taxes that a shareholder would pay on Portfolio distributions or the redemption of Portfolio shares.
(1) The MSCI Emerging Markets Free Net Index is a free float-adjusted market capitalization index that is designed to measure equity market performance in the global emerging markets. The MSCI Emerging Markets Net Index consists of the following 26 emerging market country indices: Argentina, Brazil, Chile, China, Colombia, Czech Republic, Egypt, Hungary, India, Indonesia, Israel, Jordan, Korea, Malaysia, Mexico, Morocco, Pakistan, Peru, Philippines, Poland, Russia, South Africa, Taiwan, Thailand, Turkey and Venezuela. This series approximates the minimum possible dividend reinvestment. The dividend is reinvested after deduction of withholding tax, applying the rate to non-resident individuals who do not benefit from double taxation treaties. The Index is unmanaged and its returns do not include any sales charges or fees. Such costs would lower performance. It is not possible to invest directly in an index.
(2) The Lipper Emerging Markets Funds Index is an equally weighted performance index of the largest qualifying funds (based on net assets) in the Lipper Emerging Markets Funds classification. The Index, which is adjusted for capital gains distributions and income dividends, is unmanaged and should not be considered an investment. There are currently 30 funds represented in this Index. As of the date of this report, the Portfolio is in the Lipper Emerging Markets Funds classification.
(3) Total returns for the Portfolio reflect fees waived and expenses reimbursed, if applicable, by the Adviser. Without such waivers and/or reimbursements, total returns would have been lower. Fee waivers and/or expense reimbursements are voluntary and the Adviser reserves the right to commence or terminate any waiver and/or reimbursement at any time.
(4) Commenced operations on September 25, 1992
(5) Commenced operations on January 2, 1996
(6) For comparative purposes, average annual since inception returns listed for the Indexes refer to the inception date or initial offering of the respective share class of the Portfolio, not the inception of the Index.
The Emerging Markets Portfolio seeks long-term capital appreciation by investing primarily in growth-oriented equity securities of issuers in emerging market countries. Foreign investing involves certain risks, including currency fluctuations and controls, restrictions on foreign investments,
21
2006 Annual Report |
|
|
|
December 31, 2006 |
|
Investment Overview (cont’d)
Emerging Markets Portfolio
less governmental supervision and regulation, less liquidity and the potential for market volatility and political instability. In addition, investing in emerging markets may involve a relative higher degree of volatility.
Performance
For the year ended December 31, 2006, the Portfolio had a total return based on net asset value per share of 38.00%, net of fees, for the Class A shares and 37.65%, net of fees, for the Class B shares compared to 32.17% for the Morgan Stanley Capital International (MSCI) Emerging Markets Free Net Index (the “Index”).
Factors Affecting Performance
• Emerging markets equities posted their fourth consecutive calendar year of double-digit returns in 2006. As measured by the Index, the asset class returned 32.2% for the year, following returns of 34% in 2005, 25.6% in 2004, and 55.8% in 2003. Moreover, the emerging markets continued their out performance over the developed markets for the sixth consecutive year. In 2006, the emerging markets beat the S&P 500® Index by 16% and developed international markets (as measured by the MSCI Europe, Australia and Far East [EAFE] Index) by 6%.
• During the year, the asset class benefited from strong macroeconomic growth, a healthy consumer and supportive commodity prices. On a regional basis, Latin America was the star performer, followed by Asia and the Europe, Middle East and Africa (EMEA) region.
• Relative to the Index, overall country allocation and stock selection both contributed favorably to performance.
• Specifically, strong contributors to performance included overweight allocations to Russia and Mexico and stock selection in both countries. In Russia, an overweight to the consumer-driven sectors, particularly the financials sector, provided positive returns. In Mexico, performance was helped by an overweight to significant secular themes within the wireless, media and select consumer sectors.
• Underweight allocations to South Korea, Israel and Taiwan also helped relative results. In South Korea, fundamentals have peaked, in our view, as gross domestic product (GDP) growth is slowing and domestic demand is weakening. Taiwan remains our second largest underweight position in the Portfolio as domestic demand remains sluggish. Israel remained an underweight position based on political risk and a neutral macro outlook.
• However, an overweight allocation to South Africa and stock selection there proved disadvantageous. We reduced the Portfolio’s overweight position in South Africa and now hold a neutral weight in the country due to the prospects of rising inflation and interest rates. Higher than expected inflation and trade deficit data have raised concerns that domestic interest rates may continue to rise, hampering economic growth and especially consumption, which was a key theme in the Portfolio.
• An overweight allocation to Turkey, which underperformed the Index, and an underweight to China, the best performing market in the Index, detracted from performance. However, stock selection in both countries was a positive contributor. Turkey never fully recovered from the May 2006 sell-off. Uncertainty over upcoming elections and a high current account deficit continues to put pressure on Turkey’s market. In the fourth quarter, we began shifting the Portfolio’s underweight to China to a more neutral position because of improving profitability metrics and a positive outlook on GDP growth and low inflation.
Management Strategies
• We remain positive on the long-term outlook for emerging markets, as valuations and fundamentals remain attractive by our measures. We believe a robust macroeconomic environment and a strengthening domestic consumer across these markets should provide some cushion from external shocks. Risks to the asset class include a global liquidity crunch, the potential slowing of the U.S. economy, falling commodity prices and changes in risk appetite. However, in our view, strong fundamentals in emerging markets in the aggregate, including current account surpluses, healthy fiscal accounts and low inflation, should help their economies prove resilient in the face of monetary tightening. In addition, productivity gains and a growing consumer sector within emerging markets should also help offset the economic effects of any decline in commodities prices.
• We continue to overweight Latin America and the EMEA region and remain underweight Asia. On a country basis, the Portfolio is currently overweight Mexico, Poland, Russia and Indonesia and underweight South Korea, Taiwan, Israel and Malaysia. The Portfolio
22
| 2006 Annual Report |
| |
| December 31, 2006 |
Investment Overview (cont’d)
Emerging Markets Portfolio
has a strong bias towards financials and other consumer-driven sectors and underweight energy and materials.
Expense Examples
As a shareholder of the Portfolio, you may incur two types of costs: (1) transactional costs, including redemption fees; (2) ongoing costs, including management fees, distribution (12b-1) fees (in the case of Class B); and other Portfolio expenses. These examples are intended to help you understand your ongoing costs (in dollars) of investing in the Portfolio and to compare these costs with the ongoing costs of investing in other mutual funds.
The examples are based on an investment of $1,000 invested at the beginning of the six-month period ended December 31, 2006 and held for the entire six-month period.
Actual Expenses
The first line of the tables below provides information about actual account values and actual expenses. You may use the information in this line, together with the amount you invested, to estimate the expenses that you paid over the period. Simply divide your account value by $1,000 (for example, an $8,600 account value divided by $1,000 = 8.6), then multiply the result by the number in the first line under the heading entitled “Expenses Paid During Period” to estimate the expenses you paid on your account during this period.
Please note that “Expenses Paid During Period” are grossed up to reflect Portfolio expenses prior to the effect of Expense Offset (See Note E in the Notes to Financial Statements). Therefore, the annualized net expense ratios may differ from the ratio of the expenses to average net assets shown in the Financial Highlights.
Hypothetical Example for Comparison Purposes
The second line of the tables below provides information about hypothetical account values and hypothetical expenses based on the Portfolio’s actual expense ratio and an assumed rate of return of 5% per year before expenses, which is not the Portfolio’s actual return. The hypothetical account values and expenses may not be used to estimate the actual ending account balance or expenses you paid for the period. You may use this information to compare the ongoing costs of investing in the Portfolio and other funds. To do so, compare this 5% hypothetical example with the 5% hypothetical examples that appear in the shareholder reports of the other funds.
Please note that the expenses shown in the table are meant to highlight your ongoing costs only and do not reflect any transactional costs, such as redemption fees. Therefore, the second line of the table is useful in comparing ongoing costs only, and will not help you determine the relative total costs of owning different funds. In addition, if these transactional costs were included, your costs would have been higher.
|
|
|
|
|
| Expenses Paid |
| |||
|
|
|
| Ending Account |
| During Period* |
| |||
|
| Beginning |
| Value |
| July 1, 2006 — |
| |||
|
| Account Value |
| December 31, |
| December 31, |
| |||
|
| July 1,2006 |
| 2006 |
| 2006 |
| |||
Class A |
|
|
|
|
|
|
| |||
Actual |
| $ | 1,000.00 |
| $ | 1,268.90 |
| $ | 8.01 |
|
Hypothetical (5% average annual return before expenses) |
| 1,000.00 |
| 1,018.15 |
| 7.12 |
| |||
|
|
|
|
|
|
|
| |||
Class B |
|
|
|
|
|
|
| |||
Actual |
| 1,000.00 |
| 1,267.40 |
| 9.43 |
| |||
Hypothetical (5% average annual return before expenses) |
| 1,000.00 |
| 1,016.89 |
| 8.39 |
| |||
* Expenses are equal to Class A and Class B annualized net expense ratios of 1.40% and 1.65%, respectively, multiplied by the
average account value over the period, multiplied by 184/365 (to reflect the one-half year period).
Graphic Presentation of Portfolio Holdings
The following graph depicts the Portfolio’s holdings by industry and/or security type, as a percentage of total investments.
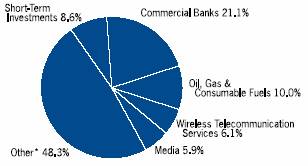
* Industries which do not appear in the above graph, as well as those which represent less than 5% of total investments, if applicable, are included in the category labeled “Other”.
January 2007
23
2006 Annual Report |
|
|
|
December 31, 2006 |
|
Portfolio of Investments
Emerging Markets Portfolio
|
|
|
| Value |
| |
|
| Shares |
| (000) |
| |
Common Stocks (98.3%) |
|
|
|
|
| |
Argentina (0.9%) |
|
|
|
|
| |
Banco Macro Bansud S.A. ADR |
| (c)309,600 |
| $ | 9,663 |
|
Tenaris S.A. ADR |
| (c)231,500 |
| 11,549 |
| |
|
|
|
| 21,212 |
| |
Austria (1.6%) |
|
|
|
|
| |
Erste Bank der Oesterreichischen |
| 153,736 |
| 11,791 |
| |
Raiffeisen International Bank Holding AG |
| (c)169,936 |
| 25,911 |
| |
|
|
|
| 37,702 |
| |
Brazil (11.6%) |
|
|
|
|
| |
All America Latina Logistica S.A. |
| 1,074,500 |
| 11,150 |
| |
Banco Itau Holding Financeira S.A. ADR |
| 570,293 |
| 20,616 |
| |
Banco Itau Holding Financeira S.A. |
| (c)363,832 |
| 13,181 |
| |
Banco Nacional S.A. (Preference) |
| (a)(d)(l)295,998,880 |
| @— |
| |
Cia Energetica de Minas Gerais S.A. ADR |
| 350,700 |
| 16,904 |
| |
CVRD ADR |
| 1,384,348 |
| 36,339 |
| |
CVRD, Class A (Preference) |
| 28,042 |
| 710 |
| |
Cyrela Brazil Realty |
| 706,000 |
| 6,738 |
| |
Gerdau S.A. ADR |
| 406,268 |
| 6,500 |
| |
Gerdau S.A. (Preference) |
| (c)390,250 |
| 6,377 |
| |
Gol Linhas Aereas Inteligentes S.A. ADR |
| (c)182,300 |
| 5,226 |
| |
Investimentos Itau S.A. |
| 2,161,894 |
| 11,050 |
| |
Lojas Americanas S.A. |
| 206,231,000 |
| 11,535 |
| |
Natura Cosmeticos S.A. |
| 628,000 |
| 8,862 |
| |
NET Servicos de ComunicacaoS.A. |
| 413,000 |
| 4,692 |
| |
Petrobras S.A. ADR |
| 183,375 |
| 18,886 |
| |
Petrobras S.A. ADR (Preference) |
| 437,594 |
| 40,591 |
| |
Petrobras S.A. (Preference) |
| 509,136 |
| 11,867 |
| |
Tam S.A. ADR |
| (a)477,010 |
| 14,315 |
| |
Unibanco - Uniao de Bancos |
| 377,442 |
| 3,569 |
| |
Unibanco - Uniao de Bancos |
| 318,390 |
| 29,597 |
| |
|
|
|
| 278,705 |
| |
Chile (0.1%) |
|
|
|
|
| |
Enersis S.A. ADR |
| (c)172,610 |
| 2,762 |
| |
China (11.1%) |
|
|
|
|
| |
Air China Ltd., Class H |
| (c)21,710,000 |
| 11,750 |
| |
Angang New Steel Co., Ltd., Class H |
| (c)135,000 |
| 198 |
| |
China Coal Energy Co. |
| (a)6,858,000 |
| 4,452 |
| |
China Communications Construction Co., Ltd. |
| (a)9,023,000 |
| 8,921 |
| |
China Construction Bank, Class H |
| (c)(e)58,455,000 |
| 37,200 |
| |
China Life Insurance Co., Ltd. |
| (c)3,513,000 |
| 11,991 |
| |
China Mobile Hong Kong Ltd. |
| (c)3,004,000 |
| 25,953 |
| |
China Netcom Group |
| 4,647,000 |
| 12,456 |
| |
China Petroleum & Chemical Corp., |
| 19,244,000 |
| 17,813 |
| |
China Power International Holding, Ltd. |
| (c)15,979,000 |
| 8,772 |
| |
China Resources Power Holdings Co. |
| 7,747,000 |
| 11,693 |
| |
China Shipping Development Co., Ltd., |
| 8,848,000 |
| 13,537 |
| |
Global Bio-Chem Technology Group Co., Ltd. |
| (c)15,919,000 |
| 5,362 |
| |
GOME Electrical Appliances Holdings Ltd. |
| (c)12,193,000 |
| 9,562 |
| |
Huadian Power International Corp., Ltd., Class H |
| 7,982,000 |
| 3,140 |
| |
Industrial & Commercial Bank of China Ltd. |
| (a)37,323,000 |
| 23,176 |
| |
Maanshan Iron & Steel, Class H |
| (c)16,711,000 |
| 9,174 |
| |
Moulin Global Eyecare Holdings Ltd. |
| (a)(d)(l)2,150,000 |
| @— |
| |
PetroChina Co., Ltd., Class H |
| 13,696,000 |
| 19,404 |
| |
PICC Property & Casualty Co., Ltd. |
| (a)(c)21,482,000 |
| 11,020 |
| |
Ping An Insurance Group Co. of China Ltd., Class H |
| (c)2,492,000 |
| 13,792 |
| |
Shenzhen Investment Ltd. |
| 17,985,000 |
| 7,492 |
| |
TPV Technology Ltd. |
| (c)2,165,000 |
| 1,369 |
| |
|
|
|
| 268,227 |
| |
Colombia (0.5%) |
|
|
|
|
| |
BanColombia S.A. ADR |
| 380,430 |
| 11,850 |
| |
Czech Republic (2.3%) |
|
|
|
|
| |
Central European Media Enterprises Ltd. |
| (a)(c)311,600 |
| 21,812 |
| |
CEZ 2 |
| 609,600 |
| 28,107 |
| |
Komercni Banka A.S. |
| 42,300 |
| 6,296 |
| |
|
|
|
| 56,215 |
| |
Hungary (0.4%) |
|
|
|
|
| |
OTP Bank Nyrt |
| 230,991 |
| 10,613 |
| |
India (7.2%) |
|
|
|
|
| |
ABB Ltd. India |
| 140,582 |
| 11,818 |
| |
Bharat Heavy Electricals Corp. |
| 448,895 |
| 23,321 |
| |
Bharti Airtel Ltd. |
| (a)1,093,273 |
| 16,022 |
| |
Cipla Ltd. |
| 1,144,912 |
| 6,502 |
| |
Container Corp. of India Ltd. |
| 125,919 |
| 6,047 |
| |
Glenmark Pharmaceuticals Ltd. |
| 538,500 |
| 7,333 |
| |
Gujarat Ambuja Cements Ltd. |
| 3,775,000 |
| 12,030 |
| |
HCL Technologies Ltd. |
| 485,700 |
| 7,040 |
| |
HDFC Bank Ltd. |
| 335,900 |
| 8,105 |
| |
Hindustan Lever Ltd. |
| 1,123,260 |
| 5,492 |
| |
ICICI Bank, Ltd. |
| 116,000 |
| 2,336 |
| |
ICICI Bank, Ltd. ADR |
| (c)134,000 |
| 5,593 |
| |
Infosys Technologies Ltd. |
| 421,872 |
| 21,368 |
| |
Infosys Technologies Ltd. ADR |
| 122,000 |
| 6,656 |
| |
ITC Ltd. |
| (c)812,000 |
| 3,231 |
| |
ITC Ltd. GDR |
| 551,000 |
| 2,176 |
| |
Mahindra & Mahindra Ltd. |
| 503,600 |
| 10,337 |
| |
Punjab National Bank |
| (d)505,735 |
| 6,363 |
| |
Siemens India Ltd. |
| 132,000 |
| 3,389 |
| |
UTI Bank Ltd. |
| 738,000 |
| 7,830 |
| |
|
|
|
| 172,989 |
| |
Indonesia (3.4%) |
|
|
|
|
| |
Astra International Tbk PT |
| 7,670,000 |
| 13,390 |
| |
Bank CentralAsia Tbk PT |
| 16,260,000 |
| 9,401 |
| |
Bank MandiriPersero Tbk PT |
| 25,483,500 |
| 8,217 |
| |
Bank Rakyat Indonesia Tbk PT |
| 14,372,500 |
| 8,230 |
| |
Perusahaan Gas Negara PT |
| 3,413,500 |
| 4,403 |
| |
The accompanying notes are an integral partof the financial statements.
24
| 2006 Annual Report |
|
|
| December 31, 2006 |
Portfolio of Investments (cont’d)
Emerging Markets Portfolio
|
|
|
| Value |
| |
|
| Shares |
| (000) |
| |
Indonesia (cont’d) |
|
|
|
|
| |
Telekomunikasi Indonesia Tbk PT |
| 28,846,500 |
| $ | 32,396 |
|
United Tractors Tbk PT |
| 8,451,500 |
| 6,155 |
| |
|
|
|
| 82,192 |
| |
Malaysia (0.2%) |
|
|
|
|
| |
Kuala Lumpur Kepong Bhd |
| 1,124,000 |
| 4,301 |
| |
Mexico (10.6%) |
|
|
|
|
| |
America Movil S.A. de C.V., Class L ADR |
| 1,473,609 |
| 66,637 |
| |
Corp. GEO S.A. de C.V. |
| (a)3,254,100 |
| 16,296 |
| |
Fomento Economico Mexicano S.A. de |
| 171,200 |
| 19,818 |
| |
Grupo Financiero Banorte S.A. de |
| 4,378,100 |
| 17,118 |
| |
Grupo Televisa S.A. ADR |
| (c)2,462,260 |
| 66,506 |
| |
Wal-Martde Mexico S.A. de C.V. ADR |
| 327,283 |
| 14,368 |
| |
Wal-Martde Mexico S.A. de C.V., |
| 12,615,809 |
| 55,506 |
| |
|
|
|
| 256,249 |
| |
Morocco (0.8%) |
|
|
|
|
| |
Banque Marocaine du Commerce |
|
|
|
|
| |
Exterieur |
| 75,210 |
| 11,134 |
| |
ONA S.A. |
| 51,400 |
| 9,375 |
| |
|
|
|
| 20,509 |
| |
Pakistan (0.3%) |
|
|
|
|
| |
Fauji Fertilizer Co., Ltd. |
| 825,800 |
| 1,432 |
| |
HUB Power Company |
| 2,619,500 |
| 1,162 |
| |
Oil & Gas Development Co., Ltd. |
| 2,567,920 |
| 4,838 |
| |
|
|
|
| 7,432 |
| |
Peru (0.4%) |
|
|
|
|
| |
Credicorp Ltd. |
| 240,810 |
| 9,859 |
| |
Philippines (0.5%) |
|
|
|
|
| |
Ayala Corp. |
| 476,450 |
| 5,731 |
| |
Philippines Long Distance Telephone Co. |
| 104,030 |
| 5,408 |
| |
|
|
|
| 11,139 |
| |
Poland (4.5%) |
|
|
|
|
| |
Bank Handlowy W Warszawie S.A. |
| 145,656 |
| 4,355 |
| |
Bank Millennium S.A. |
| 5,233,185 |
| 14,330 |
| |
Bank Pekao S.A. |
| 331,939 |
| 25,942 |
| |
Bank Zachodni WBK S.A. |
| 96,561 |
| 7,483 |
| |
Multimedia Polska S.A. |
| (a)1,675,946 |
| 7,085 |
| |
Powszechna Kasa Oszczednosci |
| 1,398,592 |
| 22,641 |
| |
TVN S.A. |
| (a)2,994,770 |
| 25,684 |
| |
|
|
|
| 107,520 |
| |
Russia (13.5%) |
|
|
|
|
| |
Alliance Cellulose Ltd. |
| (d)(l)592,359 |
| @— |
| |
CTC Media Inc. |
| (a)669,700 |
| 16,079 |
| |
Efes Breweries International N.V. GDR |
| (a)294,457 |
| 9,894 |
| |
LUKOIL ADR |
| (c)309,156 |
| 27,020 |
| |
Nova Tek OAO GDR |
| (c)597,084 |
| 37,915 |
| |
OAO Gazprom ADR (Registered) |
| (c)1,179,600 |
| 54,341 |
| |
Sberbank RF |
| 3,600 |
| 12,357 |
| |
Sberbank RF GDR |
| (a)(c)167,500 |
| 60,886 |
| |
Surgutneftegaz ADR |
| (c)119,578 |
| 9,208 |
| |
TMK OAO GDR |
| (a)(c)704,640 |
| 24,662 |
| |
Unified Energy System GDR |
| 410,711 |
| 45,014 |
| |
Wimm-Bill-DannFoods OJSC ADR |
| (c)417,400 |
| 27,778 |
| |
|
|
|
| 325,154 |
| |
South Africa(7.5%) |
|
|
|
|
| |
African Oxygen Ltd. |
| 1,662,400 |
| 7,158 |
| |
Aspen PharmacareHoldings Ltd. |
| (a)1,607,810 |
| 7,439 |
| |
Aveng Ltd. |
| (c)1,771,170 |
| 8,486 |
| |
Gold Fields Ltd. |
| 599,800 |
| 11,353 |
| |
Group Five Ltd/South Africa |
| 1,438,200 |
| 9,331 |
| |
Harmony Gold Mining Co.,Ltd. |
| (a)(c)345,502 |
| 5,478 |
| |
Harmony Gold Mining Co., Ltd. ADR |
| (a)64,673 |
| 1,019 |
| |
Massmart Holdings Ltd. |
| 1,278,800 |
| 12,800 |
| |
Mittal Steel South Africa Ltd. |
| 200 |
| 3 |
| |
MTN Group Ltd. |
| 2,875,100 |
| 34,969 |
| |
Murray & Roberts Holdings Ltd. |
| 1,897,100 |
| 10,847 |
| |
Naspers Ltd., Class N |
| 999,160 |
| 23,650 |
| |
Reunert Ltd. |
| 1,086,110 |
| 12,660 |
| |
Sappi Ltd. |
| 922,400 |
| 15,454 |
| |
Sasol Ltd. |
| 226,250 |
| 8,349 |
| |
Tiger Brands Ltd. |
| 529,420 |
| 12,908 |
| |
|
|
|
| 181,904 |
| |
South Korea (9.4%) |
|
|
|
|
| |
Amorepacific Corp. |
| (a)13,533 |
| 8,440 |
| |
CDNetworks Co., Ltd. |
| (a)65,750 |
| 2,404 |
| |
Cheil Communications, Inc. |
| (a)24,055 |
| 5,975 |
| |
Cheil Industries, Inc. |
| (a)169,500 |
| 7,154 |
| |
Doosan Infracore Co., Ltd. |
| (a)275,500 |
| 6,236 |
| |
GS Engineering & Construction Corp. |
| (a)157,370 |
| 14,062 |
| |
Hana Tour Service, Inc. |
| 23,351 |
| 1,780 |
| |
Hana Tour Service, Inc. GDR |
| (a)(d)4 |
| @— |
| |
Hite Brewery Co., Ltd |
| (a)55,541 |
| 7,137 |
| |
Hynix Semiconductor, Inc. |
| (a)136,730 |
| 5,359 |
| |
Hyundai Engineering & Construction Co. |
| (a)128,070 |
| 7,849 |
| |
Hyundai Heavy Industries Co., Ltd. |
| (a)13,547 |
| 1,835 |
| |
Hyundai Mipo Dockyard |
| (a)53,135 |
| 6,799 |
| |
Hyundai Motor Co. (Preference) |
| (a)67,360 |
| 2,745 |
| |
Kookmin Bank |
| (a)181,480 |
| 14,616 |
| |
Korea Zinc Co., Ltd. |
| 57,090 |
| 6,059 |
| |
LG Corp. |
| (a)92,510 |
| 2,969 |
| |
LG Telecom Ltd. |
| (a)200,299 |
| 2,072 |
| |
NHN Corp. |
| (a)78,420 |
| 9,621 |
| |
Orion Corp. |
| (a)31,393 |
| 9,198 |
| |
Samsung Electronics Co., Ltd. |
| 61,051 |
| 40,241 |
| |
Samsung Electronics Co., Ltd. |
| 22,226 |
| 11,472 |
| |
Samsung Fire & Marine Insurance Co., Ltd. |
| 73,690 |
| 12,797 |
| |
Shinhan Financial Group Co., Ltd. |
| (a)360,260 |
| 18,400 |
| |
Shinsegae Co., Ltd. |
| (a)16,726 |
| 10,431 |
| |
SSCP Co., Ltd. |
| (a)92,550 |
| 2,518 |
| |
The accompanying notes are an integral partof the financial statements.
25
2006 Annual Report |
|
|
|
December 31, 2006 |
|
Portfolio of Investments (cont’d)
Emerging Markets Portfolio
|
|
|
| Value |
| |
|
| Shares |
| (000) |
| |
South Korea (cont’d) |
|
|
|
|
| |
Woongjin Coway Co., Ltd. |
| (a)314,710 |
| $ | 8,731 |
|
|
|
|
| 226,900 |
| |
Taiwan (7.2%) |
|
|
|
|
| |
Acer, Inc. |
| 3,775,000 |
| 7,878 |
| |
Catcher Technology Co., Ltd. |
| 1,018,968 |
| 9,960 |
| |
Cathay Financial Holding Co., Ltd. |
| 1,931,903 |
| 4,387 |
| |
Chang Hwa Commercial Bank |
| (a)12,611,000 |
| 8,805 |
| |
Delta Electronics, Inc. |
| 7,786,192 |
| 25,090 |
| |
Everlight Electronics Co., Ltd. |
| 2,852,400 |
| 8,115 |
| |
Far Eastern Textilie, Ltd. |
| 7,125,500 |
| 6,232 |
| |
High Tech Computer Corp. |
| 532,000 |
| 10,531 |
| |
HON HAI Precision Industry Co., Ltd. |
| 3,697,457 |
| 26,382 |
| |
King Slide Works Co., Ltd. |
| 171,400 |
| 873 |
| |
Largan Precision Co., Ltd. |
| 356,797 |
| 6,898 |
| |
MediaTek, Inc. |
| 1,704,100 |
| 17,624 |
| |
Powerchip Semiconductor Corp. |
| 9,589,408 |
| 6,474 |
| |
Realtek Semiconductor Corp. |
| 2,075,000 |
| 3,572 |
| |
Shin Kong Financial Holding Co., Ltd. |
| 6,619,687 |
| 7,131 |
| |
Transced Information, Inc. |
| 2,497,576 |
| 6,592 |
| |
Tripod Technology Corp. |
| 1,761,680 |
| 6,325 |
| |
TXC Corp. |
| 1,873,000 |
| 2,995 |
| |
Wistron Corp. |
| 4,497,148 |
| 6,680 |
| |
|
|
|
| 172,544 |
| |
Thailand (0.7%) |
|
|
|
|
| |
Bangkok Bank PCL (Foreign) |
| 1,350,000 |
| 4,380 |
| |
CP Seven Eleven PCL (Foreign) |
| (c)10,981,600 |
| 1,936 |
| |
Kasikornbank PCL (Foreign) |
| 1,841,700 |
| 3,247 |
| |
PTT PCL (Foreign) |
| 742,300 |
| 4,397 |
| |
Siam Commercial BankPCL |
| 2,060,300 |
| 3,371 |
| |
|
|
|
| 17,331 |
| |
Turkey (2.9%) |
|
|
|
|
| |
BIM Birlesik Magazalar A.S. |
| 231,007 |
| 12,240 |
| |
Coca-Cola Icecek Uretim A.S. |
| (a)1,123,700 |
| 8,494 |
| |
Dogan Yayin Holding A.S. |
| (a)3,033,347 |
| 10,672 |
| |
Turkiye Garanti Bankasi A.S., Class C |
| 4,760,585 |
| 15,740 |
| |
Turkiye Is Bankasi |
| 3,263,989 |
| 14,988 |
| |
Yapi ve Kredi Bankasi A.S. |
| (a)4,586,182 |
| 7,970 |
| |
|
|
|
| 70,104 |
| |
United Kingdom (0.0%) |
|
|
|
|
| |
Anglo American plc |
| 1 |
| @— |
| |
Total Common Stocks (Cost $1,615,135) |
|
|
| 2,353,413 |
| |
Investment Companies (0.7%) |
|
|
|
|
| |
India (0.7%) |
|
|
|
|
| |
Morgan Stanley Growth Fund |
| (k)17,282,900 |
| 16,810 |
| |
|
| Face |
|
|
|
|
| Amount |
| Value |
|
|
| (000) |
| (000) |
|
Short-Term Investments (9.3%) |
|
|
|
|
|
Short-Term Debt Securities held as Collateral on Loaned Securities (6.7%) |
|
|
|
|
|
Alliance & Leicester plc, |
|
|
|
|
|
5.36%, 1/8/07 |
| (h)5,227 |
| 5,227 |
|
Bancaja, 5.37%, 1/19/07 |
| (h)2,614 |
| 2,614 |
|
Bank of America Corp., 5.32%, 1/2/07 |
| (h)8,364 |
| 8,364 |
|
Bank of New York Co., Inc., |
|
|
|
|
|
5.34%, 1/10/07 |
| (h)2,614 |
| 2,614 |
|
Bear Stearns & Co., Inc., |
|
|
|
|
|
5.37%, 1/2/07 |
| (h)3,137 |
| 3,137 |
|
5.38%, 1/2/07 |
| (h)2,092 |
| 2,092 |
|
5.39%, 1/16/07 |
| (h)5,227 |
| 5,227 |
|
BNP Paribas plc, |
|
|
|
|
|
5.35%, 2/20/07 |
| (h)5,227 |
| 5,227 |
|
CIC, New York, |
|
|
|
|
|
5.33%, 1/3/07 |
| (h)3,659 |
| 3,659 |
|
5.34%, 1/2/07 |
| (h)5,227 |
| 5,227 |
|
Dekabank Deutsche Girozentrale, |
|
|
|
|
|
5.39%, 1/19/07 |
| (h)5,332 |
| 5,332 |
|
Deutsche Bank Securities, Inc., |
|
|
|
|
|
5.33%, 1/2/07 |
| 16,774 |
| 16,774 |
|
Dexia Bank, New York, |
|
|
|
|
|
5.33%, 1/2/07 |
| (h)5,227 |
| 5,227 |
|
Gemini Securitization Corp., |
|
|
|
|
|
5.34%, 1/2/07 |
| 2,612 |
| 2,612 |
|
Goldman Sachs Group, Inc., |
|
|
|
|
|
5.40%, 1/16/07 |
| (h)2,614 |
| 2,614 |
|
5.42%, 1/2/07 |
| (h)4,914 |
| 4,914 |
|
HSBC Finance Corp., |
|
|
|
|
|
5.34%, 1/8/07 |
| (h)2,614 |
| 2,614 |
|
Liberty Lighthouse U.S. Capital, |
|
|
|
|
|
5.33%, 1/2/07 |
| (h)2,614 |
| 2,614 |
|
Manufacturers & Traders, |
|
|
|
|
|
5.33%, 1/16/07 |
| (h)3,136 |
| 3,136 |
|
Merrill Lynch & Co., |
|
|
|
|
|
5.35%, 1/26/07 |
| (h)2,748 |
| 2,748 |
|
Mitsubishi UFJ FinancialGroup, |
|
|
|
|
|
5.33%, 1/2/07 |
| (h)2,614 |
| 2,614 |
|
Natexis Banques Populaire, NewYork, |
|
|
|
|
|
5.34%, 1/2/07 |
| (h)5,227 |
| 5,227 |
|
5.35%, 1/2/07 |
| (h)2,614 |
| 2,614 |
|
National City Bank Cleveland, |
|
|
|
|
|
5.32%, 1/2/07 |
| (h)7,579 |
| 7,579 |
|
National Rural Utilities Cooperative Finance Corp., |
|
|
|
|
|
5.34%, 1/2/07 |
| (h)10,455 |
| 10,455 |
|
Nationwide Building Society, |
|
|
|
|
|
5.44%, 3/28/07 |
| (h)6,064 |
| 6,064 |
|
Nordea Bank, New York, |
|
|
|
|
|
5.31%, 1/2/07 |
| (h)7,841 |
| 7,841 |
|
Rhein-Main Securitisation Ltd., |
|
|
|
|
|
5.33%, 1/18/07 |
| 2,468 |
| 2,468 |
|
Skandi, NewYork, |
|
|
|
|
|
5.34%, 1/9/07 |
| (h)5,227 |
| 5,227 |
|
The accompanying notes are an integral part of the financial statements.
26
| 2006 Annual Report |
|
|
| December 31, 2006 |
Portfolio of Investments (cont’d)
Emerging Markets Portfolio
|
| Face |
|
|
| ||
|
| Amount |
| Value |
| ||
|
| (000) |
| (000) |
| ||
Short-Term Debt Securities held as Collateral on Loaned Securities (cont’d) |
|
|
|
|
| ||
SLM Corp., 5.36%, 1/22/07 |
| $ | (h)5,227 |
| $ | 5,227 |
|
Toronto Dominion, New York, |
|
|
|
|
| ||
5.32%, 5/29/07 |
| (h)5,227 |
| 5,227 |
| ||
Tulip Funding, 5.36%, 1/16/07 |
| 2,872 |
| 2,872 |
| ||
Unicredito Italiano Bank (Ireland) plc, |
|
|
|
|
| ||
5.36%, 1/9/07 |
| (h)3,659 |
| 3,659 |
| ||
World Savings Bank FSB, |
|
|
|
|
| ||
5.35%, 1/19/07 |
| (h)1,777 |
| 1,777 |
| ||
|
|
|
| 160,824 |
| ||
Repurchase Agreement (2.6%) |
|
|
|
|
| ||
J.P. Morgan Securities, Inc.,5.20%, |
| (f)62,734 |
| 62,734 |
| ||
Total Short-Term Investments (Cost $223,558) |
|
|
| 223,558 |
| ||
Total Investments (107.6%) (Cost $1,842,108) |
|
|
| 2,593,781 |
| ||
Liabilities in Excess of Other Assets (-7.6%) |
|
|
| (183,796 | ) | ||
Net Assets(100%) |
|
|
| $ | 2,409,985 |
| |
(a) Non-income producing security.
(c) All or portion of security on loan at December 31, 2006.
(d) Securities were valued at fair value — At December 31, 2006, the Portfolio held $6,363,000 of fair valued securities, representing 0.26% of net assets.
(e) 144A security — certain conditions for public sale may exist. Unless otherwise noted, these securities are deemed to be liquid.
(f) Represents the Portfolio’s undivided interest in a joint repurchase agreement which has a total value of $1,856,998,000. The repurchase agreement was fully collateralized by U.S. government agency securities at the date of this Portfolio of Investments as follows: Federal Farm Credit Bank, 0.00% to 7.43%, due 1/16/07 to 10/23/35; Federal Home Loan Bank, 0.00% to 7.38%, due 1/3/07 to 6/5/28; Federal Home Loan Mortgage Corp., 0.00% to 6.75%, due 1/2/07 to 7/15/32; Federal National Mortgage Association, 0.00% to 8.20%, due 1/12/07 to 11/15/30; Tennessee Valley Authority, 5.38% to 6.75%, due 11/13/08 to 4/1/36, which had a total value of $1,894,142,869. The investment in the repurchase agreement is through participation in a joint account with affiliated parties pursuant to exemptive relief received by the Portfolio from the SEC.
(h) Variable/Floating Rate Security — interest rate changes on these instruments are based on changes in a designated base rate. The rates shown are those in effect on December 31, 2006.
(k) Investments of Securities of Affiliated issuer — The Morgan Stanley Growth Fund, acquired at a cost of $3,415,000, is advised by an affiliate of the Adviser. During the year ended December 31, 2006, the Portfolio had no purchases or sales of this security. The Portfolio derived no income from this security during the year ended December 31, 2006.
(l) Security has been deemed illiquid at December 31, 2006.
@ Face Amount/Value is less than $500.
ADR American Depositary Receipts
GDR Global Depositary Receipts
Foreign Currency Exchange Contract Information:
The Portfolio had the following foreign currency exchange contract(s) open at period end:
|
|
|
|
|
|
|
|
|
|
|
| Net |
| |||||||
Currency |
|
|
|
|
|
|
| In |
|
|
| Unrealized |
| |||||||
to |
|
|
|
|
|
|
| Exchange |
|
|
| Appreciation |
| |||||||
Deliver |
| Value |
| Settlement |
| For |
| Value |
| (Depreciation) |
| |||||||||
(000) |
| (000) |
| Date |
| (000) |
| (000) |
| (000) |
| |||||||||
BRL |
| 128,685 |
| $ | 59,635 |
| 3/9/07 |
| USD |
| 59,241 |
| $ | 59,241 |
| $ | (394 | ) | ||
CZK |
| 12,659 |
| 608 |
| 1/2/07 |
| USD |
| 601 |
| 601 |
| (7 | ) | |||||
CZK |
| 41,147 |
| 1,976 |
| 1/3/07 |
| USD |
| 1,965 |
| 1,965 |
| (11 | ) | |||||
CZK |
| 3,088 |
| 149 |
| 1/4/07 |
| USD |
| 148 |
| 148 |
| (1 | ) | |||||
PLN |
| 1,525 |
| 525 |
| 1/2/07 |
| USD |
| 521 |
| 521 |
| (4 | ) | |||||
PLN |
| 5,210 |
| 1,794 |
| 1/4/07 |
| USD |
| 1,792 |
| 1,792 |
| (2 | ) | |||||
THB |
| 3,090 |
| 87 |
| 1/3/07 |
| USD |
| 86 |
| 86 |
| (1 | ) | |||||
THB |
| 423 |
| 13 |
| 1/4/07 |
| USD |
| 12 |
| 12 |
| (1 | ) | |||||
USD |
| 881 |
| 881 |
| 1/2/07 |
| HKD |
| 6,846 |
| 881 |
| @— |
| |||||
USD |
| 3,486 |
| 3,486 |
| 1/3/07 |
| HUF |
| 665,206 |
| 3,493 |
| 7 |
| |||||
USD |
| 1,639 |
| 1,639 |
| 1/4/07 |
| HUF |
| 312,363 |
| 1,640 |
| 1 |
| |||||
USD |
| 1,294 |
| 1,294 |
| 1/3/07 |
| PLN |
| 3,759 |
| 1,295 |
| 1 |
| |||||
USD |
| 777 |
| 777 |
| 1/4/07 |
| TRY |
| 1,100 |
| 777 |
| @— |
| |||||
USD |
| 5 |
| 5 |
| 1/5/07 |
| TRY |
| 7 |
| 5 |
| @— |
| |||||
USD |
| 11,761 |
| 11,761 |
| 2/14/07 |
| ZAR |
| 82,733 |
| 11,743 |
| (18 | ) | |||||
ZAR |
| 1,993 |
| 284 |
| 1/2/07 |
| USD |
| 284 |
| 284 |
| @— |
| |||||
ZAR |
| 769 |
| 110 |
| 1/3/07 |
| USD |
| 110 |
| 110 |
| @— |
| |||||
ZAR |
| 520 |
| 74 |
| 1/5/07 |
| USD |
| 74 |
| 74 |
| @— |
| |||||
ZAR |
| 658 |
| 94 |
| 1/8/07 |
| USD |
| 93 |
| 93 |
| (1 | ) | |||||
ZAR |
| 449,844 |
| 63,844 |
| 2/14/07 |
| USD |
| 61,930 |
| 61,930 |
| (1,914 | ) | |||||
|
|
|
|
| $ | 149,036 |
|
|
|
|
|
|
|
| $ | 146,691 |
| $ | (2,345 | ) |
BRL | — Brazilian Real |
CZK | — Czech Krona |
HKD | — Hong KongDollar |
HUF | — Hungarian Forint |
PLN | — Polish New Zloty |
THB | — Thailand Baht |
TRY | — New Turkish Lira |
USD | — United States Dollar |
ZAR | — South African Rand |
The accompanying notes are an integral part of the financial statements.
27
2006 Annual Report |
|
|
|
December 31, 2006 |
|
Investment Overview (unaudited)
Global Franchise Portfolio
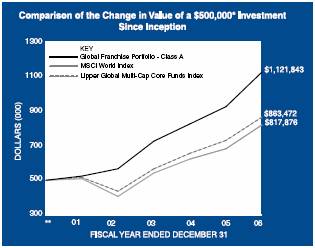
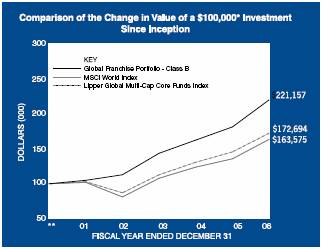
* Minimum Investment
** Commenced operations on November 28,2001
In accordance with SEC regulations, Portfolio performance shown assumes that all recurring fees (including management fees) were deducted and all dividends and distributions were reinvested.
Performance Compared to the Morgan Stanley Capital International (MSCI) World Index(1) and the Lipper GlobalMulti-Cap Core Funds Index(2)
|
| Total Returns(3) |
| |||||
|
|
|
| Average Annual |
| |||
|
| One |
|
|
| Since |
| |
|
| Year |
| Five |
| Years Inception(5) |
| |
Portfolio – Class A (4) |
| 21.60 | % | 16.44 | % | 17.20 | % | |
MSCI World Index |
| 20.07 |
| 9.97 |
| 10.15 |
| |
Lipper Global Multi-Cap Core Funds Index |
| 18.46 |
| 10.84 |
| 11.34 |
| |
|
|
|
|
|
|
|
| |
Portfolio – Class B (4) |
| 21.31 |
| 16.15 |
| 16.87 |
| |
MSCI World Index |
| 20.07 |
| 9.97 |
| 10.15 |
| |
Lipper Global Multi-Cap Core Funds Index |
| 18.46 |
| 10.84 |
| 11.34 |
| |
Performance data quoted represents past performance, which is no guarantee of future results, and current performance may be lower or higher than the figures shown. Performance assumes that all dividends and distributions, if any, were reinvested. For the most recent month-end performance figures, please visit www.morganstanley.com/im. Investment return and principal value will fluctuate so that Portfolio shares, when redeemed, may be worth moreor less than their original cost. Total returns do not reflect the deduction of taxes that a shareholder would pay on Portfolio distributions or the redemption of Portfolio shares.
(1) The Morgan Stanley Capital International (MSCI) World Index is a free float-adjusted market capitalization index that is designed to measure global developed market equity performance. The MSCI World Index consists of the following 23 developed market country indices: Australia, Austria, Belgium, Canada, Denmark, Finland, France, Germany, Greece, Hong Kong, Ireland, Italy, Japan, Netherlands, New Zealand, Norway, Portugal, Singapore, Spain, Sweden, Switzerland, the United Kingdom and the United States. The Index is unmanaged and its returns do not include any sales charges or fees. Such costs would lower performance. It is not possible to invest directly in an index.
(2) The Lipper Global Multi-Cap Core Funds Index is an equally weighted performance index of the largest qualifying funds (based on net assets) in the Lipper Global Multi-Cap Core Funds classification. The Index, which is adjusted for capital gains distributions and income dividends, is unmanaged and should not be considered an investment. There are currently 10 funds represented in this Index. As of the date of this report, the Portfolio is in the Lipper Global Multi-Cap Core Funds classification.
(3) Total returns for the Portfolio reflect fees waived and expenses reimbursed, if applicable, by the Adviser. Without such waivers and/or reimbursements, total returns would have been lower. Fee waivers and/or expense reimbursements are voluntary and the Adviser reserves the right to commence or terminate any waiver and/or reimbursement at any time.
(4) Commenced operations on November 28, 2001
(5) For comparative purposes, average annual since inception returns listed for the Indexes refer to the inception date or initial offering of the respective share class of the Portfolio, not the inception of the Index.
The Global Franchise Portfolio seeks long-term capital appreciation by investing primarily in equity securities of issuers located throughout the world, that it believes have, among other things, resilient business franchises and growth potential. This Portfolio’s concentration of its assets in a smaller number of companies may subject it to greater investment risk than a portfolio with a larger number of companies. Foreign investing involves certain risks, including currency fluctuations and controls, restrictions on foreign investments, less
28
| 2006 Annual Report |
|
|
| December 31, 2006 |
Investment Overview (cont’d)
Global Franchise Portfolio
governmental supervision and regulation, less liquidity and the potential for market volatility and political instability.
Performance
For the year ended December 31, 2006, the Portfolio had a total return based on net asset value per share of 21.60%, net of fees, for the Class A shares and 21.31%, net of fees, for the Class B shares, compared to 20.07% for the Morgan Stanley Capital International (MSCI) World Index (the “Index”).
Factors Affecting Performance
• We continue to pursue a strategy that is driven by finding companies of exceptional quality at compelling value. We manage a concentrated portfolio as only a relatively small number of companies meet our stringent quality and valuation criteria. Because of this concentration, and the fact that we do not use benchmarks as a portfolio construction tool, our strategy has a low correlation to the Index. As a result, the Portfolio’s short-term performance does not follow that of the markets.
• During the year, the Index’s top performing sectors were utilities, telecommunication services and materials. While no sector in the Index had a negative return for the year overall, the information technology, health care and energy sectors had the smallest gains. Notably, other than a small position in a materials company, the Portfolio had no exposure to the other five top and bottom performing Index sectors.
• On an absolute basis, the Portfolio achieved its largest gains in the industrials, consumer staples and consumer discretionary sectors. The top contributing holdings were British American Tobacco, Reckitt Benckiser, Swedish Match, Kone and Wolters Kluwer.
• However, negative returns primarily in the Portfolio’s media holdings, including GCap Media, New York Times, Torstar and SMG, detracted from overall performance.
• While we do not find the Index a particularly useful tool in the management of the Portfolio or stock selection process, we do include a relative performance comparison in this annual review. Relative to the Index, the Portfolio’s consumer staples and industrials sectors generated outperformance.
• The Portfolio’s zero weight in information technology also added to relative performance. Historically, very few companies in the information technology space have met our criteria for investment.
• Similarly, the Portfolio did not hold any utilities or telecommunication services stocks as our strategy prevents the Portfolio from investing in sectors that have high capital intensity and lack dominant intangible assets. During this period, however, the lack of exposure proved disadvantageous, as these sectors performed well in the broad market.
• Another source of relative under performance was in the materials sector. The Portfolio’s sole holding in the sector, Scotts Miracle-Gro, performed well on an absolute basis, but its gain lagged the more robust gains of the Index’s materials stocks.
Management Strategies
• We continue to seek investment opportunities in companies with strong business franchises protected by a dominant intangible asset. Additionally, we demand sound management, substantial free cash flow and growth potential. We invest in these high quality companies only when we can identify compelling value as measured by a current free cash flow yield in excess of the risk-free bond yield. We seek to deliver attractive returns while minimizing business and valuation risk. Our goal is for the Portfolio to outperform broadly-based benchmarks over the long-term with less than average volatility.
The information contained in this overview regarding specific securities is for informational purposes only and should not be construed as a recommendation to purchase or sell the securities mentioned.
Expense Examples
As a shareholder of the Portfolio, you may incur two types of costs: (1) transactional costs, including redemption fees; (2) ongoing costs, including management fees, distribution (12b-1) fees (in the case of Class B); and other Portfolio expenses. These examples are intended to help you understand your ongoing costs (in dollars) of investing in the Portfolio and to compare these costs with the ongoing costs of investing in other mutual funds.
The examples are based on an investment of $1,000 invested at the beginning of the six-month period ended December 31, 2006 and held for the entire six-month period.
Actual Expenses
The first line of the tables below provides information about actual account values and actual expenses. You may use the information in this line, together with the amount you invested, to estimate the expenses that you paid over the period. Simply divide your account value by $1,000 (for example, an $8,600 account value divided by $1,000 = 8.6), then multiply the result by the number in the first line under the heading entitled “Expenses Paid During Period” to estimate the expenses you paid on your account during this period.
29
2006 Annual Report |
|
|
|
December 31, 2006 |
|
Investment Overview (cont’d)
Global Franchise Portfolio
Please note that “Expenses Paid During Period” are grossed up to reflect Portfolio expenses prior to the effect of Expense Offset (See Note E in the Notes to Financial Statements). Therefore, the annualized net expense ratios may differ from the ratio of the expenses to average net assets shown in the Financial Highlights.
Hypothetical Example for Comparison Purposes
The second line of the tables below provides information about hypothetical account values and hypothetical expenses based on the Portfolio’s actual expense ratio and an assumed rate of return of 5% per year before expenses, which is not the Portfolio’s actual return. The hypothetical account values and expenses may not be used to estimate the actual ending account balance or expenses you paid for the period. You may use this information to compare the ongoing costs of investing in the Portfolio and other funds. To do so, compare this 5% hypothetical example with the 5% hypothetical examples that appear in the shareholder reports of the other funds.
Please note that the expenses shown in the table are meant to highlight your ongoing costs only and do not reflect any transactional costs, such as redemption fees. Therefore, the second line of the table is useful in comparing ongoing costs only, and will not help you determine the relative total costs of owning different funds. In addition, if these transactional costs were included, your costs would have been higher.
|
|
|
|
|
| Expenses Paid |
| |||
|
|
|
| Ending Account |
| During Period* |
| |||
|
| Beginning |
| Value |
| July 1, 2006 — |
| |||
|
| Account Value |
| December 31, |
| December 31, |
| |||
|
| July 1, 2006 |
| 2006 |
| 2006 |
| |||
Class A |
|
|
|
|
|
|
| |||
Actual |
| $ | 1,000.00 |
| $ | 1,126.90 |
| $ | 5.41 |
|
Hypothetical (5% average annual return before expenses) |
| 1,000.00 |
| 1,020.11 |
| 5.14 |
| |||
|
|
|
|
|
|
|
| |||
Class B |
|
|
|
|
|
|
| |||
Actual |
| 1,000.00 |
| 1,124.90 |
| 6.75 |
| |||
Hypothetical (5% average annual return before expenses) |
| 1,000.00 |
| 1,018.85 |
| 6.41 |
| |||
* Expenses are equal to Class A and Class B annualized net expense ratios of 1.01% and 1.26%, respectively, multiplied by the average account value over the period, multiplied by 184/365 (to reflect the one-half year period).
Graphic Presentation of Portfolio Holdings
The following graph depicts the Portfolio’s holdings by industry and/or security type, as a percentage of total investments.
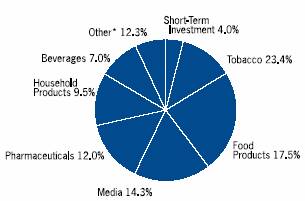
* Industries which do not appear in the above graph, as well as those which represent less than 5% of total investments, if applicable, are included in the category labeled “Other”.
January 2007
30
| 2006 Annual Report |
|
|
| December 31, 2006 |
Portfolio of Investments
Global Franchise Portfolio
|
|
|
| Value |
| |
|
| Shares |
| (000) |
| |
Common Stocks (96.5%) |
|
|
|
|
| |
Canada (1.1%) |
|
|
|
|
| |
Torstar Corp., Class B |
| 89,037 |
| $ | 1,497 |
|
Finland (4.0%) |
|
|
|
|
| |
Kone Oyj, Class B |
| 92,812 |
| 5,261 |
| |
France (8.2%) |
|
|
|
|
| |
Groupe Danone |
| 21,657 |
| 3,282 |
| |
Pernod-Ricard S.A. |
| 14,857 |
| 3,412 |
| |
Sanofi-Aventis S.A. |
| 44,516 |
| 4,111 |
| |
|
|
|
| 10,805 |
| |
Japan (2.4%) |
|
|
|
|
| |
Kao Corp. |
| 117,000 |
| 3,156 |
| |
Netherlands (6.5%) |
|
|
|
|
| |
Reed Elsevier N.V. |
| 183,670 |
| 3,132 |
| |
Wolters Kluwer N.V. CVA |
| 191,856 |
| 5,519 |
| |
|
|
|
| 8,651 |
| |
Spain (3.5%) |
|
|
|
|
| |
Altadis S.A. |
| 88,946 |
| 4,656 |
| |
Sweden (3.8%) |
|
|
|
|
| |
Swedish Match AB |
| 272,943 |
| 5,103 |
| |
Switzerland (5.8%) |
|
|
|
|
| |
Nestle S.A. (Registered) |
| 12,220 |
| 4,342 |
| |
Novartis AG (Registered) |
| 57,807 |
| 3,333 |
| |
|
|
|
| 7,675 |
| |
United Kingdom (35.1%) |
|
|
|
|
| |
British American Tobacco plc |
| 348,924 |
| 9,763 |
| |
Cadbury Schweppes plc |
| 735,800 |
| 7,874 |
| |
Diageo plc |
| 201,288 |
| 3,951 |
| |
GCAP Media plc |
| 204,590 |
| 820 |
| |
GlaxoSmithKline plc |
| 116,562 |
| 3,067 |
| |
Imperial Tobacco Group plc |
| 140,156 |
| 5,516 |
| |
Reckitt Benckiser plc |
| 130,741 |
| 5,975 |
| |
SMG plc |
| 673,377 |
| 870 |
| |
Unilever plc |
| 146,675 |
| 4,101 |
| |
WPP Group plc |
| 335,295 |
| 4,533 |
| |
|
|
|
| 46,470 |
| |
United States (26.1%) |
|
|
|
|
| |
Altria Group, Inc. |
| 71,657 |
| 6,150 |
| |
Brown-Forman Corp., Class B |
| 31,008 |
| 2,054 |
| |
Fortune Brands, Inc. |
| 41,180 |
| 3,516 |
| |
Harley-Davidson, Inc. |
| 52,059 |
| 3,668 |
| |
Kellogg Co. |
| 72,886 |
| 3,649 |
| |
Kimberly-Clark Corp. |
| 51,611 |
| 3,507 |
| |
New York Times Co. (The), Class A |
| 109,614 |
| 2,670 |
| |
Pfizer, Inc. |
| 211,198 |
| 5,470 |
| |
Scotts Miracle-Gro Co. (The), Class A |
| 76,806 |
| 3,967 |
| |
|
|
|
| 34,651 |
| |
Total Common Stocks (Cost $93,180) |
|
|
| 127,925 |
| |
|
| Face |
|
|
| |
|
| Amount |
| Value |
| |
|
| (000) |
| (000) |
| |
Short-Term Investment (4.0%) |
|
|
|
|
| |
Repurchase Agreement (4.0%) |
|
|
|
|
| |
J.P. Morgan Securities, Inc., 5.20%, |
| (f)5,286 |
| $ | 5,286 |
|
Total Investments (100.5%) (Cost $98,466) |
|
|
| 133,211 |
| |
Liabilities in Excess of Other Assets (-0.5%) |
|
|
| (642 | ) | |
Net Assets (100%) |
|
|
| $ | 132,569 |
|
(f) Represents the Portfolio’s undivided interest in a joint repurchase agreement which has a total value of $1,856,998,000. The repurchase agreement was fully collateralized by U.S. government agency securities at the date of this Portfolio of Investments as follows: Federal Farm Credit Bank, 0.00% to 7.43%, due 1/16/07 to 10/23/35; Federal Home Loan Bank, 0.00% to 7.38%, due 1/3/07 to 6/5/28; Federal Home Loan Mortgage Corp., 0.00% to 6.75%, due 1/2/07 to 7/15/32; Federal National Mortgage Association, 0.00% to 8.20%, due 1/12/07 to 11/15/30; Tennessee Valley Authority, 5.38% to 6.75%, due 11/13/08 to 4/1/36, which had a total value of $1,894,142,869. The investment in the repurchase agreement is through participation in a joint account with affiliated parties pursuant to exemptive relief received by the Portfolio from the SEC.
CVA Certificaten Van Aandelen
Foreign Currency Exchange Contract Information:
The Portfolio had the following foreign currency exchange contract(s) open at period end:
|
|
|
|
|
|
|
|
|
| Net |
| ||||||
Currency |
|
|
|
|
| In |
|
|
| Unrealized |
| ||||||
to |
|
|
|
|
| Exchange |
|
|
| Appreciation |
| ||||||
Deliver |
| Value |
| Settlement |
| For |
| Value |
| (Depreciation) |
| ||||||
(000) |
| (0 00) |
| Date |
| (000) |
| (000) |
| (000) |
| ||||||
GBP |
| 9,580 |
| $ | 18,760 |
| 1/24/07 |
| USD | 18,064 |
| $ | 18,064 |
| $ | (696 | ) |
GBP — British Pound
USD — United States Dollar
The accompanying notes are an integral part of the financial statements.
31
2006 Annual Report |
|
December 31, 2006 |
Investment Overview (unaudited)
Global Real Estate Portfolio
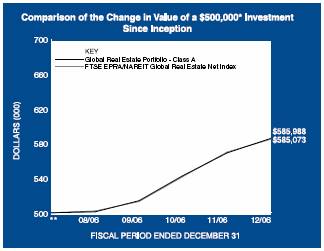
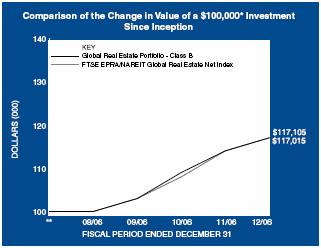
* | Minimum Investment |
** | Commenced operations on August 30, 2006 |
In accordance with SEC regulations, Portfolio performance shown assumes that all recurring fees (including management fees) were deducted and all dividends and distributions were reinvested.
Performance Compared to the FTSE EPRA/NA-REIT Global Real Estate Net Index(1)
|
| Total Returns(2) |
|
|
| Cumulative |
|
|
| Since |
|
|
| Inception(4) |
|
Portfolio – Class A (3) |
| 17.20 | % |
FTSE EPRA/NAREIT Global Real Estate Net Index |
| 17.01 |
|
|
|
|
|
Portfolio – Class B (3) |
| 17.11 |
|
FTSE EPRA/NAREIT Global Real Estate Net Index |
| 17.01 |
|
Performance data quoted represents past performance, which is no guarantee of future results, and current performance may be lower or higher than the figures shown. Performance assumes that all dividends and distributions, if any, were reinvested. For the most recent month-end performance figures, please visit www.morganstanley.com/im. Investment return and principal value will fluctuate so that Portfolio shares, when redeemed, may be worth more or less than their original cost. Total returns do not reflect the deduction of taxes that a shareholder would pay on Portfolio distributions or the redemption of Portfolio shares.
(1) The FTSE EPRA/NAREIT Global Real Estate Net Index is a market capitalization weighted index designed to reflect the stock performance of companies engaged in the North American, European and Asian real estate markets. The performance of the Index is listed in U.S. dollars and assumes reinvestment of net dividends. “Net dividends” reflects a reduction in dividends after taking into account withholding of taxes by certain foreign countries represented in the Index. The Index is unmanaged and its returns do not include any sales charges or fees. Such costs would lower performance. It is not possible to invest directly in an index.
(2) Total returns for the Portfolio reflect fees waived and expenses reimbursed, if applicable, by the Adviser. Without such waivers and/or reimbursements, total returns would have been lower. Fee waivers and/or expense reimbursements are voluntary and the Adviser reserves the right to commence or terminate any waiver and/or reimbursement at any time.
(3) Commenced operations on August 30, 2006
(4) For comparative purposes, cumulative since inception returns listed for the Index refer to the inception date or initial offering of the respective share class of the Portfolio, not the inception of the Index.
The Global Real Estate Portfolio seeks to provide current income and capital appreciation by investing primarily in equity securities of companies in the real estate industry located throughout the world, including real estate operating companies, real estate investment trusts and similar entities established outside the U.S. (foreign real estate companies). Foreign investing involves certain risks, including currency fluctuations and controls, restrictions on foreign investments, less governmental supervision and regulation, less liquidity and the potential for market volatility and political instability.
Performance
For the period from August 30, 2006 (commencement of operations) to December 31, 2006, the Portfolio had a total return based on net asset value per share of 17.20% for the Class A shares, net of fees, and 17.11% for the Class B shares, net of fees, compared to 17.01% for the FTSE EPRA/ NAREIT Global Real Estate Net Index (the “Index”).
Factors Affecting Performance
• As of December 31, 2006, the Portfolio was overweight the Asian listed property sector and underweight both the European and U.S. listed property sectors. We generated out performance in the European and U.S. portfolios, while the Asian portfolio detracted from performance.
• We believe the Asian listed property sector will continue to benefit from strong asset appreciation and
32
| 2006 Annual Report |
|
|
| December 31, 2006 |
Investment Overview (cont’d)
Global Real Estate Portfolio
improvements in private real estate valuations and underlying real estate fundamentals. The overweight to the Asian region was predominated by real estate operating companies (REOCs) in Japan and Hong Kong, which traded at discounts to net asset value (NAV), as share prices did not fully reflect the improvements in underlying real estate fundamentals and asset prices. The Portfolio benefited from stock selection and an overweight in Singapore, but this was offset by stock selection in Hong Kong.
• The Portfolio was underweight J-REITs (Japanese Real Estate Investment Trusts), as this sector traded at a substantial premium to NAV and continued to experience high levels of equity issuance from both new and existing companies.
• The Portfolio was considerably underweight Australian LPTs (Listed Property Trusts), which traded at a premium to NAV and had more limited prospects for NAV growth due to weaker cash flow growth versus other regions, as well as the challenges faced by these companies in achieving growth primarily through cross-border acquisitions with the continued compression in cap rates and rising financing costs.
• In Europe, listed property companies continued to benefit from improving underlying real estate fundamentals and asset values. Since we believed much of this favorable news had already been priced into stocks on the Continent, the Portfolio was underweight the Continental European stocks, which traded at meaningful premiums to NAV. In contrast, the Portfolio benefited from being overweight United Kingdom (U.K.) property companies which may benefit from the introduction of real estate investment trust (REIT) legislation in January 2007 and expectations for continued strength in NAV growth.
• The Portfolio was underweight the U.S., as prospects for growth in private real estate values were less attractive on a relative basis to the other regions. Nevertheless, the market continued to benefit from the significant weight of capital directed towards investment in real estate assets and improvements in underlying real estate fundamentals. The Portfolio benefited from stock selection in the U.S. hotel, mall, and office sectors, while an overweight to hotels detracted from performance.
Management Strategies
• The global portfolio is comprised of three regional portfolios with a global allocation which weights each of the three major regions (U.S., Europe and Asia) based on our view of its relative attractiveness based on underlying real estate fundamentals and public market valuations.
• Each of the regional portfolios (which typically consists of approximately 30 stocks) reflects our core investment philosophy as a real estate value investor, which results in the ownership of stocks that we believe provide the best valuation relative to their underlying real estate values, while maintaining portfolio diversification.
• Our company specific research leads us to specific preferences for sub-segments within each property sector (U.S.) or country (Europe and Asia).
Expense Examples
As a shareholder of the Portfolio, you may incur two types of costs: (1) transactional costs, including redemption fees; (2) ongoing costs, including management fees, distribution (12b-1) fees (in the case of Class B); and other Portfolio expenses. These examples are intended to help you understand your ongoing costs (in dollars) of investing in the Portfolio and to compare these costs with the ongoing costs of investing in other mutual funds.
The examples are based on an investment of $1,000 invested at the beginning of the six-month period ended December 31, 2006 and held for the entire six-month period.
Actual Expenses
The first line of the tables below provides information about actual account values and actual expenses. You may use the information in this line, together with the amount you invested, to estimate the expenses that you paid over the period. Simply divide your account value by $1,000 (for example, an $8,600 account value divided by $1,000 = 8.6), then multiply the result by the number in the first line under the heading entitled “Expenses Paid During Period” to estimate the expenses you paid on your account during this period.
Please note that both classes within the Portfolio commenced operations on August 30, 2006, however, expenses did not begin accruing until August 31, 2006; therefore, “Actual Expenses Paid During Period” reflect activity from August 31, 2006 through December 31, 2006.
Hypothetical Example for Comparison Purposes
The second line of the tables below provides information about hypothetical account values and hypothetical expenses based on the Portfolio’s actual expense ratio and an assumed rate of return of 5% per year before expenses, which is not the Portfolio’s actual return. The hypothetical account values and expenses may not be used to estimate the actual ending account balance or expenses you paid for the period. You may use this information to compare the ongoing costs of investing
33
2006 Annual Report |
|
December 31, 2006 |
Investment Overview (cont’d)
Global Real Estate Portfolio
in the Portfolio and other funds. To do so, compare this 5% hypothetical example with the 5% hypothetical examples that appear in the shareholder reports of the other funds.
Please note that while the Portfolio commenced operations on August 30, 2006, the “Hypothetical Expenses Paid During the Period” reflect projected activity for the full six month period for the purposes of comparability. This projection assumes that the annualized expense ratio for the Portfolio was in effect during the period from July 1,2006 to December 31, 2006.
Please note that the expenses shown in the table are meant to highlight your ongoing costs only and do not reflect any transactional costs, such as redemption fees. Therefore, the second line of the table is useful in comparing ongoing costs only, and will not help you determine the relative total costs of owning different funds. In addition, if these transactional costs were included, your costs would have been higher.
|
|
|
|
|
| Expenses Paid |
| |||
|
| Beginning |
| Ending Account |
| During Period* |
| |||
|
| Account Value |
| Value |
| August 31, 2006— |
| |||
|
| August 31, |
| December 31, |
| December 31, |
| |||
|
| 2006 |
| 2006 |
| 2006 |
| |||
Class A |
|
|
|
|
|
|
| |||
Actual |
| $ | 1,000.00 |
| $ | 1,172.00 |
| $ | 3.84 |
|
Hypothetical (5% average annual return before expenses) |
| 1,000.00 |
| 1,019.91 |
| 5.35 |
| |||
|
|
|
|
|
|
|
| |||
Class B |
|
|
|
|
|
|
| |||
Actual |
| 1,000.00 |
| 1,171.10 |
| 4.76 |
| |||
Hypothetical (5% average annual return before expenses) |
| 1,000.00 |
| 1,018.65 |
| 6.61 |
| |||
* Expenses are equal to Class A and Class B annualized net expense ratios of 1.05% and 1.30%, respectively, multiplied by the average account value over the period, multiplied by 123/365 (to reflect the actual days in the period for the actual example) and multiplied by 184/365 (to reflect the one-half year period for the hypothetical example).
Graphic Presentation of Portfolio Holdings
The following graph depicts the Portfolio’s holdings by industry and/or security type, as a percentage of total investments.
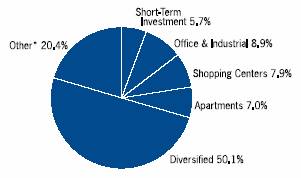
* Industries which do not appear in the above graph, as well as those which represent less than 5% of total investments, if applicable, are included in the category labeled “Other”.
January 2007
34
| 2006 Annual Report |
|
|
| December 31, 2006 |
Portfolio of Investments
Global Real Estate Portfolio
|
|
|
| Value |
| |
|
| Shares |
| (000) |
| |
Common Stocks (96.3%) |
|
|
|
|
| |
Australia (8.6%) |
|
|
|
|
| |
Centro Properties Group |
| 112,600 |
| $ | 809 |
|
CFS Retail Property Trust |
| 447,600 |
| 823 |
| |
DB RREEF Trust |
| 835,100 |
| 1,170 |
| |
GPT Group |
| 441,200 |
| 1,950 |
| |
Investa Property Group |
| 127,400 |
| 253 |
| |
Macquarie CountryWide Trust |
| 271,600 |
| 453 |
| |
Macquarie Goodman Group |
| 300,000 |
| 1,800 |
| |
Macquarie ProLogis Trust |
| 835,000 |
| 827 |
| |
Mirvac Group |
| 125,100 |
| 552 |
| |
Stockland Trust Group (New) |
| 418,050 |
| 2,732 |
| |
Westfield Group |
| 550,400 |
| 9,119 |
| |
|
|
|
| 20,488 |
| |
Austria (1.0%) |
|
|
|
|
| |
Conwert Immobilien Invest AG |
| (a)15,129 |
| 328 |
| |
Immoeast Immobilien Anlagen AG |
| (a)47,620 |
| 669 |
| |
IMMOFINANZ Immobilien Anlagen AG |
| (a)104,899 |
| 1,496 |
| |
|
|
|
| 2,493 |
| |
Canada (0.5%) |
|
|
|
|
| |
Legacy Hotels REIT |
| 62,565 |
| 509 |
| |
Sunrise Senior Living REIT |
| 84,570 |
| 773 |
| |
|
|
|
| 1,282 |
| |
Finland (0.2%) |
|
|
|
|
| |
Sponda Oyj |
| 22,914 |
| 363 |
| |
France (2.5%) |
|
|
|
|
| |
Gecina S.A. |
| 6,330 |
| 1,212 |
| |
Klepierre |
| 5,934 |
| 1,120 |
| |
Silic |
| 3,046 |
| 458 |
| |
Unibail |
| 13,466 |
| 3,290 |
| |
|
|
|
| 6,080 |
| |
Germany (0.0%) |
|
|
|
|
| |
IVG Immobilien AG |
| 788 |
| 34 |
| |
Hong Kong (9.3%) |
|
|
|
|
| |
Champion REIT |
| (a)1,589,000 |
| 768 |
| |
Cheung Kong Holdings Ltd. |
| 35,000 |
| 431 |
| |
Henderson Land Development Co., Ltd. |
| 678,000 |
| 3,792 |
| |
Hongkong Land Holdings Ltd. |
| 981,000 |
| 3,904 |
| |
Hysan Development Co., Ltd. |
| 584,000 |
| 1,528 |
| |
Kerry Properties Ltd. |
| 61,000 |
| 285 |
| |
New World Development Co., Ltd. |
| 1,976,000 |
| 3,978 |
| |
Sun Hung Kai Properties Ltd. |
| 538,000 |
| 6,180 |
| |
Swire Pacific Ltd., Class A |
| 117,500 |
| 1,262 |
| |
|
|
|
| 22,128 |
| |
Italy (0.8%) |
|
|
|
|
| |
Aedes S.p.A. |
| 27,557 |
| 224 |
| |
Beni Stabili S.p.A. |
| 631,572 |
| 1,008 |
| |
Risanamento S.p.A. |
| 59,895 |
| 648 |
| |
|
|
|
| 1,880 |
| |
Japan (13.9%) |
|
|
|
|
| |
AEON Mall Co., Ltd. |
| 7,700 |
| 435 |
| |
DAIBIRU Corp. |
| 40,300 |
| 439 |
| |
Japan Hotel and Resort, Inc. REIT |
| 122 |
| 702 |
| |
Japan Real Estate Investment Corp. REIT |
| 42 |
| 452 |
| |
Mitsubishi Estate Co., Ltd. |
| 385,000 |
| 9,964 |
| |
Mitsui Fudosan Co., Ltd. |
| 342,000 |
| 8,348 |
| |
Mori Trust Sogo, Inc. REIT |
| 28 |
| 263 |
| |
Nippon Building Fund, Inc. REIT |
| 126 |
| 1,673 |
| |
NTT Urban Development Corp. |
| 868 |
| 1,678 |
| |
Sumitomo Realty & Development Co., Ltd. |
| 207,000 |
| 6,645 |
| |
Tokyo Tatemono Co., Ltd. |
| 109,000 |
| 1,214 |
| |
Tokyu Land Corp. |
| 140,000 |
| 1,320 |
| |
|
|
|
| 33,133 |
| |
Netherlands (1.4%) |
|
|
|
|
| |
Corio N.V. |
| 6,824 |
| 558 |
| |
Eurocommercial Properties N.V. |
| 16,513 |
| 824 |
| |
Rodamco Europe N.V. |
| 10,614 |
| 1,412 |
| |
Wereldhave N.V. |
| 4,923 |
| 656 |
| |
|
|
|
| 3,450 |
| |
Singapore (4.2%) |
|
|
|
|
| |
Ascott Group Ltd. (The) |
| 716,000 |
| 752 |
| |
CapitaCommercial Trust REIT |
| 468,000 |
| 799 |
| |
CapitaLand Ltd. |
| 413,000 |
| 1,669 |
| |
CapitaMall Trust REIT |
| 382,000 |
| 725 |
| |
CapitaRetail China Trust REIT |
| (a)29,100 |
| 40 |
| |
CDL Hospitality Trusts REIT |
| (a)176,000 |
| 192 |
| |
Hotel Properties Ltd. |
| 73,000 |
| 128 |
| |
K-REIT Asia REIT |
| 107,000 |
| 174 |
| |
Keppel Land Ltd. |
| 130,000 |
| 585 |
| |
Macquarie MEAG Prime REIT |
| 1,031,000 |
| 786 |
| |
Overseas Union Enterprise Ltd. |
| 1,000 |
| 7 |
| |
Singapore Land Ltd. |
| 49,000 |
| 275 |
| |
Suntec REIT |
| 582,000 |
| 691 |
| |
United Industrial Corp., Ltd. |
| 1,296,000 |
| 1,766 |
| |
UOL Group Ltd. |
| 259,000 |
| 733 |
| |
Wheelock Properties (Singapore) Ltd. |
| 448,000 |
| 657 |
| |
|
|
|
| 9,979 |
| |
Sweden (1.0%) |
|
|
|
|
| |
Castellum AB |
| 57,814 |
| 771 |
| |
Faberge AB |
| 10,781 |
| 289 |
| |
Hufvudstaden AB, Class A |
| 115,374 |
| 1,306 |
| |
|
|
|
| 2,366 |
| |
Switzerland (0.7%) |
|
|
|
|
| |
Allreal Holding AG |
| 1,463 |
| 163 |
| |
PSP Swiss Property AG |
| (a)24,410 |
| 1,402 |
| |
|
|
|
| 1,565 |
| |
United Kingdom (11.5%) |
|
|
|
|
| |
British Land Co. plc |
| 160,757 |
| 5,395 |
| |
Brixton plc |
| 87,468 |
| 986 |
| |
Capital & Regional plc |
| 42,135 |
| 1,272 |
| |
Derwent Valley Holdings plc |
| 23,180 |
| 952 |
| |
Development Securities plc |
| 10,757 |
| 146 |
| |
Grainger Trust plc |
| 30,048 |
| 409 |
| |
Great Portland Estates plc |
| 86,126 |
| 1,170 |
| |
Hammerson plc |
| 86,838 |
| 2,681 |
| |
Insight Foundation Property Trust |
| 26,325 |
| 71 |
| |
The accompanying notes are an integral part of the financial statements.
35
2006 Annual Report |
|
December 31, 2006 |
Portfolio of Investments (cont’d)
Global Real Estate Portfolio
|
|
|
| Value |
| |
|
| Shares |
| (000) |
| |
United Kingdom (cont’d) |
|
|
|
|
| |
Land Securities Group plc |
| 127,074 |
| $ | 5,780 |
|
Liberty International plc |
| 85,088 |
| 2,326 |
| |
Minerva plc |
| (a)168,359 |
| 1,335 |
| |
Quintain Estates & Development plc |
| 41,373 |
| 693 |
| |
Shaftesbury plc |
| 27,888 |
| 428 |
| |
Slough Estates plc |
| 171,290 |
| 2,634 |
| |
Unite Group plc |
| 101,596 |
| 1,088 |
| |
Warner Estate Holdings plc |
| 5,183 |
| 88 |
| |
Workspace Group plc |
| 7,475 |
| 73 |
| |
|
|
|
| 27,527 |
| |
United States (40.7%) |
|
|
|
|
| |
Acadia Realty Trust REIT |
| 12,172 |
| 304 |
| |
AMB Property Corp. REIT |
| 35,118 |
| 2,058 |
| |
American Campus Communities, Inc. |
| 8,487 |
| 242 |
| |
Apartment Investment & Management Co., REIT |
| 9,384 |
| 526 |
| |
Archstone-Smith Trust REIT |
| 70,107 |
| 4,081 |
| |
AvalonBay Communities, Inc. REIT |
| 28,501 |
| 3,707 |
| |
Boston Properties, Inc. REIT |
| 52,595 |
| 5,884 |
| |
Brandywine Realty Trust REIT |
| 52,792 |
| 1,755 |
| |
BRE Properties, Inc. REIT |
| 20,590 |
| 1,339 |
| |
Brookfield Homes Corp. |
| 17,832 |
| 670 |
| |
Brookfield Properties Corp. |
| 130,439 |
| 5,130 |
| |
Cedar Shopping Centers, Inc. REIT |
| 8,926 |
| 142 |
| |
CentraCore Properties Trust REIT |
| 9,959 |
| 322 |
| |
Cogdell Spencer, Inc. REIT |
| 4,720 |
| 101 |
| |
Equity Lifestyle Properties, Inc. REIT |
| (a)17,085 |
| 930 |
| |
Equity Office Properties Trust REIT |
| 90,712 |
| 4,370 |
| |
Equity Residential REIT |
| 93,176 |
| 4,729 |
| |
Essex Property Trust, Inc. REIT |
| 14,234 |
| 1,840 |
| |
Federal Realty Investment Trust REIT |
| 26,728 |
| 2,272 |
| |
Forest City Enterprises, Inc., Class A |
| 31,046 |
| 1,813 |
| |
Gaylord Entertainment Co. |
| (a)5,569 |
| 284 |
| |
General Growth Properties, Inc. REIT |
| 55,401 |
| 2,894 |
| |
Health Care Property Investors, Inc. REIT |
| 20,943 |
| 771 |
| |
Health Care, Inc. REIT |
| 5,096 |
| 219 |
| |
Hersha Hospitality Trust REIT |
| 20,931 |
| 237 |
| |
Highwoods Properties, Inc. REIT |
| 13,617 |
| 555 |
| |
Hilton Hotels Corp. |
| 104,353 |
| 3,642 |
| |
Host Marriot Corp. REIT |
| 252,276 |
| 6,193 |
| |
Kilroy Realty Corp. REIT |
| 1,505 |
| 117 |
| |
Liberty Property Trust REIT |
| 30,255 |
| 1,487 |
| |
Macerich Co. (The) REIT |
| 41,840 |
| 3,622 |
| |
Mack-Cali Realty Corp. REIT |
| 35,349 |
| 1,803 |
| |
Morgans Hotel Group Co. |
| (a)26,963 |
| 456 |
| |
Parkway Properties, Inc. REIT |
| 942 |
| 48 |
| |
Plum Creek Timber Co., Inc. REIT |
| 23,660 |
| 943 |
| |
Post Properties, Inc. REIT |
| 36,879 |
| 1,685 |
| |
ProLogis REIT |
| 22,066 |
| 1,341 |
| |
Public Storage, Inc. REIT |
| 36,399 |
| 3,549 |
| |
Ramco-Gershenson Properties REIT |
| 1,365 |
| 52 |
| |
Regency Centers Corp. REIT |
| 38,138 |
| 2,981 |
| |
Republic Property Trust REIT |
| 11,726 |
| 135 |
| |
Senior Housing Properties Trust REIT |
| 39,816 |
| 975 |
| |
Simon Property Group, Inc. REIT |
| 93,325 |
| 9,453 |
| |
SL Green Realty Corp. REIT |
| 7,116 |
| 945 |
| |
Starwood Hotels & Resorts Worldwide, Inc. |
| 73,931 |
| 4,621 |
| |
Strategic Hotels & Resorts, Inc. REIT |
| 65,083 |
| 1,418 |
| |
Taubman Centers, Inc. REIT |
| 30,400 |
| 1,546 |
| |
Tenet Healthcare Corp. |
| (a)68,264 |
| 476 |
| |
Universal Health Reality Income Trust REIT |
| 4,512 |
| 176 |
| |
Vornado Realty Trust REIT |
| 19,115 |
| 2,322 |
| |
|
|
|
| 97,161 |
| |
Total Common Stocks (Cost $203,888) |
|
|
| 229,929 |
| |
Investment Company (0.5%) |
|
|
|
|
| |
Luxembourg(0.5%) |
|
|
|
|
| |
ProLogis European Properties |
| (a)62,215 |
| 1,232 |
| |
|
| Face |
|
|
| ||
|
| Amount |
|
|
| ||
|
| (000) |
|
|
| ||
Short-Term Investment (5.9%) |
|
|
|
|
| ||
Repurchase Agreement (5.9%) |
|
|
|
|
| ||
J.P. Morgan Securities, Inc., 5.20%, |
| $ | (f)14,015 |
| 14,015 |
| |
Total Investments (102.7%) (Cost $219,068) |
|
|
| 245,176 |
| ||
Liabilities in Excess of Other Assets (-2.7%) |
|
|
| (6,413 | ) | ||
Net Assets (100%) |
|
|
| $ | 238,763 |
| |
(a) Non-income producing security.
(f) Represents the Portfolio’s undivided interest in a joint repurchase agreement which has a total value of $1,856,998,000. The repurchase agreement was fully collateralized by U.S. government agency securities at the date of this Portfolio of Investments as follows: Federal Farm Credit Bank, 0.00% to 7.43%, due 1/16/07 to 10/23/35; Federal Home Loan Bank, 0.00% to 7.38%, due 1/3/07 to 6/5/28; Federal Home Loan Mortgage Corp., 0.00% to 6.75%, due 1/2/07 to 7/15/32; Federal National Mortgage Association, 0.00% to 8.20%, due 1/12/07 to 11/15/30; Tennessee Valley Authority, 5.38% to 6.75%, due 11/13/08 to 4/1/36, which had a total value of $1,894,142,869. The investment in the repurchase agreement is through participation in a joint account with affiliated parties pursuant to exemptive relief received by the Portfolio from the SEC.
REIT Real Estate Investment Trust
The accompanying notes are an integral part of the financial statements.
36
| 2006 Annual Report |
|
|
| December 31, 2006 |
Portfolio of Investments (cont’d)
Global Real Estate Portfolio
Foreign Currency Exchange Contract Information:
The Portfolio had the following foreign currency exchange contract(s) open at period end:
|
|
|
|
|
|
|
|
|
| Net |
| |||||||
Currency |
|
|
|
|
| In |
|
|
| Unrealized |
| |||||||
to |
|
|
|
|
| Exchange |
|
|
| Appreciation |
| |||||||
Deliver |
| Value |
| Settlement |
| For |
| Value |
| (Depreciation) |
| |||||||
(000) |
| (000) |
| Date |
| (000) |
| (000) |
| (000) |
| |||||||
EUR |
| 307 |
| $ | 405 |
| 1/3/07 |
| CHF |
| 492 |
| $ | 404 |
| $ | (1 | ) |
EUR |
| 15 |
| 19 |
| 1/4/07 |
| CHF |
| 24 |
| 19 |
| @— |
| |||
EUR |
| 2,908 |
| 3,839 |
| 1/2/07 |
| GBP |
| 1,950 |
| 3,818 |
| (21 | ) | |||
EUR |
| 206 |
| 272 |
| 1/3/07 |
| GBP |
| 138 |
| 271 |
| (1 | ) | |||
EUR |
| 135 |
| 179 |
| 1/2/07 |
| SEK |
| 1,223 |
| 179 |
| @— |
| |||
EUR |
| 43 |
| 56 |
| 1/3/07 |
| SEK |
| 387 |
| 57 |
| 1 |
| |||
USD |
| 2,192 |
| 2,192 |
| 1/2/07 |
| AUD |
| 2,792 |
| 2,204 |
| 12 |
| |||
USD |
| 111 |
| 111 |
| 1/3/07 |
| AUD |
| 141 |
| 111 |
| @— |
| |||
USD |
| 3,994 |
| 3,994 |
| 1/4/07 |
| JPY |
| 474,592 |
| 3,988 |
| (6 | ) | |||
USD |
| 1,076 |
| 1,076 |
| 1/3/07 |
| SGD |
| 1,653 |
| 1,078 |
| 2 |
| |||
USD |
| 45 |
| 45 |
| 1/4/07 |
| SGD |
| 69 |
| 45 |
| @— |
| |||
|
|
|
| $ | 12,188 |
|
|
|
|
|
|
| $ | 12,174 |
| $ | (14 | ) |
AUD | — Australian Dollar |
CHF | — Swiss Franc |
EUR | — Euro |
GBP | — British Pound |
JPY | — Japanese Yen |
SEK | — Swedish Krona |
SGD | — Singapore Dollar |
USD | — United States Dollar |
@ | — Face amount/Value is less than $500. |
The accompanying notes are an integral part of the financial statements.
37
2006 Annual Report |
|
December 31, 2006 |
Investment Overview (unaudited)
Global Value Equity Portfolio
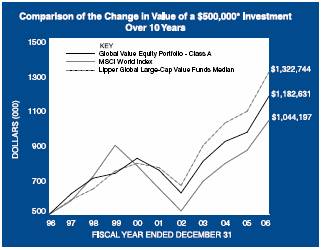
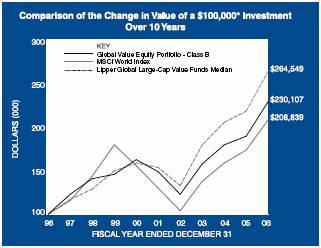
* Minimum Investment |
In accordance with SEC regulations, Portfolio performance shown assumes that all recurring fees (including management fees) were deducted and all dividends and distributions were reinvested.
Performance Compared to the Morgan Stanley Capital International (MSCI) World Index(1) and the Lipper Global Large-Cap Value Funds Median(2)
|
| Total Returns(3) |
| ||||||
|
|
|
| Average Annual |
| ||||
|
| One |
| Five |
| Ten |
| Since |
|
|
| Year |
| Years |
| Years |
| Inception(6) |
|
Portfolio – Class A (4) |
| 21.40 | % | 9.38 | % | 8.99 | % | 12.05 | % |
MSCI World Index |
| 20.07 |
| 9.97 |
| 7.64 |
| 9.34 |
|
Lipper Global Large-Cap Value Funds Median |
| 20.81 |
| 11.42 |
| 10.22 |
| — |
|
|
|
|
|
|
|
|
|
|
|
Portfolio – Class B (5) |
| 21.05 |
| 9.09 |
| 8.69 |
| 9.84 |
|
MSCI World Index |
| 20.07 |
| 9.97 |
| 7.64 |
| 8.12 |
|
Lipper Global Large-Cap Value Funds Median |
| 20.81 |
| 11.42 |
| 10.22 |
| 11.11 |
|
Performance data quoted represents past performance, which is no guarantee of future results, and current performance may be lower or higher than the figures shown. Performance assumes that all dividends and distributions, if any, were reinvested. For the most recent month-end performance figures, please visit www.morganstanley.com/im. Investment return and principal value will fluctuate so that Portfolio shares, when redeemed, may be worth more or less than their original cost. Total returns do not reflect the deduction of taxes that a shareholder would pay on Portfolio distributions or the redemption of Portfolio shares.
(1) The Morgan Stanley Capital International (MSCI) World Index is a free float-adjusted market capitalization index that is designed to measure global developed market equity performance. The MSCI World Index consists of the following 23 developed market country indices: Australia, Austria, Belgium, Canada, Denmark, Finland, France, Germany, Greece, Hong Kong, Ireland, Italy, Japan, Netherlands, New Zealand, Norway, Portugal, Singapore, Spain, Sweden, Switzerland, the United Kingdom and the United States. The Index is unmanaged and its returns do not include any sales charges or fees. Such costs would lower performance. It is not possible to invest directly in an index.
(2) The Lipper Global Large-Cap Value Funds Median tracks the performance of all funds in the Lipper Global Large-Cap Value Funds classification. The Median, which is adjusted for capital gains distributions and income dividends, is unmanaged and should not be considered an investment.
(3) Total returns for the Portfolio reflect fees waived and expenses reimbursed, if applicable, by the Adviser. Without such waivers and/or reimbursements, total returns would have been lower. Fee waivers and/or expense reimbursements are voluntary and the Adviser reserves the right to commence or terminate any waiver and/or reimbursement at any time.
(4) Commenced operations on July 15, 1992
(5) Commenced operations on January 2, 1996
(6) For comparative purposes, average annual since inception returns listed for the Indexes refer to the inception date or initial offering of the respective share class of the Portfolio, not the inception of the Index.
The Global Value Equity Portfolio seeks long-term capital appreciation by investing primarily in equity securities of issuers throughout the world, including U.S. issuers. Foreign investing involves certain risks, including currency fluctuations and controls, restrictions on foreign investments, less governmental supervision and regulation, less liquidity and the potential for market volatility and political instability.
38
| 2006 Annual Report |
|
|
| December 31, 2006 |
Investment Overview (cont’d)
Global Value Equity Portfolio
Performance
For the year ended December 31, 2006, the Portfolio had a total return based on net asset value per share of 21.40% for the Class A shares, net of fees, and 21.05% for the Class B shares, net of fees, compared to 20.07% for the Morgan Stanley Capital International (MSCI) World Index (the “Index”).
Factors Affecting Performance
• Overall, it has been another good year for financial markets. Although the markets were troubled by the U.S. slowdown and its impact on the global picture, stocks have rallied to all-time highs. The Dow Jones Industrial Average was up strongly for the year, having broken record highs almost daily in the month of December. Eurozone stocks rose even faster. Although Japan’s market stalled a little, China’s put in another impressive year.
• Relative to the Index, the strongest performance in the Portfolio over this period came from stock selection and an underweight position in the information technology sector. In particular, the Portfolio’s holdings in the equipment and hardware group and in the software and services group performed very well. The Portfolio also benefited from a zero weight in the semi-conductors group, which sold off sharply during the year.
• The Portfolio’s positioning within the energy sector was also a strongly positive influence on performance for the year. Within this sector, the Portfolio emphasized the higher quality names, which finally began to pay off as performance of the broader sector began to stall. The Portfolio was underweight in the sector throughout the year and this also had a small positive effect.
• The financials sector was another area where the Portfolio gained relative outperformance. In particular, stock selection in banks was strong, primarily in the Portfolio’s holdings in Europe. Stock selection in diversified financials was also positive but the Portfolio’s holdings within the insurance group lagged the Index.
• The weakest contributor to 2006 performance was stock selection and an underweight position in the utilities sector. Stock selection in the industrials sector was also a detractor, particularly within the capital goods group.
Management Strategies
• Although a number of changes to the Portfolio were made during the year, the key over- and underweight positions relative to the Index remain unchanged. The Portfolio holds an overweight position in the highly cash-generative consumer staples stocks, as well as in the pharmaceuticals group and the telecommunication services sector. Although we have started to re-examine energy stocks after the recent sell-offs, we remain underweight here. Other notable underweight positions include the financials sector and the disparate consumer discretionary sectors.
• We continue to believe that superior investment performance will be driven by careful stock selection. We are committed to the application of an investment process that is both proven and highly disciplined. We look for companies and sectors that combine attractive dividend yields with stable cash flows and significant potential for growth in revenues and margins. We apply strict criteria that seek to identify situations of suitable value and quality.
Expense Examples
As a shareholder of the Portfolio, you may incur two types of costs: (1) transactional costs, including redemption fees; (2) ongoing costs, including management fees, distribution (12b-1) fees (in the case of Class B); and other Portfolio expenses. These examples are intended to help you understand your ongoing costs (in dollars) of investing in the Portfolio and to compare these costs with the ongoing costs of investing in other mutual funds.
The examples are based on an investment of $1,000 invested at the beginning of the six-month period ended December 31, 2006 and held for the entire six-month period.
Actual Expenses
The first line of the tables below provides information about actual account values and actual expenses. You may use the information in this line, together with the amount you invested, to estimate the expenses that you paid over the period. Simply divide your account value by $1,000 (for example, an $8,600 account value divided by $1,000 = 8.6), then multiply the result by the number in the first line under the heading entitled “Expenses Paid During Period” to estimate the expenses you paid on your account during this period.
Please note that “Expenses Paid During Period” are grossed up to reflect Portfolio expenses prior to the effect of Expense Offset (See Note E in the Notes to Financial Statements). Therefore, the annualized net expense ratios may differ from the ratio of the expenses to average net assets shown in the Financial Highlights.
Hypothetical Example for Comparison Purposes
The second line of the tables below provides information about hypothetical account values and hypothetical expenses based on the Portfolio’s actual expense ratio and an assumed rate of return of 5% per year before expenses, which is not the Portfolio’s actual return. The hypothetical account values and expenses may not be used to estimate the actual ending account balance or expenses you paid for the period. You may
39
2006 Annual Report |
|
|
|
December 31, 2006 |
|
Investment Overview (cont’d)
Global Value Equity Portfolio
use this information to compare the ongoing costs of investing in the Portfolio and other funds. To do so, compare this 5% hypothetical example with the 5% hypothetical examples that appear in the shareholder reports of the other funds.
Please note that the expenses shown in the table are meant to highlight your ongoing costs only and do not reflect any transactional costs, such as redemption fees. Therefore, the second line of the table is useful in comparing ongoing costs only, and will not help you determine the relative total costs of owning different funds. In addition, if these transactional costs were included, your costs would have been higher.
|
|
|
|
|
| Expenses Paid |
| |||
|
|
|
| Ending |
| During Period* |
| |||
|
| Beginning |
| Account Value |
| July 1, 2006 — |
| |||
|
| Account Value |
| December 31, |
| December 31, |
| |||
|
| July 1, 2006 |
| 2006 |
| 2006 |
| |||
Class A |
|
|
|
|
|
|
| |||
Actual |
| $ | 1,000.00 |
| $ | 1,159.50 |
| $ | 4.84 |
|
Hypothetical (5% average annual return before expenses) |
| 1,000.00 |
| 1,020.72 |
| 4.53 |
| |||
|
|
|
|
|
|
|
| |||
Class B |
|
|
|
|
|
|
| |||
Actual |
| 1,000.00 |
| 1,158.10 |
| 6.20 |
| |||
Hypothetical (5% average annual return before expenses) |
| 1,000.00 |
| 1,019.46 |
| 5.80 |
| |||
* Expenses are equal to Class A and Class B annualized net expense ratios of 0.89% and 1.14%, respectively, multiplied by the average account value over the period, multiplied by 184/365 (to reflect the one-half year period).
Graphic Presentation of Portfolio Holdings
The following graph depicts the Portfolio’s holdings by industry and/or security type, as a percentage of total investments.
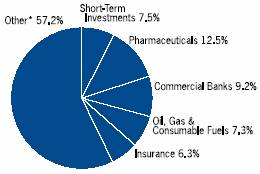
* Industries which do not appear in the above graph, as well as those which represent less than 5% of total investments, if applicable, are included in the category labeled “Other”.
January 2007
40
| 2006 Annual Report |
|
|
| December 31, 2006 |
Portfolio of Investments
Global Value Equity Portfolio
|
|
|
| Value |
| |
|
| Shares |
| (000) |
| |
Common Stocks (98.3%) |
|
|
|
|
| |
Australia (1.9%) |
|
|
|
|
| |
Boral Ltd. |
| (c)104,626 |
| $ | 630 |
|
Foster’s Group Ltd. |
| (c)138,282 |
| 756 |
| |
Goodman Fielder Ltd. |
| 583,932 |
| 1,023 |
| |
|
|
|
| 2,409 |
| |
Bermuda (5.8%) |
|
|
|
|
| |
Ingersoll Rand Co., Ltd. Class A |
| (c)57,336 |
| 2,243 |
| |
Tyco International Ltd. |
| 112,325 |
| 3,415 |
| |
XL Capital Ltd., Class A |
| (c)26,272 |
| 1,892 |
| |
|
|
|
| 7,550 |
| |
France (7.5%) |
|
|
|
|
| |
BNP Paribas S.A. |
| 29,827 |
| 3,254 |
| |
France Telecom S.A. |
| (c)26,730 |
| 739 |
| |
Lafarge S.A. |
| (c)13,226 |
| 1,968 |
| |
Sanofi-Aventis S.A. |
| 17,971 |
| 1,660 |
| |
Total S.A. |
| (c)27,685 |
| 1,997 |
| |
|
|
|
| 9,618 |
| |
Germany (2.2%) |
|
|
|
|
| |
BASF AG |
| 7,715 |
| 752 |
| |
Bayerische Motoren Werke AG |
| 24,107 |
| 1,385 |
| |
DaimlerChrysler AG |
| 10,895 |
| 673 |
| |
|
|
|
| 2,810 |
| |
Hong Kong (0.9%) |
|
|
|
|
| |
Chunghwa Telecom Co., Ltd. ADR |
| (c)44,877 |
| 885 |
| |
Yue Yuen Industrial Holdings Ltd. |
| 71,500 |
| 227 |
| |
|
|
|
| 1,112 |
| |
Ireland (3.1%) |
|
|
|
|
| |
Bank of Ireland |
| 107,751 |
| 2,489 |
| |
Kerry Group plc, Class A |
| 61,927 |
| 1,548 |
| |
|
|
|
| 4,037 |
| |
Italy (1.9%) |
|
|
|
|
| |
ENI S.p.A. |
| 73,474 |
| 2,471 |
| |
Japan (7.5%) |
|
|
|
|
| |
Astellas Pharma, Inc. |
| 29,400 |
| 1,336 |
| |
Canon, Inc. |
| 31,500 |
| 1,773 |
| |
Kao Corp. |
| 44,000 |
| 1,187 |
| |
Mitsui Sumitomo Insurance Co., Ltd. |
| 53,000 |
| 580 |
| |
Nissan Motor Co., Ltd. |
| 93,400 |
| 1,125 |
| |
Sumitomo Electric Industries Ltd. |
| (c)98,900 |
| 1,546 |
| |
Takeda Pharmaceutical Co., Ltd. |
| (c)31,700 |
| 2,176 |
| |
|
|
|
| 9,723 |
| |
Netherlands (3.8%) |
|
|
|
|
| |
Chicago Bridge & Iron Co. N.V. (NY Shares) |
| 46,102 |
| 1,261 |
| |
Koninklijke Philips Electronics N.V. |
| 16,371 |
| 617 |
| |
Unilever N.V. CVA |
| 71,168 |
| 1,945 |
| |
Wolters Kluwer N.V. CVA |
| 36,373 |
| 1,046 |
| |
|
|
|
| 4,869 |
| |
New Zealand (0.6%) |
|
|
|
|
| |
Telecom Corp. of New Zealand Ltd. |
| (c)235,717 |
| 807 |
| |
Singapore (0.7%) |
|
|
|
|
| |
ComfortDelgro Corp., Ltd. |
| 861,000 |
| 904 |
| |
South Korea (0.8%) |
|
|
|
|
| |
SK Telecom Co., Ltd. ADR |
| (c)41,077 |
| 1,088 |
| |
Spain (2.2%) |
|
|
|
|
| |
Banco Bilbao Vizcaya Argentaria S.A. |
| 59,276 |
| 1,427 |
| |
Telefonica S.A. |
| 66,655 |
| 1,418 |
| |
|
|
|
| 2,845 |
| |
Switzerland (2.7%) |
|
|
|
|
| |
Novartis AG (Registered) |
| 9,695 |
| 559 |
| |
Syngenta AG |
| (a)6,833 |
| 1,271 |
| |
UBS AG (Registered) |
| 26,670 |
| 1,621 |
| |
|
|
|
| 3,451 |
| |
United Kingdom (21.5%) |
|
|
|
|
| |
Barclays plc |
| 135,950 |
| 1,943 |
| |
Cadbury Schweppes plc |
| 249,472 |
| 2,670 |
| |
Diageo plc |
| 66,696 |
| 1,309 |
| |
GlaxoSmithKline plc |
| 114,896 |
| 3,024 |
| |
Imperial Tobacco Group plc |
| 66,662 |
| 2,624 |
| |
Old Mutual plc |
| 478,290 |
| 1,632 |
| |
Reed Elsevier plc |
| 186,833 |
| 2,050 |
| |
Rolls-Royce Group plc |
| (a)227,469 |
| 1,994 |
| |
Rolls-Royce Group plc, Class B |
| 8,446,505 |
| 17 |
| |
Royal Bank of Scotland Group plc |
| 69,704 |
| 2,720 |
| |
Royal Dutch Shell plc ADR |
| 38,016 |
| 2,691 |
| |
Vodafone Group plc |
| 717,609 |
| 1,988 |
| |
WM Morrison Supermarkets plc |
| 335,992 |
| 1,674 |
| |
WPP Group plc |
| 100,219 |
| 1,355 |
| |
|
|
|
| 27,691 |
| |
United States (35.2%) |
|
|
|
|
| |
Alcoa, Inc. |
| 28,754 |
| 863 |
| |
Altria Group, Inc. |
| 40,378 |
| 3,465 |
| |
American Electric Power Co., Inc. |
| 16,204 |
| 690 |
| |
American International Group, Inc. |
| 9,412 |
| 674 |
| |
AT&T, Inc. |
| (c)21,730 |
| 777 |
| |
BJ’s Wholesale Club, Inc. |
| (a)31,917 |
| 993 |
| |
Boeing Co. (The) |
| 8,213 |
| 730 |
| |
CBS Corp. |
| 14,804 |
| 462 |
| |
Chevron Corp. |
| 30,850 |
| 2,268 |
| |
Citigroup, Inc. |
| 48,941 |
| 2,726 |
| |
Dominion Resources, Inc. |
| 16,114 |
| 1,351 |
| |
EMC Corp. |
| (a)(c)135,088 |
| 1,783 |
| |
First DataCorp. |
| 51,466 |
| 1,313 |
| |
Freddie Mac |
| 33,826 |
| 2,297 |
| |
Hewlett-Packard Co. |
| 32,643 |
| 1,345 |
| |
International Business Machines Corp. |
| 30,713 |
| 2,984 |
| |
Marsh & McClennan Cos., Inc. |
| 66,253 |
| 2,031 |
| |
McAfee, Inc. |
| (a)36,989 |
| 1,050 |
| |
Mellon Financial Corp. |
| 44,908 |
| 1,893 |
| |
Merrill Lynch & Co., Inc. |
| 21,421 |
| 1,994 |
| |
Northrop Grumman Corp. |
| 8,859 |
| 600 |
| |
Pfizer, Inc. |
| 73,506 |
| 1,904 |
| |
Schering-Plough Corp. |
| (c)118,431 |
| 2,800 |
| |
St. Paul Travelers Cos., Inc. (The) |
| (c)25,516 |
| 1,370 |
| |
UnitedHealth Group, Inc. |
| 36,767 |
| 1,975 |
| |
Verizon Communications, Inc. |
| 31,687 |
| 1,180 |
| |
Viacom, Inc., Class B |
| (a)14,510 |
| 595 |
| |
The accompanying notes are an integral part of the financial statements.
41
2006 Annual Report |
|
|
|
December 31, 2006 |
|
Portfolio of Investments (cont’d)
Global Value Equity Portfolio
|
|
|
| Value |
| ||
|
| Shares |
| (000) |
| ||
United States (cont’d) |
|
|
|
|
| ||
Weyerhaeuser Co. |
| (c)9,670 |
| $ | 683 |
| |
Wyeth |
| 50,837 |
| 2,589 |
| ||
|
|
|
| 45,385 |
| ||
Total Common Stocks (Cost $96,331) |
|
|
| 126,770 |
| ||
|
|
|
|
|
| ||
|
| Face |
|
|
| ||
|
| Amount |
|
|
| ||
|
| (000) |
|
|
| ||
Short-Term Investments (8.0%) |
|
|
|
|
| ||
Short-Term Debt Securities held as Collateral on Loaned Securities (6.4%) |
|
|
|
|
| ||
Alliance & Leicester plc, |
|
|
|
|
| ||
5.36%, 1/8/07 |
| $ | (h)267 |
| 267 |
| |
Bancaja, 5.37%, 1/19/07 |
| (h)133 |
| 133 |
| ||
Bank of America Corp., 5.32%, 1/2/07 |
| (h)427 |
| 427 |
| ||
Bank of New York Co., Inc., |
|
|
|
|
| ||
5.34%, 1/10/07 |
| (h)133 |
| 133 |
| ||
Bear Stearns & Co., Inc., |
|
|
|
|
| ||
5.37%, 1/2/07 |
| (h)160 |
| 160 |
| ||
5.38%, 1/2/07 |
| (h)107 |
| 107 |
| ||
5.39%, 1/16/07 |
| (h)267 |
| 267 |
| ||
BNP Paribas plc, |
|
|
|
|
| ||
5.35%, 2/20/07 |
| (h)267 |
| 267 |
| ||
CIC, New York, |
|
|
|
|
| ||
5.33%, 1/3/07 |
| (h)187 |
| 187 |
| ||
5.34%, 1/2/07 |
| (h)267 |
| 267 |
| ||
Dekabank Deutsche Girozentrale, |
|
|
|
|
| ||
5.39%, 1/19/07 |
| (h)272 |
| 272 |
| ||
Deutsche Bank Securities, Inc., |
|
|
|
|
| ||
5.33%, 1/2/07 |
| 856 |
| 856 |
| ||
Dexia Bank, New York, |
|
|
|
|
| ||
5.33%, 1/2/07 |
| (h)267 |
| 267 |
| ||
Gemini Securitization Corp., |
|
|
|
|
| ||
5.34%, 1/2/07 |
| 133 |
| 133 |
| ||
Goldman Sachs Group, Inc., |
|
|
|
|
| ||
5.40%, 1/16/07 |
| (h)133 |
| 133 |
| ||
5.42%, 1/2/07 |
| (h)251 |
| 251 |
| ||
HSBC Finance Corp., 5.34%, 1/8/07 |
| (h)133 |
| 133 |
| ||
Liberty Lighthouse U.S. Capital, |
|
|
|
|
| ||
5.33%, 1/2/07 |
| (h)133 |
| 133 |
| ||
Manufacturers & Traders, |
|
|
|
|
| ||
5.33%, 1/16/07 |
| (h)160 |
| 160 |
| ||
Merrill Lynch & Co., |
|
|
|
|
| ||
5.35%, 1/26/07 |
| (h)140 |
| 140 |
| ||
Mitsubishi UFJ Financial Group, |
|
|
|
|
| ||
5.33%, 1/2/07 |
| (h)133 |
| 133 |
| ||
Natexis Banques Populaires, New York, |
|
|
|
|
| ||
5.34%, 1/2/07 |
| (h)267 |
| 267 |
| ||
5.35%, 1/2/07 |
| (h)133 |
| 133 |
| ||
National City Bank Cleveland, |
|
|
|
|
| ||
5.32%, 1/2/07 |
| (h)386 |
| 386 |
| ||
National Rural Utilities Cooperative Finance Corp., |
|
|
|
|
| ||
5.34%, 1/2/07 |
| (h)535 |
| 535 |
| ||
Nationwide Building Society, |
|
|
|
|
| ||
5.44%, 3/28/07 |
| (h)309 |
| 309 |
| ||
Nordea Bank, New York, |
|
|
|
|
| ||
5.31%, 1/2/07 |
| (h)400 |
| 400 |
| ||
Rhein-Main Securitisation Ltd., |
|
|
|
|
| ||
5.33%, 1/18/07 |
| 126 |
| 126 |
| ||
Skandi, NewYork, |
|
|
|
|
| ||
5.34%, 1/9/07 |
| (h)267 |
| 267 |
| ||
SLM Corp., 5.36%, 1/22/07 |
| (h)267 |
| 267 |
| ||
Toronto Dominion, New York, |
|
|
|
|
| ||
5.32%, 5/29/07 |
| (h)267 |
| 267 |
| ||
Tulip Funding, 5.36%, 1/16/07 |
| 146 |
| 146 |
| ||
Unicredito Italiano Bank (Ireland) plc, |
|
|
|
|
| ||
5.36%, 1/9/07 |
| (h)187 |
| 187 |
| ||
World Savings Bank FSB, |
|
|
|
|
| ||
5.35%, 1/19/07 |
| (h)91 |
| 91 |
| ||
|
|
|
| 8,207 |
| ||
Repurchase Agreement (1.6%) |
|
|
|
|
| ||
J.P. Morgan Securities, Inc., 5.20%, dated 12/29/06, due 1/2/07, repurchase price $2,123 |
| (f)2,122 |
| 2,122 |
| ||
Total Short-Term Investments (Cost $10,329) |
|
|
| 10,329 |
| ||
Total Investments (106.3%) (Cost $106,660) — including $7,841 of Securities Loaned |
|
|
| 137,099 |
| ||
Liabilities in Excess of Other Assets (-6.3%) |
|
|
| (8,163 | ) | ||
Net Assets (100%) |
|
|
| $ | 128,936 |
| |
(a) Non-income producing security.
(c) All or portion of security on loan at December 31, 2006.
(f) Represents the Portfolio’s undivided interest in a joint repurchase agreement which has a total value of $1,856,998,000. The repurchase agreement was fully collateralized by U.S. government agency securities at the date of this Portfolio of Investments as follows: Federal Farm Credit Bank, 0.00% to 7.43%, due 1/16/07 to 10/23/35; Federal Home Loan Bank, 0.00% to 7.38%, due 1/3/07 to 6/5/28; Federal Home Loan Mortgage Corp., 0.00% to 6.75%, due 1/2/07 to 7/15/32; Federal National Mortgage Association, 0.00% to 8.20%, due 1/12/07 to 11/15/30; Tennessee Valley Authority, 5.38% to 6.75%, due 11/13/08 to 4/1/36, which had a total value of $1,894,142,869. The investment in the repurchase agreement is through participation in a joint account with affiliated parties pursuant to exemptive relief received by the Portfolio from the SEC.
(h) Variable/Floating Rate Security — interest rate changes on these instruments are based on changes in a designated base rate. The rates shown are those in effect on December 31, 2006.
ADR American Depositary Receipts
CVA Certificaten Van Aandelen
Foreign Currency Exchange Contract Information:
The Portfolio had the following foreign currency exchange contract(s) open at period end:
|
|
|
|
|
|
|
|
|
| Net |
| ||||||
Currency |
|
|
|
|
| In |
|
|
| Unrealized |
| ||||||
to |
|
|
|
|
| Exchange |
|
|
| Appreciation |
| ||||||
Deliver |
| Value |
| Settlement |
| For |
| Value |
| (Depreciation) |
| ||||||
(000) |
| (000) |
| Date |
| (000) |
| (000) |
| (000) |
| ||||||
GBP |
| 3,250 |
| $ | 6,365 |
| 3/14/07 |
| USD | 6,389 |
| $ | 6,389 |
| $ | 24 |
|
GBP — British Pound
USD — United States Dollar
The accompanying notes are an integral part of the financial statements.
42
| 2006 Annual Report |
|
|
| December 31, 2006 |
Investment Overview (unaudited)
International Equity Portfolio
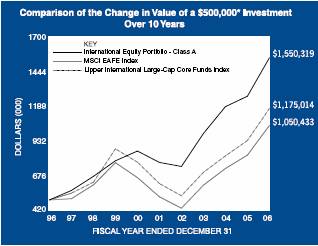
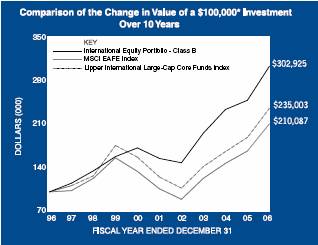
* Minimum Investment
In accordance with SEC regulations, Portfolio performance shown assumes that all recurring fees (including management fees) were deducted and all dividends and distributions were reinvested.
Performance Compared to the Morgan Stanley Capital International (MSCI) EAFE Index(1) and the Lipper International Large-Cap Core Funds Index(2)
|
| Total Returns(3) |
| ||||||
|
|
|
| Average Annual |
| ||||
|
| One |
| Five |
| Ten |
| Since |
|
Portfolio – Class A (4) |
| 22.50 | % | 14.80 | % | 11.98 | % | 11.97 | % |
MSCI EAFE Index |
| 26.34 |
| 14.98 |
| 7.71 |
| 6.17 |
|
Lipper International Large-Cap Core Funds Index |
| 25.11 |
| 13.60 |
| 8.92 |
| 9.08 |
|
|
|
|
|
|
|
|
|
|
|
Portfolio – Class B (5) |
| 22.21 |
| 14.54 |
| 11.72 |
| 12.33 |
|
MSCI EAFE Index |
| 26.34 |
| 14.98 |
| 7.71 |
| 7.55 |
|
Lipper International Large-Cap Core Funds Index |
| 25.11 |
| 13.60 |
| 8.92 |
| 9.34 |
|
Performance data quoted represents past performance, which is no guarantee of future results, and current performance may be lower or higher than the figures shown. Performance assumes that all dividends and distributions, if any, were reinvested. For the most recent month-end performance figures, please visit www.morganstanley.com/im. Investment return and principal value will fluctuate so that Portfolio shares, when redeemed, may be worth more or less than their original cost. Total returns do not reflect the deduction of taxes that a shareholder would pay on Portfolio distributions or the redemption of Portfolio shares.
(1) The Morgan Stanley Capital International (MSCI) EAFE Index (Europe, Australasia, Far East) is a free float-adjusted market capitalization index that is designed to measure developed market equity performance, excluding the U.S. & Canada. The MSCI EAFE Index consists of the following 21 developed market country indices: Australia, Austria, Belgium, Denmark, Finland, France, Germany, Greece, Hong Kong, Ireland, Italy, Japan, the Netherlands, New Zealand, Norway, Portugal, Singapore, Spain, Sweden, Switzerland and the United Kingdom. The Index is unmanaged and its returns do not include any sales charges or fees. Such costs would lower performance. It is not possible to invest directly in an index.
(2) The Lipper International Large-Cap Core Funds Index is an equally weighted performance index of the largest qualifying funds (based on net assets) in the Lipper International Large-Cap Core Funds classification. The Index, which is adjusted for capital gains distributions and income dividends, is unmanaged and should not be considered an investment. There are currently 30 funds represented in this Index. As of the date of this report, the Portfolio is in the Lipper International Large-Cap Core Funds classification.
(3) Total returns for the Portfolio reflect fees waived and expenses reimbursed, if applicable, by the Adviser. Without such waivers and/or reimbursements, total returns would have been lower. Fee waivers and/or expense reimbursements are voluntary and the Adviser reserves the right to commence or terminate any waiver and/or reimbursement at any time.
(4) Commenced operations on August 4, 1989
(5) Commenced operations on January 2, 1996
(6) For comparative purposes, average annual since inception returns listed for the Indexes refer to the inception date or initial offering of the respective share class of the Portfolio, not the inception of the Index.
The International Equity Portfolio seeks long-term capital appreciation by investing primarily in equity securities of non-U.S. issuers. Foreign investing involves certain risks, including currency fluctuations and controls, restrictions on foreign investments, less governmental supervision and regulation, less liquidity and the potential for market volatility and political instability.
43
2006 Annual Report |
|
December 31, 2006 |
Investment Overview (cont’d)
International Equity Portfolio
Performance
For the year ended December 31, 2006, the Portfolio had a total return based on net asset value per share of 22.50% for the Class A shares, net of fees, and 22.21% for the Class B shares, net of fees, compared to 26.34% for the Morgan Stanley Capital International (MSCI) EAFE Index (the “Index”).
Factors Affecting Performance
• The Index rose by 3.1% in U.S. dollar terms in December, boosting the quarterly return to 10.4% and bringing the full year gain for the Index to 26.3%. The U.S. dollar depreciated significantly over the course of the year against all major currencies except the Japanese yen. The U.S. dollar fell by 13.1% against the British pound and by 12.1% against the Euro, which boosted the Index’s overall performance by 9.6% for U.S. dollar-based investors. In local currency terms, the Index gained a solid 16.5% for the year, which, while not as spectacular as the 29% local currency performance in 2005, was nonetheless impressive in the context of it following three exceptionally strong years. This performance looks even better on closer examination, as the Index average was dragged down by Japan, up “just” 7.3% (local) following its spectacular rise in 2005. Most European markets were up at least 20% in local currency terms, and any country with some emerging markets exposure, such as Hong Kong (+30.8%) or Singapore (+36.2%), was even stronger. That the United Kingdom was a relative laggard despite a rise of 14.6% (local) says something about the intensity of international market performance in 2006.
• On a sector basis, utilities rose by 49.9% in U.S. dollar terms, reflecting the effect of an outbreak of merger and acquisition activity in Europe, a theme which contributed to the outsize returns in other top-performing sectors such as materials (+33.0%) and the automobile sub-sector (+33.1%). The persistence of low credit risk premium and strong economic growth further helped boost leveraged segments of the market such as real estate (+43.7%), insurance (+30.1%) and banks (+26.7%). Telecommunication services (+30.4%) and consumer staples (+30.0%) also performed well. On the other hand, health care(+18.6%), beset by patent expirations, energy (+17.6%), beset by falling oil prices, and technology (+11.9%) trailed the Index.
Management Strategies
• The Portfolio participated in some of the stronger performing sectors and industries, specifically materials and select utilities, where ourstock selection-buoyed by takeover activity-added significant value. Stock selection was also strong in information technology and consumer discretionary.
• Overall, though, the conservative and defensive nature of the portfolio detracted from overall performance in 2006. The Portfolio underperformed the Index as it lacked exposure to the more cyclical and leveraged stocks in the financial and industrial sectors which had strong performance during the year. In addition, our more defensive stock selection in telecommunications detracted in a market where valuation was not a key factor, and also due to a lack of exposure to names subject to takeover activity. We also increased our exposure to Japan during the year but these additions, primarily Japanese financials, failed to rally in 2006.
• Midyear, the Portfolio’s relative performance improved as some of the macro concerns that we identified earlier in the year began to affect sectors and geographies we believed were overvalued, notably cyclicals, consumer discretionary, Japan and the emerging markets The market regained its risk appetite in the fourth quarter and returned to cyclicals despite a clear deterioration in economic lead indicators.
• After several years of strong performance, economically sensitive sectors (such as material, industrial, technology and financials) account for 67% of the Index. The Portfolio’s exposure to these economically sensitive sectors is currently 45%, and is generally concentrated in less overvalued businesses with more sustainable, and therefore more reliable, free cash flow generation. We continue to be overweight in consumer staples and underweight in financials, particularly banks.
• We believe the problem for value investors today seeking absolute returns is that, unlike 1999 -2000, there are few pools of unexploited value. We continue to search for investment opportunities, particularly in Japan where segments of the market have been de-rated.
• We believe that many companies in certain sectors appear to be close to peak valuation multiples as they have participated in four years of global economic growth. While we may not know when the economic cycle will turn, we do believe the current valuations represent a risk and may not compensate investors for the potential fallout in corporate performance from a slowing global economy. In building the Portfolio, we are cautious of these trends but remain committed to our valuation discipline and focus on quality.
44
| 2006 Annual Report |
|
|
| December 31, 2006 |
Investment Overview (cont’d)
International Equity Portfolio
Expense Examples
As a shareholder of the Portfolio, you may incur two types of costs: (1) transactional costs, including redemption fees; (2) ongoing costs, including management fees, distribution (12b-1) fees (in the case of Class B); and other Portfolio expenses. These examples are intended to help you understand your ongoing costs (in dollars) of investing in the Portfolio and to compare these costs with the ongoing costs of investing in other mutual funds.
The examples are based on an investment of $1,000 invested at the beginning of the six-month period ended December 31, 2006 and held for the entire six-month period.
Actual Expenses
The first line of the tables below provides information about actual account values and actual expenses. You may use the information in this line, together with the amount you invested, to estimate the expenses that you paid over the period. Simply divide your account value by $1,000 (for example, an $8,600 account value divided by $1,000 = 8.6), then multiply the result by the number in the first line under the heading entitled “Expenses Paid During Period” to estimate the expenses you paid on your account during this period.
Please note that “Expenses Paid During Period” are grossed up to reflect Portfolio expenses prior to the effect of Expense Offset (See Note E in the Notes to Financial Statements). Therefore, the annualized net expense ratios may differ from the ratio of the expenses to average net assets shown in the Financial Highlights.
Hypothetical Example for Comparison Purposes
The second line of the tables below provides information about hypothetical account values and hypothetical expenses based on the Portfolio’s actual expense ratio and an assumed rate of return of 5% per year before expenses, which is not the Portfolio’s actual return. The hypothetical account values and expenses may not be used to estimate the actual ending account balance or expenses you paid for the period. You may use this information to compare the ongoing costs of investing in the Portfolio and other funds. To do so, compare this 5% hypothetical example with the 5% hypothetical examples that appear in the shareholder reports of the other funds.
Please note that the expenses shown in the table are meant to highlight your ongoing costs only and do not reflect any transactional costs, such as redemption fees. Therefore, the second line of the table is useful in comparing ongoing costs only, and will not help you determine the relative total costs of owning different funds. In addition, if these transactional costs were included, your costs would have been higher.
|
|
|
|
|
| Expenses Paid |
| |||
|
|
|
| Ending |
| During Period* |
| |||
|
| Beginning |
| Account Value |
| July 1, 2006 — |
| |||
|
| Account Value |
| December 31, |
| December 31, |
| |||
�� |
| July 1, 2006 |
| 2006 |
| 2006 |
| |||
Class A |
|
|
|
|
|
|
| |||
Actual |
| $ | 1,000.00 |
| $ | 1,131.60 |
| $ | 5.05 |
|
Hypothetical (5% average annual return before expenses) |
| 1,000.00 |
| 1,020.47 |
| 4.79 |
| |||
|
|
|
|
|
|
|
| |||
Class B |
|
|
|
|
|
|
| |||
Actual |
| 1,000.00 |
| 1,130.30 |
| 6.39 |
| |||
Hypothetical (5% average annual return before expenses) |
| 1,000.00 |
| 1,019.21 |
| 6.06 |
| |||
* Expenses are equal to Class A and Class B annualized net expense ratios of 0.94% and 1.19%, respectively, multiplied by the average account value over the period, multiplied by 184/365 (to reflect the one-half year period).
Graphic Presentation of Portfolio Holdings
The following graph depicts the Portfolio’s holdings by industry and/or security type, as a percentage of total investments.
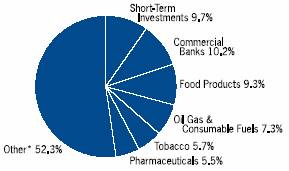
* Industries which do not appear in the above graph, as well as those which represent less than 5% of total investments, if applicable, are included in the category labeled “Other”.
January 2007
45
2006 Annual Report |
|
December 31, 2006 |
Portfolio of Investments
International Equity Portfolio
|
|
|
| Value |
| |
|
| Shares |
| (000) |
| |
Common Stocks (97.7%) |
|
|
|
|
| |
Australia (1.7%) |
|
|
|
|
| |
Foster’s Group Ltd. |
| (c)17,070,122 |
| $ | 93,242 |
|
Orica Ltd. |
| (c)1,378,376 |
| 26,439 |
| |
|
|
|
| 119,681 |
| |
Austria (1.1%) |
|
|
|
|
| |
Telekom Austria AG |
| 2,846,506 |
| 76,278 |
| |
Belgium (2.1%) |
|
|
|
|
| |
Fortis |
| (c)1,940,515 |
| 82,765 |
| |
KBC Groep N.V. |
| 542,257 |
| 66,498 |
| |
|
|
|
| 149,263 |
| |
Canada (0.5%) |
|
|
|
|
| |
EnCana Corp. |
| (c)687,302 |
| 31,626 |
| |
France (7.0%) |
|
|
|
|
| |
BNP Paribas S.A. |
| 769,398 |
| 83,943 |
| |
France Telecom S.A. |
| (c)1,604,329 |
| 44,368 |
| |
Lafarge S.A. |
| 354,478 |
| 52,735 |
| |
Renault S.A. |
| (c)657,284 |
| 78,956 |
| |
Sanofi-Aventis S.A. |
| (c)815,685 |
| 75,318 |
| |
Total S.A. |
| (c)2,204,301 |
| 159,020 |
| |
|
|
|
| 494,340 |
| |
Germany (6.1%) |
|
|
|
|
| |
Bayer AG |
| (c)1,396,659 |
| 74,963 |
| |
Bayerische Motoren Werke AG |
| 1,363,523 |
| 78,314 |
| |
Porsche AG (Non-Voting Shares) |
| 82,234 |
| 104,652 |
| |
RWE AG |
| (c)1,256,767 |
| 138,526 |
| |
Siemens AG (Registered) |
| 365,778 |
| 36,281 |
| |
|
|
|
| 432,736 |
| |
Greece (1.2%) |
|
|
|
|
| |
OPAP S.A. |
| 2,102,620 |
| 81,269 |
| |
Ireland (0.7%) |
|
|
|
|
| |
CRH plc (Dublin Shares) |
| 1,171,467 |
| 48,773 |
| |
Italy (1.6%) |
|
|
|
|
| |
ENI S.p.A. |
| 3,252,900 |
| 109,411 |
| |
Japan (19.9%) |
|
|
|
|
| |
Asatsu-DK, Inc. |
| (c)807,285 |
| 25,642 |
| |
Astellas Pharma, Inc. |
| (c)1,841,500 |
| 83,715 |
| |
Canon, Inc. |
| (c)1,911,100 |
| 107,595 |
| |
Central Japan Railway Co. |
| 10,449 |
| 107,998 |
| |
Dai Nippon Printing Co., Ltd. |
| (c)5,923,000 |
| 91,479 |
| |
JSR Corp. |
| (c)1,187,900 |
| 30,744 |
| |
Kansai Electric Power Co., Inc. (The) |
| 1,451,500 |
| 39,152 |
| |
Kao Corp. |
| (c)5,109,000 |
| 137,808 |
| |
Keyence Corp. |
| 76,900 |
| 19,056 |
| |
Mitsubishi Electric Corp. |
| 11,086,000 |
| 101,167 |
| |
Mitsui Sumitomo Insurance Co., Ltd. |
| (c)6,197,000 |
| 67,800 |
| |
Nitto Denko Corp. |
| (c)705,200 |
| 35,318 |
| |
NTT DoCoMo, Inc. |
| 46,688 |
| 73,756 |
| |
Omron Corp. |
| 1,557,600 |
| 44,239 |
| |
Oriental Land Co., Ltd. |
| (c)926,300 |
| 48,493 |
| |
Osaka Gas Co., Ltd. |
| 9,595,000 |
| 35,718 |
| |
Sega Sammy Holdings, Inc. |
| (c)1,595,000 |
| 43,023 |
| |
Shinsei Bank Ltd. |
| (c)16,100,000 |
| 94,702 |
| |
Sumitomo Mitsui Financial Group, Inc. |
| 10,544 |
| 108,094 |
| |
T&D Holdings, Inc. |
| 1,165,300 |
| 77,063 |
| |
Taiyo Nippon Sanso Corp. |
| (c)2,479,000 |
| 22,331 |
| |
Takefuji Corp. |
| (c)298,590 |
| 11,818 |
| |
|
|
|
| 1,406,711 |
| |
Netherlands (7.2%) |
|
|
|
|
| |
ABN AMRO Holding N.V. |
| 2,040,090 |
| 65,575 |
| |
Akzo Nobel N.V. |
| 990,341 |
| 60,410 |
| |
CSM N.V. CVA |
| 1,348,657 |
| 51,931 |
| |
ING Groep N.V. CVA |
| 1,261,725 |
| 55,946 |
| |
Mittal Steel Co., N.V. |
| (c)1,530,106 |
| 64,594 |
| |
Unilever N.V. CVA |
| 7,616,018 |
| 208,108 |
| |
|
|
|
| 506,564 |
| |
Norway (0.6%) |
|
|
|
|
| |
Norsk Hydro ASA |
| 796,017 |
| 24,703 |
| |
Statoil ASA |
| (c)750,463 |
| 19,890 |
| |
|
|
|
| 44,593 |
| |
Singapore (0.8%) |
|
|
|
|
| |
United Overseas Bank Ltd. |
| 4,671,000 |
| 59,082 |
| |
Spain (1.7%) |
|
|
|
|
| |
Banco Bilbao Vizcaya Argentaria S.A. |
| 2,172,906 |
| 52,319 |
| |
Telefonica S.A. |
| (c)3,150,086 |
| 67,031 |
| |
|
|
|
| 119,350 |
| |
Sweden (2.9%) |
|
|
|
|
| |
SKF AB, Class B |
| (c)2,742,573 |
| 50,677 |
| |
Telefonaktiebolaget LM Ericsson, Class B |
| 38,189,429 |
| 154,243 |
| |
|
|
|
| 204,920 |
| |
Switzerland (8.1%) |
|
|
|
|
| |
Holcim Ltd. (Registered) |
| 1,985,522 |
| 182,013 |
| |
Nestle S.A. (Registered) |
| 628,915 |
| 223,488 |
| |
Novartis AG (Registered) |
| 2,007,839 |
| 115,758 |
| |
UBS AG (Registered) |
| 847,624 |
| 51,511 |
| |
|
|
|
| 572,770 |
| |
United Kingdom (34.5%) |
|
|
|
|
| |
AstraZeneca plc |
| 1,536,802 |
| 82,569 |
| |
BHP Billiton plc |
| 4,478,865 |
| 81,952 |
| |
BP plc |
| 9,990,773 |
| 111,014 |
| |
British American Tobacco plc |
| 6,294,152 |
| 176,109 |
| |
Cadbury Schweppes plc |
| 20,019,128 |
| 214,214 |
| |
Drax Group plc |
| 4,750,867 |
| 75,905 |
| |
GlaxoSmithKline plc |
| 2,493,517 |
| 65,618 |
| |
Hanson plc |
| 1,735,445 |
| 26,182 |
| |
Hays plc |
| 41,769,946 |
| 130,244 |
| |
HSBC Holdings plc |
| 5,494,742 |
| 100,164 |
| |
Imperial Tobacco Group plc |
| 6,309,929 |
| 248,332 |
| |
Intercontinental Hotels Group plc |
| 4,624,814 |
| 114,279 |
| |
Johnston Press plc |
| 3,446,181 |
| 26,484 |
| |
Ladbrokes plc |
| 5,354,671 |
| 43,851 |
| |
National Grid plc |
| 5,153,836 |
| 74,372 |
| |
Northern Rock plc |
| 1,063,282 |
| 24,525 |
| |
Reckitt Benckiser plc |
| 2,931,560 |
| 133,972 |
| |
Reed Elsevier plc |
| 6,139,816 |
| 67,382 |
| |
Rolls-Royce Group plc |
| (a)2,086,523 |
| 18,292 |
| |
Rolls-Royce Group plc, Class B |
| 163,864,839 |
| 324 |
| |
The accompanying notes are an integral part of the financial statements.
46
| 2006 Annual Report |
|
|
| December 31, 2006 |
Portfolio of Investments (cont’d)
International Equity Portfolio
|
|
|
| Value |
| ||
|
| Shares |
| (000) |
| ||
United Kingdom (cont’d) |
|
|
|
|
| ||
Royal Bank of Scotland Group plc |
| 3,835,239 |
| $ | 149,662 |
| |
Royal Dutch Shell plc, Class A |
| 2,855,557 |
| 100,720 |
| ||
Scottish & Southern Energy plc |
| 1,209,922 |
| 36,815 |
| ||
Scottish Power plc |
| 11,334,734 |
| 166,007 |
| ||
Smiths Group plc |
| 4,066,541 |
| 78,946 |
| ||
Vodafone Group plc |
| 31,781,361 |
| 88,053 |
| ||
|
|
|
| 2,435,987 |
| ||
Total Common Stocks (Cost $5,295,776) |
|
|
| 6,893,354 |
| ||
|
|
|
|
|
| ||
|
| Face |
|
|
| ||
|
| Amount |
|
|
| ||
|
| (000) |
|
|
| ||
Short-Term Investments (10.5%) |
|
|
|
|
| ||
Short-Term Debt Securities held as Collateral on Loaned Securities (9.0%) |
|
|
|
|
| ||
Alliance & Leicester plc, |
|
|
|
|
| ||
5.36%, 1/8/07 |
| $ | (h)20,655 |
| 20,655 |
| |
Bancaja, 5.37%, 1/19/07 |
| (h)10,328 |
| 10,328 |
| ||
Bank of America Corp., 5.32%, 1/2/07 |
| (h)33,048 |
| 33,048 |
| ||
Bank of New York Co., Inc., |
|
|
|
|
| ||
5.34%, 1/10/07 |
| (h)10,327 |
| 10,327 |
| ||
Bear Stearns & Co., Inc., |
|
|
|
|
| ||
5.37%, 1/2/07 |
| (h)12,393 |
| 12,393 |
| ||
5.38%, 1/2/07 |
| (h)8,264 |
| 8,264 |
| ||
5.39%, 1/16/07 |
| (h)20,655 |
| 20,655 |
| ||
BNP Paribas plc, |
|
|
|
|
| ||
5.35%, 2/20/07 |
| (h)20,655 |
| 20,655 |
| ||
CIC, New York, |
|
|
|
|
| ||
5.33%, 1/3/07 |
| (h)14,457 |
| 14,457 |
| ||
5.34%, 1/2/07 |
| (h)20,655 |
| 20,655 |
| ||
Dekabank Deutsche Girozentrale, |
|
|
|
|
| ||
5.39%, 1/19/07 |
| (h)21,068 |
| 21,068 |
| ||
Deutsche Bank Securities, Inc., |
|
|
|
|
| ||
5.33%, 1/2/07 |
| 66,280 |
| 66,280 |
| ||
Dexia Bank, New York, |
|
|
|
|
| ||
5.33%, 1/2/07 |
| (h)20,652 |
| 20,652 |
| ||
Gemini Securitization Corp., |
|
|
|
|
| ||
5.34%, 1/2/07 |
| 10,321 |
| 10,321 |
| ||
Goldman Sachs Group, Inc., |
|
|
|
|
| ||
5.40%, 1/16/07 |
| (h)10,328 |
| 10,328 |
| ||
5.42%, 1/2/07 |
| (h)19,416 |
| 19,416 |
| ||
HSBC Finance Corp., 5.34%, 1/8/07 |
| (h)10,328 |
| 10,328 |
| ||
Liberty Lighthouse U.S. Capital, |
|
|
|
|
| ||
5.33%, 1/2/07 |
| (h)10,327 |
| 10,327 |
| ||
Manufacturers & Traders, |
|
|
|
|
| ||
5.33%, 1/16/07 |
| (h)12,393 |
| 12,393 |
| ||
Merrill Lynch & Co., |
|
|
|
|
| ||
5.35%, 1/26/07 |
| (h)10,857 |
| 10,857 |
| ||
Mitsubishi UFJ Financial Group, |
|
|
|
|
| ||
5.33%, 1/2/07 |
| (h)10,328 |
| 10,328 |
| ||
Natexis Banques Populaires, New York, |
|
|
|
|
| ||
5.34%, 1/2/07 |
| (h)20,655 |
| 20,655 |
| ||
5.35%, 1/2/07 |
| (h)10,328 |
| 10,328 |
| ||
National City Bank Cleveland, |
|
|
|
|
| ||
5.32%, 1/2/07 |
| (h)29,948 |
| 29,948 |
| ||
National Rural Utilities Cooperative |
|
|
|
|
| ||
Finance Corp., |
|
|
|
|
| ||
5.34%, 1/2/07 |
| (h)41,310 |
| 41,310 |
| ||
Nationwide Building Society, |
|
|
|
|
| ||
5.44%, 3/28/07 |
| (h)23,960 |
| 23,960 |
| ||
Nordea Bank, New York, |
|
|
|
|
| ||
5.31%, 1/2/07 |
| (h)30,982 |
| 30,982 |
| ||
Rhein-Main Securitisation Ltd., |
|
|
|
|
| ||
5.33%, 1/18/07 |
| 9,752 |
| 9,752 |
| ||
Skandi, NewYork, |
|
|
|
|
| ||
5.34%, 1/9/07 |
| (h)20,655 |
| 20,655 |
| ||
SLM Corp., 5.36%, 1/22/07 |
| (h)20,655 |
| 20,655 |
| ||
Toronto Dominion, New York, |
|
|
|
|
| ||
5.32%, 5/29/07 |
| (h)20,655 |
| 20,655 |
| ||
Tulip Funding, 5.36%, 1/16/07 |
| 11,347 |
| 11,347 |
| ||
Unicredito Italiano Bank (Ireland) plc, |
|
|
|
|
| ||
5.36%, 1/9/07 |
| (h)14,458 |
| 14,458 |
| ||
World Savings Bank FSB, |
|
|
|
|
| ||
5.35%, 1/19/07 |
| (h)7,023 |
| 7,023 |
| ||
|
|
|
| 635,463 |
| ||
Repurchase Agreement (1.5%) |
|
|
|
|
| ||
J.P. Morgan Securities, Inc., 5.20%, dated 12/29/06, due 1/2/07, repurchase price $100,814 |
| (f)100,756 |
| 100,756 |
| ||
Total Short-Term Investments (Cost $736,219) |
|
|
| 736,219 |
| ||
|
|
|
|
|
| ||
Total Investments (108.2%) (Cost $6,031,995) — including $603,724 of Securities Loaned |
|
|
| 7,629,573 |
| ||
Liabilities in Excess of Other Assets (-8.2%) |
|
|
| (575,845 | ) | ||
Net Assets (100%) |
|
|
| $ | 7,053,728 |
| |
(a) Non-income producing security.
(c) All or portion of security on loan at December 31, 2006.
(f) Represents the Portfolio’s undivided interest in a joint repurchase agreement which has a total value of $1,856,998,000. The repurchase agreement was fully collateralized by U.S. government agency securities at the date of this Portfolio of Investments as follows: Federal Farm Credit Bank, 0.00% to 7.43%, due 1/16/07 to 10/23/35; Federal Home Loan Bank, 0.00% to 7.38%, due 1/3/07 to 6/5/28; Federal Home Loan Mortgage Corp., 0.00% to 6.75%, due 1/2/07 to 7/15/32; Federal National Mortgage Association, 0.00% to 8.20%, due 1/12/07 to 11/15/30; Tennessee Valley Authority, 5.38% to 6.75%, due 11/13/08 to 4/1/36, which had a total value of $1,894,142,869. The investment in the repurchase agreement is through participation in a joint account with affiliated parties pursuant to exemptive relief received by the Portfolio from the SEC.
(h) Variable/Floating Rate Security — interest rate changes on these instruments are based on changes in a designated base rate. The rates shown are those in effect on December 31, 2006.
CVA Certificaten Van Aandelen.
The accompanying notes are an integral part of the financial statements.
47
2006 Annual Report |
|
December 31, 2006 |
Portfolio of Investments (cont’d)
International Equity Portfolio
Foreign Currency Exchange Contract Information:
The Portfolio had the following foreign currency exchange contract(s) open at period end:
|
|
|
|
|
|
|
|
|
| Net |
| |||||||
Currency |
|
|
|
|
| In |
|
|
| Unrealized |
| |||||||
to |
|
|
|
|
| Exchange |
|
|
| Appreciation |
| |||||||
Deliver |
| Value |
| Settlement |
| For |
| Value |
| (Depreciation) |
| |||||||
(000) |
| (000) |
| Date |
| (000) |
| (000) |
| (000) |
| |||||||
AUD |
| 4,138 |
| $ | 3,266 |
| 1/3/07 |
| USD |
| 3,267 |
| $ | 3,267 |
| $ | 1 |
|
CAD |
| 1,006 |
| 863 |
| 1/2/07 |
| USD |
| 867 |
| 867 |
| 4 |
| |||
CHF |
| 18,941 |
| 15,544 |
| 1/3/07 |
| USD |
| 15,511 |
| 15,511 |
| (33 | ) | |||
EUR |
| 31,038 |
| 40,972 |
| 1/2/07 |
| USD |
| 40,815 |
| 40,815 |
| (157 | ) | |||
EUR |
| 1,531 |
| 2,021 |
| 1/3/07 |
| USD |
| 2,014 |
| 2,014 |
| (7 | ) | |||
EUR |
| 284 |
| 375 |
| 1/4/07 |
| USD |
| 374 |
| 374 |
| (1 | ) | |||
GBP |
| 133,600 |
| 261,625 |
| 1/24/07 |
| JPY |
| 29,451,986 |
| 248,175 |
| (13,450 | ) | |||
GBP |
| 30,284 |
| 59,296 |
| 1/2/07 |
| USD |
| 59,386 |
| 59,386 |
| 90 |
| |||
GBP |
| 1,687 |
| 3,303 |
| 1/3/07 |
| USD |
| 3,309 |
| 3,309 |
| 6 |
| |||
JPY |
| 16,144,838 |
| 136,043 |
| 1/24/07 |
| GBP |
| 72,400 |
| 141,779 |
| 5,736 |
| |||
JPY |
| 4,268,412 |
| 35,872 |
| 1/5/07 |
| USD |
| 35,893 |
| 35,893 |
| 21 |
| |||
NOK |
| 7,412 |
| 1,189 |
| 1/2/07 |
| USD |
| 1,183 |
| 1,183 |
| (6 | ) | |||
SEK |
| 38,106 |
| 5,566 |
| 1/2/07 |
| USD |
| 5,543 |
| 5,543 |
| (23 | ) | |||
SGD |
| 2,450 |
| 1,598 |
| 1/4/07 |
| USD |
| 1,598 |
| 1,598 |
| @— |
| |||
USD |
| 181 |
| 180 |
| 1/4/07 |
| JPY |
| 21,442 |
| 180 |
| @— |
| |||
|
|
|
| $ | 567,713 |
|
|
|
|
|
|
| $ | 559,894 |
| $ | (7,819 | ) |
AUD | — Australian Dollar |
|
|
CAD | — Canadian Dollar |
|
|
CHF | — Swiss Franc |
|
|
EUR | — Euro |
|
|
GBP | — British Pound |
|
|
JPY | — Japanese Yen |
|
|
NOK | — Norwegian Krone |
|
|
SEK | — Swedish Krona |
|
|
SGD | — Singapore Dollar |
|
|
USD | — United States Dollar |
|
|
@ | — Face Amount/Value is less than $500. |
The accompanying notes are an integral part of the financial statements.
48
| 2006 Annual Report |
|
|
| December 31, 2006 |
Investment Overview (unaudited)
International Growth Equity Portfolio
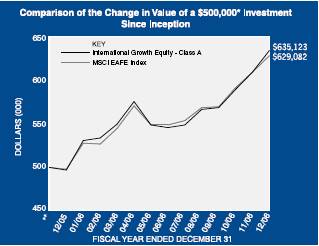
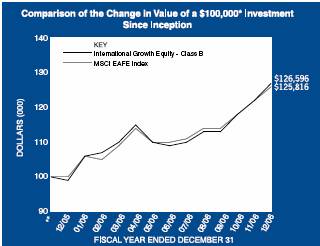
* Minimum Investment
** Commenced operations on December 27, 2005
In accordance with SEC regulations, Portfolio performance shown assumes that all recurring fees (including management fees) were deducted and all dividends and distributions were reinvested.
Performance Compared to the Morgan Stanley Capital International (MSCI) EAFE Index(1)
|
| Total Returns(2) |
| ||
|
|
|
| Average |
|
|
|
|
| Annual |
|
|
| One |
| Since |
|
|
| Year |
| Inception(4) |
|
Portfolio – Class A (3) |
| 27.92 | % | 26.70 | % |
MSCI EAFE Index |
| 26.34 |
| 25.50 |
|
|
|
|
|
|
|
Portfolio – Class B (3) |
| 27.49 |
| 26.27 |
|
MSCI EAFE Index |
| 26.34 |
| 25.50 |
|
Performance data quoted represents past performance, which is no guarantee of future results, and current performance may be lower or higher than the figures shown. Performance assumes that all dividends and distributions, if any, were reinvested. For the most recent month-end performance figures, please visit www.morganstanley.com/im. Investment return and principal value will fluctuate so that Portfolio shares, when redeemed, may be worth more or less than their original cost. Total returns do not reflect the deduction of taxes that a shareholder would pay on Portfolio distributions or the redemption of Portfolio shares.
(1) The Morgan Stanley Capital International (MSCI) EAFE Index (Europe, Australasia, Far East) is a free float-adjusted market capitalization index that is designed to measure developed market equity performance, excluding the U.S. & Canada. The MSCI EAFE Index consists of the following 21 developed market country indices: Australia, Austria, Belgium, Denmark, Finland, France, Germany, Greece, Hong Kong, Ireland, Italy, Japan, the Netherlands, New Zealand, Norway, Portugal, Singapore, Spain, Sweden, Switzerland and the United Kingdom. The Index is unmanaged and its returns do not include any sales charges or fees. Such costs would lower performance. It is not possible to invest directly in an index.
(2) Total returns for the Portfolio reflect fees waived and expenses reimbursed, if applicable, by the Adviser. Without such waivers and/or reimbursements, total returns would have been lower. Fee waivers and/or expense reimbursements are voluntary and the Adviser reserves the right to commence or terminate any waiver and/or reimbursement at any time.
(3) Commenced operations on December 27, 2005
(4) For comparative purposes, average annual since inception returns listed for the Index refer to the inception date or initial offering of the respective share class of the Portfolio, not the inception of the Index.
The International Growth Equity Portfolio seeks long-term capital appreciation, with a secondary objective of income by investing primarily in a diversified portfolio of equity securities of issuers located in countries other than the U.S. Foreign investing involves certain risks, including currency fluctuations and controls, restrictions on foreign investments, less governmental supervision and regulation, less liquidity and the potential for market volatility and political instability.
Performance
For the year ended December 31, 2006, the Portfolio had a total return based on net asset value per share of 27.92%, net of fees, for Class A shares and 27.49%, net of fees, for Class B shares compared to 26.34% for the Morgan Stanley Capital International (MSCI) EAFE Index (the “Index”).
Factors Affecting Performance
• In 2006, performance in the international equity markets was strong, boosted by robust corporate earnings growth and a wave of merger and acquisition activity globally. With the exception of Japan, most major indexes outpaced U.S. markets in U.S. dollar terms-the Index posted a total return of 26.3% vs. 15.8% for the S&P 500® Index for the year.
• After the sharp sell-off in the second quarter, which had been driven primarily by rising inflation, increased valuations, and fears of a slowdown in global economic growth, international equity markets showed convincing
49
2006 Annual Report
December 31, 2006
Investment Overview (cont’d)
International Growth Equity Portfolio
resilience with a strong recovery in the third and fourth quarters. In addition to the sound corporate earnings growth and feverish merger and acquisition activity, the second-half recovery in international markets was supported by the decision of the U.S. Federal Reserve to pause in August after two years of interest-rate tightening, which caused weakness in the U.S. dollar. Investors in foreign shares benefited as the U.S. dollar lost 10.5% vs. the Euro, lost 12.3% vs. the British pound and lost 1.0% vs. the Japanese yen for the year.
• Outperformance in the Portfolio in 2006 can be attributed to selections in Japan, Asia/Pacific ex-Japan, and the emerging markets. The Portfolio’s relative performance in Japan was strong, driven primarily by a real estate developer, an auto manufacturer, and an imaging solutions provider. All three companies, in addition to benefiting from economic growth both globally and in Japan, reported record earnings in 2006 and raised forecasts for future earnings.
• In the Asia/Pacific region, two of the Portfolio’s top performers in 2006 were an electricity generator, which benefited from soaring demand for electricity accompanying China’s economic growth, and an oil equipment manufacturer, which benefited from higher oil prices that have pushed exploration companies to take longer-term leases on drilling rigs.
• Within the Portfolio’s emerging market exposure, holdings in Mexico included a dominant retailer and one of Latin America’s largest mobile-phone companies, both of which continued to expand during the period and contributed considerable gains.
• Although the Portfolio performed well on a relative basis in Europe in the fourth quarter, performance lagged slightly in the region for the year due to an underweight in the United Kingdom (U.K.), where the FTSE 100 Index is near a six-year high.
• For the year, absolute sector benchmark returns performed mostly in a narrow range of 18.6% to 33.0%. Notable exceptions were the outperformance of the utilities sector, up 49.9% for the year, and the underperformance of the information technology sector, up 14.7%.
• The Portfolio outperformed on a relative basis in six of the10 Index sectors, led by the outsized gains in the industrials sector. The Portfolio underperformed in the materials sector due to lower than benchmark exposure to this sector and limited exposure to steel companies whose share prices rose on increased mergers and acquisitions activity.
Management Strategies
• The surprises in 2006 were the strong equity markets and economic performance on a global scale, particularly in Europe, where profits have risen at least 14% annually for the past three years; in Japan, where the economic expansion is on course to be its longest in half a century according to the Organization for Economic Co-operation and Development (OECD); and in the emerging markets, where gross domestic product (GDP) was estimated to be 5.4% in 2006.
• Enthusiasm for sustained rapid global growth, however, is muted as the European Central Bank (ECB) raised its key interest rate to a four-year high of 3.5% in December, and central banks in the U.K., Japan, and emerging markets such as India and China initiated rate hikes in 2006. And, rate increases may continue: according to the median forecast of 16 economists surveyed by Bloomberg in December, ECB interest rates will rise to 4.0% by the third quarter of 2007. Higher borrowing costs will translate into higher costs of capital which could slow spending and eventually temper corporate earnings globally.
• Given the leadership of value-oriented and lower-quality stocks in the lower interest rate environment of the past few years, we believe investors may soon focus on higher-quality, lower-leveraged companies with strong balance sheets as rates move higher.
• Given our emphasis on building diversified portfolios across regions, and investing in higher-quality, growth companies, we believe the Portfolio is well positioned for the possible market rotation and forecasted global economic slowdown.
Expense Examples
As a shareholder of the Portfolio, you may incur two types of costs: (1) transactional costs, including redemption fees; (2) ongoing costs, including management fees, distribution (12b-1) fees (in the case of Class B); and other Portfolio expenses. These examples are intended to help you understand your ongoing costs (in dollars) of investing in the Portfolio and to compare these costs with the ongoing costs of investing in other mutual funds.
The examples are based on an investment of $1,000 invested at the beginning of the six-month period ended December 31, 2006 and held for the entire six-month period.
Actual Expenses
The first line of the tables below provides information about actual account values and actual expenses. You may use the information in this line, together with the amount you
50
| 2006 Annual Report |
|
|
| December 31, 2006 |
Investment Overview (cont’d)
International Growth Equity Portfolio
invested, to estimate the expenses that you paid over the period. Simply divide your account value by $1,000 (for example, an $8,600 account value divided by $1,000 = 8.6), then multiply the result by the number in the first line under the heading entitled “Expenses Paid During Period” to estimate the expenses you paid on your account during this period.
Please note that “Expenses Paid During Period” are grossed up to reflect Portfolio expenses prior to the effect of Expense Offset (See Note E in the Notes to Financial Statements). Therefore, the annualized net expense ratios may differ from the ratio of the expenses to average net assets shown in the Financial Highlights.
Hypothetical Example for Comparison Purposes
The second line of the tables below provides information about hypothetical account values and hypothetical expenses based on the Portfolio’s actual expense ratio and an assumed rate of return of 5% per year before expenses, which is not the Portfolio’s actual return. The hypothetical account values and expenses may not be used to estimate the actual ending account balance or expenses you paid for the period. You may use this information to compare the ongoing costs of investing in the Portfolio and other funds. To do so, compare this 5% hypothetical example with the 5% hypothetical examples that appear in the shareholder reports of the other funds.
Please note that the expenses shown in the table are meant to highlight your ongoing costs only and do not reflect any transactional costs, such as redemption fees. Therefore, the second line of the table is useful in comparing ongoing costs only, and will not help you determine the relative total costs of owning different funds. In addition, if these transactional costs were included, your costs would have been higher.
|
|
|
|
|
| Expenses Paid |
| |||
|
|
|
| Ending Account |
| During Period* |
| |||
|
| Beginning |
| Value |
| July 1, 2006 — |
| |||
|
| Account Value |
| December 31, |
| December 31, |
| |||
|
| July 1, 2006 |
| 2006 |
| 2006 |
| |||
Class A |
|
|
|
|
|
|
| |||
Actual |
| $ | 1,000.00 |
| $ | 1,164.30 |
| $ | 5.62 |
|
Hypothetical (5% average annual return before expenses) |
| 1,000.00 |
| 1,020.01 |
| 5.24 |
| |||
|
|
|
|
|
|
|
| |||
Class B |
|
|
|
|
|
|
| |||
Actual |
| 1,000.00 |
| 1,162.50 |
| 7.09 |
| |||
Hypothetical (5% average annual return before expenses) |
| 1,000.00 |
| 1,018.65 |
| 6.61 |
| |||
* Expenses are equal to Class A and Class B annualized net expense ratios of 1.03% and 1.30%, respectively, multiplied by the average account value over the period, multiplied by 184/365 (to reflect the one-half year period).
Graphic Presentation of Portfolio Holdings
The following graph depicts the Portfolio’s holdings by industry and/or security type, as a percentage of total investments.

* Industries which do not appear in the above graph, as well as those which represent less than 5% of total investments, if applicable, are included in the category labeled “Other”.
January 2007
51
2006 Annual Report
December 31, 2006
Portfolio of Investments
International Growth Equity Portfolio
|
|
|
| Value |
| |
|
| Shares |
| (000) |
| |
Common Stocks (99.9%) |
|
|
|
|
| |
Australia (1.6%) |
|
|
|
|
| |
BHP Billiton Ltd. |
| 5,601 |
| $ | 112 |
|
Austria (4.4%) |
|
|
|
|
| |
Andritz AG |
| 469 |
| 102 |
| |
Erste Bank der Oesterreichischen Sparkassen |
|
|
|
|
| |
AG |
| 1,625 |
| 125 |
| |
Telekom Austria AG |
| 3,065 |
| 82 |
| |
|
|
|
| 309 |
| |
Canada (1.3%) |
|
|
|
|
| |
EnCana Corp. |
| 2,075 |
| 95 |
| |
China (3.8%) |
|
|
|
|
| |
China Resources Power Holdings Co. |
| 70,000 |
| 106 |
| |
CNOOC Ltd. |
| 92,700 |
| 88 |
| |
Parkson Retail Group Ltd |
| 14,700 |
| 73 |
| |
|
|
|
| 267 |
| |
Finland (4.2%) |
|
|
|
|
| |
Fortum Oyj |
| 4,590 |
| 130 |
| |
Kone Oyj, Class B |
| 1,600 |
| 91 |
| |
Neste Oil Oyj |
| 2,400 |
| 73 |
| |
|
|
|
| 294 |
| |
France (10.2%) |
|
|
|
|
| |
AXA S.A. |
| 2,804 |
| 113 |
| |
BNP Paribas S.A. |
| 1,026 |
| 112 |
| |
Cie Generale d’Optique Essilor International S.A. |
| 783 |
| 84 |
| |
LVMH Moet Hennessy Louis Vuitton S.A. |
| 766 |
| 81 |
| |
Schneider Electric S.A. |
| 774 |
| 86 |
| |
Total S.A. |
| 2,115 |
| 153 |
| |
Vallourec |
| 318 |
| 92 |
| |
|
|
|
| 721 |
| |
Germany (8.7%) |
|
|
|
|
| |
Celesio AG |
| 1,600 |
| 86 |
| |
Continental AG |
| 1,127 |
| 131 |
| |
Deutsche Bank AG (Registered) |
| 800 |
| 107 |
| |
E. ON AG |
| 1,009 |
| 137 |
| |
Porsche AG (Preferred) |
| 50 |
| 64 |
| |
SAP AG |
| 1,648 |
| 87 |
| |
|
|
|
| 612 |
| |
Greece (2.8%) |
|
|
|
|
| |
Coca-Cola Hellenic Bottling Co. S.A. |
| 2,426 |
| 95 |
| |
National Bank of Greece S.A. |
| 2,232 |
| 103 |
| |
|
|
|
| 198 |
| |
Hong Kong (1.7%) |
|
|
|
|
| |
Esprit Holdings Ltd. |
| 11,000 |
| 123 |
| |
India (2.6%) |
|
|
|
|
| |
Bharti Airtel Ltd. |
| (a)5,400 |
| 79 |
| |
ICICI Bank Ltd. ADR |
| 2,500 |
| 104 |
| |
|
|
|
| 183 |
| |
Ireland (5.1%) |
|
|
|
|
| |
Allied Irish Banks plc |
| 3,485 |
| 103 |
| |
Anglo Irish Bank Corp. plc |
| 7,800 |
| 162 |
| |
CRH plc (Dublin Shares) |
| 2,248 |
| 94 |
| |
|
|
|
| 359 |
| |
Israel (0.9%) |
|
|
|
|
| |
Teva Pharmaceutical Industries Ltd. ADR |
| 2,000 |
| 62 |
| |
Japan (17.5%) |
|
|
|
|
| |
Canon, Inc. |
| 2,000 |
| 113 |
| |
Casio Computer Co., Ltd. |
| 4,000 |
| 91 |
| |
Credit Saison Co., Ltd. |
| 1,900 |
| 65 |
| |
Daiwa Securities Group, Inc. |
| 7,000 |
| 79 |
| |
Hoya Corp. |
| 2,300 |
| 90 |
| |
Kobe Steel Ltd. |
| 22,000 |
| 75 |
| |
Kubota Corp. |
| 9,000 |
| 83 |
| |
ORIX Corp. |
| 300 |
| 87 |
| |
Sharp Corp. |
| 5,000 |
| 86 |
| |
Shin-Etsu Chemical Co., Ltd. |
| 1,200 |
| 80 |
| |
Sumitomo Realty & Development Co., Ltd. |
| 4,000 |
| 128 |
| |
Terumo Corp. |
| 2,200 |
| 87 |
| |
Toray Industries, Inc. |
| 11,000 |
| 82 |
| |
Toyota Motor Corp. |
| 1,400 |
| 94 |
| |
|
|
|
| 1,240 |
| |
Mexico (2.6%) |
|
|
|
|
| |
America Movil S.A. de C.V., Class L ADR |
| 1,900 |
| 86 |
| |
Wal-Mart de Mexico S.A. de C.V. ADR |
| 2,279 |
| 100 |
| |
|
|
|
| 186 |
| |
Netherlands (4.4%) |
|
|
|
|
| |
ING Groep N.V. CVA |
| 3,260 |
| 145 |
| |
Reed Elsevier N.V. |
| 4,303 |
| 73 |
| |
Royal Numico N.V. |
| 1,740 |
| 94 |
| |
|
|
|
| 312 |
| |
Norway (3.0%) |
|
|
|
|
| |
Telenor ASA |
| 6,568 |
| 124 |
| |
TGS Nopec Geophysical Co. ASA |
| (a)4,400 |
| 91 |
| |
|
|
|
| 215 |
| |
Singapore (2.4%) |
|
|
|
|
| |
DBS Group Holdings Ltd. |
| 5,000 |
| 74 |
| |
Keppel Corp., Ltd. |
| 8,500 |
| 97 |
| |
|
|
|
| 171 |
| |
South Korea (1.1%) |
|
|
|
|
| |
Samsung Electronics Co., Ltd. GDR (Registered) |
| (e)239 |
| 79 |
| |
Spain (1.2%) |
|
|
|
|
| |
Banco Popular Espanol S.A. |
| 4,845 |
| 88 |
| |
Sweden (2.6%) |
|
|
|
|
| |
Getinge AB, Class B |
| 4,699 |
| 105 |
| |
Telefonaktiebolaget LM Ericsson, Class B |
| 20,000 |
| 81 |
| |
|
|
|
| 186 |
| |
Switzerland (6.6%) |
|
|
|
|
| |
ABB Ltd. (Registered) |
| 6,000 |
| 107 |
| |
Nestle S.A. (Registered) |
| 300 |
| 107 |
| |
Novartis AG (Registered) |
| 1,322 |
| 76 |
| |
Roche Holding AG (Genusschein) |
| 450 |
| 81 |
| |
SGS S.A. (Registered) |
| 87 |
| 97 |
| |
|
|
|
| 468 |
| |
Turkey (1.0%) |
|
|
|
|
| |
Akbank TAS ADR |
| 5,704 |
| 69 |
| |
The accompanying notes are an integral part of the financial statements.
52
| 2006 Annual Report |
|
|
| December 31, 2006 |
Portfolio of Investments (cont’d)
International Growth Equity Portfolio
|
|
|
| Value |
| |
|
| Shares |
| (000) |
| |
United Kingdom (10.2%) |
|
|
|
|
| |
Barclays plc |
| 6,331 |
| $ | 91 |
|
Capita Group plc |
| 8,140 |
| 97 |
| |
HSBC Holdings plc |
| 3,913 |
| 71 |
| |
Prudential plc |
| 6,822 |
| 93 |
| |
Reckitt Benckiser plc |
| 1,827 |
| 83 |
| |
Royal Bank of Scotland Group plc |
| 2,364 |
| 92 |
| |
SABMiller plc |
| 4,264 |
| 98 |
| |
Tesco plc |
| 12,321 |
| 98 |
| |
|
|
|
| 723 |
| |
Total Common Stocks (Cost $5,726) |
|
|
| 7,072 |
| |
Total Investments (99.9%) (Cost $5,726) |
|
|
| 7,072 |
| |
Other Assets in Excess of Liabilities (0.1%) |
|
|
| 6 |
| |
Net Assets (100%) |
|
|
| $ | 7,078 |
|
(a) | Non-income producing security. |
|
|
(e) | 144A security — certain conditions for public sale may exist. Unless otherwise noted, these securities are deemed to be liquid. |
|
|
ADR | American Depositary Receipts |
|
|
CVA | Certificaten Van Aandelen |
|
|
GDR | Global Depositary Receipts |
The accompanying notes are an integral part of the financial statements.
53
2006 Annual Report |
|
|
|
December 31, 2006 |
|
Investment Overview (unaudited)
International Magnum Portfolio

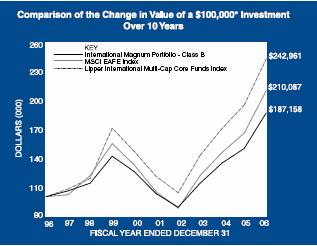
* Minimum Investment
In accordance with SEC regulations, Portfolio performance shown assumes that all recurring fees (including management fees) were deducted and all dividends and distributions were reinvested.
Performance Compared to the Morgan Stanley Capital International (MSCI) EAFE Index(1) and the Lipper International Multi-Cap Core Funds Index(2)
|
| Total Returns(3) |
| ||||||
|
|
|
| Average Annual |
| ||||
|
| One |
| Five |
| Ten |
| Since |
|
|
| Year |
| Years |
| Years |
| Inception(5) |
|
Portfolio – Class A (4) |
| 25.39 | % | 13.08 | % | 6.75 | % | 7.02 | % |
MSCI EAFE Index |
| 26.34 |
| 14.98 |
| 7.71 |
| 7.73 |
|
Lipper International Multi-Cap Core Funds Index |
| 24.89 |
| 14.87 |
| 9.28 |
| 9.79 |
|
|
|
|
|
|
|
|
|
|
|
Portfolio – Class B (4) |
| 25.10 |
| 12.78 |
| 6.47 |
| 6.73 |
|
MSCI EAFE Index |
| 26.34 |
| 14.98 |
| 7.71 |
| 7.73 |
|
Lipper International Multi-Cap Core Funds Index |
| 24.89 |
| 14.87 |
| 9.28 |
| 9.79 |
|
Performance data quoted represents past performance, which is no guarantee of future results, and current performance may be lower or higher than the figures shown. Performance assumes that all dividends and distributions, if any, were reinvested. For the most recent month-end performance figures, please visit www.morganstanley.com/im. Investment return and principal value will fluctuate so that Portfolio shares, when redeemed, may be worth more or less than their original cost. Total returns do not reflect the deduction of taxes that a shareholder would pay on Portfolio distributions or the redemption of Portfolio shares.
(1) The Morgan Stanley Capital International (MSCI) EAFE Index (Europe, Australasia, Far East) is a free float-adjusted market capitalization index that is designed to measure developed market equity performance, excluding the U.S. & Canada. The MSCI EAFE Index consists of the following 21 developed market country indices: Australia, Austria, Belgium, Denmark, Finland, France, Germany, Greece, Hong Kong, Ireland, Italy, Japan, the Netherlands, New Zealand, Norway, Portugal, Singapore, Spain, Sweden, Switzerland and the United Kingdom. The Index is unmanaged and its returns do not include any sales charges or fees. Such costs would lower performance. It is not possible to invest directly in an index.
(2) The Lipper International Multi-Cap Core Funds Index is an equally weighted performance index of the largest qualifying funds (based on net assets) in the Lipper International Multi-Cap Core Funds classification. The Index, which is adjusted for capital gains distributions and income dividends, is unmanaged and should not be considered an investment. There are currently 30 funds represented in this Index. As of the date of this report, the Portfolio is in the Lipper International Multi-Cap Core Funds classification.
(3) Total returns for the Portfolio reflect fees waived and expenses reimbursed, if applicable, by the Adviser. Without such waivers and/or reimbursements, total returns would have been lower. Fee waivers and/or expense reimbursements are voluntary and the Adviser reserves the right to commence or terminate any waiver and/or reimbursement at any time.
(4) Commenced operations on March 15, 1996
(5) For comparative purposes, average annual since inception returns listed for the Indexes refer to the inception date or initial offering of the respective share class of the Portfolio, not the inception of the Index.
The International Magnum Portfolio seeks long-term capital appreciation by investing primarily in equity securities of non-U.S. issuers domiciled in EAFE countries. Foreign investing involves certain risks, including currency fluctuations and controls, restrictions on foreign investments, less governmental supervision and regulation, less liquidity and the potential for market volatility and political instability.
54
| 2006 Annual Report |
|
|
| December 31, 2006 |
Investment Overview (cont’d)
International Magnum Portfolio
Performance
For the year ended December 31, 2006, the Portfolio had a total return based on net asset value per share of 25.39%, net of fees, for the Class A shares and 25.10%, net of fees, for the Class B shares compared to 26.34% for the Morgan Stanley Capital International (MSCI) EAFE Index (the “Index”).
Factors Affecting Performance
• It has been another stellar year for financial markets, and December was no exception. Even though economically speaking, markets have been haunted by the U.S. slowdown and its potential impact on the global picture, stocks have rallied to all-time highs. The S&P 500® Index is up over 14% this year, while Eurozone stocks have risen even faster. Although Japan’s market stalled a bit, the rest of Asia and the emerging markets put in another impressive financial year.
• The Portfolio had strong absolute returns in 2006, but slightly lagged the Index. The primary cause of the underperformance during the year was security selection within Europe. Notable detractors included the Portfolio’s underweight to and security selection within the materials and utilities sectors, as well as security selection within the consumer discretionary sector.
• Secondary causes of underperformance can be attributed to the Portfolio’s underweight to Europe, which had surprisingly strong performance in 2006.
Management Strategies
• At the beginning of 2006, we believed the coming year would see an end to the trend of “value” outperformance and a rotation into more growth oriented industries. Therefore, during the first quarter, we implemented a strategic shift in the Portfolio by adding an explicit allocation to international growth securities.
• The Portfolio remains split equally between growth and value securities. The shift into more growth-oriented stocks at the beginning of 2006 started to pay off during the second half of the year as investors began to focus on higher-quality, less-leveraged companies with strong balance sheets. Given our emphasis on building diversified portfolios across regions and investing in higher quality, growth companies, we believe the Portfolio is well positioned for a possible market rotation and forecasted global economic slowdown.
• Within Europe, the Portfolio is overweight to the Eurozone and underweight to the United Kingdom (U.K.) We prefer the Eurozone to the U.K. because the Eurozone region appears to be enjoying a “Goldilocks” recovery, with business and consumer confidence soaring to a five-year high and inflation falling to its lowest level in over two years. Although economic data in the U.K. has been somewhat mixed of late, the housing market is still painting a bullish picture. Other reports showed that unemployment unexpectedly fell in November and consumer price inflation accelerated to the highest level in a decade. We believe that valuations remain expensive for U.K. companies, particularly within the financial sector. Therefore, we continue to maintain an underweight to the U.K.
• The Portfolio is neutrally weighted to Japan. Japanese economic data has been disappointing, heightening concerns of Japan’s economic recovery stalling in the first half of 2007. By our measures, Japan’s equity market now appears expensively valued relative to other developed regions. Moreover, in terms of fundamentals, recent economic data have been weak.
• Fundamentals remain promising for emerging markets given current account surpluses, higher savings rates, improved debt management, and favorable relative valuations. Therefore, we have maintained the Portfolio’s opportunistic allocation to the emerging markets.
• Within industries, we are maintaining the Portfolio’s overweight to insurance, capital goods, technology hardware and equipment, and consumer durables and apparel. Conversely, we are underweight to banks (particularly in Japan), utilities and energy.
Expense Examples
As a shareholder of the Portfolio, you may incur two types of costs: (1) transactional costs, including redemption fees; (2) ongoing costs, including management fees, distribution (12b-1) fees (in the case of Class B); and other Portfolio expenses. These examples are intended to help you understand your ongoing costs (in dollars) of investing in the Portfolio and to compare these costs with the ongoing costs of investing in other mutual funds.
The examples are based on an investment of $1,000 invested at the beginning of the six-month period ended December 31, 2006 and held for the entire six-month period.
Actual Expenses
The first line of the tables below provides information about actual account values and actual expenses. You may use the information in this line, together with the amount you invested, to estimate the expenses that you paid over the
55
| 2006 Annual Report |
|
|
| December 31, 2006 |
Investment Overview (cont’d)
International Magnum Portfolio
period. Simply divide your account value by $1,000 (for example, an $8,600 account value divided by $1,000 = 8.6), then multiply the result by the number in the first line under the heading entitled “Expenses Paid During Period” to estimate the expenses you paid on your account during this period.
Please note that “Expenses Paid During Period” are grossed up to reflect Portfolio expenses prior to the effect of Expense Offset (See Note E in the Notes to Financial Statements). Therefore, the annualized net expense ratios may differ from the ratio of the expenses to average net assets shown in the Financial Highlights.
Hypothetical Example for Comparison Purposes
The second line of the tables below provides information about hypothetical account values and hypothetical expenses based on the Portfolio’s actual expense ratio and an assumed rate of return of 5% per year before expenses, which is not the Portfolio’s actual return. The hypothetical account values and expenses may not be used to estimate the actual ending account balance or expenses you paid for the period. You may use this information to compare the ongoing costs of investing in the Portfolio and other funds. To do so, compare this 5% hypothetical example with the 5% hypothetical examples that appear in the shareholder reports of the other funds.
Please note that the expenses shown in the table are meant to highlight your ongoing costs only and do not reflect any transactional costs, such as redemption fees. Therefore, the second line of the table is useful in comparing ongoing costs only, and will not help you determine the relative total costs of owning different funds. In addition, if these transactional costs were included, your costs would have been higher.
|
|
|
|
|
| Expenses Paid |
| |||
|
|
|
| Ending Account |
| During Period* |
| |||
|
| Beginning |
| Value |
| July 1, 2006 — |
| |||
|
| Account Value |
| December 31, |
| December 31, |
| |||
|
| July 1, 2006 |
| 2006 |
| 2006 |
| |||
Class A |
|
|
|
|
|
|
| |||
Actual |
| $ | 1,000.00 |
| $ | 1,158.60 |
| $ | 5.44 |
|
Hypothetical (5% average annual return before expenses) |
| 1,000.00 |
| 1,020.16 |
| 5.09 |
| |||
|
|
|
|
|
|
|
| |||
Class B |
|
|
|
|
|
|
| |||
Actual |
| 1,000.00 |
| 1,156.50 |
| 6.79 |
| |||
Hypothetical (5% average annual return before expenses) |
| 1,000.00 |
| 1,018.90 |
| 6.36 |
| |||
* Expenses are equal to Class A and Class B annualized net expense ratios of 1.00% and 1.25%, respectively, multiplied by the average account value over the period, multiplied by 184/365 (to reflect the one-half year period).
Graphic Presentation of Portfolio Holdings
The following graph depicts the Portfolio’s holdings by industry and/or security type, as a percentage of total investments.
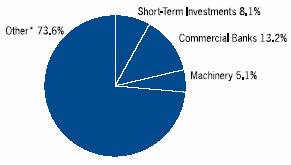
* Industries which do not appear in the above graph, as well as those which represent less than 5% of total investments, if applicable, are included in the category labeled “Other”.
January 2007
56
| 2006 Annual Report |
|
|
| December 31, 2006 |
Portfolio of Investments
International Magnum Portfolio
|
|
|
| Value |
| |
|
| Shares |
| (000) |
| |
Common Stocks (99.3%) |
|
|
|
|
| |
Australia (2.7%) |
|
|
|
|
| |
AMP Ltd. |
| 43,550 |
| $ | 347 |
|
Australia & New Zealand Banking Group Ltd. |
| (c)6,108 |
| 136 |
| |
BHP Billiton Ltd. |
| 74,470 |
| 1,487 |
| |
Guns Ltd. |
| (c)30,100 |
| 70 |
| |
National Australia Bank Ltd. |
| 3,930 |
| 126 |
| |
Newcrest Mining Ltd. |
| 3,500 |
| 73 |
| |
QBE Insurance Group Ltd. |
| 8,950 |
| 204 |
| |
Rio Tinto Ltd. |
| (c)5,900 |
| 346 |
| |
Telstra Corp Ltd. |
| (a)118,321 |
| 251 |
| |
Westpac Banking Corp. |
| 8,500 |
| 163 |
| |
|
|
|
| 3,203 |
| |
Austria (2.8%) |
|
|
|
|
| |
Andritz AG |
| 4,401 |
| 955 |
| |
Erste Bank der Oesterreichischen Sparkassen AG |
| 15,950 |
| 1,223 |
| |
Telekom Austria AG |
| 40,784 |
| 1,093 |
| |
|
|
|
| 3,271 |
| |
Belgium (1.0%) |
|
|
|
|
| |
AGFA-Geared N.V. |
| 11,710 |
| 299 |
| |
Solvay S.A., Class A |
| 2,706 |
| 415 |
| |
Unicode |
| 2,370 |
| 404 |
| |
|
|
|
| 1,118 |
| |
Finland (2.3%) |
|
|
|
|
| |
Fortum Oyj |
| 39,352 |
| 1,120 |
| |
Kone Oyj, Class B |
| 17,400 |
| 986 |
| |
Neste Oil Oyj |
| (c)20,300 |
| 617 |
| |
|
|
|
| 2,723 |
| |
France (11.4%) |
|
|
|
|
| |
AXA S.A. |
| 24,554 |
| 994 |
| |
BNP Paribas S.A. |
| 18,665 |
| 2,036 |
| |
Cie Generale d’Optique Essilor International S.A. |
| 8,018 |
| 862 |
| |
Electricite De France |
| 9,808 |
| 715 |
| |
France Telecom S.A. |
| 29,680 |
| 821 |
| |
Gaz de France |
| (c)15,142 |
| 697 |
| |
Lafarge S.A. |
| 5,305 |
| 789 |
| |
LVMH Moet Hennessy Louis Vuitton S.A. |
| 6,721 |
| 709 |
| |
Renault S.A. |
| (c)3,017 |
| 362 |
| |
Sanofi-Aventis S.A. |
| 7,431 |
| 686 |
| |
Schneider Electric S.A. |
| (c)14,538 |
| 1,614 |
| |
Total S.A. |
| 32,665 |
| 2,357 |
| |
Vallourec |
| 2,707 |
| 787 |
| |
|
|
|
| 13,429 |
| |
Germany (8.9%) |
|
|
|
|
| |
Allianz AG (Registered) |
| 4,734 |
| 967 |
| |
AWD Holding AG |
| (c)9,115 |
| 385 |
| |
Bayerische Motoren Werke AG |
| 9,691 |
| 557 |
| |
Celesio AG |
| 15,356 |
| 824 |
| |
Commerzbank AG |
| 13,438 |
| 512 |
| |
Continental AG |
| 11,355 |
| 1,320 |
| |
DaimlerChrysler AG |
| 5,816 |
| 359 |
| |
Deutsche Bank AG (Registered) |
| 7,014 |
| 938 |
| |
E. ON AG |
| 9,306 |
| 1,263 |
| |
Fresenius Medical Care AG |
| 2,811 |
| 375 |
| |
MAN AG |
| 3,920 |
| 354 |
| |
Muenchener Rueckversicherungs AG (Registered) |
| 4,703 |
| 810 |
| |
Porsche AG (Preferred) |
| 600 |
| 764 |
| |
SAP AG |
| 14,436 |
| 767 |
| |
Siemens AG (Registered) |
| 3,801 |
| 377 |
| |
|
|
|
| 10,572 |
| |
Greece (2.3%) |
|
|
|
|
| |
Coca-Cola Hellenic Bottling Co. S.A. |
| 19,667 |
| 768 |
| |
EFG Eurobank Ergasias S.A. |
| 13,312 |
| 482 |
| |
National Bank of Greece S.A. |
| 32,353 |
| 1,491 |
| |
|
|
|
| 2,741 |
| |
Hong Kong (4.0%) |
|
|
|
|
| |
BOC Hong Kong Holdings Ltd. |
| 46,000 |
| 125 |
| |
Cheung Kong Holdings Ltd. |
| 11,000 |
| 135 |
| |
China Resources Power Holdings Co. |
| (c)594,000 |
| 897 |
| |
CNOOC Ltd. |
| 772,000 |
| 733 |
| |
Dah Sing Financial Holdings Ltd. |
| 4,800 |
| 43 |
| |
Esprit Holdings Ltd. |
| (e)108,800 |
| 1,215 |
| |
Great Eagle Holdings Ltd. |
| 91,000 |
| 262 |
| |
Hutchison Whampoa Ltd. |
| 12,000 |
| 122 |
| |
Hysan Development Co., Ltd. |
| 81,000 |
| 212 |
| |
New World Development Ltd. |
| 192,000 |
| 387 |
| |
Parkson Retail Group Ltd. |
| (e)124,200 |
| 615 |
| |
Techtronic Industries Co. |
| 24,000 |
| 31 |
| |
|
|
|
| 4,777 |
| |
India (1.4%) |
|
|
|
|
| |
Bharti Airtel Ltd. |
| (a)48,700 |
| 714 |
| |
ICICI Bank Ltd. ADR |
| 21,500 |
| 897 |
| |
|
|
|
| 1,611 |
| |
Ireland (2.5%) |
|
|
|
|
| |
Allied Irish Banks plc |
| 30,627 |
| 910 |
| |
Anglo Irish Bank Corp. plc |
| 61,618 |
| 1,273 |
| |
CRH plc (Dublin Shares) |
| 19,747 |
| 822 |
| |
|
|
|
| 3,005 |
| |
Israel (0.5%) |
|
|
|
|
| |
Teva Pharmaceutical Industries Ltd. ADR |
| 17,600 |
| 547 |
| |
Italy (1.3%) |
|
|
|
|
| |
Intesa Sanpaolo S.p.A. |
| 56,076 |
| 433 |
| |
Banca Monte dei Paschi di Siena S.p.A. |
| (c)81,654 |
| 528 |
| |
UniCredito Italiano S.p.A. |
| 71,534 |
| 627 |
| |
|
|
|
| 1,588 |
| |
Japan (22.1%) |
|
|
|
|
| |
Amada Co., Ltd. |
| 19,000 |
| 201 |
| |
Astellas Pharma, Inc. |
| (c)6,900 |
| 314 |
| |
Canon, Inc. |
| 28,200 |
| 1,588 |
| |
Casio Computer Co., Ltd. |
| (c)49,100 |
| 1,114 |
| |
Credit Saison Co., Ltd. |
| (c)12,000 |
| 413 |
| |
Dai Nippon Printing Co., Ltd. |
| (c)12,000 |
| 185 |
| |
Daicel Chemical Industries Ltd. |
| (c)31,000 |
| 219 |
| |
Daifuku Co., Ltd. |
| (c)15,000 |
| 238 |
| |
Daiichi Sankyo Co., Ltd. |
| 11,000 |
| 344 |
| |
Daikin Industries Ltd. |
| (c)9,400 |
| 327 |
| |
Daiwa Securities Group, Inc. |
| 64,000 |
| 718 |
| |
The accompanying notes are an integral part of the financial statements.
57
2006 Annual Report |
|
|
|
December 31, 2006 |
|
Portfolio of Investments (cont’d)
International Magnum Portfolio
|
|
|
| Value |
| |
|
| Shares |
| (000) |
| |
Japan (cont’d) |
|
|
|
|
| |
Denki Kagaku Kogyo K.K. |
| 50,000 |
| $ | 208 |
|
East Japan Railway Co. |
| 31 |
| 207 |
| |
FamilyMart Co., Ltd. |
| 7,400 |
| 201 |
| |
Fuji Machine Manufacturing Co., Ltd. |
| 3,600 |
| 69 |
| |
Fuji Photo Film Co., Ltd. |
| 7,900 |
| 325 |
| |
Fujitec Co., Ltd. |
| 12,000 |
| 92 |
| |
Fujitsu Ltd. |
| 46,000 |
| 361 |
| |
Furukawa Electric Co., Ltd. |
| 38,000 |
| 239 |
| |
Hitachi Capital Corp. |
| 10,100 |
| 193 |
| |
Hitachi High-Technologies Corp. |
| 3,900 |
| 116 |
| |
Hitachi Ltd. |
| 45,000 |
| 281 |
| |
House Foods Corp. |
| 5,100 |
| 84 |
| |
Hoya Corp. |
| 19,500 |
| 760 |
| |
Kaneka Corp. |
| 24,000 |
| 219 |
| |
Kobe Steel Ltd. |
| 206,000 |
| 706 |
| |
Kubota Corp. |
| 81,000 |
| 750 |
| |
Kurita Water Industries Ltd. |
| (c)11,600 |
| 251 |
| |
Kyocera Corp. |
| 3,100 |
| 292 |
| |
Kyudenko Corp. |
| 8,000 |
| 47 |
| |
Lintec Corp. |
| 5,500 |
| 108 |
| |
Maeda Road Construction Co., Ltd. |
| 6,000 |
| 44 |
| |
Matsushita Electric Industrial Co., Ltd. |
| 21,000 |
| 419 |
| |
Minebea Co., Ltd. |
| 27,000 |
| 189 |
| |
Mitsubishi Chemical Corp. |
| (c)32,000 |
| 202 |
| |
Mitsubishi Corp. |
| 18,800 |
| 354 |
| |
Mitsubishi Heavy Industries Ltd. |
| 70,000 |
| 318 |
| |
Mitsui Mining & Smelting Co., Ltd. |
| 22,000 |
| 110 |
| |
Mitsumi Electric Co., Ltd. |
| (c)10,000 |
| 220 |
| |
Nagase & Co., Ltd. |
| (c)8,000 |
| 95 |
| |
NEC Corp. |
| 55,000 |
| 263 |
| |
Nifco, Inc. |
| (c)7,100 |
| 163 |
| |
Nintendo Co., Ltd. |
| 2,100 |
| 545 |
| |
Nippon Meat Packers, Inc. |
| 11,000 |
| 120 |
| |
Nippon Sheet Glass Co., Ltd. |
| (c)14,000 |
| 66 |
| |
Nippon Steel Corp. |
| 28,000 |
| 161 |
| |
Nippon Telegraph & Telephone Corp. |
| 34 |
| 167 |
| |
Nissan Motor Co., Ltd. |
| 38,400 |
| 462 |
| |
Nissha Printing Co., Ltd. |
| (c)2,000 |
| 62 |
| |
Nisshinbo Industries, Inc. |
| 11,000 |
| 114 |
| |
Obayashi Corp. |
| 30,000 |
| 195 |
| |
Ono Pharmaceutical Co., Ltd. |
| 4,300 |
| 227 |
| |
ORIX Corp. |
| 2,550 |
| 738 |
| |
Ricoh Co., Ltd. |
| 19,000 |
| 388 |
| |
Rinnai Corp. |
| 3,100 |
| 93 |
| |
Rohm Co., Ltd. |
| (c)1,900 |
| 189 |
| |
Ryosan Co., Ltd. |
| 4,900 |
| 122 |
| |
Sanki Engineering Co., Ltd. |
| 3,000 |
| 21 |
| |
Sanwa Shutter Corp. |
| 19,000 |
| 112 |
| |
Sekisui Chemical Co., Ltd. |
| 26,000 |
| 207 |
| |
Sekisui House Ltd. |
| 15,000 |
| 218 |
| |
Sharp Corp. |
| 42,000 |
| 724 |
| |
Shin-Etsu Chemical Co., Ltd. |
| 10,600 |
| 710 |
| |
Shin-Etsu Polymer Co., Ltd. |
| 10,800 |
| 151 |
| |
Sony Corp. |
| 6,200 |
| 266 |
| |
Sumitomo Realty & Development Co., Ltd. |
| 39,000 |
| 1,252 |
| |
Suzuki Motor Corp. |
| (c)11,800 |
| 333 |
| |
TDK Corp. |
| 3,400 |
| 270 |
| |
Teijin Ltd. |
| 35,000 |
| 216 |
| |
Terumo Corp. |
| 18,500 |
| 728 |
| |
Toho Co., Ltd. |
| (c)4,100 |
| 74 |
| |
Tokyo Electric Power Co., Inc. (The) |
| 5,900 |
| 191 |
| |
Toray Industries, Inc. |
| 98,000 |
| 735 |
| |
Toshiba Corp. |
| (c)66,000 |
| 430 |
| |
Toyo Ink Manufacturing Co., Ltd. |
| 17,000 |
| 69 |
| |
Toyoda Gosei Co., Ltd. |
| 3,000 |
| 69 |
| |
Toyota Motor Corp. |
| 20,900 |
| 1,398 |
| |
Tsubakimoto Chain Co. |
| 26,000 |
| 154 |
| |
Yamaha Corp. |
| 12,900 |
| 273 |
| |
Yamaha Motor Co., Ltd. |
| (c)9,900 |
| 311 |
| |
|
|
|
| 26,108 |
| |
Mexico (0.7%) |
|
|
|
|
| |
America Movil S.A. de C.V., Class L ADR |
| 17,635 |
| 797 |
| |
Netherlands (5.2%) |
|
|
|
|
| |
ING Groep N.V. CVA |
| 35,176 |
| 1,560 |
| |
Royal Dutch Shell plc, Class A |
| 45,597 |
| 1,593 |
| |
Royal Numico N.V. |
| (c)14,136 |
| 760 |
| |
TNT N.V. |
| 13,390 |
| 576 |
| |
Unilever N.V. CVA |
| 20,674 |
| 565 |
| |
Wolters Kluwer N.V. CVA |
| 37,536 |
| 1,080 |
| |
|
|
|
| 6,134 |
| |
Norway (2.2%) |
|
|
|
|
| |
Norske Skogindustrier ASA |
| 21,945 |
| 378 |
| |
Telenor ASA |
| 58,126 |
| 1,093 |
| |
TGS Nopec Geophysical Co. ASA |
| (a)52,239 |
| 1,081 |
| |
|
|
|
| 2,552 |
| |
Singapore (2.9%) |
|
|
|
|
| |
CapitaCommercial Trust REIT |
| 42,040 |
| 72 |
| |
CapitaLand Ltd. |
| 132,000 |
| 533 |
| |
Chartered Semiconductor Manufacturing Ltd. |
| (a)(c)87,000 |
| 73 |
| |
City Developments Ltd. |
| 35,000 |
| 290 |
| |
DBS Group Holdings Ltd. |
| 48,000 |
| 707 |
| |
Keppel Corp., Ltd. |
| 96,000 |
| 1,102 |
| |
Oversea-Chinese Banking Corp., Ltd. |
| 35,000 |
| 176 |
| |
SembCorp Industries Ltd. |
| 65,680 |
| 164 |
| |
Singapore Airlines Ltd. |
| 20,000 |
| 228 |
| |
Singapore Press Holdings Ltd. |
| 30,000 |
| 84 |
| |
|
|
|
| 3,429 |
| |
South Korea (0.5%) |
|
|
|
|
| |
Samsung Electronics Co., Ltd. GDR (Registered) |
| (e)1,727 |
| 568 |
| |
Spain (2.0%) |
|
|
|
|
| |
Altadis S.A. |
| 8,668 |
| 454 |
| |
Banco Bilbao Vizcaya Argentaria S.A. |
| 29,948 |
| 721 |
| |
Banco Popular Espanol S.A. |
| (c)42,523 |
| 771 |
| |
Telefonica S.A. |
| 19,222 |
| 409 |
| |
|
|
|
| 2,355 |
| |
Sweden (2.7%) |
|
|
|
|
| |
Atlas Copco AB, Class A |
| (c)11,899 |
| 400 |
| |
Getinge AB, Class B |
| (c)34,563 |
| 775 |
| |
The accompanying notes are an integral part of the financial statements.
58
| 2006 Annual Report |
|
|
| December 31, 2006 |
Portfolio of Investments (cont’d)
International Magnum Portfolio
|
|
|
| Value |
| |
|
| Shares |
| (000) |
| |
Sweden (cont’d) |
|
|
|
|
| |
Sandvik AB |
| 50,634 |
| $ | 736 |
|
Telefonaktiebolaget LM Ericsson, Class B |
| 327,632 |
| 1,323 |
| |
|
|
|
| 3,234 |
| |
Switzerland (8.3%) |
|
|
|
|
| |
ABB Ltd. (Registered) |
| (c)(e)63,500 |
| 1,139 |
| |
Ciba Specialty Chemicals AG (Registered) |
| 5,766 |
| 384 |
| |
Compagnie Financiere Richemont AG, Class A |
| 14,244 |
| 830 |
| |
Credit Suisse Group (Registered) |
| 5,800 |
| 406 |
| |
Nestle S.A. (Registered) |
| 3,910 |
| 1,389 |
| |
Nobel Biocare Holding AG |
| 1,345 |
| 398 |
| |
Novartis AG (Registered) |
| 29,157 |
| 1,681 |
| |
Roche Holding AG (Genusschein) |
| 8,654 |
| 1,552 |
| |
SGS S.A. (Registered) |
| (c)702 |
| 782 |
| |
Swiss Reinsurance (Registered) |
| 10,166 |
| 864 |
| |
Zurich Financial Services AG (Registered) |
| 1,467 |
| 395 |
| |
|
|
|
| 9,820 |
| |
Turkey (0.5%) |
|
|
|
|
| |
Akbank TAS ADR |
| 50,396 |
| 612 |
| |
United Kingdom (11.1%) |
|
|
|
|
| |
Anglo American plc |
| 7,592 |
| 370 |
| |
Aviva plc |
| 23,846 |
| 384 |
| |
Barclays plc |
| 55,557 |
| 794 |
| |
Cadbury Schweppes plc |
| 63,738 |
| 682 |
| |
Capita Group plc |
| 65,917 |
| 783 |
| |
GlaxoSmithKline plc |
| 23,241 |
| 612 |
| |
HSBC Holdings plc |
| 105,999 |
| 1,932 |
| |
Imperial Tobacco Group plc |
| 10,125 |
| 399 |
| |
Man Group Plc |
| 20,635 |
| 211 |
| |
Old Mutual plc |
| 132,303 |
| 451 |
| |
Prudential plc |
| 58,903 |
| 807 |
| |
Reckitt Benckiser plc |
| 18,623 |
| 851 |
| |
Reed Elsevier plc |
| 89,523 |
| 983 |
| |
Rexam plc |
| 33,828 |
| 348 |
| |
Rolls-Royce Group plc |
| 42,182 |
| 370 |
| |
Rolls-Royce Group plc, Class B |
| (a)1,548,079 |
| 3 |
| |
Royal Bank of Scotland Group plc |
| 20,749 |
| 810 |
| |
SABMiller plc |
| 34,475 |
| 793 |
| |
Tesco plc |
| 145,003 |
| 1,148 |
| |
WM Morrison Supermarkets plc |
| 86,458 |
| 431 |
| |
|
|
|
| 13,162 |
| |
Total Common Stocks (Cost $95,091) |
|
|
| 117,356 |
| |
|
| Face |
|
|
| |
|
| Amount |
|
|
| |
|
| (000) |
|
|
| |
Short-Term Investments (8.7%) |
|
|
|
|
| |
Short-Term Debt Securities held as Collateral on Loaned Securities (8.7%) |
|
|
|
|
| |
Alliance & Leicester plc, |
|
|
|
|
| |
5.36%, 1/8/07 |
| $ | (h)335 |
| 335 |
|
Bancaja, 5.37%, 1/19/07 |
| (h)168 |
| 168 |
| |
Bank of America Corp., 5.32%, 1/2/07 |
| (h)536 |
| 536 |
| |
Bank of New York Co., Inc., |
|
|
|
|
| |
5.34%, 1/10/07 |
| (h)167 |
| 167 |
| |
Bear Stearns & Co., Inc., |
|
|
|
|
| |
5.37%, 1/2/07 |
| (h)201 |
| 201 |
| |
5.38%, 1/2/07 |
| (h)134 |
| 134 |
| |
5.39%, 1/16/07 |
| (h)335 |
| 335 |
| |
BNP Paribas plc, |
|
|
|
|
| |
5.35%, 2/20/07 |
| (h)335 |
| 335 |
| |
CIC, New York, |
|
|
|
|
| |
5.33%, 1/3/07 |
| (h)235 |
| 235 |
| |
5.34%, 1/2/07 |
| (h)335 |
| 335 |
| |
Dekabank Deutsche Girozentrale, |
|
|
|
|
| |
5.39%, 1/19/07 |
| (h)342 |
| 342 |
| |
Deutsche Bank Securities, Inc., |
|
|
|
|
| |
5.33%, 1/2/07 |
| 1,075 |
| 1,075 |
| |
Dexia Bank, New York, |
|
|
|
|
| |
5.33%, 1/2/07 |
| (h)335 |
| 335 |
| |
Gemini Securitization Corp., |
|
|
|
|
| |
5.34%, 1/2/07 |
| 167 |
| 167 |
| |
Goldman Sachs Group, Inc., |
|
|
|
|
| |
5.40%, 1/16/07 |
| (h)168 |
| 168 |
| |
5.42%, 1/2/07 |
| (h)315 |
| 315 |
| |
HSBC Finance Corp., 5.34%, 1/8/07 |
| (h)168 |
| 168 |
| |
Liberty Lighthouse U.S. Capital, |
|
|
|
|
| |
5.33%, 1/2/07 |
| (h)167 |
| 167 |
| |
Manufacturers & Traders, |
|
|
|
|
| |
5.33%, 1/16/07 |
| (h)201 |
| 201 |
| |
Merrill Lynch & Co., |
|
|
|
|
| |
5.35%, 1/26/07 |
| (h)176 |
| 176 |
| |
Mitsubishi UFJ Financial Group, |
|
|
|
|
| |
5.33%, 1/2/07 |
| (h)168 |
| 168 |
| |
Natexis Banques Populaires, New York, |
|
|
|
|
| |
5.34%, 1/2/07 |
| (h)335 |
| 335 |
| |
5.35%, 1/2/07 |
| (h)168 |
| 168 |
| |
National City Bank Cleveland, |
|
|
|
|
| |
5.32%, 1/2/07 |
| (h)486 |
| 486 |
| |
National Rural Utilities Cooperative Finance Corp., |
|
|
|
|
| |
5.34%, 1/2/07 |
| (h)670 |
| 670 |
| |
Nationwide Building Society, |
|
|
|
|
| |
5.44%, 3/28/07 |
| (h)389 |
| 389 |
| |
Nordea Bank, New York, |
|
|
|
|
| |
5.31%, 1/2/07 |
| (h)503 |
| 503 |
| |
Rhein-Main Securitisation Ltd., |
|
|
|
|
| |
5.33%, 1/18/07 |
| 158 |
| 158 |
| |
Skandi, NewYork, |
|
|
|
|
| |
5.34%, 1/9/07 |
| (h)335 |
| 335 |
| |
SLM Corp., 5.36%, 1/22/07 |
| (h)335 |
| 335 |
| |
Toronto Dominion, New York, |
|
|
|
|
| |
5.32%, 5/29/07 |
| (h)335 |
| 335 |
| |
Tulip Funding, 5.36%, 1/16/07 |
| 184 |
| 184 |
| |
Unicredito Italiano Bank (Ireland) plc, |
|
|
|
|
| |
5.36%, 1/9/07 |
| (h)234 |
| 234 |
| |
World Savings Bank FSB, |
|
|
|
|
| |
5.35%, 1/19/07 |
| (h)114 |
| 114 |
| |
Total Short-Term Investments (Cost $10,309) |
|
|
| 10,309 |
| |
The accompanying notes are an integral part of the financial statements.
59
2006 Annual Report |
|
December 31, 2006 |
Portfolio of Investments (cont’d)
International Magnum Portfolio
|
| Value |
| |
|
| (000) |
| |
Total Investments (108.0%) (Cost $105,400) — including $9,829 of Securities Loaned |
| $ | 127,665 |
|
Liabilities in Excess of Other Assets (-8.0%) |
| (9,445 | ) | |
Net Assets (100%) |
| $ | 118,220 |
|
(a) |
| Non-income producing security. |
|
|
|
|
|
|
|
(c) |
| All or portion of security on loan at December 31, 2006. | ||
|
|
| ||
(e) |
| 144A security — certain conditions for public sale may exist. Unless otherwise noted, these securities are deemed to be liquid. | ||
|
|
| ||
(h) |
| Variable/Floating Rate Security — interest rate changes on these instruments are based on changes in a designated base rate. The rates shown are those in effect on December 31, 2006. | ||
|
|
| ||
ADR |
| American Depository Receipts |
|
|
|
|
|
|
|
CVA |
| Certificaten Van Aandelen |
|
|
|
|
|
|
|
GDR |
| Global Depository Receipts |
|
|
|
|
|
|
|
REIT |
| Real Estate Investment Trust |
|
|
Foreign Currency Exchange Contract Information: |
|
|
|
|
|
The Portfolio had the following foreign currency exchange contract(s) open at period end: |
|
|
|
|
|
|
|
|
|
|
|
|
|
|
| Net |
| ||||
Currency |
|
|
|
|
|
| In |
|
|
|
|
| Unrealized |
| ||||
to |
|
|
|
|
|
| Exchange |
|
|
|
|
| Appreciation |
| ||||
Deliver |
|
| Value |
| Settlement |
| For |
|
| Value |
|
| (Depreciation) |
| ||||
(000) |
|
| (000) |
| Date |
| (000) |
|
| (000) |
|
| (000) |
| ||||
AUD | 1,093 |
| $ | 861 |
| 3/14/07 |
| USD |
| 856 |
| $ | 856 |
| $ | (5 | ) | |
EUR | 4,505 |
| 5,965 |
| 3/14/07 |
| USD |
| 5,977 |
| 5,977 |
| 12 |
| ||||
GBP | 1,901 |
| 3,723 |
| 3/14/07 |
| USD |
| 3,737 |
| 3,737 |
| 14 |
| ||||
JPY | 404,571 |
| 3,430 |
| 3/14/07 |
| USD |
| 3,486 |
| 3,486 |
| 56 |
| ||||
USD | 4,249 |
| 4,249 |
| 3/14/07 |
| AUD |
| 5,418 |
| 4,269 |
| 20 |
| ||||
USD | 1,407 |
| 1,407 |
| 3/14/07 |
| EUR |
| 1,060 |
| 1,404 |
| (3 | ) | ||||
USD | 17,332 |
| 17,332 |
| 3/14/07 |
| GBP |
| 8,809 |
| 17,252 |
| (80 | ) | ||||
USD | 4,711 |
| 4,711 |
| 3/14/07 |
| JPY |
| 547,458 |
| 4,642 |
| (69 | ) | ||||
|
|
| $ | 41,678 |
|
|
|
|
|
|
| $ | 41,623 |
| $ | (55 | ) | |
AUD | — | Australian Dollar |
EUR | — | Euro |
GBP | — | British Pound |
JPY | — | Japanese Yen |
USD | — | United States Dollar |
The accompanying notes are an integral part of the financial statements.
60
| 2006 Annual Report |
|
|
| December 31, 2006 |
Investment Overview (unaudited)
International Real Estate Portfolio
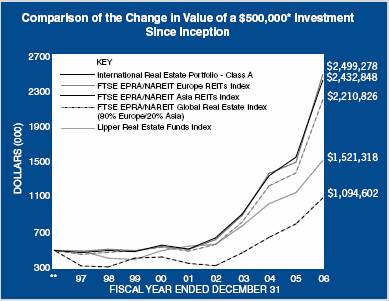
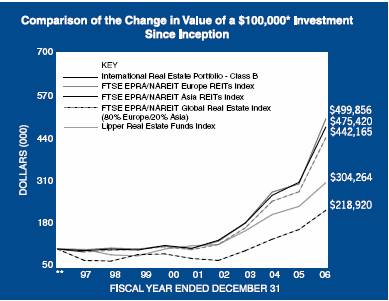
* Minimum Investment
** Commenced operations on October 1, 1997
In accordance with SEC regulations, Portfolio performance shown assumes that all recurring fees (including management fees) were deducted and all dividends and distributions were reinvested.
Performance Compared to the FTSE EPRA/NAREIT Europe REITs Index(1), the FTSE EPRA/NAREIT Asia REITs
Index(2) , FTSE EPRA/NAREIT Global Real Estate Index (80% Europe/20% Asia) (3) and the Lipper Real Estate Funds Index(4)
|
| Total Returns(5) |
| ||||
|
|
|
| Average Annual |
| ||
|
| One |
| Five |
| Since |
|
Portfolio – Class A (6) |
| 56.06 | % | 36.36 | % | 18.66 | % |
FTSE EPRA/NAREIT Europe REITs Index |
| 66.53 |
| 37.36 |
| 19.00 |
|
FTSE EPRA/NAREIT Asia REITs Index |
| 36.45 |
| 25.43 |
| 8.84 |
|
FTSE EPRA/NAREIT Global Real Estate Index (80% Europe/20% Asia) |
| 60.15 |
| 35.05 |
| 17.44 |
|
Lipper Real Estate Funds Index |
| 31.46 |
| 22.63 |
| 12.78 |
|
|
|
|
|
|
|
|
|
Portfolio – Class B (6) |
| 55.69 |
| 36.01 |
| 18.36 |
|
FTSE EPRA/NAREIT Europe REITs Index |
| 66.53 |
| 37.36 |
| 19.00 |
|
FTSE EPRA/NAREIT Asia REITs Index |
| 36.45 |
| 25.43 |
| 8.84 |
|
FTSE EPRA/NAREIT Global Real Estate Index (80% Europe/20% Asia) |
| 60.15 |
| 35.05 |
| 17.44 |
|
Lipper Real Estate Funds Index |
| 31.46 |
| 22.63 |
| 12.78 |
|
Performance data quoted represents past performance, which is no guarantee of future results, and current performance may be lower or higher than the figures shown. Performance assumes that all dividends and distributions, if any, were reinvested. For the most recent month-end performance figures, please visit www.morganstanley.com/im. Investment return and principal value will fluctuate so that Portfolio shares, when redeemed, may be worth more or less than their original cost. Total returns do not reflect the deduction of taxes that a shareholder would pay on Portfolio distributions or the redemption of Portfolio shares.
(1) The FTSE EPRA/NAREIT Europe REITs Index is the European component of the FTSE EPRA/NAREIT Global Real Estate Index, which is a market capitalization weighted index designed to reflect the stock performance of companies engaged in the North American, European and Asian real estate markets. The performance of the Index is listed in U.S. dollars and assumes reinvestment of net dividends for periods after 1/31/2005 (gross returns used prior to 1/31/2005). “Net Dividends” reflects a reduction in dividends after taking into account withholding of taxes by certain foreign countries represented in the Index. The Index is unmanaged and its returns do not include any sales charges or fees. Such costs would lower performance. It is not possible to invest directly in an index.
(2) The FTSE EPRA/NAREIT Asia REITs Index is the Asian component of the FTSE EPRA/NAREIT Global Real Estate Index, which is a market capitalization weighted index designed to reflect the stock performance of companies engaged in the North American, European and Asian real estate markets. The performance of the Index is listed in U.S. dollars and assumes reinvestment of net dividends for periods after 1/31/2005 (gross returns used prior to 1/31/2005). “Net Dividends” reflects a reduction in dividends after taking into account withholding of taxes by certain foreign countries represented in the Index. The Index is unmanaged and its returns do not include any sales charges or fees. Such costs would lower performance. It is not possible to invest directly in an index.
(3) The FTSE EPRA/NAREIT Global Real Estate Index (80% Europe/20% Asia) is a customized benchmark, 80% of which consists of the performance of the FTSE EPRA/NAREIT Europe Series and 20% of which consists of the performance of the FTSE EPRA/NAREIT Asia Series. These series are components of the FTSE EPRA/ NAREIT Global Real Estate Index which is a market capitalization weighted index designed to reflect the stock performance of companies engaged in the North American, European and Asian real estate markets. The performance of the Index is listed in U.S. dollars and assumes reinvestment of net dividends for periods after
61
2006 Annual Report |
|
December 31, 2006 |
Investment Overview (cont’d)
International Real Estate Portfolio
1/31/2005 (gross returns used prior to 1/31/2005). “Net Dividends” reflects a reduction in dividends after taking into account withholding of taxes by certain foreign countries represented in the Index. The Index is rebalanced on a monthly basis. The Index is unmanaged and its returns do not include any sales charges or fees. Such costs would lower performance. It is not possible to invest directly in an index.
(4) The Lipper Real Estate Funds Index is an equally weighted performance index of the largest qualifying funds (based on net assets) in the Lipper Real Estate Funds classification. The Index, which is adjusted for capital gains distributions and income dividends, is unmanaged and should not be considered an investment. There are currently 30 funds represented in this Index. As of the date of this report, the Portfolio is in the Lipper Real Estate Funds classification.
(5) Total returns for the Portfolio reflect fees waived and expenses reimbursed, if applicable, by the Adviser. Without such waivers and/or reimbursements, total returns would have been lower. Fee waivers and/or expense reimbursements are voluntary and the Adviser reserves the right to commence or terminate any waiver and/or reimbursement at any time.
(6) Commenced operations on October 1, 1997
(7) For comparative purposes, average annual since inception returns listed for the Indexes refer to the inception date or initial offering of the respective share class of the Portfolio, not the inception of the Index.
The International Real Estate Portfolio seeks to provide current income and long-term capital appreciation by investing primarily in equity securities of companies in the real estate industry located in various global markets throughout the world (excluding the United States and Canada). Foreign investing involves certain risks, including currency fluctuations and controls, restrictions on foreign investments, less governmental supervision and regulation, less liquidity and the potential for market volatility and political instability.
Performance
For the year ended December 31, 2006, the Portfolio had a total return based on net asset value per share of 56.06% for the Class A shares, net of fees, and 55.69% for the Class B shares, net of fees, compared to 66.53% for the FTSE EPRA / NAREIT Europe REITs Index , 36.45% for the FTSE EPRA/ NAREIT Asia REITs Index and 60.15% for the FTSE EPRA/ NAREIT Global Real Estate Index (80% Europe/20% Asia).
Factors Affecting Performance
• The Portfolio’s overweight in Asia, particularly in Japan and Hong Kong, had a negative impact on relative performance versus the Index. An underweight in Australia was detrimental as well. Stock selection was positive in Japan and Singapore, but this was more than offset by a negative contribution from Hong Kong.
• In Europe, country underweights in Austria and Belgium and an overweight in Italy had a positive impact on relative performance. This was partly offset by underweights in Spain and Poland. Stock selection was positive in the United Kingdom (U.K.) and France, but negatively affected performance in Spain and Finland.
• In 2006, overall returns from property stocks in Europe and Asia were strong, and real estate securities outperformed the regional equity markets. Performance in both markets can be attributed to improving real estate values and continued investor attraction to real estate.
• The recovery in the European office markets accelerated during 2006, with falling vacancies and improved demand putting upward pressure on rents in the majority of European office markets. The supply pipeline still remains fairly limited in most cities, and the recovery is therefore expected by many investors to continue during 2007, with the majority of European cities expected to experience positive rental growth.
• European retail sales growth remained sluggish, with little possibility of near-term improvement given the negative effect that higher interest rates and fiscal tightening will likely have on consumer disposable income. In addition, supply of new space outpaces retail sales growth in a number of European countries, which should impact rental growth prospects.
• The Asian office markets continue to improve further on the back of the economic recovery. Vacancy rates for Grade A offices have fallen below 3% in Tokyo, and rents and land prices have continued to improve following a long period of declines. Strong rental growth is already materializing in Hong Kong and Singapore, where secondary locations are now also starting to benefit. The Asian retail sector remains well supported by robust economic growth and rising domestic consumption and tourism spending.
• Throughout the reporting period, investor demand for real estate remained strong worldwide, despite higher interest rates, and yields continued to compress in most markets. Further yield compression is likely to be more limited than before, however, as a continued rise in interest rates is leading to a decrease in the spread between property yields and interest rates, thereby limiting the scope for further yield compression.
• Following the strong returns during the period, real estate securities in the European market now trade at a premium to the net asset values (NAV) of underlying assets. However, improved real estate fundamentals are still not being priced into the Asian market, and this market is still trading below NAV, except in Australia where premiums are at historic high levels.
62
| 2006 Annual Report |
|
|
| December 31, 2006 |
Investment Overview (cont’d)
International Real Estate Portfolio
Management Strategies
• We maintained our core investment philosophy as a real estate value investor. This resulted in our ownership of stocks in regions which we believe provide the best valuation relative to their underlying real estate values and growth prospects.
• As of the close of the period, the Portfolio remained overweight in Asia, as it combines improving real estate fundamentals with more attractive securities valuations compared to the European market. Within Asia, we prefer the Japanese and Hong Kong markets.
• In Europe, we added to positions in the U.K. during the year, thereby increasing the Portfolio’s overweight. We partly closed our underweight in Austria, following a period of underperformance halfway through the year. We also took profits in the Netherlands during the first half of the period, and as a result, moved from an overweight position to an underweight position. The Portfolio also included underweights in Germany and Belgium, and an overweight in Italy.
Expense Examples
As a shareholder of the Portfolio, you may incur two types of costs: (1) transactional costs, including redemption fees; (2) ongoing costs, including management fees, distribution (12b- 1) fees (in the case of Class B); and other Portfolio expenses. These examples are intended to help you understand your ongoing costs (in dollars) of investing in the Portfolio and to compare these costs with the ongoing costs of investing in other mutual funds.
The examples are based on an investment of $1,000 invested at the beginning of the six-month period ended December 31, 2006 and held for the entire six-month period.
Actual Expenses
The first line of the tables below provides information about actual account values and actual expenses. You may use the information in this line, together with the amount you invested, to estimate the expenses that you paid over the period. Simply divide your account value by $1,000 (for example, an $8,600 account value divided by $1,000 = 8.6), then multiply the result by the number in the first line under the heading entitled “Expenses Paid During Period” to estimate the expenses you paid on your account during this period.
Please note that “Expenses Paid During Period” are grossed up to reflect Portfolio expenses prior to the effect of Expense Offset (See Note E in the Notes to Financial Statements). Therefore, the annualized net expense ratios may differ from the ratio of the expenses to average net assets shown in the Financial Highlights.
Hypothetical Example for Comparison Purposes
The second line of the tables below provides information about hypothetical account values and hypothetical expenses based on the Portfolio’s actual expense ratio and an assumed rate of return of 5% per year before expenses, which is not the Portfolio’s actual return. The hypothetical account values and expenses may not be used to estimate the actual ending account balance or expenses you paid for the period. You may use this information to compare the ongoing costs of investing in the Portfolio and other funds. To do so, compare this 5% hypothetical example with the 5% hypothetical examples that appear in the shareholder reports of the other funds.
Please note that the expenses shown in the table are meant to highlight your ongoing costs only and do not reflect any transactional costs, such as redemption fees. Therefore, the second line of the table is useful in comparing ongoing costs only, and will not help you determine the relative total costs of owning different funds. In addition, if these transactional costs were included, your costs would have been higher.
|
|
|
|
|
| Expenses Paid |
| |||
|
|
|
| Ending Account |
| During Period* |
| |||
|
| Beginning |
| Value |
| July 1, 2006 — |
| |||
|
| Account Value |
| December 31, |
| December 31, |
| |||
|
| July 1, 2006 |
| 2006 |
| 2006 |
| |||
Class A |
|
|
|
|
|
|
| |||
Actual |
| $ | 1,000.00 |
| $ | 1,344.50 |
| $ | 5.55 |
|
Hypothetical (5% average annual return before expenses) |
| 1,000.00 |
| 1,020.47 |
| 4.79 |
| |||
|
|
|
|
|
|
|
| |||
Class B |
|
|
|
|
|
|
| |||
Actual |
| 1,000.00 |
| 1,342.60 |
| 7.03 |
| |||
Hypothetical (5% average annual return before expenses) |
| 1,000.00 |
| 1,019.21 |
| 6.06 |
| |||
* Expenses are equal to Class A and Class B annualized net expense ratios of 0.94% and 1.19%, respectively, multiplied by the average account value over the period, multiplied by 184/365 (to reflect the one-half year period).
63
2006 Annual Report |
|
December 31, 2006 |
Investment Overview (cont’d)
International Real Estate Portfolio
Graphic Presentation of Portfolio Holdings
The following graph depicts the Portfolio’s holdings by industry and/or security type, as a percentage of total investments.
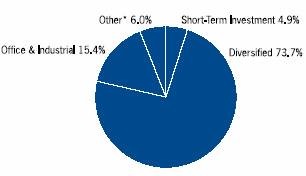
* Industries which do not appear in the above graph, as well as those which represent less than 5% of total investments, if applicable, are included in the category labeled “Other”.
January 2007
64
| 2006 Annual Report |
|
|
| December 31, 2006 |
Portfolio of Investments
International Real Estate Portfolio
|
|
|
| Value |
| |
|
| Shares |
| (000) |
| |
Common Stocks (93.3%) |
|
|
|
|
| |
Australia (6.6%) |
|
|
|
|
| |
Centro Properties Group |
| 437,784 |
| $ | 3,145 |
|
CFS Retail Property Trust |
| 1,937,932 |
| 3,559 |
| |
DB RREEF Trust |
| 3,222,287 |
| 4,515 |
| |
GPT Group |
| 1,668,200 |
| 7,374 |
| |
Investa Property Group |
| 620,700 |
| 1,230 |
| |
Macquarie CountryWide Trust |
| 744,300 |
| 1,240 |
| |
Macquarie Goodman Group |
| 876,267 |
| 5,257 |
| |
Macquarie ProLogis Trust |
| 3,120,700 |
| 3,091 |
| |
Mirvac Group |
| 732,450 |
| 3,232 |
| |
Stockland |
| 18,069 |
| 110 |
| |
Stockland (New) |
| 1,553,585 |
| 10,154 |
| |
Westfield Group |
| 2,317,850 |
| 38,403 |
| |
|
|
|
| 81,310 |
| |
Austria (3.4%) |
|
|
|
|
| |
Conwert Immobilien Invest AG |
| (a)214,614 |
| 4,646 |
| |
Immoeast Immobilien Anlagen AG |
| (a)865,673 |
| 12,170 |
| |
IMMOFINANZ Immobilien Anlagen AG |
| (a)1,753,288 |
| 24,996 |
| |
|
|
|
| 41,812 |
| |
Finland (0.8%) |
|
|
|
|
| |
Citycon Oyj |
| 299,730 |
| 1,998 |
| |
Sponda Oyj |
| 459,160 |
| 7,273 |
| |
|
|
|
| 9,271 |
| |
France (8.6%) |
|
|
|
|
| |
Gecina S.A. REIT |
| 110,775 |
| 21,203 |
| |
Klepierre REIT |
| 108,462 |
| 20,474 |
| |
Societe Immobilierede Location pour l’Industrie et le Commerce REIT |
| 47,137 |
| 7,094 |
| |
Unibail REIT |
| 233,441 |
| 57,039 |
| |
|
|
|
| 105,810 |
| |
Germany (0.1%) |
|
|
|
|
| |
IVG Immobilien AG |
| 15,678 |
| 673 |
| |
Hong Kong (7.5%) |
|
|
|
|
| |
Champion REIT |
| (a)6,192,000 |
| 2,993 |
| |
Cheung Kong Holdings Ltd. |
| 138,000 |
| 1,699 |
| |
Henderson Land Development Co., Ltd. |
| 2,744,000 |
| 15,346 |
| |
Hongkong Land Holdings Ltd. |
| 4,084,000 |
| 16,254 |
| |
Hysan Development Co., Ltd. |
| 2,432,576 |
| 6,364 |
| |
Kerry Properties Ltd. |
| 261,980 |
| 1,224 |
| |
Link REIT (The) |
| 798,000 |
| 1,641 |
| |
New World Development Ltd. |
| 7,820,410 |
| 15,745 |
| |
Sun Hung Kai Properties Ltd. |
| 2,204,000 |
| 25,318 |
| |
Swire Pacific Ltd., Class A |
| 466,000 |
| 5,006 |
| |
|
|
|
| 91,590 |
| |
Italy (2.7%) |
|
|
|
|
| |
Aedes S.p.A. |
| 472,160 |
| 3,827 |
| |
Beni Stabili S.p.A. |
| 10,300,907 |
| 16,440 |
| |
Risanamento S.p.A. |
| 1,174,989 |
| 12,718 |
| |
|
|
|
| 32,985 |
| |
Japan (11.6%) |
|
|
|
|
| |
Aeon Mall Co., Ltd. |
| 33,400 |
| 1,886 |
| |
Daibiru Corp. |
| 321,300 |
| 3,499 |
| |
Japan Hotel & Resort, Inc. REIT |
| 513 |
| 2,953 |
| |
Japan Real Estate Investment Corp. REIT |
| 118 |
| 1,269 |
| |
Mitsubishi Estate Co., Ltd. |
| 1,599,000 |
| 41,384 |
| |
Mitsui Fudosan Co., Ltd. |
| 1,418,000 |
| 34,614 |
| |
Mori Trust Sogo Reit, Inc. |
| 120 |
| 1,129 |
| |
Nippon Building Fund, Inc. REIT |
| 501 |
| 6,652 |
| |
NTT Urban Development Corp. |
| 5,125 |
| 9,905 |
| |
Sumitomo Realty & Development Co., Ltd. |
| 866,000 |
| 27,798 |
| |
Tokyo Tatemono Co., Ltd. |
| 468,000 |
| 5,215 |
| |
Tokyu Land Corp. |
| 584,000 |
| 5,506 |
| |
|
|
|
| 141,810 |
| |
Netherlands (4.6%) |
|
|
|
|
| |
Corio N.V. REIT |
| 108,362 |
| 8,854 |
| |
Eurocommercial Properties N.V. CVA REIT |
| 297,553 |
| 14,851 |
| |
Rodamco Europe N.V. REIT |
| 162,996 |
| 21,689 |
| |
Wereldhave N.V. REIT |
| 77,520 |
| 10,325 |
| |
|
|
|
| 55,719 |
| |
Singapore (3.6%) |
|
|
|
|
| |
Ascott Group Ltd. (The) |
| 2,796,600 |
| 2,936 |
| |
CapitaCommercial Trust REIT |
| 1,910,300 |
| 3,263 |
| |
CapitaLand Ltd. |
| 1,730,000 |
| 6,993 |
| |
CapitaMall Trust REIT |
| 1,602,000 |
| 3,039 |
| |
CapitaRetail China Trust |
| (a)132,500 |
| 181 |
| |
CDL Hospitality Trusts REIT |
| (a)790,000 |
| 860 |
| |
City Developments Ltd. |
| 157,000 |
| 1,300 |
| |
Hotel Properties Ltd. |
| 391,000 |
| 688 |
| |
K-REIT Asia |
| 435,400 |
| 710 |
| |
Keppel Land Ltd. |
| 441,000 |
| 1,984 |
| |
Macquarie MEAG Prime REIT |
| 4,733,000 |
| 3,611 |
| |
Overseas Union Enterprise Ltd. |
| 1,000 |
| 7 |
| |
Singapore Land Ltd. |
| 271,000 |
| 1,520 |
| |
Suntec REIT |
| 2,298,000 |
| 2,727 |
| |
United Industrial Corp., Ltd. |
| 5,868,000 |
| 7,996 |
| |
UOL Group Ltd. |
| 1,008,000 |
| 2,852 |
| |
Wheelock Properties S Ltd. |
| 2,346,000 |
| 3,442 |
| |
|
|
|
| 44,109 |
| |
Sweden (3.2%) |
|
|
|
|
| |
Castellum AB |
| 807,840 |
| 10,768 |
| |
Fabege AB |
| 203,052 |
| 5,443 |
| |
Hufvudstaden AB, Class A |
| 2,066,103 |
| 23,389 |
| |
|
|
|
| 39,600 |
| |
Switzerland (2.1%) |
|
|
|
|
| |
Allreal Holding AG |
| 22,291 |
| 2,479 |
| |
PSP Swiss Property AG |
| (a)405,642 |
| 23,303 |
| |
|
|
|
| 25,782 |
| |
United Kingdom (38.5%) |
|
|
|
|
| |
Atlas Estates Ltd. |
| 189,054 |
| 1,149 |
| |
British Land Co. plc |
| 2,721,766 |
| 91,343 |
| |
Brixton plc |
| 1,288,246 |
| 14,529 |
| |
Capital & Regional plc |
| 703,351 |
| 21,236 |
| |
Derwent Valley Holdings plc |
| 460,768 |
| 18,919 |
| |
Development Securities plc |
| 112,790 |
| 1,535 |
| |
Grainger Trust plc |
| 503,344 |
| 6,850 |
| |
Great Portland Estates plc |
| 1,369,596 |
| 18,597 |
| |
The accompanying notes are an integral part of the financial statements.
65
2006 Annual Report |
|
December 31, 2006 |
Portfolio of Investments (cont’d)
International Real Estate Portfolio
|
|
|
| Value |
| |
|
| Shares |
| (000) |
| |
United Kingdom (cont’d) |
|
|
|
|
| |
Hammerson plc |
| 1,501,512 |
| $ | 46,363 |
|
Insight Foundation Property Trust |
| 891,735 |
| 2,410 |
| |
Land Securities Group plc |
| 2,163,868 |
| 98,422 |
| |
Liberty International plc |
| 1,565,609 |
| 42,794 |
| |
London Merchant Securities plc |
| 136,147 |
| 814 |
| |
Minerva plc |
| (a)2,726,448 |
| 21,620 |
| |
Quintain Estates & Development plc |
| 609,792 |
| 10,209 |
| |
Shaftesbury plc |
| 553,318 |
| 8,494 |
| |
Slough Estates plc |
| 2,917,072 |
| 44,865 |
| |
Unite Group plc |
| 1,482,917 |
| 15,882 |
| |
Warner Estate Holdings plc |
| 116,297 |
| 1,970 |
| |
Workspace Group plc |
| 305,261 |
| 2,974 |
| |
|
|
|
| 470,975 |
| |
Total Common Stocks (Cost $869,202) |
|
|
| 1,141,446 |
| |
Investment Company (1.7%) |
|
|
|
|
| |
Luxembourg(1.7%) |
|
|
|
|
| |
ProLogis European Properties |
| (a)1,061,817 |
| 21,025 |
| |
|
| Face |
|
|
| ||
|
| Amount |
|
|
| ||
|
| (000) |
|
|
| ||
Short-Term Investment (4.9%) |
|
|
|
|
| ||
Repurchase Agreement (4.9%) |
|
|
|
|
| ||
J.P. Morgan Securities, Inc., 5.20%, dated 12/29/06, due 1/2/07, repurchase price $59,748 |
| $ | (f)59,713 |
| 59,713 |
| |
Total Investments (99.9%) (Cost $948,870) |
|
|
| 1,222,184 |
| ||
Other Assets in Excess of Liabilities (0.1%) |
|
|
| 1,336 |
| ||
Net Assets (100%) |
|
|
| $ | 1,223,520 |
| |
(a) Non-income producing security.
(f) Represents the Portfolio’s undivided interest in a joint repurchase agreement which has a total value of $1,856,998,000. The repurchase agreement was fully collateralized by U.S. government agency securities at the date of this Portfolio of Investments as follows: Federal Farm Credit Bank, 0.00% to 7.43%, due 1/16/07 to 10/23/3; Federal Home Loan Bank, 0.00% to 7.38%, due 1/3/07 to 6/5/28; Federal Home Loan Mortgage Corp., 0.00% to 6.75%, due 1/2/07 to 7/15/32; Federal National Mortgage Association, 0.00% to 8.20%, due 1/12/07 to 11/15/30; Tennessee Valley Authority, 5.38% to 6.75%, due 11/13/08 to 4/1/36, which had a total value of $1,894,142,869. The investment in the repurchase agreement is through participation in a joint account with affiliated parties pursuant to exemptive relief received by the Portfolio from the SEC.
CVA Certificaten Van Aandelen
REIT Real Estate Investment Trust
Foreign Currency Exchange Contract Information:
The Portfolio had the following foreign currency exchange contract(s) open at period end:
|
|
|
|
|
|
|
|
|
|
|
|
|
|
| Net |
| |||||||
Currency |
|
|
|
|
|
|
| In |
|
|
| Unrealized |
| ||||||||||
|
|
|
|
|
|
| Exchange |
|
|
| Appreciation |
| |||||||||||
| Value |
| Settlement |
| For |
| Value |
| (Depreciation) |
| |||||||||||||
| (000) |
|
| (000) |
| (000) |
| (000) |
| ||||||||||||||
USD | 273 |
|
| $ | 273 |
| 1/2/07 |
| HKD |
| 2,123 |
|
| $ | 273 |
|
| $ | @— |
| |||
USD | 11 |
|
| 11 |
| 1/4/07 |
| JPY |
| 1,308 |
|
| 11 |
|
| @— |
| ||||||
USD | 168 |
|
| 168 |
| 1/5/07 |
| JPY |
| 19,956 |
|
| 168 |
|
| @— |
| ||||||
USD | 48 |
|
| 48 |
| 1/3/07 |
| SGD |
| 74 |
|
| 48 |
|
| @— |
| ||||||
USD | 455 |
|
| 455 |
| 1/4/07 |
| SGD |
| 698 |
|
| 455 |
|
| @— |
| ||||||
|
|
|
| $ | 955 |
|
|
|
|
|
|
|
| $ | 955 |
|
| $ | @— |
| |||
HKD | — Hong Kong Dollar |
JPY | — Japanese Yen |
SGD | — Singapore Dollar |
USD | — United States Dollar |
@ | — Face Amount/Value is less than $500. |
The accompanying notes are an integral part of the financial statements.
66
| 2006 Annual Report |
|
|
| December 31, 2006 |
Investment Overview (unaudited)
International Small Cap Portfolio
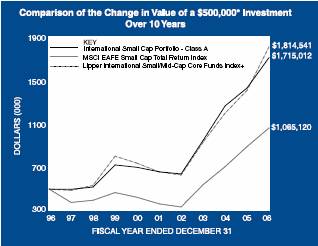
* Minimum Investment
+ The Lipper International Small/Mid-Cap Core Funds Index commenced operations on March 31, 2002. Performance data prior to December 31, 2002 is from the Lipper International Small/Mid-Cap Core Funds Average.
In accordance with SEC regulations, Portfolio performance shown assumes that all recurring fees (including management fees) were deducted and all dividends and distributions were reinvested.
Performance Compared to the Morgan Stanley Capital International (MSCI) EAFE Small Cap Total Return Index(1) and the Lipper International Small/ Mid-Cap Core Funds Index(2)
|
| Total Returns(3) |
| ||||||
|
|
|
| Average Annual |
| ||||
|
| One |
| Five |
| Ten |
| Since |
|
|
| Year |
| Years |
| Years |
| Inception(5) |
|
Portfolio – Class A (4) |
| 19.61 | % | 21.04 | % | 13.12 | % | 14.06 | % |
MSCI EAFE Small Cap Total Return Index |
| 19.31 |
| 23.97 |
| 7.86 |
| 8.37 |
|
Lipper International Small/Mid-Cap Core Funds Index |
| 28.46 |
| 22.46 |
| 13.76 |
| — |
|
Performance data quoted represents past performance, which is no guarantee of future results, and current performance may be lower or higher than the figures shown. Performance assumes that all dividends and distributions, if any, were reinvested. For the most recent month-end performance figures, please visit www.morganstanley.com/im. Investment return and principal value will fluctuate so that Portfolio shares, when redeemed, may be worth more or less than their original cost. Total returns do not reflect the deduction of taxes that a shareholder would pay on Portfolio distributions or the redemption of Portfolio shares.
(1) The Morgan Stanley Capital International (MSCI) EAFE Small Cap Total Return Index is an unmanaged, market value weighted average of the performance of over 900 securities of companies listed on the stock exchanges of countries in Europe, Australasia and the Far East, including price performance and income from dividend payments. The Index is unmanaged and its returns do not include any sales charges or fees. Such costs would lower performance. It is not possible to invest directly in an index.
(2) The Lipper International Small/Mid-Cap Core Funds Index is an equally weighted performance index of the largest qualifying funds (based on net assets) in the Lipper International Small/Mid-Cap Core Funds classification. The Lipper International Small/Mid-Cap Core Funds Index commenced operations on March 31, 2002. Performance data prior to December 31, 2002 reflects that of the Lipper International Small/Mid-Cap Core Funds Average. The Index, which is adjusted for capital gains distributions and income dividends, is unmanaged and should not be considered an investment. There are currently 10 funds represented in this Index. As of the date of this report, the Portfolio is in the Lipper International Small/Mid- Cap Core Funds classification.
(3) Total returns for the Portfolio reflect fees waived and expenses reimbursed, if applicable, by the Adviser. Without such waivers and/or reimbursements, total returns would have been lower. Fee waivers and/or expense reimbursements are voluntary and the Adviser reserves the right to commence or terminate any waiver and/or reimbursement at any time.
(4) Commenced operations on December 15, 1992
(5) For comparative purposes, average annual since inception returns listed for the Indexes refer to the inception date or initial offering of the respective share class of the Portfolio, not the inception of the Index.
The International Small Cap Portfolio seeks long-term capital appreciation by investing primarily in equity securities of small non-U.S. companies. Investments in small sized corporations are more vulnerable to financial risks and other risks than larger corporations and may involve a higher degree of price volatility than investments in the general equity markets. Foreign investing involves certain risks, including currency fluctuations and controls, restrictions on foreign investments, less governmental supervision and regulation, less liquidity and the potential for market volatility and political instability.
Performance
For the year ended December 31, 2006, the Portfolio had a total return based on net asset value per share of 19.61%, net of fees, compared to 19.31% for the Morgan Stanley Capital International (MSCI) EAFE Small Cap Total Return Index (the “Index”).
Factors Affecting Performance
• 2006 marked the fourth consecutive year of double-digit returns for the international equity markets, with the broader MSCI EAFE Index rising 26.3% and the Index posting a return of 19.3%.
• Similar to 2005, the performance of international small caps in 2006 was a tale of two halves. In the first half of 2006, the Index rose only 6.4%, as Japan was noticeably weaker and Europe sold off in May. Japan was weaker as economic data was more volatile and lacked follow through from the euphoria that gripped the market in the last half of 2005. Markets around the world sold off in May on concerns over higher commodity prices, rising rates and a weakening U.S. dollar.
• In mid-summer, markets began their comeback as oil prices declined from the peak of $77/barrel in July, corporate profits remained strong, and global merger and acquisition activity continued. The European markets also benefited from increased domestic demand and business confidence, and posted gross domestic product (GDP) growth of 2.5%, its best in six years. For
67
2006 Annual Report |
|
December 31, 2006 |
Investment Overview (cont’d)
International Small Cap Portfolio
the year, Europe rose 45%, led by Spain and Denmark, the two best performing markets. Japan recovered in the fourth quarter but ended the year down 16%. Excluding Japan, small caps continued to outperform their large cap counterparts.
• For the year, nine of 10 sectors produced double-digit returns, with energy posting a return of 59.3%. The sector is comprised of exploration and service companies, which continue to trade on the benefit of full order books. The materials sector ranked second on the back of continued strong performance from Australian mining stocks. In contrast, Japanese materials stocks rose less than 1% for the full year. Finally, utilities rose 28% on renewed interest in non-traditional sources of energy such as wind power and bio-fuel. Industrials (+20.6%), financials (+23.3%) and health care (+24.5%) all outperformed the market. Sectors that produced modest double-digit returns but underperformed the Index included consumer discretionary (+10.3%), consumer staples (+18.8%) and telecommunication services (+10.8%). The information technology sector was the outlier, with an increase of just 1.7%, as software and semiconductors companies declined but hardware and equipment companies posted positive results.
• In a reversal from 2005, the U.S. dollar weakened against British sterling and the Euro. However, the Japanese yen defied market expectations and remained weak against most major currencies. In local currency terms, the Index rose 11.7% compared to the U.S. dollar return of 19.3%. As a result of currency effects, the Portfolio’s country allocation, overweight Euro and underweight Japanese yen, contributed modestly to performance.
Management Strategies
• For the full year, the Portfolio performed in line with the Index. Performance was led by stock selection in industrials, consumer discretionary, consumer staples and health care, which was not enough to offset the detractors (which included stock selection and allocation to the information technology and financial sectors, and an underweight to energy).
• Industrials, the largest sector allocation, added to performance, primarily due to stock selection from a broad group of companies that are market leaders in niche industries with global presence. Some of these companies were overlooked in 2005 but exceeded expectations in 2006 with higher sales and stronger profit margins. This included a French power infrastructure and high-end battery company, Finnish boat engines and tubing companies, a Swedish aerospace and defense company, and Swiss machinery companies. Japanese industrials, which comprise slightly more than 9% of the sector, declined 18% in the year on valuation and earnings prospects. The Portfolio’s underweight and stock selection within Japanese industrials was a positive factor.
• Stock selection and an underweight to the consumer discretionary sector added to the Portfolio’s performance across a number of industries. Several of the retail companies benefited from restructuring coupled with an increase in sales. In addition, merger and acquisition (M&A) speculation in New Zealand’s largest retail operator was a positive factor in performance. Consumer services, primarily gaming and nightclub operators, rebounded. The traditional bricks and mortar gaming industry benefited from the World Cup. However, internet gaming companies, which had been market leaders in 2005, suffered as U.S. legislation restricted growth. Within the media sector, several factors positively influenced performance, including better results, acquisitions and changes in government regulation. Finally, the Portfolio’s underweight to the Japanese consumer discretionary sector was a positive as the sector declined nearly 12% in the year.
• Stock selection from a broad group of consumer staples added value throughout the year. In 2005, we increased the allocation, as we found investment opportunities, primarily in the United Kingdom (U.K.), among companies with lower valuations but stronger fundamentals. Within the sector, several names were under bid speculation or bought out, which aided performance. In addition, many of the companies successfully implemented business plans, restructuring to focus on core business and organic growth, which gained market attention.
• Small-cap energy stocks led the market in both 2005 and 2006, due to oil services/exploration and equipment companies. A Finnish exploration company represents the Portfolio’s investment in energy. In the third quarter, the company announced disappointing exploration results and the stock plunged but rebounded as investors recognized that the underlying fundamentals remained compelling. However, the Portfolio’s lack of exposure to energy has been a detractor from performance. We believe companies are priced to perfection, and in order to maintain leadership, they would require sustained high oil prices. As such, we believe there is more risk to the downside.
• Information technology was a sector with mixed results in stock selection. During the year, the Portfolio’s
68
| 2006 Annual Report |
|
|
| December 31, 2006 |
Investment Overview (cont’d)
International Small Cap Portfolio
holdings in software companies added value. This was offset, however, by poor stock selection in semiconductor and semiconductor equipment companies. The industry came under pressure due to overcapacity and some shifting in market leadership. In addition, stock selection in some hardware companies detracted following a mixture of disappointing order intakes and poor news flow.
• Stock selection in the financials sector was also mixed. Banks contributed positively, as the Portfolio’s position in Italian banks gained favor with investors due to takeover speculation and consolidation. Stock selection in real estate added value but the underweight allocation was a negative influence. The most significant negative impact was the Portfolio’s investment in Japanese diversified financial companies, which were hurt by regulatory changes that will significantly affect industry revenues. While these stocks were significant detractors from performance, we continue to believe in the fundamental thesis that supported our initial investment in them.
Expense Examples
As a shareholder of the Portfolio, you may incur two types of costs: (1) transactional costs, including redemption fees; (2) ongoing costs, including management fees and other Portfolio expenses. These examples are intended to help you understand your ongoing costs (in dollars) of investing in the Portfolio and to compare these costs with the ongoing costs of investing in other mutual funds.
The examples are based on an investment of $1,000 invested at the beginning of the six-month period ended December 31, 2006 and held for the entire six-month period.
Actual Expenses
The first line of the tables below provides information about actual account values and actual expenses. You may use the information in this line, together with the amount you invested, to estimate the expenses that you paid over the period. Simply divide your account value by $1,000 (for example, an $8,600 account value divided by $1,000 = 8.6), then multiply the result by the number in the first line under the heading entitled “Expenses Paid During Period” to estimate the expenses you paid on your account during this period.
Please note that “Expenses Paid During Period” are grossed up to reflect Portfolio expenses prior to the effect of Expense Offset (See Note E in the Notes to Financial Statements). Therefore, the annualized net expense ratios may differ from the ratio of the expenses to average net assets shown in the Financial Highlights.
Hypothetical Example for Comparison Purposes
The second line of the tables below provides information about hypothetical account values and hypothetical expenses based on the Portfolio’s actual expense ratio and an assumed rate of return of 5% per year before expenses, which is not the Portfolio’s actual return. The hypothetical account values and expenses may not be used to estimate the actual ending account balance or expenses you paid for the period. You may use this information to compare the ongoing costs of investing in the Portfolio and other funds. To do so, compare this 5% hypothetical example with the 5% hypothetical examples that appear in the shareholder reports of the other funds.
Please note that the expenses shown in the table are meant to highlight your ongoing costs only and do not reflect any transactional costs, such as redemption fees. Therefore, the second line of the table is useful in comparing ongoing costs only, and will not help you determine the relative total costs of owning different funds. In addition, if these transactional costs were included, your costs would have been higher.
|
|
|
|
|
| Expenses Paid |
| |||
|
|
|
| Ending Account |
| During Period* |
| |||
|
| Beginning |
| Value |
| July 1, 2006 — |
| |||
|
| Account Value |
| December 31, |
| December 31, |
| |||
|
| July 1, 2006 |
| 2006 |
| 2006 |
| |||
Class A |
|
|
|
|
|
|
| |||
Actual |
| $ | 1,000.00 |
| $ | 1,119.60 |
| $ | 5.88 |
|
Hypothetical (5% average annual return before expenses) |
| 1,000.00 |
| 1,019.66 |
| 5.60 |
| |||
* Expenses are equal to Class A annualized net expense ratios of 1.10%, multiplied by the average account value over the period, multiplied by 184/365 (to reflect the one-half year period). |
Graphic Presentation of Portfolio Holdings
The following graph depicts the Portfolio’s holdings by industry and/or security type, as a percentage of total investments.
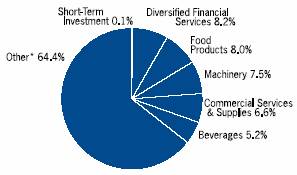
* Industries which do not appear in the above graph, as well as those which represent less than 5% of total investments, if applicable, are included in the category labeled “Other”.
January 2007
69
2006 Annual Report |
|
December 31, 2006 |
Portfolio of Investments
International Small Cap Portfolio
|
|
|
| Value |
| |
|
| Shares |
| (000) |
| |
Common Stocks (98.6%) |
|
|
|
|
| |
Australia (5.8%) |
|
|
|
|
| |
Goodman Fielder Ltd. |
| 10,167,566 |
| $ | 17,817 |
|
Infomedia Ltd. |
| 12,420,731 |
| 7,451 |
| |
John Fairfax Holdings Ltd. |
| 1,977,807 |
| 7,541 |
| |
MYOB Ltd. |
| 9,648,780 |
| 8,835 |
| |
Pacific Brands Ltd. |
| 11,075,153 |
| 22,817 |
| |
Ramsay Health Care Ltd. |
| 1,366,585 |
| 12,243 |
| |
|
|
|
| 76,704 |
| |
Austria (1.3%) |
|
|
|
|
| |
Zumtobel AG |
| (a)544,479 |
| 17,379 |
| |
Belgium (2.2%) |
|
|
|
|
| |
Omega Pharma S.A. |
| 375,311 |
| 28,314 |
| |
Denmark (1.6%) |
|
|
|
|
| |
Carlsberg A/S, Class B |
| 147,486 |
| 14,647 |
| |
Danisco A/S |
| 80,471 |
| 6,852 |
| |
|
|
|
| 21,499 |
| |
Finland (2.1%) |
|
|
|
|
| |
Uponor Oyj |
| 273,161 |
| 10,226 |
| |
Wartsila Oyj, Class B |
| 319,195 |
| 17,196 |
| |
|
|
|
| 27,422 |
| |
France (7.7%) |
|
|
|
|
| |
Bull S.A. |
| (a)1,601,299 |
| 12,831 |
| |
GL Trade S.A. |
| 203,589 |
| 10,078 |
| |
Icade Promesses |
| (a)147,278 |
| 9,303 |
| |
Ipsen S.A. |
| 424,119 |
| 19,718 |
| |
Neopost S.A. |
| 103,316 |
| 12,977 |
| |
Nexans S.A. |
| 90,114 |
| 11,538 |
| |
Saft Groupe S.A. |
| (a)400,252 |
| 13,473 |
| |
Zodiac S.A. |
| 159,895 |
| 10,743 |
| |
|
|
|
| 100,661 |
| |
Germany (6.5%) |
|
|
|
|
| |
AWD Holding AG |
| 365,409 |
| 15,445 |
| |
GFK AG |
| 337,554 |
| 14,624 |
| |
IWKA AG |
| (a)493,928 |
| 12,623 |
| |
K&S AG |
| 156,008 |
| 16,928 |
| |
Sartorius AG (Non-Voting Shares) |
| 272,388 |
| 11,866 |
| |
SCS Standard Computersysteme AG |
| (a)(d)(i)(l)21,289 |
| @— |
| |
Techem AG |
| 192,621 |
| 14,112 |
| |
|
|
|
| 85,598 |
| |
Hong Kong (0.9%) |
|
|
|
|
| |
Solomon Systech International Ltd. |
| 79,117,900 |
| 12,308 |
| |
Ireland (3.4%) |
|
|
|
|
| |
Glanbia plc |
| 3,294,061 |
| 12,871 |
| |
Kerry Group plc, Class A |
| 1,262,820 |
| 31,556 |
| |
|
|
|
| 44,427 |
| |
Italy (5.7%) |
|
|
|
|
| |
Banca CR Firenze |
| 1,860,760 |
| 6,264 |
| |
Banca Italease S.p.A. |
| 117,919 |
| 6,875 |
| |
Buzzi Unicem S.p.A. |
| 685,821 |
| 19,492 |
| |
Davide Campari-Milano S.p.A. |
| 2,173,567 |
| 21,548 |
| |
Interpump S.p.A. |
| 810,025 |
| 7,330 |
| |
SAES Getters S.p.A. |
| 204,340 |
| 7,822 |
| |
Sogefi S.p.A. |
| 624,200 |
| 4,845 |
| |
|
|
|
| 74,176 |
| |
Japan (24.1%) |
|
|
|
|
| |
Aplus Co., Ltd. |
| (a)4,738,400 |
| 6,490 |
| |
Ariake Japan Co., Ltd. |
| 1,311,300 |
| 25,619 |
| |
Century Leasing System, Inc. |
| 1,507,100 |
| 19,642 |
| |
Fuyo General Lease Co., Ltd. |
| 1,056,800 |
| 31,791 |
| |
Hurxley Corp. |
| 303,737 |
| 4,620 |
| |
Japan Securities Finance Co., Ltd. |
| 2,705,500 |
| 32,760 |
| |
Mabuchi Motor Co., Ltd. |
| 221,600 |
| 13,184 |
| |
Mars Engineering Corp. |
| 609,100 |
| 11,900 |
| |
Melco Holding, Inc. |
| 224,100 |
| 6,271 |
| |
Milbon Co., Ltd. |
| 258,300 |
| 7,206 |
| |
Nakanishi, Inc. |
| 120,100 |
| 14,734 |
| |
Nihon Micro Coating Co. |
| 248,400 |
| 1,570 |
| |
Nihon Trim Co., Ltd. |
| 141,400 |
| 6,452 |
| |
Nippon Restaurant System, Inc. |
| 346,500 |
| 11,472 |
| |
Nissha Printing Co., Ltd. |
| 749,000 |
| 23,098 |
| |
Patlite Corp. |
| 668,400 |
| 6,246 |
| |
Pronexus Inc. |
| 666,200 |
| 6,208 |
| |
Rengo Co., Ltd. |
| 2,128,000 |
| 13,626 |
| |
Shinkawa Ltd. |
| 712,000 |
| 15,167 |
| |
Sokkia Co., Ltd. |
| 643,800 |
| 2,840 |
| |
Sumitomo Osaka Cement Co., Ltd. |
| 2,957,000 |
| 9,666 |
| |
Taiheiyo Cement Corp. |
| 4,585,000 |
| 17,954 |
| |
Taisei Lamick Co., Ltd. |
| 214,400 |
| 5,261 |
| |
Takuma Co., Ltd. |
| 1,445,000 |
| 8,451 |
| |
Wacom Co., Ltd. |
| 2,991 |
| 8,947 |
| |
Yamaichi Electronics Co., Ltd. |
| 531,600 |
| 4,471 |
| |
|
|
|
| 315,646 |
| |
Netherlands (2.5%) |
|
|
|
|
| |
Macintosh Retail Group N.V. |
| 367,518 |
| 12,371 |
| |
Randstad Holdings N.V. |
| 114,610 |
| 7,928 |
| |
USG People N.V. |
| 284,532 |
| 12,436 |
| |
|
|
|
| 32,735 |
| |
New Zealand (1.7%) |
|
|
|
|
| |
Fisher & Paykel Healthcare Corp., Ltd. |
| 2,022,298 |
| 6,070 |
| |
Warehouse Group Ltd. |
| 3,117,508 |
| 15,814 |
| |
|
|
|
| 21,884 |
| |
Norway (5.3%) |
|
|
|
|
| |
Eltek ASA |
| (a)1,068,038 |
| 10,577 |
| |
Norske Skogindustrier ASA |
| 1,159,282 |
| 19,987 |
| |
Revus Energy ASA |
| (a)608,853 |
| 5,273 |
| |
Schibsted ASA |
| 673,905 |
| 24,102 |
| |
Veidekke ASA |
| 259,638 |
| 9,869 |
| |
|
|
|
| 69,808 |
| |
South Korea (0.8%) |
|
|
|
|
| |
KT&G Corp. |
| (a)168,660 |
| 10,247 |
| |
Spain (0.8%) |
|
|
|
|
| |
Miquel y Costas & Miquel S.A. |
| 319,905 |
| 10,004 |
| |
Sweden (4.4%) |
|
|
|
|
| |
Billerud Uddeholm AB |
| 376,223 |
| 6,677 |
| |
Eniro AB |
| 968,913 |
| 12,809 |
| |
Micronic Laser Systems AB |
| (a)367,884 |
| 4,138 |
| |
The accompanying notes are an integral part of the financial statements.
70
| 2006 Annual Report |
|
|
| December 31, 2006 |
Portfolio of Investments (cont’d)
International Small Cap Portfolio
|
|
|
| Value |
| |
|
| Shares |
| (000) |
| |
Sweden (cont’d) |
|
|
|
|
| |
Saab AB, Class B |
| 853,731 |
| $ | 26,188 |
|
Swedish Match AB |
| 425,900 |
| 7,963 |
| |
|
|
|
| 57,775 |
| |
Switzerland (4.2%) |
|
|
|
|
| |
Bucher Industries AG (Registered) |
| 80,908 |
| 8,785 |
| |
Galenica Holding AG (Registered) |
| 66,311 |
| 18,571 |
| |
Schindler Holding AG |
| 120,227 |
| 7,563 |
| |
Sia Abrasives Holding AG |
| 26,639 |
| 10,384 |
| |
Zehnder Group AG, Class B |
| 5,839 |
| 10,451 |
| |
|
|
|
| 55,754 |
| |
United Kingdom (17.6%) |
|
|
|
|
| |
Ark Therapeutics Group plc |
| (a)441,793 |
| 811 |
| |
Britvic plc |
| 5,369,699 |
| 30,911 |
| |
Catlin Group Ltd. |
| 1,317,538 |
| 13,260 |
| |
Cattles plc |
| 1,733,790 |
| 14,911 |
| |
De La Rue plc |
| 589,475 |
| 7,439 |
| |
Devro plc |
| 3,541,320 |
| 8,459 |
| |
Luminar plc |
| 1,450,915 |
| 20,710 |
| |
Plusnet plc |
| (a)822,518 |
| 3,342 |
| |
Premier Foods plc |
| 3,819,526 |
| 22,567 |
| |
RHM plc |
| 4,343,314 |
| 32,167 |
| |
Rotork plc |
| 731,086 |
| 11,953 |
| |
Spirax-Sarco Engineering plc |
| 912,564 |
| 17,868 |
| |
Stagecoach Group plc |
| 5,076,866 |
| 15,209 |
| |
William Hillplc |
| 1,015,623 |
| 12,568 |
| |
Wincanton plc |
| 2,928,786 |
| 19,411 |
| |
|
|
|
| 231,586 |
| |
Total Common Stocks (Cost $984,023) |
|
|
| 1,293,927 |
| |
|
| Face |
|
|
| ||
|
| Amount |
|
|
| ||
|
| (000) |
|
|
| ||
Short-Term Investment (0.1%) |
|
|
|
|
| ||
Repurchase Agreement (0.1%) |
|
|
|
|
| ||
J.P. Morgan Securities, Inc., 5.20%, dated 12/29/06, due 1/2/07, repurchase price $975 |
| $ | (f)974 |
| 974 |
| |
Total Investments (98.7%) (Cost $984,997) |
|
|
| 1,294,901 |
| ||
Other Assets in Excess of Liabilities (1.3%) |
|
|
| 17,163 |
| ||
Net Assets (100%) |
|
|
| $ | 1,312,064 |
| |
(a) Non-income producing security.
(d) Security was valued at fair value — At December 31, 2006, the Portfolio held a fair valued security valued at less than $500, representing less than 0.05% of net assets.
(f) Represents the Portfolio’s undivided interest in a joint repurchase agreement which has a total value of $1,856,998,000. The repurchase agreement was fully collateralized by U.S. government agency securities at the date of this Portfolio of Investments as follows: Federal Farm Credit Bank, 0.00% to 7.43%, due 1/16/07 to 10/23/35; Federal Home Loan Bank, 0.00% to 7.38%, due 1/3/07 to 6/5/28; Federal Home Loan Mortgage Corp., 0.00% to 6.75%, due 1/2/07 to 7/15/32; Federal National Mortgage Association, 0.00% to 8.20%, due 1/12/07 to 11/15/30; Tennessee Valley Authority, 5.38% to 6.75%, due 11/13/08 to 4/1/36, which had a total value of $1,894,142,869. The investment in the repurchase agreement is through participation in a joint account with affiliated parties pursuant to exemptive relief received by the Portfolio from the SEC.
(i) Restricted security valued at fair value and not registered under the Securities Act of 1933. SCS Standard Computersysteme AG was acquired 4/04 and has a current cost basis of $0. At December 31, 2006, this security had a market value of $0, representing 0.0% of net assets.
(I) Security has been deemed illiquid at December 31, 2006
@ Face Amount/Value is less than $500.
Foreign Currency Exchange Contract Information: |
|
The Portfolio had the following foreign currency exchange contract(s) open at period end: |
Currency |
| Value |
| Settlement |
| In |
| Value |
| Net |
| |||||||
AUD |
| 221 |
| $ | 174 |
| 1/2/07 |
| USD |
| 174 |
| $ | 174 |
| $ | @— |
|
AUD |
| 1,572 |
| 1,241 |
| 1/3/07 |
| USD |
| 1,241 |
| 1,241 |
| @— |
| |||
CHF |
| 621 |
| 510 |
| 1/3/07 |
| USD |
| 509 |
| 509 |
| (1 | ) | |||
DKK |
| 2,772 |
| 491 |
| 1/2/07 |
| USD |
| 489 |
| 489 |
| (2 | ) | |||
EUR |
| 2,923 |
| 3,858 |
| 1/2/07 |
| USD |
| 3,843 |
| 3,843 |
| (15 | ) | |||
EUR |
| 308 |
| 407 |
| 1/3/07 |
| USD |
| 405 |
| 405 |
| (2 | ) | |||
GBP |
| 1,689 |
| 3,306 |
| 1/2/07 |
| USD |
| 3,311 |
| 3,311 |
| 5 |
| |||
JPY |
| 76,300 |
| 641 |
| 1/4/07 |
| USD |
| 642 |
| 642 |
| 1 |
| |||
JPY |
| 656,489 |
| 5,517 |
| 1/5/07 |
| USD |
| 5,520 |
| 5,520 |
| 3 |
| |||
NOK |
| 3,436 |
| 551 |
| 1/2/07 |
| USD |
| 549 |
| 549 |
| (2 | ) | |||
NOK |
| 2,209 |
| 354 |
| 1/3/07 |
| USD |
| 352 |
| 352 |
| (2 | ) | |||
NZD |
| 78 |
| 54 |
| 1/3/07 |
| USD |
| 54 |
| 54 |
| @— |
| |||
NZD |
| 637 |
| 449 |
| 1/4/07 |
| USD |
| 448 |
| 448 |
| (1 | ) | |||
SEK |
| 7,595 |
| 1,109 |
| 1/2/07 |
| USD |
| 1,105 |
| 1,105 |
| (4 | ) | |||
|
|
|
| $ | 18,662 |
|
|
|
|
|
|
| $ | 18,642 |
| $ | (20 | ) |
AUD | — | Australian Dollar |
CHF | — | Swiss Franc |
DKK | — | Danish Krona |
EUR | — | Euro |
GBP | — | British Pound |
JPY | — | Japanese Yen |
NOK | — | Norwegian Krone |
NZD | — | New Zealand Dollar |
SEK | — | Swedish Krona |
USD | — | United States Dollar |
The accompanying notes are an integral part of the financial statements.
71
2006 Annual Report |
|
December 31, 2006 |
Investment Overview (unaudited)
Focus Equity Portfolio
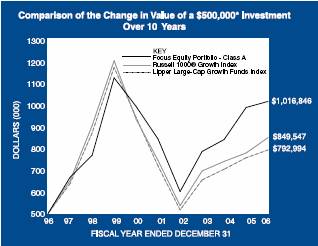
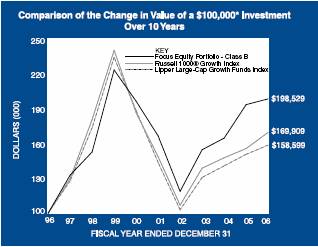
* Minimum Investment
In accordance with SEC regulations, Portfolio performance shown assumes that all recurring fees (including management fees) were deducted and all dividends and distributions were reinvested.
Performance Compared to the Russell 1000® Growth Index(1) and the Lipper Large-Cap Growth Funds Index(2)
|
| Total Returns(3) |
| ||||||
|
|
|
| Average Annual |
| ||||
|
| One |
| Five |
| Ten |
| Since |
|
|
| Year |
| Years |
| Years |
| Inception(6) |
|
Portfolio – Class A (4) |
| 2.77 | % | 3.83 | % | 7.36 | % | 12.56 | % |
Russell 1000® Growth Index |
| 9.07 |
| 2.69 |
| 5.44 |
| 8.79 |
|
Lipper Large-Cap Growth Funds Index |
| 4.72 |
| 2.01 |
| 4.72 |
| 8.01 |
|
|
|
|
|
|
|
|
|
|
|
Portfolio – Class B (5) |
| 2.49 |
| 3.57 |
| 7.10 |
| 9.72 |
|
Russell 1000® Growth Index |
| 9.07 |
| 2.69 |
| 5.44 |
| 6.87 |
|
Lipper Large-Cap Growth Funds Index |
| 4.72 |
| 2.01 |
| 4.72 |
| 6.05 |
|
Performance data quoted represents past performance, which is no guarantee of future results, and current performance may be lower or higher than the figures shown. Performance assumes that all dividends and distributions, if any, were reinvested. For the most recent month-end performance figures, please visit www.morganstanley.com/im. Investment return and principal value will fluctuate so that Portfolio shares, when redeemed, may be worth more or less than their original cost. Total returns do not reflect the deduction of taxes that a shareholder would pay on Portfolio distributions or the redemption of Portfolio shares.
(1) The Russell 1000® Growth Index measures the performance of those Russell 1000® Index companies with higher price-to-book ratios and higher forecasted growth values. The Russell 1000® Index measures the performance of the 1,000 largest companies in the Russell 3000® Index. The Russell 3000® Index measures the performance of the 3,000 largest U.S. companies based on total market capitalization. The Index is unmanaged and its returns do not include any sales charges or fees. Such costs would lower performance. It is not possible to invest directly in an index.
(2) The Lipper Large-Cap Growth Funds Index is an equally weighted performance index of the largest qualifying funds (based on net assets) in the Lipper Large-Cap Growth Funds classification. The Index, which is adjusted for capital gains distributions and income dividends, is unmanaged and should not be considered an investment. There are currently 30 funds represented in this Index. As of the date of this report, the Portfolio is in the Lipper Large-Cap Growth Funds classification.
(3) Total returns for the Portfolio reflect fees waived and expenses reimbursed, if applicable, by the Adviser. Without such waivers and reimbursements, total returns would have been lower. Fee waivers and/or expense reimbursements are voluntary and the Adviser reserves the right to commence or terminate any waiver and/or reimbursement at any time.
(4) Commenced operations on March 8, 1995
(5) Commenced operations on January 2, 1996
(6) For comparative purposes, average annual since inception returns listed for the Indexes refer to the inception date or initial offering of the respective share class of the Portfolio, not the inception of the Index.
The Focus Equity Portfolio seeks capital appreciation by investing primarily in growth-oriented equity securities of large capitalization companies. The Portfolio’s concentration of its assets in a small number of issuers will subject it to greater risks.
Performance
For the year ended December 31, 2006, the Portfolio’s Class A shares had a total return based on net asset value per share of 2.77% for the Class A shares, net of fees, and 2.49% for the Class B shares, net of fees, compared to 9.07% for the Russell 1000® Growth Index (the “Index”).
Factors Affecting Performance
• Over the 12-month period ended December 31, 2006, the markets advanced despite considerable volatility. During the first half of the year, investors grappled with high oil prices, rising interest rates, a slowing housing market and an uptick in inflation. Moreover, the Federal Open Market Committee (FOMC) continued its policy of monetary tightening. Investor anxieties erupted in May and June in the form of a market sell-off following the FOMC’s 16th and 17th consecutive federal funds rate increases. By August the markets once
72
| 2006 Annual Report |
|
|
| December 31, 2006 |
Investment Overview (cont’d)
Focus Equity Portfolio
again entered positive territory. The FOMC stopped raising the target federal funds rate following its June 29th meeting, and left the rate unchanged for the remainder of its policy meetings in 2006. Energy prices were still elevated but receded from the record high set in July. For the most part, corporate earnings reported throughout the year were still better than expected, company balance sheets were healthy, and the exceptionally strong pace of merger and acquisition activity that began in 2005 continued into 2006.
• Although disappointing gross domestic product (GDP) growth data was reported for the second and third quarters, economic growth slowed and housing data continued to decline, the U.S. economy still progressed. By the end of the year, it appeared that the immediate threat of recession subsided and a “soft landing” seemed more possible.
• For the year, value stocks outperformed growth stocks, continuing a recent trend. For this same period, large-capitalization securities, in which the Portfolio invests, outpaced mid-cap securities yet lagged small-cap stocks.
• For the period, the Portfolio underperformed the Index due to stock selection and sector allocation decisions. The most significant detriment to returns was caused by an overweight position in the consumer discretionary sector and stock selection in the sector’s commercial services, education services and leisure time industry groups. However, within this sector, investments in retail firms and radio and television broadcasters did help to mitigate unfavorable performance.
• Selection of computer technology and communications technology firms and an underweight in the technology sector also hampered the Portfolio’s performance.
• An underweight position in producer durables, along with security selection in homebuilding companies and an avoidance of aerospace stocks, also diminished returns.
• Another notable detractor to the Portfolio’s performance was stock selection of crude oil producers in the other energy sector.
• Despite these lags on performance, there were several key positive contributors to the Portfolio. Stock selection in the multi-industry sector, which includes conglomerates, significantly added to relative returns.
• An overweight allocation in the utilities sector also boosted performance, as did stock selection in wireless companies.
• In the materials and processing sector, a single holding in agriculture fishing and ranching proved beneficial to the Portfolio.
Management Strategies
• It is our goal to hold a portfolio of high quality growth stocks we believe will perform well regardless of the market environment. We continue to favor companies that have some uniqueness or dynamic competitive advantage in their business model, with a high quality stream of cash flow and the ability to redeploy capital at a high rate of return.
• For the year, the consumer discretionary sector represented the largest sector weight and overweight in the Portfolio, followed by the financial services and the “other” sectors. The financial services sector was weighted in-line with the Index, while the “other” sector was overweight.
Expense Examples
As a shareholder of the Portfolio, you may incur two types of costs: (1) transactional costs, including redemption fees; (2) ongoing costs, including management fees, distribution (12b- 1) fees (in the case of Class B); and other Portfolio expenses. These examples are intended to help you understand your ongoing costs (in dollars) of investing in the Portfolio and to compare these costs with the ongoing costs of investing in other mutual funds.
The examples are based on an investment of $1,000 invested at the beginning of the six-month period ended December 31, 2006 and held for the entire six-month period.
Actual Expenses
The first line of the tables below provides information about actual account values and actual expenses. You may use the information in this line, together with the amount you invested, to estimate the expenses that you paid over the period. Simply divide your account value by $1,000 (for example, an $8,600 account value divided by $1,000 = 8.6), then multiply the result by the number in the first line under the heading entitled “Expenses Paid During Period” to estimate the expenses you paid on your account during this period.
Please note that “Expenses Paid During Period” are grossed up to reflect Portfolio expenses prior to the effect of Expense Offset (See Note E in the Notes to Financial Statements). Therefore, the annualized net expense ratios may differ from the ratio of the expenses to average net assets shown in the Financial Highlights.
73
2006 Annual Report |
|
|
|
December 31, 2006 |
|
Investment Overview (cont’d)
Focus Equity Portfolio
Hypothetical Example for Comparison Purposes
The second line of the tables below provides information about hypothetical account values and hypothetical expenses based on the Portfolio’s actual expense ratio and an assumed rate of return of 5% per year before expenses, which is not the Portfolio’s actual return. The hypothetical account values and expenses may not be used to estimate the actual ending account balance or expenses you paid for the period. You may use this information to compare the ongoing costs of investing in the Portfolio and other funds. To do so, compare this 5% hypothetical example with the 5% hypothetical examples that appear in the shareholder reports of the other funds.
Please note that the expenses shown in the table are meant to highlight your ongoing costs only and do not reflect any transactional costs, such as redemption fees. Therefore, the second line of the table is useful in comparing ongoing costs only, and will not help you determine the relative total costs of owning different funds. In addition, if these transactional costs were included, your costs would have been higher.
|
|
|
|
|
| Expenses Paid |
| |||
|
|
|
| Ending Account |
| During Period* |
| |||
|
| Beginning |
| Value |
| July 1, 2006 — |
| |||
|
| Account Value |
| December 31, |
| December 31, |
| |||
|
| July 1, 2006 |
| 2006 |
| 2006 |
| |||
Class A |
|
|
|
|
|
|
| |||
Actual |
| $ | 1,000.00 |
| $ | 1,046.90 |
| $ | 4.13 |
|
Hypothetical (5% average annual return before expenses) |
| 1,000.00 |
| 1,021.17 |
| 4.08 |
| |||
|
|
|
|
|
|
|
| |||
Class B |
|
|
|
|
|
|
| |||
Actual |
| 1,000.00 |
| 1,045.90 |
| 5.52 |
| |||
Hypothetical (5% average annual return before expenses) |
| 1,000.00 |
| 1,019.81 |
| 5.45 |
| |||
* Expenses are equal to Class A and Class B annualized net expense ratios of 0.80% and 1.07%, respectively, multiplied by the average account value over the period, multiplied by 184/365 (to reflect the one-half year period). |
Graphic Presentation of Portfolio Holdings
The following graph depicts the Portfolio’s holdings by industry and/or security type, as a percentage of total investments.
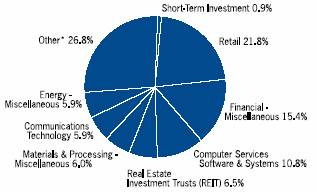
* Industries which do not appear in the above graph, as well as those which represent less than 5% of total investments, if applicable, are included in the category labeled “Other”.
January 2007
74
| 2006 Annual Report |
|
|
| December 31, 2006 |
Portfolio of Investments
Focus Equity Portfolio
|
|
|
| Value |
| |
|
| Shares |
| (000) |
| |
Common Stocks (100.2%) |
|
|
|
|
| |
Advertising Agencies (2.2%) |
|
|
|
|
| |
Monster Worldwide, Inc. |
| (a)7,060 |
| $ | 329 |
|
Air Transport (2.6%) |
|
|
|
|
| |
Expeditors International of Washington, Inc. |
| 9,312 |
| 377 |
| |
Biotechnology Research & Production (1.5%) |
|
|
|
|
| |
Genentech, Inc. |
| (a)2,795 |
| 227 |
| |
Communications Technology (6.0%) |
|
|
|
|
| |
America Movil S.A. de C.V., Class L ADR |
| 13,548 |
| 612 |
| |
Crown Castle International Corp. |
| (a)8,349 |
| 270 |
| |
|
|
|
| 882 |
| |
Computer Services Software & Systems (10.9%) |
|
|
|
|
| |
Google, Inc., Class A |
| (a)2,224 |
| 1,024 |
| |
Yahoo!, Inc. |
| (a)22,823 |
| 583 |
| |
|
|
|
| 1,607 |
| |
Consumer Electronics (1.3%) |
|
|
|
|
| |
Electronic Arts, Inc. |
| (a)3,920 |
| 197 |
| |
Energy — Miscellaneous (6.0%) |
|
|
|
|
| |
Ultra Petroleum Corp. |
| (a)18,455 |
| 881 |
| |
Financial Data Processing Services & Systems (2.7%) |
|
|
|
|
| |
Western Union Co. (The) |
| 18,062 |
| 405 |
| |
Financial — Miscellaneous (15.6%) |
|
|
|
|
| |
American Express Co. |
| 11,960 |
| 726 |
| |
Berkshire Hathaway, Inc., Class B |
| (a)159 |
| 583 |
| |
Chicago Mercantile Exchange Holdings, Inc. |
| 621 |
| 316 |
| |
Moody’s Corp. |
| 9,655 |
| 667 |
| |
|
|
|
| 2,292 |
| |
Health Care Services (2.2%) |
|
|
|
|
| |
UnitedHealth Group, Inc. |
| 5,923 |
| 318 |
| |
Hotel/Motel (4.7%) |
|
|
|
|
| |
Marriott International, Inc., Class A |
| 14,429 |
| 689 |
| |
Materials & Processing (6.0%) |
|
|
|
|
| |
Monsanto Co. |
| 16,885 |
| 887 |
| |
Radio & TV Broadcasters (4.8%) |
|
|
|
|
| |
Grupo Televisa S.A. ADR |
| 26,022 |
| 703 |
| |
Real Estate Investment Trusts (REIT) (6.6%) |
|
|
|
|
| |
Brookfield Asset Management, Inc., Class A |
| 20,153 |
| 971 |
| |
Retail (22.0%) |
|
|
|
|
| |
Abercrombie & Fitch Co. |
| 4,848 |
| 337 |
| |
Amazon.Com, Inc. |
| (a)13,946 |
| 550 |
| |
Costco Wholesale Corp. |
| 10,455 |
| 553 |
| |
eBay, Inc. |
| (a)29,791 |
| 896 |
| |
Sears Holdings Corp. |
| (a)5,405 |
| 908 |
| |
|
|
|
| 3,244 |
| |
Services: Commercial (3.0%) |
|
|
|
|
| |
Corporate Executive Board Co. |
| 5,085 |
| 446 |
| |
Shipping (2.1%) |
|
|
|
|
| |
C.H. Robinson Worldwide, Inc. |
| 7,694 |
| 315 |
| |
Total Common Stocks (Cost $13,483) |
|
|
| 14,770 |
| |
|
| Face |
|
|
| ||
|
| Amount |
| Value |
| ||
|
| (000) |
| (000) |
| ||
Short-Term Investment (0.9%) |
|
|
|
|
| ||
Repurchase Agreement (0.9%) |
|
|
|
|
| ||
J.P. Morgan Securities, Inc., 5.20%, dated 12/29/06, due 1/2/07, repurchase price $128 (Cost $128) |
| $ | (f128 | ) | 128 |
| |
Total Investments (101.1%) (Cost $13,611) |
|
|
| 14,898 |
| ||
Liabilities in Excess of Other Assets (-1.1%) |
|
|
| (165 | ) | ||
Net Assets (100%) |
|
|
| $ | 14,733 |
| |
(a) Non-income producing security.
(f) Represents the Portfolio’s undivided interest in a joint repurchase agreement which has a total value of $1,856,998,000. The repurchase agreement was fully collateralized by U.S. government agency securities at the date of this Portfolio of Investments as follows: Federal Farm Credit Bank, 0.00% to 7.43%, due 1/16/07 to 10/23/35; Federal Home Loan Bank, 0.00% to 7.38%, due 1/3/07 to 6/5/28; Federal Home Loan Mortgage Corp., 0.00% to 6.75%, due 1/2/07 to 7/15/32; Federal National Mortgage Association, 0.00% to 8.20%, due 1/12/07 to 11/15/30; Tennessee Valley Authority, 5.38% to 6.75%, due 11/13/08 to 4/1/36, which had a total value of $1,894,142,869. The investment in the repurchase agreement is through participation in a joint account with affiliated parties pursuant to exemptive relief received by the Portfolio from the SEC.
ADR American Depositary Receipts
The accompanying notes are an integral part of the financial statements.
75
2006 Annual Report |
|
December 31, 2006 |
Investment Overview (unaudited)
Large Cap Relative Value Portfolio

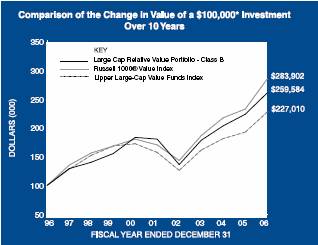
* Minimum Investment
In accordance with SEC regulations, Portfolio performance shown assumes that all recurring fees (including management fees) were deducted and all dividends and distributions were reinvested.
Performance Compared to the Russell 1000® Value Index(1) and the Lipper Large-Cap Value Funds Index(2)
|
| Total Returns(3) |
| ||||||
|
|
|
| Average Annual |
| ||||
|
| One |
| Five |
| Ten |
| Since |
|
|
| Year |
| Years |
| Years |
| Inception(6) |
|
Portfolio – Class A (4) |
| 16.74 | % | 7.89 | % | 10.31 | % | 11.39 | % |
Russell 1000® Value Index |
| 22.25 |
| 10.86 |
| 11.00 |
| 12.80 |
|
Lipper Large-Cap Value Funds Index |
| 18.28 |
| 7.67 |
| 8.54 |
| 11.23 |
|
|
|
|
|
|
|
|
|
|
|
Portfolio – Class B (5) |
| 16.38 |
| 7.62 |
| 10.01 |
| 10.76 |
|
Russell 1000® Value Index |
| 22.25 |
| 10.86 |
| 11.00 |
| 11.87 |
|
Lipper Large-Cap Value Funds Index |
| 18.28 |
| 7.67 |
| 8.54 |
| 9.57 |
|
Performance data quoted represents past performance, which is no guarantee of future results, and current performance may be lower or higher than the figures shown. Performance assumes that all dividends and distributions, if any, were reinvested. For the most recent month-end performance figures, please visit www.morganstanley.com/im. Investment return and principal value will fluctuate so that Portfolio shares, when redeemed, may be worth more or less than their original cost. Total returns do not reflect the deduction of taxes that a shareholder would pay on Portfolio distributions or the redemption of Portfolio shares.
(1) The Russell 1000® Value Index measures the performance of those companies in the Russell 1000® Index with lower
price-to-book ratios and lower forecasted growth values. The Index is unmanaged and its returns do not include any sales charges or fees. Such costs would lower performance. It is not possible to invest directly in an index.
(2) The Lipper Large-Cap Value Funds Index is an equally weighted performance index of the largest qualifying funds (based on net assets) in the Lipper Large-Cap Value Fund classification. The Index, which is adjusted for capital gains distributions and income dividends, is unmanaged and should not be considered an investment. There are currently 30 funds represented in this Index. As of the date of this report, the Portfolio is in the Lipper Large-Cap Value Funds classification.
(3) Total returns for the Portfolio reflect fees waived and expenses reimbursed, if applicable, by the Adviser. Without such waivers and/or reimbursements, total returns would have been lower. Fee waivers and/or expense reimbursements are voluntary and the Adviser reserves the right to commence or terminate any waiver and/or reimbursement at any time.
(4) Commenced operations on January 31, 1990
(5) Commenced operations on January 2, 1996
(6) For comparative purposes, average annual since inception returns listed for the Indexes refer to the inception date or initial offering of the respective share class of the Portfolio, not the inception of the Index.
The Large Cap Relative Value Portfolio seeks high total return by investing primarily in equity securities that the Advisor believes to be undervalued relative to the stock market in general at the time of purchase.
Performance
For the year ended December 31, 2006, the Portfolio had a total return based on net asset value per share of 16.74% for the Class A shares, net of fees, and 16.38% for the Class B shares, net of fees, compared to 22.25% for the Russell 1000® Value Index (the “Index”).
Factors Affecting Performance
• Stock markets advanced for the 12 months ended December 31, 2006, as investors grew less anxious about the condition of the U.S. economy. However, the period was not without turbulence. High oil prices, rising inflation, disappointing gross domestic product growth and ongoing interest federal funds target rate increases by the Federal Open Market Committee (the “Fed”) created an environment of uncertainty for many stock investors. Stock volatility was particularly strong in May and June. However, sentiment turned more positive in the second half of the year, when the Fed stopped increasing the target rate and the immediate threat of recession seemed to pass.
76
| 2006 Annual Report |
|
|
| December 31, 2006 |
Investment Overview (cont’d)
Large Cap Relative Value Portfolio
• The leading stocks in this environment tended to be from the more cyclical (or economically sensitive) market sectors, especially those driven by commodity prices. All sectors in the Index had positive returns for the 12-month period, with the telecommunication services sector producing the largest gain and the health care sector progressing the least.
• The primary area of underperformance for the Portfolio relative to the Index was in the health care sector, due to a surprise negative announcement by a health care equipment and services company early in the reporting period and an overweight in large-cap pharmaceutical stocks, which suffered on heightened political risks.
• The telecommunications sector was another drag on performance, primarily due to stock selection. The Portfolio lacked exposure to some of the market’s best performing telecommunication stocks, and one of the Portfolio’s larger telecommunication holdings provided lackluster returns during the period.
• An underweight in the energy sector also hampered gains. We had been reducing exposure to the sector all year, as the lofty valuations of many energy stocks appear to exceed what we would consider an appropriate balance of risk and return.
• However, in the consumer discretionary sector, our stock selection among retailers and autos served the Portfolio well.
• The Portfolio owned some of the utility sector’s best performing stocks, which offset the negative impact of an underweight in the sector.
• The financial services sector was a positive contributor, particularly in the Portfolio’s diversified financial holdings, which had strong exposure to the capital markets.
• On an absolute basis, the Portfolio achieved positive results from all of its represented sectors.
Management Strategies
• We continue to seek value stocks using our bottom-up security selection process. We look for undervalued companies that offer a potential catalyst for change. Such catalysts could be new company management, growth or consolidation within an industry or sector, or new products.
• We continued to maintain the Portfolio’s long-standing large-cap pharmaceuticals overweight and financials underweight.
Expense Examples
As a shareholder of the Portfolio, you may incur two types of costs: (1) transactional costs, including redemption fees; (2) ongoing costs, including management fees, distribution (12b-1) fees (in the case of Class B); and other Portfolio expenses. These examples are intended to help you understand your ongoing costs (in dollars) of investing in the Portfolio and to compare these costs with the ongoing costs of investing in other mutual funds.
The examples are based on an investment of $1,000 invested at the beginning of the six-month period ended December 31, 2006 and held for the entire six-month period.
Actual Expenses
The first line of the tables below provides information about actual account values and actual expenses. You may use the information in this line, together with the amount you invested, to estimate the expenses that you paid over the period. Simply divide your account value by $1,000 (for example, an $8,600 account value divided by $1,000 = 8.6), then multiply the result by the number in the first line under the heading entitled “Expenses Paid During Period” to estimate the expenses you paid on your account during this period.
Please note that “Expenses Paid During Period” are grossed up to reflect Portfolio expenses prior to the effect of Expense Offset (See Note E in the Notes to Financial Statements). Therefore, the annualized net expense ratios may differ from the ratio of the expenses to average net assets shown in the Financial Highlights.
Hypothetical Example for Comparison Purposes
The second line of the tables below provides information about hypothetical account values and hypothetical expenses based on the Portfolio’s actual expense ratio and an assumed rate of return of 5% per year before expenses, which is not the Portfolio’s actual return. The hypothetical account values and expenses may not be used to estimate the actual ending account balance or expenses you paid for the period. You may use this information to compare the ongoing costs of investing in the Portfolio and other funds. To do so, compare this 5% hypothetical example with the 5% hypothetical examples that appear in the shareholder reports of the other funds.
77
2006 Annual Report |
|
December 31, 2006 |
Investment Overview (cont’d)
Large Cap Relative Value Portfolio
Please note that the expenses shown in the table are meant to highlight your ongoing costs only and do not reflect any transactional costs, such as redemption fees. Therefore, the second line of the table is useful in comparing ongoing costs only, and will not help you determine the relative total costs of owning different funds. In addition, if these transactional costs were included, your costs would have been higher.
|
|
|
|
|
| Expenses Paid |
| |||
|
|
|
| Ending Account |
| During Period* |
| |||
|
| Beginning |
| Value |
| July 1, 2006 — |
| |||
|
| Account Value |
| December 31, |
| December 31, |
| |||
|
| July 1, 2006 |
| 2006 |
| 2006 |
| |||
Class A |
|
|
|
|
|
|
| |||
Actual |
| $ | 1,000.00 |
| $ | 1,133.20 |
| $ | 3.60 |
|
Hypothetical (5% average annual return before expenses) |
| 1,000.00 |
| 1,021.83 |
| 3.41 |
| |||
|
|
|
|
|
|
|
| |||
Class B |
|
|
|
|
|
|
| |||
Actual |
| 1,000.00 |
| 1,131.40 |
| 4.94 |
| |||
Hypothetical (5% average annual return before expenses) |
| 1,000.00 |
| 1,020.57 |
| 4.69 |
| |||
* Expenses are equal to Class A and Class B annualized net expense ratios of 0.67% and 0.92%, respectively, multiplied by the average account value over the period, multiplied by 184/365 (to reflect the one-half year period). |
Graphic Presentation of Portfolio Holdings
The following graph depicts the Portfolio’s holdings by industry and/or security type, as a percentage of total investments.

* Industries which do not appear in the above graph, as well as those which represent less than 5% of total investments, if applicable, are included in the category labeled “Other”.
January 2007
78
| 2006 Annual Report |
|
|
| December 31, 2006 |
Portfolio of Investments
Large Cap Relative Value Portfolio
|
|
|
| Value |
| |
|
| Shares |
| (000) |
| |
Common Stocks (96.7%) |
|
|
|
|
| |
Aerospace (2.1%) |
|
|
|
|
| |
Northrop Grumman Corp. |
| 32,650 |
| $ | 2,210 |
|
Raytheon Co. |
| 66,740 |
| 3,524 |
| |
|
|
|
| 5,734 |
| |
Automobiles (1.0%) |
|
|
|
|
| |
Honda Motor Co., Ltd. ADR |
| 67,390 |
| 2,665 |
| |
Banks: Outside New York City (1.9%) |
|
|
|
|
| |
Fifth Third Bancorp |
| 62,920 |
| 2,575 |
| |
PNC Financial Services Group, Inc. |
| 35,570 |
| 2,634 |
| |
|
|
|
| 5,209 |
| |
Biotechnology (0.5%) |
|
|
|
|
| |
Applera Corp. - Applied Biosystems Group |
| 38,710 |
| 1,420 |
| |
Beverages: Brewers (Wineries) (0.5%) |
|
|
|
|
| |
Diageo plc ADR |
| 17,660 |
| 1,401 |
| |
Beverages: Soft Drinks (1.8%) |
|
|
|
|
| |
Coca Cola Co. (The) |
| 102,610 |
| 4,951 |
| |
Chemicals (3.9%) |
|
|
|
|
| |
Bayer AG ADR |
| 141,240 |
| 7,537 |
| |
E.I. Du Pont de Nemours & Co. |
| 68,550 |
| 3,339 |
| |
|
|
|
| 10,876 |
| |
Communications & Media (4.7%) |
|
|
|
|
| |
Time Warner, Inc. |
| 375,320 |
| 8,174 |
| |
Viacom, Inc., Class B |
| (a)119,340 |
| 4,897 |
| |
|
|
|
| 13,071 |
| |
Communications Technology (1.1%) |
|
|
|
|
| |
Embarq Corp. |
| 28,546 |
| 1,500 |
| |
Motorola, Inc. |
| 68,620 |
| 1,411 |
| |
|
|
|
| 2,911 |
| |
Computer Services Software & Systems (2.2%) |
|
|
|
|
| |
Symantec Corp. |
| (a)289,980 |
| 6,046 |
| |
Computer Technology (0.4%) |
|
|
|
|
| |
Hewlett-Packard Co. |
| 25,819 |
| 1,064 |
| |
Consumer Electronics (0.8%) |
|
|
|
|
| |
Yahoo!, Inc. |
| (a)82,800 |
| 2,115 |
| |
Consumer Staples — MIscellaneous (0.4%) |
|
|
|
|
| |
Kimberly-Clark Corp. |
| 16,230 |
| 1,103 |
| |
Diversified Financial Services (11.7%) |
|
|
|
|
| |
Bank of America Corp. |
| 71,239 |
| 3,803 |
| |
Citigroup, Inc. |
| 167,730 |
| 9,343 |
| |
Goldman Sachs Group, Inc. |
| 2,830 |
| 564 |
| |
J.P. Morgan Chase & Co. |
| 206,984 |
| 9,997 |
| |
Merrill Lynch & Co., Inc. |
| 64,570 |
| 6,012 |
| |
State Street Corp. |
| 36,210 |
| 2,442 |
| |
|
|
|
| 32,161 |
| |
Drug & Grocery Store Chains (0.6%) |
|
|
|
|
| |
Safeway, Inc. |
| 19,680 |
| 680 |
| |
Supervalu, Inc. |
| 24,590 |
| 879 |
| |
|
|
|
| 1,559 |
| |
Drugs & Pharmaceuticals (14.9%) |
|
|
|
|
| |
Abbott Laboratories |
| 127,010 |
| 6,186 |
| |
Bristol-Myers Squibb Co. |
| 196,960 |
| 5,184 |
| |
Eli Lilly & Co. |
| 114,220 |
| 5,951 |
| |
GlaxoSmithKline plc ADR |
| 33,760 |
| 1,781 |
| |
Pfizer, Inc. |
| 134,660 |
| 3,488 |
| |
Roche Holding AG ADR |
| 57,540 |
| 5,150 |
| |
Sanofi-Aventis ADR |
| 39,110 |
| 1,806 |
| |
Schering-Plough Corp. |
| 302,110 |
| 7,142 |
| |
Wyeth |
| 85,830 |
| 4,370 |
| |
|
|
|
| 41,058 |
| |
Electronics: Semi-Conductors/Components (2.2%) |
|
|
|
|
| |
Intel Corp. |
| 199,951 |
| 4,049 |
| |
Micron Technology, Inc. |
| (a)149,850 |
| 2,092 |
| |
|
|
|
| 6,141 |
| |
Energy Equipment (1.1%) |
|
|
|
|
| |
Schlumberger Ltd. |
| 49,120 |
| 3,102 |
| |
Financial — Miscellaneous (4.9%) |
|
|
|
|
| |
Freddie Mac |
| 97,970 |
| 6,652 |
| |
H & R Block, Inc. |
| 11,100 |
| 256 |
| |
Marsh & McLennan Cos., Inc. |
| 210,500 |
| 6,454 |
| |
|
|
|
| 13,362 |
| |
Foods (3.2%) |
|
|
|
|
| |
Cadbury Schweppes plc ADR |
| 76,930 |
| 3,303 |
| |
ConAgra Foods, Inc. |
| 51,030 |
| 1,378 |
| |
Unilever N.V. (NY Shares) |
| 153,520 |
| 4,183 |
| |
|
|
|
| 8,864 |
| |
Insurance: Life (0.8%) |
|
|
|
|
| |
Cigna Corp. |
| 17,480 |
| 2,300 |
| |
Insurance: Multi-Line (2.5%) |
|
|
|
|
| |
Aegon N.V. (NY Registered Shares) |
| 70,830 |
| 1,342 |
| |
Hartford Financial Services Group, Inc. |
| 31,780 |
| 2,965 |
| |
XL Capital Ltd., Class A |
| 36,080 |
| 2,599 |
| |
|
|
|
| 6,906 |
| |
Insurance: Property & Casualty (3.4%) |
|
|
|
|
| |
Chubb Corp. |
| 80,840 |
| 4,277 |
| |
St. Paul Travelers Cos., Inc. (The) |
| 93,705 |
| 5,031 |
| |
|
|
|
| 9,308 |
| |
Manufacturing (2.1%) |
|
|
|
|
| |
Ingersoll Rand Co., Ltd., Class A |
| 16,520 |
| 647 |
| |
Siemens AG ADR |
| 52,170 |
| 5,141 |
| |
|
|
|
| 5,788 |
| |
Materials & Processing — Miscellaneous (1.1%) |
|
|
|
|
| |
Newmont Mining Corp. |
| 68,020 |
| 3,071 |
| |
Medical & Dental Instruments & Supplies (0.6%) |
|
|
|
|
| |
Boston Scientific Corp. |
| (a)102,460 |
| 1,760 |
| |
Multi-Sector Companies (2.8%) |
|
|
|
|
| |
General Electric Co. |
| 209,840 |
| 7,808 |
| |
Oil: Integrated (4.6%) |
|
|
|
|
| |
BP plc ADR |
| 3,880 |
| 261 |
| |
ConocoPhillips |
| 64,810 |
| 4,663 |
| |
Exxon Mobil Corp. |
| 37,820 |
| 2,898 |
| |
Royal Dutch Shell plc ADR |
| 67,300 |
| 4,764 |
| |
|
|
|
| 12,586 |
| |
Radio & TV Broadcasters (0.7%) |
|
|
|
|
| |
Clear Channel Communications, Inc. |
| 53,359 |
| 1,896 |
| |
The accompanying notes are an integral part of the financial statements.
79
2006 Annual Report
December 31, 2006
Portfolio of Investments (cont’d)
Large Cap Relative Value Portfolio
|
|
|
| Value |
| |
|
| Shares |
| (000) |
| |
Retail (3.8%) |
|
|
|
|
| |
Amazon.Com, Inc. |
| (a)44,860 |
| $ | 1,770 |
|
Kohl’s Corp. |
| (a)19,610 |
| 1,342 |
| |
McDonald’s Corp. |
| 36,170 |
| 1,604 |
| |
Office Depot, Inc. |
| (a)30,400 |
| 1,160 |
| |
Wal-Mart Stores, Inc. |
| 100,950 |
| 4,662 |
| |
|
|
|
| 10,538 |
| |
Securities Brokerage & Services (1.6%) |
|
|
|
|
| |
Charles Schwab Corp. (The) |
| 225,470 |
| 4,361 |
| |
Soaps & Household Chemicals (0.7%) |
|
|
|
|
| |
Procter & Gamble Co. |
| 29,850 |
| 1,918 |
| |
Tobacco (1.7%) |
|
|
|
|
| |
Altria Group, Inc. |
| 53,090 |
| 4,556 |
| |
Utilities: Cable TV & Radio (0.8%) |
|
|
|
|
| |
Comcast Corp., Class A |
| (a)48,950 |
| 2,072 |
| |
Utilities: Electrical (4.2%) |
|
|
|
|
| |
American Electric Power Co., Inc. |
| 72,160 |
| 3,073 |
| |
Entergy Corp. |
| 54,602 |
| 5,041 |
| |
FirstEnergy Corp. |
| 56,460 |
| 3,404 |
| |
|
|
|
| 11,518 |
| |
Utilities: Gas Pipelines (0.5%) |
|
|
|
|
| |
Williams Companies, Inc. |
| 51,430 |
| 1,343 |
| |
Utilities — Miscellaneous (0.0%) |
|
|
|
|
| |
Dynegy Holdings, Inc. |
| (a)11,487 |
| 83 |
| |
Utilities: Telecommunications (4.9%) |
|
|
|
|
| |
France Telecom S.A. ADR |
| 77,790 |
| 2,155 |
| |
Sprint Nextel Corp. |
| 253,065 |
| 4,780 |
| |
Verizon Communications, Inc. |
| 177,769 |
| 6,620 |
| |
|
|
|
| 13,555 |
| |
Total Common Stocks (Cost $223,662) |
|
|
| 266,180 |
| |
|
| Face |
|
|
| |
|
| Amount |
|
|
| |
|
| (000) |
|
|
| |
Short-Term Investment (3.3%) |
|
|
|
|
| |
Repurchase Agreement (3.3%) |
|
|
|
|
| |
J.P. Morgan Securities, Inc., 5.20%, dated 12/29/06, due 1/2/07, repurchase price $9,153 |
| $ | (f)9,148 |
| 9,148 |
|
Total Investments (100%) (Cost $232,810) |
|
|
| 275,328 |
| |
Liabilities in Excess of Other Assets (0.0%) |
|
|
| (124 | ) | |
Net Assets (100%) |
|
|
| $275,204 |
| |
(a) | Non-income producing security. |
|
|
(f) | Represents the Portfolio’s undivided interest in a joint repurchase agreement which has a total value of $1,856,998,000. The repurchase agreement was fully collateralized by U.S. government agency securities at the date of this Portfolio of Investments as follows: Federal Farm Credit Bank, 0.00% to 7.43%, due 1/16/07 to 10/23/35; Federal Home Loan Bank, 0.00% to 7.38%, due 1/3/07 to 6/5/28; Federal Home Loan Mortgage Corp., 0.00% to 6.75%, due 1/2/07 to 7/15/32; Federal National Mortgage Association, 0.00% to 8.20%, due 1/12/07 to 11/15/30; Tennessee Valley Authority, 5.38% to 6.75%, due 11/13/08 to 4/1/36, which had a total value of $1,894,142,869. The investment in the repurchase agreement is through participation in a joint account with affiliated parties pursuant to exemptive relief received by the Portfolio from the SEC. |
| |
| |
| |
| |
| |
| |
|
|
ADR | American Depositary Receipts |
The accompanying notes are an integral part of the financial statements.
80
| 2006 Annual Report |
|
|
| December 31, 2006 |
|
|
Investment Overview (unaudited) |
|
|
|
Small Company Growth Portfolio |
|
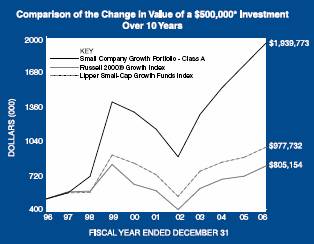
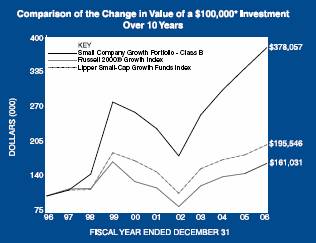
* Minimum Investment
In accordance with SEC regulations, Portfolio performance shown assumes that all recurring fees (including management fees) were deducted and all dividends and distributions were reinvested.
Performance Compared to the Russell 2000® Growth Index(1) and the Lipper Small-Cap Growth Funds Index(2)
|
| Total Returns(3) |
| ||||||
|
|
|
| Average Annual |
| ||||
|
| One |
| Five |
| Ten |
| Since |
|
|
| Year |
| Years |
| Years |
| Inception(6) |
|
Portfolio – Class A (4) |
| 11.90 | % | 11.14 | % | 14.52 | % | 13.45 | % |
Russell 2000® Growth Index |
| 13.35 |
| 6.93 |
| 4.88 |
| 7.69 |
|
Lipper Small-Cap Growth Funds Index |
| 10.65 |
| 6.18 |
| 6.94 |
| 10.44 |
|
|
|
|
|
|
|
|
|
|
|
Portfolio – Class B (5) |
| 11.55 |
| 10.87 |
| 14.22 |
| 13.22 |
|
Russell 2000® Growth Index |
| 13.35 |
| 6.93 |
| 4.88 |
| 5.44 |
|
Lipper Small-Cap Growth Funds Index |
| 10.65 |
| 6.18 |
| 6.94 |
| 7.85 |
|
Performance data quoted represents past performance, which is no guarantee of future results, and current performance may be lower or higher than the figures shown. Performance assumes that all dividends and distributions, if any, were reinvested. For the most recent month-end performance figures, please visit www.morganstanley.com/im. Investment return and principal value will fluctuate so that Portfolio shares, when redeemed, may be worth more or less than their original cost. Total returns do not reflect the deduction of taxes that a shareholder would pay on Portfolio distributions or the redemption of Portfolio shares.
(1) The Russell 2000® Growth Index measures the performance of those Russell 2000® Index companies with higher price-to-book ratios and higher forecasted growth values. The Index is unmanaged and its returns do not include any sales charges or fees. Such costs would lower performance. It is not possible to invest directly in an index.
(2) The Lipper Small-Cap Growth Funds Index is an equally weighted performance index of the largest qualifying funds (based on net assets) in the Lipper Small-Cap Growth Funds classification. The Index, which is adjusted for capital gains distributions and income dividends, is unmanaged and should not be considered an investment. There are currently 30 funds represented in this Index. As of the date of this report, the Portfolio is in the Lipper Small-Cap Growth Funds classification.
(3) Total returns for the Portfolio reflect fees waived and expenses reimbursed, if applicable, by the Adviser. Without such waivers and/or reimbursements, total returns would have been lower. Fee waivers and/or expense reimbursements are voluntary and the Adviser reserves the right to commence or terminate any waiver and/or reimbursement at any time.
(4) Commenced operations on November 1, 1989
(5) Commenced operations on January 2, 1996
(6) For comparative purposes, average annual since inception returns listed for the Indexes refer to the inception date or initial offering of the respective share class of the Portfolio, not the inception of the Index
The Small Company Growth Portfolio seeks long-term capital appreciation by investing primarily in growth-oriented equity securities of small capitalization companies. Investments in small sized corporations are more vulnerable to financial risks and other risks than larger corporations and may involve a higher degree of price volatility than investments in the general equity markets.
81
2006 Annual Report
December 31, 2006
Investment Overview (cont’d)
Small Company Growth Portfolio
Performance
For the year ended December 31, 2006, the Portfolio had a total return based on net asset value per share of 11.90% for the Class A shares, net of fees, and 11.55% for the Class B shares, net of fees, compared to 13.35% for the Russell 2000® Growth Index (the “Index”).
Factors Affecting Performance
- Over the 12-month period ended December 31, 2006, the markets advanced despite considerable volatility. During the first half of the year, investors grappled with high oil prices, rising interest rates, a slowing housing market and an uptick in inflation. Moreover, the Federal Open Market Committee (FOMC) continued its policy of monetary tightening. Investor anxieties erupted in May and June in the form of a market sell-off following the FOMC’s 16th and 17th consecutive federal funds rate increases.
- By August the markets once again entered positive territory. The FOMC stopped raising the target federal funds rate following its June 29th meeting, and left the rate unchanged for the remainder of its policy meetings in 2006. Energy prices were still elevated but receded from the record high set in July. For the most part, corporate earnings reported throughout the year were still better than expected, company balance sheets were healthy, and the exceptionally strong pace of merger and acquisition activity that began in 2005 continued into 2006.
- Although disappointing gross domestic product (GDP) growth data was reported for the second and third quarters, economic growth slowed and housing data continued to decline, the U.S. economy still progressed. By the end of the year, it appeared that the immediate threat of recession subsided and a “soft landing” seemed more possible.
- For the year, value stocks outperformed their growth counterparts, continuing a recent trend. For this same period, small-capitalization securities, in which the Portfolio invests, outpaced both large- and mid-cap stocks.
- The Portfolio underperformed the Index due to stock selection and sector allocation decisions. Within the consumer discretionary sector, a large overweight position detracted from performance, followed by stock selection in the household furnishings, consumer products and textile apparel manufacturing companies, although holdings in communications and media companies and in commercial services did somewhat mitigate returns. Stock selection in crude oil producers in the other energy sector hindered the Portfolio’s returns. Also, within the materials and processing sector, investments in select metals and minerals companies as well as stock selection in real estate firms negatively affected performance.
- There were several areas of strength for the Portfolio, including the technology sector, which benefited from stock selection primarily in miscellaneous technology, computer services software and semi-conductor companies. A sector underweight relative to the Index also proved advantageous. The producer durables sector also did well due to security selection in homebuilding firms and wireless equipment companies. Within the financial services sector, investments in diversified financial services companies and financial information service providers added to relative performance, yet returns were slightly offset by an avoidance of real estate investment trusts (REITs) in this sector.
Management Strategies
- It is our goal to hold a portfolio of high quality growth stocks we believe will perform well regardless of the market environment. We continue to favor companies that have some uniqueness or dynamic competitive advantage in their business model, with a high quality stream of cash flow and the ability to redeploy capital at a high rate of return.
- For the year, consumer discretionary represented the largest sector weight and overweight in the Portfolio, followed by the health care and technology sectors. The health care and technology sectors were underweighted versus the Index for the period.
Expense Examples
As a shareholder of the Portfolio, you may incur two types of costs: (1) transactional costs, including redemption fees; (2) ongoing costs, including management fees, distribution (12b-1) fees (in the case of Class B); and other Portfolio expenses. These examples are intended to help you understand your ongoing costs (in dollars) of investing in the Portfolio and to compare these costs with the ongoing costs of investing in other mutual funds.
The examples are based on an investment of $1,000 invested at the beginning of the six-month period ended December 31, 2006 and held for the entire six-month period.
Actual Expenses
The first line of the tables below provides information about actual account values and actual expenses. You may use the information in this line, together with the amount you invested, to estimate the expenses that you paid over the
82
| 2006 Annual Report |
|
|
| December 31, 2006 |
Investment Overview (cont’d)
Small Company Growth Portfolio
period. Simply divide your account value by $1,000 (for example, an $8,600 account value divided by $1,000 = 8.6), then multiply the result by the number in the first line under the heading entitled “Expenses Paid During Period” to estimate the expenses you paid on your account during this period.
Please note that “Expenses Paid During Period” are grossed up to reflect Portfolio expenses prior to the effect of Expense Offset (See Note E in the Notes to Financial Statements). Therefore, the annualized net expense ratios may differ from the ratio of the expenses to average net assets shown in the Financial Highlights.
Hypothetical Example for Comparison Purposes
The second line of the tables below provides information about hypothetical account values and hypothetical expenses based on the Portfolio’s actual expense ratio and an assumed rate of return of 5% per year before expenses, which is not the Portfolio’s actual return. The hypothetical account values and expenses may not be used to estimate the actual ending account balance or expenses you paid for the period. You may use this information to compare the ongoing costs of investing in the Portfolio and other funds. To do so, compare this 5% hypothetical example with the 5% hypothetical examples that appear in the shareholder reports of the other funds.
Please note that the expenses shown in the table are meant to highlight your ongoing costs only and do not reflect any transactional costs, such as redemption fees. Therefore, the second line of the table is useful in comparing ongoing costs only, and will not help you determine the relative total costs of owning different funds. In addition, if these transactional costs were included, your costs would have been higher.
|
|
|
|
|
| Expenses Paid |
| |||
|
|
|
| Ending Account |
| During Period* |
| |||
|
| Beginning |
| Value |
| July 1, 2006 — |
| |||
|
| Account Value |
| December 31, |
| December 31, |
| |||
|
| July 1, 2006 |
| 2006 |
| 2006 |
| |||
Class A |
|
|
|
|
|
|
| |||
Actual |
| $ | 1,000.00 |
| $ | 1,086.90 |
| $ | 5.42 |
|
Hypothetical (5% average annual return before expenses) |
| 1,000.00 |
| 1,020.01 |
| 5.24 |
| |||
|
|
|
|
|
|
|
| |||
Class B |
|
|
|
|
|
|
| |||
Actual |
| 1,000.00 |
| 1,085.50 |
| 6.73 |
| |||
Hypothetical (5% average annual return before expenses) |
| 1,000.00 |
| 1,018.75 |
| 6.51 |
| |||
* Expenses are equal to Class A and Class B annualized net expense ratios of 1.03% and 1.28%, respectively, multiplied by the average account value over the period, multiplied by 184/365 (to reflect the one-half year period).
Graphic Presentation of Portfolio Holdings
The following graph depicts the Portfolio’s holdings by industry and/or security type, as a percentage of total investments.
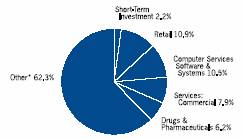
* Industries which do not appear in the above graph, as well as those which represent less than 5% of total investments, if applicable, are included in the category labeled “Other”.
January 2007
83
2006 Annual Report
December 31, 2006
Portfolio of Investments
Small Company Growth Portfolio
|
|
|
| Value |
| |
|
| Shares |
| (000) |
| |
Common Stocks (98.1%) |
|
|
|
|
| |
Building: Cement (1.1%) |
|
|
|
|
| |
Texas Industries, Inc. |
| 326,102 |
| $ | 20,946 |
|
Cable Television Services (0.5%) |
|
|
|
|
| |
Charter Communications, Inc. |
| (a)3,313,491 |
| 10,139 |
| |
Casinos & Gambling (0.3%) |
|
|
|
|
| |
Lakes Entertainment, Inc. |
| (a)493,913 |
| 5,329 |
| |
Communications & Media (0.7%) |
|
|
|
|
| |
CKX, Inc. |
| (a)1,147,442 |
| 13,459 |
| |
Communications Technology (1.8%) |
|
|
|
|
| |
3Com Corp. |
| (a)3,917,472 |
| 16,101 |
| |
GMarket, Inc. ADR |
| (a)763,762 |
| 18,300 |
| |
|
|
|
| 34,401 |
| |
Computer Services Software & Systems (10.5%) |
|
|
|
|
| |
Baidu.com ADR |
| (a)161,281 |
| 18,180 |
| |
Bankrate, Inc. |
| (a)361,323 |
| 13,712 |
| |
Blackboard, Inc. |
| (a)630,776 |
| 18,948 |
| |
Convera Corp. |
| (a)783,452 |
| 3,596 |
| |
Equinix, Inc. |
| (a)742,832 |
| 56,173 |
| |
Forrester Research, Inc. |
| (a)620,549 |
| 16,823 |
| |
IHS, Inc. |
| (a)1,325,375 |
| 52,326 |
| |
Websense, Inc. |
| (a)792,628 |
| 18,096 |
| |
|
|
|
| 197,854 |
| |
Consumer Electronics (1.0%) |
|
|
|
|
| |
CNET Networks, Inc. |
| (a)1,991,822 |
| 18,106 |
| |
Consumer Staples — Miscellaneous (1.7%) |
|
|
|
|
| |
Peet’s Coffee & Tea, Inc. |
| (a)696,812 |
| 18,284 |
| |
Spectrum Brands, Inc. |
| (a)1,179,140 |
| 12,853 |
| |
|
|
|
| 31,137 |
| |
Diversified (1.2%) |
|
|
|
|
| |
Beacon Roofing Supply, Inc. |
| (a)924,769 |
| 17,404 |
| |
FiberTower Corp. |
| (a)893,548 |
| 5,254 |
| |
|
|
|
| 22,658 |
| |
Drugs & Pharmaceuticals (6.2%) |
|
|
|
|
| |
Adams Respiratory Therapeutics, Inc. |
| (a)416,820 |
| 17,011 |
| |
Flamel Technologies ADR |
| (a)745,573 |
| 22,330 |
| |
Gen-Probe, Inc. |
| (a)498,984 |
| 26,132 |
| |
Medicis Pharmaceutical Corp., Class A |
| 1,064,258 |
| 37,387 |
| |
Noven Pharmaceuticals, Inc. |
| (a)570,023 |
| 14,507 |
| |
|
|
|
| 117,367 |
| |
Education Services (4.5%) |
|
|
|
|
| |
Ambassadors Group, Inc. |
| 1,121,556 |
| 34,039 |
| |
Strayer Education, Inc. |
| 477,837 |
| 50,675 |
| |
|
|
|
| 84,714 |
| |
Electronics (0.3%) |
|
|
|
|
| |
Omnivision Technologies, Inc. |
| (a)443,641 |
| 6,056 |
| |
Electronics: Medical Systems (0.5%) |
|
|
|
|
| |
Hologic, Inc. |
| (a)204,860 |
| 9,686 |
| |
Electronics: Semi-Conductors/Components (2.1%) |
|
|
|
|
| |
Tessera Technologies, Inc. |
| (a)959,900 |
| 38,722 |
| |
Energy — Miscellaneous (1.2%) |
|
|
|
|
| |
Quicksilver Resources, Inc. |
| (a)639,107 |
| 23,385 |
| |
Engineering & Contracting Services (2.5%) |
|
|
|
|
| |
Grupo Aeroportuario del Sureste S.A. de |
|
|
|
|
| |
CV ADR |
| 1,216,644 |
| 47,680 |
| |
Entertainment (1.1%) |
|
|
|
|
| |
Vail Resorts, Inc. |
| (a)475,190 |
| 21,298 |
| |
Forest Products (0.7%) |
|
|
|
|
| |
Deltic Timber Corp. |
| 253,050 |
| 14,115 |
| |
Homebuilding (4.6%) |
|
|
|
|
| |
Brookfield Homes Corp. |
| 555,073 |
| 20,843 |
| |
Desarrolladora Homex S.A. de CV ADR |
| (a)1,114,160 |
| 65,813 |
| |
|
|
|
| 86,656 |
| |
Hotel/Motel (3.9%) |
|
|
|
|
| |
Gaylord Entertainment Co. |
| (a)1,075,568 |
| 54,778 |
| |
Orient-Express Hotels Ltd. |
| 398,093 |
| 18,838 |
| |
|
|
|
| 73,616 |
| |
Household Furnishings (1.4%) |
|
|
|
|
| |
Select Comfort Corp. |
| (a)1,482,641 |
| 25,783 |
| |
Industrial Products (0.7%) |
|
|
|
|
| |
Mueller Water Products, Inc. |
| 837,865 |
| 12,459 |
| |
Insurance: Property & Casualty (1.6%) |
|
|
|
|
| |
Alleghany Corp. |
| (a)60,388 |
| 21,957 |
| |
Consolidated-Tomoka Land Co. |
| 113,876 |
| 8,245 |
| |
|
|
|
| 30,202 |
| |
Investment Management Companies (3.3%) |
|
|
|
|
| |
Greenhill & Co., Inc. |
| 849,895 |
| 62,722 |
| |
Leisure Time (3.0%) |
|
|
|
|
| |
Pool Corp. |
| 846,292 |
| 33,149 |
| |
WMS Industries, Inc. |
| (a)652,964 |
| 22,763 |
| |
|
|
|
| 55,912 |
| |
Machinery: Industrial/Specialty(0.8%) |
|
|
|
|
| |
Middleby Corp. |
| (a)148,877 |
| 15,583 |
| |
Medical & Dental Instruments & Supplies (2.6%) |
|
|
|
|
| |
Techne Corp. |
| (a)870,708 |
| 48,281 |
| |
Oil: Crude Producers (0.8%) |
|
|
|
|
| |
GMX Resources, Inc. |
| (a)400,971 |
| 14,234 |
| |
Oil: Integrated Domestic (1.4%) |
|
|
|
|
| |
Delta Petroleum Corp. |
| (a)1,130,780 |
| 26,189 |
| |
Printing & Copying Services (1.0%) |
|
|
|
|
| |
VistaPrint Ltd. |
| (a)587,457 |
| 19,451 |
| |
Publishing — Miscellaneous (3.2%) |
|
|
|
|
| |
Morningstar, Inc. |
| (a)1,348,889 |
| 60,767 |
| |
Real Estate (0.7%) |
|
|
|
|
| |
Grubb & Ellis Co. |
| (a)1,139,058 |
| 13,122 |
| |
Restaurants (3.7%) |
|
|
|
|
| |
BJ’s Restaurants, Inc. |
| (a)1,043,280 |
| 21,085 |
| |
P.F. Chang’s China Bistro, Inc. |
| (a)1,256,685 |
| 48,231 |
| |
|
|
|
| 69,316 |
| |
Retail (11.0%) |
|
|
|
|
| |
AFC Enterprises, Inc. |
| (a)1,594,322 |
| 28,188 |
| |
Blue Nile, Inc. |
| (a)1,179,932 |
| 43,528 |
| |
Build-A-Bear Workshop, Inc. |
| (a)901,788 |
| 25,268 |
| |
Citi Trends, Inc. |
| (a)944,701 |
| 37,448 |
| |
The accompanying notes are an integral part of the financial statements.
84
| 2006 Annual Report |
|
|
| December 31, 2006 |
Portfolio of Investments (cont’d)
Small Company Growth Portfolio
|
|
|
| Value |
| |
|
| Shares |
| (000) |
| |
Retail (cont’d) |
|
|
|
|
| |
Ctrip.com International Ltd. |
| 524,178 |
| $ | 32,751 |
|
J Crew Group, Inc. |
| (a)143,076 |
| 5,515 |
| |
Krispy Kreme Doughnuts, Inc. |
| (a)1,497,307 |
| 16,620 |
| |
NetFlix, Inc. |
| (a)674,281 |
| 17,437 |
| |
|
|
|
| 206,755 |
| |
Service Organizations (1.0%) |
|
|
|
|
| |
Steiner Leisure Ltd. |
| (a)397,489 |
| 18,086 |
| |
|
|
|
|
|
| |
Services: Commercial (7.9%) |
|
|
|
|
| |
Advisory Board Co. (The) |
| (a)1,012,201 |
| 54,193 |
| |
Coinstar, Inc. |
| (a)143,912 |
| 4,399 |
| |
Copart, Inc. |
| (a)687,784 |
| 20,634 |
| |
CoStar Group, Inc. |
| (a)772,146 |
| 41,356 |
| |
Macquarie Infrastructure Co. Trust |
| 812,682 |
| 28,834 |
| |
|
|
|
| 149,416 |
| |
Technology — Miscellaneous (0.3%) |
|
|
|
|
| |
Housevalues, Inc. |
| (a)1,102,466 |
| 6,207 |
| |
Telecommunications Equipment (2.3%) |
|
|
|
|
| |
SBA Communications Corp., Class A |
| (a)1,610,107 |
| 44,278 |
| |
Textile Apparel Manufacturers (1.2%) |
|
|
|
|
| |
Carter’s, Inc. |
| (a)529,609 |
| 13,505 |
| |
Heelys, Inc. |
| (a)288,066 |
| 9,250 |
| |
|
|
|
| 22,755 |
| |
Toys (1.4%) |
|
|
|
|
| |
Marvel Entertainment, Inc. |
| (a)963,598 |
| 25,930 |
| |
Truckers (1.8%) |
|
|
|
|
| |
Landstar System, Inc. |
| 892,665 |
| 34,082 |
| |
Utilities: Telecommunications (0.6%) |
|
|
|
|
| |
IDT Corp., Class B |
| (a)908,756 |
| 11,887 |
| |
Total Common Stocks (Cost $1,583,896) |
|
|
| 1,850,741 |
| |
|
| Face |
|
|
| ||
|
| Amount |
|
|
| ||
|
| (000) |
|
|
| ||
Short-Term Investment (2.2%) |
|
|
|
|
| ||
Repurchase Agreement (2.2%) |
|
|
|
|
| ||
J.P. Morgan Securities, Inc., 5.20%, dated 12/29/06, due 1/2/07, repurchase price $40,995 |
| $ | (f)40,972 |
| 40,972 |
| |
Total Investments (100.3%) (Cost $1,624,868) |
|
|
| 1,891,713 |
| ||
Liabilities in Excess of Other Assets (-0.3%) |
|
|
| (6,408 | ) | ||
Net Assets(100%) |
|
|
| $ | 1,885,305 |
| |
(a) Non-income producing security.
(f) Represents the Portfolio’s undivided interest in a joint repurchase agreement which has a total value of $1,856,998,000. The repurchase agreement was fully collateralized by U.S. government agency securities at the date of this Portfolio of Investments as follows: Federal Farm Credit Bank, 0.00% to 7.43%, due 1/16/07 to 10/23/35; Federal Home Loan Bank, 0.00% to 7.38%, due 1/3/07 to 6/5/28; Federal Home Loan Mortgage Corp., 0.00% to 6.75%, due 1/2/07 to 7/15/32; Federal National Mortgage Association, 0.00% to 8.20%, due 1/12/07 to 11/15/30; Tennessee Valley Authority, 5.38% to 6.75%, due 11/13/08 to 4/1/36, which had a total value of $1,894,142,869. The investment in the repurchase agreement is through participation in a joint account with affiliated parties pursuant to exemptive relief received by the Portfolio from the SEC.
ADR American Depositary Receipts
The accompanying notes are an integral part of the financial statements.
85
2006 Annual Report
December 31, 2006
Investment Overview (unaudited)
Systematic Active Large Cap Core Portfolio
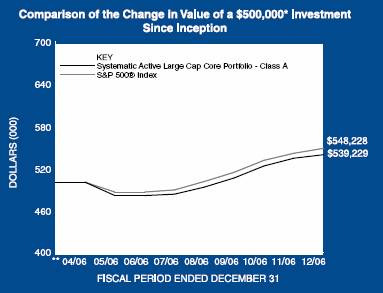

* Minimum Investment
** Commenced operations on April 28, 2006
In accordance with SEC regulations, Portfolio performance shown assumes that all recurring fees (including management fees) were deducted and all dividends and distributions were reinvested.
Performance Compared to the S&P 500® Index (1)
|
| Total Returns(2) |
|
|
| Cumulative |
|
|
| Since |
|
|
| Inception(4) |
|
Portfolio – Class A (3) |
| 7.85 | % |
S&P 500® Index |
| 9.65 |
|
|
|
|
|
Portfolio – Class B (3) |
| 7.68 |
|
S&P 500® Index |
| 9.65 |
|
Performance data quoted represents past performance, which is no guarantee of future results, and current performance may be lower or higher than the figures shown. Performance assumes that all dividends and distributions, if any, were reinvested. For the most recent month-end performance figures, please visit www.morganstanley.com/im. Investment return and principal value will fluctuate so that Portfolio shares, when redeemed, may be worth more or less than their original cost. Total returns do not reflect the deduction of taxes that a shareholder would pay on Portfolio distributions or the redemption of Portfolio shares.
(1) The S&P 500® Index is a capitalization-weighted index of 500 stocks. The Index is designed to measure performance of the broad domestic economy through changes in the aggregate market value of 500 stocks representing all major industries. The Index is unmanaged and its returns do not include any sales charges or fees. Such costs would lower performance. It is not possible to invest directly in an index.
(2) Total returns for the Portfolio reflect fees waived and expenses reimbursed, if applicable, by the Adviser. Without such waivers and/or reimbursements, total returns would have been lower. Fee waivers and/or expense reimbursements are voluntary and the Adviser reserves the right to commence or terminate any waiver and/or reimbursement at any time.
(3) Commenced operations on April 28, 2006
(4) For comparative purposes, cumulative since inception returns listed for the Index refer to the inception date or initial offering of the respective share class of the Portfolio, not the inception of the Index.
The Systematic Active Large Cap Core Portfolio seeks long-term capital appreciation by investing primarily in equity securities of large capitalization companies.
Performance
For the period from April 28, 2006 (commencement of operations) to December 31, 2006, the Portfolio had a total return based on net asset value per share of 7.85% for the Class A shares, net of fees, and 7.68% for the Class B shares, net of fees, compared to 9.65% for the S&P 500® Index (the “Index”).
Factors Affecting Performance
- In the first half of 2006, stock investors dealt with the uncertainties of a slowing economy. There was some well-received merger and acquisition activity in March and April; however, gains were rather muted as investors kept a close eye on inflation levels, energy prices and the policy actions of the Federal Open Market Committee (FOMC ). By May, recession anxieties reached a boiling
86
| 2006 Annual Report |
|
|
| December 31, 2006 |
Investment Overview (cont’d)
Systematic Active Large Cap Core Portfolio
point, prompting a market sell-off and heightened volatility that spanned into June.
- The second half of the year was characterized by greater optimism. The markets began to stabilize in July on the expectation that the FOMC would pause in its increases to the target federal funds target rate, and the FOMC did leave the rate unchanged for the remainder of 2006, given the slowdown in the housing market, rising interest rates and high energy prices. Although third quarter gross domestic product (GDP) growth was below expectations, investors appeared reasonably confident that the economy was moderating and not falling into a recession. Consumer spending and confidence, on the whole, did not flag any significant trouble, although by year end consumer debt levels were garnering greater attention. Warmer weather helped energy prices ease in the final months of 2006, and gasoline prices had also declined. The jobs market softened but was still in line with expectations, and inflation data reported at year end did not cause much of a stir.
- Based on total returns, the Portfolio’s best performing areas were the materials, industrials and consumer staples sectors.
- In terms of contribution to the Portfolio’s overall return, the financials, consumer discretionary and consumer staples sectors had the largest positive impact.
- The materials, utilities and energy sectors added the least to performance.
Management Strategies
- We believe that we can enhance returns by employing a quantitative model that uses multiple, independent factors to examine the fundamentals of a company. We further believe that our quantitative efforts in combination with our fundamental analysis can exploit market inefficiencies.
- We employ a quantitative approach to stock selection utilizing a proprietary quantitative model. The model is driven by rigorous fundamental and quantitative research that screens a universe of large-capitalization companies. The model employs three quantitative screens based on the following primary inputs: earnings expectations, price trends and relative valuations. Individual securities and industries are ranked within each sector by the most effective combination of these disciplines based on the current phase of the economic cycle. We then decide whether to buy, sell or hold a security based on its fundamental analysis and the results of this model-driven approach.
Expense Examples
As a shareholder of the Portfolio, you may incur two types of costs: (1) transactional costs, including redemption fees; (2) ongoing costs, including management fees, distribution (12b-1) fees (in the case of Class B); and other Portfolio expenses. These examples are intended to help you understand your ongoing costs (in dollars) of investing in the Portfolio and to compare these costs with the ongoing costs of investing in other mutual funds.
The examples are based on an investment of $1,000 invested at the beginning of the six-month period ended December 31, 2006 and held for the entire six-month period.
Actual Expenses
The first line of the tables below provides information about actual account values and actual expenses. You may use the information in this line, together with the amount you invested, to estimate the expenses that you paid over the period. Simply divide your account value by $1,000 (for example, an $8,600 account value divided by $1,000 = 8.6), then multiply the result by the number in the first line under the heading entitled “Expenses Paid During Period” to estimate the expenses you paid on your account during this period.
Please note that “Expenses Paid During Period” are grossed up to reflect Portfolio expenses prior to the effect of Expense Offset (See Note E in the Notes to Financial Statements). Therefore, the annualized net expense ratios may differ from the ratio of the expenses to average net assets shown in the Financial Highlights.
Hypothetical Example for Comparison Purposes
The second line of the tables below provides information about hypothetical account values and hypothetical expenses based on the Portfolio’s actual expense ratio and an assumed rate of return of 5% per year before expenses, which is not the Portfolio’s actual return. The hypothetical account values and expenses may not be used to estimate the actual ending account balance or expenses you paid for the period. You may use this information to compare the ongoing costs of investing in the Portfolio and other funds. To do so, compare this 5% hypothetical example with the 5% hypothetical examples that appear in the shareholder reports of the other funds.
Please note that the expenses shown in the table are meant to highlight your ongoing costs only and do not reflect any transactional costs, such as redemption fees. Therefore, the second line of the table is useful in comparing ongoing costs only, and will not help you determine the relative total costs of
87
2006 Annual Report
December 31, 2006
Investment Overview (cont’d)
Systematic Active Large Cap Core Portfolio
owning different funds. In addition, if these transactional costs were included, your costs would have been higher.
|
|
|
|
|
| Expenses Paid |
| |||
|
|
|
| Ending Account |
| During Period* |
| |||
|
| Beginning |
| Value |
| July 1, 2006 — |
| |||
|
| Account Value |
| December 31, |
| December 31, |
| |||
|
| July 1, 2006 |
| 2006 |
| 2006 |
| |||
Class A |
|
|
|
|
|
|
| |||
Actual |
| $ | 1,000.00 |
| $ | 1,122.20 |
| $ | 3.21 |
|
Hypothetical (5% average annual return before expenses) |
| 1,000.00 |
| 1,022.18 |
| 3.06 |
| |||
|
|
|
|
|
|
|
| |||
Class B |
|
|
|
|
|
|
| |||
Actual |
| 1,000.00 |
| 1,121.60 |
| 4.55 |
| |||
Hypothetical (5% average annual return before expenses) |
| 1,000.00 |
| 1,020.92 |
| 4.33 |
| |||
* Expenses are equal to Class A and Class B annualized net expense ratios of 0.60% and 0.85%, respectively, multiplied by the average account value over the period, multiplied by 184/365 (to reflect the one-half year period).
Graphic Presentation of Portfolio Holdings
The following graph depicts the Portfolio’s holdings by industry and/or security type, as a percentage of total investments.
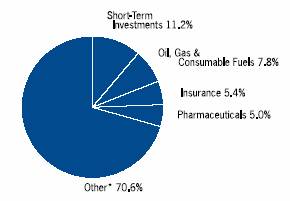
* Industries which do not appear in the above graph, as well as those which represent less than 5% of total investments, if applicable, are included in the category labeled “Other”.
January 2007
88
| 2006 Annual Report |
|
|
| December 31, 2006 |
Portfolio of Investments
Systematic Active Large Cap Core Portfolio
|
|
|
| Value |
| |
|
| Shares |
| (000) |
| |
Common Stocks (94.8%) |
|
|
|
|
| |
Aerospace &Defense (3.6%) |
|
|
|
|
| |
Boeing Co. (The) |
| 368 |
| $ | 33 |
|
General Dynamics Corp. |
| 401 |
| 30 |
| |
Honeywell International, Inc. |
| 543 |
| 24 |
| |
Lockheed Martin Corp. |
| 406 |
| 37 |
| |
Northrop Grumman Corp. |
| 496 |
| 34 |
| |
Raytheon Co. |
| 373 |
| 20 |
| |
United Technologies Corp. |
| 814 |
| 51 |
| |
|
|
|
| 229 |
| |
Air Freight & Logistics (0.8%) |
|
|
|
|
| |
FedEx Corp. |
| 281 |
| 31 |
| |
United Parcel Service, Inc., Class B |
| 300 |
| 22 |
| |
|
|
|
| 53 |
| |
Auto Components (0.5%) |
|
|
|
|
| |
Johnson Controls, Inc. |
| 351 |
| 30 |
| |
Beverages (0.4%) |
|
|
|
|
| |
MGP Ingredients, Inc. |
| (c)1,048 |
| 24 |
| |
Biotechnology (1.2%) |
|
|
|
|
| |
Amgen, Inc. |
| (a)468 |
| 32 |
| |
Genentech, Inc. |
| (a)233 |
| 19 |
| |
Gilead Sciences, Inc. |
| (a)392 |
| 25 |
| |
|
|
|
| 76 |
| |
Building Products (0.3%) |
|
|
|
|
| |
USG Corp. |
| (a)(c)352 |
| 19 |
| |
Capital Markets (5.3%) |
|
|
|
|
| |
Bear Stearns Co., Inc. |
| 372 |
| 61 |
| |
E*Trade Group, Inc. |
| (a)975 |
| 22 |
| |
Goldman Sachs Group, Inc. |
| 503 |
| 100 |
| |
Lehman Brothers Holdings, Inc. |
| 966 |
| 75 |
| |
Merrill Lynch & Co., Inc. |
| 856 |
| 80 |
| |
|
|
|
| 338 |
| |
Chemicals (0.0%) |
|
|
|
|
| |
Tronox, Inc. |
| (c)20 |
| @— |
| |
|
|
|
|
|
| |
Commercial Banks (3.3%) |
|
|
|
|
| |
Bank of America Corp. |
| 2,637 |
| 141 |
| |
National City Corp. |
| 1,302 |
| 47 |
| |
Wells Fargo & Co. |
| 636 |
| 23 |
| |
|
|
|
| 211 |
| |
Commercial Services & Supplies (0.4%) |
|
|
|
|
| |
Manpower, Inc. |
| 350 |
| 26 |
| |
Communications Equipment (4.6%) |
|
|
|
|
| |
ADC Telecommunications, Inc. |
| (a)(c)1,152 |
| 17 |
| |
Cisco Systems, Inc. |
| (a)4,438 |
| 121 |
| |
Comverse Technology, Inc. |
| (a)803 |
| 17 |
| |
Corning, Inc. |
| (a)2,890 |
| 54 |
| |
Motorola, Inc. |
| 1,905 |
| 39 |
| |
QUALCOMM, Inc. |
| 459 |
| 17 |
| |
Tellabs, Inc. |
| (a)3,095 |
| 32 |
| |
|
|
|
| 297 |
| |
Computers & Peripherals (4.4%) |
|
|
|
|
| |
Apple Computer, Inc. |
| (a)240 |
| 21 |
| |
Hewlett-Packard Co. |
| 2,789 |
| 115 |
| |
International Business Machines Corp. |
| 1,104 |
| 107 |
| |
Lexmark International Group, Inc. |
| (a)331 |
| 24 |
| |
SanDisk Corp. |
| (a)426 |
| 18 |
| |
|
|
|
| 285 |
| |
Consumer Finance (0.9%) |
|
|
|
|
| |
American Express Co. |
| 431 |
| 26 |
| |
AmeriCredit Corp. |
| (a)(c)552 |
| 14 |
| |
Capital One Financial Corp. |
| 209 |
| 16 |
| |
|
|
|
| 56 |
| |
Diversified Financial Services (4.1%) |
|
|
|
|
| |
Chicago Mercantile Exchange Holdings, Inc. |
| 101 |
| 51 |
| |
CIT Group, Inc. |
| 397 |
| 22 |
| |
Citigroup, Inc. |
| 1,450 |
| 81 |
| |
JPMorgan Chase & Co. |
| 1,870 |
| 90 |
| |
Nasdaq Stock Market, Inc. (The) |
| (a)574 |
| 18 |
| |
|
|
|
| 262 |
| |
Diversified Telecommunication Services (2.7%) |
|
|
|
|
| |
AT&T, Inc. |
| 1,947 |
| 70 |
| |
BellSouth Corp. |
| 1,314 |
| 62 |
| |
Verizon Communications, Inc. |
| 1,115 |
| 41 |
| |
|
|
|
| 173 |
| |
Electric Utilities (1.1%) |
|
|
|
|
| |
AES Corp. (The) |
| (a)1,019 |
| 22 |
| |
Exelon Corp. |
| 383 |
| 24 |
| |
Pepco Holdings, Inc. |
| 932 |
| 24 |
| |
|
|
|
| 70 |
| |
Electronic Equipment & Instruments (0.6%) |
|
|
|
|
| |
Jabil Circuit, Inc. |
| 1,015 |
| 25 |
| |
Vishay Intertechnology,Inc. |
| (a)1,056 |
| 14 |
| |
|
|
|
| 39 |
| |
Energy Equipment & Services (0.9%) |
|
|
|
|
| |
FMC Corp. |
| 264 |
| 20 |
| |
Halliburton Co. |
| 432 |
| 14 |
| |
Transocean, Inc. |
| (a)270 |
| 22 |
| |
|
|
|
| 56 |
| |
Food & Staples Retailing (1.7%) |
|
|
|
|
| |
CVS Corp. |
| 555 |
| 17 |
| |
Safeway, Inc. |
| 955 |
| 33 |
| |
Supervalu, Inc. |
| 592 |
| 21 |
| |
Wal-Mart Stores, Inc. |
| 476 |
| 22 |
| |
Whole Foods Market, Inc. |
| (c)315 |
| 15 |
| |
|
|
|
| 108 |
| |
Food Products (1.4%) |
|
|
|
|
| |
Archer-Daniels-Midland Co. |
| 1,345 |
| 43 |
| |
General Mills, Inc. |
| 841 |
| 49 |
| |
|
|
|
| 92 |
| |
Health Care Equipment & Supplies (1.6%) |
|
|
|
|
| |
Advanced Medical Optics, Inc. |
| (a)(c)883 |
| 31 |
| |
Kinetic Concepts, Inc. |
| (a)(c)587 |
| 23 |
| |
Thermo Electron Corp. |
| (a)1,137 |
| 52 |
| |
|
|
|
| 106 |
| |
The accompanying notes are an integral part of the financial statements.
89
2006 Annual Report
December 31, 2006
Portfolio of Investments (cont’d)
Systematic Active Large Cap Core Portfolio
|
|
|
| Value |
| |
|
| Shares |
| (000) |
| |
Health Care Providers & Services (5.0%) |
|
|
|
|
| |
Aetna, Inc. |
| 180 |
| $ | 8 |
|
Cardinal Health, Inc. |
| 376 |
| 24 |
| |
Express Scripts, Inc. |
| (a)249 |
| 18 |
| |
Health Net, Inc. |
| (a)(c)651 |
| 32 |
| |
Humana, Inc. |
| (a)715 |
| 40 |
| |
Quest Diagnostics, Inc. |
| 926 |
| 49 |
| |
UnitedHealth Group, Inc. |
| 1,740 |
| 93 |
| |
Wellpoint Health Networks, Inc. |
| (a)726 |
| 57 |
| |
|
|
|
| 321 |
| |
Hotels Restaurants & Leisure (2.7%) |
|
|
|
|
| |
Harrah’s Entertainment, Inc. |
| 257 |
| 21 |
| |
Marriott International,Inc., Class A |
| 614 |
| 29 |
| |
McDonald’s Corp. |
| 1,568 |
| 70 |
| |
Panera Bread Co. |
| (a)(c)323 |
| 18 |
| |
Starbucks Corp. |
| (a)449 |
| 16 |
| |
Yum! Brands, Inc. |
| 309 |
| 18 |
| |
|
|
|
| 172 |
| |
Household Durables (0.4%) |
|
|
|
|
| |
Tempur-Pedic International, Inc. |
| (a)(c)1,199 |
| 25 |
| |
Household Products(1.5%) |
|
|
|
|
| |
Energizer Holdings, Inc. |
| (a)(c)238 |
| 17 |
| |
Hansen Natural Corp. |
| (a)(c)558 |
| 19 |
| |
Procter & Gamble Co. |
| 909 |
| 58 |
| |
|
|
|
| 94 |
| |
Industrial Conglomerates (1.5%) |
|
|
|
|
| |
General Electric Co. |
| 2,555 |
| 95 |
| |
Information Technology Services (0.8%) |
|
|
|
|
| |
Accenture Ltd., Class A |
| 830 |
| 31 |
| |
Convergys Corp. |
| (a)895 |
| 21 |
| |
|
|
|
| 52 |
| |
Insurance (5.8%) |
|
|
|
|
| |
Allstate Corp. (The) |
| 558 |
| 36 |
| |
American Financial Group, Inc. |
| 795 |
| 29 |
| |
American International Group, Inc. |
| 783 |
| 56 |
| |
Archstone-Smith Trust REIT |
| 432 |
| 25 |
| |
Chubb Corp. |
| 710 |
| 38 |
| |
CNA Financial Corp. |
| (a)480 |
| 19 |
| |
Loews Corp. |
| 903 |
| 37 |
| |
Metlife, Inc. |
| 718 |
| 42 |
| |
Philadelphia Consolidated Holding Corp. |
| (a)585 |
| 26 |
| |
Prudential Financial, Inc. |
| 335 |
| 29 |
| |
St. Paul Travelers Cos., Inc. (The) |
| 609 |
| 33 |
| |
|
|
|
| 370 |
| |
Internet & Catalog Retail (0.9%) |
|
|
|
|
| |
eBay, Inc. |
| (a)1,151 |
| 35 |
| |
Expedia, Inc. |
| (a)(c)1,088 |
| 23 |
| |
|
|
|
| 58 |
| |
Machinery (1.4%) |
|
|
|
|
| |
Caterpillar, Inc. |
| 321 |
| 20 |
| |
Danaher Corp. |
| 121 |
| 9 |
| |
Deere & Co. |
| 436 |
| 41 |
| |
Joy Global, Inc. |
| 412 |
| 20 |
| |
|
|
|
| 90 |
| |
Media (2.6%) |
|
|
|
|
| |
Comcast Corp. |
| (a)1,513 |
| 64 |
| |
Meredith Corp. |
| 282 |
| 16 |
| |
News Corp., Inc. |
| 1,477 |
| 32 |
| |
Time Warner, Inc. |
| 1,386 |
| 30 |
| |
Walt Disney Co. (The) |
| 765 |
| 26 |
| |
|
|
|
| 168 |
| |
Metals & Mining (1.9%) |
|
|
|
|
| |
Alcan, Inc. |
| (c)369 |
| 18 |
| |
Alcoa, Inc. |
| 319 |
| 10 |
| |
Phelps Dodge Corp. |
| 312 |
| 37 |
| |
Rio Tinto plc ADR |
| (c)83 |
| 18 |
| |
Southern Copper Corp. |
| (c)326 |
| 17 |
| |
United States Steel LLC |
| 302 |
| 22 |
| |
|
|
|
| 122 |
| |
Multi-Utilities (0.5%) |
|
|
|
|
| |
Duke Energy Corp. |
| 946 |
| 31 |
| |
Multiline Retail (2.2%) |
|
|
|
|
| |
Federated Department Stores, Inc. |
| 1,458 |
| 56 |
| |
J.C. Penney Co., Inc. |
| 831 |
| 64 |
| |
Nordstrom, Inc. |
| 408 |
| 20 |
| |
|
|
|
| 140 |
| |
Oil, Gas & Consumable Fuels (8.4%) |
|
|
|
|
| |
Anadarko Petroleum Corp. |
| 342 |
| 15 |
| |
Chevron Corp. |
| 908 |
| 67 |
| |
ConocoPhillips |
| 1,428 |
| 103 |
| |
Exxon Mobil Corp. |
| 2,142 |
| 164 |
| |
Hess Corp. |
| 355 |
| 18 |
| |
Marathon Oil Co. |
| 486 |
| 45 |
| |
Monsanto Co. |
| 368 |
| 19 |
| |
Overseas Shipholding Group, Inc. |
| (c)576 |
| 32 |
| |
Superior Energy Services, Inc. |
| (a)811 |
| 27 |
| |
Valero Energy Corp. |
| 907 |
| 46 |
| |
|
|
|
| 536 |
| |
Personal Products (0.3%) |
|
|
|
|
| |
Estee Lauder Cos., Inc. (The) |
| 543 |
| 22 |
| |
Pharmaceuticals (5.3%) |
|
|
|
|
| |
Johnson & Johnson |
| 1,578 |
| 104 |
| |
Merck & Co., Inc. |
| 1,795 |
| 78 |
| |
Pfizer, Inc. |
| 1,687 |
| 44 |
| |
Schering-Plough Corp. |
| 1,662 |
| 40 |
| |
Teva Pharmaceutical Industries Ltd. |
| 773 |
| 24 |
| |
Wyeth |
| 1,025 |
| 52 |
| |
|
|
|
| 342 |
| |
Real Estate (0.5%) |
|
|
|
|
| |
CapitalSource, Inc. |
| (c)1,099 |
| 30 |
| |
Road & Rail (1.2%) |
|
|
|
|
| |
Burlington North Santa Fe Corp. |
| 610 |
| 45 |
| |
CSX Corp. |
| 977 |
| 34 |
| |
|
|
|
| 79 |
| |
The accompanying notes are an integral part of the financial statements.
90
| 2006 Annual Report |
|
|
| December 31, 2006 |
Portfolio of Investments (cont’d)
Systematic Active Large Cap Core Portfolio
|
|
|
| Value |
| |
|
| Shares |
| (000) |
| |
Semiconductors & Semiconductor Equipment (1.8%) |
|
|
|
|
| |
Applied Materials, Inc. |
| 1,031 |
| $ | 19 |
|
Intel Corp. |
| 1,597 |
| 32 |
| |
Micron Technology, Inc. |
| (a)1,333 |
| 19 |
| |
Tektronix, Inc. |
| 642 |
| 19 |
| |
Texas Instruments, Inc. |
| 1,051 |
| 30 |
| |
|
|
|
| 119 |
| |
Software (2.5%) |
|
|
|
|
| |
Citrix Systems, Inc. |
| (a)654 |
| 18 |
| |
Microsoft Corp. |
| 2,718 |
| 81 |
| |
Oracle Corp. |
| (a)2,529 |
| 43 |
| |
Synopsys, Inc. |
| (a)748 |
| 20 |
| |
|
|
|
| 162 |
| |
Specialty Retail (2.7%) |
|
|
|
|
| |
Abercrombie & Fitch Co. |
| 227 |
| 16 |
| |
American Eagle Outfitters, Inc. |
| 1,078 |
| 34 |
| |
AMR Corp. |
| (a)402 |
| 12 |
| |
Best Buy Co., Inc. |
| 739 |
| 36 |
| |
Chico’s FAS, Inc. |
| (a)(c)688 |
| 14 |
| |
Continental Airlines, Inc., Class B |
| (a)(c)253 |
| 10 |
| |
Men’s Wearhouse, Inc. |
| (c)850 |
| 33 |
| |
Staples, Inc. |
| 625 |
| 17 |
| |
|
|
|
| 172 |
| |
Textiles, Apparel & Luxury Goods (1.1%) |
|
|
|
|
| |
Coach, Inc. |
| (a)536 |
| 23 |
| |
Nike Inc. |
| 304 |
| 30 |
| |
Polo Ralph Lauren Corp. |
| 232 |
| 18 |
| |
|
|
|
| 71 |
| |
Thrifts & Mortgage Finance (1.2%) |
|
|
|
|
| |
Fannie Mae |
| 702 |
| 41 |
| |
Radian Group, Inc. |
| 349 |
| 19 |
| |
Washington Mutual, Inc. |
| 456 |
| 21 |
| |
|
|
|
| 81 |
| |
Tobacco (2.8%) |
|
|
|
|
| |
Altria Group, Inc. |
| 1,331 |
| 114 |
| |
Loews Corp. - Carolina Group |
| 739 |
| 48 |
| |
Reynolds American, Inc. |
| (c)281 |
| 19 |
| |
|
|
|
| 181 |
| |
Total Common Stocks (Cost $5,634) |
|
|
| 6,083 |
| |
|
| Face |
|
|
| ||||
|
| Amount |
|
|
| ||||
|
| (000) |
|
|
| ||||
Short-Term Investments (12.0%) |
|
|
|
|
| ||||
Short-Term Debt Securities held as Collateral on Loaned Securities (6.6%) |
|
|
|
|
| ||||
Alliance & Leicester plc, |
|
|
|
|
| ||||
5.36%, 1/8/07 |
| $ | (h)13 |
| 13 |
| |||
Bancaja, 5.37%, 1/19/07 |
| (h)7 |
| 7 |
| ||||
Bank of America Corp., 5.32%, 1/2/07 |
| (h)22 |
| 22 |
| ||||
Bank of New York Co., Inc., |
|
|
|
|
| ||||
5.34%, 1/10/07 |
| (h)7 |
| 7 |
| ||||
Bear Stearns & Co., Inc., |
|
|
|
|
| ||||
5.37%, 1/2/07 |
| (h)8 |
| 8 |
| ||||
5.38%, 1/2/07 |
| (h)5 |
| 5 |
| ||||
5.39%, 1/16/07 |
| (h)14 |
| 14 |
| ||||
BNP Paribas plc, |
|
|
|
|
| ||||
5.35%, 2/20/07 |
| (h)14 |
| 14 |
| ||||
CIC, New York, |
|
|
|
|
| ||||
5.33%, 1/3/07 |
| (h)9 |
| 9 |
| ||||
5.34%, 1/2/07 |
| (h)14 |
| 14 |
| ||||
Dekabank Deutsche Girozentrale, |
|
|
|
|
| ||||
5.39%, 1/19/07 |
| (h)14 |
| 14 |
| ||||
Deutsche Bank Securities, Inc., |
|
|
|
|
| ||||
5.33%, 1/2/07 |
| 44 |
| 44 |
| ||||
Dexia Bank, New York, |
|
|
|
|
| ||||
5.33%, 1/2/07 |
| (h)14 |
| 14 |
| ||||
Gemini Securitization Corp., |
|
|
|
|
| ||||
5.34%, 1/2/07 |
| 7 |
| 7 |
| ||||
Goldman Sachs Group, Inc., |
|
|
|
|
| ||||
5.40%, 1/16/07 |
| (h)7 |
| 7 |
| ||||
5.42%, 1/2/07 |
| (h)13 |
| 13 |
| ||||
HSBC Finance Corp., 5.34%, 1/8/07 |
| (h)7 |
| 7 |
| ||||
Liberty Lighthouse U.S. Capital, |
|
|
|
|
| ||||
5.33%, 1/2/07 |
| (h)7 |
| 7 |
| ||||
Manufacturers & Traders, |
|
|
|
|
| ||||
5.33%, 1/16/07 |
| (h)8 |
| 8 |
| ||||
Merrill Lynch & Co., |
|
|
|
|
| ||||
5.35%, 1/26/07 |
| (h)7 |
| 7 |
| ||||
Mitsubishi UFJ FinancialGroup, |
|
|
|
|
| ||||
5.33%, 1/2/07 |
| (h)7 |
| 7 |
| ||||
Natexis Banques Populaires, New York, |
|
|
|
|
| ||||
5.34%, 1/2/07 |
| (h)14 |
| 14 |
| ||||
5.35%, 1/2/07 |
| (h)7 |
| 7 |
| ||||
National City Bank Cleveland, |
|
|
|
|
| ||||
5.32%, 1/2/07 |
| (h)20 |
| 20 |
| ||||
National Rural Utilities Cooperative Finance Corp., |
|
|
|
|
| ||||
5.34%, 1/2/07 |
| (h)27 |
| 27 |
| ||||
Nationwide B uilding Society, |
|
|
|
|
| ||||
5.44%, 3/28/07 |
| (h)16 |
| 16 |
| ||||
Nordea Bank, New York, |
|
|
|
|
| ||||
5.31%, 1/2/07 |
| (h)20 |
| 20 |
| ||||
Rhein-Main Securitisation Ltd., |
|
|
|
|
| ||||
5.33%, 1/18/07 |
| 6 |
| 6 |
| ||||
Skandi, NewYork, |
|
|
|
|
| ||||
5.34%, 1/9/07 |
| (h)14 |
| 14 |
| ||||
SLM Corp., 5.36%, 1/22/07 |
| (h)14 |
| 14 |
| ||||
Toronto Dominion, New York, |
|
|
|
|
| ||||
5.32%, 5/29/07 |
| (h)14 |
| 14 |
| ||||
Tulip Funding, 5.36%, 1/16/07 |
| 7 |
| 7 |
| ||||
Unicredito Italiano Bank (Ireland) plc, |
|
|
|
|
| ||||
5.36%, 1/9/07 |
| (h)9 |
| 9 |
| ||||
World Savings Bank FSB, |
|
|
|
|
| ||||
5.35%, 1/19/07 |
| (h)5 |
| 5 |
| ||||
|
|
|
| 421 |
| ||||
The accompanying notes are an integral part of the financial statements.
91
2006 Annual Report
December 31, 2006
Portfolio of Investments (cont’d)
Systematic Active Large Cap Core Portfolio
|
| Face |
|
|
| ||
|
| Amount |
| Value |
| ||
|
| (000) |
| (000) |
| ||
Repurchase Agreement (5.4%) |
|
|
|
|
| ||
J.P. Morgan Securities, Inc., 5.20%, dated 12/29/06, due 1/2/07, repurchase price $345 |
| $ | (f)345 |
| $ | 345 |
|
Total Short-Term Investments (Cost $766) |
|
|
| 766 |
| ||
Total Investments (106.8%) (Cost $6,400) including $412 of Securities Loaned |
|
|
| 6,849 |
| ||
Liabilities in Excess of Other Assets (-6.8%) |
|
|
| (434) |
| ||
Net Assets(100%) |
|
|
| $ | 6,415 |
| |
(a) Non-income producing security.
(c) All or portion of security on loan at December 31, 2006.
(f) Represents the Portfolio’s undivided interest in a joint repurchase agreement which has a total value of $1,856,998,000. The repurchase agreement was fully collateralized by U.S. government agency securities at the date of this Portfolio of Investments as follows: Federal Farm Credit Bank, 0.00% to 7.43%, due 1/16/07 to 10/23/35; Federal Home Loan Bank, 0.00% to 7.38%, due 1/3/07 to 6/5/28; Federal Home Loan Mortgage Corp., 0.00% to 6.75%, due 1/2/07 to 7/15/32; Federal National Mortgage Association, 0.00% to 8.20%, due 1/12/07 to 11/15/30; Tennessee Valley Authority, 5.38% to 6.75%, due 11/13/08 to 4/1/36, which had a total value of $1,894,142,869. The investment in the repurchase agreement is through participation in a joint account with affiliated parties pursuant to exemptive relief received by the Portfolio from the SEC.
(h) Variable/Floating Rate Security — interest rate changes on these instruments are based on changes in a designated base rate. The rates shown are those in effect on December 31, 2006.
@ Face Amount/Value is less than $500.
ADR American Depositary Receipts
REIT Real Estate Investment Trust
Futures Contracts:
The Portfolio had the following futures contract(s) open at period end:
|
|
|
|
|
|
|
| Net |
| ||
|
|
|
|
|
|
|
| Unrealized |
| ||
|
| Number |
|
|
|
|
| Appreciation |
| ||
|
| of |
| Value |
| Expiration |
| (Depreciation) |
| ||
|
| Contracts |
| (000) |
| Date |
| (000) |
| ||
Long: |
|
|
|
|
|
|
|
|
| ||
E-Mini S&P 500 (United States) |
| 5 |
| $ | 357 |
| Mar-07 |
| $ | @— |
|
The accompanying notes are an integral part of the financial statements.
92
| 2006 Annual Report |
|
|
| December 31, 2006 |
Investment Overview (unaudited)
Systematic Active Small Cap Core Portfolio

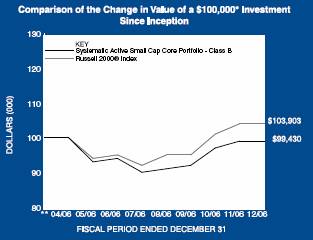
* Minimum Investment
** Commenced operations on April 28, 2006
In accordance with SEC regulations, Portfolio performance shown assumes that all recurring fees (including management fees) were deducted and all dividends and distributions were reinvested.
Performance Compared to the Russell 2000® Index(1)
|
| Total Returns(2) |
|
|
| Cumulative |
|
|
| Since |
|
|
| Inception(4) |
|
Portfolio – Class A (3) |
| (0.41 | )% |
Russell 2000® Index |
| 3.90 |
|
|
|
|
|
Portfolio – Class B (3) |
| (0.57 | ) |
Russell 2000® Index |
| 3.90 |
|
Performance data quoted represents past performance, which is no guarantee of future results, and current performance may be lower or higher than the figures shown. Performance assumes that all dividends and distributions, if any, were reinvested. For the most recent month-end performance figures, please visit www.morganstanley.com/im. Investment return and principal value will fluctuate so that Portfolio shares, when redeemed, may be worth more or less than their original cost. Total returns do not reflect the deduction of taxes that a shareholder would pay on Portfolio distributions or the redemption of Portfolio shares.
(1) The Russell 2000® Index is constructed to provide a comprehensive and unbiased small-cap barometer and is completely reconstituted annually to ensure larger stocks do not distort the performance and characteristics of the true small-cap opportunity set. The Russell 2000® includes the smallest 2000 securities in the Russell 3000® . The Index is unmanaged and its returns do not include any sales charges or fees. Such costs would lower performance. It is not possible to invest directly in an index.
(2) Total returns for the Portfolio reflect fees waived and expenses reimbursed, if applicable, by the Adviser. Without such waivers and/or reimbursements, total returns would have been lower. Fee waivers and/or expense reimbursements are voluntary and the Adviser reserves the right to commence or terminate any waiver and/or reimbursement at any time.
(3) Commenced operations on April 28, 2006
(4) For comparative purposes, cumulative since inception returns listed for the Index refer to the inception date or initial offering of the respective share class of the Portfolio, not the inception of the Index.
The Systematic Active Small Cap Core Portfolio seeks longterm capital appreciation by investing primarily in equity securities of small capitalization companies. Investments in small sized corporations are more vulnerable to financial risks and other risks than larger corporations and may involve a higher degree of price volatility than investments in the general equity markets.
Performance
For the period from April 28, 2006 (commencement of operations) to December 31, 2006, the Portfolio had a total return based on net asset value per share of (0.41)% for the Class A shares, net of fees, and (0.57)% for the Class B shares, net of fees, compared to 3.90% for the Russell 2000® Index (the “Index”).
Factors Affecting Performance
• The Portfolio’s launch in April coincided with the turbulent second quarter of 2006. Although small-cap stocks subsequently returned to positive territory in the third and fourth quarters, the Index had only a modest gain for the period since inception through December 31, 2006, and the Portfolio was virtually flat for the period.
• In the first half of 2006, stock investors dealt with the uncertainties of a slowing economy. There was some well-received merger and acquisition activity in March and April; however, gains were rather muted as investors kept a close eye on inflation levels, energy prices and the policy actions of the Federal Open Market Committee (FOMC). By May, recession anxieties reached a boiling
93
2006 Annual Report
December 31, 2006
Investment Overview (cont’d)
Systematic Active Small Cap Core Portfolio
point, prompting a market sell-off and heightened volatility that spanned into June.
• The second half of the year was characterized by greater optimism. The markets began to stabilize in July on the expectation that the FOMC would pause in its increases to the target federal funds target rate, and the FOMC did leave the rate unchanged for the remainder of 2006, given the slowdown in the housing market, rising interest rates and high energy prices. Although third quarter gross domestic product (GDP) growth was below expectations, investors appeared reasonably confident that the economy was moderating and not falling into a recession. Consumer spending and confidence, on the whole, did not flag any significant trouble, although by year end consumer debt levels were garnering greater attention. Warmer weather helped energy prices ease in the final months of 2006, and gasoline prices had also declined. The jobs market softened but was still in line with expectations, and inflation data reported at year end did not cause much of a stir.
• In aggregate, the Portfolio’s utilities holdings had the highest total return during the period, while technology holdings returned least.
• In terms of contribution to the Portfolio’s overall return, the financial sector had the largest positive impact, while the technology sector was the largest detractor from performance.
• Relative to the Index, the Portfolio outperformed in the health care sector. Strong performance from a medical device holding and a pharmaceutical holding drove considerable gains.
• The Portfolio’s financial stocks, despite having the highest absolute return for the period, were the most significant source of underperformance relative to the Index. An underweight allocation in real estate investment trusts (REIT), one of the market’s best performing areas, and exposure to several sub-prime lending companies, whose stocks faltered during the period, detracted from results.
Management Strategies
• We believe that we can enhance returns by employing a quantitative model that uses multiple, independent factors to examine the fundamentals of a company. We further believe that our quantitative efforts in combination with our fundamental analysis can exploit market inefficiencies.
• We employ a quantitative approach to stock selection utilizing a proprietary quantitative model. The model is driven by rigorous fundamental and quantitative research that screens a universe of large capitalization companies. The model employs three quantitative screens based on the following primary inputs-earnings expectations, price trends and relative valuations. Individual securities and industries are ranked within each sector by the most effective combination of these disciplines based on the current phase of the economic cycle. We then decide whether to buy, sell or hold a security based on its fundamental analysis and the results of this model-driven approach.
Expense Examples
As a shareholder of the Portfolio, you may incur two types of costs: (1) transactional costs, including redemption fees; (2) ongoing costs, including management fees, distribution (12b-1) fees (in the case of Class B); and other Portfolio expenses.
These examples are intended to help you understand your ongoing costs (in dollars) of investing in the Portfolio and to compare these costs with the ongoing costs of investing in other mutual funds.
The examples are based on an investment of $1,000 invested at the beginning of the six-month period ended December 31, 2006 and held for the entire six-month period.
Actual Expenses
The first line of the tables below provides information about actual account values and actual expenses. You may use the information in this line, together with the amount you invested, to estimate the expenses that you paid over the period. Simply divide your account value by $1,000 (for example, an $8,600 account value divided by $1,000 = 8.6), then multiply the result by the number in the first line under the heading entitled “Expenses Paid During Period” to estimate the expenses you paid on your account during this period.
Please note that “Expenses Paid During Period” are grossed up to reflect Portfolio expenses prior to the effect of Expense Offset (See Note E in the Notes to Financial Statements). Therefore, the annualized net expense ratios may differ from the ratio of the expenses to average net assets shown in the Financial Highlights.
Hypothetical Example for Comparison Purposes
The second line of the tables below provides information about hypothetical account values and hypothetical expenses based on the Portfolio’s actual expense ratio and an assumed rate of return of 5% per year before expenses, which is not the Portfolio’s actual return. The hypothetical account values and expenses may not be used to estimate the actual ending
94
| 2006 Annual Report |
|
|
| December 31, 2006 |
Investment Overview (cont’d)
Systematic Active Small Cap Core Portfolio
account balance or expenses you paid for the period. You may use this information to compare the ongoing costs of investing in the Portfolio and other funds. To do so, compare this 5% hypothetical example with the 5% hypothetical examples that appear in the shareholder reports of the other funds.
Please note that the expenses shown in the table are meant to highlight your ongoing costs only and do not reflect any transactional costs, such as redemption fees. Therefore, the second line of the table is useful in comparing ongoing costs only, and will not help you determine the relative total costs of owning different funds. In addition, if these transactional costs were included, your costs would have been higher.
|
|
|
|
|
| Expenses Paid |
| |||
|
|
|
| Ending |
| During Period* |
| |||
|
| Beginning |
| Account Value |
| July 1, 2006 — |
| |||
|
| Account Value |
| December 31, |
| December 31, |
| |||
|
| July 1, 2006 |
| 2006 |
| 2006 |
| |||
Class A |
|
|
|
|
|
|
| |||
Actual |
| $ | 1,000.00 |
| $ | 1,064.00 |
| $ | 5.72 |
|
Hypothetical (5% average annual return before expenses) |
| 1,000.00 |
| 1,019.66 |
| 5.60 |
| |||
|
|
|
|
|
|
|
| |||
Class B |
|
|
|
|
|
|
| |||
Actual |
| 1,000.00 |
| 1,062.30 |
| 7.02 |
| |||
Hypothetical (5% average annual return before expenses) |
| 1,000.00 |
| 1,018.40 |
| 6.87 |
| |||
* Expenses are equal to Class A and Class B annualized net expense ratios of 1.10% and 1.35%, respectively, multiplied by the average account value over the period, multiplied by 184/365 (to reflect the one-half year period).
Graphic Presentation of Portfolio Holdings
The following graph depicts the Portfolio’s holdings by industry and/or security type, as a percentage of total investments.
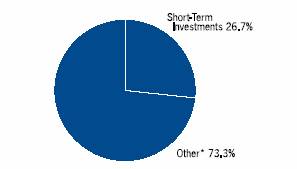
* Industries which do not appear in the above graph, as well as those which represent less than 5% of total investments, if applicable, are included in the category labeled “Other”.
January 2007
95
2006 Annual Report
December 31, 2006
Portfolio of Investments
Systematic Active Small Cap Core Portfolio
|
|
|
| Value |
| |
|
| Shares |
| (000) |
| |
Common Stock (99.3%) |
|
|
|
|
| |
Advertising Agencies (0.7%) |
|
|
|
|
| |
InVentive Health, Inc. |
| (a)(c)753 |
| $ | 27 |
|
Sitel Corp. |
| (a)4,545 |
| 19 |
| |
|
|
|
| 46 |
| |
Aerospace/Defense — Equipment (0.2%) |
|
|
|
|
| |
MTC Technologies, Inc. |
| (a)(c)491 |
| 12 |
| |
Air Transport (1.6%) |
|
|
|
|
| |
AAR Corp. |
| (a)(c)1,482 |
| 43 |
| |
Alaska Air Group, Inc. |
| (a)709 |
| 28 |
| |
Bristow Group, Inc. |
| (a)536 |
| 20 |
| |
Republic Airways Holdings, Inc. |
| (a)(c)795 |
| 13 |
| |
|
|
|
| 104 |
| |
Auto Parts: After Market (0.6%) |
|
|
|
|
| |
Commercial Vehicle Group, Inc. |
| (a)(c)515 |
| 11 |
| |
Keystone Automotive Industries, Inc. |
| (a)(c)492 |
| 17 |
| |
Superior Industries International, Inc. |
| (c)630 |
| 12 |
| |
|
|
|
| 40 |
| |
Auto Parts: Original Equipment (0.1%) |
|
|
|
|
| |
Noble International, Ltd. |
| 304 |
| 6 |
| |
Automobiles (0.6%) |
|
|
|
|
| |
Navistar International Corp. |
| (a)1,187 |
| 40 |
| |
Banks: New York City (0.7%) |
|
|
|
|
| |
Community Bank System, Inc. |
| 1,945 |
| 45 |
| |
Banks: Outside New York City (4.9%) |
|
|
|
|
| |
BankFinancial Corp. |
| 2,553 |
| 46 |
| |
Centennial Bank Holdings, Inc. |
| (a)(c)3,568 |
| 34 |
| |
Citizens First Bancorp, Inc. |
| (c)253 |
| 8 |
| |
First Bancorp North Carolina |
| (c)257 |
| 6 |
| |
First Bancorp Puerto Rico |
| 1,264 |
| 12 |
| |
First Source Corp. |
| (c)342 |
| 11 |
| |
GB&T Bancshares, Inc. |
| 2,093 |
| 46 |
| |
Harleysville National Corp. |
| (c)1,164 |
| 23 |
| |
Omega Financial Corp. |
| 1,419 |
| 45 |
| |
Oriental Financial Group |
| (c)2,796 |
| 36 |
| |
Simmons First National Corp. |
| 476 |
| 15 |
| |
Sun Bancorp, Inc. New Jersey |
| (a)(c)633 |
| 13 |
| |
Susquehanna Bancshares, Inc. |
| (c)982 |
| 26 |
| |
|
|
|
| 321 |
| |
Biotechnology Research & Production (4.3%) |
|
|
|
|
| |
Albany Molecular Research, Inc. |
| (a)3,636 |
| 38 |
| |
Applera Corp. — Celera Genomics Group |
| (a)2,678 |
| 38 |
| |
Digene Corp. |
| (a)905 |
| 43 |
| |
Genitope Corp |
| (a)693 |
| 3 |
| |
Kendle International, Inc. |
| (a)1,529 |
| 48 |
| |
Lexicon Genetics, Inc. |
| (a)10,780 |
| 39 |
| |
Martek Biosciences Corp. |
| (a)(c)1,216 |
| 28 |
| |
Nabi Biopharmaceuticals |
| (a)5,787 |
| 39 |
| |
Neurocrine Biosciences, Inc. |
| (a)249 |
| 3 |
| |
|
|
|
| 279 |
| |
Building Materials (1.2%) |
|
|
|
|
| |
Ameron International Corp. |
| 317 |
| 24 |
| |
BlueLinx Holdings, Inc. |
| (c)761 |
| 8 |
| |
Building Material Holding Corp. |
| (c)452 |
| 11 |
| |
NCI Building Systems, Inc. |
| (a)(c)626 |
| 33 |
| |
|
|
|
| 76 |
| |
Building — Miscellaneous (0.2%) |
|
|
|
|
| |
Comfort Systems USA, Inc. |
| 821 |
| 10 |
| |
Casinos & Gambling (0.1%) |
|
|
|
|
| |
Magna Entertainment Corp. |
| (a)(c)1,095 |
| 5 |
| |
Chemicals (1.8%) |
|
|
|
|
| |
PolyOne Corp. |
| (a)6,251 |
| 47 |
| |
Rockwood Holdings, Inc. |
| (a)1,020 |
| 25 |
| |
Spartech Corp. |
| 1,518 |
| 40 |
| |
Stepan Co. |
| 216 |
| 7 |
| |
|
|
|
| 119 |
| |
Commercial Banks (0.7%) |
|
|
|
|
| |
UMB Financial Corp. |
| 1,242 |
| 45 |
| |
Commercial Information Services (0.4%) |
|
|
|
|
| |
CMGI, Inc. |
| (a)(c)21,825 |
| 29 |
| |
Communications Technology (2.0%) |
|
|
|
|
| |
3Com Corp. |
| (a)5,808 |
| 24 |
| |
Black Box Corp. |
| 684 |
| 29 |
| |
Cogent Communications Group, Inc. |
| (a)1,279 |
| 21 |
| |
Netgear, Inc. |
| (a)(c)1,085 |
| 28 |
| |
UTstarcom, Inc. |
| (a)(c)3,122 |
| 27 |
| |
|
|
|
| 129 |
| |
Computer Services Software & Systems (4.0%) |
|
|
|
|
| |
CACI International, Inc., Class A |
| (a)428 |
| 24 |
| |
COMSYS IT Partners, Inc. |
| (a)(c)476 |
| 10 |
| |
JDA Software Group Inc |
| (a)3,176 |
| 44 |
| |
Mantech InternationalCorp., Class A |
| (a)481 |
| 18 |
| |
Mapinfo Corp. |
| (a)(c)3,717 |
| 49 |
| |
MicroStrategy, Inc. |
| (a)240 |
| 27 |
| |
Parametric Technology Corp. |
| (a)1,950 |
| 35 |
| |
Schawk, Inc. |
| (c)676 |
| 13 |
| |
SonicWALL, Inc. |
| (a)5,381 |
| 45 |
| |
|
|
|
| 265 |
| |
Computer Technology (2.1%) |
|
|
|
|
| |
Hutchinson Technology, Inc. |
| (a)(c)607 |
| 14 |
| |
Imation Corp. |
| 580 |
| 27 |
| |
Komag, Inc. |
| (a)(c)1,381 |
| 52 |
| |
Palm, Inc. |
| (a)3,258 |
| 46 |
| |
|
|
|
| 139 |
| |
Construction (0.4%) |
|
|
|
|
| |
Dycom Industries, Inc. |
| (a)1,082 |
| 23 |
| |
Consumer Electronics (0.7%) |
|
|
|
|
| |
Earthlink, Inc. |
| (a)4,666 |
| 33 |
| |
Ipass, Inc. |
| (a)(c)1,735 |
| 10 |
| |
|
|
|
| 43 |
| |
Consumer Staples — Miscellaneous (1.6%) |
|
|
|
|
| |
American Greetings Corp., Class A |
| (c)1,626 |
| 39 |
| |
CSS Industries, Inc. |
| (c)595 |
| 21 |
| |
Nashua Corp. |
| (a)762 |
| 7 |
| |
Prestige Brands, Inc. |
| (a)3,020 |
| 39 |
| |
|
|
|
| 106 |
| |
The accompanying notes are an integral part of the financial statements.
96
| 2006 Annual Report |
|
|
| December 31, 2006 |
Portfolio of Investments (cont’d)
Systematic Active Small Cap Core Portfolio
|
|
|
| Value |
| |
|
| Shares |
| (000) |
| |
Containers & Packaging: Paper &Plastic (0.2%) |
|
|
|
|
| |
Myers Industries, Inc. |
| 1,042 |
| $ | 16 |
|
Copper (0.3%) |
|
|
|
|
| |
Mueller Industries, Inc. |
| 710 |
| 22 |
| |
Cosmetics (0.0%) |
|
|
|
|
| |
Parlux Fragrances, Inc. |
| (a)(c)490 |
| 3 |
| |
Distributors (0.3%) |
|
|
|
|
| |
Core-Mark Holding Co., Inc. |
| (a)529 |
| 18 |
| |
Diversified Financial Services (2.2%) |
|
|
|
|
| |
Euronet Worldwide, Inc. |
| (a)(c)764 |
| 23 |
| |
First Niagara Financial Group, Inc. |
| 3,857 |
| 57 |
| |
Knight Capital Group, Inc. |
| (a)3,194 |
| 61 |
| |
|
|
|
| 141 |
| |
Diversified Materials & Processing (0.4%) |
|
|
|
|
| |
Corn Products International, Inc. |
| 755 |
| 26 |
| |
Drug & Grocery Store Chains (0.1%) |
|
|
|
|
| |
Ingles Markets, Inc. |
| 280 |
| 8 |
| |
Drugs & Pharmaceuticals (1.5%) |
|
|
|
|
| |
Hi-Tech Pharmacal Co., Inc. |
| (a)(c)1,293 |
| 16 |
| |
Perrigo Co. |
| 1,816 |
| 31 |
| |
Valeant Pharmaceuticals International |
| 2,928 |
| 51 |
| |
|
|
|
| 98 |
| |
E-Commerce/Services (1.4%) |
|
|
|
|
| |
Agile Software Corp. |
| (a)7,623 |
| 47 |
| |
Ariba, Inc. |
| (a)5,905 |
| 46 |
| |
|
|
|
| 93 |
| |
Education Services (0.7%) |
|
|
|
|
| |
Educate, Inc. |
| (a)6,423 |
| 46 |
| |
Electrical Equipment & Components (0.6%) |
|
|
|
|
| |
Greatbatch, Inc. |
| (a)(c)512 |
| 14 |
| |
Technitrol, Inc. |
| 1,060 |
| 25 |
| |
|
|
|
| 39 |
| |
Electronics (0.3%) |
|
|
|
|
| |
Multi-Fineline Electronix, Inc. |
| (a)(c)499 |
| 10 |
| |
Omnivision Technologies, Inc. |
| (a)(c)521 |
| 7 |
| |
|
|
|
| 17 |
| |
Electronics: Instruments Gauges & Meters (0.1%) |
|
|
|
|
| |
Tech/Ops Sevcon, Inc. |
| 1,004 |
| 8 |
| |
Electronics: Medical Systems (0.5%) |
|
|
|
|
| |
Datascope Corp. |
| 384 |
| 14 |
| |
Zoll Medical Corp. |
| (a)(c)368 |
| 21 |
| |
|
|
|
| 35 |
| |
Electronics: Semi-Conductors/Components (2.7%) |
|
|
|
|
| |
Amkor Technology, Inc. |
| (a)(c)3,889 |
| 36 |
| |
Genesis Microchip, Inc. |
| (a)1,056 |
| 11 |
| |
IXYS Corp. |
| (a)(c)1,404 |
| 13 |
| |
ON Semiconductor Corp. |
| (a)(c)4,280 |
| 32 |
| |
Plexus Corp. |
| (a)704 |
| 17 |
| |
Silicon Storage Technology, Inc. |
| (a)(c)8,973 |
| 40 |
| |
Skyworks Solutions, Inc. |
| (a)4,325 |
| 31 |
| |
|
|
|
| 180 |
| |
Electronics: Technology (0.8%) |
|
|
|
|
| |
Checkpoint Systems, Inc. |
| (a)1,319 |
| 27 |
| |
EDO Corp. |
| (c)635 |
| 15 |
| |
Zygo Corp. |
| (a)542 |
| 9 |
| |
|
|
|
| 51 |
| |
Energy — Miscellaneous (1.6%) |
|
|
|
|
| |
Alon USA Energy, Inc. |
| 1,575 |
| 41 |
| |
Callon Petroleum Co. |
| (a)(c)675 |
| 10 |
| |
Giant Industries, Inc. |
| (a)266 |
| 20 |
| |
Harvest Natural Resources, Inc. |
| (a)(c)877 |
| 9 |
| |
Mariner Energy, Inc. |
| (a)454 |
| 9 |
| |
Swift Energy Co. |
| (a)418 |
| 19 |
| |
|
|
|
| 108 |
| |
Engineering & Contracting Services (0.4%) |
|
|
|
|
| |
Washington Group International, Inc. |
| (a)452 |
| 27 |
| |
Entertainment (0.7%) |
|
|
|
|
| |
Carmike Cinemas |
| (c)202 |
| 4 |
| |
Take-Two Interactive Software, Inc. |
| (a)(c)2,433 |
| 43 |
| |
|
|
|
| 47 |
| |
Finance Companies (0.6%) |
|
|
|
|
| |
Accredited Home Lenders Holding Co. |
| (a)(c)935 |
| 26 |
| |
Asta Funding, Inc. |
| (c)481 |
| 15 |
| |
|
|
|
| 41 |
| |
Financial — Miscellaneous (0.7%) |
|
|
|
|
| |
Advanta Corp., Class B |
| 959 |
| 42 |
| |
Federal Agricultural Mortgage Corp. |
| 213 |
| 6 |
| |
|
|
|
| 48 |
| |
Foods (0.9%) |
|
|
|
|
| |
Del Monte Corp. |
| 4,121 |
| 45 |
| |
Premium Standard Farms, Inc. |
| 734 |
| 14 |
| |
|
|
|
| 59 |
| |
Health Care Facilities (1.1%) |
|
|
|
|
| |
Psychiatric Solutions, Inc. |
| (a)(c)1,833 |
| 69 |
| |
VistaCare, Inc., Class A |
| (a)(c)427 |
| 4 |
| |
|
|
|
| 73 |
| |
Health Care Management Services (0.8%) |
|
|
|
|
| |
Molina Healthcare, Inc. |
| (a)564 |
| 18 |
| |
Sierra Health Services, Inc. |
| (a)213 |
| 8 |
| |
Vital Images,Inc. |
| (a)(c)800 |
| 28 |
| |
|
|
|
| 54 |
| |
Health Care — Miscellaneous (0.1%) |
|
|
|
|
| |
Medical Action Industries, Inc. |
| (a)(c)293 |
| 9 |
| |
Health Care Services (0.3%) |
|
|
|
|
| |
Bio-Reference Labs, Inc. |
| (a)(c)1,000 |
| 22 |
| |
Homebuilding (0.9%) |
|
|
|
|
| |
Hanover Compressor Co. |
| (a)(c)1,788 |
| 34 |
| |
WCI Communities, Inc. |
| (a)(c)1,140 |
| 22 |
| |
|
|
|
| 56 |
| |
Hotel/Motel (1.4%) |
|
|
|
|
| |
Bluegreen Corp. |
| (a)3,561 |
| 46 |
| |
Lodgian, Inc. |
| (a)3,381 |
| 46 |
| |
|
|
|
| 92 |
| |
Household Furnishings (0.4%) |
|
|
|
|
| |
Hooker Furniture Corp. |
| (c)361 |
| 6 |
| |
The accompanying notes are an integral part of the financial statements.
97
2006 Annual Report
December 31, 2006
Portfolio of Investments (cont’d)
Systematic Active Small Cap Core Portfolio
|
|
|
| Value |
| |
|
| Shares |
| (000) |
| |
Household Furnishings (cont’d) |
|
|
|
|
| |
La-Z-Boy, Inc. |
| (c)1,115 |
| $ | 13 |
|
Lifetime Brands, Inc. |
| (c)228 |
| 4 |
| |
|
|
|
| 23 |
| |
Insurance: Life (0.7%) |
|
|
|
|
| |
Kansas City Life Insurance Co. |
| (c)49 |
| 3 |
| |
Presidential Life Insurance Corp. |
| 2,065 |
| 45 |
| |
|
|
|
| 48 |
| |
Insurance: Multi-Line (0.0%) |
|
|
|
|
| |
Independence Holding Co. |
| (c)129 |
| 3 |
| |
Insurance: Property & Casualty (2.0%) |
|
|
|
|
| |
Affirmative Insurance Holdings, Inc. |
| 351 |
| 6 |
| |
Commerce Group, Inc. |
| 978 |
| 29 |
| |
Infinity Property & Casualty Corp. |
| 635 |
| 31 |
| |
Ohio Casualty Corp. |
| 1,197 |
| 36 |
| |
Selective Insurance Group |
| (c)481 |
| 27 |
| |
|
|
|
| 129 |
| |
Investment Management Companies (1.5%) |
|
|
|
|
| |
Apollo Investment Corp. |
| (c)2,258 |
| 51 |
| |
Capital Southwest Corp. |
| (c)126 |
| 16 |
| |
Friedman Billings Ramsey & Co. REIT |
| (c)3,537 |
| 28 |
| |
Gladstone Capital Corp. |
| (c)248 |
| 6 |
| |
|
|
|
| 101 |
| |
Leisure Time (0.1%) |
|
|
|
|
| |
Steinway Musical Instruments |
| (a)142 |
| 4 |
| |
Machinery & Engineering (0.4%) |
|
|
|
|
| |
Applied Industrial Technologies, Inc. |
| (c)1,090 |
| 29 |
| |
Machinery: Construction & Handling (0.3%) |
|
|
|
|
| |
Manitowoc Company, Inc. (The) |
| 323 |
| 19 |
| |
Machinery: Engines (0.4%) |
|
|
|
|
| |
Briggs & Stratton Corp. |
| (c)1,033 |
| 28 |
| |
Machinery: Industrial/Specialty (0.4%) |
|
|
|
|
| |
EnPro Industries, Inc. |
| (a)798 |
| 26 |
| |
Machinery: Oil Well Equipment & Services (0.9%) |
|
|
|
|
| |
Lufkin Industries, Inc. |
| 330 |
| 19 |
| |
Oceaneering International,Inc. |
| (a)410 |
| 16 |
| |
Oil States International, Inc. |
| (a)774 |
| 25 |
| |
|
|
|
| 60 |
| |
Manufactured Housing (0.2%) |
|
|
|
|
| |
Skyline Corp. |
| 288 |
| 12 |
| |
Manufacturing (0.6%) |
|
|
|
|
| |
Acuity Brands, Inc. |
| 759 |
| 39 |
| |
Materials & Processing — Miscellaneous (0.7%) |
|
|
|
|
| |
Rogers Corp. |
| (a)(c)462 |
| 27 |
| |
USEC, Inc. |
| (a)1,526 |
| 20 |
| |
|
|
|
| 47 |
| |
Medical & Dental Instruments & Supplies (2.1%) |
|
|
|
|
| |
ICU Medical, Inc. |
| (a)307 |
| 12 |
| |
Inverness Medical Innovations, Inc. |
| (a)(c)1,072 |
| 41 |
| |
Sonic Innovations, Inc. |
| (a)820 |
| 4 |
| |
STERIS Corp. |
| 1,731 |
| 44 |
| |
Viasys Healthcare, Inc. |
| (a)925 |
| 26 |
| |
Young Innovations, Inc. |
| 256 |
| 9 |
| |
|
|
|
| 136 |
| |
Medical Services (0.4%) |
|
|
|
|
| |
Magellan Health Services, Inc. |
| (a)621 |
| 27 |
| |
Metal Fabricating (1.5%) |
|
|
|
|
| |
Commercial Metals Co. |
| 640 |
| 16 |
| |
Encore Wire Corp. |
| (c)556 |
| 12 |
| |
Lone Star Technologies, Inc. |
| (a)447 |
| 22 |
| |
Quanex Corp. |
| 680 |
| 24 |
| |
Ryerson, Inc. |
| (c)952 |
| 24 |
| |
|
|
|
| 98 |
| |
Multi-Sector Companies (0.4%) |
|
|
|
|
| |
Sequa Corp. |
| (a)210 |
| 24 |
| |
Office Furniture & Business Equipment (0.6%) |
|
|
|
|
| |
Ikon Office Solutions, Inc. |
| 2,348 |
| 38 |
| |
Oil: Crude Producers (0.8%) |
|
|
|
|
| |
Edge Petroleum Corp. |
| (a)(c)595 |
| 11 |
| |
Stone Energy Corp. |
| (a)1,215 |
| 43 |
| |
|
|
|
| 54 |
| |
Paper (0.7%) |
|
|
|
|
| |
Albany International Corp. |
| 693 |
| 23 |
| |
Rock-Tenn Co. |
| 866 |
| 23 |
| |
|
|
|
| 46 |
| |
Power Transmission Equipment (0.6%) |
|
|
|
|
| |
Regal-Beloit Corp. |
| 791 |
| 42 |
| |
Production Technology Equipment (1.3%) |
|
|
|
|
| |
Credence Systems Corp. |
| (a)11,340 |
| 59 |
| |
Mattson Technology, Inc. |
| (a)(c)1,433 |
| 13 |
| |
Varian Semiconductor Equipment Associates, Inc. |
| (a)338 |
| 16 |
| |
|
|
|
| 88 |
| |
Publishing (0.7%) |
|
|
|
|
| |
Journal Register Co. |
| 6,432 |
| 47 |
| |
Publishing— Miscellaneous (0.7%) |
|
|
|
|
| |
Scholastic Corp. |
| (a)1,365 |
| 49 |
| |
Real Estate Investment Trusts (REIT) (6.6%) |
|
|
|
|
| |
Ashford Hospitality Trust, Inc. REIT |
| 1,069 |
| 13 |
| |
BioMed Realty Trust, Inc. REIT |
| (c)987 |
| 28 |
| |
Equity One, Inc. REIT |
| (c)1,719 |
| 46 |
| |
First Industrial Realty Trust Inc. REIT |
| 1,095 |
| 51 |
| |
Franklin Street Properties Corp. REIT |
| (c)1,799 |
| 38 |
| |
Highland Hospitality Corp. REIT |
| 1,020 |
| 15 |
| |
Innkeepers USA Trust REIT |
| (c)2,296 |
| 36 |
| |
KKR Financial Corp., Class A REIT |
| (c)1,940 |
| 52 |
| |
RAIT Investment Trust REIT |
| 1,137 |
| 39 |
| |
Redwood Trust, Inc. REIT |
| (c)715 |
| 42 |
| |
Sunstone Hotel Investors, Inc. REIT |
| 1,387 |
| 37 |
| |
Tarragon Corp. |
| (c)850 |
| 10 |
| |
Winston Hotels, Inc. REIT |
| (c)1,849 |
| 24 |
| |
|
|
|
| 431 |
| |
Restaurants (2.2%) |
|
|
|
|
| |
CBRL Group, Inc. |
| (c)659 |
| 30 |
| |
Jack In The Box, Inc. |
| (a)875 |
| 53 |
| |
Luby’s, Inc. |
| (a)4,208 |
| 46 |
| |
The accompanying notes are an integral part of the financial statements.
98
| 2006 Annual Report |
|
|
| December 31, 2006 |
Portfolio of Investments (cont’d)
Systematic Active Small Cap Core Portfolio
|
|
|
| Value |
| |
|
| Shares |
| (000) |
| |
Restaurants (cont’d) |
|
|
|
|
| |
O’Charleys, Inc. |
| (a)699 |
| $ | 15 |
|
|
|
|
| 144 |
| |
Retail (6.7%) |
|
|
|
|
| |
Big Lots, Inc. |
| (a)(c)2,459 |
| 56 |
| |
Bon-Ton Stores, Inc. |
| 256 |
| 9 |
| |
Cato Corp. |
| 1,674 |
| 38 |
| |
Central Garden & Pet Co. |
| (a)(c)428 |
| 21 |
| |
Charlotte Russe Holding, Inc. |
| (a)780 |
| 24 |
| |
Charming Shoppes, Inc. |
| (a)(c)1,205 |
| 16 |
| |
Childrens Place Retail Stores, Inc. (The) |
| (a)(c)758 |
| 48 |
| |
Conn’s, Inc. |
| (a)573 |
| 13 |
| |
Dress Barn, Inc. |
| (a)(c)878 |
| 21 |
| |
Global Imaging Systems, Inc. |
| (a)1,270 |
| 28 |
| |
Lawson Products, Inc. |
| 228 |
| 11 |
| |
Men’s Wearhouse, Inc. |
| 1,088 |
| 42 |
| |
Pantry, Inc. (The) |
| (a)345 |
| 16 |
| |
Priceline.com, Inc. |
| (a)(c)1,220 |
| 53 |
| |
Stein Mart, Inc. |
| (c)1,451 |
| 19 |
| |
Tween Brands, Inc. |
| (a)552 |
| 22 |
| |
|
|
|
| 437 |
| |
Rental & Leasing Services: Consumer (0.5%) |
|
|
|
|
| |
Amerco, Inc. |
| (a)(c)361 |
| 31 |
| |
Savings & Loan (1.1%) |
|
|
|
|
| |
BFC Financial Corp. |
| (a)997 |
| 6 |
| |
ITLA Capital Corp. |
| 109 |
| 6 |
| |
Kearny Financial Corp. |
| (c)2,733 |
| 44 |
| |
KNBT Bancorp, Inc. |
| 755 |
| 13 |
| |
|
|
|
| 69 |
| |
Services: Commercial (4.1%) |
|
|
|
|
| |
AMN Healthcare Services, Inc. |
| (a)(c)666 |
| 18 |
| |
BearingPoint, Inc. |
| (a)3,627 |
| 28 |
| |
Kelly Services, Inc., Class A |
| (c)860 |
| 25 |
| |
Kforce, Inc. |
| (a)3,710 |
| 45 |
| |
Labor Ready,Inc. |
| (a)1,055 |
| 19 |
| |
Live Nation, Inc. |
| (a)1,814 |
| 41 |
| |
Monroe Muffler Brake, Inc. |
| (c)404 |
| 14 |
| |
MPS Group, Inc. |
| (a)1,177 |
| 17 |
| |
PHH Corp. |
| (a)1,094 |
| 32 |
| |
Unifirst Corp |
| (c)277 |
| 11 |
| |
World Fuel Services Corp. |
| 477 |
| 21 |
| |
|
|
|
| 271 |
| |
Shoes (0.2%) |
|
|
|
|
| |
Shoe Carnival, Inc. |
| (a)333 |
| 11 |
| |
Steel (0.9%) |
|
|
|
|
| |
AK Steel Holding Corp. |
| (a)1,688 |
| 28 |
| |
Schnitzer Steel Industries, Inc. |
| (c)443 |
| 18 |
| |
Wheeling-Pittsburgh Corp. |
| (a)(c)609 |
| 11 |
| |
|
|
|
| 57 |
| |
Telecommunications Equipment (0.6%) |
|
|
|
|
| |
C-COR.Net Corp. |
| (a)(c)1,086 |
| 12 |
| |
Mastec, Inc. |
| (a)(c)1,335 |
| 16 |
| |
Powerwave Technologies, Inc. |
| (a)(c)1,592 |
| 10 |
| |
|
|
|
| 38 |
| |
Textile Apparel Manufacturers (1.0%) |
|
|
|
|
| |
Kellwood Co. |
| (c)604 |
| 20 |
| |
Warnaco Group, Inc. (The) |
| (a)(c)1,751 |
| 44 |
| |
|
|
|
| 64 |
| |
Transportation — Miscellaneous (0.7%) |
|
|
|
|
| |
SIRVA, Inc. |
| (a)13,726 |
| 48 |
| |
|
|
|
|
|
| |
Truckers (0.7%) |
|
|
|
|
| |
Arkansas Best Corp. |
| 237 |
| 9 |
| |
Old Dominion Freight Line, Inc. |
| (a)(c)592 |
| 14 |
| |
PAM Transportation Services, Inc. |
| (a)(c)321 |
| 7 |
| |
Quality Distribution, Inc. |
| (a)(c)1,460 |
| 19 |
| |
|
|
|
| 49 |
| |
Utilities: Electrical (2.1%) |
|
|
|
|
| |
Idacorp, Inc. |
| 700 |
| 27 |
| |
PNM Resources, Inc. |
| 901 |
| 28 |
| |
Unisource Energy Corp. |
| 592 |
| 21 |
| |
Westar Energy, Inc. |
| 2,260 |
| 59 |
| |
|
|
|
| 135 |
| |
Utilities: Gas Distributors (1.2%) |
|
|
|
|
| |
Laclede Group, Inc. (The) |
| (c)579 |
| 20 |
| |
New Jersey Resources Corp. |
| (c)388 |
| 19 |
| |
Northwestern Corp. |
| 520 |
| 19 |
| |
WGL Holdings, Inc. |
| (c)618 |
| 20 |
| |
|
|
|
| 78 |
| |
Utilities: Telecommunications (0.9%) |
|
|
|
|
| |
IDT Corp., Class B |
| (a)3,534 |
| 46 |
| |
North Pittsburgh Systems, Inc. |
| 422 |
| 10 |
| |
|
|
|
| 56 |
| |
Wholesale & International Trade (0.5%) |
|
|
|
|
| |
Central European Distribution Corp. |
| (a)(c)1,003 |
| 30 |
| |
Wholesalers (0.4%) |
|
|
|
|
| |
United Stationers Supply, Inc. |
| (a)573 |
| 27 |
| |
|
|
|
|
|
| |
Total Common Stocks (Cost $6,391) |
|
|
| 6,512 |
| |
|
| Face |
|
|
| |
|
| Amount |
|
|
| |
|
| (000) |
|
|
| |
Short-Term Investments (36.2%) |
|
|
|
|
| |
Short-Term Debt Securities held as Collateral on Loaned Securities (28.0%) |
|
|
|
|
| |
Alliance & Leicester plc, 5.36%, 1/8/07 |
| $ | (h)59 |
| 59 |
|
Bancaja, 5.37%, 1/19/07 |
| (h)30 |
| 30 |
| |
Bank of America Corp., 5.32%, 1/2/07 |
| (h)95 |
| 95 |
| |
Bank of New York Co., Inc., 5.34%, 1/10/07 |
| (h)30 |
| 30 |
| |
Bear Stearns & Co., Inc., |
|
|
|
|
| |
5.37%, 1/2/07 |
| (h)36 |
| 36 |
| |
5.38%, 1/2/07 |
| (h)24 |
| 24 |
| |
5.39%, 1/16/07 |
| (h)60 |
| 60 |
| |
BNP Paribas plc, 5.35%, 2/20/07 |
| (h)60 |
| 60 |
| |
CIC, New York, |
|
|
|
|
| |
5.33%, 1/3/07 |
| (h)42 |
| 42 |
| |
5.34%, 1/2/07 |
| (h)60 |
| 60 |
| |
Dekabank Deutsche Girozentrale, 5.39%, 1/19/07 |
| (h)61 |
| 61 |
| |
Deutsche Bank Securities, Inc., 5.33%, 1/2/07 |
| 191 |
| 191 |
| |
Dexia Bank, New York, 5.33%, 1/2/07 |
| (h)60 |
| 60 |
| |
The accompanying notes are an integral part of the financial statements.
99
2006 Annual Report |
|
|
|
December 31, 2006 |
|
Portfolio of Investments (cont’d)
Systematic Active Small Cap Core Portfolio
|
| Face |
|
|
| ||
|
| Amount |
| Value |
| ||
|
| (000) |
| (000) |
| ||
Short-Term Debt Securities held as Collateral on Loaned Securities (cont’d) |
|
|
|
|
| ||
Gemini Securitization Corp., 5.34%, 1/2/07 |
| $ | 30 |
| $ | 30 |
|
Goldman Sachs Group, Inc., |
|
|
|
|
| ||
5.40%, 1/16/07 |
| (h)30 |
| 30 |
| ||
5.42%, 1/2/07 |
| (h)56 |
| 56 |
| ||
HSBC Finance Corp., 5.34%, 1/8/07 |
| (h)30 |
| 30 |
| ||
Liberty Lighthouse U.S. Capital, 5.33%, 1/2/07 |
| (h)30 |
| 30 |
| ||
Manufacturers & Traders, 5.33%, 1/16/07 |
| (h)36 |
| 36 |
| ||
Merrill Lynch & Co., 5.35%, 1/26/07 |
| (h)31 |
| 31 |
| ||
Mitsubishi UFJ Financial Group, 5.33%, 1/2/07 |
| (h)30 |
| 30 |
| ||
Nattexis Banques Populaire, New York, |
|
|
|
|
| ||
5.34%, 1/2/07 |
| (h)60 |
| 60 |
| ||
5.35%, 1/2/07 |
| (h)30 |
| 30 |
| ||
National City Bank Cleveland, 5.32%, 1/2/07 |
| (h)86 |
| 86 |
| ||
National Rural Utilities Cooperative Finance Corp., 5.34%, 1/2/07 |
| (h)119 |
| 119 |
| ||
Nationwide Building Society, 5.44%, 3/28/07 |
| (h)69 |
| 69 |
| ||
Nordea Bank, New York, 5.31%, 1/2/07 |
| (h)89 |
| 89 |
| ||
Rhein-Main Securitisation Ltd., 5.33%, 1/18/07 |
| 28 |
| 28 |
| ||
Skandi, New York, 5.34%, 1/9/07 |
| (h)59 |
| 59 |
| ||
SLM Corp., 5.36%, 1/22/07 |
| (h)59 |
| 59 |
| ||
Toronto Dominion, New York, 5.32%, 5/29/07 |
| (h)59 |
| 59 |
| ||
Tulip Funding, 5.36%, 1/16/07 |
| 33 |
| 33 |
| ||
Unicredito Italiano Bank (Ireland) plc,5.36%, 1/9/07 |
| (h)42 |
| 42 |
| ||
World Savings Bank FSB, 5.35%, 1/19/07 |
| (h)20 |
| 20 |
| ||
|
|
|
| 1,834 |
| ||
Repurchase Agreement (8.2%) |
|
|
|
|
| ||
J.P. Morgan Securities, Inc.,5.20%, dated 12/29/06, due 1/2/07, repurchase price $537 |
| (f)537 |
| 537 |
| ||
Total Short-Term Investments (Cost $2,371) |
|
|
| 2,371 |
| ||
Total Investments (135.5%) (Cost $8,762) including $1,771 of Securities Loaned |
|
|
| 8,883 |
| ||
Liabilities in Excess of Other Assets (-35.5%) |
|
|
| (2,329 | ) | ||
Net Assets (100%) |
|
|
| $ | 6,554 |
| |
(a) |
| Non-income producing security. |
|
|
|
(c) |
| All or portion of security on loan at December 31, 2006. |
|
|
|
(f) |
| Represents the Portfolio’s undivided interest in a joint repurchase agreement which has a total value of $1,856,998,000. The repurchase agreement was fully collateralized by U.S. government agency securities at the date of this Portfolio of Investments as follows: Federal Farm Credit Bank, 0.00% to 7.43%, due 1/16/07 to 10/23/35; Federal Home Loan Bank, 0.00% to 7.38%, due 1/3/07 to 6/5/28; Federal Home Loan Mortgage Corp., 0.00% to 6.75%, due 1/2/07 to 7/15/32; Federal National Mortgage Association, 0.00% to 8.20%, due 1/12/07 to 11/15/30; Tennessee Valley Authority, 5.38% to 6.75%, due 11/13/08 to 4/1/36, which had a total value of $1,894,142,869. The investment in the repurchase agreement is through participation in a joint account with affiliated parties pursuant to exemptive relief received by the Portfolio from the SEC. |
|
|
|
(h) |
| Variable/Floating Rate Security — interest rate changes on these instruments are based on changes in a designated base rate. The rates shown are those in effect on December 31, 2006. |
|
|
|
REIT |
| Real Estate Investment Trust |
Futures Contracts:
The Portfolio had the following futures contract(s) open at period end:
|
|
|
|
|
|
|
| Net |
| ||
|
|
|
|
|
|
|
| Unrealized |
| ||
|
| Number |
|
|
|
|
| Appreciation |
| ||
|
| of |
| Value |
| Expiration |
| (Depreciation) |
| ||
|
| Contracts |
| (000) |
| Date |
| (000) |
| ||
Long: |
|
|
|
|
|
|
|
|
| ||
E-Mini Russell 2000 (United States) |
| 1 |
| $ | 79 |
| Mar-07 |
| $ | (1 | ) |
The accompanying notes are an integral part of the financial statements.
100
| 2006 Annual Report |
|
|
| December 31, 2006 |
Investment Overview (unaudited)
Systematic Active Small Cap Growth Portfolio
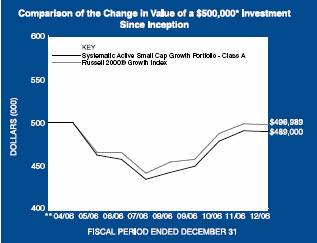
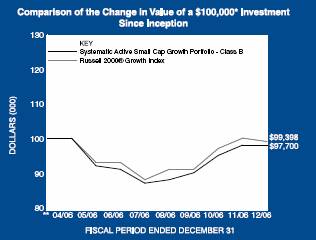
* Minimum Investment
** Commenced operations on April 28, 2006
In accordance with SEC regulations, Portfolio performance shown assumes that all recurring fees (including management fees) were deducted and all dividends and distributions were reinvested.
Performance Compared to the Russell 2000®
Growth Index(1)
|
| Total Returns(2) |
|
|
| Cumulative |
|
|
| Since |
|
|
| Inception(4) |
|
Portfolio – Class A (3) |
| (2.20 | )% |
Russell 2000® Growth Index |
| (0.60 | ) |
|
|
|
|
Portfolio – Class B (3) |
| (2.30 | ) |
Russell 2000® Growth Index |
| (0.60 | ) |
Performance data quoted represents past performance, which is no guarantee of future results, and current performance may be lower or higher than the figures shown. Performance assumes that all dividends and distributions, if any, were reinvested. For the most recent month-end performance figures, please visit www.morganstanley.com/im. Investment return and principal value will fluctuate so that Portfolio shares, when redeemed, may be worth more or less than their original cost. Total returns do not reflect the deduction of taxes that a shareholder would pay on Portfolio distributions or the redemption of Portfolio shares.
(1) |
| The Russell 2000® Growth Index measures the performance of those Russell 2000® companies with higher price-to-book ratios and higher forecasted growth values. The Index is unmanaged and its returns do not include any sales charges or fees. Such costs would lower performance. It is not possible to invest directly in an index. |
|
|
|
(2) |
| Total returns for the Portfolio reflect fees waived and expenses reimbursed, if applicable, by the Adviser. Without such waivers and/or reimbursements, total returns would have been lower. Fee waivers and/or expense reimbursements are voluntary and the Adviser reserves the right to commence or terminate any waiver and/or reimbursement at any time. |
|
|
|
(3) |
| Commenced operations on April 28, 2006 |
|
|
|
(4) |
| For comparative purposes, cumulative since inception returns listed for the Index refer to the inception date or initial offering of the respective share class of the Portfolio, not the inception of the Index. |
The Systematic Active Small Cap Growth Portfolio seeks long-term capital appreciation by investing primarily in growth-oriented equity securities of small capitalization companies. Investments in small sized corporations are more vulnerable to financial risks and other risks than larger corporations and may involve a higher degree of price volatility than investments in the general equity markets.
Performance
For the period from April 28, 2006 (commencement of operations) to December 31, 2006, the Portfolio had a total return based on net asset value per share of (2.20)% for the Class A shares, net of fees, and (2.30)% for the Class B shares, net of fees, compared to (0.60)% for the Russell 2000® Growth Index (the “Index”).
Factors Affecting Performance
• The Portfolio’s launch in April coincided with the turbulent second quarter of 2006. Small-cap growth stocks had a more protracted recovery, remaining in negative territory in the third quarter, followed by much improved gains in the fourth quarter. As a result, Index performance was a flat for the period since inception through December 31, 2006, and the Portfolio finished the period lower.
• In the first half of 2006, stock investors dealt with the uncertainties of a slowing economy. There was some well-received merger and acquisition activity in March and April; however, gains were rather muted as investors kept a close eye on inflation levels, energy prices and the policy actions of the Federal Open Market Committee (FOMC). By May, recession anxieties reached a boiling
101
2006 Annual Report |
|
|
|
December 31, 2006 |
|
Investment Overview (cont’d)
Systematic Active Small Cap Growth Portfolio
point, prompting a market sell-off and heightened volatility that spanned into June.
• The second half of the year was characterized by greater optimism. The markets began to stabilize in July on the expectation that the FOMC would pause in its increases to the target federal funds target rate, and the FOMC did leave the rate unchanged for the remainder of 2006, given the slowdown in the housing market, rising interest rates and high energy prices. Although third quarter gross domestic product (GDP) growth was below expectations, investors appeared reasonably confident that the economy was moderating and not falling into a recession. Consumer spending and confidence, on the whole, did not flag any significant trouble, although by year end consumer debt levels were garnering greater attention. Warmer weather helped energy prices ease in the final months of 2006, and gasoline prices had also declined. The jobs market softened but was still in line with expectations, and inflation data reported at year end did not cause much of a stir.
• In aggregate, the Portfolio’s telecommunication services holdings had the highest total return during the period, while the materials holdings returned least.
• In terms of contribution to the Portfolio’s overall return, the financial sector had the largest positive impact, while the technology sector was the largest detractor from performance.
• Relative to the Index, an underweight in the technology sector was the primary driver of outperformance. The sector had a negative return during the period.
• Detractors from relative performance included the two consumer sectors. In the consumer staples sector, the Portfolio lacked exposure to some of the Index’s stronger performing names. In the consumer discretionary sector, relative results were dampened by the Portfolio’s underweight exposure to two stocks that performed well coupled with several holdings that lagged.
Management Strategies
• We believe that we can enhance returns by employing a quantitative model that uses multiple, independent factors to examine the fundamentals of a company. We further believe that our quantitative efforts in combination with our fundamental analysis can exploit market inefficiencies.
• We employ a quantitative approach to stock selection utilizing a proprietary quantitative model. The model is driven by rigorous fundamental and quantitative research that screens a universe of large capitalization companies. The model employs three quantitative screens based on the following primary inputs-earnings expectations, price trends and relative valuations. Individual securities and industries are ranked within each sector by the most effective combination of these disciplines based on the current phase of the economic cycle. We then decide whether to buy, sell or hold a security based on its fundamental analysis and the results of this model-driven approach.
Expense Examples
As a shareholder of the Portfolio, you may incur two types of costs: (1) transactional costs, including redemption fees; (2) ongoing costs, including management fees, distribution (12b-1) fees (in the case of Class B); and other Portfolio expenses. These examples are intended to help you understand your ongoing costs (in dollars) of investing in the Portfolio and to compare these costs with the ongoing costs of investing in other mutual funds.
The examples are based on an investment of $1,000 invested at the beginning of the six-month period ended December 31, 2006 and held for the entire six-month period.
Actual Expenses
The first line of the tables below provides information about actual account values and actual expenses. You may use the information in this line, together with the amount you invested, to estimate the expenses that you paid over the period. Simply divide your account value by $1,000 (for example, an $8,600 account value divided by $1,000 = 8.6), then multiply the result by the number in the first line under the heading entitled “Expenses Paid During Period” to estimate the expenses you paid on your account during this period.
Please note that “Expenses Paid During Period” are grossed up to reflect Portfolio expenses prior to the effect of Expense Offset (See Note E in the Notes to Financial Statements). Therefore, the annualized net expense ratios may differ from the ratio of the expenses to average net assets shown in the Financial Highlights.
Hypothetical Example for Comparison Purposes
The second line of the tables below provides information about hypothetical account values and hypothetical expenses based on the Portfolio’s actual expense ratio and an assumed rate of return of 5% per year before expenses, which is not the Portfolio’s actual return. The hypothetical account values and expenses may not be used to estimate the actual ending account balance or expenses you paid for the period. You may use this information to compare the ongoing costs of investing in the Portfolio and other funds. To do so, compare this 5%
102
| 2006 Annual Report |
|
|
| December 31, 2006 |
Investment Overview (cont’d)
Systematic Active Small Cap Growth Portfolio
hypothetical example with the 5% hypothetical examples that appear in the shareholder reports of the other funds.
Please note that the expenses shown in the table are meant to highlight your ongoing costs only and do not reflect any transactional costs, such as redemption fees. Therefore, the second line of the table is useful in comparing ongoing costs only, and will not help you determine the relative total costs of owning different funds. In addition, if these transactional costs were included, your costs would have been higher.
|
|
|
|
|
| Expenses Paid |
| |||
|
|
|
| Ending Account |
| During Period* |
| |||
|
| Beginning |
| Value |
| July 1, 2006 — |
| |||
|
| Account Value |
| December 31, |
| December 31, |
| |||
|
| July 1, 2006 |
| 2006 |
| 2006 |
| |||
Class A |
|
|
|
|
|
|
| |||
Actual |
| $ | 1,000.00 |
| $ | 1,070.00 |
| $ | 5.74 |
|
Hypothetical (5% average annual return before expenses) |
| 1,000.00 |
| 1,019.66 |
| 5.60 |
| |||
|
|
|
|
|
|
|
| |||
Class B |
|
|
|
|
|
|
| |||
Actual |
| 1,000.00 |
| 1,068.90 |
| 7.04 |
| |||
Hypothetical (5% average annual return before expenses) |
| 1,000.00 |
| 1,018.40 |
| 6.87 |
| |||
* Expenses are equal to Class A and Class B annualized net expense ratios of 1.10% and 1.35%, respectively, multiplied by the average account value over the period, multiplied by 184/365 (to reflect the one-half year period).
Graphic Presentation of Portfolio Holdings
The following graph depicts the Portfolio’s holdings by industry and/or security type, as a percentage of total investments.
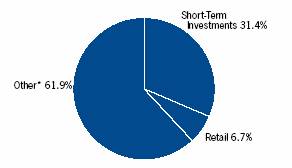
* Industries which do not appear in the above graph, as well as those which represent less than 5% of total investments, if applicable, are included in the category labeled “Other”.
January 2007
103
2006 Annual Report |
|
|
|
December 31, 2006 |
|
Portfolio of Investments
Systematic Active Small Cap Growth Portfolio
|
|
|
| Value |
| |
|
| Shares |
| (000) |
| |
Common Stocks (99.2%) |
|
|
|
|
| |
Advertising Agencies (0.2%) |
|
|
|
|
| |
Sitel Corp. |
| (a)2,714 |
| $ | 12 |
|
Air Transport (1.7%) |
|
|
|
|
| |
AAR Corp. |
| (a)(c)1,213 |
| 35 |
| |
Alaska Air Group, Inc. |
| (a)777 |
| 31 |
| |
ExpressJet Holdings, Inc. |
| (a)1,786 |
| 15 |
| |
Skywest, Inc. |
| 1,213 |
| 31 |
| |
|
|
|
| 112 |
| |
Auto Parts: After Market (1.5%) |
|
|
|
|
| |
Accuride Corp. |
| (a)991 |
| 11 |
| |
Keystone Automotive Industries, Inc. |
| (a)800 |
| 27 |
| |
Navistar International Corp. |
| (a)1,867 |
| 62 |
| |
|
|
|
| 100 |
| |
Auto Parts: Original Equipment (0.5%) |
|
|
|
|
| |
Noble International Ltd. |
| 310 |
| 6 |
| |
Sauer-Danfoss, Inc. |
| (c)939 |
| 31 |
| |
|
|
|
| 37 |
| |
Banks: Outside New York City (2.8%) |
|
|
|
|
| |
International Bancshares Corp |
| 577 |
| 18 |
| |
Investors Bancorp, Inc. |
| (c)2,293 |
| 36 |
| |
Signature Bank |
| (a)1,527 |
| 47 |
| |
Southside Bankchares, Inc. |
| (c)264 |
| 7 |
| |
SVB Financial Group |
| (a)742 |
| 34 |
| |
USB Holdings Co., Inc. |
| (c)451 |
| 11 |
| |
Wintrust Financial Corp. |
| (c)766 |
| 37 |
| |
|
|
|
| 190 |
| |
Biotechnology Research & Production (3.2%) |
|
|
|
|
| |
Albany Molecular Research, Inc. |
| (a)(c)1,823 |
| 19 |
| |
Arthrocare Corp. |
| (a)48 |
| 2 |
| |
Digene Corp. |
| (a)1,163 |
| 56 |
| |
Idenix Pharmaceuticals, Inc. |
| (a)5,016 |
| 43 |
| |
Lexicon Genetics Inc |
| (a)12,795 |
| 46 |
| |
Martek Biosciences Corp. |
| (a)(c)1,221 |
| 28 |
| |
Neurocrine Biosciences, Inc. |
| (a)265 |
| 3 |
| |
PRA International |
| (a)(c)661 |
| 17 |
| |
|
|
|
| 214 |
| |
Building Materials (0.2%) |
|
|
|
|
| |
NCI Building Systems, Inc. |
| (a)232 |
| 12 |
| |
Building: Plumbing & Heating (0.4%) |
|
|
|
|
| |
Interline Brands, Inc. |
| (a)1,147 |
| 26 |
| |
Casinos & Gambling (0.8%) |
|
|
|
|
| |
Aztar Corp. |
| (a)868 |
| 47 |
| |
MTR Gaming Group, Inc. |
| (a)611 |
| 8 |
| |
|
|
|
| 55 |
| |
Chemicals (0.4%) |
|
|
|
|
| |
Arch Chemicals, Inc. |
| 606 |
| 20 |
| |
Cabot Microelectronics Corp. |
| (a)(c)162 |
| 6 |
| |
|
|
|
| 26 |
| |
Coal (0.6%) |
|
|
|
|
| |
Alpha Natural Resources, Inc. |
| (a)(c)1,393 |
| 20 |
| |
International Coal Group, Inc. |
| (a)(c)3,085 |
| 17 |
| |
Westmoreland Coal Co. |
| (a)(c)166 |
| 3 |
| |
|
|
|
| 40 |
| |
Commercial Information Services (0.2%) |
|
|
|
|
| |
infoUSA, Inc. |
| 1,377 |
| 16 |
| |
Commercial Services & Supplies (1.0%) |
|
|
|
|
| |
Kendle International, Inc. |
| (a)1,556 |
| 49 |
| |
Vector Group Ltd |
| 1,116 |
| 20 |
| |
|
|
|
| 69 |
| |
Communications & Media (0.7%) |
|
|
|
|
| |
CBeyond Communications |
| (a)1,527 |
| 47 |
| |
Communications Technology (4.0%) |
|
|
|
|
| |
Anixter International, Inc. |
| (a)534 |
| 29 |
| |
Brocade Communications Systems, Inc. |
| (a)5,364 |
| 44 |
| |
CommScope, Inc. |
| (a)1,487 |
| 45 |
| |
Harmonic, Inc. |
| (a)(c)2,727 |
| 20 |
| |
InPhonic, Inc. |
| (a)(c)634 |
| 7 |
| |
Netgear, Inc. |
| (a)(c)883 |
| 23 |
| |
SAVVIS, Inc. |
| (a)(c)574 |
| 21 |
| |
Standard Micosystems Corp. |
| (a)572 |
| 16 |
| |
Tekelec |
| (a)(c)2,436 |
| 36 |
| |
UTstarcom, Inc. |
| (a)(c)3,139 |
| 28 |
| |
|
|
|
| 269 |
| |
Computer Services Software & Systems (5.4%) |
|
|
|
|
| |
CACI International, Inc., Class A |
| (a)704 |
| 40 |
| |
COMSYS IT Partners, Inc. |
| (a)(c)491 |
| 10 |
| |
Forrester Research, Inc. |
| (a)624 |
| 17 |
| |
iGate Corp. |
| (a)(c)2,680 |
| 18 |
| |
JDA Software Group, Inc. |
| (a)3,470 |
| 48 |
| |
Mantech International Corp., Class A |
| (a)393 |
| 14 |
| |
Mapinfo Corp. |
| (a)(c)4,184 |
| 55 |
| |
Mercury Computer Systems, Inc. |
| (a)(c)531 |
| 7 |
| |
Merge Technologies, Inc. |
| (a)(c)143 |
| 1 |
| |
TTM Technologies, Inc. |
| (a)3,361 |
| 48 |
| |
Schawk, Inc. |
| (c)663 |
| 13 |
| |
SonicWALL, Inc. |
| (a)5,511 |
| 46 |
| |
Vignette Corp. |
| (a)(c)2,683 |
| 46 |
| |
|
|
|
| 363 |
| |
Computer Technology (1.3%) |
|
|
|
|
| |
EGL, Inc. |
| (a)1,590 |
| 47 |
| |
Komag, Inc. |
| (a)(c)657 |
| 25 |
| |
Radisys Corp. |
| (a)807 |
| 14 |
| |
|
|
|
| 86 |
| |
Construction (0.3%) |
|
|
|
|
| |
Granite Construction, Inc. |
| 439 |
| 22 |
| |
Consumer Electronics (1.5%) |
|
|
|
|
| |
Infospace, Inc. |
| (a)(c)2,808 |
| 58 |
| |
Ipass, Inc. |
| (a)(c)6,968 |
| 41 |
| |
|
|
|
| 99 |
| |
Consumer Products (0.2%) |
|
|
|
|
| |
Jarden Corp. |
| (a)(c)343 |
| 12 |
| |
Consumer Staples — Miscellaneous (0.2%) |
|
|
|
|
| |
AACO Brands Corp. |
| (a)573 |
| 15 |
| |
The accompanying notes are an integral part of the financial statements.
104
| 2006 Annual Report |
|
|
| December 31, 2006 |
Portfolio of Investments (cont’d)
Systematic Active Small Cap Growth Portfolio
|
|
|
| Value |
| |
|
| Shares |
| (000) |
| |
Containers & Packaging: Paper &Plastic (0.4%) |
|
|
|
|
| |
Silgan Holdings, Inc. |
| (c)641 |
| $ | 28 |
|
Copper (0.7%) |
|
|
|
|
| |
Mueller Industries, Inc. |
| 1,455 |
| 46 |
| |
Cosmetics (0.0%) |
|
|
|
|
| |
Parlux Fragrances, Inc. |
| (a)(c)404 |
| 2 |
| |
Diversified Materials & Processing (1.8%) |
|
|
|
|
| |
Armor Holdings, Inc. |
| (a)(c)855 |
| 47 |
| |
Barnes Group, Inc. |
| 1,206 |
| 26 |
| |
Olin Corp. |
| 2,793 |
| 46 |
| |
|
|
|
| 119 |
| |
Drug & Grocery Store Chains (0.2%) |
|
|
|
|
| |
Casey’s General Stores, Inc. |
| 449 |
| 11 |
| |
Drugs & Pharmaceuticals (3.3%) |
|
|
|
|
| |
Alkermes, Inc. |
| (a)(c)2,202 |
| 30 |
| |
Hi-Tech Pharmacal Co., Inc. |
| (a)(c)1,156 |
| 14 |
| |
Medicis Pharmaceutical Corp. |
| (c)1,485 |
| 52 |
| |
Perrigo Com. |
| (c)1,396 |
| 24 |
| |
Pharmion Corp. |
| (a)(c)2,459 |
| 63 |
| |
Valeant Pharmaceuticals International |
| 2,320 |
| 40 |
| |
|
|
|
| 223 |
| |
Electrical & Electronics (0.3%) |
|
|
|
|
| |
TTM Technologies, Inc. |
| (a)1,781 |
| 20 |
| |
Electrical Equipment & Components (1.1%) |
|
|
|
|
| |
A.O. Smith Corp. |
| 640 |
| 24 |
| |
Greatbatch, Inc. |
| (a)(c)514 |
| 14 |
| |
RF Micro Devices, Inc. |
| (a)(c)5,126 |
| 35 |
| |
|
|
|
| 73 |
| |
Electronics (1.7%) |
|
|
|
|
| |
Avid Technology, Inc. |
| (a)(c)981 |
| 37 |
| |
Omnivision Technologies, Inc. |
| (a)(c)5,672 |
| 77 |
| |
|
|
|
| 114 |
| |
Electronics: Instruments Gauges & Meters (0.4%) |
|
|
|
|
| |
Watts Water Technologies, Inc., Class A |
| (c)732 |
| 30 |
| |
Electronics: Medical Systems (2.2%) |
|
|
|
|
| |
Bruker BioSciences Corp. |
| (a)(c)5,803 |
| 44 |
| |
Candela Corp. |
| (a)3,551 |
| 44 |
| |
Haemonetics Corp. |
| (a)855 |
| 38 |
| |
Zoll Medical Corp. |
| (a)(c)363 |
| 21 |
| |
|
|
|
| 147 |
| |
Electronics: Semi-Conductors/Components (3.9%) |
|
|
|
|
| |
Amkor Technology, Inc. |
| (a)(c)3,582 |
| 34 |
| |
Benchmark Electronics, Inc. |
| (a)1,653 |
| 40 |
| |
Genesis Microchip, Inc. |
| (a)1,471 |
| 15 |
| |
Integrated Device Technology, Inc. |
| (a)609 |
| 9 |
| |
IXYS Corp. |
| (a)(c)1,022 |
| 9 |
| |
ON Semiconductor Corp. |
| (a)(c)8,426 |
| 64 |
| |
Photon Dynamics, Inc. |
| (a)316 |
| 4 |
| |
Plexus Corp. |
| (a)(c)2,054 |
| 49 |
| |
Portalplayer, Inc. |
| (a)591 |
| 8 |
| |
Skyworks Solutions, Inc. |
| (a)4,436 |
| 31 |
| |
|
|
|
| 263 |
| |
Electronics: Technology (0.1%) |
|
|
|
|
| |
Secure Computing Corp. |
| (a)1,367 |
| 9 |
| |
Energy — Miscellaneous (2.0%) |
|
|
|
|
| |
Allis-Chalmers Energy, Inc. |
| (a)(c)301 |
| 7 |
| |
Alon USA Energy, Inc. |
| (c)576 |
| 15 |
| |
Energy Partners Ltd. |
| (a)924 |
| 23 |
| |
Giant Industries, Inc. |
| (a)269 |
| 20 |
| |
Helix Energy Solutions Group, Inc. |
| (a)(c)360 |
| 11 |
| |
Markwest Hydrocarbon, Inc. |
| 279 |
| 14 |
| |
Swift Energy Co. |
| (a)1,038 |
| 46 |
| |
|
|
|
| 136 |
| |
Entertainment (0.9%) |
|
|
|
|
| |
Take-Two Interactive Software, Inc. |
| (a)3,377 |
| 60 |
| |
Finance Companies (0.6%) |
|
|
|
|
| |
Asta Funding, Inc. |
| (c)526 |
| 16 |
| |
Jefferies Group, Inc. |
| 999 |
| 27 |
| |
|
|
|
| 43 |
| |
Finance: Small Loan (0.1%) |
|
|
|
|
| |
QC Holdings, Inc. |
| (a)496 |
| 8 |
| |
Financial — Miscellaneous (2.3%) |
|
|
|
|
| |
Advanta Corp., Class B |
| 971 |
| 42 |
| |
Asset Acceptance Capital Corp. |
| (a)(c)996 |
| 17 |
| |
Harris & Harris Group, Inc. |
| (a)(c)3,865 |
| 47 |
| |
Jackson Hewitt Tax Service, Inc. |
| 1,489 |
| 50 |
| |
|
|
|
| 156 |
| |
Foods (0.7%) |
|
|
|
|
| |
Flowers Foods, Inc. |
| 1,746 |
| 47 |
| |
Forest Products (0.3%) |
|
|
|
|
| |
Universal Forest Products, Inc. |
| (c)379 |
| 18 |
| |
Glass (0.3%) |
|
|
|
|
| |
Apogee Enterprises, Inc. |
| 1,000 |
| 19 |
| |
Health Care Facilities (1.2%) |
|
|
|
|
| |
Medcath Corp. |
| (a)630 |
| 17 |
| |
Psychiatric Solutions, I nc. |
| (a)(c)1,485 |
| 56 |
| |
VistaCare, Inc., Class A |
| (a)(c)527 |
| 5 |
| |
|
|
|
| 78 |
| |
Health Care Management Services (1.4%) |
|
|
|
|
| |
Centene Corp. |
| (a)(c)253 |
| 6 |
| |
Corvel Corp. |
| (a)276 |
| 13 |
| |
Eclipsys Corp. |
| (a)2,055 |
| 42 |
| |
Molina Healthcare, Inc. |
| (a)777 |
| 26 |
| |
Sierra Health Services, Inc. |
| (a)242 |
| 9 |
| |
|
|
|
| 96 |
| |
Health Care — Miscellaneous (0.6%) |
|
|
|
|
| |
Medical Action Industries, Inc. |
| (a)(c)360 |
| 12 |
| |
NBTY, Inc. |
| (a)734 |
| 30 |
| |
|
|
|
| 42 |
| |
Health Care Services (0.7%) |
|
|
|
|
| |
Amedisys, Inc. |
| (a)(c)1,166 |
| 39 |
| |
Matria Healthcare, Inc. |
| (a)(c)216 |
| 6 |
| |
|
|
|
| 45 |
| |
The accompanying notes are an integral part of the financial statements.
105
2006 Annual Report |
|
|
|
December 31, 2006 |
|
Portfolio of Investments (cont’d)
Systematic Active Small Cap Growth Portfolio
|
|
|
| Value |
| |
|
| Shares |
| (000) |
| |
Homebuilding (0.8%) |
|
|
|
|
| |
Brookfield Homes Corp. |
| (c)1,078 |
| $ | 41 |
|
M/I Homes, Inc. |
| (c)347 |
| 13 |
| |
|
|
|
| 54 |
| |
Hotel/Motel (0.7%) |
|
|
|
|
| |
Lodgian, Inc. |
| (a)3,465 |
| 47 |
| |
Household Furnishings (0.4%) |
|
|
|
|
| |
American Woodmark Corp. |
| 286 |
| 12 |
| |
Lifetime Brands, Inc. |
| 890 |
| 15 |
| |
|
|
|
| 27 |
| |
Identification Control & Filter Devices (0.1%) |
|
|
|
|
| |
X-Rite, Inc. |
| (c)387 |
| 5 |
| |
Industrial Products (0.1%) |
|
|
|
|
| |
A.M. Castle & Co. |
| 389 |
| 10 |
| |
Insurance: Multi-Line (0.2%) |
|
|
|
|
| |
HealthExtras, Inc. |
| (a)(c)670 |
| 16 |
| |
Investment Management Companies (0.7%) |
|
|
|
|
| |
National Financial Partners Corp. |
| 1,036 |
| 46 |
| |
Machinery & Engineering (0.5%) |
|
|
|
|
| |
Applied Industrial Technologies, Inc. |
| 1,278 |
| 34 |
| |
Machinery: Industrial/Specialty (0.2%) |
|
|
|
|
| |
Columbus McKinnon Corp. |
| (a)528 |
| 11 |
| |
Machinery: Oil Well Equipment & Services (0.9%) |
|
|
|
|
| |
Gulf Island Fabrication, Inc. |
| (c)366 |
| 13 |
| |
Oil States International, Inc. |
| (a)799 |
| 26 |
| |
W-H Energy Services, Inc. |
| (a)394 |
| 19 |
| |
|
|
|
| 58 |
| |
Manufactured Housing (0.8%) |
|
|
|
|
| |
Palm Harbor Homes, Inc. |
| (a)679 |
| 9 |
| |
Winnebago Industries, Inc. |
| 1,456 |
| 48 |
| |
|
|
|
| 57 |
| |
Manufacturing (1.3%) |
|
|
|
|
| |
Actuant Corp., Class A |
| (c)980 |
| 47 |
| |
Acuity Brands, Inc. |
| (c)776 |
| 40 |
| |
|
|
|
| 87 |
| |
Medical & Dental Instruments & Supplies (3.8%) |
|
|
|
|
| |
Arrow International, Inc. |
| (c)1,091 |
| 39 |
| |
Biosite Diagnostics, Inc. |
| (a)(c)697 |
| 34 |
| |
Enzon Pharmaceuticals, Inc. |
| (a)(c)1,569 |
| 13 |
| |
ICU Medical, Inc. |
| (a)722 |
| 29 |
| |
Inverness Medical Innovations, Inc. |
| (a)(c)1,238 |
| 48 |
| |
Sonic Innovations, Inc. |
| (a)950 |
| 5 |
| |
Thoratec Corp. |
| (a)683 |
| 12 |
| |
West Pharmaceutical Services, Inc. |
| 1,437 |
| 74 |
| |
|
|
|
| 254 |
| |
Medical Services (0.4%) |
|
|
|
|
| |
Parexel International Corp. |
| (a)1,048 |
| 30 |
| |
Metal Fabricating (2.1%) |
|
|
|
|
| |
Lone Star Technologies, Inc. |
| (a)952 |
| 46 |
| |
Quanex Corp. |
| 1,343 |
| 46 |
| |
Superior Essex, Inc. |
| (a)1,437 |
| 48 |
| |
|
|
|
| 140 |
| |
Office Furniture & Business Equipment (0.2%) |
|
|
|
|
| |
Kimball International, Inc., Class B |
| 640 |
| 16 |
| |
Oil & Gas (0.7%) |
|
|
|
|
| |
Todco |
| (a)1,347 |
| 46 |
| |
Oil: Crude Producers (0.5%) |
|
|
|
|
| |
PetroHawk Energy Corp. |
| (a)2,784 |
| 32 |
| |
Pharmaceuticals (0.7%) |
|
|
|
|
| |
Salix Pharmaceuticals Ltd. |
| (a)3,893 |
| 47 |
| |
Pollution Control & Environmental Services (0.2%) |
|
|
|
|
| |
Headwaters, Inc. |
| (a)(c)471 |
| 11 |
| |
Power Transmission Equipment (0.7%) |
|
|
|
|
| |
Regal-Beloit Corp. |
| 871 |
| 46 |
| |
Printing & Copying Services (0.4%) |
|
|
|
|
| |
Consolidated Graphics, Inc. |
| (a)459 |
| 27 |
| |
Production Technology Equipment (0.7%) |
|
|
|
|
| |
Mattson Technology, Inc. |
| (a)(c)3,320 |
| 31 |
| |
MTS Systems Corp. |
| (c)394 |
| 15 |
| |
|
|
|
| 46 |
| |
Real Estate (0.8%) |
|
|
|
|
| |
Resource Capital Corp. |
| (c)3,162 |
| 54 |
| |
Real Estate Investment Trusts (REIT) (2.4%) |
|
|
|
|
| |
BioMed Realty Trust, Inc. REIT |
| 1,664 |
| 48 |
| |
Mills Corp. (The) REIT |
| (c)3,359 |
| 67 |
| |
Sunstone Hotel Investors, Inc. REIT |
| 1,773 |
| 47 |
| |
|
|
|
| 162 |
| |
Restaurants (1.5%) |
|
|
|
|
| |
Rare Hospitality International, Inc. |
| (a)1,327 |
| 44 |
| |
Ruby Tuesday, Inc. |
| (c)2,050 |
| 56 |
| |
|
|
|
| 100 |
| |
Retail (9.7%) |
|
|
|
|
| |
1-800-FLOWERS.COM, Inc., Class A |
| (a)(c)739 |
| 5 |
| |
America’s Car-Mart, Inc. |
| (a)(c)206 |
| 2 |
| |
Brown Shoe Co., Inc. |
| 1,051 |
| 50 |
| |
Build-A-Bear Workshop, Inc. |
| (a)(c)559 |
| 16 |
| |
Central Garden & Pet Co. |
| (a)(c)688 |
| 33 |
| |
Charming Shoppes, Inc. |
| (a)2,400 |
| 33 |
| |
Childrens Place Retail Stores, Inc. (The) |
| (a)(c)1,179 |
| 75 |
| |
CKE Restaurants, Inc. |
| (c)2,464 |
| 45 |
| |
Conn’s, Inc. |
| (a)879 |
| 20 |
| |
Dress Barn, Inc. |
| (a)(c)870 |
| 20 |
| |
Drugstore.Com, Inc. |
| (a)2,007 |
| 7 |
| |
Global Imaging Systems, Inc. |
| (a)1,554 |
| 34 |
| |
MarineMax, Inc. |
| (a)(c)447 |
| 12 |
| |
Men’s Wearhouse, Inc. |
| 1,042 |
| 40 |
| |
Morton’s Restaurant Group, Inc. |
| (a)2,054 |
| 34 |
| |
New York & Co., Inc. |
| (a)3,530 |
| 46 |
| |
Nu Skin Enterprises, Inc., Class A |
| 804 |
| 15 |
| |
Pantry, Inc. (The) |
| (a)1,175 |
| 55 |
| |
Payless Shoesource, Inc. |
| (a)660 |
| 22 |
| |
Priceline.com, Inc. |
| (a)(c)1,253 |
| 55 |
| |
School Specialty, Inc. |
| (a)(c)741 |
| 28 |
| |
Wet Seal, Inc. (The), Class A |
| (a)1,241 |
| 8 |
| |
|
|
|
| 655 |
| |
The accompanying notes are an integral part of the financial statements.
106
| 2006 Annual Report |
|
|
| December 31, 2006 |
Portfolio of Investments (cont’d)
Systematic Active Small Cap Growth Portfolio
|
|
|
| Value |
| |
|
| Shares |
| (000) |
| |
Rental & Leasing Services: Consumer (0.3%) |
|
|
|
|
| |
Amerco, Inc. |
| (a)(c)281 |
| $ | 24 |
|
Securities Brokerage & Services (0.0%) |
|
|
|
|
| |
MarketAxess Holdings, Inc. |
| (a)237 |
| 3 |
| |
Services: Commercial (5.6%) |
|
|
|
|
| |
Aaron Rents, Inc. |
| 1,116 |
| 32 |
| |
AMN Healthcare Services, Inc. |
| (a)(c)1,168 |
| 32 |
| |
Barrett Business Services |
| (c)289 |
| 7 |
| |
Hudson Highland Group, Inc. |
| (a)2,793 |
| 46 |
| |
Kelly Services, Inc., Class A |
| (c)837 |
| 24 |
| |
Kforce.com, Inc. |
| (a)3,857 |
| 47 |
| |
Labor Ready,Inc. |
| (a)2,454 |
| 45 |
| |
Live Nation, Inc. |
| (a)1,620 |
| 36 |
| |
Monro Muffler, Inc. |
| (c)475 |
| 17 |
| |
MPS Group, Inc. |
| (a)1,638 |
| 23 |
| |
Spherion Corp. |
| (a)(c)5,333 |
| 40 |
| |
World Fuel Services Corp. |
| 644 |
| 29 |
| |
|
|
|
| 378 |
| |
Shoes (0.3%) |
|
|
|
|
| |
Skechers U.S.A., Inc., Class A |
| (a)672 |
| 22 |
| |
Software (1.4%) |
|
|
|
|
| |
Agile Software Corp |
| (a)7,838 |
| 48 |
| |
Wind River Systems |
| (a)4,552 |
| 47 |
| |
|
|
|
| 95 |
| |
Steel (0.6%) |
|
|
|
|
| |
AK Steel Holding Corp. |
| (a)2,569 |
| 43 |
| |
Technology (1.4%) |
|
|
|
|
| |
Semitool Inc. |
| (a)3,578 |
| 48 |
| |
Synchronoss Technologies, Inc. |
| (a)3,559 |
| 49 |
| |
|
|
|
| 97 |
| |
Telecommunications Equipment (0.5%) |
|
|
|
|
| |
Arris Group, Inc. |
| 2,125 |
| 26 |
| |
Symmetricom, Inc. |
| (a)1,087 |
| 10 |
| |
|
|
|
| 36 |
| |
Textile Apparel Manufacturers (0.7%) |
|
|
|
|
| |
Warnaco Group, Inc. (The) |
| (a)(c)1,810 |
| 46 |
| |
Toys (0.2%) |
|
|
|
|
| |
Leapfrog Enterprises, Inc. |
| (a)1,169 |
| 11 |
| |
Transportation— Miscellaneous (0.7%) |
|
|
|
|
| |
Dynamex, Inc. |
| (a)(c)273 |
| 6 |
| |
Greenbrier Cos.,Inc. |
| (c)361 |
| 11 |
| |
Pacer International, Inc. |
| 1,110 |
| 33 |
| |
|
|
|
| 50 |
| |
Truckers (0.4%) |
|
|
|
|
| |
Marten Transport Ltd. |
| (a)(c)733 |
| 13 |
| |
Old Dominion Freight Line |
| (a)(c)609 |
| 15 |
| |
|
|
|
| 28 |
| |
Utilities: Telecommunications (0.6%) |
|
|
|
|
| |
Dobson Communications Corp. |
| (a)4,061 |
| 35 |
| |
Radyne Corp. |
| (a)369 |
| 4 |
| |
|
|
|
| 39 |
| |
Wholesale & International Trade (0.5%) |
|
|
|
|
| |
Central European Distribution Corp. |
| (a)(c)1,110 |
| 33 |
| |
Wholesalers (0.2%) |
|
|
|
|
| |
WESCO International, Inc. |
| (a)232 |
| 14 |
| |
Total Common Stocks (Cost $6,659) |
|
|
| 6,692 |
| |
|
| Face |
|
|
| |
|
| Amount |
|
|
| |
|
| (000) |
|
|
| |
Short-Term Investments (45.3%) |
|
|
|
|
| |
Short-Term Debt Securities held as Collateral on Loaned Securities (32.2%) |
|
|
|
|
| |
Alliance & Leicester plc, 5.36%, 1/8/07 |
| $ | (h)71 |
| 71 |
|
Bancaja, 5.37%, 1/19/07 |
| (h)35 |
| 35 |
| |
Bank of America Corp., 5.32%, 1/2/07 |
| (h)113 |
| 113 |
| |
Bank of New York Co., Inc., |
|
|
|
|
| |
5.34%, 1/10/07 |
| (h)35 |
| 35 |
| |
Bear Stearns & Co., Inc., |
|
|
|
|
| |
5.37%, 1/2/07 |
| (h)42 |
| 42 |
| |
5.38%, 1/2/07 |
| (h)28 |
| 28 |
| |
5.39%, 1/16/07 |
| (h)71 |
| 71 |
| |
BNP Paribas plc, |
|
|
|
|
| |
5.35%, 2/20/07 |
| (h)71 |
| 71 |
| |
CIC, New York, |
|
|
|
|
| |
5.33%, 1/3/07 |
| (h)50 |
| 50 |
| |
5.34%, 1/2/07 |
| (h)71 |
| 71 |
| |
Dekabank Deutsche Girozentrale, |
|
|
|
|
| |
5.39%, 1/19/07 |
| (h)72 |
| 72 |
| |
Deutsche Bank Securities, Inc., |
|
|
|
|
| |
5.33%, 1/2/07 |
| 227 |
| 227 |
| |
Dexia Bank New York, |
|
|
|
|
| |
5.33%, 1/2/07 |
| (h)71 |
| 71 |
| |
Gemini Securitization Corp., |
|
|
|
|
| |
5.34%, 1/2/07 |
| 35 |
| 35 |
| |
Goldman Sachs Group, Inc., |
|
|
|
|
| |
5.40%, 1/16/07 |
| (h)35 |
| 35 |
| |
5.42%, 1/2/07 |
| (h)66 |
| 66 |
| |
HSBC Finance Corp., |
|
|
|
|
| |
5.34%, 1/8/07 |
| (h)35 |
| 35 |
| |
Liberty Lighthouse U.S. Capital, |
|
|
|
|
| |
5.33%, 1/2/07 |
| (h)35 |
| 35 |
| |
Manufacturers & Traders, |
|
|
|
|
| |
5.33%, 1/16/07 |
| (h)43 |
| 43 |
| |
Merrill Lynch& Co., |
|
|
|
|
| |
5.35%, 1/26/07 |
| (h)37 |
| 37 |
| |
Mitsubishi UFJ FinancialGroup, |
|
|
|
|
| |
5.33%, 1/2/07 |
| (h)35 |
| 35 |
| |
Natexis Banques Populaires, New York, |
|
|
|
|
| |
5.34%, 1/2/07 |
| (h)71 |
| 71 |
| |
5.35%, 1/2/07 |
| (h)35 |
| 35 |
| |
National City Bank Cleveland, |
|
|
|
|
| |
5.32%, 1/2/07 |
| (h)103 |
| 103 |
| |
National Rural Utilities Cooperative Finance Corp., |
|
|
|
|
| |
5.34%, 1/2/07 |
| (h)141 |
| 141 |
| |
Nationwide Building Society, |
|
|
|
|
| |
5.44%, 3/28/07 |
| (h)82 |
| 82 |
| |
Nordea Bank, New York, |
|
|
|
|
| |
5.31%, 1/2/07 |
| (h)106 |
| 106 |
| |
Rhein-Main Securitisation Ltd., |
|
|
|
|
| |
5.33%, 1/18/07 |
| 33 |
| 33 |
| |
The accompanying notes are an integral part of the financial statements.
107
2006 Annual Report |
|
|
|
December 31, 2006 |
|
Portfolio of Investments (cont’d)
Systematic Active Small Cap Growth Portfolio
|
| Face |
|
|
| |||
|
| Amount |
| Value |
| |||
|
| (000) |
| (000) |
| |||
Short-Term Debt Securities held as Collateral on Loaned Securities (cont’d) |
|
|
|
|
| |||
Skandi, New York, |
|
|
|
|
| |||
5.34%, 1/9/07 |
| $ | (h)71 |
| $ | 71 |
| |
SLM Corp., 5.36%, 1/22/07 |
| (h)71 |
| 71 |
| |||
Toronto Dominion, New York, |
|
|
|
|
| |||
5.32%, 5/29/07 |
| (h)71 |
| 71 |
| |||
Tulip Funding, 5.36%, 1/16/07 |
| 39 |
| 39 |
| |||
Unicredito Italiano Bank (Ireland) plc, |
|
|
|
|
| |||
5.36%, 1/9/07 |
| (h)49 |
| 49 |
| |||
World Savings Bank FSB, |
|
|
|
|
| |||
5.35%, 1/19/07 |
| (h)24 |
| 24 |
| |||
|
|
|
| 2,174 |
| |||
Repurchase Agreement (13.1%) |
|
|
|
|
| |||
J.P. Morgan Securities, Inc., 5.20%, dated 12/29/06, due 1/2/07, repurchase price $883 |
| (f)882 |
| 882 |
| |||
Total Short-Term Investments (Cost $3,056) |
|
|
| 3,056 |
| |||
Total Investments (144.5%) (Cost $9,715) — including $2,103 of Securities Loaned |
|
|
| 9,748 |
| |||
Liabilities in Excess of Other Assets (-44.5%) |
|
|
| (3,004 | ) | |||
Net Assets (100%) |
|
|
| $ | 6,744 |
| ||
(a) |
| Non-income producing security. |
|
|
|
(c) |
| All or portion of security on loan at December 31, 2006. |
|
|
|
(f) |
| Represents the Portfolio’s undivided interest in a joint repurchase agreement which has a total value of $1,856,998,000. The repurchase agreement was fully collateralized by U.S. government agency securities at the date of this Portfolio of Investments as follows: Federal Farm Credit Bank, 0.00% to 7.43%, due 1/16/07 to 10/23/35; Federal Home Loan Bank, 0.00% to 7.38%, due 1/3/07 to 6/5/28; Federal Home Loan Mortgage Corp., 0.00% to 6.75%, due 1/2/07 to 7/15/32; Federal National Mortgage Association, 0.00% to 8.20%, due 1/12/07 to 11/15/30; Tennessee Valley Authority, 5.38% to 6.75%, due 11/13/08 to 4/1/36, which had a total value of $1,894,142,869. The investment in the repurchase agreement is through participation in a joint account with affiliated parties pursuant to exemptive relief received by the Portfolio from the SEC. |
|
|
|
(h) |
| Variable/Floating Rate Security — interest rate changes on these instruments are based on changes in a designated base rate. The rates shown are those in effect on December 31, 2006. |
|
|
|
REIT |
| Real Estate Investment Trust |
The accompanying notes are an integral part of the financial statements.
108
| 2006 Annual Report |
|
|
| December 31, 2006 |
Investment Overview (unaudited)
Systematic Active Small Cap Value Portfolio
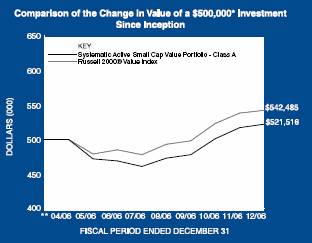
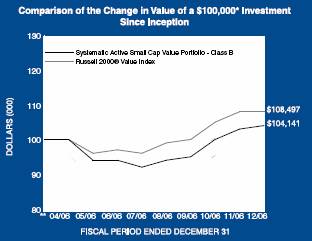
* Minimum Investment
** Commenced operations on April 28, 2006
In accordance with SEC regulations, Portfolio performance shown assumes that all recurring fees (including management fees) were deducted and all dividends and distributions were reinvested.
Performance Compared to the Russell 2000®
Value Index(1)
|
| Total Returns(2) |
|
|
| Cumulative |
|
|
| Since |
|
|
| Inception(4) |
|
Portfolio – Class A (3) |
| 4.30 | % |
Russell 2000® Value Index |
| 8.50 |
|
|
|
|
|
Portfolio – Class B (3) |
| 4.14 |
|
Russell 2000® Value Index |
| 8.50 |
|
Performance data quoted represents past performance, which is no guarantee of future results, and current performance may be lower or higher than the figures shown. Performance assumes that all dividends and distributions, if any, were reinvested. For the most recent month-end performance figures, please visit www.morganstanley.com/im. Investment return and principal value will fluctuate so that Portfolio shares, when redeemed, may be worth more or less than their original cost. Total returns do not reflect the deduction of taxes that a shareholder would pay on Portfolio distributions or the redemption of Portfolio shares.
(1) |
| The Russell 2000® Value Index measures the performance of those companies in the Russell 2000® Index with lower price-to-book ratios and lower forecasted growth values. The Index is unmanaged and its returns do not include any sales charges or fees. Such costs would lower performance. It is not possible to invest directly in an index. |
|
|
|
(2) |
| Total returns for the Portfolio reflect fees waived and expenses reimbursed, if applicable, by the Adviser. Without such waivers and/or reimbursements, total returns would have been lower. Fee waivers and/or expense reimbursements are voluntary and the Adviser reserves the right to commence or terminate any waiver and/or reimbursement at any time. |
|
|
|
(3) |
| Commenced operations on April 28, 2006 |
|
|
|
(4) |
| For comparative purposes, cumulative since inception returns listed for the Index refer to the inception date or initial offering of the respective share class of the Portfolio, not the inception of the Index. |
The Systematic Active Small Cap Value Portfolio seeks long-term capital appreciation by investing primarily in valued oriented equity securities of small capitalization companies. Investments in small sized corporations are more vulnerable to financial risks and other risks than larger corporations and may involve a higher degree of price volatility than investments in the general equity markets.
Performance
For the period from April 28, 2006 (commencement of operations) to December 31, 2006, the Portfolio had a total return based on net asset value per share of 4.30% for the Class A shares, net of fees, and 4.14% for the Class B shares, net of fees, compared to 8.50% for the Russell 2000® Value Index (the “Index”).
Factors Affecting Performance
• The Portfolio’s launch in April coincided with the turbulent second quarter of 2006. Small-cap stocks subsequently returned to positive territory in the third and fourth quarters, with the value segment showing the strongest rebound. As a result, both the Index and the Portfolio had positive returns for the period since inception through December 31, 2006.
• In the first half of 2006, stock investors dealt with the uncertainties of a slowing economy. There was some well-received merger and acquisition activity in March and April; however, gains were rather muted as investors kept a close eye on inflation levels, energy prices and the policy actions of the Federal Open Market Committee (FOMC). By May, recession anxieties reached a boiling
109
2006 Annual Report |
|
|
|
December 31, 2006 |
|
Investment Overview (cont’d)
Systematic Active Small Cap Value Portfolio
point, prompting a market sell-off and heightened volatility that spanned into June.
• The second half of the year was characterized by greater optimism. The markets began to stabilize in July on the expectation that the FOMC would pause in its increases to the target federal funds target rate, and the FOMC did leave the rate unchanged for the remainder of 2006, given the slowdown in the housing market, rising interest rates and high energy prices. Although third quarter gross domestic product (GDP) growth was below expectations, investors appeared reasonably confident that the economy was moderating and not falling into a recession. Consumer spending and confidence, on the whole, did not flag any significant trouble, although by year end consumer debt levels were garnering greater attention. Warmer weather helped energy prices ease in the final months of 2006, and gasoline prices had also declined. The jobs market softened but was still in line with expectations, and inflation data reported at year end did not cause much of a stir.
• In aggregate, the Portfolio’s consumer staples holdings had the highest total return during the period, while materials holdings returned least.
• In terms of contribution to the Portfolio’s overall return, the financial sector had the largest positive impact, while the industrials sector was the largest detractor from performance.
• Relative to the Index, the Portfolio outperformed in the consumer discretionary sector. The Portfolio’s exposure to a publishing company was additive as the announcement of a new book title led to significantly strong pre-sales for the book.
• The materials sector was the primary detractor from relative performance, due to the Portfolio’s lack of exposure to one of the sector’s best performing stocks, a paper and packaging company.
Management Strategies
• We believe that we can enhance returns by employing a quantitative model that uses multiple, independent factors to examine the fundamentals of a company. We further believe that our quantitative efforts in combination with our fundamental analysis can exploit market inefficiencies.
• We employ a quantitative approach to stock selection utilizing a proprietary quantitative model. The model is driven by rigorous fundamental and quantitative research that screens a universe of large capitalization companies. The model employs three quantitative screens based on the following primary inputs-earnings expectations, price trends and relative valuations. Individual securities and industries are ranked within each sector by the most effective combination of these disciplines based on the current phase of the economic cycle. We then decide whether to buy, sell or hold a security based on its fundamental analysis and the results of this model-driven approach.
Expense Examples
As a shareholder of the Portfolio, you may incur two types of costs: (1) transactional costs, including redemption fees; (2) ongoing costs, including management fees, distribution (12b- 1) fees (in the case of Class B); and other Portfolio expenses. These examples are intended to help you understand your ongoing costs (in dollars) of investing in the Portfolio and to compare these costs with the ongoing costs of investing in other mutual funds.
The examples are based on an investment of $1,000 invested at the beginning of the six-month period ended December 31, 2006 and held for the entire six-month period.
Actual Expenses
The first line of the tables below provides information about actual account values and actual expenses. You may use the information in this line, together with the amount you invested, to estimate the expenses that you paid over the period. Simply divide your account value by $1,000 (for example, an $8,600 account value divided by $1,000 = 8.6), then multiply the result by the number in the first line under the heading entitled ���Expenses Paid During Period” to estimate the expenses you paid on your account during this period.
Please note that “Expenses Paid During Period” are grossed up to reflect Portfolio expenses prior to the effect of Expense Offset (See Note E in the Notes to Financial Statements). Therefore, the annualized net expense ratios may differ from the ratio of the expenses to average net assets shown in the Financial Highlights.
Hypothetical Example for Comparison Purposes
The second line of the tables below provides information about hypothetical account values and hypothetical expenses based on the Portfolio’s actual expense ratio and an assumed rate of return of 5% per year before expenses, which is not the Portfolio’s actual return. The hypothetical account values and expenses may not be used to estimate the actual ending account balance or expenses you paid for the period. You may use this information to compare the ongoing costs of investing in the Portfolio and other funds. To do so, compare this 5%
110
| 2006 Annual Report |
|
|
| December 31, 2006 |
Investment Overview (cont’d)
Systematic Active Small Cap Value Portfolio
hypothetical example with the 5% hypothetical examples that appear in the shareholder reports of the other funds.
Please note that the expenses shown in the table are meant to highlight your ongoing costs only and do not reflect any transactional costs, such as redemption fees. Therefore, the second line of the table is useful in comparing ongoing costs only, and will not help you determine the relative total costs of owning different funds. In addition, if these transactional costs were included, your costs would have been higher.
|
|
|
|
|
| Expenses Paid |
| |||
|
|
|
| Ending |
| During Period* |
| |||
|
| Beginning |
| Account Value |
| July 1, 2006 — |
| |||
|
| Account Value |
| December 31, |
| December 31, |
| |||
|
| July 1, 2006 |
| 2006 |
| 2006 |
| |||
Class A |
|
|
|
|
|
|
| |||
Actual |
| $ | 1,000.00 |
| $ | 1,112.00 |
| $ | 5.86 |
|
Hypothetical (5% average annual return before expenses) |
| 1,000.00 |
| 1,019.66 |
| 5.60 |
| |||
|
|
|
|
|
|
|
| |||
Class B |
|
|
|
|
|
|
| |||
Actual |
| 1,000.00 |
| 1,111.40 |
| 7.18 |
| |||
Hypothetical (5% average annual return before expenses) |
| 1,000.00 |
| 1,018.40 |
| 6.87 |
| |||
* Expenses are equal to Class A and Class B annualized net expense ratios of 1.10% and 1.35%, respectively, multiplied by the average account value over the period, multiplied by 184/365 (to reflect the one-half year period).
Graphic Presentation of Portfolio Holdings
The following graph depicts the Portfolio’s holdings by industry and/or security type, as a percentage of total investments.
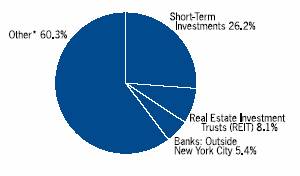
* Industries which do not appear in the above graph, as well as those which represent less than 5% of total investments, if applicable, are included in the category labeled “Other”.
January 2007
111
2006 Annual Report |
|
|
|
December 31, 2006 |
|
Portfolio of Investments
Systematic Active Small Cap Value Portfolio
|
|
|
| Value |
| |
|
| Shares |
| (000) |
| |
Common Stocks (99.8%) |
|
|
|
|
| |
Aerospace/Defense-Equipment (0.3%) |
|
|
|
|
| |
Kaman Corp. |
| 924 |
| $ | 21 |
|
Air Transport (0.6%) |
|
|
|
|
| |
Republic Airways Holdings, Inc. |
| (a)(c)795 |
| 13 |
| |
Skywest, Inc. |
| 1,048 |
| 27 |
| |
|
|
|
| 40 |
| |
Airlines (0.3%) |
|
|
|
|
| |
Continental Airlines, Inc., Class B |
| (a)507 |
| 21 |
| |
Auto Parts: After Market (0.2%) |
|
|
|
|
| |
Commercial Vehicle Group, Inc. |
| (a)553 |
| 12 |
| |
Auto Trucks & Parts (0.9%) |
|
|
|
|
| |
Lear Corp. |
| 1,511 |
| 45 |
| |
Modine Manufacturing Co. |
| (c)695 |
| 17 |
| |
|
|
|
| 62 |
| |
Automobiles (0.9%) |
|
|
|
|
| |
Navistar International Corp. |
| (a)1,901 |
| 64 |
| |
Banking (0.5%) |
|
|
|
|
| |
First Citizens BancShares, Inc., Class A |
| 176 |
| 36 |
| |
Banks: New York City (0.7%) |
|
|
|
|
| |
Community Bank System, Inc. |
| (c)1,966 |
| 45 |
| |
Banks: Outside New York City (7.3%) |
|
|
|
|
| |
1st Source Corp. |
| (c)614 |
| 20 |
| |
Arrow Financial Corp. |
| 208 |
| 5 |
| |
Banner Corp. |
| 446 |
| 19 |
| |
Cadence Financial Corp. |
| (c)124 |
| 3 |
| |
Central Pacific Financial Corp |
| (c)1,694 |
| 66 |
| |
Chemical Financial Corp. |
| (c)1,388 |
| 46 |
| |
Citizens First Bancorp, Inc. |
| (c)233 |
| 7 |
| |
First Bancorp/Puerto Rico |
| 5,311 |
| 51 |
| |
First Merchants Corp. |
| (c)635 |
| 17 |
| |
Franklin Bank Corp. |
| (a)(c)662 |
| 14 |
| |
GB&T Bancshares, Inc. |
| (c)1,197 |
| 27 |
| |
Irwin Financial Corp. |
| (c)1,888 |
| 43 |
| |
MainSource Financial Group, Inc. |
| (c)426 |
| 7 |
| |
MBT Financial Corp. |
| (c)326 |
| 5 |
| |
Omega Financial Corp. |
| (c)1,242 |
| 39 |
| |
Oriental Financial Group |
| 927 |
| 12 |
| |
Provident Bancshares Corp. |
| (c)1,115 |
| 40 |
| |
Security Bank Corp. |
| (c)208 |
| 5 |
| |
Sun Bancorp, Inc./NJ |
| (a)(c)645 |
| 13 |
| |
Susquehanna Bancshares, Inc. |
| (c)2,522 |
| 68 |
| |
|
|
|
| 507 |
| |
Biotechnology Research & Production (0.2%) |
|
|
|
|
| |
Albany Molecular Research, Inc. |
| (a)1,191 |
| 13 |
| |
Building Materials (0.6%) |
|
|
|
|
| |
BlueLinx Holdings, Inc. |
| (c)823 |
| 9 |
| |
Building Material Holding Corp. |
| (c)1,222 |
| 30 |
| |
|
|
|
| 39 |
| |
Building: Miscellaneous (0.2%) |
|
|
|
|
| |
Comfort Systems USA, Inc. |
| 1,136 |
| 14 |
| |
Cable Television Services (0.6%) |
|
|
|
|
| |
Charter Communications, Inc. |
| (a)(c)13,228 |
| 40 |
| |
Chemicals (2.2%) |
|
|
|
|
| |
Cambrex Corp. |
| (c)568 |
| 13 |
| |
Georgia Gulf Corp. |
| 1,155 |
| 22 |
| |
PolyOne Corp. |
| (a)3,368 |
| 25 |
| |
Rockwood Holdings, Inc. |
| (a)(c)1,837 |
| 47 |
| |
Schulman (A), Inc. |
| 2,096 |
| 47 |
| |
|
|
|
| 154 |
| |
Coal (1.1%) |
|
|
|
|
| |
International Coal Group, Inc. |
| (a)(c)11,746 |
| 64 |
| |
Massey Energy Company |
| 600 |
| 14 |
| |
|
|
|
| 78 |
| |
Commercial Banks (1.8%) |
|
|
|
|
| |
Alabama National Bancorp |
| 403 |
| 28 |
| |
Centennial Bank Holdings, Inc. |
| (a)4,353 |
| 41 |
| |
South Financial Group, Inc. (The) |
| 787 |
| 21 |
| |
W Holding Company, Inc. |
| 5,667 |
| 34 |
| |
|
|
|
| 124 |
| |
Commercial Information Services (1.2%) |
|
|
|
|
| |
CMGI, Inc. |
| (a)(c)24,710 |
| 33 |
| |
Deluxe Corp. |
| 1,115 |
| 28 |
| |
Source Interlink Co., Inc. |
| (a)2,570 |
| 21 |
| |
|
|
|
| 82 |
| |
Communications Technology (1.5%) |
|
|
|
|
| |
Black Box Corp. |
| (c)831 |
| 35 |
| |
Cogent Communications Group, Inc. |
| (a)1,356 |
| 22 |
| |
InPhonic, Inc. |
| (a)1,264 |
| 14 |
| |
Utstarcom, Inc. |
| (a)(c)3,539 |
| 31 |
| |
|
|
|
| 102 |
| |
Computer Services Software & Systems (1.8%) |
|
|
|
|
| |
Borland Software Corp. |
| (a)2,803 |
| 15 |
| |
JDA Software Group, Inc. |
| (a)2,374 |
| 33 |
| |
Perot Systems Corp., Class A |
| (a)4,559 |
| 75 |
| |
|
|
|
| 123 |
| |
Computer Technology (1.8%) |
|
|
|
|
| |
Hutchinson Technology, Inc. |
| (a)(c)242 |
| 6 |
| |
Imation Corp. |
| 809 |
| 38 |
| |
Komag, Inc. |
| (a)(c)770 |
| 29 |
| |
Palm, Inc. |
| (a)(c)2,657 |
| 37 |
| |
Quantum Corp. |
| (a)616 |
| 1 |
| |
|
|
|
| 111 |
| |
Construction (0.8%) |
|
|
|
|
| |
Emcor Group, Inc. |
| (a)990 |
| 56 |
| |
Consumer Electronics (0.8%) |
|
|
|
|
| |
Infospace, Inc. |
| (a)(c)2,781 |
| 57 |
| |
Consumer Finance (0.5%) |
|
|
|
|
| |
Freemont General Corp. |
| 2,103 |
| 34 |
| |
Consumer Products-Miscellaneous (0.2%) |
|
|
|
|
| |
Anixter International, Inc. |
| (a)254 |
| 14 |
| |
Containers & Packaging (0.5%) |
|
|
|
|
| |
Owens-Illinois, Inc. |
| (a)1,847 |
| 34 |
| |
Copper (0.4%) |
|
|
|
|
| |
Mueller Industries, Inc. |
| 943 |
| 30 |
| |
The accompanying notes are an integral part of the financial statements.
112
| 2006 Annual Report |
|
|
| December 31, 2006 |
Portfolio of Investments (cont’d)
Systematic Active Small Cap Value Portfolio
|
|
|
| Value |
| |
|
| Shares |
| (000) |
| |
Distributors (0.5%) |
|
|
|
|
| |
Volcano Corp. |
| (a)2,188 |
| $ | 36 |
|
Diversified Financial Services (0.7%) |
|
|
|
|
| |
First Niagara Financial Group, Inc. |
| (c)3,366 |
| 50 |
| |
Diversified Materials & Processing (0.2%) |
|
|
|
|
| |
Olin Corp. |
| 799 |
| 13 |
| |
Drug & Grocery Store Chains (0.4%) |
|
|
|
|
| |
Casey’s General Stores, Inc. |
| (c)1,097 |
| 26 |
| |
Spartan Stores, Inc. |
| 225 |
| 5 |
| |
|
|
|
| 31 |
| |
Drugs & Pharmaceuticals (0.7%) |
|
|
|
|
| |
Perrigo Co. |
| 1,490 |
| 26 |
| |
PharmaNet Development Group, Inc. |
| (a)921 |
| 20 |
| |
|
|
|
| 46 |
| |
Electrical Equipment & Components (0.7%) |
|
|
|
|
| |
Smith, A. O. Corp. |
| 823 |
| 31 |
| |
Technitrol, Inc. |
| 874 |
| 21 |
| |
|
|
|
| 52 |
| |
Electronic Components, Instruments (0.4%) |
|
|
|
|
| |
Cubic Corp. |
| 1,260 |
| 27 |
| |
Electronics (0.6%) |
|
|
|
|
| |
Avid Technology, Inc. |
| (a)(c)1,021 |
| 38 |
| |
Methode Electonics, Inc. |
| 268 |
| 3 |
| |
|
|
|
| 41 |
| |
Electronics: Semi-Conductors/Components (2.3%) |
|
|
|
|
| |
Benchmark Electronics, Inc. |
| (a)(c)2,332 |
| 57 |
| |
Brooks Automation, Inc. |
| (a)(c)2,323 |
| 33 |
| |
Conexant Systems, Inc. |
| (a)(c)27,031 |
| 55 |
| |
Genesis Microchip, Inc. |
| (a)785 |
| 8 |
| |
IXYS Corp. |
| (a)341 |
| 3 |
| |
|
|
|
| 156 |
| |
Electronics: Technology (0.4%) |
|
|
|
|
| |
Checkpoint Systems, Inc. |
| (a)1,550 |
| 31 |
| |
Energy Miscellaneous (0.5%) |
|
|
|
|
| |
Callon Petroleum Co. |
| (a)(c)1,433 |
| 21 |
| |
Harvest Natural Resources, Inc. |
| (a)(c)1,104 |
| 12 |
| |
|
|
|
| 33 |
| |
Engineering & Contracting Services (0.2%) |
|
|
|
|
| |
URS Corp. |
| (a)265 |
| 11 |
| |
Entertainment (1.5%) |
|
|
|
|
| |
Carmike Cinemas |
| (c)1,098 |
| 22 |
| |
Take-Two Interactive Software, Inc. |
| (a)(c)4,447 |
| 79 |
| |
|
|
|
| 101 |
| |
Finance Companies (0.5%) |
|
|
|
|
| |
Accredited Home Lenders Holding Co. |
| (a)(c)665 |
| 18 |
| |
MCG Capital Corp. |
| 944 |
| 19 |
| |
|
|
|
| 37 |
| |
Financial Miscellaneous (1.2%) |
|
|
|
|
| |
Advanta Corp., Class B |
| 602 |
| 26 |
| |
Federal Agricultural Mortgage Corp., Class C |
| 284 |
| 8 |
| |
LandAmerica Financial Group, Inc. |
| (c)735 |
| 46 |
| |
|
|
|
| 80 |
| |
Foods (1.8%) |
|
|
|
|
| |
Del Monte Corp. |
| 3,152 |
| 35 |
| |
Premium Std Farms, Inc. |
| 723 |
| 13 |
| |
Ralcorp Holdings, Inc. |
| (a)158 |
| 8 |
| |
Ruddick Corp. |
| (c)1,331 |
| 37 |
| |
Smithfield Foods Inc. |
| (a)1,356 |
| 35 |
| |
|
|
|
| 128 |
| |
Health Care Facilities (0.2%) |
|
|
|
|
| |
National Healthcare Corp. |
| (c)214 |
| 12 |
| |
Health Care Services (1.4%) |
|
|
|
|
| |
Alliance Imaging, Inc. |
| (a)(c)354 |
| 2 |
| |
AMERIGROUP Corp. |
| (a)650 |
| 23 |
| |
Matria Healthcare, Inc. |
| (a)(c)367 |
| 11 |
| |
Odyssey HealthCare, Inc. |
| (a)1,210 |
| 16 |
| |
Sunrise Assisted Living, Inc. |
| (a)(c)1,447 |
| 45 |
| |
|
|
|
| 97 |
| |
Homebuilding (2.9%) |
|
|
|
|
| |
Hanover Compressor Co. |
| (a)(c)2,825 |
| 53 |
| |
Hovnanian Enterprises, Inc. |
| (a)1,995 |
| 68 |
| |
Meritage Homes Corp. |
| (a)(c)937 |
| 45 |
| |
Orleans Homebuilders, Inc. |
| (c)295 |
| 6 |
| |
Technical Olympic USA, Inc. |
| (c)297 |
| 3 |
| |
WCI Communities, Inc. |
| (a)(c)1,319 |
| 25 |
| |
|
|
|
| 200 |
| |
Industrial Products (0.4%) |
|
|
|
|
| |
A.M. Castle & Co. |
| 1,070 |
| 27 |
| |
Insurance: Life (0.3%) |
|
|
|
|
| |
American Equity Investment Life Holding Co. |
| (c)123 |
| 2 |
| |
Conseco, Inc. |
| (a)1,043 |
| 21 |
| |
|
|
|
| 23 |
| |
Insurance: Property & Casualty (2.3%) |
|
|
|
|
| |
21st Century Insurance Group |
| (c)1,020 |
| 18 |
| |
Commerce Group, Inc. |
| 2,276 |
| 68 |
| |
Infinity Property & Casualty Corp. |
| 654 |
| 32 |
| |
RLI Corp. |
| 807 |
| 45 |
| |
|
|
|
| 163 |
| |
Investment Management Companies (2.7%) |
|
|
|
|
| |
Apollo Investment Corp. |
| (c)3,099 |
| 70 |
| |
Capital Southwest Corp. |
| (c)90 |
| 11 |
| |
Friedman Billings Ramsey Group, Inc., |
|
|
|
|
| |
Class A REIT |
| (c)7,781 |
| 62 |
| |
Piper Jaffray Cos. |
| (a)710 |
| 46 |
| |
|
|
|
| 189 |
| |
Leisure Time (0.7%) |
|
|
|
|
| |
K2, Inc. |
| (a)(c)3,562 |
| 47 |
| |
Lodging/Resorts (0.6%) |
|
|
|
|
| |
Bluegreen Corp. |
| (a)3,238 |
| 42 |
| |
Machinery: Industrial/Specialty (0.6%) |
|
|
|
|
| |
EnPro Industries, Inc. |
| (a)(c)429 |
| 14 |
| |
Kennametal, Inc. |
| 499 |
| 30 |
| |
|
|
|
| 44 |
| |
The accompanying notes are an integral part of the financial statements.
113
2006 Annual Report |
|
|
|
December 31, 2006 |
|
Portfolio of Investments (cont’d)
Systematic Active Small Cap Value Portfolio
|
|
|
| Value |
| |
|
| Shares |
| (000) |
| |
Machinery: Oil Well Equipment & Services (0.4%) |
|
|
|
|
| |
Helmerich & Payne, Inc. |
| 844 |
| $ | 21 |
|
Parker Drilling Co. |
| (a)985 |
| 8 |
| |
|
|
|
| 29 |
| |
Manufacturing (0.7%) |
|
|
|
|
| |
Acuity Brands, Inc. |
| 533 |
| 28 |
| |
Koppers Holdings, Inc. |
| (c)610 |
| 16 |
| |
Standex International Corp. |
| 213 |
| 6 |
| |
|
|
|
| 50 |
| |
Materials & Processing — Miscellaneous (0.6%) |
|
|
|
|
| |
Metal Management, Inc. |
| 1,089 |
| 41 |
| |
Medical & Dental Instruments & Supplies (0.7%) |
|
|
|
|
| |
Inverness Medical Innovations, Inc. |
| (a)(c)1,269 |
| 49 |
| |
Medical Services (0.6%) |
|
|
|
|
| |
Magellan Health Services, Inc. |
| (a)(c)904 |
| 39 |
| |
Option Care, Inc. |
| (c)206 |
| 3 |
| |
|
|
|
| 42 |
| |
Metal Fabricating (1.8%) |
|
|
|
|
| |
Commercial Metals Co. |
| 672 |
| 17 |
| |
Lone Star Technologies, Inc. |
| (a)632 |
| 31 |
| |
Quanex Corp. |
| (c)879 |
| 30 |
| |
Ryerson, Inc. |
| (c)1,008 |
| 25 |
| |
Superior Essex, Inc. |
| (a)704 |
| 23 |
| |
|
|
|
| 126 |
| |
Multi-Sector Companies (0.4%) |
|
|
|
|
| |
Sequa Corp., Class A |
| (a)244 |
| 28 |
| |
Oil: Crude Producers (0.7%) |
|
|
|
|
| |
Cimarex Energy Co. |
| (c)286 |
| 10 |
| |
Forest Oil Corp. |
| (a)341 |
| 11 |
| |
Resource America, Inc. |
| (c)322 |
| 9 |
| |
Stone Energy Corp. |
| (a)629 |
| 22 |
| |
|
|
|
| 52 |
| |
Paper (1.1%) |
|
|
|
|
| |
Albany International Corp., Class A |
| 716 |
| 24 |
| |
Caraustar Industries, Inc. |
| (a)(c)603 |
| 5 |
| |
Chesapeake Corp. |
| (c)1,246 |
| 21 |
| |
Rock-Tenn Co. |
| 1,045 |
| 28 |
| |
|
|
|
| 78 |
| |
Printing & Copying Services (1.2%) |
|
|
|
|
| |
Banta Corp. |
| 1,156 |
| 42 |
| |
Consolidated Graphics, Inc. |
| (a)700 |
| 41 |
| |
|
|
|
| 83 |
| |
Property & Casualty Insurance (0.5%) |
|
|
|
|
| |
FPIC Insurance Group, Inc. |
| (a)889 |
| 35 |
| |
Publishing: Miscellaneous (0.9%) |
|
|
|
|
| |
Scholastic Corp. |
| (a)1,692 |
| 61 |
| |
Railroad Equipment (0.1%) |
|
|
|
|
| |
Freightcar America, Inc. |
| (c)187 |
| 10 |
| |
Real Estate Investment Trusts (REIT) (10.9%) |
|
|
|
|
| |
American Financial Realty Trust REIT |
| 4,675 |
| 54 |
| |
Anworth Mortgage Asset Corp. REIT |
| 1,472 |
| 14 |
| |
Ashford Hospitality Trust, Inc. REIT |
| 1,190 |
| 15 |
| |
CentraCore Properties Trust REIT |
| 204 |
| 7 |
| |
Crescent Real Estate EQT Co. REIT |
| (c)1,264 |
| 25 |
| |
Entertainment Properties Trust REIT |
| 1,335 |
| 78 |
| |
First Industrial Realty Trust, Inc. REIT |
| (c)1,328 |
| 62 |
| |
GMH Communities Trust REIT |
| 4,103 |
| 42 |
| |
Healthcare Realty Trust, Inc. REIT |
| 1,443 |
| 57 |
| |
Highland Hospitality Corp. REIT |
| 3,845 |
| 55 |
| |
Innkeepers USA Trust REIT |
| 2,534 |
| 39 |
| |
KKR Financial Corp. REIT |
| (c)3,076 |
| 82 |
| |
Luminent Mortgage Capital,Inc. REIT |
| 4,340 |
| 42 |
| |
National Retail Properties REIT |
| (c)2,061 |
| 47 |
| |
Pennsylvania Real Estate Investment Trust REIT |
| (c)1,182 |
| 47 |
| |
RAIT Investment Trust REIT |
| 1,279 |
| 44 |
| |
Redwood Trust, Inc. REIT |
| (c)866 |
| 50 |
| |
|
|
|
| 760 |
| |
Reinsurance (0.7%) |
|
|
|
|
| |
Endurance Specialty Holdings Ltd. |
| 761 |
| 28 |
| |
Odyssey Re Holdings Corp. |
| 561 |
| 21 |
| |
|
|
|
| 49 |
| |
Restaurants (1.0%) |
|
|
|
|
| |
Bob Evans Farms, Inc. |
| 2,099 |
| 72 |
| |
Retail (5.8%) |
|
|
|
|
| |
AC Moore Arts & Crafts, Inc. |
| (a)959 |
| 21 |
| |
Bon-Ton Stores, Inc. (The) |
| 1,371 |
| 48 |
| |
Borders Group, Inc. |
| (c)2,443 |
| 55 |
| |
Central Garden & Pet Co. |
| (a)(c)1,081 |
| 52 |
| |
Charming Shoppes, Inc. |
| (a)2,011 |
| 27 |
| |
Conn’s, Inc. |
| (a)(c)533 |
| 12 |
| |
Insight Enterprises, Inc. |
| (a)1,664 |
| 31 |
| |
Landry’s Seafood Restaurants |
| (c)1,828 |
| 55 |
| |
MarineMax, Inc. |
| (a)534 |
| 14 |
| |
Pantry, Inc. (The) |
| (a)433 |
| 20 |
| |
Stein Mart, Inc. |
| 3,053 |
| 40 |
| |
Zale Corp. |
| (a)(c)1,095 |
| 31 |
| |
|
|
|
| 406 |
| |
Rental & Leasing Services: Consumer (0.5%) |
|
|
|
|
| |
Dollar Thrifty Automotive Group |
| (a)(c)715 |
| 33 |
| |
Savings & Loan (1.5%) |
|
|
|
|
| |
Berkshire Hills Bancorp, Inc. |
| (c)147 |
| 5 |
| |
BFC Financial Corp. |
| (a)1,004 |
| 6 |
| |
Downey Financial Corp. |
| (c)989 |
| 72 |
| |
Itla Capital Corp. |
| 109 |
| 6 |
| |
KNBT Bancorp, Inc. |
| (c)982 |
| 17 |
| |
|
|
|
| 106 |
| |
Securities Brokerage & Services (0.1%) |
|
|
|
|
| |
Marketaxess Holdings, Inc. |
| (a)500 |
| 7 |
| |
Semiconductor Equipment (0.5%) |
|
|
|
|
| |
Triquint Semiconductor, Inc. |
| (a)7,848 |
| 35 |
| |
Services: Commercial (2.4%) |
|
|
|
|
| |
Autobytel, Inc. |
| (a)1,160 |
| 4 |
| |
Clark, Inc. |
| 825 |
| 14 |
| |
Hudson Highland Group, Inc. |
| (a)1,217 |
| 20 |
| |
Kelly Services, Inc., Class A |
| 953 |
| 28 |
| |
Live Nation, Inc. |
| (a)1,619 |
| 36 |
| |
Maximus, Inc. |
| (c)515 |
| 16 |
| |
The accompanying notes are an integral part of the financial statements.
114
| 2006 Annual Report |
|
|
| December 31, 2006 |
Portfolio of Investments (cont’d)
Systematic Active Small Cap Value Portfolio
|
|
|
| Value |
| |
|
| Shares |
| (000) |
| |
Services: Commercial (cont’d) |
|
|
|
|
| |
MPS Group, Inc. |
| (a)2,000 |
| $ | 28 |
|
Unifirst Corp. |
| 570 |
| 22 |
| |
|
|
|
| 168 |
| |
Shoes (0.8%) |
|
|
|
|
| |
Finish Line, Class A |
| (c)1,487 |
| 21 |
| |
Shoe Carnival, Inc. |
| (a)527 |
| 17 |
| |
Stride Rite Corp. |
| 1,116 |
| 17 |
| |
|
|
|
| 55 |
| |
Steel (0.4%) |
|
|
|
|
| |
Shiloh Industries, Inc. |
| 1,219 |
| 23 |
| |
Wheeling-Pittsburgh Corp. |
| (a)(c)421 |
| 8 |
| |
|
|
|
| 31 |
| |
Telecommunications (0.2%) |
|
|
|
|
| |
Atlantic Tele-Network, Inc. |
| 489 |
| 14 |
| |
Telecommunications Equipment (1.2%) |
|
|
|
|
| |
Andrew Corp. |
| (a)6,553 |
| 67 |
| |
Powerwave Technologies, Inc. |
| (a)(c)2,758 |
| 18 |
| |
|
|
|
| 85 |
| |
Textile Apparel Manufacturers (1.5%) |
|
|
|
|
| |
Kellwood Co. |
| (c)1,899 |
| 62 |
| |
Oxford Industries, Inc. |
| 171 |
| 8 |
| |
Perry Ellis International, Inc. |
| (a)286 |
| 12 |
| |
Warnaco Group, Inc. (The) |
| (a)(c)808 |
| 21 |
| |
|
|
|
| 103 |
| |
Thrifts & Mortgage Finance (1.1%) |
|
|
|
|
| |
BankFinancial Corp. |
| 2,326 |
| 41 |
| |
Brookline Bancorp, Inc. |
| 2,628 |
| 35 |
| |
|
|
|
| 76 |
| |
Tobacco (0.2%) |
|
|
|
|
| |
Alliance One International, Inc. |
| (a)(c)1,978 |
| 14 |
| |
Transportation Miscellaneous (0.3%) |
|
|
|
|
| |
Saia Inc. |
| (a)994 |
| 23 |
| |
Truckers (0.3%) |
|
|
|
|
| |
Marten Transport Ltd. |
| (a)(c)846 |
| 15 |
| |
PAM Transportation Services |
| (a)267 |
| 6 |
| |
|
|
|
| 21 |
| |
Utilities: Electrical (4.1%) |
|
|
|
|
| |
CH Energy Group, Inc. |
| (c)503 |
| 26 |
| |
Cleco Corp. |
| 1,351 |
| 34 |
| |
Duquesne Light Holdings, Inc. |
| 467 |
| 9 |
| |
El Paso Electric Co. |
| (a)1,312 |
| 32 |
| |
Empire District Electric Co. (The) |
| (c)266 |
| 7 |
| |
Otter Tail Corp. |
| 855 |
| 27 |
| |
PNM Resources, Inc. |
| 1,790 |
| 56 |
| |
Unisource Energy Corp. |
| 415 |
| 15 |
| |
Westar Energy, Inc. |
| 2,894 |
| 75 |
| |
|
|
|
| 281 |
| |
Utilities: Gas Distributors (2.2%) |
|
|
|
|
| |
Laclede Group, Inc. (The) |
| 698 |
| 24 |
| |
New Jersey Resources Corp. |
| (c)565 |
| 27 |
| |
Northwest Natural Gas Co. |
| (c)652 |
| 28 |
| |
NorthWestern Corp. |
| 860 |
| 30 |
| |
WGL Holdings, Inc. |
| 1,424 |
| 46 |
| |
|
|
|
| 155 |
| |
Utilities: Telecommunications (0.8%) |
|
|
|
|
| |
Alaska Communications Systems Group, Inc. |
| 1,683 |
| 26 |
| |
IDT Corp., Class B |
| (a)2,155 |
| 28 |
| |
|
|
|
| 54 |
| |
Wholesalers (1.0%) |
|
|
|
|
| |
United Stationers, Inc. |
| (a)1,404 |
| 66 |
| |
Total Common Stocks (Cost $6,678) |
|
|
| 6,928 |
| |
|
| Face |
|
|
| |
|
| Amount |
|
|
| |
|
| (000) |
|
|
| |
Short-Term Investments (35.4%) |
|
|
|
|
| |
Short-Term Debt Securities held as Collateral on Loaned Securities (32.3%) |
|
|
|
|
| |
Alliance & Leicester plc, |
|
|
|
|
| |
5.36%, 1/8/07 |
| $ | (h)73 |
| 73 |
|
Bancaja, 5.37%, 1/19/07 |
| (h)36 |
| 36 |
| |
Bank of America Corp., 5.32%, 1/2/07 |
| (h)116 |
| 116 |
| |
Bank of New York Co., Inc., |
|
|
|
|
| |
5.34%, 1/10/07 |
| (h)36 |
| 36 |
| |
Bear Stearns & Co., Inc., |
|
|
|
|
| |
5.37%, 1/2/07 |
| (h)44 |
| 44 |
| |
5.38%, 1/2/07 |
| (h)29 |
| 29 |
| |
5.39%, 1/16/07 |
| (h)74 |
| 73 |
| |
BNP Paribas plc, |
|
|
|
|
| |
5.35%, 2/20/07 |
| (h)73 |
| 74 |
| |
CIC, New York, |
|
|
|
|
| |
5.33%, 1/3/07 |
| (h)51 |
| 51 |
| |
5.34%, 1/2/07 |
| (h)73 |
| 73 |
| |
Dekabank Deutsche Girozentrale, |
|
|
|
|
| |
5.39%, 1/19/07 |
| (h)75 |
| 75 |
| |
Deutsche Bank Securities, Inc., |
|
|
|
|
| |
5.33%, 1/2/07 |
| 234 |
| 234 |
| |
Dexia Bank, New York, |
|
|
|
|
| |
5.33%, 1/2/07 |
| (h)73 |
| 73 |
| |
Gemini Securitization Corp., |
|
|
|
|
| |
5.34%, 1/2/07 |
| 36 |
| 36 |
| |
Goldman Sachs Group, Inc., |
|
|
|
|
| |
5.40%, 1/16/07 |
| (h)36 |
| 36 |
| |
5.42%, 1/2/07 |
| (h)68 |
| 68 |
| |
HSBC Finance Corp., 5.34%, 1/8/07 |
| (h)36 |
| 36 |
| |
Liberty Lighthouse U.S. Capital, |
|
|
|
|
| |
5.33%, 1/2/07 |
| (h)36 |
| 36 |
| |
Manufacturers & Traders, |
|
|
|
|
| |
5.33%, 1/16/07 |
| (h)44 |
| 44 |
| |
Merrill Lynch & Co., |
|
|
|
|
| |
5.35%, 1/26/07 |
| (h)38 |
| 38 |
| |
Mitsubishi UFJ Financial Group, |
|
|
|
|
| |
5.33%, 1/2/07 |
| (h)36 |
| 36 |
| |
Natexis Banques Populaires, New York, |
|
|
|
|
| |
5.34%, 1/2/07 |
| (h)73 |
| 73 |
| |
5.35%, 1/2/07 |
| (h)36 |
| 36 |
| |
National City Bank Cleveland, |
|
|
|
|
| |
5.32%, 1/2/07 |
| (h)106 |
| 106 |
| |
Nationwide Rural Utilities Cooperative Finance Corp., |
|
|
|
|
| |
5.34%, 1/2/07 |
| (h)146 |
| 146 |
| |
The accompanying notes are an integral part of the financial statements.
115
2006 Annual Report |
|
|
|
December 31, 2006 |
|
Portfolio of Investments (cont’d)
Systematic Active Small Cap Value Portfolio
|
| Face |
|
|
| ||
|
| Amount |
| Value |
| ||
|
| (000) |
| (000) |
| ||
Short-Term Debt Securities held as Collateral on Loaned Securities (cont’d) |
|
|
|
|
| ||
Nationwide Building Society, |
|
|
|
|
| ||
5.44%, 3/28/07 |
| $ | (h)84 |
| $ | 84 |
|
Nordea Bank, New York, |
|
|
|
|
| ||
5.31%, 1/2/07 |
| (h)109 |
| 109 |
| ||
Rhein-Main Securitisation Ltd., |
|
|
|
|
| ||
5.33%, 1/18/07 |
| 34 |
| 34 |
| ||
Skandi, New York, |
|
|
|
|
| ||
5.34%, 1/9/07 |
| (h)73 |
| 73 |
| ||
SLM Corp., 5.36%, 1/22/07 |
| (h)73 |
| 73 |
| ||
Toronto Dominion, New York, |
|
|
|
|
| ||
5.32%, 5/29/07 |
| (h)73 |
| 73 |
| ||
Tulip Funding, 5.36%, 1/16/07 |
| 40 |
| 40 |
| ||
Unicredito Italiano Bank (Ireland) plc, |
|
|
|
|
| ||
5.36%, 1/9/07 |
| (h)51 |
| 51 |
| ||
World Savings Bank FSB, |
|
|
|
|
| ||
5.35%, 1/19/07 |
| (h)25 |
| 25 |
| ||
|
|
|
| 2,240 |
| ||
Repurchase Agreement (3.1%) |
|
|
|
|
| ||
J.P. Morgan Securities, Inc., 5.20%, dated 12/29/06, due 1/2/07, repurchase price $219 |
| (f)219 |
| 219 |
| ||
Total Short-Term Investments (Cost $2,459) |
|
|
| 2,459 |
| ||
Total Investments (135.2%) (Cost $9,137) — including $2,167 of Securities Loaned |
|
|
| 9,387 |
| ||
Liabilities in Excess of Other Assets (-35.2%) |
|
|
| (2,442 | ) | ||
Net Assets (100%) |
|
|
| $ | 6,945 |
| |
(a) |
| Non-income producing security. |
|
|
|
(c) |
| All or portion of security on loan at December 31, 2006. |
|
|
|
(f) |
| Represents the Portfolio’s undivided interest in a joint repurchase agreement which has a total value of $1,856,998,000. The repurchase agreement was fully collateralized by U.S. government agency securities at the date of this Portfolio of Investments as follows: Federal Farm Credit Bank, 0.00% to 7.43%, due 1/16/07 to 10/23/35; Federal Home Loan Bank, 0.00% to 7.38%, due 1/3/07 to 6/5/28; Federal Home Loan Mortgage Corp., 0.00% to 6.75%, due 1/2/07 to 7/15/32; Federal National Mortgage Association, 0.00% to 8.20%, due 1/12/07 to 11/15/30; Tennessee Valley Authority, 5.38% to 6.75%, due 11/13/08 to 4/1/36, which had a total value of $1,894,142,869. The investment in the repurchase agreement is through participation in a joint account with affiliated parties pursuant to exemptive relief received by the Portfolio from the SEC. |
|
|
|
(h) |
| Variable/Floating Rate Security — interest rate changes on these instruments are based on changes in a designated base rate. The rates shown are those in effect on December 31, 2006. |
|
|
|
REIT |
| Real Estate Investment Trust |
The accompanying notes are an integral part of the financial statements.
116
| 2006 Annual Report |
|
|
| December 31, 2006 |
Investment Overview (unaudited)
U.S. Large Cap Growth Portfolio
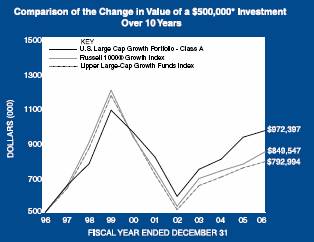
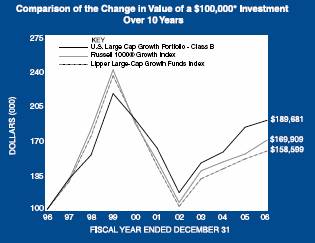
* Minimum Investment
In accordance with SEC regulations, Portfolio performance shown assumes that all recurring fees (including management fees) were deducted and all dividends and distributions were reinvested.
Performance Compared to the Russell 1000®
Growth Index(1) and the Lipper Large-Cap Growth
Funds Index(2)
|
| Total Returns(3) |
| ||||||
|
|
|
| Average Annual |
| ||||
|
| One |
| Five |
| Ten |
| Since |
|
|
| Year |
| Years |
| Years |
| Inception(6) |
|
Portfolio – Class A (4) |
| 4.07 | % | 3.50 | % | 6.88 | % | 10.50 | % |
Russell 1000® Growth Index |
| 9.07 |
| 2.69 |
| 5.44 |
| 8.74 |
|
Lipper Large-Cap Growth Funds Index |
| 4.72 |
| 2.01 |
| 4.72 |
| 8.29 |
|
|
|
|
|
|
|
|
|
|
|
Portfolio – Class B (5) |
| 3.85 |
| 3.25 |
| 6.61 |
| 8.57 |
|
Russell 1000® Growth Index |
| 9.07 |
| 2.69 |
| 5.44 |
| 6.87 |
|
Lipper Large-Cap Growth Funds Index |
| 4.72 |
| 2.01 |
| 4.72 |
| 6.05 |
|
Performance data quoted represents past performance, which is no guarantee of future results, and current performance may be lower or higher than the figures shown. Performance assumes that all dividends and distributions, if any, were reinvested. For the most recent month-end performance figures, please visit www.morganstanley.com/im. Investment return and principal value will fluctuate so that Portfolio shares, when redeemed, may be worth more or less than their original cost. Total returns do not reflect the deduction of taxes that a shareholder would pay on Portfolio distributions or the redemption of Portfolio shares.
(1) |
| The Russell 1000® Growth Index measures the performance of those Russell 1000® Index companies with higher price-to-book ratios and higher forecasted growth values. The Russell 1000® Index measures the performance of the 1,000 largest companies in the Russell 3000® Index. The Russell 3000® Index measures the performance of the 3,000 largest U.S. companies based on total market capitalization. The Index is unmanaged and its returns do not include any sales charges or fees. Such costs would lower performance. It is not possible to invest directly in an index. |
|
|
|
(2) |
| The Lipper Large-Cap Growth Funds Index is an equally weighted performance index of the largest qualifying funds (based on net assets) in the Lipper Large-Cap Growth Funds classification. The Index, which is adjusted for capital gains distributions and income dividends, is unmanaged and should not be considered an investment. There are currently 30 funds represented in this Index. As of the date of this report, the Portfolio is in the Lipper Large-Cap Growth Funds classification. |
|
|
|
(3) |
| Total returns for the Portfolio reflect fees waived and expenses reimbursed, if applicable, by the Adviser. Without such waivers and/or reimbursements, total returns would have been lower. Fee waivers and/or expense reimbursements are voluntary and the Adviser reserves the right to commence or terminate any waiver and/or reimbursement at any time. |
|
|
|
(4) |
| Commenced operations on April 2, 1991 |
|
|
|
(5) |
| Commenced operations on January 2, 1996 |
|
|
|
(6) |
| For comparative purposes, average annual since inception returns listed for the Indexes refer to the inception date or initial offering of the respective share class of the Portfolio, not the inception of the Index. |
The U.S. Large Cap Growth Portfolio seeks long-term capital appreciation by investing primarily in growth-oriented equity securities of large capitalization companies.
Performance
For the year ended December 31, 2006, the Portfolio had a total return based on net asset value per share of 4.07% for the Class A shares, net of fees, and 3.85% for the Class B shares, net of fees, compared to 9.07% for the Russell 1000® Growth Index (the “Index”).
117
2006 Annual Report |
|
|
|
December 31, 2006 |
|
Investment Overview (cont’d)
U.S. Large Cap Growth Portfolio
Factors Affecting Performance
• Over the 12-month period ended December 31, 2006, the markets advanced despite considerable volatility. During the first half of the year, investors grappled with high oil prices, rising interest rates, a slowing housing market and an uptick in inflation. Moreover, the Federal Open Market Committee (FOMC) continued its policy of monetary tightening. Investor anxieties erupted in May and June in the form of a market sell-off following the FOMC’s 16th and 17th consecutive federal funds rate increases. By August the markets once again entered positive territory. The FOMC stopped raising the target federal funds rate following its June 29th meeting, and left the rate unchanged for the remainder of its policy meetings in 2006. Energy prices were still elevated but receded from the record high set in July. For the most part, corporate earnings reported throughout the year were still better than expected, company balance sheets were healthy, and the exceptionally strong pace of merger and acquisition activity that began in 2005 continued into 2006.
• Although disappointing gross domestic product (GDP) growth data was reported for the second and third quarters, economic growth slowed and housing data continued to decline, the U.S. economy still progressed. By the end of the year, it appeared that the immediate threat of recession subsided and a “soft landing” seemed more possible.
• For the year, value stocks outperformed growth stocks, continuing a recent trend. For this same period, largecapitalization securities, in which the Portfolio invests, outpaced mid-cap securities yet lagged small-cap stocks.
• The Portfolio underperformed the Index due to stock selection, although sector allocations did help to boost overall performance. For the period, the sectors that contributed least to relative performance were the consumer discretionary, producer durables and health care sectors. Within the consumer discretionary sector, stock selection in commercial services, education services and leisure time companies as well as an overweight allocation served as the largest detractor to overall returns. However, investment in retail firms and radio and television broadcasters in this sector did help to mitigate the unfavorable performance.
• An overweight position in the producer durables sector along with selection in homebuilding companies and an avoidance of aerospace stocks also hindered returns.
• Additionally, stock selection in the heath care sector hampered performance, offsetting the positive impact of this sector’s underweight allocation. Selection in pharmaceutical companies and medical and dental instrument firms were the main areas of weakness in the sector.
• Despite these negative influences on performance, there were several areas of strength in the Portfolio. Most notable was the multi-industry sector, which includes conglomerates. In this sector, stock selection was a significant positive contributor to performance, and more than offset the detrimental effect caused by the sector overweight.
• In the materials and processing sector, a single holding in agriculture fishing and ranching added to relative returns, as did a sector overweight.
• Within the utilities sector, an overweight allocation and stock selection in wireless companies proved beneficial.
Management Strategies
• It is our goal to hold a portfolio of high quality growth stocks we believe will perform well regardless of the market environment. We continue to favor companies that have some uniqueness or dynamic competitive advantage in their business model, with a high quality stream of cash flow and the ability to redeploy capital at a high rate of return.
• For the year, the consumer discretionary sector represented the largest sector weight and overweight in the Portfolio, followed by the financial services and the “other” sectors. The financial services sector was weighted in-line with the Index, while the “other” sector was overweight.
Expense Examples
As a shareholder of the Portfolio, you may incur two types of costs: (1) transactional costs, including redemption fees; (2) ongoing costs, including management fees, distribution (12b-1) fees (in the case of Class B); and other Portfolio expenses. These examples are intended to help you understand your ongoing costs (in dollars) of investing in the Portfolio and to compare these costs with the ongoing costs of investing in other mutual funds.
The examples are based on an investment of $1,000 invested at the beginning of the six-month period ended December 31, 2006 and held for the entire six-month period.
Actual Expenses
The first line of the tables below provides information about actual account values and actual expenses. You may use the information in this line, together with the amount you invested, to estimate the expenses that you paid over the
118
| 2006 Annual Report |
|
|
| December 31, 2006 |
Investment Overview (cont’d)
U.S. Large Cap Growth Portfolio
period. Simply divide your account value by $1,000 (for example, an $8,600 account value divided by $1,000 = 8.6), then multiply the result by the number in the first line under the heading entitled “Expenses Paid During Period” to estimate the expenses you paid on your account during this period.
Please note that “Expenses Paid During Period” are grossed up to reflect Portfolio expenses prior to the effect of Expense Offset (See Note E in the Notes to Financial Statements). Therefore, the annualized net expense ratios may differ from the ratio of the expenses to average net assets shown in the Financial Highlights.
Hypothetical Example for Comparison Purposes
The second line of the tables below provides information about hypothetical account values and hypothetical expenses based on the Portfolio’s actual expense ratio and an assumed rate of return of 5% per year before expenses, which is not the Portfolio’s actual return. The hypothetical account values and expenses may not be used to estimate the actual ending account balance or expenses you paid for the period. You may use this information to compare the ongoing costs of investing in the Portfolio and other funds. To do so, compare this 5% hypothetical example with the 5% hypothetical examples that appear in the shareholder reports of the other funds.
Please note that the expenses shown in the table are meant to highlight your ongoing costs only and do not reflect any transactional costs, such as redemption fees. Therefore, the second line of the table is useful in comparing ongoing costs only, and will not help you determine the relative total costs of owning different funds. In addition, if these transactional costs were included, your costs would have been higher.
|
|
|
|
|
| Expenses Paid |
| |||
|
|
|
| Ending Account |
| During Period* |
| |||
|
| Beginning |
| Value |
| July 1, 2006 — |
| |||
|
| Account Value |
| December 31, |
| December 31, |
| |||
|
| July 1, 2006 |
| 2006 |
| 2006 |
| |||
Class A |
|
|
|
|
|
|
| |||
Actual |
| $ | 1,000.00 |
| $ | 1,072.60 |
| $ | 3.34 |
|
Hypothetical (5% average annual return before expenses) |
| 1,000.00 |
| 1,021.98 |
| 3.26 |
| |||
|
|
|
|
|
|
|
| |||
Class B |
|
|
|
|
|
|
| |||
Actual |
| 1,000.00 |
| 1,071.40 |
| 4.65 |
| |||
Hypothetical (5% average annual return before expenses) |
| 1,000.00 |
| 1,020.72 |
| 4.53 |
| |||
* Expenses are equal to Class A and Class B annualized net expense ratios of 0.64% and 0.89%, respectively, multiplied by the average account value over the period, multiplied by 184/365 (to reflect the one-half year period).
Graphic Presentation of Portfolio Holdings
The following graph depicts the Portfolio’s holdings by industry and/or security type, as a percentage of total investments.
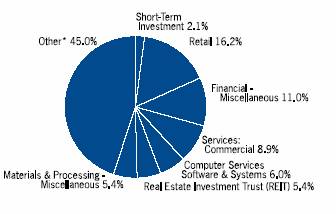
* Industries which do not appear in the above graph, as well as those which represent less than 5% of total investments, if applicable, are included in the category labeled “Other”.
January 2007
119
2006 Annual Report |
|
|
|
December 31, 2006 |
|
Portfolio of Investments
U.S. Large Cap Growth Portfolio
|
|
|
| Value |
| ||
|
| Shares |
| (000) |
| ||
Common Stocks (98.0%) |
|
|
|
|
| ||
Advertising Agencies (1.6%) |
|
|
|
|
| ||
Monster Worldwide, Inc. |
| (a)356,563 |
| $ | 16,630 |
| |
Air Transport (1.6%) |
|
|
|
|
| ||
Expeditors International of Washington, Inc. |
| 430,624 |
| 17,440 |
| ||
Beverages: Soft Drinks (1.5%) |
|
|
|
|
| ||
Coca Cola Co. (The) |
| 332,833 |
| 16,059 |
| ||
Biotechnology Research & Production (1.3%) |
|
|
|
|
| ||
Genentech, Inc. |
| (a)176,874 |
| 14,350 |
| ||
Building: Cement (1.5%) |
|
|
|
|
| ||
Cemex S.A. de C.V. ADR |
| (a)472,906 |
| 16,022 |
| ||
Casinos & Gambling (3.1%) |
|
|
|
|
| ||
International Game Technology |
| 372,378 |
| 17,204 |
| ||
Wynn Resorts Ltd. |
| 173,700 |
| 16,302 |
| ||
|
|
|
| 33,506 |
| ||
Communications & Media (1.8%) |
|
|
|
|
| ||
McGraw-Hill Cos., Inc. (The) |
| 275,967 |
| 18,771 |
| ||
Communications Technology (4.5%) |
|
|
|
|
| ||
America Movil S.A. de C.V., Class L ADR |
| 760,924 |
| 34,409 |
| ||
Crown Castle International Corp. |
| (a)415,939 |
| 13,435 |
| ||
|
|
|
| 47,844 |
| ||
Computer Services Software & Systems (6.0%) |
|
|
|
|
| ||
Google, Inc., Class A |
| (a)139,111 |
| 64,058 |
| ||
Computer Technology (1.7%) |
|
|
|
|
| ||
Apple Computer, Inc. |
| (a)219,437 |
| 18,617 |
| ||
Seagate Technology, Inc. |
| (a)(d)186,100 |
| @— |
| ||
|
|
|
| 18,617 |
| ||
Consumer Electronics (4.6%) |
|
|
|
|
| ||
Electronic Arts, Inc. |
| (a)270,859 |
| 13,640 |
| ||
Yahoo!, Inc. |
| (a)1,408,451 |
| 35,972 |
| ||
|
|
|
| 49,612 |
| ||
Electronics: Semi-Conductors/Components (1.1%) |
|
|
|
|
| ||
Marvell Technology Group Ltd. |
| (a)626,335 |
| 12,019 |
| ||
Energy — Miscellaneous (3.6%) |
|
|
|
|
| ||
Ultra Petroleum Corp. |
| (a)803,581 |
| 38,371 |
| ||
Financial Data Processing Services & Systems (1.6%) |
|
|
|
|
| ||
Western Union Co. (The) |
| 748,054 |
| 16,772 |
| ||
Financial — Miscellaneous (11.0%) |
|
|
|
|
| ||
American Express Co. |
| 632,082 |
| 38,349 |
| ||
Berkshire Hathaway, Inc., Class B |
| (a)9,168 |
| 33,610 |
| ||
Chicago Mercantile Exchange Holdings, Inc. |
| 28,758 |
| 14,659 |
| ||
Moody’s Corp. |
| 451,537 |
| 31,183 |
| ||
|
|
|
| 117,801 |
| ||
Foods (1.5%) |
|
|
|
|
| ||
Nestle S.A. ADR (Registered) |
| 184,765 |
| 16,385 |
| ||
HealthCare Services (2.9%) |
|
|
|
|
| ||
Dade Behring Holdings, Inc. |
| 357,636 |
| 14,237 |
| ||
UnitedHealth Group, Inc. |
| 319,818 |
| 17,184 |
| ||
|
|
|
| 31,421 |
| ||
Hotel/Motel (3.3%) |
|
|
|
|
| ||
Marriott International, Inc., Class A |
| 738,300 |
| 35,232 |
| ||
Materials & Processing — Miscellaneous (5.4%) |
|
|
|
|
| ||
Monsanto Co. |
| 1,096,530 |
| 57,601 |
| ||
Pollution Control & Environmental Services (1.4%) |
|
|
|
|
| ||
Waste Management, Inc. |
| 417,304 |
| 15,344 |
| ||
Radio & TV Broadcasters (3.3%) |
|
|
|
|
| ||
Grupo Televisa S.A. ADR |
| 1,322,260 |
| 35,714 |
| ||
Real Estate Investment Trusts (REIT) (5.5%) |
|
|
|
|
| ||
Brookfield Asset Management, Inc. |
| 1,208,554 |
| 58,228 |
| ||
Retail (16.2%) |
|
|
|
|
| ||
Abercrombie & Fitch Co. |
| 296,780 |
| 20,665 |
| ||
Amazon.com, Inc. |
| (a)862,266 |
| 34,025 |
| ||
Costco Wholesale Corp. |
| 613,033 |
| 32,411 |
| ||
Home Depot, Inc. |
| 425,823 |
| 17,101 |
| ||
McDonald’s Corp. |
| 375,926 |
| 16,665 |
| ||
Sears Holdings Corp. |
| (a)314,402 |
| 52,797 |
| ||
|
|
|
| 173,664 |
| ||
Services: Commercial (9.0%) |
|
|
|
|
| ||
Corporate Executive Board Co. |
| 291,149 |
| 25,534 |
| ||
eBay, Inc. |
| (a)1,799,077 |
| 54,098 |
| ||
Iron Mountain, Inc. |
| (a)391,324 |
| 16,177 |
| ||
|
|
|
| 95,809 |
| ||
Shipping (1.5%) |
|
|
|
|
| ||
C.H. Robinson Worldwide, Inc. |
| 378,013 |
| 15,457 |
| ||
Textile Apparel Manufacturers (1.5%) |
|
|
|
|
| ||
Coach, Inc. |
| (a)374,021 |
| 16,068 |
| ||
Total Common Stocks (Cost $896,595) |
|
|
| 1,048,795 |
| ||
|
|
|
|
|
| ||
|
| Face |
|
|
| ||
Short-Term Investment (2.1%) |
|
|
|
|
| ||
Repurchase Agreement (2.1%) |
|
|
|
|
| ||
J.P. Morgan Securities, Inc., 5.20%, dated 12/29/06, due 1/2/07, repurchase price $22,651 |
| $ | (f)22,638 |
| 22,638 |
| |
Total Investments (100.1%) (Cost $919,233) |
|
|
| 1,071,433 |
| ||
Liabilities in Excess of Other Assets (-0.1%) |
|
|
| (1,327 | ) | ||
Net Assets (100%) |
|
|
| $ | 1,070,106 |
| |
(a) Non-income producing security.
(d) Security was valued at fair value — At December 31, 2006, the Portfolio held a fair valued security, valued at less than $500, representing less than 0.05% of net assets.
(f) Represents the Portfolio’s undivided interest in a joint repurchase agreement which has a total value of $1,856,998,000. The repurchase agreement was fully collateralized by U.S. government agency securities at the date of this Portfolio of Investments as follows: Federal Farm Credit Bank, 0.00% to 7.43%, due 1/16/07 to 10/23/35; Federal Home Loan Bank, 0.00% to 7.38%, due 1/3/07 to 6/5/28; Federal Home Loan Mortgage Corp., 0.00% to 6.75%, due 1/2/07 to 7/15/32; Federal National Mortgage Association, 0.00% to 8.20%, due 1/12/07 to 11/15/30; Tennessee Valley Authority, 5.38% to 6.75%, due 11/13/08 to 4/1/36, which had a total value of $1,894,142,869. The investment in the repurchase agreement is through participation in a joint account with affiliated parties pursuant to exemptive relief received by the Portfolio from the SEC.
@ Face Amount/Value is less than $500.
ADR American Depositary Receipts
The accompanying notes are an integral part of the financial statements.
120
| 2006 Annual Report |
|
|
| December 31, 2006 |
Investment Overview (unaudited)
U.S. Real Estate Portfolio
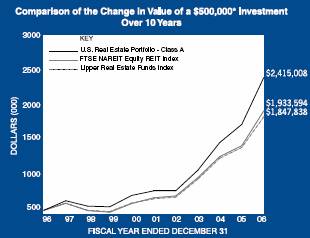
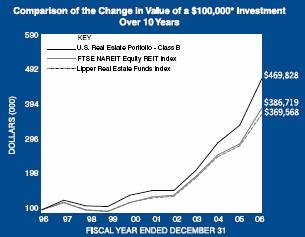
* Minimum Investment
In accordance with SEC regulations, Portfolio performance shown assumes that all recurring fees (including management fees) were deducted and all dividends and distributions were reinvested.
Performance Compared to the FTSE NAREIT Equity REIT Index(1) and the Lipper Real Estate Funds Index(2)
|
| Total Returns(3) |
| ||||||
|
|
|
| Average Annual |
| ||||
|
| One |
| Five |
| Ten |
| Since |
|
Portfolio – Class A (4) |
| 38.85 | % | 25.33 | % | 17.06 | % | 19.38 | % |
FTSE NAREIT Equity REIT Index |
| 35.06 |
| 23.20 |
| 14.48 |
| 16.35 |
|
Lipper Real Estate Funds Index |
| 31.46 |
| 22.63 |
| 13.96 |
| — |
|
|
|
|
|
|
|
|
|
|
|
Portfolio – Class B (5) |
| 38.52 |
| 25.01 |
| 16.73 |
| 18.55 |
|
FTSE NAREIT Equity REIT Index |
| 35.06 |
| 23.20 |
| 14.48 |
| 16.24 |
|
Lipper Real Estate Funds Index |
| 31.46 |
| 22.63 |
| 13.96 |
| 15.47 |
|
Performance data quoted represents past performance, which is no guarantee of future results, and current performance may be lower or higher than the figures shown. Performance assumes that all dividends and distributions, if any, were reinvested. For the most recent month-end performance figures, please visit www.morganstanley.com/im. Investment return and principal value will fluctuate so that Portfolio shares, when redeemed, may be worth more or less than their original cost. Total returns do not reflect the deduction of taxes that a shareholder would pay on Portfolio distributions or the redemption of Portfolio shares.
(1) The FTSE NAREIT Equity REIT Index (formerly NAREIT Equity Index) is an unmanaged market weighted index of tax qualified REITs listed on the New York Stock Exchange, American Stock Exchange and the NASDAQ National Market System, including dividends. The Index is unmanaged and its returns do not include any sales charges or fees. Such costs would lower performance. It is not possible to invest directly in an index.
(2) The Lipper Real Estate Funds Index is an equally weighted performance index of the largest qualifying funds (based on net assets) in the Lipper Real Estate Funds classification. The Index, which is adjusted for capital gains distributions and income dividends, is unmanaged and should not be considered an investment. There are currently 30 funds represented in this Index. As of the date of this report, the Portfolio is in the Lipper Real Estate Funds classification.
(3) Total returns for the Portfolio reflect fees waived and expenses reimbursed, if applicable, by the Adviser. Without such waivers and/or reimbursements, total returns would have been lower. Fee waivers and/or expense reimbursements are voluntary and the Adviser reserves the right to commence or terminate any waiver and/or reimbursement at any time.
(4) Commenced operations on February 24, 1995
(5) Commenced operations on January 2, 1996
(6) For comparative purposes, average annual since inception returns listed for the Indexes refer to the inception date or initial offering of the respective share class of the Portfolio, not the inception of the Index.
The U.S. Real Estate Portfolio seeks to provide above average current income and long-term capital appreciation by investing primarily in equity securities of companies in the U.S. real estate industry, including real estate investment trusts (“REITs”). The Portfolio’s concentration in the real estate sector makes it subject to greater risk and volatility than other portfolios that are more diversified, and the value of its shares may be substantially affected by economic events in the real estate industry.
121
2006 Annual Report |
|
|
|
December 31, 2006 |
|
Investment Overview (cont’d)
U.S. Real Estate Portfolio
Performance
For the year ended December 31, 2006, the Portfolio had a total return based on net asset value per share of 38.85% for the Class A shares, net of fees, and 38.52% for the Class B shares, net of fees, compared to 35.06% for the FTSE NAREIT Equity REIT Index (the “Index”).
Factors Affecting Performance
• The period under review was highly positive both for the direct real estate market, as well, as the public real estate securities market. The very strong performance of the public securities market over the period may be attributed to the following factors: evidence of continued improvements in underlying real estate values in the direct real estate market; the stronger outlook for the recovery of property fundamentals, which has been supported by favorable earnings results by the public companies; continued take-private activity and speculation; and strong investment flows from both institutional and individual investors.
• Among the major U.S. real estate sectors, apartment and office stocks outperformed while retail stocks lagged. The favorable performance of apartment stocks was due to strong reported earnings and their favorable forward outlook. The sector also benefited from upgraded views on underlying asset values due to transactional evidence, including takeover activity in the sector.
• The office sector posted strong returns due to continued evidence of strength in private market values, as observed in individual transactions as well as significant continued takeover activity.
• Fundamentals continued to remain strong in the retail sector, however, retail real estate investment trusts (REITs) appeared to be hurt by investor concerns over the potential negative impact of higher interest rates, higher energy costs, and a weaker housing market.
• The performance of mall REITs, in particular, was negatively impacted by company-specific issues at two of the larger mall owners. Among the smaller sectors, the storage sector outperformed, while the hotel sector underperformed.
• Both stock selection and sector allocation contributed to the Portfolio’s outperformance this year. Stock selection was favorable in every sector, with the exception of apartments. The most significant contributions were generated in the mall, hotel and office sectors. From a sector allocation perspective, the largest contributors were from the overweight to the office and apartment sectors, while the overweight to hotels detracted from performance.
Management Strategies
• We seek stocks that provide the best valuations relative to their underlying real estate values. Our company specific research leads us to specific preferences for subsegments within each property sector.
• Current top-down preferences include an overweighting of companies that are focused in the ownership of upscale urban hotels, coastal apartments, high quality retail assets and Class A office properties in central business district and select suburban locations, and underweighting to companies concentrated in the ownership of strip shopping centers and industrial properties.
• Due to the abundant interest in direct real estate investment, we do not expect near-term declines in private real estate valuations. We believe that over the medium- and long-term, the best indicator for REIT valuations will be private real estate values. Privatization transactions in the fourth quarter illustrated that REITs are trading at comparable values to private real estate and that the demand for real estate remains strong.
• We believe strongly in the merits of including REITs in a diversified long-term portfolio. REITs have historically provided compelling diversification opportunities, in that their performance has not been highly correlated to stocks or bonds.
Expense Examples
As a shareholder of the Portfolio, you may incur two types of costs: (1) transactional costs, including redemption fees; (2) ongoing costs, including management fees, distribution (12b-1) fees (in the case of Class B); and other Portfolio expenses. These examples are intended to help you understand your ongoing costs (in dollars) of investing in the Portfolio and to compare these costs with the ongoing costs of investing in other mutual funds. The examples are based on an investment of $1,000 invested at the beginning of the six-month period ended December 31, 2006 and held for the entire six-month period.
Actual Expenses
The first line of the tables below provides information about actual account values and actual expenses. You may use the information in this line, together with the amount you invested, to estimate the expenses that you paid over the period. Simply divide your account value by $1,000 (for example, an $8,600 account value divided by $1,000 = 8.6), then multiply the result by the number in the first line under
122
| 2006 Annual Report |
|
|
| December 31, 2006 |
Investment Overview (cont’d)
U.S. Real Estate Portfolio
the heading entitled “Expenses Paid During Period” to estimate the expenses you paid on your account during this period.
Please note that “Expenses Paid During Period” are grossed up to reflect Portfolio expenses prior to the effect of Expense Offset (See Note E in the Notes to Financial Statements). Therefore, the annualized net expense ratios may differ from the ratio of the expenses to average net assets shown in the Financial Highlights.
Hypothetical Example for Comparison Purposes
The second line of the tables below provides information about hypothetical account values and hypothetical expenses based on the Portfolio’s actual expense ratio and an assumed rate of return of 5% per year before expenses, which is not the Portfolio’s actual return. The hypothetical account values and expenses may not be used to estimate the actual ending account balance or expenses you paid for the period. You may use this information to compare the ongoing costs of investing in the Portfolio and other funds. To do so, compare this 5% hypothetical example with the 5% hypothetical examples that appear in the shareholder reports of the other funds.
Please note that the expenses shown in the table are meant to highlight your ongoing costs only and do not reflect any transactional costs, such as redemption fees. Therefore, the second line of the table is useful in comparing ongoing costs only, and will not help you determine the relative total costs of owning different funds. In addition, if these transactional costs were included, your costs would have been higher.
|
|
|
|
|
| Expenses Paid |
| |||
|
|
|
| Ending Account |
| During Period* |
| |||
|
| Beginning |
| Value |
| July 1, 2006 — |
| |||
|
| Account Value |
| December 31, |
| December 31, |
| |||
|
| July 1, 2006 |
| 2006 |
| 2006 |
| |||
Class A |
|
|
|
|
|
|
| |||
Actual |
| $ | 1,000.00 |
| $ | 1,205.10 |
| $ | 4.84 |
|
Hypothetical (5% average annual return before expenses) |
| 1,000.00 |
| 1,020.82 |
| 4.43 |
| |||
|
|
|
|
|
|
|
| |||
Class B |
|
|
|
|
|
|
| |||
Actual |
| 1,000.00 |
| 1,203.80 |
| 6.22 |
| |||
Hypothetical (5% average annual return before expenses) |
| 1,000.00 |
| 1,019.56 |
| 5.70 |
| |||
* Expenses are equal to Class A and Class B annualized net expense ratios of 0.87% and 1.12%, respectively, multiplied by the average account value over the period, multiplied by 184/365 (to reflect the one-half year period).
Graphic Presentation of Portfolio Holdings
The following graph depicts the Portfolio’s holdings by industry and/or security type, as a percentage of total investments.
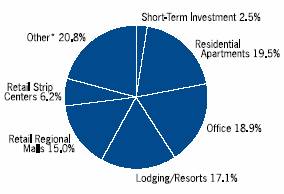
* Industries which do not appear in the above graph, as well as those which represent less than 5% of total investments, if applicable, are included in the category labeled “Other”.
January 2007
123
2006 Annual Report |
|
|
|
December 31, 2006 |
|
Portfolio of Investments
U.S. Real Estate Portfolio
|
|
|
| Value |
| ||
|
| Shares |
| (000) |
| ||
Common Stocks (97.6%) |
|
|
|
|
| ||
Diversified (4.2%) |
|
|
|
|
| ||
CentraCore Properties Trust REIT |
| 185,929 |
| $ | 6,011 |
| |
Forest City Enterprises, Inc., Class A |
| 371,744 |
| 21,710 |
| ||
Vornado Realty Trust REIT |
| 438,555 |
| 53,284 |
| ||
|
|
|
| 81,005 |
| ||
Health Care (4.4%) |
|
|
|
|
| ||
Cogdell Spencer, Inc. REIT |
| 135,380 |
| 2,911 |
| ||
Health Care Property Investors, Inc. REIT |
| 315,496 |
| 11,617 |
| ||
Health Care REIT, Inc. |
| 37,322 |
| 1,605 |
| ||
Senior Housing Properties Trust REIT |
| 1,278,769 |
| 31,304 |
| ||
Sunrise Senior Living REIT |
| 2,000,785 |
| 18,289 |
| ||
Tenet Healthcare Corp. |
| (a)1,948,201 |
| 13,579 |
| ||
Universal Health Reality Income Trust REIT |
| 133,028 |
| 5,185 |
| ||
|
|
|
| 84,490 |
| ||
Industrial (3.5%) |
|
|
|
|
| ||
AMB Property Corp. REIT |
| 685,632 |
| 40,185 |
| ||
Keystone Industrial Fund L.P. |
| (d)(i)(l)1,637,568 |
| 1,638 |
| ||
ProLogis REIT |
| 420,493 |
| 25,553 |
| ||
|
|
|
| 67,376 |
| ||
Lodging/Resorts (17.2%) |
|
|
|
|
| ||
Gaylord Entertainment Co. |
| (a)157,747 |
| 8,034 |
| ||
Hersha Hospitality Trust REIT |
| 599,110 |
| 6,794 |
| ||
Hilton Hotels Corp. |
| 1,750,749 |
| 61,101 |
| ||
Host Hotels & Resorts, Inc. REIT |
| 3,854,677 |
| 94,632 |
| ||
Legacy Hotels REIT |
| 1,788,051 |
| 14,536 |
| ||
Morgans Hotel Group Co. |
| (a)865,987 |
| 14,661 |
| ||
Starwood Hotels & Resorts Worldwide, Inc. |
| 1,455,212 |
| 90,951 |
| ||
Strategic Hotel Capital, Inc. REIT |
| 1,643,130 |
| 35,804 |
| ||
|
|
|
| 326,513 |
| ||
Office (18.9%) |
|
|
|
|
| ||
Beacon Capital Partners, Inc. |
| (a)(d)(i)(l)335,100 |
| 1,010 |
| ||
Boston Properties, Inc. REIT |
| 855,090 |
| 95,667 |
| ||
Brandywine Realty Trust REIT |
| 1,170,724 |
| 38,926 |
| ||
BRCP REIT I, LLC |
| (a)(d)(i)(l)5,934,197 |
| 4,389 |
| ||
BRCP REIT II, LLC |
| (a)(d)(i)(l)1,060,733 |
| 1,061 |
| ||
Brookfield Properties Corp. |
| 2,285,142 |
| 89,875 |
| ||
Cabot Industrial Value Fund L.P. |
| (d)(i)(l)3,668 |
| 1,834 |
| ||
Equity Office Properties Trust REIT |
| 1,628,433 |
| 78,442 |
| ||
Kilroy Realty Corp. REIT |
| 13,790 |
| 1,076 |
| ||
Mack-Cali Realty Corp. REIT |
| 641,293 |
| 32,706 |
| ||
Parkway Properties, Inc. REIT |
| 21,589 |
| 1,101 |
| ||
Republic Property Trust REIT |
| 370,669 |
| 4,277 |
| ||
SL Green Realty Corp. REIT |
| 76,379 |
| 10,142 |
| ||
|
|
|
| 360,506 |
| ||
Office/Industrial - Mixed (2.2%) |
|
|
|
|
| ||
Highwoods Properties, Inc. REIT |
| 253,183 |
| 10,320 |
| ||
Liberty Property Trust REIT |
| 653,113 |
| 32,094 |
| ||
|
|
|
| 42,414 |
| ||
Paper (1.2%) |
|
|
|
|
| ||
Plum Creek Timber Co., Inc. REIT |
| 557,374 |
| 22,211 |
| ||
Residential Apartments (19.5%) |
|
|
|
|
| ||
American Campus Communities, Inc. REIT |
| 238,398 |
| 6,787 |
| ||
Archstone-Smith Trust REIT |
| 1,143,937 |
| 66,588 |
| ||
Atlantic Gulf Communities Corp. |
| (a)(d)(i)(l)140,284 |
| @— |
| ||
AvalonBay Communities, Inc. REIT |
| 620,046 |
| 80,637 |
| ||
BRE Properties, Inc. REIT |
| 263,701 |
| 17,146 |
| ||
Brookfield Homes Corp. |
| 488,686 |
| 18,350 |
| ||
Equity Residential REIT |
| 1,862,301 |
| 94,512 |
| ||
Essex Property Trust, Inc. REIT |
| 376,438 |
| 48,655 |
| ||
Post Properties, Inc. REIT |
| 850,258 |
| 38,857 |
| ||
|
|
|
| 371,532 |
| ||
Residential Manufactured Homes (1.4%) |
|
|
|
|
| ||
Equity Lifestyle Properties, Inc. REIT |
| 486,909 |
| 26,503 |
| ||
Retail Regional Malls (15.0%) |
|
|
|
|
| ||
General Growth Properties, Inc. REIT |
| 858,775 |
| 44,854 |
| ||
Macerich Co. (The) REIT |
| 651,802 |
| 56,426 |
| ||
Simon Property Group, Inc. REIT |
| 1,690,622 |
| 171,243 |
| ||
Taubman Centers, Inc. REIT |
| 247,598 |
| 12,593 |
| ||
|
|
|
| 285,116 |
| ||
Retail Strip Centers (6.2%) |
|
|
|
|
| ||
Acadia Realty Trust REIT |
| 273,058 |
| 6,832 |
| ||
BPP Liquidating Trust REIT |
| (a)(d)(l)113,290 |
| 6 |
| ||
Cedar Shopping Centers, Inc. REIT |
| 237,689 |
| 3,782 |
| ||
Federal Realty Investment Trust REIT |
| 563,049 |
| 47,859 |
| ||
Ramco-Gershenson Properties REIT |
| 42,865 |
| 1,635 |
| ||
Regency Centers Corp. REIT |
| 733,977 |
| 57,375 |
| ||
|
|
|
| 117,489 |
| ||
Self Storage (3.9%) |
|
|
|
|
| ||
Public Storage, Inc. REIT |
| 758,835 |
| 73,986 |
| ||
Total Common Stocks (Cost $1,124,964) |
|
|
| 1,859,141 |
| ||
|
|
|
|
|
| ||
Preferred Stocks (0.0%) |
|
|
|
|
| ||
Residential Apartments (0.0%) |
|
|
|
|
| ||
Atlantic Gulf Communities Corp., Series B |
| (a)(d)(i)(l)107,021 |
| @— |
| ||
Atlantic Gulf Communities Corp., Series B (Convertible) |
| (a)(d)(i)(l)75,765 |
| @— |
| ||
Total Preferred Stocks (Cost $1,828) |
|
|
| @— |
| ||
|
|
|
|
|
| ||
|
| Face |
|
|
| ||
|
| Amount |
|
|
| ||
|
| (000) |
|
|
| ||
Short-Term Investment (2.5%) |
|
|
|
|
| ||
Repurchase Agreement (2.5%) |
|
|
|
|
| ||
J.P. Morgan Securities, Inc., 5.20%, dated 12/29/06, due 1/2/07, repurchase price $46,879 (Cost $46,852) |
| $ | (f)46,852 |
| 46,852 |
| |
Total Investments (100.1%) (Cost $1,173,644) |
|
|
| 1,905,993 |
| ||
Liabilities in Excess of Other Assets (-0.1%) |
|
|
| (1,530 | ) | ||
Net Assets (100%) |
|
|
| $ | 1,904,463 |
| |
The accompanying notes are an integral part of the financial statements.
124
| 2006 Annual Report |
|
|
| December 31, 2006 |
Portfolio of Investments (cont’d)
U.S. Real Estate Portfolio
(a) Non-income producing security.
(d) Securities were valued at fair value — At December 31, 2006, the Portfolio held $9,938,000 of fair valued securities, representing 0.5% of net assets.
(f) Represents the Portfolio’s undivided interest in a joint repurchase agreement which has a total value of $1,856,998,000. The repurchase agreement was fully collateralized by U.S. government agency securities at the date of this Portfolio of Investments as follows: Federal Farm Credit Bank, 0.00% to 7.43%, due 1/16/07 to 10/23/35; Federal Home Loan Bank, 0.00% to 7.38%, due 1/3/07 to 6/5/28; Federal Home Loan Mortgage Corp., 0.00% to 6.75%, due 1/2/07 to 7/15/32; Federal National Mortgage Association, 0.00% to 8.20%, due 1/12/07 to 11/15/30; Tennessee Valley Authority, 5.38% to 6.75%, due 11/13/08 to 4/1/36, which had a total value of $1,894,142,869. The investment in the repurchase agreement is through participation in a joint account with affiliated parties pursuant to exemptive relief received by the Portfolio from the SEC.
(i) Restricted security valued at fair value and not registered under the Securities Act of 1933. Atlantic Gulf Communities Corp. was acquired 6/97 and has a current cost basis of $790,000. Atlantic Gulf Communities Corp., Series B Preferred was acquired 2/00 and has a current cost basis of $758,000. Atlantic Gulf Communities Corp., Series B Preferred was acquired 6/97 and has a current cost basis of $1,070,000. Beacon Capital Partners, Inc. was acquired 3/98 and has a current cost basis of $1,010,000, BRCP REIT I, LLC was acquired 5/03 - 11/06 and has a current cost basis of $4,389,000. BRCP REIT II, LLC was acquired 10/06 and has a current cost basis of $1,061,000. Cabot Industrial Value Fund L.P. was aquired 11/05 - 6/06 and has a current cost basis of 1,834,000. Keystone Industries Fund L.P. was acquired 10/05 - 9/06 and has a current cost basis of $1,638,000. At December 31, 2006, these securities had an aggregate market value of $9,932,000 representing 0.5% of net assets.
(l) Security has been deemed illiquid at December 31, 2006.
@ Face Amount/Value is less than $500.
REIT Real Estate Investment Trust
The accompanying notes are an integral part of the financial statements.
125
2006 Annual Report |
|
|
|
December 31, 2006 |
|
Investment Overview (unaudited)
Emerging Markets Debt Portfolio
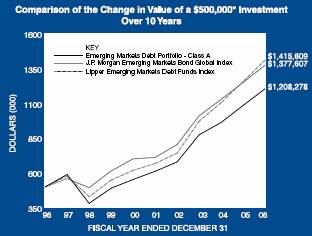
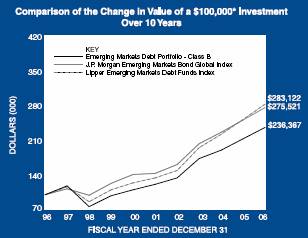
* Minimum Investment
In accordance with SEC regulations, Portfolio performance shown assumes that all recurring fees (including management fees) were deducted and all dividends and distributions were reinvested.
Performance Compared to the J.P. Morgan Emerging Markets Bond Global Index(1) and the Lipper Emerging Markets Debt Funds Index(2)
|
|
|
| Total Returns(3) |
| ||||
|
|
|
| Average Annual |
| ||||
|
| One |
| Five |
| Ten |
| Since |
|
|
| Year |
| Years |
| Years |
| Inception(6) |
|
Portfolio – Class A (4) |
| 11.08 | % | 14.54 | % | 9.22 | % | 11.35 | % |
J.P. Morgan Emerging Markets Bond Global Index |
| 9.88 |
| 14.08 |
| 10.67 |
| 10.92 |
|
Lipper Emerging MarketsDebt Funds Index |
| 12.34 |
| 16.19 |
| 10.97 |
| — |
|
|
|
|
|
|
|
|
|
|
|
Portfolio – Class B (5) |
| 10.79 |
| 14.25 |
| 8.98 |
| 12.10 |
|
J.P. Morgan Emerging Markets Bond Global Index |
| 9.88 |
| 14.08 |
| 10.67 |
| 12.59 |
|
Lipper Emerging MarketsDebt Funds Index |
| 12.34 |
| 16.19 |
| 10.97 |
| 13.16 |
|
Performance data quoted represents past performance, which is no guarantee of future results, and current performance may be lower or higher than the figures shown. Performance assumes that all dividends and distributions, if any, were reinvested. For the most recent month-end performance figures, please visit www.morganstanley.com/im. Investment return and principal value will fluctuate so that Portfolio shares, when redeemed, may be worth more or less than their original cost. Total returns do not reflect the deduction of taxes that a shareholder would pay on Portfolio distributions or the redemption of Portfolio shares.
(1) The J.P. Morgan Emerging Markets Bond Global Index tracks total returns for U.S. dollar - denominated debt instruments issued by emerging market sovereign and quasi - sovereign entities, including Brady Bonds, loans, Eurobonds and local market instruments for over 30 emerging market countries. The Index is unmanaged and its returns do not include any sales charges or fees. Such costs would lower performance. It is not possible to invest directly in an index.
(2) The Lipper Emerging Markets Debt Funds Index is an equally weighted performance index of the largest qualifying funds (based on net assets) in the Lipper Emerging Markets Debt Funds classification. The Index, which is adjusted for capital gains distributions and income dividends, is unmanaged and should not be considered an investment. There are currently 10 funds represented in this Index. As of the date of this report, the Portfolio is in the Lipper Emerging Markets Debt Funds classification.
(3) Total returns for the Portfolio reflect fees waived and expenses reimbursed, if applicable, by the Adviser. Without such waivers and/or reimbursements, total returns would have been lower. Fee waivers and/or expense reimbursements are voluntary and the Adviser reserves the right to commence or terminate any waiver and/or reimbursement at any time.
(4) Commenced operations on February 1, 1994
(5) Commenced operations on January 2, 1996
(6) For comparative purposes, average annual since inception returns listed for the Indexes refer to the inception date or initial offering of the respective share class of the Portfolio, not the inception of the Index.
The Emerging Markets Debt Portfolio seeks high total return by investing primarily in fixed income securities of government and government-related issuers and, to a lesser extent, of corporate issuers in emerging market countries. Foreign investing involves certain risks, including currency fluctuations and controls, restrictions on foreign investments, less governmental supervision and regulation, less liquidity
126
| 2006 Annual Report |
|
|
| December 31, 2006 |
Investment Overview (cont’d)
Emerging Markets Debt Portfolio
and the potential for market volatility and political instability. In addition, investing in emerging markets may involve a relatively higher degree of volatility.
Performance
For the year ended December 31, 2006, the Portfolio had a total return based on net asset value per share of 11.08% for Class A shares, net of fees, and 10.79% for Class B shares, net of fees, compared to 9.88% for the J.P. Morgan Emerging Markets Bond Global Index (the “Index”).
Factors Affecting Performance
• The emerging markets debt (EMD) asset class had a very positive 2006: a 10-plus percent return, 66 basis points of credit spread tightening, solid growth across the universe of countries, improved fundamentals (higher foreign exchange reserves, higher ratings, lower levels of external debt) and low volatility.
• The EMD asset class enjoyed strong performance at the start of the year until uncertainty over the path of G3 (Group of Three, a free trade agreement between Colombia, Mexico and Venezuela) monetary policy and fear of policy overkill (i.e., excessive tightening) dampened investor risk tolerance during the late spring/ early summer months. This caused a sell-off in emerging market equity (EME) markets and turmoil in select emerging markets (EM) currency markets.
• Several issues continued to confront the larger global economy, such as imbalances in the U.S. economy, tight commodity markets and risk of a supply shock, the dependence of certain export-oriented economies on the U.S., the political tensions in the Middle East, and the risk of a correction in the credit markets. These issues were similar to issues present at the end of 2005, and importantly, did not detract from the fundamental, and in a few cases, permanent improvements in many EM countries’ balance sheets.
• Reflective of their improved fundamental position and stronger-than-expected cash flows in 2006, sovereign issuers reduced overall debt at a faster-than-expected pace. In addition, these issuers reduced their dependency on hard currency denominated financing and set aside excess cash flows for the proverbial “rainy day.”
• Hikes in short-term U.S. interest rates during the first half of the year weighed on high-beta/risky assets like EMD and EME due to the fact that the funding side of most risk-seeking trades was becoming less attractive. However, the turmoil in EM equity and currency markets did not, in most cases, extend to the external (hard currency denominated) bonds.
• During the second half of the year, softening economic data led to the belief that U.S. monetary tightening policy would be on hold. As such, EM currency markets rallied strongly during the final few months of the year and spreads on hard currency denominated debt tightened as well. Spreads on U.S. dollar denominated EM bonds, which had remained in a relatively narrow range all year, nudged through the tighter end of their range, ending the year at +171 basis points above U.S. Treasuries.
Management Strategies
• The vulnerability of EM to higher interest rates prompted our adaptation of a slightly defensive stance early in the year; a stance characterized by underweights in some of the historically volatile credits and overweights in shorter duration or local currency denominated assets.
• Within this more defensive stance, we favored countries such as Indonesia, the Philippines and Argentina where we believed that valuations had not yet reflected the ongoing improvements in macro conditions.
• We maintained defensive interest-rate risk postures, given our view that U.S. Treasury bond yields remained rich.
• The pause in monetary tightening during the second half of the year, increased the attractiveness of higher yielding assets in the EM universe and renewed investor risk appetite. However, the historically tight valuations did not warrant an overweight to higher beta hard currency assets in our view.
• Our overweights in local currency denominated bonds aided relative returns over the course of the year. We increased our exposure to local currency denominated assets in Argentina, Brazil, Mexico, Turkey, and a few other smaller countries over the course of the summer months to take advantage of what we viewed as more attractive valuations.
• The Portfolio maintained an overall risk posture close to that of the Index.
Expense Examples
As a shareholder of the Portfolio, you may incur two types of costs: (1) transactional costs, including redemption fees; (2) ongoing costs, including management fees, distribution (12b- 1) fees (in the case of Class B); and other Portfolio expenses. These examples are intended to help you understand your ongoing costs (in dollars) of investing in the Portfolio and to
127
2006 Annual Report |
|
|
|
December 31, 2006 |
|
Investment Overview (cont’d)
Emerging Markets Debt Portfolio
compare these costs with the ongoing costs of investing in other mutual funds.
The examples are based on an investment of $1,000 invested at the beginning of the six-month period ended December 31, 2006 and held for the entire six-month period.
Actual Expenses
The first line of the tables below provides information about actual account values and actual expenses. You may use the information in this line, together with the amount you invested, to estimate the expenses that you paid over the period. Simply divide your account value by $1,000 (for example, an $8,600 account value divided by $1,000 = 8.6), then multiply the result by the number in the first line under the heading entitled “Expenses Paid During Period” to estimate the expenses you paid on your account during this period.
Please note that “Expenses Paid During Period” are grossed up to reflect Portfolio expenses prior to the effect of Expense Offset (See Note E in the Notes to Financial Statements). Therefore, the annualized net expense ratios may differ from the ratio of the expenses to average net assets shown in the Financial Highlights.
Hypothetical Example for Comparison Purposes
The second line of the tables below provides information about hypothetical account values and hypothetical expenses based on the Portfolio’s actual expense ratio and an assumed rate of return of 5% per year before expenses, which is not the Portfolio’s actual return. The hypothetical account values and expenses may not be used to estimate the actual ending account balance or expenses you paid for the period. You may use this information to compare the ongoing costs of investing in the Portfolio and other funds. To do so, compare this 5% hypothetical example with the 5% hypothetical examples that appear in the shareholder reports of the other funds.
Please note that the expenses shown in the table are meant to highlight your ongoing costs only and do not reflect any transactional costs, such as redemption fees. Therefore, the second line of the table is useful in comparing ongoing costs only, and will not help you determine the relative total costs of owning different funds. In addition, if these transactional costs were included, your costs would have been higher.
|
|
|
|
|
| Expenses Paid |
| |||
|
|
|
| Ending |
| During Period* |
| |||
|
| Beginning |
| Account Value |
| July 1, 2006 — |
| |||
|
| Account Value |
| December 31, |
| December 31, |
| |||
|
| July 1, 2006 |
| 2006 |
| 2006 |
| |||
Class A |
|
|
|
|
|
|
| |||
Actual |
| $ | 1,000.00 |
| $ | 1,126.30 |
| $ | 4.61 |
|
Hypothetical (5% average annual return before expenses) |
| 1,000.00 |
| 1,020.87 |
| 4.38 |
| |||
|
|
|
|
|
|
|
| |||
Class B |
|
|
|
|
|
|
| |||
Actual |
| 1,000.00 |
| 1,125.90 |
| 6.00 |
| |||
Hypothetical (5% average annual return before expenses) |
| 1,000.00 |
| 1,019.56 |
| 5.70 |
| |||
* Expenses are equal to Class A and Class B annualized net expense ratios of 0.86% and 1.12%, respectively, multiplied by the average account value over the period, multiplied by 184/365 (to reflect the one-half year period).
Graphic Presentation of Portfolio Holdings
The following graph depicts the Portfolio’s holdings by industry and/or security type, as a percentage of total investments.
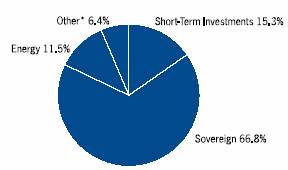
* Industries which do not appear in the above graph, as well as those which represent less than 5% of total investments, if applicable, are included in the category labeled “Other”.
January 2007
128
| 2006 Annual Report |
|
|
| December 31, 2006 |
Portfolio of Investments
Emerging Markets Debt Portfolio
|
|
|
| Face |
|
|
| ||||
|
|
|
| Amount |
| Value |
| ||||
|
|
|
|
|
|
|
| ||||
Debt Instruments (96.1%) |
|
|
|
|
|
|
| ||||
Argentina (3.5%) |
|
|
|
|
|
|
| ||||
Sovereign (3.5%) |
|
|
|
|
|
|
| ||||
Republic of Argentina |
|
|
|
|
|
|
| ||||
5.83%, 12/31/33 |
|
|
| $ | (b)4,590 |
| $ | 2,238 |
| ||
8.28%, 12/31/33 |
|
|
| (d)112 |
| 121 |
| ||||
Republic of Argentina (Linked Variable Rate) |
|
|
|
|
|
|
| ||||
86.70%, 4/10/49 |
|
|
| (b)1,120 |
| 498 |
| ||||
|
|
|
|
|
| 2,857 |
| ||||
Brazil (12.8%) |
|
|
|
|
|
|
| ||||
Corporate (1.1%) |
|
|
|
|
|
|
| ||||
Banco ABN Amro Real S.A. |
|
|
|
|
|
|
| ||||
Zero Coupon, 12/13/07 |
|
|
| BRL | 1,850 |
| 893 |
| |||
Sovereign (11.7%) |
|
|
|
|
|
|
| ||||
Citigroup, Inc. |
|
|
|
|
|
|
| ||||
6.00%, 5/18/09 |
|
|
| $ | 800 |
| 839 |
| |||
Federative Republic of Brazil |
|
|
|
|
|
|
| ||||
8.00%, 1/15/18 |
|
|
| 962 |
| 1,071 |
| ||||
8.88%, 10/14/19 - 4/15/24 |
|
|
| 3,235 |
| 3,980 |
| ||||
10.50%, 7/14/14 |
|
|
| 620 |
| 789 |
| ||||
11.00%, 8/17/40 |
|
|
| (c)890 |
| 1,182 |
| ||||
14.50%, 10/15/09 |
|
|
| 1,370 |
| 1,703 |
| ||||
|
|
|
|
|
| 9,564 |
| ||||
|
|
|
|
|
| 10,457 |
| ||||
Bulgaria (1.2%) |
|
|
|
|
|
|
| ||||
Sovereign (1.2%) |
|
|
|
|
|
|
| ||||
Republic of Bulgaria |
|
|
|
|
|
|
| ||||
8.25%, 1/15/15 |
|
|
| (e)200 |
| 238 |
| ||||
8.25%, 1/15/15 |
|
|
| 170 |
| 202 |
| ||||
Republic of Bulgaria (Registered) |
|
|
|
|
|
|
| ||||
8.25%, 1/15/15 |
|
|
| 473 |
| 563 |
| ||||
|
|
|
|
|
| 1,003 |
| ||||
Chile (1.5%) |
|
|
|
|
|
|
| ||||
Corporate (1.5%) |
|
|
|
|
|
|
| ||||
Empresa Nacional de Petroleo |
|
|
|
|
|
|
| ||||
6.75%, 11/15/12 |
|
|
| (e)1,150 |
| 1,213 |
| ||||
Colombia (3.1%) |
|
|
|
|
|
|
| ||||
Sovereign (3.1%) |
|
|
|
|
|
|
| ||||
Republic of Colombia |
|
|
|
|
|
|
| ||||
7.38%, 9/18/37 |
|
|
| 670 |
| 725 |
| ||||
8.13%, 5/21/24 |
|
|
| 480 |
| 555 |
| ||||
8.25%, 12/22/14 |
|
|
| 340 |
| 386 |
| ||||
9.75%, 4/9/11 |
|
|
| 238 |
| 260 |
| ||||
11.75%, 2/25/20 |
|
|
| 415 |
| 605 |
| ||||
|
|
|
|
|
| 2,531 |
| ||||
Ecuador (0.9%) |
|
|
|
|
|
|
| ||||
Sovereign (0.9%) |
|
|
|
|
|
|
| ||||
Republic of Ecuador |
|
|
|
|
|
|
| ||||
9.38%, 12/15/15 |
|
|
| (c)190 |
| 151 |
| ||||
Republic of Ecuador (Registered) |
|
|
|
|
|
|
| ||||
10.00%, 8/15/30 |
|
|
| (c)(n)780 |
| 581 |
| ||||
|
|
|
|
|
| 732 |
| ||||
Indonesia (3.7%) |
|
|
|
|
|
|
| ||||
Corporate (3.7%) |
|
|
|
|
|
|
| ||||
Pindo Deli Finance Mauritius |
|
|
|
|
|
|
| ||||
Tranche A, 6.38%, 4/28/15 |
|
|
| (e)(h)2,227 |
| 390 |
| ||||
Tranche B, 6.38%, 4/28/18 |
|
|
| (e)(h)1,101 |
| 600 |
| ||||
Tranche C, Zero Coupon, 4/28/27 |
|
|
| (e)324 |
| 251 |
| ||||
Tjiwi Kimia Finance Mauritius Ltd. |
|
|
|
|
|
|
| ||||
Tranche A, 6.38%, 4/28/15 |
|
|
| (h)962 |
| 775 |
| ||||
Tranche A, 6.38%, 4/28/15 |
|
|
| (e)(h)503 |
| 405 |
| ||||
Tranche B, 6.38%, 4/28/18 |
|
|
| (e)(h)808 |
| 440 |
| ||||
Tranche C, Zero Coupon, 4/28/27 |
|
|
| (e)998 |
| 175 |
| ||||
|
|
|
|
|
| 3,036 |
| ||||
Ivory Coast (0.2%) |
|
|
|
|
|
|
| ||||
Sovereign (0.2%) |
|
|
|
|
|
|
| ||||
Ivory Coast |
|
|
|
|
|
|
| ||||
2.50%, 3/30/18 |
|
|
| (b)580 |
| 133 |
| ||||
Mexico (18.4%) |
|
|
|
|
|
|
| ||||
Corporate (7.6%) |
|
|
|
|
|
|
| ||||
Pemex Project Funding Master Trust |
|
|
|
|
|
|
| ||||
6.66%, 6/15/10 |
|
|
| (e)(h)1,230 |
| 1,265 |
| ||||
8.63%, 12/1/23 |
|
|
| 460 |
| 568 |
| ||||
9.13%, 10/13/10 |
|
|
| 1,260 |
| 1,416 |
| ||||
9.50%, 9/15/27 |
|
|
| 2,210 |
| 2,976 |
| ||||
|
|
|
|
|
| 6,225 |
| ||||
Sovereign (10.8%) |
|
|
|
|
|
|
| ||||
Mexican Bonos |
|
|
|
|
|
|
| ||||
8.00%, 12/17/15 |
|
|
| MXN | 18,050 |
| 1,731 |
| |||
10.00%, 12/5/24 |
|
|
| 33,320 |
| 3,829 |
| ||||
United Mexican States |
|
|
|
|
|
|
| ||||
7.50%, 1/14/12 |
|
|
| $ | 560 |
| 616 |
| |||
8.13%, 12/30/19 |
|
|
| 1,173 |
| 1,437 |
| ||||
8.38%, 1/14/11 |
|
|
| 1,070 |
| 1,193 |
| ||||
|
|
|
|
|
| 8,806 |
| ||||
|
|
|
|
|
| 15,031 |
| ||||
Nigeria (1.3%) |
|
|
|
|
|
|
| ||||
Sovereign (1.3%) |
|
|
|
|
|
|
| ||||
Central Bank of Nigeria Credit-Linked Mortgage Bond |
|
|
|
|
|
|
| ||||
15.00%, 1/30/09 |
|
|
| 937 |
| 1,060 |
| ||||
Panama (2.4%) |
|
|
|
|
|
|
| ||||
Sovereign (2.4%) |
|
|
|
|
|
|
| ||||
Republic of Panama |
|
|
|
|
|
|
| ||||
7.13%, 1/29/26 |
|
|
| 650 |
| 705 |
| ||||
7.25%, 3/15/15 |
|
|
| 230 |
| 250 |
| ||||
9.38%, 4/1/29 |
|
|
| 540 |
| 722 |
| ||||
9.63%, 2/8/11 |
|
|
| 249 |
| 287 |
| ||||
|
|
|
|
|
| 1,964 |
| ||||
The accompanying notes are an integral part of the financial statements.
129
2006 Annual Report |
|
|
|
December 31, 2006 |
|
Portfolio of Investments (cont’d)
Emerging Markets Debt Portfolio
|
| Face |
|
|
| ||
|
| Amount |
| Value |
| ||
|
| (000) |
| (000) |
| ||
Peru (3.0%) |
|
|
|
|
| ||
Sovereign (3.0%) |
|
|
|
|
| ||
Republic of Peru |
|
|
|
|
| ||
8.38%, 5/3/16 |
| $ | (c)330 |
| $ | 393 |
|
8.75%, 11/21/33 |
| (c)1,080 |
| 1,426 |
| ||
9.88%, 2/6/15 |
| (c)480 |
| 609 |
| ||
|
|
|
| 2,428 |
| ||
Philippines (11.8%) |
|
|
|
|
| ||
Sovereign (11.8%) |
|
|
|
|
| ||
Republic of Philippines |
|
|
|
|
| ||
8.88%, 3/17/15 |
| (c)3,470 |
| 4,125 |
| ||
9.00%, 2/15/13 |
| (c)740 |
| 859 |
| ||
9.50%, 2/2/30 |
| (c)3,222 |
| 4,301 |
| ||
10.63%, 3/16/25 |
| (c)270 |
| 388 |
| ||
|
|
|
| 9,673 |
| ||
Qatar (0.6%) |
|
|
|
|
| ||
Sovereign (0.6%) |
|
|
|
|
| ||
State of Qatar (Registered) |
|
|
|
|
| ||
9.75%, 6/15/30 |
| 350 |
| 524 |
| ||
Russia (14.1%) |
|
|
|
|
| ||
Corporate (4.4%) |
|
|
|
|
| ||
Gaz Capital for Gazprom |
|
|
|
|
| ||
6.21%, 11/22/16 |
| (e)1,117 |
| 1,127 |
| ||
8.63%, 4/28/34 |
| 1,040 |
| 1,347 |
| ||
RSHB Capital S.A. for OJSC Russian |
|
|
|
|
| ||
Agricultural Bank |
|
|
|
|
| ||
7.18%, 5/16/13 |
| (e)950 |
| 1,003 |
| ||
7.18%, 5/16/13 |
| (c)100 |
| 106 |
| ||
|
|
|
| 3,583 |
| ||
Sovereign (9.7%) |
|
|
|
|
| ||
Russian Federation |
|
|
|
|
| ||
5.00%, 3/31/30 |
| (e)(n)65 |
| 74 |
| ||
Russian Federation (Registered) |
|
|
|
|
| ||
5.00%, 3/31/30 |
| (n)2,933 |
| 3,318 |
| ||
11.00%, 7/24/18 |
| 1,606 |
| 2,324 |
| ||
12.75%, 6/24/28 |
| 1,250 |
| 2,261 |
| ||
|
|
|
| 7,977 |
| ||
|
|
|
| 11,560 |
| ||
Trinidad (1.1%) |
|
|
|
|
| ||
Corporate (1.1%) |
|
|
|
|
| ||
National Gas of Trinidad & Tobago, Ltd. |
|
|
|
|
| ||
6.05%, 1/15/36 |
| (e)932 |
| 914 |
| ||
Tunisia (0.3%) |
|
|
|
|
| ||
Sovereign (0.3%) |
|
|
|
|
| ||
Banque Centrale de Tunisie |
|
|
|
|
| ||
7.38%, 4/25/12 |
| 210 |
| 227 |
| ||
Turkey (8.8%) |
|
|
|
|
| ||
Sovereign (8.8%) |
|
|
|
|
| ||
Citigroup Global Markets Holdings, Inc. |
|
|
|
|
| ||
Zero Coupon, 8/14/08 |
| 1,780 |
| 1,847 |
| ||
J.P. Morgan Chase & Co., Zero Coupon, 8/14/08 |
|
|
|
|
| ||
|
| 2,120 |
| 1,585 |
| ||
Republic of Turkey |
|
|
|
|
| ||
7.00%, 9/26/16 |
| 950 |
| 968 |
| ||
11.00%, 1/14/13 |
| 920 |
| 1,132 |
| ||
11.88%, 1/15/30 |
| (c)1,080 |
| 1,665 |
| ||
|
|
|
| 7,197 |
| ||
Ukraine (1.0%) |
|
|
|
|
| ||
Sovereign (1.0%) |
|
|
|
|
| ||
Republic of Ukraine |
|
|
|
|
| ||
6.58%, 11/21/16 |
| 820 |
| 822 |
| ||
Venezuela (6.4%) |
|
|
|
|
| ||
Sovereign (6.4%) |
|
|
|
|
| ||
Republic of Venezuela |
|
|
|
|
| ||
5.75%, 2/26/16 |
| 610 |
| 580 |
| ||
8.50%, 10/8/14 |
| (c)590 |
| 671 |
| ||
9.38%, 1/13/34 |
| (c)742 |
| 982 |
| ||
10.75%, 9/19/13 |
| 2,390 |
| 2,976 |
| ||
|
|
|
| 5,209 |
| ||
Total Debt Instruments (Cost $74,326) |
|
|
| 78,571 |
| ||
|
| No. of |
|
|
|
|
| Warrants |
|
|
|
|
| (000) |
|
|
|
Warrants (1.1%) |
|
|
|
|
|
Argentina (0.8%) |
|
|
|
|
|
Republic of Argentina, expiring 12/15/35 |
| (b)16,231 |
| 631 |
|
Republic of Argentina, expiring 12/15/35 |
| (d)298 |
| 40 |
|
|
|
|
| 671 |
|
Nigeria (0.2%) |
|
|
|
|
|
Central Bank of Nigeria, expiring 11/15/20 |
| 750 |
| 143 |
|
Venezuela (0.1%) |
|
|
|
|
|
Republic of Venezuela Oil-Linked Payment |
|
|
|
|
|
Obligation, expiring 4/15/20 |
| 2,700 |
| 90 |
|
Total Warrants (Cost $@—) |
|
|
| 904 |
|
|
| No. of |
|
|
|
|
| Contracts |
|
|
|
Put Option Purchased (0.0%) |
|
|
|
|
|
Turkey (0.0%) |
|
|
|
|
|
Put Option |
|
|
|
|
|
Turkish Lira Put @ $1.492 |
|
|
|
|
|
expiring 2/8/07 (Cost $45) |
| (a)1,641,800 |
| 3 |
|
|
| Face |
|
|
| |
|
| Amount |
|
|
| |
|
| (000) |
|
|
| |
Short-Term Investments (17.6%) |
|
|
|
|
| |
Short-Term Debt Securities held as Collateral on Loaned Securities (16.8%) |
|
|
|
|
| |
Alliance & Leicester plc, |
|
|
|
|
| |
5.36%, 1/8/07 |
| $ | (h)448 |
| 448 |
|
Bancaja, 5.37%, 1/19/07 |
| (h)224 |
| 224 |
| |
Bank of America Corp., 5.32%, 1/2/07 |
| (h)716 |
| 716 |
| |
The accompanying notes are an integral part of the financial statements.
130
| 2006 Annual Report |
|
|
| December 31, 2006 |
Portfolio of Investments (cont’d)
Emerging Markets Debt Portfolio
|
| Face |
|
|
| ||
|
| Amount |
| Value |
| ||
|
| (000) |
| (000) |
| ||
Short-Term Debt Securities held as Collateral on Loaned Securities (cont’d) |
|
|
|
|
| ||
Bank of New York Co., Inc., |
|
|
|
|
| ||
5.34%, 1/10/07 |
| $ | (h)224 |
| $ | 224 |
|
Bear Stearns & Co., Inc., |
|
|
|
|
| ||
5.37%, 1/2/07 |
| (h)268 |
| 268 |
| ||
5.38%, 1/2/07 |
| (h)179 |
| 179 |
| ||
5.39%, 1/16/07 |
| (h)448 |
| 448 |
| ||
BNP Paribas plc, |
|
|
|
|
| ||
5.35%, 2/20/07 |
| (h)448 |
| 448 |
| ||
CIC, New York, |
|
|
|
|
| ||
5.33%, 1/3/07 |
| (h)313 |
| 313 |
| ||
5.34%, 1/2/07 |
| (h)448 |
| 448 |
| ||
Dekabank Deutsche Girozentrale, |
|
|
|
|
| ||
5.39%, 1/19/07 |
| (h)457 |
| 457 |
| ||
Deutsche Bank Securities, Inc., |
|
|
|
|
| ||
5.33%, 1/2/07 |
| 1,436 |
| 1,436 |
| ||
Dexia Bank, New York, |
|
|
|
|
| ||
5.33%, 1/2/07 |
| (h)448 |
| 448 |
| ||
Gemini Securitization Corp., |
|
|
|
|
| ||
5.34%, 1/2/07 |
| 224 |
| 224 |
| ||
Goldman Sachs Group, Inc., |
|
|
|
|
| ||
5.40%, 1/16/07 |
| (h)224 |
| 224 |
| ||
5.42%, 1/2/07 |
| (h)421 |
| 421 |
| ||
HSBC Finance Corp., 5.34%, 1/8/07 |
| (h)224 |
| 224 |
| ||
Liberty Lighthouse U.S. Capital, |
|
|
|
|
| ||
5.33%, 1/2/07 |
| (h)224 |
| 224 |
| ||
Manufacturers & Traders, |
|
|
|
|
| ||
5.33%, 1/16/07 |
| (h)268 |
| 268 |
| ||
Merrill Lynch & Co., |
|
|
|
|
| ||
5.35%, 1/26/07 |
| (h)235 |
| 235 |
| ||
Mitsubishi UFJ Financial Group, 5.33%, |
|
|
|
|
| ||
1/2/07 |
| (h)224 |
| 224 |
| ||
Natexis Banques Populaires, New York, |
|
|
|
|
| ||
5.34%, 1/2/07 |
| (h)448 |
| 448 |
| ||
5.35%, 1/2/07 |
| (h)224 |
| 224 |
| ||
National City Bank Cleveland, |
|
|
|
|
| ||
5.32%, 1/2/07 |
| (h)649 |
| 649 |
| ||
National Rural Utilities Cooperative |
|
|
|
|
| ||
Finance Corp., |
|
|
|
|
| ||
5.34%, 1/2/07 |
| (h)895 |
| 895 |
| ||
Nationwide Building Society, |
|
|
|
|
| ||
5.44%, 3/28/07 |
| (h)519 |
| 519 |
| ||
Nordea Bank, New York, |
|
|
|
|
| ||
5.31%, 1/2/07 |
| (h)671 |
| 671 |
| ||
Rhein-Main Securitisation Ltd., |
|
|
|
|
| ||
5.33%, 1/18/07 |
| 211 |
| 211 |
| ||
Skandi, New York, |
|
|
|
|
| ||
5.34%, 1/9/07 |
| (h)448 |
| 448 |
| ||
SLM Corp., 5.36%, 1/22/07 |
| (h)448 |
| 448 |
| ||
Toronto Dominion, New York, 5.32%, |
|
|
|
|
| ||
5/29/07 |
| (h)448 |
| 448 |
| ||
Tulip Funding, 5.36%, 1/16/07 |
| 246 |
| 246 |
| ||
Unicredito Italiano Bank (Ireland) plc, |
|
|
|
|
| ||
5.36%, 1/9/07 |
| (h)313 |
| 313 |
| ||
World Savings Bank FSB, |
|
|
|
|
| ||
5.35%, 1/19/07 |
| (h)152 |
| 152 |
| ||
|
|
|
| 13,773 |
| ||
Repurchase Agreement (0.8%) |
|
|
|
|
| ||
J.P. Morgan Securities, Inc., 5.20%, dated 12/29/06, due 1/2/07, repurchase price $630 |
| (f)630 |
| 630 |
| ||
Total Short-Term Investments (Cost $14,403) |
|
|
| 14,403 |
| ||
Total Investments (114.8%) (Cost $88,774) — including $13,206 of Securities Loaned |
|
|
| 93,881 |
| ||
Liabilities in Excess of Other Assets (-14.8%) |
|
|
| (12,104 | ) | ||
Net Assets (100%) |
|
|
| $ | 81,777 |
| |
(a) Non-income producing security.
(b) Issuer is in default.
(c) All or portion of security on loan at December 31, 2006.
(d) Securities were valued at fair value — At December 31, 2006, the Portfolio held $161,000 of fair valued securities, representing 0.2% of net assets.
(e) 144A security — certain conditions for public sale may exist. Unless otherwise noted, these securities are deemed to be liquid.
(f) Represents the Portfolio’s undivided interest in a joint repurchase agreement which has a total value of $1,856,998,000. The repurchase agreement was fully collateralized by U.S. government agency securities at the date of this Portfolio of Investments as follows: Federal Farm Credit Bank, 0.00% to 7.43%, due 1/16/07 to 10/23/35; Federal Home Loan Bank, 0.00% to 7.38%, due 1/3/07 to 6/5/28; Federal Home Loan Mortgage Corp., 0.00% to 6.75%, due 1/2/07 to 7/15/32; Federal National Mortgage Association, 0.00% to 8.20%, due 1/12/07 to 11/15/30; Tennessee Valley Authority, 5.38% to 6.75%, due 11/13/08 to 4/1/36, which had a total value of $1,894,142,869. The investment in the repurchase agreement is through participation in a joint account with affiliated parties pursuant to exemptive relief received by the Portfolio from the SEC.
(h) Variable/Floating Rate Security — interest rate changes on these instruments are based on changes in a designated base rate. The rates shown are those in effect on December 31, 2006.
(n) Step Bond — coupon rate increases in increments to maturity. Rate disclosed is as of December 31, 2006. Maturity date disclosed is the ultimate maturity date.
@ Face Amount/Value is less than $500.
BRL Brazilian Real
MXN Mexican Peso
Futures Contracts:
The Portfolio had the following futures contract(s) open at period end:
|
| Number |
| Value |
| Expiration |
| Net |
| ||
Short: |
|
|
|
|
|
|
|
|
| ||
2 Year U.S. Treasury Notes |
| 1 |
| $ | 204 |
| Mar-07 |
| $ | @— |
|
The accompanying notes are an integral part of the financial statements.
131
2006 Annual Report |
|
|
|
December 31, 2006 |
|
Statements of Assets and Liabilities
|
| Active |
|
|
|
|
|
|
| ||||
|
| International |
| Emerging |
| Global |
| Global |
| ||||
|
| Allocation |
| Markets |
| Franchise |
| Real Estate |
| ||||
|
| Portfolio |
| Portfolio |
| Portfolio |
| Portfolio |
| ||||
|
| (000) |
| (000) |
| (000) |
| (000) |
| ||||
Assets: |
|
|
|
|
|
|
|
|
| ||||
Investments in Securities of Unaffiliated Issuers, at Cost: |
| $ | 841,941 |
| $ | 1,838,693 |
| $ | 98,466 |
| $ | 219,068 |
|
Investment in Security of Affiliated Issuer, at Cost: |
| — |
| 3,415 |
| — |
| — |
| ||||
Foreign Currency, at Cost: |
| 264 |
| 931 |
| 98 |
| 7,607 |
| ||||
Investments in Securities of Unaffiliated Issuers, at Value:(1) |
| 1,090,522 |
| 2,576,971 |
| 133,211 |
| 245,176 |
| ||||
Investment in Security of Affiliated Issuer, at Value: |
| — |
| 16,810 |
| — |
| — |
| ||||
Foreign Currency, at Value: |
| 266 |
| 941 |
| 97 |
| 7,639 |
| ||||
Cash |
| — |
| 65 |
| @— |
| @— |
| ||||
Due from Broker |
| 19,462 |
| — |
| — |
| — |
| ||||
Receivable for Portfolio Shares Sold |
| 959 |
| 708 |
| — |
| 1,084 |
| ||||
Receivable for Investments Sold |
| — |
| 13,014 |
| 38 |
| 103 |
| ||||
Unrealized Appreciation on Foreign Currency Exchange Contracts |
| 3,048 |
| 9 |
| — |
| 15 |
| ||||
Foreign Withholding Tax Reclaim Receivable |
| 37 |
| 536 |
| 72 |
| — |
| ||||
Dividends Receivable |
| 928 |
| 3,028 |
| 164 |
| 889 |
| ||||
Interest Receivable |
| 35 |
| 27 |
| 2 |
| 6 |
| ||||
Other Assets |
| 14 |
| 29 |
| 2 |
| — |
| ||||
Total Assets |
| 1,115,271 |
| 2,612,138 |
| 133,586 |
| 254,912 |
| ||||
Liabilities: |
|
|
|
|
|
|
|
|
| ||||
Collateral on Securities Loaned, at Value: |
| 127,541 |
| 160,824 |
| — |
| — |
| ||||
Unrealized Depreciation on Foreign Currency Exchange Contracts |
| 1,238 |
| 2,354 |
| 696 |
| 29 |
| ||||
Payable for Investments Purchased |
| 2,537 |
| 14,238 |
| — |
| 15,432 |
| ||||
Payable for Portfolio Shares Redeemed |
| 10,702 |
| 16,452 |
| — |
| 230 |
| ||||
Investment Advisory Fees Payable |
| 1,498 |
| 6,548 |
| 266 |
| 358 |
| ||||
Bank Overdraft Payable |
| 572 |
| — |
| — |
| — |
| ||||
Payable for Administration Fees |
| 66 |
| 159 |
| 9 |
| 14 |
| ||||
Payable for Custodian Fees |
| 71 |
| 531 |
| 10 |
| 55 |
| ||||
Directors’ Fees and Expenses Payable |
| 14 |
| 57 |
| @— |
| @— |
| ||||
Deferred Capital Gain Country Tax |
| — |
| 808 |
| — |
| — |
| ||||
Distribution Fees — Class B |
| 1 |
| 26 |
| 1 |
| @— |
| ||||
Other Liabilities |
| 97 |
| 156 |
| 35 |
| 31 |
| ||||
Total Liabilities |
| 144,337 |
| 202,153 |
| 1,017 |
| 16,149 |
| ||||
Net Assets |
| $ | 970,934 |
| $ | 2,409,985 |
| $ | 132,569 |
| $ | 238,763 |
|
Net Assets Consist Of: |
|
|
|
|
|
|
|
|
| ||||
Paid-in Capital |
| $ | 738,732 |
| $ | 1,618,922 |
| $ | 95,596 |
| $ | 213,306 |
|
Undistributed (Distributions in Excess of) Net Investment Income |
| 775 |
| (14,608 | ) | 228 |
| (1,309 | ) | ||||
Accumulated Net Realized Gain (Loss) |
| (21,263 | ) | 57,185 |
| 2,687 |
| 665 |
| ||||
Unrealized Appreciation (Depreciation) on: |
|
|
|
|
|
|
|
|
| ||||
Investments |
| 248,581 |
| 750,758 | * | 34,745 |
| 26,108 |
| ||||
Foreign Currency Exchange Contracts and Translations |
| 1,825 |
| (2,272 | ) | (687 | ) | (7 | ) | ||||
Futures Contracts |
| 2,284 |
| — |
| — |
| — |
| ||||
Net Assets |
| $ | 970,934 |
| $ | 2,409,985 |
| $ | 132,569 |
| $ | 238,763 |
|
CLASS A: |
|
|
|
|
|
|
|
|
| ||||
Net Assets |
| $ | 967,361 |
| $ | 2,283,535 |
| $ | 128,434 |
| $ | 238,647 |
|
Shares Outstanding $0.001 par value shares of beneficial interest (500,000,000 shares authorized) (not in 000’s) |
| 64,047,081 |
| 77,958,878 |
| 7,143,975 |
| 20,638,457 |
| ||||
Net Asset Value, Offering and Redemption Price Per Share |
| $ | 15.10 |
| $ | 29.29 |
| $ | 17.98 |
| $ | 11.56 |
|
CLASS B: |
|
|
|
|
|
|
|
|
| ||||
Net Assets |
| $ | 3,573 |
| $ | 126,450 |
| $ | 4,135 |
| $ | 116 |
|
Shares Outstanding $0.001 par value shares of beneficial interest (500,000,000 shares authorized) (not in 000’s) |
| 232,554 |
| 4,373,962 |
| 231,980 |
| 10,000 |
| ||||
Net Asset Value, Offering and Redemption Price Per Share |
| $ | 15.36 |
| $ | 28.91 |
| $ | 17.82 |
| $ | 11.56 |
|
|
| ||||||||||||
| |||||||||||||
(1) Including: |
|
|
|
|
|
|
|
|
| ||||
Repurchase Agreements, at Value: |
| $ | 79,856 |
| $ | 62,734 |
| $ | 5,286 |
| $ | 14,015 |
|
Securities on Loan, at Value: |
| 121,642 |
| 152,940 |
| — |
| — |
| ||||
@ Amount is less than $500.
* Net of $915 Deferred Capital Gain Country Tax.
The accompanying notes are an integral part of the financial statements.
132
| 2006 Annual Report |
|
|
| December 31, 2006 |
Statements of Assets and Liabilities
|
| Global Value |
| International |
| International |
| International |
| ||||
|
| Equity |
| Equity |
| Growth Equity |
| Magnum |
| ||||
|
| Portfolio |
| Portfolio |
| Portfolio |
| Portfolio |
| ||||
|
| (000) |
| (000) |
| (000) |
| (000) |
| ||||
Assets: |
|
|
|
|
|
|
|
|
| ||||
Investments in Securities of Unaffiliated Issuers, at Cost: |
| $ | 106,660 |
| $ | 6,031,995 |
| $ | 5,726 |
| $ | 105,400 |
|
Foreign Currency, at Cost: |
| 103 |
| 4,806 |
| 15 |
| 692 |
| ||||
Investments in Securities of Unaffiliated Issuers, at Value:(1) |
| 137,099 |
| 7,629,573 |
| 7,072 |
| 127,665 |
| ||||
Foreign Currency, at Value: |
| 103 |
| 4,819 |
| 15 |
| 696 |
| ||||
Cash |
| 9 |
| @— |
| — |
| — |
| ||||
Due from Advisor |
| — |
| — |
| 25 |
| — |
| ||||
Due from Broker |
| — |
| — |
| — |
| 692 |
| ||||
Receivable for Portfolio Shares Sold |
| @— |
| 3,042 |
| — |
| 56 |
| ||||
Receivable for Investments Sold |
| — |
| 170,517 |
| — |
| — |
| ||||
Unrealized Appreciation on Foreign Currency Exchange Contracts |
| 24 |
| 5,858 |
| — |
| 102 |
| ||||
Foreign Withholding Tax Reclaim Receivable |
| 18 |
| 285 |
| 5 |
| 18 |
| ||||
Dividends Receivable |
| 164 |
| 5,242 |
| 3 |
| 48 |
| ||||
Interest Receivable |
| 1 |
| 44 |
| — |
| — |
| ||||
Other Assets |
| 2 |
| 117 |
| — |
| 2 |
| ||||
Total Assets |
| 137,420 |
| 7,819,497 |
| 7,120 |
| 129,279 |
| ||||
Liabilities: |
|
|
|
|
|
|
|
|
| ||||
Collateral on Securities Loaned, at Value: |
| 8,207 |
| 635,463 |
| — |
| 10,309 |
| ||||
Unrealized Depreciation on Foreign Currency Exchange Contracts |
| — |
| 13,677 |
| — |
| 157 |
| ||||
Payable for Investments Purchased |
| — |
| 820 |
| — |
| — |
| ||||
Bank Overdraft Payable |
| — |
| — |
| 13 |
| 192 |
| ||||
Payable for Portfolio Shares Redeemed |
| — |
| 99,392 |
| — |
| 109 |
| ||||
Investment Advisory Fees Payable |
| 213 |
| 14,381 |
| — |
| 211 |
| ||||
Payable for Administration Fees |
| 9 |
| 492 |
| @— |
| 8 |
| ||||
Payable for Custodian Fees |
| 11 |
| 510 |
| 6 |
| 20 |
| ||||
Directors’ Fees and Expenses Payable |
| 7 |
| 164 |
| — |
| 8 |
| ||||
Distribution Fees — Class B |
| 6 |
| 251 |
| @— |
| @— |
| ||||
Other Liabilities |
| 31 |
| 619 |
| 23 |
| 45 |
| ||||
Total Liabilities |
| 8,484 |
| 765,769 |
| 42 |
| 11,059 |
| ||||
Net Assets |
| $ | 128,936 |
| $ | 7,053,728 |
| $ | 7,078 |
| $ | 118,220 |
|
Net Assets Consist Of: |
|
|
|
|
|
|
|
|
| ||||
Paid-in Capital |
| $ | 99,212 |
| $ | 5,340,707 |
| $ | 5,689 |
| $ | 95,321 |
|
Undistributed (Distributions in Excess of) Net Investment Income |
| (32 | ) | (4,528 | ) | (4 | ) | 123 |
| ||||
Accumulated Net Realized Gain (Loss) |
| (709 | ) | 127,318 |
| 47 |
| 562 |
| ||||
Unrealized Appreciation (Depreciation) on: |
|
|
|
|
|
|
|
|
| ||||
Investments |
| 30,439 |
| 1,597,578 |
| 1,346 |
| 22,265 |
| ||||
Foreign Currency Exchange Contracts and Translations |
| 26 |
| (7,347 | ) | @— |
| (51 | ) | ||||
Net Assets |
| $ | 128,936 |
| $ | 7,053,728 |
| $ | 7,078 |
| $ | 118,220 |
|
CLASS A: |
|
|
|
|
|
|
|
|
| ||||
Net Assets |
| $ | 101,163 |
| $ | 5,900,906 |
| $ | 6,753 |
| $ | 116,443 |
|
Shares Outstanding $0.001 par value shares of beneficial interest (500,000,000 shares authorized) (not in 000’s) |
| 4,998,813 |
| 286,720,707 |
| 538,241 |
| 8,286,195 |
| ||||
Net Asset Value, Offering and Redemption Price Per Share |
| $ | 20.24 |
| $ | 20.58 |
| $ | 12.55 |
| $ | 14.05 |
|
CLASS B: |
|
|
|
|
|
|
|
|
| ||||
Net Assets |
| $ | 27,773 |
| $ | 1,152,822 |
| $ | 325 |
| $ | 1,777 |
|
Shares Outstanding $0.001 par value shares of beneficial interest (500,000,000 shares authorized) (not in 000’s) |
| 1,386,568 |
| 56,512,522 |
| 25,845 |
| 126,845 |
| ||||
Net Asset Value, Offering and Redemption Price Per Share |
| $ | 20.03 |
| $ | 20.40 |
| $ | 12.56 |
| $ | 14.01 |
|
|
| ||||||||||||
(1) Including: |
|
|
|
|
|
|
|
|
| ||||
Repurchase Agreements, at Value: |
| $ | 2,122 |
| $ | 100,756 |
| $ | — |
| $ | — |
|
Securities on Loan, at Value: |
| 7,841 |
| 603,724 |
| — |
| 9,829 |
| ||||
@ Amount is less than $500.
The accompanying notes are an integral part of the financial statements.
133
2006 Annual Report |
|
|
|
December 31, 2006 |
|
Statements of Assets and Liabilities
|
| International |
| International |
| Focus |
| Large Cap |
| ||||
|
| Real Estate |
| Small Cap |
| Equity |
| Relative Value |
| ||||
|
| Portfolio |
| Portfolio |
| Portfolio |
| Portfolio |
| ||||
|
| (000) |
| (000) |
| (000) |
| (000) |
| ||||
Assets: |
|
|
|
|
|
|
|
|
| ||||
Investments in Securities of Unaffiliated Issuers, at Cost: |
| $ | 948,870 |
| $ | 984,997 |
| $ | 13,611 |
| $ | 232,810 |
|
Foreign Currency, at Cost: |
| 585 |
| (316 | ) | — |
| — |
| ||||
Investments in Securities of Unaffiliated Issuers, at Value:(1) |
| 1,222,184 |
| 1,294,901 |
| 14,898 |
| 275,328 |
| ||||
Foreign Currency, at Value: |
| 587 |
| — |
| — |
| — |
| ||||
Cash |
| @— |
| @— |
| 1 |
| 140 |
| ||||
Receivable for Portfolio Shares Sold |
| 8,009 |
| 400 |
| 1 |
| 2 |
| ||||
Receivable for Investments Sold |
| 1,032 |
| 19,848 |
| — |
| — |
| ||||
Unrealized Appreciation on Foreign Currency Exchange Contracts |
| @— |
| 9 |
| — |
| — |
| ||||
Foreign Withholding Tax Reclaim Receivable |
| 138 |
| 598 |
| — |
| — |
| ||||
Dividends Receivable |
| 1,964 |
| 2,518 |
| 2 |
| 271 |
| ||||
Interest Receivable |
| 26 |
| 1 |
| @— |
| 4 |
| ||||
Other Assets |
| 9 |
| 21 |
| 1 |
| 4 |
| ||||
Total Assets |
| 1,233,949 |
| 1,318,296 |
| 14,903 |
| 275,749 |
| ||||
Liabilities: |
|
|
|
|
|
|
|
|
| ||||
Unrealized Depreciation on Foreign Currency Exchange Contracts |
| @— |
| 29 |
| — |
| — |
| ||||
Payable for Investments Purchased |
| 8,067 |
| 26 |
| — |
| 127 |
| ||||
Payable for Portfolio Shares Redeemed |
| 170 |
| 2,322 |
| 84 |
| 5 |
| ||||
Foreign Currency Overdraft Payable |
| — |
| 316 |
| — |
| — |
| ||||
Investment Advisory Fees Payable |
| 1,988 |
| 3,189 |
| 51 |
| 317 |
| ||||
Payable for Administration Fees |
| 77 |
| 92 |
| 1 |
| 19 |
| ||||
Payable for Custodian Fees |
| 68 |
| 125 |
| 3 |
| 7 |
| ||||
Directors’ Fees and Expenses Payable |
| 1 |
| 15 |
| 6 |
| 17 |
| ||||
Distribution Fees — Class B |
| 18 |
| — |
| 1 |
| 13 |
| ||||
Other Liabilities |
| 40 |
| 118 |
| 24 |
| 40 |
| ||||
Total Liabilities |
| 10,429 |
| 6,232 |
| 170 |
| 545 |
| ||||
Net Assets |
| $ | 1,223,520 |
| $ | 1,312,064 |
| $ | 14,733 |
| $ | 275,204 |
|
Net Assets Consist Of: |
|
|
|
|
|
|
|
|
| ||||
Paid-in Capital |
| $ | 958,938 |
| $ | 983,084 |
| $ | 31,012 |
| $ | 280,692 |
|
Undistributed (Distributions in Excess of) Net Investment Income |
| (14,871 | ) | (5,572 | ) | — |
| (21 | ) | ||||
Accumulated Net Investment Loss |
| — |
| — |
| (7 | ) | — |
| ||||
Accumulated Net Realized Gain (Loss) |
| 6,127 |
| 24,566 |
| (17,559 | ) | (47,985 | ) | ||||
Unrealized Appreciation (Depreciation) on: |
|
|
|
|
|
|
|
|
| ||||
Investments |
| 273,314 |
| 309,904 |
| 1,287 |
| 42,518 |
| ||||
Foreign Currency Exchange Contracts and Translations |
| 12 |
| 82 |
| — |
| — |
| ||||
Net Assets |
| $ | 1,223,520 |
| $ | 1,312,064 |
| $ | 14,733 |
| $ | 275,204 |
|
CLASS A: |
|
|
|
|
|
|
|
|
| ||||
Net Assets |
| $ | 1,125,569 |
| $ | 1,312,064 |
| $ | 12,416 |
| $ | 211,904 |
|
Shares Outstanding $0.001 par value shares of beneficial interest (500,000,000 shares authorized) (not in 000’s) |
| 32,320,810 |
| 55,316,667 |
| 817,581 |
| 17,375,774 |
| ||||
Net Asset Value, Offering and Redemption Price Per Share |
| $ | 34.82 |
| $ | 23.72 |
| $ | 15.19 |
| $ | 12.20 |
|
CLASS B: |
|
|
|
|
|
|
|
|
| ||||
Net Assets |
| $ | 97,951 |
| $ | — |
| $ | 2,317 |
| $ | 63,300 |
|
Shares Outstanding $0.001 par value shares of beneficial interest (500,000,000 shares authorized) (not in 000’s) |
| 2,811,956 |
| — |
| 156,487 |
| 5,195,776 |
| ||||
Net Asset Value, Offering and Redemption Price Per Share |
| $ | 34.83 |
| $ | — |
| $ | 14.81 |
| $ | 12.18 |
|
|
|
|
|
|
|
|
|
|
| ||||
(1) Including: |
|
|
|
|
|
|
|
|
| ||||
Repurchase Agreements, at Value: |
| $ | 59,713 |
| $ | 974 |
| $ | 128 |
| $ | 9,148 |
|
@ Amount is less than $500.
The accompanying notes are an integral part of the financial statements.
134
| 2006 Annual Report |
|
|
| December 31, 2006 |
Statements of Assets and Liabilities
|
| Small |
| Systematic |
| Systematic |
| Systematic |
| ||||
|
| Company |
| Active Large |
| Active Small |
| Active Small |
| ||||
|
| Growth |
| Cap Core |
| Cap Core |
| Cap Growth |
| ||||
|
| Portfolio |
| Portfolio |
| Portfolio |
| Portfolio |
| ||||
|
| (000) |
| (000) |
| (000) |
| (000) |
| ||||
Assets: |
|
|
|
|
|
|
|
|
| ||||
Investments in Securities of Unaffiliated Issuers, at Cost: |
| $ | 1,624,868 |
| $ | 6,400 |
| $ | 8,762 |
| $ | 9,715 |
|
Investments in Securities of Unaffiliated Issuers, at Value:(1) |
| 1,891,713 |
| 6,849 |
| 8,883 |
| 9,748 |
| ||||
Cash |
| @— |
| — |
| @— |
| @— |
| ||||
Due from Adviser |
| — |
| 16 |
| 6 |
| 14 |
| ||||
Receivable for Portfolio Shares Sold |
| 1,267 |
| — |
| — |
| — |
| ||||
Receivable for Investments Sold |
| 22,690 |
| 12 |
| 819 |
| 925 |
| ||||
Dividends Receivable |
| 32 |
| 5 |
| 9 |
| 2 |
| ||||
Interest Receivable |
| 18 |
| @— |
| @— |
| @— |
| ||||
Other Assets |
| 25 |
| — |
| — |
| — |
| ||||
Total Assets |
| 1,915,745 |
| 6,882 |
| 9,717 |
| 10,689 |
| ||||
Liabilities: |
|
|
|
|
|
|
|
|
| ||||
Collateral on Securities Loaned, at Value: |
| — |
| 421 |
| 1,834 |
| 2,174 |
| ||||
Due to Broker |
| — |
| 1 |
| 1 |
| @— |
| ||||
Payable for Investments Purchased |
| 17,357 |
| — |
| 1,292 |
| 1,734 |
| ||||
Payable for Portfolio Shares Redeemed |
| 8,390 |
| — |
| — |
| — |
| ||||
Bank Overdraft Payable |
| — |
| 4 |
| — |
| — |
| ||||
Investment Advisory Fees Payable |
| 4,168 |
| — |
| — |
| — |
| ||||
Payable for Administration Fees |
| 129 |
| 1 |
| @— |
| @— |
| ||||
Payable for Custodian Fees |
| 20 |
| 2 |
| 4 |
| 5 |
| ||||
Directors’ Fees and Expenses Payable |
| 10 |
| @— |
| @— |
| @— |
| ||||
Distribution Fees — Class B |
| 184 |
| @— |
| @— |
| @— |
| ||||
Other Liabilities |
| 182 |
| 38 |
| 32 |
| 32 |
| ||||
Total Liabilities |
| 30,440 |
| 467 |
| 3,163 |
| 3,945 |
| ||||
Net Assets |
| $ | 1,885,305 |
| $ | 6,415 |
| $ | 6,554 |
| $ | 6,744 |
|
Net Assets Consist Of: |
|
|
|
|
|
|
|
|
| ||||
Paid-in Capital |
| $ | 1,626,071 |
| $ | 5,998 |
| $ | 6,598 |
| $ | 6,894 |
|
Undistributed (Distributions in Excess of) Net Investment Income |
| — |
| 2 |
| 2 |
| — |
| ||||
Accumulated Net Investment Loss |
| (14 | ) | — |
| — |
| — |
| ||||
Accumulated Net RealizedGain (Loss) |
| (7,597 | ) | (34 | ) | (166 | ) | (183 | ) | ||||
Unrealized Appreciation (Depreciation) on: |
|
|
|
|
|
|
|
|
| ||||
Investments |
| 266,845 |
| 449 |
| 121 |
| 33 |
| ||||
Futures Contracts |
| — |
| @— |
| (1 | ) | — |
| ||||
Net Assets |
| $ | 1,885,305 |
| $ | 6,415 |
| $ | 6,554 |
| $ | 6,744 |
|
CLASS A: |
|
|
|
|
|
|
|
|
| ||||
Net Assets |
| $ | 1,028,030 |
| $ | 6,308 |
| $ | 6,455 |
| $ | 6,646 |
|
Shares Outstanding $0.001 par value shares of beneficial interest (500,000,000 shares authorized) (not in 000’s) |
| 77,248,918 |
| 590,000 |
| 650,000 |
| 680,000 |
| ||||
Net Asset Value, Offering and Redemption Price Per Share |
| $ | 13.31 |
| $ | 10.69 |
| $ | 9.93 |
| $ | 9.77 |
|
CLASS B: |
|
|
|
|
|
|
|
|
| ||||
Net Assets |
| $ | 857,275 |
| $ | 107 |
| $ | 99 |
| $ | 98 |
|
Shares Outstanding $0.001 par value shares of beneficial interest (500,000,000 shares authorized) (not in 000’s) |
| 67,894,628 |
| 10,000 |
| 10,000 |
| 10,000 |
| ||||
Net Asset Value, Offering and Redemption Price Per Share |
| $ | 12.63 |
| $ | 10.69 |
| $ | 9.93 |
| $ | 9.76 |
|
|
|
|
|
|
|
|
|
|
| ||||
(1) Including: |
|
|
|
|
|
|
|
|
| ||||
Repurchase Agreements, at Value: |
| $ | 40,972 |
| $ | 345 |
| $ | 537 |
| $ | 882 |
|
Securities on Loan, at Value: |
| — |
| 412 |
| 1,771 |
| 2,103 |
| ||||
@ Amount is less than $500.
The accompanying notes are an integral part of the financial statements.
135
2006 Annual Report |
|
|
|
December 31, 2006 |
|
Statements of Assets and Liabilities
|
| Systematic |
|
|
|
|
|
|
| ||||
|
| Active Small |
| U.S. Large |
| U.S. Real |
| Emerging |
| ||||
|
| Cap Value |
| Cap Growth |
| Estate |
| Markets Debt |
| ||||
|
| Portfolio |
| Portfolio |
| Portfolio |
| Portfolio |
| ||||
|
| (000) |
| (000) |
| (000) |
| (000) |
| ||||
Assets: |
|
|
|
|
|
|
|
|
| ||||
Investments in Securities of Unaffiliated Issuers, at Cost: |
| $ | 9,137 |
| $ | 919,233 |
| $ | 1,173,644 |
| $ | 88,774 |
|
Foreign Currency, at Cost: |
| — |
| — |
| — |
| 13 |
| ||||
Investments in Securities of Unaffiliated Issuers, at Value:(1) |
| 9,387 |
| 1,071,433 |
| 1,905,993 |
| 93,881 |
| ||||
Foreign Currency, at Value: |
| — |
| — |
| — |
| 15 |
| ||||
Cash |
| 1 |
| @— |
| 625 |
| 1 |
| ||||
Due from Adviser |
| 4 |
| — |
| — |
| — |
| ||||
Due from Broker |
| — |
| — |
| — |
| 65 |
| ||||
Receivable for Portfolio Shares Sold |
| — |
| 400 |
| 3,720 |
| — |
| ||||
Receivable for Investments Sold |
| 1,290 |
| — |
| 2,564 |
| 488 |
| ||||
Dividends Receivable |
| 13 |
| 163 |
| 10,700 |
| — |
| ||||
Interest Receivable |
| @— |
| 10 |
| 20 |
| 1,280 |
| ||||
Other Assets |
| — |
| 17 |
| 26 |
| 1 |
| ||||
Total Assets |
| 10,695 |
| 1,072,023 |
| 1,923,648 |
| 95,731 |
| ||||
Liabilities: |
|
|
|
|
|
|
|
|
| ||||
Collateral on Securities Loaned, at Value: |
| 2,240 |
| — |
| — |
| 13,773 |
| ||||
Due to Broker |
| @— |
| — |
| — |
| — |
| ||||
Payable for Investments Purchased |
| 1,474 |
| — |
| 10,368 |
| — |
| ||||
Payable for Portfolio Shares Redeemed |
| — |
| 371 |
| 5,056 |
| — |
| ||||
Bank Overdraft Payable |
| @— |
| — |
| — |
| — |
| ||||
Investment Advisory Fees Payable |
| — |
| 1,323 |
| 3,382 |
| 127 |
| ||||
Payable for Administration Fees |
| 1 |
| 73 |
| 129 |
| 6 |
| ||||
Payable for Custodian Fees |
| 3 |
| 12 |
| 21 |
| 5 |
| ||||
Directors’ Fees and Expenses Payable |
| @— |
| 38 |
| 17 |
| 5 |
| ||||
Distribution Fees — Class B |
| @— |
| 12 |
| 57 |
| @— |
| ||||
Other Liabilities |
| 32 |
| 88 |
| 155 |
| 38 |
| ||||
Total Liabilities |
| 3,750 |
| 1,917 |
| 19,185 |
| 13,954 |
| ||||
Net Assets |
| $ | 6,945 |
| $ | 1,070,106 |
| $ | 1,904,463 |
| $ | 81,777 |
|
Net Assets Consist Of: |
|
|
|
|
|
|
|
|
| ||||
Paid-in Capital |
| $ | 6,698 |
| $ | 989,271 |
| $ | 1,135,270 |
| $ | 88,288 |
|
Undistributed (Distributions in Excess of) Net Investment Income |
| 2 |
| (43 | ) | (2,899 | ) | (1,051 | ) | ||||
Accumulated Net Realized Gain (Loss) |
| (5 | ) | (71,322 | ) | 39,743 |
| (10,569 | ) | ||||
Unrealized Appreciation (Depreciation) on: |
|
|
|
|
|
|
|
|
| ||||
Investments |
| 250 |
| 152,200 |
| 732,349 |
| 5,107 |
| ||||
Foreign Currency Exchange Contracts and Translations |
| — |
| — |
| @— |
| 2 |
| ||||
Futures Contracts |
| — |
| — |
| — |
| @— |
| ||||
Net Assets |
| $ | 6,945 |
| $ | 1,070,106 |
| $ | 1,904,463 |
| $ | 81,777 |
|
CLASS A: |
|
|
|
|
|
|
|
|
| ||||
Net Assets |
| $ | 6,841 |
| $ | 1,012,417 |
| $ | 1,635,926 |
| $ | 81,212 |
|
Shares Outstanding $0.001† par value shares of beneficial interest (500,000,000 shares authorized) (not in 000’s) |
| 660,000 |
| 49,920,673 |
| 57,933,827 |
| 6,773,827 |
| ||||
Net Asset Value, Offering and Redemption Price Per Share |
| $ | 10.37 |
| $ | 20.28 |
| $ | 28.24 |
| $ | 11.99 |
|
CLASS B: |
|
|
|
|
|
|
|
|
| ||||
Net Assets |
| $ | 104 |
| $ | 57,689 |
| $ | 268,537 |
| $ | 565 |
|
Shares Outstanding $0.001† par value shares of beneficial interest (500,000,000 shares authorized) (not in 000’s) |
| 10,000 |
| 2,891,621 |
| 9,605,024 |
| 46,006 |
| ||||
Net Asset Value, Offering and Redemption Price Per Share |
| $ | 10.36 |
| $ | 19.95 |
| $ | 27.96 |
| $ | 12.29 |
|
|
|
|
|
|
|
|
|
|
| ||||
(1) Including: |
|
|
|
|
|
|
|
|
| ||||
Repurchase Agreements, at Value: |
| $ | 219 |
| $ | 22,638 |
| $ | 46,852 |
| $ | 630 |
|
Securities on Loan, at Value: |
| 2,167 |
| — |
| — |
| 13,206 |
| ||||
@ Amount is less than $500.
† $0.003 par value shares of beneficial interest for Emerging Markets Debt Portfolio.
The accompanying notes are an integral part of the financial statements.
136
| 2006 Annual Report |
|
|
| December 31, 2006 |
Statements of Operations
For the Year Ended December 31, 2006
|
| Active |
|
|
|
|
|
|
|
|
| |||||
|
| International |
| Emerging |
| Global |
| Global |
| Global |
| |||||
|
| Allocation |
| Markets |
| Franchise |
| Real Estate |
| Value Equity |
| |||||
|
| Portfolio |
| Portfolio |
| Portfolio |
| Portfolio^ |
| Portfolio |
| |||||
|
| (000) |
| (000) |
| (000) |
| (000) |
| (000) |
| |||||
Investment Income: |
|
|
|
|
|
|
|
|
|
|
| |||||
Dividends from Securities of Unaffiliated Issuers |
| $ | 21,358 |
| $ | 40,579 |
| $ | 3,311 |
| $ | 1,357 |
| $ | 2,948 |
|
Dividends from Security of Affiliated Issuers |
| — |
| 763 |
| — |
| — |
| — |
| |||||
Interest |
| 4,750 |
| 4,323 |
| 261 |
| 183 |
| 198 |
| |||||
Less: Foreign Taxes Withheld |
| (1,489 | ) | (2,760 | ) | (134 | ) | (66 | ) | (120 | ) | |||||
Total Investment Income |
| 24,619 |
| 42,905 |
| 3,438 |
| 1,474 |
| 3,026 |
| |||||
Expenses: |
|
|
|
|
|
|
|
|
|
|
| |||||
Investment Advisory Fees (Note B) |
| 5,731 |
| 25,072 |
| 1,003 |
| 486 |
| 773 |
| |||||
Administration Fees (Note C) |
| 705 |
| 1,691 |
| 100 |
| 46 |
| 92 |
| |||||
Custodian Fees (Note E) |
| 327 |
| 2,197 |
| 45 |
| 76 |
| 51 |
| |||||
Directors’ Fees and Expenses |
| 14 |
| 37 |
| 2 |
| 1 |
| 2 |
| |||||
Professional Fees |
| 68 |
| 150 |
| 34 |
| 30 |
| 36 |
| |||||
Bank Overdraft Expense |
| 5 |
| 34 |
| 4 |
| — |
| — |
| |||||
Shareholder Reporting Fees |
| 162 |
| 217 |
| 29 |
| 11 |
| 34 |
| |||||
Distribution Fees — Class B (Note D) |
| 11 |
| 332 |
| 11 |
| @— |
| 59 |
| |||||
Country Tax Expense |
| 1 |
| 2 |
| — |
| — |
| — |
| |||||
Other Expenses |
| 183 |
| 237 |
| 48 |
| 8 |
| 61 |
| |||||
Total Expenses |
| 7,207 |
| 29,969 |
| 1,276 |
| 658 |
| 1,108 |
| |||||
Voluntary Waiver of Investment Advisory Fees (Note B) |
| (128 | ) | — |
| (4 | ) | (57 | ) | — |
| |||||
Expense Offset (Note E) |
| (5 | ) | (7 | ) | (2 | ) | @— |
| @— |
| |||||
Net Expenses |
| 7,074 |
| 29,962 |
| 1,270 |
| 601 |
| 1,108 |
| |||||
Net Investment Income (Loss) |
| 17,545 |
| 12,943 |
| 2,168 |
| 873 |
| 1,918 |
| |||||
Realized Gain (Loss): |
|
|
|
|
|
|
|
|
|
|
| |||||
Investments Sold |
| 33,978 |
| 405,492 | * | 9,291 |
| 1,259 |
| 6,669 |
| |||||
Foreign Currency Transactions |
| 5,445 |
| 1,862 |
| (1,086 | ) | (49 | ) | 63 |
| |||||
Futures Contracts |
| 8,605 |
| — |
| — |
| — |
| — |
| |||||
Net Realized Gain (Loss) |
| 48,028 |
| 407,354 |
| 8,205 |
| 1,210 |
| 6,732 |
| |||||
Change in Unrealized Appreciation(Depreciation): |
|
|
|
|
|
|
|
|
|
|
| |||||
Investments |
| 121,781 |
| 244,450 | ** | 14,699 |
| 26,108 |
| 14,293 |
| |||||
Foreign Currency Exchange Contracts and Translations |
| 4,024 |
| 105 |
| (1,061 | ) | (7 | ) | 29 |
| |||||
Futures Contracts |
| 987 |
| — |
| — |
| — |
| — |
| |||||
Net Change in Unrealized Appreciation (Depreciation) |
| 126,792 |
| 244,555 |
| 13,638 |
| 26,101 |
| 14,322 |
| |||||
Total Net Realized Gain (Loss) and Change in Unrealized Appreciation (Depreciation) |
| 174,820 |
| 651,909 |
| 21,843 |
| 27,311 |
| 21,054 |
| |||||
Net Increase (Decrease) in Net Assets Resulting from Operations |
| $ | 192,365 |
| $ | 664,852 |
| $ | 24,011 |
| $ | 28,184 |
| $ | 22,972 |
|
^ For the period from August 30, 2006 (commencement of operations) to December 31, 2006.
@ Amount is less than $500.
* Net of Capital Gain Country Tax of $130.
** Net of increase in Deferred Capital Gain Country Tax Accrual of $143.
The accompanying notes are an integral part of the financial statements.
137
2006 Annual Report |
|
|
|
December 31, 2006 |
|
Statements of Operations
For the Year Ended December 31, 2006
|
| International |
| International |
| International |
| International |
| International |
| |||||
|
| Equity |
| Growth Equity |
| Magnum |
| Real Estate |
| Small Cap |
| |||||
|
| Portfolio |
| Portfolio |
| Portfolio |
| Portfolio |
| Portfolio |
| |||||
|
| (000) |
| (000) |
| (000) |
| (000) |
| (000) |
| |||||
Investment Income: |
|
|
|
|
|
|
|
|
|
|
| |||||
Dividends from Securities of Unaffiliated Issuers |
| $ | 287,660 |
| $ | 126 |
| $ | 2,536 |
| $ | 12,694 |
| $ | 34,713 |
|
Interest |
| 14,745 |
| 1 |
| 350 |
| 1,389 |
| 1,112 |
| |||||
Less: Foreign Taxes Withheld |
| (17,554 | ) | (11 | ) | (210 | ) | (972 | ) | (2,897 | ) | |||||
Total Investment Income |
| 284,851 |
| 116 |
| 2,676 |
| 13,111 |
| 32,928 |
| |||||
Expenses: |
|
|
|
|
|
|
|
|
|
|
| |||||
Investment Advisory Fees (Note B) |
| 59,516 |
| 46 |
| 902 |
| 4,897 |
| 13,312 |
| |||||
Administration Fees (Note C) |
| 5,951 |
| 5 |
| 90 |
| 490 |
| 1,121 |
| |||||
Custodian Fees (Note E) |
| 2,025 |
| 21 |
| 103 |
| 250 |
| 548 |
| |||||
Directors’ Fees and Expenses |
| 126 |
| @— |
| 2 |
| 7 |
| 22 |
| |||||
Bank Overdraft Expense |
| 14 |
| @— |
| 5 |
| 14 |
| 4 |
| |||||
Professional Fees |
| 259 |
| 59 |
| 31 |
| 35 |
| 82 |
| |||||
Shareholder Reporting Fees |
| 1,020 |
| 4 |
| 53 |
| 32 |
| 167 |
| |||||
Distribution Fees — Class B (Note D) |
| 3,012 |
| 1 |
| 5 |
| 82 |
| — |
| |||||
Other Expenses |
| 710 |
| 33 |
| 65 |
| 110 |
| 166 |
| |||||
Total Expenses |
| 72,633 |
| 169 |
| 1,256 |
| 5,917 |
| 15,422 |
| |||||
Voluntary Waiver of Investment Advisory Fees (Note B) |
| — |
| (46 | ) | (119 | ) | — |
| — |
| |||||
Reimbursement of Investment Advisory Fees (Note B) |
| — |
| (57 | ) | — |
| — |
| — |
| |||||
Expense Offset (Note E) |
| (6 | ) | (3 | ) | @— |
| (30 | ) | (1 | ) | |||||
Net Expenses |
| 72,627 |
| 63 |
| 1,137 |
| 5,887 |
| 15,421 |
| |||||
Net Investment Income (Loss) |
| 212,224 |
| 53 |
| 1,539 |
| 7,224 |
| 17,507 |
| |||||
Realized Gain (Loss): |
|
|
|
|
|
|
|
|
|
|
| |||||
Investments Sold |
| 1,072,677 |
| 82 |
| 18,812 |
| 42,087 |
| 204,314 |
| |||||
Foreign Currency Transactions |
| (38,098 | ) | (7 | ) | 1,273 |
| 415 |
| 7 |
| |||||
Futures Contracts |
| — |
| — |
| 535 |
| — |
| — |
| |||||
Net Realized Gain (Loss) |
| 1,034,579 |
| 75 |
| 20,620 |
| 42,502 |
| 204,321 |
| |||||
Change in Unrealized Appreciation(Depreciation): |
|
|
|
|
|
|
|
|
|
|
| |||||
Investments |
| 272,846 |
| 1,379 |
| 4,328 |
| 254,598 |
| 22,081 |
| |||||
Foreign Currency Exchange Contracts and Translations |
| (8,152 | ) | 3 |
| 186 |
| 29 |
| 115 |
| |||||
Futures Contracts |
| — |
| — |
| (199 | ) | — |
| — |
| |||||
Net Change in Unrealized Appreciation (Depreciation) |
| 264,694 |
| 1,382 |
| 4,315 |
| 254,627 |
| 22,196 |
| |||||
Total Net Realized Gain (Loss) and Change in Unrealized Appreciation (Depreciation) |
| 1,299,273 |
| 1,457 |
| 24,935 |
| 297,129 |
| 226,517 |
| |||||
Net Increase (Decrease) in Net Assets Resulting from Operations |
| $ | 1,511,497 |
| $ | 1,510 |
| $ | 26,474 |
| $ | 304,353 |
| $ | 244,024 |
|
@ Amount is less than $500.
The accompanying notes are an integral part of the financial statements.
138
| 2006 Annual Report |
|
|
| December 31, 2006 |
Statements of Operations
For the Year Ended December 31, 2006
|
|
|
| Large Cap |
| Small |
| Systematic |
| Systematic |
| |||||
|
| Focus |
| Relative |
| Company |
| Active Large |
| Active Small |
| |||||
|
| Equity |
| Value |
| Growth |
| Cap Core |
| Cap Core |
| |||||
|
| Portfolio |
| Portfolio |
| Portfolio |
| Portfolio^ |
| Portfolio^ |
| |||||
|
| (000) |
| (000) |
| (000) |
| (000) |
| (000) |
| |||||
Investment Income: |
|
|
|
|
|
|
|
|
|
|
| |||||
Dividends from Securities of Unaffiliated Issuers |
| $ | 267 |
| $ | 5,027 |
| $ | 6,281 |
| $ | 60 |
| $ | 49 |
|
Interest |
| 80 |
| 627 |
| 2,185 |
| 14 |
| 15 |
| |||||
Less: Foreign Taxes Withheld |
| (8 | ) | @— |
| — |
| @— |
| — |
| |||||
Total Investment Income |
| 339 |
| 5,654 |
| 8,466 |
| 74 |
| 64 |
| |||||
Expenses: |
|
|
|
|
|
|
|
|
|
|
| |||||
Investment Advisory Fees (Note B) |
| 300 |
| 1,141 |
| 16,580 |
| 14 |
| 31 |
| |||||
Administration Fees (Note C) |
| 48 |
| 189 |
| 1,513 |
| 3 |
| 3 |
| |||||
Custodian Fees (Note E) |
| 13 |
| 27 |
| 90 |
| 7 |
| 11 |
| |||||
Directors’ Fees and Expenses |
| 1 |
| 4 |
| 29 |
| @— |
| @— |
| |||||
Bank Overdraft Expense |
| @— |
| @— |
| 9 |
| — |
| — |
| |||||
Professional Fees |
| 39 |
| 42 |
| 79 |
| 27 |
| 27 |
| |||||
Shareholder Reporting Fees |
| 23 |
| 61 |
| 447 |
| 27 |
| 21 |
| |||||
Distribution Fees — Class B (Note D) |
| 24 |
| 154 |
| 2,178 |
| @— |
| @— |
| |||||
Other Expenses |
| 48 |
| 154 |
| 386 |
| 9 |
| 9 |
| |||||
Total Expenses |
| 496 |
| 1,772 |
| 21,311 |
| 87 |
| 102 |
| |||||
Voluntary Waiver of Investment Advisory Fees (Note B) |
| — |
| — |
| — |
| (14 | ) | (31 | ) | |||||
Reimbursement of Investment Advisory Fees (Note B) |
| — |
| — |
| — |
| (49 | ) | (26 | ) | |||||
Expense Offset (Note E) |
| @— |
| (1 | ) | (18 | ) | @— |
| @— |
| |||||
Net Expenses |
| 496 |
| 1,771 |
| 21,293 |
| 24 |
| 45 |
| |||||
Net Investment Income (Loss) |
| (157 | ) | 3,883 |
| (12,827 | ) | 50 |
| 19 |
| |||||
Realized Gain (Loss): |
|
|
|
|
|
|
|
|
|
|
| |||||
Investments Sold |
| 11,170 |
| 13,794 |
| 169,063 |
| (53 | ) | (178 | ) | |||||
Foreign Currency Transactions |
| — |
| 3 |
| — |
| — |
| — |
| |||||
Futures Contracts |
| — |
| — |
| — |
| 19 |
| 12 |
| |||||
Net Realized Gain (Loss) |
| 11,170 |
| 13,797 |
| 169,063 |
| (34 | ) | (166 | ) | |||||
Change in Unrealized Appreciation(Depreciation): |
|
|
|
|
|
|
|
|
|
|
| |||||
Investments |
| (10,424 | ) | 18,703 |
| 29,319 |
| 449 |
| 121 |
| |||||
Foreign Currency Exchange Contracts and Translations |
| — |
| — |
| — |
| — |
| — |
| |||||
Futures Contracts |
| — |
| — |
| — |
| @— |
| (1 | ) | |||||
Net Change in Unrealized Appreciation (Depreciation) |
| (10,424 | ) | 18,703 |
| 29,319 |
| 449 |
| 120 |
| |||||
Total Net Realized Gain (Loss) and Change in Unrealized Appreciation (Depreciation) |
| 746 |
| 32,500 |
| 198,382 |
| 415 |
| (46 | ) | |||||
Net Increase (Decrease) in Net Assets Resulting from Operations |
| $ | 589 |
| $ | 36,383 |
| $ | 185,555 |
| $ | 465 |
| $ | (27 | ) |
^ For the periodfrom April 28, 2006 (commencement of operations) to December 31, 2006.
@ Amount is less than $500.
The accompanying notes are an integral part of the financial statements.
139
2006 Annual Report |
|
|
|
December 31, 2006 |
|
Statements of Operations
For the Year Ended December 31, 2006
|
| Systematic |
| Systematic |
|
|
|
|
| Emerging |
| |||||
|
| Active Small |
| Active Small |
| U.S. Large |
| U.S. Real |
| Market |
| |||||
|
| Cap Growth |
| Cap Value |
| Cap Growth |
| Estate |
| Debt |
| |||||
|
| Portfolio^ |
| Portfolio^ |
| Portfolio |
| Portfolio |
| Portfolio |
| |||||
|
| (000) |
| (000) |
| (000) |
| (000) |
| (000) |
| |||||
Investment Income: |
|
|
|
|
|
|
|
|
|
|
| |||||
Dividends from Securities of Unaffiliated Issuers |
| $ | 18 |
| $ | 72 |
| $ | 5,589 |
| $ | 38,384 |
| $ | — |
|
Interest |
| 23 |
| 16 |
| 1,000 |
| 1,941 |
| 6,014 |
| |||||
Less: Foreign Taxes Withheld |
| — |
| @— |
| (100 | ) | (460 | ) | — |
| |||||
Total Investment Income |
| 41 |
| 88 |
| 6,489 |
| 39,865 |
| 6,014 |
| |||||
Expenses: |
|
|
|
|
|
|
|
|
|
|
| |||||
Investment Advisory Fees (Note B) |
| 32 |
| 33 |
| 4,894 |
| 12,233 |
| 641 |
| |||||
Administration Fees (Note C) |
| 3 |
| 3 |
| 784 |
| 1,312 |
| 68 |
| |||||
Custodian Fees (Note E) |
| 12 |
| 10 |
| 50 |
| 90 |
| 24 |
| |||||
Directors’ Fees and Expenses |
| @— |
| @— |
| 17 |
| 25 |
| 2 |
| |||||
Bank Overdraft Expense |
| — |
| — |
| 4 |
| 3 |
| 6 |
| |||||
Professional Fees |
| 27 |
| 27 |
| 57 |
| 67 |
| 75 |
| |||||
Shareholder Reporting Fees |
| 21 |
| 21 |
| 209 |
| 255 |
| 25 |
| |||||
Distribution Fees — Class B (Note D) |
| @— |
| @— |
| 116 |
| 510 |
| 1 |
| |||||
Other Expenses |
| 10 |
| 9 |
| 199 |
| 283 |
| 44 |
| |||||
Total Expenses |
| 105 |
| 103 |
| 6,330 |
| 14,778 |
| 886 |
| |||||
Voluntary Waiver of Investment Advisory Fees (Note B) |
| (32 | ) | (33 | ) | — |
| — |
| (93 | ) | |||||
Reimbursement of Investment Advisory Fees (Note B) |
| (26 | ) | (22 | ) | — |
| — |
| — |
| |||||
Expense Offset (Note E) |
| @— |
| @— |
| (1 | ) | (10 | ) | (1 | ) | |||||
Net Expenses |
| 47 |
| 48 |
| 6,329 |
| 14,768 |
| 792 |
| |||||
Net Investment Income (Loss) |
| (6 | ) | 40 |
| 160 |
| 25,097 |
| 5,222 |
| |||||
Realized Gain (Loss): |
|
|
|
|
|
|
|
|
|
|
| |||||
Investments Sold |
| (223 | ) | (4 | ) | 4,322 |
| 242,799 |
| 1,913 |
| |||||
Foreign Currency Transactions |
| — |
| — |
| — |
| (18 | ) | 62 |
| |||||
Futures Contracts |
| 40 |
| (1 | ) | — |
| — |
| (13 | ) | |||||
Net Realized Gain (Loss) |
| (183 | ) | (5 | ) | 4,322 |
| 242,781 |
| 1,962 |
| |||||
Change in Unrealized Appreciation (Depreciation): |
|
|
|
|
|
|
|
|
|
|
| |||||
Investments |
| 33 |
| 250 |
| 40,881 |
| 266,069 |
| 1,076 |
| |||||
Foreign Currency Exchange Contracts and Translations |
| — |
| — |
| — |
| @— |
| 2 |
| |||||
Futures Contracts |
| — |
| — |
| — |
| — |
| 11 |
| |||||
Net Change in Unrealized Appreciation (Depreciation) |
| 33 |
| 250 |
| 40,881 |
| 266,069 |
| 1,089 |
| |||||
Total Net Realized Gain (Loss) and Change in |
|
|
|
|
|
|
|
|
|
|
| |||||
Unrealized Appreciation (Depreciation) |
| (150 | ) | 245 |
| 45,203 |
| 508,850 |
| 3,051 |
| |||||
Net Increase (Decrease) in Net Assets Resulting from Operations |
| $ | (156 | ) | $ | 285 |
| $ | 45,363 |
| $ | 533,947 |
| $ | 8,273 |
|
^ For the period from April 28, 2006 (commencement of operations) to December 31, 2006.
@ Amount is less than $500.
The accompanying notes are an integral part of the financial statements.
140
| 2006 Annual Report |
|
|
| December 31, 2006 |
Statements of Changes in Net Assets
|
| Active |
|
|
|
|
| ||||||
|
| International Allocation |
| Emerging Markets |
| ||||||||
|
| Portfolio |
| Portfolio |
| ||||||||
|
| Year Ended |
| Year Ended |
| Year Ended |
| Year Ended |
| ||||
|
| December 31, |
| December 31, |
| December 31, |
| December 31, |
| ||||
|
| 2006 |
| 2005 |
| 2006 |
| 2005 |
| ||||
|
| (000) |
| (000) |
| (000) |
| (000) |
| ||||
Increase (Decrease) in Net Assets |
|
|
|
|
|
|
|
|
| ||||
Operations: |
|
|
|
|
|
|
|
|
| ||||
Net Investment Income (Loss) |
| $ | 17,545 |
| $ | 11,056 |
| $ | 12,943 |
| $ | 16,822 |
|
Net Realized Gain (Loss) |
| 48,028 |
| 31,370 |
| 407,354 |
| 229,354 |
| ||||
Net Change in Unrealized Appreciation (Depreciation) |
| 126,792 |
| 48,208 |
| 244,555 |
| 206,742 |
| ||||
Net Increase (Decrease) in Net Assets Resulting from Operations |
| 192,365 |
| 90,634 |
| 664,852 |
| 452,918 |
| ||||
Distributions from and/or in Excess of: |
|
|
|
|
|
|
|
|
| ||||
Class A: |
|
|
|
|
|
|
|
|
| ||||
Net Investment Income |
| (22,355 | ) | (8,193 | ) | (19,320 | ) | (23,918 | ) | ||||
Net Realized Gain |
| — |
| — |
| (344,280 | ) | — |
| ||||
Class B: |
|
|
|
|
|
|
|
|
| ||||
Net Investment Income |
| (70 | ) | (22 | ) | (740 | ) | (1,181 | ) | ||||
Net Realized Gain |
| — |
| — |
| (19,457 | ) | — |
| ||||
Total Distributions |
| (22,425 | ) | (8,215 | ) | (383,797 | ) | (25,099 | ) | ||||
Capital Share Transactions:(1) |
|
|
|
|
|
|
|
|
| ||||
Class A: |
|
|
|
|
|
|
|
|
| ||||
Subscribed |
| 187,571 |
| 330,640 |
| 592,680 |
| 476,524 |
| ||||
Distributions Reinvested |
| 18,880 |
| 6,969 |
| 352,736 |
| 22,742 |
| ||||
Redeemed |
| (200,465 | ) | (208,263 | ) | (680,751 | ) | (399,299 | ) | ||||
Redemption Fees |
| 3 |
| 2 |
| 339 |
| 187 |
| ||||
Class B: |
|
|
|
|
|
|
|
|
| ||||
Subscribed |
| 6,914 |
| 948 |
| 113,026 |
| 56,394 |
| ||||
Distributions Reinvested |
| 70 |
| 22 |
| 20,035 |
| 1,163 |
| ||||
Redeemed |
| (6,523 | ) | (1,667 | ) | (122,311 | ) | (52,962 | ) | ||||
Redemption Fees |
| @— |
| @— |
| 23 |
| 32 |
| ||||
Net Increase (Decrease) in Net Assets Resulting from Capital Share Transactions |
| 6,450 |
| 128,651 |
| 275,777 |
| 104,781 |
| ||||
Total Increase (Decrease) in Net Assets |
| 176,390 |
| 211,070 |
| 556,832 |
| 532,600 |
| ||||
Net Assets: |
|
|
|
|
|
|
|
|
| ||||
Beginning of Period |
| 794,544 |
| 583,474 |
| 1,853,153 |
| 1,320,553 |
| ||||
End of Period |
| $ | 970,934 |
| $ | 794,544 |
| $ | 2,409,985 |
| $ | 1,853,153 |
|
Undistributed (Distributions in Excess of) Net Investment Income Included in End of Period Net Assets |
| $ | 775 |
| $ | (1,432 | ) | $ | (14,608 | ) | $ | (11,174 | ) |
(1) | Capital Share Transactions: |
|
|
|
|
|
|
|
|
|
| Class A: |
|
|
|
|
|
|
|
|
|
| Shares Subscribed |
| 13,737 |
| 28,928 |
| 20,344 |
| 22,141 |
|
| Shares Issued on Distributions Reinvested |
| 1,261 |
| 600 |
| 12,457 |
| 902 |
|
| Shares Redeemed |
| (14,670 | ) | (18,827 | ) | (23,842 | ) | (19,439 | ) |
| Net Increase (Decrease) in Class A Shares Outstanding |
| 328 |
| 10,701 |
| 8,959 |
| 3,604 |
|
| Class B: |
|
|
|
|
|
|
|
|
|
| Shares Subscribed |
| 514 |
| 83 |
| 3,784 |
| 2,643 |
|
| Shares Issued on Distributions Reinvested |
| 4 |
| 2 |
| 717 |
| 47 |
|
| Shares Redeemed |
| (461 | ) | (145 | ) | (4,254 | ) | (2,333 | ) |
| Net Increase (Decrease) in Class B Shares Outstanding |
| 57 |
| (60 | ) | 247 |
| 357 |
|
@ Amount is less than $500.
The accompanying notes are an integral part of the financial statements.
141
2006 Annual Report |
|
|
|
December 31, 2006 |
|
Statements of Changes in Net Assets
��
|
| Global Franchise |
| Global Real Estate |
| |||||
|
| Portfolio |
| Portfolio |
| |||||
|
| Year Ended |
| Year Ended |
| Period Ended |
| |||
|
| December 31, |
| December 31, |
| December 31, |
| |||
|
| 2006 |
| 2005 |
| 2006^ |
| |||
|
| (000) |
| (000) |
| (000) |
| |||
Increase (Decrease) in Net Assets |
|
|
|
|
|
|
| |||
Operations: |
|
|
|
|
|
|
| |||
Net Investment Income (Loss) |
| $ | 2,168 |
| $ | 1,317 |
| $ | 873 |
|
Net Realized Gain (Loss) |
| 8,205 |
| 4,190 |
| 1,210 |
| |||
Net Change in Unrealized Appreciation (Depreciation) |
| 13,638 |
| 3,466 |
| 26,101 |
| |||
Net Increase (Decrease) in Net Assets Resulting from Operations |
| 24,011 |
| 8,973 |
| 28,184 |
| |||
Distributions from and/or in Excess of: |
|
|
|
|
|
|
| |||
Class A: |
|
|
|
|
|
|
| |||
Net Investment Income |
| (898 | ) | (1,562 | ) | (2,292 | ) | |||
Net Realized Gain |
| (6,479 | ) | (4,637 | ) | (438 | ) | |||
Class B: |
|
|
|
|
|
|
| |||
Net Investment Income |
| (19 | ) | (72 | ) | (1 | ) | |||
Net Realized Gain |
| (205 | ) | (243 | ) | @— |
| |||
Total Distributions |
| (7,601 | ) | (6,514 | ) | (2,731 | ) | |||
Capital Share Transactions:(1) |
|
|
|
|
|
|
| |||
Class A: |
|
|
|
|
|
|
| |||
Subscribed |
| 51,389 |
| 22,698 |
| 218,187 |
| |||
Distributions Reinvested |
| 7,255 |
| 6,188 |
| 2,728 |
| |||
Redeemed |
| (30,984 | ) | (4,405 | ) | (7,708 | ) | |||
Redemption Fees |
| 4 |
| @— |
| 3 |
| |||
Class B: |
|
|
|
|
|
|
| |||
Subscribed |
| 453 |
| 571 |
| 100 |
| |||
Distributions Reinvested |
| 181 |
| 267 |
| — |
| |||
Redeemed |
| (1,558 | ) | (523 | ) | — |
| |||
Redemption Fees |
| @— |
| — |
| @— |
| |||
Net Increase (Decrease) in Net Assets Resulting from Capital Share Transactions |
| 26,740 |
| 24,796 |
| 213,310 |
| |||
Total Increase (Decrease) in Net Assets |
| 43,150 |
| 27,255 |
| 238,763 |
| |||
Net Assets: |
|
|
|
|
|
|
| |||
Beginning of Period |
| 89,419 |
| 62,164 |
| — |
| |||
End of Period |
| $ | 132,569 |
| $ | 89,419 |
| $ | 238,763 |
|
Undistributed (Distributions in Excess of) Net Investment Income Included in End of Period Net Assets |
| $ | 228 |
| $ | 62 |
| $ | (1,309 | ) |
(1) | Capital Share Transactions: |
|
|
|
|
|
|
|
| Class A: |
|
|
|
|
|
|
|
| Shares Subscribed |
| 3,123 |
| 1,454 |
| 21,098 |
|
| Shares Issued on Distributions Reinvested |
| 409 |
| 390 |
| 241 |
|
| Shares Redeemed |
| (1,808 | ) | (274 | ) | (701 | ) |
| Net Increase (Decrease) in Class A Shares Outstanding |
| 1,724 |
| 1,570 |
| 20,638 |
|
| Class B: |
|
|
|
|
|
|
|
| Shares Subscribed |
| 26 |
| 36 |
| 10 |
|
| Shares Issued on Distributions Reinvested |
| 10 |
| 17 |
| — |
|
| Shares Redeemed |
| (87 | ) | (33 | ) | — |
|
| Net Increase (Decrease) in Class B Shares Outstanding |
| (51 | ) | 20 |
| 10 |
|
^ Global Real Estate Portfolio commenced operations on August 30, 2006.
@ Amount is less than $500.
The accompanying notes are an integral part of the financial statements.
142
| 2006 Annual Report |
|
|
| December 31, 2006 |
Statements of Changes in Net Assets
|
| Global Value Equity |
| International Equity |
| ||||||||
|
| Portfolio |
| Portfolio |
| ||||||||
|
| Year Ended |
| Year Ended |
| Year Ended |
| Year Ended |
| ||||
|
| December 31, |
| December 31, |
| December 31, |
| December 31, |
| ||||
|
| 2006 |
| 2005 |
| 2006 |
| 2005 |
| ||||
|
| (000) |
| (000) |
| (000) |
| (000) |
| ||||
Increase (Decrease) in Net Assets |
|
|
|
|
|
|
|
|
| ||||
Operations: |
|
|
|
|
|
|
|
|
| ||||
Net Investment Income (Loss) |
| $ | 1,918 |
| $ | 1,775 |
| $ | 212,224 |
| $ | 164,231 |
|
Net Realized Gain (Loss) |
| 6,732 |
| 5,010 |
| 1,034,579 |
| 739,864 |
| ||||
Net Change in Unrealized Appreciation (Depreciation) |
| 14,322 |
| (556 | ) | 264,694 |
| (398,185 | ) | ||||
Net Increase (Decrease) in Net Assets Resulting from Operations |
| 22,972 |
| 6,229 |
| 1,511,497 |
| 505,910 |
| ||||
Distributions from and/or in Excess of: |
|
|
|
|
|
|
|
|
| ||||
Class A: |
|
|
|
|
|
|
|
|
| ||||
Net Investment Income |
| (1,618 | ) | (1,434 | ) | (144,056 | ) | (106,112 | ) | ||||
Net Realized Gain |
| (4,953 | ) | (3,111 | ) | (917,867 | ) | (503,334 | ) | ||||
Class B: |
|
|
|
|
|
|
|
|
| ||||
Net Investment Income |
| (386 | ) | (300 | ) | (25,432 | ) | (16,435 | ) | ||||
Net Realized Gain |
| (1,352 | ) | (894 | ) | (181,273 | ) | (91,535 | ) | ||||
Total Distributions |
| (8,309 | ) | (5,739 | ) | (1,268,628 | ) | (717,416 | ) | ||||
Capital Share Transactions:(1) |
|
|
|
|
|
|
|
|
| ||||
Class A: |
|
|
|
|
|
|
|
|
| ||||
Subscribed |
| 12,229 |
| 18,729 |
| 787,978 |
| 1,057,038 |
| ||||
Distributions Reinvested |
| 6,534 |
| 4,515 |
| 967,612 |
| 566,819 |
| ||||
Redeemed |
| (15,405 | ) | (6,023 | ) | (2,767,428 | ) | (1,945,491 | ) | ||||
Redemption Fees |
| 25 |
| 7 |
| 266 |
| 187 |
| ||||
Class B: |
|
|
|
|
|
|
|
|
| ||||
Subscribed |
| 4,567 |
| 3,447 |
| 365,342 |
| 406,346 |
| ||||
Distributions Reinvested |
| 1,739 |
| 1,193 |
| 206,433 |
| 107,811 |
| ||||
Redeemed |
| (3,360 | ) | (13,525 | ) | (660,276 | ) | (344,263 | ) | ||||
Redemption Fees |
| 6 |
| 2 |
| 75 |
| 32 |
| ||||
Net Increase (Decrease) in Net Assets Resulting from Capital Share Transactions |
| 6,335 |
| 8,345 |
| (1,099,998 | ) | (151,521 | ) | ||||
Total Increase (Decrease) in Net Assets |
| 20,998 |
| 8,835 |
| (857,129 | ) | (363,027 | ) | ||||
Net Assets: |
|
|
|
|
|
|
|
|
| ||||
Beginning of Period |
| 107,938 |
| 99,103 |
| 7,910,857 |
| 8,273,884 |
| ||||
End of Period |
| $ | 128,936 |
| $ | 107,938 |
| $ | 7,053,728 |
| $ | 7,910,857 |
|
Undistributed (Distributions in Excess of) Net Investment Income Included in End of Period Net Assets |
| $ | (32 | ) | $ | (9 | ) | $ | (4,528 | ) | $ | (2,762 | ) |
(1) | Capital Share Transactions: |
|
|
|
|
|
|
|
|
|
| Class A: |
|
|
|
|
|
|
|
|
|
| Shares Subscribed |
| 653 |
| 1,055 |
| 35,254 |
| 50,203 |
|
| Shares Issued on Distributions Reinvested |
| 329 |
| 252 |
| 47,109 |
| 27,726 |
|
| Shares Redeemed |
| (800 | ) | (336 | ) | (125,261 | ) | (91,383 | ) |
| Net Increase (Decrease) in Class A Shares Outstanding |
| 182 |
| 971 |
| (42,898 | ) | (13,454 | ) |
| Class B: |
|
|
|
|
|
|
|
|
|
| Shares Subscribed |
| 238 |
| 196 |
| 16,542 |
| 19,383 |
|
| Shares Issued on Distributions Reinvested |
| 89 |
| 67 |
| 10,139 |
| 5,321 |
|
| Shares Redeemed |
| (180 | ) | (757 | ) | (29,904 | ) | (16,439 | ) |
| Net Increase (Decrease) in Class B Shares Outstanding |
| 147 |
| (494 | ) | (3,223 | ) | 8,265 |
|
The accompanying notes are an integral part of the financial statements.
143
2006 Annual Report |
|
|
|
December 31, 2006 |
|
Statements of Changes in Net Assets
|
| International Growth Equity |
| International Magnum |
| ||||||||
|
| Portfolio |
| Portfolio |
| ||||||||
|
| Year Ended |
| Period Ended |
| Year Ended |
| Year Ended |
| ||||
|
| December 31, |
| December 31, |
| December 31, |
| December 31, |
| ||||
|
| 2006 |
| 2005^ |
| 2006 |
| 2005 |
| ||||
|
| (000) |
| (000) |
| (000) |
| (000) |
| ||||
Increase (Decrease) in Net Assets |
|
|
|
|
|
|
|
|
| ||||
Operations: |
|
|
|
|
|
|
|
|
| ||||
Net Investment Income (Loss) |
| $ | 53 |
| $ | @— |
| $ | 1,539 |
| $ | 1,472 |
|
Net Realized Gain (Loss) |
| 75 |
| (1 | ) | 20,620 |
| 8,896 |
| ||||
Net Change in Unrealized Appreciation (Depreciation) |
| 1,382 |
| (36 | ) | 4,315 |
| 429 |
| ||||
Net Increase (Decrease) in Net Assets Resulting from Operations |
| 1,510 |
| (37 | ) | 26,474 |
| 10,797 |
| ||||
Distributions from and/or in Excess of: |
|
|
|
|
|
|
|
|
| ||||
Class A: |
|
|
|
|
|
|
|
|
| ||||
Net Investment Income |
| (49 | ) | — |
| (2,641 | ) | (1,254 | ) | ||||
Net Realized Gain |
| (32 | ) | — |
| (13,710 | ) | — |
| ||||
Class B: |
|
|
|
|
|
|
|
|
| ||||
Net Investment Income |
| (1 | ) | — |
| (36 | ) | (32 | ) | ||||
Net Realized Gain |
| (2 | ) | — |
| (206 | ) | — |
| ||||
Total Distributions |
| (84 | ) | — |
| (16,593 | ) | (1,286 | ) | ||||
Capital Share Transactions:(1) |
|
|
|
|
|
|
|
|
| ||||
Class A: |
|
|
|
|
|
|
|
|
| ||||
Subscribed |
| 613 |
| 4,900 |
| 25,211 |
| 23,305 |
| ||||
Distributions Reinvested |
| 8 |
| — |
| 16,307 |
| 1,234 |
| ||||
Redeemed |
| (30 | ) | — |
| (41,092 | ) | (21,557 | ) | ||||
Redemption Fees |
| — |
| — |
| 2 |
| @— |
| ||||
Class B: |
|
|
|
|
|
|
|
|
| ||||
Subscribed |
| 630 |
| 100 |
| 934 |
| 1,938 |
| ||||
Distributions Reinvested |
| 2 |
| — |
| 240 |
| 31 |
| ||||
Redeemed |
| (534 | ) | — |
| (3,266 | ) | (1,227 | ) | ||||
Redemption Fees |
| — |
| — |
| @— |
| 1 |
| ||||
Net Increase (Decrease) in Net Assets Resulting from Capital Share Transactions |
| 689 |
| 5,000 |
| (1,664 | ) | 3,725 |
| ||||
Total Increase (Decrease) in Net Assets |
| 2,115 |
| 4,963 |
| 8,217 |
| 13,236 |
| ||||
Net Assets: |
|
|
|
|
|
|
|
|
| ||||
Beginning of Period |
| 4,963 |
| — |
| 110,003 |
| 96,767 |
| ||||
End of Period |
| $ | 7,078 |
| $ | 4,963 |
| $ | 118,220 |
| $ | 110,003 |
|
Undistributed (Distributions in Excess of) Net Investment Income Included in End of Period Net Assets |
| $ | (4 | ) | $ | @— |
| $ | 123 |
| $ | (25 | ) |
(1) | Capital Share Transactions: |
|
|
|
|
|
|
|
|
|
| Class A: |
|
|
|
|
|
|
|
|
|
| Shares Subscribed |
| 50 |
| 490 |
| 1,768 |
| 1,938 |
|
| Shares Issued on Distributions Reinvested |
| 1 |
| — |
| 1,169 |
| 98 |
|
| Shares Redeemed |
| (2 | ) | — |
| (2,829 | ) | (1,815 | ) |
| Net Increase (Decrease) in Class A Shares Outstanding |
| 49 |
| 490 |
| 108 |
| 221 |
|
| Class B: |
|
|
|
|
|
|
|
|
|
| Shares Subscribed |
| 59 |
| 10 |
| 66 |
| 159 |
|
| Shares Issued on Distributions Reinvested |
| @— |
| — |
| 17 |
| 3 |
|
| Shares Redeemed |
| (43 | ) | — |
| (236 | ) | (102 | ) |
| Net Increase (Decrease) in Class B Shares Outstanding |
| 16 |
| 10 |
| (153 | ) | 60 |
|
^ International Growth Equity Portfolio commenced operations on December 27, 2005.
@ Amount is less than $500.
The accompanying notes are an integral part of the financial statements.
144
| 2006 Annual Report |
|
|
| December 31, 2006 |
Statements of Changes in Net Assets
|
| International Real Estate |
| International SmallCap |
| ||||||||
|
| Portfolio |
| Portfolio |
| ||||||||
|
| Year Ended |
| Year Ended |
| Year Ended |
| Year Ended |
| ||||
|
| December 31, |
| December 31, |
| December 31, |
| December 31, |
| ||||
|
| 2006 |
| 2005 |
| 2006 |
| 2005 |
| ||||
|
| (000) |
| (000) |
| (000) |
| (000) |
| ||||
Increase (Decrease) in Net Assets |
|
|
|
|
|
|
|
|
| ||||
Operations: |
|
|
|
|
|
|
|
|
| ||||
Net Investment Income (Loss) |
| $ | 7,224 |
| $ | 2,479 |
| $ | 17,507 |
| $ | 16,686 |
|
Net Realized Gain (Loss) |
| 42,502 |
| 18,145 |
| 204,321 |
| 225,188 |
| ||||
Net Change in Unrealized Appreciation (Depreciation) |
| 254,627 |
| 2,929 |
| 22,196 |
| (72,679 | ) | ||||
Net Increase (Decrease) in Net Assets Resulting from Operations |
| 304,353 |
| 23,553 |
| 244,024 |
| 169,195 |
| ||||
Distributions from and/or in Excess of: |
|
|
|
|
|
|
|
|
| ||||
Class A: |
|
|
|
|
|
|
|
|
| ||||
Net Investment Income |
| (25,151 | ) | (3,321 | ) | (20,542 | ) | (23,957 | ) | ||||
Net Realized Gain |
| (31,595 | ) | (13,425 | ) | (229,672 | ) | (190,069 | ) | ||||
Class B: |
|
|
|
|
|
|
|
|
| ||||
Net Investment Income |
| (1,958 | ) | (99 | ) | — |
| — |
| ||||
Net Realized Gain |
| (2,513 | ) | (431 | ) | — |
| — |
| ||||
Total Distributions |
| (61,217 | ) | (17,276 | ) | (250,214 | ) | (214,026 | ) | ||||
Capital Share Transactions:(1) |
|
|
|
|
|
|
|
|
| ||||
Class A: |
|
|
|
|
|
|
|
|
| ||||
Subscribed |
| 680,101 |
| 221,133 |
| 154,461 |
| 277,611 |
| ||||
Distributions Reinvested |
| 46,370 |
| 15,117 |
| 228,241 |
| 201,916 |
| ||||
Redeemed |
| (81,039 | ) | (42,622 | ) | (453,530 | ) | (321,709 | ) | ||||
Redemption Fees |
| 20 |
| 46 |
| 4 |
| 8 |
| ||||
Class B: |
|
|
|
|
|
|
|
|
| ||||
Subscribed |
| 85,871 |
| 8,793 |
| — |
| — |
| ||||
Distributions Reinvested |
| 4,408 |
| 489 |
| — |
| — |
| ||||
Redeemed |
| (14,534 | ) | (1,495 | ) | — |
| — |
| ||||
Redemption Fees |
| 2 |
| — |
| — |
| — |
| ||||
Net Increase (Decrease) in Net Assets Resulting from Capital Share Transactions |
| 721,199 |
| 201,461 |
| (70,824 | ) | 157,826 |
| ||||
Total Increase (Decrease) in Net Assets |
| 964,335 |
| 207,738 |
| (77,014 | ) | 112,995 |
| ||||
Net Assets: |
|
|
|
|
|
|
|
|
| ||||
Beginning of Period |
| 259,185 |
| 51,447 |
| 1,389,078 |
| 1,276,083 |
| ||||
End of Period |
| $ | 1,223,520 |
| $ | 259,185 |
| $ | 1,312,064 |
| $ | 1,389,078 |
|
Undistributed (Distributions in Excess of) Net Investment Income Included in End of Period Net Assets |
| $ | (14,871 | ) | $ | (490 | ) | $ | (5,572 | ) | $ | (6,847 | ) |
(1) | Capital Share Transactions: |
|
|
|
|
|
|
|
|
|
| Class A: |
|
|
|
|
|
|
|
|
|
| Shares Subscribed |
| 22,996 |
| 9,542 |
| 5,989 |
| 10,729 |
|
| Shares Issued on Distributions Reinvested |
| 1,397 |
| 643 |
| 9,545 |
| 8,366 |
|
| Shares Redeemed |
| (2,674 | ) | (1,890 | ) | (17,759 | ) | (12,371 | ) |
| Net Increase (Decrease) in Class A Shares Outstanding |
| 21,719 |
| 8,295 |
| (2,225 | ) | 6,724 |
|
| Class B: |
|
|
|
|
|
|
|
|
|
| Shares Subscribed |
| 2,783 |
| 373 |
| — |
| — |
|
| Shares Issued on Distributions Reinvested |
| 132 |
| 21 |
| — |
| — |
|
| Shares Redeemed |
| (469 | ) | (65 | ) | — |
| — |
|
| Net Increase (Decrease) in Class B Shares Outstanding |
| 2,446 |
| 329 |
| — |
| — |
|
The accompanying notes are an integral part of the financial statements.
145
2006 Annual Report |
|
|
|
December 31, 2006 |
|
Statements of Changes in Net Assets
|
| Focus Equity |
| Large Cap Relative Value |
| ||||||||
|
| Portfolio |
| Portfolio |
| ||||||||
|
| Year Ended |
| Year Ended |
| Year Ended |
| Year Ended |
| ||||
|
| December 31, |
| December 31, |
| December 31, |
| December 31, |
| ||||
|
| 2006 |
| 2005 |
| 2006 |
| 2005 |
| ||||
|
| (000) |
| (000) |
| (000) |
| (000) |
| ||||
Increase (Decrease) in Net Assets |
|
|
|
|
|
|
|
|
| ||||
Operations: |
|
|
|
|
|
|
|
|
| ||||
Net Investment Income (Loss) |
| $ | (157 | ) | $ | (174 | ) | $ | 3,883 |
| $ | 2,274 |
|
Net Realized Gain (Loss) |
| 11,170 |
| 3,931 |
| 13,797 |
| 14,891 |
| ||||
Net Change in Unrealized Appreciation (Depreciation) |
| (10,424 | ) | 5,645 |
| 18,703 |
| 717 |
| ||||
Net Increase (Decrease) in Net Assets Resulting from Operations |
| 589 |
| 9,402 |
| 36,383 |
| 17,882 |
| ||||
Distributions from and/or in Excess of: |
|
|
|
|
|
|
|
|
| ||||
Class A: |
|
|
|
|
|
|
|
|
| ||||
Net Investment Income |
| — |
| (84 | ) | (3,061 | ) | (1,266 | ) | ||||
Net Realized Gain |
| — |
| — |
| (8,593 | ) | (2,991 | ) | ||||
Class B: |
|
|
|
|
|
|
|
|
| ||||
Net Investment Income |
| — |
| (14 | ) | (886 | ) | (1,011 | ) | ||||
Net Realized Gain |
| — |
| — |
| (2,670 | ) | (2,953 | ) | ||||
Total Distributions |
| — |
| (98 | ) | (15,210 | ) | (8,221 | ) | ||||
Capital Share Transactions:(1) |
|
|
|
|
|
|
|
|
| ||||
Class A: |
|
|
|
|
|
|
|
|
| ||||
Subscribed |
| 8,415 |
| 8,113 |
| 94,848 |
| 15,705 |
| ||||
Issued on Portfolio Merger |
| — |
| — |
| 66,823 |
| — |
| ||||
Distributions Reinvested |
| — |
| 83 |
| 11,599 |
| 4,218 |
| ||||
Redeemed |
| (51,735 | ) | (14,588 | ) | (78,180 | ) | (12,783 | ) | ||||
Redemption Fees |
| @— |
| — |
| 2 |
| — |
| ||||
Class B: |
|
|
|
|
|
|
|
|
| ||||
Subscribed |
| 4,977 |
| 6,550 |
| 5,886 |
| 35,739 |
| ||||
Distributions Reinvested |
| — |
| 14 |
| 3,542 |
| 3,954 |
| ||||
Redeemed |
| (14,276 | ) | (4,029 | ) | (54,962 | ) | (18,149 | ) | ||||
Redemption Fees |
| @— |
| — |
| 1 |
| — |
| ||||
Net Increase (Decrease) in Net Assets Resulting from Capital Share Transactions |
| (52,619 | ) | (3,857 | ) | 49,559 |
| 28,684 |
| ||||
Total Increase (Decrease) in Net Assets |
| (52,030 | ) | 5,447 |
| 70,732 |
| 38,345 |
| ||||
Net Assets: |
|
|
|
|
|
|
|
|
| ||||
Beginning of Period |
| 66,763 |
| 61,316 |
| 204,472 |
| 166,127 |
| ||||
End of Period |
| $ | 14,733 |
| $ | 66,763 |
| $ | 275,204 |
| $ | 204,472 |
|
Undistributed (Distributions in Excess of) Net Investment Income Included in End of Period Net Assets |
| $ | — |
| $ | (7 | ) | $ | (21 | ) | $ | (11 | ) |
Accumulated Net Investment Loss Included in End of Period Net Assets |
| (7 | ) | — |
| — |
| — |
| ||||
(1) | Capital Share Transactions: |
|
|
|
|
|
|
|
|
|
| Class A: |
|
|
|
|
|
|
|
|
|
| Shares Subscribed |
| 565 |
| 605 |
| 8,191 |
| 1,448 |
|
| Shares Issued on Portfolio Merger |
| — |
| — |
| 5,706 |
| — |
|
| Shares Issued on Distributions Reinvested |
| — |
| 6 |
| 986 |
| 378 |
|
| Shares Redeemed |
| (3,422 | ) | (1,128 | ) | (6,786 | ) | (1,192 | ) |
| Net Increase (Decrease) in Class A Shares Outstanding |
| (2,857 | ) | (517 | ) | 8,097 |
| 634 |
|
| Class B: |
|
|
|
|
|
|
|
|
|
| Shares Subscribed |
| 337 |
| 502 |
| 579 |
| 3,320 |
|
| Shares Issued on Distributions Reinvested |
| — |
| 1 |
| 302 |
| 354 |
|
| Shares Redeemed |
| (1,041 | ) | (336 | ) | (4,836 | ) | (1,674 | ) |
| Net Increase (Decrease) in Class B Shares Outstanding |
| (704 | ) | 167 |
| (3,955 | ) | 2,000 |
|
The accompanying notes are an integral part of the financial statements.
146
| 2006 Annual Report |
|
|
| December 31, 2006 |
Statements of Changes in Net Assets
|
|
|
|
|
| Systematic Active |
| |||
|
| Small Company Growth |
| Large Cap Core |
| |||||
|
| Portfolio |
| Portfolio |
| |||||
|
| Year Ended |
| Year Ended |
| Period Ended |
| |||
|
| December 31, |
| December 31, |
| December 31, |
| |||
|
| 2006 |
| 2005 |
| 2006^ |
| |||
|
| (000) |
| (000) |
| (000) |
| |||
Increase (Decrease) in Net Assets |
|
|
|
|
|
|
| |||
Operations: |
|
|
|
|
|
|
| |||
Net Investment Income (Loss) |
| $ | (12,827 | ) | $ | (2,015 | ) | $ | 50 |
|
Net Realized Gain (Loss) |
| 169,063 |
| 177,923 |
| (34 | ) | |||
Net Change in Unrealized Appreciation (Depreciation) |
| 29,319 |
| 15,575 |
| 449 |
| |||
Net Increase (Decrease) in Net Assets Resulting from Operations |
| 185,555 |
| 191,483 |
| 465 |
| |||
Distributions from and/or in Excess of: |
|
|
|
|
|
|
| |||
Class A: |
|
|
|
|
|
|
| |||
Net Investment Income |
| — |
| — |
| (50 | ) | |||
Net Realized Gain |
| (79,237 | ) | (85,937 | ) | — |
| |||
Class B: |
|
|
|
|
|
|
| |||
Net Investment Income |
| — |
| — |
| @— |
| |||
Net Realized Gain |
| (69,508 | ) | (79,058 | ) | — |
| |||
Total Distributions |
| (148,745 | ) | (164,995 | ) | (50 | ) | |||
Capital Share Transactions:(1) |
|
|
|
|
|
|
| |||
Class A: |
|
|
|
|
|
|
| |||
Subscribed |
| 296,952 |
| 355,282 |
| 5,900 |
| |||
Distributions Reinvested |
| 74,528 |
| 81,725 |
| — |
| |||
Redeemed |
| (261,098 | ) | (200,646 | ) | — |
| |||
Redemption Fees |
| 55 |
| @— |
| — |
| |||
Class B: |
|
|
|
|
|
|
| |||
Subscribed |
| 228,726 |
| 244,551 |
| 100 |
| |||
Distributions Reinvested |
| 69,484 |
| 79,029 |
| — |
| |||
Redeemed |
| (264,904 | ) | (246,741 | ) | — |
| |||
Redemption Fees |
| 55 |
| — |
| — |
| |||
Net Increase (Decrease) in Net Assets Resulting from Capital Share Transactions |
| 143,798 |
| 313,200 |
| 6,000 |
| |||
Total Increase (Decrease) in Net Assets |
| 180,608 |
| 339,688 |
| 6,415 |
| |||
Net Assets: |
|
|
|
|
|
|
| |||
Beginning of Period |
| 1,704,697 |
| 1,365,009 |
| — |
| |||
End of Period |
| $ | 1,885,305 |
| $ | 1,704,697 |
| $ | 6,415 |
|
Undistributed (Distributions in Excess of) Net Investment Income Included in End of Period Net Assets |
| $ | — |
| $ | — |
| $ | 2 |
|
Accumulated Net Investment Loss Included in End of Period Net Assets |
| (14 | ) | (134 | ) | — |
| |||
(1) | Capital Share Transactions: |
|
|
|
|
|
|
|
| Class A: |
|
|
|
|
|
|
|
| Shares Subscribed |
| 21,757 |
| 26,705 |
| 590 |
|
| Shares Issued on Distributions Reinvested |
| 5,644 |
| 6,245 |
| — |
|
| Shares Redeemed |
| (19,704 | ) | (15,501 | ) | — |
|
| Net Increase (Decrease) in Class A Shares Outstanding |
| 7,697 |
| 17,449 |
| 590 |
|
| Class B: |
|
|
|
|
|
|
|
| Shares Subscribed |
| 17,495 |
| 19,625 |
| 10 |
|
| Shares Issued on Distributions Reinvested |
| 5,542 |
| 6,321 |
| — |
|
| Shares Redeemed |
| (20,843 | ) | (19,620 | ) | — |
|
| Net Increase (Decrease) in Class B Shares Outstanding |
| 2,194 |
| 6,326 |
| 10 |
|
^ Systematic Active Large Cap Core Portfolio commenced operations on April 28, 2006.
@ Amount is less than $500.
The accompanying notes are an integral part of the financial statements.
147
2006 Annual Report |
|
|
|
December 31, 2006 |
|
Statements of Changes in Net Assets
|
| Systematic Active |
| Systematic Active |
| ||
|
| Small Cap Core |
| Small Cap Growth |
| ||
|
| Portfolio |
| Portfolio |
| ||
|
| Period Ended |
| Period Ended |
| ||
|
| December 31, |
| December 31, |
| ||
|
| 2006^ |
| 2006^ |
| ||
|
| (000) |
| (000) |
| ||
Increase (Decrease) in Net Assets |
|
|
|
|
| ||
Operations: |
|
|
|
|
| ||
Net Investment Income (Loss) |
| $ | 19 |
| $ | (6 | ) |
Net Realized Gain (Loss) |
| (166 | ) | (183 | ) | ||
Net Change in Unrealized Appreciation (Depreciation) |
| 120 |
| 33 |
| ||
Net Increase (Decrease) in Net Assets Resulting from Operations |
| (27 | ) | (156 | ) | ||
Distributions from and/or in Excess of: |
|
|
|
|
| ||
Class A: |
|
|
|
|
| ||
Net Investment Income |
| (19 | ) | — |
| ||
Net Realized Gain |
| — |
| — |
| ||
Class B: |
|
|
|
|
| ||
Net Investment Income |
| @— |
| — |
| ||
Net Realized Gain |
| — |
| — |
| ||
Total Distributions |
| (19 | ) | — |
| ||
Capital Share Transactions:(1) |
|
|
|
|
| ||
Class A: |
|
|
|
|
| ||
Subscribed |
| 6,500 |
| 6,800 |
| ||
Distributions Reinvested |
| — |
| — |
| ||
Redeemed |
| — |
| — |
| ||
Class B: |
|
|
|
|
| ||
Subscribed |
| 100 |
| 100 |
| ||
Distributions Reinvested |
| — |
| — |
| ||
Redeemed |
| — |
| — |
| ||
Net Increase (Decrease) in Net Assets Resulting from Capital Share Transactions |
| 6,600 |
| 6,900 |
| ||
Total Increase (Decrease) in Net Assets |
| 6,554 |
| 6,744 |
| ||
Net Assets: |
|
|
|
|
| ||
Beginning of Period |
| — |
| — |
| ||
End of Period |
| $ | 6,554 |
| $ | 6,744 |
|
Undistributed (Distributions in Excess of) Net Investment Income Included in End of Period Net Assets |
| $ | 2 |
| $ | — |
|
(1) | Capital Share Transactions: |
|
|
|
|
|
| Class A: |
|
|
|
|
|
| Shares Subscribed |
| 650 |
| 680 |
|
| Shares Issued on Distributions Reinvested |
| — |
| — |
|
| Shares Redeemed |
| — |
| — |
|
| Net Increase (Decrease) in Class A Shares Outstanding |
| 650 |
| 680 |
|
| Class B: |
|
|
|
|
|
| Shares Subscribed |
| 10 |
| 10 |
|
| Shares Issued on Distributions Reinvested |
| — |
| — |
|
| Shares Redeemed |
| — |
| — |
|
| Net Increase (Decrease) in Class B Shares Outstanding |
| 10 |
| 10 |
|
^ Systematic Active Small Cap Core and Systematic Active Small Cap Growth Portfolios commenced operations on
April 28, 2006.
@ Amount is less than $500.
The accompanying notes are an integral part of the financial statements.
148
| 2006 Annual Report |
|
|
| December 31, 2006 |
Statements of Changes in Net Assets
|
| Systematic Active |
|
|
|
|
| |||
|
| Small Cap Value |
| U.S. Large Cap Growth |
| |||||
|
| Portfolio |
| Portfolio |
| |||||
|
| Period Ended |
| Year Ended |
| Year Ended |
| |||
|
| December 31, |
| December 31, |
| December 31, |
| |||
|
| 2006^ |
| 2006 |
| 2005 |
| |||
|
| (000) |
| (000) |
| (000) |
| |||
Increase (Decrease) in Net Assets |
|
|
|
|
|
|
| |||
Operations: |
|
|
|
|
|
|
| |||
Net Investment Income (Loss) |
| $ | 40 |
| $ | 160 |
| $ | 662 |
|
Net Realized Gain (Loss) |
| (5 | ) | 4,322 |
| 50,227 |
| |||
Net Change in Unrealized Appreciation (Depreciation) |
| 250 |
| 40,881 |
| 34,212 | �� | |||
Net Increase (Decrease) in Net Assets Resulting from Operations |
| 285 |
| 45,363 |
| 85,101 |
| |||
Distributions from and/or in excess of: |
|
|
|
|
|
|
| |||
Class A: |
|
|
|
|
|
|
| |||
Net Investment Income |
| (39 | ) | (184 | ) | (1,531 | ) | |||
Class B: |
|
|
|
|
|
|
| |||
Net Investment Income |
| (1 | ) | — |
| (87 | ) | |||
Total Distributions |
| (40 | ) | (184 | ) | (1,618 | ) | |||
Capital Share Transactions:(1) |
|
|
|
|
|
|
| |||
Class A: |
|
|
|
|
|
|
| |||
Subscribed |
| 6,600 |
| 333,417 |
| 376,150 |
| |||
Distributions Reinvested |
| — |
| 184 |
| 1,527 |
| |||
Redeemed |
| — |
| (234,697 | ) | (145,562 | ) | |||
Redemption Fees |
| — |
| 16 |
| — |
| |||
Class B: |
|
|
|
|
|
|
| |||
Subscribed |
| 100 |
| 38,689 |
| 28,674 |
| |||
Distributions Reinvested |
| — |
| — |
| 86 |
| |||
Redeemed |
| — |
| (20,266 | ) | (193,765 | ) | |||
Redemption Fees |
| — |
| 1 |
| — |
| |||
Net Increase (Decrease) in Net Assets Resulting from Capital Share Transactions |
| 6,700 |
| 117,344 |
| 67,110 |
| |||
Total Increase (Decrease) in Net Assets |
| 6,945 |
| 162,523 |
| 150,593 |
| |||
Net Assets: |
|
|
|
|
|
|
| |||
Beginning of Period |
| — |
| 907,583 |
| 756,990 |
| |||
End of Period |
| $ | 6,945 |
| $ | 1,070,106 |
| $ | 907,583 |
|
Undistributed (Distributions in Excess of) Net Investment Income Included in End of Period Net Assets |
| $ | 2 |
| $ | (43 | ) | $ | (44 | ) |
(1) | Capital Share Transactions: |
|
|
|
|
|
|
|
| Class A: |
|
|
|
|
|
|
|
| Shares Subscribed |
| 660 |
| 17,611 |
| 20,312 |
|
| Shares Issued on Distributions Reinvested |
| — |
| 9 |
| 84 |
|
| Shares Redeemed |
| — |
| (12,445 | ) | (8,468 | ) |
| Net Increase (Decrease) in Class A Shares Outstanding |
| 660 |
| 5,175 |
| 11,928 |
|
| Class B: |
|
|
|
|
|
|
|
| Shares Subscribed |
| 10 |
| 2,118 |
| 1,705 |
|
| Shares Issued on Distributions Reinvested |
| — |
| — |
| 5 |
|
| Shares Redeemed |
| — |
| (1,083 | ) | (12,021 | ) |
| Net Increase (Decrease) in Class B Shares Outstanding |
| 10 |
| 1,035 |
| (10,311 | ) |
^ Systematic Active Small Cap Value Portfolio commenced operations on April 28, 2006.
@ Amount is less than $500.
The accompanying notes are an integral part of the financial statements.
149
2006 Annual Report |
|
|
|
December 31, 2006 |
|
Statements of Changes in Net Assets
|
| U.S. Real Estate |
| Emerging Markets Debt |
| ||||||||
|
| Portfolio |
| Portfolio |
| ||||||||
|
| Year Ended |
| Year Ended |
| Year Ended |
| Year Ended |
| ||||
|
| December 31, |
| December 31, |
| December 31, |
| December 31, |
| ||||
|
| 2006 |
| 2005 |
| 2006 |
| 2005 |
| ||||
|
| (000) |
| (000) |
| (000) |
| (000) |
| ||||
Increase (Decrease) in Net Assets |
|
|
|
|
|
|
|
|
| ||||
Operations: |
|
|
|
|
|
|
|
|
| ||||
Net Investment Income (Loss) |
| $ | 25,097 |
| $ | 22,655 |
| $ | 5,222 |
| $ | 5,248 |
|
Net Realized Gain (Loss) |
| 242,781 |
| 182,274 |
| 1,962 |
| 2,414 |
| ||||
Net Change in Unrealized Appreciation (Depreciation) |
| 266,069 |
| (6,011 | ) | 1,089 |
| 1,224 |
| ||||
Net Increase (Decrease) in Net Assets Resulting from Operations |
| 533,947 |
| 198,918 |
| 8,273 |
| 8,886 |
| ||||
Distributions from and/or in excess of: |
|
|
|
|
|
|
|
|
| ||||
Class A: |
|
|
|
|
|
|
|
|
| ||||
Net Investment Income |
| (25,711 | ) | (19,989 | ) | (5,931 | ) | (5,414 | ) | ||||
Net Realized Gain |
| (186,870 | ) | (155,774 | ) | — |
| — |
| ||||
Class B: |
|
|
|
|
|
|
|
|
| ||||
Net Investment Income |
| (3,370 | ) | (2,437 | ) | (37 | ) | (32 | ) | ||||
Net Realized Gain |
| (29,839 | ) | (20,941 | ) | — |
| — |
| ||||
Total Distributions |
| (245,790 | ) | (199,141 | ) | (5,968 | ) | (5,446 | ) | ||||
Capital Share Transactions:(1) |
|
|
|
|
|
|
|
|
| ||||
Class A: |
|
|
|
|
|
|
|
|
| ||||
Subscribed |
| 529,570 |
| 344,057 |
| 10,023 |
| 31,778 |
| ||||
Distributions Reinvested |
| 204,975 |
| 168,982 |
| 3,531 |
| 2,943 |
| ||||
Redeemed |
| (563,233 | ) | (398,651 | ) | (26,920 | ) | (26,950 | ) | ||||
Redemption Fees |
| 35 |
| 8 |
| 1 |
| 1 |
| ||||
Class B: |
|
|
|
|
|
|
|
|
| ||||
Subscribed |
| 101,776 |
| 82,808 |
| 19 |
| 100 |
| ||||
Distributions Reinvested |
| 33,205 |
| 23,376 |
| 37 |
| 32 |
| ||||
Redeemed |
| (57,345 | ) | (99,937 | ) | (109 | ) | — |
| ||||
Redemption Fees |
| 5 |
| — |
| @— |
| — |
| ||||
Net Increase (Decrease) in Net Assets Resulting from Capital Share Transactions |
| 248,988 |
| 120,643 |
| (13,418 | ) | 7,904 |
| ||||
Total Increase (Decrease) in Net Assets |
| 537,145 |
| 120,420 |
| (11,113 | ) | 11,344 |
| ||||
Net Assets: |
|
|
|
|
|
|
|
|
| ||||
Beginning of Period |
| 1,367,318 |
| 1,246,898 |
| 92,890 |
| 81,546 |
| ||||
End of Period |
| $ | 1,904,463 |
| $ | 1,367,318 |
| $ | 81,777 |
| $ | 92,890 |
|
Undistributed (Distributions in Excess of) Net Investment Income Included in End of Period Net Assets |
| $ | (2,899 | ) | $ | 202 |
| $ | (1,051 | ) | $ | (316 | ) |
(1) | Capital Share Transactions†: |
|
|
|
|
|
|
|
|
|
| Class A: |
|
|
|
|
|
|
|
|
|
| Shares Subscribed |
| 19,517 |
| 14,289 |
| 855 |
| 2,714 |
|
| Shares Issued on Distributions Reinvested |
| 7,480 |
| 7,119 |
| 295 |
| 255 |
|
| Shares Redeemed |
| (20,735 | ) | (17,037 | ) | (2,333 | ) | (2,437 | ) |
| Net Increase (Decrease) in Class A Shares Outstanding |
| 6,262 |
| 4,371 |
| (1,183 | ) | 532 |
|
| Class B: |
|
|
|
|
|
|
|
|
|
| Shares Subscribed |
| 3,751 |
| 3,507 |
| 2 |
| 8 |
|
| Shares Issued on Distributions Reinvested |
| 1,221 |
| 992 |
| 3 |
| 3 |
|
| Shares Redeemed |
| (2,158 | ) | (4,182 | ) | (9 | ) | — |
|
| Net Increase (Decrease) in Class B Shares Outstanding |
| 2,814 |
| 317 |
| (4 | ) | 11 |
|
† Capital share transactions prior to March 17, 2006 for the Emerging Markets Debt Portfolio have been restated to reflect the effect of a reverse stock split as described in the Notes to Financial Statements.
The accompanying notes are an integral part of the financial statements.
150
| 2006 Annual Report |
|
|
| December 31, 2006 |
Financial Highlights
Active International Allocation Portfolio
|
| Class A |
| |||||||||||||
|
| Year Ended December 31, |
| |||||||||||||
Selected Per Share Data and Ratios |
| 2006 |
| 2005 |
| 2004 |
| 2003 |
| 2002 |
| |||||
Net Asset Value, Beginning of Period |
| $ | 12.43 |
| $ | 10.96 |
| $ | 9.58 |
| $ | 7.30 |
| $ | 8.65 |
|
Income (Loss) from Investment Operations |
|
|
|
|
|
|
|
|
|
|
| |||||
Net Investment Income (Loss)† |
| 0.27 |
| 0.21 |
| 0.13 |
| 0.13 |
| 0.13 |
| |||||
Net Realized and Unrealized Gain (Loss) on Investments |
| 2.75 |
| 1.40 |
| 1.46 |
| 2.32 |
| (1.26 | ) | |||||
Total from Investment Operations |
| 3.02 |
| 1.61 |
| 1.59 |
| 2.45 |
| (1.13 | ) | |||||
Distributions from and/or in Excess of: |
|
|
|
|
|
|
|
|
|
|
| |||||
Net Investment Income |
| (0.35 | ) | (0.14 | ) | (0.21 | ) | (0.17 | ) | (0.22 | ) | |||||
Redemption Fees |
| 0.00 | ‡ | 0.00 | ‡ | — |
| — |
| — |
| |||||
Net Asset Value, End of Period |
| $ | 15.10 |
| $ | 12.43 |
| $ | 10.96 |
| $ | 9.58 |
| $ | 7.30 |
|
Total Return |
| 24.34 | % | 14.85 | % | 16.64 | % | 33.65 | % | (13.11 | )% | |||||
Ratios and Supplemental Data: |
|
|
|
|
|
|
|
|
|
|
| |||||
Net Assets, End of Period (Thousands) |
| $ | 967,361 |
| $ | 792,329 |
| $ | 580,851 |
| $ | 353,488 |
| $ | 249,742 |
|
Ratio of Expenses to Average Net Assets (1) |
| 0.80 | % | 0.80 | % | 0.80 | % | 0.80 | % | 0.80 | % | |||||
Ratio of Expenses to Average Net Assets Excluding Bank Overdraft Expense |
| 0.80 | % | 0.80 | % | 0.80 | % | 0.80 | % | N/A |
| |||||
Ratio of Net Investment Income (Loss) to Average Net Assets(1) |
| 1.99 | % | 1.84 | % | 1.28 | % | 1.66 | % | 1.57 | % | |||||
Portfolio Turnover Rate |
| 16 | % | 24 | % | 24 | % | 55 | % | 42 | % | |||||
(1) Supplemental Information on the Ratios to Average Net Assets: |
|
|
|
|
|
|
|
|
|
|
|
Ratios before expense limitation: |
|
|
|
|
|
|
|
|
|
|
|
Expenses to Average Net Assets |
| 0.82 | % | 0.83 | % | 0.91 | % | 0.96 | % | 0.93 | % |
Net Investment Income (Loss) to Average Net Assets |
| 1.97 | % | 1.81 | % | 1.18 | % | 1.50 | % | 1.44 | % |
|
| Class B |
| |||||||||||||
|
| Year Ended December 31, |
| |||||||||||||
Selected Per Share Data and Ratios |
| 2006 |
| 2005 |
| 2004 |
| 2003 |
| 2002 |
| |||||
Net Asset Value, Beginning of Period |
| $ | 12.64 |
| $ | 11.13 |
| $ | 9.72 |
| $ | 7.41 |
| $ | 8.77 |
|
Income (Loss) from Investment Operations |
|
|
|
|
|
|
|
|
|
|
| |||||
Net Investment Income (Loss)† |
| 0.22 |
| 0.19 |
| 0.10 |
| 0.12 |
| 0.11 |
| |||||
Net Realized and Unrealized Gain (Loss) on Investments |
| 2.81 |
| 1.43 |
| 1.35 |
| 2.33 |
| (1.27 | ) | |||||
Total from Investment Operations |
| 3.03 |
| 1.62 |
| 1.45 |
| 2.45 |
| (1.16 | ) | |||||
Distributions from and/or in Excess of: |
|
|
|
|
|
|
|
|
|
|
| |||||
Net Investment Income |
| (0.31 | ) | (0.11 | ) | (0.17 | ) | (0.14 | ) | (0.20 | ) | |||||
Redemption Fees |
| 0.00 | ‡ | 0.00 | ‡ | 0.13 |
| — |
| — |
| |||||
Net Asset Value, End of Period |
| $ | 15.36 |
| $ | 12.64 |
| $ | 11.13 |
| $ | 9.72 |
| $ | 7.41 |
|
Total Return |
| 23.95 | % | 14.67 | % | 16.29 | % | 33.13 | % | (13.29 | )% | |||||
Ratios and Supplemental Data: |
|
|
|
|
|
|
|
|
|
|
| |||||
Net Assets, End of Period (Thousands) |
| $ | 3,573 |
| $ | 2,215 |
| $ | 2,623 |
| $ | 5,635 |
| $ | 8,418 |
|
Ratio of Expenses to Average Net Assets (2) |
| 1.05 | % | 1.05 | % | 1.05 | % | 1.05 | % | 1.05 | % | |||||
Ratio of Expenses to Average Net Assets Excluding Bank Overdraft Expense |
| 1.05 | % | 1.05 | % | 1.05 | % | 1.05 | % | N/A |
| |||||
Ratio of Net Investment Income (Loss) to Average Net Assets (2) |
| 1.61 | % | 1.69 | % | 1.03 | % | 1.41 | % | 1.32 | % | |||||
Portfolio Turnover Rate |
| 16 | % | 24 | % | 24 | % | 55 | % | 42 | % | |||||
(2) Supplemental Information on the Ratios to Average Net Assets: |
|
|
|
|
|
|
|
|
|
|
|
Ratios before expense limitation: |
|
|
|
|
|
|
|
|
|
|
|
Expenses to Average Net Assets |
| 1.07 | % | 1.08 | % | 1.16 | % | 1.21 | % | 1.18 | % |
Net Investment Income (Loss) to Average Net Assets |
| 1.59 | % | 1.66 | % | 0.92 | % | 1.25 | % | 1.19 | % |
† Per share amount is based on average shares outstanding.
‡ Amount is less than $0.005 per share.
The accompanying notes are an integral part of the financial statements.
151
2006 Annual Report |
|
|
|
December 31, 2006 |
|
Financial Highlights
Emerging Markets Portfolio
|
| Class A |
| |||||||||||||
|
| Year Ended December 31, |
| |||||||||||||
Selected Per Share Data and Ratios |
| 2006 |
| 2005 |
| 2004 |
| 2003 |
| 2002 |
| |||||
Net Asset Value, Beginning of Period |
| $ | 25.36 |
| $ | 19.10 |
| $ | 15.52 |
| $ | 10.13 |
| $ | 10.81 |
|
Income (Loss) from Investment Operations |
|
|
|
|
|
|
|
|
|
|
| |||||
Net Investment Income (Loss)† |
| 0.18 |
| 0.25 |
| 0.19 |
| 0.14 |
| 0.04 |
| |||||
Net Realized and Unrealized Gain (Loss) on Investments |
| 9.22 |
| 6.36 |
| 3.54 |
| 5.44 |
| (0.71 | ) | |||||
Total from Investment Operations |
| 9.40 |
| 6.61 |
| 3.73 |
| 5.58 |
| (0.67 | ) | |||||
Distributions from and/or in Excess of: |
|
|
|
|
|
|
|
|
|
|
| |||||
Net Investment Income |
| (0.29 | ) | (0.35 | ) | (0.15 | ) | (0.18 | ) | (0.01 | ) | |||||
Net Realized Gain |
| (5.18 | ) |
|
|
|
|
|
|
|
| |||||
Return of Capital |
| — |
| — |
| — |
| (0.01 | ) | — |
| |||||
Total Distributions |
| (5.47 | ) | (0.35 | ) | (0.15 | ) | (0.19 | ) | (0.01 | ) | |||||
Redemption Fees |
| 0.00 | ‡ | 0.00 | ‡ | 0.00 | ‡ | 0.00 | ‡ | — |
| |||||
Net Asset Value, End of Period |
| $ | 29.29 |
| $ | 25.36 |
| $ | 19.10 |
| $ | 15.52 |
| $ | 10.13 |
|
Total Return |
| 38.00 | % | 34.54 | % | 24.09 | % | 55.08 | % | (6.24 | )% | |||||
Ratios and Supplemental Data: |
|
|
|
|
|
|
|
|
|
|
| |||||
Net Assets, End of Period (Thousands) |
| $ | 2,283,535 |
| $ | 1,749,671 |
| $ | 1,249,299 |
| $ | 1,020,353 |
| $ | 657,203 |
|
Ratio of Expenses to Average Net Assets |
| 1.40 | % | 1.41 | % | 1.52 | %^^ | 1.64 | % | 1.65 | % | |||||
Ratio of Expenses to Average Net Assets Excluding Capital Gain Country Tax Expense and Bank Overdraft Expense |
| 1.40 | % | 1.41 | % | 1.52 | % | 1.61 | % | 1.58 | % | |||||
Ratio of Net Investment Income (Loss) to Average Net Assets |
| 0.62 | % | 1.17 | % | 1.09 | % | 1.15 | % | 0.35 | % | |||||
Portfolio Turnover Rate |
| 82 | % | 59 | % | 73 | % | 92 | % | 91 | % | |||||
|
| Class B |
| |||||||||||||
|
| Year Ended December 31, |
| |||||||||||||
Selected Per Share Data and Ratios |
| 2006 |
| 2005 |
| 2004 |
| 2003 |
| 2002 |
| |||||
Net Asset Value, Beginning of Period |
| $ | 25.07 |
| $ | 18.90 |
| $ | 15.36 |
| $ | 10.06 |
| $ | 10.73 |
|
Income (Loss) from Investment Operations |
|
|
|
|
|
|
|
|
|
|
| |||||
Net Investment Income (Loss)† |
| 0.13 |
| 0.19 |
| 0.15 |
| 0.11 |
| 0.01 |
| |||||
Net Realized and Unrealized Gain (Loss) on Investments |
| 9.09 |
| 6.26 |
| 3.49 |
| 5.35 |
| (0.68 | ) | |||||
Total from Investment Operations |
| 9.22 |
| 6.45 |
| 3.64 |
| 5.46 |
| (0.67 | ) | |||||
Distributions from and/or in Excess of: |
|
|
|
|
|
|
|
|
|
|
| |||||
Net Investment Income |
| (0.20 | ) | (0.29 | ) | (0.11 | ) | (0.15 | ) | — |
| |||||
Net Realized Gain |
| (5.18 | ) |
|
|
|
|
|
|
|
| |||||
Return of Capital |
| — |
| — |
| — |
| (0.01 | ) | — |
| |||||
Total Distributions |
| (5.38 | ) | (0.29 | ) | (0.11 | ) | (0.16 | ) | — |
| |||||
Redemption Fees |
| 0.00 | ‡ | 0.01 |
| 0.01 |
| — |
| — |
| |||||
Net Asset Value, End of Period |
| $ | 28.91 |
| $ | 25.07 |
| $ | 18.90 |
| $ | 15.36 |
| $ | 10.06 |
|
Total Return |
| 37.65 | % | 34.17 | % | 23.84 | % | 54.31 | % | (6.24 | )% | |||||
Ratios and Supplemental Data: |
|
|
|
|
|
|
|
|
|
|
| |||||
Net Assets, End of Period (Thousands) |
| $ | 126,450 |
| $ | 103,482 |
| $ | 71,254 |
| $ | 42,046 |
| $ | 13,208 |
|
Ratio of Expenses to Average Net Assets |
| 1.65 | % | 1.66 | % | 1.77 | %^^ | 1.89 | % | 1.90 | % | |||||
Ratio of Expenses to Average Net Assets Excluding Capital Gain Country Tax Expense and Bank Overdraft Expense |
| 1.65 | % | 1.66 | % | 1.77 | % | 1.86 | % | 1.83 | % | |||||
Ratio of Net Investment Income (Loss) to Average Net Assets |
| 0.47 | % | 0.90 | % | 0.89 | % | 0.90 | % | 0.10 | % | |||||
Portfolio Turnover Rate |
| 82 | % | 59 | % | 73 | % | 92 | % | 91 | % | |||||
† Per share amount is based on average shares outstanding.
‡ Amount is less than $0.005 per share.
^^ Effective November 1, 2004, the Adviser has voluntarily agreed to limit the ratio of expenses to average net assets to the maximum ratio of 1.65% for Class A and 1.90% for Class B shares. Prior to November 1, 2004, the maximum ratios were 1.75% for Class A and 2.00% for Class B shares.
The accompanying notes are an integral part of the financial statements.
152
| 2006 Annual Report |
|
|
| December 31, 2006 |
Financial Highlights
Global Franchise Portfolio
|
| Class A |
| |||||||||||||
|
| Year Ended December 31, |
| |||||||||||||
Selected Per Share Data and Ratios |
| 2006 |
| 2005 |
| 2004 |
| 2003 |
| 2002 |
| |||||
Net Asset Value, Beginning of Period |
| $ | 15.69 |
| $ | 15.12 |
| $ | 14.29 |
| $ | 11.29 |
| $ | 10.48 |
|
Income (Loss) from Investment Operations |
|
|
|
|
|
|
|
|
|
|
| |||||
Net Investment Income (Loss)† |
| 0.30 |
| 0.26 |
| 0.27 |
| 0.23 |
| 0.17 |
| |||||
Net Realized and Unrealized Gain (Loss) on Investments |
| 3.07 |
| 1.52 |
| 1.66 |
| 2.91 |
| 0.68 |
| |||||
Total from Investment Operations |
| 3.37 |
| 1.78 |
| 1.93 |
| 3.14 |
| 0.85 |
| |||||
Distributions from and/or in Excess of: |
|
|
|
|
|
|
|
|
|
|
| |||||
Net Investment Income |
| (0.13 | ) | (0.31 | ) | — |
| (0.03 | ) | — |
| |||||
Net Realized Gain |
| (0.95 | ) | (0.90 | ) | (1.13 | ) | (0.11 | ) | (0.04 | ) | |||||
Total Distributions |
| (1.08 | ) | (1.21 | ) | (1.13 | ) | (0.14 | ) | (0.04 | ) | |||||
Redemption Fees |
| 0.00 | ‡ | 0.00 | ‡ | 0.03 |
| 0.00 | ‡ | — |
| |||||
Net Asset Value, End of Period |
| $ | 17.98 |
| $ | 15.69 |
| $ | 15.12 |
| $ | 14.29 |
| $ | 11.29 |
|
Total Return |
| 21.60 | % | 11.91 | % | 13.77 | % | 27.92 | % | 8.10 | % | |||||
Ratios and Supplemental Data: |
|
|
|
|
|
|
|
|
|
|
| |||||
Net Assets, End of Period (Thousands) |
| $ | 128,434 |
| $ | 85,018 |
| $ | 58,223 |
| $ | 79,756 |
| $ | 48,644 |
|
Ratio of Expenses to Average Net Assets (1) |
| 1.00 | % | 1.00 | % | 1.00 | % | 1.00 | % | 1.00 | % | |||||
Ratio of Expenses to Average Net Assets Excluding Bank Overdraft Expense |
| 1.00 | % | 1.00 | % | N/A |
| N/A |
| N/A |
| |||||
Ratio of Net Investment Income (Loss) to Average Net Assets (1) |
| 1.74 | % | 1.67 | % | 1.82 | % | 1.91 | % | 1.41 | % | |||||
Portfolio Turnover Rate |
| 35 | % | 19 | % | 21 | % | 32 | % | 62 | % | |||||
(1) Supplemental Information on the Ratios to Average Net Assets: |
|
|
|
|
|
|
|
|
|
|
|
Ratios before expense limitation: |
|
|
|
|
|
|
|
|
|
|
|
Expenses to Average Net Assets |
| 1.01 | % | 1.07 | % | 1.16 | % | 1.23 | % | 1.28 | % |
Net Investment Income (Loss) to Average Net Assets |
| 1.73 | % | 1.60 | % | 1.66 | % | 1.68 | % | 1.13 | % |
|
| Class B |
| |||||||||||||
|
| Year Ended December 31, |
| |||||||||||||
Selected Per Share Data and Ratios |
| 2006 |
| 2005 |
| 2004 |
| 2003 |
| 2002 |
| |||||
Net Asset Value, Beginning of Period |
| $ | 15.56 |
| $ | 15.01 |
| $ | 14.22 |
| $ | 11.24 |
| $ | 10.46 |
|
Income (Loss) from Investment Operations |
|
|
|
|
|
|
|
|
|
|
| |||||
Net Investment Income (Loss)† |
| 0.24 |
| 0.24 |
| 0.22 |
| 0.22 |
| 0.11 |
| |||||
Net Realized and Unrealized Gain (Loss) on Investments |
| 3.04 |
| 1.48 |
| 1.69 |
| 2.88 |
| 0.71 |
| |||||
Total from Investment Operations |
| 3.28 |
| 1.72 |
| 1.91 |
| 3.10 |
| 0.82 |
| |||||
Distributions from and/or in Excess of: |
|
|
|
|
|
|
|
|
|
|
| |||||
Net Investment Income |
| (0.07 | ) | (0.27 | ) | — |
| (0.01 | ) | — |
| |||||
Net Realized Gain |
| (0.95 | ) | (0.90 | ) | (1.13 | ) | (0.11 | ) | (0.04 | ) | |||||
Total Distributions |
| (1.02 | ) | (1.17 | ) | (1.13 | ) | (0.12 | ) | (0.04 | ) | |||||
Redemption Fees |
| 0.00 | ‡ | — |
| 0.01 |
| — |
| — |
| |||||
Net Asset Value, End of Period |
| $ | 17.82 |
| $ | 15.56 |
| $ | 15.01 |
| $ | 14.22 |
| $ | 11.24 |
|
Total Return |
| 21.31 | % | 11.53 | % | 13.56 | % | 27.62 | % | 7.82 | % | |||||
Ratios and Supplemental Data: |
|
|
|
|
|
|
|
|
|
|
| |||||
Net Assets, End of Period (Thousands) |
| $ | 4,135 |
| $ | 4,401 |
| $ | 3,941 |
| $ | 2,682 |
| $ | 1,427 |
|
Ratio of Expenses to Average Net Assets (2) |
| 1.25 | % | 1.25 | % | 1.25 | % | 1.25 | % | 1.25 | % | |||||
Ratio of Expenses to Average Net Assets Excluding Bank Overdraft Expense |
| 1.25 | % | 1.25 | % | N/A |
| N/A |
| N/A |
| |||||
Ratio of Net Investment Income (Loss) to Average Net Assets (2) |
| 1.43 | % | 1.52 | % | 1.47 | % | 1.66 | % | 1.16 | % | |||||
Portfolio Turnover Rate |
| 35 | % | 19 | % | 21 | % | 32 | % | 62 | % | |||||
(2) Supplemental Information on the Ratios to Average Net Assets: |
|
|
|
|
|
|
|
|
|
|
|
Ratios before expense limitation: |
|
|
|
|
|
|
|
|
|
|
|
Expenses to Average Net Assets |
| 1.26 | % | 1.32 | % | 1.41 | % | 1.48 | % | 1.53 | % |
Net Investment Income (Loss) to Average Net Assets |
| 1.42 | % | 1.45 | % | 1.31 | % | 1.43 | % | 0.88 | % |
† Per share amount is based on average shares outstanding.
‡ Amount is less than $0.005 per share.
The accompanying notes are an integral part of the financial statements.
153
2006 Annual Report |
|
|
|
December 31, 2006 |
|
Financial Highlights
Global Real Estate Portfolio
|
| Class A |
| |
|
| Period from |
| |
|
| August 30, 2006^ |
| |
Selected Per Share Data and Ratios |
| to December 31, 2006 |
| |
Net Asset Value, Beginning of Period |
| $ | 10.00 |
|
Income (Loss) from Investment Operations |
|
|
| |
Net Investment Income (Loss)† |
| 0.06 |
| |
Net Realized and Unrealized Gain (Loss) on Investments |
| 1.66 |
| |
Total from Investment Operations |
| 1.72 |
| |
Distributions from and/or in Excess of: |
|
|
| |
Net Investment Income |
| (0.13 | ) | |
Net Realized Gain |
| (0.03 | ) | |
Total Distributions |
| (0.16 | ) | |
Redemption Fees |
| 0.00 | ‡ | |
Net Asset Value, End of Period |
| $ | 11.56 |
|
Total Return |
| 17.20 | %# | |
Ratios and Supplemental Data: |
|
|
| |
Net Assets, End of Period (Thousands) |
| $ | 238,647 |
|
Ratio of Expenses to Average Net Assets (1) |
| 1.05 | %* | |
Ratio of Net Investment Income (Loss) to Average Net Assets (1) |
| 1.53 | %* | |
Portfolio Turnover Rate |
| 4 | %# | |
(1) Supplemental Information on the Ratios to Average Net Assets: |
|
|
|
Ratios before expense limitation: |
|
|
|
Expenses to Average Net Assets |
| 1.15 | %* |
Net Investment Income (Loss) to Average Net Assets |
| 1.43 | %* |
|
| Class B |
| |
|
| Period from |
| |
|
| August 30, 2006^ |
| |
Selected Per Share Data and Ratios |
| to December 31, 2006 |
| |
Net Asset Value, Beginning of Period |
| $ | 10.00 |
|
Income (Loss) from Investment Operations |
|
|
| |
Net Investment Income (Loss)† |
| 0.04 |
| |
Net Realized and Unrealized Gain (Loss) on Investments |
| 1.67 |
| |
Total from Investment Operations |
| 1.71 |
| |
Distributions from and/or in Excess of: |
|
|
| |
Net Investment Income |
| (0.12 | ) | |
Net Realized Gain |
| (0.03 | ) | |
Total Distributions |
| (0.15 | ) | |
Redemption Fees |
| 0.00 | ‡ | |
Net Asset Value, End of Period |
| $ | 11.56 |
|
Total Return |
| 17.11 | %# | |
Ratios and Supplemental Data: |
|
|
| |
Net Assets, End of Period (Thousands) |
| $ | 116 |
|
Ratio of Expenses to Average Net Assets (2) |
| 1.30 | %* | |
Ratio of Net Investment Income (Loss) to Average Net Assets (2) |
| 1.07 | %* | |
Portfolio Turnover Rate |
| 4 | %# | |
(2) Supplemental Information on the Ratios to Average Net Assets: |
|
|
|
Ratios before expense limitation: |
|
|
|
Expenses to Average Net Assets |
| 1.41 | %* |
Net Investment Income (Loss) to Average Net Assets |
| 0.96 | %* |
† Per share amount is based on average shares outstanding.
‡ Amount is less than $0.005 per share.
^ Commencement of operations.
# Not annualized
* Annualized
The accompanying notes are an integral part of the financial statements.
154
| 2006 Annual Report |
|
|
| December 31, 2006 |
Financial Highlights
Global Value Equity Portfolio
|
| Class A |
| |||||||||||||
|
| Year Ended December 31, |
| |||||||||||||
Selected Per Share Data and Ratios |
| 2006 |
| 2005 |
| 2004 |
| 2003 |
| 2002 |
| |||||
Net Asset Value, Beginning of Period |
| $ | 17.85 |
| $ | 17.81 |
| $ | 15.84 |
| $ | 12.46 |
| $ | 15.45 |
|
Income (Loss) from Investment Operations |
|
|
|
|
|
|
|
|
|
|
| |||||
Net Investment Income (Loss)† |
| 0.33 |
| 0.31 |
| 0.22 |
| 0.19 |
| 0.15 |
| |||||
Net Realized and Unrealized Gain (Loss) on Investments |
| 3.44 |
| 0.72 |
| 2.02 |
| 3.42 |
| (2.82 | ) | |||||
Total from Investment Operations |
| 3.77 |
| 1.03 |
| 2.24 |
| 3.61 |
| (2.67 | ) | |||||
Distributions from and/or in Excess of: |
|
|
|
|
|
|
|
|
|
|
| |||||
Net Investment Income |
| (0.34 | ) | (0.31 | ) | (0.22 | ) | (0.16 | ) | (0.20 | ) | |||||
Net Realized Gain |
| (1.05 | ) | (0.68 | ) | (0.05 | ) | (0.08 | ) | (0.12 | ) | |||||
Total Distributions |
| (1.39 | ) | (0.99 | ) | (0.27 | ) | (0.24 | ) | (0.32 | ) | |||||
Redemption Fees |
| 0.01 |
| 0.00 | ‡ | 0.00 | ‡ | 0.01 |
| — |
| |||||
Net Asset Value, End of Period |
| $ | 20.24 |
| $ | 17.85 |
| $ | 17.81 |
| $ | 15.84 |
| $ | 12.46 |
|
Total Return |
| 21.40 | % | 5.81 | % | 14.13 | % | 29.21 | % | (17.34 | )% | |||||
Ratios and Supplemental Data: |
|
|
|
|
|
|
|
|
|
|
| |||||
Net Assets, End of Period (Thousands) |
| $ | 101,163 |
| $ | 86,000 |
| $ | 68,505 |
| $ | 55,545 |
| $ | 34,297 |
|
Ratio of Expenses to Average Net Assets (1) |
| 0.91 | % | 0.90 | % | 1.00 | % | 1.00 | % | 1.00 | % | |||||
Ratio of Expenses to Average Net Assets Excluding Bank Overdraft Expense |
| N/A |
| N/A |
| 1.00 | % | 1.00 | % | N/A |
| |||||
Ratio of Net Investment Income (Loss) to Average Net Assets (1) |
| 1.71 | % | 1.74 | % | 1.31 | % | 1.44 | % | 1.08 | % | |||||
Portfolio Turnover Rate |
| 29 | % | 29 | % | 30 | % | 53 | % | 42 | % | |||||
(1) Supplemental Information on the Ratios to Average Net Assets: |
|
|
|
|
|
|
|
|
|
|
|
Ratios before expense limitation: |
|
|
|
|
|
|
|
|
|
|
|
Expenses to Average Net Assets |
| N/A |
| N/A |
| 1.07 | % | 1.20 | % | 1.12 | % |
Net Investment Income (Loss) to Average Net Assets |
| N/A |
| N/A |
| 1.24 | % | 1.24 | % | 0.96 | % |
|
| Class B |
| |||||||||||||
|
| Year Ended December 31, |
| |||||||||||||
Selected Per Share Data and Ratios |
| 2006 |
| 2005 |
| 2004 |
| 2003 |
| 2002 |
| |||||
Net Asset Value, Beginning of Period |
| $ | 17.69 |
| $ | 17.64 |
| $ | 15.70 |
| $ | 12.35 |
| $ | 15.33 |
|
Income (Loss) from Investment Operations |
|
|
|
|
|
|
|
|
|
|
| |||||
Net Investment Income (Loss)† |
| 0.28 |
| 0.27 |
| 0.17 |
| 0.16 |
| 0.12 |
| |||||
Net Realized and Unrealized Gain (Loss) on Investments |
| 3.40 |
| 0.71 |
| 2.00 |
| 3.40 |
| (2.82 | ) | |||||
Total from Investment Operations |
| 3.68 |
| 0.98 |
| 2.17 |
| 3.56 |
| (2.70 | ) | |||||
Distributions from and/or in Excess of: |
|
|
|
|
|
|
|
|
|
|
| |||||
Net Investment Income |
| (0.29 | ) | (0.25 | ) | (0.18 | ) | (0.13 | ) | (0.16 | ) | |||||
Net Realized Gain |
| (1.05 | ) | (0.68 | ) | (0.05 | ) | (0.08 | ) | (0.12 | ) | |||||
Total Distributions |
| (1.34 | ) | (0.93 | ) | (0.23 | ) | (0.21 | ) | (0.28 | ) | |||||
Redemption Fees |
| 0.00 | ‡ | 0.00 | ‡ | 0.00 | ‡ | — |
| — |
| |||||
Net Asset Value, End of Period |
| $ | 20.03 |
| $ | 17.69 |
| $ | 17.64 |
| $ | 15.70 |
| $ | 12.35 |
|
Total Return |
| 21.05 | % | 5.59 | % | 13.78 | % | 28.95 | % | (17.63 | )% | |||||
Ratios and Supplemental Data: |
|
|
|
|
|
|
|
|
|
|
| |||||
Net Assets, End of Period (Thousands) |
| $ | 27,773 |
| $ | 21,938 |
| $ | 30,598 |
| $ | 32,761 |
| $ | 26,866 |
|
Ratio of Expenses to Average Net Assets (2) |
| 1.16 | % | 1.15 | % | 1.25 | % | 1.25 | % | 1.25 | % | |||||
Ratio of Expenses to Average Net Assets Excluding Bank Overdraft Expense |
| N/A |
| N/A |
| 1.25 | % | 1.25 | % | N/A |
| |||||
Ratio of Net Investment Income (Loss) to Average Net Assets (2) |
| 1.47 | % | 1.53 | % | 1.07 | % | 1.19 | % | 0.83 | % | |||||
Portfolio Turnover Rate |
| 29 | % | 29 | % | 30 | % | 53 | % | 42 | % | |||||
(2) Supplemental Information on the Ratios to Average Net Assets: |
|
|
|
|
|
|
|
|
|
|
|
Ratios before expense limitation: |
|
|
|
|
|
|
|
|
|
|
|
Expenses to Average Net Assets |
| N/A |
| N/A |
| 1.32 | % | 1.45 | % | 1.37 | % |
Net Investment Income (Loss) to Average Net Assets |
| N/A |
| N/A |
| 0.99 | % | 0.99 | % | 0.71 | % |
† Per share amount is based on average shares outstanding.
‡ Amount is less than $0.005 per share.
The accompanying notes are an integral part of the financial statements.
155
2006 Annual Report |
|
|
|
December 31, 2006 |
|
Financial Highlights
International Equity Portfolio
|
| Class A |
| |||||||||||||
|
| Year Ended December 31, |
| |||||||||||||
Selected Per Share Data and Ratios |
| 2006 |
| 2005 |
| 2004 |
| 2003 |
| 2002 |
| |||||
Net Asset Value, Beginning of Period |
| $ | 20.34 |
| $ | 20.99 |
| $ | 19.06 |
| $ | 14.60 |
| $ | 15.59 |
|
Income (Loss) from Investment Operations |
|
|
|
|
|
|
|
|
|
|
| |||||
Net Investment Income (Loss)† |
| 0.64 |
| 0.43 |
| 0.30 |
| 0.24 |
| 0.19 |
| |||||
Net Realized and Unrealized Gain (Loss) on Investments |
| 3.93 |
| 0.93 |
| 3.50 |
| 4.54 |
| (0.82 | ) | |||||
Total from Investment Operations |
| 4.57 |
| 1.36 |
| 3.80 |
| 4.78 |
| (0.63 | ) | |||||
Distributions from and/or in Excess of: |
|
|
|
|
|
|
|
|
|
|
| |||||
Net Investment Income |
| (0.59 | ) | (0.35 | ) | (0.37 | ) | (0.32 | ) | (0.33 | ) | |||||
Net Realized Gain |
| (3.74 | ) | (1.66 | ) | (1.50 | ) | — |
| (0.03 | ) | |||||
Total Distributions |
| (4.33 | ) | (2.01 | ) | (1.87 | ) | (0.32 | ) | (0.36 | ) | |||||
Redemption Fees |
| 0.00 | ‡ | 0.00 | ‡ | 0.00 | ‡ | 0.00 | ‡ | — |
| |||||
Net Asset Value, End of Period |
| $ | 20.58 |
| $ | 20.34 |
| $ | 20.99 |
| $ | 19.06 |
| $ | 14.60 |
|
Total Return |
| 22.50 | % | 6.45 | % | 19.96 | % | 32.82 | % | (4.02 | )% | |||||
Ratios and Supplemental Data: |
|
|
|
|
|
|
|
|
|
|
| |||||
Net Assets, End of Period (Thousands) |
| $ | 5,900,906 |
| $ | 6,704,732 |
| $ | 7,200,606 |
| $ | 5,657,941 |
| $ | 3,953,655 |
|
Ratio of Expenses to Average Net Assets (1) |
| 0.94 | % | 0.93 | % | 0.98 | % | 1.00 | % | 1.00 | % | |||||
Ratio of Expenses to Average Net Assets Excluding Bank Overdraft Expense |
| 0.94 | % | 0.93 | % | N/A |
| N/A |
| N/A |
| |||||
Ratio of Net Investment Income (Loss) to Average Net Assets (1) |
| 2.88 | % | 2.04 | % | 1.48 | % | 1.48 | % | 1.24 | % | |||||
Portfolio Turnover Rate |
| 38 | % | 28 | % | 41 | % | 45 | % | 51 | % | |||||
(1) Supplemental Information on the Ratios to Average Net Assets: |
|
|
|
|
|
|
|
|
|
|
|
Ratios before expense limitation: |
|
|
|
|
|
|
|
|
|
|
|
Expenses to Average Net Assets |
| N/A |
| N/A |
| N/A |
| 1.02 | % | 1.00 | % |
Net Investment Income (Loss) to Average Net Assets |
| N/A |
| N/A |
| N/A |
| 1.46 | % | 1.24 | % |
|
| Class B |
| |||||||||||||
|
| Year Ended December 31, |
| |||||||||||||
Selected Per Share Data and Ratios |
| 2006 |
| 2005 |
| 2004 |
| 2003 |
| 2002 |
| |||||
Net Asset Value, Beginning of Period |
| $ | 20.19 |
| $ | 20.85 |
| $ | 18.96 |
| $ | 14.53 |
| $ | 15.53 |
|
Income (Loss) from Investment Operations |
|
|
|
|
|
|
|
|
|
|
| |||||
Net Investment Income (Loss)† |
| 0.60 |
| 0.37 |
| 0.24 |
| 0.18 |
| 0.12 |
| |||||
Net Realized and Unrealized Gain (Loss) on Investments |
| 3.87 |
| 0.93 |
| 3.47 |
| 4.54 |
| (0.78 | ) | |||||
Total from Investment Operations |
| 4.47 |
| 1.30 |
| 3.71 |
| 4.72 |
| (0.66 | ) | |||||
Distributions from and/or in Excess of: |
|
|
|
|
|
|
|
|
|
|
| |||||
Net Investment Income |
| (0.52 | ) | (0.30 | ) | (0.32 | ) | (0.29 | ) | (0.31 | ) | |||||
Net Realized Gain |
| (3.74 | ) | (1.66 | ) | (1.50 | ) | — |
| (0.03 | ) | |||||
Total Distributions |
| (4.26 | ) | (1.96 | ) | (1.82 | ) | (0.29 | ) | (0.34 | ) | |||||
Redemption Fees |
| 0.00 | ‡ | 0.00 | ‡ | 0.00 | ‡ | 0.00 | ‡ | — |
| |||||
Net Asset Value, End of Period |
| $ | 20.40 |
| $ | 20.19 |
| $ | 20.85 |
| $ | 18.96 |
| $ | 14.53 |
|
Total Return |
| 22.21 | % | 6.20 | % | 19.67 | % | 32.46 | % | (4.25 | )% | |||||
Ratios and Supplemental Data: |
|
|
|
|
|
|
|
|
|
|
| |||||
Net Assets, End of Period (Thousands) |
| $ | 1,152,822 |
| $ | 1,206,125 |
| $ | 1,073,278 |
| $ | 733,298 |
| $ | 439,422 |
|
Ratio of Expenses to Average Net Assets (2) |
| 1.19 | % | 1.18 | % | 1.23 | % | 1.25 | % | 1.25 | % | |||||
Ratio of Expenses to Average Net Assets Excluding Bank Overdraft Expense |
| 1.19 | % | 1.18 | % | N/A |
| N/A |
| N/A |
| |||||
Ratio of Net Investment Income (Loss) to Average Net Assets (2) |
| 2.71 | % | 1.77 | % | 1.21 | % | 1.23 | % | 0.99 | % | |||||
Portfolio Turnover Rate |
| 38 | % | 28 | % | 41 | % | 45 | % | 51 | % | |||||
(2) Supplemental Information on the Ratios to Average Net Assets: |
|
|
|
|
|
|
|
|
|
|
|
Ratios before expense limitation: |
|
|
|
|
|
|
|
|
|
|
|
Expenses to Average Net Assets |
| N/A |
| N/A |
| N/A |
| 1.27 | % | 1.25 | % |
Net Investment Income (Loss) to Average Net Assets |
| N/A |
| N/A |
| N/A |
| 1.21 | % | 0.99 | % |
† Per share amount is based on average shares outstanding.
‡ Amount is less than $0.005 per share.
The accompanying notes are an integral part of the financial statements.
156
| 2006 Annual Report |
|
|
| December 31, 2006 |
Financial Highlights
International Growth Equity Portfolio
|
| Class A |
| ||||
|
| Year Ended |
| Period from |
| ||
|
| December 31, |
| December 27, 2005^ |
| ||
Selected Per Share Data and Ratios |
| 2006 |
| to December 31, 2005 |
| ||
Net Asset Value, Beginning of Period |
| $ | 9.93 |
| $ | 10.00 |
|
Income (Loss) from Investment Operations |
|
|
|
|
| ||
Net Investment Income (Loss)† |
| 0.10 |
| (0.00 | )‡ | ||
Net Realized and Unrealized Gain (Loss) on Investments |
| 2.67 |
| (0.07 | ) | ||
Total from Investment Operations |
| 2.77 |
| (0.07 | ) | ||
Distributions from and/or in Excess of: |
|
|
|
|
| ||
Net Investment Income |
| (0.09 | ) | — |
| ||
Net Realized Gain |
| (0.06 | ) | — |
| ||
Total Distributions |
| (0.15 | ) | — |
| ||
Net Asset Value, End of Period |
| $ | 12.55 |
| $ | 9.93 |
|
Total Return |
| 27.92 | % | (0.70 | )%# | ||
Ratios and Supplemental Data: |
|
|
|
|
| ||
Net Assets, End of Period (Thousands) |
| $ | 6,753 |
| $ | 4,864 |
|
Ratio of Expenses to Average Net Assets (1) |
| 1.01 | % | 1.00 | %* | ||
Ratio of Expenses to Average Net Assets Excluding Bank Overdraft Expense |
| 1.00 | % | — |
| ||
Ratio of Net Investment Income (Loss) to Average Net Assets (1) |
| 0.89 | % | (0.86 | )%* | ||
Portfolio Turnover Rate |
| 24 | % | 4 | %# | ||
(1) Supplemental Information on the Ratios to Average Net Assets: |
|
|
|
|
|
Ratios before expense limitation: |
|
|
|
|
|
Expenses to Average Net Assets |
| 2.74 | % | 31.60 | %* |
Net Investment Income (Loss) to Average Net Assets |
| (0.84 | )% | (31.46 | )%* |
|
| Class B |
| ||||
|
| Year Ended |
| Period from |
| ||
|
| December 31, |
| December 27, 2005^ |
| ||
Selected Per Share Data and Ratios |
| 2006 |
| to December 31, 2005 |
| ||
Net Asset Value, Beginning of Period |
| $ | 9.93 |
| $ | 10.00 |
|
Income (Loss) from Investment Operations |
|
|
|
|
| ||
Net Investment Income (Loss)† |
| 0.09 |
| (0.00 | )‡ | ||
Net Realized and Unrealized Gain (Loss) on Investments |
| 2.64 |
| (0.07 | ) | ||
Total from Investment Operations |
| 2.73 |
| (0.07 | ) | ||
Distributions from and/or in Excess of: |
|
|
|
|
| ||
Net Investment Income |
| (0.04 | ) | — |
| ||
Net Realized Gain |
| (0.06 | ) | — |
| ||
Total Distributions |
| (0.10 | ) | — |
| ||
Net Asset Value, End of Period |
| $ | 12.56 |
| $ | 9.93 |
|
Total Return |
| 27.49 | % | (0.70 | )%# | ||
Ratios and Supplemental Data: |
|
|
|
|
| ||
Net Assets, End of Period (Thousands) |
| $ | 325 |
| $ | 99 |
|
Ratio of Expenses to Average Net Assets (2) |
| 1.27 | % | 1.25 | %* | ||
Ratio of Expenses to Average Net Assets Excluding Bank Overdraft Expense |
| 1.25 | % | — |
| ||
Ratio of Net Investment Income (Loss) to Average Net Assets (2) |
| 0.78 | % | (1.16 | )%* | ||
Portfolio Turnover Rate |
| 24 | % | 4 | %# | ||
(2) Supplemental Information on the Ratios to Average Net Assets: |
|
|
|
|
|
Ratios before expense limitation: |
|
|
|
|
|
Expenses to Average Net Assets |
| 3.07 | % | 31.85 | %* |
Net Investment Income (Loss) to Average Net Assets |
| (1.02 | )% | (31.76 | )%* |
† Per share amount is based on average shares outstanding.
^ Commencement of operations.
# Not annualized
* Annualized
‡ Amount is less than $0.005 per share.
The accompanying notes are an integral part of the financial statements.
157
2006 Annual Report |
|
|
|
December 31, 2006 |
|
Financial Highlights
International Magnum Portfolio
|
| Class A |
| ||||||||||||||||||
|
| Year Ended December 31, |
| ||||||||||||||||||
Selected Per Share Data and Ratios |
| 2006 |
| 2005 |
| 2004 |
| 2003 |
| 2002 |
| ||||||||||
Net Asset Value, Beginning of Period |
| $ | 13.01 |
| $ | 11.83 |
| $ | 10.20 |
| $ | 8.04 |
| $ | 9.34 |
| |||||
Income (Loss) from Investment Operations |
|
|
|
|
|
|
|
|
|
|
| ||||||||||
Net Investment Income (Loss)† |
| 0.20 |
| 0.18 |
| 0.13 |
| 0.11 |
| 0.07 |
| ||||||||||
Net Realized and Unrealized Gain (Loss) on Investments |
| 3.08 |
| 1.16 |
| 1.74 |
| 2.22 |
| (1.31 | ) | ||||||||||
Total from Investment Operations |
| 3.28 |
| 1.34 |
| 1.87 |
| 2.33 |
| (1.24 | ) | ||||||||||
Distributions from and/or in Excess of: |
|
|
|
|
|
|
|
|
|
|
| ||||||||||
Net Investment Income |
| (0.36 | ) | (0.16 | ) | (0.24 | ) | (0.17 | ) | (0.06 | ) | ||||||||||
Net Realized Gain |
| (1.88 | ) | — |
| — |
| — |
| — |
| ||||||||||
Total Distributions |
| (2.24 | ) | (0.16 | ) | (0.24 | ) | (0.17 | ) | (0.06 | ) | ||||||||||
Redemption Fees |
| 0.00 | ‡ | 0.00 | ‡ | — |
| — |
| — |
| ||||||||||
Net Asset Value, End of Period |
| $ | 14.05 |
| $ | 13.01 |
| $ | 11.83 |
| $ | 10.20 |
| $ | 8.04 |
| |||||
Total Return |
| 25.39 | % | 11.35 | % | 18.45 | % | 29.07 | % | (13.36 | )% | ||||||||||
Ratios and Supplemental Data: |
|
|
|
|
|
|
|
|
|
|
| ||||||||||
Net Assets, End of Period (Thousands) |
| $ | 116,443 |
| $ | 106,369 |
| $ | 94,162 |
| $ | 91,087 |
| $ | 68,275 |
| |||||
Ratio of Expenses to Average Net Assets (1) |
| 1.00 | % | 1.00 | % | 1.00 | % | 1.00 | % | 1.01 | % | ||||||||||
Ratio of Expenses to Average Net Assets Excluding Bank Overdraft Expense |
| 1.00 | % | 1.00 | % | 1.00 | % | 1.00 | % | 1.00 | % | ||||||||||
Ratio of Net Investment Income (Loss) to Average Net Assets (1) |
| 1.37 | % | 1.51 | % | 1.20 | % | 1.25 | % | 0.81 | % | ||||||||||
Portfolio Turnover Rate |
| 81 | % | 32 | % | 49 | % | 53 | % | 59 | % | ||||||||||
(1) Supplemental Information on the Ratios to Average Net Assets: |
|
|
|
|
|
|
|
|
|
|
|
Ratios before expense limitation: |
|
|
|
|
|
|
|
|
|
|
|
Expenses to Average Net Assets |
| 1.11 | % | 1.12 | % | 1.23 | % | 1.29 | % | 1.30 | % |
Net Investment Income (Loss) to Average Net Assets |
| 1.26 | % | 1.39 | % | 0.96 | % | 0.96 | % | 0.52 | % |
|
| Class B |
| |||||||||||||
|
| Year Ended December 31, |
| |||||||||||||
Selected Per Share Data and Ratios |
| 2006 |
| 2005 |
| 2004 |
| 2003 |
| 2002 |
| |||||
Net Asset Value, Beginning of Period |
| $ | 12.97 |
| $ | 11.80 |
| $ | 10.18 |
| $ | 8.04 |
| $ | 9.32 |
|
Income (Loss) from Investment Operations |
|
|
|
|
|
|
|
|
|
|
| |||||
Net Investment Income (Loss)† |
| 0.18 |
| 0.15 |
| 0.11 |
| 0.10 |
| 0.06 |
| |||||
Net Realized and Unrealized Gain (Loss) on Investments |
| 3.06 |
| 1.15 |
| 1.70 |
| 2.18 |
| (1.31 | ) | |||||
Total from Investment Operations |
| 3.24 |
| 1.30 |
| 1.81 |
| 2.28 |
| (1.25 | ) | |||||
Distributions from and/or in Excess of: |
|
|
|
|
|
|
|
|
|
|
| |||||
Net Investment Income |
| (0.32 | ) | (0.13 | ) | (0.22 | ) | (0.14 | ) | (0.03 | ) | |||||
Net Realized Gain |
| (1.88 | ) | — |
| — |
| — |
| — |
| |||||
Total Distributions |
| (2.20 | ) | (0.13 | ) | (0.22 | ) | (0.14 | ) | (0.03 | ) | |||||
Redemption Fees |
| 0.00 | ‡ | 0.00 | ‡ | 0.03 |
| 0.00 | ‡ | — |
| |||||
Net Asset Value, End of Period |
| $ | 14.01 |
| $ | 12.97 |
| $ | 11.80 |
| $ | 10.18 |
| $ | 8.04 |
|
Total Return |
| 25.10 | % | 11.04 | % | 18.15 | % | 28.49 | % | (13.49 | )% | |||||
Ratios and Supplemental Data: |
|
|
|
|
|
|
|
|
|
|
| |||||
Net Assets, End of Period (Thousands) |
| $ | 1,777 |
| $ | 3,634 |
| $ | 2,605 |
| $ | 2,232 |
| $ | 6,644 |
|
Ratio of Expenses to Average Net Assets (2) |
| 1.25 | % | 1.25 | % | 1.25 | % | 1.25 | % | 1.26 | % | |||||
Ratio of Expenses to Average Net Assets Excluding Bank Overdraft Expense |
| 1.25 | % | 1.25 | % | 1.25 | % | 1.25 | % | 1.25 | % | |||||
Ratio of Net Investment Income (Loss) to Average Net Assets (2) |
| 1.27 | % | 1.25 | % | 1.00 | % | 1.00 | % | 0.56 | % | |||||
Portfolio Turnover Rate |
| 81 | % | 32 | % | 49 | % | 53 | % | 59 | % | |||||
(2) Supplemental Information on the Ratios to Average Net Assets: |
|
|
|
|
|
|
|
|
|
|
|
Ratios before expense limitation: |
|
|
|
|
|
|
|
|
|
|
|
Expenses to Average Net Assets |
| 1.35 | % | 1.38 | % | 1.48 | % | 1.54 | % | 1.55 | % |
Net Investment Income (Loss) to Average Net Assets |
| 1.17 | % | 1.12 | % | 0.77 | % | 0.71 | % | 0.27 | % |
† Per share amount is based on average shares outstanding.
‡ Amount is less than $0.005 per share.
The accompanying notes are an integral part of the financial statements.
158
| 2006 Annual Report |
|
|
| December 31, 2006 |
Financial Highlights
International Real Estate Portfolio
|
| Class A |
| ||||||||||||||||||
|
| Year Ended December 31, |
| ||||||||||||||||||
Selected Per Share Data and Ratios |
| 2006 |
| 2005 |
| 2004 |
| 2003 |
| 2002 |
| ||||||||||
Net Asset Value, Beginning of Period |
| $ | 23.63 |
| $ | 21.95 |
| $ | 15.13 |
| $ | 10.93 |
| $ | 9.30 |
| |||||
Income (Loss) from Investment Operations |
|
|
|
|
|
|
|
|
|
|
| ||||||||||
Net Investment Income (Loss)† |
| 0.35 |
| 0.43 |
| 0.36 |
| 0.27 |
| 0.37 |
| ||||||||||
Net Realized and Unrealized Gain (Loss) on Investments |
| 12.78 |
| 2.96 |
| 6.82 |
| 4.35 |
| 1.90 |
| ||||||||||
Total from Investment Operations |
| 13.13 |
| 3.39 |
| 7.18 |
| 4.62 |
| 2.27 |
| ||||||||||
Distributions from and/or in Excess of: |
|
|
|
|
|
|
|
|
|
|
| ||||||||||
Net Investment Income |
| (0.85 | ) | (0.35 | ) | (0.36 | ) | (0.42 | ) | (0.64 | ) | ||||||||||
Net Realized Gain |
| (1.09 | ) | (1.36 | ) | — |
| — |
| — |
| ||||||||||
Total Distributions |
| (1.94 | ) | (1.71 | ) | (0.36 | ) | (0.42 | ) | (0.64 | ) | ||||||||||
Redemption Fees |
| 0.00 | ‡ | 0.00 | ‡ | 0.00 | ‡ | — |
| — |
| ||||||||||
Net Asset Value, End of Period |
| $ | 34.82 |
| $ | 23.63 |
| $ | 21.95 |
| $ | 15.13 |
| $ | 10.93 |
| |||||
Total Return |
| 56.06 | % | 15.52 | % | 47.49 | % | 42.41 | % | 24.52 | % | ||||||||||
Ratios and Supplemental Data: |
|
|
|
|
|
|
|
|
|
|
| ||||||||||
Net Assets, End of Period (Thousands) |
| $ | 1,125,569 |
| $ | 250,511 |
| $ | 50,620 |
| $ | 22,184 |
| $ | 19,215 |
| |||||
Ratio of Expenses to Average Net Assets (1) |
| 0.95 | % | 1.00 | % | 1.00 | % | 1.00 | % | 1.00 | % | ||||||||||
Ratio of Expenses to Average Net Assets Excluding Bank Overdraft Expense |
| 0.95 | % | 1.00 | % | 1.00 | % | 1.00 | % | N/A |
| ||||||||||
Ratio of Net Investment Income (Loss) to Average Net Assets (1) |
| 1.19 | % | 1.88 | % | 2.05 | % | 2.23 | % | 3.37 | % | ||||||||||
Portfolio Turnover Rate |
| 36 | % | 57 | % | 42 | % | 47 | % | 79 | % | ||||||||||
(1) Supplemental Information on the Ratios to Average Net Assets: |
|
|
|
|
|
|
|
|
|
|
|
Ratios before expense limitation: |
|
|
|
|
|
|
|
|
|
|
|
Expenses to Average Net Assets |
| N/A |
| 1.11 | % | 1.38 | % | 1.49 | % | 1.56 | % |
Net Investment Income (Loss) to Average Net Assets |
| N/A |
| 1.77 | % | 1.67 | % | 1.74 | % | 2.81 | % |
|
| Class B |
| |||||||||||||
|
| Year Ended December 31, |
| |||||||||||||
Selected Per Share Data and Ratios |
| 2006 |
| 2005 |
| 2004 |
| 2003 |
| 2002 |
| |||||
Net Asset Value, Beginning of Period |
| $ | 23.68 |
| $ | 22.04 |
| $ | 15.17 |
| $ | 10.96 |
| $ | 9.33 |
|
Income (Loss) from Investment Operations |
|
|
|
|
|
|
|
|
|
|
| |||||
Net Investment Income (Loss)† |
| 0.29 |
| 0.32 |
| 0.35 |
| 0.28 |
| 0.27 |
| |||||
Net Realized and Unrealized Gain (Loss) on Investments |
| 12.77 |
| 3.01 |
| 6.81 |
| 4.32 |
| 1.97 |
| |||||
Total from Investment Operations |
| 13.06 |
| 3.33 |
| 7.16 |
| 4.60 |
| 2.24 |
| |||||
Distributions from and/or in Excess of: |
|
|
|
|
|
|
|
|
|
|
| |||||
Net Investment Income |
| (0.82 | ) | (0.33 | ) | (0.29 | ) | (0.39 | ) | (0.61 | ) | |||||
Net Realized Gain |
| (1.09 | ) | (1.36 | ) | — |
| — |
| — |
| |||||
Total Distributions |
| (1.91 | ) | (1.69 | ) | (0.29 | ) | (0.39 | ) | (0.61 | ) | |||||
Redemption Fees |
| 0.00 | ‡ | — |
| — |
| — |
| — |
| |||||
Net Asset Value, End of Period |
| $ | 34.83 |
| $ | 23.68 |
| $ | 22.04 |
| $ | 15.17 |
| $ | 10.96 |
|
Total Return |
| 55.69 | % | 15.22 | % | 47.15 | % | 42.06 | % | 24.11 | % | |||||
Ratios and Supplemental Data: |
|
|
|
|
|
|
|
|
|
|
| |||||
Net Assets, End of Period (Thousands) |
| $ | 97,951 |
| $ | 8,674 |
| $ | 827 |
| $ | 915 |
| $ | 953 |
|
Ratio of Expenses to Average Net Assets (2) |
| 1.20 | % | 1.25 | % | 1.25 | % | 1.25 | % | 1.25 | % | |||||
Ratio of Expenses to Average Net Assets Excluding Bank Overdraft Expense |
| 1.20 | % | 1.25 | % | 1.25 | % | 1.25 | % | N/A |
| |||||
Ratio of Net Investment Income (Loss) to Average Net Assets (2) |
| 0.94 | % | 1.34 | % | 2.03 | % | 1.98 | % | 3.12 | % | |||||
Portfolio Turnover Rate |
| 36 | % | 57 | % | 42 | % | 47 | % | 79 | % | |||||
(2) Supplemental Information on the Ratios to Average Net Assets: |
|
|
|
|
|
|
|
|
|
|
|
Ratios before expense limitation: |
|
|
|
|
|
|
|
|
|
|
|
Expenses to Average Net Assets |
| N/A |
| 1.45 | % | 1.66 | % | 1.74 | % | 1.81 | % |
Net Investment Income (Loss) to Average Net Assets |
| N/A |
| 1.14 | % | 1.62 | % | 1.49 | % | 2.56 | % |
† Per share amount is based on average shares outstanding.
‡ Amount is less than $0.005 per share.
The accompanying notes are an integral part of the financial statements.
159
2006 Annual Report |
|
December 31, 2006 |
Financial Highlights
International Small Cap Portfolio
|
| Class A |
| |||||||||||||
|
| Year Ended December 31, |
| |||||||||||||
Selected Per Share Data and Ratios |
| 2006 |
| 2005 |
| 2004 |
| 2003 |
| 2002 |
| |||||
Net Asset Value, Beginning of Period |
| $ | 24.14 |
| $ | 25.11 |
| $ | 20.52 |
| $ | 14.21 |
| $ | 14.82 |
|
Income (Loss) from Investment Operations |
|
|
|
|
|
|
|
|
|
|
| |||||
Net Investment Income (Loss)† |
| 0.32 |
| 0.32 |
| 0.24 |
| 0.24 |
| 0.15 |
| |||||
Net Realized and Unrealized Gain (Loss) on Investments |
| 4.27 |
| 2.89 |
| 6.59 |
| 6.61 |
| (0.59 | ) | |||||
Total from Investment Operations |
| 4.59 |
| 3.21 |
| 6.83 |
| 6.85 |
| (0.44 | ) | |||||
Distributions from and/or in Excess of: |
|
|
|
|
|
|
|
|
|
|
| |||||
Net Investment Income |
| (0.41 | ) | (0.47 | ) | (0.35 | ) | (0.23 | ) | (0.13 | ) | |||||
Net Realized Gain |
| (4.60 | ) | (3.71 | ) | (1.89 | ) | (0.31 | ) | (0.04 | ) | |||||
Total Distributions |
| (5.01 | ) | (4.18 | ) | (2.24 | ) | (0.54 | ) | (0.17 | ) | |||||
Redemption Fees |
| 0.00 | ‡ | 0.00 | ‡ | 0.00 | ‡ | 0.00 | ‡ | — |
| |||||
Net Asset Value, End of Period |
| $ | 23.72 |
| $ | 24.14 |
| $ | 25.11 |
| $ | 20.52 |
| $ | 14.21 |
|
Total Return |
| 19.61 | % | 13.07 | % | 33.53 | % | 48.32 | % | (2.99 | )% | |||||
Ratios and Supplemental Data: |
|
|
|
|
|
|
|
|
|
|
| |||||
Net Assets, End of Period (Thousands) |
| $ | 1,312,064 |
| $ | 1,389,078 |
| $ | 1,276,083 |
| $ | 899,996 |
| $ | 440,124 |
|
Ratio of Expenses to Average Net Assets (1) |
| 1.10 | % | 1.10 | % | 1.15 | % | 1.15 | % | 1.15 | % | |||||
Ratio of Expenses to Average Net Assets Excluding Bank Overdraft Expense |
| 1.10 | % | 1.10 | % | 1.15 | % | 1.15 | % | N/A |
| |||||
Ratio of Net Investment Income (Loss) to Average Net Assets (1) |
| 1.25 | % | 1.22 | % | 1.04 | % | 1.40 | % | 1.00 | % | |||||
Portfolio Turnover Rate |
| 40 | % | 47 | % | 38 | % | 38 | % | 34 | % | |||||
| ||||||||||||||||
(1) Supplemental Information on the Ratios to Average Net Assets: |
|
|
|
|
|
|
|
|
|
|
| |||||
Ratios before expense limitation: |
|
|
|
|
|
|
|
|
|
|
| |||||
Expenses to Average Net Assets |
| N/A |
| N/A |
| 1.16 | % | 1.20 | % | 1.19 | % | |||||
Net Investment Income (Loss) to Average Net Assets |
| N/A |
| N/A |
| 1.03 | % | 1.35 | % | 0.96 | % | |||||
† Per share amount is based on average shares outstanding.
‡ Amount is less than $0.005 per share.
The accompanying notes are an integral part of the financial statements.
160
| 2006 Annual Report |
| |
| December 31, 2006 |
Financial Highlights
Focus Equity Portfolio
|
| Class A |
| |||||||||||||
|
| Year Ended December 31, |
| |||||||||||||
Selected Per Share Data and Ratios |
| 2006 |
| 2005 |
| 2004 |
| 2003 |
| 2002 |
| |||||
Net Asset Value, Beginning of Period |
| $ | 14.78 |
| $ | 12.59 |
| $ | 11.79 |
| $ | 9.02 |
| $ | 12.67 |
|
Income (Loss) from Investment Operations |
|
|
|
|
|
|
|
|
|
|
| |||||
Net Investment Income (Loss)† |
| (0.03 | ) | (0.03 | ) | 0.04 |
| 0.02 |
| 0.00‡ |
| |||||
Net Realized and Unrealized Gain (Loss) on Investments |
| 0.44 |
| 2.24 |
| 0.78 |
| 2.77 |
| (3.65 | ) | |||||
Total from Investment Operations |
| 0.41 |
| 2.21 |
| 0.82 |
| 2.79 |
| (3.65 | ) | |||||
Distributions from and/or in Excess of: |
|
|
|
|
|
|
|
|
|
|
| |||||
Net Investment Income |
| — |
| (0.02 | ) | (0.02 | ) | (0.02 | ) | — |
| |||||
Redemption Fees |
| 0.00 | ‡ | — |
| — |
| — |
| — |
| |||||
Net Asset Value, End of Period |
| $ | 15.19 |
| $ | 14.78 |
| $ | 12.59 |
| $ | 11.79 |
| $ | 9.02 |
|
Total Return |
| 2.77 | % | 17.60 | % | 7.00 | % | 30.99 | %§ | (28.81 | )% | |||||
Ratios and Supplemental Data: |
|
|
|
|
|
|
|
|
|
|
| |||||
Net Assets, End of Period (Thousands) |
| $ | 12,416 |
| $ | 54,321 |
| $ | 52,757 |
| $ | 61,420 |
| $ | 51,347 |
|
Ratio of Expenses to Average Net Assets (1) |
| 0.79 | % | 0.91 | % | 1.00 | % | 1.00 | % | 1.00 | % | |||||
Ratio of Expenses to Average Net Assets Excluding Bank Overdraft Expense |
| 0.79 | % | 0.91 | % | 1.00 | % | 1.00 | % | N/A |
| |||||
Ratio of Net Investment Income (Loss) to Average Net Assets (1) |
| (0.23 | )% | (0.27 | )% | 0.35 | % | 0.22 | % | 0.02 | % | |||||
Portfolio Turnover Rate |
| 76 | % | 78 | % | 163 | % | 160 | % | 173 | % | |||||
|
|
|
|
|
|
|
|
|
|
|
| |||||
(1) Supplemental Information on the Ratios to Average Net Assets: |
|
|
|
|
|
|
|
|
|
|
| |||||
Ratios before expense limitation: |
|
|
|
|
|
|
|
|
|
|
| |||||
Expenses to Average Net Assets |
| N/A |
| N/A |
| 1.11 | % | 1.14 | % | 1.09 | % | |||||
Net Investment Income (Loss) to Average Net Assets |
| N/A |
| N/A |
| 0.24 | % | 0.08 | % | (0.07 | )% | |||||
|
| Class B |
| |||||||||||||
|
| Year Ended December 31, |
| |||||||||||||
Selected Per Share Data and Ratios |
| 2006 |
| 2005 |
| 2004 |
| 2003 |
| 2002 |
| |||||
Net Asset Value, Beginning of Period |
| $ | 14.45 |
| $ | 12.34 |
| $ | 11.57 |
| $ | 8.85 |
| $ | 12.45 |
|
Income (Loss) from Investment Operations |
|
|
|
|
|
|
|
|
|
|
| |||||
Net Investment Income (Loss)† |
| (0.06 | ) | (0.06 | ) | 0.02 |
| (0.00 | )‡ | (0.03 | ) | |||||
Net Realized and Unrealized Gain (Loss) on Investments |
| 0.42 |
| 2.19 |
| 0.75 |
| 2.72 |
| (3.57 | ) | |||||
Total from Investment Operations |
| 0.36 |
| 2.13 |
| 0.77 |
| 2.72 |
| (3.60 | ) | |||||
Distributions from and/or in Excess of: |
|
|
|
|
|
|
|
|
|
|
| |||||
Net Investment Income |
| — |
| (0.02 | ) | — |
| — |
| — |
| |||||
Redemption Fees |
| 0.00 | ‡ | — |
| — |
| — |
| — |
| |||||
Net Asset Value, End of Period |
| $ | 14.81 |
| $ | 14.45 |
| $ | 12.34 |
| $ | 11.57 |
| $ | 8.85 |
|
Total Return |
| 2.49 | % | 17.30 | % | 6.75 | % | 30.62 | %§ | (28.92 | )% | |||||
Ratios and Supplemental Data: |
|
|
|
|
|
|
|
|
|
|
| |||||
Net Assets, End of Period (Thousands) |
| $ | 2,317 |
| $ | 12,442 |
| $ | 8,559 |
| $ | 8,156 |
| $ | 6,414 |
|
Ratio of Expenses to Average Net Assets (2) |
| 1.04 | % | 1.16 | % | 1.25 | % | 1.25 | % | 1.25 | % | |||||
Ratio of Expenses to Average Net Assets Excluding Bank Overdraft Expense |
| 1.04 | % | 1.16 | % | 1.25 | % | 1.25 | % | N/A |
| |||||
Ratio of Net Investment Income (Loss) to Average Net Assets (2) |
| (0.45 | )% | (0.49 | )% | 0.18 | % | (0.03 | )% | (0.23 | )% | |||||
Portfolio Turnover Rate |
| 76 | % | 78 | % | 163 | % | 160 | % | 173 | % | |||||
|
|
|
|
|
|
|
|
|
|
|
| |||||
(2) Supplemental Information on the Ratios to Average Net Assets: |
|
|
|
|
|
|
|
|
|
|
| |||||
Ratios before expense limitation: |
|
|
|
|
|
|
|
|
|
|
| |||||
Expenses to Average Net Assets |
| N/A |
| N/A |
| 1.36 | % | 1.39 | % | 1.34 | % | |||||
Net Investment Income (Loss) to Average Net Assets |
| N/A |
| N/A |
| 0.07 | % | (0.17 | )% | (0.32 | )% | |||||
† Per share amount is based on average shares outstanding.
‡ Amount is less than $0.005 per share.
§ In 2003, performance was positively impacted by approximately 5.64%, due to the receipt of proceeds from the settlement of class action suits involving, primarily, one of the Portfolio’s holdings. This was a one-time settlement, and as a result, the impact on the NAV and consequently the performance will not likely be repeated in the future. Had these settlements not occurred, the 2003 total return for Class A shares and Class B shares would have been approximately 25.35% and 24.98%, respectively.
The accompanying notes are an integral part of the financial statements.
161
2006 Annual Report |
|
December 31, 2006 |
Financial Highlights
Large Cap Relative Value Portfolio
|
| Class A |
| |||||||||||||
|
| Year Ended December 31, |
| |||||||||||||
Selected Per Share Data and Ratios |
| 2006 |
| 2005 |
| 2004 |
| 2003 |
| 2002 |
| |||||
Net Asset Value, Beginning of Period |
| $ | 11.10 |
| $ | 10.52 |
| $ | 9.30 |
| $ | 7.21 |
| $ | 9.68 |
|
Income (Loss) from Investment Operations |
|
|
|
|
|
|
|
|
|
|
| |||||
Net Investment Income (Loss)† |
| 0.20 |
| 0.15 |
| 0.12 |
| 0.13 |
| 0.14 |
| |||||
Net Realized and Unrealized Gain (Loss) on Investments |
| 1.62 |
| 0.90 |
| 1.23 |
| 2.09 |
| (2.47 | ) | |||||
Total from Investment Operations |
| 1.82 |
| 1.05 |
| 1.35 |
| 2.22 |
| (2.33 | ) | |||||
Distributions from and/or in Excess of: |
|
|
|
|
|
|
|
|
|
|
| |||||
Net Investment Income |
| (0.20 | ) | (0.14 | ) | (0.13 | ) | (0.13 | ) | (0.14 | ) | |||||
Net Realized Gain |
| (0.52 | ) | (0.33 | ) | — |
| — |
| — |
| |||||
Total Distributions |
| (0.72 | ) | (0.47 | ) | (0.13 | ) | (0.13 | ) | (0.14 | ) | |||||
Redemption Fees |
| 0.00 | ‡ | — |
| — |
| — |
| — |
| |||||
Net Asset Value, End of Period |
| $ | 12.20 |
| $ | 11.10 |
| $ | 10.52 |
| $ | 9.30 |
| $ | 7.21 |
|
Total Return |
| 16.74 | % | 10.07 | % | 14.56 | % | 31.05 | % | (24.22 | )% | |||||
Ratios and Supplemental Data: |
|
|
|
|
|
|
|
|
|
|
| |||||
Net Assets, End of Period (Thousands) |
| $ | 211,904 |
| $ | 102,973 |
| $ | 90,938 |
| $ | 108,997 |
| $ | 76,452 |
|
Ratio of Expenses to Average Net Assets (1) |
| 0.68 | % | 0.68 | % | 0.70 | % | 0.70 | % | 0.70 | % | |||||
Ratio of Expenses to Average Net Assets Excluding Bank Overdraft Expense |
| 0.68 | % | 0.68 | % | N/A |
| N/A |
| N/A |
| |||||
Ratio of Net Investment Income (Loss) to Average Net Assets (1) |
| 1.71 | % | 1.36 | % | 1.28 | % | 1.62 | % | 1.69 | % | |||||
Portfolio Turnover Rate |
| 33 | % | 46 | % | 84 | % | 130 | % | 45 | % | |||||
|
|
|
|
|
|
|
|
|
|
|
| |||||
(1) Supplemental Information on the Ratios to Average Net Assets: |
|
|
|
|
|
|
|
|
|
|
| |||||
Ratios before expense limitation: |
|
|
|
|
|
|
|
|
|
|
| |||||
Expenses to Average Net Assets |
| N/A |
| N/A |
| 0.74 | % | 0.77 | % | 0.76 | % | |||||
Net Investment Income (Loss) to Average Net Assets |
| N/A |
| N/A |
| 1.24 | % | 1.55 | % | 1.63 | % | |||||
|
| Class B |
| |||||||||||||
|
| Year Ended December 31, |
| |||||||||||||
Selected Per Share Data and Ratios |
| 2006 |
| 2005 |
| 2004 |
| 2003 |
| 2002 |
| |||||
Net Asset Value, Beginning of Period |
| $ | 11.09 |
| $ | 10.51 |
| $ | 9.31 |
| $ | 7.21 |
| $ | 9.67 |
|
Income (Loss) from Investment Operations |
|
|
|
|
|
|
|
|
|
|
| |||||
Net Investment Income (Loss)† |
| 0.17 |
| 0.12 |
| 0.10 |
| 0.11 |
| 0.12 |
| |||||
Net Realized and Unrealized Gain (Loss) on Investments |
| 1.61 |
| 0.91 |
| 1.20 |
| 2.10 |
| (2.46 | ) | |||||
Total from Investment Operations |
| 1.78 |
| 1.03 |
| 1.30 |
| 2.21 |
| (2.34 | ) | |||||
Distributions from and/or in Excess of: |
|
|
|
|
|
|
|
|
|
|
| |||||
Net Investment Income |
| (0.17 | ) | (0.12 | ) | (0.10 | ) | (0.11 | ) | (0.12 | ) | |||||
Net Realized Gain |
| (0.52 | ) | (0.33 | ) | — |
| — |
| — |
| |||||
Total Distributions |
| (0.69 | ) | (0.45 | ) | (0.10 | ) | (0.11 | ) | (0.12 | ) | |||||
Redemption Fees |
| 0.00 | ‡ | — |
| — |
| — |
| — |
| |||||
Net Asset Value, End of Period |
| $ | 12.18 |
| $ | 11.09 |
| $ | 10.51 |
| $ | 9.31 |
| $ | 7.21 |
|
Total Return |
| 16.38 | % | 9.81 | % | 14.07 | % | 30.86 | % | (24.32 | )% | |||||
Ratios and Supplemental Data: |
|
|
|
|
|
|
|
|
|
|
| |||||
Net Assets, End of Period (Thousands) |
| $ | 63,300 |
| $ | 101,499 |
| $ | 75,189 |
| $ | 72,180 |
| $ | 46,757 |
|
Ratio of Expenses to Average Net Assets (2) |
| 0.93 | % | 0.93 | % | 0.95 | % | 0.95 | % | 0.95 | % | |||||
Ratio of Expenses to Average Net Assets Excluding Bank Overdraft Expense |
| 0.93 | % | 0.93 | % | N/A |
| N/A |
| N/A |
| |||||
Ratio of Net Investment Income (Loss) to Average Net Assets (2) |
| 1.44 | % | 1.10 | % | 1.05 | % | 1.37 | % | 1.44 | % | |||||
Portfolio Turnover Rate |
| 33 | % | 46 | % | 84 | % | 130 | % | 45 | % | |||||
|
|
|
|
|
|
|
|
|
|
|
| |||||
(2) Supplemental Information on the Ratios to Average Net Assets: |
|
|
|
|
|
|
|
|
|
|
| |||||
Ratios before expense limitation: |
|
|
|
|
|
|
|
|
|
|
| |||||
Expenses to Average Net Assets |
| N/A |
| N/A |
| 0.99 | % | 1.02 | % | 1.01 | % | |||||
Net Investment Income (Loss) to Average Net Assets |
| N/A |
| N/A |
| 1.01 | % | 1.30 | % | 1.38 | % | |||||
† Per share amount is based on average shares outstanding.
‡ Amount is less than $0.005 per share.
The accompanying notes are an integral part of the financial statements.
162
| 2006 Annual Report |
| |
| December 31, 2006 |
Financial Highlights
Small Company Growth Portfolio
|
| Class A |
| |||||||||||||
|
| Year Ended December 31, |
| |||||||||||||
Selected Per Share Data and Ratios |
| 2006 |
| 2005 |
| 2004 |
| 2003 |
| 2002 |
| |||||
Net Asset Value, Beginning of Period |
| $ | 12.89 |
| $ | 12.50 |
| $ | 10.81 |
| $ | 7.50 |
| $ | 9.65 |
|
Income (Loss) from Investment Operations |
|
|
|
|
|
|
|
|
|
|
| |||||
Net Investment Income (Loss)† |
| (0.08 | ) | (0.00 | )‡ | (0.09 | ) | (0.09 | ) | (0.07 | ) | |||||
Net Realized and Unrealized Gain (Loss) on Investments |
| 1.59 |
| 1.72 |
| 2.16 |
| 3.40 |
| (2.08 | ) | |||||
Total from Investment Operations |
| 1.51 |
| 1.72 |
| 2.07 |
| 3.31 |
| (2.15 | ) | |||||
Distributions from and/or in Excess of: |
|
|
|
|
|
|
|
|
|
|
| |||||
Net Realized Gain |
| (1.09 | ) | (1.33 | ) | (0.38 | ) | — |
| — |
| |||||
Redemption Fees |
| 0.00 | ‡ | 0.00 | ‡ | — |
| — |
| — |
| |||||
Net Asset Value, End of Period |
| $ | 13.31 |
| $ | 12.89 |
| $ | 12.50 |
| $ | 10.81 |
| $ | 7.50 |
|
Total Return |
| 11.90 | % | 13.55 | % | 19.17 | % | 44.13 | % | (22.28 | )% | |||||
Ratios and Supplemental Data: |
|
|
|
|
|
|
|
|
|
|
| |||||
Net Assets, End of Period (Thousands) |
| $ | 1,028,030 |
| $ | 896,204 |
| $ | 651,276 |
| $ | 299,198 |
| $ | 74,554 |
|
Ratio of Expenses to Average Net Assets (1) |
| 1.01 | % | 1.04 | % | 1.10 | % | 1.10 | % | 1.10 | % | |||||
Ratio of Expenses to Average Net Assets Excluding Bank Overdraft Expense |
| 1.01 | % | 1.04 | % | N/A |
| N/A |
| N/A |
| |||||
Ratio of Net Investment Income (Loss) to Average Net Assets (1) |
| (0.56 | )% | (0.04 | )% | (0.79 | )% | (0.93 | )% | (0.82 | )% | |||||
Portfolio Turnover Rate |
| 76 | % | 73 | % | 111 | % | 160 | % | 133 | % | |||||
(1) Supplemental Information on the Ratios to Average Net Assets: |
|
|
|
|
|
|
|
|
|
|
|
Ratios before expense limitation: |
|
|
|
|
|
|
|
|
|
|
|
Expenses to Average Net Assets |
| N/A |
| N/A |
| 1.16 | % | 1.26 | % | 1.22 | % |
Net Investment Income (Loss) to Average Net Assets |
| N/A |
| N/A |
| (0.85 | )% | (1.09 | )% | (0.94 | )% |
|
| Class B |
| |||||||||||||
|
| Year Ended December 31, |
| |||||||||||||
Selected Per Share Data and Ratios |
| 2006 |
| 2005 |
| 2004 |
| 2003 |
| 2002 |
| |||||
Net Asset Value, Beginning of Period |
| $ | 12.31 |
| $ | 12.02 |
| $ | 10.43 |
| $ | 7.26 |
| $ | 9.36 |
|
Income (Loss) from Investment Operations |
|
|
|
|
|
|
|
|
|
|
| |||||
Net Investment Income (Loss)† |
| (0.10 | ) | (0.03 | ) | (0.11 | ) | (0.10 | ) | (0.09 | ) | |||||
Net Realized and Unrealized Gain (Loss) on Investments |
| 1.51 |
| 1.65 |
| 2.08 |
| 3.27 |
| (2.01 | ) | |||||
Total from Investment Operations |
| 1.41 |
| 1.62 |
| 1.97 |
| 3.17 |
| (2.10 | ) | |||||
Distributions from and/or in Excess of: |
|
|
|
|
|
|
|
|
|
|
| |||||
Net Realized Gain |
| (1.09 | ) | (1.33 | ) | (0.38 | ) | — |
| — |
| |||||
Redemption Fees |
| 0.00 | ‡ | — |
| — |
| — |
| — |
| |||||
Net Asset Value, End of Period |
| $ | 12.63 |
| $ | 12.31 |
| $ | 12.02 |
| $ | 10.43 |
| $ | 7.26 |
|
Total Return |
| 11.55 | % | 13.35 | % | 18.79 | % | 43.80 | % | (22.44 | )% | |||||
Ratios and Supplemental Data: |
|
|
|
|
|
|
|
|
|
|
| |||||
Net Assets, End of Period (Thousands) |
| $ | 857,275 |
| $ | 808,493 |
| $ | 713,733 |
| $ | 484,136 |
| $ | 215,899 |
|
Ratio of Expenses to Average Net Assets (2) |
| 1.26 | % | 1.29 | % | 1.35 | % | 1.35 | % | 1.35 | % | |||||
Ratio of Expenses to Average Net Assets Excluding Bank Overdraft Expense |
| 1.26 | % | 1.29 | % | N/A |
| N/A |
| N/A |
| |||||
Ratio of Net Investment Income (Loss) to Average Net Assets (2) |
| (0.81 | )% | (0.24 | )% | (1.02 | )% | (1.18 | )% | (1.07 | )% | |||||
Portfolio Turnover Rate |
| 76 | % | 73 | % | 111 | % | 160 | % | 133 | % | |||||
|
|
|
|
|
|
|
|
|
|
|
| |||||
(2) Supplemental Information on the Ratios to Average Net Assets: |
|
|
|
|
|
|
|
|
|
|
| |||||
Ratios before expense limitation: |
|
|
|
|
|
|
|
|
|
|
| |||||
Expenses to Average Net Assets |
| N/A |
| N/A |
| 1.41 | % | 1.51 | % | 1.47 | % | |||||
Net Investment Income (Loss) to Average Net Assets |
| N/A |
| N/A |
| (1.09 | )% | (1.34 | )% | (1.19 | )% | |||||
† Per share amount is based on average shares outstanding.
‡ Amount is less than $0.005 per share.
The accompanying notes are an integral part of the financial statements.
163
2006 Annual Report |
|
December 31, 2006 |
Financial Highlights
Systematic Active Large Cap Core Portfolio
|
| Class A |
| |
|
| Period from |
| |
|
| April 28, 2006^ |
| |
Selected Per Share Data and Ratios |
| to December 31, 2006 |
| |
Net Asset Value, Beginning of Period |
| $ | 10.00 |
|
Income (Loss) from Investment Operations |
|
|
| |
Net Investment Income (Loss)† |
| 0.08 |
| |
Net Realized and Unrealized Gain (Loss) on Investments |
| 0.69 |
| |
Total from Investment Operations |
| 0.77 |
| |
Distributions from and/or in Excess of: |
|
|
| |
Net Investment Income |
| (0.08 | ) | |
Net Asset Value, End of Period |
| $ | 10.69 |
|
Total Return |
| 7.85 | %# | |
Ratios and Supplemental Data: |
|
|
| |
Net Assets, End of Period (Thousands) |
| $ | 6,308 |
|
Ratio of Expenses to Average Net Assets (1) |
| 0.60 | %* | |
Ratio of Net Investment Income (Loss) to Average Net Assets (1) |
| 1.25 | %* | |
Portfolio Turnover Rate |
| 55 | %# | |
(1) Supplemental Information on the Ratios to Average Net Assets: |
|
|
|
Ratios before expense limitation: |
|
|
|
Expenses to Average Net Assets |
| 2.17 | %* |
Net Investment Income (Loss) to Average Net Assets |
| (0.32 | )%* |
|
| Class B |
| |
|
| Period from |
| |
|
| April 28, 2006^ |
| |
Selected Per Share Data and Ratios |
| to December 31, 2006 |
| |
Net Asset Value, Beginning of Period |
| $ | 10.00 |
|
Income (Loss) from Investment Operations |
|
|
| |
Net Investment Income (Loss)† |
| 0.07 |
| |
Net Realized and Unrealized Gain (Loss) on Investments |
| 0.69 |
| |
Total from Investment Operations |
| 0.76 |
| |
Distributions from and/or in Excess of: |
|
|
| |
Net Investment Income |
| (0.07 | ) | |
Net Asset Value, End of Period |
| $ | 10.69 |
|
Total Return |
| 7.68 | %# | |
Ratios and Supplemental Data: |
|
|
| |
Net Assets, End of Period (Thousands) |
| $ | 107 |
|
Ratio of Expenses to Average Net Assets (2) |
| 0.85 | %* | |
Ratio of Net Investment Income (Loss) to Average Net Assets (2) |
| 1.00 | %* | |
Portfolio Turnover Rate |
| 55 | %# | |
(2) Supplemental Information on the Ratios to Average Net Assets: |
|
|
|
Ratios before expense limitation: |
|
|
|
Expenses to Average Net Assets |
| 2.42 | %* |
Net Investment Income (Loss) to Average Net Assets |
| (0.57 | )%* |
† Per share amount is based on average shares outstanding.
^ Commencement of operations.
# Not annualized
* Annualized
The accompanying notes are an integral part of the financial statements.
164
| 2006 Annual Report |
| |
| December 31, 2006 |
Financial Highlights
Systematic Active Small Cap Core Portfolio
|
| Class A |
| |
|
| Period from |
| |
|
| April 28, 2006^ |
| |
Selected Per Share Data and Ratios |
| to December 31, 2006 |
| |
Net Asset Value, Beginning of Period |
| $ | 10.00 |
|
Income (Loss) from Investment Operations |
|
|
| |
Net Investment Income (Loss)† |
| 0.03 |
| |
Net Realized and Unrealized Gain (Loss) on Investments |
| (0.07 | ) | |
Total from Investment Operations |
| (0.04 | ) | |
Distributions from and/or in Excess of: |
|
|
| |
Net Investment Income |
| (0.03 | ) | |
Net Asset Value, End of Period |
| $ | 9.93 |
|
Total Return |
| (0.41 | )%# | |
Ratios and Supplemental Data: |
|
|
| |
Net Assets, End of Period (Thousands) |
| $ | 6,455 |
|
Ratio of Expenses to Average Net Assets (1) |
| 1.10 | %* | |
Ratio of Net Investment Income (Loss) to Average Net Assets (1) |
| 0.45 | %* | |
Portfolio Turnover Rate |
| 60 | %# | |
(1) Supplemental Information on the Ratios to Average Net Assets: |
|
|
|
Ratios before expense limitation: |
|
|
|
Expenses to Average Net Assets |
| 2.47 | %* |
Net Investment Income (Loss) to Average Net Assets |
| (0.92 | )%* |
|
| Class B |
| |
|
| Period from |
| |
|
| April 28, 2006^ |
| |
Selected Per Share Data and Ratios |
| to December 31, 2006 |
| |
Net Asset Value, Beginning of Period |
| $ | 10.00 |
|
Income (Loss) from Investment Operations |
|
|
| |
Net Investment Income (Loss)† |
| 0.01 |
| |
Net Realized and Unrealized Gain (Loss) on Investments |
| (0.07 | ) | |
Total from Investment Operations |
| (0.06 | ) | |
Distributions from and/or in Excess of: |
|
|
| |
Net Investment Income |
| (0.01 | ) | |
Net Asset Value, End of Period |
| $ | 9.93 |
|
Total Return |
| (0.57 | )%# | |
Ratios and Supplemental Data: |
|
|
| |
Net Assets, End of Period (Thousands) |
| $ | 99 |
|
Ratio of Expenses to Average Net Assets (2) |
| 1.35 | %* | |
Ratio of Net Investment Income (Loss) to Average Net Assets (2) |
| 0.20 | %* | |
Portfolio Turnover Rate |
| 60 | %# | |
(2) Supplemental Information on the Ratios to Average Net Assets: |
|
|
|
Ratios before expense limitation: |
|
|
|
Expenses to Average Net Assets |
| 2.72 | %* |
Net Investment Income (Loss) to Average Net Assets |
| (1.17 | )%* |
|
|
|
|
† Per share amount is based on average shares outstanding. |
|
|
|
|
|
|
|
^ Commencement of operations. |
|
|
|
|
|
|
|
# Not annualized |
|
|
|
|
|
|
|
* Annualized |
|
|
|
The accompanying notes are an integral part of the financial statements.
165
2006 Annual Report |
|
December 31, 2006 |
Financial Highlights
Systematic Active Small Cap Growth Portfolio
|
| Class A |
| |
|
| Period from |
| |
|
| April 28, 2006^ |
| |
Selected Per Share Data and Ratios |
| to December 31, 2006 |
| |
Net Asset Value, Beginning of Period |
| $ | 10.00 |
|
Income (Loss) from Investment Operations |
|
|
| |
Net Investment Income (Loss)† |
| (0.01 | ) | |
Net Realized and Unrealized Gain (Loss) on Investments |
| (0.22 | ) | |
Total from Investment Operations |
| (0.23 | ) | |
Net Asset Value, End of Period |
| $ | 9.77 |
|
Total Return |
| (2.20 | )%# | |
Ratios and Supplemental Data: |
|
|
| |
Net Assets, End of Period (Thousands) |
| $ | 6,646 |
|
Ratio of Expenses to Average Net Assets (1) |
| 1.10 | %* | |
Ratio of Net Investment Income (Loss) to Average Net Assets (1) |
| (0.13 | )%* | |
Portfolio Turnover Rate |
| 76 | %# | |
(1) Supplemental Information on the Ratios to Average Net Assets: |
|
|
|
Ratios before expense limitation: |
|
|
|
Expenses to Average Net Assets |
| 2.46 | %* |
Net Investment Income (Loss) to Average Net Assets |
| (1.49 | )%* |
|
| Class B |
| |
|
| Period from |
| |
|
| April 28, 2006^ |
| |
Selected Per Share Data and Ratios |
| to December 31, 2006 |
| |
Net Asset Value, Beginning of Period |
| $ | 10.00 |
|
Income (Loss) from Investment Operations |
|
|
| |
Net Investment Income (Loss)† |
| (0.02 | ) | |
Net Realized and Unrealized Gain (Loss) on Investments |
| (0.22 | ) | |
Total from Investment Operations |
| (0.24 | ) | |
Net Asset Value, End of Period |
| $ | 9.76 |
|
Total Return |
| (2.30 | )%# | |
Ratios and Supplemental Data: |
|
|
| |
Net Assets, End of Period (Thousands) |
| $ | 98 |
|
Ratio of Expenses to Average Net Assets (2) |
| 1.35 | %* | |
Ratio of Net Investment Income (Loss) to Average Net Assets (2) |
| (0.38 | )%* | |
Portfolio Turnover Rate |
| 76 | %# | |
(2) Supplemental Information on the Ratios to Average Net Assets: |
|
|
|
Ratios before expense limitation: |
|
|
|
Expenses to Average Net Assets |
| 2.71 | %* |
Net Investment Income (Loss) to Average Net Assets |
| (1.74 | )%* |
|
|
|
|
† Per share amount is based on average shares outstanding. |
|
|
|
|
|
|
|
^ Commencement of operations. |
|
|
|
|
|
|
|
# Not annualized |
|
|
|
|
|
|
|
* Annualized |
|
|
|
The accompanying notes are an integral part of the financial statements.
166
| 2006 Annual Report |
| |
| December 31, 2006 |
Financial Highlights
Systematic Active Small Cap Value Portfolio
|
| Class A |
| |
|
| Period from |
| |
|
| April 28, 2006^ |
| |
Selected Per Share Data and Ratios |
| to December 31, 2006 |
| |
Net Asset Value, Beginning of Period |
| $ | 10.00 |
|
Income (Loss) from Investment Operations |
|
|
| |
Net Investment Income (Loss)† |
| 0.06 |
| |
Net Realized and Unrealized Gain (Loss) on Investments |
| 0.37 |
| |
Total from Investment Operations |
| 0.43 |
| |
Distributions from and/or in Excess of: |
|
|
| |
Net Investment Income |
| (0.06 | ) | |
Net Asset Value, End of Period |
| $ | 10.37 |
|
Total Return |
| 4.30 | %# | |
Ratios and Supplemental Data: |
|
|
| |
Net Assets, End of Period (Thousands) |
| $ | 6,841 |
|
Ratio of Expenses to Average Net Assets (1) |
| 1.10 | %* | |
Ratio of Net Investment Income (Loss) to Average Net Assets (1) |
| 0.92 | %* | |
Portfolio Turnover Rate |
| 77 | %# | |
(1) Supplemental Information on the Ratios to Average Net Assets: |
|
|
|
Ratios before expense limitation: |
|
|
|
Expenses to Average Net Assets |
| 2.37 | %* |
Net Investment Income (Loss) to Average Net Assets |
| (0.35 | )%* |
|
| Class B |
| |
|
| Period from |
| |
|
| April 28, 2006^ |
| |
Selected Per Share Data and Ratios |
| to December 31, 2006 |
| |
Net Asset Value, Beginning of Period |
| $ | 10.00 |
|
Income (Loss) from Investment Operations |
|
|
| |
Net Investment Income (Loss)† |
| 0.04 |
| |
Net Realized and Unrealized Gain (Loss) on Investments |
| 0.36 |
| |
Total from Investment Operations |
| 0.40 |
| |
Distributions from and/or in Excess of: |
|
|
| |
Net Investment Income |
| (0.04 | ) | |
Net Asset Value, End of Period |
| $ | 10.36 |
|
Total Return |
| 4.14 | %# | |
Ratios and Supplemental Data: |
|
|
| |
Net Assets, End of Period (Thousands) |
| $ | 104 |
|
Ratio of Expenses to Average Net Assets (2) |
| 1.35 | %* | |
Ratio of Net Investment Income (Loss) to Average Net Assets (2) |
| 0.67 | %* | |
Portfolio Turnover Rate |
| 77 | %# | |
(2) Supplemental Information on the Ratios to Average Net Assets: |
|
|
|
Ratios before expense limitation: |
|
|
|
Expenses to Average Net Assets |
| 2.62 | %* |
Net Investment Income (Loss) to Average Net Assets |
| (0.60 | )%* |
|
|
|
|
† Per share amount is based on average shares outstanding. |
|
|
|
|
|
|
|
^ Commencement of operations. |
|
|
|
|
|
|
|
# Not annualized |
|
|
|
|
|
|
|
* Annualized |
|
|
|
The accompanying notes are an integral part of the financial statements.
167
2006 Annual Report |
|
December 31, 2006 |
Financial Highlights
U.S. Large Cap Growth Portfolio
|
| Class A |
| |||||||||||||
|
| Year Ended December 31, |
| |||||||||||||
Selected Per Share Data and Ratios |
| 2006 |
| 2005 |
| 2004 |
| 2003 |
| 2002 |
| |||||
Net Asset Value, Beginning of Period |
| $ | 19.49 |
| $ | 16.88 |
| $ | 15.74 |
| $ | 12.49 |
| $ | 17.29 |
|
Income (Loss) from Investment Operations |
|
|
|
|
|
|
|
|
|
|
| |||||
Net Investment Income (Loss)† |
| 0.01 |
| 0.02 |
| 0.09 |
| 0.05 |
| 0.03 |
| |||||
Net Realized and Unrealized Gain (Loss) on Investments |
| 0.78 |
| 2.63 |
| 1.13 |
| 3.25 |
| (4.80 | ) | |||||
Total from Investment Operations |
| 0.79 |
| 2.65 |
| 1.22 |
| 3.30 |
| (4.77 | ) | |||||
Distributions from and/or in Excess of: |
|
|
|
|
|
|
|
|
|
|
| |||||
Net Investment Income |
| (0.00 | )‡ | (0.04 | ) | (0.08 | ) | (0.05 | ) | (0.03 | ) | |||||
Redemption Fees |
| 0.00 | ‡ | — |
| — |
| — |
| — |
| |||||
Net Asset Value, End of Period |
| $ | 20.28 |
| $ | 19.49 |
| $ | 16.88 |
| $ | 15.74 |
| $ | 12.49 |
|
Total Return |
| 4.07 | % | 15.72 | % | 7.75 | % | 26.41 | %§ | (27.64 | )% | |||||
Ratios and Supplemental Data: |
|
|
|
|
|
|
|
|
|
|
| |||||
Net Assets, End of Period (Thousands) |
| $ | 1,012,417 |
| $ | 871,905 |
| $ | 554,097 |
| $ | 589,698 |
| $ | 432,207 |
|
Ratio of Expenses to Average Net Assets (1) |
| 0.63 | % | 0.65 | % | 0.77 | % | 0.80 | % | 0.80 | % | |||||
Ratio of Expenses to Average Net Assets Excluding Bank Overdraft Expense |
| 0.63 | % | 0.65 | % | N/A |
| N/A |
| N/A |
| |||||
Ratio of Net Investment Income (Loss) to Average Net Assets (1) |
| 0.03 | % | 0.13 | % | 0.58 | % | 0.34 | % | 0.21 | % | |||||
Portfolio Turnover Rate |
| 59 | % | 106 | % | 179 | % | 131 | % | 143 | % | |||||
|
|
|
|
|
|
|
|
|
|
|
| |||||
(1) Supplemental Information on the Ratios to Average Net Assets: |
|
|
|
|
|
|
|
|
|
|
| |||||
Ratios before expense limitation: |
|
|
|
|
|
|
|
|
|
|
| |||||
Expenses to Average Net Assets |
| N/A |
| N/A |
| N/A |
| 0.82 | % | 0.81 | % | |||||
Net Investment Income (Loss) to Average Net Assets |
| N/A |
| N/A |
| N/A |
| 0.32 | % | 0.21 | % | |||||
|
| Class B |
| |||||||||||||
|
| Year Ended December 31, |
| |||||||||||||
Selected Per Share Data and Ratios |
| 2006 |
| 2005 |
| 2004 |
| 2003 |
| 2002 |
| |||||
Net Asset Value, Beginning of Period |
| $ | 19.21 |
| $ | 16.67 |
| $ | 15.55 |
| $ | 12.34 |
| $ | 17.08 |
|
Income (Loss) from Investment Operations |
|
|
|
|
|
|
|
|
|
|
| |||||
Net Investment Income (Loss)† |
| (0.04 | ) | (0.03 | ) | 0.05 |
| 0.01 |
| (0.00 | )‡ | |||||
Net Realized and Unrealized Gain (Loss) on Investments |
| 0.78 |
| 2.60 |
| 1.11 |
| 3.21 |
| (4.74 | ) | |||||
Total from Investment Operations |
| 0.74 |
| 2.57 |
| 1.16 |
| 3.22 |
| (4.74 | ) | |||||
Distributions from and/or in Excess of: |
|
|
|
|
|
|
|
|
|
|
| |||||
Net Investment Income |
| — |
| (0.03 | ) | (0.04 | ) | (0.01 | ) | — |
| |||||
Redemption Fees |
| 0.00 | ‡ | — |
| — |
| — |
| — |
| |||||
Net Asset Value, End of Period |
| $ | 19.95 |
| $ | 19.21 |
| $ | 16.67 |
| $ | 15.55 |
| $ | 12.34 |
|
Total Return |
| 3.85 | % | 15.41 | % | 7.45 | % | 26.13 | %§ | (27.75 | )% | |||||
Ratios and Supplemental Data: |
|
|
|
|
|
|
|
|
|
|
| |||||
Net Assets, End of Period (Thousands) |
| $ | 57,689 |
| $ | 35,678 |
| $ | 202,893 |
| $ | 199,591 |
| $ | 156,501 |
|
Ratio of Expenses to Average Net Assets (2) |
| 0.88 | % | 0.90 | % | 1.02 | % | 1.05 | % | 1.05 | % | |||||
Ratio of Expenses to Average Net Assets Excluding Bank Overdraft Expense |
| 0.88 | % | 0.90 | % | N/A |
| N/A |
| N/A |
| |||||
Ratio of Net Investment Income (Loss) to Average Net Assets (2) |
| (0.23 | )% | (0.17 | )% | 0.33 | % | 0.09 | % | (0.04 | )% | |||||
Portfolio Turnover Rate |
| 59 | % | 106 | % | 179 | % | 131 | % | 143 | % | |||||
(2) Supplemental Information on the Ratios to Average Net Assets: |
|
|
|
|
|
|
|
|
|
|
|
Ratios before expense limitation: |
|
|
|
|
|
|
|
|
|
|
|
Expenses to Average Net Assets |
| N/A |
| N/A |
| N/A |
| 1.07 | % | 1.06 | % |
Net Investment Income (Loss) to Average Net Assets |
| N/A |
| N/A |
| N/A |
| 0.07 | % | (0.04 | )% |
|
|
|
|
|
|
|
|
|
|
|
|
† Per share amount is based on average shares outstanding. | |||||||||||
| |||||||||||
‡ Amount is less than $0.005 per share. | |||||||||||
| |||||||||||
§ In 2003, performance was positively impacted by approximately 1.34%, due to the receipt of proceeds from the settlement of class action suits involving, primarily, one of the Portfolio’s holdings. This was a one-time settlement, and as a result, the impact on the NAV and consequently the performance will not likely be repeated in the future. Had these settlements not occurred, the total return for Class A shares and Class B shares would have been approximately 25.07% and 24.79% respectively. | |||||||||||
The accompanying notes are an integral part of the financial statements.
168
| 2006 Annual Report |
| |
| December 31, 2006 |
Financial Highlights
U.S. Real Estate Portfolio
|
| Class A |
| |||||||||||||
|
| Year Ended December 31, |
| |||||||||||||
Selected Per Share Data and Ratios |
| 2006 |
| 2005 |
| 2004 |
| 2003 |
| 2002 |
| |||||
Net Asset Value, Beginning of Period |
| $ | 23.41 |
| $ | 23.21 |
| $ | 17.92 |
| $ | 13.55 |
| $ | 14.63 |
|
Income (Loss) from Investment Operations |
|
|
|
|
|
|
|
|
|
|
| |||||
Net Investment Income (Loss)† |
| 0.42 |
| 0.45 |
| 0.40 |
| 0.48 |
| 0.52 |
| |||||
Net Realized and Unrealized Gain (Loss) on Investments |
| 8.44 |
| 3.58 |
| 6.17 |
| 4.55 |
| (0.48 | ) | |||||
Total from Investment Operations |
| 8.86 |
| 4.03 |
| 6.57 |
| 5.03 |
| 0.04 |
| |||||
Distributions from and/or in Excess of: |
|
|
|
|
|
|
|
|
|
|
| |||||
Net Investment Income |
| (0.49 | ) | (0.44 | ) | (0.42 | ) | (0.48 | ) | (0.52 | ) | |||||
Net Realized Gain |
| (3.54 | ) | (3.39 | ) | (0.86 | ) | (0.18 | ) | (0.60 | ) | |||||
Total Distributions |
| (4.03 | ) | (3.83 | ) | (1.28 | ) | (0.66 | ) | (1.12 | ) | |||||
Redemption Fees |
| 0.00 | ‡ | — |
| — |
| — |
| — |
| |||||
Net Asset Value, End of Period |
| $ | 28.24 |
| $ | 23.41 |
| $ | 23.21 |
| $ | 17.92 |
| $ | 13.55 |
|
Total Return |
| 38.85 | % | 17.66 | % | 37.28 | % | 37.61 | % | 0.18 | % | |||||
Ratios and Supplemental Data: |
|
|
|
|
|
|
|
|
|
|
| |||||
Net Assets, End of Period (Thousands) |
| $ | 1,635,926 |
| $ | 1,209,668 |
| $ | 1,097,718 |
| $ | 897,551 |
| $ | 655,274 |
|
Ratio of Expenses to Average Net Assets (1) |
| 0.87 | % | 0.89 | % | 0.97 | % | 1.00 | % | 0.99 | % | |||||
Ratio of Expenses to Average Net Assets Excluding Bank Overdraft Expense |
| 0.87 | % | 0.89 | % | N/A |
| N/A |
| N/A |
| |||||
Ratio of Net Investment Income (Loss) to Average Net Assets (1) |
| 1.55 | % | 1.87 | % | 2.02 | % | 3.08 | % | 3.49 | % | |||||
Portfolio Turnover Rate |
| 36 | % | 33 | % | 21 | % | 17 | % | 47 | % | |||||
|
|
|
|
|
|
|
|
|
|
|
| |||||
(1) Supplemental Information on the Ratios to Average Net Assets: |
|
|
|
|
|
|
|
|
|
|
| |||||
Ratios before expense limitation: |
|
|
|
|
|
|
|
|
|
|
| |||||
Expenses to Average Net Assets |
| N/A |
| N/A |
| N/A |
| 1.01 | % | 0.99 | % | |||||
Net Investment Income (Loss) to Average Net Assets |
| N/A |
| N/A |
| N/A |
| 3.07 | % | 3.49 | % | |||||
|
| Class B |
| |||||||||||||
|
| Year Ended December 31, |
| |||||||||||||
Selected Per Share Data and Ratios |
| 2006 |
| 2005 |
| 2004 |
| 2003 |
| 2002 |
| |||||
Net Asset Value, Beginning of Period |
| $ | 23.21 |
| $ | 23.04 |
| $ | 17.80 |
| $ | 13.47 |
| $ | 14.55 |
|
Income (Loss) from Investment Operations |
|
|
|
|
|
|
|
|
|
|
| |||||
Net Investment Income (Loss)† |
| 0.37 |
| 0.38 |
| 0.35 |
| 0.45 |
| 0.45 |
| |||||
Net Realized and Unrealized Gain (Loss) on Investments |
| 8.34 |
| 3.56 |
| 6.13 |
| 4.50 |
| (0.45 | ) | |||||
Total from Investment Operations |
| 8.71 |
| 3.94 |
| 6.48 |
| 4.95 |
| — |
| |||||
Distributions from and/or in Excess of: |
|
|
|
|
|
|
|
|
|
|
| |||||
Net Investment Income |
| (0.42 | ) | (0.38 | ) | (0.38 | ) | (0.44 | ) | (0.48 | ) | |||||
Net Realized Gain |
| (3.54 | ) | (3.39 | ) | (0.86 | ) | (0.18 | ) | (0.60 | ) | |||||
Total Distributions |
| (3.96 | ) | (3.77 | ) | (1.24 | ) | (0.62 | ) | (1.08 | ) | |||||
Redemption Fees |
| 0.00 | ‡ | — |
| — |
| — |
| — |
| |||||
Net Asset Value, End of Period |
| $ | 27.96 |
| $ | 23.21 |
| $ | 23.04 |
| $ | 17.80 |
| $ | 13.47 |
|
Total Return |
| 38.52 | % | 17.37 | % | 36.95 | % | 37.23 | % | (0.07 | )% | |||||
Ratios and Supplemental Data: |
|
|
|
|
|
|
|
|
|
|
| |||||
Net Assets, End of Period (Thousands) |
| $ | 268,537 |
| $ | 157,650 |
| $ | 149,180 |
| $ | 70,146 |
| $ | 31,584 |
|
Ratio of Expenses to Average Net Assets (2) |
| 1.12 | % | 1.14 | % | 1.22 | % | 1.25 | % | 1.24 | % | |||||
Ratio of Expenses to Average Net Assets Excluding Bank Overdraft Expense |
| 1.12 | % | 1.14 | % | N/A |
| N/A |
| N/A |
| |||||
Ratio of Net Investment Income (Loss) to Average Net Assets (2) |
| 1.37 | % | 1.60 | % | 1.76 | % | 2.83 | % | 3.24 | % | |||||
Portfolio Turnover Rate |
| 36 | % | 33 | % | 21 | % | 17 | % | 47 | % | |||||
(2) Supplemental Information on the Ratios to Average Net Assets: |
|
|
|
|
|
|
|
|
|
|
|
Ratios before expense limitation: |
|
|
|
|
|
|
|
|
|
|
|
Expenses to Average Net Assets |
| N/A |
| N/A |
| N/A |
| 1.26 | % | 1.24 | % |
Net Investment Income (Loss) to Average Net Assets |
| N/A |
| N/A |
| N/A |
| 2.82 | % | 3.24 | % |
|
|
|
|
|
|
|
|
|
|
|
|
† Per share amount is based on average shares outstanding. |
|
|
|
|
|
|
|
| |||
|
|
|
|
|
|
|
|
| |||
‡ Amount is less than $0.005 per share. |
|
|
|
|
|
|
|
| |||
The accompanying notes are an integral part of the financial statements.
169
2006 Annual Report |
|
| |
December 31, 2006 |
|
Financial Highlights
Emerging Markets Debt Portfolio
|
| Class A†† |
| |||||||||||||
|
| Year Ended December 31, |
| |||||||||||||
Selected Per Share Data and Ratios |
| 2006 |
| 2005 |
| 2004 |
| 2003 |
| 2002 |
| |||||
Net Asset Value, Beginning of Period |
| $ | 11.61 |
| $ | 10.92 |
| $ | 10.59 |
| $ | 8.85 |
| $ | 8.85 |
|
Income (Loss) from Investment Operations |
|
|
|
|
|
|
|
|
|
|
| |||||
Net Investment Income† |
| 0.49 |
| 0.81 |
| 0.78 |
| 0.75 |
| 0.81 |
| |||||
Net Realized and Unrealized Gain (Loss) on Investments |
| 0.80 |
| 0.57 |
| 0.30 |
| 1.77 |
| 0.18 |
| |||||
Total from Investment Operations |
| 1.29 |
| 1.38 |
| 1.08 |
| 2.52 |
| 0.99 |
| |||||
Distributions from and/or in Excess of: |
|
|
|
|
|
|
|
|
|
|
| |||||
Net Investment Income |
| (0.91 | ) | (0.69 | ) | (0.75 | ) | (0.78 | ) | (0.99 | ) | |||||
Redemption Fees |
| 0.00 | ‡ | 0.00 | ‡ | 0.00 | ‡ | — |
| — |
| |||||
Net Asset Value, End of Period |
| $ | 11.99 |
| $ | 11.61 |
| $ | 10.92 |
| $ | 10.59 |
| $ | 8.85 |
|
Total Return |
| 11.08 | % | 12.78 | % | 10.07 | % | 28.46 | % | 11.29 | % | |||||
Ratios and Supplemental Data: |
|
|
|
|
|
|
|
|
|
|
| |||||
Net Assets, End of Period (Thousands) |
| $ | 81,212 |
| $ | 92,294 |
| $ | 81,109 |
| $ | 54,647 |
| $ | 48,769 |
|
Ratio of Expenses to Average Net Assets(1) |
| 0.93 | %# | 1.01 | % | 1.04 | %# | 1.16 | % | 1.06 | % | |||||
Ratio of Expenses to Average Net Assets Excluding Bank Overdraft Expense |
| 0.92 | % | 1.00 | % | 1.04 | % | 1.13 | % | N/A |
| |||||
Ratio of Net Investment Income to Average Net Assets(1) |
| 6.11 | % | 7.02 | % | 7.33 | % | 7.48 | % | 8.79 | % | |||||
Portfolio Turnover Rate |
| 55 | % | 84 | % | 151 | % | 216 | % | 157 | % | |||||
(1) Supplemental Information on the Ratios to Average Net Assets: |
|
|
|
|
|
|
|
|
|
|
|
Ratios before expense limitation: |
|
|
|
|
|
|
|
|
|
|
|
Expenses to Average Net Assets |
| 1.04 | % | N/A |
| 1.07 | % | N/A |
| N/A |
|
Net Investment Income (Loss) to Average Net Assets |
| 6.00 | % | N/A |
| 7.30 | % | N/A |
| N/A |
|
|
| Class B†† |
| |||||||||||||
|
| Year Ended December 31, |
| |||||||||||||
Selected Per Share Data and Ratios |
| 2006 |
| 2005 |
| 2004 |
| 2003 |
| 2002 |
| |||||
Net Asset Value, Beginning of Period |
| $ | 11.85 |
| $ | 11.16 |
| $ | 10.80 |
| $ | 9.00 |
| $ | 9.03 |
|
Income (Loss) from Investment Operations |
|
|
|
|
|
|
|
|
|
|
| |||||
Net Investment Income† |
| 0.50 |
| 0.78 |
| 0.78 |
| 0.75 |
| 0.78 |
| |||||
Net Realized and Unrealized Gain (Loss) on Investments |
| 0.81 |
| 0.60 |
| 0.30 |
| 1.80 |
| 0.15 |
| |||||
Total from Investment Operations |
| 1.31 |
| 1.38 |
| 1.08 |
| 2.55 |
| 0.93 |
| |||||
Distributions from and/or in Excess of: |
|
|
|
|
|
|
|
|
|
|
| |||||
Net Investment Income |
| (0.87 | ) | (0.69 | ) | (0.72 | ) | (0.75 | ) | (0.96 | ) | |||||
Redemption Fees |
| 0.00 | ‡ | — |
| — |
| — |
| — |
| |||||
Net Asset Value, End of Period |
| $ | 12.29 |
| $ | 11.85 |
| $ | 11.16 |
| $ | 10.80 |
| $ | 9.00 |
|
Total Return |
| 10.79 | % | 12.54 | % | 9.90 | % | 28.34 | % | 10.34 | % | |||||
Ratios and Supplemental Data: |
|
|
|
|
|
|
|
|
|
|
| |||||
Net Assets, End of Period (Thousands) |
| $ | 565 |
| $ | 596 |
| $ | 437 |
| $ | 429 |
| $ | 343 |
|
Ratio of Expenses to Average Net Assets(2) |
| 1.17 | %# | 1.26 | % | 1.29 | %# | 1.41 | % | 1.31 | % | |||||
Ratio of Expenses to Average Net Assets Excluding Bank Overdraft Expense |
| 1.16 | % | 1.25 | % | 1.29 | % | 1.38 | % | N/A |
| |||||
Ratio of Net Investment Income to Average Net Assets(2) |
| 5.94 | % | 6.70 | % | 7.07 | % | 7.23 | % | 8.54 | % | |||||
Portfolio Turnover Rate |
| 55 | % | 84 | % | 151 | % | 216 | % | 157 | % | |||||
(2) Supplemental Information on the Ratios to Average Net Assets: |
|
|
|
|
|
|
|
|
|
|
| |
Ratios before expense limitation: |
|
|
|
|
|
|
|
|
|
|
| |
Expenses to Average Net Assets |
| 1.29 | % | N/A |
| 1.32 | % | N/A |
| N/A |
| |
Net Investment Income (Loss) to Average Net Assets |
| 5.82 | % | N/A |
| 7.04 | % | N/A |
| N/A |
| |
|
|
|
|
|
|
|
|
|
|
|
| |
† | Per share amount is based on average shares outstanding. | |||||||||||
|
| |||||||||||
†† | On March 17, 2006, the Portfolio effected a reverse stock split as described in the Notes to Financial Statements. Per share data prior to this date has been restated to give effect to the reverse stock split. | |||||||||||
|
| |||||||||||
‡ | Amount is less than $0.005 per share. | |||||||||||
|
| |||||||||||
# | Effective June 1, 2006, the Adviser has voluntarily agreed to limit the ratio of expenses to average net assets to the maximum ratio of 0.85% for Class A shares and 1.10% for Class B shares. Prior to June 1, 2006, these maximum ratios were 1.00% for Class A shares and 1.25% for Class B shares. Prior to May 1, 2004 these maximum ratios were 1.75% for Class A shares and 2.00% for Class B shares. | |||||||||||
The accompanying notes are an integral part of the financial statements.
170
| 2006 Annual Report |
| |
| December 31, 2006 |
Notes to Financial Statements
Morgan Stanley Institutional Fund, Inc. (the “Fund”) is registered under the Investment Company Act of 1940, as amended (the “1940 Act”), as an open-end management investment company. The Fund is comprised of twenty separate, active, diversified and non-diversified portfolios (individually referred to as a “Portfolio”, collectively as the “Portfolios”). Each Portfolio (with the exception of the International Small Cap Portfolio) offers two classes of shares - Class A and Class B. Both classes of shares have identical voting rights (except that shareholders of a Class have exclusive voting rights regarding any matter relating solely to that Class of shares), dividend, liquidation and other rights. Effective April 28, 2006, each of the Systematic Active Large Cap Core, Systematic Active Small Cap Core, Systematic Active Small Cap Growth and Systematic Active Small Cap Value Portfolios commenced operations. Effective August 30, 2006 the Global Real Estate Portfolio commenced operations.
For detailed descriptions of the investment objectives of each of the Portfolios and other related information, please refer to the Prospectuses of the Fund. Generally, the investment objective of the domestic and international equity portfolios is to seek capital appreciation by investing in equity and equity-related securities. The investment objective of the international fixed income portfolio is primarily to seek a high total return consistent with preservation of capital.
The Global Franchise, International Equity, International Real Estate, International Small Cap and U.S. Real Estate Portfolios are currently closed to new investors. However, these Portfolios will continue to offer shares as follows: (1) through certain retirement plan accounts, (2) to clients of registered investment advisors who currently offer shares of the Portfolios in their discretionary asset allocation programs, (3) through certain endowments and foundations, (4) to clients of family office practices where shares of the Portfolios are held by family members of such clients, (5) to directors and trustees of the Morgan Stanley Funds, (6) to Morgan Stanley and its affiliates and their employees, and (7) to benefit plans sponsored by Morgan Stanley and its affiliates. The Portfolios will continue to offer shares of the Portfolios to existing shareholders and may recommence offering shares of the Portfolios to other new investors in the future.
The Fund has suspended offering shares of the Small Company Growth Portfolio to new investors. The Fund will continue to offer shares of the Portfolio to existing shareholders. The Fund may recommence offering shares of the Portfolio to new investors in the future.
On April 28, 2006, the net assets of the Equity Portfolio’s (formerly, a Portfolio of Morgan Stanley Institutional Fund Trust) Institutional Class shares were merged into the Large Cap Relative Value Portfolio’s Class A shares through a tax-free exchange. In exchange for the $66,823,000 in net assets received, including $3,685,000 in unrealized appreciation, 5,706,469 Class A shares of the Large Cap Relative Value Portfolio were issued. Prior to the combination, the net assets of the Large Cap Relative Value Portfolio totaled $194,284,000. Immediately after the combination, the net assets of the Large Cap Relative Value Portfolio totaled $261,107,000.
A. Accounting Policies: The following significant accounting policies are in conformity with U.S. generally accepted accounting principles. Such policies are consistently followed by the Fund in the preparation of the financial statements. U.S. generally accepted accounting principles may require management to make estimates and assumptions that affect the reported amounts and disclosures in the financial statements. Actual results may differ from those estimates.
1. Security Valuation: Securities listed on a foreign exchange are valued at their closing price. Unlisted securities and listed securities not traded on the valuation date for which market quotations are readily available are valued at the mean between the current bid and asked prices obtained from reputable brokers. Equity securities listed on a U.S. exchange are valued at the latest quoted sales price on the valuation date. Equity securities listed or traded on NASDAQ, for which market quotations are available, are valued at the NASDAQ Official Closing Price. Bonds and other fixed income securities may be valued according to the broadest and most representative market. In addition, bonds and other fixed income securities may be valued on the basis of prices provided by a pricing service. The prices provided by a pricing service take into account broker dealer market price quotations for institutional size trading in similar groups of securities, security quality, maturity, coupon and other security characteristics as well as any developments related to the specific securities. Debt securities purchased with remaining maturities of 60 days or less are valued at amortized cost, if it approximates value.
All other securities and investments for which market values are not readily available, including restricted securities, and those securities for which it is inappropriate to determine prices in accordance with the aforementioned procedures, are valued at fair value as determined in good faith under procedures adopted by the Board of Directors, although the actual calculations may be done by others. Factors considered in making this determination may include, but are not limited to, information obtained by contacting the issuer, analysts, or the appropriate stock exchange (for exchange-traded securities), analysis of the issuer’s financial statements or other available documents
171
2006 Annual Report |
|
|
|
December 31, 2006 |
|
Notes to Financial Statements (cont’d)
and, if necessary, available information concerning other securities in similar circumstances.
Most foreign markets close before the New York Stock Exchange (NYSE). Occasionally, developments that could affect the closing prices of securities and other assets may occur between the times at which valuations of such securities are determined (that is, close of the foreign market on which the securities trade) and the close of business on the NYSE. If these developments are expected to materially affect the value of the securities, the valuations may be adjusted to reflect the estimated fair value as of the close of the NYSE, as determined in good faith under procedures established by the Board of Directors.
2. Repurchase Agreements: The Portfolios may enter into repurchase agreements under which a Portfolio lends excess cash and takes possession of securities with an agreement that the counterparty will repurchase such securities. In connection with transactions in repurchase agreements, a bank as custodian for the Fund takes possession of the underlying securities which are held as collateral, with a market value at least equal to the amount of the repurchase transaction, including principal and accrued interest. To the extent that any repurchase transaction exceeds one business day, the value of the collateral is marked-to-market on a daily basis to determine the adequacy of the collateral. In the event of default on the obligation to repurchase, the Fund has the right to liquidate the collateral and apply the proceeds in satisfaction of the obligation. In the event of default or bankruptcy by the counterparty to the agreement, realization and/or retention of the collateral or proceeds may be subject to legal proceedings. The Portfolios, along with other affiliated investment companies, may utilize a joint trading account for the purpose of entering into repurchase agreements.
3. Foreign Currency Translation and Foreign Investments: The books and records of the Fund are maintained in U.S. dollars. Foreign currency amounts are translated into U.S. dollars at the mean of the bid and asked prices of such currencies against U.S. dollars last quoted by a major bank, prior to the close of the NYSE, as follows:
- investments, other assets and liabilities-at the prevailing rates of exchange on the valuation date;
- investment transactions, investment income and expenses-at the prevailing rates of exchange on the dates of such transactions.
Although the net assets of the Fund are presented at the foreign exchange rates and market values at the close of the period, the Fund does not isolate that portion of the results of operations arising as a result of changes in the foreign exchange rates from the fluctuations arising from changes in the market prices of the securities held at period end. Similarly, the Fund does not isolate the effect of changes in foreign exchange rates from the fluctuations arising from changes in the market prices of securities sold during the period. Accordingly, realized and unrealized foreign currency gains (losses) on investments in securities are included in the reported net realized and unrealized gains (losses) on investment transactions and balances. However, pursuant to U.S. Federal income tax regulations, gains and losses from certain foreign currency transactions and the foreign currency portion of gains and losses realized on sales and maturities of foreign denominated debt securities are treated as ordinary income for U.S. Federal income tax purposes.
Net realized gains (losses) on foreign currency transactions represent net foreign exchange gains (losses) from foreign currency exchange contracts, disposition of foreign currencies, currency gains or losses realized between the trade and settlement dates on securities transactions, and the difference between the amount of investment income and foreign taxes recorded on the Fund’s books and the U.S. dollar equivalent amounts actually received or paid. Net unrealized currency gains (losses) from valuing foreign currency denominated assets and liabilities at period end exchange rates are reflected as a component of unrealized appreciation (depreciation) on the Statements of Assets and Liabilities. The change in net unrealized currency gains (losses) for the period is reflected on the Statements of Operations.
Foreign security and currency transactions may involve certain considerations and risks not typically associated with those of U.S. dollar denominated transactions as a result of, among other factors, fluctuations of exchange rates in relation to the U.S. dollar, the possibility of lower levels of government supervision and regulation of foreign securities markets and the possibility of political or economic instability.
Prior governmental approval for foreign investments may be required under certain circumstances in some countries, and the extent of foreign investments in domestic companies may be subject to limitation in other countries. Foreign ownership limitations also may be imposed by the charters of individual companies to prevent, among other concerns, violations of foreign investment limitations. As a result, an additional class of shares
172
| 2006 Annual Report |
|
|
| December 31, 2006 |
Notes to Financial Statements (cont’d)
(identified as “Foreign” in the Portfolio of Investments) may be created and offered for investment. The “local” and “foreign shares” market values may differ. In the absence of trading of the foreign shares in such markets, the Fund values the foreign shares at the closing exchange price of the local shares. Such securities, if any, are identified as fair valued on the Portfolio of Investments.
4. Foreign Currency Exchange Contracts: Certain Portfolios may enter into foreign currency exchange contracts generally to attempt to protect securities and related receivables and payables against changes in future foreign currency exchange rates and, in certain situations, to gain exposure to foreign currencies. Certain Portfolios may also enter into cross currency hedges which involve the sale of one currency against the positive exposure to a different currency. Cross currency hedges may be used for hedging purposes or to establish an active exposure to the exchange rate between any two currencies. A foreign currency exchange contract is an agreement between two parties to buy or sell currency at a set price on a future date. The market value of the contract will fluctuate with changes in currency exchange rates. The contract is marked-to-market daily and the change in market value is recorded by the Portfolios as unrealized gain or loss. The Portfolios record realized gains or losses when the contract is closed equal to the difference between the value of the contract at the time it was opened and the value at the time it was closed. Credit risk may arise upon entering into these contracts from the potential inability of counterparts to meet the terms of their contracts and is generally limited to the amount of the unrealized gains on the contracts, if any, at the date of default. Risks may also arise from unanticipated movements in the value of a foreign currency relative to the U.S. dollar.
5. Loan Agreements: Certain Portfolios may invest in fixed and floating rate loans (“Loans”) arranged through private negotiations between an issuer of sovereign debt obligations and one or more financial institutions (“Lenders”) deemed to be creditworthy by the investment adviser. A Portfolio’s investments in Loans may be in the form of participation in Loans (“Participation”) or assignments of all or a portion of Loans (“Assignments”) from third parties. A Portfolio’s investment in a Participation typically results in the Portfolio having a contractual relationship with only the Lender and not with the borrower. The Portfolios have the right to receive payments of principal, interest and any fees to which it is entitled only upon receipt by the Lender of the payments from the borrower. The Portfolios generally have no right to enforce compliance by the borrower under the terms of the loan agreement. As a result, the Portfolio may be subject to the credit risk of both the borrower and the Lender that is selling the Participation and any intermediaries between the Lender and the Portfolio. When a Portfolio purchases Assignments from Lenders, it typically acquires direct rights against the borrower on the Loan. Because Assignments are arranged through private negotiations between potential assignees and potential assignors, the rights and obligations acquired by the Portfolio as the purchaser of an Assignment may differ from, and be more limited than, those held by the assigning Lender.
6. Short Sales: Certain Portfolios may sell securities short. A short sale is a transaction in which a Portfolio sells securities it may or may not own, but has borrowed, in anticipation of a decline in the market price of the securities. The Portfolio is obligated to replace the borrowed securities at the market price at the time of replacement. The Portfolio may have to pay a premium to borrow the securities as well as pay any dividends or interest payable on the securities until they are replaced. Dividends and interest payable on such securities sold short are included in dividend expense and interest expense, respectively, in the Statements of Operations. A Portfolio’s obligation to replace the securities borrowed in connection with a short sale will generally be secured by collateral deposited with the broker that consists of cash, U.S. government securities or other liquid, high grade debt obligations. In addition, the Portfolio will either designate on the Portfolio’s records or place in a segregated account with its Custodian an amount of cash, U.S. government securities or other liquid high grade debt obligations equal to the difference, if any, between (1) the market value of the securities sold at the time they were sold short and (2) cash, U.S. government securities or other liquid high grade debt obligations deposited as collateral with the broker in connection with the short sale. Short sales by the Portfolios involve certain risks and special considerations. Possible losses from short sales differ from losses that could be incurred from the purchase of a security, because losses from short sales may be unlimited, whereas losses from purchases cannot exceed the total amount invested.
7. Securities Lending: Certain Portfolios may lend securities to qualified financial institutions, such as broker-dealers, to earn additional income. Any increase or decrease in the fair value of the securities loaned that might occur and any interest earned or dividends declared on those securities during the term of the loan would remain in the Portfolio. Portfolios that lend securities receive cash or securities as collateral in an amount equal to or exceeding 100% of the current fair value of the
173
2006 Annual Report |
|
|
|
December 31, 2006 |
|
Notes to Financial Statements (cont’d)
loaned securities. The collateral is marked to market daily, by the securities lending agent, to ensure that a minimum of 100% collateral coverage is maintained.
Based on pre-established guidelines, the securities lending agent invests any cash collateral that is received in high-quality short-term investments. Securities lending income is generated from the earnings on the invested collateral and borrowing fees, less any rebates owed to the borrowers and compensation to the lending agent, and is included in the Portfolios’ Statements of Operations in interest income. Risks in securities lending transactions are that a borrower may not provide additional collateral when required or return the securities when due, and that the value of the short-term investments will be less than the amount of cash collateral plus any rebate that is required to be returned to the borrower.
The value of loaned securities and related collateral outstanding at December 31, 2006 are as follows:
|
| Value of |
|
|
| ||
|
| Loaned |
| Value of |
| ||
|
| Securities |
| Collateral |
| ||
Portfolio |
| (000) |
| (000) |
| ||
Active International Allocation |
| $ | 121,642 |
| $ | 127,541 |
|
Emerging Markets |
| 152,940 |
| 160,824 |
| ||
Global Value Equity |
| 7,841 |
| 8,207 |
| ||
International Equity |
| 603,724 |
| 635,463 |
| ||
International Magnum |
| 9,829 |
| 10,309 |
| ||
Systematic Active Large Cap Core |
| 412 |
| 421 |
| ||
Systematic Active Small Cap Core |
| 1,771 |
| 1,834 |
| ||
Systematic Active Small Cap Growth |
| 2,103 |
| 2,174 |
| ||
Systematic Active Small Cap Value |
| 2,167 |
| 2,240 |
| ||
Emerging Markets Debt |
| 13,206 |
| 13,773 |
| ||
The following Portfolios had income from securities lending (after rebates to borrowers and fee paid to securities lending agent):
|
| Net Interest |
| |
|
| Earned by |
| |
|
| Portfolio |
| |
Portfolio |
| (000) |
| |
Active International Allocation |
| $ | 815 |
|
Emerging Markets |
| 854 |
| |
Global Value Equity |
| 43 |
| |
International Equity |
| 7,361 |
| |
International Magnum |
| 94 |
| |
Systematic Active Large Cap Core |
| 1 |
| |
Systematic Active Small Cap Core |
| 4 |
| |
Systematic Active Small Cap Growth |
| 4 |
| |
Systematic Active Small Cap Value |
| 3 |
| |
Emerging Markets Debt |
| 16 |
| |
8. Structured Securities: The Emerging Markets Debt Portfolio may invest in interests in entities organized and operated solely for the purpose of restructuring the investment characteristics of sovereign debt obligations. This type of restructuring involves the deposit with or purchase by an entity of specified instruments and the issuance by that entity of one or more classes of securities (“Structured Securities”) backed by, or representing interests in, the underlying instruments. Structured Securities generally will expose the Portfolio to credit risks of the underlying instruments as well as of the issuer of the structured security. Structured securities are typically sold in private placement transactions with no active trading market. Investments in Structured Securities may be more volatile than their underlying instruments; however, any loss is limited to the amount of the original investment.
9. Futures: Certain Portfolios may purchase and sell futures contracts. Futures contracts provide for the sale by one party and purchase by another party of a specified amount of a specified security, index, instrument or basket of instruments. Futures contracts (secured by cash, government securities or other high grade liquid investments deposited with brokers or custodians as “initial margin”) are valued based upon their quoted daily settlement prices; changes in initial settlement value (represented by cash paid to or received from brokers as “variation margin”) are accounted for as unrealized appreciation (depreciation). When futures contracts are closed, the difference between the opening value at the date the contract was entered into and the value at closing is recorded as a realized gain or loss in the Statements of Operations. Due from (to) broker includes both initial margin and variation margin, as stated in the Statements of Assets and Liabilities.
Certain Portfolios may use futures contracts in order to manage their exposure to the stock and bond markets, to hedge against unfavorable changes in the value of securities or to remain fully invested and to reduce transaction costs. Futures contracts involve market risk in excess of the amounts recognized in the Statements of Assets and Liabilities. Risks arise from the possible movements in security values underlying these instruments. The change in value of futures contracts primarily corresponds with the value of their underlying instruments, which may not correlate with the change in value of hedged investments.
10. Purchased and Written Options: Certain Portfolios may write covered call and put options on portfolio securities and other financial instruments. Premiums are received and are recorded as liabilities. The liabilities are subsequently adjusted to reflect the current value of the options written. Premiums received from writing options which expire are treated as realized gains. Premiums received from writing options which are exercised or are closed are added to or offset against the proceeds or amount paid on the transaction to determine the net realized gain or loss. By writing a covered call option, a Portfolio,
174
| 2006 Annual Report |
|
|
| December 31, 2006 |
Notes to Financial Statements (cont’d)
in exchange for the premium, foregoes the opportunity for capital appreciation above the exercise price should the market price of the underlying security increase. By writing a put option, a Portfolio, in exchange for the premium, accepts the risk of having to purchase a security at an exercise price that is above the current market price.
Certain Portfolios may purchase call and put options on their portfolio securities or other financial instruments. Each Portfolio may purchase call options to protect against an increase in the price of the security or financial instrument it anticipates purchasing. Each Portfolio may purchase put options on securities which it holds or other financial instruments to protect against a decline in the value of the security or financial instrument or to close out covered written put positions. Risks may arise from an imperfect correlation between the change in market value of the securities held by the Portfolio and the prices of options relating to the securities purchased or sold by the Portfolio and from the possible lack of a liquid secondary market for an option. The maximum exposure to loss for any purchased option is limited to the premium initially paid for the option.
11. Unfunded Commitments: Subject to the terms of a Subscription Agreement between the U.S. Real Estate Portfolio and BRCP REIT I, LLC the Portfolio has made a subscription commitment of $7,000,000 for which it will receive 7,000,000 shares of common stock. As of December 31, 2006, BRCP REIT I, LLC has drawn down $5,934,000 which represents 84.8% of the commitment. In addition, the Portfolio received return of capital distributions totaling $1,545,000.
Subject to the terms of a Subscription Agreement between the U.S. Real Estate Portfolio and BRCP REIT II, LLC the Portfolio has made a subscription commitment of $9,000,000 for which it will receive 9,000,000 shares of common stock. As of December 31, 2006, BRCP REIT II, LLC has drawn down $1,061,000 which represents 11.8% of the commitment.
Subject to the terms of a Subscription Agreement between the U.S. Real Estate Portfolio and Keystone Industrial Fund, L.P., the Portfolio has made a subscription commitment of $7,500,000 for which it will receive 7,500,000 shares of common stock. As of December 31, 2006, Keystone Industrial Fund, L.P. has drawn down $1,638,000, which represents 21.8% of the commitment.
Subject to the terms of a Subscription Agreement between the U.S. Real Estate Portfolio and Cabot Industrial Value Fund, L.P., the Portfolio has made a subscription commitment of $7,500,000 for which it will receive 15,000 shares of common stock. As of December 31, 2006, Cabot Industrial Value Fund, L.P. has drawn down $1,834,000, which represents 24.5% of the commitment.
12. Redemption Fees: The following redemption fees are designed to protect each Portfolio and its shareholders from the effects of short-term trading. Shares of the Active International Allocation, Emerging Markets, Global Franchise, Global Real Estate, Global Value Equity, International Equity, International Growth Equity, International Magnum, International Real Estate, International Small Cap, Large Cap Relative Value, Small Company Growth, Systematic Active Small Cap Core, Systematic Active Small Cap Growth, Systematic Active Small Cap Value, U.S. Real Estate and Emerging Markets Debt Portfolios redeemed within 30 days of purchase may be subject to a 2% redemption fee. Shares of the Focus Equity, Systematic Active Large Cap Core and U.S. Large Cap Growth Portfolios redeemed within 7 days of purchase may be subject to a 2% redemption fee. These fees, if any, are included on the Statements of Changes in Net Assets.
13. Restricted Securities: Certain Portfolios may invest in unregistered or otherwise restricted securities. The term restricted securities refers to securities that are unregistered or are held by control persons of the issuer and securities that are subject to contractual restrictions on their resale. As a result, restricted securities may be more difficult to value and the Portfolio may have difficulty disposing of such assets either in a timely manner or for a reasonable price. In order to dispose of an unregistered security, the Portfolio, where it has contractual rights to do so, may have to cause such security to be registered. A considerable period may elapse between the time the decision is made to sell the security and the time the security is registered so that the Fund could sell it. Contractual restrictions on the resale of securities vary in length and scope and are generally the result of a negotiation between the issuer and acquiror of the securities. The Portfolio would, in either case, bear market risks during that period.
14. New Accounting Pronouncements: In July 2006, the Financial Accounting Standards Board (FASB) issued Interpretation 48, “Accounting for Uncertainty in Income Taxes — an Interpretation of FASB Statement No. 109” (FIN 48). FIN 48 clarifies the accounting for income taxes by prescribing the minimum recognition threshold a tax position must meet before being recognized in the financial statements. FIN 48 is effective for fiscal years beginning after December 15, 2006 and is to be applied to all open tax years as of the effective date. Recent SEC guidance allows implementing FIN 48 in the
175
2006 Annual Report |
|
|
|
December 31, 2006 |
|
Notes to Financial Statements (cont’d)
Portfolio NAV calculations as late as the Portfolio’s last NAV calculation in the first required financial statement period. As a result, the Portfolio will incorporate FIN 48 in its semi annual report on June 30, 2007. The impact to the Portfolio’s financial statements, if any, is currently being assessed.
In addition, in September 2006, Statement of Financial Accounting Standards No. 157, Fair Value Measurements (SFAS 157), was issued and is effective for fiscal years beginning after November 15, 2007. SFAS 157 defines fair value, establishes a framework for measuring fair value and expands disclosures about fair value measurements. Management is currently evaluating the impact the adoption of SFAS 157 will have on the Portfolios’ financial statement disclosures.
15. Other: Security transactions are accounted for on the date the securities are purchased or sold. Realized gains and losses on the sale of investment securities are determined on the specific identified cost basis. Dividend income and distributions are recorded on the ex-dividend date (except for certain foreign dividends which may be recorded as soon as the Fund is informed of such dividends) net of applicable withholding taxes. Interest income is recognized on the accrual basis except where collection is in doubt. Discounts and premiums on securities purchased are amortized according to the effective yield method over their respective lives. Most expenses of the Fund can be directly attributed to a particular Portfolio. Expenses which cannot be directly attributed are apportioned among the Portfolios based upon relative net assets or other appropriate measures. Income, expenses (other than class specific expenses) and realized and unrealized gains or losses are allocated to each class of shares based upon their relative net assets.
Certain Portfolios may own shares of real estate investment trusts (“REITs”) which report information on the source of their distributions annually. A portion of distributions received from REITs during the year is estimated to be a return of capital and is recorded as a reduction of their cost.
B. Investment Advisory Fees: Morgan Stanley Investment Management Inc. (the “Adviser” or “MS Investment Management”), a wholly-owned subsidiary of Morgan Stanley, provides the Fund with investment advisory services under the terms of an Investment Advisory Agreement (the “Agreement”) at the annual rates of the average daily net assets indicated below. MS Investment Management has voluntarily agreed to waive fees payable to it and to reimburse the Portfolios for certain expenses, after giving effect to custody fee offsets, if necessary, if the total annual operating expenses, excluding bank overdraft, certain foreign taxes and extraordinary expenses as defined, expressed as a percentage of average daily net assets, exceed the maximum ratios indicated as follows:
|
|
|
|
|
| Maximum |
| ||
|
|
|
|
|
| Expense Ratio |
| ||
|
| Average Daily |
| Advisory |
|
|
|
|
|
Portfolio |
| Net Assets |
| Fee |
| Class A |
| Class B |
|
Active International Allocation |
| first $1.0 billion |
| 0.65 | % | 0.80 | % | 1.05 | % |
|
| over $1.0 billion |
| 0.60 |
|
|
|
|
|
Emerging Markets |
| first $500 million |
| 1.25 |
| 1.65 |
| 1.90 |
|
|
| next $500 million |
| 1.20 |
|
|
|
|
|
|
| next $1.5 billion |
| 1.15 |
|
|
|
|
|
|
| over $2.5 billion |
| 1.00 |
|
|
|
|
|
Global Franchise |
| first $500 million |
| 0.80 |
| 1.00 | % | 1.25 | % |
|
| next $500 million |
| 0.75 |
|
|
|
|
|
|
| over $1.0 billion |
| 0.70 |
|
|
|
|
|
Global Real Estate |
|
|
| 0.85 |
| 1.05 |
| 1.30 |
|
Global Value Equity |
| first $1.0 billion |
| 0.67 |
| 1.00 |
| 1.25 |
|
|
| next $500 million |
| 0.645 |
|
|
|
|
|
|
| next $1.0 billion |
| 0.62 |
|
|
|
|
|
|
| next $1.0 billion |
| 0.595 |
|
|
|
|
|
|
| next $1.0 billion |
| 0.57 |
|
|
|
|
|
|
| over $4.5 billion |
| 0.545 |
|
|
|
|
|
International Equity |
| first $10 billion |
| 0.80 |
| 1.00 |
| 1.25 |
|
|
| over $10 billion |
| 0.75 |
|
|
|
|
|
International Growth Equity |
| first $1.0 billion |
| 0.75 |
| 1.00 |
| 1.25 |
|
|
| over $1.0 billion |
| 0.70 |
|
|
|
|
|
International Magnum |
| first $500 million |
| 0.80 |
| 1.00 |
| 1.25 |
|
|
| next $500 million |
| 0.75 |
|
|
|
|
|
|
| over $1.0 billion |
| 0.70 |
|
|
|
|
|
International Real Estate |
|
|
| 0.80 |
| 1.00 |
| 1.25 |
|
International Small Cap |
| first $1.5 billion |
| 0.95 |
| 1.15 |
| N/A |
|
|
| over $1.5 billion |
| 0.90 |
|
|
|
|
|
Focus Equity |
| first $1.0 billion |
| 0.50 |
| 1.00 |
| 1.25 |
|
|
| next $1.0 billion |
| 0.45 |
|
|
|
|
|
|
| next $1.0 billion |
| 0.40 |
|
|
|
|
|
|
| over $3.0 billion |
| 0.35 |
|
|
|
|
|
Large Cap Relative Value |
| first $150 million |
| 0.50 |
| 0.70 |
| 0.95 |
|
|
| next $100 million |
| 0.45 |
|
|
|
|
|
|
| next $100 million |
| 0.40 |
|
|
|
|
|
|
| over $350 million |
| 0.35 |
|
|
|
|
|
Small Company Growth |
| first $1.0 billion |
| 0.92 |
| 1.10 |
| 1.35 |
|
|
| next $500 million |
| 0.85 |
|
|
|
|
|
|
| over $1.5 billion |
| 0.80 |
|
|
|
|
|
Systematic Active Large Cap Core |
|
|
| 0.35 |
| 0.60 |
| 0.85 |
|
Systematic Active Small Cap Core |
|
|
| 0.75 |
| 1.10 |
| 1.35 |
|
Systematic Active Small Cap Growth |
|
|
| 0.75 |
| 1.10 |
| 1.35 |
|
Systematic Active Small Cap Value |
|
|
| 0.75 |
| 1.10 |
| 1.35 |
|
U.S. Large Cap Growth |
| first $1.0 billion |
| 0.50 |
| 0.80 |
| 1.05 |
|
|
| next $1.0 billion |
| 0.45 |
|
|
|
|
|
|
| next $1.0 billion |
| 0.40 |
|
|
|
|
|
|
| over $3.0 billion |
| 0.35 |
|
|
|
|
|
U.S. Real Estate |
| first $500 million |
| 0.80 |
| 1.00 |
| 1.25 |
|
|
| next $500 million |
| 0.75 |
|
|
|
|
|
|
| over $1.0 billion |
| 0.70 |
|
|
|
|
|
176
| 2006 Annual Report |
|
|
| December 31, 2006 |
Notes to Financial Statements (cont’d)
|
|
|
|
|
| Maximum |
| ||
|
|
|
|
|
| Expense Ratio |
| ||
|
| Average Daily |
| Advisory |
|
|
|
|
|
Portfolio |
| Net Assets |
| Fee |
| Class A |
| Class B |
|
Emerging Markets Debt |
| first $500 million |
| 0.75 | % | 0.85 | % | 1.10 | % |
|
| next $500 million |
| 0.70 |
|
|
|
|
|
|
| over $1.0 billion |
| 0.65 |
|
|
|
|
|
Prior to June 1, 2006, the maximum expense ratio was 1.00% for Class A and 1.25% for Class B of the Emerging Markets Debt Portfolio.
Fee waivers and/or expense reimbursements are voluntary and may be commenced or terminated at any time. For the year ended December 31, 2006, the Portfolios had advisory fees waived and/or certain expenses reimbursed as follows:
|
| Advisory Fees |
| |
|
| Waived and/or |
| |
|
| Reimbursed |
| |
Portfolio |
| (000) |
| |
Active International Allocation |
| $ | 128 |
|
Global Franchise |
| 4 |
| |
Global Real Estate |
| 57 |
| |
International Growth Equity |
| 103 |
| |
International Magnum |
| 119 |
| |
Systematic Active Large Cap Core |
| 63 |
| |
Systematic Active Small Cap Core |
| 57 |
| |
Systematic Active Small Cap Growth |
| 58 |
| |
Systematic Active Small Cap Value |
| 55 |
| |
Emerging Markets Debt |
| 93 |
| |
The Adviser has entered into Sub-Advisory Agreements with Morgan Stanley Investment Advisors Inc., Morgan Stanley Investment Management Limited, Morgan Stanley Asset & Investment Trust Management Co., Limited and Morgan Stanley Investment Management Company (each a “Sub-Adviser”), all wholly-owned subsidiaries of Morgan Stanley. The Sub-Advisers, subject to the control and supervision of the Fund, its officers, Directors and the Adviser, and in accordance with the investment objectives, policies and restrictions of the Portfolios, make certain day-to-day investment decisions for certain Portfolios and place certain of the Portfolios’ purchase and sales orders. The Adviser pays the Sub-Advisers on a monthly basis a portion of the net advisory fees the Adviser receives from the Portfolios which receive these services.
C. Administration Fees: MS Investment Management (the “Administrator”) also provides the Fund with administrative services pursuant to an administration agreement for a monthly fee, which on an annual basis equals 0.08% of the average daily net assets of each Portfolio. Under an agreement between the Administrator and J.P. Morgan Investor Services Co. (“JPMIS”), a corporate affiliate of JP Morgan Chase Bank, N.A., JPMIS provides certain administrative services to the Fund. For such services, the Administrator pays JPMIS a portion of the fee the Administrator receives from the Fund. An employee of JPMIS is an officer of the Fund. Administration costs (including out-of-pocket expenses) incurred in the ordinary course of providing services under the administration agreement, except pricing services and extraordinary expenses, are covered under the administration fee. In addition, the Fund incurs local administration fees in connection with doing business in certain emerging market countries.
D. Distribution Fees: Morgan Stanley Distribution, Inc. (“MSDI” or the “Distributor”), a wholly-owned subsidiary of the Adviser, serves as the Distributor of the Fund and provides Class B shareholders of the applicable Portfolios with distribution services pursuant to a Distribution Plan (the “Plan”) in accordance with Rule 12b-1 under the 1940 Act. The distribution fee is an asset-based fee to compensate the Distributor for distribution efforts and/or servicing of accounts. Under the Plan, each Portfolio is authorized to pay the Distributor a distribution fee, which is accrued daily and paid monthly, at an annual rate of 0.25% of the Class B shares’ average daily net assets.
E. Custodian Fees: JPMorgan Chase Bank, N.A. (the “Custodian”) serves as Custodian for the Fund in accordance with a custodian agreement. The Custodian holds cash, securities, and other assets of the Fund as required by the 1940 Act.
The Fund has entered into an arrangement with its Custodian whereby credits realized on uninvested cash balances were used to offset a portion of each applicable Portfolio’s expenses. These custodian credits are shown as “Expense Offset” on the Statements of Operations.
F. Purchases and Sales: During the year ended December 31, 2006, purchases and sales of investment securities, other than long-term U.S. Government securities and short-term investments, were:
|
| Purchases |
| Sales |
| ||
Portfolio |
| (000) |
| (000) |
| ||
Active International Allocation |
| $ | 132,714 |
| $ | 131,837 |
|
Emerging Markets |
| 1,693,936 |
| 1,802,298 |
| ||
Global Franchise |
| 57,882 |
| 41,407 |
| ||
Global Real Estate |
| 210,368 |
| 6,094 |
| ||
Global Value Equity |
| 33,750 |
| 33,019 |
| ||
International Equity |
| 2,738,113 |
| 4,939,583 |
| ||
International Growth Equity |
| 2,156 |
| 1,426 |
| ||
International Magnum |
| 87,437 |
| 89,630 |
| ||
International Real Estate |
| 827,961 |
| 215,437 |
| ||
International Small Cap |
| 551,363 |
| 820,425 |
| ||
Focus Equity |
| 43,065 |
| 92,114 |
| ||
Large Cap Relative Value |
| 75,672 |
| 102,208 |
| ||
Small Company Growth |
| 1,427,171 |
| 1,407,103 |
| ||
Systematic Active Large Cap Core |
| 8,850 |
| 3,162 |
| ||
Systematic Active Small Cap Core |
| 10,222 |
| 3,654 |
| ||
Systematic Active Small Cap Growth |
| 11,440 |
| 4,558 |
| ||
Systematic Active Small Cap Value |
| 11,509 |
| 4,827 |
| ||
U.S. Large Cap Growth |
| 692,201 |
| 569,422 |
| ||
U.S. Real Estate |
| 587,681 |
| 571,150 |
| ||
Emerging Markets Debt |
| 45,520 |
| 59,162 |
| ||
177
2006 Annual Report |
|
|
|
December 31, 2006 |
|
Notes to Financial Statements (cont’d)
There were no purchases and sales of long-term U.S. Government securities for the year ended December 31, 2006.
During the year ended December 31, 2006, the following Portfolios paid brokerage commissions to Morgan Stanley & Co., an affiliated broker/dealer:
|
| Brokerage |
| |
|
| Commissions |
| |
Portfolio |
| (000) |
| |
Emerging Markets |
| $ | 30 |
|
Focus Equity |
| 2 |
| |
Small Company Growth |
| 3 |
| |
U.S. Large Cap Growth |
| 5 |
| |
Additionally, during the year ended December 31, 2006, Emerging Markets Portfolio paid $5,239 brokerage commissions to China International Capital Corporation (Hong Kong) Limited (CICC), an affiliated broker/dealer.
G. Federal Income Taxes: It is each Portfolio’s intention to qualify as a regulated investment company and distribute all of its taxable and tax-exempt income. Accordingly, no provision for Federal income taxes is required in the financial statements.
A Portfolio may be subject to taxes imposed by countries in which it invests. Such taxes are generally based on income and/or capital gains earned or repatriated. Taxes are accrued based on net investment income, net realized gains and net unrealized appreciation as income and/or capital gains are earned. Taxes may also be based on the movement of foreign currency and are accrued based on the value of investments denominated in such currency.
The tax character of distributions paid may differ from the character of distributions shown on the Statements of Changes in Net Assets due to short-term capital gains being treated as ordinary income for tax purposes. The tax character of distributions paid during 2006 and 2005 were as follows:
|
| 2006 Distributions |
| 2005 Distributions |
| ||||||||
|
| Paid From: |
| Paid From: |
| ||||||||
|
| Ordinary |
| Long-term |
| Ordinary |
| Long-term |
| ||||
|
| Income |
| Capital Gain |
| Income |
| Capital Gain |
| ||||
Portfolio |
| (000) |
| (000) |
| (000) |
| (000) |
| ||||
Active International Allocation |
| $ | 22,425 |
| $ | — |
| $ | 8,215 |
| $ | — |
|
Emerging Markets |
| 18,163 |
| 365,634 |
| 25,099 |
| — |
| ||||
Global Franchise |
| 1,579 |
| 6,022 |
| 1,929 |
| 4,585 |
| ||||
Global Real Estate |
| 2,647 |
| 84 |
| — |
| — |
| ||||
Global Value Equity |
| 2,202 |
| 6,107 |
| 2,100 |
| 3,639 |
| ||||
International Equity* |
| 217,756 |
| 1,050,872 |
| 179,447 |
| 537,969 |
| ||||
International Growth Equity |
| 84 |
| — |
| — |
| — |
| ||||
International Magnum |
| 2,676 |
| 13,917 |
| 1,286 |
| — |
| ||||
International Real Estate |
| 43,788 |
| 17,429 |
| 7,106 |
| 10,170 |
| ||||
International Small Cap |
| 36,378 |
| 213,836 |
| 37,511 |
| 176,515 |
| ||||
Focus Equity |
| — |
| — |
| 98 |
| — |
| ||||
Large Cap Relative Value |
| 3,869 |
| 11,341 |
| 2,275 |
| 5,946 |
| ||||
Small Company Growth |
| — |
| 148,745 |
| 50,209 |
| 114,786 |
| ||||
Systematic Active Large Cap Core |
| 50 |
| — |
| — |
| — |
| ||||
Systematic Active Small Cap Core |
| 19 |
| — |
| — |
| — |
| ||||
Systematic Active Small Cap Value |
| 40 |
| — |
| — |
| — |
| ||||
U.S. Large Cap Growth |
| 184 |
| — |
| 1,618 |
| — |
| ||||
U.S. Real Estate |
| 47,476 |
| 198,314 |
| 30,891 |
| 168,250 |
| ||||
Emerging Markets Debt |
| 5,968 |
| — |
| 5,446 |
| — |
| ||||
*Amounts based on October 31 tax year end.
The amount and character of income and gains to be distributed are determined in accordance with income tax regulations which may differ from U.S. generally accepted accounting principles. These book/tax differences are either considered temporary or permanent in nature.
Temporary differences are generally due to differing book and tax treatments for the timing of the recognition of gains and losses on certain investment transactions and the timing and the deductibility of certain expenses.
Permanent differences, primarily due to REIT adjustments, gain (loss) on in-kind redemptions, foreign currency transactions, defaulted bonds, paydown adjustments, return of capital from certain securities, expiring capital losses, distribution reclass, foreign taxes paid on capital gains, reclasses resulting from net operating losses, nondeductible expenses and gains on certain equity securities designated as issued by “passive foreign investment companies,” resulted in the following reclassifications among the Portfolios’ components of net assets at December 31, 2006:
|
| Accumulated |
|
|
|
|
| |||
|
| Undistributed |
|
|
|
|
| |||
|
| (Distributions in |
|
|
|
|
| |||
|
| Excess of) Net |
| Accumulated |
|
|
| |||
|
| Investment |
| Net Realized |
| Paid-in |
| |||
|
| Income (Loss) |
| Gain (Loss) |
| Capital |
| |||
Portfolio |
| (000) |
| (000) |
| (000) |
| |||
Active International Allocation |
| $ | 7,087 |
| $ | (7,087 | ) | $ | — |
|
Emerging Markets |
| 3,683 |
| (3,683 | ) | — |
| |||
Global Franchise |
| (1,085 | ) | 1,085 |
| — |
| |||
Global Real Estate |
| 111 |
| (107 | ) | (4 | ) | |||
Global Value Equity |
| 63 |
| (80 | ) | 17 |
| |||
International Equity |
| (44,502 | ) | 44,502 |
| — |
| |||
International Growth Equity |
| (7 | ) | 7 |
| — |
| |||
International Magnum |
| 1,286 |
| (1,286 | ) | — |
| |||
International Real Estate |
| 5,504 |
| (5,504 | ) | — |
| |||
International Small Cap |
| 4,310 |
| (4,310 | ) | — |
| |||
Focus Equity |
| 157 |
| 1 |
| (158 | ) | |||
Large Cap Relative Value |
| 54 |
| (53,083 | ) | 53,029 |
| |||
Small Company Growth |
| 12,947 |
| (10,125 | ) | (2,822 | ) | |||
Systematic Active Large Cap Core |
| 2 |
| — |
| (2 | ) | |||
Systematic Active Small Cap Core |
| 2 |
| — |
| (2 | ) | |||
Systematic Active Small Cap Growth |
| 6 |
| — |
| (6 | ) | |||
Systematic Active Small Cap Value |
| 2 |
| — |
| (2 | ) | |||
U.S. Large Cap Growth |
| 25 |
| 2 |
| (27 | ) | |||
U.S. Real Estate |
| 883 |
| (26,988 | ) | 26,105 |
| |||
Emerging Markets Debt |
| 298 |
| 71,363 |
| (71,661 | ) | |||
178
| 2006 Annual Report |
|
|
| December 31, 2006 |
Notes to Financial Statements (cont’d)
At December 31, 2006, the components of distributable earnings on a tax basis were as follows:
|
|
|
| Undistributed |
| ||
|
| Undistributed |
| Long-term |
| ||
|
| Ordinary Income |
| Capital Gain |
| ||
Portfolio |
| (000) |
| (000) |
| ||
Active International Allocation |
| $ | 4,144 |
| $ | — |
|
Emerging Markets |
| 2,639 |
| 57,263 |
| ||
Global Franchise |
| 66 |
| 2,942 |
| ||
Global Real Estate |
| 4,466 |
| 261 |
| ||
Global Value Equity |
| — |
| 791 |
| ||
International Growth Equity |
| 50 |
| — |
| ||
International Magnum |
| 166 |
| 735 |
| ||
International Real Estate |
| 34,784 |
| 3,740 |
| ||
International Small Cap |
| 1,634 |
| 26,344 |
| ||
Large Cap Relative Value |
| — |
| 4,734 |
| ||
Small Company Growth |
| — |
| 18,028 |
| ||
Systematic Active Large Cap Core |
| 1 |
| — |
| ||
Systematic Active Small Cap Core |
| 1 |
| — |
| ||
Systematic Active Small Cap Value |
| 1 |
| — |
| ||
U.S. Real Estate |
| 1,537 |
| 38,814 |
| ||
Emerging Markets Debt |
| 162 |
| — |
| ||
Any Portfolios not shown above had no distributable earnings on a tax basis at December 31, 2006.
At December 31, 2006, cost, unrealized appreciation, unrealized depreciation, and net unrealized appreciation (depreciation) for U.S. Federal income tax purposes of the investments of each of the Portfolios were:
|
|
|
|
|
|
|
| Net |
| ||||
|
|
|
|
|
|
|
| Appreciation |
| ||||
|
| Cost |
| Appreciation |
| Depreciation |
| (Depreciation) |
| ||||
Portfolio |
| (000) |
| (000) |
| (000) |
| (000) |
| ||||
Active International Allocation |
| $ | 850,062 |
| $ | 251,880 |
| $ | (11,420 | ) | $ | 240,460 |
|
Emerging Markets |
| 1,857,268 |
| 766,410 |
| (29,897 | ) | 736,513 |
| ||||
Global Franchise |
| 98,786 |
| 35,963 |
| (1,538 | ) | 34,425 |
| ||||
Global Real Estate |
| 224,444 |
| 21,092 |
| (360 | ) | 20,732 |
| ||||
Global Value Equity |
| 108,143 |
| 29,779 |
| (823 | ) | 28,956 |
| ||||
International Equity |
| 6,057,327 |
| 1,664,575 |
| (92,329 | ) | 1,572,246 |
| ||||
International Growth Equity |
| 5,732 |
| 1,416 |
| (76 | ) | 1,340 |
| ||||
International Magnum |
| 105,662 |
| 24,701 |
| (2,698 | ) | 22,003 |
| ||||
International Real Estate |
| 996,136 |
| 227,023 |
| (975 | ) | 226,048 |
| ||||
International Small Cap |
| 993,955 |
| 357,981 |
| (57,035 | ) | 300,946 |
| ||||
Focus Equity |
| 13,611 |
| 2,422 |
| (1,135 | ) | 1,287 |
| ||||
Large Cap Relative Value |
| 234,487 |
| 42,967 |
| (2,126 | ) | 40,841 |
| ||||
Small Company Growth |
| 1,631,409 |
| 322,672 |
| (62,368 | ) | 260,304 |
| ||||
Systematic Active Large Cap Core |
| 6,401 |
| 565 |
| (117 | ) | 448 |
| ||||
Systematic Active Small Cap Core |
| 8,762 |
| 514 |
| (393 | ) | 121 |
| ||||
Systematic Active Small Cap Growth |
| 9,715 |
| 481 |
| (448 | ) | 33 |
| ||||
Systematic Active Small Cap Value |
| 9,137 |
| 514 |
| (264 | ) | 250 |
| ||||
U.S. Large Cap Growth |
| 920,731 |
| 181,400 |
| (30,698 | ) | 150,702 |
| ||||
U.S. Real Estate |
| 1,177,047 |
| 735,779 |
| (6,833 | ) | 728,946 |
| ||||
Emerging Markets Debt |
| 89,368 |
| 5,951 |
| (1,438 | ) | 4,513 |
| ||||
At December 31, 2006, the following Portfolios had available capital loss carryforwards to offset future net capital gains, to the extent provided by regulations, through the indicated expiration dates:
Expiration Date December 31, (000) |
| |||||||||||||||||||||
Portfolio |
| 2007 |
| 2009 |
| 2010 |
| 2011 |
| 2012 |
| 2014 |
| Total |
| |||||||
Active International Allocation |
| $ | — |
| $ | — |
| $ | — |
| $ | 14,711 |
| $ | — |
| $ | — |
| $ | 14,711 |
|
Focus Equity |
| — |
| — |
| 17,264 |
| — |
| 296 |
| — |
| 17,560 |
| |||||||
Large Cap Relative Value* |
| — |
| 18,929 |
| 32,106 |
| — |
| — |
| — |
| 51,035 |
| |||||||
Small Company Growth* |
| — |
| 993 |
| 18,090 |
| — |
| — |
| — |
| 19,083 |
| |||||||
Systematic Active Large Cap Core |
| — |
| — |
| — |
| — |
| — |
| 33 |
| 33 |
| |||||||
Systematic Active Small Cap Core |
| — |
| — |
| — |
| — |
| — |
| 165 |
| 165 |
| |||||||
Systematic Active Small Cap Growth |
| — |
| — |
| — |
| — |
| — |
| 184 |
| 184 |
| |||||||
Systematic Active Small Cap Value |
| — |
| — |
| — |
| — |
| — |
| 5 |
| 5 |
| |||||||
U.S. Large Cap Growth |
| — |
| — |
| 44,469 |
| 22,405 |
| — |
| — |
| 66,874 |
| |||||||
Emerging Markets Debt |
| 9,761 |
| 778 |
| — |
| — |
| — |
| — |
| 10,539 |
| |||||||
*Capital loss carryover from target fund.
The amounts reflected in the capital loss carryforward table for Large Cap Relative Value Portfolio represent capital loss carryforward brought forward as a result of the Portfolio’s merger with the MSIFT Equity Portfolio. Based on certain provisions in the Internal Revenue Code, various limitations regarding the future utilization of these carryforwards may apply. This acquired capital loss carryforward is expected to expire between 2009-2010.
In addition, the amounts reflected in the capital loss carryforward table above for the Small Company Growth Portfolio represent capital loss carryforward acquired from MSIFT Small Cap Growth Portfolio after limitations pursuant to Internal Revenue Code, Section 383.
179
2006 Annual Report |
|
December 31, 2006 |
Notes to Financial Statements (cont’d)
During the year ended December 31, 2006, the following Portfolios utilized capital loss carryforwards for U.S. Federal income tax purposes of approximately:
|
| Capital Loss |
| |
|
| Carryforward |
| |
|
| Utilized |
| |
Portfolio |
| (000) |
| |
Active International Allocation |
| $ | 39,331 |
|
International Magnum |
| 3,356 |
| |
Focus Equity |
| 11,145 |
| |
Large Cap Relative Value |
| 1,929 |
| |
Small Company Growth |
| 5,434 |
| |
U.S. Large Cap Growth |
| 6,919 |
| |
Emerging Markets Debt |
| 1,669 |
| |
The Large Cap Relative Value Portfolio utilized $1,929,000 of the capital losses acquired from MSIFT Equity Portfolio for federal tax purposes during the year ended December 31, 2006.
The Small Company Growth Portfolio utilized $5,434,000 of the capital losses acquired from MSIFT Small Cap Growth Portfolio for federal tax purposes during the year ended December 31, 2006.
During the year ended December 31, 2006, the Emerging Market Debt Portfolio had expired capital loss carryforwards for U.S. Federal income tax purposes of approximately $71,692,000.
To the extent that capital loss carryovers are used to offset any future capital gains realized during the carryover period as provided by U.S. Federal income tax regulations, no capital gains tax liability will be incurred by a Portfolio for gains realized and not distributed. To the extent that capital gains are offset, such gains will not be distributed to the shareholders.
Net capital, passive investment company (PFIC), and currency losses incurred after October 31, and within the taxable year are deemed to arise on the first day of the Portfolio’s next taxable year. For the year ended December 31, 2006, the Portfolio deferred to January 3, 2007 for U.S. Federal income tax purposes, post-October capital, PFIC and currency losses as indicated:
|
| Capital |
| Currency |
| PFIC |
| |||
|
| Losses |
| Losses |
| Losses |
| |||
Portfolio |
| (000) |
| (000) |
| (000) |
| |||
Emerging Markets |
| $ | — |
| $ | 4,393 |
| $ | — |
|
Global Franchise |
| — |
| 468 |
| — |
| |||
International Growth Equity |
| — |
| @— |
| — |
| |||
International Small Cap |
| — |
| 5 |
| — |
| |||
U.S. Large Cap Growth |
| 2,950 |
| — |
| — |
| |||
U.S. Real Estate |
| — |
| 10 |
| 72 |
| |||
Emerging Markets Debt |
| 24 |
| 29 |
| — |
| |||
@ Amount is less than $500.
For the year ended December 31, 2006, the U.S. Real Estate Portfolio realized gains from in-kind redemptions of $28,006,000. The gains are not taxable income to the U.S. Real Estate Portfolio.
H. Contractual Obligations: The Fund enters into contracts that contain a variety of indemnifications. The Fund’s maximum exposure under these arrangements is unknown. However, the Fund has not had prior claims or losses pursuant to these contracts and expects the risk of loss to be remote.
I. Other: The net assets of certain Portfolios include foreign denominated securities and currency. Changes in currency exchange rates will affect the U.S. dollar value of and investment income from such securities. Further, at times certain of the Portfolios’ investments are concentrated in a limited number of countries and regions. This concentration may further increase the risk of the Portfolio.
The Emerging Markets Debt Portfolio holds a significant portion of its investments in securities which are traded by a small number of market makers who may also be utilized by the Portfolio to provide pricing information used to value such investments. The amounts realized upon disposition of these securities may differ from the value reflected on the Statements of Assets and Liabilities.
Settlement and registration of foreign securities transactions may be subject to significant risks not normally associated with investments in the United States. In certain markets, including Russia, ownership of shares is defined according to entries in the issuer’s share register. In Russia, currently no central registration system exists and the share registrars may not be subject to effective state supervision. It is possible that a Portfolio could lose its share registration through fraud, negligence or even mere oversight. In addition, shares being delivered for sales and cash being paid for purchases may be delivered before the exchange is complete. This may subject the Portfolio to further risk of loss in the event of a counterparty’s failure to complete the transaction.
At December 31, 2006, certain Portfolios had otherwise unaffiliated record owners of 10% or greater. Investment activities of these shareholders could have a material impact on these Portfolios.
180
| 2006 Annual Report |
|
|
| December 31, 2006 |
Notes to Financial Statements (cont’d)
These Portfolios and the aggregate percentage of such owners were as follows:
|
| Percentage of Ownership |
| ||
Portfolio |
| Class A |
| Class B |
|
Active International Allocation |
| — | % | 62.4 | % |
Emerging Markets |
| 23.4 |
| 93.6 |
|
Global Franchise |
| 61.5 |
| — |
|
Global Real Estate |
| 75.4 |
| — |
|
Global Value Equity |
| 77.0 |
| 95.2 |
|
International Equity |
| — |
| 76.0 |
|
International Growth Equity |
| — |
| 27.0 |
|
International Magnum |
| 19.6 |
| 86.8 |
|
International Real Estate |
| 33.8 |
| 95.8 |
|
International Small Cap |
| 30.8 |
| — |
|
Focus Equity |
| — |
| 17.6 |
|
Large Cap Relative Value |
| 55.1 |
| 98.3 |
|
Small Company Growth |
| 26.1 |
| 59.5 |
|
Systematic Active Large Cap Core |
| — |
| — |
|
Systematic Active Small Cap Core |
| — |
| — |
|
Systematic Active Small Cap Growth |
| — |
| — |
|
Systematic Active Small Cap Value |
| — |
| — |
|
U.S. Large Cap Growth |
| 17.9 |
| 86.1 |
|
U.S. Real Estate |
| 27.3 |
| 78.2 |
|
Emerging Markets Debt |
| 93.5 |
| 52.5 |
|
The Adviser reimbursed the International Real Estate Portfolio $682,811 for a trade correction. This amount is included in the realized gain and currency gain transactions on the Portfolio’s Statement of Operations and in the paid in capital on the Portfolio’s Statement of Changes.
J. Reverse Stock Split: After the close of business on March 17, 2006, Emerging Markets Debt Portfolio effected a 1 for 3 reverse stock split for Class A and Class B shares of the Portfolio. All transactions in capital stock and per share data prior to March 18, 2006 have been restated to give effect to the reverse stock split. The reverse stock split had no impact on the overall value of a shareholder’s investment in the Portfolio.
K. Supplemental Proxy Information (unaudited): On August 1, 2006, a Special Meeting of Shareholders of the Fund was scheduled in order to vote on the proposals set forth below. In the case of certain proposals listed below the quorum necessary in order to hold the meeting was not obtained, and, therefore, the meeting was adjourned several times, to permit further solicitation of proxies. The final meeting was held on October 30, 2006.
(1) Election of Directors:
|
| For |
| Withhold |
| Abstain |
| BNV** |
|
Frank L. Bowman |
| 764,912,392 |
| 14,765,200 |
| 0 |
| 0 |
|
Kathleen A. Dennis |
| 764,857,704 |
| 14,819,888 |
| 0 |
| 0 |
|
Michael F. Klein |
| 765,337,596 |
| 14,339,996 |
| 0 |
| 0 |
|
W. Allen Reed |
| 764,886,773 |
| 14,790,819 |
| 0 |
| 0 |
|
(2) Modify fundamental policy regarding diversification:
Portfolio |
| For |
| Against |
| Abstain |
| BNV** |
|
Active International Allocation(2) |
| 34,307,769 |
| 478,369 |
| 1,335,433 |
| 26,084,794 |
|
Emerging Markets(1) |
| 31,323,596 |
| 202,926 |
| 367,842 |
| 8,585,760 |
|
Global Franchise* |
| NA |
| NA |
| NA |
| NA |
|
Global Value Equity* |
| NA |
| NA |
| NA |
| NA |
|
International Equity(2) |
| 149,588,321 |
| 2,010,171 |
| 9,860,282 |
| 39,944,959 |
|
International Growth Equity(1) |
| 500,000 |
| 0 |
| 0 |
| 0 |
|
International Magnum(2) |
| 3,994,095 |
| 62,903 |
| 124,478 |
| 19,550 |
|
International Small Cap(2) |
| 29,628,897 |
| 4,128,187 |
| 750,424 |
| 2,690,270 |
|
Large Cap Relative Growth* |
| NA |
| NA |
| NA |
| NA |
|
Small Company Growth* |
| NA |
| NA |
| NA |
| NA |
|
Systematic Active Large Cap Core(1) |
| 600,000 |
| 0 |
| 0 |
| 0 |
|
Systematic Active Small Cap Core(1) |
| 660,000 |
| 0 |
| 0 |
| 0 |
|
Systematic Active Small Cap Growth(1) |
| 690,000 |
| 0 |
| 0 |
| 0 |
|
Systematic Active Small Cap Value(1) |
| 670,000 |
| 0 |
| 0 |
| 0 |
|
U.S. Large Cap Growth(2) |
| 26,258,393 |
| 425,138 |
| 854,892 |
| 2,361,447 |
|
(3) Modify fundamental policy regarding borrowing money:
Portfolio |
| For |
| Against |
| Abstain |
| BNV** |
|
Active International Allocation(2) |
| 34,025,982 |
| 693,043 |
| 1,402,546 |
| 26,084,794 |
|
Emerging Markets(1) |
| 30,671,405 |
| 823,865 |
| 399,094 |
| 8,585,760 |
|
Emerging Markets Debt(1) |
| 3,969,381 |
| 0 |
| 21,006 |
| 333,503 |
|
Focus Equity(2) |
| 3,503,952 |
| 14,318 |
| 8,388 |
| 455,021 |
|
Global Franchise* |
| NA |
| NA |
| NA |
| NA |
|
Global Value Equity* |
| NA |
| NA |
| NA |
| NA |
|
International Equity(2) |
| 139,869,735 |
| 8,272,404 |
| 13,316,635 |
| 39,944,959 |
|
International Growth Equity(1) |
| 500,000 |
| 0 |
| 0 |
| 0 |
|
International Magnum(2) |
| 3,963,389 |
| 89,705 |
| 128,382 |
| 19,550 |
|
International Real Estate* |
| NA |
| NA |
| NA |
| NA |
|
International Small Cap(2) |
| 29,289,074 |
| 4,415,630 |
| 802,804 |
| 2,690,270 |
|
Large Cap Relative Growth* |
| NA |
| NA |
| NA |
| NA |
|
Small Company Growth* |
| NA |
| NA |
| NA |
| NA |
|
Systematic Active Large Cap Core(1) |
| 600,000 |
| 0 |
| 0 |
| 0 |
|
Systematic Active Small Cap Core(1) |
| 660,000 |
| 0 |
| 0 |
| 0 |
|
Systematic Active Small Cap Growth(1) |
| 690,000 |
| 0 |
| 0 |
| 0 |
|
Systematic Active Small Cap Value(1) |
| 670,000 |
| 0 |
| 0 |
| 0 |
|
U.S. Large Cap Growth(2) |
| 25,763,155 |
| 893,890 |
| 881,378 |
| 2,361,447 |
|
U.S. Real Estate(2) |
| 27,463,477 |
| 2,396,208 |
| 928,184 |
| 9,943,493 |
|
181
2006 Annual Report |
|
|
|
December 31, 2006 |
|
Notes to Financial Statements (cont’d)
(4) Modify fundamental policy regarding loans:
Portfolio |
| For |
| Against |
| Abstain |
| BNV** |
|
Active International Allocation(2) |
| 34,072,849 |
| 639,496 |
| 1,409,226 |
| 26,084,794 |
|
Emerging Markets(1) |
| 31,159,110 |
| 339,545 |
| 395,709 |
| 8,585,760 |
|
Emerging Markets Debt(1) |
| 3,969,981 |
| 0 |
| 21,006 |
| 333,503 |
|
Focus Equity(2) |
| 3,503,952 |
| 14,318 |
| 8,388 |
| 455,021 |
|
Global Franchise* |
| NA |
| NA |
| NA |
| NA |
|
Global Value Equity* |
| NA |
| NA |
| NA |
| NA |
|
International Equity(2) |
| 145,848,357 |
| 3,655,514 |
| 11,954,903 |
| 39,944,959 |
|
International Growth Equity(1) |
| 500,000 |
| 0 |
| 0 |
| 0 |
|
International Magnum(2) |
| 3,969,814 |
| 84,821 |
| 126,841 |
| 19,550 |
|
International Real Estate* |
| NA |
| NA |
| NA |
| NA |
|
International Small Cap(2) |
| 33,244,232 |
| 458,797 |
| 804,479 |
| 2,690,270 |
|
Large Cap Relative Growth* |
| NA |
| NA |
| NA |
| NA |
|
Small Company Growth* |
| NA |
| NA |
| NA |
| NA |
|
Systematic Active Large Cap Core(1) |
| 600,000 |
| 0 |
| 0 |
| 0 |
|
Systematic Active Small Cap Core(1) |
| 660,000 |
| 0 |
| 0 |
| 0 |
|
Systematic Active Small Cap Growth(1) |
| 690,000 |
| 0 |
| 0 |
| 0 |
|
Systematic Active Small Cap Value(1) |
| 670,000 |
| 0 |
| 0 |
| 0 |
|
U.S. Large Cap Growth(2) |
| 26,051,766 |
| 594,502 |
| 892,155 |
| 2,361,447 |
|
U.S. Real Estate(2) |
| 27,441,821 |
| 2,409,999 |
| 936,049 |
| 9,943,493 |
|
(5) Modify fundamental policy regarding investment in commodities, commodity contracts and futures contracts:
Portfolio |
| For |
| Against |
| Abstain |
| BNV** |
|
Active International Allocation(2) |
| 34,137,806 |
| 576,457 |
| 1,407,308 |
| 26,084,794 |
|
Emerging Markets(1) |
| 30,708,834 |
| 782,202 |
| 403,328 |
| 8,585,760 |
|
Emerging Markets Debt(1) |
| 3,969,381 |
| 0 |
| 21,006 |
| 333,503 |
|
Focus Equity(2) |
| 3,503,952 |
| 14,318 |
| 8,388 |
| 455,021 |
|
Global Franchise* |
| NA |
| NA |
| NA |
| NA |
|
Global Value Equity* |
| NA |
| NA |
| NA |
| NA |
|
International Equity(2) |
| 140,693,775 |
| 8,083,022 |
| 12,681,977 |
| 39,944,959 |
|
International Growth Equity(1) |
| 500,000 |
| 0 |
| 0 |
| 0 |
|
International Magnum(2) |
| 3,980,662 |
| 75,882 |
| 124,932 |
| 19,550 |
|
International Real Estate* |
| NA |
| NA |
| NA |
| NA |
|
International Small Cap(2) |
| 29,049,722 |
| 4,654,238 |
| 803,548 |
| 2,690,270 |
|
Large Cap Relative Growth* |
| NA |
| NA |
| NA |
| NA |
|
Small Company Growth* |
| NA |
| NA |
| NA |
| NA |
|
Systematic Active Large Cap Core(1) |
| 600,000 |
| 0 |
| 0 |
| 0 |
|
Systematic Active Small Cap Core(1) |
| 660,000 |
| 0 |
| 0 |
| 0 |
|
Systematic Active Small Cap Growth(1) |
| 690,000 |
| 0 |
| 0 |
| 0 |
|
Systematic Active Small Cap Value(1) |
| 670,000 |
| 0 |
| 0 |
| 0 |
|
U.S. Large Cap Growth(2) |
| 25,875,452 |
| 793,157 |
| 869,814 |
| 2,361,447 |
|
U.S. Real Estate(2) |
| 27,482,626 |
| 2,337,029 |
| 968,213 |
| 9,943,493 |
|
(6) Modify fundamental policy regarding issuance of senior securities:
Portfolio |
| For |
| Against |
| Abstain |
| BNV** |
|
Active International Allocation(2) |
| 34,211,284 |
| 553,712 |
| 1,356,575 |
| 26,084,794 |
|
Emerging Markets(1) |
| 31,210,999 |
| 286,947 |
| 396,418 |
| 8,585,760 |
|
Emerging Markets Debt(1) |
| 3,969,381 |
| 0 |
| 21,006 |
| 333,503 |
|
Focus Equity(2) |
| 3,503,952 |
| 14,318 |
| 8,388 |
| 455,021 |
|
Global Franchise* |
| NA |
| NA |
| NA |
| NA |
|
Global Value Equity* |
| NA |
| NA |
| NA |
| NA |
|
International Equity(2) |
| 146,064,746 |
| 2,313,391 |
| 13,080,637 |
| 39,944,959 |
|
International Growth Equity(1) |
| 500,000 |
| 0 |
| 0 |
| 0 |
|
International Magnum(2) |
| 3,985,494 |
| 73,319 |
| 122,663 |
| 19,550 |
|
International Real Estate* |
| NA |
| NA |
| NA |
| NA |
|
International Small Cap(2) |
| 31,344,787 |
| 2,365,000 |
| 797,721 |
| 2,690,270 |
|
Large Cap Relative Growth* |
| NA |
| NA |
| NA |
| NA |
|
Small Company Growth* |
| NA |
| NA |
| NA |
| NA |
|
Systematic Active Large Cap Core(1) |
| 600,000 |
| 0 |
| 0 |
| 0 |
|
Systematic Active Small Cap Core(1) |
| 660,000 |
| 0 |
| 0 |
| 0 |
|
Systematic Active Small Cap Growth(1) |
| 690,000 |
| 0 |
| 0 |
| 0 |
|
Systematic Active Small Cap Value(1) |
| 670,000 |
| 0 |
| 0 |
| 0 |
|
U.S. Large Cap Growth(2) |
| 26,184,493 |
| 510,575 |
| 843,355 |
| 2,361,447 |
|
U.S. Real Estate(2) |
| 27,522,023 |
| 2,320,487 |
| 945,358 |
| 9,943,493 |
|
(1) Meeting was held on August 23, 2006
(2) Meeting was held on September 27, 2006.
* Quorum not achieved for this proposal
** Broker “non-votes” are shares held in street name for which the broker indicates that instructions have not been received from the beneficial owners or other persons entitled to vote and for which the broker does not have discretionary voting authority.
182
| 2006 Annual Report |
|
|
| December 31, 2006 |
Report of Independent Registered Public Accounting Firm
To the Shareholders and Board of Directors of Morgan Stanley Institutional Fund, Inc.
We have audited the accompanying statements of assets and liabilities, including the portfolios of investments, of the Morgan Stanley Institutional Fund, Inc. (the “Fund”) (comprising, respectively, the Active International Allocation Portfolio, Emerging Markets Portfolio, Global Franchise Portfolio, Global Real Estate Portfolio, Global Value Equity Portfolio, International Equity Portfolio, International Growth Equity Portfolio, International Magnum Portfolio, International Real Estate Portfolio, International Small Cap Portfolio, Focus Equity Portfolio, Large Cap Relative Value Portfolio, Small Company Growth Portfolio, Systematic Active Large Cap Core Portfolio, Systematic Active Small Cap Core Portfolio, Systematic Active Small Cap Growth Portfolio, Systematic Active Small Cap Value Portfolio, U.S. Large Cap Growth Portfolio, U.S. Real Estate Portfolio and Emerging Markets Debt Portfolio), as of December 31, 2006, and the related statements of operations, the statements of changes in net assets, and the financial highlights for each of the periods indicated therein. These financial statements and financial highlights are the responsibility of the Fund’s management. Our responsibility is to express an opinion on these financial statements and financial highlights based on our audits.
We conducted our audits in accordance with the standards of the Public Company Accounting Oversight Board (United States). Those standards require that we plan and perform the audit to obtain reasonable assurance about whether the financial statements and financial highlights are free of material misstatement. We were not engaged to perform an audit of the Fund’s internal control over financial reporting. Our audits included consideration of internal control over financial reporting as a basis for designing audit procedures that are appropriate in the circumstances, but not for the purpose of expressing an opinion on the effectiveness of the Fund’s internal control over financial reporting. Accordingly, we express no such opinion. An audit also includes examining, on a test basis, evidence supporting the amounts and disclosures in the financial statements and financial highlights, assessing the accounting principles used and significant estimates made by management, and evaluating the overall financial statement presentation. Our procedures included confirmation of securities owned as of December 31, 2006, by correspondence with the custodian and brokers, or by other appropriate auditing procedures where replies from brokers were not received. We believe that our audits provide a reasonable basis for our opinion.
In our opinion, the financial statements and financial highlights referred to above present fairly, in all material respects, the financial position of each of the aforementioned portfolios constituting the Morgan Stanley Institutional Fund, Inc. at December 31, 2006, the results of their operations, the changes in their net assets, and the financial highlights for each of the periods indicated therein, in conformity with U.S. generally accepted accounting principles.

Boston, Massachusetts
February 20, 2007
183
2006 Annual Report |
|
|
|
December 31, 2006 |
|
Federal Income Tax Information (unaudited)
For the year ended December 31, 2006, the percentage of dividends paid that qualify for the 70% dividend received deduction for corporate shareholders for the Global Franchise, Global Value Equity, International Growth Equity, Large Cap Relative Value, Systematic Active Large Cap Core, Systematic Active Small Cap Core, Systematic Active Small Cap Value, U.S. Large Cap Growth and U.S. Real Estate Portfolios are 57.9%, 47.7%, 0.25%, 98.7%, 100.0%, 100.0%, 97.5%, 100.0% and 5.2%, respectively.
For the year ended December 31, 2006, the following Portfolios intend to pass through foreign tax credits and have derived gross income from sources within foreign countries amounting to:
|
| Foreign |
| Foreign |
| ||
|
| Tax Credit |
| Source |
| ||
|
| Pass-Through |
| Income |
| ||
Portfolio |
| (000) |
| (000) |
| ||
Active International Allocation |
| $ | 75 |
| $ | 21,841 |
|
Emerging Markets |
| 1,469 |
| 42,357 |
| ||
Global Franchise |
| 102 |
| 2,361 |
| ||
Global Real Estate |
| 11 |
| 690 |
| ||
Global Value Equity |
| 72 |
| 1,963 |
| ||
International Equity* |
| 1,967 |
| 302,402 |
| ||
International Growth Equity |
| 9 |
| 127 |
| ||
International Magnum |
| 28 |
| 2,565 |
| ||
International Real Estate |
| 420 |
| 13,084 |
| ||
International Small Cap |
| 2,348 |
| 35,471 |
| ||
*Amounts based on October 31 tax year end.
Each applicable Portfolio hereby designates the following amount as long-term capital gain dividends for the purpose of the dividend paid deduction on its federal tax return:
|
| Long-term |
| |
|
| Capital Gain - 20% |
| |
Portfolio |
| (000) |
| |
Emerging Markets |
| $ | 365,634 |
|
Global Franchise |
| 6,022 |
| |
Global Real Estate |
| 84 |
| |
Global Value Equity |
| 6,107 |
| |
International Equity |
| 1,050,872 |
| |
International Magnum |
| 13,917 |
| |
International Real Estate |
| 17,429 |
| |
International Small Cap |
| 213,836 |
| |
Large Cap Relative Value |
| 11,341 |
| |
Small Company Growth |
| 148,745 |
| |
U.S. Real Estate |
| 198,314 |
| |
184
| 2006 Annual Report |
|
|
| December 31, 2006 |
Federal Income Tax Information (unaudited) (cont’d)
For the year ended December 31, 2006, qualified dividend income for each applicable Portfolio totaled:
|
| Qualifying |
| |
|
| Dividend Income |
| |
Portfolio |
| (000) |
| |
Active International Allocation |
| $ | 12,151 |
|
Emerging Markets |
| 21,585 |
| |
Global Franchise |
| 808 |
| |
Global Real Estate |
| 258 |
| |
Global Value Equity |
| 2,209 |
| |
International Equity |
| 212,413 |
| |
International Growth Equity |
| 93 |
| |
International Magnum |
| 1,294 |
| |
International Real Estate |
| 7,580 |
| |
International Small Cap |
| 26,788 |
| |
Large Cap Relative Value |
| 3,947 |
| |
Systematic Active Large Cap Core |
| 51 |
| |
Systematic Active Small Cap Core |
| 19 |
| |
Systematic Active Small Cap Value |
| 40 |
| |
U.S. Large Cap Growth |
| 184 |
| |
185
2006 Annual Report |
|
|
|
December 31, 2006 |
|
Director and Officer Information (unaudited)
Independent Directors:
|
|
|
|
|
|
|
| Number of |
|
|
|
|
|
|
|
|
|
| Portfolios in |
|
|
|
|
|
|
|
|
|
| Fund Complex |
|
|
|
|
|
|
|
|
|
| Overseen by |
|
|
Name, Age and Address of |
| Position(s) Held |
| Length of |
|
|
| Independent |
|
|
Independent Director |
| with Registrant |
| Time Served* |
| Principal Occupation(s) During Past 5 Years |
| Director** |
| Other Directorships Held by Director |
Frank L. Bowman (62) |
| Director |
| Since August 2006 |
| President and Chief Executive Officer of the Nuclear Energy Institute (policy organization) (since February 2005); Director or Trustee of various Retail and Institutional Funds (since August 2006); formerly variously, Admiral in the U.S. Navy, Director of Naval Nuclear Propulsion Program and Deputy Administrator — Naval Reactors in the National Nuclear Security Administration at the U.S. Department of Energy (1996-2004). Honorary Knight Commander of the Most Excellent Order of the British Empire. |
| 171 |
| Director of the National Energy Foundation, the U.S. Energy Association, the American Council for Capital Formation and the Armed Services YMCA of the USA. |
|
|
|
|
|
|
|
|
|
|
|
Michael Bozic (65) c/o Kramer Levin Naftalis & |
| Director |
| Since April 1994 |
| Private Investor; Chairperson of the Valuation, Insurance and Compliance Committee (since October 2006); Director or Trustee of the Retail Funds (since April 1994) and the Institutional Funds (since July 2003); formerly Chairperson of the Insurance Committee (July 2006-September 2006), Vice Chairman of Kmart Corporation (December 1998-October 2000), Chairman and Chief Executive Officer of Levitz Furniture Corporation (November 1995-November 1998) and President and Chief Executive Officer of Hills Department Stores (May 1991-July 1995); variously Chairman, Chief Executive Officer, President and Chief Operating Officer (1987-1991) of the Sears Merchandise Group of Sears Roebuck & Co. |
| 173 |
| Director of various business |
|
|
|
|
|
|
|
|
|
|
|
Kathleen A. Dennis (53)
|
| Director |
| Since August 2006 |
| President, Cedarwood Associates (mutual fund consulting) (since July 2006); Chairperson of the Closed-End, Money Market and Alternatives Sub-Committee of the Investment Committee (since October 2006) and Director or Trustee of various Retail and Institutional Funds (since August 2006); formerly, Senior Managing Director of Victory Capital Management (1993-2006). |
| 171 |
| None. |
|
|
|
|
|
|
|
|
|
|
|
Dr. Manuel H. Johnson (57) |
| Director |
| Since July 1991 |
| Senior Partner, Johnson Smick International, Inc.(consulting firm); Chairperson of the Investment Committee (since October 2006) and Director or Trustee of the Retail Funds (since July 1991) and the Institutional Funds (since July 2003); Co-Chairman and a founder of the Group of Seven Council (G7C) international economic commission; formerly Chairperson of the Audit Committee (July 1991-September 2006); Vice Chairman of the Board of Governors of the Federal Reserve System and Assistant Secretary of the U.S. Treasury. |
| 173 |
| Director of NVR, Inc. (home construction); Director of KFX Energy; Director of RBS Greenwich Capital Holdings (financial holding company). |
|
|
|
|
|
|
|
|
|
|
|
Joseph J. Kearns (64) |
| Director |
| Since August 1994 |
| President, Kearns & Associates LLC (investment consulting); Chairperson of the Audit Committee (since October 2006) and Director or Trustee of the Retail Funds (since July 2003) and the Institutional Funds (since August 1994); formerly Deputy Chairperson of the Audit Committee (July 2003-September 2006) and Chairman of the Audit Committee of the Institutional Funds (October 2001- July 2003); formerly CFO of the J. Paul Getty Trust. |
| 174 |
| Director of Electro Rent Corporation |
186
| 2006 Annual Report |
|
|
| December 31, 2006 |
Director and Officer Information (cont’d)
Independent Directors:
|
|
|
|
|
|
|
| Number of |
|
|
|
|
|
|
|
|
|
| Portfolios in |
|
|
|
|
|
|
|
|
|
| Fund Complex |
|
|
|
|
|
|
|
|
|
| Overseen by |
|
|
Name, Age and Address of |
| Position(s) Held |
| Length of |
|
|
| Independent |
|
|
Independent Director |
| with Registrant |
| Time Served* |
| Principal Occupation(s) During Past 5 Years |
| Director** |
| Other Directorships Held by Director |
Michael F. Klein (48) |
| Director |
| Since August |
| Chief Operating Officer and Managing Director, Aetos Capital, LLC (since March 2000); Chairperson of the Fixed-Income Sub-Committee of the Investment Committee (since October 2006) and Director or Trustee of various Retail and Institutional Funds (since August 2006); formerly Managing Director, Morgan Stanley & Co., Inc. and Morgan Stanley Dean Witter Investment Management, President, Morgan Stanley Institutional Funds (June 1998-March 2000) and Principal, Morgan Stanley & Co., Inc. and Morgan Stanley Dean Witter Investment Management (August 1997-December 1999). |
| 171 |
| Director of certain investment funds managed or sponsored by Aetos Capital LLC. |
| ||||||||||
|
|
|
|
|
|
|
|
|
|
|
Michael E. Nugent (70) |
| Chairman of the Board and Director |
| Chairman of the Boards since July 2006 and Trustee since July 1991 |
| General Partner of Triumph Capital, L.P. private investment partnership; Chairman of the Boards of the Retail Funds and Institutional Funds (since July 2006); Director or Trustee of the Retail Funds (since July 1991) and the Institutional Funds (since July 2001); formerly Chairperson of the Insurance Committee (until July 2006) and Vice President, Bankers Trust Company and BT Capital Corporation (1984-1988). |
| 173 |
| None. |
|
|
|
|
|
|
|
|
|
|
|
W. Allen Reed (59) |
| Director |
| Since August 2006 |
| Chairperson of the Equity Sub-Committee of the Investment Committee (since October 2006) and Director or Trustee of various Retail and Institutional Funds (since August 2006); formerly President and CEO of General Motors Asset Management; Chairman and Chief Executive Officer of the GM Trust Bank and Corporate Vice President of General Motors Corporation (July 1994- December 2005). |
| 171 |
| Director of GMAC (financial services) and Temple-Inland Industries (packaging, banking and forest products); Director of Legg Mason and Director of the Auburn University Foundation. |
|
|
|
|
|
|
|
|
|
|
|
Fergus Reid (74) |
| Director |
| Since June 1992 |
| Chairman of Lumelite Plastics Corporation; Chairperson of the Governance Committee and Director or Trustee of the Retail Funds (since July 2003) and the Institutional Funds (since June 1992). |
| 174 |
| Trustee and Director of certain investment companies in the JPMorgan Funds complex managed by JP Morgan Investment Management Inc. |
187
2006 Annual Report |
|
|
|
December 31, 2006 |
|
Director and Officer Information (cont’d)
Interested Director:
Name, Age and Address of |
| Position(s) |
| Term of Office |
|
|
| Number of |
|
|
Interested Director |
| Registrant |
| Time Served* |
| Principal Occupation(s) During Past 5 Years |
| Director** |
| Other Directorships Held by Director |
James F. Higgins (58) |
| Director |
| Since June 2000 |
| Director or Trustee of the Retail Funds (since June 2000) and the Institutional Funds (since July 2003); Senior Advisor of Morgan Stanley (since August 2000). |
| 173 |
| Director of AXA Financial, Inc. and The Equitable Life Assurance Society of the United States (financial services). |
* This is the earliest date the Director began serving the Retail Funds or Institutional Funds. Each Director serves an indefinite term, until his or her successor is elected.
** The Fund Complex includes all funds advised by Morgan Stanley Investments LP (“MSI”) that have an investment advisor that is an affiliated entity of MSI (including but not limited to, Morgan Stanley Investment Management Inc. (“MSIM”), Morgan Stanley Investment Advisors Inc. (“MSIA”) and Morgan Stanley AIP GP LP). The Retail Funds are those funds advised by MSIA. The Institutional Funds are certain U.S. registered funds advised by MSI, MSIM and Morgan Stanley AIP GP LP.
Additional information about the Fund’s Directors can be found in the Fund’s Statement of Additional Information (SAI). The SAI may be obtained without charge upon request, by calling the Fund at 1-800-548-7786. You may also retrieve this information on-line at the Securities and Exchange Commission’s website at “http://www.sec.gov”.
188
| 2006 Annual Report |
|
|
| December 31, 2006 |
Director and Officer Information (cont’d)
Executive Officers:
|
| Position(s) |
| Term of Office |
|
|
|
| Held with |
| and Length of |
|
|
Name, Age and Address of Executive Officer |
| Registrant |
| Time Served* |
| Principal Occupation(s) During Past 5 Years |
Ronald E. Robison (67) |
| President and Principal Executive Officer |
| President since September 2005 and Principal Executive Officer since May 2003 |
| President (since September 2005) and Principal Executive Officer (since May 2003) of funds in the Fund Complex; President (since September 2005) and Principal Executive Officer (since May 2003) of the Van Kampen Funds; Managing Director, Director and/or Officer of the Adviser and various entities affiliated with the Adviser; Director of Morgan Stanley SICAV (since May 2004). Formerly, Executive Vice President (July 2003 to September 2005) of funds in the Fund Complex and the Van Kampen Funds; President and Director of the Institutional Funds (March 2001 to July 2003); Chief Global Operating Officer of the Adviser; Chief Administrative Officer of Morgan Stanley Investment Advisors Inc.; Chief Administrative Officer of Morgan Stanley Services Company Inc. |
|
|
| ||||
|
|
| ||||
|
|
| ||||
|
|
| ||||
|
|
| ||||
|
|
| ||||
|
|
| ||||
|
|
|
|
|
|
|
J. David Germany (52) |
| Vice President |
| Since February 2006 |
| Managing Director and (since December 2005) Chief Investment Officer—Global Fixed Income of Morgan Stanley Investment Management; Managing Director and Director of Morgan Stanley Investment Management Limited; Vice President of the Retail and Institutional Funds (since February 2006). |
|
|
| ||||
|
|
| ||||
|
|
| ||||
|
|
| ||||
|
|
| ||||
|
|
| ||||
|
|
|
|
|
|
|
Dennis F. Shea (53) |
| Vice President |
| Since February 2006 |
| Managing Director and (since February 2006) Chief Investment Officer—Global Equity of Morgan Stanley Investment Management; Vice President of the Retail and Institutional Funds (since February 2006). Formerly, Managing Director and Director of Global Equity Research at Morgan Stanley. |
|
|
| ||||
|
|
| ||||
|
|
|
|
|
|
|
Barry Fink (51) |
| Vice President |
| Since February 1997 |
| Managing Director and General Counsel of Morgan Stanley Investment Management; Managing Director of the Adviser and various entities affiliated with the Adviser; Vice President of the Retail Funds and (since July 2003) the Institutional Funds. Formerly, Secretary, General Counsel and/or Director of the Adviser and various entities affiliated with the Adviser; Secretary and General Counsel of the Retail Funds. |
|
|
|
|
|
|
|
Amy R. Doberman(44) |
| Vice President |
| Since July 2004 |
| Managing Director and General Counsel, U.S. Investment Management of Morgan Stanley Investment Management (since July 2004); Vice President of the Retail Funds and the Institutional Funds (since July 2004); Vice President of the Van Kampen Funds (since August 2004); Secretary (since February 2006) and Managing Director (since July 2004) of the Adviser and various entities affiliated with the Adviser. Formerly, Managing Director and General Counsel — Americas, UBS Global Asset Management (July 2000-July 2004). |
|
|
|
|
|
|
|
Carsten Otto(43) |
| Chief Compliance Officer |
| Since October 2004 |
| Managing Director and U.S. Director of Compliance for Morgan Stanley Investment Management (since October 2004); Managing Director and Chief Compliance Officer of Morgan Stanley Investment Management. Formerly, Assistant Secretary and Assistant General Counsel of the Retail Funds. |
|
|
|
|
|
|
|
Stefanie V. Chang Yu (40) |
| Vice President |
| Since December 1997 |
| Executive Director of the Adviser and various entities affiliated with the Adviser; Vice President of the Retail Funds (since July 2002) and the Institutional Funds (since December 1997). Formerly, Secretary of various entities affiliated with the Adviser. |
|
|
|
|
|
|
|
Mary E. Mullin (39) |
| Secretary |
| Since June 1999 |
| Executive Director of the Adviser and various entities affiliated with the Adviser; Secretary of the Retail Funds (since July 2003) and the Institutional Funds (since June 1999). |
|
| |||||
|
| |||||
|
| |||||
|
|
|
|
|
|
|
James W. Garrett (38) |
| Treasurer and Chief Financial Officer |
| Treasurer since February 2002 and Chief Financial Officer since July 2003 |
| Head of Global Fund Administration; Managing Director of the Adviser and various entities affiliated with the Adviser; Treasurer and Chief Financial Officer of the Institutional Funds. Formerly with PriceWaterhouse LLP (now PricewaterhouseCoopers LLP). |
|
|
|
|
|
|
|
Michael J. Leary (41) Boston, MA 02108 |
| Assistant Treasurer |
| Since March 2003 |
| Director and Vice President of Fund Administration, JPMorgan Investor Services Co. (formerly Chase Global Funds Services Company). Formerly, Audit Manager at Ernst & Young, LLP. |
|
* This is the earliest date the Officer began serving the Retail Funds or Institutional Funds. Each Officer serves an indefinite term, until his or her successor is elected.
189
2006 Annual Report |
|
|
|
December 31, 2006 |
|
Investment Adviser and Administrator |
Morgan Stanley Investment Management Inc. |
1221 Avenue of the Americas |
New York, NY 10020 |
Distributor |
Morgan Stanley Distribution, Inc. |
One Tower Bridge |
100 Front Street, Suite 1100 |
West Conshohocken, PA 19428-2899 |
|
Custodian |
JPMorgan Chase Bank, N.A. |
270 Park Avenue |
New York, NY 10017 |
|
Legal Counsel |
Clifford Chance US LLP |
31 West 52nd Street |
New York, NY 10166 |
|
Independent Registered Public Accounting Firm |
Ernst & Young LLP |
200 Clarendon Street |
Boston, MA 02116-5072 |
Reporting to Shareholders
Each Morgan Stanley Fund provides a complete schedule of portfolio holdings in its semi-annual and annual reports within 60 days of the end of the Fund’s second and fourth fiscal quarters. The semi-annual reports and the annual reports are filed electronically with the Securities and Exchange Commission (SEC) on Form N-CSRS and Form N-CSR, respectively. Morgan Stanley also delivers the semi-annual and annual reports to Fund shareholders and makes these reports available on its public website, www.morganstanley.com. Each Morgan Stanley Fund also files a complete schedule of portfolio holdings with the SEC for the Fund’s first and third fiscal quarters on Form N-Q. Morgan Stanley does not deliver the reports for the first and third fiscal quarters to shareholders, nor are the reports posted to the Morgan Stanley public website. You may, however, obtain the Form N-Q filings (as well as the Form N-CSR and N-CSRS filings) by accessing the SEC’s website, http:/www.sec.gov. You may also review and copy them at the SEC’s public reference room in Washington, DC. Information on the operation of the SEC’s Public Reference Room may be obtained by calling the SEC at 1(800) SEC-0330. You can also request copies of these materials, upon payment of a duplicating fee, by electronic request at the SEC’s email address (publicinfo@sec.gov) or by writing the Public Reference section of the SEC, Washington, DC 20549-0102.
Proxy Voting Policies and Procedures and Proxy Voting Record
You may obtain a copy of the Fund’s Proxy Voting Policy and Procedures and information regarding how the Fund voted proxies relating to portfolio securities during the most recent twelve-month period ended June 30, without charge, upon request, by calling toll-free 1(800)548-7786 or by visiting our website at www.morganstanley.com/im. This information is also available on the SEC’s website at http://www.sec.gov.
This report is authorized for distribution only when preceded or accompanied by the prospectus of the Morgan Stanley Institutional Fund, Inc. which describes in detail each Investment Portfolio’s investment policies, risks, fees and expenses. Please read the prospectus carefully before you invest or send money. For additional information, including information regarding the investments comprising the Portfolio, please visit our website at www.morganstanley.com/im or call 1(800) 548-7786.
190
Printed in U.S.A.
This Report has been prepared for shareholders and may be distributed to others only if preceded or accompanied by a current prospectus.
Morgan Stanley Investment Management Inc.
1221 Avenue of the Americas
New York, NY 10020
MSIF: (800) 548-7786
© 2007 Morgan Stanley
| MSIFTANR IS07-00195P-Y12/06 |
Item 2. Code of Ethics.
(a) The Fund has adopted a code of ethics (the “Code of Ethics”) that applies to its principal executive officer, principal financial officer, principal accounting officer or controller, or persons performing similar functions, regardless of whether these individuals are employed by the Fund or a third party.
(b) No information need be disclosed pursuant to this paragraph.
(c) Not applicable.
(d) Not applicable.
(e) Not applicable.
(f)
(1) The Fund’s Code of Ethics is attached hereto as Exhibit 12 A.
(2) Not applicable.
(3) Not applicable.
Item 3. Audit Committee Financial Expert.
The Fund’s Board of Trustees has determined that Joseph J. Kearns, an “independent” Trustee, is an “audit committee financial expert” serving on its audit committee. Under applicable securities laws, a person who is determined to be an audit committee financial expert will not be deemed an “expert” for any purpose, including without limitation for the purposes of Section 11 of the Securities Act of 1933, as a result of being designated or identified as an audit committee financial expert. The designation or identification of a person as an audit committee financial expert does not impose on such person any duties, obligations, or liabilities that are greater than the duties, obligations, and liabilities imposed on such person as a member of the audit committee and Board of Trustees in the absence of such designation or identification.
1
Item 4. Principal Accountant Fees and Services.
(a)(b)(c)(d) and (g). Based on fees billed for the periods shown:
2006
|
| Registrant |
| Covered Entities(1) |
| ||
Audit Fees |
| $ | 627,000 |
| N/A |
| |
|
|
|
|
|
| ||
Non-Audit Fees |
|
|
|
|
| ||
Audit-Related Fees |
| $ |
| $ | 756,000 | (2) | |
Tax Fees. |
| $ | 68,000 | (3) | $ | 79,422 | (4) |
All Other Fees |
| $ |
| $ | 531,708 | (5) | |
Total Non-Audit Fees. |
| $ | 68,000 |
| $ | 1,367,130 |
|
|
|
|
|
|
| ||
Total |
| $ | 695,000 |
| $ | 1,367,130 |
|
2005
|
| Registrant |
| Covered Entities(1) |
| ||
Audit Fees |
| $ | 484,334 |
| N/A |
| |
|
|
|
|
|
| ||
Non-Audit Fees |
|
|
|
|
| ||
Audit-Related Fees |
| $ |
| $ | 235,000 | (2) | |
Tax Fees |
| $ | 45,938 | (3) | $ | 52,799 | (4) |
All Other Fees |
| $ |
| $ | 956,268 | (5) | |
Total Non-Audit Fees |
| $ | 45,938 |
| $ | 1,244,067 |
|
|
|
|
|
|
| ||
Total |
| $ | 530,272 |
| $ | 1.244,067 |
|
N/A- Not applicable, as not required by Item 4.
(1) Covered Entities include the Adviser (excluding sub-advisors) and any entity controlling, controlled by or under common control with the Adviser that provides ongoing services to the Registrant.
(2) Audit-Related Fees represent assurance and related services provided that are reasonably rel ated to the performance of the audit of the financial statements of the Covered Entities and funds advised by the Adviser or its affiliates, specifically attestation services provided in connection with a SAS 70 Report.
(3) Tax Fees represent tax advice and compliance services provided in connection with the review of the Registrant’s tax returns.
(4) Tax Fees represent tax advice services provided to Covered Entities, including research and identification of PFIC entities.
(5) All Other Fees represent attestation services provided in connection with performance presentation standards and a compliance review project performed.
2
(e)(1) The audit committee’s pre-approval policies and procedures are as follows:
APPENDIX A
AUDIT COMMITTEE
AUDIT AND NON-AUDIT SERVICES
PRE-APPROVAL POLICY AND PROCEDURES
OF THE
MORGAN STANLEY RETAIL AND INSTITUTIONAL FUNDS
AS ADOPTED AND AMENDED JULY 23, 2004,(1)
1. Statement of Principles
The Audit Committee of the Board is required to review and, in its sole discretion, pre-approve all Covered Services to be provided by the Independent Auditors to the Fund and Covered Entities in order to assure that services performed by the Independent Auditors do not impair the auditor’s independence from the Fund.
The SEC has issued rules specifying the types of services that an independent auditor may not provide to its audit client, as well as the audit committee’s administration of the engagement of the independent auditor. The SEC’s rules establish two different approaches to pre-approving services, which the SEC considers to be equally valid. Proposed services either: may be pre-approved without consideration of specific case-by-case services by the Audit Committee (“general pre-approval”); or require the specific pre-approval of the Audit Committee or its delegate (“specific pre-approval”). The Audit Committee believes that the combination of these two approaches in this Policy will result in an effective and efficient procedure to pre-approve services performed by the Independent Auditors. As set forth in this Policy, unless a type of service has received general pre-approval, it will require specific pre-approval by the Audit Committee (or by any member of the Audit Committee to which pre-approval authority has been delegated) if it is to be provided by the Independent Auditors. Any proposed services exceeding pre-approved cost levels or budgeted amounts will also require specific pre-approval by the Audit Committee.
The appendices to this Policy describe the Audit, Audit-related, Tax and All Other services that have the general pre-approval of the Audit Committee. The term of any general pre-approval is 12 months from the date of pre-approval, unless the Audit Committee considers and provides a different period and states otherwise. The Audit Committee will annually review and pre-approve the services that may be provided by the Independent Auditors without obtaining specific pre-approval from the Audit
(1) This Audit Committee Audit and Non-Audit Services Pre-Approval Policy and Procedures (the “Policy”), adopted as of the date above, supersedes and replaces all prior versions that may have been adopted from time to time.
3
Committee. The Audit Committee will add to or subtract from the list of general pre-approved services from time to time, based on subsequent determinations.
The purpose of this Policy is to set forth the policy and procedures by which the Audit Committee intends to fulfill its responsibilities. It does not delegate the Audit Committee’s responsibilities to pre-approve services performed by the Independent Auditors to management.
The Fund’s Independent Auditors have reviewed this Policy and believes that implementation of the Policy will not adversely affect the Independent Auditors’ independence.
2. Delegation
As provided in the Act and the SEC’s rules, the Audit Committee may delegate either type of pre-approval authority to one or more of its members. The member to whom such authority is delegated must report, for informational purposes only, any pre-approval decisions to the Audit Committee at its next scheduled meeting.
3. Audit Services
The annual Audit services engagement terms and fees are subject to the specific pre-approval of the Audit Committee. Audit services include the annual financial statement audit and other procedures required to be performed by the Independent Auditors to be able to form an opinion on the Fund’s financial statements. These other procedures include information systems and procedural reviews and testing performed in order to understand and place reliance on the systems of internal control, and consultations relating to the audit. The Audit Committee will approve, if necessary, any changes in terms, conditions and fees resulting from changes in audit scope, Fund structure or other items.
In addition to the annual Audit services engagement approved by the Audit Committee, the Audit Committee may grant general pre-approval to other Audit services, which are those services that only the Independent Auditors reasonably can provide. Other Audit services may include statutory audits and services associated with SEC registration statements (on Forms N-1A, N-2, N-3, N-4, etc.), periodic reports and other documents filed with the SEC or other documents issued in connection with securities offerings.
The Audit Committee has pre-approved the Audit services in Appendix B.1. All other Audit services not listed in Appendix B.1 must be specifically pre-approved by the Audit Committee (or by any member of the Audit Committee to which pre-approval has been delegated).
4. Audit-related Services
Audit-related services are assurance and related services that are reasonably related to the performance of the audit or review of the Fund’s financial statements and, to the extent they are Covered Services, the Covered Entities or that are traditionally performed by the Independent Auditors. Because the Audit Committee believes that the provision of Audit-related services does not impair the independence of the auditor and is consistent with the SEC’s rules on auditor independence, the Audit Committee may grant general
4
pre-approval to Audit-related services. Audit-related services include, among others, accounting consultations related to accounting, financial reporting or disclosure matters not classified as “Audit services”; assistance with understanding and implementing new accounting and financial reporting guidance from rulemaking authorities; agreed-upon or expanded audit procedures related to accounting and/or billing records required to respond to or comply with financial, accounting or regulatory reporting matters; and assistance with internal control reporting requirements under Forms N-SAR and/or N-CSR.
The Audit Committee has pre-approved the Audit-related services in Appendix B.2. All other Audit-related services not listed in Appendix B.2 must be specifically pre-approved by the Audit Committee (or by any member of the Audit Committee to which pre-approval has been delegated).
5. Tax Services
The Audit Committee believes that the Independent Auditors can provide Tax services to the Fund and, to the extent they are Covered Services, the Covered Entities, such as tax compliance, tax planning and tax advice without impairing the auditor’s independence, and the SEC has stated that the Independent Auditors may provide such services.
Pursuant to the preceding paragraph, the Audit Committee has pre-approved the Tax Services in Appendix B.3. All Tax services in Appendix B.3 must be specifically pre-approved by the Audit Committee (or by any member of the Audit Committee to which pre-approval has been delegated).
6. All Other Services
The Audit Committee believes, based on the SEC’s rules prohibiting the Independent Auditors from providing specific non-audit services, that other types of non-audit services are permitted. Accordingly, the Audit Committee believes it may grant general pre-approval to those permissible non-audit services classified as All Other services that it believes are routine and recurring services, would not impair the independence of the auditor and are consistent with the SEC’s rules on auditor independence.
The Audit Committee has pre-approved the All Other services in Appendix B.4. Permissible All Other services not listed in Appendix B.4 must be specifically pre-approved by the Audit Committee (or by any member of the Audit Committee to which pre-approval has been delegated).
7. Pre-Approval Fee Levels or Budgeted Amounts
Pre-approval fee levels or budgeted amounts for all services to be provided by the Independent Auditors will be established annually by the Audit Committee. Any proposed services exceeding these levels or amounts will require specific pre-approval by the Audit Committee. The Audit Committee is mindful of the overall relationship of fees for audit and non-audit services in determining whether to pre-approve any such services.
5
8. Procedures
All requests or applications for services to be provided by the Independent Auditors that do not require specific approval by the Audit Committee will be submitted to the Fund’s Chief Financial Officer and must include a detailed description of the services to be rendered. The Fund’s Chief Financial Officer will determine whether such services are included within the list of services that have received the general pre-approval of the Audit Committee. The Audit Committee will be informed on a timely basis of any such services rendered by the Independent Auditors. Requests or applications to provide services that require specific approval by the Audit Committee will be submitted to the Audit Committee by both the Independent Auditors and the Fund’s Chief Financial Officer, and must include a joint statement as to whether, in their view, the request or application is consistent with the SEC’s rules on auditor independence.
The Audit Committee has designated the Fund’s Chief Financial Officer to monitor the performance of all services provided by the Independent Auditors and to determine whether such services are in compliance with this Policy. The Fund’s Chief Financial Officer will report to the Audit Committee on a periodic basis on the results of its monitoring. Both the Fund’s Chief Financial Officer and management will immediately report to the chairman of the Audit Committee any breach of this Policy that comes to the attention of the Fund’s Chief Financial Officer or any member of management.
9. Additional Requirements
The Audit Committee has determined to take additional measures on an annual basis to meet its responsibility to oversee the work of the Independent Auditors and to assure the auditor’s independence from the Fund, such as reviewing a formal written statement from the Independent Auditors delineating all relationships between the Independent Auditors and the Fund, consistent with Independence Standards Board No. 1, and discussing with the Independent Auditors its methods and procedures for ensuring independence.
10. Covered Entities
Covered Entities include the Fund’s investment adviser(s) and any entity controlling, controlled by or under common control with the Fund’s investment adviser(s) that provides ongoing services to the Fund(s). Beginning with non-audit service contracts entered into on or after May 6, 2003, the Fund’s audit committee must pre-approve non-audit services provided not only to the Fund but also to the Covered Entities if the engagements relate directly to the operations and financial reporting of the Fund. This list of Covered Entities would include:
Morgan Stanley Retail Funds
Morgan Stanley Investment Advisors Inc.
Morgan Stanley & Co. Incorporated
Morgan Stanley DW Inc.
Morgan Stanley Investment Management Inc.
Morgan Stanley Investment Management Limited
Morgan Stanley Investment Management Private Limited
Morgan Stanley Asset & Investment Trust Management Co., Limited
Morgan Stanley Investment Management Company
Van Kampen Asset Management
6
Morgan Stanley Services Company, Inc.
Morgan Stanley Distributors Inc.
Morgan Stanley Trust FSB
Morgan Stanley Institutional Funds
Morgan Stanley Investment Management Inc.
Morgan Stanley Investment Advisors Inc.
Morgan Stanley Investment Management Limited
Morgan Stanley Investment Management Private Limited
Morgan Stanley Asset & Investment Trust Management Co., Limited
Morgan Stanley Investment Management Company
Morgan Stanley & Co. Incorporated
Morgan Stanley Distribution, Inc.
Morgan Stanley AIP GP LP
Morgan Stanley Alternative Investment Partners LP
(e)(2) Beginning with non-audit service contracts entered into on or after May 6, 2003, the audit committee also is required to pre-approve services to Covered Entities to the extent that the services are determined to have a direct impact on the operations or financial reporting of the Registrant. 100% of such services were pre-approved by the audit committee pursuant to the Audit Committee’s pre-approval policies and procedures (attached hereto).
(f) Not applicable.
(g) See table above.
(h) The audit committee of the Board of Trustees has considered whether the provision of services other than audit services performed by the auditors to the Registrant and Covered Entities is compatible with maintaining the auditors’ independence in performing audit services.
Item 5. Audit Committee of Listed Registrants.
(a) The Fund has a separately-designated standing audit committee established in accordance with Section 3(a)(58)(A) of the Exchange Act whose members are: Frank Bowman, Joseph Kearns, Michael Nugent and Allen Reed.
(b) Not applicable.
Item 6. Schedule of Investments
Refer to Item 1.
7
Item 7. Disclosure of Proxy Voting Policies and Procedures for Closed-End Management Investment Companies.
Applicable only to reports filed by closed-end funds.
Item 8. Portfolio Managers of Closed-End Management Investment Companies
Applicable only to reports filed by closed-end funds.
Item 9. Closed-End Fund Repurchases
Applicable only to reports filed by closed-end funds.
Item 10. Submission of Matters to a Vote of Security Holders
Not applicable.
Item 11. Controls and Procedures
(a) The Fund’s principal executive officer and principal financial officer have concluded that the Fund’s disclosure controls and procedures are sufficient to ensure that information required to be disclosed by the Fund in this Form N-CSR was recorded, processed, summarized and reported within the time periods specified in the Securities and Exchange Commission’s rules and forms, based upon such officers’ evaluation of these controls and procedures as of a date within 90 days of the filing date of the report.
(b) There were no changes in the registrant’s internal control over financial reporting that occurred during the registrant’s most recent fiscal half-year (the registrant’s second fiscal half-year in the case of an annual report) that has materially affected, or is reasonably likely to materially affect, the registrant’s internal control over financial reporting.
Item 12. Exhibits
(a) The Code of Ethics for Principal Executive and Senior Financial Officers is attached hereto.
(b) A separate certification for each principal executive officer and principal financial officer of the registrant are attached hereto as part of EX-99.CERT.
8
SIGNATURES
Pursuant to the requirements of the Securities Exchange Act of 1934 and the Investment Company Act of 1940, the registrant has duly caused this report to be signed on its behalf by the undersigned, thereunto duly authorized.
(Registrant) | Morgan Stanley Institutional Fund, Inc. | ||
| |||
By: | /s/ Ronald E. Robison | ||
Name: | Ronald E. Robison | ||
Title: | Principal Executive Officer | ||
Date: | February 8, 2007 | ||
Pursuant to the requirements of the Securities Exchange Act of 1934 and the Investment Company Act of 1940, this report has been signed by the following persons on behalf of the registrant and in the capacities and on the dates indicated.
By: | /s/ Ronald E. Robison | |
Name: | Ronald E. Robison | |
Title: | Principal Executive Officer | |
Date: | February 8, 2007 | |
By: | /s/ James W. Garrett | |
Name: | James W. Garrett | |
Title: | Principal Financial Officer | |
Date: | February 8, 2007 | |