UNITED STATES
SECURITIES AND EXCHANGE COMMISSION
Washington, D.C. 20549
FORM N-CSR
CERTIFIED SHAREHOLDER REPORT OF REGISTERED
MANAGEMENT INVESTMENT COMPANIES
Investment Company Act file number | 811-05624 |
|
Morgan Stanley Institutional Fund, Inc. |
(Exact name of registrant as specified in charter) |
|
522 Fifth Avenue New York, NY | | 10036 |
(Address of principal executive offices) | | (Zip code) |
|
Randy Takian
522 Fifth Avenue New York, New York 10036 |
(Name and address of agent for service) |
|
Registrant’s telephone number, including area code: | 1-800-221-6726 | |
|
Date of fiscal year end: | 12/31 | |
|
Date of reporting period: | 12/31/08 | |
| | | | | | | | |
Form N-CSR is to be used by management investment companies to file reports with the Commission not later than 10 days after the transmission to stockholders of any report that is required to be transmitted to stockholders under Rule 30e-1 under the Investment Company Act of 1940 (17 CFR 270.30e-1). The Commission may use the information provided on Form N-CSR in its regulatory, disclosure review, inspection, and policymaking roles.
A registrant is required to disclose the information specified by Form N-CSR, and the Commission will make this information public. A registrant is not required to respond to the collection of information contained in Form N-CSR unless the Form displays a currently valid Office of Management and Budget (“OMB”) control number. Please direct comments concerning the accuracy of the information collection burden estimate and any suggestions for reducing the burden to Secretary, Securities and Exchange Commission, 450 Fifth Street, NW, Washington, DC 20549-0609. The OMB has reviewed this collection of information under the clearance requirements of 44 U.S.C. Section 3507.
ITEM 1. REPORTS TO STOCKHOLDERS.
The Fund’s annual report transmitted to shareholders pursuant to Rule 30e-1 under the Investment Company Act of 1940 is as follows:

| 2008 Annual Report |
|
December 31, 2008 |
Morgan Stanley Institutional Fund, Inc.
Global and International Equity Portfolios
Active International Allocation
Emerging Markets
Global Franchise
Global Real Estate
Global Value Equity
International Equity
International Growth Active Extension
International Growth Equity
International Real Estate
International Small Cap
U.S. Equity Portfolios
Capital Growth
Focus Growth
Large Cap Relative Value
Small Company Growth
U.S. Real Estate
U.S. Small/Mid Cap Value
Fixed Income Portfolio
Emerging Markets Debt
| 2008 Annual Report |
| |
| December 31, 2008 |
Table of Contents
Shareholder’s Letter | 3 |
Performance Summary | 4 |
Expense Examples | 6 |
Portfolios of Investments Global and International Equity Portfolios: | |
Active International Allocation | 8 |
Emerging Markets | 20 |
Global Franchise | 25 |
Global Real Estate | 28 |
Global Value Equity | 34 |
International Equity | 38 |
International Growth Active Extension | 43 |
International Growth Equity | 49 |
International Real Estate | 54 |
International Small Cap | 59 |
U.S. Equity Portfolios: | |
Capital Growth | 64 |
Focus Growth | 67 |
Large Cap Relative Value | 70 |
Small Company Growth | 74 |
U.S. Real Estate | 78 |
U.S. Small/Mid Cap Value | 83 |
Fixed Income Portfolio: | |
Emerging Markets Debt | 87 |
Statements of Assets and Liabilities | 92 |
Statements of Operations | 100 |
Statements of Changes in Net Assets | 104 |
Statement of Cash Flows | 116 |
Financial Highlights | 117 |
Notes to Financial Statements | 143 |
U.S. Privacy Policy | 161 |
Director and Officer Information | 164 |
This report is authorized for distribution only when preceded or accompanied by prospectuses of the Morgan Stanley Institutional Fund, Inc. To receive a prospectus and/or SAI, which contains more complete information such as investment objectives, charges, expenses, policies for voting proxies, risk considerations, and describes in detail each of the Portfolio’s investment policies to the prospective investor, please call 1 (800) 548-7786. Please read the prospectuses carefully before you invest or send money. Additionally, you can access portfolio information including performance, characteristics, and investment team commentary through Morgan Stanley Investment Management’s website: www.morganstanley.com/msim.
Market forecasts provided in this report may not necessarily come to pass. There is no guarantee that any sectors mentioned will continue to perform as discussed herein or that securities in such sectors will be held by the Portfolio in the future. There is no assurance that a Portfolio will achieve its investment objective. Portfolios are subject to market risk, which is the possibility that market values of securities owned by the Portfolio will decline and, therefore, the value of the Portfolio’s shares may be less than what you paid for them. Accordingly, you can lose money investing in Portfolios. Please see the prospectus for more complete information on investment risks.
(This Page has been left blank intentionally.)
| 2008 Annual Report |
| |
| December 31, 2008 |
Shareholder’s Letter
Dear Shareholders:
We are pleased to present to you the Fund’s Annual Report for the year ended December 31, 2008. Our Fund currently offers 17 portfolios providing investors with a full array of global and domestic equity and fixed-income products. The Fund’s portfolios, together with the portfolios of the Morgan Stanley Institutional Fund Trust, provide investors with a means to help them meet specific investment needs and to allocate their investments among equities (e.g., value and growth; small, medium, and large capitalization) and fixed income (e.g., short, medium, and long duration; investment grade and high yield).
Sincerely,

Randy Takian
President and Principal Executive Officer
January 2009
2008 Annual Report | |
| |
December 31, 2008 | |
Performance Summary
| | | | | | | | | | | | One Year | | | | Five Year |
| | Inception Dates | | Total Return | | | | Average Annual Total Return |
| | | | | | | | | | | | | | Comparable | | | | | | | Comparable | | |
| | Class I | | Class P | | Class H | | Class L | | Class I | | Class P | | Indices | | | Class I | | Class P | | Indices | | |
Global and International Equity Portfolios: | | | | | | | | | | | | | | | | | | | | | | | | | |
Active International Allocation | | 1/17/92 | | 1/2/96 | | — | | — | | (39.25 | )% | (39.41 | ) | (43.38 | )% | (1) | 3.13 | % | 2.86 | % | 1.66 | % | (1) |
Emerging Markets | | 9/25/92 | | 1/2/96 | | — | | — | | (56.39 | ) | (56.50 | ) | (53.33 | ) | (2) | 7.30 | | 7.03 | | 7.66 | | (2) |
Global Franchise | | 11/28/01 | | 11/28/01 | | — | | — | | (28.88 | ) | (29.00 | ) | (40.71 | ) | (3) | 3.83 | | 3.57 | | (0.51 | ) | (3) |
Global Real Estate | | 8/30/06 | | 8/30/06 | | 1/2/08 | | 6/16/08 | | (45.00 | ) | (45.15 | ) | (47.83 | ) | (4) | — | | — | | — | | (4) |
Global Value Equity | | 7/15/92 | | 1/2/96 | | — | | — | | (41.82 | ) | (41.98 | ) | (40.71 | ) | (3) | (1.88 | ) | (2.14 | ) | (0.51 | ) | (3) |
International Equity | | 8/4/89 | | 1/2/96 | | — | | — | | (33.12 | ) | (33.21 | ) | (43.38 | ) | (1) | 2.82 | | 2.58 | | 1.66 | | (1) |
International Growth Active Extension | | 7/31/07 | | 7/31/07 | | 1/2/08 | | 6/16/08 | | (54.13 | ) | (54.48 | ) | (43.38 | ) | (1) | — | | — | | — | | (1) |
International Growth Equity | | 12/27/05 | | 12/27/05 | | — | | — | | (48.70 | ) | (48.82 | ) | (43.38 | ) | (1) | — | | — | | — | | (1) |
International Real Estate | | 10/1/97 | | 10/1/97 | | — | | — | | (49.95 | ) | (50.05 | ) | (51.38 | ) | (5) | 1.86 | | 1.63 | | 1.39 | | (5) |
International Small Cap | | 12/15/92 | | 10/21/08 | | — | | — | | (38.33 | ) | — | | (47.01 | ) | (6) | 1.51 | | — | | 1.14 | | (6) |
U.S. Equity Portfolios: | | | | | | | | | | | | | | | | | | | | | | | |
Capital Growth | | 4/2/91 | | 1/2/96 | | — | | — | | (50.47 | ) | (50.57 | ) | (38.44 | ) | (8) | (4.70 | ) | (4.94 | ) | (3.42 | ) | (8) |
Focus Growth | | 3/8/95 | | 1/2/96 | | — | | — | | (52.19 | ) | (52.27 | ) | (38.44 | ) | (8) | (5.17 | ) | (5.40 | ) | (3.42 | ) | (8) |
Large Cap Relative Value | | 1/31/90 | | 1/2/96 | | — | | — | | (32.01 | ) | (32.21 | ) | (36.85 | ) | (7) | 0.59 | | 0.30 | | (0.79 | ) | (7) |
Small Company Growth | | 11/1/89 | | 1/2/96 | | — | | — | | (41.84 | ) | (41.97 | ) | (38.54 | ) | (9) | (1.93 | ) | (2.17 | ) | (2.35 | ) | (9) |
U.S. Real Estate | | 2/24/95 | | 1/2/96 | | — | | — | | (38.07 | ) | (38.26 | ) | (37.73 | ) | (10) | 2.97 | | 2.72 | | 0.91 | | (10) |
U.S. Small/Mid Cap Value | | 9/27/07 | | 9/27/07 | | — | | — | | (38.03 | ) | (38.21 | ) | (31.99 | ) | (11) | — | | — | | — | | (11) |
Fixed Income Portfolio: | | | | | | | | | | | | | | | | | | | | | | | |
Emerging Markets Debt | | 2/1/94 | | 1/2/96 | | 1/2/08 | | 6/16/08 | | (10.07 | ) | (10.34 | ) | (5.22 | ) | (12) | 5.26 | | 4.98 | | 6.60 | | (12) |
| 2008 Annual Report |
| |
| December 31, 2008 |
Performance Summary (cont’d)
Ten Year | | | | | | | Since Inception | | | | | | | |
Average Annual Total Return | | | | | | | Average Annual Total Return | | | | | | | |
| | | | | | | | | Comparable | | | | Comparable | | | | Comparable | | | | Comparable | | | |
| | | | Comparable | | | | | Indices - | | | | Indices - | | | | Indices - | | | | Indices - | | | |
Class I | | Class P | | Indices | | | Class I | | Class I | | Class P | | Class P | | Class H | | Class H | | Class L | | Class L | | | |
1.94 | % | 1.63 | % | 0.80 | % | (1) | 5.28 | % | 4.33 | % | 4.07 | % | 2.63 | % | — | % | — | % | — | % | — | % | (1) |
9.40 | | 9.12 | | 9.05 | | (2) | 7.09 | | 6.44 | | 5.27 | | 3.94 | | — | | — | | — | | — | | (2) |
— | | — | | — | | (3) | 8.20 | | 0.79 | | 7.91 | | 0.79 | | — | | — | | — | | — | | (3) |
— | | — | | — | | (4) | (19.99 | ) | (21.54 | ) | (20.22 | ) | (21.54 | ) | (44.88 | )† | (47.68 | ) | (63.88 | )†† | (43.95 | ) | (4) |
0.34 | | 0.08 | | (0.64 | ) | (3) | 7.36 | | 5.33 | | 4.32 | | 3.30 | | — | | — | | — | | — | | (3) |
5.38 | | 5.14 | | 0.80 | | (1) | 8.93 | | 3.03 | | 7.72 | | 2.63 | | — | | — | | — | | — | | (1) |
— | | — | | — | | (1) | (39.60 | ) | (32.15 | ) | (39.96 | ) | (32.15 | ) | (54.42 | )† | (43.38 | ) | (73.12 | )†† | (38.46 | ) | (1) |
— | | — | | — | | (1) | (9.08 | ) | (7.45 | ) | (9.30 | ) | (7.45 | ) | — | | — | | — | | — | | (1) |
7.23 | | 6.96 | | 6.31 | | (5) | 6.39 | | 5.18 | | 6.13 | | 5.18 | | — | | — | | — | | — | | (5) |
7.03 | | — | | 3.72 | | (6) | 8.65 | | 3.22 | | 1.56 | ††† | (4.31 | ) | — | | — | | — | | — | | (6) |
| | | | | | | | | | | | | | | | | | | | | | | |
(2.78 | ) | (3.02 | ) | (4.27 | ) | (8) | 6.22 | | 5.48 | | 3.11 | | 2.79 | | — | | — | | — | | — | | (8) |
(2.40 | ) | (2.63 | ) | (4.27 | ) | (8) | 6.54 | | 4.61 | | 3.87 | | 2.79 | | — | | — | | — | | — | | (8) |
2.87 | | 2.62 | | 1.36 | | (7) | 8.06 | | 8.69 | | 6.04 | | 6.12 | | — | | — | | — | | — | | (7) |
5.06 | | 4.81 | | (0.76 | ) | (9) | 9.01 | | 4.55 | | 6.75 | | 1.26 | | — | | — | | — | | — | | (9) |
8.34 | | 8.05 | | 7.42 | | (10) | 10.94 | | 8.66 | | 9.71 | | 8.08 | | — | | — | | — | | — | | (10) |
— | | — | | — | | (11) | (34.44 | ) | (30.83 | ) | (34.65 | ) | (30.83 | ) | — | | — | | — | | — | | (11) |
| | | | | | | | | | | | | | | | | | | | | | | |
11.48 | | 11.17 | | 10.91 | | (12) | 9.27 | | 9.48 | | 9.54 | | 10.66 | | (10.70 | )† | (5.62 | ) | (20.75 | )†† | (6.28 | ) | (12) |
† | Performance figures are cumulative since inception as Class H shares commenced operations on January 2, 2008. |
| |
†† | Performance figures are cumulative since inception as Class L shares commenced operations on June 16, 2008. |
| |
††† | Performance figures are cumulative since inception as Class P shares commenced operations on October 21, 2008. |
Performance data quoted assumes that all dividends and distributions, if any, were reinvested and represents past performance, which is no guarantee of future results. Returns do not reflect the deduction of any applicable sales charges for Class H shares. Such costs would lower performance. Current performance may be lower or higher than the figures shown. For the most recent month-end performance figures, please visit www.morganstanley.com/msim or call 1-800-548-7786. Investment returns and principal value will fluctuate and fund shares, when redeemed, may be worth more or less than their original cost.
Indices:
(1) | | MSCI EAFE (Europe, Australasia, and Far East) |
(2) | | MSCI Emerging Markets Net |
(3) | | MSCI World |
(4) | | FTSE EPRA/NAREIT Global Real Estate — Net Total Return to U.S. Investors |
(5) | | FTSE EPRA/NAREIT Global ex-North America Real Estate (80% Europe/20% Asia) |
(6) | | MSCI EAFE Small Cap Total Return |
(7) | | Russell 1000® Value |
(8) | | Russell 1000® Growth |
(9) | | Russell 2000® Growth |
(10) | | FTSE NAREIT Equity REIT |
(11) | | Russell 2500® Value |
(12) | | J.P. Morgan EMBI Global Bond /J.P. Morgan GBI-EM Global Diversified Bond |
2008 Annual Report | |
| |
December 31, 2008 | |
Expense Examples (unaudited)
Expense Examples
As a shareholder of a Portfolio, you may incur two types of costs: (1) transactional costs, including redemptions fees, and (2) ongoing costs, including management fees, shareholder servicing and distribution fees (in the case of Class P, Class H and Class L) and other Portfolio expenses. These examples are intended to help you understand your ongoing costs (in dollars) of investing in a Portfolio and to compare these costs with the ongoing costs of investing in other mutual funds.
The examples are based on an investment of $1,000 invested at the beginning of the six-month period ended December 31, 2008 and held for the entire six-month period.
Actual Expenses
The table below provides information about actual account values and actual expenses. You may use the information in this table, together with the amount you invested, to estimate the expenses that you paid over the period. Simply divide your account value by $1,000 (for example, an $8,600 account value divided by $1,000 = 8.6), then multiply the result by the number in the table under the heading entitled “Actual Expenses Paid During Period” to estimate the expenses you paid on your account during this period.
Please note that the Class P shares of the International Small Cap Portfolio commenced operations on October 21, 2008, however, expenses did not begin accruing until October 22, 2008; therefore, “Actual Expenses Paid During Period” reflect activity from October 22, 2008 through December 31, 2008.
Please note that “Actual Expenses Paid During Period” are grossed up to reflect Portfolio expenses prior to the effect of Expense Offset (See Note F in the Notes to Financial Statements). Therefore, the annualized net expense ratios may differ from the ratio of expenses to average net assets shown in the Financial Highlights.
Hypothetical Example for Comparison Purposes
The table below provides information about hypothetical account values and hypothetical expenses based on the Portfolio’s actual expense ratio and an assumed rate of return of 5% per year before expenses, which is not the Portfolio’s actual return. The hypothetical account values and expenses may not be used to estimate the actual ending account balance or expenses you paid for the period. You may use this information to compare the ongoing costs of investing in the Portfolio and other funds. To do so, compare this 5% hypothetical example with the 5% hypothetical examples that appear in the shareholder reports of the other funds.
Please note that while the Class P shares of the International Small CapPortfolio commenced operations on October 21, 2008, the “Hypothetical Expenses Paid During the Period” reflect projected activity for the full six month period for the purposes of comparability. This projection assumes that the annualized expense ratios for the Class P shares were in effect during the period from July 1, 2008 through December 31, 2008.
Please note that the expenses shown in the table are meant to highlight your ongoing costs only and do not reflect any transactional costs, such as redemption fees. Therefore, the second line of the table is useful in comparing ongoing costs only, and will not help you determine the relative total costs of owning different funds. In addition, if these transactional costs were included, your costs would have been higher. Expenses are calculated using each Fund’s annualized expense ratio (as disclosed), multiplied by the average account value over the period, and multiplied by 184/366(to reflect the most recent one-half year period).
| 2008 Annual Report |
| |
| December 31, 2008 |
Expense Examples (cont’d)
| | | | | | | | Actual | | | | Net | |
| | Beginning | | Actual Ending | | | | Expenses | | | | Expense | |
| | Account | | Account | | Hypothetical | | Paid | | Hypothetical | | Ratio | |
| | Value | | Value | | Ending Account | | During | | Expenses Paid | | During | |
| | 7/1/08 | | 12/31/08 | | Value | | Period* | | During Period* | | Period | |
Active International Allocation Class I | | $1,000.00 | | $ 670.70 | | $1,021.17 | | $ 3.32 | | $ 4.01 | | 0.79 | % |
Active International Allocation Class P | | 1,000.00 | | 669.10 | | 1,019.91 | | 4.36 | | 5.28 | | 1.04 | |
Emerging Markets Class I | | 1,000.00 | | 516.90 | | 1,017.34 | | 5.91 | | 7.86 | | 1.55 | |
Emerging Markets Class P | | 1,000.00 | | 516.30 | | 1,016.09 | | 6.86 | | 9.12 | | 1.80 | |
Global Franchise Class I | | 1,000.00 | | 826.60 | | 1,020.11 | | 4.59 | | 5.08 | | 1.00 | |
Global Franchise Class P | | 1,000.00 | | 825.50 | | 1,018.85 | | 5.74 | | 6.34 | | 1.25 | |
Global Real Estate Class I | | 1,000.00 | | 631.80 | | 1,019.76 | | 4.39 | | 5.43 | | 1.07 | |
Global Real Estate Class P | | 1,000.00 | | 631.00 | | 1,018.55 | | 5.37 | | 6.65 | | 1.31 | |
Global Real Estate Class H | | 1,000.00 | | 630.40 | | 1,021.52 | | 2.95 | | 3.66 | | 0.72 | |
Global Real Estate Class L | | 1,000.00 | | 630.20 | | 1,016.54 | | 7.01 | | 8.67 | | 1.71 | |
Global Value Equity Class I | | 1,000.00 | | 686.50 | | 1,020.06 | | 4.28 | | 5.13 | | 1.01 | |
Global Value Equity Class P | | 1,000.00 | | 685.20 | | 1,018.85 | | 5.30 | | 6.34 | | 1.25 | |
International Equity Class I | | 1,000.00 | | 723.00 | | 1,020.21 | | 4.24 | | 4.98 | | 0.98 | |
International Equity Class P | | 1,000.00 | | 722.70 | | 1,018.95 | | 5.33 | | 6.24 | | 1.23 | |
International Growth Active Extension Class I | | 1,000.00 | | 519.10 | | 1,013.88 | | 8.55 | | 11.34 | | 2.24 | |
International Growth Active Extension Class P | | 1,000.00 | | 515.80 | | 1,012.62 | | 9.49 | | 12.60 | | 2.49 | |
International Growth Active Extension Class H | | 1,000.00 | | 515.10 | | 1,010.91 | | 10.78 | | 14.30 | | 2.83 | |
International Growth Active Extension Class L | | 1,000.00 | | 520.50 | | 1,014.48 | | 8.10 | | 10.74 | | 2.12 | |
International Growth Equity Class I | | 1,000.00 | | 573.80 | | 1,020.11 | | 3.96 | | 5.08 | | 1.00 | |
International Growth Equity Class P | | 1,000.00 | | 573.30 | | 1,018.85 | | 4.94 | | 6.34 | | 1.25 | |
International Real Estate Class I | | 1,000.00 | | 585.40 | | 1,020.36 | | 3.79 | | 4.82 | | 0.95 | |
International Real Estate Class P | | 1,000.00 | | 584.90 | | 1,019.10 | | 4.78 | | 6.09 | | 1.20 | |
International Small Cap Class I | | 1,000.00 | | 683.10 | | 1,019.36 | | 4.87 | | 5.84 | | 1.15 | |
International Small Cap Class P | | 1,000.00 | | 1,015.60 | | 1,016.19 | | 3.53 | ** | 9.02 | | 1.78 | |
Capital Growth Class I | | 1,000.00 | | 551.00 | | 1,021.87 | | 2.53 | | 3.30 | | 0.65 | |
Capital Growth Class P | | 1,000.00 | | 550.10 | | 1,020.61 | | 3.51 | | 4.57 | | 0.90 | |
Focus Growth Class I | | 1,000.00 | | 516.80 | | 1,020.06 | | 3.85 | | 5.13 | | 1.01 | |
Focus Growth Class P | | 1,000.00 | | 516.80 | | 1,018.80 | | 4.80 | | 6.39 | | 1.26 | |
Large Cap Relative Value Class I | | 1,000.00 | | 777.10 | | 1,021.52 | | 3.22 | | 3.66 | | 0.72 | |
Large Cap Relative Value Class P | | 1,000.00 | | 775.30 | | 1,020.26 | | 4.33 | | 4.93 | | 0.97 | |
Small Company Growth Class I | | 1,000.00 | | 669.90 | | 1,019.96 | | 4.32 | | 5.23 | | 1.03 | |
Small Company Growth Class P | | 1,000.00 | | 669.50 | | 1,018.70 | | 5.37 | | 6.50 | | 1.28 | |
U.S. Real Estate Class I | | 1,000.00 | | 646.40 | | 1,020.21 | | 4.06 | | 4.98 | | 0.98 | |
U.S. Real Estate Class P | | 1,000.00 | | 645.70 | | 1,018.90 | | 5.13 | | 6.29 | | 1.24 | |
U.S. Small/Mid Cap Value Class I | | 1,000.00 | | 698.60 | | 1,018.40 | | 5.72 | | 6.80 | | 1.34 | |
U.S. Small/Mid Cap Value Class P | | 1,000.00 | | 697.50 | | 1,017.14 | | 6.78 | | 8.06 | | 1.59 | |
Emerging Markets Debt Class I | | 1,000.00 | | 873.40 | | 1,020.26 | | 4.57 | | 4.93 | | 0.97 | |
Emerging Markets Debt Class P | | 1,000.00 | | 872.10 | | 1,019.30 | | 5.46 | | 5.89 | | 1.16 | |
Emerging Markets Debt Class H | | 1,000.00 | | 873.00 | | 1,018.85 | | 5.89 | | 6.34 | | 1.25 | |
Emerging Markets Debt Class L | | 1,000.00 | | 871.20 | | 1,016.84 | | 7.76 | | 8.36 | | 1.65 | |
* | Expenses are calculated using each Portfolio Class’ annualized net expense ratio (as disclosed), multiplied by the average account value over the period, and multiplied by 184/366 (to reflect the most recent one-half year period). |
** | Expenses are calculated using each Portfolio Class’ annualized net expense ratio (as disclosed), multiplied by the average account value over the period, and multiplied by 72/366 (to reflect the most recent one-half year period). |
2008 Annual Report | |
| |
December 31, 2008 | |
Investment Overview (unaudited)
Active International Allocation Portfolio
The Active International Allocation Portfolio (the “Portfolio”) seeks long-term capital appreciation by investing primarily, in accordance with country and sector weightings determined by the Adviser, in equity securities of non-U.S. issuers which, in the aggregate, replicate broad market indices.
Foreign investing involves certain risks, including currency fluctuations and controls, restrictions on foreign investments, less governmental supervision and regulation, less liquidity and the potential for market volatility and political instability. The risks of investing in emerging-market countries are greater than the risks generally associated with foreign investments.
Performance
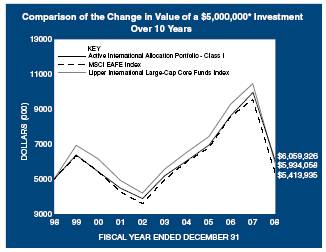
For the year ended December 31, 2008, the Portfolio had a total return based on net asset value and reinvestment of distributions per share of -39.25%, net of fees, for Class I shares. The Portfolio’s Class I shares outperformed against its benchmark, the Morgan Stanley Capital International (MSCI) EAFE Index (the “Index”) which returned -43.38%.
Factors Affecting Performance
· The value destruction of 2008 was mitigated slightly in the month of December by a 6% rise in international equities (as measured by the MSCI EAFE Index). This did little to soften the 2008 returns however, with the Index down 43.38% in U.S. dollar terms. Regional returns (as measured by the Index) in U.S. dollars were roughly: Japan, -29%; Europe, -46%; Asia ex-Japan, -50% and the emerging markets, -53%. Sector performance for the year was entirely negative, as follows: health care, -18%; utilities, -28%; consumer staples, -31%; information technology, -45%; industrials, -44%, materials, -52%; and financials, -55%. There were huge and divergent currency moves relative to the U.S. dollar for the year, with the Japanese yen up 23%, while the euro lost 5% and the British pound collapsed 28%.
· Relative to the Index, the Portfolio’s outperformance was due to its underweight position in financials. However, this was slightly offset by an overweight to technology. We positioned the Portfolio cyclically in the first half of the year and more defensively in the latter half. On average, the Portfolio held approximately 6% cash in the second half, which we reduced to about 3% during December, due to the oversold condition of the market.
Management Strategies
· Economic reports continue to confirm the worst global, synchronized slowdown in at least three decades. Along with a plunge in industrial activity, global business surveys collapsed, and consumers in Europe, Japan and the U.S. drastically reduced spending. In our view, keeping hope and confidence alive is vital to putting a floor under this recession. The good news is that the global authorities have started to implement massive fiscal stimulus and slash taxes and short-term interest rates and that the cost of gasoline has fallen sharply. Equally important, we think, was the U.S. Federal Reserve’s decision to buy $500-$600 billion of mortgage debt directly from the Government Sponsored Enterprises (GSEs) and $200-$300 billion of asset-backed securities to support consumer lending. Federal Reserve Chairman Bernanke also said the Fed is open to buying longer-dated Treasuries and even corporate debt.
· Resolutions of every prior major banking crisis were elusive, until bad assets were removed (or written off) from the banks’ balance sheets. This has not completely happened yet in the U.S. and Europe. Many of the bad assets are synthetic, leveraged instruments collateralized by mortgages, consumer loans, and commercial real estate. Because the reasonable price of these assets is unknowable until the extent of the economic downturn and the medium-term cost of capital is clearer, sellers are reluctant to sell, and buyers are not buying. Private equity firms are under pressure to spend their funds on working capital, rather than acquisitions; sovereign wealth funds need to conserve capital for domestic purposes; and distressed bond funds are still only picking at the margin. Everything governments and central banks have done to encourage the pricing and clearing of these assets (including TARP) has been helpful but up to now, insufficient in our view. That said, governments and central banks have so far been able to buy time as they wind down the shadow banking system and work to repair the financial system and credit conduits.
· As we look out on the prospects for 2009, there is virtually no clarity yet on economic growth for 2009 and 2010. Large swathes of the credit markets, while better, are still not functioning and toxic assets remain on bank balance sheets. In our view, without the availability of credit, the economy, and therefore equities, will not be able to decisively sustain a recovery.
| 2008 Annual Report |
| |
| December 31, 2008 |
Investment Overview (cont’d)
Active International Allocation Portfolio
· That said, we believe equity markets are oversold and prone to sharp tactical rallies, as the economic, fiscal and monetary news unfolds. Our work shows us that equity valuations are reasonably priced, but not necessarily cheap, given the level of economic and financial distress. We remain cautious.
* Minimum Investment
In accordance with SEC regulations, Portfolio’s performance shown assumes that all recurring fees (including management fees) were deducted and all dividends and distributions were reinvested. The performance of Class P shares will vary from the Class I shares based upon their different inception dates and will be negatively impacted by additional fees assessed to that class.
Performance Compared to the Morgan Stanley Capital International (MSCI) EAFE Index(1) and the Lipper International Large-Cap Core Funds Index(2)
| | Total Returns(3) | |
| | | | Average Annual | |
| | One | | Five | | Ten | | Since | |
| | Year | | Years | | Years | | Inception(6) | |
| | | | | | | | | |
Portfolio — Class I (4) | | (39.25 | )% | 3.13 | % | 1.94 | % | 5.28 | % |
MSCI EAFE Index | | (43.38 | ) | 1.66 | | 0.80 | | 4.33 | |
Lipper International Large-Cap Core Funds Index | | (43.31 | ) | 1.26 | | 1.73 | | 5.78 | |
| | | | | | | | | |
Portfolio — Class P (5) | | (39.41 | ) | 2.86 | | 1.63 | | 4.07 | |
MSCI EAFE Index | | (43.38 | ) | 1.66 | | 0.80 | | 2.63 | |
Lipper International Large-Cap Core Funds Index | | (43.31 | ) | 1.26 | | 1.73 | | 4.18 | |
| | | | | | | | | | |
Performance data quoted represents past performance, which is no guarantee of future results, and current performance may be lower or higher than the figures shown. Performance assumes that all dividends and distributions, if any, were reinvested. For the most recent month-end performance figures, please visit www.morganstanley.com/msim. Investment return and principal value will fluctuate so that Portfolio shares, when redeemed, may be worth more or less than their original cost. Total returns do not reflect the deduction of taxes that a shareholder would pay on Portfolio distributions or the redemption of Portfolio shares. Performance of share classes will vary due to difference in expenses.
(1) | | The Morgan Stanley Capital International (MSCI) EAFE Index (Europe, Australasia, Far East) is a free float-adjusted market capitalization index that is designed to measure the international equity market performance of developed markets, excluding the US & Canada. The term “free float” represents the portion of shares outstanding that are deemed to be available for purchase in the public equity markets by investors. The MSCI EAFE Index currently consists of 21 developed market country indices. The performance of the Index is listed in U.S. dollars and assumes reinvestment of net dividends. The Index is unmanaged and its returns do not include any sales charges or fees. Such costs would lower performance. It is not possible to invest directly in an index. |
(2) | | The Lipper International Large-Cap Core Funds Index is an equally weighted performance index of the largest qualifying funds (based on net assets) in the Lipper International Large-Cap Core Funds classification. The Index, which is adjusted for capital gains distributions and income dividends, is unmanaged and should not be considered an investment. There are currently 30 funds represented in this Index. As of the date of this report, the Portfolio was in the Lipper International Large-Cap Core Funds classification. |
(3) | | Total returns for the Portfolio reflect fees waived and expenses reimbursed, if applicable, by the Adviser. Without such waivers and reimbursements, total returns would have been lower. Fee waivers and/or expense reimbursements are voluntary and the Adviser reserves the right to commence or terminate any waiver and/or reimbursement at any time. |
(4) | | Commenced operations on January 17, 1992 |
(5) | | Commenced operations on January 2, 1996 |
(6) | | For comparative purposes, average annual since inception returns listed for the Indexes refer to the inception date or initial offering of the respective share class of the Portfolio, not the inception of the Index. |
Portfolio Composition**
| | Percentage of | |
Classification | | Total Investments | |
Pharmaceuticals | | 11.0 | % |
Oil, Gas & Consumable Fuels | | 8.2 | |
Commercial Banks | | 7.8 | |
Food Products | | 5.6 | |
Other*** | | | 67.4 | |
Total Investments | | | 100.0 | % |
** | Percentages indicated are based upon total investments (excluding Securities held as collateral on Loaned Securities) as of December 31, 2008. |
*** | Industries which do not appear in the above table, as well as those which represent less than 5% of total investments, if applicable, are included in the category labeled “Other”. |
2008 Annual Report | |
| |
December 31, 2008 | |
Portfolio of Investments
Active International Allocation Portfolio
| | | | Value | |
| | Shares | | (000) | |
Common Stocks (97.0%) | | | | | |
Australia (2.0%) | | | | | |
AGL Energy Ltd. | | 13,793 | | $ 147 | |
Alumina Ltd. | | 37,564 | | 37 | |
Amcor Ltd. | | 42,601 | | 173 | |
AMP Ltd. | | 50,078 | | 190 | |
Ansell Ltd. (c) | | 2,311 | | 20 | |
Aristocrat Leisure Ltd. | | 5,302 | | 15 | |
Asciano Group | | 14,978 | | 16 | |
ASX Ltd. | | 2,832 | | 66 | |
Australia & New Zealand Banking Group Ltd. | | 39,773 | | 427 | |
AXA Asia Pacific Holdings Ltd. | | 15,474 | | 54 | |
Bendigo & Adelaide Bank Ltd. | | 4,692 | | 36 | |
BHP Billiton Ltd. | | 105,286 | | 2,217 | |
Billabong International Ltd. | | 2,929 | | 16 | |
BlueScope Steel Ltd. | | 24,370 | | 60 | |
Boart Longyear Group | | 25,056 | | 4 | |
Boral Ltd. (c) | | 29,092 | | 94 | |
Brambles Ltd. | | 35,595 | | 185 | |
Caltex Australia Ltd. (c) | | 11,082 | | 56 | |
CFS Retail Property Trust REIT (c) | | 29,725 | | 39 | |
Coca-Cola Amatil Ltd. | | 16,092 | | 104 | |
Cochlear Ltd. | | 924 | | 36 | |
Commonwealth Bank of Australia | | 26,065 | | 528 | |
Computershare Ltd. | | 8,016 | | 44 | |
Crown Ltd. | | 7,679 | | 32 | |
CSL Ltd. | | 13,430 | | 317 | |
CSR Ltd. (c) | | 50,798 | | 63 | |
Dexus Property Group REIT | | 45,764 | | 27 | |
Fairfax Media Ltd. (c) | | 37,059 | | 43 | |
Fortescue Metals Group Ltd. (a)(c) | | 23,253 | | 32 | |
Foster’s Group Ltd. | | 57,016 | | 219 | |
Goodman Fielder Ltd. | | 22,864 | | 21 | |
Goodman Group REIT | | 35,527 | | 19 | |
GPT Group REIT | | 72,261 | | 47 | |
Harvey Norman Holdings Ltd. (c) | | 8,905 | | 17 | |
Incitec Pivot Ltd. | | 21,387 | | 38 | |
Insurance Australia Group Ltd. | | 53,694 | | 146 | |
James Hardie Industries N.V. (c) | | 23,021 | | 75 | |
Leighton Holdings Ltd. (c) | | 5,464 | | 106 | |
Lend Lease Corp. Ltd. | | 11,733 | | 59 | |
Lion Nathan Ltd. | | 4,844 | | 28 | |
Macquarie Airports | | 11,500 | | 19 | |
Macquarie Group Ltd. (c) | | 7,701 | | 157 | |
Macquarie Infrastructure Group | | 70,911 | | 85 | |
Macquarie Office Trust REIT | | 34,843 | | 6 | |
Metcash Ltd. | | 13,117 | | 40 | |
Mirvac Group REIT | | 18,051 | | 16 | |
National Australia Bank Ltd. (c) | | 32,949 | | 483 | |
Newcrest Mining Ltd. | | 14,215 | | 337 | |
OneSteel Ltd. | | 26,367 | | 46 | |
Orica Ltd. | | 15,355 | | 151 | |
Origin Energy Ltd. | | 25,507 | | 288 | |
OZ Minerals Ltd. (c)(d) | | 54,866 | | | 23 | |
Paladin Energy Ltd. (a) | | 10,336 | | 18 | |
PaperlinX Ltd. | | 14,803 | | 7 | |
Perpetual Ltd. | | 681 | | 18 | |
Qantas Airways Ltd. | | 15,466 | | 28 | |
QBE Insurance Group Ltd. (c) | | 24,116 | | 438 | |
Rio Tinto Ltd. (c) | | 9,106 | | 244 | |
Santos Ltd. | | 18,197 | | 190 | |
Sims Metal Management Ltd. | | 2,800 | | 34 | |
Sonic Healthcare Ltd. | | 7,528 | | 77 | |
Stockland REIT | | 27,296 | | 79 | |
Suncorp-Metway Ltd. | | 24,003 | | 142 | |
TABCORP Holdings Ltd. | | 14,239 | | 70 | |
Tatts Group Ltd. | | 18,850 | | 37 | |
Telstra Corp. Ltd. | | 99,265 | | 266 | |
Toll Holdings Ltd. (c) | | 15,272 | | 66 | |
Transurban Group (c) | | 29,438 | | 113 | |
Virgin Blue Holdings Ltd. | | 12,474 | | 3 | |
Wesfarmers Ltd. | | 24,285 | | 307 | |
Wesfarmers Ltd. PPS | | 7,385 | | 93 | |
Westfield Group REIT | | 31,278 | | 288 | |
Westpac Banking Corp. | | 49,286 | | 587 | |
Woodside Petroleum Ltd. | | 15,968 | | 412 | |
Woolworths Ltd. | | 34,418 | | 642 | |
WorleyParsons Ltd. | | 2,684 | | 27 | |
| | | | 11,690 | |
Austria (0.0%) | | | | | |
Erste Group Bank AG (c) | | 205 | | 5 | |
Belgium (0.4%) | | | | | |
Anheuser-Busch InBev N.V. (c) | | 28,900 | | 670 | |
Anheuser-Busch InBev N.V. VVPR (a) | | 17,784 | | — | @ |
Belgacom S.A. (c) | | 8,877 | | 339 | |
Groupe Bruxelles Lambert S.A. (c) | | 4,777 | | 380 | |
KBC Groep N.V. | | 8,099 | | 245 | |
Nationale a Portefeuille | | 2,339 | | 114 | |
Solvay S.A., Class A (c) | | 3,665 | | 272 | |
UCB S.A. (c) | | 8,995 | | 293 | |
Umicore (c) | | 7,660 | | 151 | |
| | | | 2,464 | |
Brazil (0.2%) | | | | | |
All America Latina Logistica S.A. | | 43,200 | | 193 | |
Banco do Brasil S.A. | | 34,500 | | 224 | |
Cia Energetica de Minas Gerais S.A. (Preference) | | 1 | | — | @ |
Cyrela Brazil Realty S.A. | | 42,900 | | 173 | |
Cyrela Commercial Properties S.A. Empreendimentos e Participacoes | | 8,580 | | 22 | |
Lojas Renner S.A. | | 29,100 | | 199 | |
Perdigao S.A. (a) | | 21,300 | | 277 | |
Sadia S.A. (Preference) | | 76,877 | | 125 | |
| | | | 1,213 | |
| | | | | | |
10 | The accompanying notes are an integral part of the financial statements. | |
| 2008 Annual Report |
| |
| December 31, 2008 |
Portfolio of Investments (cont’d)
Active International Allocation Portfolio
| | | | Value | |
| | Shares | | (000) | |
Denmark (0.6%) | | | | | |
AP Moller - Maersk A/S | | 76 | | $ 407 | |
DSV A/S | | 11,750 | | 128 | |
GN Store Nord A/S (a) | | 25,467 | | 50 | |
Novo-Nordisk A/S, Class B | | 40,029 | | 2,037 | |
Novozymes A/S, Class B | | 2,864 | | 228 | |
Vestas Wind Systems A/S (a) | | 9,602 | | 571 | |
| | | | 3,421 | |
Finland (1.2%) | | | | | |
Fortum Oyj (c) | | 27,278 | | 586 | |
Kesko Oyj, Class B (c) | | 13,895 | | 348 | |
Kone Oyj, Class B (c) | | 8,819 | | 193 | |
Metso Oyj (c) | | 8,674 | | 105 | |
Neste Oil Oyj (c) | | 8,252 | | 123 | |
Nokia Oyj (c) | | 272,204 | | 4,220 | |
Outokumpu Oyj | | 9,991 | | 117 | |
Rautaruukki Oyj (c) | | 5,946 | | 103 | |
Sampo Oyj, Class A | | 17,422 | | 326 | |
Stora Enso Oyj, Class R (c) | | 42,157 | | 329 | |
UPM-Kymmene Oyj | | 36,668 | | 465 | |
Wartsila Oyj (c) | | 3,594 | | 107 | |
| | | | 7,022 | |
France (10.5%) | | | | | |
Accor S.A. (c) | | 13,357 | | 657 | |
Air Liquide S.A. (c) | | 21,898 | | 2,004 | |
Alcatel-Lucent (a)(c) | | 130,864 | | 283 | |
Alstom (c) | | 15,984 | | 944 | |
ArcelorMittal (c) | | 62,821 | | 1,514 | |
Atos Origin S.A. | | 2,078 | | 52 | |
AXA S.A. (c) | | 70,219 | | 1,566 | |
BNP Paribas | | 53,510 | | 2,260 | |
Bouygues | | 35,272 | | 1,493 | |
Cap Gemini S.A. (c) | | 13,103 | | 505 | |
Carrefour S.A. (c) | | 90,417 | | 3,472 | |
Casino Guichard Perrachon S.A. (c) | | 10,592 | | 806 | |
Cie de Saint-Gobain (c) | | 18,240 | | 860 | |
Cie Generale d’Optique Essilor International S.A. (c) | | 18,913 | | 887 | |
CNP Assurances | | 2,798 | | 203 | |
Compagnie Generale des Etablissements Michelin, Class B (c) | | 5,304 | | 278 | |
Credit Agricole S.A. | | 34,143 | | 388 | |
Dassault Systemes S.A. (c) | | 5,663 | | 256 | |
Electricite de France | | 187 | | 11 | |
Eurazeo | | 1,498 | | 70 | |
European Aeronautic Defense & Space Co. N.V. (c) | | 14,653 | | 247 | |
France Telecom S.A. (c) | | 169,302 | | 4,736 | |
GDF Suez S.A. (c) | | 51,961 | | 2,573 | |
Groupe Danone (c) | | 32,872 | | 1,984 | |
Hermes International (c) | | 4,191 | | 585 | |
Imerys S.A. | | 2,425 | | 110 | |
Lafarge S.A. (c) | | 13,126 | | 798 | |
Lagardere S.C.A. (c) | | 11,315 | | 459 | |
L’Oreal S.A. (c) | | 12,243 | | 1,064 | |
LVMH Moet Hennessy Louis Vuitton S.A. (c) | | 16,196 | | 1,088 | |
Neopost S.A. | | 2,954 | | 267 | |
Pernod-Ricard S.A. (c) | | 3,180 | | 236 | |
Peugeot S.A. (c) | | 5,883 | | 100 | |
PPR (c) | | 3,223 | | 211 | |
Publicis Groupe (c) | | 5,491 | | 141 | |
Renault S.A. (c) | | 6,055 | | 158 | |
Safran S.A. | | 4,812 | | 65 | |
Sanofi-Aventis S.A. (c) | | 103,353 | | 6,564 | |
Schneider Electric S.A. (c) | | 26,873 | | 2,007 | |
SCOR SE | | 4,069 | | 94 | |
Societe BIC S.A. | | 1,790 | | 103 | |
Societe Generale | | 20,040 | | 1,015 | |
Societe Television Francaise 1 (c) | | 12,949 | | 189 | |
Sodexo (c) | | 6,417 | | 355 | |
Technip S.A. (c) | | 9,503 | | 291 | |
Thales S.A. (c) | | 6,584 | | 275 | |
Total S.A. (c) | | 190,600 | | 10,391 | |
Unibail-Rodamco REIT | | 67 | | 10 | |
Valeo S.A. (c) | | 5,824 | | 87 | |
Vallourec | | 2,485 | | 283 | |
Veolia Environnement (c) | | 49,288 | | 1,547 | |
Vinci S.A. | | 16,850 | | 710 | |
Vivendi (c) | | 94,582 | | 3,079 | |
Zodiac S.A. | | 774 | | 28 | |
| | | | 60,359 | |
Germany (8.8%) | | | | | |
Adidas AG (c) | | 12,872 | | 495 | |
Allianz SE (Registered) (c) | | 18,800 | | 2,017 | |
BASF AG (c) | | 85,333 | | 3,372 | |
Bayer AG (c) | | 58,974 | | 3,464 | |
Bayerische Motoren Werke AG (c) | | 340 | | 11 | |
Beiersdorf AG (c) | | 11,711 | | 697 | |
Celesio AG (c) | | 6,826 | | 186 | |
Commerzbank AG (c) | | 18,707 | | 178 | |
Daimler AG (c) | | 52,640 | | 2,000 | |
Deutsche Bank AG (Registered) (c) | | 14,584 | | 582 | |
Deutsche Boerse AG (c) | | 19,320 | | 1,407 | |
Deutsche Lufthansa AG (Registered) | | 14,582 | | 231 | |
Deutsche Post AG (Registered) (c) | | 46,451 | | 786 | |
Deutsche Postbank AG (c) | | 3,501 | | 77 | |
Deutsche Telekom AG (c) | | 237,372 | | 3,607 | |
E.ON AG (c) | | 221,594 | | 8,961 | |
Fresenius Medical Care AG & Co. KGaA (c) | | 16,666 | | 782 | |
Henkel KGaA (Non-Voting Shares) (c) | | 17,347 | | 556 | |
Hochtief AG | | 3,004 | | 152 | |
Infineon Technologies AG (a)(c) | | 36,889 | | 51 | |
K&S AG (c) | | 21,305 | | 1,223 | |
Linde AG (c) | | 8,476 | | 717 | |
MAN AG | | 7,562 | | 417 | |
Merck KGaA | | 5,489 | | 499 | |
| The accompanying notes are an integral part of the financial statements. | 11 |
2008 Annual Report | |
|
December 31, 2008 |
Portfolio of Investments (cont’d)
Active International Allocation Portfolio
| | | | Value | |
| | Shares | | (000) | |
Germany (cont’d) | | | | | |
Metro AG (c) | | 26,325 | | $ 1,067 | |
Muenchener Rueckversicherungs AG (Registered) (c) | | 9,485 | | 1,491 | |
Porsche Automobil Holding SE (Non-Voting Shares) (c) | | 7,903 | | 616 | |
Puma AG Rudolf Dassler Sport | | 571 | | 113 | |
RWE AG (c) | | 47,334 | | 4,255 | |
RWE AG (Non-Voting Shares) | | 3,634 | | 275 | |
SAP AG (c) | | 79,020 | | 2,832 | |
Siemens AG (Registered) (c) | | 46,346 | | 3,471 | |
Suedzucker AG (c) | | 9,046 | | 138 | |
ThyssenKrupp AG (c) | | 22,339 | | 604 | |
TUI AG (c) | | 9,833 | | 112 | |
Volkswagen AG | | 7,913 | | 2,772 | |
Volkswagen AG (Non-Voting Shares) (c) | | 6,000 | | 320 | |
| | | | 50,534 | |
Greece (0.3%) | | | | | |
Alpha Bank A.E. | | 32,683 | | 307 | |
EFG Eurobank Ergasias S.A. | | 23,085 | | 183 | |
National Bank of Greece S.A. | | 42,489 | | 787 | |
OPAP S.A. | | 9,540 | | 275 | |
Piraeus Bank S.A. | | 26,875 | | 242 | |
Titan Cement Co., S.A. | | 3,950 | | 76 | |
| | | | 1,870 | |
Hong Kong (2.5%) | | | | | |
Agile Property Holdings Ltd. | | 291,280 | | 154 | |
Bank of East Asia Ltd. | | 119,000 | | 251 | |
BOC Hong Kong Holdings Ltd. | | 327,000 | | 373 | |
Cathay Pacific Airways Ltd. | | 112,000 | | 126 | |
Chaoda Modern Agriculture Holdings Ltd. (c) | | 176,904 | | 114 | |
Cheung Kong Holdings Ltd. | | 113,000 | | 1,077 | |
Cheung Kong Infrastructure Holdings Ltd. | | 38,000 | | 143 | |
China Resources Enterprise Ltd. (c) | | 102,000 | | 179 | |
China Resources Land Ltd. | | 145,000 | | 179 | |
China Travel International Investment Hong Kong Ltd. (c) | | 768,000 | | 151 | |
Chow Sang Sang Holdings | | 57,438 | | 30 | |
CLP Holdings Ltd. (c) | | 156,000 | | 1,061 | |
Daphne International Holdings Ltd. (c) | | 321,200 | | 53 | |
Esprit Holdings Ltd. | | 94,600 | | 539 | |
Hang Lung Group Ltd. | | 68,000 | | 208 | |
Hang Lung Properties Ltd. (c) | | 320,500 | | 703 | |
Hang Seng Bank Ltd. (c) | | 70,900 | | 936 | |
Henderson Land Development Co., Ltd. | | 90,000 | | 336 | |
Hong Kong & China Gas Co., Ltd. (c) | | 330,000 | | 500 | |
Hong Kong Exchanges & Clearing Ltd. | | 82,400 | | 790 | |
HongKong Electric Holdings | | 100,000 | | 563 | |
Hopewell Holdings Ltd. | | 50,000 | | 165 | |
Hutchison Telecommunications International Ltd. | | 115,000 | | 31 | |
Hutchison Whampoa Ltd. | | 183,000 | | 923 | |
Hysan Development Co., Ltd. | | 45,000 | | 73 | |
Kerry Properties Ltd. | | 65,000 | | 175 | |
Li & Fung Ltd. (c) | | 332,000 | | 573 | |
Li Ning Co. Ltd. (c) | | 94,000 | | 148 | |
Link (The) REIT | | 151,000 | | 251 | |
MTR Corp. (c) | | 119,500 | | 279 | |
New World China Land Ltd. | | 271,600 | | 83 | |
New World Development Ltd. | | 209,000 | | 214 | |
Noble Group Ltd. | | 173,000 | | 124 | |
NWS Holdings Ltd. | | 12,000 | | 18 | |
PCCW Ltd. (c) | | 242,000 | | 116 | |
Rexcapital Financial Holdings Ltd. (a) | | 891,948 | | 22 | |
Shangri-La Asia Ltd. | | 6,000 | | 7 | |
Sino Land Co. | | 144,000 | | 150 | |
Sun Hung Kai Properties Ltd. | | 129,500 | | 1,089 | |
Swire Pacific Ltd., Class A | | 65,000 | | 451 | |
Wharf Holdings Ltd. | | 115,000 | | 318 | |
Wheelock & Co., Ltd. | | 82,000 | | 182 | |
Wing Hang Bank Ltd. | | 15,000 | | 87 | |
Yue Yuen Industrial Holdings Ltd. | | 54,000 | | 107 | |
| | | | 14,052 | |
Indonesia (0.1%) | | | | | |
Astra International Tbk PT | | 258,000 | | 260 | |
Ireland (0.1%) | | | | | |
CRH plc | | 554 | | 14 | |
Experian plc | | 35,818 | | 224 | |
| | | | 238 | |
Italy (0.7%) | | | | | |
Alleanza Assicurazioni S.p.A. | | 10,973 | | 89 | |
Assicurazioni Generali S.p.A. | | 31,368 | | 860 | |
Banco Popolare S.C. | | 441 | | 3 | |
Enel S.p.A. | | 3,756 | | 24 | |
ENI S.p.A. | | 37,836 | | 897 | |
Intesa Sanpaolo S.p.A. | | 462,253 | | 1,665 | |
Telecom Italia S.p.A. | | 10,225 | | 17 | |
UniCredit S.p.A. | | 200,060 | | 498 | |
Unione di Banche Italiane SCPA | | 468 | | 7 | |
| | | | 4,060 | |
Japan (29.8%) | | | | | |
77 Bank Ltd. (The) | | 76,000 | | 413 | |
Acom Co., Ltd. (c) | | 2,980 | | 125 | |
Advantest Corp. (c) | | 18,390 | | 298 | |
Aeon Co., Ltd. (c) | | 45,700 | | 458 | |
Aeon Credit Service Co., Ltd. | | 3,600 | | 38 | |
Aeon Mall Co., Ltd. | | 400 | | 8 | |
Aiful Corp. (c) | | 2,500 | | 7 | |
Aioi Insurance Co., Ltd. | | 3,000 | | 16 | |
Ajinomoto Co., Inc. (c) | | 73,400 | | 800 | |
Alps Electric Co., Ltd. | | 16,000 | | 78 | |
Amada Co., Ltd. | | 28,000 | | 135 | |
Aozora Bank Ltd. | | 3,100 | | 3 | |
Asahi Breweries Ltd. | | 22,600 | | 389 | |
Asahi Glass Co., Ltd. | | 123,800 | | 703 | |
Asahi Kasei Corp. | | 121,000 | | 532 | |
12 | The accompanying notes are an integral part of the financial statements. | |
| 2008 Annual Report |
| |
| December 31, 2008 |
Portfolio of Investments (cont’d)
Active International Allocation Portfolio
| | | | Value | |
| | Shares | | (000) | |
Japan (cont’d) | | | | | |
Asatsu-DK, Inc. (c) | | 3,600 | | $ 81 | |
Astellas Pharma, Inc. | | 46,700 | | 1,900 | |
Bank of Kyoto Ltd. (The) (c) | | 29,000 | | 325 | |
Bank of Yokohama Ltd. (The) | | 180,000 | | 1,065 | |
Benesse Corp. | | 5,900 | | 258 | |
Bridgestone Corp. (c) | | 91,000 | | 1,367 | |
Canon, Inc. | | 96,300 | | 3,023 | |
Casio Computer Co., Ltd. | | 38,500 | | 242 | |
Central Japan Railway Co. | | 150 | | 1,296 | |
Chiba Bank Ltd. (The) | | 77,000 | | 481 | |
Chiyoda Corp. | | 20,000 | | 111 | |
Chubu Electric Power Co., Inc. | | 55,600 | | 1,690 | |
Chugai Pharmaceutical Co., Ltd. | | 24,507 | | 474 | |
Chuo Mitsui Trust Holdings, Inc. | | 62,545 | | 306 | |
Citizen Holdings Co., Ltd. (c) | | 32,800 | | 119 | |
Coca-Cola West Co., Ltd. (c) | | 700 | | 15 | |
COMSYS Holdings Corp. (c) | | 17,000 | | 158 | |
Credit Saison Co., Ltd. | | 6,700 | | 92 | |
CSK Holdings Corp. (c) | | 7,100 | | 39 | |
Dai Nippon Printing Co., Ltd. | | 44,600 | | 492 | |
Daicel Chemical Industries Ltd. (c) | | 15,000 | | 71 | |
Daiichi Sankyo Co., Ltd. | | 63,400 | | 1,507 | |
Daikin Industries Ltd. (c) | | 17,800 | | 469 | |
Dainippon Ink & Chemicals, Inc. | | 66,000 | | 138 | |
Daito Trust Construction Co., Ltd. | | 16,500 | | 864 | |
Daiwa House Industry Co., Ltd. (c) | | 85,600 | | 838 | |
Daiwa Securities Group, Inc. | | 186,000 | | 1,108 | |
Denki Kagaku Kogyo KK | | 42,000 | | 103 | |
Denso Corp. | | 65,350 | | 1,087 | |
Dowa Holdings, Co., Ltd. (c) | | 57,000 | | 210 | |
East Japan Railway Co. | | 369 | | 2,882 | |
Ebara Corp. (c) | | 32,800 | | 76 | |
Eisai Co., Ltd. | | 21,802 | | 903 | |
FamilyMart Co., Ltd. | | 5,900 | | 256 | |
Fanuc Ltd. (c) | | 18,500 | | 1,316 | |
Fast Retailing Co., Ltd. | | 9,000 | | 1,312 | |
Fuji Electric Holdings Co., Ltd. (c) | | 15,000 | | 23 | |
Fuji Media Holdings, Inc. | | 36 | | 51 | |
Fuji Soft, Inc. (c) | | 3,500 | | 74 | |
FUJIFILM Holdings Corp. | | 45,700 | | 1,006 | |
Fujikura Ltd. | | 24,000 | | 79 | |
Fujitsu Ltd. (c) | | 172,200 | | 832 | |
Fukuoka Financial Group, Inc. | | 105,000 | | 457 | |
Furukawa Electric Co., Ltd. (c) | | 58,800 | | 286 | |
Gunma Bank Ltd. (The) | | 3,000 | | 19 | |
H2O Retailing Corp. (c) | | 10,000 | | 75 | |
Hachijuni Bank Ltd. (The) | | 3,000 | | 17 | |
Hirose Electric Co., Ltd. (c) | | 2,800 | | 283 | |
Hiroshima Bank Ltd. (The) | | 5,000 | | 22 | |
Hitachi Construction Machinery Co., Ltd. (c) | | 3,100 | | 37 | |
Hitachi Ltd. | | 313,000 | | 1,214 | |
Hokkaido Electric Power Co., Inc. (c) | | 11,000 | | 278 | |
Hokuhoku Financial Group, Inc. | | 199,000 | | 471 | |
Honda Motor Co., Ltd. | | 155,204 | | 3,366 | |
Hoya Corp. (c) | | 38,600 | | 671 | |
Ibiden Co., Ltd. (c) | | 11,200 | | 231 | |
IHI Corp. (c) | | 102,000 | | 129 | |
INPEX Corp. | | 47 | | 371 | |
Isetan Mitsukoshi Holdings Ltd. (a) | | 31,680 | | 273 | |
IT Holdings Corp. (a) | | 3,304 | | 51 | |
Ito En Ltd. (c) | | 2,100 | | 31 | |
Ito En Ltd. (Preference) | | 630 | | 6 | |
Itochu Corp. | | 164,000 | | 823 | |
Itochu Techno-Solutions Corp. (c) | | 2,900 | | 71 | |
J Front Retailing Co., Ltd. | | 38,000 | | 157 | |
Jafco Co., Ltd. | | 300 | | 8 | |
Japan Airlines Corp. (a)(c) | | 89,000 | | 211 | |
Japan Prime Realty Investment Corp. REIT | | 3 | | 7 | |
Japan Real Estate Investment Corp. REIT | | 53 | | 476 | |
Japan Retail Fund Investment Corp. REIT | | 48 | | 208 | |
Japan Tobacco, Inc. | | 392 | | 1,298 | |
JFE Holdings, Inc. (c) | | 37,500 | | 992 | |
JGC Corp. | | 26,000 | | 391 | |
Joyo Bank Ltd. (The) | | 139,000 | | 792 | |
JS Group Corp. | | 24,500 | | 379 | |
JSR Corp. (c) | | 14,800 | | 167 | |
Kajima Corp. | | 127,400 | | 446 | |
Kamigumi Co., Ltd. (c) | | 1,000 | | 9 | |
Kaneka Corp. | | 24,000 | | 153 | |
Kansai Electric Power Co., Inc. (The) | | 79,400 | | 2,301 | |
Kao Corp. | | 59,000 | | 1,787 | |
Kawasaki Heavy Industries Ltd. (c) | | 102,000 | | 207 | |
Kawasaki Kisen Kaisha Ltd. (c) | | 6,000 | | 28 | |
Keihin Electric Express Railway Co., Ltd. (c) | | 39,000 | | 344 | |
Keio Corp. (c) | | 24,000 | | 144 | |
Keyence Corp. | | 3,300 | | 676 | |
Kikkoman Corp. | | 12,000 | | 142 | |
Kinden Corp. | | 1,000 | | 9 | |
Kintetsu Corp. (c) | | 171,200 | | 787 | |
Kirin Brewery Co., Ltd. | | 55,400 | | 730 | |
Kobe Steel Ltd. (c) | | 189,000 | | 348 | |
Kokuyo Co., Ltd. | | 6,600 | | 48 | |
Komatsu Ltd. | | 108,300 | | 1,372 | |
Konami Corp. (c) | | 9,900 | | 255 | |
Konica Minolta Holdings, Inc. | | 42,500 | | 329 | |
Kubota Corp. | | 148,000 | | 1,064 | |
Kuraray Co., Ltd. | | 34,000 | | 265 | |
Kurita Water Industries Ltd. (c) | | 6,500 | | 175 | |
Kyocera Corp. | | 15,200 | | 1,096 | |
Kyowa Hakko Kogyo Co., Ltd. | | 28,028 | | 293 | |
Kyushu Electric Power Co., Inc. | | 34,600 | | 920 | |
Lawson, Inc. | | 5,600 | | 323 | |
Leopalace21 Corp. | | 12,300 | | 125 | |
Mabuchi Motor Co., Ltd. (c) | | 2,900 | | 120 | |
Marubeni Corp. | | 222,000 | | 846 | |
| The accompanying notes are an integral part of the financial statements. | 13 |
2008 Annual Report
December 31, 2008
Portfolio of Investments (cont’d)
Active International Allocation Portfolio
| | | | Value | |
| | Shares | | (000) | |
Japan (cont’d) | | | | | |
Marui Group Co., Ltd. | | 41,100 | | $ 239 | |
Matsui Securities Co., Ltd. (c) | | 18,100 | | 151 | |
Meiji Dairies Corp. | | 19,000 | | 102 | |
Meiji Seika Kaisha Ltd. (c) | | 22,000 | | 106 | |
Meitec Corp. | | 2,700 | | 47 | |
Millea Holdings, Inc. | | 84,052 | | 2,463 | |
Minebea Co., Ltd. | | 35,000 | | 120 | |
Mitsubishi Chemical Holdings Corp. | | 88,500 | | 391 | |
Mitsubishi Corp. | | 146,700 | | 2,059 | |
Mitsubishi Electric Corp. | | 209,800 | | 1,313 | |
Mitsubishi Estate Co., Ltd. | | 109,000 | | 1,798 | |
Mitsubishi Heavy Industries Ltd. (c) | | 356,000 | | 1,588 | |
Mitsubishi Logistics Corp. | | 8,000 | | 101 | |
Mitsubishi Materials Corp. | | 187,000 | | 471 | |
Mitsubishi Rayon Co., Ltd. (c) | | 48,000 | | 145 | |
Mitsubishi UFJ Financial Group, Inc. (o) | | 819,746 | | 5,087 | |
Mitsubishi UFJ Lease & Finance Co., Ltd. (o) | | 600 | | 15 | |
Mitsui & Co., Ltd. | | 178,800 | | 1,829 | |
Mitsui Chemicals, Inc. (c) | | 48,000 | | 177 | |
Mitsui Fudosan Co., Ltd. | | 77,400 | | 1,286 | |
Mitsui Mining & Smelting Co., Ltd. | | 110,000 | | 232 | |
Mitsui OSK Lines Ltd. (c) | | 15,000 | | 92 | |
Mitsui Sumitomo Insurance Group Holdings, Inc. | | 41,400 | | 1,320 | |
Mizuho Financial Group, Inc. (c) | | 1,063 | | 3,164 | |
Mizuho Trust & Banking Co., Ltd. | | 6,000 | | 8 | |
Murata Manufacturing Co., Ltd. | | 18,900 | | 741 | |
Namco Bandai Holdings, Inc. (c) | | 2,400 | | 26 | |
NEC Corp. | | 186,400 | | 626 | |
NEC Electronics Corp. (a) | | 4,500 | | 42 | |
NGK Insulators Ltd. (c) | | 37,600 | | 423 | |
NGK Spark Plug Co., Ltd. (c) | | 23,000 | | 184 | |
Nidec Corp. | | 10,200 | | 397 | |
Nikon Corp. (c) | | 30,000 | | 359 | |
Nintendo Co., Ltd. | | 7,400 | | 2,843 | |
Nippon Building Fund, Inc. REIT | | 65 | | 713 | |
Nippon Electric Glass Co., Ltd. | | 29,500 | | 155 | |
Nippon Express Co., Ltd. | | 89,800 | | 378 | |
Nippon Meat Packers, Inc. | | 21,600 | | 326 | |
Nippon Mining Holdings, Inc. | | 49,500 | | 213 | |
Nippon Oil Corp. | | 157,800 | | 795 | |
Nippon Paper Group, Inc. | | 83 | | 339 | |
Nippon Sheet Glass Co., Ltd. (c) | | 41,000 | | 135 | |
Nippon Steel Corp. (c) | | 487,000 | | 1,599 | |
Nippon Telegraph & Telephone Corp. | | 284 | | 1,526 | |
Nippon Yusen KK | | 115,000 | | 709 | |
Nipponkoa Insurance Co., Ltd. | | 3,000 | | 23 | |
Nishi-Nippon City Bank Ltd. (The) | | 58,000 | | 168 | |
Nissan Chemical Industries Ltd. | | 13,000 | | 126 | |
Nissan Motor Co., Ltd. (c) | | 230,800 | | 836 | |
Nisshin Seifun Group, Inc. | | 15,000 | | 197 | |
Nisshinbo Industries, Inc. | | 7,000 | | 53 | |
Nissin Foods Holdings Co., Ltd. | | 7,400 | | 260 | |
Nitto Denko Corp. | | 20,700 | | 398 | |
Nomura Holdings, Inc. | | 262,300 | | 2,163 | |
Nomura Real Estate Holdings, Inc. (c) | | 500 | | 10 | |
Nomura Real Estate Office Fund, Inc. REIT | | 1 | | 6 | |
Nomura Research Institute Ltd. (c) | | 12,600 | | 239 | |
NSK Ltd. | | 69,000 | | 259 | |
NTN Corp. (c) | | 49,000 | | 148 | |
NTT Data Corp. | | 142 | | 570 | |
NTT DoCoMo, Inc. | | 387 | | 763 | |
NTT Urban Development Corp. | | 7 | | 8 | |
Obayashi Corp. | | 85,000 | | 507 | |
Obic Co., Ltd. | | 830 | | 136 | |
OJI Paper Co., Ltd. (c) | | 112,400 | | 661 | |
Oki Electric Industry Co., Ltd. (a)(c) | | 51,000 | | 33 | |
Okumura Corp. (c) | | 23,000 | | 116 | |
Olympus Corp. (c) | | 13,000 | | 261 | |
Omron Corp. | | 20,500 | | 275 | |
Onward Holdings Co., Ltd. | | 20,000 | | 159 | |
Oracle Corp. Japan (c) | | 3,300 | | 143 | |
Oriental Land Co., Ltd. (c) | | 6,700 | | 551 | |
ORIX Corp. | | 1,040 | | 59 | |
Osaka Gas Co., Ltd. | | 206,600 | | 954 | |
Panasonic Corp. | | 205,000 | | 2,569 | |
Panasonic Electric Works Co., Ltd. | | 30,000 | | 267 | |
Pioneer Corp. | | 16,854 | | 31 | |
Promise Co., Ltd. (c) | | 3,500 | | 89 | |
Resona Holdings, Inc. (c) | | 529 | | 839 | |
Ricoh Co., Ltd. | | 61,000 | | 777 | |
Rohm Co., Ltd. | | 13,400 | | 677 | |
Sanken Electric Co., Ltd. (c) | | 14,000 | | 55 | |
Sanyo Electric Co., Ltd. (a)(c) | | 171,000 | | 320 | |
Sapporo Hokuyo Holdings, Inc. | | 2 | | 8 | |
Sapporo Holdings Ltd. (c) | | 12,000 | | 76 | |
SBI Holdings, Inc. (c) | | 948 | | 146 | |
Secom Co., Ltd. (c) | | 17,100 | | 881 | |
Seiko Epson Corp. (c) | | 11,200 | | 178 | |
Sekisui Chemical Co., Ltd. | | 52,000 | | 325 | |
Sekisui House Ltd. | | 103,600 | | 907 | |
Seven & I Holdings Co., Ltd. (c) | | 75,200 | | 2,576 | |
Sharp Corp. (c) | | 85,200 | | 611 | |
Shimachu Co., Ltd. | | 6,300 | | 142 | |
Shimamura Co., Ltd. | | 2,400 | | 186 | |
Shimano, Inc. | | 10,200 | | 409 | |
Shimizu Corp. (c) | | 88,600 | | 517 | |
Shin-Etsu Chemical Co., Ltd. | | 39,596 | | 1,816 | |
Shinko Securities Co., Ltd. | | 67,000 | | 147 | |
Shinsei Bank Ltd. | | 168,000 | | 266 | |
Shionogi & Co., Ltd. | | 25,000 | | 642 | |
Shiseido Co., Ltd. | | 37,000 | | 757 | |
Shizuoka Bank Ltd. (The) | | 67,000 | | 776 | |
Showa Denko KK | | 59,000 | | 85 | |
Showa Shell Sekiyu KK | | 16,700 | | 165 | |
SMC Corp. | | 6,600 | | 675 | |
14 | The accompanying notes are an integral part of the financial statements. | |
| 2008 Annual Report |
| |
| December 31, 2008 |
Portfolio of Investments (cont’d)
Active International Allocation Portfolio
| | | | Value | |
| | Shares | | (000) | |
Japan (cont’d) | | | | | |
Softbank Corp. | | 94,700 | | $ 1,715 | |
Sompo Japan Insurance, Inc. | | 95,000 | | 696 | |
Sony Corp. | | 72,497 | | 1,576 | |
Sony Financial Holdings, Inc. | | 8 | | 31 | |
Stanley Electric Co., Ltd. | | 7,300 | | 77 | |
Sumitomo Chemical Co., Ltd. | | 137,600 | | 470 | |
Sumitomo Corp. (c) | | 107,500 | | 947 | |
Sumitomo Electric Industries Ltd. | | 67,200 | | 517 | |
Sumitomo Heavy Industries Ltd. | | 42,000 | | 167 | |
Sumitomo Metal Industries Ltd. | | 290,000 | | 715 | |
Sumitomo Metal Mining Co., Ltd. | | 106,800 | | 1,135 | |
Sumitomo Mitsui Financial Group, Inc. (c) | | 532 | | 2,304 | |
Sumitomo Realty & Development Co., Ltd. (c) | | 33,000 | | 492 | |
Sumitomo Trust & Banking Co., Ltd. (The) | | 143,000 | | 846 | |
Suruga Bank Ltd. | | 2,000 | | 20 | |
T&D Holdings, Inc. | | 26,050 | | 1,092 | |
Taiheiyo Cement Corp. | | 61,000 | | 118 | |
Taisei Corp. | | 122,000 | | 336 | |
Taisho Pharmaceutical Co., Ltd. | | 13,441 | | 286 | |
Taiyo Yuden Co., Ltd. | | 8,000 | | 45 | |
Takara Holdings, Inc. | | 7,000 | | 41 | |
Takashimaya Co., Ltd. | | 38,000 | | 288 | |
Takeda Pharmaceutical Co., Ltd. | | 77,000 | | 3,994 | |
Takefuji Corp. | | 4,690 | | 38 | |
TDK Corp. | | 11,700 | | 430 | |
Teijin Ltd. | | 85,400 | | 241 | |
Terumo Corp. | | 20,100 | | 941 | |
THK Co., Ltd. | | 3,900 | | 41 | |
Tobu Railway Co., Ltd. (c) | | 92,400 | | 550 | |
Toho Co., Ltd. | | 7,300 | | 157 | |
Tohoku Electric Power Co., Inc. | | 47,100 | | 1,275 | |
Tokyo Broadcasting System, Inc. | | 10,500 | | 160 | |
Tokyo Electric Power Co., Inc. (The) | | 115,600 | | 3,860 | |
Tokyo Electron Ltd. | | 20,400 | | 716 | |
Tokyo Gas Co., Ltd. | | 241,600 | | 1,224 | |
Tokyo Tatemono Co., Ltd. | | 25,000 | | 114 | |
Tokyu Corp. | | 105,400 | | 530 | |
Tokyu Land Corp. | | 2,000 | | 8 | |
TonenGeneral Sekiyu KK (c) | | 33,000 | | 330 | |
Toppan Printing Co., Ltd. | | 43,600 | | 336 | |
Toray Industries, Inc. (c) | | 121,100 | | 617 | |
Toshiba Corp. | | 268,000 | | 1,103 | |
Tosoh Corp. | | 49,000 | | 120 | |
Toto Ltd. (c) | | 49,600 | | 311 | |
Toyo Seikan Kaisha Ltd. | | 18,900 | | 326 | |
Toyoda Gosei Co., Ltd. (c) | | 800 | | 9 | |
Toyota Industries Corp. | | 9,350 | | 200 | |
Toyota Motor Corp. | | 251,000 | | 8,216 | |
Trend Micro, Inc. (a) | | 10,700 | | 374 | |
Unicharm Corp. (c) | | 4,000 | | 302 | |
UNY Co., Ltd. | | 12,000 | | 132 | |
Urban Corp. | | 1,600 | | — | @ |
Ushio, Inc. | | 4,000 | | 53 | |
USS Co., Ltd. | | 3,120 | | 165 | |
Wacoal Holdings Corp. (c) | | 7,000 | | 91 | |
West Japan Railway Co. | | 38 | | 173 | |
Yahoo! Japan Corp. (c) | | 1,691 | | 692 | |
Yakult Honsha Co., Ltd. (c) | | 10,100 | | 216 | |
Yamada Denki Co., Ltd. | | 11,320 | | 786 | |
Yamaha Corp. | | 10,200 | | 95 | |
Yamaha Motor Co., Ltd. (c) | | 3,100 | | 32 | |
Yamato Holdings Co., Ltd. | | 28,000 | | 365 | |
Yamazaki Baking Co., Ltd. (c) | | 10,000 | | 154 | |
Yokogawa Electric Corp. (c) | | 19,600 | | 129 | |
| | | | 170,702 | |
Mexico (0.2%) | | | | | |
Corp. GEO S.A.B. de C.V., Class B (a)(c) | | 91,400 | | 103 | |
Desarrolladora Homex S.A.B. de C.V. ADR (a) | | 8,600 | | 197 | |
Urbi Desarrollos Urbanos S.A.B de C.V. (a) | | 46,400 | | 63 | |
Wal-Mart de Mexico S.A.B. de C.V., Class V | | 168,417 | | 450 | |
| | | | 813 | |
Netherlands (2.4%) | | | | | |
Aegon N.V. | | 96,896 | | 618 | |
Akzo Nobel N.V. | | 15,894 | | 655 | |
ASML Holding N.V. (c) | | 31,721 | | 566 | |
Fugro N.V. CVA | | 4,917 | | 141 | |
Heineken N.V. | | 22,255 | | 684 | |
ING Groep N.V. CVA | | 86,743 | | 907 | |
Koninklijke Ahold N.V. | | 1,806 | | 22 | |
Koninklijke DSM N.V. (c) | | 9,080 | | 233 | |
Koninklijke KPN N.V. | | 138,789 | | 2,013 | |
Koninklijke Numico N.V. (a) | | 9,003 | | 688 | |
Koninklijke Philips Electronics N.V. (c) | | 50,999 | | 992 | |
Reed Elsevier N.V. | | 42,115 | | 496 | |
SBM Offshore N.V. (c) | | 12,147 | | 159 | |
TNT N.V. | | 32,654 | | 627 | |
Unilever N.V. CVA (c) | | 188,158 | | 4,559 | |
Wolters Kluwer N.V. | | 27,245 | | 515 | |
| | | | 13,875 | |
New Zealand (0.0%) | | | | | |
Telecom Corp. of New Zealand Ltd. | | 19,672 | | 26 | |
Norway (0.6%) | | | | | |
Aker Kvaerner ASA | | 13,920 | | 92 | |
DNB NOR ASA | | 22,725 | | 91 | |
Norsk Hydro ASA (c) | | 52,107 | | 210 | |
Orkla ASA (c) | | 47,680 | | 317 | |
Prosafe Production Public Ltd. (a)(c) | | 29,937 | | 48 | |
SeaDrill Ltd. (c) | | 23,700 | | 193 | |
StatoilHydro ASA | | 101,843 | | 1,677 | |
Telenor ASA (c) | | 58,103 | | 389 | |
Yara International ASA (c) | | 27,938 | | 611 | |
| | | | 3,628 | |
| The accompanying notes are an integral part of the financial statements. | 15 |
2008 Annual Report
December 31, 2008
Portfolio of Investments (cont’d)
Active International Allocation Portfolio
| | | | Value | |
| | Shares | | (000) | |
Portugal (0.2%) | | | | | |
Banco Comercial Portugues S.A. (Registered), Class R (a)(c) | | 115,280 | | $ 132 | |
Brisa-Auto Estradas de Portugal S.A. (c) | | 23,604 | | 177 | |
Energias de Portugal S.A. | | 40,425 | | 152 | |
Portugal Telecom SGPS S.A. (c) | | 53,269 | | 452 | |
Zon Multimedia Servicos de Telecommicacoes e Multimedia SGPS S.A. (c) | | 17,308 | | 90 | |
| | | | 1,003 | |
Russia (0.0%) | | | | | |
Unified Energy System OAO GDR (a) | | 1,348 | | 31 | |
Wimm-Bill-Dann Foods OJSC ADR (a)(c) | | 5,600 | | 147 | |
| | | | 178 | |
Singapore (1.5%) | | | | | |
Ascendas REIT | | 106,000 | | 103 | |
CapitaCommercial Trust REIT (c) | | 106,000 | | 66 | |
CapitaLand Ltd. | | 183,000 | | 402 | |
CapitaMall Trust REIT (c) | | 120,514 | | 134 | |
City Developments Ltd. | | 64,741 | | 289 | |
ComfortDelgro Corp., Ltd. | | 196,538 | | 199 | |
Cosco Corp. Singapore Ltd. (c) | | 117,000 | | 79 | |
DBS Group Holdings Ltd. | | 126,678 | | 752 | |
Fraser & Neave Ltd. | | 106,000 | | 219 | |
Golden Agri-Resources Ltd. | | 551,842 | | 92 | |
Jardine Cycle & Carriage Ltd. | | 22,034 | | 146 | |
Keppel Corp. Ltd. (c) | | 139,000 | | 421 | |
Olam International Ltd. | | 145,000 | | 117 | |
Oversea-Chinese Banking Corp. Ltd. (c) | | 264,758 | | 922 | |
Parkway Holdings Ltd. | | 52,000 | | 45 | |
Raffles Education Corp. Ltd. | | 52,862 | | 21 | |
SembCorp Industries Ltd. | | 106,183 | | 173 | |
SembCorp Marine Ltd. | | 94,000 | | 111 | |
Singapore Airlines Ltd. | | 78,010 | | 612 | |
Singapore Exchange Ltd. (c) | | 92,581 | | 332 | |
Singapore Press Holdings Ltd. | | 134,083 | | 290 | |
Singapore Telecommunications Ltd. | | 851,115 | | 1,515 | |
United Overseas Bank Ltd. | | 136,448 | | 1,232 | |
UOL Group Ltd. | | 56,217 | | 87 | |
Venture Corp., Ltd. (c) | | 25,530 | | 78 | |
Wilmar International Ltd. | | 94,000 | | 184 | |
| | | | 8,621 | |
South Africa (0.0%) | | | | | |
Mondi Ltd. | | 1,426 | | 5 | |
Spain (3.4%) | | | | | |
Abertis Infraestructuras S.A. (c) | | 20,913 | | 372 | |
Acerinox S.A. (c) | | 11,233 | | 180 | |
ACS Actividades de Construccion y Servicios S.A. | | 225 | | 10 | |
Banco Bilbao Vizcaya Argentaria S.A. | | 90,633 | | 1,112 | |
Banco Popular Espanol S.A. (c) | | 59,122 | | 513 | |
Banco Santander S.A. | | 240,553 | | 2,322 | |
Cintra Concesiones de Infraestructuras de Transporte S.A. | | 9,914 | | 75 | |
Gas Natural SDG S.A. | | 14,077 | | 384 | |
Iberdrola S.A. | | 186,112 | | 1,728 | |
Inditex S.A. (c) | | 40,797 | | 1,803 | |
Indra Sistemas S.A. (c) | | 3,088 | | 70 | |
Mapfre S.A. (c) | | 29,616 | | 101 | |
Repsol YPF S.A. | | 79,530 | | 1,694 | |
Telefonica S.A. | | 395,687 | | 8,870 | |
Union Fenosa S.A. | | 13,754 | | 340 | |
| | | | 19,574 | |
Sweden (1.7%) | | | | | |
Alfa Laval AB (c) | | 4,456 | | 39 | |
Assa Abloy AB, Class B (c) | | 18,241 | | 207 | |
Atlas Copco AB, Class A (c) | | 120,279 | | 1,035 | |
Atlas Copco AB, Class B | | 21,894 | | 168 | |
Electrolux AB, Class B (c) | | 12,800 | | 110 | |
Getinge AB, Class B (c) | | 15,247 | | 183 | |
Hennes & Mauritz AB, Class B | | 20,492 | | 801 | |
Holmen AB, Class B | | 3,400 | | 84 | |
Husqvarna AB, Class B (c) | | 12,800 | | 68 | |
Investor AB, Class B (c) | | 26,655 | | 401 | |
Lundin Petroleum AB (a)(c) | | 18,642 | | 99 | |
Modern Times Group AB, Class B | | 3,950 | | 86 | |
Nordea Bank AB (c) | | 178,500 | | 1,256 | |
Sandvik AB (c) | | 59,290 | | 377 | |
Securitas AB, Class B (c) | | 800 | | 6 | |
Skanska AB, Class B (c) | | 18,129 | | 181 | |
Ssab Svenskt Stal AB, Class A (c) | | 11,481 | | 101 | |
Svenska Cellulosa AB, Class B | | 39,566 | | 338 | |
Svenska Handelsbanken AB, Class A | | 39,509 | | 643 | |
Swedish Match AB | | 23,165 | | 332 | |
Tele2 AB, Class B | | 11,276 | | 100 | |
Telefonaktiebolaget LM Ericsson, Class B (c) | | 255,283 | | 1,958 | |
TeliaSonera AB | | 120,137 | | 598 | |
Volvo AB, Class A (c) | | 26,675 | | 150 | |
Volvo AB, Class B (c) | | 64,025 | | 354 | |
| | | | 9,675 | |
Switzerland (9.8%) | | | | | |
ABB Ltd. (Registered) (a) | | 137,881 | | 2,078 | |
Baloise Holding AG | | 2,281 | | 171 | |
Compagnie Financiere Richemont S.A. (c) | | 39,899 | | 775 | |
Credit Suisse Group (Registered) | | 77,714 | | 2,130 | |
Geberit AG (Registered) | | 2,713 | | 292 | |
Givaudan S.A. (Registered) | | 527 | | 415 | |
Holcim Ltd. (Registered) | | 17,313 | | 997 | |
Julius Baer Holding AG | | 12,453 | | 479 | |
Logitech International S.A. (Registered) (a)(c) | | 18,316 | | 286 | |
Lonza Group AG (Registered) (c) | | 3,536 | | 327 | |
Nestle S.A. (Registered) | | 417,300 | | 16,447 | |
Nobel Biocare Holding AG (Registered) (c) | | 12,695 | | 260 | |
Novartis AG (Registered) | | 229,942 | | 11,521 | |
OC Oerlikon Corp. AG (Registered) (a) | | 464 | | 31 | |
Roche Holding AG (Genusschein) | | 69,154 | | 10,645 | |
Schindler Holding AG | | 4,342 | | 198 | |
STMicroelectronics N.V. | | 55,320 | | 371 | |
Straumann Holding AG (Registered) (c) | | 830 | | 146 | |
16 | The accompanying notes are an integral part of the financial statements. | |
| 2008 Annual Report |
| |
| December 31, 2008 |
Portfolio of Investments (cont’d)
Active International Allocation Portfolio
| | | | Value | |
| | Shares | | (000) | |
Switzerland (cont’d) | | | | | |
Sulzer AG (Registered) | | 313 | | $ 18 | |
Swatch Group AG (The) | | 4,317 | | 118 | |
Swatch Group AG (The), Class B | | 2,368 | | 331 | |
Swiss Life Holding AG (a) | | 1,526 | | 106 | |
Swiss Reinsurance (Registered) | | 30,710 | | 1,492 | |
Swisscom AG (Registered) | | 1,991 | | 643 | |
Syngenta AG (Registered) | | 11,596 | | 2,247 | |
Synthes, Inc. | | 6,408 | | 810 | |
UBS AG (Registered) (a) | | 69,907 | | 1,014 | |
Zurich Financial Services AG (Registered) | | 8,104 | | 1,759 | |
| | | | 56,107 | |
United Kingdom (20.0%) | | | | | |
3I Group plc | | 28,582 | | 113 | |
AMEC plc | | 18,916 | | 135 | |
Anglo American plc | | 80,866 | | 1,847 | |
AstraZeneca plc | | 152,431 | | 6,176 | |
Aviva plc | | 195,010 | | 1,104 | |
BAE Systems plc | | 220,384 | | 1,201 | |
Balfour Beatty plc | | 32,230 | | 154 | |
Barclays plc | | 393,205 | | 886 | |
Berkeley Group Holdings plc (a) | | 5,144 | | 65 | |
BG Group plc | | 252,960 | | 3,512 | |
BHP Billiton plc | | 131,572 | | 2,478 | |
BP plc | | 1,475,305 | | 11,304 | |
British Airways plc | | 41,427 | | 108 | |
British American Tobacco plc | | 192,660 | | 5,006 | |
British Sky Broadcasting Group plc | | 128,380 | | 893 | |
BT Group plc, Class A | | 741,822 | | 1,458 | |
Bunzl plc | | 27,598 | | 236 | |
Burberry Group plc | | 27,861 | | 89 | |
Cadbury plc | | 91,543 | | 801 | |
Capita Group plc (The) | | 8,472 | | 90 | |
Carnival plc | | 10,876 | | 237 | |
Centrica plc | | 321,961 | | 1,237 | |
Close Brothers Group plc | | 3,491 | | 27 | |
Cobham plc | | 75,726 | | 225 | |
Compass Group plc | | 133,577 | | 663 | |
Daily Mail & General Trust, Class A | | 22,419 | | 88 | |
Diageo plc | | 233,128 | | 3,243 | |
Firstgroup plc | | 28,266 | | 177 | |
Friends Provident plc | | 146,894 | | 184 | |
G4S plc | | 13,896 | | 41 | |
GKN plc | | 27,325 | | 39 | |
GlaxoSmithKline plc | | 527,967 | | 9,801 | |
Hays plc | | 19,415 | | 20 | |
HBOS plc | | 251,970 | | 256 | |
Home Retail Group plc | | 35,804 | | 110 | |
HSBC Holdings plc | | 388,568 | | 3,719 | |
ICAP plc | | 3,278 | | 14 | |
IMI plc | | 29,947 | | 118 | |
Imperial Tobacco Group plc | | 63,422 | | 1,694 | |
Intercontinental Hotels Group plc | | 21,651 | | 176 | |
International Power plc | | 29,339 | | 102 | |
Invensys plc (a) | | 11,595 | | 29 | |
ITV plc | | 435,223 | | 250 | |
J. Sainsbury plc | | 91,679 | | 436 | |
Johnson Matthey plc | | 13,060 | | 207 | |
Kingfisher plc | | 51,136 | | 100 | |
Ladbrokes plc | | 35,645 | | 95 | |
Legal & General Group plc | | 503,163 | | 561 | |
Lloyds TSB Group plc | | 414,342 | | 758 | |
LogicaCMG plc | | 74,870 | | 75 | |
London Stock Exchange Group plc | | 1,887 | | 14 | |
Man Group plc | | 153,007 | | 528 | |
Marks & Spencer Group plc | | 74,430 | | 232 | |
Meggitt plc | | 34,216 | | 79 | |
National Express Group plc | | 8,751 | | 62 | |
National Grid plc | | 363,951 | | 3,597 | |
Next plc | | 11,465 | | 180 | |
Old Mutual plc | | 157,558 | | 126 | |
Pearson plc | | 58,216 | | 540 | |
Prudential plc | | 144,016 | | 877 | |
Reckitt Benckiser Group plc | | 111,990 | | 4,172 | |
Reed Elsevier plc | | 79,548 | | 580 | |
Rexam plc | | 38,576 | | 197 | |
Rio Tinto plc | | 60,296 | | 1,306 | |
Rolls-Royce Group plc (a) | | 120,169 | | 589 | |
Rolls-Royce Group plc, C Shares (a) | | 6,202,196 | | 9 | |
Royal Bank of Scotland Group plc | | 1,000,961 | | 724 | |
Royal Dutch Shell plc, Class A | | 307,145 | | 8,029 | |
Royal Dutch Shell plc, Class B | | 196,948 | | 4,957 | |
RSA Insurance Group plc | | 100,260 | | 200 | |
SABMiller plc | | 60,834 | | 1,024 | |
Sage Group plc (The) | | 128,663 | | 316 | |
Schroders plc | | 3,605 | | 45 | |
Scottish & Southern Energy plc | | 114,674 | | 2,019 | |
Serco Group plc | | 5,648 | | 37 | |
Severn Trent plc | | 37,996 | | 658 | |
Smith & Nephew plc | | 163,605 | | 1,038 | |
Smiths Group plc | | 25,466 | | 328 | |
Stagecoach Group plc | | 21,928 | | 45 | |
Standard Chartered plc | | 42,603 | | 545 | |
Standard Life plc | | 39,731 | | 117 | |
Tate & Lyle plc | | 49,884 | | 290 | |
Tesco plc | | 515,043 | | 2,683 | |
Thomson Reuters plc | | 17,278 | | 382 | |
TI Automotive Ltd., Class A (a)(d)(l) | | 1,505 | | — | |
Tomkins plc | | 64,434 | | 115 | |
Unilever plc | | 133,905 | | 3,043 | |
United Business Media Ltd. | | 18,172 | | 134 | |
United Utilities Group plc | | 20,334 | | 184 | |
Vodafone Group plc | | 5,074,363 | | 10,215 | |
Whitbread plc | | 12,255 | | 162 | |
Wolseley plc | | 38,214 | | 213 | |
WPP plc | | 175,391 | | 1,022 | |
Xstrata plc | | 39,767 | | 371 | |
| | | | 114,322 | |
Total Common Stocks (Cost $686,644) | | | | 555,717 | |
| The accompanying notes are an integral part of the financial statements. | 17 |
2008 Annual Report | |
| |
December 31, 2008 | |
Portfolio of Investments (cont’d)
Active International Allocation Portfolio
| | No. of | | Value | |
| | Rights | | (000) | |
Rights (0.0%) | | | | | |
Australia (0.0%) | | | | | |
Macquarie Office Trust, expires 1/20/09 (a) | | 34,843 | | $ 1 | |
Belgium (0.0%) | | | | | |
Fortis, expires 12/31/49 (a)(c) | | 94,211 | | — | |
Japan (0.0%) | | | | | |
Dowa Holdings, Co., Ltd., expires 1/29/10 (a) | | 49,000 | | — | |
Singapore (0.0%) | | | | | |
DBS Group Holdings Ltd., expires 1/20/09 (a) | | 63,339 | | 137 | |
United States (0.0%) | | | | | |
HBOS plc, expires 1/9/09 (a) | | 348,701 | | — | |
Lloyds TSB Group, expires 1/9/09 (a) | | 180,114 | | — | |
| | | | — | |
Total Rights (Cost $—) | | | | 138 | |
| | | | | |
| | No. of | | | |
| | Warrants | | | |
Warrants (0.0%) | | | | | |
Malaysia (0.0%) | | | | | |
IJM Land Bhd, expires 9/11/13 | | | | | |
(Cost $—) (a) | | 39,680 | | 2 | |
| | | | | |
| | Shares | | | |
Short-Term Investments (21.3%) | | | | | |
Securities held as Collateral on Loaned Securities (21.3%) | | | | | |
Investment Company (17.1%) | | | | | |
Morgan Stanley Institutional Liquidity Money Market Portfolio —Institutional Class (o) | | 97,759,879 | | 97,760 | |
| | | | | |
| | Face | | | |
| | Amount | | | |
| | (000) | | | |
Repurchase Agreement (4.2%) | | | | | |
Goldman Sachs & Co., 0.06%, dated 12/31/08, due 1/2/09, repurchase price $24,016; fully collateralized by U.S. government agency securities at the date of this Portfolio of Investments as follows: Federal Home Loan Mortgage Corp., Gold Pools: rates ranging from 4.50% to 6.00%, due 11/1/19 - 12/1/38; Federal National Mortgage Association, Fixed Rate Mortgages: rates ranging from 4.00% - 7.00%, due 9/1/18 - 1/1/39; Government National Mortgage Association, Fixed Rate Mortgages: rates ranging from 4.50% to 11.50%, due 6/15/16 - 12/20/38, valued at $24,496. | | $ 24,016 | | 24,016 | |
| | | | 121,776 | |
Total Short-Term Investments (Cost $121,776) | | | | 121,776 | |
Total Investments (118.3%) (Cost $808,420) — | | | | | |
including $115,931 of Securities Loaned (v) | | | | 677,633 | |
Liabilities in Excess of Other Assets (-18.3%) | | | | (104,706 | ) |
Net Assets (100%) | | | | $ 572,927 | |
(a) | | Non-income producing security. |
(c) | | All or a portion of security on loan at December 31, 2008. |
(d) | | At December 31, 2008, the Portfolio held approximately $23,000 of fair valued securities, representing less than 0.05% of net assets. These securities have been fair valued as determined in good faith under procedures established by and under the general supervision of the Portfolio’s Directors. |
(l) | | Security has been deemed illiquid at December 31, 2008. |
(o) | | See Note G to the financial statements regarding investment in Mitsubishi UFJ Financial Group, Inc., Mitsubishi UFJ Lease & Finance Co., Ltd. and Morgan Stanley Institutional Liquidity Money Market Portfolio — Institutional Class. |
(v) | | The approximate market value and percentage of total investments, $554,008,000 and 81.8%, respectively, represent the securities that have been fair valued under the fair valuation policy for international investments as disclosed in Note A within the Notes to Financial Statements. |
@ | | Value is less than $500. |
ADR | | American Depositary Receipt |
CVA | | Certificaten Van Aandelen |
GDR | | Global Depositary Receipt |
PPS | | Price Protected Shares |
REIT | | Real Estate Investment Trust |
VVPR | | Verminderde Voorheffing Precompte Reduit |
18 | The accompanying notes are an integral part of the financial statements. | |
| 2008 Annual Report |
| |
| December 31, 2008 |
Portfolio of Investments (cont’d)
Active International Allocation Portfolio
Foreign Currency Exchange Contract Information:
The Portfolio had the following foreign currency exchange contract(s) open at period end:
Currency
to
Deliver
(000) | | | Value
(000) | | | Settlement
Date | | In
Exchange
For
(000) | | Value
(000) | | Net
Unrealized
Appreciation
(Depreciation)
(000) | |
EUR | 7,905 | | | $ 10,983 | | | 1/15/09 | | USD | 10,150 | | | $ 10,150 | | | $ (833) | | |
EUR | 7,905 | | | 10,983 | | | 1/15/09 | | USD | 10,150 | | | 10,150 | | | (833) | | |
EUR | 7,089 | | | 9,849 | | | 1/15/09 | | USD | 9,132 | | | 9,132 | | | (717) | | |
EUR | 206 | | | 287 | | | 1/15/09 | | USD | 266 | | | 266 | | | (21) | | |
EUR | 4,389 | | | 6,101 | | | 1/2/09 | | USD | 6,210 | | | 6,210 | | | 109 | | |
EUR | 4,145 | | | 5,762 | | | 1/2/09 | | USD | 5,802 | | | 5,802 | | | 40 | | |
EUR | 2,468 | | | 3,429 | | | 1/15/09 | | USD | 3,180 | | | 3,180 | | | (249) | | |
GBP | 11,741 | | | 16,875 | | | 1/15/09 | | USD | 17,288 | | | 17,288 | | | 413 | | |
GBP | 2,285 | | | 3,285 | | | 1/15/09 | | USD | 3,377 | | | 3,377 | | | 92 | | |
JPY | 11,960 | | | 132 | | | 1/5/09 | | USD | 133 | | | 133 | | | 1 | | |
JPY | 298,638 | | | 3,295 | | | 1/15/09 | | USD | 3,306 | | | 3,306 | | | 11 | | |
JPY | 742,833 | | | 8,196 | | | 1/15/09 | | USD | 8,043 | | | 8,043 | | | (153) | | |
JPY | 38,523 | | | 425 | | | 1/15/09 | | USD | 417 | | | 417 | | | (8) | | |
JPY | 6,587,063 | | | 72,680 | | | 1/15/09 | | USD | 71,282 | | | 71,282 | | | (1,398) | | |
NOK | 232 | | | 34 | | | 1/2/09 | | USD | 33 | | | 33 | | | (1) | | |
SEK | 326 | | | 42 | | | 1/2/09 | | USD | 41 | | | 41 | | | (1) | | |
USD | 12,020 | | | 12,020 | | | 1/15/09 | | EUR | 8,417 | | | 11,694 | | | (326) | | |
USD | 5,624 | | | 5,624 | | | 1/15/09 | | EUR | 4,380 | | | 6,085 | | | 461 | | |
USD | 20,541 | | | 20,541 | | | 1/15/09 | | EUR | 15,942 | | | 22,151 | | | 1,610 | | |
USD | 3,010 | | | 3,010 | | | 1/15/09 | | EUR | 2,336 | | | 3,245 | | | 235 | | |
USD | 5,872 | | | 5,872 | | | 1/15/09 | | EUR | 4,579 | | | 6,362 | | | 490 | | |
USD | 820 | | | 820 | | | 1/15/09 | | GBP | 555 | | | 798 | | | (22) | | |
USD | 2,420 | | | 2,420 | | | 1/15/09 | | GBP | 1,640 | | | 2,357 | | | (63) | | |
USD | 8,066 | | | 8,066 | | | 1/15/09 | | GBP | 5,465 | | | 7,855 | | | (211) | | |
USD | 32,772 | | | 32,772 | | | 1/15/09 | | JPY | 3,028,464 | | | 33,415 | | | 643 | | |
USD | 15,262 | | | 15,262 | | | 1/15/09 | | JPY | 1,412,182 | | | 15,582 | | | 320 | | |
USD | 8,690 | | | 8,690 | | | 1/15/09 | | JPY | 802,531 | | | 8,855 | | | 165 | | |
USD | 14,748 | | | 14,748 | | | 1/15/09 | | JPY | 1,364,559 | | | 15,056 | | | 308 | | |
USD | 5,207 | | | 5,207 | | | 1/15/09 | | JPY | 481,787 | | | 5,316 | | | 109 | | |
| | | | $287,410 | | | | | | | | | $287,581 | | | $ 171 | | |
| | | | | | | | | | | | | | | | | | | |
EUR | — Euro |
GBP | — British Pound |
JPY | — Japanese Yen |
NOK | — Norwegian Krone |
SEK | — Swedish Krona |
USD | — United States Dollar |
The Portfolio had the following futures contract(s) open at period end:
| | | | | | | | Net | |
| | | | | | | | Unrealized | |
| | Number | | | | | | Appreciation | |
| | of | | Value | | Expiration | | (Depreciation) | |
| | Contracts | | (000) | | Date | | (000) | |
Long: | | | | | | | | | |
DJ Euro STOXX 50 | | | | | | | | | |
(Germany) | | 503 | | $17,130 | | Mar-09 | | | $235 | | |
| | | | | | | | | | | |
Short: | | | | | | | | | | | |
TOPIX Index | | | | | | | | | | | |
(Japan) | | (68) | | (6,466 | ) | Mar-09 | | | (7 | ) | |
| | | | | | | | | $228 | | |
| The accompanying notes are an integral part of the financial statements. | 19 |
2008 Annual Report | |
| |
December 31, 2008 | |
Investment Overview (unaudited)
Emerging Markets Portfolio
The Emerging Markets Portfolio (the “Portfolio”) seeks long-term capital appreciation by investing primarily in growth-oriented equity securities of issuers in emerging market countries. Foreign investing involves certain risks, including currency fluctuations and controls, restrictions on foreign investments, less governmental supervision and regulation, less liquidity and the potential for market volatility and political instability. In addition, investing in emerging markets may involve a relative higher degree of volatility.
Performance
For the year ended December 31, 2008, the Portfolio had a total return based on net asset value and reinvestment of distributions per share of -56.39%, net of fees, for the Class I shares. The Portfolio’s Class I shares underperformed against its benchmark the Morgan Stanley Capital International (MSCI) Emerging Markets Net Index (the “Index”) which returned -53.33%.
Factors Affecting Performance
· The MSCI Emerging Markets Index declined 53.3% in 2008, underperforming the developed markets for the one-year period. Latin America declined 51.4%, followed by Asia, which was down 53%. Emerging Europe, Middle East and Africa was the worst performing region, falling 55.7%.
· The year 2008 began with a prevailing concern for inflation in emerging markets as oil prices continued to outpace economic growth. In the second half of the year, while the price of oil and other commodities prices did retreat, the U.S. experienced an unprecedented credit crisis that led to global liquidity tightening, a sharp rise in risk aversion and further declines in the emerging markets. On the positive side, central bank tightening measures taken in the first half of 2008, coupled with falling commodity prices, have driven inflation lower in many emerging market economies and have allowed governments to cut interest rates at a fast pace. That said, however, good quality companies with strong balance sheets have largely become victims of collateral damage from the global credit crisis. We see this as an opportunity in our portfolio to buy and hold what we believe to be companies with higher-quality management, strong corporate governance and a competitive advantage.
· Overall, country allocation contributed favorably to relative performance. An overweight allocation to Panama and underweight allocations to Brazil, Russia and Hungary bolstered relative performance. Stock selection in India also added to relative gains.
· However, stock selection in China, Brazil and Mexico detracted from relative returns. An underweight allocation to Taiwan and stock selection within the country also hurt relative performance. Furthering dampening relative gains was an underweight allocation to Israel.
Management Strategies
· Early in 2008, we began reducing the Portfolio’s weightings in those countries with heavy energy and materials exposure. As such, during the year, we increased our underweight in Brazil and Russia. In South Africa, we shifted positions away from commodity-oriented stocks and into consumer staples stocks.
· Concurrently, we increased the Portfolio’s weightings in stocks and countries that we believe will benefit from easing commodity prices and moderating inflation pressures, such as Turkey, Poland and India. We believe these countries, and other net energy importers, are likely to show improvement in their current account deficits and may benefit from a lessening in pressure on their fiscal budgets. Falling prices for energy and other commodities are helping to reduce inflationary pressures in these countries and allowing their central banks to begin cutting interest rates. On a sector basis, the Portfolio is overwhelmingly overweight consumer discretionary, consumer staples and financials.
· At period-end, key overweight positions were Poland, Turkey, India, Indonesia and the Czech Republic. The largest underweight positions were Brazil, Taiwan, Malaysia, Israel and Korea.
· In the emerging markets, the era of high economic growth has ended but we believe growth at lower levels is likely to continue. By our analysis, growth may average pre-2002 levels of 3.5% to 4%, driven primarily by domestic consumption as the growth model that once depended on foreign flows will now depend on domestic savings.
20
| 2008 Annual Report |
| |
| December 31, 2008 |
Investment Overview (cont’d)
Emerging Markets Portfolio
· Emerging markets consumers — in sharp contrast to their U.S. counterparts — remain underleveraged. Thus, as inflation further settles down and interest rates fall, domestic consumption in emerging markets could resume and provide some cushion to the investment and global economic slowdown. From an investment perspective, emerging markets were trading at a discount of some 25% to developed markets at the end of the period. In a low return world, we believe the emerging markets may hold relatively more appeal than the U.S. due to growth differentials.

* Minimum Investment
In accordance with SEC regulations, Portfolio’s performance shown assumes that all recurring fees (including management fees) were deducted and all dividends and distributions were reinvested. The performance of Class P shares will vary from the Class I shares based upon their different inception dates and will be negatively impacted by additional fees assessed to that class.
Performance Compared to the Morgan Stanley Capital International (MSCI) Emerging Markets Net Index(1) and the Lipper Emerging Markets Funds Index(2)
| | | | | Total Returns(3) | |
| | | | | Average Annual | |
| | One | | Five | | Ten | | Since | |
| | Year | | Years | | Years | | Inception | (6) |
Portfolio — Class I (4) | | (56.39 | )% | 7.30 | % | 9.40 | % | 7.09 | % |
MSCI Emerging Markets Net Index | | (53.33 | ) | 7.66 | | 9.05 | | 6.44 | |
Lipper Emerging Markets Funds Index | | (54.76 | ) | 6.30 | | 8.64 | | — | |
| | | | | | | | | |
Portfolio — Class P (5) | | (56.50 | ) | 7.03 | | 9.12 | | 5.27 | |
MSCI Emerging Markets Net Index | | (53.33 | ) | 7.66 | | 9.05 | | 3.94 | |
Lipper Emerging Markets Funds Index | | (54.76 | ) | 6.30 | | 8.64 | | 4.03 | |
Performance data quoted represents past performance, which is no guarantee of future results, and current performance may be lower or higher than the figures shown. Performance assumes that all dividends and distributions, if any, were reinvested. For the most recent month-end performance figures, please visit www.morganstanley.com/msim. Investment return and principal value will fluctuate so that Portfolio shares, when redeemed, may be worth more or less than their original cost. Total returns do not reflect the deduction of taxes that a shareholder would pay on Portfolio distributions or the redemption of Portfolio shares. Performance of share classes will vary due to difference in expenses.
(1) The Morgan Stanley Capital International (MSCI) Emerging Markets Net Index is a free float-adjusted market capitalization weighted index that is designed to measure equity market performance of emerging markets. The term “free float” represents the portion of shares outstanding that are deemed to be available for purchase in the public equity markets by investors. The MSCI Emerging Markets Index currently consists of 23 emerging market country indices. The performance of the Index is listed in U.S. dollars and assumes reinvestment of net dividends. The Index is unmanaged and its returns do not include any sales charges or fees. Such costs would lower performance. It is not possible to invest directly in an index.
(2) The Lipper Emerging Markets Funds Index is an equally weighted performance index of the largest qualifying funds (based on net assets) in the Lipper Emerging Markets Funds classification. The Index, which is adjusted for capital gains distributions and income dividends, is unmanaged and should not be considered an investment. There are currently 30 funds represented in this Index. As of the date of this report, the Portfolio was in the Lipper Emerging Markets Funds classification.
(3) Total returns for the Portfolio reflect fees waived and expenses reimbursed, if applicable, by the Adviser. Without such waivers and reimbursements, total returns would have been lower. Fee waivers and/or expense reimbursements are voluntary and the Adviser reserves the right to commence or terminate any waiver and/or reimbursement at any time.
(4) Commenced operations on September 25, 1992
(5) Commenced operations on January 2, 1996
(6) For comparative purposes, average annual since inception returns listed for the Indexes refer to the inception date or initial offering of the respective share class of the Portfolio, not the inception of the Index.
Portfolio Composition**
| | Percentage of | |
Classification | | Total Investments | |
Commercial Banks | | 19.8 | % |
Wireless Telecommunication Services | | 14.0 | |
Oil, Gas & Consumable Fuels | | 9.3 | |
Other*** | | 52.9 | |
Short-Term Investment | | 4.0 | |
Total Investments | | | 100.0 | % |
| | | | |
** Percentages indicated are based upon total investments (excluding Securities held as collateral on Loaned Securities) as of December 31, 2008.
*** Industries which do not appear in the above table, as well as those which represent less than 5% of total investments, if applicable, are included in the category labeled “Other”.
21
2008 Annual Report | |
| |
December 31, 2008 | |
Portfolio of Investments
Emerging Markets Portfolio
| | | | Value | |
| | Shares | | (000) | |
Common Stocks (95.5%) | | | | | |
Brazil (9.3%) | | | | | |
Banco Bradesco S.A. ADR (c) | | 769,400 | | $ | 7,594 | |
Banco Bradesco S.A. (Preference) | | 240,100 | | 2,346 | |
Banco do Brasil S.A. | | 374,108 | | 2,424 | |
Banco Itau Holding Financeira S.A. ADR (c) | | 898,000 | | 10,417 | |
Banco Nacional S.A. (Preference) (a)(d)(l) | | 295,998,880 | | — | |
Cia de Bebidas das Americas (Preference) ADR (c) | | 176,100 | | 7,803 | |
Cia Vale do Rio Doce ADR (c) | | 1,545,275 | | 16,457 | |
Cia Vale do Rio Doce (Preference), Class A | | 31,084 | | 327 | |
Cyrela Brazil Realty S.A. | | 755,196 | | 3,043 | |
NET Servicos de Comunicacao S.A. (Preference) (a) | | 1,263,479 | | 7,284 | |
PDG Realty S.A. Empreendimentos e Participacoes | | 564,700 | | 2,768 | |
Perdigao S.A. | | 677,676 | | 8,823 | |
Petroleo Brasileiro S.A. ADR (c) | | 709,324 | | 14,477 | |
Petroleo Brasileiro S.A. (Preference) | | 982,272 | | 9,892 | |
Ultrapar Participacoes S.A. (Preference) | | 188,700 | | 4,142 | |
Unibanco - Uniao de Bancos Brasileiros S.A. ADR (c) | | 229,356 | | 14,821 | |
Unibanco - Uniao de Bancos Brasileiros S.A. | | 186,342 | | 1,194 | |
Vivo Participacoes S.A. ADR (c) | | 269,000 | | 3,373 | |
| | | | 117,185 | |
China/Hong Kong (18.8%) | | | | | |
Anhui Conch Cement Co., Ltd., Class H (a)(c) | | 2,705,000 | | 12,568 | |
Beijing Enterprises Holdings Ltd. | | 872,000 | | 3,585 | |
BYD Electronic International Co., Ltd. | | 6,130,000 | | 2,189 | |
China Coal Energy Co. (c) | | 3,911,000 | | 3,161 | |
China Communications Services Corp., Ltd., Class H | | 7,736,000 | | 4,891 | |
China Construction Bank Corp., Class H (c) | | 34,903,000 | | 19,315 | |
China Life Insurance Co., Ltd., Class H (c) | | 8,529,000 | | 26,283 | |
China Mobile Ltd. (c) | | 5,696,500 | | 57,756 | |
China Resources Power Holdings Co., Ltd. (c) | | 3,731,000 | | 7,251 | |
China Unicom Hong Kong Ltd. (c) | | 3,738,000 | | 4,547 | |
Datang International Power Generation Co., Ltd., Class H (c) | | 8,904,000 | | 4,759 | |
Dongfeng Motor Group Co., Ltd., Class H | | 29,845,000 | | 9,732 | |
Focus Media Holding Ltd. ADR (a)(c) | | 549,600 | | 4,996 | |
GOME Electrical Appliances Holdings Ltd. (c) | | 75,157,000 | | 10,861 | |
Industrial & Commercial Bank of China, Class H (c) | | 31,606,000 | | 16,798 | |
Maanshan Iron & Steel, Class H (c) | | 13,963,000 | | 5,060 | |
PetroChina Co., Ltd., Class H | | 25,170,000 | | 22,302 | |
Ping An Insurance Group Co. of China Ltd., Class H | | 2,147,000 | | 10,492 | |
Shanghai Industrial Holdings Ltd. (c) | | 4,265,000 | | 9,814 | |
| | | | 236,360 | |
Colombia (0.7%) | | | | | |
BanColombia S.A. ADR (c) | | 374,952 | | 8,755 | |
Czech Republic (2.2%) | | | | | |
CEZ | | 301,619 | | 12,258 | |
Komercni Banka A.S. | | 51,686 | | 7,954 | |
Telefonica O2 Czech Republic A.S. | | 343,413 | | 7,553 | |
| | | | 27,765 | |
Hungary (0.7%) | | | | | |
Richter Gedeon Nyrt | | 58,000 | | 8,638 | |
India (8.4%) | | | | | |
Bharat Heavy Electricals Ltd. | | 391,590 | | 11,094 | |
Bharti Airtel Ltd. (a) | | 636,672 | | 9,405 | |
Deccan Chronicle Holdings Ltd. | | 2,251,920 | | 2,024 | |
Glenmark Pharmaceuticals Ltd. (a) | | 551,600 | | 3,395 | |
HDFC Bank Ltd. ADR (c) | | 51,600 | | 3,683 | |
HDFC Bank Ltd. | | 452,300 | | 9,397 | |
Hero Honda Motors Ltd. | | 210,500 | | 3,514 | |
Hindustan Unilever Ltd. | | 2,186,500 | | 11,288 | |
Housing Development Finance Corp. | | 123,900 | | 3,864 | |
India Cements Ltd. | | 2,173,792 | | 4,385 | |
Infosys Technologies Ltd. | | 554,772 | | 12,847 | |
ITC Ltd. | | 1,181,500 | | 4,198 | |
Maruti Suzuki India Ltd. | | 430,100 | | 4,658 | |
Reliance Industries Ltd. | | 224,200 | | 5,712 | |
State Bank of India Ltd. (d) | | 440,200 | | 11,919 | |
Television Eighteen India Ltd. (d) | | 634,100 | | 1,222 | |
Union Bank Of India (d) | | 796,000 | | 2,760 | |
| | | | 105,365 | |
Indonesia (2.9%) | | | | | |
Astra International Tbk PT | | 4,033,500 | | 4,069 | |
Bank Central Asia Tbk PT | | 25,858,500 | | 7,824 | |
Bank Mandiri Persero Tbk PT | | 16,878,000 | | 3,217 | |
Bank Rakyat Indonesia Tbk PT | | 11,931,500 | | 5,274 | |
Bumi Resources Tbk PT | | 17,791,000 | | 1,535 | |
Perusahaan Gas Negara PT | | 12,491,000 | | 2,259 | |
Telekomunikasi Indonesia Tbk PT | | 19,742,000 | | 12,840 | |
| | | | 37,018 | |
Luxembourg (0.7%) | | | | | |
Millicom International Cellular S.A. (c) | | 200,915 | | 9,023 | |
Malaysia (1.0%) | | | | | |
Bumiputra-Commerce Holdings Bhd | | 518,000 | | 882 | |
Digi.com Bhd | | 666,300 | | 4,203 | |
Sime Darby Bhd | | 2,159,300 | | 3,267 | |
Tenaga Nasional Bhd | | 2,189,900 | | 3,981 | |
| | | | 12,333 | |
Mexico (6.2%) | | | | | |
America Movil S.A.B. de C.V., Class L ADR | | 932,744 | | 28,906 | |
Corp. GEO S.A.B. de C.V., Class B (a)(c) | | 1,683,714 | | 1,897 | |
Empresas ICA S.A.B de C.V. (a)(c) | | 1,825,529 | | 3,012 | |
Fomento Economico Mexicano S.A.B. de C.V. ADR | | 535,000 | | 16,119 | |
Grupo Financiero Banorte S.A.B. de C.V., Class O (c) | | 3,235,800 | | 5,841 | |
Grupo Televisa S.A. ADR | | 676,500 | | 10,107 | |
| | | | | | |
22 | The accompanying notes are an integral part of the financial statements. | |
| 2008 Annual Report |
| |
| December 31, 2008 |
Portfolio of Investments (cont’d)
Emerging Markets Portfolio
| | | | Value | |
| | Shares | | (000) | |
Mexico (cont’d) | | | | | |
Urbi Desarrollos Urbanos S.A.B de C.V. (a) | | 1,657,300 | | $ 2,262 | |
Wal-Mart de Mexico S.A.B. de C.V. ADR (c) | | 38,343 | | 1,035 | |
Wal-Mart de Mexico S.A.B. de C.V., Class V (c) | | 3,330,672 | | 8,899 | |
| | | | 78,078 | |
Nigeria (0.1%) | | | | | |
Guaranty Trust Bank plc GDR | | 307,681 | | 1,227 | |
Pakistan (0.8%) | | | | | |
MCB Bank Ltd. | | 1,416,600 | | 2,254 | |
National Bank of Pakistan | | 2,749,780 | | 1,736 | |
Oil & Gas Development Co., Ltd. | | 4,635,100 | | 2,925 | |
Pakistan State Oil Co., Ltd. | | 653,400 | | 1,196 | |
Pakistan Telecommunication Co., Ltd. (a) | | 7,087,500 | | 1,515 | |
| | | | 9,626 | |
Panama (0.7%) | | | | | |
Copa Holdings S.A., Class A | | 310,568 | | 9,416 | |
Poland (4.2%) | | | | | |
Bank Pekao S.A. | | 370,297 | | 15,846 | |
Bank Zachodni WBK S.A. | | 132,774 | | 4,988 | |
KGHM Polska Miedz S.A. | | 114,897 | | 1,097 | |
PBG S.A. (a) | | 52,941 | | 3,502 | |
Polimex Mostostal S.A. | | 1,039,195 | | 1,070 | |
Polskie Gornictwo Naftowe I Gazownictwo S.A. | | 851,625 | | 1,038 | |
Powszechna Kasa Oszczednosci Bank Polski S.A. | | 1,396,394 | | 16,729 | |
Telekomunikacja Polska S.A. | | 1,310,286 | | 8,490 | |
| | | | 52,760 | |
Russia (4.7%) | | | | | |
Alliance Cellulose Ltd. (a)(d)(l) | | 592,359 | | — | |
Gazprom OAO ADR (c) | | 698,367 | | 10,010 | |
LUKOIL ADR (c) | | 677,039 | | 21,952 | |
Mobile Telesystems OJSC ADR | | 146,300 | | 3,903 | |
Rosneft Oil Co. GDR (a) | | 2,978,604 | | 11,308 | |
RusHydro (a) | | 226,674,300 | | 4,746 | |
Vimpel-Communications ADR | | 1,029,925 | | 7,374 | |
| | | | 59,293 | |
South Africa (8.5%) | | | | | |
AngloGold Ashanti Ltd. ADR | | 40,420 | | 1,120 | |
AngloGold Ashanti Ltd. | | 320,790 | | 8,908 | |
Harmony Gold Mining Co., Ltd. ADR (a)(c) | | 93,500 | | 1,026 | |
Harmony Gold Mining Co., Ltd. (a) | | 536,700 | | 5,855 | |
Massmart Holdings Ltd. | | 994,871 | | 9,131 | |
Mr. Price Group Ltd. | | 2,215,500 | | 5,954 | |
MTN Group Ltd. | | 2,196,448 | | 25,988 | |
Naspers Ltd., Class N | | 728,800 | | 13,247 | |
Raubex Group Ltd. | | 1,226,052 | | 2,893 | |
SABMiller plc | | 789,342 | | 13,910 | |
Sasol Ltd. | | 210,831 | | 6,440 | |
Tiger Brands Ltd. | | 774,400 | | 12,055 | |
| | | | 106,527 | |
South Korea (11.9%) | | | | | |
Amorepacific Corp. (a) | | 12,010 | | 6,279 | |
Cheil Industries, Inc. (a) | | 227,922 | | 7,411 | |
Cheil Worldwide, Inc. (a) | | 40,296 | | 6,291 | |
Hyundai Development Co. (a) | | 151,800 | | 4,002 | |
Hyundai Motor Co. | | 157,898 | | 5,083 | |
KB Financial Group, Inc. (a) | | 106,070 | | 2,907 | |
KT&G Corp. | | 33,250 | | 2,079 | |
LG Chem Ltd. | | 174,541 | | 10,037 | |
LG Electronics, Inc. | | 77,588 | | 4,737 | |
LG Telecom Ltd. | | 284,100 | | 2,231 | |
NHN Corp. (a) | | 135,053 | | 13,704 | |
Samsung Electronics Co., Ltd. | | 92,720 | | 33,668 | |
Samsung Electronics Co., Ltd. (Preference) | | 21,673 | | 4,500 | |
Samsung Fire & Marine Insurance Co., Ltd. | | 70,620 | | 10,747 | |
Shinhan Financial Group Co., Ltd. (a) | | 292,674 | | 6,779 | |
SK Telecom Co., Ltd. ADR (c) | | 140,000 | | 2,545 | |
SK Telecom Co., Ltd. | | 77,172 | | 12,739 | |
SSCP Co., Ltd. (a) | | 271,644 | | 1,597 | |
Woongjin Coway Co., Ltd. (a) | | 598,322 | | 12,855 | |
| | | | 150,191 | |
Taiwan (7.5%) | | | | | |
Acer, Inc. | | 5,950,120 | | 7,801 | |
Asustek Computer, Inc. | | 7,293,646 | | 8,284 | |
Cathay Financial Holding Co., Ltd. | | 6,163,500 | | 6,917 | |
Chinatrust Financial Holding Co., Ltd. | | 12,627,543 | | 5,445 | |
Chunghwa Telecom Co., Ltd. | | 3,446,090 | | 5,499 | |
First Financial Holding Co., Ltd. | | 7,734,352 | | 4,100 | |
HON HAI Precision Industry Co., Ltd. | | 5,867,750 | | 11,568 | |
HTC Corp. | | 996,200 | | 10,049 | |
Taiwan Fertilizer Co., Ltd. | | 662,000 | | 1,064 | |
Taiwan Semiconductor Manufacturing Co., Ltd. | | 14,713,162 | | 20,138 | |
Wistron Corp. | | 3,423,000 | | 2,631 | |
Yuanta Financial Holding Co., Ltd. | | 22,944,000 | | 10,444 | |
| | | | 93,940 | |
Thailand (1.7%) | | | | | |
Advanced Info Service PCL (Foreign) (d) | | 1,747,700 | | 3,945 | |
Bangkok Bank PCL NVDR (c)(d) | | 1,962,300 | | 3,990 | |
Kasikornbank PCL (Foreign) | | 88,100 | | 116 | |
Kasikornbank PCL NVDR (c)(d) | | 3,607,700 | | 4,779 | |
PTT Exploration & Production PCL (Foreign) (d) | | 1,086,700 | | 3,338 | |
PTT PCL (Foreign) (d) | | 502,800 | | 2,591 | |
Siam Commercial Bank PCL (Foreign) (d) | | 2,195,800 | | 3,094 | |
| | | | 21,853 | |
Turkey (4.5%) | | | | | |
Akbank T.A.S. | | 3,572,213 | | 11,151 | |
Anadolu Efes Biracilik Ve Malt Sanayii A.S. | | 890,939 | | 5,964 | |
Haci Omer Sabanci Holding A.S. | | 2,015,455 | | 4,602 | |
Turkcell Iletisim Hizmet A.S. | | 2,162,754 | | 12,448 | |
Turkiye Garanti Bankasi A.S. (a) | | 8,153,525 | | 13,922 | |
| The accompanying notes are an integral part of the financial statements. | 23 |
2008 Annual Report | |
| |
December 31, 2008 | |
Portfolio of Investments (cont’d)
Emerging Markets Portfolio
| | | | Value | |
| | Shares | | (000) | |
Turkey (cont’d) | | | | | |
Turkiye Halk Bankasi A.S. | | 1,313,885 | | $ | 3,945 | |
Turkiye Is Bankasi A.S., Class C | | 1,929,092 | | 5,189 | |
| | | | 57,221 | |
Total Common Stocks (Cost $1,763,473) | | | | 1,202,574 | |
Investment Company (0.9%) | | | | | |
India (0.9%) | | | | | |
Morgan Stanley Growth Fund | | | | | |
(Cost $3,415) (a)(o) | | 17,282,900 | | 11,192 | |
Short-Term Investments (16.1%) | | | | | |
Securities held as Collateral on Loaned Securities (12.0%) | | | | | |
Investment Company (9.6%) | | | | | |
Morgan Stanley Institutional Liquidity Money Market Portfolio — Institutional Class (o) | | 121,387,381 | | 121,388 | |
| | | | | |
| | Face | | | |
| | Amount | | | |
| | (000) | | | |
Repurchase Agreement (2.4%) | | | | | |
Goldman Sachs & Co., 0.06%, dated 12/31/08, due 1/2/09, repurchase price $29,820; fully collateralized by U.S. government agency securities at the date of this Portfolio of Investments as follows: Federal Home Loan Mortgage Corp., Gold Pools: rates ranging from 4.50% to 6.00%, due 11/1/19 - 12/1/38; Federal National Mortgage Association, Fixed Rate Mortgages: rates ranging from 4.00% - 7.00%, due 9/1/18 - 1/1/39; Government National Mortgage Association, Fixed Rate Mortgages: rates ranging from 4.50% to 11.50%, due 6/15/16 - 12/20/38, valued at $30,416. | $ | 29,820 | | 29,820 | |
| | | | 151,208 | |
| | | | | |
| | Shares | | | |
Investment Company (4.1%) | | | | | |
Morgan Stanley Institutional Liquidity Money Market Portfolio — Institutional Class (o) | | 50,786,430 | | 50,786 | |
Total Short-Term Investments (Cost $201,994) | | | | 201,994 | |
Total Investments (112.5%) (Cost $1,968,882) — | | | | | |
including $142,125 of Securities Loaned (v) | | | | 1,415,760 | |
Liabilities in Excess of Other Assets (-12.5%) | | | | (157,002 | ) |
Net Assets (100%) | | | | $1,258,758 | |
| | | | | | |
(a) Non-income producing security.
(c) All or a portion of security on loan at December 31, 2008.
(d) At December 31, 2008, the Portfolio held approximately $37,638,000 of fair valued securities, representing 3.0% of net assets. These securities have been fair valued as determined in good faith under the general supervision of the Portfolio’s Directors.
(l) Security has been deemed illiquid at December 31, 2008.
(o) See Note G to the financial statements regarding investment in Morgan Stanley Growth Fund and Morgan Stanley Institutional Liquidity Funds Money Market Portfolio — Institutional Class.
(v) The approximate market value and percentage of total investments, $997,339,000 and 70.4%, respectively, represent the securities that have been fair valued under the fair valuation policy for international investments as disclosed in Note A within the Notes to Financial Statements.
@ Value is less than $500.
ADR American Depositary Receipt
GDR Global Depositary Receipt
NVDR Non-Voting Depositary Receipt
Foreign Currency Exchange Contract Information:
The Portfolio had the following foreign currency exchange contract(s) open at period end:
| | | | | | | | | | | | | | Net |
Currency | | | | | | In | | | | Unrealized |
to | | | | | | Exchange | | | | Appreciation |
Deliver | | Value | | Settlement | | For | | Value | | (Depreciation) |
(000) | | (000) | | Date | | (000) | | (000) | | (000) | |
CZK | | 178,484 | | $ | 9,214 | | 3/19/09 | | USD | | 9,508 | | $ | 9,508 | | $ | 294 | | |
PLN | | 55,986 | | 18,744 | | 3/19/09 | | USD | | 19,015 | | 19,015 | | 271 | | |
TRY | | 599 | | 388 | | 1/2/09 | | USD | | 392 | | 392 | | 4 | | |
USD | | 75 | | 75 | | 1/2/09 | | HKD | | 583 | | 75 | | — | @ | |
USD | | 77 | | 77 | | 1/5/09 | | HKD | | 595 | | 77 | | — | @ | |
USD | | 67 | | 67 | | 1/2/09 | | MYR | | 233 | | 67 | | — | @ | |
USD | | 780 | | 780 | | 1/5/09 | | PLN | | 2,290 | | 773 | | (7 | ) | |
USD | | 626 | | 626 | | 1/6/09 | | PLN | | 1,854 | | 626 | | — | @ | |
USD | | 388 | | 388 | | 1/7/09 | | PLN | | 1,148 | | 387 | | (1 | ) | |
| | | | | $ | 30,359 | | | | | | | | | $ | 30,920 | | | $ | 561 | | |
| | | | | | | | | | | | | | | | |
| | | | | | | | | | | | | | | | | | | | | | | | | | |
CZK | — Czech Koruna |
HKD | — Hong Kong Dollar |
MYR | — Malaysian Ringgit |
PLN | — Polish Zloty |
TRY | — Turkish Lira |
USD | — United States Dollar |
24 | The accompanying notes are an integral part of the financial statements. | |
| 2008 Annual Report |
| |
| December 31, 2008 |
Investment Overview (unaudited)
Global Franchise Portfolio
The Global Franchise Portfolio (the “Portfolio”) seeks long-term capital appreciation by investing primarily in equity securities of issuers located throughout the world, that it believes have, among other things, resilient business franchises and growth potential. This Portfolio’s concentration of its assets in a smaller number of companies may subject it to greater investment risk than a portfolio with a larger number of companies. Foreign investing involves certain risks, including currency fluctuations and controls, restrictions on foreign investments, less governmental supervision and regulation, less liquidity and the potential for market volatility and political instability.
Performance
For the year ended December 31, 2008, the Portfolio had a total return based on net asset value and reinvestment of distributions per share of -28.88%, net of fees, for the Class I shares. The Portfolio’s Class I shares outperformed against its benchmark the Morgan Stanley Capital International (MSCI) World Index (the “Index”) which returned -40.71%.
Factors Affecting Performance
· The 12-month period was a very difficult year for global markets. All sectors had substantially negative returns, with financials, materials and industrials the weakest groups. Although the Portfolio also registered declines in each of its sectors, it preserved capital better than the Index during the period. Although past performance is no guarantee of future results, the Portfolio has historically generated a substantial portion of its outperformance by preserving capital in falling markets.
· Generally the Portfolio’s performance in 2008 was divided into two distinct periods, corresponding to the surge and then the pullback in commodity prices. In the first half of the year, the Portfolio underperformed the Index as strongly rising commodity prices created a wide dispersion in sector returns. While energy and materials produced solid gains, other sectors such as consumer staples (in which the Portfolio holds a large weighting) declined considerably as their margins were squeezed by rising input costs. However, market conditions shifted dramatically in July. Commodity prices began a swift retreat that persisted through the end of the year, and global stock markets endured a major correction in the third and fourth quarters. Sectors perceived to preserve capital better in economic downturns, such as consumer staples, began to rebound as lower energy and raw materials costs eased the pressure on consumer staples companies’ margins. In this environment, the Portfolio outperformed the Index in the second half of 2008.
· For the period overall, the Portfolio’s underweights in the market’s weakest sectors (financials and materials), along with good stock selection decisions in industrials, materials and financials, were beneficial to relative returns. This positioning allowed the Portfolio to register a significantly less negative return than the Index in the very difficult environment.
· However, some of the other sectors that outperformed the broad Index during the period, including health care and utilities, were held by the Portfolio in smaller proportions than in the Index. As a result, these underweight positions detracted from performance on a relative basis for the 12-month period.
· Positive contributors to performance during the period were Kao Corporation, McGraw-Hill, and Scotts Miracle-Gro.
· The largest detractors were Imperial Tobacco, British American Tobacco, Swedish Match, Harley-Davidson and Unilever.
Management Strategies
· The Portfolio’s turnover in 2008, at 15.3%, remained roughly in line with historical averages. During the year, we sold three of the Portfolio’s four pharmaceutical holdings. In our view, the strength of these franchises was eroding, given the anticipated patent expirations over the next several years. Purchases in 2008 included Procter & Gamble, Estee Lauder, Starbucks, eBay and McGraw Hill, and the repurchase of Danone. The recent market correction has presented us an opportunity to take positions in companies that we have been watching for some time but previously have been too expensive.
· We do not attempt to predict from a macro perspective the direction of the markets. Our focus remains on the Global Franchise philosophy of seeking exceptional quality at compelling value. As a result of the market correction, we are finding opportunities to add quality franchises to the Portfolio in companies that were previously not available to us for valuation reasons.
25
2008 Annual Report | |
| |
December 31, 2008 | |
Investment Overview (cont’d)
Global Franchise Portfolio
· We continue to seek investment opportunities in companies with strong business franchises protected by a dominant intangible asset. Additionally, we demand sound management, substantial free cash flow and growth potential. We invest in these high quality companies only when we can identify compelling value as measured by a current free cash flow yield in excess of the risk-free bond yield. We seek to deliver attractive returns while minimizing business and valuation risk. Our goal is for the Portfolio to outperform broadly-based benchmarks over the long term with less than average volatility.
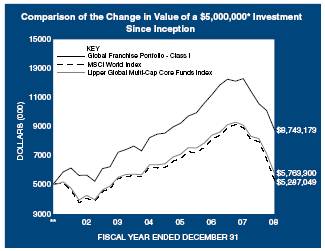
* Minimum Investment
** Commenced operations on November 28, 2001.
In accordance with SEC regulations, Portfolio’s performance shown assumes that all recurring fees (including management fees) were deducted and all dividends and distributions were reinvested. The performance of Class P shares will vary from the Class I shares based upon their different inception dates and will be negatively impacted by additional fees assessed to that class.
Performance Compared to the Morgan Stanley Capital International (MSCI) World Index(1) and the Lipper Global Multi-Cap Core Funds Index(2)
| | | | | Total Returns(3) | |
| | | | | Average Annual | |
| | One | | Five | | Since | |
| | Year | | Years | | Inception | (5) |
Portfolio — Class I (4) | | (28.88 | )% | 3.83 | % | 8.20 | % |
MSCI World Index | | (40.71 | ) | (0.51 | ) | 0.79 | |
Lipper Global Multi-Cap Core Funds Index | | (36.70 | ) | 0.88 | | 2.02 | |
| | | | | | | |
Portfolio — Class P (4) | | (29.00 | ) | 3.57 | | 7.91 | |
MSCI World Index | | (40.71 | ) | (0.51 | ) | 0.79 | |
Lipper Global Multi-Cap Core Funds Index | | (36.70 | ) | 0.88 | | 2.02 | |
Performance data quoted represents past performance, which is no guarantee of future results, and current performance may be lower or higher than the figures shown. Performance assumes that all dividends and distributions, if any, were reinvested. For the most recent month-end performance figures, please visit www.morganstanley.com/msim. Investment return and principal value will fluctuate so that Portfolio shares, when redeemed, may be worth more or less than their original cost. Total returns do not reflect the deduction of taxes that a shareholder would pay on Portfolio distributions or the redemption of Portfolio shares. Performance of share classes will vary due to difference in expenses.
(1) The Morgan Stanley Capital International (MSCI) World Index is a free float-adjusted market capitalization weighted index that is designed to measure the global equity market performance of developed markets. The term “free float” represents the portion of shares outstanding that are deemed to be available for purchase in the public equity markets by investors. The MSCI World Index currently consists of 23 developed market country indices. The performance of the Index is listed in U.S. dollars and assumes reinvestment of net dividends. The Index is unmanaged and its returns do not include any sales charges or fees. Such costs would lower performance. It is not possible to invest directly in an index.
(2) The Lipper Global Multi-Cap Core Funds Index is an equally weighted performance index of the largest qualifying funds (based on net assets) in the Lipper Global Multi-Cap Core Funds classification. The Index, which is adjusted for capital gains distributions and income dividends, is unmanaged and should not be considered an investment. There are currently 30 funds represented in this Index. As of the date of this report, the Portfolio was in the Lipper Global Multi-Cap Core Funds classification.
(3) Total returns for the Portfolio reflect fees waived and expenses reimbursed, if applicable, by the Adviser. Without such waivers and reimbursements, total returns would have been lower. Fee waivers and/or expense reimbursements are voluntary and the Adviser reserves the right to commence or terminate any waiver and/or reimbursement at any time.
(4) Commenced operations on November 28, 2001
(5) For comparative purposes, average annual since inception returns listed for the Indexes refer to the inception date or initial offering of the respective share class of the Portfolio, not the inception of the Index.
Portfolio Composition
| | Percentage of | |
Classification | | Total Investments | |
Tobacco | | 23.7 | % |
Food Products | | 17.3 | |
Household Products | | 10.1 | |
Media | | 9.3 | |
Beverages | | 8.5 | |
Other* | | 27.5 | |
Short-Term Investment | | 3.6 | |
Total Investments | | | 100.0 | % |
| | | | |
* Industries which do not appear in the above table, as well as those which represent less than 5% of total investments, if applicable, are included in the category labeled “Other”.
26
| 2008 Annual Report |
| |
| December 31, 2008 |
Portfolio of Investments
Global Franchise Portfolio
| | | | Value | |
| | Shares | | (000) | |
Common Stocks (96.6%) | | | | | |
Finland (2.2%) | | | | | |
Kone Oyj, Class B | | 82,062 | | $ | 1,799 | |
France (5.7%) | | | | | |
Groupe Danone | | 41,591 | | 2,510 | |
Pernod-Ricard S.A. | | 28,490 | | 2,113 | |
| | | | 4,623 | |
Ireland (5.0%) | | | | | |
C&C Group plc | | 354,111 | | 717 | |
Experian plc | | 524,593 | | 3,285 | |
| | | | 4,002 | |
Japan (3.2%) | | | | | |
Kao Corp. | | 86,000 | | 2,605 | |
Netherlands (7.7%) | | | | | |
Reed Elsevier N.V. | | 241,615 | | 2,847 | |
Wolters Kluwer N.V. | | 178,356 | | 3,368 | |
| | | | 6,215 | |
Sweden (4.2%) | | | | | |
Swedish Match AB | | 237,458 | | 3,399 | |
Switzerland (6.7%) | | | | | |
Nestle S.A. (Registered) | | 77,376 | | 3,050 | |
Novartis AG (Registered) | | 47,823 | | 2,396 | |
| | | | 5,446 | |
United Kingdom (28.7%) | | | | | |
British American Tobacco plc | | 253,849 | | 6,596 | |
Cadbury plc | | 345,602 | | 3,025 | |
Diageo plc | | 145,106 | | 2,019 | |
Imperial Tobacco Group plc | | 192,498 | | 5,142 | |
Reckitt Benckiser Group plc | | 80,472 | | 2,998 | |
Unilever plc | | 152,658 | | 3,469 | |
| | | | 23,249 | |
United States (33.2%) | | | | | |
Brown-Forman Corp., Class B | | 40,096 | | 2,064 | |
Career Education Corp. (a) | | 82,871 | | 1,487 | |
eBay, Inc. (a) | | 111,309 | | 1,554 | |
Estee Lauder Cos., Inc. (The) | | 63,823 | | 1,976 | |
Fortune Brands, Inc. | | 47,889 | | 1,977 | |
Harley-Davidson, Inc. | | 78,919 | | 1,339 | |
Kellogg Co. | | 44,171 | | 1,937 | |
McGraw-Hill Cos., Inc. (The) | | 54,101 | | 1,255 | |
Moody’s Corp. | | 69,437 | | 1,395 | |
Philip Morris International, Inc. | | 93,218 | | 4,056 | |
Procter & Gamble Co. | | 42,157 | | 2,606 | |
Scotts Miracle-Gro, Co. (The), Class A | | 61,783 | | 1,836 | |
Starbucks Corp. (a) | | 150,522 | | 1,424 | |
Weight Watchers International, Inc. | | 65,263 | | 1,920 | |
| | | | 26,826 | |
Total Common Stocks (Cost $91,641) | | | | 78,164 | |
Short-Term Investment (3.6%) | | | | | |
Investment Company (3.6%) | | | | | |
Morgan Stanley Institutional Liquidity Funds — Government Portfolio — Institutional Class | | | | | |
(Cost $2,897) (o) | | 2,896,582 | | | 2,897 | |
Total Investments (100.2%) (Cost $94,538) (v) | | | | 81,061 | |
Liabilities in Excess of Other Assets (-0.2%) | | | | (140 | ) |
Net Assets (100%) | | | | $ | 80,921 | |
(a) Non-income producing security.
(o) See Note G to the financial statements regarding investment in Morgan Stanley Institutional Liquidity Government Portfolio — Institutional Class.
(v) The approximate market value and percentage of total investments, $51,338,000 and 63.3%, respectively, represent the securities that have been fair valued under the fair valuation policy for international investments as disclosed in Note A within the Notes to Financial Statements.
Foreign Currency Exchange Contract Information:
The Portfolio had the following foreign currency exchange contract(s) open at period end:
| | | | | | | | | | | | Net | |
Currency | | | | | | In | | | | Unrealized | |
to | | | | | | Exchange | | | | Appreciation | |
Deliver | | | Value | | Settlement | | For | | | Value | | (Depreciation) | |
(000) | | | (000) | | Date | | (000) | | | (000) | | (000) | |
GBP | | 1,950 | | | $2,802 | | 1/26/09 | | USD | | 2,913 | | | | $2,913 | | | $111 | | |
GBP | | 1,950 | | 2,802 | | 1/26/09 | | USD | | 2,916 | | | | 2,916 | | | 114 | | |
GBP | | 445 | | 639 | | 1/26/09 | | USD | | 665 | | | | 665 | | | 26 | | |
GBP | | 1,960 | | 2,816 | | 1/26/09 | | USD | | 2,934 | | | | 2,934 | | | 118 | | |
| | | | | $9,059 | | | | | | | | | $9,428 | | | $369 | | |
| | | | | | | | | | | | | | | | | | | |
GBP | — | British Pound |
USD | — | United States Dollar |
| The accompanying notes are an integral part of the financial statements. | 27 |
2008 Annual Report | |
| |
December 31, 2008 | |
Investment Overview (unaudited)
Global Real Estate Portfolio
The Global Real Estate Portfolio (the “Portfolio”) seeks to provide current income and capital appreciation by investing primarily in equity securities of companies in the real estate industry located throughout the world, including real estate operating companies, real estate investment trusts and similar entities established outside the U.S. (foreign real estate companies). Foreign investing involves certain risks, including currency fluctuations and controls, restrictions on foreign investments, less governmental supervision and regulation, less liquidity and the potential for market volatility and political instability. The risks of investing in emerging-market countries are greater than the risks generally associated with foreign investments. In addition, the risks associated with ownership of real estate and the real estate industry in general include, fluctuations in the value of underlying property, defaults by borrowers or tenants, market saturation, decreases in market rents, interest rates, property taxes, increases in operating expenses and political or regulatory occurrences adversely affecting real estate.
Performance
For the year ended December 31, 2008, the Portfolio had a total return based on net asset value and reinvestment of distributions per share of -45.00% for the Class I shares, net of fees. The Portfolio’s Class I shares outperformed against the FTSE EPRA/NAREIT Global Real Estate Index — Net Total Return to U.S. Investors (the “Index”) which returned -47.83% and underperformed against the MSCI World Index which returned -40.71%.
Factors Affecting Performance
· The Portfolio outperformed the benchmark, the FTSE EPRA/NAREIT Global Real Estate Index — Net Total Return to U.S. Investors, for the period. Among the three regional portfolios, the Asian and U.S. portfolios contributed to performance, while the European portfolio detracted from returns. With regard to global allocation among the regions, the underweight to Europe (on average for the period) contributed to performance, while the overweight to Asia and underweight to the U.S. detracted from returns.
· In Asia, the Portfolio benefited from stock selection within and an underweight to Australia, an overweight to Japan and stock selection in Hong Kong; this was modestly offset by the overweight to Hong Kong.
· In Europe, the Portfolio benefited from stock selection within and an underweight to Austria and stock selection in France and Sweden. The benefit was offset by stock selection within and an overweight to the U.K. as well as an underweight to Belgium and Switzerland.
· In the U.S., the Portfolio benefited from stock selection in the shopping center, mall and office sectors as well as stock selection within (and an overweight to) the apartment sector. This was partially offset by an overweight to the hotel sector, an underweight to the storage and health care sectors and stock selection in the industrial sector.
Management Strategies
· The Portfolio is comprised of three regional portfolios with a global allocation which weights each of the three major regions (U.S., Europe and Asia) based on our view of the relative attractiveness of each region in terms of underlying real estate fundamentals and public market valuations. Moreover, each of the regional portfolios reflects our core investment philosophy as a real estate value investor, which results in the ownership of stocks that we believe provide the best valuation relative to their underlying real estate values, while maintaining portfolio diversification.
· Our company-specific research has led us to specific preferences for sub-segments within each of the property sectors and countries. At the end of the period, the Portfolio was overweight the Asian listed property sector, neutral to the European listed property sector and underweight the U.S. listed property sector.
· We believe the Asian listed property sector will continue to exhibit stable underlying property fundamentals and asset values. The overweight to the Asian region was predominated by the real estate operating companies (REOCs) in Hong Kong and Japan, which continue to trade at very large discounts to NAV. Despite only modest weakening in underlying fundamentals and favorable supply dynamics in the Hong Kong and Japanese real estate markets, the Hong Kong and Japanese REOCs experienced significant share price declines in the year. We continue to prefer the Asian REOCs, as we believe these companies continue to offer better value relative to the REITs and possess the ability to engage in value-added opportunities such as the development of new assets and redevelopment of existing assets, as opposed to the Asian REITs which are externally managed vehicles and limited to property ownership.
· The Portfolio was considerably underweight the Australian Listed Property Trust (LPT) sector, which ended the period trading at a discount to NAVs which still do not yet fully reflect prospective asset value declines.
· In Europe, stocks on the Continent posted large declines and ended the year trading at a discount to reported NAVs, which only reflect modest capital value declines since the start of the credit crisis. Property stocks in the
28
| 2008 Annual Report |
| |
| December 31, 2008 |
Investment Overview (cont’d)
Global Real Estate Portfolio
U.K. also experienced significant declines, and the stocks continue to trade at discounted valuations that appear too wide, especially since NAVs already reflect a sharp correction in asset values.
· Within Europe, the Portfolio continues to be underweight the Continent and overweight the U.K., as we believe the U.K. property market continues to offer better relative value.
· The Portfolio was underweight the U.S., which trades at a discount to NAVs based on consensus estimates of significant downward adjustment to asset values, and the market faces prospects for additional declines in underlying asset values as a result of the continued impairment of the credit markets and negative outlook for fundamentals given the economic recession. In contrast to the stable outlook for underlying property fundamentals in Asia-ex-Australia, in the U.S., Europe and Australia, there are expectations for substantial weakness in underlying property fundamentals and asset values. However, the key question to us remains the magnitude of asset value declines since there continues to be limited transactional evidence. This situation is due to the lack of liquidity for direct real estate assets, which has resulted in a wide bid-ask spread between buyers and sellers. In some sub-segments of these markets, we believe current share price valuations already more than reflect any prospective weakening in underlying fundamentals and asset values.
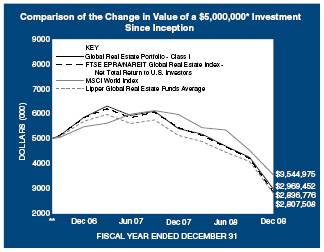
* Minimum Investment
** Commenced operations on August 30, 2006.
In accordance with SEC regulations, Portfolio’s performance shown assumes that all recurring fees (including management fees) were deducted and all dividends and distributions were reinvested. The performance of Class P, Class H, and Class L shares will vary from the Class I shares based upon their different inception dates and will be negatively impacted by additional fees assessed to those classes.
Performance Compared to the FTSE EPRA/NAREIT Global Real Estate Index — Net Total Return to U.S. Investors(1), the Morgan Stanley Capital International (MSCI) World Index(2) and the Lipper Global Real Estate Funds Average(3)
| | | Total Returns(4) | |
| | | | Average Annual | |
| | One | | Since | |
| | Year | | Inception | (8) |
Portfolio — Class I (5) | | (45.00 | )% | (19.99 | )% |
FTSE EPRA/NAREIT Global Real Estate Index — | | | | | |
Net Total Return to U.S. Investors | | (47.83 | ) | (21.54 | ) |
MSCI World Index | | (40.71 | ) | (13.68 | ) |
Lipper Global Real Estate Funds Average | | (45.33 | ) | (21.87 | ) |
| | | | | |
Portfolio — Class P (5) | | (45.15 | ) | (20.22 | ) |
FTSE EPRA/NAREIT Global Real Estate Index — | | | | | |
Net Total Return to U.S. Investors | | (47.83 | ) | (21.54 | ) |
MSCI World Index | | (40.71 | ) | (13.68 | ) |
Lipper Global Real Estate Funds Average | | (45.33 | ) | (21.87 | ) |
| | | | | |
| | | | Cumulative | |
| | | | Since | |
| | | | Inception | (8) |
Portfolio — Class H w/o sales charges (6) | | — | | (44.88 | ) |
Portfolio — Class H with maximum 4.75% sale charges (6) | | — | | (47.51 | ) |
FTSE EPRA/NAREIT Global Real Estate Index — Net Total Return to U.S. Investors | | — | | (47.68 | ) |
MSCI World Index | | — | | (40.32 | ) |
Lipper Global Real Estate Funds Average | | — | | (43.68 | ) |
| | | | | |
Portfolio — Class L (7) | | — | | (42.45 | ) |
FTSE EPRA/NAREIT Global Real Estate Index — Net Total Return to U.S. Investors | | — | | (43.95 | ) |
MSCI World Index | | — | | (36.63 | ) |
Lipper Global Real Estate Funds Average | | — | | (37.11 | ) |
| | | | | | |
Performance data quoted represents past performance, which is no guarantee of future results, and current performance may be lower or higher than the figures shown. Performance assumes that all dividends and distributions, if any, were reinvested. For the most recent month-end performance figures, please visit www.morganstanley.com/msim. Investment return and principal value will fluctuate so that Portfolio shares, when redeemed, may be worth more or less than their original cost. Total returns do not reflect the deduction of taxes that a shareholder would pay on Portfolio distributions or the redemption of Portfolio shares. Performance of share classes will vary due to difference in sales charges and expenses.
(1) The FTSE EPRA/NAREIT Global Real Estate Index — Net Total Return to U.S. investors is a market capitalization weighted index designed to reflect the stock performance of companies engaged in the North American, European and Asian real estate markets. The performance of the Index is listed in U.S. dollars and assumes reinvestment of dividends. “Net Total Return to U.S. investors” reflects a reduction in total returns after taking into account the withholding tax on dividends by certain foreign countries represented in the Index for periods after 1/31/05 (gross returns used prior to 1/31/05). The Index is unmanaged and its returns do not include any sales charges or fees. Such costs would lower performance. It is not possible to invest directly in an index.
(2) The Morgan Stanley Capital International (MSCI) World Index is a free float-adjusted market capitalization weighted index that is designed to measure the global equity market performance of developed markets. The term “free float” represents the portion of shares outstanding that are deemed to be available for purchase in the public equity markets by investors. The MSCI World Index currently consists of
29
2008 Annual Report | |
| |
December 31, 2008 | |
Investment Overview (cont’d)
Global Real Estate Portfolio
23 developed market country indices. The performance of the Index is listed in U.S. dollars and assumes reinvestment of net dividends. The Index is unmanaged and its returns do not include any sales charges or fees. Such costs would lower performance. It is not possible to invest directly in an index.
(3) The Lipper Global Real Estate Funds Average tracks the performance of all funds in the Lipper Global Real Estate Funds classification. The Average, which is adjusted for capital gains distributions and income dividends, is unmanaged and should not be considered an investment. As of the date of this report, the Portfolio was in the Lipper Global Real Estate Funds classification.
(4) Total returns for the Portfolio reflect fees waived and expenses reimbursed, if applicable, by the Adviser. Without such waivers and reimbursements, total returns would have been lower. Fee waivers and/or expense reimbursements are voluntary and the Adviser reserves the right to commence or terminate any waiver and/or reimbursement at any time.
(5) Commenced operations on August 30, 2006.
(6) Commenced operations on January 2, 2008.
(7) Commenced operations on June 16, 2008.
(8) For comparative purposes, average annual since inception returns listed for the Indexes refer to the inception date or initial offering of the respective share class of the Portfolio, not the inception of the Index.
Portfolio Composition*
| | Percentage of | |
Classification | | Total Investments | |
Diversified | | 37.9 | % |
Retail | | 16.3 | |
Office | | 14.8 | |
Residential | | 13.7 | |
Health Care | | 5.1 | |
Other** | | 10.7 | |
Short-Term Investment | | 1.5 | |
Total Investments | | | 100.0 | % |
| | | | |
* Percentages indicated are based upon total investments (excluding Securities held as collateral on Loaned Securities) as of December 31, 2008.
** Industries which do not appear in the above table, as well as those which represent less than 5% of total investments, if applicable, are included in the category labeled “Other”.
30
| 2008 Annual Report |
| |
| December 31, 2008 |
Portfolio of Investments
Global Real Estate Portfolio
| | | | Value | |
| | Shares | | (000) | |
Common Stocks (97.1%) | | | | | |
Australia (5.8%) | | | | | |
CFS Retail Property Trust REIT (c) | | 1,114,211 | | $ | 1,461 | |
GPT Group REIT | | 419,966 | | 272 | |
Stockland REIT (c) | | 1,003,864 | | 2,905 | |
Westfield Group REIT (c) | | 2,743,634 | | 25,279 | |
| | | | 29,917 | |
Austria (0.2%) | | | | | |
CA Immobilien Anlagen AG (a)(c) | | 50,567 | | 302 | |
Conwert Immobilien Invest SE (a)(c) | | 162,805 | | 731 | |
| | | | 1,033 | |
Brazil (0.4%) | | | | | |
BR Malls Participacoes S.A. (a) | | 482,540 | | 1,915 | |
Canada (0.2%) | | | | | |
Extendicare REIT | | 116,590 | | 553 | |
RioCan REIT | | 52,965 | | 586 | |
| | | | 1,139 | |
Finland (0.3%) | | | | | |
Citycon Oyj (c) | | 151,291 | | 355 | |
Sponda Oyj | | 226,132 | | 990 | |
| | | | 1,345 | |
France (5.2%) | | | | | |
Fonciere Des Regions REIT (c) | | 15,185 | | 1,039 | |
Gecina S.A. REIT (c) | | 23,647 | | 1,642 | |
ICADE REIT (c) | | 31,607 | | 2,631 | |
Klepierre REIT (c) | | 85,956 | | 2,107 | |
Silic REIT | | 23,708 | | 2,204 | |
Unibail-Rodamco REIT | | 117,313 | | 17,473 | |
| | | | 27,096 | |
Germany (0.3%) | | | | | |
Alstria Office AG REIT | | 185,691 | | 1,296 | |
Hong Kong (18.6%) | | | | | |
China Overseas Land & Investment Ltd. (c) | | 4,623,000 | | 6,499 | |
China Resources Land Ltd. (c) | | 4,485,000 | | 5,553 | |
Guangzhou R&F Properties Co., Ltd., Class H (c) | | 11,886,700 | | 13,287 | |
Hang Lung Properties Ltd. (c) | | 2,110,000 | | 4,628 | |
Henderson Land Development Co., Ltd. (c) | | 1,485,000 | | 5,547 | |
Hongkong Land Holdings Ltd. (c) | | 5,795,000 | | 14,519 | |
Hysan Development Co., Ltd. (c) | | 2,474,868 | | 4,019 | |
Kerry Properties Ltd. | | 4,895,220 | | 13,176 | |
Sun Hung Kai Properties Ltd. (c) | | 3,403,000 | | 28,614 | |
Swire Pacific Ltd., Class A (c) | | 89,500 | | 620 | |
| | | | 96,462 | |
Italy (0.2%) | | | | | |
Beni Stabili S.p.A. (c) | | 1,612,891 | | 1,127 | |
Risanamento S.p.A. (a) | | 258,173 | | 157 | |
| | | | 1,284 | |
Japan (17.4%) | | | | | |
Japan Real Estate Investment Corp. REIT | | 258 | | 2,319 | |
Mitsubishi Estate Co., Ltd. | | 1,916,000 | | 31,597 | |
Mitsui Fudosan Co., Ltd. | | 1,737,000 | | 28,865 | |
Nippon Building Fund, Inc. REIT | | 489 | | 5,367 | |
NTT Urban Development Corp. | | 5,634 | | 6,079 | |
Sumitomo Realty & Development Co., Ltd. (c) | | 1,089,000 | | 16,225 | |
| | | | 90,452 | |
Netherlands (1.7%) | | | | | |
Corio N.V. REIT | | 83,627 | | 3,834 | |
Eurocommercial Properties N.V. CVA REIT | | 29,499 | | 992 | |
ProLogis European Properties | | 205,934 | | 923 | |
Vastned Retail N.V. REIT | | 21,993 | | 1,103 | |
Wereldhave N.V. REIT (c) | | 23,701 | | 2,093 | |
| | | | 8,945 | |
Singapore (2.3%) | | | | | |
CapitaCommercial Trust REIT (c) | | 3,000 | | 2 | |
CapitaLand Ltd. | | 1,097,000 | | 2,410 | |
Macquarie Prime REIT | | 5,109,000 | | 1,848 | |
United Industrial Corp., Ltd. | | 8,725,000 | | 6,378 | |
Wheelock Properties Singapore Ltd. | | 1,476,000 | | 1,071 | |
| | | | 11,709 | |
Sweden (0.7%) | | | | | |
Castellum AB | | 127,786 | | 994 | |
Hufvudstaden AB, Class A | | 392,369 | | 2,762 | |
| | | | 3,756 | |
Switzerland (0.5%) | | | | | |
PSP Swiss Property AG (Registered) (a) | | 55,033 | | 2,744 | |
United Kingdom (7.0%) | | | | | |
Big Yellow Group plc REIT | | 469,512 | | 1,625 | |
British Land Co. plc REIT | | 852,274 | | 6,832 | |
Brixton plc REIT | | 914,584 | | 1,754 | |
Capital & Regional plc | | 441,930 | | 300 | |
Derwent London plc REIT | | 211,512 | | 2,222 | |
Grainger plc | | 424,691 | | 836 | |
Great Portland Estates plc REIT | | 290,164 | | 1,090 | |
Hammerson plc REIT | | 559,206 | | 4,332 | |
Invista Foundation Property Trust Ltd. REIT | | 77,300 | | 19 | |
Land Securities Group plc REIT | | 694,528 | | 9,257 | |
Liberty International plc REIT | | 340,659 | | 2,361 | |
Minerva plc (a) | | 712,164 | | 139 | |
Quintain Estates & Development plc | | 694,795 | | 371 | |
Safestore Holdings plc | | 735,221 | | 584 | |
Segro plc REIT | | 948,582 | | 3,393 | |
Shaftesbury plc REIT | | 47,642 | | 249 | |
Unite Group plc | | 405,751 | | 861 | |
Workspace Group plc REIT | | 87,560 | | 78 | |
| | | | 36,303 | |
United States (36.3%) | | | | | |
Acadia Realty Trust REIT | | 105,947 | | 1,512 | |
AMB Property Corp. REIT | | 138,689 | | 3,248 | |
Assisted Living Concepts, Inc., Class A (a) | | 310,387 | | 1,288 | |
AvalonBay Communities, Inc. REIT | | 240,488 | | 14,569 | |
Boston Properties, Inc. REIT | | 240,975 | | 13,254 | |
Brandywine Realty Trust REIT | | 2,924 | | 22 | |
Brookfield Properties Corp. | | 1,122,873 | | 8,680 | |
| | | | | | |
| The accompanying notes are an integral part of the financial statements. | 31 |
2008 Annual Report | |
| |
December 31, 2008 | |
Portfolio of Investments (cont’d)
Global Real Estate Portfolio
| | | | Value | |
| | Shares | | (000) | |
United States (cont’d) | | | | | |
Cabot Industrial Value Fund III, LP (a)(i) | | 221 | | $ | 111 | |
Camden Property Trust REIT | | 262,953 | | 8,241 | |
Care Investment Trust, Inc. REIT | | 36,365 | | 283 | |
DCT Industrial Trust, Inc. REIT | | 208,380 | | 1,054 | |
DiamondRock Hospitality Co. REIT | | 80,060 | | 406 | |
Douglas Emmett, Inc. REIT | | 57,630 | | 753 | |
Duke Realty Corp. REIT | | 219,759 | | 2,408 | |
Equity Lifestyle Properties, Inc. REIT (a) | | 100,671 | | 3,862 | |
Equity Residential REIT | | 374,923 | | 11,180 | |
Exeter Industrial Value Fund, LP (d) | | 800,000 | | 800 | |
Federal Realty Investment Trust REIT | | 126,154 | | 7,832 | |
Forest City Enterprises, Inc., Class A | | 380,881 | | 2,552 | |
HCP, Inc. REIT | | 193,146 | | 5,364 | |
Healthcare Realty Trust, Inc. REIT | | 342,507 | | 8,042 | |
Host Hotels & Resorts, Inc. REIT | | 1,048,764 | | 7,939 | |
LaSalle Hotel Properties REIT | | 15,630 | | 173 | |
Liberty Property Trust REIT | | 236,174 | | 5,392 | |
Macerich Co. (The) REIT | | 5,878 | | 107 | |
Mack-Cali Realty Corp. REIT | | 229,448 | | 5,621 | |
Morgans Hotel Group Co. (a) | | 122,919 | | 573 | |
Parkway Properties, Inc. REIT | | 902 | | 16 | |
Post Properties, Inc. REIT | | 249,293 | | 4,113 | |
PS Business Parks, Inc. REIT | | 22,123 | | 988 | |
Public Storage REIT | | 109,945 | | 8,741 | |
Ramco-Gershenson Properties Trust REIT | | 33,055 | | 204 | |
Regency Centers Corp. REIT | | 231,201 | | 10,797 | |
Senior Housing Properties Trust REIT | | 367,674 | | 6,589 | |
Simon Property Group, Inc. REIT | | 300,585 | | 15,970 | |
Sovran Self Storage, Inc. REIT | | 5,079 | | 183 | |
Starwood Hotels & Resorts Worldwide, Inc. | | 673,860 | | 12,062 | |
Strategic Hotels & Resorts, Inc. REIT | | 474,011 | | 796 | |
Taubman Centers, Inc. REIT | | 42,475 | | 1,081 | |
Ventas, Inc. REIT | | 107,300 | | 3,602 | |
Vornado Realty Trust REIT | | 130,930 | | 7,902 | |
| | | | 188,310 | |
Total Common Stocks (Cost $947,562) | | | | 503,706 | |
| | | | | |
| | No. of | | | |
| | Rights | | | |
Rights (0.0%) | | | | | |
Hong Kong (0.0%) | | | | | |
China Overseas Land & Investment Ltd.,
expires 1/21/09 (Cost $—) (a) | | 189,240 | | 71 | |
| | | | | |
| | Shares | | | |
Short-Term Investments (11.3%) | | | | | |
Securities held as Collateral on Loaned Securities (9.8%) | | | | | |
Investment Company (7.9%) | | | | | |
Morgan Stanley Institutional Liquidity Money Market Portfolio — Institutional Class (o) | | 40,941,177 | | 40,941 | |
| | | | | |
| | Face | | | |
| | Amount | | | |
| | (000) | | | |
Repurchase Agreement (1.9%) | | | | | | | |
Goldman Sachs & Co., 0.06%, dated 12/31/08, due 1/2/09, repurchase price $10,058; fully collateralized by U.S. government agency securities at the date of this Portfolio of Investments as follows: Federal Home Loan Mortgage Corp., Gold Pools: rates ranging from 4.50% to 6.00%, due 11/1/19 - 12/1/38; Federal National Mortgage Association, Fixed Rate Mortgages: rates ranging from 4.00% - 7.00%, due 9/1/18 - 1/1/39; Government National Mortgage Association, Fixed Rate Mortgages: rates ranging from 4.50% to 11.50%, due 6/15/16 - 12/20/38, valued at $10,259. | | $ | 10,058 | | | 10,058 | |
| | | | 50,999 | |
| | | | | |
| | Shares | | | |
Investment Company (1.5%) | | | | | |
Morgan Stanley Institutional Liquidity Money Market Portfolio — Institutional Class (o) | | 7,525,268 | | 7,525 | |
Total Short-Term Investments (Cost $58,524) | | | | 58,524 | |
Total Investments (108.4%) (Cost $1,006,086) — including $48,070 of Securities Loaned (v) | | | | 562,301 | |
Liabilities in Excess of Other Assets (-8.4%) | | | | (43,635) | |
Net Assets (100%) | | | | $518,666 | |
| | | | | | | | |
(a) Non-income producing security.
(c) All or a portion of security on loan at December 31, 2008.
(d) At December 31, 2008, the Portfolio held approximately $800,000 of fair valued securities, representing 0.2% of net assets. These securities have been fair valued as determined in good faith under procedures established by and under the general supervision of the Portfolio’s Directors.
(i) Restricted security valued at fair value and not registered under the Securities Act of 1933, Cabot Industrial Value Fund, LP was aquired on 6/08 and has a current cost basis of $111,000. At December 31, 2008, this security had an aggregate market value of 111,000 representing 0.02% of net assets.
(o) See Note G to the financial statements regarding investment in Morgan Stanley Institutional Liquidity Money Market Portfolio — Institutional Class.
(v) The approximate market value and percentage of total investments, $314,258,000 and 55.9%, respectively, represent the securities that have been fair valued under the fair valuation policy for international investments as disclosed in Note A within the Notes to Financial Statements.
@ Value is less than $500.
CVA Certificaten Van Aandelen
REIT Real Estate Investment Trust
32 | The accompanying notes are an integral part of the financial statements. | |
| 2008 Annual Report |
| |
| December 31, 2008 |
Portfolio of Investments (cont’d)
Global Real Estate Portfolio
Foreign Currency Exchange Contract Information:
The Portfolio had the following foreign currency exchange contract(s) open at period end:
| | | | | | | | | | | | Net | |
Currency | | | | | | In | | | | Unrealized | |
to | | | | | | Exchange | | | | Appreciation | |
Deliver | | Value | | Settlement | | For | | Value | | (Depreciation) | |
(000) | | (000) | | Date | | (000) | | (000) | | (000) | |
AUD | | 926 | | | $ 645 | | 1/5/09 | | USD | | 637 | | | | $ 637 | | | $(8 | ) | |
HKD | | 12,345 | | | 1,593 | | 1/5/09 | | USD | | 1,593 | | | | 1,593 | | | — | @ | |
HKD | | 4,404 | | | 568 | | 1/2/09 | | USD | | 568 | | | | 568 | | | — | @ | |
SGD | | 158 | | | 110 | | 1/5/09 | | USD | | 110 | | | | 110 | | | — | @ | |
SGD | | 117 | | | 81 | | 1/5/09 | | USD | | 81 | | | | 81 | | | — | @ | |
| | | | | $ 2,997 | | | | | | | | | | $2,989 | | | $(8 | ) | |
| | | | | | | | | | | | | | | | | | | | |
AUD — Australian Dollar
HKD — Hong Kong Dollar
SGD — Singapore Dollar
USD — United States Dollar
| The accompanying notes are an integral part of the financial statements. | 33 |
2008 Annual Report | |
| |
December 31, 2008 | |
Investment Overview (unaudited)
Global Value Equity Portfolio
The Global Value Equity Portfolio (the “Portfolio”) seeks long-term capital appreciation by investing primarily in equity securities of issuers throughout the world, including U.S. issuers. Foreign investing involves certain risks, including currency fluctuations and controls, restrictions on foreign investments, less governmental supervision and regulation, less liquidity and the potential for market volatility and political instability.
Performance
For the year ended December 31, 2008, the Portfolio had a total return based on net asset value and reinvestment of distributions per share of -41.82%, net of fees, for Class I shares. The Portfolio’s Class I shares underperformed against its benchmark, the Morgan Stanley Capital International (MSCI) World Index (the “Index”) which returned -40.71%.
Factors Affecting Performance
· Global equities declined precipitously during the period under review. In 2008, the U.S. market had its worst one-year performance since the 1930s. The complete reshuffling of Wall Street and dire global economic conditions were met with unprecedented policy response by governments and central banks around the world. The shift from inflation fears to deflation fears as the primary threat to the global economy’s recovery further impelled the massive fiscal and monetary stimulus. Falling commodity prices (since July 2008), declining home values and a substantial drop in consumer demand exerted downward pressure on prices such that deflation became policymakers’ chief concern.
· Although the interventions were initially met with disappointment among investors, equity prices appeared to stabilize in December and a key liquidity measure showed some improvement. However, certain “fear gauges” remained troubling at year end, including the CBOE VIX volatility index. Without more positive readings here, we believe any equity rally will be short-lived and substantial improvements in economic and financial conditions will be delayed.
· By the end of the period, most of the developed world had entered into recession, and outlooks remained gloomy. The U.S. and Europe grappled with a wave of negative economic data, while Japan continued to suffer from weak domestic demand and falling exports. The Asia Pacific region excluding Japan dealt with the impact of languishing growth both in the developed world and in China, which until then had served as the region’s economic engine.
· During the period, the Portfolio was well served by its defensive positioning, with overweights to health care and telecommunication services, and underweights to cyclical sectors such as materials, energy and industrials. As the global economic outlook became increasingly dire, negative sentiment fueled a strong sell-off in economically sensitive sectors. The Portfolio’s underweights there buffered the impact of those sectors’ substantial declines. At the same time, stock selection and relative overweights in both the health care (where the Portfolio holds predominantly pharmaceuticals stocks) and telecommunication services sectors added relative value, as these sectors outperformed the Index during the period.
· However, other positions were disappointments. Weaker than expected results from food producers and tobacco companies led to losses in the Portfolio’s consumer staples segment. These companies suffered from the expectation that high raw materials and energy costs earlier in 2008 would crimp profit margins. The financials sector was another significant detractor for the period. The benefit of an underweight to the sector was overwhelmed by the considerably negative impact of stock selection. On valuations, many of the financial stocks looked compellingly cheap. But with the credit crisis accelerating and the operating environment deteriorating much faster than anticipated, a number of the Portfolio’s holdings within the sector were negatively impacted.
Management Strategies
· At the end of November, the responsibility for the management of the Portfolio’s assets was assumed by another team, and the composition of the Portfolio changed to reflect the Global Franchise investment philosophy. The most noticeable change at year end was a significant reduction in the financials allocation. Generally, the Global Franchise management team avoids companies that rely on substantial leverage to generate returns on their capital and, as such, historically the team’s portfolios have not been invested in banks, insurance companies, or property companies.
· In keeping with the Global Franchise philosophy, the team seeks to invest in companies with strong business franchises protected by a dominant intangible asset. Additionally, the team demands sound management, substantial free cash flow and growth potential. The team invests in these high quality companies only when it can identify compelling value as measured by a current free cash flow yield in excess of the risk-free bond yield. The team seeks to deliver attractive returns while minimizing
34
| 2008 Annual Report |
| |
| December 31, 2008 |
Investment Overview (cont’d)
Global Value Equity Portfolio
business and valuation risk. The goal is for the Portfolio to outperform broadly-based benchmarks over the long term with less than average volatility.
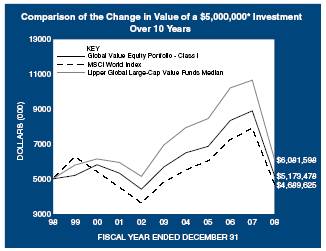
* Minimum Investment
In accordance with SEC regulations, Portfolio’s performance shown assumes that all recurring fees (including management fees) were deducted and all dividends and distributions were reinvested. The performance of Class P shares will vary from the Class I shares based upon their different inception dates and will be negatively impacted by additional fees assessed to that class.
Performance Compared to the Morgan Stanley Capital International (MSCI) World Index(1) and the Lipper Global Large-Cap Value Funds Median(2)
| | | Total Returns(3) | |
| | | | Average Annual | |
| | One | | Five | | Ten | | Since | |
| | Year | | Years | | Years | | Inception | (6) |
Portfolio — Class I (4) | | (41.82 | )% | (1.88 | ) | 0.34 | % | 7.36 | % |
MSCI World Index | | (40.71 | ) | (0.51 | ) | (0.64 | ) | 5.33 | |
Lipper Global Large-Cap Value Funds Median | | (43.19 | ) | (2.46 | ) | 0.30 | | 7.11 | |
Portfolio — Class P (5) | | (41.98 | ) | (2.14 | ) | 0.08 | | 4.32 | |
MSCI World Index | | (40.71 | ) | (0.51 | ) | (0.64 | ) | 3.30 | |
Lipper Global Large-Cap Value Funds Median | | (43.19 | ) | (2.46 | ) | 0.30 | | 4.19 | |
| | | | | | | | | | |
Performance data quoted represents past performance, which is no guarantee of future results, and current performance may be lower or higher than the figures shown. Performance assumes that all dividends and distributions, if any, were reinvested. For the most recent month-end performance figures, please visit www.morganstanley.com/msim. Investment return and principal value will fluctuate so that Portfolio shares, when redeemed, may be worth more or less than their original cost. Total returns do not reflect the deduction of taxes that a shareholder would pay on Portfolio distributions or the redemption of Portfolio shares. Performance of share classes will vary due to differences in expenses.
(1) The Morgan Stanley Capital International (MSCI) World Index is a free float-adjusted market capitalization weighted index that is designed to measure the global equity market performance of developed markets. The term “free float” represents the portion of shares outstanding that are deemed to be available for purchase in the public equity markets by investors. The MSCI World Index currently consists of 23 developed market country indices. The performance of the Index is listed in U.S. dollars and assumes reinvestment of net dividends. The Index is unmanaged and its returns do not include any sales charges or fees. Such costs would lower performance. It is not possible to invest directly in an index.
(2) The Lipper Global Large-Cap Value Funds Median tracks the performance of all funds in the Lipper Global Large-Cap Value Funds classification. The Median, which is adjusted for capital gains distribution and income dividends, is unmanaged and should not be considered an investment. As of the date of this report, the Portfolio was in the Lipper Global Large-Cap Value Funds classification.
(3) Total returns for the Portfolio reflect fees waived and expenses reimbursed, if applicable, by the Adviser. Without such waivers and reimbursements, total returns would have been lower. Fee waivers and/or expense reimbursements are voluntary and the Adviser reserves the right to commence or terminate any waiver and/or reimbursement at any time.
(4) Commenced operations on July 15, 1992
(5) Commenced operations on January 2, 1996
(6) For comparative purposes, average annual since inception returns listed for the Indexes refer to the inception date or initial offering of the respective share class of the Portfolio, not the inception of the Index.
Portfolio Composition**
| | Percentage of | |
Classification | | Total Investments | |
Tobacco | | 23.8 | % |
Food Products | | 17.5 | |
Household Products | | 10.3 | |
Media | | 9.4 | |
Beverages | | 8.7 | |
Other*** | | 28.1 | |
Short-Term Investment | | 2.2 | |
Total Investments | | | 100.0 | % |
| | | | |
** Percentages indicated are based upon total investments (excluding Securities held as collateral on Loaned Securities) as of December 31, 2008.
*** Industries which do not appear in the above table, as well as those which represent less than 5% of total investments, if applicable, are included in the category labeled “Other”.
35
2008 Annual Report | |
| |
December 31, 2008 | |
Portfolio of Investments
Global Value Equity Portfolio
| | | | Value | |
| | Shares | | (000) | |
Common Stocks (97.5%) | | | | | |
Finland (2.2%) | | | | | |
Kone Oyj, Class B (c) | | 36,816 | | $ | 807 | |
France (5.8%) | | | | | |
Groupe Danone (c) | | 18,659 | | 1,126 | |
Pernod-Ricard S.A. (c) | | 12,781 | | 948 | |
| | | | 2,074 | |
Ireland (5.0%) | | | | | |
C&C Group plc | | 158,443 | | 321 | |
Experian plc | | 235,352 | | 1,474 | |
| | | | 1,795 | |
Japan (3.3%) | | | | | |
Kao Corp. | | 39,000 | | 1,181 | |
Netherlands (7.8%) | | | | | |
Reed Elsevier N.V. | | 108,398 | | 1,277 | |
Wolters Kluwer N.V. (c) | | 80,017 | | 1,511 | |
| | | | 2,788 | |
Sweden (4.2%) | | | | | |
Swedish Match AB | | 106,533 | | 1,525 | |
Switzerland (6.8%) | | | | | |
Nestle S.A. (Registered) | | 34,713 | | 1,368 | |
Novartis AG (Registered) | | 21,455 | | 1,075 | |
| | | | 2,443 | |
United Kingdom (28.9%) | | | | | |
British American Tobacco plc | | 111,571 | | 2,899 | |
Cadbury plc | | 155,050 | | 1,357 | |
Diageo plc | | 68,023 | | 946 | |
Imperial Tobacco Group plc | | 86,361 | | 2,307 | |
Reckitt Benckiser Group plc | | 36,102 | | 1,345 | |
Rolls-Royce Group plc, C Shares (a) | | 4,500,610 | | 7 | |
Unilever plc | | 68,488 | | 1,556 | |
| | | | 10,417 | |
United States (33.5%) | | | | | |
Brown-Forman Corp., Class B | | 17,493 | | 901 | |
Career Education Corp. (a) | | 37,179 | | 667 | |
eBay, Inc. (a) | | 50,272 | | 702 | |
Estee Lauder Cos., Inc. (The) (c) | | 28,990 | | 897 | |
Fortune Brands, Inc. (c) | | 21,676 | | 895 | |
Harley-Davidson, Inc. (c) | | 35,872 | | 609 | |
Kellogg Co. | | 19,817 | | 869 | |
McGraw-Hill Cos., Inc. (The) | | 24,592 | | 570 | |
Moody’s Corp. | | 31,587 | | 635 | |
Philip Morris International, Inc. | | 41,821 | | 1,820 | |
Procter & Gamble Co. (c) | | 18,913 | | 1,169 | |
Scotts Miracle-Gro, Co. (The), Class A | | 27,718 | | 824 | |
Starbucks Corp. (a) | | 68,293 | | 646 | |
Weight Watchers International, Inc. (c) | | 29,279 | | 861 | |
| | | | 12,065 | |
Total Common Stocks (Cost $32,842) | | | | 35,095 | |
Short-Term Investments (11.6%) | | | | | |
Securities held as Collateral on Loaned Securities (9.3%) | | | | | |
Investment Company (7.5%) | | | | | |
Morgan Stanley Institutional Liquidity Funds — Money Market Portfolio — Institutional Class (o) | | 2,694,327 | | 2,694 | |
| | | | | |
| | Face | | | |
| | Amount | | | |
| | (000) | | | |
Repurchase Agreement (1.8%) | | | | | |
Goldman Sachs & Co., 0.06%, dated 12/31/08, due 1/2/09, repurchase price $662; fully collateralized by U.S. government agency securities at the date of this Portfolio of Investments as follows: Federal Home Loan Mortgage Corp., Gold Pools: rates ranging from 4.50% to 6.00%, due 11/1/19 - 12/1/38; Federal National Mortgage Association, Fixed Rate Mortgages: rates ranging from 4.00% - 7.00%, due 9/1/18 - 1/1/39; Government National Mortgage Association, Fixed Rate Mortgages: rates ranging from 4.50% to 11.50%, due 6/15/16 - 12/20/38, valued at $675. | | $ 662 | | 662 | |
| | | | 3,356 | |
| | | | | |
| | Shares | | | |
Investment Company (2.3%) | | | | | |
Morgan Stanley Institutional Liquidity Money Market Portfolio — Institutional Class (o) | | 804,637 | | 805 | |
Total Short-Term Investments (Cost $4,161) | | | | 4,161 | |
Total Investments (109.1%) (Cost $37,003) —
Including $3,217 of Securities Loaned (v) | | | | 39,256 | |
Liabilities in Excess of Other Assets (-9.1%) | | | | (3,258) | |
Net Assets (100%) | | | | $ | 35,998 | |
(a) Non-income producing security.
(c) All or a portion of security on loan at December 31, 2008.
(o) See Note G to the financial statements regarding investment in Morgan Stanley Institutional Liquidity Money Market Portfolio — Institutional Class.
(v) The approximate market value and percentage of total investments, $23,024,000 and 58.7%, respectively, represent the securities that have been fair valued under the fair valuation policy for international investments as disclosed in Note A within the Notes to Financial Statements.
36 | The accompanying notes are an integral part of the financial statements. | |
| 2008 Annual Report |
| |
| December 31, 2008 |
Portfolio of Investments (cont’d)
Global Value Equity Portfolio
Foreign Currency Exchange Contract Information:
The Portfolio had the following foreign currency exchange contract(s) open at period end:
Currency
to
Deliver
(000) | | Value
(000) | | Settlement
Date | | In
Exchange
For
(000) | | Value
(000) | | Net
Unrealized
Appreciation
(Depreciation)
(000) | |
GBP | 700 | | | $1,006 | | | 1/26/09 | | USD | 1,039 | | | $1,039 | | | $ 33 | | |
GBP | 650 | | | 934 | | | 1/26/09 | | USD | 965 | | | 965 | | | 31 | | |
GBP | 700 | | | 1,006 | | | 1/26/09 | | USD | 1,039 | | | 1,039 | | | 33 | | |
GBP | 700 | | | 1,006 | | | 1/26/09 | | USD | 1,040 | | | 1,040 | | | 34 | | |
| | | | $3,952 | | | | | | | | | $4,083 | | | $131 | | |
| | | | | | | | | | | | | | | | | | | |
GBP — British Pound
USD — United States Dollar
The accompanying notes are an integral part of the financial statements. | 37 |
2008 Annual Report | |
| |
December 31, 2008 | |
Investment Overview (unaudited)
International Equity Portfolio
The International Equity Portfolio (the “Portfolio”) seeks long-term capital appreciation by investing primarily in equity securities of non-U.S. issuers. Foreign investing involves certain risks, including currency fluctuations and controls, restrictions on foreign investments, less governmental supervision and regulation, less liquidity and the potential for market volatility and political instability. The risks of investing in emerging-market countries are greater than the risks generally associated with foreign investments.
Performance
For the year ended December 31, 2008, the Portfolio had a total return based on net asset value and reinvestment of distributions per share of -33.12% net of fees, for Class I shares. The Portfolio’s Class I shares outperformed against its benchmark, the Morgan Stanley Capital International (MSCI) EAFE Index (the “Index”) which returned -43.38%.
Factors Affecting Performance
· The Index rose 6.01% in December, most of which was generated by U.S. dollar weakness as the rise was a more muted 1.2% in local currency terms. This brought the Index return for 2008 to -43.4% in U.S. dollar terms — the largest ever collapse in the EAFE Index over a one-year period.
· Currency movements had a significant impact on U.S. dollar-based returns among the various local markets. The old order of strength was re-established with the yen in the vanguard (+13% vs. U.S. dollar) and sterling (-19% vs. U.S. dollar) in the rear. This transformed the Japanese stock market’s local return of -43% for the year into one of the least negative in dollar terms at -30%, and the U.K.’s local return of -31% into a crunching - -50% in U.S. dollars. Beyond the travails of the large markets there was chaos in some smaller markets, particularly on the euro periphery where a decade or more of easy money had monstrously inflated immature banking systems. Years of massive increases in bank balance sheets came home to roost in Ireland (-73%), Austria (-69%) and Greece (-67%), where only inclusion in the euro zone stood between them and the fate of Iceland (whose market fell 87% in dollar terms).
· The banking crisis was the determining feature of 2008, and as bank nationalizations followed bank bail-outs, the market had to face the potential for unlimited dilution and for share prices to fall to zero in “broken” banks. Additionally, it was also the year where the banking crisis went far beyond subprime mortgages and spread to every corner of economic activity. Cyclical sectors that had previously been considered immune were massively downgraded by the market and declined sharply. One of the most surprising features of 2008 was the degree of loss in sectors with traditional defensive characteristics like consumer staples, telecommunications and utilities.
Unlike previous recent bear markets, such as the Asian crisis in 1998 and the tech-media-telecom (TMT) crash of 2001-2003, the degree of forced selling and the impenetrability of the looming storm clouds meant there were no safe havens in which to hide.
Management Strategies
· The Portfolio’s positioning in anticipation of financial and cyclical sector weakness served it well in 2008 on a relative basis. The underweights in European and Australian financials, commodity materials, capital goods, the emerging markets (where the Portfolio had zero exposure), and consumer discretionary sectors added value. Positive stock selection was significant in our financial, materials and technology holdings. In particular, our Japanese financials were significantly insulated from losses in Western securities; however, this was offset by continued weakness in our Japanese industrials and technology positions as the yen strengthened. Our consumer staples positions declined with the sector in the general panic, and those domiciled in the U.K. particularly suffered in dollar terms as the sterling depreciated, despite their predominantly non- sterling based profits. Our cash position and hedging strategy proved profitable in an absolute return sense.
· We believe that the first central issue that markets will have to face in 2009 will be the viciousness of profit evaporation in cyclical sectors and companies. While there is a consensus that profits will be weak in cyclicals, we believe the potential weakness is woefully underestimated. Despite the recent sales declines in capital equipment and other industrials, inventories continue to build. As a result, we anticipate that sales declines and inventory write-offs will increase and cash flows will turn more steeply negative.
· The second major issue for 2009 in our view will be the impact on banks of the vast surplus of capacity that has accumulated in manufacturing during the boom years of 2004-2007. Even if governments can kick-start the global economy, which we doubt, we believe working off this excess capacity will take much longer and cyclicals will remain off the table for some time. We also believe that, simply put, banks have hardly raised enough capital
| 2008 Annual Report |
| |
| December 31, 2008 |
Investment Overview (cont’d)
International Equity Portfolio
to deal with their securities writedowns of 2008 and will continue to restrict lending wherever possible to lower their leverage levels. The likely failure of the banking system to pass on the credit so keenly offered by central banks will mean systemic bank nationalizations in places like the U.K. and Ireland is a real possibility this year.
· Finally, can emerging markets come to the rescue in 2009? We believe emerging markets do not have the same degree of risk in their finance industries as Western markets, but their exposure to the secondary effects of these fireworks is likely to be just as problematic on their still relatively expensive stock markets.
· As always, our key reference point for investing is valuation. In the cyclical areas of the market we believe valuation levels have moved back to discounting average mid-cycle margins. We think a scenario far worse than this is likely over the medium term and so, in the main, we believe valuations there are not yet attractive. The exception to this is Japan, where valuation levels are lower, but here the strength of the yen means that cyclical exporters are right to be discounting additional weakness. We believe Western banks remain dangerous for the reasons explained above. Defensive sectors such as consumer staples, however, with defendable (and growing) free cash streams valued on a free cash flow yield of 7% do look attractive, particularly given the disinflation bias we think is highly probable for the global economy. We feel that a relative re-rating of defensives is due after the indiscriminate destruction of 2008. Overall, we continue to feel pessimistic about the market’s ability to shrug off the effects of a massive structural withdrawal of credit, and remain defensively positioned in the best business franchises we can find at good to excellent prices.
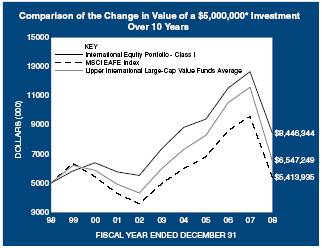
* Minimum Investment
In accordance with SEC regulations, Portfolio’s performance shown assumes that all recurring fees (including management fees) were deducted and all dividends and distributions were reinvested. The performance of Class P shares will vary from the Class I shares based upon their different inception dates and will be negatively impacted by additional fees assessed to that class.
Performance Compared to the Morgan Stanley Capital International (MSCI) EAFE Index(1) and the Lipper International Large-Cap Value Funds Average(2)
| | | Total Returns(3) | |
| | | | Average Annual | |
| | One
Year | | Five
Years | | Ten
Years | | Since
Inception | (6) |
Portfolio – Class I (4) | | (33.12 | )% | 2.82 | % | 5.38 | % | 8.93 | % |
MSCI EAFE Index | | (43.38 | ) | 1.66 | | 0.80 | | 3.03 | |
Lipper International Large-Cap Value Funds Average | | (43.78 | ) | 1.69 | | 3.31 | | 8.17 | |
Portfolio – Class P (5) | | (33.21 | ) | 2.58 | | 5.14 | | 7.72 | |
MSCI EAFE Index | | (43.38 | ) | 1.66 | | 0.80 | | 2.63 | |
Lipper International Large-Cap Value Funds Average | | (43.78 | ) | 1.69 | | 3.31 | | 5.79 | |
| | | | | | | | | | |
Performance data quoted represents past performance, which is no guarantee of future results, and current performance may be lower or higher than the figures shown. Performance assumes that all dividends and distributions, if any, were reinvested. For the most recent month-end performance figures, please visit www.morganstanley.com/msim. Investment return and principal value will fluctuate so that Portfolio shares, when redeemed, may be worth more or less than their original cost. Total returns do not reflect the deduction of taxes that a shareholder would pay on Portfolio distributions or the redemption of Portfolio shares. Performance of share classes will vary due to difference in expenses.
2008 Annual Report | |
| |
December 31, 2008 | |
Investment Overview (cont’d)
International Equity Portfolio
(1) The Morgan Stanley Capital International (MSCI) EAFE Index (Europe, Australasia, Far East) is a free float-adjusted market capitalization index that is designed to measure the international equity market performance of developed markets, excluding the US & Canada. The term “free float” represents the portion of shares outstanding that are deemed to be available for purchase in the public equity markets by investors. The MSCI EAFE Index curently consists of 21 developed market country indices. The performance of the Index is listed in U.S. dollars and assumes reinvestment of net dividends. The Index is unmanaged and its returns do not include any sales charges or fees. Such costs would lower performance. It is not possible to invest directly in an index.
(2) The Lipper International Large-Cap Value Funds Average tracks the performance of all funds in the Lipper International Large-Cap Value Funds classification. The Average, which is adjusted for capital gains distributions and income dividends, is unmanaged and should not be considered an investment. As of the date of this report, the Portfolio was in the Lipper International Large-Cap Value Funds classification.
(3) Total returns for the Portfolio reflect fees waived and expenses reimbursed, if applicable, by the Adviser. Without such waivers and/or reimbursements, total returns would have been lower. Fee waivers and/or expense reimbursements are voluntary and the Adviser reserves the right to commence or terminate any waiver and/or reimbursement at any time.
(4) Commenced operations on August 4, 1989
(5) Commenced operations on January 2, 1996
(6) For comparative purposes, average annual since inception returns listed for the Indexes refer to the inception date or initial offering of the respective share class of the Portfolio, not the inception of the Index.
Portfolio Composition*
| | Percentage of | |
Classification | | Total Investments | |
Oil, Gas & Consumable Fuels | | 10.2 | % |
Food Products | | 7.7 | |
Pharmaceuticals | | 6.7 | |
Tobacco | | 6.2 | |
Electronic Equipment & Instruments | | 5.9 | |
Insurance | | 5.0 | |
Other** | | 53.5 | |
Short-Term Investment | | | 4.8 | |
Total Investments | | | 100.0 | % |
* | Percentages indicated are based upon total investments (excluding Securities held as collateral on Loaned Securities) as of December 31, 2008. |
** | Industries which do not appear in the above table, as well as those which represent less than 5% of total investments, if applicable, are included in the category labeled “Other”. |
| 2008 Annual Report |
| |
| December 31, 2008 |
Portfolio of Investments
International Equity Portfolio
| | | | Value | |
| | Shares | | (000) | |
Common Stocks (93.9%) | | | | | |
Australia (3.6%) | | | | | |
AMP Ltd. | | 7,502,580 | | $ 28,522 | |
Foster’s Group Ltd. | | 5,764,385 | | 22,176 | |
Orica Ltd. | | 674,055 | | 6,618 | |
OZ Minerals Ltd. (d) | | 44,323,307 | | 18,265 | |
Santos Ltd. | | 3,990,606 | | 41,706 | |
| | | | 117,287 | |
Austria (0.7%) | | | | | |
Telekom Austria AG | | 1,694,331 | | 24,490 | |
Belgium (0.4%) | | | | | |
KBC Groep N.V. | | 402,948 | | 12,171 | |
Canada (0.9%) | | | | | |
EnCana Corp. | | 644,309 | | 29,729 | |
Finland (0.5%) | | | | | |
Nokia Oyj (c) | | 1,018,799 | | 15,794 | |
France (6.8%) | | | | | |
ArcelorMittal (c) | | 405,776 | | 9,781 | |
Electricite de France (c) | | 1,202,197 | | 69,873 | |
France Telecom S.A. (c) | | 664,186 | | 18,578 | |
Legrand S.A. (c) | | 2,200,936 | | 42,291 | |
Total S.A. (c) | | 917,435 | | 50,016 | |
Vallourec (c) | | 296,406 | | 33,712 | |
| | | | 224,251 | |
Germany (5.6%) | | | | | |
Bayer AG (c) | | 865,029 | | 50,816 | |
Continental AG (a) | | 250,579 | | 25,382 | |
E.ON AG (c) | | 1,418,550 | | 57,362 | |
Porsche Automobil Holding SE | | | | | |
(Non-Voting Shares) (c) | | 136,603 | | 10,642 | |
RWE AG (c) | | 456,071 | | 40,999 | |
| | | | 185,201 | |
Greece (0.9%) | | | | | |
OPAP S.A. | | 1,059,423 | | 30,478 | |
Hong Kong (0.4%) | | | | | |
Esprit Holdings Ltd. | | 2,583,500 | | 14,726 | |
Ireland (1.5%) | | | | | |
CRH plc | | 1,961,453 | | 49,503 | |
Italy (2.2%) | | | | | |
ENI S.p.A. | | 2,087,446 | | 49,464 | |
UniCredit S.p.A. | | 9,166,527 | | 22,820 | |
| | | | 72,284 | |
Japan (27.6%) | | | | | |
Asatsu-DK, Inc. (c) | | 647,085 | | 14,507 | |
Astellas Pharma, Inc. | | 856,300 | | 34,844 | |
Canon, Inc. | | 428,100 | | 13,439 | |
Chiba Bank Ltd. (The) | | 3,900,000 | | 24,368 | |
Fukuoka Financial Group, Inc. | | 5,631,000 | | 24,527 | |
Hoya Corp. (c) | | 2,669,800 | | 46,379 | |
INPEX Corp. | | 4,568 | | 36,090 | |
JSR Corp. (c) | | 1,228,300 | | 13,824 | |
Kao Corp. | | 1,007,000 | | | 30,495 | |
Keyence Corp. (c) | | 290,100 | | 59,400 | |
Komatsu Ltd. | | 834,200 | | 10,567 | |
Kyocera Corp. | | 239,600 | | 17,285 | |
Mitsubishi Electric Corp. | | 5,323,000 | | 33,310 | |
Mitsubishi Estate Co., Ltd. | | 2,335,000 | | 38,507 | |
Mitsui Sumitomo Insurance Group Holdings, Inc. | | 1,588,600 | | 50,666 | |
Murata Manufacturing Co., Ltd. (c) | | 1,128,800 | | 44,249 | |
NGK Spark Plug Co., Ltd. (c) | | 3,559,000 | | 28,523 | |
Nintendo Co., Ltd. | | 44,000 | | 16,905 | |
Nitto Denko Corp. | | 757,700 | | 14,557 | |
NTT DoCoMo, Inc. | | 21,494 | | 42,371 | |
Omron Corp. | | 1,936,700 | | 25,994 | |
Rohm Co., Ltd. | | 682,100 | | 34,443 | |
Sega Sammy Holdings, Inc. (c) | | 1,574,000 | | 18,264 | |
Sekisui House Ltd. (c) | | 3,997,000 | | 34,986 | |
Sumitomo Mitsui Financial Group, Inc. (c) | | 9,193 | | 39,822 | |
T&D Holdings, Inc. | | 1,965,950 | | 82,433 | |
Taiyo Nippon Sanso Corp. | | 5,776,000 | | 44,524 | |
Teijin Ltd. (c) | | 4,334,000 | | 12,251 | |
Toyota Motor Corp. | | 643,700 | | 21,070 | |
| | | | 908,600 | |
Netherlands (4.3%) | | | | | |
Akzo Nobel N.V. | | 995,361 | | 41,046 | |
CSM N.V. (c) | | 1,000,281 | | 16,070 | |
Unilever N.V. CVA | | 3,503,508 | | 84,891 | |
| | | | 142,007 | |
Spain (2.0%) | | | | | |
Telefonica S.A. | | 2,951,310 | | 66,155 | |
Sweden (0.3%) | | | | | |
Ssab Svenskt Stal AB, Class A (c) | | 949,597 | | 8,364 | |
Switzerland (9.8%) | | | | | |
Givaudan S.A. (Registered) | | 22,306 | | 17,572 | |
Holcim Ltd. (Registered) (c) | | 662,899 | | 38,169 | |
Nestle S.A. (Registered) | | 3,155,236 | | 124,356 | |
Novartis AG (Registered) | | 1,227,834 | | 61,520 | |
Roche Holding AG (Genusschein) | | 456,984 | | 70,345 | |
UBS AG (Registered) (a) | | 830,602 | | 12,047 | |
| | | | 324,009 | |
United Kingdom (25.5%) | | | | | |
BG Group plc | | 2,218,585 | | 30,802 | |
BHP Billiton plc | | 3,870,456 | | 72,907 | |
BP plc | | 7,174,526 | | 54,973 | |
British American Tobacco plc | | 3,859,534 | | 100,284 | |
British Land Co. plc REIT | | 1,966,935 | | 15,767 | |
Cadbury plc | | 2,795,494 | | 24,472 | |
Drax Group plc | | 818,593 | | 6,636 | |
Hays plc | | 34,939,263 | | 35,224 | |
Imperial Tobacco Group plc | | 3,794,176 | | 101,354 | |
Intercontinental Hotels Group plc | | 4,403,562 | | 35,830 | |
Ladbrokes plc | | 5,337,007 | | 14,274 | |
Lonmin plc | | 1,514,669 | | 19,996 | |
| | | | | | |
| The accompanying notes are an integral part of the financial statements. | 41 |
2008 Annual Report | |
| |
December 31, 2008 | |
Portfolio of Investments (cont’d)
International Equity Portfolio
| | | | Value | |
| | Shares | | (000) | |
United Kingdom (cont’d) | | | | | |
National Grid plc | | 709,740 | | $ 7,014 | |
Reckitt Benckiser Group plc | | 2,089,669 | | 77,850 | |
Reed Elsevier plc | | 5,928,800 | | 43,214 | |
Royal Bank of Scotland Group plc | | 9,537,505 | | 6,895 | |
Royal Dutch Shell plc, Class A | | 1,519,499 | | 39,603 | |
Scottish & Southern Energy plc | | 1,347,091 | | 23,719 | |
Smiths Group plc | | 3,089,754 | | 39,781 | |
Vodafone Group plc | | 32,534,330 | | 65,495 | |
Wolseley plc | | 4,156,534 | | 23,175 | |
| | | | 839,265 | |
United States (0.9%) | | | | | |
Dr. Pepper Snapple Group, Inc. (a) | | 1,767,407 | | 28,720 | |
Total Common Stocks (Cost $3,826,005) | | | | 3,093,034 | |
Short-Term Investments (13.1%) | | | | | |
Securities held as Collateral on Loaned Securities (8.4%) | | | | | |
Investment Company (6.7%) | | | | | |
Morgan Stanley Institutional Liquidity Money Market Portfolio — Institutional Class (o) | | 220,548,120 | | 220,548 | |
| | | | | |
| | Face | | | |
| | Amount | | | |
| | (000) | | | |
Repurchase Agreement (1.7%) | | | | | |
Goldman Sachs & Co., 0.06%, dated 12/31/08, due 1/2/09, repurchase price $54,180; fully collateralized by U.S. government agency securities at the date of this Portfolio of Investments as follows: Federal Home Loan Mortgage Corp., Gold Pools: rates ranging from 4.50% to 6.00%, due 11/1/19 - 12/1/38; Federal National Mortgage Association, Fixed Rate Mortgages: rates ranging from 4.00% - 7.00%, due 9/1/18 - 1/1/39; Government National Mortgage Association, Fixed Rate Mortgages: rates ranging from 4.50% to 11.50%, due 6/15/16 - 12/20/38, valued at $55,264. | | $ 54,180 | | 54,180 | |
| | | | 274,728 | |
| | | | | |
| | Shares | | | |
Investment Company (4.7%) | | | | | |
Morgan Stanley Institutional Liquidity Money Market Portfolio — Institutional Class (o) | | 155,575,139 | | 155,575 | |
Total Short-Term Investments (Cost $430,303) | | | | 430,303 | |
Total Investments (107.0%) (Cost $4,256,308) — including $261,509 of Securities Loaned (v) | | | | 3,523,337 | |
Liabilities in Excess of Other Assets (-7.0%) | | | | (229,437 | ) |
Net Assets (100%) | | | | $3,293,900 | |
(a) | Non-income producing security. |
(c) | All or a portion of security on loan at December 31, 2008. |
(d) | At December 31, 2008, the Portfolio held approximately $18,265,000 of fair valued securities, representing 0.6% of net assets. These securities have been fair valued as determined in good faith under procedures established by and under the general supervision of the Portfolio’s Directors. |
(o) | See Note G to the financial statements regarding investment in Morgan Stanley Institutional Liquidity Money Market Portfolio — Institutional Class. |
(v) | The approximate market value and percentage of total investments, $3,016,320,000 and 85.6%, respectively, represent the securities that have been fair valued under the fair valuation policy for international investments as disclosed in Note A within the Notes to Financial Statements. |
CVA | Certificaten Van Aandelen |
REIT | Real Estate Investment Trust |
Foreign Currency Exchange Contract Information:
The Portfolio had the following foreign currency exchange contract(s) open at period end:
Currency
to
Deliver
(000) | | Value
(000) | | Settlement
Date | | In
Exchange
For
(000) | | Value
(000) | | Net
Unrealized
Appreciation
(Depreciation)
(000) | |
GBP | 52,000 | | | $ 74,748 | | | 1/12/09 | | AUD | 115,852 | | | $ 80,707 | | | | $ 5,959 | | |
GBP | 52,000 | | | 74,749 | | | 1/12/09 | | EUR | 65,315 | | | 90,763 | | | | 16,014 | | |
GBP | 26,000 | | | 37,374 | | | 1/12/09 | | SGD | 67,730 | | | 46,999 | | | | 9,625 | | |
| | | | $186,871 | | | | | | | | | $218,469 | | | | $31,598 | | |
AUD — Australian Dollar
EUR — Euro
GBP — British Pound
SGD — Singapore Dollar
42 | The accompanying notes are an integral part of the financial statements. | |
| 2008 Annual Report |
| |
| December 31, 2008 |
Investment Overview (unaudited)
International Growth Active Extension Portfolio
The International Growth Active Extension Portfolio (the “Portfolio”) seeks long-term capital appreciation with a secondary objective of income. The Adviser seeks to construct a diversified portfolio primarily consisting of equity securities of issuers located in countries other than the United States using a quantitative security selection model and fundamental analysis. In addition to purchasing equity securities (i.e., taking long positions), the Adviser attempts to identify stocks that it believes will underperform relative to the average stock in the MSCI EAFE Index and will sell these securities short on behalf of the Portfolio.
Investments in foreign markets entail special risks such as currency, political, economic, and market risks. The risks of investing in emerging-market countries are greater than the risks generally associated with foreign investments. Short sales expose the Portfolio to the risk that it will be required to cover its short positions at a time when securities have appreciated in value, thus resulting in a loss to the portfolio. Leverage may cause the Portfolio’s net asset value to be more volatile than if it had not been leveraged because leverage tends to magnify the effect of any increases or decreases in the value of Portfolio’s securities. The Portfolio cannot assure you that the use of leverage will result in a higher return on your investment.
Performance
For the year ended December 31, 2008, the Portfolio had a total return based on net asset value and reinvestment of distributions per share of -54.13%, net of fees, for Class I shares. The Portfolio’s Class I shares underperformed against its benchmark, the MSCI EAFE Index (the “Index”) which returned -43.38% for the same period.
Factors Affecting Performance
· International equity markets experienced record price declines in calendar year 2008, fueled by the global financial maelstrom, frozen credit markets, and high volatility in the world’s commodity prices. For the year ending December 31, 2008, the Index showed a net total return of -43.38%, the biggest yearly decline in the 39-year history of the Index.
· In 2008, all regional benchmarks, along with the Index, had negative returns. Within EAFE, the Asia Pacific Ex-Japan region was down the most in the year - -50.50%. Japan was down the least in the year -29.21%, helped by the strong yen. EAFE sector returns were down universally as well for the year. In 2008, health care was the best performing sector on a relative basis -18.66%, while financials was the worst performing sector -54.87%. Additionally, investors in foreign shares were disadvantaged by global central banks that were slow to cut rates relative to the U.S. Federal Reserve, which has lowered interest rates by 5.0% since the beginning of 2007. The U.S. dollar gained against most foreign currencies including 4.4% versus the euro and 35.9% versus the pound; however, the dollar lost 18.9% versus the yen for the year.
· Underperformance in the Portfolio in 2008 can be attributed to selections in Japan and Europe. Additionally, in Japan, the strengthening yen negatively impacted returns due to the Portfolio’s underweight in the country relative to the Index and positions in Japanese exporters. For example, the Portfolio held a long position in the world’s second largest camera maker, which cut its full-year net income forecast by 40% in the fourth quarter, citing lower investment by chipmakers and a stronger yen. A short position in a Japanese rail operator also detracted from performance, as the company boosted its full year sales forecast after revealing its plan to lift its stake in a travel agency. In Europe, bank stock performance ebbed for much of the year. Long positions in the Portfolio that underperformed included a large French bank, which was under pressure to increase its shareholder equity at year end after a disappointing fourth quarter earnings release and a regulatory challenge to a planned acquisition, and a leading Greek lender, which posted a lower third-quarter profit on higher impairment costs and plans to tap the Greek government’s liquidity support plan. Finally, a short position in a French clothing and handbag designer detracted from performance as takeover speculation boosted its shares.
· While the Asia Pacific ex-Japan region was the worst performing region in absolute terms, it was the best performing region in the Portfolio relative to the Index in the year. A long position in an Australian health care company, which is the world’s second largest maker of blood plasma products, performed well on announced plans to boost research spending at the fastest pace in four years to accelerate the development of flu vaccines and drugs for cancer and rheumatoid arthritis in anticipation of rising demand. A short position in New Zealand’s largest phone company helped performance as the company announced both a decline in prices for calling and Internet services and rising costs to meet government regulations.
43
2008 Annual Report | |
| |
December 31, 2008 | |
Investment Overview (cont’d)
International Growth Active Extension Portfolio
· On a sector basis, Portfolio holdings in the telecommunications sector were the largest underperformers relative to the Index for the year. A long position in a large Nordic phone company slumped after the company agreed in October to buy 60% of an Indian telecom. We believed this strategy increased the company’s overall risk profile and the position was sold in the fourth quarter. The financials sector also contributed to the Portfolio’s relative underperformance for the year. In addition to the aforementioned banks, a long position in Norway’s largest publicly traded insurer lagged after it reported its first quarterly loss in more than five years as weakening financial markets reduced the value of its investments.
· Performance in the materials sector was positive relative to Index for the year. A long position in the world’s largest maker of carbon and graphite products was additive, as the company reported a third-quarter profit increase of 70% on demand from steel and aluminum customers as well as from a price increase in its graphite electrodes, which are used in smelting furnaces. A short position in a Greek cement company also helped performance as the stock price fell on higher production costs and slowing demand.
Management Strategies
· While the initial impact of the financial crisis was directly on the U.S. economy, the surprise in 2008 was the subsequent global scale of the impact and collective decline of international equity markets. During the year, a broad number of country indexes fell by more than 40%, including Germany, France, Japan, Hong Kong, China and India. Given the broad-based market sell-off, our high-quality, predominantly large-cap growth investment style faced stiff headwinds in the latter part of the third quarter and in the beginning of the fourth quarter as investors indiscriminately sold highly liquid equities, value was briefly in favor, and lower-quality stocks outperformed higher-quality stocks. These conditions contributed to the Portfolio’s relative underperformance.
· The outlook for a sustained recovery in non-U.S. equity markets is contingent on credit market improvements in the U.S. and abroad, which we began to see toward the end of the year. For example, over the last five weeks of 2008 (November 24th to December 31st), the Index rallied 10.72%. As global markets began to digest the massive fiscal and monetary policy efforts, various classes of bond spreads to government bonds declined. Equity market volatility dropped below its November peak, providing further stability to the equity markets. While the economic news may continue to deteriorate into 2009, we believe equity markets may steady. Stocks typically move earlier, quicker, and sharper, than business and economic fundamentals. Given the uncertain economic conditions, we believe investors may gravitate toward growth stocks and their stable cash flow generation. Additionally, in our view, growth companies’ relatively healthy cash balances will also help reduce their vulnerability to tight credit conditions. Given our bottom-up investment process of building a diversified portfolio comprised of high-quality growth stocks, we believe the Portfolio is well positioned in the current economic environment.
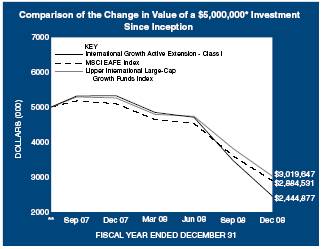
* | Minimum Investment |
** | Commenced operations on July 31, 2007. |
In accordance with SEC regulations, Portfolio’s performance shown assumes that all recurring fees (including management fees) were deducted and all dividends and distributions were reinvested. The performance of Class P, Class H, and Class L shares will vary from the Class I shares based upon their different inception dates and will be negatively impacted by additional fees assessed to those classes.
44
| 2008 Annual Report |
| |
| December 31, 2008 |
Investment Overview (cont’d)
International Growth Active Extension Portfolio
Performance Compared to the Morgan Stanley Capital International (MSCI) EAFE Index(1) and the Lipper International Large-Cap Growth Funds Index(2)
| | Total Returns(3) | |
| | | | Average Annual |
| | One | | Since | |
| | Year | | Inception | (7) |
Portfolio – Class I (4) | | (54.13 | )% | (39.60 | )% |
MSCI EAFE Index | | (43.38 | ) | (32.15 | ) |
Lipper International Large-Cap Growth Funds Index | | (42.68 | ) | (29.95 | ) |
| | | | | |
Portfolio – Class P (4) | | (54.48 | ) | (39.96 | ) |
MSCI EAFE Index | | (43.38 | ) | (32.15 | ) |
Lipper International Large-Cap Growth Funds Index | | (42.68 | ) | (29.95 | ) |
| | | | | |
| | | | Cumulative | |
| | | | Since | |
| | | | Inception | (7) |
Portfolio – Class H w/o sales charges (5) | | — | | (54.42 | ) |
Portfolio – Class H with maximum 4.75% sales charges (5) | | — | | (56.59 | ) |
MSCI EAFE Index | | — | | (43.38 | ) |
Lipper International Large-Cap Growth Funds Index | | — | | (42.34 | ) |
| | | | | |
Portfolio – Class L (6) | | — | | (50.96 | ) |
MSCI EAFE Index | | — | | (38.46 | ) |
Lipper International Large-Cap Growth Funds Index | | — | | (38.54 | ) |
Performance data quoted represents past performance, which is no guarantee of future results, and current performance may be lower or higher than the figures shown. Performance assumes that all dividends and distributions, if any, were reinvested. For the most recent month-end performance figures, please visit www.morganstanley.com/msim. Investment return and principal value will fluctuate so that Portfolio shares, when redeemed, may be worth more or less than their original cost. Total returns do not reflect the deduction of taxes that a shareholder would pay on Portfolio distributions or the redemption of Portfolio shares. Performance of share classes will vary due to difference in sales charges and expenses.
(1) The Morgan Stanley Capital International (MSCI) EAFE Index (Europe, Australasia, Far East) is a free float-adjusted market capitalization index that is designed to measure the international equity market performance of developed markets, excluding the US & Canada. The term “free float” represents the portion of shares outstanding that are deemed to be available for purchase in the public equity markets by investors. The MSCI EAFE Index currently consists of 21 developed market country indices. The performance of the Index is listed in U.S. dollars and assumes reinvestment of net dividends. The Index is unmanaged and its returns do not include any sales charges or fees. Such costs would lower performance. It is not possible to invest directly in an index.
(2) The Lipper International Large-Cap Growth Funds Index is an equally weighted performance index of the largest qualifying funds (based on net assets) in the Lipper International Large-Cap Growth Funds classification. The Index, which is adjusted for capital gains distributions and income dividends, is unmanaged and should not be considered an investment. There are currently 10 funds represented in this Index. As of the date of this report, the Portfolio was in the Lipper International Large-Cap Growth Funds classification.
(3) Total returns for the Portfolio reflect fees waived and expenses reimbursed, if applicable, by the Adviser. Without such waivers and reimbursements, total returns would have been lower. Fee waivers and/or expense reimbursements are voluntary and the Adviser reserves the right to commence or terminate any waiver and/or reimbursement at any time.
(4) Commenced operations on July 31, 2007
(5) Commenced operations on January 2, 2008
(6) Commenced operations on June 16, 2008
(7) For comparative purposes, average annual since inception returns listed for the Indexes refer to the inception date or initial offering of the respective share class of the Portfolio, not the inception of the Index.
Portfolio Composition
| | Percentage of | |
Classification | | Total Investments | |
Commercial Banks | | 10.9 | % |
Oil, Gas & Consumable Fuels | | 6.7 | |
Pharmaceuticals | | 6.1 | |
Health Care Equipment & Supplies | | 5.4 | |
Other* | | 70.7 | |
Short-Term Investment | | | 0.2 | |
Total Investments | | | 100.0 | % |
* | Industries which do not appear in the above table, as well as those which represent less than 5% of total investments, if applicable, are included in the category labeled “Other”. |
45
2008 Annual Report | |
| |
December 31, 2008 | |
Portfolio of Investments
International Growth Active Extension Portfolio
| | | | Value | |
| | Shares | | (000) | |
Long Positions (130.7%) | | | | | |
Common Stocks (128.5%) | | | | | |
Australia (3.6%) | | | | | |
BHP Billiton Ltd. (q) | | 3,924 | | $ 83 | |
CSL Ltd. | | 4,121 | | 97 | |
| | | | 180 | |
Austria (3.2%) | | | | | |
Erste Group Bank AG (q) | | 2,900 | | 68 | |
Vienna Insurance Group | | 2,712 | | 94 | |
| | | | 162 | |
Canada (3.5%) | | | | | |
EnCana Corp. (q) | | 1,850 | | 85 | |
Petrobank Energy & Resources Ltd. (a) | | 2,500 | | 41 | |
Research In Motion Ltd. (a)(q) | | 1,200 | | 49 | |
| | | | 175 | |
Denmark (1.9%) | | | | | |
Vestas Wind Systems A/S (a) | | 1,571 | | 93 | |
Egypt (1.0%) | | | | | |
Orascom Construction Industries GDR (q) | | 986 | | 50 | |
Finland (3.6%) | | | | | |
Fortum Oyj (q) | | 4,131 | | 89 | |
Kone Oyj, Class B (q) | | 4,120 | | 90 | |
| | | | 179 | |
France (13.0%) | | | | | |
ArcelorMittal | | 1,780 | | 43 | |
AXA S.A. (q) | | 3,855 | | 86 | |
BNP Paribas (q) | | 1,636 | | 69 | |
Cie Generale d’Optique Essilor International S.A. | | 3,685 | | 173 | |
LVMH Moet Hennessy Louis Vuitton S.A. (q) | | 1,198 | | 81 | |
Total S.A. (q) | | 3,695 | | 201 | |
| | | | 653 | |
Germany (14.5%) | | | | | |
Adidas AG | | 2,395 | | 92 | |
Bayer AG | | 1,485 | | 87 | |
E.ON AG | | 4,955 | | 200 | |
Linde AG | | 1,638 | | 139 | |
SAP AG | | 2,736 | | 98 | |
SGL Carbon AG (a) | | 3,359 | | 115 | |
| | | | 731 | |
Greece (3.2%) | | | | | |
Coca-Cola Hellenic Bottling Co. S.A. | | 6,296 | | 92 | |
National Bank of Greece S.A. | | 3,760 | | 70 | |
| | | | 162 | |
Hong Kong (8.6%) | | | | | |
Bank of East Asia Ltd. | | 30,800 | | 65 | |
China Resources Power Holdings Co., Ltd. | | 52,000 | | 101 | |
CNOOC Ltd. | | 104,000 | | 99 | |
Esprit Holdings Ltd. | | 13,500 | | 77 | |
Parkson Retail Group Ltd. | | 81,000 | | 92 | |
| | | | 434 | |
Indonesia (0.3%) | | | | | |
Bumi Resources Tbk PT | | 186,500 | | 16 | |
Ireland (1.7%) | | | | | |
Ryanair Holdings plc ADR (a) | | 3,000 | | 87 | |
Israel (2.4%) | | | | | |
Teva Pharmaceutical Industries Ltd. ADR (q) | | 2,900 | | 123 | |
Japan (20.8%) | | | | | |
Canon, Inc. (q) | | 3,300 | | 104 | |
FamilyMart Co., Ltd. | | 2,900 | | 126 | |
Fast Retailing Co., Ltd. | | 1,100 | | 160 | |
Komatsu Ltd. (q) | | 6,300 | | 80 | |
Mitsubishi Estate Co., Ltd. | | 6,000 | | 99 | |
Nikon Corp. | | 4,000 | | 48 | |
Nippon Electric Glass Co., Ltd. | | 9,000 | | 47 | |
Rakuten, Inc. (a) | | 139 | | 88 | |
Shin-Etsu Chemical Co., Ltd. (q) | | 2,000 | | 92 | |
Shionogi & Co., Ltd. | | 1,000 | | 26 | |
Stanley Electric Co., Ltd. | | 6,900 | | 73 | |
Terumo Corp. (q) | | 2,200 | | 103 | |
| | | | 1,046 | |
Luxembourg (1.4%) | | | | | |
Millicom International Cellular S.A. (q) | | 1,600 | | 72 | |
Mexico (1.7%) | | | | | |
America Movil S.A.B. de C.V., Class L ADR (q) | | 2,700 | | 84 | |
Netherlands (2.6%) | | | | | |
Reed Elsevier N.V. (q) | | 10,951 | | 129 | |
Norway (0.9%) | | | | | |
Storebrand ASA | | 18,812 | | 46 | |
Portugal (3.9%) | | | | | |
Banco Espirito Santo S.A. (Registered) | | 11,800 | | 111 | |
Jeronimo Martins SGPS S.A. | | 15,209 | | 84 | |
| | | | 195 | |
Singapore (2.6%) | | | | | |
DBS Group Holdings Ltd. | | 12,000 | | 71 | |
Keppel Corp. Ltd. | | 19,000 | | 58 | |
| | | | 129 | |
Spain (1.9%) | | | | | |
Banco Santander S.A. | | 9,752 | | 94 | |
Sweden (1.6%) | | | | | |
Tele2 AB, Class B | | 8,876 | | 79 | |
Switzerland (14.6%) | | | | | |
ABB Ltd. (Registered) (a)(q) | | 5,787 | | 87 | |
EFG International AG (q) | | 4,356 | | 78 | |
Nestle S.A. (Registered) (q) | | 5,552 | | 219 | |
Roche Holding AG (Genusschein) (q) | | 1,081 | | 167 | |
SGS S.A. (Registered) (q) | | 175 | | 183 | |
| | | | 734 | |
Taiwan (1.8%) | | | | | |
Delta Electronics, Inc. | | 47,080 | | 92 | |
46 | The accompanying notes are an integral part of the financial statements. | |
| 2008 Annual Report |
| |
| December 31, 2008 |
Portfolio of Investments (cont’d)
International Growth Active Extension Portfolio
| | | | Value | |
| | Shares | | (000) | |
United Kingdom (14.2%) | | | | | |
G4S plc | | 33,259 | | $ 99 | |
HSBC Holdings plc | | 10,178 | | 97 | |
Man Group plc | | 12,068 | | 42 | |
Prudential plc (q) | | 14,128 | | 86 | |
Reckitt Benckiser Group plc (q) | | 4,482 | | 167 | |
SABMiller plc (q) | | 4,657 | | 78 | |
Smith & Nephew plc | | 12,582 | | 80 | |
Standard Chartered plc (q) | | 5,099 | | 65 | |
| | | | 714 | |
Total Common Stocks (Cost $10,893) | | | | 6,459 | |
| | | | | |
| | No. of | | | |
| | Rights | | | |
Rights (0.2%) | | | | | |
Singapore (0.2%) | | | | | |
DBS Group Holdings Ltd., expires 1/20/09 | | | | | |
(Cost $—) (a) | | 6,000 | | 13 | |
| | | | | |
| | No. of | | | |
| | Warrants | | | |
Warrant (1.6%) | | | | | |
India (1.6%) | | | | | |
Bharti Airtel Ltd., expires 3/17/11 | | | | | |
(Cost $129) (a)(e) | | 5,500 | | 81 | |
| | | | | |
| | Shares | | | |
Short-Term Investment (0.2%) | | | | | |
Investment Company (0.2%) | | | | | |
Morgan Stanley Institutional Liquidity Money Market Portfolio — Institutional Class
(Cost $12) (o) | | 11,683 | | 12 | |
Total Investments (130.5%) (Cost $11,034) (v) | | | | 6,565 | |
Liabilities in Excess of Other Assets (-30.5%) | | | | (1,536 | ) |
Net Assets (100%) | | | | $ 5,029 | |
Short Positions (34.4%)* | | | | | |
Common Stocks (32.4%) | | | | | |
Belgium (0.9%) | | | | | |
Solvay S.A., Class A | | 586 | | 44 | |
France (5.0%) | | | | | |
BioMerieux | | 657 | | 55 | |
Hermes International | | 329 | | 46 | |
Legrand S.A. | | 4,100 | | 79 | |
Pernod-Ricard S.A. | | 965 | | 71 | |
| | | | 251 | |
Germany (1.2%) | | | | | |
Fraport AG Frankfurt Airport Services Worldwide | | 1,444 | | 63 | |
Hong Kong (1.0%) | | | | | |
Sino Land Co. | | 48,000 | | 50 | |
Italy (2.7%) | | | | | |
Lottomtica S.p.A. | | 2,714 | | 67 | |
Mediaset S.p.A. | | 11,816 | | 67 | |
| | | | 134 | |
Japan (9.0%) | | | | | |
Dai Nippon Printing Co., Ltd. | | 7,000 | | 77 | |
Daiwa Securities Group, Inc. | | 10,000 | | 60 | |
Kintetsu Corp. | | 24,000 | | 110 | |
Ono Pharmaceutical Co., Ltd. | | 1,100 | | 57 | |
Sompo Japan Insurance, Inc. | | 11,000 | | 81 | |
Toyota Motor Corp. | | 2,100 | | 69 | |
| | | | 454 | |
Mexico (0.9%) | | | | | |
Wal-Mart de Mexico S.A.B. de C.V., Class V | | 16,900 | | 45 | |
New Zealand (0.9%) | | | | | |
Telecom Corp. of New Zealand Ltd. | | 32,298 | | 43 | |
Sweden (3.6%) | | | | | |
Svenska Handelsbanken AB, Class A | | 4,194 | | 68 | |
Telefonaktiebolaget LM Ericsson, Class B | | 8,647 | | 66 | |
Volvo AB, Class B | | 8,400 | | 47 | |
| | | | 181 | |
Switzerland (4.3%) | | | | | |
Givaudan S.A. (Registered) | | 88 | | 69 | |
Kaba Holding AG | | 355 | | 88 | |
Lindt & Spruengli AG | | 33 | | 61 | |
| | | | 218 | |
United Kingdom (2.9%) | | | | | |
GlaxoSmithKline plc | | 4,047 | | 75 | |
Kingfisher plc | | 36,210 | | 71 | |
| | | | 146 | |
Total Common Stocks (Proceeds $2,163) | | | | 1,629 | |
Investment Company (2.0%) | | | | | |
United States (2.0%) | | | | | |
Vanguard Emerging Markets ETF (Cost $175) | | 4,200 | | 100 | |
Total Investment Companies (Proceeds $175) | | | | 100 | |
Total Short Positions (Proceeds $2,338) | | | | $ 1,729 | |
* | Percentage is based on Net Assets. |
(a) | Non-income producing security. |
(e) | 144A security — Certain conditions for public sale may exist. Unless otherwise noted, these securities are deemed to be liquid. |
(o) | See Note G to the financial statements regarding investment in Morgan Stanley Institutional Liquidity Money Market Portfolio — Institutional Class. |
(q) | Securities are pledged with a broker as collateral for short sales. |
(v) | The approximate market value and percentage of total investments, $6,099,000 and 92.8%, respectively, represent the securities that have been fair valued under the fair valuation policy for international investments as disclosed in Note A within the Notes to Financial Statements. |
@ | Value is less than $500. |
| The accompanying notes are an integral part of the financial statements. | 47 |
2008 Annual Report
December 31, 2008
Portfolio of Investments (cont’d)
International Growth Active Extension Portfolio
Foreign Currency Exchange Contract Information:
The Portfolio had the following foreign currency exchange contract(s) open at period end:
Currency
to
Deliver
(000) | | Value
(000) | | Settlement
Date | | In
Exchange
For
(000) | | Value
(000) | | Net
Unrealized
Appreciation
(Depreciation)
(000) | |
USD | 9 | | | $ 9 | | | 1/6/09 | | CHF | 10 | | | $ 9 | | | | $(— | )@ | |
USD | 1 | | | 1 | | | 1/7/09 | | CHF | 1 | | | 1 | | | | (— | )@ | |
| | | | $10 | | | | | | | | | $10 | | | | $(— | )@ | |
CHF — Swiss Franc
USD — United States Dollar
The Portfolio had the following futures contract(s) open at period end:
| | Number
of
Contracts | | Value
(000) | | Expiration
Date | | Net
Unrealized
Appreciation
(Depreciation)
(000) | |
Long: | | | | | | | | | | |
TOPIX Index | | | | | | | | | | |
(Japan) | | 2 | | $190 | | Mar-09 | | $10 | | |
| | | | | | | | | | |
Short: | | | | | | | | | | |
DJ Euro STOXX 50 | | | | | | | | | | |
(Germany) | | (5) | | (170) | | Mar-09 | | | (6 | ) | |
| | | | | | | | | $ 4 | | |
Contracts for Difference:
The Portfolio had the following contracts for difference open at period end:
Contracts to Buy/Sell | | | | | | Shares | | Net
Unrealized
Appreciation
(Depreciation)
(000) | |
Titan Cement Co. | | | | | | (2,446 | ) | | $52 | | |
LG Display Co., Ltd. | | | | | | (3,170 | ) | | 29 | | |
Tesco plc | | | | | | 28,927 | | | | (9 | ) | |
| | | | | | | | | $72 | | |
48 | The accompanying notes are an integral part of the financial statements. | |
| 2008 Annual Report |
| |
| December 31, 2008 |
Investment Overview (unaudited)
International Growth Equity Portfolio
The International Growth Equity Portfolio (the “Portfolio”) seeks long-term capital appreciation, with a secondary objective of income by investing primarily in a diversified portfolio of equity securities of issuers located in countries other than the U.S. Foreign investing involves certain risks, including currency fluctuations and controls, restrictions on foreign investments, less governmental supervision and regulation, less liquidity and the potential for market volatility and political instability. The risks of investing in emerging-market countries are greater than the risks generally associated with foreign investments.
Performance
For the year ended December 31, 2008, the Portfolio had a total return based on net asset value and reinvestment of distributions per share of -48.70%, net of fees, for Class I shares. The Portfolio’s Class I shares underperformed against its benchmark, the Morgan Stanley Capital International (MSCI) EAFE Index (the “Index”) which returned -43.38%.
Factors Affecting Performance
· International equity markets experienced record price declines in calendar year 2008, fueled by the global financial maelstrom, frozen credit markets, and high volatility in the world’s commodity prices. For the year ending December 31, 2008, the Index showed a net total return of -43.38%, the biggest yearly decline in the 39-year history of the Index.
· In 2008, all regional benchmarks, along with the MSCI Emerging Markets Index, had negative returns. Within EAFE, the Asia Pacific Ex-Japan region was down the most in the year -50.50%. Japan was down the least in the year -29.21%, helped by the strong yen. EAFE sector returns were down universally as well for the year. In 2008, health care was the best performing sector on a relative basis - -18.66%, while financials was the worst performing sector -54.87%. Additionally, investors in foreign shares were disadvantaged by global central banks that were slow to cut rates relative to the U.S. Federal Reserve, which has lowered interest rates by 5.0% since the beginning of 2007. The U.S. dollar gained against most foreign currencies including 4.4% versus the euro and 35.9% versus the pound; however, the dollar lost 18.9% versus the yen for the year.
· Underperformance in the Portfolio in 2008 can be attributed to selections in Japan and Europe. Additionally, in Japan, the strengthening yen negatively impacted returns due to the Portfolio’s underweight in the country relative to the Index and positions in Japanese exporters. For example, the Portfolio held a position in the world’s second largest camera maker, which cut its full-year net income forecast by 40% in the fourth quarter citing lower investment by chipmakers and a stronger yen. In Europe, bank stock performance ebbed for much of the year. Positions in the Portfolio that underperformed included a large French bank, which was under pressure to increase its shareholder equity at year end after a disappointing fourth quarter earnings release and a regulatory challenge to a planned acquisition; an Austrian bank, which lowered its 2008 earnings outlook due to the decline in global markets and subsequent widening of credit spreads; and a leading Greek lender, which posted a lower third-quarter profit on higher impairment costs and plans to tap the Greek government’s liquidity support plan.
· While the Asia Pacific ex-Japan region was the worst performing region in absolute terms, it was the best performing region in the Portfolio relative to the Index in the year. A position in an Australian health care company, which is the world’s second largest maker of blood plasma products, performed well on announced plans to boost research spending at the fastest pace in four years to accelerate the development of flu vaccines and drugs for cancer and rheumatoid arthritis in anticipation of rising demand.
· On a sector basis, Portfolio holdings in the telecommunications sector were the largest underperformers relative to the Index for the year. A large Nordic phone company slumped after agreeing in October to buy 60% of an Indian telecom. We believed this strategy increased the company’s overall risk profile and the position was sold in the fourth quarter. The financials sector also contributed to the Portfolio’s relative underperformance for the year. In addition to the aforementioned banks, relative performance was hurt by Norway’s largest publicly traded insurer, which reported its first quarterly loss in more than five years as weakening financial markets reduced the value of its investments.
· Performance in the materials sector was positive relative to Index for the year. The Portfolio’s positions included the world’s largest maker of carbon and graphite products, which reported a third-quarter profit increase of 70% on demand from steel and aluminum customers as well as from a price increase in its graphite electrodes, which are used in smelting furnaces. Also held by the Portfolio was the world’s largest silicon wafer manufacturer, which saw its first-half profit slightly exceed its forecast supported by increased sales of its polyvinyl chloride products.
49
2008 Annual Report
December 31, 2008
Investment Overview (cont’d)
International Growth Equity Portfolio
Management Strategies
· While the initial impact of the financial crisis was directly on the U.S. economy, the surprise in 2008 was the subsequent global scale of the impact and collective decline of international equity markets. During the year, a broad number of country indexes fell by more than 40%, including Germany, France, Japan, Hong Kong, China and India. Given the broad-based market sell-off, our high-quality, predominantly large-cap growth investment style faced stiff headwinds in the latter part of the third quarter and in the beginning of the fourth quarter as investors indiscriminately sold highly liquid equities, value was briefly in favor, and lower-quality stocks outperformed higher-quality stocks. These conditions contributed to the Portfolio’s relative underperformance.
· The outlook for a sustained recovery in non-U.S. equity markets is contingent on credit market improvements in the U.S. and abroad, which we began to see toward the end of the year. For example, over the last five weeks of 2008 (November 24th to December 31st), the Index rallied 10.72%. As global markets began to digest the massive fiscal and monetary policy efforts, various classes of bond spreads to government bonds declined. Equity market volatility dropped below its November peak, providing further stability to the equity markets. While the economic news may continue to deteriorate into 2009, we believe equity markets may steady. Stocks typically move earlier, quicker, and sharper, than business and economic fundamentals. Given the uncertain economic conditions, we believe investors may gravitate toward growth stocks and their stable cash flow generation. Additionally, in our view, growth companies’ relatively healthy cash balances will also help reduce their vulnerability to tight credit conditions. Given our bottom-up investment process of building a diversified portfolio comprised of high-quality growth stocks, we believe the portfolio is well positioned in the current economic environment.
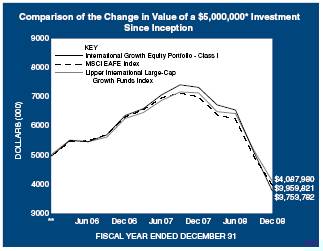
* | Minimum Investment |
** | Commenced operations on December 27, 2005. |
In accordance with SEC regulations, Portfolio’s performance shown assumes that all recurring fees (including management fees) were deducted and all dividends and distributions were reinvested. The performance of Class P shares will vary from the Class I shares based upon their different inception dates and will be negatively impacted by additional fees assessed to that class.
Performance Compared to the Morgan Stanley Capital International (MSCI) EAFE Index(1) and the Lipper International Large-Cap Growth Funds Index(2)
| | | Total Returns(3) | |
| | | | Average Annual |
| | One | | Since | |
| | Year | | Inception | (5) |
Portfolio – Class I (4) | | (48.70 | )% | (9.08 | )% |
MSCI EAFE Index | | (43.38 | ) | (7.45 | ) |
Lipper International Large-Cap Growth Funds Index | | (42.68 | ) | (6.47 | ) |
| | | | | |
Portfolio – Class P (4) | | (48.82 | ) | (9.30 | ) |
MSCI EAFE Index | | (43.38 | ) | (7.45 | ) |
Lipper International Large-Cap Growth Funds Index | | (42.68 | ) | (6.47 | ) |
| | | | | | |
Performance data quoted represents past performance, which is no guarantee of future results, and current performance may be lower or higher than the figures shown. Performance assumes that all dividends and distributions, if any, were reinvested. For the most recent month-end performance figures, please visit www.morganstanley.com/msim. Investment return and principal value will fluctuate so that Portfolio shares, when redeemed, may be worth more or less than their original cost. Total returns do not reflect the deduction of taxes that a shareholder would pay on Portfolio distributions or the redemption of Portfolio shares. Performance of share classes will vary due to difference in expenses.
(1) The Morgan Stanley Capital International (MSCI) EAFE Index (Europe, Australasia, Far East) is a free float-adjusted market capitalization index that is designed to measure the international equity market performance of developed markets, excluding the US & Canada. The term “free float” represents the portion of shares outstanding that are deemed to be available for purchase in the public equity markets by investors. The MSCI EAFE Index currently consists of 21 developed market country indices. The performance of the Index is listed in U.S. dollars and assumes reinvestment of net dividends. The Index is unmanaged and its returns do
50
| 2008 Annual Report |
| |
| December 31, 2008 |
Investment Overview (cont’d)
International Growth Equity Portfolio
not include any sales charges or fees. Such costs would lower performance. It is not possible to invest directly in an index.
(2) The Lipper International Large-Cap Growth Funds Index is an equally weighted performance index of the largest qualifying funds (based on net assets) in the Lipper International Large-Cap Growth Funds classification. The Index, which is adjusted for capital gains distributions and income dividends, is unmanaged and should not be considered an investment. There are currently 10 funds represented in this Index. As of the date of this report, the Portfolio was in the Lipper International Large-Cap Growth Funds classification.
(3) Total returns for the Portfolio reflect fees waived and expenses reimbursed, if applicable, by the Adviser. Without such waivers and reimbursements, total returns would have been lower. Fee waivers and/or expense reimbursements are voluntary and the Adviser reserves the right to commence or terminate any waiver and/or reimbursement at any time.
(4) Commenced operations on December 27, 2005
(5) For comparative purposes, average annual since inception returns listed for the Indexes refer to the inception date or initial offering of the respective share class of the Portfolio, not the inception of the Indexes.
Portfolio Composition*
| | Percentage of | |
Classification | | Total Investments | |
Commercial Banks | | 10.9 | % |
Oil, Gas & Consumable Fuels | | 6.6 | |
Pharmaceuticals | | 6.4 | |
Health Care Equipment & Supplies | | 5.2 | |
Other** | | 69.2 | |
Short-Term Investment | | | 1.7 | |
Total Investments | | | 100.0 | % |
* | Percentages indicated are based upon total investments (excluding Securities held as collateral on Loaned Securities) as of December 31, 2008. |
** | Industries which do not appear in the above table, as well as those which represent less than 5% of total investments, if applicable, are included in the category labeled “Other”. |
51
2008 Annual Report
December 31, 2008
Portfolio of Investments
International Growth Equity Portfolio
| | | | Value | |
| | Shares | | (000) | |
Common Stocks (99.1%) | | | | | |
Australia (2.8%) | | | | | |
BHP Billiton Ltd. | | 24,494 | | $ 516 | |
CSL Ltd. | | 26,533 | | 626 | |
| | | | 1,142 | |
Austria (2.6%) | | | | | |
Erste Group Bank AG (c) | | 18,672 | | 438 | |
Vienna Insurance Group (c) | | 17,462 | | 602 | |
| | | | 1,040 | |
Canada (2.9%) | | | | | |
EnCana Corp. | | 11,925 | | 550 | |
Petrobank Energy & Resources Ltd. (a)(c) | | 16,250 | | 268 | |
Research In Motion Ltd. (a) | | 8,900 | | 361 | |
| | | | 1,179 | |
Denmark (1.4%) | | | | | |
Vestas Wind Systems A/S (a) | | 9,804 | | 583 | |
Egypt (0.8%) | | | | | |
Orascom Construction Industries GDR | | 6,296 | | 321 | |
Finland (2.7%) | | | | | |
Fortum Oyj (c) | | 25,788 | | 554 | |
Kone Oyj, Class B (c) | | 25,717 | | 564 | |
| | | | 1,118 | |
France (9.6%) | | | | | |
ArcelorMittal (c) | | 11,456 | | 276 | |
AXA S.A. | | 24,066 | | 537 | |
BNP Paribas | | 9,765 | | 412 | |
Cie Generale d’Optique Essilor International S.A. | | 21,480 | | 1,008 | |
LVMH Moet Hennessy Louis Vuitton S.A. (c) | | 7,714 | | 518 | |
Total S.A. | | 21,924 | | 1,195 | |
| | | | 3,946 | |
Germany (10.5%) | | | | | |
Adidas AG | | 13,836 | | 532 | |
Bayer AG (c) | | 9,268 | | 545 | |
E.ON AG (c) | | 29,507 | | 1,193 | |
Linde AG (c) | | 9,482 | | 802 | |
SAP AG | | 15,738 | | 564 | |
SGL Carbon AG (a)(c) | | 19,406 | | 663 | |
| | | | 4,299 | |
Greece (2.5%) | | | | | |
Coca-Cola Hellenic Bottling Co. S.A. | | 39,960 | | 583 | |
National Bank of Greece S.A. | | 23,863 | | 442 | |
| | | | 1,025 | |
Hong Kong (6.8%) | | | | | |
Bank of East Asia Ltd. (c) | | 198,200 | | 418 | |
China Resources Power Holdings Co., Ltd. (c) | | 334,000 | | 649 | |
CNOOC Ltd. | | 668,700 | | 635 | |
Esprit Holdings Ltd. | | 87,100 | | 497 | |
Parkson Retail Group Ltd. (c) | | 522,500 | | 598 | |
| | | | 2,797 | |
India (1.3%) | | | | | |
Bharti Airtel Ltd. (a) | | 34,494 | | 510 | |
Indonesia (0.3%) | | | | | |
Bumi Resources Tbk PT | | 1,216,000 | | 105 | |
Ireland (0.2%) | | | | | |
Ryanair Holdings plc ADR (a) | | 2,900 | | 84 | |
Israel (2.3%) | | | | | |
Teva Pharmaceutical Industries Ltd. ADR (c) | | 22,152 | | 943 | |
Japan (15.8%) | | | | | |
Canon, Inc. | | 21,000 | | 659 | |
FamilyMart Co., Ltd. | | 17,200 | | 747 | |
Fast Retailing Co., Ltd. | | 6,300 | | 918 | |
Komatsu Ltd. | | 40,300 | | 511 | |
Mitsubishi Estate Co., Ltd. | | 36,000 | | 594 | |
Nikon Corp. | | 28,000 | | 335 | |
Nippon Electric Glass Co., Ltd. | | 56,000 | | 294 | |
Rakuten, Inc. (a)(c) | | 807 | | 514 | |
Shin-Etsu Chemical Co., Ltd. | | 13,000 | | 596 | |
Shionogi & Co., Ltd. | | 8,000 | | 206 | |
Stanley Electric Co., Ltd. (c) | | 44,700 | | 472 | |
Terumo Corp. | | 13,500 | | 632 | |
| | | | 6,478 | |
Luxembourg (1.1%) | | | | | |
Millicom International Cellular S.A. | | 10,331 | | 464 | |
Mexico (1.3%) | | | | | |
America Movil S.A.B. de C.V., Class L ADR | | 17,503 | | 542 | |
Netherlands (1.8%) | | | | | |
Reed Elsevier N.V. | | 63,487 | | 748 | |
Norway (0.7%) | | | | | |
Storebrand ASA | | 121,108 | | 299 | |
Portugal (2.6%) | | | | | |
Banco Espirito Santo S.A. (Registered) | | 68,641 | | 645 | |
Jeronimo Martins SGPS S.A. | | 76,179 | | 423 | |
| | | | 1,068 | |
Singapore (2.1%) | | | | | |
DBS Group Holdings Ltd. | | 81,000 | | 480 | |
Keppel Corp. Ltd. | | 123,000 | | 373 | |
| | | | 853 | |
Spain (1.4%) | | | | | |
Banco Santander S.A. | | 57,038 | | 551 | |
Sweden (1.2%) | | | | | |
Tele2 AB, Class B | | 55,927 | | 497 | |
Switzerland (10.1%) | | | | | |
ABB Ltd. (Registered) (a)(c) | | 36,123 | | 545 | |
EFG International AG | | 25,203 | | 451 | |
Nestle S.A. (Registered) | | 32,845 | | 1,294 | |
Roche Holding AG (Genusschein) | | 6,283 | | 967 | |
SGS S.A. (Registered) (c) | | 846 | | 886 | |
| | | | 4,143 | |
Taiwan (1.4%) | | | | | |
Delta Electronics, Inc. | | 299,420 | | 583 | |
52 | The accompanying notes are an integral part of the financial statements. | |
| 2008 Annual Report |
| |
| December 31, 2008 |
Portfolio of Investments (cont’d)
International Growth Equity Portfolio
| | | | Value | |
| | Shares | | (000) | |
United Kingdom (12.9%) | | | | | |
G4S plc | | 214,115 | | $ 635 | |
HSBC Holdings plc | | 60,504 | | 579 | |
Man Group plc | | 77,694 | | 268 | |
Prudential plc | | 90,955 | | 554 | |
Reckitt Benckiser Group plc | | 26,185 | | 976 | |
SABMiller plc | | 29,066 | | 489 | |
Smith & Nephew plc | | 78,535 | | 498 | |
Standard Chartered plc | | 32,826 | | 420 | |
Tesco plc | | 169,273 | | 882 | |
| | | | 5,301 | |
Total Common Stocks (Cost $71,414) | | | | 40,619 | |
| | | | | |
| | No. of | | | |
| | Rights | | | |
Rights (0.2%) | | | | | |
Singapore (0.2%) | | | | | |
DBS Group Holdings Ltd., expires 1/20/09 | | | | | |
(Cost $—) (a) | | 40,500 | | 88 | |
| | | | | |
| | Shares | | | |
Short-Term Investments (23.3%) | | | | | |
Securities held as Collateral on Loaned Securities (21.6%) | | | | | |
Investment Company (17.3%) | | | | | |
Morgan Stanley Institutional Liquidity Money Market Portfolio — Institutional Class (o) | | 7,098,005 | | 7,098 | |
| | | | | |
| | Face | | | |
| | Amount | | | |
| | (000) | | | |
Repurchase Agreement (4.3%) | | | | | |
Goldman Sachs & Co., 0.06%, dated 12/31/08, due 1/2/09, repurchase price $1,743; fully collateralized by U.S. government agency securities at the date of this Portfolio of Investments as follows: Federal Home Loan Mortgage Corp., Gold Pools: rates ranging from 4.50% to 6.00%, due 11/1/19 - 12/1/38; Federal National Mortgage Association, Fixed Rate Mortgages: rates ranging from 4.00% - 7.00%, due 9/1/18 - 1/1/39; Government National Mortgage Association, Fixed Rate Mortgages: rates ranging from 4.50% to 11.50%, due 6/15/16 - 12/20/38, valued at $1,779. | | $ | 1,743 | | 1,743 | |
| | | | 8,841 | |
| | | | | |
| | Shares | | | |
Investment Company (1.7%) | | | | | |
Morgan Stanley Institutional Liquidity Money Market Portfolio — Institutional Class (o) | | 711,559 | | 712 | |
Total Short-Term Investments (Cost $9,553) | | | | 9,553 | |
Total Investments (122.6%) (Cost $80,967) — including $8,480 of Securities Loaned (v) | | | | 50,260 | |
Liabilities in Excess of Other Assets (-22.6%) | | | | (9,267 | ) |
Net Assets (100%) | | | | $40,993 | |
| | | | | | |
(a) | Non-income producing security. |
(c) | All or a portion of security on loan at December 31, 2008. |
(o) | See Note G to the financial statements regarding investment in Morgan Stanley Institutional Liquidity Money Market Portfolio — Institutional Class. |
(v) | The approximate market value and percentage of total investments, $37,086,000 and 73.7%, respectively, represent the securities that have been fair valued under the fair valuation policy for international investments as disclosed in Note A within the Notes to Financial Statements. |
ADR | American Depositary Receipt |
GDR | Global Depositary Receipt |
| The accompanying notes are an integral part of the financial statements. | 53 |
2008 Annual Report
December 31, 2008
Investment Overview (unaudited)
International Real Estate Portfolio
The International Real Estate Portfolio (the “Portfolio”) seeks to provide current income and long-term capital appreciation by investing primarily in equity securities of companies in the real estate industry located throughout the world (excluding the United States and Canada). Foreign investing involves certain risks, including currency fluctuations and controls, restrictions on foreign investments, less governmental supervision and regulation, less liquidity and the potential for market volatility and political instability. The risks of investing in emerging-market countries are greater than the risks generally associated with foreign investments. In addition to the risks associated with ownership of real estate and the real estate industry in general include, fluctuations in the value of underlying property, defaults by borrowers or tenants, market saturation, decreases in market rents, interest rates, property taxes, increases in operating expenses and political or regulatory occurrences adversely affecting real estate.
Performance
For the year ended December 31, 2008, the Portfolio had a total return based on net asset value and reinvestment of distributions per share of -49.95% for the Class I shares, net of fees. The Portfolio’s Class I shares outperformed against the FTSE EPRA/NAREIT Global ex-North America Real Estate Index (80% Europe/20% Asia) which returned -51.38%, the FTSE EPRA/NAREIT Global Real Estate Index: Europe Series which returned -51.46%, the FTSE EPRA/NAREIT Global Real Estate Index: Asia Series which returned -52.51% and underperformed against the MSCI EAFE Index which returned -43.38%.
Factors Affecting Performance
· The Portfolio outperformed the benchmark, the FTSE EPRA/NAREIT Global ex-North America Real Estate Index (80% Europe/20% Asia) (the “Index”), for the period. The Portfolio’s Asian portfolio contributed to performance, while the European portfolio detracted from returns. With regard to global allocation between the regions, the Portfolio’s overweight to Asia and underweight to Europe both contributed to performance.
· In Asia, the Portfolio benefited from stock selection within and an underweight to Australia, an overweight to Japan and stock selection in Hong Kong; this was modestly offset by stock selection in Japan.
· In Europe, the Portfolio benefited from stock selection within and an underweight to Austria and stock selection in France and Sweden. This was offset by stock selection within and an overweight to the U.K. as well as underweights to Belgium and Switzerland.
Management Strategies
· The Portfolio is comprised of two regional portfolios with a global allocation which weights each major region (Europe and Asia) based on our view of its relative attractiveness in terms of underlying real estate fundamentals and public market valuations. Moreover, each regional portfolio reflects our core investment philosophy as a real estate value investor, which results in the ownership of stocks that we believe provide the best valuation relative to their underlying real estate values, while maintaining portfolio diversification. Our company specific research leads us to specific preferences for sub-segments within each country. At the end of the period, the Portfolio was overweight the Asian listed property sector and underweight the European listed property sector.
· We believe the Asian listed property sector will continue to exhibit stable underlying property fundamentals and asset values. The Portfolio’s overweight to the Asian region was predominated by real estate operating companies (REOCs) in Hong Kong and Japan, which continue to trade at very large discounts to NAV. Despite only modest weakening in underlying fundamentals and favorable supply dynamics in the Hong Kong and Japanese real estate markets, the Hong Kong and Japanese REOCs experienced significant share price declines in the year. We continue to prefer the Asian REOCs, as we believe these companies continue to offer better value relative to the REITs and possess the ability to engage in value-added opportunities such as the development of new assets and redevelopment of existing assets, as opposed to the Asian REITs which are externally managed vehicles and limited to property ownership.
· The Portfolio was considerably underweight the Australian LPT sector, which ended the period trading at a discount to NAVs which still do not yet fully reflect prospective asset value declines.
· In Europe, stocks on the Continent posted large declines and ended the year trading at a discount to reported NAVs, which only reflect modest capital value declines since the start of the credit crisis. Property stocks in the U.K. also experienced significant declines, and the stocks continue to trade at discounted valuations that appear too wide, especially since NAVs already reflect a sharp correction in asset values.
54
| 2008 Annual Report |
| |
| December 31, 2008 |
Investment Overview (cont’d)
International Real Estate Portfolio
· Within Europe, the Portfolio continues to be underweight the Continent and overweight the U.K., as we believe the U.K. property market continues to offer better relative value.
· In contrast to the stable outlook for underlying property fundamentals in Asia-ex-Australia, in Europe and Australia, there are expectations for weakening underlying property fundamentals and asset values. However, there is considerable debate with regard to the magnitude of asset value declines since there continues to be limited transactional evidence due to the lack of liquidity for direct real estate assets which has resulted in a wide bid-ask spread between buyers and sellers. In some sub-segments of these markets, we believe current share price valuations already more than reflect any prospective weakening in underlying fundamentals and asset values.
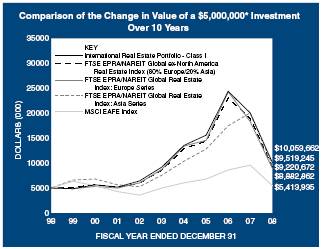
* Minimum Investment
In accordance with SEC regulations, Portfolio’s performance shown assumes that all recurring fees (including management fees) were deducted and all dividends and distributions were reinvested. The performance of Class P shares will vary from the Class I shares based upon their different inception dates and will be negatively impacted by additional fees assessed to that class.
Performance Compared to the FTSE EPRA/NAREIT Global ex-North America Real Estate Index (80% Europe/20% Asia)(1), FTSE EPRA/NAREIT Global Real Estate Index: Europe Series(2), the FTSE EPRA/NAREIT Global Real Estate Index: Asia Series(3) and the Morgan Stanley Capital International (MSCI) EAFE Index(4)
| | | Total Returns(5) | |
| | | | Average Annual | |
| | One
Year | | Five
Years | | Ten
Years | | Since
Inception | (7) |
Portfolio – Class I (6) | | (49.95 | )% | 1.86 | % | 7.23 | % | 6.39 | % |
FTSE EPRA/NAREIT Global ex-North America Real Estate Index | | | | | | | | | |
(80% Europe/20% Asia) | | (51.38 | ) | 1.39 | | 6.31 | | 5.18 | |
FTSE EPRA/NAREIT Global Real Estate | | | | | | | | | |
Index: Europe Series | | (51.46 | ) | 0.29 | | 5.92 | | 5.50 | |
FTSE EPRA/NAREIT Global Real Estate | | | | | | | | | |
Index: Asia Series | | (52.51 | ) | 4.70 | | 6.65 | | 1.58 | |
MSCI EAFE Index | | (43.38 | ) | 1.66 | | 0.80 | | 1.59 | |
| | | | | | | | | |
Portfolio – Class P (6) | | (50.05 | ) | 1.63 | | 6.96 | | 6.13 | |
FTSE EPRA/NAREIT Global ex-North America Real Estate Index | | | | | | | | | |
(80% Europe/20% Asia) | | (51.38 | ) | 1.39 | | 6.31 | | 5.18 | |
FTSE EPRA/NAREIT Global Real Estate | | | | | | | | | |
Index: Europe Series | | (51.46 | ) | 0.29 | | 5.92 | | 5.50 | |
FTSE EPRA/NAREIT Global Real Estate | | | | | | | | | |
Index: Asia Series | | (52.51 | ) | 4.70 | | 6.65 | | 1.58 | |
MSCI EAFE Index | | (43.38 | ) | 1.66 | | 0.80 | | 1.59 | |
| | | | | | | | | | |
Performance data quoted represents past performance, which is no guarantee of future results, and current performance may be lower or higher than the figures shown. Performance assumes that all dividends and distributions, if any, were reinvested. For the most recent month-end performance figures, please visit www.morganstanley.com/msim. Investment return and principal value will fluctuate so that Portfolio shares, when redeemed, may be worth more or less than their original cost. Total returns do not reflect the deduction of taxes that a shareholder would pay on Portfolio distributions or the redemption of Portfolio shares. Performance of share classes will vary due to difference in expenses.
(1) The FTSE EPRA/NAREIT Global ex-North America Real Estate Index (80% Europe 20% Asia) — Net Total Return to U.S. investors is a customized benchmark, 80% of which consists of the performance of the FTSE EPRA/NAREIT Global Real Estate Index: Europe Series — Net Total Return to U.S. investors and 20% of which consists of the performance of the FTSE EPRA/NAREIT Global Real Estate Index: Asia Series — Net Total Return to U.S. investors. These series are components of the FTSE EPRA/NAREIT Global Real Estate Index — Net Total Return to U.S. investors, which is a market capitalization weighted index designed to reflect the stock performance of companies engaged in the North American, European and Asian real estate markets. The performance of the Index is listed in U.S. dollars and assumes reinvestment of dividends. “Net Total Return to U.S. investors” reflects a reduction in total returns after taking into account the withholding tax on dividends by certain foreign countries represented in the Index for periods after 1/31/05 (gross returns used prior to 1/31/05). The Index is unmanaged and its returns do not include any sales charges or fees. Such costs would lower performance. It is not possible to invest directly in an index.
(2) The FTSE EPRA/NAREIT Global Real Estate Index: Europe Series — Net Total Return to US investors is the European component of the FTSE EPRA/NAREIT Global Real
55
2008 Annual Report
December 31, 2008
Investment Overview (cont’d)
International Real Estate Portfolio
Estate Index — Net Total Return to U.S. investors, which is a market capitalization weighted index designed to reflect the stock performance of companies engaged in the North American, European and Asian real estate markets. The performance of the Index is listed in U.S. dollars and assumes reinvestment of dividends. “Net Total Return to U.S. investors” reflects a reduction in total returns after taking into account the witholding tax on dividends by certain foreign countries represented in the Index for periods after 1/31/05 (gross returns used prior to 1/31/05). The Index is unmanaged and its returns do not include any sales charges or fees. Such costs would lower performance. It is not possible to invest directly in an index.
(3) The FTSE EPRA/NAREIT Global Real Estate Index: Asia Series — Net Total Return to US investors is the Asian component of the FTSE EPRA/NAREIT Global Real Estate Index — Net Total Return to U.S. investors, which is a market capitalization weighted index designed to reflect the stock performance of companies engaged in the North American, European and Asian real estate markets. The performance of the Index is listed in U.S. dollars and assumes reinvestment of dividends. “Net Total Return to U.S. investors” reflects a reduction in total returns after taking into account the witholding tax on dividends by certain foreign countries represented in the Index for periods after 1/31/05 (gross returns used prior to 1/31/05). The Index is unmanaged and its returns do not include any sales charges or fees. Such costs would lower performance. It is not possible to invest directly in an index.
(4) The Morgan Stanley Capital International (MSCI) EAFE Index (Europe, Australasia, Far East) is a free float-adjusted market capitalization index that is designed to measure the international equity market performance of developed markets, excluding the U.S. & Canada. The term “free float” represents the portion of shares outstanding that are deemed to be available for purchase in the public equity markets by investors. The MSCI EAFE Index currently consists of 21 developed market country indices. The performance of the Index is listed in U.S. dollars and assumes reinvestment of net dividends. The Index is unmanaged and its returns do not include any sales charges or fees. Such costs would lower performance. It is not possible to invest directly in an index.
(5) Total returns for the Portfolio reflect fees waived and expenses reimbursed, if applicable, by the Adviser. Without such waivers and reimbursements, total returns would have been lower. Fee waivers and/or expense reimbursements are voluntary and the Adviser reserves the right to commence or terminate any waiver and/or reimbursement at any time.
(6) Commenced operations on October 1, 1997
(7) For comparative purposes, average annual since inception returns listed for the Indexes refer to the inception date or initial offering of the respective share class of the Portfolio, not the inception of the Index.
Portfolio Composition*
| | Percentage of | |
Classification | | Total Investments | |
Diversified | | 54.4 | % |
Office | | 16.0 | |
Retail | | 16.0 | |
Residential | | 5.0 | |
Other** | | 7.4 | |
Short-Term Investment | | | 1.2 | |
Total Investments | | | 100.0 | % |
* | Percentages indicated are based upon total investments (excluding Securities held as collateral on Loaned Securities) as of December 31, 2008. |
** | Industries which do not appear in the above table, as well as those which represent less than 5% of total investments, if applicable, are included in the category labeled “Other”. |
56
| 2008 Annual Report |
| |
| December 31, 2008 |
Portfolio of Investments
International Real Estate Portfolio
| | | | Value | |
| | Shares | | (000) | |
Common Stocks (98.4%) | | | | | |
Australia (3.7%) | | | | | |
CFS Retail Property Trust REIT (c) | | 611,410 | | $ 802 | |
GPT Group REIT | | 85,506 | | 155 | |
Stockland REIT (c) | | 564,939 | | 1,635 | |
Westfield Group REIT | | 1,499,658 | | 13,817 | |
| | | | 16,309 | |
Austria (1.0%) | | | | | |
CA Immobilien Anlagen AG (a)(c) | | 278,157 | | 1,659 | |
Conwert Immobilien Invest SE (a)(c) | | 624,347 | | 2,803 | |
| | | | 4,462 | |
Finland (1.1%) | | | | | |
Citycon Oyj (c) | | 567,107 | | 1,330 | |
Sponda Oyj | | 801,232 | | 3,509 | |
| | | | 4,839 | |
France (21.9%) | | | | | |
Fonciere Des Regions REIT (c) | | 53,788 | | 3,683 | |
Gecina S.A. REIT (c) | | 85,177 | | 5,915 | |
ICADE REIT | | 111,924 | | 9,316 | |
Klepierre REIT (c) | | 295,597 | | 7,245 | |
Silic REIT (c) | | 80,828 | | 7,515 | |
Unibail-Rodamco REIT | | 414,887 | | 61,794 | |
| | | | 95,468 | |
Germany (1.1%) | | | | | |
Alstria Office AG REIT | | 658,471 | | 4,596 | |
Hong Kong (13.2%) | | | | | |
China Overseas Land & Investment Ltd. (c) | | 2,831,000 | | 3,980 | |
China Resources Land Ltd. (c) | | 2,751,000 | | 3,406 | |
Guangzhou R&F Properties Co., Ltd., | | | | | |
Class H (c) | | 6,921,200 | | 7,737 | |
Hang Lung Properties Ltd. (c) | | 1,221,000 | | 2,678 | |
Henderson Land Development Co., Ltd. | | 847,000 | | 3,164 | |
Hongkong Land Holdings Ltd. (c) | | 3,580,000 | | 8,969 | |
Hysan Development Co., Ltd. | | 1,569,185 | | 2,548 | |
Kerry Properties Ltd. (c) | | 2,758,271 | | 7,424 | |
Sun Hung Kai Properties Ltd. | | 2,081,000 | | 17,498 | |
Swire Pacific Ltd., Class A (c) | | 53,000 | | 368 | |
| | | | 57,772 | |
Italy (1.3%) | | | | | |
Beni Stabili S.p.A. (c) | | 6,771,199 | | 4,730 | |
Risanamento S.p.A. (a)(c) | | 1,841,837 | | 1,121 | |
| | | | 5,851 | |
Japan (11.7%) | | | | | |
Japan Real Estate Investment Corp. REIT | | 195 | | 1,753 | |
Mitsubishi Estate Co., Ltd. | | 1,037,000 | | 17,101 | |
Mitsui Fudosan Co., Ltd. | | 934,000 | | 15,521 | |
Nippon Building Fund, Inc. REIT (c) | | 322 | | 3,534 | |
NTT Urban Development Corp. | | 3,122 | | 3,368 | |
Sumitomo Realty & Development Co., Ltd. (c) | | 658,000 | | 9,804 | |
| | | | 51,081 | |
Netherlands (7.4%) | | | | | |
Corio N.V. REIT | | 286,518 | | 13,137 | |
Eurocommercial Properties N.V. CVA REIT | | 122,297 | | 4,112 | |
ProLogis European Properties | | 729,008 | | 3,267 | |
Vastned Retail N.V. REIT | | 75,384 | | 3,779 | |
Wereldhave N.V. REIT (c) | | 90,006 | | 7,950 | |
| | | | 32,245 | |
Singapore (1.7%) | | | | | |
CapitaLand Ltd. | | 643,000 | | 1,413 | |
Macquarie Prime REIT | | 3,561,000 | | 1,288 | |
United Industrial Corp., Ltd. | | 4,928,000 | | 3,603 | |
Wheelock Properties Singapore Ltd. | | 1,237,000 | | 897 | |
| | | | 7,201 | |
Sweden (3.1%) | | | | | |
Castellum AB (c) | | 453,002 | | 3,522 | |
Hufvudstaden AB, Class A (c) | | 1,447,974 | | 10,194 | |
| | | | 13,716 | |
Switzerland (2.2%) | | | | | |
PSP Swiss Property AG (Registered) (a) | | 190,068 | | 9,476 | |
United Kingdom (29.0%) | | | | | |
Big Yellow Group plc REIT | | 1,662,488 | | 5,754 | |
British Land Co. plc REIT | | 2,929,436 | | 23,482 | |
Brixton plc REIT | | 2,951,864 | | 5,661 | |
Capital & Regional plc | | 1,887,697 | | 1,282 | |
Derwent London plc REIT | | 749,014 | | 7,869 | |
Grainger plc | | 1,503,898 | | 2,962 | |
Great Portland Estates plc REIT | | 1,027,537 | | 3,860 | |
Hammerson plc REIT | | 1,785,712 | | 13,833 | |
Invista Foundation Property Trust Ltd. REIT | | 778,960 | | 192 | |
Land Securities Group plc REIT | | 2,416,167 | | 32,204 | |
Liberty International plc REIT | | 1,318,814 | | 9,139 | |
Minerva plc (a) | | 3,795,400 | | 740 | |
Quintain Estates & Development plc | | 2,563,343 | | 1,368 | |
Safestore Holdings plc | | 2,859,115 | | 2,272 | |
Segro plc REIT | | 3,299,460 | | 11,803 | |
Shaftesbury plc REIT | | 162,424 | | 848 | |
Unite Group plc | | 1,386,449 | | 2,943 | |
Workspace Group plc REIT | | 332,010 | | 296 | |
| | | | 126,508 | |
Total Common Stocks (Cost $1,016,304) | | | | 429,524 | |
| | | | | |
| | No. of | | | |
| | Rights | | | |
Rights (0.0%) | | | | | |
Hong Kong (0.0%) | | | | | |
China Overseas Land & Investment Ltd., expires 1/21/09 (Cost $—) (a) | | 113,240 | | 42 | |
| The accompanying notes are an integral part of the financial statements. | 57 |
2008 Annual Report
December 31, 2008
Portfolio of Investments (cont’d)
International Real Estate Portfolio
| | | | Value | |
| | Shares | | (000) | |
Short-Term Investments (12.4%) | | | | | |
Securities held as Collateral on Loaned Securities (11.2%) | | | | | |
Investment Company (9.0%) | | | | | |
Morgan Stanley Institutional Liquidity Money Market Portfolio — Institutional Class (o) | | 39,134,663 | | $ 39,135 | |
| | | | | |
| | Face | | | |
| | Amount | | | |
| | (000) | | | |
Repurchase Agreement (2.2%) | | | | | |
Goldman Sachs & Co., 0.06%, dated 12/31/08, due 1/2/09, repurchase price $9,614; fully collateralized by U.S. government agency securities at the date of this Portfolio of Investments as follows: Federal Home Loan Mortgage Corp., Gold Pools: rates ranging from 4.50% to 6.00%, due 11/1/19 - 12/1/38; Federal National Mortgage Association, Fixed Rate Mortgages: rates ranging from 4.00% - 7.00%, due 9/1/18 - 1/1/39; Government National Mortgage Association, Fixed Rate Mortgages: rates ranging from 4.50% to 11.50%, due 11/15/16 - 12/15/38, valued at $9,806. | | $ | 9,614 | | 9,614 | |
| | | | 48,749 | |
| | | | | |
| | Shares | | | |
Investment Company (1.2%) | | | | | |
Morgan Stanley Institutional Liquidity Money Market Portfolio — Institutional Class (o) | | 5,282,570 | | 5,283 | |
Total Short-Term Investments (Cost $54,032) | | | | 54,032 | |
Total Investments (110.8%) (Cost $1,070,336) — including $46,081 of Securities Loaned (v) | | | | 483,598 | |
Liabilities in Excess of Other Assets (-10.8%) | | | | (47,308 | ) |
Net Assets (100%) | | | | $436,290 | |
| | | | | | |
(a) | Non-income producing security. |
(c) | All or a portion of security on loan at December 31, 2008. |
(o) | See Note G to the financial statements regarding investment in Morgan Stanley Institutional Liquidity Money Market Portfolio — Institutional Class. |
(v) | The approximate market value and percentage of total investments, $429,524,000 and 88.8%, respectively, represent the securities that have been fair valued under the fair valuation policy for international investments as disclosed in Note A within the Notes to Financial Statements. |
@ | Value is less than $500. |
CVA | Certificaten Van Aandelen |
REIT | Real Estate Investment Trust |
Foreign Currency Exchange Contract Information:
The Portfolio had the following foreign currency exchange contract(s) open at period end:
Currency
to
Deliver
(000) | | Value
(000) | | Settlement
Date | | In
Exchange
For
(000) | | Value
(000) | | Net
Unrealized
Appreciation
(Depreciation)
(000) | |
EUR | 444 | | | $617 | | | 1/2/09 | | USD | 621 | | | $621 | | | | $4 | | |
SGD | 76 | | | 53 | | | 1/5/09 | | USD | 53 | | | 53 | | | | — | @ | |
SGD | 28 | | | 20 | | | 1/5/09 | | USD | 20 | | | 20 | | | | — | @ | |
USD | 86 | | | 86 | | | 1/5/09 | | AUD | 124 | | | 87 | | | | 1 | | |
| | | | $776 | | | | | | | | | $781 | | | | $5 | | |
AUD | — | Australian Dollar |
EUR | — | Euro |
SGD | — | Singapore Dollar |
USD | — | United States Dollar |
58 | The accompanying notes are an integral part of the financial statements. | |
| 2008 Annual Report |
| |
| December 31, 2008 |
Investment Overview (unaudited)
International Small Cap Portfolio
The International Small Cap Portfolio (the “Portfolio”) seeks long-term capital appreciation by investing primarily in equity securities of small non-U.S. companies. Investments in small sized corporations are more vulnerable to financial risks and other risks than larger corporations and may involve a higher degree of price volatility than investments in the general equity markets. Foreign investing involves certain risks, including currency fluctuations and controls, restrictions on foreign investments, less governmental supervision and regulation, less liquidity and the potential for market volatility and political instability. The risks of investing in emerging-market countries are greater than the risks generally associated with foreign investments.
Performance
For the year ended December 31, 2008, the Portfolio had a total return based on net asset value and reinvestment of distributions per share of -38.33%, net of fees, for the Class I shares. The Portfolio’s Class I shares outperformed against its benchmark, the Morgan Stanley Capital International (MSCI) EAFE Small Cap Total Return Index (the “Index”) which returned -47.01%.
Factors Affecting Performance
· In the final month of 2008, stocks posted a modest gain but the scale of the full-year correction will go down in history. For the first six months of the year, equity markets were modestly weaker but were supported by the energy and materials sectors that were anointed the “new defensives”. Since then, however, the financial system crisis in September and October, and the significant and rapid deterioration in the global economy left the equity market in tatters. For the full year, the MSCI EAFE Index returned -43.4%, the MSCI EAFE Small Cap Index (“the Index”) ended down 47.0%, the S&P 500® Index fell 37.0% and the Russell 2000® Index declined 33.8%.
· In the Index, cyclical sectors (materials, consumer discretionary, industrials, financials and information technology) were sharply downgraded on the back of fear over a slowdown in China, a collapse in non-residential construction, contracting global capital expenditure and a retrenchment of the consumer. Energy stocks, which had risen in lock step with the oil price, reversed direction on the dramatic decline in oil and the sector lost 59.0% for the year, to become the worst performing sector. Health care and consumer staples showed relatively greater resilience in the second half of the year with returns of -32.3% and -36.9% for the full year.
Management Strategies
· Relative performance for the year was driven by positive stock selection in seven out of the 10 sectors in the Index and an overweight to defensives, primarily consumer staples and health care. The primary sectors that added value from stock selection were utilities, materials, and consumer discretionary.
· In particular, the overweight to consumer staples was a major contributor to performance but stock selection offset the relative gain of the allocation. The Portfolio benefited from strong outperformance from a number of its holdings but the sector’s performance was dominated by the volatile performance of one stock in particular (whose performance rebounded in December).
· The Portfolio’s overweight to health care was also a positive contributor but stock selection, primarily in the last quarter of 2008, was a detractor. Poor performance from a German supplier to the biotech industry, which had disappointing third quarter results as its customers are reducing their inventories for production equipment, was the most significant detractor. Stock selection in pharmaceuticals was mixed. Several companies including a French pharmaceutical company involved in oncology and endocrinology and a Norwegian pharmaceutical firm with a leading omega-3 drug reported strong sales and new drugs in their pipelines.
· On a country basis, the Portfolio’s stock selection and overweight to Japan was a positive contributor to relative performance as the market benefitted from the strengthening yen.
· Finally, an average allocation of 3% to cash also contributed positively to performance.
· The macro news at the close of 2008 and going into 2009 remains grim as the global recession takes hold. Governments continue to attempt to moderate the downturn with various bailout packages of historic size. We remain concerned that the current credit environment will persist for some time. As a result we will continue to focus on companies that have negligible debt requirements and the ability to finance their capital needs internally. The Portfolio remains defensively positioned with a substantial overweight to consumer staples and health care, and a broadly based underweight to cyclicals.
59
2008 Annual Report | |
| |
December 31, 2008 | |
Investment Overview (cont’d)
International Small Cap Portfolio
· Despite its strong relative outperformance last year, we are finding some extraordinary value in Japan. The bear market for Japanese small caps started in 2006 and we believe that the market now offers some compelling value in quality cyclicals as many have seen extreme falls. Importantly, we believe Japan has entered the downturn in considerably better shape than much of the world and does not have the same credit excesses to work through. We have started to take profits on some of the Portfolio’s holdings in Japanese defensives following their strong bounce, and are slowly building positions in some more cyclical names.
· In contrast, recognition of the scale of the downturn in Europe only really started to take hold in the fourth quarter last year. Analysts have not yet fully reflected this outlook in their earnings estimates and we expect further downgrades. Moreover, in 2008, European defensives sold off sharply, in line with the more cyclical names. As a result some already attractively valued defensives have become extremely cheap. We believe they continue to offer more attractive value than most European cyclicals.
· Asia ex-Japan is now offering better value as the region has declined nearly 64% from its 2007 highs but we do remain cautious as the region is highly dependent on cyclical companies. Valuations are not yet as striking as those on offer in Japan.
· Whilst we anticipate a deep and prolonged downturn, we feel there are some extraordinary valuations now on offer in some very high quality companies. The equity markets are likely to remain volatile and we will need to be nimble but we have great confidence that our total focus on fundamental analysis and valuation will stand us in good stead in the coming months.
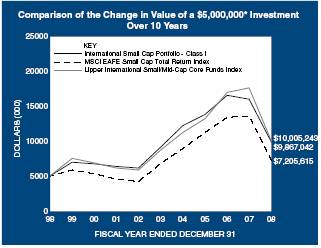
* Minimum Investment
+ The Lipper International Small/Mid-Cap Core Funds Index commenced operations on March 31, 2002. Performance data prior to December 31, 2002 is from the Lipper International Small/Mid-Cap Core Funds Average.
In accordance with SEC regulations, Portfolio performance shown assumes that all recurring fees (including management fees) were deducted and all dividends and distributions were reinvested. The performance of Class P shares will vary from the Class I shares based upon their different inception dates and will be negatively impacted by additional fees assessed to that class.
Performance Compared to the Morgan Stanley Capital International (MSCI) EAFE Small Cap Total Return Index(1) and the Lipper International Small/Mid-Cap Core Funds Index(2)
| | Total Returns(3) | |
| | | | Average Annual |
| | One
Year | | | Five
Years | | | Ten
Years | | | Since
Inception | (6) | |
Portfolio – Class I (4) | | (38.33 | )% | | 1.51 | % | | 7.03 | % | | 8.65 | % | |
MSCI EAFE Small Cap Total Return Index | | (47.01 | ) | | 1.14 | | | 3.72 | | | 3.22 | | |
Lipper International Small/Mid-Cap Core Funds Index | | (43.23 | ) | | 2.79 | | | 7.18 | | | — | | |
| | | | | | | | | | | | | |
Portfolio – Class P (5) | | — | | | — | | | — | | | 1.56 | | |
MSCI EAFE Small Cap Total Return Index | | — | | | — | | | — | | | (4.31 | ) | |
Lipper International Small/Mid-Cap Core Funds Index | | — | | | — | | | — | | | (1.02 | ) | |
Performance data quoted represents past performance, which is no guarantee of future results, and current performance may be lower or higher than the figures shown. Performance assumes that all dividends and distributions, if any, were reinvested. For the most recent month-end performance figures, please visit www.morganstanley.com/msim. Investment return and principal value will fluctuate so that Portfolio shares, when redeemed, may be worth more or less than their original cost. Total returns do not reflect the deduction of taxes that a shareholder would pay on Portfolio distributions or the redemption of Portfolio shares. Performance of share classes will vary due to difference in expenses.
60
| 2008 Annual Report |
| |
| December 31, 2008 |
Investment Overview (cont’d)
International Small Cap Portfolio
(1) | The Morgan Stanley Capital International (MSCI) EAFE Small Cap Total Return Index is an unmanaged, market value weighted average of the performance of over 900 securities of companies listed on the stock exchanges of countries in Europe, Australasia and the Far East, including price performance and income from dividend payments. The MSCI EAFE Small Cap Total Return Index commenced as of January 31, 2002. Returns, including periods prior to January 31, 2002, are calculated using the return data of the MSCI EAFE Small Cap Index through January 30, 2002 and the return data of the MSCI EAFE Small Cap Total Return Index since January 31, 2002. The Index is unmanaged and its returns do not include any sales charges or fees. Such costs would lower performance. It is not possible to invest directly in an index. |
(2) | The Lipper International Small/Mid-Cap Core Funds Index is an equally weighted performance index of the largest qualifying funds (based on net assets) in the Lipper International Small/Mid-Cap Core Funds classification. The Index, which is adjusted for capital gains distributions and income dividends, is unmanaged and should not be considered an investment. There are currently 10 funds represented in this Index. As of the date of this report, the Portfolio was in the Lipper International Small/Mid-Cap Core Funds classification. |
(3) | Total returns for the Portfolio reflect fees waived and expenses reimbursed, if applicable, by the Adviser. Without such waivers and reimbursements, total returns would have been lower. Fee waivers and/or expense reimbursements are voluntary and the Adviser reserves the right to commence or terminate any waiver and/or reimbursement at any time. |
(4) | Commenced operations on December 15, 1992 |
(5) | Commenced operations on October 21, 2008 |
(6) | For comparative purposes, average annual since inception returns listed for the Indexes refer to the inception date or initial offering of the respective share class of the Portfolio, not the inception of the Index. |
Portfolio Composition
| | Percentage of |
Classification | | Total Investments |
Food Products | | | 15.0 | % |
Beverages | | | 5.8 | |
Health Care Equipment & Supplies | | | 5.5 | |
Other* | | | 69.9 | |
Short-Term Investment | | | 3.8 | |
Total Investments | | | 100.0 | % |
* Industries which do not appear in the above table, as well as those which represent less than 5% of total investments, if applicable, are included in the category labeled “Other”.
61
2008 Annual Report | |
| |
December 31, 2008 | |
Portfolio of Investments
International Small Cap Portfolio
| | Shares | | Value
(000) | |
Common Stocks (96.5%) | | | | | |
Australia (4.1%) | | | | | |
Goodman Fielder Ltd. | | 4,827,274 | | $ 4,493 | |
Infomedia Ltd. | | 7,808,192 | | 1,568 | |
MYOB Ltd. | | 4,953,000 | | 3,834 | |
Pacific Brands Ltd. | | 3,043,137 | | 918 | |
Ramsay Health Care Ltd. | | 280,484 | | 2,061 | |
| | | | 12,874 | |
Belgium (0.8%) | | | | | |
Omega Pharma S.A. | | 68,222 | | 2,577 | |
Denmark (3.3%) | | | | | |
Danisco A/S | | 122,989 | | 5,013 | |
Royal Unibrew A/S | | 60,941 | | 1,367 | |
Topdanmark A/S (a) | | 30,503 | | 3,960 | |
| | | | 10,340 | |
Finland (3.3%) | | | | | |
Elisa Oyj | | 368,448 | | 6,377 | |
HKScan Oyj | | 325,076 | | 2,013 | |
Oriola-KD OYJ | | 1,217,747 | | 2,227 | |
| | | | 10,617 | |
France (4.0%) | | | | | |
Bull S.A. (a) | | 861,076 | | 1,385 | |
ICADE REIT | | 33,730 | | 2,808 | |
Ipsen S.A. | | 94,405 | | 3,686 | |
Teleperformance | | 175,104 | | 4,883 | |
| | | | 12,762 | |
Germany (3.8%) | | | | | |
Alstria Office AG REIT | | 156,592 | | 1,093 | |
K&S AG | | 20,840 | | 1,197 | |
MTU Aero Engines Holding AG | | 121,384 | | 3,345 | |
Sartorius AG (Non-Voting Shares) | | 245,110 | | 2,825 | |
SCS Standard Computersysteme AG (a)(d)(i)(l) | | 21,289 | | — | |
Symrise AG | | 255,439 | | 3,608 | |
| | | | 12,068 | |
Hong Kong (0.7%) | | | | | |
Solomon Systech International Ltd. | | 38,775,900 | | 898 | |
Yip’s Chemical Holdings Ltd. | | 4,628,000 | | 1,248 | |
| | | | 2,146 | |
Ireland (5.1%) | | | | | |
DCC plc | | 177,149 | | 2,578 | |
Glanbia plc | | 1,768,177 | | 5,262 | |
Kerry Group plc, Class A | | 402,563 | | 7,341 | |
Smurfit Kappa Group plc | | 365,604 | | 925 | |
| | | | 16,106 | |
Italy (3.8%) | | | | | |
Davide Campari-Milano S.p.A. | | 1,263,373 | | 8,539 | |
Interpump S.p.A. | | 364,605 | | 2,224 | |
SAES Getters S.p.A. | | 87,654 | | 738 | |
Sogefi S.p.A. | | 304,959 | | 532 | |
| | | | 12,033 | |
Japan (45.1%) | | | | | |
Ariake Japan Co., Ltd. | | 752,700 | | 14,176 | |
Axell Corp. | | 389 | | 1,342 | |
Daibiru Corp. | | 246,200 | | 2,618 | |
Doutor Nichires Holdings Co., Ltd. | | 600,889 | | 13,130 | |
Fuyo General Lease Co., Ltd. | | 181,600 | | 3,539 | |
Harmonic Drive Systems Inc. | | 326 | | 551 | |
Hikari Tsushin, Inc. | | 334,119 | | 6,422 | |
Jaccs Co., Ltd. (a) | | 2,144,000 | | 4,079 | |
Japan Pure Chemical Co. Ltd. | | 254 | | 570 | |
Japan Securities Finance Co., Ltd. | | 1,343,492 | | 6,539 | |
Leopalace21 Corp. | | 162,800 | | 1,651 | |
Maxvalu Tokai Co., Ltd. | | 46,000 | | 792 | |
Milbon Co., Ltd. | | 168,322 | | 4,716 | |
Miraial Co., Ltd. | | 193,700 | | 1,848 | |
Nakanishi, Inc. | | 63,386 | | 4,013 | |
Nihon Micro Coating Co., Ltd. | | 364,700 | | 342 | |
Nihon Trim Co., Ltd. | | 109,300 | | 2,689 | |
Ohara, Inc. | | 83,100 | | 673 | |
Okinawa Cellular Telephone Co. | | 2,967 | | 6,448 | |
Okinawa Electric Power Co., Inc. (The) | | 151,319 | | 11,274 | |
Osaki Engineering Co., Ltd. | | 616 | | 544 | |
OZEKI Co., Ltd. | | 53,800 | | 1,542 | |
Rengo Co., Ltd. | | 332,000 | | 2,715 | |
Sawada Holdings Co., Ltd. (a) | | 331,400 | | 797 | |
Shinkawa Ltd. | | 310,000 | | 3,675 | |
Snow Brand Milk Products Co., Ltd. | | 286,500 | | 1,094 | |
Sumitomo Osaka Cement Co., Ltd. | | 4,810,970 | | 12,318 | |
Sun Frontier Fudousan Co., Ltd. | | 8,879 | | 3,043 | |
TOC Co., Ltd. | | 821,000 | | 4,221 | |
Toei Animation Co., Ltd. | | 374,000 | | 7,086 | |
Tokyo Tomin Bank Ltd. (The) | | 368,581 | | 5,963 | |
Vantec Group Holdings Corp. | | 2,162 | | 3,880 | |
Yachiyo Bank Ltd. (The) | | 2,635 | | 8,470 | |
| | | | 142,760 | |
Netherlands (0.8%) | | | | | |
Advanced Metallurgical Group N.V. (a) | | 87,713 | | 860 | |
Smartrac N.V. (a) | | 107,471 | | 1,838 | |
| | | | 2,698 | |
New Zealand (1.7%) | | | | | |
Fisher & Paykel Healthcare Corp., Ltd. | | 2,239,326 | | 4,148 | |
Warehouse Group Ltd. (The) | | 597,914 | | 1,234 | |
| | | | 5,382 | |
Norway (3.3%) | | | | | |
Cermaq ASA | | 462,845 | | 1,776 | |
Fred Olsen Energy ASA | | 47,725 | | 1,283 | |
Pronova BioPharma A/S (a) | | 1,250,382 | | 4,156 | |
Schibsted ASA | | 151,279 | | 1,807 | |
TGS Nopec Geophysical Co. ASA (a) | | 281,641 | | 1,433 | |
| | | | 10,455 | |
Spain (0.6%) | | | | | |
Miquel y Costas & Miquel S.A. | | 119,548 | | 1,929 | |
62 | The accompanying notes are an integral part of the financial statements. | |
| 2008 Annual Report |
| |
| December 31, 2008 |
Portfolio of Investments (cont’d)
International Small Cap Portfolio
| | Shares | | Value
(000) | |
Sweden (2.1%) | | | | | |
Billerud AB | | 411,279 | | $ 1,116 | |
Micronic Laser Systems AB (a) | | 484,283 | | 367 | |
Saab AB, Class B | | 563,750 | | 5,152 | |
| | | | 6,635 | |
Switzerland (4.2%) | | | | | |
Bucher Industries AG (Registered) | | 10,320 | | 1,044 | |
Coltene Holding AG | | 95,940 | | 3,896 | |
Galenica AG (Registered) | | 14,583 | | 4,729 | |
LEM Holding S.A. (Registered) | | 10,581 | | 1,315 | |
Schindler Holding AG | | 48,440 | | 2,214 | |
| | | | 13,198 | |
United Kingdom (9.8%) | | | | | |
Ark Therapeutics Group plc (a) | | 3,635,466 | | 2,055 | |
Britvic plc | | 2,249,260 | | 8,582 | |
Charter International plc | | 210,519 | | 1,005 | |
CVS Group plc (a) | | 1,176,101 | | 2,159 | |
Filtrona plc | | 1,208,114 | | 2,388 | |
Luminar Group Holdings plc | | 1,236,573 | | 2,408 | |
Premier Foods plc | | 14,753,827 | | 6,498 | |
Spirax-Sarco Engineering plc | | 206,957 | | 2,712 | |
Wincanton plc | | 1,240,296 | | 3,204 | |
| | | | 31,011 | |
Total Common Stocks (Cost $419,460) | | | | 305,591 | |
Short-Term Investment (3.8%) | | | | | |
Investment Company (3.8%) | | | | | |
Morgan Stanley Institutional Liquidity Money Market Portfolio — Institutional Class (Cost $12,029) (o) | | 12,029,067 | | 12,029 | |
Total Investments (100.3%) (Cost $431,489) (v) | | | | 317,620 | |
Liabilities in Excess of Other Assets (-0.3%) | | | | (975 | ) |
Net Assets (100%) | | | | $316,645 | |
(a) | Non-income producing security. |
(d) | At December 31, 2008, the Portfolio held less than $500 of fair valued securities, representing less than 0.05% of net assets. These securities have been fair valued as determined in good faith under procedures established by and under the general supervision of the Portfolio’s Directors. |
(i) | Restricted security valued at fair value and not registered under the Securities Act of 1933. SCS Standard Computersysteme AG was acquired 4/04 and has a current cost basis of $0. At December 31, 2008, these securities had an aggregate market value of $0 representing 0.0% of net assets. |
(l) | Security has been deemed illiquid at December 31, 2008. |
(o) | See Note G to the financial statements regarding investment in Morgan Stanley Institutional Liquidity Money Market Portfolio — Institutional Class. |
(v) | The approximate market value and percentage of total investments, $305,591,000 and 96.2%, respectively, represent the securities that have been fair valued under the fair valuation policy for international investments as disclosed in Note A within the Notes to Financial Statements. |
@ | Value is less than $500. |
REIT | Real Estate Investment Trust |
Foreign Currency Exchange Contract Information:
The Portfolio had the following foreign currency exchange contract(s) open at period end:
Currency
to
Deliver
(000) | | Value
(000) | | Settlement
Date | | In
Exchange
For
(000) | | Value
(000) | | Net
Unrealized
Appreciation
(Depreciation)
(000) | |
JPY | 28,328 | | | $313 | | | 1/7/09 | | USD | 313 | | | $313 | | | | $— | @ | |
NOK | 2,179 | | | 311 | | | 1/2/09 | | USD | 303 | | | 303 | | | | (8 | ) | |
SEK | 44 | | | 6 | | | 1/5/09 | | USD | 6 | | | 6 | | | | — | @ | |
SEK | 94 | | | 12 | | | 1/2/09 | | USD | 12 | | | 12 | | | | — | @ | |
SEK | 56 | | | 7 | | | 1/7/09 | | USD | 7 | | | 7 | | | | — | @ | |
USD | 92 | | | 92 | | | 1/5/09 | | JPY | 8,334 | | | 92 | | | | — | @ | |
USD | 32 | | | 32 | | | 1/6/09 | | JPY | 2,948 | | | 32 | | | | — | @ | |
| | | | $773 | | | | | | | | | $765 | | | | $(8 | ) | |
JPY | — Japanese Yen |
NOK | — Norwegian Krone |
SEK | — Swedish Krona |
USD | — United States Dollar |
| The accompanying notes are an integral part of the financial statements. | 63 |
2008 Annual Report | |
| |
December 31, 2008 | |
Investment Overview (unaudited)
Capital Growth Portfolio
The Capital Growth Portfolio (the “Portfolio”) seeks long-term capital appreciation by investing primarily in growth-oriented equity securities of large capitalization companies. In general equity securities’ values also fluctuate in response to activities specific to a company. Investments in foreign markets entail special risks such as currency, political, economic, and market risks. The risks of investing in emerging-market countries are greater than the risks generally associated with foreign investments.
Performance
For the year ended December 31, 2008, the Portfolio had a total return based on net asset value and reinvestment of distributions per share of -50.47%, net of fees, for Class I shares. The Portfolio’s Class I shares underperformed against its benchmark, the Russell 1000® Growth Index (the “Index”) which returned -38.44%.
Factors Affecting Performance
· The market environment was extremely challenging in the 12-month period ended December 31, 2008. Paralysis in the credit markets and a complete reshaping of the financial industry prompted a significant loss of investor confidence. Risk aversion soared, as investors fled all segments of the stock and bond markets for the perceived safety of U.S. Treasuries and cash. Although the federal government and the Federal Reserve intervened with unprecedented policy measures, investors remained uncertain about the effectiveness of the response, particularly as the U.S. economy was officially declared in recession since December 2007. These events kept the stock market volatile through the end of the period.
· By far, stock selection in consumer discretionary had the largest negative impact on relative performance, despite the positive influence of an overweight to the sector. The main detractors within the sector were holdings in commercial services and hotel/motel stocks.
· Relative performance was also hurt by stock selection and an overweight in the financial services sector. Here, diversified financial services stocks were the primary area of weakness.
· Stock selection in technology was also a source of relative weakness, where holdings in communications technology lagged.
· In contrast, stock selection in the other energy sector was the largest positive contributor to relative performance, primarily due to natural gas producers. An overweight in the other energy sector slightly offset some of the relative gain.
· Both stock selection and an overweight in autos and transportation added relative value, driven by miscellaneous transportation (logistics) holdings.
· Finally, the Portfolio benefited from stock selection in the materials and processing sector, especially in steel companies.
Management Strategies
· In our view, market volatility is far greater than fundamental business volatility. The market is fearful, with investors making little differentiation on fundamentals and quality. It is our goal to hold a portfolio of high-quality growth stocks we believe will perform well regardless of the market environment. To that end, the investment team continues to focus on quality — evaluating the nature and sustainability of a company’s competitive advantage and balance sheet strength. We continue to favor companies that have some uniqueness or dynamic competitive advantage in their business model, with a high quality stream of cash flow and earnings growth and the ability to redeploy capital at a high rate of return.
· At the margin, we have eliminated names that are more cyclical or where we believe there are stronger long-term opportunities elsewhere. We believe the Portfolio is well positioned for when the market once again begins to differentiate on fundamentals.
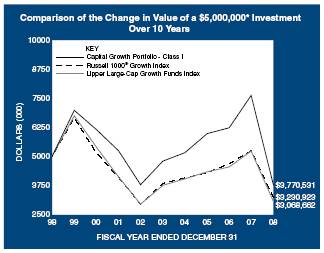
* Minimum Investment
In accordance with SEC regulations, Portfolio’s performance shown assumes that all recurring fees (including management fees) were deducted and all dividends and distributions were reinvested. The performance of Class P shares will vary from the Class I shares based upon their different inception dates and will be negatively impacted by additional fees assessed to that class.
64
| 2008 Annual Report |
| |
| December 31, 2008 |
Investment Overview (cont’d)
Capital Growth Portfolio
Performance Compared to the Russell 1000® Growth Index(1) and the Lipper Large-Cap Growth Funds Index(2)
| | Total Returns(3) | |
| | | | Average Annual |
| | One
Year | | | Five
Years | | | Ten
Years | | | Since
Inception | (6) | |
Portfolio – Class I (4) | | (50.47 | )% | | (4.70 | )% | | (2.78 | )% | | 6.22 | % | |
Russell 1000® Growth Index | | (38.44 | ) | | (3.42 | ) | | (4.27 | ) | | 5.48 | | |
Lipper Large-Cap Growth Funds Index | | (41.39 | ) | | (3.99 | ) | | (4.76 | ) | | 4.96 | | |
| | | | | | | | | | | | | |
Portfolio – Class P (5) | | (50.57 | ) | | (4.94 | ) | | (3.02 | ) | | 3.11 | | |
Russell 1000® Growth Index | | (38.44 | ) | | (3.42 | ) | | (4.27 | ) | | 2.79 | | |
Lipper Large-Cap Growth Funds Index | | (41.39 | ) | | (3.99 | ) | | (4.76 | ) | | 1.95 | | |
Performance data quoted represents past performance, which is no guarantee of future results, and current performance may be lower or higher than the figures shown. Performance assumes that all dividends and distributions, if any, were reinvested. For the most recent month-end performance figures, please visit www.morganstanley.com/msim. Investment return and principal value will fluctuate so that Portfolio shares, when redeemed, may be worth more or less than their original cost. Total returns do not reflect the deduction of taxes that a shareholder would pay on Portfolio distributions or the redemption of Portfolio shares. Performance of share classes will vary due to difference in expenses.
(1) | The Russell 1000® Growth Index measures the performance of the large-cap growth segment of the U.S. equity universe. It includes those Russell 1000® Index companies with higher price-to-book ratios and higher forecasted growth values. The Index is unmanaged and its returns do not include any sales charges or fees. Such costs would lower performance. It is not possible to invest directly in an index. |
(2) | The Lipper Large-Cap Growth Funds Index is an equally weighted performance index of the largest qualifying funds (based on net assets) in the Lipper Large-Cap Growth Funds classification. The Index, which is adjusted for capital gains distributions and income dividends, is unmanaged and should not be considered an investment. There are currently 30 funds represented in this Index. As of the date of this report, the Portfolio was in the Lipper Large-Cap Growth Funds classification. |
(3) | Total returns for the Portfolio reflect fees waived and expenses reimbursed, if applicable, by the Adviser. Without such waivers and reimbursements, total returns would have been lower. Fee waivers and/or expense reimbursements are voluntary and the Adviser reserves the right to commence or terminate any waiver and/or reimbursement at any time. |
(4) | Commenced operations on April 2, 1991 |
(5) | Commenced operations on January 2, 1996 |
(6) | For comparative purposes, average annual since inception returns listed for the Indexes refer to the inception date or initial offering of the respective share class of the Portfolio, not the inception of the Index. |
Portfolio Composition
| | Percentage of |
Classification | | Total Investments |
Financial – Miscellaneous | | | 11.3 | % |
Communications Technology | | | 10.7 | |
Computer Services Software & Systems | | | 10.7 | |
Energy – Miscellaneous | | | 7.8 | |
Retail | | | 6.7 | |
Chemicals | | | 6.4 | |
Services: Commercial | | | 6.0 | |
Other* | | | 38.4 | |
Short-Term Investment | | | 2.0 | |
Total Investments | | | 100.0 | % |
* Industries which do not appear in the above table, as well as those which represent less than 5% of total investments, if applicable, are included in the category labeled “Other”.
65
2008 Annual Report | |
| |
December 31, 2008 | |
Portfolio of Investments
Capital Growth Portfolio
| | Shares | | Value
(000) | |
Common Stocks (98.3%) | | | | | |
Advertising Agencies (0.7%) | | | | | |
Monster Worldwide, Inc. (a) | | 338,123 | | $ 4,088 | |
Air Transport (3.0%) | | | | | |
Expeditors International Washington, Inc. | | 552,014 | | 18,365 | |
Biotechnology Research & Production (3.7%) | | | | | |
Genentech, Inc. (a) | | 121,885 | | 10,105 | |
Illumina, Inc. (a) | | 475,199 | | 12,379 | |
| | | | 22,484 | |
Building: Cement (3.7%) | | | | | |
Cemex S.A.B. de C.V. ADR (a) | | 816,225 | | 7,460 | |
Martin Marietta Materials, Inc. | | 150,060 | | 14,568 | |
| | | | 22,028 | |
Casinos & Gambling (3.2%) | | | | | |
Wynn Resorts Ltd. (a) | | 453,030 | | 19,145 | |
Chemicals (6.5%) | | | | | |
Monsanto Co. | | 554,548 | | 39,012 | |
Communications Technology (10.7%) | | | | | |
America Movil S.A.B. de C.V., Class L ADR | | 446,486 | | 13,837 | |
China Mobile Ltd. ADR | | 223,641 | | 11,372 | |
Cisco Systems, Inc. (a) | | 801,116 | | 13,058 | |
QUALCOMM, Inc. | | 394,824 | | 14,146 | |
Research In Motion Ltd. (a) | | 302,627 | | 12,281 | |
| | | | 64,694 | |
Computer Services Software & Systems (10.7%) | | | | | |
Baidu, Inc. ADR (a) | | 59,403 | | 7,756 | |
Google, Inc., Class A (a) | | 127,162 | | 39,121 | |
Tencent Holdings Ltd. | | 2,030,000 | | 13,216 | |
VMware, Inc., Class A (a) | | 196,232 | | 4,649 | |
| | | | 64,742 | |
Computer Technology (4.5%) | | | | | |
Apple, Inc. (a) | | 321,085 | | 27,405 | |
Seagate Technology, Inc. (a)(d)(l) | | 186,100 | | — | |
| | | | 27,405 | |
Diversified Financial Services (2.0%) | | | | | |
CME Group, Inc. | | 58,059 | | 12,083 | |
Drugs & Pharmaceuticals (2.1%) | | | | | |
Allergan, Inc. | | 187,112 | | 7,544 | |
Gen-Probe, Inc. (a) | | 124,944 | | 5,353 | |
| | | | 12,897 | |
Electronics: Semi-Conductors/Components (1.0%) | | | | | |
First Solar, Inc. (a) | | 43,461 | | 5,996 | |
Energy — Miscellaneous (7.9%) | | | | | |
Southwestern Energy Co. (a) | | 661,943 | | 19,176 | |
Ultra Petroleum Corp. (a) | | 822,797 | | 28,395 | |
| | | | 47,571 | |
Finance Companies (1.4%) | | | | | |
BM&F Bovespa S.A. | | 3,209,237 | | 8,445 | |
Financial — Miscellaneous (11.3%) | | | | | |
American Express Co. | | 447,593 | | 8,303 | |
Berkshire Hathaway, Inc., Class B (a) | | 5,634 | | 18,108 | |
Mastercard, Inc., Class A | | 130,162 | | 18,604 | |
Redecard S.A. | | 1,426,211 | | 15,902 | |
Visa, Inc., Class A | | 140,483 | | 7,368 | |
| | | | 68,285 | |
Health Care Equipment & Supplies (1.1%) | | | | | |
Intuitive Surgical, Inc. (a) | | 50,687 | | 6,437 | |
Insurance: Multi-Line (1.6%) | | | | | |
Loews Corp. | | 345,094 | | 9,749 | |
Real Estate Investment Trusts (REIT) (4.2%) | | | | | |
Brookfield Asset Management, Inc., Class A | | 1,653,741 | | 25,253 | |
Restaurants (2.1%) | | | | | |
Starbucks Corp. (a) | | 1,339,498 | | 12,672 | |
Retail (6.7%) | | | | | |
Amazon.com, Inc. (a) | | 787,574 | | 40,387 | |
Services: Commercial (6.0%) | | | | | |
Corporate Executive Board Co. (The) | | 271,990 | | 6,000 | |
eBay, Inc. (a) | | 837,243 | | 11,688 | |
Leucadia National Corp. (a) | | 936,989 | | 18,552 | |
| | | | 36,240 | |
Shipping (2.2%) | | | | | |
C.H. Robinson Worldwide, Inc. | | 245,689 | | 13,520 | |
Wholesalers (2.0%) | | | | | |
Li & Fung Ltd. | | 6,881,601 | | 11,873 | |
Total Common Stocks (Cost $890,175) | | | | 593,371 | |
Short-Term Investment (2.0%) | | | | | |
Investment Company (2.0%) | | | | | |
Morgan Stanley Institutional Liquidity Money Market Portfolio — Institutional Class (Cost $11,972) (o) | | 11,972,287 | | 11,972 | |
Total Investments (100.3%) (Cost $902,147) (v) | | | | 605,343 | |
Liabilities in Excess of Other Assets (-0.3%) | | | | (1,619 | ) |
Net Assets (100%) | | | | $603,724 | |
| |
(a) | Non-income producing security. |
(d) | At December 31, 2008, the Portfolio held less than $500 of fair valued securities, representing less than 0.05% of net assets. These securities have been fair valued as determined in good faith under procedures established by and under the general supervision of the Portfolio’s Directors. |
(l) | Security has been deemed illiquid at December 31, 2008. |
(o) | See Note G to the financial statements regarding investment in Morgan Stanley Institutional Liquidity Money Market Portfolio — Institutional Class. |
(v) | The approximate market value and percentage of total investments, $49,436,000 and 8.2%, respectively, represent the securities that have been fair valued under the fair valuation policy for international investments as disclosed in Note A within the Notes to Financial Statements. |
ADR | American Depositary Receipt |
| | | | | | |
66 | The accompanying notes are an integral part of the financial statements. | |
| 2008 Annual Report |
| |
| December 31, 2008 |
Investment Overview (unaudited)
Focus Growth Portfolio
The Focus Growth Portfolio (formerly Focus Equity Portfolio) (the “Portfolio”) seeks capital appreciation by investing primarily in growth-oriented equity securities of large capitalization companies. The Portfolio’s concentration of its assets in a small number of issuers will subject it to greater risks. Investments in foreign markets entail special risks such as currency, political, economic, and market risks. The risks of investing in emerging-market countries are greater than the risks generally associated with foreign investments.
Performance
For the year ended December 31, 2008, the Portfolio had a total return based on net asset value per share of -52.19%, net of fees, for Class I shares. The Portfolio’s Class I shares underperformed against its benchmark, the Russell 1000® Growth Index (the “Index”) which returned -38.44%.
Factors Affecting Performance
· The market environment was extremely challenging in the 12-month period ended December 31, 2008. Paralysis in the credit markets and a complete reshaping of the financial industry prompted a significant loss of investor confidence. Risk aversion soared, as investors fled all segments of the stock and bond markets for the perceived safety of U.S. Treasuries and cash. Although the federal government and the Federal Reserve intervened with unprecedented policy measures, investors remained uncertain about the effectiveness of the response, particularly as the U.S. economy was officially declared in recession since December 2007. These events kept the stock market volatile through the end of the period.
· By far, stock selection in consumer discretionary had the largest negative impact on relative performance, despite the positive influence of an overweight to the sector. The main detractors within the sector were holdings in commercial services and consumer electronics stocks.
· Relative performance was also hurt by stock selection and an overweight in the financial services sector. Here, diversified financial services stocks were the primary area of weakness.
· Stock selection in technology was also a source of relative weakness, where holdings in communications technology lagged.
· In contrast, both stock selection and an overweight in autos and transportation added relative value, driven by miscellaneous transportation (logistics) holdings.
· The Portfolio also benefited from an avoidance of the producer durables sector.
· Finally, an overweight in the utilities sector was a positive contributor, more than offsetting the negative impact of stock selection within the sector.
Management Strategies
· In our view, market volatility is far greater than fundamental business volatility. The market is fearful, with investors making little differentiation on fundamentals and quality. It is our goal to hold a portfolio of high-quality growth stocks we believe will perform well regardless of the market environment. To that end, the investment team continues to focus on quality — evaluating the nature and sustainability of a company’s competitive advantage and balance sheet strength. We continue to favor companies that have some uniqueness or dynamic competitive advantage in their business model, with a high quality stream of cash flow and earnings growth and the ability to redeploy capital at a high rate of return.
· At the margin, we have eliminated names that are more cyclical or where we believe there are stronger long-term opportunities elsewhere. We believe the Portfolio is well positioned for when the market once again begins to differentiate on fundamentals.
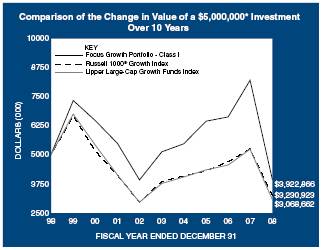
* Minimum Investment
In accordance with SEC regulations, Portfolio’s performance shown assumes that all recurring fees (including management fees) were deducted and all dividends and distributions were reinvested. The performance of Class P shares will vary from the Class I shares based upon their different inception dates and will be negatively impacted by additional fees assessed to that class.
67
2008 Annual Report |
|
December 31, 2008 |
Investment Overview (cont’d)
Focus Growth Portfolio
Performance Compared to the Russell 1000® Growth Index(1) and the Lipper Large-Cap Growth Funds Index(2)
| | Total Returns(3) | |
| | | | Average Annual |
| | One
Year | | | Five
Years | | | Ten
Years | | | Since
Inception | (6) | |
Portfolio – Class I (4) | | (52.19 | )% | | (5.17 | )% | | (2.40 | )% | | 6.54 | % | |
Russell 1000® Growth Index | | (38.44 | ) | | (3.42 | ) | | (4.27 | ) | | 4.61 | | |
Lipper Large-Cap Growth Funds Index | | (41.39 | ) | | (3.99 | ) | | (4.76 | ) | | 3.80 | | |
| | | | | | | | | | | | | |
Portfolio – Class P (5) | | (52.27 | ) | | (5.40 | ) | | (2.63 | ) | | 3.87 | | |
Russell 1000® Growth Index | | (38.44 | ) | | (3.42 | ) | | (4.27 | ) | | 2.79 | | |
Lipper Large-Cap Growth Funds Index | | (41.39 | ) | | (3.99 | ) | | (4.76 | ) | | 1.95 | | |
Performance data quoted represents past performance, which is no guarantee of future results, and current performance may be lower or higher than the figures shown. Performance assumes that all dividends and distributions, if any, were reinvested. For the most recent month-end performance figures, please visit www.morganstanley.com/msim. Investment return and principal value will fluctuate so that Portfolio shares, when redeemed, may be worth more or less than their original cost. Total returns do not reflect the deduction of taxes that a shareholder would pay on Portfolio distributions or the redemption of Portfolio shares. Performance of share classes will vary due to difference in expenses.
(1) | The Russell 1000® Growth Index measures the performance of the large-cap growth segment of the U.S. equity universe. It includes those Russell 1000® Index companies with higher price-to-book ratios and higher forecasted growth values. The Index is unmanaged and its returns do not include any sales charges or fees. Such costs would lower performance. It is not possible to invest directly in an index. |
(2) | The Lipper Large-Cap Growth Funds Index is an equally weighted performance index of the largest qualifying funds (based on net assets) in the Lipper Large-Cap Growth Funds classification. The Index, which is adjusted for capital gains distributions and income dividends, is unmanaged and should not be considered an investment. There are currently 30 funds represented in this Index. As of the date of this report, the Portfolio was in the Lipper Large-Cap Growth Funds classification. |
(3) | Total returns for the Portfolio reflect fees waived and expenses reimbursed, if applicable, by the Adviser. Without such waivers and reimbursements, total returns would have been lower. Fee waivers and/or expense reimbursements are voluntary and the Adviser reserves the right to commence or terminate any waiver and/or reimbursement at any time. |
(4) | Commenced operations on March 8, 1995 |
(5) | Commenced operations on January 2, 1996 |
(6) | For comparative purposes, average annual since inception returns listed for the Indexes refer to the inception date or initial offering of the respective share class of the Portfolio, not the inception of the Index. |
Portfolio Composition
| | Percentage of |
Classification | | Total Investments |
Computer Services Software & Systems | | | 13.9 | % |
Retail | | | 10.4 | |
Financial – Miscellaneous | | | 8.7 | |
Chemicals | | | 8.6 | |
Energy – Miscellaneous | | | 8.5 | |
Services: Commercial | | | 8.2 | |
Communications Technology | | | 7.8 | |
Computer Technology | | | 6.2 | |
Real Estate Investment Trusts (REIT) | | | 5.2 | |
Other* | | | 21.7 | |
Short-Term Investment | | | 0.8 | |
Total Investments | | | 100.0 | % |
* Industries which do not appear in the above table, as well as those which represent less than 5% of total investments, if applicable, are included in the category labeled “Other”.
68
| 2008 Annual Report |
| |
| December 31, 2008 |
Portfolio of Investments
Focus Growth Portfolio
| | Shares | | Value
(000) | |
Common Stocks (100.4%) | | | | | |
Air Transport (4.9%) | | | | | |
Expeditors International Washington, Inc. | | 8,743 | | $ 291 | |
Building: Cement (1.2%) | | | | | |
Cemex S.A.B. de C.V. ADR (a) | | 7,943 | | 73 | |
Casinos & Gambling (4.0%) | | | | | |
Wynn Resorts Ltd. (a) | | 5,669 | | 239 | |
Chemicals (8.7%) | | | | | |
Monsanto Co. | | 7,372 | | 519 | |
Communications Technology (7.9%) | | | | | |
America Movil S.A.B. de C.V., Class L ADR | | 7,171 | | 222 | |
Cisco Systems, Inc. (a) | | 4,173 | | 68 | |
Research In Motion Ltd. (a) | | 4,392 | | 178 | |
| | | | 468 | |
Computer Services Software & Systems (14.0%) | | | | | |
Baidu, Inc. ADR (a) | | 1,001 | | 131 | |
Google, Inc., Class A (a) | | 1,597 | | 491 | |
Tencent Holdings Ltd. | | 32,600 | | 212 | |
| | | | 834 | |
Computer Technology (6.3%) | | | | | |
Apple, Inc. (a) | | 4,366 | | 373 | |
Diversified Financial Services (3.2%) | | | | | |
CME Group, Inc. | | 903 | | 188 | |
Energy — Miscellaneous (8.6%) | | | | | |
Ultra Petroleum Corp. (a) | | 14,841 | | 512 | |
Finance Companies (2.8%) | | | | | |
BM&F Bovespa S.A. | | 63,349 | | 167 | |
Financial — Miscellaneous (8.8%) | | | | | |
Berkshire Hathaway, Inc., Class B (a) | | 69 | | 222 | |
Mastercard, Inc., Class A | | 2,105 | | 301 | |
| | | | 523 | |
Real Estate Investment Trusts (REIT) (5.3%) | | | | | |
Brookfield Asset Management, Inc., Class A | | 20,500 | | 313 | |
Retail (10.5%) | | | | | |
Amazon.com, Inc. (a) | | 12,221 | | 627 | |
Services: Commercial (8.3%) | | | | | |
Corporate Executive Board Co. (The) | | 3,448 | | 76 | |
eBay, Inc. (a) | | 11,645 | | 163 | |
Leucadia National Corp. (a) | | 12,907 | | 255 | |
| | | | 494 | |
Shipping (3.4%) | | | | | |
C.H. Robinson Worldwide, Inc. | | 3,645 | | 200 | |
Wholesalers (2.5%) | | | | | |
Li & Fung Ltd. | | 88,100 | | 152 | |
Total Common Stocks (Cost $9,775) | | | | 5,973 | |
Short-Term Investment (0.9%) | | | | | |
Investment Company (0.9%) | | | | | |
Morgan Stanley Institutional Liquidity Money Market Portfolio — Institutional Class (Cost $51) (o) | | 51,084 | | 51 | |
Total Investments (101.3%) (Cost $9,826) (v) | | | | 6,024 | |
Liabilities in Excess of Other Assets (-1.3%) | | | | (76 | ) |
Net Assets (100%) | | | | $5,948 | |
(a) | Non-income producing security. |
(o) | See Note G to the financial statements regarding investment in Morgan Stanley Institutional Liquidity Money Market Portfolio — Institutional Class. |
(v) | The approximate market value and percentage of total investments, $531,000 and 8.8%, respectively, represent the securities that have been fair valued under the fair valuation policy for international investments as disclosed in Note A within the Notes to Financial Statements. |
ADR | American Depositary Receipt |
| The accompanying notes are an integral part of the financial statements. | 69 |
2008 Annual Report | |
| |
December 31, 2008 | |
Investment Overview (unaudited)
Large Cap Relative Value Portfolio
The Large Cap Relative Value Portfolio (the “Portfolio”) seeks high total return by investing primarily in equity securities that the Adviser believes to be undervalued relative to the stock market in general at the time of purchase. Investments in foreign markets entail special risks such as currency, political, economic, and market risks.
Performance
For the year ended December 31, 2008, the Portfolio had a total return based on net asset value and reinvestment of distributions per share of -32.01%, net of fees, for Class I shares. The Portfolio’s Class I shares outperformed against its benchmark, the Russell 1000® Value Index (the “Index”) which returned - -36.85%.
Factors Affecting Performance
· In 2008, U.S. financial markets endured one of the worst years in history. With credit markets nearly frozen, major banks collapsing, and a lackluster policy response to the accelerating financial crisis, investors suffered a severe loss of confidence. No segment of the stock or bond markets was spared from high volatility and falling prices as investors fled to the relative safety of U.S. Treasury securities and cash. Economic woes further dampened investor sentiment. The official declaration that the U.S. economy had been in recession since December 2007 was hardly surprising to investors and consumers alike, as consumers have been pulling back spending for more than a year in response to falling real estate values, rising unemployment and lack of access to credit.
· Against this backdrop, all sectors of the stock market posted substantial declines for the 12-month period. Large-capitalization value stocks (in which the Portfolio primarily invests) lost considerable value, but growth stocks and all other market capitalization ranges showed similarly negative returns.
· All sectors in the Russell 1000® Value Index had negative absolute returns for the period. Although the same was true for the Portfolio, on a relative basis the Portfolio lost less value than the Index. Specifically, stock selection in the financial services sector was a positive contributor to relative performance. The Portfolio had better relative performance in diversified financial services, due to a holding that was more resilient than many of its peers because of its lower subprime mortgage exposure. The Portfolio’s insurance stocks, particularly in the property and casualty segment, also held up relatively well because of these companies’ comparatively more conservative balance sheets.
· An overweight position in the consumer staples sector was another positive relative contributor. Within the sector, the Portfolio held a food and staples retailer that benefited from prudent inventory management and scaling down its growth strategy.
· Stock selection in the materials sector helped the Portfolio sidestep some of the sector’s volatility. The Portfolio avoided exposure to the heavily commodity-oriented companies that declined strongly when commodity prices began to fall and instead owned a gold mining company which held up better than its peers in the difficult environment.
· However, the Portfolio’s underweight positions in the energy and utilities sectors were relative detractors. Although the sectors had negative returns for the period, they were among the better performing sectors in the Index.
· Stock selection in the consumer discretionary sector was an area of weakness, as retail holdings were hurt by falling consumer spending and media holdings saw declining advertising revenues.
Management Strategies
· The turmoil of the past year has not changed our underlying investment philosophy or our stock selection process. We continue to seek undervalued companies that are experiencing a positive change or catalyst that should have a positive impact on the stock valuation. Such catalysts could be new company management, growth or consolidation within an industry or sector, or new products.
· As a result of this process, during the year the Portfolio’s financials and energy weightings increased. The consumer staples weighting declined as we pared down good performing holdings that no longer fit our risk-return profile. The Portfolio’s top five sectors as of the end of the period were financials, health care, consumer staples, consumer discretionary, and energy.
70
| 2008 Annual Report |
| |
| December 31, 2008 |
Investment Overview (cont’d)
Large Cap Relative Value Portfolio
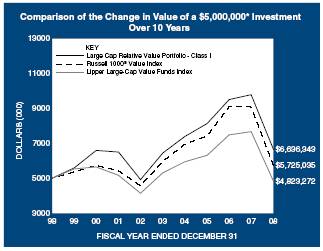
* Minimum Investment
In accordance with SEC regulations, Portfolio’s performance shown assumes that all recurring fees (including management fees) were deducted and all dividends and distributions were reinvested. The performance of Class P shares will vary from the Class I shares based upon their different inception dates and will be negatively impacted by additional fees assessed to that class.
Performance Compared to the Russell 1000® Value Index(1) and the Lipper Large-Cap Value Funds Index(2)
| | Total Returns(3) | |
| | | | Average Annual |
| | One
Year | | | Five
Years | | | Ten
Years | | | Since
Inception | (6) | |
Portfolio – Class I (4) | | (32.01 | )% | | 0.59 | % | | 2.87 | % | | 8.06 | % | |
Russell 1000® Value Index | | (36.85 | ) | | (0.79 | ) | | 1.36 | | | 8.69 | | |
Lipper Large-Cap Value Funds Index | | (37.00 | ) | | (1.90 | ) | | (0.36 | ) | | 7.47 | | |
| | | | | | | | | | | | | |
Portfolio – Class P (5) | | (32.21 | ) | | 0.30 | | | 2.62 | | | 6.04 | | |
Russell 1000® Value Index | | (36.85 | ) | | (0.79 | ) | | 1.36 | | | 6.12 | | |
Lipper Large-Cap Value Funds Index | | (37.00 | ) | | (1.90 | ) | | (0.36 | ) | | 4.46 | | |
Performance data quoted represents past performance, which is no guarantee of future results, and current performance may be lower or higher than the figures shown. Performance assumes that all dividends and distributions, if any, were reinvested. For the most recent month-end performance figures, please visit www.morganstanley.com/msim. Investment return and principal value will fluctuate so that Portfolio shares, when redeemed, may be worth more or less than their original cost. Total returns do not reflect the deduction of taxes that a shareholder would pay on Portfolio distributions or the redemption of Portfolio shares. Performance of share classes will vary due to difference in expenses.
(1) | The Russell 1000® Value Index measures the performance of the large-cap value segment of the U.S. equity universe. It includes those Russell 1000® Index companies with lower price-to-book ratios and lower expected growth values. The Index is unmanaged and its returns do not include any sales charges or fees. Such costs would lower performance. It is not possible to invest directly in an index. |
(2) | The Lipper Large-Cap Value Funds Index is an equally weighted performance index of the largest qualifying funds (based on net assets) in the Lipper Large-Cap Value Fund classification. The Index, which is adjusted for capital gains distributions and income dividends, is unmanaged and should not be considered an investment. There are currently 30 funds represented in this Index. As of the date of this report, the Portfolio was in the Lipper Large-Cap Value Funds classification. |
(3) | Total returns for the Portfolio reflect fees waived and expenses reimbursed, if applicable, by the Adviser. Without such waivers and reimbursements, total returns would have been lower. Fee waivers and/or expense reimbursements are voluntary and the Adviser reserves the right to commence or terminate any waiver and/or reimbursement at any time. |
(4) | Commenced operations on January 31, 1990 |
(5) | Commenced operations on January 2, 1996 |
(6) | For comparative purposes, average annual since inception returns listed for the Indexes refer to the inception date or initial offering of the respective share class of the Portfolio, not the inception of the Index. |
Portfolio Composition
| | Percentage of |
Classification | | Total Investments |
Drugs & Pharmaceuticals | | | 11.8 | % |
Foods | | | 7.3 | |
Communications & Media | | | 6.8 | |
Oil: Integrated | | | 5.7 | |
Utilities: Electrical | | | 5.3 | |
Other** | | | 57.7 | |
Short-Term Investment | | | 5.4 | |
Total Investments | | | 100.0 | % |
** | Industries which do not appear in the above table, as well as those which represent less than 5% of total investments, if applicable, are included in the category labeled “Other”. |
71
2008 Annual Report | |
| |
December 31, 2008 | |
Portfolio of Investments
Large Cap Relative Value Portfolio
| | Shares | | Value
(000) | |
Common Stocks (92.1%) | | | | | |
Aerospace & Defense (2.2%) | | | | | |
Raytheon Co. | | 81,110 | | $ 4,140 | |
Air Transport (0.6%) | | | | | |
Continental Airlines, Inc., Class B (a) | | 60,010 | | 1,084 | |
Auto Components (0.3%) | | | | | |
Autoliv, Inc. | | 21,865 | | 469 | |
Banks: Outside New York City (2.9%) | | | | | |
PNC Financial Services Group, Inc. | | 65,536 | | 3,211 | |
SunTrust Banks, Inc. | | 71,254 | | 2,105 | |
| | | | 5,316 | |
Beverages: Soft Drinks (1.0%) | | | | | |
Coca-Cola Co. (The) | | 39,740 | | 1,799 | |
Chemicals (2.5%) | | | | | |
Bayer AG ADR | | 76,510 | | 4,545 | |
Commercial Banks (1.5%) | | | | | |
KeyCorp | | 121,355 | | 1,034 | |
Mitsubishi UFJ Financial Group, Inc. ADR (o) | | 59,212 | | 368 | |
Mizuho Financial Group, Inc. ADR | | 118,142 | | 682 | |
Sumitomo Mitsui Financial Group, Inc. | | 143 | | 619 | |
| | | | 2,703 | |
Communications & Media (6.8%) | | | | | |
Comcast Corp., Class A | | 205,595 | | 3,470 | |
Time Warner, Inc. | | 531,578 | | 5,348 | |
Viacom, Inc., Class B (a) | | 194,692 | | 3,711 | |
| | | | 12,529 | |
Communications Technology (1.6%) | | | | | |
Alcatel-Lucent ADR (a) | | 309,100 | | 665 | |
Cisco Systems, Inc. (a) | | 136,530 | | 2,225 | |
| | | | 2,890 | |
Computer Services Software & Systems (0.2%) | | | | | |
Symantec Corp. (a) | | 28,542 | | 386 | |
Computer Technology (1.7%) | | | | | |
EMC Corp. (a) | | 38,040 | | 398 | |
Hewlett-Packard Co. | | 75,949 | | 2,756 | |
| | | | 3,154 | |
Consumer Electronics (1.1%) | | | | | |
Sony Corp. ADR | | 92,200 | | 2,016 | |
Consumer Staples — Miscellaneous (0.4%) | | | | | |
Kimberly-Clark Corp. | | 15,390 | | 812 | |
Cosmetics (0.9%) | | | | | |
Estee Lauder Cos., Inc. (The) | | 55,500 | | 1,718 | |
Diversified Financial Services (1.5%) | | | | | |
Bank of America Corp. | | 200,697 | | 2,826 | |
Drugs & Pharmaceuticals (11.8%) | | | | | |
Abbott Laboratories | | 72,600 | | 3,875 | |
Bristol-Myers Squibb Co. | | 162,980 | | 3,789 | |
Cardinal Health, Inc. | | 36,100 | | 1,244 | |
Novartis AG ADR | | 58,120 | | 2,892 | |
Roche Holding AG ADR | | 42,000 | | 3,215 | |
Schering-Plough Corp. | | 285,360 | | 4,860 | |
Wyeth | | 52,250 | | 1,960 | |
| | | | 21,835 | |
Electronics: Semi-Conductors/Components (1.5%) | | | | | |
ASML Holding N.V. (NY Shares) | | 65,300 | | 1,180 | |
Intel Corp. | | 113,731 | | 1,667 | |
| | | | 2,847 | |
Energy — Miscellaneous (3.7%) | | | | | |
Anadarko Petroleum Corp. | | 36,800 | | 1,419 | |
Devon Energy Corp. | | 23,710 | | 1,558 | |
Occidental Petroleum Corp. | | 63,560 | | 3,813 | |
| | | | 6,790 | |
Energy Equipment (0.6%) | | | | | |
Schlumberger Ltd. | | 27,740 | | 1,174 | |
Financial — Miscellaneous (3.5%) | | | | | |
Marsh & McLennan Cos., Inc. | | 264,447 | | 6,418 | |
Foods (7.4%) | | | | | |
Cadbury plc ADR | | 128,619 | | 4,588 | |
Kraft Foods, Inc., Class A | | 67,078 | | 1,801 | |
Philip Morris International, Inc. | | 42,730 | | 1,859 | |
Unilever N.V. | | 219,040 | | 5,378 | |
| | | | 13,626 | |
Insurance: Property & Casualty (4.2%) | | | | | |
Chubb Corp. | | 74,480 | | 3,798 | |
Travelers Cos., Inc. (The) | | 87,400 | | 3,951 | |
| | | | 7,749 | |
Investment Management Companies (4.8%) | | | | | |
JPMorgan Chase & Co. | | 284,604 | | 8,974 | |
Manufacturing (1.5%) | | | | | |
Siemens AG ADR | | 23,210 | | 1,758 | |
Tyco International Ltd. | | 43,545 | | 941 | |
| | | | 2,699 | |
Materials & Processing — Miscellaneous (1.4%) | | | | | |
Newmont Mining Corp. | | 63,050 | | 2,566 | |
Medical & Dental Instruments & Supplies (1.9%) | | | | | |
Boston Scientific Corp. (a) | | 178,110 | | 1,379 | |
Covidien Ltd. | | 60,855 | | 2,205 | |
| | | | 3,584 | |
Multi-Sector Companies (1.1%) | | | | | |
General Electric Co. | | 124,520 | | 2,017 | |
Oil, Gas & Consumable Fuels (0.4%) | | | | | |
Hess Corp. | | 14,700 | | 789 | |
Oil: Integrated (5.7%) | | | | | |
BP plc ADR | | 41,430 | | 1,937 | |
ConocoPhillips | | 21,610 | | 1,119 | |
Exxon Mobil Corp. | | 49,600 | | 3,960 | |
Royal Dutch Shell plc ADR | | 66,950 | | 3,544 | |
| | | | 10,560 | |
Recreational Vehicles & Boats (0.4%) | | | | | |
Harley-Davidson, Inc. | | 48,877 | | 829 | |
72 | The accompanying notes are an integral part of the financial statements. | |
| 2008 Annual Report |
| |
| December 31, 2008 |
Portfolio of Investments (cont’d)
Large Cap Relative Value Portfolio
| | Shares | | Value
(000) | |
Restaurants (0.5%) | | | | | |
Starbucks Corp. (a) | | 101,630 | | $ 961 | |
Retail (4.5%) | | | | | |
Home Depot, Inc. | | 150,116 | | 3,456 | |
Macy’s, Inc. | | 107,520 | | 1,113 | |
Wal-Mart Stores, Inc. | | 67,040 | | 3,758 | |
| | | | 8,327 | |
Securities Brokerage & Services (1.2%) | | | | | |
Charles Schwab Corp. (The) | | 141,372 | | 2,286 | |
Services: Commercial (2.0%) | | | | | |
eBay, Inc. (a) | | 192,390 | | 2,686 | |
Manpower, Inc. | | 19,100 | | 649 | |
Robert Half International, Inc. | | 17,500 | | 364 | |
| | | | 3,699 | |
Soaps & Household Chemicals (1.1%) | | | | | |
Procter & Gamble Co. | | 32,550 | | 2,012 | |
Utilities: Electrical (5.3%) | | | | | |
American Electric Power Co., Inc. | | 144,980 | | 4,825 | |
Entergy Corp. | | 24,590 | | 2,044 | |
FirstEnergy Corp. | | 59,350 | | 2,883 | |
| | | | 9,752 | |
Utilities: Telecommunications (2.4%) | | | | | |
Verizon Communications, Inc. | | 131,665 | | 4,463 | |
Total Common Stocks (Cost $215,179) | | | | 170,344 | |
Preferred Stock (0.6%) | | | | | |
Diversified Financial Services (0.6%) | | | | | |
Bank of America Corp. (Convertible) | | | | | |
(Cost $1,538) (a) | | 1,601 | | 1,041 | |
Investment Companies (2.2%) | | | | | |
Financial Select Sector SPDR Fund | | 242,451 | | 3,060 | |
Regional Bank Holders Trust | | 4,579 | | 346 | |
SPDR KBW Regional Banking ETF | | 20,243 | | 590 | |
Total Investment Companies (Cost $6,952) | | | | 3,996 | |
Short-Term Investment (5.4%) | | | | | |
Investment Company (5.4%) | | | | | |
Morgan Stanley Institutional Liquidity Funds — Money Market Portfolio — Institutional Class (Cost $10,002) (o) | | 10,002,575 | | 10,003 | |
Total Investments (100.3%) (Cost $233,671) (v) | | | | 185,384 | |
Liabilities in Excess of Other Assets (-0.3%) | | | | (503 | ) |
Net Assets (100%) | | | | $184,881 | |
(a) | Non-income producing security. |
(o) | See Note G to the financial statements regarding investments in Mitsubishi UFJ Financial Group, Inc. ADR and Morgan Stanley Institutional Liquidity Funds — Money Market Portfolio — Institutional Class. |
(v) | The approximate market value and percentage of total investments, $619,000 and 0.3%, respectively, represent the securities that have been fair valued under the fair valuation policy for international investments as disclosed in Note A within the Notes to Financial Statements. |
ADR | American Depositary Receipt |
ETF | Exchange Traded Fund |
SPDR | Standard & Poor’s Depositary Receipt |
| The accompanying notes are an integral part of the financial statements. | 73 |
2008 Annual Report | |
| |
December 31, 2008 | |
Investment Overview (unaudited)
Small Company Growth Portfolio
The Small Company Growth Portfolio (the “Portfolio”) seeks long-term capital appreciation by investing primarily in growth-oriented equity securities of small capitalization companies. Investments in small sized corporations are more vulnerable to financial risks and other risks than larger corporations and may involve a higher degree of price volatility than investments in the general equity markets.
Performance
For the year ended December 31, 2008, the Portfolio had a total return based on net asset value and reinvestment of distributions per share of -41.84%, net of fees, for Class I shares. The Portfolio’s Class I shares underperformed against its benchmark, the Russell 2000® Growth Index (the “Index”) which returned -38.54%.
Factors Affecting Performance
· The market environment was extremely challenging in the 12-month period ended December 31, 2008. Paralysis in the credit markets and a complete reshaping of the financial industry prompted a significant loss of investor confidence. Risk aversion soared, as investors fled all segments of the stock and bond markets for the perceived safety of U.S. Treasuries and cash. Although the federal government and the Federal Reserve intervened with unprecedented policy measures, investors remained uncertain about the effectiveness of the response, particularly as the U.S. economy was officially declared in recession since December 2007. These events kept the stock market volatile through the end of the period. Small-cap stocks, in which the Portfolio invests, finished the year with a substantial loss.
· Stock selection in the technology sector had the largest negative impact on relative performance, despite the positive influence of an underweight in the sector. Within the sector, the Portfolio was hurt by exposure to the miscellaneous technology (business software and services) industry.
· Stock selection and an overweight in the consumer discretionary sector also had a detrimental effect on relative performance. Within the sector, commercial services and retail holdings lagged.
· Finally, in the financial services sector, stock selection hampered relative performance, offsetting the benefit of an overweight in the sector. The group’s leading detractor was a real estate investment trust.
· However, stock selection and an underweight in the other energy sector was by far the largest contributor to relative performance, driven by natural gas producers.
· Stock selection in health care also had a positive effect on relative performance, although an underweight to the sector dampened some of the relative gain. Within the sector, health care services holdings led stronger relative performance.
· Rounding out the top three positive contributors was the materials and processing sector, where stock selection and an overweight in the sector both added value.
Management Strategies
· This period was an unusual year for small-cap funds, as portfolios aligned more closely to the benchmark outperformed the more concentrated, less “benchmark aware” portfolios such as ours. Historically, over time, active managers have outperformed small-cap benchmarks.
· In our view, market volatility is far greater than fundamental business volatility. The market is fearful, with investors making little differentiation on fundamentals and quality. It is our goal to hold a portfolio of high-quality growth stocks we believe will perform well regardless of the market environment. To that end, the investment team continues to focus on quality — evaluating the nature and sustainability of a company’s competitive advantage and balance sheet strength. We continue to favor companies that have some uniqueness or dynamic competitive advantage in their business model, with a high quality stream of cash flow and earnings growth and the ability to redeploy capital at a high rate of return.
· At the margin, we have eliminated names that are more cyclical or where we believe there are stronger long-term opportunities. We believe the Portfolio is well positioned for when the market once again begins to differentiate on fundamentals.
74
| 2008 Annual Report |
| |
| December 31, 2008 |
Investment Overview (cont’d)
Small Company Growth Portfolio
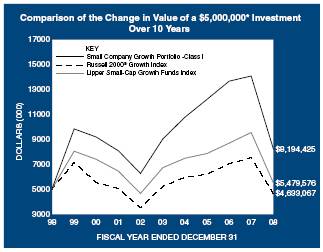
* Minimum Investment
In accordance with SEC regulations, Portfolio’s performance shown assumes that all recurring fees (including management fees) were deducted and all dividends and distributions were reinvested. The performance of Class P shares will vary from the Class I shares based upon their different inception dates and will be negatively impacted by additional fees assessed to that class.
Performance Compared to the Russell 2000® Growth Index(1) and the Lipper Small-Cap Growth Funds Index(2)
| | Total Returns(3) |
| | | | Average Annual |
| | One | | Five | | Ten | | Since | |
| | Year | | Years | | Years | | Inception | (6) |
Portfolio — Class I (4) | | (41.84 | )% | (1.93 | )% | 5.06 | % | 9.01 | % |
Russell 2000® Growth Index | | (38.54 | ) | (2.35 | ) | (0.76 | ) | 4.55 | |
Lipper Small-Cap Growth Funds Index | | (42.62 | ) | (4.06 | ) | 0.92 | | 6.70 | |
| | | | | | | | | |
Portfolio — Class P (5) | | (41.97 | ) | (2.17 | ) | 4.81 | | 6.75 | |
Russell 2000® Growth Index | | (38.54 | ) | (2.35 | ) | (0.76 | ) | 1.26 | |
Lipper Small-Cap Growth Funds Index | | (42.62 | ) | (4.06 | ) | 0.92 | | 2.87 | |
Performance data quoted represents past performance, which is no guarantee of future results, and current performance may be lower or higher than the figures shown. Performance assumes that all dividends and distributions, if any, were reinvested. For the most recent month-end performance figures, please visit www.morganstanley.com/msim. Investment return and principal value will fluctuate so that Portfolio shares, when redeemed, may be worth more or less than their original cost. Total returns do not reflect the deduction of taxes that a shareholder would pay on Portfolio distributions or the redemption of Portfolio shares. Performance of share classes will vary due to difference in expenses.
(1) The Russell 2000® Growth Index measures the performance of the small-cap growth segment of the U.S. equity universe. It includes those Russell 2000® Index companies with higher price-to-book ratios and higher forecasted growth values. The Index is unmanaged and its returns do not include any sales charges or fees. Such costs would lower performance. It is not possible to invest directly in an index.
(2) The Lipper Small-Cap Growth Funds Index is an equally weighted performance index of the largest qualifying funds (based on net assets) in the Lipper Small-Cap Growth Funds classification. The Index, which is adjusted for capital gains distributions and income dividends, is unmanaged and should not be considered an investment. There are currently 30 funds represented in this Index. As of the date of this report, the Portfolio was in the Lipper Small-Cap Growth Funds classification.
(3) Total returns for the Portfolio reflect fees waived and expenses reimbursed, if applicable, by the Adviser. Without such waivers and expense reimbursements, total returns would have been lower. Fee waivers and/or expense reimbursements are voluntary and the Adviser reserves the right to commence or terminate any waiver and/or reimbursement at any time.
(4) Commenced operations on November 1, 1989
(5) Commenced operations on January 2, 1996
(6) For comparative purposes, average annual since inception returns listed for the Indexes refer to the inception date or initial offering of the respective share class of the Portfolio, not the inception of the Index.
Portfolio Composition
| | Percentage of |
Classification | | Total Investments |
Computer Services Software & Systems | | 11.1 | % |
Services: Commercial | | 9.8 | |
Retail | | 6.8 | |
Medical & Dental Instruments & Supplies | | 6.7 | |
Investment Management Companies | | 5.8 | |
Building: Cement | | 5.1 | |
Other** | | 53.0 | |
Short-Term Investment | | 1.7 | |
Total Investments | | | 100.0 | % |
| | | | |
** Industries which do not appear in the above table, as well as those which represent less than 5% of total investments, if applicable, are included in the category labeled “Other”.
75
2008 Annual Report | |
| |
December 31, 2008 | |
Portfolio of Investments
Small Company Growth Portfolio
| | | | Value | |
| | Shares | | (000) | |
Common Stocks (96.6%) | | | | | |
Biotechnology Research & Production (4.2%) | | | | | |
Alnylam Pharmaceuticals, Inc. (a) | | 900,786 | | $ | 22,277 | |
Illumina, Inc. (a) | | 738,470 | | 19,237 | |
| | | | 41,514 | |
Building: Cement (5.1%) | | | | | |
Eagle Materials, Inc. | | 1,361,917 | | 25,073 | |
Texas Industries, Inc. | | 738,699 | | 25,485 | |
| | | | 50,558 | |
Casinos & Gambling (0.3%) | | | | | |
Lakes Entertainment, Inc. (a) | | 613,119 | | 2,465 | |
Communications & Media (0.4%) | | | | | |
CKX, Inc. (a) | | 1,117,557 | | 4,101 | |
Communications Technology (2.3%) | | | | | |
Gmarket, Inc. ADR (a) | | 695,472 | | 11,997 | |
GSI Commerce, Inc. (a) | | 1,047,523 | | 11,020 | |
| | | | 23,017 | |
Computer Services Software & Systems (11.2%) | | | | | |
Bankrate, Inc. (a) | | 329,016 | | 12,503 | |
Blackboard, Inc. (a) | | 650,745 | | 17,069 | |
comScore, Inc. (a) | | 535,398 | | 6,826 | |
Forrester Research, Inc. (a) | | 1,145,683 | | 32,320 | |
Longtop Financial Technologies Ltd. ADR (a) | | 1,088,234 | | 16,454 | |
Sina Corp. (a) | | 352,953 | | 8,171 | |
Solera Holdings, Inc. (a) | | 712,090 | | 17,161 | |
| | | | 110,504 | |
Education Services (4.0%) | | | | | |
Ambassadors Group, Inc. | | 1,021,275 | | 9,396 | |
American Public Education, Inc. (a) | | 256,799 | | 9,550 | |
Strayer Education, Inc. | | 93,311 | | 20,007 | |
| | | | 38,953 | |
Electronics: Semi-Conductors/Components (1.2%) | | | | | |
Tessera Technologies, Inc. (a) | | 970,576 | | 11,531 | |
Electronics: Technology (1.3%) | | | | | |
Cogent Communications Group, Inc. (a) | | 1,976,323 | | 12,905 | |
Energy — Miscellaneous (4.6%) | | | | | |
Contango Oil & Gas Co. (a) | | 800,188 | | 45,051 | |
Engineering & Contracting Services (2.2%) | | | | | |
Grupo Aeroportuario del Pacifico S.A.B. de C.V. ADR | | 918,391 | | 21,141 | |
Finance Companies (0.3%) | | | | | |
Climate Exchange plc (a) | | 213,895 | | 2,721 | |
Financial — Miscellaneous (4.7%) | | | | | |
Interactive Data Corp. | | 594,014 | | 14,648 | |
Riskmetrics Group, Inc. (a) | | 2,089,651 | | 31,115 | |
| | | | 45,763 | |
Homebuilding (1.3%) | | | | | |
Brascan Residential Properties S.A. | | 3,224,207 | | 3,445 | |
Gafisa S.A. ADR | | 983,576 | | 9,108 | |
| | | | 12,553 | |
Hotel/Motel (0.6%) | | | | | |
Mandarin Oriental International Ltd. | | 6,241,693 | | | 6,198 | |
Insurance: Multi-Line (1.9%) | | | | | |
Greenlight Capital Re Ltd., Class A (a) | | 1,198,300 | | 15,566 | |
Pico Holdings, Inc. (a) | | 111,103 | | 2,953 | |
| | | | 18,519 | |
Investment Management Companies (5.8%) | | | | | |
Capital Southwest Corp. | | 32,715 | | 3,539 | |
Greenhill & Co., Inc. | | 773,905 | | 53,995 | |
| | | | 57,534 | |
Leisure Time (1.0%) | | | | | |
Aruze Corp. | | 879,600 | | 8,877 | |
Premier Exhibitions, Inc. (a) | | 917,249 | | 1,009 | |
| | | | 9,886 | |
Machinery: Industrial/Specialty (0.8%) | | | | | |
Middleby Corp. (a) | | 278,215 | | 7,587 | |
Medical & Dental Instruments & Supplies (6.8%) | | | | | |
Cepheid, Inc. (a) | | 629,832 | | 6,538 | |
Techne Corp. | | 938,521 | | 60,553 | |
| | | | 67,091 | |
Oil: Crude Producers (2.6%) | | | | | |
Carrizo Oil & Gas, Inc. (a) | | 444,989 | | 7,164 | |
GMX Resources, Inc. (a) | | 722,787 | | 18,301 | |
| | | | 25,465 | |
Printing & Copying Services (1.0%) | | | | | |
VistaPrint Ltd. (a) | | 534,406 | | 9,945 | |
Publishing — Miscellaneous (1.2%) | | | | | |
Morningstar, Inc. (a) | | 329,472 | | 11,696 | |
Real Estate Investment Trusts (REIT) (0.5%) | | | | | |
Consolidated-Tomoka Land Co. | | 131,943 | | 5,039 | |
Restaurants (3.6%) | | | | | |
BJ’s Restaurants, Inc. (a) | | 1,042,269 | | 11,225 | |
P.F. Chang’s China Bistro, Inc. (a) | | 1,144,323 | | 23,962 | |
| | | | 35,187 | |
Retail (6.8%) | | | | | |
Blue Nile, Inc. (a) | | 1,074,431 | | 26,313 | |
Citi Trends, Inc. (a) | | 860,234 | | 12,663 | |
Ctrip.com International Ltd. ADR | | 810,649 | | 19,293 | |
Dena Co., Ltd. | | 2,794 | | 8,982 | |
| | | | 67,251 | |
Services: Commercial (9.9%) | | | | | |
Advisory Board Co. (The) (a) | | 1,116,930 | | 24,908 | |
Corporate Executive Board Co. (The) | | 419,678 | | 9,258 | |
CoStar Group, Inc. (a) | | 959,295 | | 31,599 | |
Information Services Group, Inc. (a) | | 2,373,870 | | 8,071 | |
MercadoLibre, Inc. (a) | | 630,330 | | 10,344 | |
New Oriental Education & Technology Group ADR (a) | | 244,135 | | 13,405 | |
| | | | 97,585 | |
76 | The accompanying notes are an integral part of the financial statements. | |
| 2008 Annual Report |
| |
| December 31, 2008 |
Portfolio of Investments (cont’d)
Small Company Growth Portfolio
| | | | Value | |
| | Shares | | (000) | |
Shoes (1.0%) | | | | | |
Lululemon Athletica, Inc. (a) | | 1,246,740 | | $ | 9,887 | |
Technology — Miscellaneous (3.7%) | | | | | |
athenahealth, Inc. (a) | | 708,315 | | 26,647 | |
iRobot Corp. (a) | | 703,141 | | 6,349 | |
Market Leader, Inc. (a) | | 1,024,170 | | 1,741 | |
Rediff.com India Ltd. ADR (a) | | 804,484 | | 1,617 | |
| | | | 36,354 | |
Toys (3.0%) | | | | | |
Marvel Entertainment, Inc. (a) | | 964,468 | | 29,657 | |
Transportation — Miscellaneous (0.5%) | | | | | |
Integrated Distribution Services Group Ltd. | | 4,778,400 | | 5,270 | |
Utilities: Electrical (2.8%) | | | | | |
Brookfield Infrastructure Partners LP | | 2,482,297 | | 27,802 | |
Total Common Stocks (Cost $1,423,530) | | | | 950,730 | |
Preferred Stocks (2.6%) | | | | | |
Biotechnology Research & Production (0.6%) | | | | | |
Pacific Biosciences of California, Inc. (Convertible) (a)(d)(l) | | 1,046,420 | | 5,860 | |
Diversified Financial Services (0.5%) | | | | | |
Ning, Inc. (Convertible) (a)(d)(l) | | 1,132,800 | | 5,670 | |
Drugs & Pharmaceuticals (1.5%) | | | | | |
Ironwood Pharmaceutical, Inc. (Convertible) (a)(d)(l) | | 1,212,976 | | 14,556 | |
Total Preferred Stocks (Cost $23,006) | | | | 26,086 | |
Short-Term Investment (1.8%) | | | | | |
Investment Company (1.8%) | | | | | |
Morgan Stanley Institutional Liquidity Money Market Portfolio — Institutional Class
(Cost $17,235) (o) | | 17,235,166 | | 17,235 | |
Total Investments (101.0%) (Cost $1,463,771) (v) | | | | 994,051 | |
Liabilities in Excess of Other Assets (-1.0%) | | | | (10,190 | ) |
Net Assets (100%) | | | | $ | 983,861 | |
(a) Non-income producing security.
(d) At December 31, 2008, the Portfolio held approximately $26,086,000 of fair valued securities, representing 2.7% of net assets. These securities have been fair valued as determined in good faith under procedures established by and under the general supervision of the Portfolio’s Directors.
(l) Security has been deemed illiquid at December 31, 2008.
(o) See Note G to the financial statements regarding investment in Morgan Stanley Institutional Liquidity Money Market Portfolio — Institutional Class.
(v) The approximate market value and percentage of total investments, $35,493,000 and 3.6%, respectively, represent the securities that have been fair valued under the fair valuation policy for international investments as disclosed in Note A within the Notes to Financial Statements.
ADR American Depositary Receipt
| The accompanying notes are an integral part of the financial statements. | 77 |
2008 Annual Report | |
| |
December 31, 2008 | |
Investment Overview (unaudited)
U.S. Real Estate Portfolio
The U.S. Real Estate Portfolio (the “Portfolio”) seeks to provide above average current income and long-term capital appreciation by investing primarily in equity securities of companies in the U.S. real estate industry, including real estate investment trusts (“REITs”). The Portfolio’s concentration in the real estate sector makes it subject to greater risk and volatility than other portfolios that are more diversified, and the value of its shares may be substantially affected by economic events in the real estate industry. In addition to the risks associated with ownership of real estate and the real estate industry in general include, fluctuations in the value of underlying property, defaults by borrowers or tenants, market saturation, decreases in market rents, interest rates, property taxes, increases in operating expenses and political or regulatory occurrences adversely affecting real estate.
Performance
For the year ended December 31, 2008, the Portfolio had a total return based on net asset value and reinvestment of distributions per share of -38.07%, net of fees, for Class I shares. The Portfolio’s Class I shares underperformed against its benchmarks, the FTSE NAREIT Equity REIT Index (the “Index”) which returned -37.73% and the S&P 500® Index which returned -37.00%.
Factors Affecting Performance
· The real estate investment trust (REIT) market experienced a significant decline of 37.73% in the year ending December 31, 2008, as measured by the FTSE NAREIT Equity REIT Index (the “Index”).
· Despite the continued deterioration of the credit markets and weakened outlook for economic growth, REITs posted modest gains through September. It appeared that movements in REIT share prices through September were most impacted by investor sentiment, as the sector may have been viewed as a defensive investment due to the lagged negative impact of a weaker economy on company earnings and limited transactional evidence of declines in asset values.
· In wide contrast, the REIT market subsequently declined 38.8% in the fourth quarter, reflecting investor concerns with regard to growing evidence of an economic recession and a further deterioration of the financial and credit markets. Indeed, the profound lack of debt capital and absence of liquidity for assets has caused companies to become highly conservative with regard to their capital planning and investors to question the viability of a number of listed property companies facing significant upcoming debt maturities.
· Among the major U.S. REIT sectors, the apartment sector significantly outperformed, the office sector modestly underperformed and the retail sector significantly underperformed the Index. Apartment stocks appeared to outperform as investors viewed them as marginally safer than other sectors given their favorable operating performance through the third quarter despite a continued weak employment picture. Perhaps of greater importance, these companies continue to have access to debt financing from Fannie Mae and Freddie Mac, which currently differentiates them from owners of commercial assets. The office sector modestly underperformed as investors weighed the benefit of their longer-term lease structure versus the likely negative impact on leasing from continued corporate layoff announcements. The retail sector significantly underperformed as it is expected that weaker retail properties may suffer meaningful occupancy declines due to store closures. In addition, the sector features a number of companies with higher than average leverage and near-term debt maturities, which investors believe will likely be problematic in the current credit environment.
· The smaller REIT sectors had the most significant disparities from the Index. The strongest performers were the storage and health care sectors, which are perceived as defensive sectors in a weak economic environment. The hotel REITs significantly underperformed the Index due to a continued weakening of demand. The weakest performer was the industrial sector as investors became increasingly concerned that the massive global development business platforms for the two largest industrial REITs will be severely impaired in this economic environment and that these companies may face significant refinancing issues.
· The Portfolio modestly underperformed the Index in the period. Bottom-up stock selection contributed to performance and top-down sector allocation detracted from returns. Stock selection was strong in the shopping center, mall and apartment sectors; this was partially offset by stock selection in the hotel and industrial sectors. From a top-down perspective, the Portfolio benefited from an underweight to the industrial sector, an overweight to the apartment sector and from a higher than average level of cash. This was offset by an overweight to the hotel sector and an underweight to the storage and health care sectors.
Management Strategies
· We have maintained our core investment philosophy as a real estate value investor. This results in the ownership of stocks whose share prices provide real estate exposure at what we believe to be the best valuation relative to their underlying asset values.
78
| 2008 Annual Report |
| |
| December 31, 2008 |
Investment Overview (cont’d)
U.S. Real Estate Portfolio
· Given the unprecedented current lack of clarity on underlying asset values due to the lack of liquidity for assets, we have favored stocks whose share prices already more than reflect prospective declines in underlying asset values. In addition, we seek to invest in companies that we believe are well-positioned to weather the current liquidity crisis and have a capital plan that is appropriately conservative due to the uncertain timing of the recovery of the credit markets.
· Our company-specific research has led us to an overweighting in the Portfolio to a group of companies that are focused in the ownership of upscale urban hotels and apartment properties, as well as an underweighting to companies concentrated in the ownership of storage, industrial, health care and shopping center assets.
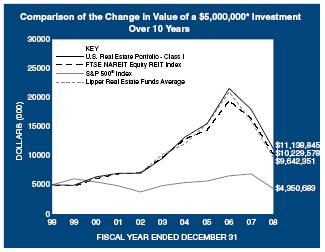
* Minimum Investment
In accordance with SEC regulations, Portfolio’s performance shown assumes that all recurring fees (including management fees) were deducted and all dividends and distributions were reinvested. The performance of Class P shares will vary from the Class I shares based upon their different inception dates and will be negatively impacted by additional fees assessed to that class.
Performance Compared to the FTSE NAREIT Equity REIT Index(1), the S&P 500® Index(2) and the Lipper Real Estate Funds Average(3)
| | Total Returns(4) | |
| | | | Average Annual | |
| | One | | Five | | Ten | | Since | |
| | Year | | Years | | Years | | Inception | (7) |
Portfolio – Class I (5) | | (38.07 | )% | 2.97 | % | 8.34 | % | 10.94 | % |
FTSE NAREIT Equity REIT Index | | (37.73 | ) | 0.91 | | 7.42 | | 8.66 | |
S&P 500® Index | | (37.00 | ) | (2.19 | ) | (1.38 | ) | 6.42 | |
Lipper Real Estate Funds Index | | (39.92 | ) | (0.67 | ) | 6.82 | | 8.63 | |
| | | | | | | | | |
Portfolio – Class P (6) | | (38.26 | ) | 2.72 | | 8.05 | | 9.71 | |
FTSE NAREIT Equity REIT Index | | (37.73 | ) | 0.91 | | 7.42 | | 8.08 | |
S&P 500® Index | | (37.00 | ) | (2.19 | ) | (1.38 | ) | 4.72 | |
Lipper Real Estate Funds Index | | (39.92 | ) | (0.67 | ) | 6.82 | | 7.77 | |
Performance data quoted represents past performance, which is no guarantee of future results, and current performance may be lower or higher than the figures shown. Performance assumes that all dividends and distributions, if any, were reinvested. For the most recent month-end performance figures, please visit www.morganstanley.com/msim. Investment return and principal value will fluctuate so that Portfolio shares, when redeemed, may be worth more or less than their original cost. Total returns do not reflect the deduction of taxes that a shareholder would pay on Portfolio distributions or the redemption of Portfolio shares. Performance of share classes will vary due to difference in expenses.
(1) The FTSE NAREIT (National Association of Real Estate Investment Trusts) Equity REIT Index is an unmanaged market weighted index of tax-qualified REITs listed on the New York Stock Exchange, American Stock Exchange and the NASDAQ National Market System. The Index is unmanaged and its returns do not include any sales charges or fees. Such costs would lower performance. It is not possible to invest directly in an index.
(2) The Standard & Poor’s 500® Index (S&P 500®) measures the performance of the large cap segment of the U.S. equities market, covering approximately 75% of the U.S. equities market. The Index includes 500 leading companies in leading industries of the U.S. economy. The Index is unmanaged and its returns do not include any sales charges or fees. Such costs would lower performance. It is not possible to invest directly in an index.
(3) The Lipper Real Estate Funds Average tracks the performance of all funds in the Lipper Real Estate Funds classification. The Average, which is adjusted for capital gains distributions and income dividends, is unmanaged and should not be considered an investment. As of the date of this report, the Portfolio was in the Lipper Real Estate Funds classification.
(4) Total returns for the Portfolio reflect fees waived and expenses reimbursed, if applicable, by the Adviser. Without such waivers and reimbursements, total returns would have been lower. Fee waivers and/or expense reimbursements are voluntary and the Adviser reserves the right to commence or terminate any waiver and/or reimbursement at any time.
(5) Commenced operations on February 24, 1995
(6) Commenced operations on January 2, 1996
(7) For comparative purposes, average annual since inception returns listed for the Indexes refer to the inception date or initial offering of the respective share class of the Portfolio, not the inception of the Index.
79
2008 Annual Report | |
| |
December 31, 2008 | |
Investment Overview (cont’d)
U.S. Real Estate Portfolio
Portfolio Composition*
| | Percentage of |
Classification | | Total Investments |
Residential Apartments | | 19.0 | % |
Office | | 15.0 | |
Health Care | | 13.5 | |
Lodging/Resorts | | 10.6 | |
Retail Strip Centers | | 10.4 | |
Retail Regional Malls | | 9.3 | |
Other** | | | 21.3 | |
Short-Term Investment | | | 0.9 | |
Total Investments | | | 100.0 | % |
* Percentages indicated are based upon total investments (excluding Securities held as collateral on Loaned Securities) as of December 31, 2008.
** Industries which do not appear in the above table, as well as those which represent less than 5% of total investments, if applicable, are included in the category labeled “Other”.
80
| 2008 Annual Report |
| |
| December 31, 2008 |
Portfolio of Investments
U.S. Real Estate Portfolio
| | | | Value | |
| | Shares | | (000) | |
Common Stocks (98.0%) | | | | | |
Diversified (4.7%) | | | | | |
Forest City Enterprises, Inc., Class A (c) | | 768,371 | | $ | 5,148 | |
Vornado Realty Trust REIT (c) | | 339,635 | | 20,497 | |
| | | | 25,645 | |
Health Care (13.3%) | | | | | |
Assisted Living Concepts, Inc., Class A (a)(c) | | 1,110,310 | | 4,608 | |
Care Investment Trust, Inc. REIT | | 126,450 | | 985 | |
Extendicare REIT | | 44,700 | | 212 | |
HCP, Inc. REIT | | 530,449 | | 14,730 | |
Healthcare Realty Trust, Inc. REIT (c) | | 971,390 | | 22,808 | |
Senior Housing Properties Trust REIT | | 1,130,292 | | 20,255 | |
Ventas, Inc. REIT | | 268,550 | | 9,015 | |
| | | | 72,613 | |
Industrial (4.3%) | | | | | |
AMB Property Corp. REIT (c) | | 255,623 | | 5,987 | |
Cabot Industrial Value Fund II, LP (a)(d)(i)(l) | | 12,667 | | 6,334 | |
Cabot Industrial Value Fund III, LP (a)(i) | | 221 | | 111 | |
DCT Industrial Trust, Inc. REIT (c) | | 379,190 | | 1,918 | |
Exeter Industrial Value Fund, LP (d) | | 3,400,000 | | 3,400 | |
Keystone Industrial Fund, LP (d)(i)(l) | | 6,525,000 | | 5,401 | |
| | | | 23,151 | |
Lodging/Resorts (10.5%) | | | | | |
Host Hotels & Resorts, Inc. REIT (c) | | 2,953,112 | | 22,355 | |
Morgans Hotel Group Co. (a) | | 648,265 | | 3,021 | |
Starwood Hotels & Resorts Worldwide, Inc. (c) | | 1,624,665 | | 29,082 | |
Strategic Hotels & Resorts, Inc. REIT | | 1,481,244 | | 2,488 | |
| | | | 56,946 | |
Office (14.8%) | | | | | |
Boston Properties, Inc. REIT | | 652,181 | | 35,870 | |
BRCP REIT I, LLC (a)(d)(i)(l) | | 6,101,396 | | 2,287 | |
BRCP REIT II, LLC (a)(d)(i)(l) | | 5,586,430 | | 4,469 | |
Brookfield Properties Corp. | | 2,405,542 | | 18,595 | |
Douglas Emmett, Inc. REIT (c) | | 126,623 | | 1,654 | |
Mack-Cali Realty Corp. REIT (c) | | 735,001 | | 18,007 | |
| | | | 80,882 | |
Office/Industrial (3.0%) | | | | | |
Duke Realty Corp. REIT (c) | | 322,712 | | 3,537 | |
Liberty Property Trust REIT (c) | | 442,470 | | 10,101 | |
PS Business Parks, Inc. REIT | | 65,512 | | 2,926 | |
| | | | 16,564 | |
Residential Apartments (18.8%) | | | | | |
Atlantic Gulf Communities Corp. (a)(i)(l) | | 140,284 | | — | |
AvalonBay Communities, Inc. REIT (c) | | 653,034 | | 39,561 | |
Camden Property Trust REIT (c) | | 659,218 | | 20,660 | |
Equity Residential REIT (c) | | 989,591 | | 29,510 | |
Post Properties, Inc. REIT | | 780,813 | | 12,883 | |
| | | | 102,614 | |
Residential Manufactured Homes (2.0%) | | | | | |
Equity Lifestyle Properties, Inc. REIT (c) | | 278,334 | | 10,677 | |
Retail Regional Malls (9.2%) | | | | | |
Macerich Co. (The) REIT (c) | | 8,089 | | | 147 | |
Simon Property Group, Inc. REIT (c) | | 887,864 | | 47,172 | |
Taubman Centers, Inc. REIT | | 104,503 | | 2,661 | |
| | | | 49,980 | |
Retail Strip Centers (10.3%) | | | | | |
Acadia Realty Trust REIT (c) | | 364,383 | | 5,200 | |
BPP Liquidating Trust REIT (a)(d)(l) | | 113,290 | | — | |
Federal Realty Investment Trust REIT (c) | | 331,404 | | 20,574 | |
Ramco-Gershenson Properties Trust REIT (c) | | 135,525 | | 837 | |
Regency Centers Corp. REIT (c) | | 630,107 | | 29,426 | |
Weingarten Realty Investors REIT (c) | | 13,050 | | 270 | |
| | | | 56,307 | |
Self Storage (4.0%) | | | | | |
Public Storage REIT | | 240,528 | | 19,122 | |
Sovran Self Storage, Inc. REIT (c) | | 69,962 | | 2,519 | |
| | | | 21,641 | |
Timber (3.1%) | | | | | |
Plum Creek Timber Co., Inc. REIT (c) | | 480,608 | | 16,696 | |
Total Common Stocks (Cost $808,500) | | | | 533,716 | |
Preferred Stocks (0.0%) | | | | | |
Residential Apartments (0.0%) | | | | | |
Atlantic Gulf Communities Corp., Series B (a)(d)(i)(l) | | 107,021 | | — | |
Atlantic Gulf Communities Corp., Series B (Convertible) (a)(d)(i)(l) | | 75,765 | | — | |
Total Preferred Stocks (Cost $1,828) | | | | — | |
Short-Term Investments (25.1%) | | | | | |
Securities held as Collateral on Loaned Securities (24.2%) | | | | | |
Investment Company (19.4%) | | | | | |
Morgan Stanley Institutional Liquidity Money Market Portfolio — Institutional Class (o) | | 105,764,317 | | 105,764 | |
| | | | | |
| | Face | | | |
| | Amount | | | |
| | (000) | | | |
Repurchase Agreement (4.8%) | | | | | |
Goldman Sachs & Co., 0.06%, dated 12/31/08, due 1/2/09, repurchase price $25,982; fully collateralized by U.S. government agency securities at the date of this Portfolio of Investments as follows: Federal Home Loan Mortgage Corp., Gold Pools: rates ranging from 4.50% to 6.00%, due 11/1/19 - 12/1/38; Federal National Mortgage Association, Fixed Rate Mortgages: rates ranging from 4.00% - 7.00%, due 9/1/18 - 1/1/39; Government National Mortgage Association, Fixed Rate Mortgages: rates ranging from 4.50% to 11.50%, due 6/15/16 - 12/20/38, valued at $26,502. | | $ 25,982 | | 25,982 | |
| | | | 131,746 | |
| | | | | | | |
| The accompanying notes are an integral part of the financial statements. | 81 |
2008 Annual Report | |
| |
December 31, 2008 | |
Portfolio of Investments (cont’d)
U.S. Real Estate Portfolio
| | | | Value | |
| | Shares | | (000) | |
Investment Company (0.9%) | | | | | |
Morgan Stanley Institutional Liquidity Money Market Portfolio — Institutional Class (o) | | 5,079,104 | | $ | 5,079 | |
Total Short-Term Investments (Cost $136,825) | | | | 136,825 | |
Total Investments (123.1%) (Cost $947,153) —including $128,396 of Securities Loaned | | | | 670,541 | |
Liabilities in Excess of Other Assets (-23.1%) | | | | (125,816 | ) |
Net Assets (100%) | | | | $ | 544,725 | |
(a) | | Non-income producing security. |
(c) | | All or a portion of security on loan at December 31, 2008. |
(d) | | At December 31, 2008, the Portfolio held approximately $21,891,000 of fair valued securities, representing 4.0% of net assets. These securities have been fair valued as determined in good faith under procedures established by and under the general supervision of the Portfolio’s Directors. |
(i) | | Restricted security valued at fair value and not registered under the Securities Act of 1933. Atlantic Gulf Communities Corp. was acquired in 6/97 and has a current cost basis of $790,000. Atlantic Gulf Communities Corp., Series B Preferred was acquired in 11/97 and has a current cost basis of $758,000. Atlantic Gulf Communities Corp., Series B (Convertible) Preferred was acquired in 6/97 and has a current cost basis of $1,070,000. BRCP REIT I, LLC was acquired between 5/03 - 5/08 and has a current cost basis of $2,464,000. BRCP REIT II, LLC was acquired between 10/06 - 12/07 and has a current cost basis of $5,586,000. Cabot Industrial Value Fund II, LP was acquired between 11/05 - 11/08 and has a current cost basis of $6,334,000, Cabot Industrial Value Fund III, LP was acquired on 12/08 and has a current cost basis of $111,000, Keystone Industrial Fund, LP was acquired between 3/06 - 9/07 and has a current cost basis of $5,401,000. At December 31, 2008, these securities had an aggregate market value of $18,602,000 representing 3.4% of net assets. |
(l) | | Security has been deemed illiquid at December 31, 2008. |
(o) | | See Note G to the financial statements regarding investment in Morgan Stanley Institutional Liquidity Money Market Portfolio — Institutional Class. |
REIT | Real Estate Investment Trust |
82 | The accompanying notes are an integral part of the financial statements. | |
| 2008 Annual Report |
| |
| December 31, 2008 |
Investment Overview (unaudited)
U.S. Small/Mid Cap Value Portfolio
U.S. Small/Mid Cap Value Portfolio (the “Portfolio”) seeks long-term capital appreciation by investing primarily in common stocks and other equity securities, including convertible securities, of small- and mid-size companies that the Adviser believes are undervalued relative to the marketplace or to similar companies. Stocks of small and medium-sized companies entail special risks, such as limited product lines, markets, and financial resources, and greater market volatility than securities of larger, more-established companies. In addition to the risks associated with common stocks, investments in convertible securities are subject to the risks associated with fixed-income securities, namely credit, price and interest-rate risks.
Performance
For the year ended December 31, 2008, the Portfolio had a total return based on net asset value and reinvestment of distributions per share of -38.03%, net of fees, for Class I shares. The Portfolio’s Class I shares underperformed against its benchmark, the Russell 2500® Value Index (the “Index”) which returned -31.99%.
Factors Affecting Performance
· Following a volatile start to 2008, the broad stock market enjoyed a relative upswing from mid-March through mid-May. The market was supported by renewed confidence that capital markets were beginning to stabilize and expectations that a recession, if one occurred, would be shorter and shallower than initially expected.
· However, the sense of relief was soon overshadowed by more bad news from the financial sector and the economy, including drastically lower consumer sentiment measures and concerns about the solvency of Fannie Mae and Freddie Mac.
· A series of problems with major financial institutions, and subsequent government interventions with forced consolidations within the sector, led to wild swings in the stock market in September and October. Credit conditions, which had been tight since the demise of the subprime mortgage market, froze, exacerbating the deterioration of investor confidence. Recession expectations turned more pessimistic, leading to a steep drop in commodity prices. Additionally, mutual fund tax-loss selling, which occurs in October, and forced selling by hedge funds further contributed to volatility.
· Governments and central banks around the world responded quickly to the accelerating crisis with aggressive fiscal and monetary policy.
· In November, market volatility remained heightened. The official announcement that the U.S. had been in recession since December 2007 was hardly surprising to observers, amid bad news from nearly every segment of the economy and the appeal by U.S. automakers for a government bailout.
· Sentiment turned more upbeat in December, however. With oil prices substantially off their highs, inflation concerns were put to rest (although they were replaced by deflation concerns). The Federal Reserve reduced the target federal funds rate and indicated rates were likely to remain low for some time, while Congress approved loans to U.S. automakers. Observers kept a close eye on the cabinet choices and proposed stimulus plan of the incoming Obama Administration. Volatility in equity prices moderated somewhat and liquidity measures showed slight improvement. However, considerable uncertainty remained.
· Across the market capitalization spectrum, no particular segment outperformed, with all segments posting considerable declines for the period. Value stocks held up better than growth stocks in every market cap range, but particularly so in small-caps. Within the Index, the utilities, consumer staples, and financial services sectors had the smallest declines; while energy, consumer discretionary, and technology were the weakest performers.
· Relative to the Index, the Portfolio’s performance was bolstered by stock selection in the consumer discretionary sector, where selected business services holdings were particularly beneficial.
· Stock selection within the health care sector also drove relative gains, due to a health care services company and a specialty pharmaceuticals company.
· Although the Portfolio has minimal exposure to the autos and transportation sector, an aerospace-related holding added value.
· Finally, an underweight in the energy sector helped the Portfolio avoid some of the sector’s decline.
· However, stock selection in the producer durables sector was less favorable. The slowing economy and drop in end-market demand hurt many companies in this sector, including the Portfolio’s holdings in aerospace, telecommunications equipment, and office supplies and equipment companies.
83
2008 Annual Report
December 31, 2008
Investment Overview (cont’d)
U.S. Small/Mid Cap Value Portfolio
· The materials and processing sector was another area of weakness, as selected holdings dampened relative performance.
· An underweight position and stock selection within the financial services sector had a negative impact, with an underweight to banks, positions in several insurance companies, and a hotel real estate investment trust (REIT) holding being the primary detractors.
· An overweight to the technology sector, one of the worst performing sectors in the Index, further hampered relative results.
Management Strategies
· The Portfolio began the year with an overweight in producer durables but finished the year with a neutral weighting in the sector. Outside of that change, the Portfolio’s positioning shifted very little during the period.
· At the end of the period, as a result of our bottom-up, value-driven stock selection process, the Portfolio held significant underweights in financial services, especially banks and REITs (although insurance represented an overweight), and in utilities. The largest overweights in the Portfolio were consumer discretionary, especially business services, technology, and health care.
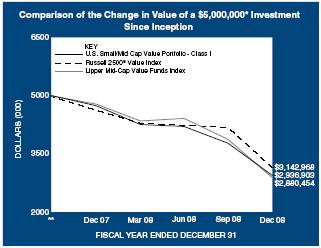
* | Minimum Investment |
** | Commenced operations on September 27, 2007. |
In accordance with SEC regulations, Portfolio’s performance shown assumes that all recurring fees (including management fees) were deducted and all dividends and distributions were reinvested. The performance of Class P shares will vary from the Class I shares based upon their different inception dates and will be negatively impacted by additional fees assessed to that class.
Performance Compared to the Russell 2500® Value Index(1) and the Lipper Mid-Cap Value Funds Index(2)
| | Total Returns(3) |
| | | | Average Annual |
| | One | | Five | | Ten | | Since | |
| | Year | | Years | | Years | | Inception(5) | |
Portfolio – Class I (4) | | (38.03 | )% | — | | — | | (34.44 | )% |
Russell 2500® Value Index | | (31.99 | ) | — | | — | | (30.83 | ) |
Lipper Mid-Cap Value Funds Index | | (39.71 | ) | — | | — | | (35.46 | ) |
| | | | | | | | | |
Portfolio – Class P (4) | | (38.21 | ) | — | | — | | (34.65 | ) |
Russell 2500® Value Index | | (31.99 | ) | — | | — | | (30.83 | ) |
Lipper Mid-Cap Value Funds Index | | (39.71 | ) | — | | — | | (35.46 | ) |
| | | | | | | | | | |
Performance data quoted represents past performance, which is no guarantee of future results, and current performance may be lower or higher than the figures shown. Performance assumes that all dividends and distributions, if any, were reinvested. For the most recent month-end performance figures, please visit www.morganstanley.com/msim. Investment return and principal value will fluctuate so that Portfolio shares, when redeemed, may be worth more or less than their original cost. Total returns do not reflect the deduction of taxes that a shareholder would pay on Portfolio distributions or the redemption of Portfolio shares. Performance of share classes will vary due to difference in expenses.
(1) | The Russell 2500® Value Index measures the performance of those companies in the Russell 2500® Index with lower price -to-book ratios and lower forecasted growth values. The Index is unmanaged and its returns do not include any sales charges or fees. Such costs would lower performance. It is not possible to invest directly in an index. |
(2) | The Lipper Mid-Cap Value Funds Index is an equally weighted performance index of the largest qualifying funds (based on net assets) in the Lipper Mid-Cap Value Funds classification. The Index, which is adjusted for capital gains distributions and income dividends, is unmanaged and should not be considered an investment. There are currently 30 funds represented in this Index. As of the date of this report, the Portfolio was in the Lipper Mid-Cap Value Funds classification. |
(3) | Total returns for the Portfolio reflect fees waived and expenses reimbursed, if applicable, by the Adviser. Without such waivers and reimbursements, total returns would have been lower. Fee waivers and/or expense reimbursements are voluntary and the Adviser reserves the right to commence or terminate any waiver and/or reimbursement at any time. |
(4) | Commenced operations on September 27, 2007 |
(5) | For comparative purposes, cumulative since inception returns listed for the Indexes refer to the inception date or initial offering of the respective share class of the Portfolio, not the inception of the Index. |
Portfolio Composition
| | Percentage of | |
Classification | | Total Investments | |
Insurance | | 18.6 | % |
Aerospace & Defense | | 9.7 | |
Information Technology Services | | 9.2 | |
Commercial Services & Supplies | | 6.2 | |
Other*** | | 51.1 | |
Short-Term Investment | | | 5.2 | |
Total Investments | | | 100.0 | % |
| | | | | |
*** Industries which do not appear in the above table, as well as those which represent less than 5% of total investments, if applicable, are included in the category labeled “Other”.
84
| 2008 Annual Report |
| |
| December 31, 2008 |
Portfolio of Investments
U.S. Small/Mid Cap Value Portfolio
| | | | Value | |
| | Shares | | (000) | |
Common Stocks (93.1%) | | | | | |
Aerospace & Defense (9.7%) | | | | | |
AAR Corp. (a) | | 34,500 | | $ | 635 | |
Alliant Techsystems, Inc. (a) | | 5,000 | | 429 | |
Goodrich Corp. | | 11,200 | | 415 | |
Spirit Aerosystems Holdings, Inc., Class A (a) | | 12,800 | | 130 | |
| | | | 1,609 | |
Beverages (2.5%) | | | | | |
Molson Coors Brewing Co., Class B | | 8,500 | | 416 | |
Chemicals (3.2%) | | | | | |
Cytec Industries, Inc. | | 9,900 | | 210 | |
Lubrizol Corp. | | 8,800 | | 320 | |
| | | | 530 | |
Commercial Services & Supplies (6.1%) | | | | | |
Brink’s Co. (The) | | 12,400 | | 333 | |
Brink’s Home Security Holdings Inc. (a) | | 12,400 | | 272 | |
Cenveo, Inc. (a) | | 28,700 | | 128 | |
Copart, Inc. (a) | | 3,100 | | 84 | |
RR Donnelley & Sons Co. | | 14,700 | | 200 | |
| | | | 1,017 | |
Computers & Peripherals (3.4%) | | | | | |
MSC.Software Corp. (a) | | 28,600 | | 191 | |
Teradata Corp. (a) | | 25,200 | | 374 | |
| | | | 565 | |
Containers & Packaging (3.8%) | | | | | |
Owens-Illinois, Inc. (a) | | 7,400 | | 202 | |
Pactiv Corp. (a) | | 16,200 | | 403 | |
Smurfit-Stone Container Corp. (a) | | 114,100 | | 29 | |
| | | | 634 | |
Diversified Telecommunication Services (2.4%) | | | | | |
CenturyTel, Inc. | | 14,700 | | 402 | |
Electrical Equipment (2.0%) | | | | | |
Belden, Inc. | | 15,500 | | 323 | |
Energy Equipment & Services (2.2%) | | | | | |
Exterran Holdings, Inc. (a) | | 11,500 | | 245 | |
Superior Energy Services, Inc. (a) | | 8,000 | | 127 | |
| | | | 372 | |
Food Products (3.2%) | | | | | |
ConAgra Foods, Inc. | | 14,800 | | 244 | |
Corn Products International, Inc. | | 9,800 | | 283 | |
| | | | 527 | |
Gas Utilities (2.6%) | | | | | |
UGI Corp. | | 17,400 | | 425 | |
Health Care Providers & Services (3.8%) | | | | | |
IMS Health, Inc. | | 15,500 | | 235 | |
PerkinElmer, Inc. | | 28,800 | | 400 | |
| | | | 635 | |
Hotels Restaurants & Leisure (0.8%) | | | | | |
AFC Enterprises, Inc. (a) | | 26,500 | | | 124 | |
Household Durables (4.3%) | | | | | |
Snap-On, Inc. | | 12,100 | | 477 | |
Stanley Works (The) | | 6,900 | | 235 | |
| | | | 712 | |
Information Technology Services (9.2%) | | | | | |
Broadridge Financial Solutions, Inc. | | 34,000 | | 426 | |
Computer Sciences Corp. (a) | | 12,000 | | 422 | |
MAXIMUS, Inc. | | 19,300 | | 678 | |
| | | | 1,526 | |
Insurance (18.6%) | | | | | |
Assurant, Inc. | | 20,700 | | 621 | |
Axis Capital Holdings Ltd. | | 9,400 | | 274 | |
Conseco, Inc. (a) | | 75,700 | | 392 | |
Hanover Insurance Group, Inc. (The) | | 15,059 | | 647 | |
Markel Corp. (a) | | 1,400 | | 419 | |
Reinsurance Group of America Inc. | | 16,800 | | 719 | |
| | | | 3,072 | |
Media (1.3%) | | | | | |
Scripps Networks Interactive, Inc., Class A | | 9,500 | | 209 | |
Office Electronics (2.2%) | | | | | |
Zebra Technologies Corp., Class A (a) | | 18,100 | | 367 | |
Oil, Gas & Consumable Fuels (0.9%) | | | | | |
Pioneer Natural Resources Co. | | 8,700 | | 141 | |
Pharmaceuticals (4.5%) | | | | | |
Mylan, Inc. (a) | | 25,200 | | 249 | |
NBTY, Inc. (a) | | 9,000 | | 141 | |
Perrigo Co. | | 11,000 | | 355 | |
| | | | 745 | |
Software (4.4%) | | | | | |
Amdocs Ltd. (a) | | 17,300 | | 317 | |
Check Point Software Technologies (a) | | 21,500 | | 408 | |
| | | | 725 | |
Thrifts & Mortgage Finance (2.0%) | | | | | |
TFS Financial Corp. | | 25,800 | | 333 | |
Total Common Stocks (Cost $21,143) | | | | 15,409 | |
| | | | | |
| | Face | | | |
| | Amount | | | |
| | (000) | | | |
Fixed Income (1.4%) | | | | | |
Life Science Tools & Services (1.4%) | | | | | |
Life Technologies Corp. (Convertible), 1.50%, 2/15/24 (Cost $309) | | $ | 309 | | 233 | |
| | | | | | | |
| The accompanying notes are an integral part of the financial statements. | 85 |
2008 Annual Report
December 31, 2008
Portfolio of Investments (cont’d)
U.S. Small/Mid Cap Value Portfolio
| | | | Value | |
| | Shares | | (000) | |
Short-Term Investment (5.2%) | | | | | |
Investment Company (5.2%) | | | | | |
Morgan Stanley Institutional Liquidity Funds — Money Market Portfolio — Institutional Class (Cost $861) (o) | | 860,939 | | $ | 861 | |
Total Investments (99.7%) (Cost $22,313) | | | | 16,503 | |
Other Assets in Excess of Liabilities (0.3%) | | | | 47 | |
Net Assets (100%) | | | | $ | 16,550 | |
(a) Non-income producing security
(o) See Note G to the financial statements regarding investment in Morgan Stanley Institutional Liquidity Money Market Portfolio — Institutional Class.
86 | The accompanying notes are an integral part of the financial statements. | |
| 2008 Annual Report |
| |
| December 31, 2008 |
Investment Overview (unaudited)
Emerging Markets Debt Portfolio
The Emerging Markets Debt Portfolio (the “Portfolio”) seeks high total return by investing primarily in fixed income securities of government and government-related issuers and, to a lesser extent, of corporate issuers in emerging market countries. Foreign investing involves certain risks, including currency fluctuations and controls, restrictions on foreign investments, less governmental supervision and regulation, less liquidity and the potential for market volatility and political instability. In addition, investing in emerging markets may involve a relatively higher degree of volatility. Fixed income securities are subject to credit and interest-rate risk. Credit risk refers to the ability of an issuer to make timely payments of interest and principal. Interest-rate risk refers to fluctuations in the value of a fixed-income security resulting from changes in the general level of interest rates. In a declining interest-rate environment, the portfolio may generate less income. In a rising interest-rate environment, bond prices fall.
Performance
For the year ended December 31, 2008, the Portfolio had a total return based on net asset value and reinvestment of distributions per share of -10.07%, net of fees, for Class I shares. The Portfolio’s Class I shares underperformed against its benchmark, the JP Morgan EMBI Global Bond Index / JP Morgan GBI-EM Diversified Bond Index, which returned -5.22%.
Factors Affecting Performance
· In the first half of 2008, the global economy avoided a serious recession and the prospect of the rest of the world “decoupling” from the U.S.-centered credit crisis was considered a possibility. The most serious threat to the economic performance of emerging market (EM) countries during this time was inflationary pressures coming from high food and commodity prices. While economic data began to show signs of deterioration in the U.S. and other developed countries, economic growth in the emerging world remained strong, driven by the continued growth of external accounts and increasing domestic demand. EM bonds, both in U.S. dollars and in local currency, performed relatively well with spreads trading in a fairly narrow range.
· Late in the third quarter, the Lehman Brothers bankruptcy and the associated freezing of credit markets turned the economic headwinds decidedly more negative. Investor confidence plummeted, risk appetite collapsed, and forced selling of all sorts of risky assets ensued. Credit in global markets dried up, marking a turning point for those countries that had managed to remain on the sidelines of the crisis. EM countries endured a series of shocks including manic selling by leveraged investors, an unprecedented drop in commodity prices, and a sharp contraction in developed market growth. Most asset classes declined regardless of fundamentals as indiscriminate deleveraging generated a vicious cycle in which falling prices further undermined investor confidence, fueling additional unwinding of positions.
· Central Banks across the globe pursued aggressive monetary policies in the last quarter of the year, including considerable reductions in benchmark interest rates, which helped EM local bonds recover some of the losses incurred in the prior months. For the overall year, however, EM government bonds underperformed developed bonds as investors sought the relative safety of U.S. Treasury bonds, yet outperformed other risky asset classes such as U.S. high yield bonds, leveraged loans and commercial mortgage-backed securities. The J. P. Morgan GBI-EM Diversified Bond Index declined 5.22% in 2008, and the yield rose from 8.22% to 8.34%.
· The Fund’s underweights to Hungary and Russia in the latter part of the year, as well as overweights to Mexico and Nigeria aided relative returns. Conversely, an overweight to Argentina early in the year and underweights to the Czech Republic and Thailand detracted from relative returns.
Management Strategies
· We favored securities in Brazil, Mexico and Malaysia during the reporting period.
· The Fund maintained a neutral risk posture throughout most of the period, but had a moderately lower interest-rate duration relative to the Index.
· While EM debt and credit fundamentals remained strong at year end, particularly for the systematically important EM countries, risk premiums and domestic interest rates remain elevated. There was some improvement in the credit markets late in the year, which allowed issuers to borrow from the capital markets and trading volumes to improve slightly. We believe that the destruction of value in the last months of the year has created good opportunities in those EM countries with still strong fundamentals that should well position them to weather the global economic recession.
87
2008 Annual Report |
|
December 31, 2008 |
Investment Overview (cont’d)
Emerging Markets Debt Portfolio
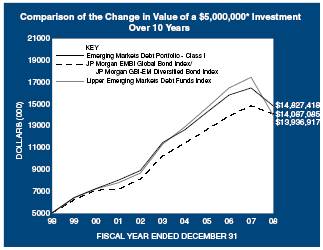
* Minimum Investment
In accordance with SEC regulations, Portfolio’s performance shown assumes that all recurring fees (including management fees) were deducted and all dividends and distributions were reinvested. The performance of Class P, Class H, and Class L shares will vary from the Class I shares based upon their different inception dates and will be negatively impacted by additional fees assessed to those classes.
Performance Compared to the JP Morgan EMBI Global Bond Index/JP Morgan GBI-EM Diversified Bond Index(1) and the Lipper Emerging Markets Debt Funds Index(2).
| | Total Returns(3) |
| | | | Average Annual |
| | One | | Five | | Ten | | Since | |
| | Year | | Years | | Years | | Inception | (8) |
Portfolio – Class I (4) | | (10.07) | % | 5.26 | % | 11.48 | % | 9.27 | % |
JP Morgan EMBI Global Bond Index/JP Morgan GBI-EM Diversified Bond Index | | (5.22) | | 6.60 | | 10.91 | | 9.48 | |
Lipper Emerging Markets Debt Funds Index | | (20.11) | | 4.21 | | 10.79 | | — | |
Portfolio – Class P (5) | | (10.34) | | 4.98 | | 11.17 | | 9.54 | |
JP Morgan EMBI Global Bond Index/JP Morgan GBI-EM Diversified Bond Index | | (5.22) | | 6.60 | | 10.91 | | 10.66 | |
Lipper Emerging Markets Debt Funds Index | | (20.11) | | 4.21 | | 10.79 | | 9.10 | |
| | Total Returns(3) |
| | | | Average Annual |
| | One | | Five | | Ten | | Since |
| | Year | | Years | | Years | | Inception (8) |
Portfolio – Class H w/o sales charges (6) | | — | | — | | — | | (10.70) | % |
Portfolio – Class H with maximum 3.50% sales charges (6) | | — | | — | | — | | (13.84) | |
JP Morgan EMBI Global Bond Index/JP Morgan GBI-EM Diversified Bond Index | | — | | — | | — | | (5.62) | |
Lipper Emerging Markets Debt Funds Index | | — | | — | | — | | (20.28) | |
Portfolio – Class L(7) | | — | | — | | — | | (11.85) | |
JP Morgan EMBI Global Bond Index/JP Morgan GBI-EM Diversified Bond Index | | — | | — | | — | | (6.28) | |
Lipper Emerging Markets Debt Funds Index | | — | | — | | — | | (19.62) | |
Performance data quoted represents past performance, which is no guarantee of future results, and current performance may be lower or higher than the figures shown. Performance assumes that all dividends and distributions, if any, were reinvested. For the most recent month-end performance figures, please visit www.morganstanley.com/msim. Investment return and principal value will fluctuate so that Portfolio shares, when redeemed, may be worth more or less than their original cost. Total returns do not reflect the deduction of taxes that a shareholder would pay on Portfolio distributions or the redemption of Portfolio shares. Performance of share classes will vary due to difference in sales charges and expenses.
(1) | JP Morgan EMBI Global Bond Index/JP Morgan GBI-EM Diversified Bond Index is a custom index represented by performance of the JP Morgan EMBI Global Bond Index (which tracks the performance U.S. dollar - denominated debt instruments issued by emerging markets) for periods from the Portfolio’s inception to September 30, 2007 and the JP Morgan GBI-EM Diversified Bond Index (which tracks local currency government bonds issued by emerging markets) for periods thereafter. The Index is unmanaged and its returns do not include any sales charges or fees. Such costs would lower performance. It is not possible to invest directly in an index. |
(2) | The Lipper Emerging Markets Debt Funds Index is an equally weighted performance index of the largest qualifying funds (based on net assets) in the Lipper Emerging Markets Debt Funds classification. The Index, which is adjusted for capital gains distributions and income dividends, is unmanaged and should not be considered an investment. There are currently 10 funds represented in this Index. As of the date of this report, the Portfolio was in the Lipper Emerging Markets Debt Funds classification. |
(3) | Total returns for the Portfolio reflect fees waived and expenses reimbursed, if applicable, by the Adviser. Without such waivers and reimbursements, total returns would have been lower. Fee waivers and/or expense reimbursements are voluntary and the Adviser reserves the right to commence or terminate any waiver and/or reimbursement at any time. |
(4) | Commenced operations on February 1, 1994. |
(5) | Commenced operations on January 2, 1996. |
(6) | Commenced operations on January 2, 2008. |
(7) | Commenced operations on June 16, 2008. |
(8) | For comparative purposes, average annual since inception returns listed for the Indexes refer to the inception date or initial offering of the respective share class of the Portfolio, not the inception of the Index. |
Portfolio Composition
| | Percentage of | |
Classification | | Total Investments | |
Sovereign | | 83.6 | % |
Other** | | 3.9 | |
Short-Term Investment | | | 12.5 | |
Total Investments | | | 100.0 | % |
** Industries which do not appear in the above table, as well as those which represent less than 5% of total investments, if applicable, are included in the category labeled “Other”.
88
| 2008 Annual Report |
| |
| December 31, 2008 |
Portfolio of Investments
Emerging Markets Debt Portfolio
| | Face | | | |
| | Amount | | Value | |
| | (000) | | (000) | |
Debt Instruments (92.9%) | | | | | |
Brazil (12.9%) | | | | | |
Corporate (0.3%) | | | | | |
Banco ABN Amro Real S.A., | | | | | |
16.20%, 2/22/10 | | BRL | 170 | | $ | 74 | |
Sovereign (12.6%) | | | | | |
Brazil Notas do Tesouro Nacional, Series F, | | | | | |
10.00%, 1/1/14 | | 9,131 | | 3,499 | |
| | | | 3,573 | |
Colombia (1.3%) | | | | | |
Sovereign (1.3%) | | | | | |
Republic of Colombia, | | | | | |
12.00%, 10/22/15 | | COP | 713,000 | | 350 | |
Hungary (10.3%) | | | | | |
Sovereign (10.3%) | | | | | |
Republic of Hungary, | | | | | |
6.25%, 8/24/10 | | HUF | 144,850 | | 719 | |
6.75%, 4/12/10 | | 118,430 | | 601 | |
Republic of Hungary, 12/B, | | | | | |
7.25%, 6/12/12 | | 290,140 | | 1,418 | |
Republic of Hungary, 17/B, | | | | | |
6.75%, 2/24/17 | | 20,280 | | 95 | |
| | | | 2,833 | |
Indonesia (7.8%) | | | | | |
Corporate (0.0%) | | | | | |
Tjiwi Kimia Finance Mauritius Ltd., Tranche A, | | | | | |
5.53%, 4/28/15 (e)(h) | | $ | — | @ | — | @ |
Sovereign (7.8%) | | | | | |
Barclays plc, Republic of Indonesia Government Bond, Credit Linked Notes, | | | | | |
9.00%, 9/15/18 | | IDR | 10,000,000 | | 758 | |
JPMorgan Chase & Co., Republic of Indonesia Government Bond, Credit Linked Notes, | | | | | |
Zero Coupon, 9/20/09 | | 8,500,000 | | 715 | |
9.00%, 9/15/18 | | 3,300,000 | | 251 | |
UBS AG, Republic of Indonesia Government Bond, Credit Linked Notes, | | | | | |
9.00%, 9/15/18 | | 5,850,000 | | 443 | |
| | | | 2,167 | |
| | | | 2,167 | |
Malaysia (12.6%) | | | | | |
Sovereign (12.6%) | | | | | |
Government of Malaysia, | | | | | |
3.76%, 4/28/11 | | MYR | 597 | | 175 | |
3.83%, 9/28/11 | | 11,186 | | 3,302 | |
| | | | 3,477 | |
Mexico (12.2%) | | | | | |
Sovereign (12.2%) | | | | | |
Mexican Bonos, | | | | | |
10.00%, 12/5/24 | | MXN | 20,880 | | 1,736 | |
Mexican Bonos, M 10, | | | | | |
8.00%, 12/17/15 | | 12,344 | | 895 | |
Mexican Bonos, MI10, | | | | | |
9.50%, 12/18/14 | | | 2,555 | | 199 | |
United Mexican States, | | | | | |
5.95%, 3/19/19 | | $ | 544 | | 547 | |
| | | | 3,377 | |
Nigeria (2.6%) | | | | | |
Corporate (2.2%) | | | | | |
Shell Petroleum Development Co., Credit Linked Notes, | | | | | |
Zero Coupon, 5/15/09 | | 800 | | 620 | |
Sovereign (0.4%) | | | | | |
UBS AG, Federal Republic of Nigeria, Credit Linked Notes, | | | | | |
Zero Coupon, 3/5/09 | | NGN | 14,400 | | 102 | |
| | | | 722 | |
Peru (1.4%) | | | | | |
Sovereign (1.4%) | | | | | |
Republic of Peru, | | | | | |
12.25%, 8/10/11 | | PEN | 1,105 | | 396 | |
Poland (5.7%) | | | | | |
Sovereign (5.7%) | | | | | |
Republic of Poland, | | | | | |
4.25%, 5/24/11 | | PLN | 4,740 | | 1,562 | |
South Africa (9.9%) | | | | | |
Corporate (1.4%) | | | | | |
International Finance Corp., | | | | | |
11.00%, 7/1/09 | | ZAR | 3,660 | | 393 | |
Sovereign (8.5%) | | | | | |
Republic of South Africa, | | | | | |
13.00%, 8/31/10 | | 19,989 | | 2,352 | |
| | | | 2,745 | |
Thailand (4.9%) | | | | | |
Sovereign (4.9%) | | | | | |
Kingdom of Thailand, | | | | | |
4.25%, 3/13/13 | | THB | 39,400 | | 1,232 | |
5.25%, 7/13/13 | | 4,070 | | 133 | |
| | | | 1,365 | |
Turkey (9.8%) | | | | | |
Sovereign (9.8%) | | | | | |
Republic of Turkey, | | | | | |
Zero Coupon, 8/5/09 - 6/23/10 | | TRY | 4,317 | | 2,348 | |
16.00%, 3/7/12 | | 559 | | 356 | |
| | | | 2,704 | |
Venezuela (1.5%) | | | | | |
Sovereign (1.5%) | | | | | |
Republic of Venezuela, | | | | | |
9.25%, 5/7/28 | | $ | 940 | | | 400 | |
Total Debt Instruments (Cost $28,701) | | | | 25,671 | |
| | | | | | | | | | | |
| The accompanying notes are an integral part of the financial statements. | 89 |
2008 Annual Report |
|
December 31, 2008 |
Portfolio of Investments (cont’d)
Emerging Markets Debt Portfolio
| | No. of | | Value | |
| | Warrants | | (000) | |
Warrants (0.0%) | | | | | |
Venezuela (0.0%) | | | | | |
Republic of Venezuela, Oil-Linked Payment Obligation, expires 4/15/20 (Cost $—) | | 495 | | $ | 13 | |
| | | | | |
| | Shares | | | |
Short-Term Investment (13.3%) | | | | | |
Investment Company (13.3%) | | | | | |
Morgan Stanley Institutional Liquidity Money Market Portfolio — Institutional Class
(Cost $3,665) (o) | | 3,665,444 | | 3,665 | |
Total Investments (106.2%) (Cost $32,366) | | | | 29,349 | |
Liabilities in Excess of Other Assets (-6.2%) | | | | (1,722 | ) |
Net Assets (100%) | | | | $ | 27,627 | |
(e) 144A security — Certain conditions for public sale may exist. Unless otherwise noted, these securities are deemed to be liquid.
(h) Variable/Floating Rate Security — Interest rate changes on these instruments are based on changes in a designated base rate. The rates shown are those in effect on December 31, 2008.
(o) See Note G to the financial statements regarding investment in Morgan Stanley Institutional Liquidity Money Market Portfolio — Institutional Class.
@ Face Amount/Value is less than $500.
Foreign Currency Exchange Contract Information:
The Portfolio had the following foreign currency exchange contract(s) open at period end:
| | | | | | | | | | Net | |
Currency | | | | | | In | | | | Unrealized | |
to | | | | | | Exchange | | | | Appreciation | |
Deliver | | Value | | Settlement | | For | | Value | | (Depreciation) | |
(000) | | (000) | | Date | | (000) | | (000) | | (000) | |
BRL | 1,090 | | | $ | 467 | | | 1/5/09 | | USD | 470 | | | $ 470 | | | | $ | 3 | | |
MXN | 6,580 | | | 476 | | | 1/2/09 | | USD | 500 | | | 500 | | | | 24 | | |
USD | 348 | | | 348 | | | 1/2/09 | | BRL | 837 | | | 359 | | | | 11 | | |
USD | 456 | | | 456 | | | 1/5/09 | | BRL | 1,090 | | | 467 | | | | 11 | | |
USD | 139 | | | 139 | | | 1/12/09 | | EUR | 108 | | | 150 | | | | 11 | | |
USD | 351 | | | 351 | | | 1/5/09 | | HUF | 65,336 | | | 342 | | | | (9 | ) | |
USD | 498 | | | 498 | | | 1/2/09 | | MXN | 6,700 | | | 484 | | | | (14 | ) | |
USD | 487 | | | 487 | | | 1/2/09 | | MXN | 6,580 | | | 475 | | | | (12 | ) | |
USD | 138 | | | 138 | | | 1/12/09 | | MXN | 1,880 | | | 135 | | | | (3 | ) | |
USD | 497 | | | 497 | | | 1/23/09 | | MXN | 6,580 | | | 472 | | | | (25 | ) | |
USD | 256 | | | 256 | | | 1/5/09 | | PLN | 754 | | | 255 | | | | (1 | ) | |
USD | 250 | | | 250 | | | 1/5/09 | | TRY | 382 | | | 248 | | | | (2 | ) | |
| | | $ | 4,363 | | | | | | | | $4,357 | | | | $ | (6 | ) | |
| | | | | | | | | | | | | | | | | | | | | | |
BRL | — Brazilian Real |
COP | — Colombian Peso |
EUR | — Euro |
HUF | — Hungarian Forint |
IDR | — Indonesian Rupiah |
MXN | — Mexican Peso |
MYR | — Malaysian Ringgit |
NGN | — Nigerian Naira |
PEN | — Peruvian Sol |
PLN | — Polish Zloty |
THB | — Thailand Baht |
TRY | — Turkish Lira |
USD | — United States Dollar |
ZAR | — South African Rand |
90 | The accompanying notes are an integral part of the financial statements. | |
| 2008 Annual Report |
| |
| December 31, 2008 |
Portfolio of Investments (cont’d)
Emerging Markets Debt Portfolio
Interest Rate Swap Contracts
The Portfolio had the following interest rate swap agreement(s) open at period end:
| | | | | | | | | | | | Unrealized | |
| | | | | | | | | | Notional | | Appreciation | |
| | Floating Rate | | Pay/Receive | | Fixed | | Termination | | Amount | | (Depreciation) | |
Swap Counterparty | | Index | | Floating Rate | | Rate | | Date | | (000) | | (000) | |
JPMorgan Chase | | 3 Month JIBAR | | Pay | | 10.93 | % | 8/26/10 | | $4,800 | | | $ | 18 | | |
| | MXN-TIIE-Banxico | | Pay | | 9.41 | | 7/8/13 | | 5,500 | | | 21 | | |
| | 3 Month JIBAR | | Receive | | 9.67 | | 8/27/18 | | 1,300 | | | (18 | ) | |
| | | | | | | | | | | | | $ | 21 | | |
| | | | | | | | | | | | | | | |
JIBAR | — Johannesburg Interbank Agreed Rate |
MXN-TIIE | — Mexican Inter Bank Equilibrium Interest Rate |
| The accompanying notes are an integral part of the financial statements. | 91 |
2008 Annual Report |
|
December 31, 2008 |
Statements of Assets and Liabilities
| | Active | | | | | | | |
| | International | | Emerging | | Global | | Global Real | |
| | Allocation | | Markets | | Franchise | | Estate | |
| | Portfolio | | Portfolio | | Portfolio | | Portfolio | |
| | (000) | | (000) | | (000) | | (000) | |
Assets: | | | | | | | | | |
Investments in Securities of Unaffiliated Issuers, at Cost: | | $ | 701,822 | | $ | 1,793,293 | | $ | 91,641 | | $ | 957,620 | |
Investment in Securities of Affiliated Issuers, at Cost: | | 106,598 | | 175,589 | | 2,897 | | 48,466 | |
Total Investments in Securities, at Cost: | | 808,420 | | 1,968,882 | | 94,538 | | 1,006,086 | |
Foreign Currency, at Cost: | | 2,058 | | 3,146 | | 109 | | 1,790 | |
Investments in Securities of Unaffiliated Issuers, at Value:(1) | | 574,771 | | 1,232,394 | | 78,164 | | 513,835 | |
Investment in Securities of Affiliated Issuers, at Value: | | 102,862 | | 183,366 | | 2,897 | | 48,466 | |
Total Investments in Securities, at Value: | | 677,633 | | 1,415,760 | | 81,061 | | 562,301 | |
Foreign Currency, at Value: | | 2,051 | | 3,194 | | 111 | | 1,780 | |
Cash | | — | | — | | 31 | | — | |
Due from Broker | | 3,141 | | — | | — | | — | |
Receivable for Portfolio Shares Sold | | 237 | | 2,914 | | — | | 501 | |
Receivable for Investments Sold | | 13,883 | | 2,536 | | — | | 4,264 | |
Unrealized Appreciation on Foreign Currency Exchange Contracts | | 5,007 | | 569 | | 369 | | — | @ |
Tax Reclaim Receivable | | 53 | | 1,068 | | 90 | | 261 | |
Receivable from Affiliates | | 8 | | 54 | | 4 | | 10 | |
Capital Gain Country Tax Receivable | | 5 | | — | | — | | — | |
Dividends Receivable | | 833 | | 2,087 | | 108 | | 2,650 | |
Interest Receivable | | 37 | | — | | — | | — | |
Other Assets | | 10 | | 25 | | 1 | | 10 | |
Total Assets | | 702,898 | | 1,428,207 | | 81,775 | | 571,777 | |
Liabilities: | | | | | | | | | |
Collateral on Securities Loaned, at Value: | | 121,776 | | 151,208 | | — | | 50,999 | |
Unrealized Depreciation on Foreign Currency Exchange Contracts | | 4,836 | | 8 | | — | | 8 | |
Payable for Investments Purchased | | — | | 11,911 | | 35 | | — | |
Bank Overdraft | | 1,283 | | — | | — | | 133 | |
Payable for Portfolio Shares Redeemed | | 1,010 | | 359 | | 603 | | 547 | |
Payable for Investment Advisory Fees | | 791 | | 3,827 | | 149 | | 1,168 | |
Payable for Administration Fees | | 38 | | 82 | | 5 | | 33 | |
Payable for Custodian Fees | | 68 | | 717 | | 5 | | 58 | |
Payable for Directors’ Fees and Expenses | | 8 | | 32 | | 1 | | 1 | |
Payable for Transfer Agent Fees | | 5 | | 11 | | 4 | | 8 | |
Payable for Shareholder Servicing Fees — Class P | | 1 | | 14 | | 1 | | 8 | |
Payable for Shareholder Servicing Fees — Class H | | — | | — | | — | | — | @ |
Payable for Distribution and Shareholder Servicing Fees — Class L | | — | | — | | — | | — | @ |
Payable for Sub Transfer Agency Fees — Class I | | 23 | | 962 | | 22 | | 39 | |
Payable for Sub Transfer Agency Fees — Class P | | 1 | | 71 | | 2 | | 2 | |
Payable for Transfer Agency Fees — Class H | | — | | — | | — | | — | @ |
Payable for Transfer Agency Fees — Class L | | — | | — | | — | | — | @ |
Other Liabilities | | 131 | | 247 | | 27 | | 107 | |
Total Liabilities | | 129,971 | | 169,449 | | 854 | | 53,111 | |
Net Assets | | $ | 572,927 | | $ | 1,258,758 | | $ | 80,921 | | $ | 518,666 | |
Net Assets Consist Of: | | | | | | | | | |
Paid-in Capital | | $ | 733,790 | | $ | 2,069,937 | | $ | 94,167 | | $ | 1,078,666 | |
Undistributed (Distributions in Excess of) Net Investment Income | | 903 | | (8,440 | ) | 689 | | (132 | ) |
Accumulated Net Realized Loss | | (31,305 | ) | (250,086 | ) | (837 | ) | (116,001 | ) |
Unrealized Appreciation (Depreciation) on: | | | | | | | | | |
Investments | | (130,787 | ) | (553,122 | ) | (13,477 | ) | (443,785 | ) |
Foreign Currency Exchange Contracts and Translations | | 98 | | 469 | | 379 | | (82 | ) |
Futures Contracts | | 228 | | — | | — | | — | |
Net Assets | | $ | 572,927 | | $ | 1,258,758 | | $ | 80,921 | | $ | 518,666 | |
92 | The accompanying notes are an integral part of the financial statements. | |
| 2008 Annual Report |
| |
| December 31, 2008 |
Statements of Assets and Liabilities
| | Active | | | | | | | |
| | International | | Emerging | | Global | | Global Real | |
| | Allocation | | Markets | | Franchise | | Estate | |
| | Portfolio | | Portfolio | | Portfolio | | Portfolio | |
| | (000) | | (000) | | (000) | | (000) | |
CLASS I: | | | | | | | | | |
Net Assets | | $ | 565,313 | | $ | 1,191,199 | | $ | 78,029 | | $ | 473,459 | |
Shares Outstanding $0.001 par value shares of beneficial interest(500,000,000 shares authorized) (not in 000’s) | | 62,085,367 | | 86,372,818 | | 7,211,644 | | 86,199,530 | |
Net Asset Value, Offering and Redemption Price Per Share | | $ | 9.11 | | $ | 13.79 | | $ | 10.82 | | $ | 5.49 | |
CLASS P: | | | | | | | | | |
Net Assets | | $ | 7,614 | | $ | 67,559 | | $ | 2,892 | | $ | 44,555 | |
Shares Outstanding $0.001 par value shares of beneficial interest (500,000,000 shares authorized) (not in 000’s) | | 821,677 | | 5,000,693 | | 270,080 | | 8,137,881 | |
Net Asset Value, Offering and Redemption Price Per Share | | $ | 9.27 | | $ | 13.51 | | $ | 10.71 | | $ | 5.47 | |
CLASS H: | | | | | | | | | |
Net Assets | | $ | — | | $ | — | | $ | — | | $ | 391 | |
Shares Outstanding $0.001 par value shares of beneficial interest (500,000,000 shares authorized) (not in 000’s) | | — | | — | | — | | 71,541 | |
Net Asset Value and Redemption Price Per Share | | $ | — | | $ | — | | $ | — | | $ | 5.47 | |
Maximum Sales Load | | — | | — | | — | | 4.75 | % |
Maximum Sales Charge | | $ | — | | $ | — | | $ | — | | $ | 0.27 | |
Maximum Offering Price Per Share | | $ | — | | $ | — | | $ | — | | $ | 5.74 | |
CLASS L: | | | | | | | | | |
Net Assets | | $ | — | | $ | — | | $ | — | | $ | 261 | |
Shares Outstanding $0.001 par value shares of beneficial interest (500,000,000 shares authorized) (not in 000’s) | | — | | — | | — | | 48,126 | |
Net Asset Value, Offering and Redemption Price Per Share | | $ | — | | $ | — | | $ | — | | $ | 5.43 | |
| | | | | | | | | | | | | |
(1) | Including: | | | | | | | | | |
| Securities on Loan, at Value: | | $ | 115,931 | | $ | 142,125 | | $ | — | | $ | 48,070 | |
@ Amount is less than $500. | | | | | | | | | |
| The accompanying notes are an integral part of the financial statements. | 93 |
2008 Annual Report |
|
December 31, 2008 |
Statements of Assets and Liabilities
| | | | | | International | | | |
| | Global Value | | International | | Growth Active | | International | |
| | Equity | | Equity | | Extension | | Growth Equity | |
| | Portfolio | | Portfolio | | Portfolio | | Portfolio | |
| | (000) | | (000) | | (000) | | (000) | |
Assets: | | | | | | | | | |
Investments in Securities of Unaffiliated Issuers, at Cost: | | $ | 33,504 | | $ | 3,880,185 | | $ | 11,022 | | | $ | 73,157 | | |
Investment in Securities of Affiliated Issuers, at Cost: | | 3,499 | | 376,123 | | 12 | | | 7,810 | | |
Total Investments in Securities, at Cost: | | 37,003 | | 4,256,308 | | 11,034 | | | 80,967 | | |
Foreign Currency, at Cost: | | 19 | | 7,627 | | 6 | | | 8 | | |
Investments in Securities of Unaffiliated Issuers, at Value: (1) | | 35,757 | | 3,147,214 | | 6,553 | | | 42,450 | | |
Investment in Securities of Affiliated Issuers, at Value: | | 3,499 | | 376,123 | | 12 | | | 7,810 | | |
Total Investments in Securities, at Value: | | 39,256 | | 3,523,337 | | 6,565 | | | 50,260 | | |
Foreign Currency, at Value: | | 19 | | 7,573 | | 6 | | | 8 | | |
Cash | | 15 | | — | | — | | | — | | |
Due from Adviser | | — | | — | | 17 | | | — | | |
Due from Broker | | — | | — | | 166 | | | — | | |
Receivable for Portfolio Shares Sold | | 5 | | 18,954 | | — | | | 16 | | |
Receivable for Investments Sold | | — | | — | | 9 | | | 57 | | |
Unrealized Appreciation on Contracts for Difference Agreements | | — | | — | | 81 | | | — | | |
Unrealized Appreciation on Foreign Currency Exchange Contracts | | 131 | | 31,598 | | — | | | — | | |
Tax Reclaim Receivable | | 2 | | 598 | | 1 | | | 5 | | |
Receivable from Affiliates | | 3 | | 156 | | — | @ | | 1 | | |
Dividends Receivable | | 60 | | 1,691 | | 4 | | | 23 | | |
Interest Receivable | | — | | 8 | | — | | | — | | |
Other Assets | | 1 | | 63 | | — | @ | | 1 | | |
Total Assets | | 39,492 | | 3,583,978 | | 6,849 | | | 50,371 | | |
Liabilities: | | | | | | | | | | | |
Collateral on Securities Loaned, at Value: | | 3,356 | | 274,728 | | — | | | 8,841 | | |
Unrealized Depreciation on Foreign Currency Exchange Contracts | | — | | — | | — | @ | | — | | |
Payable for Investments Purchased | | 18 | | — | | 10 | | | — | | |
Bank Overdraft | | — | | — | | 46 | | | 1 | | |
Unrealized Depreciation on Contracts for Difference Agreements | | — | | — | | 9 | | | — | | |
Payable for Portfolio Shares Redeemed | | — | | 6,066 | | 1 | | | 452 | | |
Payable for Investment Advisory Fees | | 49 | | 6,477 | | — | | | 49 | | |
Payable for Administration Fees | | 3 | | 212 | | — | @ | | 3 | | |
Payable for Custodian Fees | | 4 | | 243 | | 7 | | | 10 | | |
Payable for Directors’ Fees and Expenses | | 4 | | 90 | | — | | | 1 | | |
Payable for Transfer Agent Fees | | 4 | | 21 | | 4 | | | 4 | | |
Payable for Shareholder Servicing Fees — Class P | | 2 | | 134 | | — | @ | | — | @ | |
Payable for Shareholder Servicing Fees — Class H | | — | | — | | — | @ | | — | | |
Payable for Distribution and Shareholder Servicing Fees — Class L | | — | | — | | — | @ | | — | | |
Payable for Sub Transfer Agency Fees — Class I | | 21 | | 1,083 | | — | | | — | @ | |
Payable for Sub Transfer Agency Fees — Class P | | 8 | | 388 | | — | | | — | @ | |
Payable for Transfer Agency Fees — Class H | | — | | — | | — | @ | | — | | |
Payable for Transfer Agency Fees — Class L | | — | | — | | — | @ | | — | | |
Payable for Dividend Income on Short Positions | | — | | — | | 1 | | | — | | |
Payable for Securities Sold Short, at Value (Proceeds $2,338) | | — | | — | | 1,729 | | | — | | |
Other Liabilities | | 25 | | 636 | | 13 | | | 17 | | |
Total Liabilities | | 3,494 | | 290,078 | | 1,820 | | | 9,378 | | |
Net Assets | | $ | 35,998 | | $ | 3,293,900 | | $ | 5,029 | | | $ | 40,993 | | |
Net Assets Consist Of: | | | | | | | | | | | |
Paid-in Capital | | $ | 48,209 | | $ | 4,162,080 | | $ | 10,662 | | | $ | 81,674 | | |
Undistributed (Distributions in Excess of) Net Investment Income | | 150 | | 4,431 | | — | @ | | (13 | ) | |
Accumulated Net Realized Loss | | (14,745 | ) | (171,171 | ) | (1,849 | ) | | (9,961 | ) | |
Unrealized Appreciation (Depreciation) on: | | | | | | | | | | | |
Investments | | 2,253 | | (732,971 | ) | (4,469 | ) | | (30,707 | ) | |
Contracts for Difference | | — | | — | | 72 | | | — | | |
Foreign Currency Exchange Contracts and Translations | | 131 | | 31,531 | | — | @ | | — | @ | |
Futures Contracts | | — | | — | | 4 | | | — | | |
Securities Sold Short | | — | | — | | 609 | | | — | | |
Net Assets | | $ | 35,998 | | $ | 3,293,900 | | $ | 5,029 | | | $ | 40,993 | | |
94 | The accompanying notes are an integral part of the financial statements. | |
| 2008 Annual Report |
| |
| December 31, 2008 |
| |
Statements of Assets and Liabilities | |
| | | | | | International | | | |
| | Global Value | | International | | Growth Active | | International | |
| | Equity | | Equity | | Extension | | Growth Equity | |
| | Portfolio | | Portfolio | | Portfolio | | Portfolio | |
| | (000) | | (000) | | (000) | | (000) | |
CLASS I: | | | | | | | | | | | |
Net Assets | | $ | 24,110 | | $ | 2,606,704 | | $ | 4,697 | | | $ | 40,756 | | |
Shares Outstanding $0.001 par value shares of beneficial interest (500,000,000 shares authorized) (not in 000’s) | | 2,541,790 | | 236,687,734 | | 990,000 | | | 6,063,329 | | |
Net Asset Value, Offering and Redemption Price Per Share | | $ | 9.49 | | $ | 11.01 | | $ | 4.74 | | | $ | 6.72 | | |
CLASS P: | | | | | | | | | | | |
Net Assets | | $ | 11,888 | | $ | 687,196 | | $ | 47 | | | $ | 237 | | |
Shares Outstanding $0.001 par value shares of beneficial interest (500,000,000 shares authorized) (not in 000’s) | | 1,268,600 | | 63,059,748 | | 10,000 | | | 35,150 | | |
Net Asset Value, Offering and Redemption Price Per Share | | $ | 9.37 | | $ | 10.90 | | $ | 4.73 | | | $ | 6.74 | | |
CLASS H: | | | | | | | | | | | |
Net Assets | | $ | — | | $ | — | | $ | 266 | | | $ | — | | |
Shares Outstanding $0.001 par value shares of beneficial interest (500,000,000 shares authorized) (not in 000’s) | | — | | — | | 56,222 | | | — | | |
Net Asset Value and Redemption Price Per Share | | $ | — | | $ | — | | $ | 4.73 | | | $ | — | | |
Maximum Sales Load | | — | | — | | 4.75 | % | | — | | |
Maximum Sales Charge | | $ | — | | $ | — | | $ | 0.24 | | | $ | — | | |
Maximum Offering Price Per Share | | $ | — | | $ | — | | $ | 4.97 | | | $ | — | | |
CLASS L: | | | | | | | | | | | |
Net Assets | | $ | — | | $ | — | | $ | 19 | | | $ | — | | |
Shares Outstanding $0.001 par value shares of beneficial interest (500,000,000 shares authorized) (not in 000’s) | | — | | — | | 3,950 | | | — | | |
Net Asset Value, Offering and Redemption Price Per Share | | $ | — | | $ | — | | $ | 4.70 | | | $ | — | | |
(1) Including: | | | | | | | | | | | |
Securities on Loan, at Value: | | $ | 3,217 | | $ | 261,509 | | $ | — | | | $ | 8,480 | | |
@ Amount is less than $500. | | | | | | | | | | | |
| | | | | | | | | | | | | | | | |
| The accompanying notes are an integral part of the financial statements. | 95 |
2008 Annual Report |
|
December 31, 2008 |
Statements of Assets and Liabilities
| | International | | International | | | | | |
| | Real Estate | | Small Cap | | Capital Growth | | Focus Growth | |
| | Portfolio | | Portfolio | | Portfolio | | Portfolio | |
| | (000) | | (000) | | (000) | | (000) | |
Assets: | | | | | | | | | | | |
Investments in Securities of Unaffiliated Issuers, at Cost: | | $ | 1,025,918 | | $ | 419,460 | | $ | 890,175 | | | $ | 9,775 | | |
Investment in Securities of Affiliated Issuers, at Cost: | | 44,418 | | 12,029 | | 11,972 | | | 51 | | |
Total Investments in Securities, at Cost: | | 1,070,336 | | 431,489 | | 902,147 | | | 9,826 | | |
Foreign Currency, at Cost: | | 175 | | 25 | | 2 | | | — | | |
Investments in Securities of Unaffiliated Issuers, at Value:(1) | | 439,180 | | 305,591 | | 593,371 | | | 5,973 | | |
Investment in Securities of Affiliated Issuers, at Value: | | 44,418 | | 12,029 | | 11,972 | | | 51 | | |
Total Investments in Securities, at Value: | | 483,598 | | 317,620 | | 605,343 | | | 6,024 | | |
Foreign Currency, at Value: | | 175 | | 26 | | 2 | | | — | | |
Cash | | — | | — | | 4 | | | — | | |
Receivable for Portfolio Shares Sold | | 937 | | 211 | | 1,707 | | | 1 | | |
Receivable for Investments Sold | | 1,106 | | 881 | | — | | | — | | |
Unrealized Appreciation on Foreign Currency Exchange Contracts | | 5 | | 1 | | — | | | — | | |
Tax Reclaim Receivable | | 894 | | 991 | | — | | | — | | |
Receivable from Affiliates | | 9 | | 8 | | 33 | | | — | @ | |
Dividends Receivable | | 723 | | 658 | | 139 | | | 1 | | |
Other Assets | | 8 | | 6 | | 14 | | | — | @ | |
Total Assets | | 487,455 | | 320,402 | | 607,242 | | | 6,026 | | |
Liabilities: | | | | | | | | | | | |
Collateral on Securities Loaned, at Value: | | 48,749 | | — | | — | | | — | | |
Unrealized Depreciation on Foreign Currency Exchange Contracts | | — | | 8 | | — | | | — | | |
Payable for Investments Purchased | | 96 | | 357 | | — | | | — | | |
Payable for Portfolio Shares Redeemed | | 1,018 | | 2,426 | | 2,284 | | | 40 | | |
Payable for Investment Advisory Fees | | 981 | | 749 | | 852 | | | 8 | | |
Payable for Administration Fees | | 29 | | 21 | | 41 | | | 1 | | |
Payable for Custodian Fees | | 63 | | 48 | | 31 | | | 2 | | |
Payable for Directors’ Fees and Expenses | | — | | 8 | | 21 | | | 4 | | |
Payable for Transfer Agent Fees | | 14 | | 4 | | 8 | | | 4 | | |
Payable for Shareholder Servicing Fees — Class P | | 2 | | — | @ | 13 | | | — | @ | |
Payable for Sub Transfer Agency Fees — Class I | | 59 | | 33 | | 36 | | | 4 | | |
Payable for Sub Transfer Agency Fees — Class P | | 18 | | — | | 27 | | | 1 | | |
Other Liabilities | | 137 | | 103 | | 205 | | | 14 | | |
Total Liabilities | | 51,166 | | 3,757 | | 3,518 | | | 78 | | |
Net Assets | | $ | 436,289 | | $ | 316,645 | | $ | 603,724 | | | $ | 5,948 | | |
Net Assets Consist Of: | | | | | | | | | | | |
Paid-in Capital | | $ | 1,188,083 | | $ | 524,678 | | $ | 1,011,773 | | | $ | 26,605 | | |
Undistributed (Distributions in Excess of) Net Investment Income | | (2,134 | ) | 713 | | (39 | ) | | (5 | ) | |
Accumulated Net Realized Loss | | (162,652 | ) | (94,978 | ) | (111,206 | ) | | (16,850 | ) | |
Unrealized Appreciation (Depreciation) on: | | | | | | | | | | | |
Investments | | (586,739 | ) | (113,869 | ) | (296,804 | ) | | (3,802 | ) | |
Foreign Currency Exchange Contracts and Translations | | (269 | ) | 101 | | — | @ | | — | | |
Net Assets | | $ | 436,289 | | $ | 316,645 | | $ | 603,724 | | | $ | 5,948 | | |
CLASS I: | | | | | | | | | | | |
Net Assets | | $ | 427,148 | | $ | 316,526 | | $ | 543,841 | | | $ | 4,879 | | |
Shares Outstanding $0.001 par value shares of beneficial interest (500,000,000 shares authorized) (not in 000’s) | | 33,920,543 | | 33,206,836 | | 44,879,158 | | | 544,938 | | |
Net Asset Value, Offering and Redemption Price Per Share | | $ | 12.59 | | $ | 9.53 | | $ | 12.12 | | | $ | 8.95 | | |
CLASS P: | | | | | | | | | | | |
Net Assets | | $ | 9,141 | | $ | 119 | | $ | 59,883 | | | $ | 1,069 | | |
Shares Outstanding $0.001 par value shares of beneficial interest (500,000,000 shares authorized) (not in 000’s) | | 726,812 | | 12,531 | | 5,014,582 | | | 122,403 | | |
Net Asset Value, Offering and Redemption Price Per Share | | $ | 12.58 | | $ | 9.53 | | $ | 11.94 | | | $ | 8.73 | | |
(1) Including: | | | | | | | | | | | |
Securities on Loan, at Value: | | $ | 46,081 | | $ | — | | $ | — | | | $ | — | | |
@ Amount is less than $500. | | | | | | | | | | | |
| | | | | | | | | | | | | | | | | | |
96 | The accompanying notes are an integral part of the financial statements. | |
| 2008 Annual Report |
| |
| December 31, 2008 |
Statements of Assets and Liabilities | |
| | Large Cap | | Small Company | | | | U.S. Small/Mid | |
| | Relative Value | | Growth | | U.S. Real Estate | | Cap Value | |
| | Portfolio | | Portfolio | | Portfolio | | Portfolio | |
| | (000) | | (000) | | (000) | | (000) | |
Assets: | | | | | | | | | |
Investments in Securities of Unaffiliated Issuers, at Cost: | | $ | 223,119 | | $ | 1,446,536 | | $ | 836,310 | | $ | 21,452 | |
Investment in Securities of Affiliated Issuers, at Cost: | | 10,552 | | 17,235 | | 110,843 | | 861 | |
Total Investments in Securities, at Cost: | | 233,671 | | 1,463,771 | | 947,153 | | 22,313 | |
Foreign Currency, at Cost: | | — | | 2 | | — | @ | — | |
Investments in Securities of Unaffiliated Issuers, at Value:(1) | | 175,013 | | 976,816 | | 559,698 | | 15,642 | |
Investment in Securities of Affiliated Issuers, at Value: | | 10,371 | | 17,235 | | 110,843 | | 861 | |
Total Investments in Securities, at Value: | | 185,384 | | 994,051 | | 670,541 | | 16,503 | |
Foreign Currency, at Value: | | — | | 1 | | — | | — | |
Cash | | — | | — | | 286 | | — | |
Receivable for Portfolio Shares Sold | | 169 | | 2,112 | | 1,521 | | — | @ |
Receivable for Investments Sold | | 223 | | — | | 2,332 | | 60 | |
Receivable from Affiliates | | 13 | | 17 | | 2 | | 1 | |
Dividends Receivable | | 299 | | 136 | | 5,818 | | 11 | |
Interest Receivable | | — | | — | | — | | 2 | |
Other Assets | | 4 | | 19 | | 12 | | 21 | |
Total Assets | | 186,092 | | 996,336 | | 680,512 | | 16,598 | |
Liabilities: | | | | | | | | | |
Collateral on Securities Loaned, at Value: | | — | | — | | 131,746 | | — | |
Payable for Investments Purchased | | 546 | | 739 | | — | | 2 | |
Payable for Portfolio Shares Redeemed | | 235 | | 8,914 | | 2,450 | | — | @ |
Payable for Investment Advisory Fees | | 229 | | 2,274 | | 1,158 | | 27 | |
Payable for Administration Fees | | 12 | | 64 | | 35 | | 1 | |
Payable for Custodian Fees | | 7 | | 12 | | 8 | | 2 | |
Payable for Directors’ Fees and Expenses | | 10 | | 6 | | 10 | | — | |
Payable for Transfer Agent Fees | | 7 | | 23 | | 20 | | 3 | |
Payable for Shareholder Servicing Fees — Class P | | 7 | | 70 | | 19 | | — | |
Payable for Sub Transfer Agency Fees — Class I | | 82 | | 23 | | 69 | | — | |
Payable for Sub Transfer Agency Fees — Class P | | 21 | | 84 | | 6 | | — | |
Other Liabilities | | 55 | | 266 | | 266 | | 13 | |
Total Liabilities | | 1,211 | | 12,475 | | 135,787 | | 48 | |
Net Assets | | $ | 184,881 | | $ | 983,861 | | $ | 544,725 | | $ | 16,550 | |
Net Assets Consist Of: | | | | | | | | | |
Paid-in Capital | | $ | 296,170 | | $ | 1,476,727 | | $ | 905,894 | | $ | 27,000 | |
Undistributed (Distributions in Excess of) Net Investment Income | | 22 | | (24 | ) | 258 | | 1 | |
Accumulated Net Realized Loss | | (63,024 | ) | (23,122 | ) | (84,815 | ) | (4,641 | ) |
Unrealized Appreciation (Depreciation) on:
Investments | | (48,287 | ) | (469,720 | ) | (276,612 | ) | (5,810 | ) |
Foreign Currency Exchange Contracts and Translations | | — | | — | @ | — | @ | — | |
Net Assets | | $ | 184,881 | | $ | 983,861 | | $ | 544,725 | | $ | 16,550 | |
CLASS I: | | | | | | | | | |
Net Assets | | $ | 150,025 | | $ | 638,559 | | $ | 448,897 | | $ | 16,492 | |
Shares Outstanding $0.001 par value shares of beneficial interest (500,000,000 shares authorized) (not in 000’s) | | 19,110,237 | | 83,633,371 | | 50,590,945 | | 2,813,394 | |
Net Asset Value, Offering and Redemption Price Per Share | | $ | 7.85 | | $ | 7.64 | | $ | 8.87 | | $ | 5.86 | |
CLASS P: | | | | | | | | | |
Net Assets | | $ | 34,856 | | $ | 345,302 | | $ | 95,828 | | $ | 58 | |
Shares Outstanding $0.001 par value shares of beneficial interest (500,000,000 shares authorized) (not in 000’s) | | 4,443,185 | | 48,028,593 | | 10,976,391 | | 10,000 | |
Net Asset Value, Offering and Redemption Price Per Share | | $ | 7.84 | | $ | 7.19 | | $ | 8.73 | | $ | 5.84 | |
(1) Including: | | | | | | | | | |
Securities on Loan, at Value: | | $ | — | | $ | — | | $ | 128,396 | | $ | — | |
@ Amount is less than $500. | | | | | | | | | |
| | | | | | | | | | | | | | | | | |
| The accompanying notes are an integral part of the financial statements. | 97 |
2008 Annual Report | |
| |
December 31, 2008 | |
Statements of Assets and Liabilities
| | Emerging | |
| | Markets Debt | |
| | Portfolio | |
| | (000) | |
Assets: | | | |
Investments in Securities of Unaffiliated Issuers, at Cost: | | $ | 28,701 | |
Investment in Securities of Affiliated Issuers, at Cost: | | 3,665 | |
Total Investments in Securities, at Cost: | | 32,366 | |
Foreign Currency, at Cost: | | 50 | |
Investments in Securities of Unaffiliated Issuers, at Value:(1) | | 25,684 | |
Investment in Securities of Affiliated Issuers, at Value: | | 3,665 | |
Total Investments in Securities, at Value: | | 29,349 | |
Foreign Currency, at Value: | | 47 | |
Due from Adviser | | 49 | |
Receivable for Portfolio Shares Sold | | 58 | |
Unrealized Appreciation on Swap Agreements | | 39 | |
Unrealized Appreciation on Foreign Currency Exchange Contracts | | 60 | |
Receivable from Affiliates | | — | @ |
Dividends Receivable | | 2 | |
Interest Receivable | | 633 | |
Other Assets | | — | @ |
Total Assets | | 30,237 | |
Liabilities: | | | |
Unrealized Depreciation on Foreign Currency Exchange Contracts | | 66 | |
Payable for Investments Purchased | | 2,449 | |
Bank Overdraft | | — | @ |
Unrealized Depreciation on Swap Agreements | | 18 | |
Payable for Administration Fees | | 2 | |
Payable for Custodian Fees | | 35 | |
Payable for Directors’ Fees and Expenses | | 4 | |
Payable for Transfer Agent Fees | | 5 | |
Payable for Shareholder Servicing Fees — Class P | | 1 | |
Payable for Shareholder Servicing Fees — Class H | | — | @ |
Payable for Distribution and Shareholder Servicing Fees — Class L | | — | @ |
Payable for Sub Transfer Agency Fees — Class I | | — | @ |
Payable for Sub Transfer Agency Fees — Class P | | — | @ |
Payable for Transfer Agency Fees — Class H | | — | @ |
Payable for Transfer Agency Fees — Class L | | — | @ |
Other Liabilities | | 30 | |
Total Liabilities | | 2,610 | |
Net Assets | | $ | 27,627 | |
Net Assets Consist Of: | | | |
Paid-in Capital | | $ | 32,377 | |
Undistributed Net Investment Income | | 4 | |
Accumulated Net Realized Loss | | (1,702 | ) |
Unrealized Appreciation (Depreciation) on:
Investments | | (3,017 | ) |
Foreign Currency Exchange Contracts and Translations | | (56 | ) |
Swap Agreements | | 21 | |
Net Assets | | $ | 27,627 | |
| | | | | |
98 | The accompanying notes are an integral part of the financial statements. | |
| 2008 Annual Report |
| |
| December 31, 2008 |
Statements of Assets and Liabilities
| | Emerging | |
| | Markets Debt | |
| | Portfolio | |
| | (000) | |
CLASS I: | | | |
Net Assets | | $ | 21,887 | |
Shares Outstanding $0.001 par value shares of beneficial interest (500,000,000 shares authorized) (not in 000’s)† | | 2,202,505 | |
Net Asset Value, Offering and Redemption Price Per Share | | $ | 9.94 | |
CLASS P: | | | |
Net Assets | | $ | 3,640 | |
Shares Outstanding $0.001 par value shares of beneficial interest (500,000,000 shares authorized) (not in 000’s)† | | 357,603 | |
Net Asset Value, Offering and Redemption Price Per Share | | $ | 10.18 | |
CLASS H: | | | |
Net Assets | | $ | 1,758 | |
Shares Outstanding $0.001 par value shares of beneficial interest (500,000,000 shares authorized) (not in 000’s)† | | 172,791 | |
Net Asset Value and Redemption Price Per Share | | $ | 10.18 | |
Maximum Sales Load | | 3.50 | % |
Maximum Sales Charge | | $ | 0.37 | |
Maximum Offering Price Per Share | | $ | 10.55 | |
CLASS L: | | | |
Net Assets | | $ | 342 | |
Shares Outstanding $0.001 par value shares of beneficial interest (500,000,000 shares authorized) (not in 000’s)† | | 33,885 | |
Net Asset Value, Offering and Redemption Price Per Share | | $ | 10.09 | |
@ | Amount is less than $500. |
† | $ 0.003 par value shares of beneficial interest for Emerging Markets Debt Portfolio. |
| | | | | | |
| The accompanying notes are an integral part of the financial statements. | 99 |
2008 Annual Report |
|
December 31, 2008 |
Statements of Operations
For the Year Ended December 31, 2008
| | Active | | | | | | | | Global | |
| | International | | Emerging | | Global | | Global Real | | Value | |
| | Allocation | | Markets | | Franchise | | Estate | | Equity | |
| | Portfolio | | Portfolio | | Portfolio | | Portfolio | | Portfolio | |
| | (000) | | (000) | | (000) | | (000) | | (000) | |
Investment Income: | | | | | | | | | | | |
Dividends from Securities of Unaffiliated Issuers | | $ | 27,188 | | $ | 55,427 | | $ | 3,803 | | $ | 21,967 | | $ | 2,142 | |
Dividends from Securities of Affiliated Issuers | | 3,097 | | 2,320 | | 89 | | 762 | | 56 | |
Interest from Securities of Unaffiliated Issuers | | 1,999 | | 1,289 | | 3 | | 146 | | 41 | |
Less: Foreign Taxes Withheld | | (2,357 | ) | (4,938 | ) | (265 | ) | (876 | ) | (109 | ) |
Total Investment Income | | 29,927 | | 54,098 | | 3,630 | | 21,999 | | 2,130 | |
Expenses: | | | | | | | | | | | |
Investment Advisory Fees (Note B) | | 5,556 | | 28,482 | | 832 | | 6,238 | | 372 | |
Administration Fees (Note C) | | 685 | | 1,962 | | 83 | | 588 | | 44 | |
Custodian Fees (Note F) | | 328 | | 3,073 | | 26 | | 253 | | 23 | |
Directors’ Fees and Expenses | | 11 | | 27 | | 3 | | 13 | | — | |
Professional Fees | | 49 | | 119 | | 30 | | 176 | | 31 | |
Shareholder Reporting Fees | | 273 | | 382 | | 18 | | 198 | | 24 | |
Shareholder Servicing Fees — Class P (Note D) | | 12 | | 313 | | 11 | | 51 | | 43 | |
Shareholder Servicing Fees — Class H (Note D) | | — | | — | | — | | 1 | | — | |
Distribution and Shareholder Servicing Fees — Class L (Note D) | | — | | — | | — | | 1 | | — | |
Sub Transfer Agency Fees — Class I | | 23 | | 827 | | 16 | | — | | 16 | |
Sub Transfer Agency Fees — Class P | | — | @ | 44 | | 1 | | — | | 7 | |
Transfer Agency Fees (Note E) | | 14 | | 30 | | 8 | | 15 | | 9 | |
Registration Fees | | 73 | | 68 | | 26 | | 152 | | 28 | |
Country Tax Expense# | | — | @ | 2 | | — | | — | | — | |
Other Expenses | | 39 | | 74 | | 12 | | 29 | | 12 | |
Expenses Before Non Operating Expenses | | 7,063 | | 35,403 | | 1,066 | | 7,715 | | 609 | |
Bank Overdraft Expense | | 3 | | 53 | | — | @ | 5 | | 2 | |
Investment Related Expenses | | — | | — | | — | | 79 | | — | |
Transfer Agency Fees — Class H (Note E) | | — | | — | | — | | 2 | | — | |
Transfer Agency Fees — Class L (Note E) | | — | | — | | — | | — | @ | — | |
Total Expenses | | 7,066 | | 35,456 | | 1,066 | | 7,801 | | 611 | |
Voluntary Waiver of Investment Advisory Fees (Note B) | | (202 | ) | — | | (15 | ) | (4 | ) | (13 | ) |
Rebate from Morgan Stanley Affiliated Cash Sweep (Note G) | | (83 | ) | (54 | ) | (5 | ) | (27 | ) | (1 | ) |
Expense Offset (Note F) | | (4 | ) | (11 | ) | — | @ | (5 | ) | — | @ |
Net Expenses | | 6,777 | | 35,391 | | 1,046 | | 7,765 | | 597 | |
Net Investment Income | | 23,150 | | 18,707 | | 2,584 | | 14,234 | | 1,533 | |
Realized Gain (Loss): | | | | | | | | | | | |
Investments Sold | | 10,065 | * | (214,184 | )* | (751 | ) | (109,327 | ) | (13,757 | ) |
Foreign Currency Transactions | | (10,907 | ) | (5,351 | ) | 3,607 | | (884 | ) | 962 | |
Futures Contracts | | (35,040 | ) | — | | — | | — | | — | |
Net Realized Gain (Loss) | | (35,882 | ) | (219,535 | ) | 2,856 | | (110,211 | ) | (12,795 | ) |
Change in Unrealized Appreciation (Depreciation): | | | | | | | | | | | |
Investments | | (384,461 | )** | (1,629,891 | ) | (40,540 | ) | (373,101 | ) | (17,955 | ) |
Foreign Currency Exchange Contracts and Translations | | 737 | | 359 | | (19 | ) | (96 | ) | 30 | |
Futures Contracts | | (1,928 | ) | — | | — | | — | | — | |
Net Change in Unrealized Appreciation (Depreciation) | | (385,652 | ) | (1,629,532 | ) | (40,559 | ) | (373,197 | ) | (17,925 | ) |
Total Net Realized Loss and Change in | | | | | | | | | | | |
Unrealized Appreciation (Depreciation) | | (421,534 | ) | (1,849,067 | ) | (37,703 | ) | (483,408 | ) | (30,720 | ) |
Net Decrease in Net Assets Resulting from Operations | | $ | (398,384 | ) | $ | (1,830,360 | ) | $ | (35,119 | ) | $ | (469,174 | ) | $ | (29,187 | ) |
@ | | Amount is less than $500. |
# | | CPMF (Provisional Contribution on Financial Transactions) is a Brazilian federal tax imposed on certain banking transactions and account withdrawals. The tax is charged based on the value of the transaction. |
* | | Net of Capital Gain Country Tax of $224 and $275 for Active International Allocation and Emerging Markets, respectively. |
** | | Net of decrease in Deferred Capital Gain Country Tax Accrual on unrealized appreciation of $440 for Active International Allocation. |
| | | | | | | | | | | | | | | | | | | | | | | | |
100 | The accompanying notes are an integral part of the financial statements. | |
| 2008 Annual Report |
| |
| December 31, 2008 |
Statements of Operations
For the Year Ended December 31, 2008
| | | | International | | | | | | | |
| | | | Growth | | International | | | | | |
| | International | | Active | | Growth | | International | | International | |
| | Equity | | Extension | | Equity | | Real Estate | | Small Cap | |
| | Portfolio | | Portfolio | | Portfolio | | Portfolio | | Portfolio | |
| | (000) | | (000) | | (000) | | (000) | | (000) | |
Investment Income: | | | | | | | | | | | |
Dividends from Securities of Unaffiliated Issuers | | $ | 174,790 | | $ | 422 | | $ | 2,485 | | $ | 35,024 | | $ | 20,709 | |
Dividends from Securities of Affiliated Issuers | | 8,215 | | 4 | | 129 | | 938 | | 267 | |
Interest from Securities of Unaffiliated Issuers | | 4,060 | | — | | 61 | | 293 | | 32 | |
Less: Foreign Taxes Withheld | | (13,791 | ) | (36 | ) | (178 | ) | (2,296 | ) | (1,537 | ) |
Total Investment Income | | 173,274 | | 390 | | 2,497 | | 33,959 | | 19,471 | |
Expenses: | | | | | | | | | | | |
Investment Advisory Fees (Note B) | | 37,736 | | 99 | | 486 | | 7,446 | | 5,131 | |
Administration Fees (Note C) | | 3,777 | | 7 | | 52 | | 746 | | 433 | |
Custodian Fees (Note F) | | 1,047 | | 28 | | 57 | | 323 | | 199 | |
Directors’ Fees and Expenses | | 26 | | — | | 2 | | 20 | | 7 | |
Professional Fees | | 109 | | 36 | | 64 | | 41 | | 71 | |
Shareholder Reporting Fees | | 946 | | 32 | | 9 | | 165 | | 152 | |
Shareholder Servicing Fees — Class P (Note D) | | 2,185 | | — | @ | 1 | | 145 | | — | @ |
Shareholder Servicing Fees — Class H (Note D) | | — | | 1 | | — | | — | | — | |
Distribution and Shareholder Servicing Fees — Class L (Note D) | | — | | — | @ | — | | — | | — | |
Sub Transfer Agency Fees — Class I | | 879 | | — | | — | @ | 147 | | 82 | |
Sub Transfer Agency Fees — Class P | | 200 | | — | | — | @ | 10 | | — | @ |
Transfer Agency Fees (Note E) | | 57 | | 7 | | 9 | | 29 | | 11 | |
Registration Fees | | 67 | | 48 | | 26 | | 50 | | 42 | |
Other Expenses | | 116 | | 12 | | 11 | | 48 | | 24 | |
Expenses Before Non Operating Expenses | | 47,145 | | 270 | | 717 | | 9,170 | | 6,152 | |
Bank Overdraft Expense | | 1 | | 1 | | 1 | | 55 | | 57 | |
Dividend Expense on Short Positions | | — | | 120 | | — | | — | | — | |
Stock Loan Fee | | — | | 21 | | — | | — | | — | |
Transfer Agency Fees — Class H (Note E) | | — | | 2 | | — | | — | | — | |
Transfer Agency Fees — Class L (Note E) | | — | | — | @ | — | | — | | — | |
Total Expenses | | 47,146 | | 414 | | 718 | | 9,225 | | 6,209 | |
Voluntary Waiver of Investment Advisory Fees (Note B) | | — | | (99 | ) | (69 | ) | — | | — | |
Expenses Reimbursed by Adviser (Note B) | | — | | (63 | ) | — | | — | | — | |
Rebate from Morgan Stanley Affiliated Cash Sweep (Note G) | | (187 | ) | — | @ | (2 | ) | (24 | ) | (11 | ) |
Voluntary Waiver of Sub Transfer Agent Fees — Class I | | — | | — | | — | | (147 | ) | (82 | ) |
Voluntary Waiver of Sub Transfer Agent Fees — Class P | | — | | — | | — | | (10 | ) | — | @ |
Expense Offset (Note F) | | (2 | ) | — | @ | (1 | ) | (8 | ) | — | @ |
Net Expenses | | 46,957 | | 252 | | 646 | | 9,036 | | 6,116 | |
Net Investment Income | | 126,317 | | 138 | | 1,851 | | 24,923 | | 13,355 | |
Realized Gain (Loss): | | | | | | | | | | | |
Investments Sold | | 15,488 | | (1,744 | ) | (9,951 | ) | (144,283 | ) | (89,028 | ) |
Foreign Currency Transactions | | (11,434 | ) | 1 | | 17 | | (783 | ) | 733 | |
Futures Contracts | | — | | (20 | ) | — | | — | | — | |
Net Realized Gain (Loss) | | 4,054 | | (1,763 | ) | (9,934 | ) | (145,066 | ) | (88,295 | ) |
Change in Unrealized Appreciation (Depreciation): | | | | | | | | | | | |
Investments | | (1,982,419 | ) | (5,044 | ) | (32,556 | )** | (426,168 | ) | (169,350 | ) |
Contracts for Difference | | — | | 72 | | — | | — | | — | |
Foreign Currency Exchange Contracts and Translations | | 31,578 | | — | @ | 19 | | (243 | ) | (131 | ) |
Futures Contracts | | — | | 4 | | — | | — | | — | |
Securities Sold Short | | — | | 423 | | — | | — | | — | |
Net Change in Unrealized Appreciation (Depreciation) | | (1,950,841 | ) | (4,545 | ) | (32,537 | ) | (426,411 | ) | (169,481 | ) |
Total Net Realized Loss and Change in | | | | | | | | | | | |
Unrealized Appreciation (Depreciation) | | (1,946,787 | ) | (6,308 | ) | (42,471 | ) | (571,477 | ) | (257,776 | ) |
Net Decrease in Net Assets Resulting from Operations | | $ | (1,820,470 | ) | $ | (6,170 | ) | $ | (40,620 | ) | $ | (546,554 | ) | $ | (244,421 | ) |
@ | Amount is less than $500. | | | | | | | | | | | |
** | Net of decrease in Deferred Capital Gain Country Tax Accrual on unrealized appreciation of $1 for International Growth Equity. |
| | | | | | | | | | | | | | | | | | | | | | |
| The accompanying notes are an integral part of the financial statements. | 101 |
2008 Annual Report |
|
December 31, 2008 |
Statements of Operations
For the Year Ended December 31, 2008
| | | | | | Large Cap | | Small | | | |
| | Capital | | Focus | | Relative | | Company | | U.S. Real | |
| | Growth | | Growth | | Value | | Growth | | Estate | |
| | Portfolio | | Portfolio | | Portfolio | | Portfolio | | Portfolio | |
| | (000) | | (000) | | (000) | | (000) | | (000) | |
Investment Income: | | | | | | | | | | | |
Dividends from Securities of Unaffiliated Issuers | | $ | 9,799 | | $ | 115 | | $ | 6,240 | | $ | 12,731 | | $ | 27,574 | |
Dividends from Securities of Affiliated Issuers | | 564 | | 14 | | 302 | | 578 | | 1,557 | |
Interest from Securities of Unaffiliated Issuers | | 5 | | — | | 12 | | 43 | | 656 | |
Less: Foreign Taxes Withheld | | (112 | ) | — | | — | | (42 | ) | (205 | ) |
Total Investment Income | | 10,256 | | 129 | | 6,554 | | 13,310 | | 29,582 | |
Expenses: | | | | | | | | | | | |
Investment Advisory Fees (Note B) | | 5,781 | | 63 | | 1,153 | | 12,723 | | 7,247 | |
Administration Fees (Note C) | | 946 | | 10 | | 192 | | 1,137 | | 751 | |
Custodian Fees (Note F) | | 112 | | 10 | | 24 | | 69 | | 33 | |
Directors’ Fees and Expenses | | 8 | | — | | 1 | | 23 | | 12 | |
Professional Fees | | 41 | | 28 | | 26 | | 36 | | 41 | |
Shareholder Reporting Fees | | 371 | | 8 | | 84 | | 382 | | 391 | |
Shareholder Servicing Fees — Class P (Note D) | | 309 | | 5 | | 103 | | 1,317 | | 363 | |
Sub Transfer Agency Fees — Class I | | 36 | | 4 | | 69 | | 274 | | 74 | |
Sub Transfer Agency Fees — Class P | | 4 | | 1 | | 14 | | 162 | | 13 | |
Transfer Agency Fees (Note E) | | 19 | | 7 | | 15 | | 43 | | 39 | |
Registration Fees | | 49 | | 26 | | 32 | | 78 | | 59 | |
Other Expenses | | 35 | | 5 | | 12 | | 41 | | 39 | |
Expenses Before Non Operating Expenses | | 7,711 | | 167 | | 1,725 | | 16,285 | | 9,062 | |
Bank Overdraft Expense | | 7 | | 1 | | — | @ | 4 | | 22 | |
Investment Related Expenses | | — | | — | | — | | — | | 263 | |
Total Expenses | | 7,718 | | 168 | | 1,725 | | 16,289 | | 9,347 | |
Voluntary Waiver of Investment Advisory Fees (Note B) | | — | | (37 | ) | — | | — | | — | |
Rebate from Morgan Stanley Affiliated Cash Sweep (Note G) | | (21 | ) | — | @ | (12 | ) | (20 | ) | (37 | ) |
Voluntary Waiver of Sub Transfer Agent Fees — Class I | | — | | — | | — | | (274 | ) | (74 | ) |
Voluntary Waiver of Sub Transfer Agent Fees — Class P | | — | | — | | — | | (162 | ) | (13 | ) |
Expense Offset (Note F) | | (1 | ) | — | @ | (1 | ) | (6 | ) | (1 | ) |
Net Expenses | | 7,696 | | 131 | | 1,712 | | 15,827 | | 9,222 | |
Net Investment Income (Loss) | | 2,560 | | (2 | ) | 4,842 | | (2,517 | ) | 20,360 | |
Realized Gain (Loss): | | | | | | | | | | | |
Investments Sold | | (110,540 | ) | (366 | ) | (13,809 | ) | (7,371 | ) | (84,612 | ) |
Foreign Currency Transactions | | 55 | | 3 | | — | @ | (98 | ) | (12 | ) |
Futures Contracts | | — | | — | | (7 | ) | — | | — | |
Net Realized Loss | | (110,485 | ) | (363 | ) | (13,816 | ) | (7,469 | ) | (84,624 | ) |
Change in Unrealized Appreciation (Depreciation): | | | | | | | | | | | |
Investments | | (615,295 | ) | (7,132 | ) | (81,222 | ) | (736,061 | ) | (315,804 | ) |
Foreign Currency Exchange Contracts and Translations | | — | @ | — | @ | — | | — | @ | (1 | ) |
Net Change in Unrealized Appreciation (Depreciation) | | (615,295 | ) | (7,132 | ) | (81,222 | ) | (736,061 | ) | (315,805 | ) |
Total Net Realized Loss and Change in | | | | | | | | | | | |
Unrealized Appreciation (Depreciation) | | (725,780 | ) | (7,495 | ) | (95,038 | ) | (743,530 | ) | (400,429 | ) |
Net Decrease in Net Assets Resulting from Operations | | $ | (723,220 | ) | $ | (7,497 | ) | $ | (90,196 | ) | $ | (746,047 | ) | $ | (380,069 | ) |
@ Amount is less than $500. | | | | | | | | | | | |
| | | | | | | | | | | | | | | | | | |
102 | The accompanying notes are an integral part of the financial statements. | |
| 2008 Annual Report |
| |
| December 31, 2008 |
Statements of Operations
For the Year Ended December 31, 2008
| | U.S. | | Emerging | |
| | Small/Mid | | Markets | |
| | Cap Value | | Debt | |
| | Portfolio | | Portfolio | |
| | (000) | | (000) | |
Investment Income: | | | | | |
Dividends from Securities of Unaffiliated Issuers | | $ | 207 | | $ | — | |
Dividends from Securities of Affiliated Issuers | | 36 | | 74 | |
Interest from Securities of Unaffiliated Issuers | | 7 | | 3,491 | |
Less: Foreign Taxes Withheld | | — | | (25 | ) |
Total Investment Income | | 250 | | 3,540 | |
Expenses: | | | | | |
Investment Advisory Fees (Note B) | | 141 | | 269 | |
Administration Fees (Note C) | | 17 | | 29 | |
Custodian Fees (Note F) | | 12 | | 105 | |
Directors’ Fees and Expenses | | 1 | | — | |
Professional Fees | | 27 | | 50 | |
Shareholder Reporting Fees | | 6 | | 50 | |
Shareholder Servicing Fees — Class P (Note D) | | — | | 4 | |
Shareholder Servicing Fees — Class H (Note D) | | — | | 8 | |
Distribution and Shareholder Servicing Fees — Class L (Note D) | | — | | 1 | |
Transfer Agency Fees (Note E) | | 7 | | 10 | |
Registration Fees | | 28 | | 50 | |
Country Tax Expense# | | — | | 14 | |
Other Expenses | | 8 | | 11 | |
Expenses Before Non Operating Expenses | | 247 | | 601 | |
Bank Overdraft Expense | | — | @ | 4 | |
Transfer Agency Fees — Class H (Note E) | | — | | 2 | |
Transfer Agency Fees — Class L (Note E) | | — | | — | @ |
Total Expenses | | 247 | | 607 | |
Voluntary Waiver of Investment Advisory Fees (Note B) | | — | | (278 | ) |
Expenses Reimbursed by Adviser (Note B) | | — | | (11 | ) |
Rebate from Morgan Stanley Affiliated Cash Sweep (Note G) | | (1 | ) | (3 | ) |
Expense Offset (Note F) | | (1 | ) | (1 | ) |
Net Expenses | | 245 | | 314 | |
Net Investment Income | | 5 | | 3,226 | |
Realized Gain (Loss): | | | | | |
Investments Sold | | (4,586 | ) | (1,756 | ) |
Foreign Currency Transactions | | — | | (1,557 | ) |
Swap Agreements | | — | | 1 | |
Net Realized Gain (Loss) | | (4,586 | ) | (3,312 | ) |
Change in Unrealized Appreciation (Depreciation): | | | | | |
Investments | | (4,738 | ) | (2,423 | ) |
Foreign Currency Exchange Contracts and Translations | | — | | (40 | ) |
Swap Agreements | | — | | 21 | |
Net Change in Unrealized Appreciation (Depreciation) | | (4,738 | ) | (2,442 | ) |
Total Net Realized Loss and Change in Unrealized Appreciation (Depreciation) | | (9,324 | ) | (5,754 | ) |
Net Decrease in Net Assets Resulting from Operations | | $ | (9,319 | ) | $ | (2,528 | ) |
@ | Amount is less than $500. |
# | CPMF (Provisional Contribution on Financial Transactions) is a Brazilian federal tax imposed on certain banking transactions and account withdrawals. The tax is charged based on the value of the transaction. |
| | | | | | | | | | |
| The accompanying notes are an integral part of the financial statements. | 103 |
2008 Annual Report | | |
| | |
December 31, 2008 | | |
Statements of Changes in Net Assets
| | Active International Allocation | | Emerging Markets | |
| | Portfolio | | Portfolio | |
| | Year Ended | | Year Ended | | Year Ended | | Year Ended | |
| | December 31, | | December 31, | | December 31, | | December 31, | |
| | 2008 | | 2007 | | 2008 | | 2007 | |
| | (000) | | (000) | | (000) | | (000) | |
Increase (Decrease) in Net Assets | | | | | | | | | |
Operations: | | | | | | | | | |
Net Investment Income | | $ | 23,150 | | $ | 20,592 | | $ | 18,707 | | $ | 7,932 | |
Net Realized Gain (Loss) | | (35,882 | ) | 124,998 | | (219,535 | ) | 658,240 | |
Net Change in Unrealized Appreciation (Depreciation) | | (385,652 | ) | 2,501 | | (1,629,532 | ) | 328,393 | |
Net Increase (Decrease) in Net Assets Resulting from Operations | | (398,384 | ) | 148,091 | | (1,830,360 | ) | 994,565 | |
Distributions from and/or in Excess of: | | | | | | | | | |
Class I: | | | | | | | | | |
Net Investment Income | | (9,076 | ) | (34,919 | ) | — | | (10,445 | ) |
Net Realized Gain | | (39,989 | ) | (58,076 | ) | (148,947 | ) | (571,529 | ) |
Class P: | | | | | | | | | |
Net Investment Income | | (91 | ) | (149 | ) | — | | (208 | ) |
Net Realized Gain | | (199 | ) | (273 | ) | (8,146 | ) | (30,744 | ) |
Total Distributions | | (49,355 | ) | (93,417 | ) | (157,093 | ) | (612,926 | ) |
Capital Share Transactions:(1) | | | | | | | | | |
Class I: | | | | | | | | | |
Subscribed | | 215,834 | | 172,124 | | 370,659 | | 660,992 | |
Distributions Reinvested | | 42,354 | | 77,571 | | 146,475 | | 569,830 | |
Redeemed | | (340,922 | ) | (177,984 | ) | (762,206 | ) | (557,714 | ) |
Class P: | | | | | | | | | |
Subscribed | | 5,298 | | 3,372 | | 24,253 | | 81,605 | |
Distributions Reinvested | | 290 | | 422 | | 8,134 | | 30,914 | |
Redeemed | | (1,338 | ) | (2,096 | ) | (44,234 | ) | (74,740 | ) |
Net Increase (Decrease) in Net Assets Resulting from Capital Share Transactions | | (78,484 | ) | 73,409 | | (256,919 | ) | 710,887 | |
Redemption Fees | | 130 | | 3 | | 166 | | 453 | |
Total Increase (Decrease) in Net Assets | | (526,093 | ) | 128,086 | | (2,244,206 | ) | 1,092,979 | |
Net Assets: | | | | | | | | | |
Beginning of Period | | 1,099,020 | | 970,934 | | 3,502,964 | | 2,409,985 | |
End of Period | | $ | 572,927 | | $ | 1,099,020 | | $ | 1,258,758 | | $ | 3,502,964 | |
Undistributed (Distributions in Excess of) Net Investment Income Included in End of Period Net Assets | | $ | 903 | | $ | (2,542 | ) | $ | (8,440 | ) | $ | (24,956 | ) |
(1) Capital Share Transactions: | | | | | | | | | |
Class I: | | | | | | | | | |
Shares Subscribed | | 21,061 | | 10,505 | | 14,823 | | 19,285 | |
Shares Issued on Distributions Reinvested | | 3,453 | | 5,006 | | 6,573 | | 17,164 | |
Shares Redeemed | | (31,149 | ) | (10,838 | ) | (32,695 | ) | (16,736 | ) |
Net Increase (Decrease) in Class I Shares Outstanding | | (6,635 | ) | 4,673 | | (11,299 | ) | 19,713 | |
Class P: | | | | | | | | | |
Shares Subscribed | | 575 | | 193 | | 1,118 | | 2,355 | |
Shares Issued on Distributions Reinvested | | 25 | | 27 | | 372 | | 950 | |
Shares Redeemed | | (104 | ) | (126 | ) | (1,863 | ) | (2,305 | ) |
Net Increase (Decrease) in Class P Shares Outstanding | | 496 | | 94 | | (373 | ) | 1,000 | |
| | | | | | | | | | | | | | | | | | |
104 | The accompanying notes are an integral part of the financial statements. | |
| 2008 Annual Report |
| |
| December 31, 2008 |
Statements of Changes in Net Assets
| | Global Franchise | | Global Real Estate | |
| | Portfolio | | Portfolio | |
| | Year Ended | | Year Ended | | Year Ended | | Year Ended | |
| | December 31, | | December 31, | | December 31, | | December 31, | |
| | 2008 | | 2007 | | 2008 | | 2007 | |
| | (000) | | (000) | | (000) | | (000) | |
Increase (Decrease) in Net Assets | | | | | | | | | |
Operations: | | | | | | | | | |
Net Investment Income | | $ | 2,584 | | $ | 2,753 | | $ | 14,234 | | $ | 6,981 | |
Net Realized Gain (Loss) | | 2,856 | | 15,352 | | (110,211 | ) | 11,995 | |
Net Change in Unrealized Appreciation (Depreciation) | | (40,559 | ) | (6,597 | ) | (373,197 | ) | (96,771 | ) |
Net Increase (Decrease) in Net Assets Resulting from Operations | | (35,119 | ) | 11,508 | | (469,174 | ) | (77,795 | ) |
Distributions from and/or in Excess of: | | | | | | | | | |
Class I: | | | | | | | | | |
Net Investment Income | | (5,813 | ) | (870 | ) | (1,495 | ) | (21,830 | ) |
Net Realized Gain | | (1,417 | ) | (17,250 | ) | (2,187 | ) | (12,446 | ) |
Class P: | | | | | | | | | |
Net Investment Income | | (214 | ) | (39 | ) | (86 | ) | (398 | ) |
Net Realized Gain | | (65 | ) | (940 | ) | (38 | ) | (256 | ) |
Class H: | | | | | | | | | |
Net Investment Income | | — | | — | | — | | — | |
Net Realized Gain | | — | | — | | (2 | ) | — | |
Class L: | | | | | | | | | |
Net Investment Income | | — | | — | | — | | — | |
Net Realized Gain | | — | | — | | — | @ | — | |
Total Distributions | | (7,509 | ) | (19,099 | ) | (3,808 | ) | (34,930 | ) |
Capital Share Transactions:(1) | | | | | | | | | |
Class I: | | | | | | | | | |
Subscribed | | 11,091 | | 4,659 | | 524,819 | | 665,106 | |
Distributions Reinvested | | 6,932 | | 17,953 | | 3,480 | | 32,111 | |
Redeemed | | (9,303 | ) | (33,859 | ) | (231,460 | ) | (193,108 | ) |
Class P: | | | | | | | | | |
Subscribed | | 205 | | 3,728 | | 56,573 | | 22,603 | |
Distributions Reinvested | | 229 | | 862 | | 124 | | 638 | |
Redeemed | | (2,067 | ) | (1,859 | ) | (8,907 | ) | (7,482 | ) |
Class H*: | | | | | | | | | |
Subscribed | | — | | — | | 744 | | — | |
Distributions Reinvested | | — | | — | | 1 | | — | |
Redeemed | | — | | — | | (62 | ) | — | |
Class L*: | | | | | | | | | |
Subscribed | | — | | — | | 390 | | — | |
Distributions Reinvested | | — | | — | | — | @ | — | |
Redeemed | | — | | — | | — | | — | |
Net Increase (Decrease) in Net Assets Resulting from Capital Share Transactions | | 7,087 | | (8,516 | ) | 345,702 | | 519,868 | |
Redemption Fees | | — | | — | | 22 | | 18 | |
Total Increase (Decrease) in Net Assets | | (35,541 | ) | (16,107 | ) | (127,258 | ) | 407,161 | |
Net Assets: | | | | | | | | | |
Beginning of Period | | 116,462 | | 132,569 | | 645,924 | | 238,763 | |
End of Period | | $ | 80,921 | | $ | 116,462 | | $ | 518,666 | | $ | 645,924 | |
Undistributed (Distributions in Excess of) Net Investment Income Included in End of Period Net Assets | | $ | 689 | | $ | 525 | | $ | 132 | | $ | (13,261 | ) |
| | | | | | | | | | | | | | | | | |
| The accompanying notes are an integral part of the financial statements. | 105 |
2008 Annual Report |
|
December 31, 2008 |
Statements of Changes in Net Assets
| | Global Franchise | | Global Real Estate | |
| | Portfolio | | Portfolio | |
| | Year Ended | | Year Ended | | Year Ended | | Year Ended | |
| | December 31, | | December 31, | | December 31, | | December 31, | |
| | 2008 | | 2007 | | 2008 | | 2007 | |
| | (000) | | (000) | | (000) | | (000) | |
(1) Capital Share Transactions: | | | | | | | | | |
Class I: | | | | | | | | | |
Shares Subscribed | | 721 | | 242 | | 58,712 | | 55,916 | |
Shares Issued on Distributions Reinvested | | 605 | | 1,063 | | 499 | | 3,196 | |
Shares Redeemed | | (742 | ) | (1,821 | ) | (36,048 | ) | (16,713 | ) |
Net Increase (Decrease) in Class I Shares Outstanding | | 584 | | (516 | ) | 23,163 | | 42,399 | |
Class P: | | | | | | | | | |
Shares Subscribed | | 13 | | 198 | | 8,112 | | 1,903 | |
Shares Issued on Distributions Reinvested | | 20 | | 52 | | 20 | | 64 | |
Shares Redeemed | | (148 | ) | (97 | ) | (1,311 | ) | (660 | ) |
Net Increase (Decrease) in Class P Shares Outstanding | | (115 | ) | 153 | | 6,821 | | 1,307 | |
Class H*: | | | | | | | | | |
Shares Subscribed | | — | | — | | 79 | | — | |
Shares Issued on Distributions Reinvested | | — | | — | | — | # | — | |
Shares Redeemed | | — | | — | | (7 | ) | — | |
Net Increase in Class H Shares Outstanding | | — | | — | | 72 | | — | |
Class L*: | | | | | | | | | |
Shares Subscribed | | — | | — | | 48 | | — | |
Shares Issued on Distributions Reinvested | | — | | — | | — | # | — | |
Shares Redeemed | | — | | — | | — | | — | |
Net Increase in Class L Shares Outstanding | | — | | — | | 48 | | — | |
@ | Amount is less than $500. |
# | Shares are less than 500. |
* | The Global Real Estate Portfolio’s Class H and Class L commenced operations on January 2, 2008 and June 16, 2008, respectively. |
| | | | | | | | | | | | | | | | |
106 | The accompanying notes are an integral part of the financial statements. | |
| 2008 Annual Report |
| |
| December 31, 2008 |
Statements of Changes in Net Assets
| | Global Value Equity | | International Equity | |
| | Portfolio | | Portfolio | |
| | Year Ended | | Year Ended | | Year Ended | | Year Ended |
| | December 31, | | December 31, | | December 31, | | December 31, |
| | 2008 | | 2007 | | 2008 | | 2007 |
| | (000) | | (000) | | (000) | | (000) |
Increase (Decrease) in Net Assets | | | | | | | | | |
Operations: | | | | | | | | | |
Net Investment Income | | $ | 1,533 | | $ | 1,558 | | $ | 126,317 | | $ | 134,498 | |
Net Realized Gain (Loss) | | (12,795) | | 15,162 | | 4,054 | | 871,941 | |
Net Change in Unrealized Appreciation (Depreciation) | | (17,925) | | (10,156) | | (1,950,841) | | (340,830) | |
Net Increase (Decrease) in Net Assets Resulting from Operations | | (29,187) | | 6,564 | | (1,820,470) | | 665,609 | |
Distributions from and/or in Excess of: | | | | | | | | | |
Class I: | | | | | | | | | |
Net Investment Income | | (1,652) | | (1,044) | | (85,581) | | (105,722) | |
Net Realized Gain | | (558) | | (10,780) | | (246,224) | | (731,331) | |
Class P: | | | | | | | | | |
Net Investment Income | | (746) | | (322) | | (19,871) | | (18,724) | |
Net Realized Gain | | (228) | | (3,997) | | (63,382) | | (149,480) | |
Total Distributions | | (3,184) | | (16,143) | | (415,058) | | (1,005,257) | |
Capital Share Transactions:(1) | | | | | | | | | |
Class I: | | | | | | | | | |
Subscribed | | 2,804 | | 3,698 | | 609,414 | | 746,973 | |
Distributions Reinvested | | 2,130 | | 11,789 | | 310,637 | | 780,820 | |
Redeemed | | (23,799) | | (43,789) | | (1,608,578) | | (2,044,329) | |
Class P: | | | | | | | | | |
Subscribed | | 3,042 | | 4,116 | | 554,769 | | 321,010 | |
Distributions Reinvested | | 975 | | 4,319 | | 83,112 | | 168,106 | |
Redeemed | | (7,018) | | (9,264) | | (545,639) | | (561,568) | |
Net Decrease in Net Assets Resulting from Capital Share Transactions | | (21,866) | | (29,131) | | (596,285) | | (588,988) | |
Redemption Fees | | 1 | | 8 | | 311 | | 310 | |
Total Decrease in Net Assets | | (54,236) | | (38,702) | | (2,831,502) | | (928,326) | |
Net Assets: | | | | | | | | | |
Beginning of Period | | 90,234 | | 128,936 | | 6,125,402 | | 7,053,728 | |
End of Period | | $ | 35,998 | | $ | 90,234 | | $ | 3,293,900 | | $ | 6,125,402 | |
Undistributed (Distributions in Excess of) Net Investment Income Included in End of Period Net Assets | | $ | 150 | | $ | 58 | | $ | 4,431 | | $ | (3,623) | |
(1) Capital Share Transactions: | | | | | | | | | |
Class I: | | | | | | | | | |
Shares Subscribed | | 182 | | 173 | | 39,005 | | 34,520 | |
Shares Issued on Distributions Reinvested | | 203 | | 671 | | 29,205 | | 42,066 | |
Shares Redeemed | | (1,574) | | (2,112) | | (101,449) | | (93,380) | |
Net Decrease in Class I Shares Outstanding | | (1,189) | | (1,268) | | (33,239) | | (16,794) | |
Class P: | | | | | | | | | |
Shares Subscribed | | 282 | | 194 | | 37,546 | | 14,903 | |
Shares Issued on Distributions Reinvested | | 95 | | 248 | | 7,895 | | 9,151 | |
Shares Redeemed | | (492) | | (445) | | (36,829) | | (26,119) | |
Net Increase (Decrease) in Class P Shares Outstanding | | (115) | | (3) | | 8,612 | | (2,065) | |
| The accompanying notes are an integral part of the financial statements. | 107 |
2008 Annual Report |
|
December 31, 2008 |
Statements of Changes in Net Assets
| | International Growth Active | | International Growth Equity | |
| | Extension Portfolio | | Portfolio | |
| | Year Ended | | Year Ended | | Year Ended | | Year Ended |
| | December 31, | | December 31, | | December 31, | | December 31, |
| | 2008 | | 2007^ | | 2008 | | 2007 |
| | (000) | | (000) | | (000) | | (000) |
Increase (Decrease) in Net Assets
Operations: | | | | | | | | | |
Net Investment Income (Loss) | | $ | 138 | | | $ | (23 | ) | | $ | 1,851 | | | $ | 74 | | |
Net Realized Gain (Loss) | | (1,763 | ) | | (79 | ) | | (9,934 | ) | | 537 | | |
Net Change in Unrealized Appreciation (Depreciation) | | (4,545 | ) | | 761 | | | (32,537 | ) | | 484 | | |
Net Increase (Decrease) in Net Assets Resulting from Operations | | (6,170 | ) | | 659 | | | (40,620 | ) | | 1,095 | | |
Distributions from and/or in Excess of: | | | | | | | | | | | | | |
Class I: | | | | | | | | | | | | | |
Net Investment Income | | (143 | ) | | — | | | (1,877 | ) | | (63 | ) | |
Net Realized Gain | | — | | | — | | | (270 | ) | | (301 | ) | |
Class P: | | | | | | | | | | | | | |
Net Investment Income | | (1 | ) | | — | | | (10 | ) | | (3 | ) | |
Net Realized Gain | | — | | | — | | | (1 | ) | | (20 | ) | |
Class H: | | | | | | | | | | | | | |
Net Investment Income | | (6 | ) | | — | | | — | | | — | | |
Class L: | | | | | | | | | | | | | |
Net Investment Income | | (1 | ) | | — | | | — | | | — | | |
Total Distributions | | (151 | ) | | — | | | (2,158 | ) | | (387 | ) | |
Capital Share Transactions:(1) | | | | | | | | | | | | | |
Class I: | | | | | | | | | | | | | |
Subscribed | | — | | | — | | | 84,193 | | | 15,122 | | |
Distributions Reinvested | | — | | | — | | | 1,750 | | | 36 | | |
Redeemed | | — | | | — | | | (25,148 | ) | | (60 | ) | |
Class P: | | | | | | | | | | | | | |
Subscribed | | — | | | — | | | 61 | | | 153 | | |
Distributions Reinvested | | — | | | — | | | 8 | | | 17 | | |
Redeemed | | — | | | — | | | (147 | ) | | — | | |
Class H: | | | | | | | | | | | | | |
Subscribed | | 925 | | | — | | | — | | | — | | |
Distributions Reinvested | | 5 | | | — | | | — | | | — | | |
Redeemed | | (274 | ) | | — | | | — | | | — | | |
Class L: | | | | | | | | | | | | | |
Subscribed | | 35 | | | — | | | — | | | — | | |
Distributions Reinvested | | — | @ | | — | | | — | | | — | | |
Redeemed | | — | | | — | | | — | | | — | | |
Net Increase in Net Assets Resulting from Capital Share Transactions | | 691 | | | — | | | 60,717 | | | 15,268 | | |
Redemption Fees | | — | | | — | | | — | | | — | | |
Total Increase (Decrease) in Net Assets | | (5,630 | ) | | 659 | | | 17,939 | | | 15,976 | | |
Net Assets: | | | | | | | | | | | | | |
Beginning of Period | | 10,659 | | | 10,000 | | | 23,054 | | | 7,078 | | |
End of Period | | $ | 5,029 | | | $ | 10,659 | | | $ | 40,993 | | | $ | 23,054 | | |
Distributions in Excess of Net Investment Income Included in End of Period Net Assets | | $ | — | | | $ | (3 | ) | | $ | (13 | ) | | $ | — | | |
108 | The accompanying notes are an integral part of the financial statements. | |
| 2008 Annual Report |
| |
| December 31, 2008 |
Statements of Changes in Net Assets
| | International Growth Active | | International Growth Equity | |
| | Extension Portfolio | | Portfolio | |
| | Year Ended | | Year Ended | | Year Ended | | Year Ended | |
| | December 31, | | December 31, | | December 31, | | December 31, | |
| | 2008 | | 2007^ | | 2008 | | 2007 | |
| | (000) | | (000) | | (000) | | (000) | |
(1) Capital Share Transactions: | | | | | | | | | | | | | |
Class I: | | | | | | | | | | | | | |
Shares Subscribed | | — | | | 990 | | | 6,530 | | | 1,100 | | |
Shares Issued on Distributions Reinvested | | — | | | — | | | 253 | | | 3 | | |
Shares Redeemed | | — | | | — | | | (2,357 | ) | | (4 | ) | |
Net Increase in Class I Shares Outstanding | | — | | | 990 | | | 4,426 | | | 1,099 | | |
Class P: | | | | | | | | | | | | | |
Shares Subscribed | | — | | | 10 | | | 8 | | | 12 | | |
Shares Issued on Distributions Reinvested | | — | | | — | | | 1 | | | 1 | | |
Shares Redeemed | | — | | | — | | | (12 | ) | | — | | |
Net Increase (Decrease) in Class P Shares Outstanding | | — | | | 10 | | | (3 | ) | | 13 | | |
Class H: | | | | | | | | | | | | | |
Shares Subscribed | | 93 | | | — | | | — | | | — | | |
Shares Issued on Distributions Reinvested | | 1 | | | — | | | — | | | — | | |
Shares Redeemed | | (38 | ) | | — | | | — | | | — | | |
Net Increase in Class H Shares Outstanding | | 56 | | | — | | | — | | | — | | |
Class L: | | | | | | | | | | | | | |
Shares Subscribed | | 4 | | | — | | | — | | | — | | |
Shares Issued on Distributions Reinvested | | — | # | | — | | | — | | | — | | |
Shares Redeemed | | — | | | — | | | — | | | — | | |
Net Increase in Class L Shares Outstanding | | 4 | | | — | | | — | | | — | | |
^ | International Growth Active Extension commenced operations on July 31, 2007. |
@ | Amount is less than $500. |
# | Shares are less than 500. |
| The accompanying notes are an integral part of the financial statements. | 109 |
2008 Annual Report |
| |
December 31, 2008 |
Statements of Changes in Net Assets
| | International Real Estate | | International Small Cap | |
| | Portfolio | | Portfolio | |
| | Year Ended | | Year Ended | | Year Ended | | Year Ended | |
| | December 31, | | December 31, | | December 31, | | December 31, | |
| | 2008 | | 2007 | | 2008 | | 2007 | |
| | (000) | | (000) | | (000) | | (000) | |
Increase (Decrease) in Net Assets | | | | | | | | | |
Operations: | | | | | | | | | |
Net Investment Income | | $ | 24,923 | | | $ | 32,360 | | | $ | 13,355 | | | $ | 13,493 | | |
Net Realized Gain (Loss) | | (145,066 | ) | | 90,725 | | | (88,295 | ) | | 226,235 | | |
Net Change in Unrealized Appreciation (Depreciation) | | (426,411 | ) | | (433,923 | ) | | (169,481 | ) | | (254,273 | ) | |
Net Decrease in Net Assets Resulting from Operations | | (546,554 | ) | | (310,838 | ) | | (244,421 | ) | | (14,545 | ) | |
Distributions from and/or in Excess of: | | | | | | | | | | | | | |
Class I: | | | | | | | | | | | | | |
Net Investment Income | | — | | | (75,854 | ) | | (13,260 | ) | | (10,502 | ) | |
Net Realized Gain | | (5,239 | ) | | (67,563 | ) | | (30,495 | ) | | (223,789 | ) | |
Class P: | | | | | | | | | | | | | |
Net Investment Income | | — | | | (5,828 | ) | | (1 | ) | | — | | |
Net Realized Gain | | (172 | ) | | (5,753 | ) | | — | | | — | | |
Total Distributions | | (5,411 | ) | | (154,998 | ) | | (43,756 | ) | | (234,291 | ) | |
Capital Share Transactions:(1) | | | | | | | | | | | | | |
Class I: | | | | | | | | | | | | | |
Subscribed | | 330,959 | | | 936,214 | | | 69,427 | | | 93,078 | | |
Distributions Reinvested | | 3,596 | | | 97,520 | | | 39,520 | | | 208,756 | | |
Redeemed | | (424,987 | ) | | (675,327 | ) | | (300,305 | ) | | (569,019 | ) | |
Class P: | | | | | | | | | | | | | |
Subscribed | | 34,330 | | | 107,694 | | | 119 | | | — | | |
Distributions Reinvested | | 168 | | | 11,447 | | | 1 | | | — | | |
Redeemed | | (106,691 | ) | | (84,467 | ) | | (1 | ) | | — | | |
Net Increase (Decrease) in Net Assets Resulting from Capital Share Transactions | | (162,625 | ) | | 393,081 | | | (191,239 | ) | | (267,185 | ) | |
Redemption Fees | | 61 | | | 53 | | | 11 | | | 7 | | |
Total Decrease in Net Assets | | (714,529 | ) | | (72,702 | ) | | (479,405 | ) | | (516,014 | ) | |
Net Assets: | | | | | | | | | | | | | |
Beginning of Period | | 1,150,818 | | | 1,223,520 | | | 796,050 | | | 1,312,064 | | |
End of Period | | $ | 436,289 | | | $ | 1,150,818 | | | $ | 316,645 | | | $ | 796,050 | | |
Undistributed (Distributions in Excess of) Net Investment Income Included in End of Period Net Assets | | $ | (2,134 | ) | | $ | (34,483 | ) | | $ | 713 | | | $ | (144 | ) | |
(1) Capital Share Transactions: | | | | | | | | | | | | | |
Class I: | | | | | | | | | | | | | |
Shares Subscribed | | 16,150 | | | 27,636 | | | 5,203 | | | 3,786 | | |
Shares Issued on Distributions Reinvested | | 174 | | | 3,730 | | | 3,232 | | | 12,028 | | |
Shares Redeemed | | (24,020 | ) | | (22,070 | ) | | (21,823 | ) | | (24,536 | ) | |
Net Increase (Decrease) in Class I Shares Outstanding | | (7,696 | ) | | 9,296 | | | (13,388 | ) | | (8,722 | ) | |
Class P: | | | | | | | | | | | | | |
Shares Subscribed | | 1,401 | | | 3,292 | | | 13 | | | — | | |
Shares Issued on Distributions Reinvested | | 8 | | | 441 | | | — | # | | — | | |
Shares Redeemed | | (4,544 | ) | | (2,683 | ) | | — | # | | — | | |
Net Increase (Decrease) in Class P Shares Outstanding | | (3,135 | ) | | 1,050 | | | 13 | | | — | | |
# Shares are less than 500 | | | | | | | | | | | | | |
110 | The accompanying notes are an integral part of the financial statements. | |
| 2008 Annual Report |
| |
| December 31, 2008 |
Statements of Changes in Net Assets
| | Capital Growth | | Focus Growth | |
| | Portfolio | | Portfolio | |
| | Year Ended | | Year Ended | | Year Ended | | Year Ended | |
| | December 31, | | December 31, | | December 31, | | December 31, | |
| | 2008 | | 2007 | | 2008 | | 2007 | |
| | (000) | | (000) | | (000) | | (000) | |
Increase (Decrease) in Net Assets | | | | | | | | | |
Operations: | | | | | | | | | |
Net Investment Income (Loss) | | $ | 2,560 | | | $ | 5,480 | | | $ | (2 | ) | | $ | 18 | | |
Net Realized Gain (Loss) | | (110,485 | ) | | 72,047 | | | (363 | ) | | 1,077 | | |
Net Change in Unrealized Appreciation (Depreciation) | | (615,295 | ) | | 166,291 | | | (7,132 | ) | | 2,043 | | |
Net Increase (Decrease) in Net Assets Resulting from Operations | | (723,220 | ) | | 243,818 | | | (7,497 | ) | | 3,138 | | |
Distributions from and/or in Excess of: | | | | | | | | | | | | | |
Class I: | | | | | | | | | | | | | |
Net Investment Income | | (4,568 | ) | | (4,987 | ) | | (24 | ) | | (22 | ) | |
Net Realized Gain | | (1,281 | ) | | — | | | — | | | — | | |
Class P: | | | | | | | | | | | | | |
Net Investment Income | | (196 | ) | | (436 | ) | | — | @ | | — | | |
Net Realized Gain | | (151 | ) | | — | | | — | | | — | | |
Total Distributions | | (6,196 | ) | | (5,423 | ) | | (24 | ) | | (22 | ) | |
Capital Share Transactions:(1) | | | | | | | | | | | | | |
Class I: | | | | | | | | | | | | | |
Subscribed | | 153,379 | | | 365,245 | | | 1,060 | | | 2,269 | | |
Distributions Reinvested | | 5,844 | | | 4,984 | | | 24 | | | 21 | | |
Redeemed | | (369,316 | ) | | (196,520 | ) | | (3,807 | ) | | (3,443 | ) | |
Class P: | | | | | | | | | | | | | |
Subscribed | | 35,237 | | | 113,572 | | | 84 | | | 776 | | |
Distributions Reinvested | | 346 | | | 435 | | | — | @ | | — | | |
Redeemed | | (65,945 | ) | | (22,637 | ) | | (658 | ) | | (707 | ) | |
Net Increase (Decrease) in Net Assets Resulting from Capital Share Transactions | | (240,455 | ) | | 265,079 | | | (3,297 | ) | | (1,084 | ) | |
Redemption Fees | | 12 | | | 3 | | | 1 | | | — | @ | |
Total Increase (Decrease) in Net Assets | | (969,859 | ) | | 503,477 | | | (10,817 | ) | | 2,032 | | |
Net Assets: | | | | | | | | | | | | | |
Beginning of Period | | 1,573,583 | | | 1,070,106 | | | 16,765 | | | 14,733 | | |
End of Period | | $ | 603,724 | | | $ | 1,573,583 | | | $ | 5,948 | | | $ | 16,765 | | |
Distributions in Excess of Net Investment Income Included in End of Period Net Assets | | $ | (39 | ) | | $ | (23 | ) | | $ | (5 | ) | | $ | (9 | ) | |
(1) Capital Share Transactions: | | | | | | | | | | | | | |
Class I: | | | | | | | | | | | | | |
Shares Subscribed | | 8,076 | | | 15,536 | | | 61 | | | 123 | | |
Shares Issued on Distributions Reinvested | | 432 | | | 205 | | | 3 | | | 1 | | |
Shares Redeemed | | (20,618 | ) | | (8,673 | ) | | (255 | ) | | (205 | ) | |
Net Increase (Decrease) in Class I Shares Outstanding | | (12,110 | ) | | 7,068 | | | (191 | ) | | (81 | ) | |
Class P: | | | | | | | | | | | | | |
Shares Subscribed | | 1,754 | | | 4,978 | | | 5 | | | 44 | | |
Shares Issued on Distributions Reinvested | | 23 | | | 18 | | | — | # | | — | | |
Shares Redeemed | | (3,633 | ) | | (1,018 | ) | | (42 | ) | | (42 | ) | |
Net Increase (Decrease) in Class P Shares Outstanding | | (1,856 | ) | | 3,978 | | | (37 | ) | | 2 | | |
# Shares are less than 500.
| The accompanying notes are an integral part of the financial statements. | 111 |
2008 Annual Report |
|
December 31, 2008 |
Statements of Changes in Net Assets
| | Large Cap Relative Value | | Small Company Growth | |
| | Portfolio | | Portfolio | |
| | Year Ended | | Year Ended | | Year Ended | | Year Ended | |
| | December 31, | | December 31, | | December 31, | | December 31, | |
| | 2008 | | 2007 | | 2008 | | 2007 | |
| | (000) | | (000) | | (000) | | (000) | |
Increase (Decrease) in Net Assets | | | | | | | | | |
Operations: | | | | | | | | | |
Net Investment Income (Loss) | | $ | 4,842 | | | $ | 5,052 | | | $ | (2,517 | ) | | $ | (8,851 | ) | |
Net Realized Gain (Loss) | | (13,816 | ) | | 11,824 | | | (7,469 | ) | | 67,104 | | |
Net Change in Unrealized Appreciation (Depreciation) | �� | (81,222 | ) | | (9,583 | ) | | (736,061 | ) | | (504 | ) | |
Net Increase (Decrease) in Net Assets Resulting from Operations | | (90,196 | ) | | 7,293 | | | (746,047 | ) | | 57,749 | | |
Distributions from and/or in Excess of: | | | | | | | | | | | | | |
Class I: | | | | | | | | | | | | | |
Net Investment Income | | (4,046 | ) | | (4,158 | ) | | — | | | — | | |
Net Realized Gain | | (1,014 | ) | | (9,556 | ) | | — | | | (48,432 | ) | |
Class P: | | | | | | | | | | | | | |
Net Investment Income | | (752 | ) | | (891 | ) | | — | | | — | | |
Net Realized Gain | | (206 | ) | | (2,283 | ) | | — | | | (34,374 | ) | |
Total Distributions | | (6,018 | ) | | (16,888 | ) | | — | | | (82,806 | ) | |
Capital Share Transactions:(1) | | | | | | | | | | | | | |
Class I: | | | | | | | | | | | | | |
Subscribed | | 32,039 | | | 67,425 | | | 187,129 | | | 316,184 | | |
Distributions Reinvested | | 5,042 | | | 13,663 | | | — | | | 46,288 | | |
Redeemed | | (44,054 | ) | | (47,813 | ) | | (220,193 | ) | | (234,892 | ) | |
Class P: | | | | | | | | | | | | | |
Subscribed | | 7,908 | | | 8,087 | | | 86,946 | | | 122,392 | | |
Distributions Reinvested | | 953 | | | 3,161 | | | — | | | 34,371 | | |
Redeemed | | (7,866 | ) | | (23,076 | ) | | (160,035 | ) | | (308,689 | ) | |
Net Increase (Decrease) in Net Assets Resulting from Capital Share Transactions | | (5,978 | ) | | 21,447 | | | (106,153 | ) | | (24,346 | ) | |
Redemption Fees | | 2 | | | 15 | | | 39 | | | 120 | | |
Total Increase (Decrease) in Net Assets | | (102,190 | ) | | 11,867 | | | (852,161 | ) | | (49,283 | ) | |
Net Assets: | | | | | | | | | | | | | |
Beginning of Period | | 287,071 | | | 275,204 | | | 1,836,022 | | | 1,885,305 | | |
End of Period | | $ | 184,881 | | | $ | 287,071 | | | $ | 983,861 | | | $ | 1,836,022 | | |
Undistributed (Distributions in Excess of) Net Investment Income Included in End of Period Net Assets | | $ | 22 | | | $ | (21 | ) | | $ | (24 | ) | | $ | — | | |
Accumulated Net Investment Loss Included in End of Period Net Assets | | $ | — | | | $ | — | | | $ | — | | | $ | (22 | ) | |
(1) Capital Share Transactions: | | | | | | | | | | | | | |
Class I: | | | | | | | | | | | | | |
Shares Subscribed | | 3,121 | | | 5,313 | | | 19,052 | | | 22,899 | | |
Shares Issued on Distributions Reinvested | | 529 | | | 1,112 | | | — | | | 3,507 | | |
Shares Redeemed | | (4,503 | ) | | (3,838 | ) | | (22,138 | ) | | (16,936 | ) | |
Net Increase (Decrease) in Class I Shares Outstanding | | (853 | ) | | 2,587 | | | (3,086 | ) | | 9,470 | | |
Class P: | | | | | | | | | | | | | |
Shares Subscribed | | 842 | | | 648 | | | 8,753 | | | 9,315 | | |
Shares Issued on Distributions Reinvested | | 101 | | | 256 | | | — | | | 2,751 | | |
Shares Redeemed | | (743 | ) | | (1,857 | ) | | (17,079 | ) | | (23,606 | ) | |
Net Increase (Decrease) in Class P Shares Outstanding | | 200 | | | (953 | ) | | (8,326 | ) | | (11,540 | ) | |
112 | The accompanying notes are an integral part of the financial statements. | |
| 2008 Annual Report |
| |
| December 31, 2008 |
Statements of Changes in Net Assets
| | U.S. Real Estate | | U.S. Small/Mid Cap Value | |
| | Portfolio | | Portfolio | |
| | Year Ended | | Year Ended | | Year Ended | | Period Ended |
| | December 31, | | December 31, | | December 31, | | December 31, |
| | 2008 | | 2007 | | 2008 | | 2007^ |
| | (000) | | (000) | | (000) | | (000) |
Increase (Decrease) in Net Assets | | | | | | | | | |
Operations: | | | | | | | | | |
Net Investment Income | | $ | 20,360 | | | $ | 20,283 | | | $ | 5 | | | $ | 5 | | |
Net Realized Gain (Loss) | | (84,624 | ) | | 420,629 | | | (4,586 | ) | | (17 | ) | |
Net Change in Unrealized Appreciation (Depreciation) | | (315,805 | ) | | (693,156 | ) | | (4,738 | ) | | (1,072 | ) | |
Net Decrease in Net Assets Resulting from Operations | | (380,069 | ) | | (252,244 | ) | | (9,319 | ) | | (1,084 | ) | |
Distributions from and/or in Excess of: | | | | | | | | | | | | | |
Class I: | | | | | | | | | | | | | |
Net Investment Income | | (17,355 | ) | | (24,407 | ) | | (11 | ) | | — | | |
Net Realized Gain | | (59,526 | ) | | (322,942 | ) | | (20 | ) | | (18 | ) | |
Class P: | | | | | | | | | | | | | |
Net Investment Income | | (2,855 | ) | | (3,761 | ) | | — | | | — | | |
Net Realized Gain | | (10,774 | ) | | (58,276 | ) | | — | @ | | — | @ | |
Total Distributions | | (90,510 | ) | | (409,386 | ) | | (31 | ) | | (18 | ) | |
Capital Share Transactions:(1) | | | | | | | | | | | | | |
Class I: | | | | | | | | | | | | | |
Subscribed | | 252,586 | | | 358,040 | | | 7,041 | | | 1,326 | | |
Distributions Reinvested | | 74,979 | | | 340,743 | | | 9 | | | 1 | | |
Redeemed | | (394,990 | ) | | (863,055 | ) | | (1,357 | ) | | (18 | ) | |
Class P: | | | | | | | | | | | | | |
Subscribed | | 53,564 | | | 111,307 | | | — | | | — | | |
Distributions Reinvested | | 13,625 | | | 62,036 | | | — | | | — | | |
Redeemed | | (67,890 | ) | | (168,578 | ) | | — | | | — | | |
Net Increase (Decrease) in Net Assets Resulting from Capital Share Transactions | | (68,126 | ) | | (159,507 | ) | | 5,693 | | | 1,309 | | |
Redemption Fees | | 33 | | | 71 | | | — | | | — | | |
Total Increase (Decrease) in Net Assets | | (538,672 | ) | | (821,066 | ) | | (3,657 | ) | | 207 | | |
Net Assets: | | | | | | | | | | | | | |
Beginning of Period | | 1,083,397 | | | 1,904,463 | | | 20,207 | | | 20,000 | | |
End of Period | | $ | 544,725 | | | $ | 1,083,397 | | | $ | 16,550 | | | $ | 20,207 | | |
Undistributed Net Investment Income Included in End of Period Net Assets | | $ | 258 | | | $ | 1,114 | | | $ | 1 | | | $ | 6 | | |
(1) Capital Share Transactions: | | | | | | | | | | | | | |
Class I: | | | | | | | | | | | | | |
Shares Subscribed | | 18,700 | | | 12,926 | | | 864 | | | 2,125 | | |
Shares Issued on Distributions Reinvested | | 5,475 | | | 20,310 | | | 1 | | | — | | |
Shares Redeemed | | (31,461 | ) | | (33,292 | ) | | (175 | ) | | (2 | ) | |
Net Increase (Decrease) in Class I Shares Outstanding | | (7,286 | ) | | (56 | ) | | 690 | | | 2,123 | | |
Class P: | | | | | | | | | | | | | |
Shares Subscribed | | 4,111 | | | 3,955 | | | — | | | 10 | | |
Shares Issued on Distributions Reinvested | | 1,009 | | | 3,756 | | | — | | | — | | |
Shares Redeemed | | (5,194 | ) | | (6,266 | ) | | — | | | — | | |
Net Increase (Decrease) in Class P Shares Outstanding | | (74 | ) | | 1,445 | | | — | | | 10 | | |
^ U.S. Small/Mid Cap Value commenced operations on September 27, 2007.
@ Amount is less than $500.
| The accompanying notes are an integral part of the financial statements. | 113 |
2008 Annual Report |
|
December 31, 2008 |
Statements of Changes in Net Assets
| | Emerging Markets Debt | |
| | Portfolio | |
| | Year Ended | | Year Ended | |
| | December 31, | | December 31, | |
| | 2008 | | 2007 | |
| | (000) | | (000) | |
Increase (Decrease) in Net Assets | | | | | |
Operations: | | | | | |
Net Investment Income | | $ | 3,226 | | | $ | 3,188 | | |
Net Realized Gain | | (3,312 | ) | | 4,437 | | |
Net Change in Unrealized Appreciation (Depreciation) | | (2,442 | ) | | (5,719 | ) | |
Net Increase (Decrease) in Net Assets Resulting from Operations | | (2,528 | ) | | 1,906 | | |
Distributions from and/or in Excess of: | | | | | | | |
Class I: | | | | | | | |
Net Investment Income | | (756 | ) | | (4,215 | ) | |
Class P: | | | | | | | |
Net Investment Income | | (76 | ) | | (68 | ) | |
Class H: | | | | | | | |
Net Investment Income | | (149 | ) | | — | | |
Class L: | | | | | | | |
Net Investment Income | | (8 | ) | | — | | |
Total Distributions | | (989 | ) | | (4,283 | ) | |
Capital Share Transactions:(1) | | | | | | | |
Class I: | | | | | | | |
Subscribed | | 29,549 | | | 17,784 | | |
Distributions Reinvested | | 211 | | | 4,205 | | |
Redeemed | | (58,315 | ) | | (48,197 | ) | |
Class P: | | | | | | | |
Subscribed | | 4,082 | | | 423 | | |
Distributions Reinvested | | 76 | | | 68 | | |
Redeemed | | (885 | ) | | (141 | ) | |
Class H: | | | | | | | |
Subscribed | | 5,169 | | | — | | |
Distributions Reinvested | | 146 | | | — | | |
Redeemed | | (2,848 | ) | | — | | |
Class L: | | | | | | | |
Subscribed | | 396 | | | — | | |
Distributions Reinvested | | 8 | | | — | | |
Redeemed | | (1 | ) | | — | | |
Net Decrease in Net Assets Resulting from Capital Share Transactions | | (22,412 | ) | | (25,858 | ) | |
Redemption Fees | | — | | | 14 | | |
Total Decrease in Net Assets | | (25,929 | ) | | (28,221 | ) | |
Net Assets: | | | | | | | |
Beginning of Period | | 53,556 | | | 81,777 | | |
End of Period | | $ | 27,627 | | | $ | 53,556 | | |
Undistributed (Distributions in Excess of) Net Investment Income Included in End of Period Net Assets | | $ | 6,113 | | | $ | (270 | ) | |
114 | The accompanying notes are an integral part of the financial statements. | |
| 2008 Annual Report |
| |
| December 31, 2008 |
Statements of Changes in Net Assets
| | Emerging Markets Debt | |
| | Portfolio | |
| | Year Ended | | Year Ended | |
| | December 31, | | December 31, | |
| | 2008 | | 2007 | |
| | (000) | | (000) | |
(1) Capital Share Transactions: | | | | | |
Class I: | | | | | |
Shares Subscribed | | 2,569 | | | 1,441 | | |
Shares Issued on Distributions Reinvested | | 20 | | | 371 | | |
Shares Redeemed | | (4,979 | ) | | (3,993 | ) | |
Net Decrease in Class I Shares Outstanding | | (2,390 | ) | | (2,181 | ) | |
Class P: | | | | | | | |
Shares Subscribed | | 371 | | | 33 | | |
Shares Issued on Distributions Reinvested | | 7 | | | 6 | | |
Shares Redeemed | | (94 | ) | | (11 | ) | |
Net Increase in Class P Shares Outstanding | | 284 | | | 28 | | |
Class H: | | | | | | | |
Shares Subscribed | | 431 | | | — | | |
Shares Issued on Distributions Reinvested | | 13 | | | — | | |
Shares Redeemed | | (271 | ) | | — | | |
Net Increase in Class H Shares Outstanding | | 173 | | | — | | |
Class L: | | | | | | | |
Shares Subscribed | | 33 | | | — | | |
Shares Issued on Distributions Reinvested | | 1 | | | — | | |
Shares Redeemed | | — | # | | — | | |
Net Increase in Class L Shares Outstanding | | 34 | | | — | | |
# Shares are less than 500.
| The accompanying notes are an integral part of the financial statements. | 115 |
2008 Annual Report | | |
| | |
December 31, 2008 | | |
Statement of Cash Flows
| | International | |
| | Growth | |
| | Active | |
| | Extension | |
| | Portfolio | |
| | (000) | |
Cash Flows From Operating Activities: | | | |
Proceeds from Sales and Maturities of Investments | | $ | 5,823 | | |
Purchases of Investments | | (5,996 | ) | |
Proceeds from Securities Sold Short | | 4,370 | | |
Covers of Securities Sold Short | | (4,944 | ) | |
Net (Increase) Decrease in Short-Term Investments | | 31 | | |
Net (Increase) Decrease in Foreign Currency Holdings | | 15 | | |
Net (Increase) Decrease in Cash Overdrafts | | 42 | | |
Net Realized Gain (Loss) for Foreign Currency Transactions | | 1 | | |
Net Realized Gain (Loss) on Futures Contracts | | (20 | ) | |
Net Investment Income | | 138 | | |
Adjustments to Reconcile Net Investment Income to Net Cash Provided by Operating Activities: | | | | |
Net (Increase) Decrease in Receivables Related to Operations | | 1 | | |
Net Increase (Decrease) in Payables Related to Operations | | 6 | | |
Net Cash Provided (Used) by Operating Activities | | (533 | ) | |
Cash Flows from Financing Activities: | | | | |
Proceeds from Portfolio Shares Sold | | 960 | | |
Payment on Portfolio Shares Redeemed | | (273 | ) | |
Cash Dividends and Distributions Paid | | (154 | ) | |
Net Cash Received (Paid) from Financing Activities | | 533 | | |
Net Increase (Decrease) in Cash | | — | | |
Cash at Beginning of Period | | — | | |
Cash at End of Period | | $ | — | | |
| | | | |
Supplemental Disclosure of Cash Flow Information: | | | | |
Interest Paid on Short Positions during the Period | | 128 | | |
116 | The accompanying notes are an integral part of the financial statements. | |
| 2008 Annual Report |
| |
| December 31, 2008 |
Financial Highlights
Active International Allocation Portfolio
| | Class I |
| | Year Ended December 31, |
Selected Per Share Data and Ratios | | 2008 | | 2007 | | 2006 | | 2005 | | 2004 | |
Net Asset Value, Beginning of Period | | $ 15.92 | | $ 15.10 | | $ 12.43 | | $ 10.96 | | $ 9.58 | |
Income (Loss) from Investment Operations | | | | | | | | | | | |
Net Investment Income† | | 0.35 | | 0.30 | | 0.27 | | 0.21 | | 0.13 | |
Net Realized and Unrealized Gain (Loss) on Investments | | (6.41 | ) | 1.96 | | 2.75 | | 1.40 | | 1.46 | |
Total from Investment Operations | | (6.06 | ) | 2.26 | | 3.02 | | 1.61 | | 1.59 | |
Distributions from and/or in Excess of: | | | | | | | | | | | |
Net Investment Income | | (0.14 | ) | (0.54 | ) | (0.35 | ) | (0.14 | ) | (0.21 | ) |
Net Realized Gain | | (0.61 | ) | (0.90 | ) | — | | — | | — | |
Total Distributions | | (0.75 | ) | (1.44 | ) | (0.35 | ) | (0.14 | ) | (0.21 | ) |
Redemption Fees | | 0.00 | ‡ | 0.00 | ‡ | 0.00 | ‡ | 0.00 | ‡ | — | |
Net Asset Value, End of Period | | $ 9.11 | | $ 15.92 | | $ 15.10 | | $ 12.43 | | $ 10.96 | |
Total Return++ | | (39.25 | )% | 15.30 | % | 24.34 | % | 14.85 | % | 16.64 | % |
Ratios and Supplemental Data: | | | | | | | | | | | |
Net Assets, End of Period (Thousands) | | $565,313 | | $1,093,735 | | $967,361 | | $792,329 | | $580,851 | |
Ratio of Expenses to Average Net Assets (1) | | 0.79 | %+ | 0.80 | %+ | 0.80 | % | 0.80 | % | 0.80 | % |
Ratio of Expenses to Average Net Assets Excluding Non Operating Expenses | | 0.79 | %+ | 0.80 | %+ | 0.80 | % | 0.80 | % | 0.80 | % |
Ratio of Net Investment Income to Average Net Assets (1) | | 2.70 | %+ | 1.93 | %+ | 1.99 | % | 1.84 | % | 1.28 | % |
Portfolio Turnover Rate | | 34 | % | 28 | % | 16 | % | 24 | % | 24 | % |
(1) Supplemental Information on the Ratios to Average Net Assets: | | | | | | | | | | | |
Ratios before expense limitation: | | | | | | | | | | | |
Expenses to Average Net Assets | | 0.82 | %+ | 0.81 | %+ | 0.82 | % | 0.83 | % | 0.91 | % |
Net Investment Income to Average Net Assets | | 2.67 | %+ | 1.92 | %+ | 1.97 | % | 1.81 | % | 1.18 | % |
| | | | | | | | | | | |
| | Class P |
| | Year Ended December 31, |
Selected Per Share Data and Ratios | | 2008 | | 2007 | | 2006 | | 2005 | | 2004 | |
Net Asset Value, Beginning of Period | | $ 16.20 | | $ 15.36 | | $ 12.64 | | $ 11.13 | | $ 9.72 | |
Income (Loss) from Investment Operations | | | | | | | | | | | |
Net Investment Income† | | 0.29 | | 0.24 | | 0.22 | | 0.19 | | 0.10 | |
Net Realized and Unrealized Gain (Loss) on Investments | | (6.48 | ) | 2.01 | | 2.81 | | 1.43 | | 1.35 | |
Total from Investment Operations | | (6.19 | ) | 2.25 | | 3.03 | | 1.62 | | 1.45 | |
Distributions from and/or in Excess of: | | | | | | | | | | | |
Net Investment Income | | (0.13 | ) | (0.51 | ) | (0.31 | ) | (0.11 | ) | (0.17 | ) |
Net Realized Gain | | (0.61 | ) | (0.90 | ) | — | | — | | — | |
Total Distributions | | (0.74 | ) | (1.41 | ) | (0.31 | ) | (0.11 | ) | (0.17 | ) |
Redemption Fees | | 0.00 | ‡ | 0.00 | ‡ | 0.00 | ‡ | 0.00 | ‡ | 0.13 | |
Net Asset Value, End of Period | | $ 9.27 | | $ 16.20 | | $ 15.36 | | $ 12.64 | | $ 11.13 | |
Total Return++ | | (39.41 | )% | 14.95 | % | 23.95 | % | 14.67 | % | 16.29 | % |
Ratios and Supplemental Data: | | | | | | | | | | | |
Net Assets, End of Period (Thousands) | | $ 7,614 | | $ 5,285 | | $ 3,573 | | $ 2,215 | | $ 2,623 | |
Ratio of Expenses to Average Net Assets (1) | | 1.04 | %+ | 1.05 | %+ | 1.05 | % | 1.05 | % | 1.05 | % |
Ratio of Expenses to Average Net Assets Excluding Non Operating Expenses | | 1.04 | %+ | 1.05 | %+ | 1.05 | % | 1.05 | % | 1.05 | % |
Ratio of Net Investment Income to Average Net Assets (1) | | 2.32 | %+ | 1.52 | %+ | 1.61 | % | 1.69 | % | 1.03 | % |
Portfolio Turnover Rate | | 34 | % | 28 | % | 16 | % | 24 | % | 24 | % |
(1) Supplemental Information on the Ratios to Average Net Assets: | | | | | | | | | | | |
Ratios before expense limitation: | | | | | | | | | | | |
Expenses to Average Net Assets | | 1.07 | %+ | 1.06 | %+ | 1.07 | % | 1.08 | % | 1.16 | % |
Net Investment Income to Average Net Assets | | 2.29 | %+ | 1.51 | %+ | 1.59 | % | 1.66 | % | 0.92 | % |
† | Per share amount is based on average shares outstanding. |
‡ | Amount is less than $0.005 per share. |
++ | Calculated based on the net asset value as of the last business day of the period. |
+ | Reflects rebate of certain Portfolio expenses in connection with the investments in Morgan Stanley Institutional Liquidity Money Market Portfolio — Institutional Class during the period. As a result of such rebate, the expenses as a percentage of its net assets were effected by approximately 0.01% and less than 0.005% for the years ended December 31, 2008 and December 31, 2007, respectively. |
| The accompanying notes are an integral part of the financial statements. | 117 |
2008 Annual Report | |
| |
December 31, 2008 | |
Financial Highlights
Emerging Markets Portfolio
| | Class I |
| | Year Ended December 31, |
Selected Per Share Data and Ratios | | 2008 | | 2007 | | 2006 | | 2005 | | 2004 | |
Net Asset Value, Beginning of Period | | $ 34.02 | | $ 29.29 | | $ 25.36 | | $ 19.10 | | $ 15.52 | |
Income (Loss) from Investment Operations | | | | | | | | | | | |
Net Investment Income† | | 0.19 | | 0.10 | | 0.18 | | 0.25 | | 0.19 | |
Net Realized and Unrealized Gain (Loss) on Investments | | (18.78 | ) | 11.76 | | 9.22 | | 6.36 | | 3.54 | |
Total from Investment Operations | | (18.59 | ) | 11.86 | | 9.40 | | 6.61 | | 3.73 | |
Distributions from and/or in Excess of: | | | | | | | | | | | |
Net Investment Income | | — | | (0.13 | ) | (0.29 | ) | (0.35 | ) | (0.15 | ) |
Net Realized Gain | | (1.64 | ) | (7.01 | ) | (5.18 | ) | — | | — | |
Total Distributions | | (1.64 | ) | (7.14 | ) | (5.47 | ) | (0.35 | ) | (0.15 | ) |
Redemption Fees | | 0.00 | ‡ | 0.01 | | 0.00 | ‡ | 0.00 | ‡ | 0.00 | ‡ |
Net Asset Value, End of Period | | $ 13.79 | | $ 34.02 | | $ 29.29 | | $ 25.36 | | $ 19.10 | |
Total Return++ | | (56.39 | )% | 41.56 | % | 38.00 | % | 34.54 | % | 24.09 | % |
Ratios and Supplemental Data: | | | | | | | | | | | |
Net Assets, End of Period (Thousands) | | $1,191,199 | | $3,323,130 | | $2,283,535 | | $1,749,671 | | $1,249,299 | |
Ratio of Expenses to Average Net Assets | | 1.43 | %+ | 1.35 | %+ | 1.40 | % | 1.41 | % | 1.52 | %^^ |
Ratio of Expenses to Average Net Assets Excluding Non Operating Expenses | | 1.43 | %+ | 1.35 | %+ | 1.40 | % | 1.41 | % | 1.52 | % |
Ratio of Net Investment Income to Average Net Assets | | 0.78 | %+ | 0.28 | %+ | 0.62 | % | 1.17 | % | 1.09 | % |
Portfolio Turnover Rate | | 96 | % | 101 | % | 82 | % | 59 | % | 73 | % |
† | Per share amount is based on average shares outstanding. |
‡ | Amount is less than $0.005 per share. |
++ | Calculated based on the net asset value as of the last business day of the period. |
+ | Reflects rebate of certain Portfolio expenses in connection with the investments in Morgan Stanley Institutional Liquidity Money Market Portfolio — Institutional Class during the period. As a result of such rebate, the expenses as a percentage of its net assets were effected by less than 0.005%. |
^^ | Effective November 1, 2004, the Adviser has voluntarily agreed to limit the ratio of expenses to average net assets to the maximum ratio of 1.65% for Class I shares. Prior to November 1, 2004, the maximum ratio was 1.75% for Class I shares. |
118 | The accompanying notes are an integral part of the financial statements. | |
| 2008 Annual Report |
| |
| December 31, 2008 |
Financial Highlights
Emerging Markets Portfolio
| | Class P |
| | Year Ended December 31, |
Selected Per Share Data and Ratios | | 2008 | | 2007 | | 2006 | | 2005 | | 2004 | |
Net Asset Value, Beginning of Period | | $ 33.46 | | $ 28.91 | | $ 25.07 | | $ 18.90 | | $ 15.36 | |
Income (Loss) from Investment Operations | | | | | | | | | | | |
Net Investment Income† | | 0.13 | | 0.01 | | 0.13 | | 0.19 | | 0.15 | |
Net Realized and Unrealized Gain (Loss) on Investments | | (18.44 | ) | 11.60 | | 9.09 | | 6.26 | | 3.49 | |
Total from Investment Operations | | (18.31 | ) | 11.61 | | 9.22 | | 6.45 | | 3.64 | |
Distributions from and/or in Excess of: | | | | | | | | | | | |
Net Investment Income | | — | | (0.05 | ) | (0.20 | ) | (0.29 | ) | (0.11 | ) |
Net Realized Gain | | (1.64 | ) | (7.01 | ) | (5.18 | ) | — | | — | |
Total Distributions | | (1.64 | ) | (7.06 | ) | (5.38 | ) | (0.29 | ) | (0.11 | ) |
Redemption Fees | | 0.00 | ‡ | 0.00 | ‡ | 0.00 | ‡ | 0.01 | | 0.01 | |
Net Asset Value, End of Period | | $ 13.51 | | $ 33.46 | | $ 28.91 | | $ 25.07 | | $ 18.90 | |
Total Return++ | | (56.50 | )% | 41.20 | % | 37.65 | % | 34.17 | % | 23.84 | % |
Ratios and Supplemental Data: | | | | | | | | | | | |
Net Assets, End of Period (Thousands) | | $67,559 | | $179,834 | | $126,450 | | $103,482 | | $71,254 | |
Ratio of Expenses to Average Net Assets | | 1.68 | %+ | 1.60 | %+ | 1.65 | % | 1.66 | % | 1.77 | %^^ |
Ratio of Expenses to Average Net Assets Excluding Non Operating Expenses | | 1.68 | %+ | 1.60 | %+ | 1.65 | % | 1.66 | % | 1.77 | % |
Ratio of Net Investment Income to Average Net Assets | | 0.52 | %+ | 0.02 | %+ | 0.47 | % | 0.90 | % | 0.89 | % |
Portfolio Turnover Rate | | 96 | % | 101 | % | 82 | % | 59 | % | 73 | % |
† | Per share amount is based on average shares outstanding. |
‡ | Amount is less than $0.005 per share. |
++ | Calculated based on the net asset value as of the last business day of the period. |
+ | Reflects rebate of certain Portfolio expenses in connection with the investments in Morgan Stanley Institutional Liquidity Money Market Portfolio — Institutional Class during the period. As a result of such rebate, the expenses as a percentage of its net assets were effected by less than 0.005%. |
^^ | Effective November 1, 2004, the Adviser has voluntarily agreed to limit the ratio of expenses to average net assets to the maximum ratio of 1.90% for Class P shares. Prior to November 1, 2004, the maximum ratio was 2.00% for Class P shares. |
| The accompanying notes are an integral part of the financial statements. | 119 |
2008 Annual Report | |
| |
December 31, 2008 | |
Financial Highlights
Global Franchise Portfolio
| | Class I |
| | Year Ended December 31, |
Selected Per Share Data and Ratios | | 2008 | | 2007 | | 2006 | | 2005 | | 2004 | |
Net Asset Value, Beginning of Period | | $ 16.62 | | $ 17.98 | | $ 15.69 | | $ 15.12 | | $ 14.29 | |
Income (Loss) from Investment Operations | | | | | | | | | | | |
Net Investment Income† | | 0.35 | | 0.40 | | 0.30 | | 0.26 | | 0.27 | |
Net Realized and Unrealized Gain (Loss) on Investments | | (5.11 | ) | 1.30 | | 3.07 | | 1.52 | | 1.66 | |
Total from Investment Operations | | (4.76 | ) | 1.70 | | 3.37 | | 1.78 | | 1.93 | |
Distributions from and/or in Excess of: | | | | | | | | | | | |
Net Investment Income | | (0.84 | ) | (0.15 | ) | (0.13 | ) | (0.31 | ) | — | |
Net Realized Gain | | (0.20 | ) | (2.91 | ) | (0.95 | ) | (0.90 | ) | (1.13 | ) |
Total Distributions | | (1.04 | ) | (3.06 | ) | (1.08 | ) | (1.21 | ) | (1.13 | ) |
Redemption Fees | | — | | — | | 0.00 | ‡ | 0.00 | ‡ | 0.03 | |
Net Asset Value, End of Period | | $ 10.82 | | $ 16.62 | | $ 17.98 | | $ 15.69 | | $ 15.12 | |
Total Return++ | | (28.88 | )% | 9.58 | % | 21.60 | % | 11.91 | % | 13.77 | % |
Ratios and Supplemental Data: | | | | | | | | | | | |
Net Assets, End of Period (Thousands) | | $78,029 | | $110,135 | | $128,434 | | $85,018 | | $58,223 | |
Ratio of Expenses to Average Net Assets (1) | | 1.00 | %+ | 0.99 | %+ | 1.00 | % | 1.00 | % | 1.00 | % |
Ratio of Expenses to Average Net Assets Excluding Non Operating Expenses | | 1.00 | %+ | 0.98 | %+ | 1.00 | % | 1.00 | % | N/A | |
Ratio of Net Investment Income to Average Net Assets (1) | | 2.49 | %+ | 2.10 | %+ | 1.74 | % | 1.67 | % | 1.82 | % |
Portfolio Turnover Rate | | 31 | % | 22 | % | 35 | % | 19 | % | 21 | % |
(1) Supplemental Information on the Ratios to Average Net Assets: | | | | | | | | | | | |
Ratios before expense limitation: | | | | | | | | | | | |
Expenses to Average Net Assets | | 1.01 | %+ | N/A | | 1.01 | % | 1.07 | % | 1.16 | % |
Net Investment Income to Average Net Assets | | 2.48 | %+ | N/A | | 1.73 | % | 1.60 | % | 1.66 | % |
| | | | | | | | | | | |
| | Class P |
| | Year Ended December 31, |
Selected Per Share Data and Ratios | | 2008 | | 2007 | | 2006 | | 2005 | | 2004 | |
Net Asset Value, Beginning of Period | | $ 16.44 | | $ 17.82 | | $ 15.56 | | $ 15.01 | | $ 14.22 | |
Income (Loss) from Investment Operations | | | | | | | | | | | |
Net Investment Income† | | 0.34 | | 0.30 | | 0.24 | | 0.24 | | 0.22 | |
Net Realized and Unrealized Gain (Loss) on Investments | | (5.07 | ) | 1.34 | | 3.04 | | 1.48 | | 1.69 | |
Total from Investment Operations | | (4.73 | ) | 1.64 | | 3.28 | | 1.72 | | 1.91 | |
Distributions from and/or in Excess of: | | | | | | | | | | | |
Net Investment Income | | (0.80 | ) | (0.11 | ) | (0.07 | ) | (0.27 | ) | — | |
Net Realized Gain | | (0.20 | ) | (2.91 | ) | (0.95 | ) | (0.90 | ) | (1.13 | ) |
Total Distributions | | (1.00 | ) | (3.02 | ) | (1.02 | ) | (1.17 | ) | (1.13 | ) |
Redemption Fees | | — | | — | | 0.00 | ‡ | — | | 0.01 | |
Net Asset Value, End of Period | | $ 10.71 | | $ 16.44 | | $ 17.82 | | $ 15.56 | | $ 15.01 | |
Total Return++ | | (29.00 | )% | 9.26 | % | 21.31 | % | 11.53 | % | 13.56 | % |
Ratios and Supplemental Data: | | | | | | | | | | | |
Net Assets, End of Period (Thousands) | | $ 2,892 | | $ 6,327 | | $ 4,135 | | $ 4,401 | | $ 3,941 | |
Ratio of Expenses to Average Net Assets (1) | | 1.25 | %+ | 1.24 | %+ | 1.25 | % | 1.25 | % | 1.25 | % |
Ratio of Expenses to Average Net Assets Excluding Non Operating Expenses | | 1.25 | %+ | 1.23 | %+ | 1.25 | % | 1.25 | % | N/A | |
Ratio of Net Investment Income to Average Net Assets (1) | | 2.43 | %+ | 1.62 | %+ | 1.43 | % | 1.52 | % | 1.47 | % |
Portfolio Turnover Rate | | 31 | % | 22 | % | 35 | % | 19 | % | 21 | % |
(1) Supplemental Information on the Ratios to Average Net Assets: | | | | | | | | | | | |
Ratios before expense limitation: | | | | | | | | | | | |
Expenses to Average Net Assets | | 1.26 | %+ | N/A | | 1.26 | % | 1.32 | % | 1.41 | % |
Net Investment Income to Average Net Assets | | 2.42 | %+ | N/A | | 1.42 | % | 1.45 | % | 1.31 | % |
† | Per share amount is based on average shares outstanding. |
‡ | Amount is less than $0.005 per share. |
++ | Calculated based on the net asset value as of the last business day of the period. |
+ | Reflects rebate of certain Portfolio expenses in connection with the investments in Morgan Stanley Institutional Liquidity Money Market Portfolio — Institutional Class during the period. As a result of such rebate, the expenses as a percentage of its net assets were effected by approximately 0.01% and less than 0.005% for the years ended December 31, 2008 and December 31, 2007, respectively. |
120 | The accompanying notes are an integral part of the financial statements. | |
| 2008 Annual Report |
| |
| December 31, 2008 |
Financial Highlights
Global Real Estate Portfolio
| | Class I |
| | Year Ended December 31, | | Period from
August 30, 2006^ to |
Selected Per Share Data and Ratios | | 2008 | | 2007 | | December 31, 2006 |
Net Asset Value, Beginning of Period | | $ 10.04 | | $ 11.56 | | $ 10.00 | |
Income (Loss) from Investment Operations | | | | | | | |
Net Investment Income† | | 0.16 | | 0.18 | | 0.06 | |
Net Realized and Unrealized Gain (Loss) on Investments | | (4.67 | ) | (1.09 | ) | 1.66 | |
Total from Investment Operations | | (4.51 | ) | (0.91 | ) | 1.72 | |
Distributions from and/or in Excess of: | | | | | | | |
Net Investment Income | | (0.02 | ) | (0.40 | ) | (0.13 | ) |
Net Realized Gain | | (0.02 | ) | (0.21 | ) | (0.03 | ) |
Total Distributions | | (0.04 | ) | (0.61 | ) | (0.16 | ) |
Redemption Fees | | 0.00 | ‡ | 0.00 | ‡ | 0.00 | ‡ |
Net Asset Value, End of Period | | $5.49 | | $10.04 | | $11.56 | |
Total Return++ | | (45.00 | )% | 7.87 | % | 17.20 | %# |
Ratios and Supplemental Data: | | | | | | | |
Net Assets, End of Period (Thousands) | | $473,459 | | $632,737 | | $238,647 | |
Ratio of Expenses to Average Net Assets (1) | | 1.05 | %+ | 1.02 | %+ | 1.05 | %* |
Ratio of Expenses to Average Net Assets Excluding Non Operating Expenses | | 1.04 | %+ | 1.02 | %+ | N/A | |
Ratio of Net Investment Income to Average Net Assets (1) | | 1.92 | %+ | 1.55 | %+ | 1.53 | %* |
Portfolio Turnover Rate | | 40 | % | 39 | % | 4 | %# |
(1) Supplemental Information on the Ratios to Average Net Assets: | | | | | | | |
Ratios before expense limitation: | | | | | | | |
Expenses to Average Net Assets | | N/A | | N/A | | 1.15 | %* |
Net Investment Income to Average Net Assets | | N/A | | N/A | | 1.43 | %* |
| | | | | | | |
| | Class P |
| | Year Ended December 31, | | Period from
August 30, 2006^ to |
Selected Per Share Data and Ratios | | 2008 | | 2007 | | December 31, 2006 |
Net Asset Value, Beginning of Period | | $ 10.02 | | $ 11.56 | | $ 10.00 | |
Income (Loss) from Investment Operations | | | | | | | |
Net Investment Income† | | 0.16 | | 0.16 | | 0.04 | |
Net Realized and Unrealized Gain (Loss) on Investments | | (4.68 | ) | (1.11 | ) | 1.67 | |
Total from Investment Operations | | (4.52 | ) | (0.95 | ) | 1.71 | |
Distributions from and/or in Excess of: | | | | | | | |
Net Investment Income | | (0.01 | ) | (0.38 | ) | (0.12 | ) |
Net Realized Gain | | (0.02 | ) | (0.21 | ) | (0.03 | ) |
Total Distributions | | (0.03 | ) | (0.59 | ) | (0.15 | ) |
Redemption Fees | | 0.00 | ‡ | 0.00 | ‡ | 0.00 | ‡ |
Net Asset Value, End of Period | | $ 5.47 | | $ 10.02 | | $ 11.56 | |
Total Return++ | | (45.15 | )% | (8.15 | )% | 17.11 | %# |
Ratios and Supplemental Data: | | | | | | | |
Net Assets, End of Period (Thousands) | | $ 44,555 | | $ 13,187 | | $ 116 | |
Ratio of Expenses to Average Net Assets (1) | | 1.30 | %+ | 1.27 | %+ | 1.30 | %* |
Ratio of Expenses to Average Net Assets Excluding Non Operating Expenses | | 1.29 | %+ | 1.27 | %+ | N/A | |
Ratio of Net Investment Income to Average Net Assets (1) | | 2.32 | %+ | 1.39 | %+ | 1.07 | %* |
Portfolio Turnover Rate | | 40 | % | 39 | % | 4 | %# |
(1) Supplemental Information on the Ratios to Average Net Assets: | | | | | | | |
Ratios before expense limitation: | | | | | | | |
Expenses to Average Net Assets | | 1.32 | %+ | N/A | | 1.41 | %* |
Net Investment Income to Average Net Assets | | 2.30 | %+ | N/A | | 0.96 | %* |
^ | Commencement of Operations |
† | Per share amount is based on average shares outstanding. |
‡ | Amount is less than $0.005 per share. |
++ | Calculated based on the net asset value as of the last business day of the period. |
# | Not Annualized |
+ | Reflects rebate of certain Portfolio expenses in connection with the investments in Morgan Stanley Institutional Liquidity Money Market Portfolio — Institutional Class during the period. As a result of such rebate, the expenses as a percentage of its net assets were effected by less than 0.005%. |
* | Annualized |
| The accompanying notes are an integral part of the financial statements. | 121 |
2008 Annual Report | |
| |
December 31, 2008 | |
Financial Highlights
Global Real Estate Portfolio
| | Class H |
| | Period from |
| | January 2, 2008^ |
Selected Per Share Data and Ratios | | to December 31, 2008 |
Net Asset Value, Beginning of Period | | $ 9.95 | |
Income (Loss) from Investment Operations | | | |
Net Investment Income† | | 0.11 | |
Net Realized and Unrealized Loss on Investments | | (4.57 | ) |
Total from Investment Operations | | (4.46 | ) |
Distributions from and/or in Excess of: | | | |
Net Realized Gain | | (0.02 | ) |
Net Asset Value, End of Period | | $ 5.47 | |
Total Return++ | | (44.88 | )%# |
Ratios and Supplemental Data: | | | |
Net Assets, End of Period (Thousands) | | $ 391 | |
Ratio of Expenses to Average Net Assets (1) | | 1.70 | %*+ |
Ratio of Expenses to Average Net Assets Excluding Non Operating Expenses (1) | | 1.29 | %*+ |
Ratio of Net Investment Income to Average Net Assets (1) | | 1.42 | %*+ |
Portfolio Turnover Rate | | 40 | % |
(1) Supplemental Information on the Ratios to Average Net Assets: | | | |
Ratios before expense limitation: | | | |
Expenses to Average Net Assets | | 1.70 | %*+ |
Net Investment Income to Average Net Assets | | 1.42 | %*+ |
^ | Commencement of Operations |
† | Per share amount is based on average shares outstanding. |
++ | Calculated based on the net asset value which does not reflect sales charges, if applicable, as of the last business day of the period. |
# | Not Annualized |
* | Annualized |
+ | Reflects rebate of certain Portfolio expenses in connection with the investments in Morgan Stanley Institutional Liquidity Money Market Portfolio — Institutional Class during the period. As a result of such rebate, the expenses as a percentage of its net assets were effected by less than 0.005%. |
122 | The accompanying notes are an integral part of the financial statements. | |
| 2008 Annual Report |
| |
| December 31, 2008 |
Financial Highlights
Global Real Estate Portfolio
| | Class L |
| | Period from |
| | June 16, 2008^ |
Selected Per Share Data and Ratios | | to December 31, 2008 |
Net Asset Value, Beginning of Period | | $ 9.46 | |
Income (Loss) from Investment Operations | | | |
Net Investment Income† | | 0.04 | |
Net Realized and Unrealized Loss on Investments | | (4.05 | ) |
Total from Investment Operations | | (4.01 | ) |
Distributions from and/or in Excess of: | | | |
Net Realized Gain | | (0.02 | ) |
Net Asset Value, End of Period | | $ 5.43 | |
Total Return++ | | (42.45 | )%# |
Ratios and Supplemental Data: | | | |
Net Assets, End of Period (Thousands) | | $ 261 | |
Ratio of Expenses to Average Net Assets (1) | | 1.81 | %*+ |
Ratio of Expenses to Average Net Assets Excluding Non Operating Expenses | | 1.80 | %*+ |
Ratio of Net Investment Income to Average Net Assets (1) | | 1.20 | %*+ |
Portfolio Turnover Rate | | 40 | % |
(1) Supplemental Information on the Ratios to Average Net Assets: | | | |
Ratios before expense limitation: | | | |
Expenses to Average Net Assets | | 1.84 | %*+ |
Net Investment Income to Average Net Assets | | 1.17 | %*+ |
^ | Commencement of Operations |
† | Per share amount is based on average shares outstanding. |
++ | Calculated based on the net asset value as of the last business day of the period. |
# | Not Annualized |
* | Annualized |
+ | Reflects rebate of certain Portfolio expenses in connection with the investments in Morgan Stanley Institutional Liquidity Money Market Portfolio — Institutional Class during the period. As a result of such rebate, the expenses as a percentage of its net assets were effected by less than 0.005%. |
| The accompanying notes are an integral part of the financial statements. | 123 |
2008 Annual Report | |
| |
December 31, 2008 | |
Financial Highlights
Global Value Equity Portfolio
| | Class I |
| | Year Ended December 31, |
Selected Per Share Data and Ratios | | 2008 | | 2007 | | 2006 | | 2005 | | 2004 | |
Net Asset Value, Beginning of Period | | $ 17.70 | | $ 20.24 | | $ 17.85 | | $ 17.81 | | $ 15.84 | |
Income (Loss) from Investment Operations | | | | | | | | | | | |
Net Investment Income† | | 0.40 | | 0.33 | | 0.33 | | 0.31 | | 0.22 | |
Net Realized and Unrealized Gain (Loss) on Investments | | (7.74 | ) | 0.96 | | 3.44 | | 0.72 | | 2.02 | |
Total from Investment Operations | | (7.34 | ) | 1.29 | | 3.77 | | 1.03 | | 2.24 | |
Distributions from and/or in Excess of: | | | | | | | | | | | |
Net Investment Income | | (0.66 | ) | (0.34 | ) | (0.34 | ) | (0.31 | ) | (0.22 | ) |
Net Realized Gain | | (0.21 | ) | (3.49 | ) | (1.05 | ) | (0.68 | ) | (0.05 | ) |
Total Distributions | | (0.87 | ) | (3.83 | ) | (1.39 | ) | (0.99 | ) | (0.27 | ) |
Redemption Fees | | 0.00 | ‡ | 0.00 | ‡ | 0.01 | | 0.00 | ‡ | 0.00 | ‡ |
Net Asset Value, End of Period | | $ 9.49 | | $ 17.70 | | $ 20.24 | | $ 17.85 | | $ 17.81 | |
Total Return++ | | (41.82 | )% | 6.65 | % | 21.40 | % | 5.81 | % | 14.13 | % |
Ratios and Supplemental Data: | | | | | | | | | | | |
Net Assets, End of Period (Thousands) | | $24,110 | | $66,035 | | $101,163 | | $86,000 | | $68,505 | |
Ratio of Expenses to Average Net Assets (1) | | 1.00 | %+ | 0.90 | %+ | 0.91 | % | 0.90 | % | 1.00 | % |
Ratio of Expenses to Average Net Assets Excluding Non Operating Expenses | | 1.00 | %+ | 0.90 | %+ | N/A | | N/A | | 1.00 | % |
Ratio of Net Investment Income to Average Net Assets (1) | | 2.82 | %+ | 1.58 | %+ | 1.71 | % | 1.74 | % | 1.31 | % |
Portfolio Turnover Rate | | 86 | % | 31 | % | 29 | % | 29 | % | 30 | % |
(1) Supplemental Information on the Ratios to Average Net Assets: | | | | | | | | | | | |
Ratios before expense limitation: | | | | | | | | | | | |
Expenses to Average Net Assets | | 1.02 | %+ | N/A | | N/A | | N/A | | 1.07 | % |
Net Investment Income to Average Net Assets | | 2.80 | %+ | N/A | | N/A | | N/A | | 1.24 | % |
| | | | | | | | | | | |
| | Class P | |
| | Year Ended December 31, | |
Selected Per Share Data and Ratios | | 2008 | | 2007 | | 2006 | | 2005 | | 2004 | |
Net Asset Value, Beginning of Period | | $ 17.48 | | $ 20.03 | | $ 17.69 | | $ 17.64 | | $ 15.70 | |
Income (Loss) from Investment Operations | | | | | | | | | | | |
Net Investment Income† | | 0.38 | | 0.29 | | 0.28 | | 0.27 | | 0.17 | |
Net Realized and Unrealized Gain (Loss) on Investments | | (7.66 | ) | 0.93 | | 3.40 | | 0.71 | | 2.00 | |
Total from Investment Operations | | (7.28 | ) | 1.22 | | 3.68 | | 0.98 | | 2.17 | |
Distributions from and/or in Excess of: | | | | | | | | | | | |
Net Investment Income | | (0.62 | ) | (0.28 | ) | (0.29 | ) | (0.25 | ) | (0.18 | ) |
Net Realized Gain | | (0.21 | ) | (3.49 | ) | (1.05 | ) | (0.68 | ) | (0.05 | ) |
Total Distributions | | (0.83 | ) | (3.77 | ) | (1.34 | ) | (0.93 | ) | (0.23 | ) |
Redemption Fees | | 0.00 | ‡ | 0.00 | ‡ | 0.00 | ‡ | 0.00 | ‡ | 0.00 | ‡ |
Net Asset Value, End of Period | | $ 9.37 | | $ 17.48 | | $ 20.03 | | $ 17.69 | | $ 17.64 | |
Total Return++ | | (41.98 | )% | 6.37 | % | 21.05 | % | 5.59 | % | 13.78 | % |
Ratios and Supplemental Data: | | | | | | | | | | | |
Net Assets, End of Period (Thousands) | | $11,888 | | $24,199 | | $27,773 | | $21,938 | | $30,598 | |
Ratio of Expenses to Average Net Assets (1) | | 1.25 | %+ | 1.15 | %+ | 1.16 | % | 1.15 | % | 1.25 | % |
Ratio of Expenses to Average Net Assets Excluding Non Operating Expenses | | 1.25 | %+ | 1.15 | %+ | N/A | | N/A | | 1.25 | % |
Ratio of Net Investment Income to Average Net Assets (1) | | 2.65 | %+ | 1.36 | %+ | 1.47 | % | 1.53 | % | 1.07 | % |
Portfolio Turnover Rate | | 86 | % | 31 | % | 29 | % | 29 | % | 30 | % |
(1) Supplemental Information on the Ratios to Average Net Assets: | | | | | | | | | | | |
Ratios before expense limitation: | | | | | | | | | | | |
Expenses to Average Net Assets | | 1.27 | %+ | N/A | | N/A | | N/A | | 1.32 | % |
Net Investment Income to Average Net Assets | | 2.63 | %+ | N/A | | N/A | | N/A | | 0.99 | % |
† | Per share amount is based on average shares outstanding. |
‡ | Amount is less than $0.005 per share. |
++ | Calculated based on the net asset value as of the last business day of the period. |
+ | Reflects rebate of certain Portfolio expenses in connection with the investments in Morgan Stanley Institutional Liquidity Money Market Portfolio — Institutional Class during the period. As a result of such rebate, the expenses as a percentage of its net assets were effected by less than 0.005%. |
124 | The accompanying notes are an integral part of the financial statements. | |
| 2008 Annual Report |
| |
| December 31, 2008 |
Financial Highlights
International Equity Portfolio
| | Class I |
| | Year Ended December 31, |
Selected Per Share Data and Ratios | | 2008 | | 2007 | | 2006 | | 2005 | | 2004 | |
Net Asset Value, Beginning of Period | | $ 18.92 | | $ 20.58 | | $ 20.34 | | $ 20.99 | | $ 19.06 | |
Income (Loss) from Investment Operations | | | | | | | | | | | |
Net Investment Income† | | 0.44 | | 0.43 | | 0.64 | | 0.43 | | 0.30 | |
Net Realized and Unrealized Gain (Loss) on Investments | | (6.76 | ) | 1.53 | | 3.93 | | 0.93 | | 3.50 | |
Total from Investment Operations | | (6.32 | ) | 1.96 | | 4.57 | | 1.36 | | 3.80 | |
Distributions from and/or in Excess of: | | | | | | | | | | | |
Net Investment Income | | (0.41 | ) | (0.46 | ) | (0.59 | ) | (0.35 | ) | (0.37 | ) |
Net Realized Gain | | (1.18 | ) | (3.16 | ) | (3.74 | ) | (1.66 | ) | (1.50 | ) |
Total Distributions | | (1.59 | ) | (3.62 | ) | (4.33 | ) | (2.01 | ) | (1.87 | ) |
Redemption Fees | | 0.00 | ‡ | 0.00 | ‡ | 0.00 | ‡ | 0.00 | ‡ | 0.00 | ‡ |
Net Asset Value, End of Period | | $ 11.01 | | $ 18.92 | | $ 20.58 | | $ 20.34 | | $ 20.99 | |
Total Return++ | | (33.12 | )% | 9.84 | % | 22.50 | % | 6.45 | % | 19.96 | % |
Ratios and Supplemental Data: | | | | | | | | | | | |
Net Assets, End of Period (Thousands) | | $2,606,704 | | $5,105,807 | | $5,900,906 | | $6,704,732 | | $7,200,606 | |
Ratio of Expenses to Average Net Assets | | 0.95 | %+ | 0.93 | %+ | 0.94 | % | 0.93 | % | 0.98 | % |
Ratio of Expenses to Average Net Assets Excluding Non Operating Expenses | | 0.95 | %+ | 0.93 | %+ | 0.94 | % | 0.93 | % | N/A | |
Ratio of Net Investment Income to Average Net Assets | | 2.73 | %+ | 1.97 | %+ | 2.88 | % | 2.04 | % | 1.48 | % |
Portfolio Turnover Rate | | 34 | % | 31 | % | 38 | % | 28 | % | 41 | % |
| | | | | | | | | | | |
| | Class P |
| | Year Ended December 31, |
Selected Per Share Data and Ratios | | 2008 | | 2007 | | 2006 | | 2005 | | 2004 | |
Net Asset Value, Beginning of Period | | $ 18.73 | | $ 20.40 | | $ 20.19 | | $ 20.85 | | $ 18.96 | |
Income (Loss) from Investment Operations | | | | | | | | | | | |
Net Investment Income† | | 0.38 | | 0.37 | | 0.60 | | 0.37 | | 0.24 | |
Net Realized and Unrealized Gain (Loss) on Investments | | (6.66 | ) | 1.52 | | 3.87 | | 0.93 | | 3.47 | |
Total from Investment Operations | | (6.28 | ) | 1.89 | | 4.47 | | 1.30 | | 3.71 | |
Distributions from and/or in Excess of: | | | | | | | | | | | |
Net Investment Income | | (0.37 | ) | (0.40 | ) | (0.52 | ) | (0.30 | ) | (0.32 | ) |
Net Realized Gain | | (1.18 | ) | (3.16 | ) | (3.74 | ) | (1.66 | ) | (1.50 | ) |
Total Distributions | | (1.55 | ) | (3.56 | ) | (4.26 | ) | (1.96 | ) | (1.82 | ) |
Redemption Fees | | 0.00 | ‡ | 0.00 | ‡ | 0.00 | ‡ | 0.00 | ‡ | 0.00 | ‡ |
Net Asset Value, End of Period | | $ 10.90 | | $ 18.73 | | $ 20.40 | | $ 20.19 | | $ 20.85 | |
Total Return++ | | (33.21 | )% | 9.52 | % | 22.21 | % | 6.20 | % | 19.67 | % |
Ratios and Supplemental Data: | | | | | | | | | | | |
Net Assets, End of Period (Thousands) | | $ 687,196 | | $1,019,595 | | $1,152,822 | | $1,206,125 | | $1,073,278 | |
Ratio of Expenses to Average Net Assets | | 1.20 | %+ | 1.18 | %+ | 1.19 | % | 1.18 | % | 1.23 | % |
Ratio of Expenses to Average Net Assets Excluding Non Operating Expenses | | 1.20 | %+ | 1.18 | %+ | 1.19 | % | 1.18 | % | N/A | |
Ratio of Net Investment Income to Average Net Assets | | 2.43 | %+ | 1.71 | %+ | 2.71 | % | 1.77 | % | 1.21 | % |
Portfolio Turnover Rate | | 34 | % | 31 | % | 38 | % | 28 | % | 41 | % |
† | Per share amount is based on average shares outstanding. |
‡ | Amount is less than $0.005 per share. |
++ | Calculated based on the net asset value as of the last business day of the period. |
+ | Reflects rebate of certain Portfolio expenses in connection with the investments in Morgan Stanley Institutional Liquidity Money Market Portfolio �� Institutional Class during the period. As a result of such rebate, the expenses as a percentage of its net assets were effected by less than 0.005%. |
| The accompanying notes are an integral part of the financial statements. | 125 |
2008 Annual Report | |
| |
December 31, 2008 | |
Financial Highlights
International Growth Active Extension Portfolio
| | Class I |
| | Year Ended | | Period from |
| | December 31, | | July 31, 2007^ to |
Selected Per Share Data and Ratios | | 2008 | | December 31, 2007 |
Net Asset Value, Beginning of Period | | $ 10.66 | | $ 10.00 | |
Income (Loss) from Investment Operations | | | | | |
Net Investment Income (Loss)† | | 0.14 | | (0.02 | ) |
Net Realized and Unrealized Gain (Loss) on Investments | | (5.92 | ) | 0.68 | |
Total from Investment Operations | | (5.78 | ) | 0.66 | |
Distributions from and/or in Excess of: | | | | | |
Net Investment Income | | (0.14 | ) | — | |
Total Distributions | | (0.14 | ) | — | |
Net Asset Value, End of Period | | $ 4.74 | | $ 10.66 | |
Total Return++ | | (54.13 | )% | 6.60 | %# |
Ratios and Supplemental Data: | | | | | |
Net Assets, End of Period (Thousands) | | $ 4,697 | | $10,553 | |
Ratio of Expenses to Average Net Assets (1) | | 2.89 | %+ | 2.17 | %*+ |
Ratio of Expenses to Average Net Assets Excluding Non Operating Expenses | | 1.25 | %+ | 1.25 | %*+ |
Ratio of Net Investment Income (Loss) to Average Net Assets (1) | | 1.69 | %+ | (0.52 | )%*+ |
Portfolio Turnover Rate | | 51 | % | 20 | %# |
(1) Supplemental Information on the Ratios to Average Net Assets: | | | | | |
Ratios before expense limitation: | | | | | |
Expenses to Average Net Assets | | 4.77 | %+ | 3.84 | %*+ |
Net Investment Loss to Average Net Assets | | (0.19 | )%+ | (2.19 | )%*+ |
| | | | | |
| | Class P |
| | Year Ended | | Period from |
| | December 31, | | July 31, 2007^ to |
Selected Per Share Data and Ratios | | 2008 | | December 31, 2007 |
Net Asset Value, Beginning of Period | | $ 10.65 | | $ 10.00 | |
Income (Loss) from Investment Operations | | | | | |
Net Investment Income (Loss)† | | 0.12 | | (0.03 | ) |
Net Realized and Unrealized Gain (Loss) on Investments | | (5.92 | ) | 0.68 | |
Total from Investment Operations | | (5.80 | ) | 0.65 | |
Distributions from and/or in Excess of: | | | | | |
Net Investment Income | | (0.12 | ) | — | |
Total Distributions | | (0.12 | ) | — | |
Net Asset Value, End of Period | | $ 4.73 | | $ 10.65 | |
Total Return++ | | (54.48 | )% | 6.50 | %# |
Ratios and Supplemental Data: | | | | | |
Net Assets, End of Period (Thousands) | | $ 47 | | $ 106 | |
Ratio of Expenses to Average Net Assets (1) | | 3.15 | %+ | 2.42 | %*+ |
Ratio of Expenses to Average Net Assets Excluding Non Operating Expenses | | 1.50 | %+ | 1.50 | %*+ |
Ratio of Net Investment Income (Loss) to Average Net Assets (1) | | 1.43 | %+ | (0.77 | )%*+ |
Portfolio Turnover Rate | | 51 | % | 20 | %# |
(1) Supplemental Information on the Ratios to Average Net Assets: | | | | | |
Ratios before expense limitation: | | | | | |
Expenses to Average Net Assets | | 5.01 | %+ | 4.09 | %*+ |
Net Investment Loss to Average Net Assets | | (0.40 | )%+ | (2.44 | )%*+ |
| | | | | | |
^ | Commencement of Operations |
† | Per share amount is based on average shares outstanding. |
++ | Calculated based on the net asset value as of the last business day of the period. |
# | Not Annualized |
+ | Reflects rebate of certain Portfolio expenses in connection with the investments in Morgan Stanley Institutional Liquidity Money Market Portfolio — Institutional Class during the period. As a result of such rebate, the expenses as a percentage of its net assets were effected by less than 0.005%. |
* | Annualized |
126 | The accompanying notes are an integral part of the financial statements. | |
| 2008 Annual Report |
| |
| December 31, 2008 |
Financial Highlights
International Growth Active Extension Portfolio
| | Class H |
| | Period from |
| | January 2, 2008^ |
Selected Per Share Data and Ratios | | to December 31, 2008 |
Net Asset Value, Beginning of Period | | $ 10.60 | |
Income (Loss) from Investment Operations | | | |
Net Investment Loss† | | (0.01 | ) |
Net Realized and Unrealized Loss on Investments | | (5.76 | ) |
Total from Investment Operations | | (5.77 | ) |
Distributions from and/or in Excess of: | | | |
Net Investment Income | | (0.10 | ) |
Total Distributions | | (0.10 | ) |
Net Asset Value, End of Period | | $ 4.73 | |
Total Return++ | | (54.42 | )%# |
Ratios and Supplemental Data: | | | |
Net Assets, End of Period (Thousands) | | $ 266 | |
Ratio of Expenses to Average Net Assets (1) | | 3.40 | %*+ |
Ratio of Expenses to Average Net Assets Excluding Non Operating Expenses | | 1.50 | %*+ |
Ratio of Net Investment Loss to Average Net Assets (1) | | (0.12 | )%*+ |
Portfolio Turnover Rate | | 51 | %# |
(1) Supplemental Information on the Ratios to Average Net Assets: | | | |
Ratios before expense limitation: | | | |
Expenses to Average Net Assets | | 5.21 | %*+ |
Net Investment Loss to Average Net Assets | | (1.93 | )%*+ |
^ | Commencement of Operations |
† | Per share amount is based on average shares outstanding. |
++ | Calculated based on the net asset value which does not reflect sales charges, if applicable, as of the last business day of the period. |
# | Not Annualized |
* | Annualized |
+ | Reflects rebate of certain Portfolio expenses in connection with the investments in Morgan Stanley Institutional Liquidity Money Market Portfolio — Institutional Class during the period. As a result of such rebate, the expenses as a percentage of its net assets were effected by less than 0.005%. |
| The accompanying notes are an integral part of the financial statements. | 127 |
2008 Annual Report | |
| |
December 31, 2008 | |
Financial Highlights
International Growth Active Extension Portfolio
| | Class L |
| | Period from |
| | June 16, 2008^ |
Selected Per Share Data and Ratios | | to December 31, 2008 |
Net Asset Value, Beginning of Period | | $ 9.84 | |
Income (Loss) from Investment Operations | | | |
Net Investment Loss† | | (0.06 | ) |
Net Realized and Unrealized Loss on Investments | | (4.96 | ) |
Total from Investment Operations | | (5.02 | ) |
Distributions from and/or in Excess of: | | | |
Net Investment Income | | (0.12 | ) |
Total Distributions | | (0.12 | ) |
Net Asset Value, End of Period | | $ 4.70 | |
Total Return++ | | (50.96 | )%# |
Ratios and Supplemental Data: | | | |
Net Assets, End of Period (Thousands) | | $ 19 | |
Ratio of Expenses to Average Net Assets (1) | | 3.19 | %*+ |
Ratio of Expenses to Average Net Assets Excluding Non Operating Expenses | | 2.00 | %*+ |
Ratio of Net Investment Loss to Average Net Assets (1) | | (1.70 | )%*+ |
Portfolio Turnover Rate | | 51 | %# |
(1) Supplemental Information on the Ratios to Average Net Assets: | | | |
Ratios before expense limitation: | | | |
Expenses to Average Net Assets | | 4.99 | %*+ |
Net Investment Loss to Average Net Assets | | (3.51 | )%*+ |
^ | Commencement of Operations |
† | Per share amount is based on average shares outstanding. |
++ | Calculated based on the net asset value as of the last business day of the period. |
# | Not Annualized |
* | Annualized |
+ | Reflects rebate of certain Portfolio expenses in connection with the investments in Morgan Stanley Institutional Liquidity Money Market Portfolio — Institutional Class during the period. As a result of such rebate, the expenses as a percentage of its net assets were effected by less than 0.005%. |
128 | The accompanying notes are an integral part of the financial statements. | |
| 2008 Annual Report |
| |
| December 31, 2008 |
Financial Highlights
International Growth Equity Portfolio
| | Class I |
| | | | | | | | Period from |
| | Year Ended December 31, | | December 27, 2005^ to |
Selected Per Share Data and Ratios | | 2008 | | 2007 | | 2006 | | December 31, 2005 |
Net Asset Value, Beginning of Period | | $ | 13.76 | | $ | 12.55 | | $ | 9.93 | | $ | 10.00 | |
Income (Loss) from Investment Operations | | | | | | | | | |
Net Investment Income† | | 0.31 | | 0.13 | | 0.10 | | 0.00 | ‡ |
Net Realized and Unrealized Gain (Loss) on Investments | | (6.98 | ) | 1.75 | | 2.67 | | (0.07 | ) |
Total from Investment Operations | | (6.67 | ) | 1.88 | | 2.77 | | (0.07 | ) |
Distributions from and/or in Excess of: | | | | | | | | | |
Net Investment Income | | (0.32 | ) | (0.12 | ) | (0.09 | ) | — | |
Net Realized Gain | | (0.05 | ) | (0.55 | ) | (0.06 | ) | — | |
Total Distributions | | (0.37 | ) | (0.67 | ) | (0.15 | ) | — | |
Net Asset Value, End of Period | | $ | 6.72 | | $ | 13.76 | | $ | 12.55 | | $ | 9.93 | |
Total Return++ | | (48.70 | )% | 15.22 | % | 27.92 | % | (0.70 | )%# |
Ratios and Supplemental Data: | | | | | | | | | |
Net Assets, End of Period (Thousands) | | $ | 40,756 | | $ | 22,523 | | $ | 6,753 | | $ | 4,864 | |
Ratio of Expenses to Average Net Assets (1) | | 1.00 | %+ | 1.00 | %+ | 1.01 | % | 1.00 | %* |
Ratio of Expenses to Average Net Assets Excluding Non Operating Expenses | | 1.00 | %+ | 1.00 | %+ | 1.00 | % | N/A | |
Ratio of Net Investment Income (Loss) to Average Net Assets (1) | | 2.86 | %+ | 0.94 | %+ | 0.89 | % | (0.86 | )%* |
Portfolio Turnover Rate | | 49 | % | 32 | % | 24 | % | 4 | %# |
(1) Supplemental Information on the Ratios to Average Net Assets: | | | | | | | | | |
Ratios before expense limitation: | | | | | | | | | |
Expenses to Average Net Assets | | 1.11 | %+ | 2.42 | %+ | 2.74 | % | 31.60 | %* |
Net Investment Income (Loss) to Average Net Assets | | 2.75 | %+ | (0.48 | )%+ | (0.84 | )% | (31.46 | )%* |
| | | | | | | | | |
| | Class P |
| | | | Period from |
| | Year Ended December 31, | | December 27, 2005^ to |
Selected Per Share Data and Ratios | | 2008 | | 2007 | | 2006 | | December 31, 2005 |
Net Asset Value, Beginning of Period | | $ | 13.78 | | $ | 12.56 | | $ | 9.93 | | $ | 10.00 | |
Income (Loss) from Investment Operations | | | | | | | | | |
Net Investment Income† | | 0.30 | | 0.10 | | 0.09 | | 0.00 | ‡ |
Net Realized and Unrealized Gain (Loss) on Investments | | (7.00 | ) | 1.76 | | 2.64 | | (0.07 | ) |
Total from Investment Operations | | (6.70 | ) | 1.86 | | 2.73 | | (0.07 | ) |
Distributions from and/or in Excess of: | | | | | | | | | |
Net Investment Income | | (0.29 | ) | (0.09 | ) | (0.04 | ) | — | |
Net Realized Gain | | (0.05 | ) | (0.55 | ) | (0.06 | ) | — | |
Total Distributions | | (0.34 | ) | (0.64 | ) | (0.10 | ) | — | |
Net Asset Value, End of Period | | $ | 6.74 | | $ | 13.78 | | $ | 12.56 | | $ | 9.93 | |
Total Return++ | | (48.82 | )% | 15.03 | % | 27.49 | % | (0.70 | )%# |
Ratios and Supplemental Data: | | | | | | | | | |
Net Assets, End of Period (Thousands) | | $ | 237 | | $ | 531 | | $ | 325 | | $ | 99 | |
Ratio of Expenses to Average Net Assets (1) | | 1.25 | %+ | 1.25 | +% | 1.27 | % | 1.25 | %* |
Ratio of Expenses to Average Net Assets Excluding Non Operating Expenses | | 1.25 | %+ | 1.25 | %+ | 1.25 | % | N/A | |
Ratio of Net Investment Income (Loss) to Average Net Assets (1) | | 2.72 | %+ | 0.70 | %+ | 0.78 | % | (1.16 | )%* |
Portfolio Turnover Rate | | 49 | % | 32 | % | 24 | % | 4 | %# |
(1) Supplemental Information on the Ratios to Average Net Assets: | | | | | | | | | |
Ratios before expense limitation: | | | | | | | | | |
Expenses to Average Net Assets | | 1.36 | %+ | 2.67 | %+ | 3.07 | % | 31.85 | %* |
Net Investment Income (Loss) to Average Net Assets | | 2.61 | %+ | (0.72 | )%+ | (1.02 | )% | (31.76 | )%* |
| | | | | | | | | | | | | | | | | | | |
^ | Commencement of Operations |
† | Per share amount is based on average shares outstanding. |
‡ | Amount is less than $0.005 per share. |
++ | Calculated based on the net asset value as of the last business day of the period. |
# | Not Annualized |
+ | Reflects rebate of certain Portfolio expenses in connection with the investments in Morgan Stanley Institutional Liquidity Money Market Portfolio — Institutional Class during the period. As a result of such rebate, the expenses as a percentage of its net assets were effected by less than 0.005%. |
* | Annualized |
| The accompanying notes are an integral part of the financial statements. | 129 |
2008 Annual Report | |
| |
December 31, 2008 | |
Financial Highlights
International Real Estate Portfolio
| | Class I |
| | Year Ended December 31, |
Selected Per Share Data and Ratios | | 2008 | | 2007 | | 2006 | | 2005 | | 2004 | |
Net Asset Value, Beginning of Period | | $ | 25.30 | | $ | 34.82 | | $ | 23.63 | | $ | 21.95 | | $ | 15.13 | |
Income (Loss) from Investment Operations | | | | | | | | | | | |
Net Investment Income† | | 0.56 | | 0.69 | | 0.35 | | 0.43 | | 0.36 | |
Net Realized and Unrealized Gain (Loss) on Investments | | (13.15 | ) | (6.79 | ) | 12.78 | | 2.96 | | 6.82 | |
Total from Investment Operations | | (12.59 | ) | (6.10 | ) | 13.13 | | 3.39 | | 7.18 | |
Distributions from and/or in Excess of: | | | | | | | | | | | |
Net Investment Income | | — | | (1.77 | ) | (0.85 | ) | (0.35 | ) | (0.36 | ) |
Net Realized Gain | | (0.12 | ) | (1.65 | ) | (1.09 | ) | (1.36 | ) | — | |
Total Distributions | | (0.12 | ) | (3.42 | ) | (1.94 | ) | (1.71 | ) | (0.36 | ) |
Redemption Fees | | 0.00 | ‡ | 0.00 | ‡ | 0.00 | ‡ | 0.00 | ‡ | 0.00 | ‡ |
Net Asset Value, End of Period | | $ | 12.59 | | $ | 25.30 | | $ | 34.82 | | $ | 23.63 | | $ | 21.95 | |
Total Return++ | | (49.95 | )% | (17.59 | )% | 56.06 | % | 15.52 | % | 47.49 | % |
Ratios and Supplemental Data: | | | | | | | | | | | |
Net Assets, End of Period (Thousands) | | $ | 427,148 | | $ | 1,053,018 | | $ | 1,125,569 | | $ | 250,511 | | $ | 50,620 | |
Ratio of Expenses to Average Net Assets (1) | | 0.95 | %+ | 0.94 | %+ | 0.95 | % | 1.00 | % | 1.00 | % |
Ratio of Expenses to Average Net Assets Excluding Non Operating Expenses | | 0.94 | %+ | 0.94 | %+ | 0.95 | % | 1.00 | % | 1.00 | % |
Ratio of Net Investment Income to Average Net Assets (1) | | 2.68 | %+ | 2.10 | %+ | 1.19 | % | 1.88 | % | 2.05 | % |
Portfolio Turnover Rate | | 54 | % | 55 | % | 36 | % | 57 | % | 42 | % |
(1) Supplemental Information on the Ratios to Average Net Assets: | | | | | | | | | | | |
Ratios before expense limitation: | | | | | | | | | | | |
Expenses to Average Net Assets | | 0.97 | %+ | N/A | | N/A | | 1.11 | % | 1.38 | % |
Net Investment Income to Average Net Assets | | 2.66 | %+ | N/A | | N/A | | 1.77 | % | 1.67 | % |
| | | | | | | | | | | |
| | Class P |
| | Year Ended December 31, |
Selected Per Share Data and Ratios | | 2008 | | 2007 | | 2006 | | 2005 | | 2004 | |
Net Asset Value, Beginning of Period | | $ | 25.33 | | $ | 34.83 | | $ | 23.68 | | $ | 22.04 | | $ | 15.17 | |
Income (Loss) from Investment Operations | | | | | | | | | | | |
Net Investment Income† | | 0.63 | | 0.58 | | 0.29 | | 0.32 | | 0.35 | |
Net Realized and Unrealized Gain (Loss) on Investments | | (13.26 | ) | (6.74 | ) | 12.77 | | 3.01 | | 6.81 | |
Total from Investment Operations | | (12.63 | ) | (6.16 | ) | 13.06 | | 3.33 | | 7.16 | |
Distributions from and/or in Excess of: | | | | | | | | | | | |
Net Investment Income | | — | | (1.69 | ) | (0.82 | ) | (0.33 | ) | (0.29 | ) |
Net Realized Gain | | (0.12 | ) | (1.65 | ) | (1.09 | ) | (1.36 | ) | — | |
Total Distributions | | (0.12 | ) | (3.34 | ) | (1.91 | ) | (1.69 | ) | (0.29 | ) |
Redemption Fees | | 0.00 | ‡ | 0.00 | ‡ | 0.00 | ‡ | — | | — | |
Net Asset Value, End of Period | | $ | 12.58 | | $ | 25.33 | | $ | 34.83 | | $ | 23.68 | | $ | 22.04 | |
Total Return++ | | (50.05 | )% | (17.76 | )% | 55.69 | % | 15.22 | % | 47.15 | % |
Ratios and Supplemental Data: | | | | | | | | | | | |
Net Assets, End of Period (Thousands) | | $ | 9,141 | | $ | 97,800 | | $ | 97,951 | | $ | 8,674 | | $ | 827 | |
Ratio of Expenses to Average Net Assets (1) | | 1.19+ | % | 1.19 | %+ | 1.20 | % | 1.25 | % | 1.25 | % |
Ratio of Expenses to Average Net Assets Excluding Non Operating Expenses | | 1.19 | %+ | 1.19 | %+ | 1.20 | % | 1.25 | % | 1.25 | % |
Ratio of Net Investment Income to Average Net Assets (1) | | 2.66 | %+ | 1.76 | %+ | 0.94 | % | 1.34 | % | 2.03 | % |
Portfolio Turnover Rate | | 54 | % | 55 | % | 36 | % | 57 | % | 42 | % |
(1) Supplemental Information on the Ratios to Average Net Assets: | | | | | | | | | | | |
Ratios before expense limitation: | | | | | | | | | | | |
Expenses to Average Net Assets | | 1.22 | %+ | N/A | | N/A | | 1.45 | % | 1.66 | % |
Net Investment Income to Average Net Assets | | 2.64 | %+ | N/A | | N/A | | 1.14 | % | 1.62 | % |
† | Per share amount is based on average shares outstanding. |
‡ | Amount is less than $0.005 per share. |
++ | Calculated based on the net asset value as of the last business day of the period. |
+ | Reflects rebate of certain Portfolio expenses in connection with the investments in Morgan Stanley Institutional Liquidity Money Market Portfolio — Institutional Class during the period. As a result of such rebate, the expenses as a percentage of its net assets were effected by less than 0.005%. |
130 | The accompanying notes are an integral part of the financial statements. | |
| 2008 Annual Report |
| |
| December 31, 2008 |
Financial Highlights
International Small Cap Portfolio
| | Class I |
| | Year Ended December 31, |
Selected Per Share Data and Ratios | | 2008 | | 2007 | | 2006 | | 2005 | | 2004 | |
Net Asset Value, Beginning of Period | | $ | 17.08 | | $ | 23.72 | | $ | 24.14 | | $ | 25.11 | | $ | 20.52 | |
Income (Loss) from Investment Operations | | | | | | | | | | | |
Net Investment Income† | | 0.34 | | 0.27 | | 0.32 | | 0.32 | | 0.24 | |
Net Realized and Unrealized Gain (Loss) on Investments | | (6.66 | ) | (1.11 | ) | 4.27 | | 2.89 | | 6.59 | |
Total from Investment Operations | | (6.32 | ) | (0.84 | ) | 4.59 | | 3.21 | | 6.83 | |
Distributions from and/or in Excess of: | | | | | | | | | | | |
Net Investment Income | | (0.41 | ) | (0.27 | ) | (0.41 | ) | (0.47 | ) | (0.35 | ) |
Net Realized Gain | | (0.82 | ) | (5.53 | ) | (4.60 | ) | (3.71 | ) | (1.89 | ) |
Total Distributions | | (1.23 | ) | (5.80 | ) | (5.01 | ) | (4.18 | ) | (2.24 | ) |
Redemption Fees | | 0.00 | ‡ | 0.00 | ‡ | 0.00 | ‡ | 0.00 | ‡ | 0.00 | ‡ |
Net Asset Value, End of Period | | $ | 9.53 | | $ | 17.08 | | $ | 23.72 | | $ | 24.14 | | $ | 25.11 | |
Total Return++ | | (38.33 | )% | (3.22 | )% | 19.61 | % | 13.07 | % | 33.53 | % |
Ratios and Supplemental Data: | | | | | | | | | | | |
Net Assets, End of Period (Thousands) | | $ | 316,526 | | $ | 796,050 | | $ | 1,312,064 | | $ | 1,389,078 | | $ | 1,276,083 | |
Ratio of Expenses to Average Net Assets (1) | | 1.13 | %+ | 1.09 | %+ | 1.10 | % | 1.10 | % | 1.15 | % |
Ratio of Expenses to Average Net Assets Excluding Non Operating Expenses | | 1.12 | %+ | 1.09 | %+ | 1.10 | % | 1.10 | % | 1.15 | % |
Ratio of Net Investment Income to Average Net Assets (1) | | 2.47 | %+ | 1.10 | %+ | 1.25 | % | 1.22 | % | 1.04 | % |
Portfolio Turnover Rate | | 49 | % | 53 | % | 40 | % | 47 | % | 38 | % |
(1) Supplemental Information on the Ratios to Average Net Assets: | | | | | | | | | | | |
Ratios before expense limitation: | | | | | | | | | | | |
Expenses to Average Net Assets | | 1.15 | %+ | N/A | | N/A | | N/A | | 1.16 | % |
Net Investment Income to Average Net Assets | | 2.44 | %+ | N/A | | N/A | | N/A | | 1.03 | % |
† | Per share amount is based on average shares outstanding. |
‡ | Amount is less than $0.005 per share. |
++ | Calculated based on the net asset value as of the last business day of the period. |
+ | Reflects rebate of certain Portfolio expenses in connection with the investments in Morgan Stanley Institutional Liquidity Money Market Portfolio — Institutional Class during the period. As a result of such rebate, the expenses as a percentage of its net assets were effected by less than 0.005%. |
| The accompanying notes are an integral part of the financial statements. | 131 |
2008 Annual Report | |
| |
December 31, 2008 | |
Financial Highlights
International Small Cap Portfolio
| | Class P |
| | Period from |
| | October 21, 2008^ |
Selected Per Share Data and Ratios | | to December 31, 2008 |
Net Asset Value, Beginning of Period | | $ 9.80 | | |
Income (Loss) from Investment Operations | | | | |
Net Investment Income† | | 0.00 | ‡ | |
Net Realized and Unrealized Gain on Investments | | 0.14 | | |
Total from Investment Operations | | 0.14 | | |
Distributions from and/or in Excess of: | | | | |
Net Investment Income | | (0.41 | ) | |
Total Distributions | | (0.41 | ) | |
Net Asset Value, End of Period | | $ 9.53 | | |
Total Return++ | | 1.56 | %# | |
Ratios and Supplemental Data: | | | | |
Net Assets, End of Period (Thousands) | | $ 119 | | |
Ratio of Expenses to Average Net Assets (1) | | 1.39 | %*+ | |
Ratio of Expenses to Average Net Assets Excluding Non Operating Expenses (1) | | 1.39 | %*+ | |
Ratio of Net Investment Income to Average Net Assets (1) | | 0.09 | %*+ | |
Portfolio Turnover Rate | | 49 | %# | |
(1) Supplemental Information on the Ratios to Average Net Assets: | | | | |
Ratios before expense limitation: | | | | |
Expenses to Average Net Assets | | 1.86 | %*+ | |
Net Investment Income to Average Net Assets | | (0.38 | )%*+ | |
^ | Commencement of Operations |
† | Per share amount is based on average shares outstanding. |
++ | Calculated based on the net asset value as of the last business day of the period. |
# | Not Annualized |
* | Annualized |
+ | Reflects rebate of certain Portfolio expenses in connection with the investments in Morgan Stanley Institutional Liquidity Money Market Portfolio — Institutional Class during the period. As a result of such rebate, the expenses as a percentage of its net assets were effected by less than 0.005%. |
132 | The accompanying notes are an integral part of the financial statements. | |
| 2008 Annual Report |
| |
| December 31, 2008 |
Financial Highlights
Capital Growth Portfolio
| | Class I |
| | Year Ended December 31, |
Selected Per Share Data and Ratios | | 2008 | | 2007 | | 2006 | | 2005 | | 2004 | |
Net Asset Value, Beginning of Period | | $ | 24.69 | | $ | 20.28 | | $ | 19.49 | | $ | 16.88 | | $ | 15.74 | |
Income (Loss) from Investment Operations | | | | | | | | | | | |
Net Investment Income† | | 0.05 | | 0.10 | | 0.01 | | 0.02 | | 0.09 | |
Net Realized and Unrealized Gain (Loss) on Investments | | (12.50 | ) | 4.41 | | 0.78 | | 2.63 | | 1.13 | |
Total from Investment Operations | | (12.45 | ) | 4.51 | | 0.79 | | 2.65 | | 1.22 | |
Distributions from and/or in Excess of: | | | | | | | | | | | |
Net Investment Income | | (0.10 | ) | (0.10 | ) | (0.00 | )‡ | (0.04 | ) | (0.08 | ) |
Net Realized Gain | | (0.02 | ) | — | | — | | — | | — | |
Total Distributions | | (0.12 | ) | (0.10 | ) | — | | (0.04 | ) | (0.08 | ) |
Redemption Fees | | 0.00 | ‡ | 0.00 | ‡ | 0.00 | ‡ | — | | — | |
Net Asset Value, End of Period | | $ | 12.12 | | $ | 24.69 | | $ | 20.28 | | $ | 19.49 | | $ | 16.88 | |
Total Return++ | | (50.47 | )% | 22.29 | % | 4.07 | % | 15.72 | % | 7.75 | % |
Ratios and Supplemental Data: | | | | | | | | | | | |
Net Assets, End of Period (Thousands) | | $ | 543,841 | | $ | 1,406,866 | | $ | 1,012,417 | | $ | 871,905 | | $ | 554,097 | |
Ratio of Expenses to Average Net Assets | | 0.62 | %+ | 0.62 | %+ | 0.63 | % | 0.65 | % | 0.77 | % |
Ratio of Expenses to Average Net Assets Excluding Non Operating Expenses | | 0.62 | %+ | 0.62 | %+ | 0.63 | % | 0.65 | % | N/A | |
Ratio of Net Investment Income to Average Net Assets | | 0.24 | %+ | 0.46 | %+ | 0.03 | % | 0.13 | % | 0.58 | % |
Portfolio Turnover Rate | | 42 | % | 50 | % | 59 | % | 106 | % | 179 | % |
| | Class P |
| | Year Ended December 31, |
Selected Per Share Data and Ratios | | 2008 | | 2007 | | 2006 | | 2005 | | 2004 | |
Net Asset Value, Beginning of Period | | $ | 24.27 | | $ | 19.95 | | $ 19.21 | | $ | 16.67 | | $ | 15.55 | |
Income (Loss) from Investment Operations | | | | | | | | | | | |
Net Investment Income (Loss)† | | 0.00 | ‡ | 0.05 | | (0.04 | ) | (0.03 | ) | 0.05 | |
Net Realized and Unrealized Gain (Loss) on Investments | | (12.27 | ) | 4.33 | | 0.78 | | 2.60 | | 1.11 | |
Total from Investment Operations | | (12.27 | ) | 4.38 | | 0.74 | | 2.57 | | 1.16 | |
Distributions from and/or in Excess of: | | | | | | | | | | | |
Net Investment Income | | (0.04 | ) | (0.06 | ) | — | | (0.03 | ) | (0.04 | ) |
Net Realized Gain | | (0.02 | ) | — | | — | | — | | — | |
Total Distributions | | (0.06 | ) | (0.06 | ) | — | | (0.03 | ) | (0.04 | ) |
Redemption Fees | | 0.00 | ‡ | 0.00 | ‡ | 0.00 | ‡ | — | | — | |
Net Asset Value, End of Period | | $ | 11.94 | | $ | 24.27 | | $ 19.95 | | $ 19.21 | | $ | 16.67 | |
Total Return++ | | (50.57 | )% | 21.93 | % | 3.85 | % | 15.41 | % | 7.45 | % |
Ratios and Supplemental Data: | | | | | | | | | | | |
Net Assets, End of Period (Thousands) | | $ | 59,883 | | $ | 166,717 | | $ 57,689 | | $ 35,678 | | $ | 202,893 | |
Ratio of Expenses to Average Net Assets | | 0.87 | %+ | 0.87 | %+ | 0.88 | % | 0.90 | % | 1.02 | % |
Ratio of Expenses to Average Net Assets Excluding Non Operating Expenses | | 0.87 | %+ | 0.87 | %+ | 0.88 | % | 0.90 | % | N/A | |
Ratio of Net Investment Income (Loss) to Average Net Assets | | (0.01 | )%+ | 0.24 | +% | (0.23 | )% | (0.17 | )% | 0.33 | % |
Portfolio Turnover Rate | | 42 | % | 50 | % | 59 | % | 106 | % | 179 | % |
| | | | | | | | | | | | | | | |
† | Per share amount is based on average shares outstanding. |
‡ | Amount is less than $0.005 per share. |
++ | Calculated based on the net asset value as of the last business day of the period. |
+ | Reflects rebate of certain Portfolio expenses in connection with the investments in Morgan Stanley Institutional Liquidity Money Market Portfolio — Institutional Class during the period. As a result of such rebate, the expenses as a percentage of its net assets were effected by less than 0.005%. |
| The accompanying notes are an integral part of the financial statements. | 133 |
2008 Annual Report | |
| |
December 31, 2008 | |
Financial Highlights
Focus Growth Portfolio
| | Class I |
| | Year Ended December 31, |
Selected Per Share Data and Ratios | | 2008 | | 2007 | | 2006 | | 2005 | | 2004 | |
Net Asset Value, Beginning of Period | | $ | 18.81 | | $ | 15.19 | | $ | 14.78 | | $ | 12.59 | | $ | 11.79 | |
Income (Loss) from Investment Operations | | | | | | | | | | | |
Net Investment Income (Loss)† | | 0.00 | ‡ | 0.03 | | (0.03 | ) | (0.03 | ) | 0.04 | |
Net Realized and Unrealized Gain (Loss) on Investments | | (9.82 | ) | 3.62 | | 0.44 | | 2.24 | | 0.78 | |
Total from Investment Operations | | (9.82 | ) | 3.65 | | 0.41 | | 2.21 | | 0.82 | |
Distributions from and/or in Excess of: | | | | | | | | | | | |
Net Investment Income | | (0.04 | ) | (0.03 | ) | — | | (0.02 | ) | (0.02 | ) |
Total Distributions | | (0.04 | ) | (0.03 | ) | — | | (0.02 | ) | (0.02 | ) |
Redemption Fees | | 0.00 | ‡ | 0.00 | ‡ | 0.00 | ‡ | — | | — | |
Net Asset Value, End of Period | | $ | 8.95 | | $ | 18.81 | | $ | 15.19 | | $ | 14.78 | | $ | 12.59 | |
Total Return++ | | (52.19 | )% | 24.02 | % | 2.77 | % | 17.60 | % | 7.00 | % |
Ratios and Supplemental Data: | | | | | | | | | | | |
Net Assets, End of Period (Thousands) | | $ | 4,879 | | $ | 13,852 | | $ | 12,416 | | $ | 54,321 | | $ | 52,757 | |
Ratio of Expenses to Average Net Assets (1) | | 1.00 | %+ | 1.00 | %+ | 0.79 | % | 0.91 | % | 1.00 | % |
Ratio of Expenses to Average Net Assets Excluding Non Operating Expenses | | 1.00 | %+ | 1.00 | %+ | 0.79 | % | 0.91 | % | 1.00 | % |
Ratio of Net Investment Income (Loss) to Average Net Assets (1) | | 0.02 | %+ | 0.16 | %+ | (0.23 | )% | (0.27 | )% | 0.35 | % |
Portfolio Turnover Rate | | 36 | % | 57 | % | 76 | % | 78 | % | 163 | % |
(1) Supplemental Information on the Ratios to Average Net Assets: | | | | | | | | | | | |
Ratios before expense limitation: | | | | | | | | | | | |
Expenses to Average Net Assets | | 1.29 | %+ | 1.13 | %+ | N/A | | N/A | | 1.11 | % |
Net Investment Income (Loss) to Average Net Assets | | (0.27 | )%+ | 0.03 | %+ | N/A | | N/A | | 0.24 | % |
| | Class P |
| | Year Ended December 31, |
Selected Per Share Data and Ratios | | 2008 | | 2007 | | 2006 | | 2005 | | 2004 | |
Net Asset Value, Beginning of Period | | $ | 18.32 | | $ | 14.81 | | $ | 14.45 | | $ | 12.34 | | $ | 11.57 | |
Income (Loss) from Investment Operations | | | | | | | | | | | |
Net Investment Income (Loss)† | | (0.04 | ) | (0.01 | ) | (0.06 | ) | (0.06 | ) | 0.02 | |
Net Realized and Unrealized Gain (Loss) on Investments | | (9.55 | ) | 3.52 | | 0.42 | | 2.19 | | 0.75 | |
Total from Investment Operations | | (9.59 | ) | 3.51 | | 0.36 | | 2.13 | | 0.77 | |
Distributions from and/or in Excess of: | | | | | | | | | | | |
Net Investment Income | | 0.00 | ‡ | — | | — | | (0.02 | ) | — | |
Total Distributions | | 0.00 | ‡ | — | | — | | (0.02 | ) | — | |
Redemption Fees | | 0.00 | ‡ | 0.00 | ‡ | 0.00 | ‡ | — | | — | |
Net Asset Value, End of Period | | $ | 8.73 | | $ | 18.32 | | $ | 14.81 | | $ | 14.45 | | $ | 12.34 | |
Total Return++ | | (52.27 | )% | 23.70 | % | 2.49 | % | 17.30 | % | 6.75 | % |
Ratios and Supplemental Data: | | | | | | | | | | | |
Net Assets, End of Period (Thousands) | | $ | 1,069 | | $ | 2,913 | | $ | 2,317 | | $ | 12,442 | | $ | 8,559 | |
Ratio of Expenses to Average Net Assets (1) | | 1.25 | %+ | 1.25 | %+ | 1.04 | % | 1.16 | % | 1.25 | % |
Ratio of Expenses to Average Net Assets Excluding Non Operating Expenses | | 1.25 | %+ | 1.25 | %+ | 1.04 | % | 1.16 | % | 1.25 | % |
Ratio of Net Investment Income (Loss) to Average Net Assets (1) | | (0.24 | )%+ | (0.07 | )%+ | (0.45 | )% | (0.49 | )% | 0.18 | % |
Portfolio Turnover Rate | | 36 | % | 57 | % | 76 | % | 78 | % | 163 | % |
(1) Supplemental Information on the Ratios to Average Net Assets: | | | | | | | | | | | |
Ratios before expense limitation: | | | | | | | | | | | |
Expenses to Average Net Assets | | 1.54 | %+ | 1.38 | %+ | N/A | | N/A | | 1.36 | % |
Net Investment Income (Loss) to Average Net Assets | | (0.53 | )%+ | (0.20 | )%+ | N/A | | N/A | | 0.07 | % |
† | Per share amount is based on average shares outstanding. |
‡ | Amount is less than $0.005 per share. |
++ | Calculated based on the net asset value as of the last business day of the period. |
+ | Reflects rebate of certain Portfolio expenses in connection with the investments in Morgan Stanley Institutional Liquidity Money Market Portfolio — Institutional Class during the period. As a result of such rebate, the expenses as a percentage of its net assets were effected by less than 0.005%. |
134 | The accompanying notes are an integral part of the financial statements. | |
| 2008 Annual Report |
| |
| December 31, 2008 |
Financial Highlights
Large Cap Relative Value Portfolio
| | Class I | |
| | Year Ended December 31, | |
Selected Per Share Data and Ratios | | 2008 | | 2007 | | 2006 | | 2005 | | 2004 | |
Net Asset Value, Beginning of Period | | $ 11.86 | | $ 12.20 | | $ 11.10 | | $ 10.52 | | $ 9.30 | |
Income (Loss) from Investment Operations | | | | | | | | | | | |
Net Investment Income† | | 0.21 | | 0.21 | | 0.20 | | 0.15 | | 0.12 | |
Net Realized and Unrealized Gain (Loss) on Investments | | (3.96 | ) | 0.16 | | 1.62 | | 0.90 | | 1.23 | |
Total from Investment Operations | | (3.75 | ) | 0.37 | | 1.82 | | 1.05 | | 1.35 | |
Distributions from and/or in Excess of: | | | | | | | | | | | |
Net Investment Income | | (0.21 | ) | (0.22 | ) | (0.20 | ) | (0.14 | ) | (0.13 | ) |
Net Realized Gain | | (0.05 | ) | (0.49 | ) | (0.52 | ) | (0.33 | ) | — | |
Total Distributions | | (0.26 | ) | (0.71 | ) | (0.72 | ) | (0.47 | ) | (0.13 | ) |
Redemption Fees | | 0.00 | ‡ | 0.00 | ‡ | 0.00 | ‡ | — | | — | |
Net Asset Value, End of Period | | $ 7.85 | | $ 11.86 | | $ 12.20 | | $ 11.10 | | $ 10.52 | |
Total Return++ | | (32.01 | )% | 2.90 | % | 16.47 | % | 10.07 | % | 14.56 | % |
Ratios and Supplemental Data: | | | | | | | | | | | |
Net Assets, End of Period (Thousands) | | $150,025 | | $236,784 | | $211,904 | | $102,973 | | $90,938 | |
Ratio of Expenses to Average Net Assets | | 0.67 | %+ | 0.67 | %+ | 0.68 | % | 0.68 | % | 0.70 | % |
Ratio of Expenses to Average Net Assets Excluding Non Operating Expenses | | 0.67 | %+ | 0.67 | %+ | 0.68 | | 0.68 | % | N/A | |
Ratio of Net Investment Income to Average Net Assets | | 2.06 | %+ | 1.71 | %+ | 1.71 | % | 1.36 | % | 1.28 | % |
Portfolio Turnover Rate | | 50 | % | 31 | % | 33 | % | 46 | % | 84 | % |
(1) Supplemental Information on the Ratios to Average Net Assets: | | | | | | | | | | | |
Ratios before expense limitation: | | | | | | | | | | | |
Expenses to Average Net Assets | | N/A | | N/A | | N/A | | N/A | | 0.74 | % |
Net Investment Income to Average Net Assets | | N/A | | N/A | | N/A | | N/A | | 1.24 | % |
| | | | | | | | | | | |
| | Class P | |
| | Year Ended December 31, | |
Selected Per Share Data and Ratios | | 2008 | | 2007 | | 2006 | | 2005 | | 2004 | |
Net Asset Value, Beginning of Period | | $ 11.85 | | $ 12.18 | | $ 11.09 | | $ 10.51 | | $ 9.31 | |
Income (Loss) from Investment Operations | | | | | | | | | | | |
Net Investment Income† | | 0.18 | | 0.19 | | 0.17 | | 0.12 | | 0.10 | |
Net Realized and Unrealized Gain (Loss) on Investments | | (3.96 | ) | 0.15 | | 1.61 | | 0.91 | | 1.20 | |
Total from Investment Operations | | (3.78 | ) | 0.34 | | 1.78 | | 1.03 | | 1.30 | |
Distributions from and/or in Excess of: | | | | | | | | | | | |
Net Investment Income | | (0.18 | ) | (0.18 | ) | (0.17 | ) | (0.12 | ) | (0.10 | ) |
Net Realized Gain | | (0.05 | ) | (0.49 | ) | (0.52 | ) | (0.33 | ) | — | |
Total Distributions | | (0.23 | ) | (0.67 | ) | (0.69 | ) | (0.45 | ) | (0.10 | ) |
Redemption Fees | | 0.00 | ‡ | 0.00 | ‡ | 0.00 | ‡ | — | | — | |
Net Asset Value, End of Period | | $ 7.84 | | $ 11.85 | | $ 12.18 | | $ 11.09 | | $ 10.51 | |
Total Return++ | | (32.21 | )% | 2.72 | % | 16.38 | % | 9.81 | % | 14.07 | % |
Ratios and Supplemental Data: | | | | | | | | | | | |
Net Assets, End of Period (Thousands) | | $ 34,856 | | $ 50,287 | | $ 63,300 | | $101,499 | | $75,189 | |
Ratio of Expenses to Average Net Assets | | 0.92 | %+ | 0.92 | %+ | 0.93 | % | 0.93 | % | 0.95 | % |
Ratio of Expenses to Average Net Assets Excluding Non Operating Expenses | | 0.92 | %+ | 0.92 | %+ | 0.93 | % | 0.93 | % | N/A | |
Ratio of Net Investment Income to Average Net Assets | | 1.81 | %+ | 1.48 | %+ | 1.44 | % | 1.10 | % | 1.05 | % |
Portfolio Turnover Rate | | 50 | % | 31 | % | 33 | % | 46 | % | 84 | % |
(1) Supplemental Information on the Ratios to Average Net Assets: | | | | | | | | | | | |
Ratios before expense limitation: | | | | | | | | | | | |
Expenses to Average Net Assets | | N/A | | N/A | | N/A | | N/A | | 0.99 | % |
Net Investment Income to Average Net Assets | | N/A | | N/A | | N/A | | N/A | | 1.01 | % |
† | Per share amount is based on average shares outstanding. |
‡ | Amount is less than $0.005 per share. |
++ | Calculated based on the net asset value as of the last business day of the period. |
+ | Reflects rebate of certain Portfolio expenses in connection with the investments in Morgan Stanley Institutional Liquidity Money Market Portfolio — Institutional Class during the period. As a result of such rebate, the expenses as a percentage of its net assets were effected by approximately 0.01% and less than 0.005% for the years ended December 31, 2008 and December 31, 2007, respectively. |
| | | | | | | | | | | | |
| The accompanying notes are an integral part of the financial statements. | 135 |
2008 Annual Report | |
| |
December 31, 2008 | |
Financial Highlights
Small Company Growth Portfolio
| | Class I | |
| | Year Ended December 31, | |
Selected Per Share Data and Ratios | | 2008 | | 2007 | | 2006 | | 2005 | | 2004 | |
Net Asset Value, Beginning of Period | | $ 13.12 | | $ 13.31 | | $ 12.89 | | $ 12.50 | | $ 10.81 | |
Income (Loss) from Investment Operations | | | | | | | | | | | |
Net Investment Loss† | | (0.01 | ) | (0.05 | ) | (0.08 | ) | 0.00 | ‡ | (0.09 | ) |
Net Realized and Unrealized Gain (Loss) on Investments | | (5.47 | ) | 0.45 | | 1.59 | | 1.72 | | 2.16 | |
Total from Investment Operations | | (5.48 | ) | 0.40 | | 1.51 | | 1.72 | | 2.07 | |
Distributions from and/or in Excess of: | | | | | | | | | | | |
Net Realized Gain | | — | | (0.59 | ) | (1.09 | ) | (1.33 | ) | (0.38 | ) |
Total Distributions | | — | | (0.59 | ) | (1.09 | ) | (1.33 | ) | (0.38 | ) |
Redemption Fees | | 0.00 | ‡ | 0.00 | ‡ | 0.00 | ‡ | 0.00 | ‡ | — | |
Net Asset Value, End of Period | | $ 7.64 | | $ 13.12 | | $ 13.31 | | $ 12.89 | | $ 12.50 | |
Total Return++ | | (41.84 | )% | 3.04 | % | 11.90 | % | 13.55 | % | 19.17 | % |
Ratios and Supplemental Data: | | | | | | | | | | | |
Net Assets, End of Period (Thousands) | | $638,559 | | $1,137,839 | | $1,028,030 | | $896,204 | | $651,276 | |
Ratio of Expenses to Average Net Assets (1) | | 1.02 | %+ | 1.01 | %+ | 1.01 | % | 1.04 | % | 1.10 | % |
Ratio of Expenses to Average Net Assets Excluding Non Operating Expenses | | 1.02 | %+ | 1.01 | %+ | 1.01 | % | 1.04 | % | N/A | |
Ratio of Net Investment Loss to Average Net Assets (1) | | (0.08 | )%+ | (0.35 | )%+ | (0.56 | )% | (0.04 | )% | (0.79 | )% |
Portfolio Turnover Rate | | 34 | % | 50 | % | 76 | % | 73 | % | 111 | % |
(1) Supplemental Information on the Ratios to Average Net Assets: | | | | | | | | | | | |
Ratios before expense limitation: | | | | | | | | | | | |
Expenses to Average Net Assets | | 1.05 | %+ | N/A | | N/A | | N/A | | 1.16 | % |
Net Investment Loss to Average Net Assets | | (0.11 | )%+ | N/A | | N/A | | N/A | | (0.85 | )% |
| | | Class P | |
| | | Year Ended December 31, | |
| Selected Per Share Data and Ratios | | 2008 | | 2007 | | 2006 | | 2005 | | 2004 | |
| Net Asset Value, Beginning of Period | | $ 12.39 | | $ 12.63 | | $ 12.31 | | $ 12.02 | | $ 10.43 | |
| Income (Loss) from Investment Operations | | | | | | | | | | | |
| Net Investment Loss† | | (0.03 | ) | (0.08 | ) | (0.10 | ) | (0.03 | ) | (0.11 | ) |
| Net Realized and Unrealized Gain (Loss) on Investments | | (5.17 | ) | 0.43 | | 1.51 | | 1.65 | | 2.08 | |
| Total from Investment Operations | | (5.20 | ) | 0.35 | | 1.41 | | 1.62 | | 1.97 | |
| Distributions from and/or in Excess of: | | | | | | | | | | | |
| Net Realized Gain | | — | | (0.59 | ) | (1.09 | ) | (1.33 | ) | (0.38 | ) |
| Total Distributions | | — | | (0.59 | ) | (1.09 | ) | (1.33 | ) | (0.38 | ) |
| Redemption Fees | | 0.00 | ‡ | 0.00 | ‡ | 0.00 | ‡ | — | | — | |
| Net Asset Value, End of Period | | $ 7.19 | | $ 12.39 | | $ 12.63 | | $ 12.31 | | $ 12.02 | |
| Total Return++ | | (41.97 | )% | 2.81 | % | 11.55 | % | 13.35 | % | 18.79 | % |
| Ratios and Supplemental Data: | | | | | | | | | | | |
| Net Assets, End of Period (Thousands) | | $345,302 | | $ 698,183 | | $ 857,275 | | $ 808,493 | | $ 713,733 | |
| Ratio of Expenses to Average Net Assets (1) | | 1.27 | %+ | 1.26 | %+ | 1.26 | % | 1.29 | % | 1.35 | % |
| Ratio of Expenses to Average Net Assets Excluding Non Operating Expenses | | 1.27 | %+ | 1.26 | %+ | 1.26 | % | 1.29 | % | N/A | |
| Ratio of Net Investment Loss to Average Net Assets (1) | | (0.34 | )%+ | (0.61 | )%+ | (0.81 | )% | (0.24 | )% | (1.02 | )% |
| Portfolio Turnover Rate | | 34 | % | 50 | % | 76 | % | 73 | % | 111 | % |
| (1) Supplemental Information on the Ratios to Average Net Assets: | | | | | | | | | | | |
| Ratios before expense limitation: | | | | | | | | | | | |
| Expenses to Average Net Assets | | 1.30 | %+ | N/A | | N/A | | N/A | | 1.41 | % |
| Net Investment Loss to Average Net Assets | | (0.37 | )%+ | N/A | | N/A | | N/A | | (1.09 | )% |
† | Per share amount is based on average shares outstanding. |
‡ | Amount is less than $0.005 per share. |
++ | Calculated based on the net asset value as of the last business day of the period. |
+ | Reflects rebate of certain Portfolio expenses in connection with the investments in Morgan Stanley Institutional Liquidity Money Market Portfolio — Institutional Class during the period. As a result of such rebate, the expenses as a percentage of its net assets were effected by less than 0.005%. |
| | | | | | | | | | | | | |
136 | | The accompanying notes are an integral part of the financial statements. |
| 2008 Annual Report |
| |
| December 31, 2008 |
Financial Highlights
U.S. Real Estate Portfolio
| | Class I | |
| | Year Ended December 31, | |
Selected Per Share Data and Ratios | | 2008 | | 2007 | | 2006 | | 2005 | | 2004 | |
Net Asset Value, Beginning of Period | | $ 15.75 | | $ 28.24 | | $ 23.41 | | $ 23.21 | | $ 17.92 | |
Income (Loss) from Investment Operations | | | | | | | | | | | |
Net Investment Income† | | 0.31 | | 0.33 | | 0.42 | | 0.45 | | 0.40 | |
Net Realized and Unrealized Gain (Loss) on Investments | | (5.84 | ) | (4.87 | ) | 8.44 | | 3.58 | | 6.17 | |
Total from Investment Operations | | (5.53 | ) | (4.54 | ) | 8.86 | | 4.03 | | 6.57 | |
Distributions from and/or in Excess of: | | | | | | | | | | | |
Net Investment Income | | (0.31 | ) | (0.50 | ) | (0.49 | ) | (0.44 | ) | (0.42 | ) |
Net Realized Gain | | (1.04 | ) | (7.45 | ) | (3.54 | ) | (3.39 | ) | (0.86 | ) |
Total Distributions | | (1.35 | ) | (7.95 | ) | (4.03 | ) | (3.83 | ) | (1.28 | ) |
Redemption Fees | | 0.00 | ‡ | 0.00 | ‡ | 0.00 | ‡ | — | | — | |
Net Asset Value, End of Period | | $ 8.87 | | $ 15.75 | | $ 28.24 | | $ 23.41 | | $ 23.21 | |
Total Return++ | | (38.07 | )% | (16.63 | )% | 38.85 | % | 17.66 | % | 37.28 | % |
Ratios and Supplemental Data: | | | | | | | | | | | |
Net Assets, End of Period (Thousands) | | $448,897 | | $911,819 | | $1,635,926 | | $1,209,668 | | $1,097,718 | |
Ratio of Expenses to Average Net Assets (1) | | 0.95 | %+ | 0.90 | %+ | 0.87 | % | 0.89 | % | 0.97 | % |
Ratio of Expenses to Average Net Assets Excluding Non Operating Expenses | | 0.91 | %+ | 0.88 | %+ | 0.87 | % | 0.89 | % | N/A | |
Ratio of Net Investment Income to Average Net Assets (1) | | 2.19 | %+ | 1.23 | %+ | 1.55 | % | 1.87 | % | 2.02 | % |
Portfolio Turnover Rate | | 38 | % | 38 | % | 36 | % | 33 | % | 21 | % |
(1) Supplemental Information on the Ratios to Average Net Assets: | | | | | | | | | | | |
Ratios before expense limitation: | | | | | | | | | | | |
Expenses to Average Net Assets | | 0.96 | %+ | N/A | | N/A | | N/A | | N/A | |
Net Investment Income to Average Net Assets | | 2.18 | %+ | N/A | | N/A | | N/A | | N/A | |
| | | Class P | | |
| | | Year Ended December 31, | | |
| Selected Per Share Data and Ratios | | 2008 | | 2007 | | 2006 | | 2005 | | 2004 | | |
| Net Asset Value, Beginning of Period | | $ 15.53 | | $ 27.96 | | $ 23.21 | | $ 23.04 | | $ 17.80 | | |
| Income (Loss) from Investment Operations | | | | | | | | | | | | |
| Net Investment Income† | | 0.28 | | 0.27 | | 0.37 | | 0.38 | | 0.35 | | |
| Net Realized and Unrealized Gain (Loss) on Investments | | (5.77 | ) | (4.82 | ) | 8.34 | | 3.56 | | 6.13 | | |
| Total from Investment Operations | | (5.49 | ) | (4.55 | ) | 8.71 | | 3.94 | | 6.48 | | |
| Distributions from and/or in Excess of: | | | | | | | | | | | | |
| Net Investment Income | | (0.27 | ) | (0.43 | ) | (0.42 | ) | (0.38 | ) | (0.38 | ) | |
| Net Realized Gain | | (1.04 | ) | (7.45 | ) | (3.54 | ) | (3.39 | ) | (0.86 | ) | |
| Total Distributions | | (1.31 | ) | (7.88 | ) | (3.96 | ) | (3.77 | ) | (1.24 | ) | |
| Redemption Fees | | 0.00 | ‡ | 0.00 | ‡ | 0.00 | ‡ | — | | — | | |
| Net Asset Value, End of Period | | $ 8.73 | | $ 15.53 | | $ 27.96 | | $ 23.21 | | $ 23.04 | | |
| Total Return++ | | (38.26 | )% | (16.80 | )% | 38.52 | % | 17.37 | % | 36.95 | % | |
| Ratios and Supplemental Data: | | | | | | | | | | | | |
| Net Assets, End of Period (Thousands) | | $ 95,828 | | $171,578 | | $ 268,537 | | $157,650 | | $149,180 | | |
| Ratio of Expenses to Average Net Assets (1) | | 1.20 | %+ | 1.15 | %+ | 1.12 | % | 1.14 | % | 1.22 | % | |
| Ratio of Expenses to Average Net Assets Excluding Non Operating Expenses | | 1.16 | %+ | 1.13 | %+ | 1.12 | % | 1.14 | % | N/A | | |
| Ratio of Net Investment Income to Average Net Assets (1) | | 2.05 | %+ | 1.02 | %+ | 1.37 | % | 1.60 | % | 1.76 | % | |
| Portfolio Turnover Rate | | 38 | % | 38 | % | 36 | % | 33 | % | 21 | % | |
| (1) Supplemental Information on the Ratios to Average Net Assets: | | | | | | | | | | | | |
| Ratios before expense limitation: | | | | | | | | | | | | |
| Expenses to Average Net Assets | | 1.21 | %+ | N/A | | N/A | | N/A | | N/A | | |
| Net Investment Income to Average Net Assets | | 2.04 | %+ | N/A | | N/A | | N/A | | N/A | | |
† | Per share amount is based on average shares outstanding. |
‡ | Amount is less than $0.005 per share. |
++ | Calculated based on the net asset value as of the last business day of the period. |
+ | Reflects rebate of certain Portfolio expenses in connection with the investments in Morgan Stanley Institutional Liquidity Money Market Portfolio — Institutional Class during the period. As a result of such rebate, the expenses as a percentage of its net assets were effected by less than 0.005%. |
| | | | | | | | | | | | | | |
The accompanying notes are an integral part of the financial statements. | | 137 |
2008 Annual Report | |
| |
December 31, 2008 | |
Financial Highlights
U.S. Small/Mid Cap Value Portfolio
| | Class I | |
| | Year Ended | | Period from |
| | December 31, | | September 27, 2007^ to |
Selected Per Share Data and Ratios | | 2008 | | December 31, 2007 |
Net Asset Value, Beginning of Period | | $ 9.47 | | | $ 10.00 | | |
Income (Loss) from Investment Operations | | | | | | | |
Net Investment Income† | | 0.00 | ‡ | | 0.00 | ‡ | |
Net Realized and Unrealized Loss on Investments | | (3.60 | ) | | (0.52 | ) | |
Total from Investment Operations | | (3.60 | ) | | (0.52 | ) | |
Distributions from and/or in Excess of: | | | | | | | |
Net Investment Income | | (0.00 | )‡ | | — | | |
Net Realized Gain | | (0.01 | ) | | (0.01 | ) | |
Total Distributions | | (0.01 | ) | | (0.01 | ) | |
Net Asset Value, End of Period | | $ 5.86 | | | $ 9.47 | | |
Total Return++ | | (38.03 | )% | | (5.21 | )%# | |
Ratios and Supplemental Data: | | | | | | | |
Net Assets, End of Period (Thousands) | | $16,492 | | | $20,112 | | |
Ratio of Expenses to Average Net Assets | | 1.17 | %+ | | 1.30 | %*+ | |
Ratio of Expenses to Average Net Assets Excluding Non Operating Expenses | | 1.17 | %+ | | N/A | | |
Ratio of Net Investment Income to Average Net Assets | | 0.02 | %+ | | 0.09 | %*+ | |
Portfolio Turnover Rate | | 69 | % | | 38 | %# | |
| | | | | | | | |
| | | Class P | |
| | | Year Ended | | Period from | |
| | | December 31, | | September 27, 2007^ to | |
| Selected Per Share Data and Ratios | | 2008 | | December 31, 2007 | |
| Net Asset Value, Beginning of Period | | $ 9.47 | | | $ 10.00 | | | |
| Income (Loss) from Investment Operations | | | | | | | | |
| Net Investment Loss† | | (0.02 | ) | | 0.00 | ‡ | | |
| Net Realized and Unrealized Loss on Investments | | (3.60 | ) | | (0.52 | ) | | |
| Total from Investment Operations | | (3.62 | ) | | (0.52 | ) | | |
| Distributions from and/or in Excess of: | | | | | | | | |
| Net Realized Gain | | (0.01 | ) | | (0.01 | ) | | |
| Total Distributions | | (0.01 | ) | | (0.01 | ) | | |
| Net Asset Value, End of Period | | $ 5.84 | | | $ 9.47 | | | |
| Total Return++ | | (38.21 | )% | | (5.31 | )%# | | |
| Ratios and Supplemental Data: | | | | | | | | |
| Net Assets, End of Period (Thousands) | | $ 58 | | | $ 95 | | | |
| Ratio of Expenses to Average Net Assets | | 1.42 | %+ | | 1.55 | %*+ | | |
| Ratio of Expenses to Average Net Assets Excluding Non Operating Expenses | | 1.42 | %+ | | N/A | | | |
| Ratio of Net Investment Loss to Average Net Assets | | (0.24 | )%+ | | (0.16 | )%*+ | | |
| Portfolio Turnover Rate | | 69 | % | | 38 | %# | | |
^ | Commencement of Operations |
† | Per share amount is based on average shares outstanding. |
‡ | Amount is less than $0.005 per share. |
++ | Calculated based on the net asset value as of the last business day of the period. |
# | Not Annualized |
+ | Reflects rebate of certain Portfolio expenses in connection with the investments in Morgan Stanley Institutional Liquidity Money Market Portfolio — Institutional Class during the period. As a result of such rebate, the expenses as a percentage of its net assets were effected by approximately 0.01% and less than 0.005% for the years ended December 31, 2008 and December 31, 2007, respectively. |
* | Annualized |
| | | | | | | | | | |
138 | | The accompanying notes are an integral part of the financial statements. |
| 2008 Annual Report |
| |
| December 31, 2008 |
Financial Highlights
Emerging Markets Debt Portfolio
| | Class I†† | |
| | Year Ended December 31, | |
Selected Per Share Data and Ratios | | 2008 | | 2007 | | 2006 | | 2005 | | 2004 | |
Net Asset Value, Beginning of Period | | $ 11.47 | | $ 11.99 | | $ 11.61 | | $ 10.92 | | $ 10.59 | |
Income (Loss) from Investment Operations | | | | | | | | | | | |
Net Investment Income† | | 1.03 | | 0.71 | | 0.49 | | 0.81 | | 0.78 | |
Net Realized and Unrealized Gain (Loss) on Investments | | (2.15 | ) | (0.23 | ) | 0.80 | | 0.57 | | 0.30 | |
Total from Investment Operations | | (1.12 | ) | 0.48 | | 1.29 | | 1.38 | | 1.08 | |
Distributions from and/or in Excess of: | | | | | | | | | | | |
Net Investment Income | | (0.41 | ) | (1.00 | ) | (0.91 | ) | (0.69 | ) | (0.75 | ) |
Total Distributions | | (0.41 | ) | (1.00 | ) | (0.91 | ) | (0.69 | ) | (0.75 | ) |
Redemption Fees | | — | | 0.00 | ‡ | 0.00 | ‡ | 0.00 | ‡ | 0.00 | ‡ |
Net Asset Value, End of Period | | $ 9.94 | | $ 11.47 | | $ 11.99 | | $ 11.61 | | $ 10.92 | |
Total Return++ | | (10.07 | )% | 4.68 | % | 11.08 | % | 12.78 | % | 10.07 | % |
Ratios and Supplemental Data: | | | | | | | | | | | |
Net Assets, End of Period (Thousands) | | $21,887 | | $52,686 | | $81,212 | | $92,294 | | $81,109 | |
Ratio of Expenses to Average Net Assets (1) | | 0.83 | %+ | 0.93 | %+^ | 0.93 | %^ | 1.01 | % | 1.04 | %^ |
Ratio of Expenses to Average Net Assets Excluding Non Operating Expenses | | 0.81 | %+ | 0.85 | %+ | 0.92 | % | 1.00 | % | 1.04 | % |
Ratio of Net Investment Income to Average Net Assets (1) | | 9.16 | %+ | 6.28 | %+ | 6.11 | % | 7.02 | % | 7.33 | % |
Portfolio Turnover Rate | | 248 | % | 155 | % | 55 | % | 84 | % | 151 | % |
(1) Supplemental Information on the Ratios to Average Net Assets: | | | | | | | | | | | |
Ratios before expense limitation: | | | | | | | | | | | |
Expenses to Average Net Assets | | 1.61 | %+ | 1.21 | %+ | 1.04 | % | N/A | | 1.07 | % |
Net Investment Income to Average Net Assets | | 8.38 | %+ | 6.00 | %+ | 6.00 | % | N/A | | 7.30 | % |
†† | On March 17, 2006, the Portfolio effected a reverse stock split as described in the Notes to Financial Statements. Per share data prior to this date has been restated to give effect to the reverse stock split. |
† | Per share amount is based on average shares outstanding. |
‡ | Amount is less than $0.005 per share. |
++ | Calculated based on the net asset value as of the last business day of the period. |
+ | Reflects rebate of certain Portfolio expenses in connection with the investments in Morgan Stanley Institutional Liquidity Money Market Portfolio — Institutional Class during the period. As a result of such rebate, the expenses as a percentage of its net assets were effected by approximately 0.01% and less than 0.005% for the years ended December 31, 2008 and December 31, 2007, respectively. |
^ | Effective June 1, 2006, the Adviser has voluntarily agreed to limit the ratio of expenses to average net assets to the maximum ratio of 0.85% for Class I shares. Prior to June 1, 2006, the maximum ratio was 1.00% for Class I shares. Prior to May 1, 2004, the maximum ratio was 1.75% for Class I shares. |
| | | | | | | | | | | | |
| The accompanying notes are an integral part of the financial statements. | 139 |
2008 Annual Report |
|
December 31, 2008 |
Financial Highlights
Emerging Markets Debt Portfolio
| | Class P†† |
| | Year Ended December 31, |
Selected Per Share Data and Ratios | | 2008 | | 2007 | | 2006 | | 2005 | | 2004 | |
Net Asset Value, Beginning of Period | | $ | 11.77 | | $ | 12.29 | | $ | 11.85 | | $ | 11.16 | | $ | 10.80 | |
Income (Loss) from Investment Operations | | | | | | | | | | | |
Net Investment Income† | | 0.94 | | 0.69 | | 0.50 | | 0.78 | | 0.78 | |
Net Realized and Unrealized Gain (Loss) on Investments | | (2.13 | ) | (0.23 | ) | 0.81 | | 0.60 | | 0.30 | |
Total from Investment Operations | | (1.19 | ) | 0.46 | | 1.31 | | 1.38 | | 1.08 | |
Distributions from and/or in Excess of: | | | | | | | | | | | |
Net Investment Income | | (0.40 | ) | (0.98 | ) | (0.87 | ) | (0.69 | ) | (0.72 | ) |
Total Distributions | | (0.40 | ) | (0.98 | ) | (0.87 | ) | (0.69 | ) | (0.72 | ) |
Redemption Fees | | — | | 0.00 | ‡ | 0.00 | ‡ | — | | — | |
Net Asset Value, End of Period | | $ | 10.18 | | $ | 11.77 | | $ | 12.29 | | $ | 11.85 | | $ | 11.16 | |
Total Return++ | | (10.34 | )% | 4.29 | % | 10.79 | % | 12.54 | % | 9.90 | % |
Ratios and Supplemental Data: | | | | | | | | | | | |
Net Assets, End of Period (Thousands) | | $ | 3,640 | | $ | 870 | | $ | 565 | | $ | 596 | | $ | 437 | |
Ratio of Expenses to Average Net Assets (1) | | 1.12 | %+ | 1.20 | %+^ | 1.17 | %^ | 1.26 | % | 1.29 | %^ |
Ratio of Expenses to Average Net Assets Excluding Non Operating Expenses | | 1.10 | %+ | 1.10 | %+ | 1.16 | % | 1.25 | % | 1.29 | % |
Ratio of Net Investment Income to Average Net Assets (1) | | 8.56 | %+ | 5.99 | %+ | 5.94 | % | 6.70 | % | 7.07 | % |
Portfolio Turnover Rate | | 248 | % | 155 | % | 55 | % | 84 | % | 151 | % |
(1) Supplemental Information on the Ratios to Average Net Assets: | | | | | | | | | | | |
Ratios before expense limitation: | | | | | | | | | | | |
Expenses to Average Net Assets | | 2.31 | %+ | 1.49 | %+ | 1.29 | % | N/A | | 1.32 | % |
Net Investment Income to Average Net Assets | | 7.37 | %+ | 5.71 | %+ | 5.82 | % | N/A | | 7.04 | % |
†† | On March 17, 2006, the Portfolio effected a reverse stock split as described in the Notes to Financial Statements. Per share data prior to this date has been restated to give effect to the reverse stock split. |
† | Per share amount is based on average shares outstanding. |
‡ | Amount is less than $0.005 per share. |
++ | Calculated based on the net asset value as of the last business day of the period. |
+ | Reflects rebate of certain Portfolio expenses in connection with the investments in Morgan Stanley Institutional Liquidity Money Market Portfolio — Institutional Class during the period. As a result of such rebate, the expenses as a percentage of its net assets were effected by approximately 0.01% and less than 0.005% for the years ended December 31, 2008 and December 31, 2007, respectively. |
^ | Effective June 1, 2006, the Adviser has voluntarily agreed to limit the ratio of expenses to average net assets to the maximum ratio of 1.10% for Class P shares. Prior to June 1, 2006, the maximum ratio was 1.25% for Class P shares. Prior to May 1, 2004, the maximum ratio was 2.00% for Class P shares. |
| | | | | | | | | | | | | | | | | |
140 | The accompanying notes are an integral part of the financial statements. | |
| 2008 Annual Report |
| |
| December 31, 2008 |
Financial Highlights
Emerging Markets Debt Portfolio
| | Class H | |
| | Period from | |
| | January 2, 2008^ | |
Selected Per Share Data and Ratios | | to December 31, 2008 | |
Net Asset Value, Beginning of Period | | $ 11.86 | | |
Income (Loss) from Investment Operations | | | | |
Net Investment Income† | | 0.88 | | |
Net Realized and Unrealized Loss on Investments | | (2.17 | ) | |
Total from Investment Operations | | (1.29 | ) | |
Distributions from and/or in Excess of: | | | | |
Net Investment Income | | (0.39 | ) | |
Total Distributions | | (0.39 | ) | |
Net Asset Value, End of Period | | $ 10.18 | | |
Total Return++ | | (10.70 | )%# | |
Ratios and Supplemental Data: | | | | |
Net Assets, End of Period (Thousands) | | $ 1,758 | | |
Ratio of Expenses to Average Net Assets (1) | | 1.18 | %*+ | |
Ratio of Expenses to Average Net Assets Excluding Non Operating Expenses | | 1.10 | %*+ | |
Ratio of Net Investment Income to Average Net Assets (1) | | 7.66 | %*+ | |
Portfolio Turnover Rate | | 248 | %# | |
(1) Supplemental Information on the Ratios to Average Net Assets: | | | | |
Ratios before expense limitation: | | | | |
Expenses to Average Net Assets | | 2.11 | %*+ | |
Net Investment Income to Average Net Assets | | 6.73 | %*+ | |
^ | Commencement of Operations |
† | Per share amount is based on average shares outstanding. |
++ | Calculated based on the net asset value which does not reflect sales charges, if applicable, as of the last business day of the period. |
# | Not Annualized |
* | Annualized |
+ | Reflects rebate of certain Portfolio expenses in connection with the investments in Morgan Stanley Institutional Liquidity Money Market Portfolio — Institutional Class during the period. As a result of such rebate, the expenses as a percentage of its net assets were effected by approximately 0.01% and less than 0.005% for the years ended December 31, 2008 and December 31, 2007, respectively. |
| | | | | |
| The accompanying notes are an integral part of the financial statements. | 141 |
2008 Annual Report |
|
December 31, 2008 |
Financial Highlights
Emerging Markets Debt Portfolio
| | Class L | |
| | Period from | |
| | June 16, 2008^ | |
Selected Per Share Data and Ratios | | to December 31, 2008 | |
Net Asset Value, Beginning of Period | | $ 11.84 | | |
Income (Loss) from Investment Operations | | | | |
Net Investment Income† | | 0.50 | | |
Net Realized and Unrealized Loss on Investments | | (1.87 | ) | |
Total from Investment Operations | | (1.37 | ) | |
Distributions from and/or in Excess of: | | | | |
Net Investment Income | | (0.38 | ) | |
Total Distributions | | (0.38 | ) | |
Net Asset Value, End of Period | | $ 10.09 | | |
Total Return++ | | (11.85 | )%# | |
Ratios and Supplemental Data: | | | | |
Net Assets, End of Period (Thousands) | | $ 342 | | |
Ratio of Expenses to Average Net Assets (1) | | 1.72 | %*+ | |
Ratio of Expenses to Average Net Assets Excluding Non Operating Expenses | | 1.60 | %*+ | |
Ratio of Net Investment Income to Average Net Assets (1) | | 8.78 | %*+ | |
Portfolio Turnover Rate | | 248 | %# | |
(1) Supplemental Information on the Ratios to Average Net Assets: | | | | |
Ratios before expense limitation: | | | | |
Expenses to Average Net Assets | | 3.03 | %*+ | |
Net Investment Income to Average Net Assets | | 7.47 | %*+ | |
^ | Commencement of Operations |
† | Per share amount is based on average shares outstanding. |
++ | Calculated based on the net asset value as of the last business day of the period. |
# | Not Annualized |
* | Annualized |
+ | Reflects rebate of certain Portfolio expenses in connection with the investments in Morgan Stanley Institutional Liquidity Money Market Portfolio — Institutional Class during the period. As a result of such rebate, the expenses as a percentage of its net assets were effected by approximately 0.01% and less than 0.005% for the years ended December 31, 2008 and December 31, 2007, respectively. |
| | | | | |
142 | The accompanying notes are an integral part of the financial statements. | |
| 2008 Annual Report |
| |
| December 31, 2008 |
Notes to Financial Statements
Morgan Stanley Institutional Fund, Inc. (the “Fund”) is registered under the Investment Company Act of 1940, as amended (the “1940 Act”), as an open-end management investment company. The Fund is comprised of seventeen separate, active, diversified and non-diversified portfolios (individually referred to as a “Portfolio”, collectively as the “Portfolios”). The Fund offers up to four different classes of shares for certain Portfolios — Class I shares, Class P shares, Class H shares and Class L shares. Effective January 2, 2008, Class A shares and Class B shares of the Portfolios were renamed Class I shares and Class P shares, respectively. Each Portfolio (with the exception of the Global Real Estate, International Growth Active Extension, and Emerging Markets Debt Portfolios), offers two classes of shares — Class I and Class P. Global Real Estate, International Growth Active Extension and Emerging Markets Debt Portfolios offer Class I shares, Class P shares, Class H shares and Class L shares. Each class of shares has identical voting rights (except shareholders of each Class have exclusive voting rights regarding any matter relating solely to that particular Class of shares), dividend, liquidation and other rights. Effective January 2, 2008, the Class H shares commenced operations for the Global Real Estate, International Growth Active Extension and Emerging Markets Debt Portfolios. Effective May 1, 2008, Focus Equity and U.S. Large Cap Growth Portfolios were renamed Focus Growth and Capital Growth Portfolios, respectively. Effective June 16, 2008, the Class L shares commenced operations for the Global Real Estate, International Growth Active Extension and Emerging Markets Debt Portfolios. Effective October 21, 2008, the Class P shares commenced operations for the International Small Cap Portfolio.
For detailed descriptions of the investment objectives of each of the Portfolios and other related information, please refer to the Prospectuses of the Fund. Generally, the investment objective of the domestic and international equity portfolios is to seek capital appreciation by investing in equity and equity-related securities. The investment objective of the international fixed income portfolio is primarily to seek a high total return consistent with preservation of capital.
The Global Franchise, International Real Estate, and U.S. Real Estate Portfolios are currently closed to new investors. However, these Portfolios will continue to offer shares as follows: (1) through certain retirement plan accounts, (2) to clients of registered investment advisors who currently offer shares of the Portfolios in their discretionary asset allocation programs, (3) through certain endowments and foundations, (4) to clients of family office practices where shares of the Portfolios are held by family members of such clients, (5) to directors and trustees of the Morgan Stanley Funds, (6) to Morgan Stanley and its affiliates and their employees, (7) to benefit plans sponsored by Morgan Stanley and its affiliates, and (8) through certain mutual fund wrap programs sponsored by affiliates of the Adviser. The Portfolios will continue to offer shares of the Portfolios to existing shareholders and may recommence offering shares of the Portfolios to other new investors in the future.
The Fund has suspended offering shares of the Small Company Growth Portfolio to new investors. The Fund will continue to offer shares of the Portfolio to existing shareholders. The Fund may recommence offering shares of the Portfolio to new investors in the future.
A. Accounting Policies: The following significant accounting policies are in conformity with U.S. generally accepted accounting principles. Such policies are consistently followed by the Fund in the preparation of the financial statements. U.S. generally accepted accounting principles may require management to make estimates and assumptions that affect the reported amounts and disclosures in the financial statements. Actual results may differ from those estimates.
1. Security Valuation: Securities listed on a foreign exchange are valued at their closing price. Unlisted securities and listed securities not traded on the valuation date for which market quotations are readily available are valued at the mean between the current bid and asked prices obtained from reputable brokers. Equity securities listed on a U.S. exchange are valued at the latest quoted sales price on the valuation date. Equity securities listed or traded on NASDAQ, for which market quotations are available, are valued at the NASDAQ Official Closing Price. Bonds and other fixed income securities may be valued according to the broadest and most representative market. In addition, bonds and other fixed income securities may be valued on the basis of prices provided by a pricing service. The prices provided by a pricing service take into account broker dealer market price quotations for institutional size trading in similar groups of securities, security quality, maturity, coupon and other security characteristics as well as any developments related to the specific securities. Debt securities purchased with remaining maturities of 60 days or less are valued at amortized cost, if it approximates value.
All other securities and investments for which market values are not readily available, including restricted securities, and those securities for which it is inappropriate to determine prices in accordance with the aforementioned procedures, are valued at fair value as determined in good faith under procedures adopted by the Board of Directors (the “Directors”), although the actual calculations may be done by others. Factors considered in making this determination may include, but are not limited to, information obtained by
143
2008 Annual Report |
|
December 31, 2008 |
Notes to Financial Statements (cont’d)
contacting the issuer, analysts, or the appropriate stock exchange (for exchange-traded securities), analysis of the issuer’s financial statements or other available documents and, if necessary, available information concerning other securities in similar circumstances.
Most foreign markets close before the New York Stock Exchange (NYSE). Occasionally, developments that could affect the closing prices of securities and other assets may occur between the times at which valuations of such securities are determined (that is, close of the foreign market on which the securities trade) and the close of business on the NYSE. If these developments are expected to materially affect the value of the securities, the valuations may be adjusted to reflect the estimated fair value as of the close of the NYSE, as determined in good faith under procedures established by the Directors.
2. Foreign Currency Translation and Foreign Investments: The books and records of the Fund are maintained in U.S. dollars. Foreign currency amounts are translated into U.S. dollars at the mean of the bid and asked prices of such currencies against U.S. dollars last quoted by a major bank, prior to the close of the NYSE, as follows:
· | investments, other assets and liabilities-at the prevailing rates of exchange on the valuation date; |
| |
· | investment transactions, investment income and expenses-at the prevailing rates of exchange on the dates of such transactions. |
Although the net assets of the Fund are presented at the foreign exchange rates and market values at the close of the period, the Fund does not isolate that portion of the results of operations arising as a result of changes in the foreign exchange rates from the fluctuations arising from changes in the market prices of securities held at period end. Similarly, the Fund does not isolate the effect of changes in foreign exchange rates from the fluctuations arising from changes in the market prices of securities sold during the period. Accordingly, realized and unrealized foreign currency gains (losses) on investments in securities are included in the reported net realized and unrealized gains (losses) on investment transactions and balances. However, pursuant to U.S. Federal income tax regulations, gains and losses from certain foreign currency transactions and the foreign currency portion of gains and losses realized on sales and maturities of foreign denominated debt securities are treated as ordinary income for U.S. Federal income tax purposes.
Net realized gains (losses) on foreign currency transactions represent net foreign exchange gains (losses) from foreign currency exchange contracts, disposition of foreign currencies, currency gains or losses realized between the trade and settlement dates on securities transactions, and the difference between the amount of investment income and foreign taxes recorded on the Fund’s books and the U.S. dollar equivalent amounts actually received or paid. Net unrealized currency gains (losses) from valuing foreign currency denominated assets and liabilities at period end exchange rates are reflected as a component of unrealized appreciation (depreciation) on the Statements of Assets and Liabilities. The change in net unrealized currency gains (losses) for the period is reflected on the Statements of Operations.
Foreign security and currency transactions may involve certain considerations and risks not typically associated with those of U.S. dollar denominated transactions as a result of, among other factors, fluctuations of exchange rates in relation to the U.S. dollar, the possibility of lower levels of government supervision and regulation of foreign securities markets and the possibility of political or economic instability.
Governmental approval for foreign investments may be required in advance of making an investment under certain circumstances in some countries, and the extent of foreign investments in domestic companies may be subject to limitation in other countries. Foreign ownership limitations also may be imposed by the charters of individual companies to prevent, among other concerns, violations of foreign investment limitations. As a result, an additional class of shares (identified as “Foreign” in the Portfolio of Investments) may be created and offered for investment. The “local” and “foreign shares” market values may differ. In the absence of trading of the foreign shares in such markets, the Fund values the foreign shares at the closing exchange price of the local shares. Such securities, if any, are identified as fair valued on the Portfolio of Investments.
3. Foreign Currency Exchange Contracts: Certain Portfolios may enter into foreign currency exchange contracts generally to attempt to protect securities and related receivables and payables against changes in future foreign currency exchange rates and, in certain situations, to gain exposure to foreign currencies. Certain Portfolios may also enter into cross currency hedges which involve the sale of one currency against the positive exposure to a different currency. Cross currency hedges may be used for hedging purposes or to establish an active exposure to the exchange rate between any two currencies. A foreign currency ex-change contract is an agreement between two parties to buy or sell currency at a set price on a future date. The market value of the contract will fluctuate with changes in currency exchange rates. The contract is marked-to-market
144
| 2008 Annual Report |
| |
| December 31, 2008 |
Notes to Financial Statements (cont’d)
daily and the change in market value is recorded by the Portfolios as unrealized gain or loss. The Portfolios record realized gains or losses when the contract is closed equal to the difference between the value of the contract at the time it was opened and the value at the time it was closed. Credit risk may arise upon entering into these contracts from the potential inability of counterparts to meet the terms of their contracts and is generally limited to the amount of the unrealized gains on the contracts, if any, at the date of default. Risks may also arise from unanticipated movements in the value of a foreign currency relative to the U.S. dollar.
4. Loan Agreements: Certain Portfolios may invest in fixed and floating rate loans (“Loans”) arranged through private negotiations between an issuer of sovereign debt obligations and one or more financial institutions (“Lenders”) deemed to be creditworthy by the investment adviser. A Portfolio’s investments in Loans may be in the form of participation in Loans (“Participation”) or assignments of all or a portion of Loans (“Assignments”) from third parties. A Portfolio’s investment in a Participation typically results in the Portfolio having a contractual relationship with only the Lender and not with the borrower. The Portfolios have the right to receive payments of principal, interest and any fees to which it is entitled only upon receipt by the Lender of the payments from the borrower. The Portfolios generally have no right to enforce compliance by the borrower under the terms of the loan agreement. As a result, the Portfolio may be subject to the credit risk of both the borrower and the Lender that is selling the Participation and any intermediaries between the Lender and the Portfolio. When a Portfolio purchases Assignments from Lenders, it typically acquires direct rights against the borrower on the Loan. Because Assignments are arranged through private negotiations between potential assignees and potential assignors, the rights and obligations acquired by the Portfolio as the purchaser of an Assignment may differ from, and be more limited than, those held by the assigning Lender.
5. Short Sales: Certain Portfolios may sell securities short. A short sale is a transaction in which a Portfolio sells securities it may or may not own, but has borrowed, in anticipation of a decline in the market price of the securities. The Portfolio is obligated to replace the borrowed securities at the market price at the time of replacement. The Portfolio may have to pay a premium to borrow the securities as well as pay any dividends or interest payable on the securities until they are replaced. Dividends and interest payable on such securities sold short are included in dividend expense and interest expense, respectively, in the Statements of Operations. A Portfolio’s obligation to replace the securities borrowed in connection with a short sale will generally be secured by collateral deposited with the broker that consists of cash, U.S. government securities or other liquid, high grade debt obligations. In addition, the Portfolio will either designate on the Portfolio’s records or place in a segregated account with its Custodian an amount of cash, U.S. government securities or other liquid high grade debt obligations equal to the difference, if any, between (1) the market value of the securities sold at the time they were sold short and (2) cash, U.S. government securities or other liquid high grade debt obligations deposited as collateral with the broker in connection with the short sale. Short sales by the Portfolios involve certain risks and special considerations. Possible losses from short sales differ from losses that could be incurred from the purchase of a security, because losses from short sales may be unlimited, whereas losses from purchases cannot exceed the total amount invested.
6. Securities Lending: Certain Portfolios may lend securities to qualified financial institutions, such as broker-dealers, to earn additional income. Any increase or decrease in the fair value of the securities loaned that might occur and any interest earned or dividends declared on those securities during the term of the loan would remain in the Portfolio. Portfolios that lend securities receive cash or securities as collateral in an amount equal to or exceeding 100% of the current fair value of the loaned securities. The collateral is marked to market daily, by the securities lending agent, to ensure that a minimum of 100% collateral coverage is maintained.
Based on pre-established guidelines, the securities lending agent invests any cash collateral that is received in an affiliated money market portfolio and repurchase agreements backed by U.S. Treasury and Agency securities. Securities lending income is generated from the earnings on the invested collateral and borrowing fees, less any rebates owed to the borrowers and compensation to the lending agent, and is included in the Portfolios’ Statements of Operations in interest income. Risks in securities lending transactions are that a borrower may not provide additional collateral when required or return the securities when due, and that the value of the short-term investments will be less than the amount of cash collateral plus any rebate that is required to be returned to the borrower.
145
2008 Annual Report |
|
December 31, 2008 |
Notes to Financial Statements (cont’d)
The value of loaned securities and related collateral outstanding at December 31, 2008 are as follows:
| Value of | | |
| Loaned | | Value of |
| Securities | | Collateral |
Portfolio | (000) | | (000) |
Active International Allocation | $115,931 | | $121,861 |
Emerging Markets | 142,125 | | 151,208 |
Global Real Estate | 48,070 | | 50,999 |
Global Value Equity | 3,217 | | 3,356 |
International Equity | 261,509 | | 274,728 |
International Growth Equity | 8,480 | | 8,841 |
International Real Estate | 46,081 | | 48,749 |
U.S. Real Estate | 128,396 | | 131,746 |
The following Portfolios had income from securities lending (after rebates to borrowers and fees paid to securities lending agent):
| Net Interest |
| Earned by |
| Portfolio |
Portfolio | (000) |
Active International Allocation | $1,491 |
Emerging Markets | 2,121 |
Global Real Estate | 144 |
Global Value Equity | 72 |
International Equity | 7,369 |
International Growth Equity | 116 |
International Real Estate | 429 |
U.S. Real Estate | 1,229 |
Emerging Markets Debt | 8 |
7. Repurchase Agreements: The Portfolios may enter into repurchase agreements under which a Portfolio lends excess cash and takes possession of securities with an agreement that the counterparty will repurchase such securities. In connection with transactions in repurchase agreements, a bank as custodian for the Fund takes possession of the underlying securities which are held as collateral, with a market value at least equal to the amount of the repurchase transaction, including principal and accrued interest. To the extent that any repurchase transaction exceeds one business day, the value of the collateral is marked-to-market on a daily basis to determine the adequacy of the collateral. In the event of default on the obligation to repurchase, the Fund has the right to liquidate the collateral and apply the proceeds in satisfaction of the obligation. In the event of default or bankruptcy by the counterparty to the agreement, realization and/or retention of the collateral or proceeds may be subject to legal proceedings. The Fund, along with other affiliated investment companies, may utilize a joint trading account for the purpose of entering into repurchase agreements.
8. Structured Securities: The Emerging Markets Debt Portfolio may invest in interests in entities organized and operated solely for the purpose of restructuring the investment characteristics of sovereign debt obligations. This type of restructuring involves the deposit with or purchase by an entity of specified instruments and the issuance by that entity of one or more classes of securities (“Structured Securities”) backed by, or representing interests in, the underlying instruments. Structured Securities generally will expose the Portfolio to credit risks of the underlying instruments as well as of the issuer of the structured security. Structured securities are typically sold in private placement transactions with no active trading market. Investments in Structured Securities may be more volatile than their underlying instruments; however, any loss is limited to the amount of the original investment.
9. Futures: Certain Portfolios may purchase and sell futures contracts. Futures contracts provide for the sale by one party and purchase by another party of a specified amount of a specified security, index, instrument or basket of instruments. Futures contracts (secured by cash, government securities or other high grade liquid investments deposited with brokers or custodians as “initial margin”) are valued based upon their quoted daily settlement prices; changes in initial settlement value (represented by cash paid to or received from brokers as “variation margin”) are accounted for as unrealized appreciation (depreciation). When futures contracts are closed, the difference between the opening value at the date the contract was entered into and the value at closing is recorded as a realized gain or loss in the Statements of Operations. Due from (to) broker includes both initial margin and variation margin, as stated in the Statements of Assets and Liabilities.
Certain Portfolios may use futures contracts in order to manage their exposure to the stock and bond markets, to hedge against unfavorable changes in the value of securities or to remain fully invested and to reduce transaction costs. Futures contracts involve market risk in excess of the amounts recognized in the Statements of Assets and Liabilities. Risks arise from the possible movements in security values underlying these instruments. The change in value of futures contracts primarily corresponds with the value of their underlying instruments, which may not correlate with the change in value of hedged investments.
10. Purchased and Written Options: Certain Portfolios may write covered call and put options on portfolio securities and other financial instruments. Premiums are received and are recorded as liabilities. The liabilities are subsequently adjusted to reflect the current value of the options written. Premiums received from writing options which expire are treated as realized gains. Premiums received from writing options which are exercised or are closed are added to or offset against the proceeds or amount paid on the transaction to determine the net realized gain or loss. By writing a covered call option, a Portfolio, in exchange for the premium, foregoes the
146
| 2008 Annual Report |
| |
| December 31, 2008 |
Notes to Financial Statements (cont’d)
opportunity for capital appreciation above the exercise price should the market price of the underlying security increase. By writing a put option, a Portfolio, in exchange for the premium, accepts the risk of having to purchase a security at an exercise price that is above the current market price.
Certain Portfolios may purchase call and put options on their portfolio securities or other financial instruments. Each Portfolio may purchase call options to protect against an increase in the price of the security or financial instrument it anticipates purchasing. Each Portfolio may purchase put options on securities which it holds or other financial instruments to protect against a decline in the value of the security or financial instrument or to close out covered written put positions. Risks may arise from an imperfect correlation between the change in market value of the securities held by the Portfolio and the prices of options relating to the securities purchased or sold by the Portfolio and from the possible lack of a liquid secondary market for an option. The maximum exposure to loss for any purchased option is limited to the premium initially paid for the option.
At December 31, 2008, the Portfolios did not have any outstanding options written.
11. Swap Agreements: Each Portfolio may enter into swap agreements to exchange one return or cash flow for another return or cash flow in order to hedge against unfavorable changes in the value of securities or to remain fully invested and to reduce transaction costs. Securities designated as collateral for swap agreements, if any, are designated as such in the Portfolio of Investments. Cash collateral for swap agreements, if applicable, is deposited with the broker serving as counterparty to the agreement, and is included in “Due from (to) Broker” on the Statement of Assets and Liabilities. The following summarizes swaps which may be entered into by the Portfolio.
Credit Default Swaps: Credit default swaps involve commitments to pay a fixed rate in exchange for payment if a credit event affecting a third party (the referenced company) occurs. Credit events may include a failure to pay interest, bankruptcy, or restructuring. The Portfolio accrues for interim payments on swap contracts on a daily basis, with the net amount recorded within unrealized appreciation (depreciation) of swap contracts on the Statement of Assets and Liabilities. Once interim payments are settled in cash, the net amount is recorded within realized gain (loss) on swaps on the Statement of Operations. Credit default swaps are marked-to-market daily based upon quotations from market makers and the change, if any, is recorded as unrealized appreciation or depreciation in the Statements of Operations.
Interest Rate Swaps: Interest rate swaps involve the exchange of commitments to pay and receive interest based on a notional principal amount. The Portfolio accrues for interim payments on swap contracts on a daily basis, with the net amount recorded within unrealized appreciation (depreciation) of swap contracts on the Statement of Assets and Liabilities. Once interim payments are settled in cash, the net amount is recorded within realized gain (loss) on swaps on the Statement of Operations. In a zero-coupon interest rate swap, payments only occur at maturity, at which time one counterparty pays the total compounded fixed rate over the life of the swap and the other pays the total compounded floating rate that would have been earned had a series of LIBOR investments been rolled over through the life of the swap. The Portfolio amortizes its interest payment obligation over the life of the swap. The amortized portion of this payment is recorded within realized gain (loss) on the Statement of Operations. The unamortized portion of this payment is included in “Due from (to) Broker” on the Statement of Assets and Liabilities. Interest rate swaps are marked-to-market daily based upon quotations from market makers and the change, if any, is recorded as unrealized appreciation or depreciation in the Statement of Operations.
Total Return Swaps: Total return swaps involve commitments to pay interest in exchange for a market-linked return based on a notional amount. To the extent the total return of the security or index underlying the transaction exceeds or falls short of the offsetting interest rate obligation, the Portfolio will receive a payment from or make a payment to the counterparty, respectively. Total return swaps are marked-to-market daily based upon quotations from market makers and the change, if any, is recorded as unrealized appreciation or depreciation in the Statement of Operations. Periodic payments received or made at the end of each measurement period are recorded as realized gains (losses) in the Statement of Operations.
Realized gains (losses) on maturity or termination of swap agreements are presented in the Statement of Operations. Because there is no organized market for these swap agreements, the unrealized gain (loss) reported in the Statement of Assets and Liabilities may differ from that which would be realized in the event the Portfolio terminated its position in the agreement.
Risks may arise upon entering into these agreements from the potential inability of the counterparties to meet the terms of the agreements and are generally limited to the amount of net interest payments to be received, if any, at the date of default. Risks also arise from potential losses from adverse market movements, and such losses could exceed the related amounts shown in the Statement of Assets and Liabilities.
147
2008 Annual Report | |
| |
December 31, 2008 | |
Notes to Financial Statements (cont’d)
12. Contract for Differences (CFDs): CFDs are contracts entered into between a broker and the Portfolio under which the parties agree to make payments to each other so as to replicate the economic consequences that would apply had a purchase or short sale of the underlying security taken place. Upon entering into CFDs, the Portfolio is required to pledge to the broker an amount of cash and/or other assets equal to a certain percentage of the contract amount (margin account). Periodically, payments are made to recognize changes in value of the contract resulting from interest on the notional value of the contract, market value changes in the underlying security, and/or dividends paid by the issuer of the underlying security. The Portfolio recognizes a realized gain or loss when cash is received from, or paid to, the broker. CFDs are valued daily by the Portfolio and the unrealized gains or losses on the contracts (as measured by the difference between the contract amount plus or minus cash received or paid and the market value of the underlying securities) are recorded in the Statement of Operations. The margin account and any net unrealized gains or losses on open CFDs are included in the Statement of Assets and Liabilities. The risks of entering into CFDs include unfavorable price movements in the underlying securities or the inability of the counterparties to fulfill their obligations under the contract.
13. Unfunded Commitments: Subject to the terms of a Subscription Agreement between the U.S. Real Estate Portfolio and BRCP REIT I, LLC the Portfolio has made a subscription commitment of $7,000,000 for which it will receive 7,000,000 shares of common stock. As of December 31, 2008, BRCP REIT I, LLC has drawn down approximately $2,287,000 which represents 32.7% of the commitment.
Subject to the terms of a Subscription Agreement between the U.S. Real Estate Portfolio and BRCP REIT II, LLC the Portfolio has made a subscription commitment of $9,000,000 for which it will receive 9,000,000 shares of common stock. As of December 31, 2008, BRCP REIT II, LLC has drawn down approximately $5,586,000 which represents 49.7% of the commitment.
Subject to the terms of a Subscription Agreement between the Global Real Estate Portfolio and Exeter Industrial Value Fund LP the Portfolio has made a subscription commitment of $2,000,000 for which it will receive 2,000,000 shares of common stock. As of December 31, 2008, Exeter Industrial Value Fund LP has drawn down approximately $800,000 which represents 0.40% of the commitment.
Subject to the terms of a Subscription Agreement between the U.S. Real Estate Portfolio and Exeter Industrial Value Fund LP the Portfolio has made a subscription commitment of $8,500,000 for which it will receive 8,500,000 shares of common stock. As of December 31, 2008, Exeter Industrial Value Fund LP has drawn down approximately $3,400,000 which represents 40.0% of the commitment.
Subject to the terms of a Subscription Agreement between the U.S. Real Estate Portfolio and Keystone Industrial Fund, LP, the Portfolio has made a subscription commitment of $7,500,000 for which it will receive 7,500,000 shares of common stock. As of December 31, 2008, Keystone Industrial Fund, LP has drawn down approximately $5,401,000 which represents 72.0% of the commitment.
Subject to the terms of a Subscription Agreement between the U.S. Real Estate Portfolio and Cabot Industrial Value Fund II, LP, the Portfolio has made a subscription commitment of $7,500,000 for which it will receive 7,500,000 shares of common stock. As of December 31, 2008, Cabot Industrial Value Fund, LP has drawn down approximately $6,334,000 which represents 84.4% of the commitment.
Subject to the terms of a Subscription Agreement between the U.S. Real Estate Portfolio and Cabot Industrial Value Fund III, LP, the Portfolio has made a subscription commitment of $7,500,000 for which it will receive 7,500,000 shares of common stock. As of December 31, 2008, Cabot Industrial Value Fund III, LP has drawn down approximately $111,000 which represents 1.5% of the commitment.
Subject to the terms of a Subscription Agreement between the U.S. Global Real Estate Portfolio and Cabot Industrial Value Fund III, LP, the Portfolio has made a subscription commitment of $7,500,000 for which it will receive 7,500,000 shares of common stock. As of December 31, 2008, Cabot Industrial Value Fund III, LP has drawn down approximately $111,000 which represents 1.5% of the commitment.
14. Redemption Fees: The following redemption fees are designed to protect each Portfolio and its shareholders from the effects of short-term trading. Shares of the Active International Allocation, Emerging Markets, Global Franchise, Global Real Estate, Global Value Equity, International Equity, International Growth Active Extension, International Growth Equity, International Real Estate, International Small Cap, Large Cap Relative Value, Small Company Growth, U.S. Real Estate and Emerging Markets Debt Portfolios redeemed within 30 days of purchase may be subject to a 2% redemption fee. Shares of the Capital Growth, Focus Growth, and U.S. Small/Mid Cap Value Portfolios redeemed within 7 days of purchase may be subject to a 2% redemption fee. These fees, if any, are included on the Statements of Changes in Net Assets.
15. Restricted Securities: Certain Portfolios may invest in unregistered or otherwise restricted securities. The term restricted securities refers to securities that are unregistered
148
| 2008 Annual Report |
| |
| December 31, 2008 |
Notes to Financial Statements (cont’d)
or are held by control persons of the issuer and securities that are subject to contractual restrictions on their resale. As a result, restricted securities may be more difficult to value and the Portfolio may have difficulty disposing of such assets either in a timely manner or for a reasonable price. In order to dispose of an unregistered security, the Portfolio, where it has contractual rights to do so, may have to cause such security to be registered. A considerable period may elapse between the time the decision is made to sell the security and the time the security is registered so that the Portfolio could sell it. Contractual restrictions on the resale of securities vary in length and scope and are generally the result of a negotiation between the issuer and acquirer of the securities. The Portfolio would, in either case, bear market risks during that period.
16. New Accounting Pronouncement: On March 19, 2008, Financial Accounting Standards Board released Statement of Financial Accounting Standards No. 161, “Disclosures about Derivative Instruments and Hedging Activities” (“SFAS 161”). SFAS 161 requires qualitative disclosures about objectives and strategies for using derivatives, quantitative disclosures about fair value amounts of and gains and losses on derivative instruments, and disclosures about credit-risk-related contingent features in derivative agreements. The application of SFAS 161 is required for fiscal years and interim periods beginning after November 15, 2008. At this time, management is evaluating the implications of SFAS 161 and its impact on the financial statements has not yet been determined.
17. Fair Value Measurement: The Portfolios adopted Financial Accounting Standards Board Statement of Financial Accounting Standards No. 157, “Fair Value Measurements” (“SFAS 157”), effective January 1, 2008. In accordance SFAS 157, fair value is defined as the price that the Portfolios would receive to sell an investment or pay to transfer a liability in a timely transaction with an independent buyer in the principal market, or in the absence of a principal market the most advantageous market for the investment or liability. SFAS 157 establishes a three-tier hierarchy to distinguish between (1) inputs that reflect the assumptions market participants would use in valuing an asset or liability developed based on market data obtained from sources independent of the reporting entity (observable inputs) and (2) inputs that reflect the reporting entity’s own assumptions about the assumptions market participants would use in valuing an asset or liability developed based on the best information available in the circumstances (unobservable inputs) and to establish classification of fair value measurements for disclosure purposes. Various inputs are used in determining the value the Portfolios’ investments. The inputs are summarized in the three board levels listed below:
· Level 1 — | quoted prices in active markets for identical securities |
| |
· Level 2 — | other significant observable inputs (including quoted prices for similar securities, interest rates, prepayment speeds, credit risk, etc.) |
| |
· Level 3 — | significant unobservable inputs (including each Portfolio’s own assumptions in determining the fair value of investments) |
The inputs or methodology used for valuing securities, are not necessarily an indication of the risk associated with investing in those securities.
149
2008 Annual Report | |
| |
December 31, 2008 | |
Notes to Financial Statements (cont’d)
The following is a summary of the inputs used as of December 31, 2008 in valuing the Portfolios’ investments carried at value:
| | Investments in
Securities
(Level 1) | | Investments
in
Securities
(Level 2) | | Investments
in
Securities
(Level 3) | | Total for
Investments
in Securities | | Other
Financial
Instrument*
(Level 1) | | Other
Financial
Instrument*
(Level 2) | | Other Financial Instrument*
(Level 3) | | Total for Other
Financial
Instruments | |
| | (000) | | (000) | | (000) | | (000) | | (000) | | (000) | | (000) | | (000) | |
Active International Allocation | | $ 98,729 | | $ 578,882 | | $ 22 | | $ 677,633 | | $228 | | $ 171 | | $— | | $ 399 | |
Emerging Markets | | 372,629 | | 1,043,131 | | — | ** | 1,415,760 | | — | | 561 | | — | | 561 | |
Global Franchise | | 29,723 | | 51,338 | | — | | 81,061 | | — | | 369 | | — | | 369 | |
Global Real Estate | | 237,004 | | 324,386 | | 911 | | 562,301 | | — | | (8 | ) | — | | (8 | ) |
Global Value Equity | | 15,570 | | 23,686 | | — | | 39,256 | | — | | 131 | | — | | 131 | |
International Equity | | 434,572 | | 3,070,500 | | 18,265 | | 3,523,337 | | — | | 31,598 | | — | | 31,598 | |
International Growth Active Extension | | 408 | | 4,428 | | — | | 4,836 | | 76 | | — | | — | | 76 | |
International Growth Equity | | 10,843 | | 39,417 | | — | | 50,260 | | — | | — | | — | | — | |
International Real Estate | | 44,418 | | 439,180 | | — | | 483,598 | | — | | — | | — | | — | |
International Small Cap | | 12,029 | | 305,591 | | — | ** | 317,620 | | — | | (7 | ) | — | | (7 | ) |
Capital Growth | | 555,908 | | 49,435 | | — | ** | 605,343 | | — | | — | | — | | — | |
Focus Growth | | 5,493 | | 531 | | — | | 6,024 | | — | | — | | — | | — | |
Large Cap Relative Value | | 177,005 | | 8,379 | | — | | 185,384 | | — | | — | | — | | — | |
Small Company Growth | | 932,473 | | 35,493 | | 26,085 | | 994,051 | | — | | — | | — | | — | |
U.S. Real Estate | | 622,558 | | 25,982 | | 22,001 | | 670,541 | | — | | — | | — | | — | |
U.S. Small/Mid Cap Value | | 16,270 | | 233 | | — | | 16,503 | | — | | — | | — | | — | |
Emerging Markets Debt | | 3,665 | | 25,684 | | — | | 29,349 | | — | | 15 | | — | | 15 | |
Following is a reconciliation of investments in which significant unobservable inputs (Level 3) were used in determining value for Investment in Securities:
| | Beginning | | Accrued | | | | Change in
unrealized | | | | Net transfers in | | | |
| | Balance as of | | discounts/ | | Realized | | appreciation | | Net purchases | | and/or out of | | Balance as of | |
| | 12/31/07 | | Premiums | | gain (loss) | | (depreciation) | | (sales) | | Level 3 | | 12/31/08 | |
| | (000) | | (000) | | (000) | | (000) | | (000) | | (000) | | (000) | |
Active International Allocation | | $ — | | $— | | $ — | | $ — | | $ — | | $ 22 | | $ 22 | |
Emerging Markets | | — | ** | — | | — | | — | | — | | — | | — | ** |
Global Franchise | | — | | — | | — | | — | | — | | — | | — | |
Global Real Estate | | 200 | | — | | — | | — | | 711 | | — | | 911 | |
Global Value Equity | | — | | — | | — | | — | | — | | — | | — | |
International Equity | | — | | — | | — | | — | | — | | 18,265 | | 18,265 | |
International Growth Active Extension | | — | | — | | — | | — | | — | | — | | — | |
International Growth Equity | | — | | — | | — | | — | | — | | — | | — | |
International Real Estate | | — | | — | | — | | — | | — | | — | | — | |
International Small Cap | | — | ** | — | | — | | — | | — | | — | | — | ** |
Capital Growth | | — | ** | — | | — | | — | | — | | — | | — | ** |
Focus Growth | | — | | — | | — | | — | | — | | — | | — | |
Large Cap Relative Value | | — | | — | | — | | — | | — | | — | | — | |
Small Company Growth | | 7,581 | | — | | — | | 5,510 | | 7,325 | | 5,669 | | 26,085 | |
U.S. Real Estate | | 18,833 | | — | | (1,056 | ) | (40 | ) | 4,264 | | — | | 22,001 | |
U.S. Small/Mid Cap Value | | — | | — | | — | | — | | — | | — | | — | |
Emerging Markets Debt | | 114 | | — | @ | — | | (15 | ) | (99 | ) | — | | — | |
@ | | Amount is less than $500. |
* | | Other financial instruments include futures, forwards, swaps and CFDs. |
** | | Includes a security which is valued at zero. |
150
| 2008 Annual Report |
| |
| December 31, 2008 |
Notes to Financial Statements (cont’d)
Following is the amounts of total gains (losses) for the period included in earnings attributable to the change in un-realized gains (losses) relating to assets and liabilities still held at December 31, 2008:
| Investments | Other Financial |
| in Securities | Instruments |
Portfolio | (000) | (000) |
Active International Allocation | $ (14) | $— |
Emerging Markets | — | — |
Global Franchise | — | — |
Global Real Estate | — | — |
Global Value Equity | — | — |
International Equity | (1,438) | — |
International Growth Active Extension | — | — |
International Growth Equity | — | — |
International Real Estate | — | — |
International Small Cap | — | — |
Capital Growth | — | — |
Focus Growth | — | — |
Large Cap Relative Value | — | — |
Small Company Growth | (3,895) | — |
U.S. Real Estate | (1,301) | — |
U.S. Small/Mid Cap Value | — | — |
Emerging Markets Debt | — | — |
18. Other: Security transactions are accounted for on the date the securities are purchased or sold. Realized gains (losses) on the sale of investment securities are determined on the specific identified cost basis. Dividend income and distributions are recorded on the ex-dividend date (except for certain foreign dividends which may be recorded as soon as the Fund is informed of such dividends) net of applicable withholding taxes. Interest income is recognized on the accrual basis except where collection is in doubt. Discounts and premiums on securities purchased are amortized according to the effective yield method over their respective lives. Most expenses of the Fund can be directly attributed to a particular Portfolio. Expenses which cannot be directly attributed are apportioned among the Portfolios based upon relative net assets or other appropriate measures. Income, expenses (other than class specific expenses) and realized and unrealized gains or losses are allocated to each class of shares based upon their relative net assets.
Certain Portfolios may own shares of real estate investment trusts (“REITs”) which report information on the source of their distributions annually. A portion of distributions received from REITs during the year is estimated to be a return of capital and is recorded as a reduction of their cost.
B. Investment Advisory Fees: Morgan Stanley Investment Management Inc. (the “Adviser” or “MS Investment Management”), a wholly-owned subsidiary of Morgan Stanley, provides the Fund with investment advisory services under the terms of an Investment Advisory Agreement (the “Agreement”) at the annual rates of the average daily net assets indicated below.
| | Average Daily | | Advisory | |
Portfolio | | Net Assets | | Fee | |
Active International Allocation | | first $1.0 billion | | 0.65 | % |
| | over $1.0 billion | | 0.60 | |
Emerging Markets | | first $500 million | | 1.25 | |
| | next $500 million | | 1.20 | |
| | next $1.5 billion | | 1.15 | |
| | over $2.5 billion | | 1.00 | |
Global Franchise | | first $500 million | | 0.80 | |
| | next $500 million | | 0.75 | |
| | over $1.0 billion | | 0.70 | |
Global Real Estate | | | | 0.85 | |
Global Value Equity | | first $1.0 billion | | 0.67 | |
| | next $500 million | | 0.645 | |
| | next $1.0 billion | | 0.62 | |
| | next $1.0 billion | | 0.595 | |
| | next $1.0 billion | | 0.57 | |
| | over $4.5 billion | | 0.545 | |
International Equity | | first $10 billion | | 0.80 | |
| | over $10 billion | | 0.75 | |
International Growth Active Extension | | first $1.0 billion | | 1.15 | |
| | next $500 million | | 1.05 | |
| | over $1.5 billion | | 0.95 | |
International Growth Equity | | first $1.0 billion | | 0.75 | |
| | over $1.0 billion | | 0.70 | |
International Real Estate | | | | 0.80 | |
International Small Cap | | first $1.5 billion | | 0.95 | |
| | over $1.5 billion | | 0.90 | |
Capital Growth | | first $1.0 billion | | 0.50 | |
| | next $1.0 billion | | 0.45 | |
| | next $1.0 billion | | 0.40 | |
| | over $3.0 billion | | 0.35 | |
Focus Growth | | first $1.0 billion | | 0.50 | |
| | next $1.0 billion | | 0.45 | |
| | next $1.0 billion | | 0.40 | |
| | over $3.0 billion | | 0.35 | |
Large Cap Relative Value | | first $150 million | | 0.50 | |
| | next $100 million | | 0.45 | |
| | next $100 million | | 0.40 | |
| | over $350 million | | 0.35 | |
Small Company Growth | | first $1.0 billion | | 0.92 | |
| | next $500 million | | 0.85 | |
| | over $1.5 billion | | 0.80 | |
U.S. Real Estate | | first $500 million | | 0.80 | |
| | next $500 million | | 0.75 | |
| | over $1.0 billion | | 0.70 | |
U.S. Small/Mid Cap Value | | | | 0.67 | |
Emerging Markets Debt | | first $500 million | | 0.75 | |
| | next $500 million | | 0.70 | |
| | over $1.0 billion | | 0.65 | |
MS Investment Management has voluntarily agreed to waive fees payable to it and to reimburse the Portfolios for certain expenses, after giving effect to custody fee offsets, if necessary, if the total annual operating expenses, excluding bank overdraft, certain foreign taxes, transfer agent fees for Class H and Class L Shares and extraordinary expenses as defined,
151
2008 Annual Report | |
| |
December 31, 2008 | |
Notes to Financial Statements (cont’d)
expressed as a percentage of average daily net assets, exceed the maximum ratios indicated as follows:
| | Maximum Expense Ratio | |
| Class I | Class P | Class H | Class L |
Active International Allocation | 0.80 | % | 1.05 | % | N/A | | N/A | |
Emerging Markets | 1.65 | | 1.90 | | N/A | | N/A | |
Global Franchise | 1.00 | | 1.25 | | N/A | | N/A | |
Global Real Estate | 1.05 | | 1.30 | | 1.30 | % | 1.80 | % |
Global Value Equity | 1.00 | | 1.25 | | N/A | | N/A | |
International Equity | 1.00 | | 1.25 | | N/A | | N/A | |
International Growth Active Extension | 1.25 | | 1.50 | | 1.50 | | 2.00 | |
International Growth Equity | 1.00 | | 1.25 | | N/A | | N/A | |
International Real Estate | 1.00 | | 1.25 | | N/A | | N/A | |
International Small Cap | 1.15 | | 1.40 | | N/A | | N/A | |
Capital Growth | 0.80 | | 1.05 | | N/A | | N/A | |
Focus Growth | 1.00 | | 1.25 | | N/A | | N/A | |
Large Cap Relative Value | 0.70 | | 0.95 | | N/A | | N/A | |
Small Company Growth | 1.10 | | 1.35 | | N/A | | N/A | |
U.S. Real Estate | 1.00 | | 1.25 | | N/A | | N/A | |
U.S. Small/Mid Cap Value | N/A | | N/A | | N/A | | N/A | |
Emerging Markets Debt | 0.85 | | 1.10 | | 1.10 | | 1.60 | |
Fee waivers and/or expense reimbursements are voluntary and may be commenced or terminated at any time. For the year ended December 31, 2008, the Portfolios had advisory fees waived and/or certain expenses reimbursed as follows:
| Advisory Fees |
| Waived and/or |
| Reimbursed |
Portfolio | (000) |
Active International Allocation | $202 |
Global Franchise | 15 |
Global Real Estate | 4 |
Global Value Equity | 13 |
International Growth Active Extension | 162 |
International Growth Equity | 69 |
Focus Growth | 37 |
Emerging Markets Debt | 289 |
@ Amount is less than $500.
The Adviser has entered into Sub-Advisory Agreements with Morgan Stanley Investment Management Limited, Morgan Stanley Asset & Investment Trust Management Co., Limited and Morgan Stanley Investment Management Company (each a “Sub- Adviser”), all wholly-owned subsidiaries of Morgan Stanley. The Sub-Advisers, subject to the control and supervision of the Fund, its officers, Directors and the Adviser, and in accordance with the investment objectives, policies and restrictions of the Portfolios, make certain day-to-day investment decisions for certain Portfolios and place certain of the Portfolios’ purchase and sales orders. The Adviser pays the Sub-Advisers on a monthly basis a portion of the net advisory fees the Adviser receives from the Portfolios which receive these services.
C. Administration Fees: MS Investment Management (the “Administrator”) also provides the Fund with administrative services pursuant to an administration agreement for a monthly fee, which on an annual basis equals 0.08% of the average daily net assets of each Portfolio. Under an agreement between the Administrator and JPMorgan Investor Services Co. (“JPMIS”), a corporate affiliate of JPMorgan Chase Bank, N.A., JPMIS provides certain administrative services to the Fund. For such services, the Administrator pays JPMIS a portion of the fee the Administrator receives from the Fund. Administration costs (including out-of-pocket expenses) incurred in the ordinary course of providing services under the administration agreement, except pricing services and extraordinary expenses, are covered under the administration fee. In addition, the Fund incurs local administration fees in connection with doing business in certain emerging market countries.
D. Distribution and Shareholder Servicing Fees: Morgan Stanley Distribution, Inc. (“MSDI” or the “Distributor”), a wholly-owned subsidiary of the Adviser, and an indirect subsidiary of Morgan Stanley, serves as the Fund’s Distributor of Portfolio shares pursuant to a Distribution agreement. The Fund had adopted Shareholder Service Plans with respect to Class P and Class H shares pursuant to Rule 12b-1 under the 1940 Act. Under the Shareholder Service Plans, each applicable Portfolio pays the Distributor a shareholder servicing fee, accrued daily and paid monthly, at an annual rate of 0.25% of the Portfolio’s average daily net assets attributable to Class P and Class H shares.
In addition, the Fund has adopted a Distribution and Shareholder Service Plan with respect to Class L shares pursuant to Rule 12b-1 under the 1940 Act. Under the Distribution and Shareholder Service Plan, each applicable Portfolio pays the Distributor a distribution fee, accrued daily and paid monthly, at an annual rate of 0.50% and a shareholder servicing fee, accrued daily and paid monthly, at an annual rate of 0.25% of the Portfolio’s average daily net assets attributable to Class L shares.
The distribution and shareholder servicing fees are used to support the expenses associated with servicing and maintaining accounts. The Distributor may compensate other parties for providing shareholder support services to investors who purchase Class P, Class H and Class L shares.
E. Dividend Disbursing and Transfer Agent: Effective June 9, 2008, the Fund dividend disbursing and transfer agent is Morgan Stanley Services Company, Inc. (“Morgan Stanley Services”). Pursuant to a Transfer Agency Agreement, the Fund pays Morgan Stanley Services a fee generally based on the number of classes, accounts and transactions relating to the Portfolios of the Fund. Prior to June 9, 2008, JPMorgan Investor Services Company provided dividend disbursing and transfer agency services for the Fund.
152
| 2008 Annual Report |
| |
| December 31, 2008 |
Notes to Financial Statements (cont’d)
F. Custodian Fees: JPMorgan Chase Bank, N.A. (the “Custodian”) serves as Custodian for the Fund in accordance with a custodian agreement. The Custodian holds cash, securities, and other assets of the Fund as required by the 1940Act. The Fund has entered into an arrangement with its Custodian whereby credits realized on uninvested cash balances were used to offset a portion of each applicable Portfolio’s expenses. These custodian credits are shown as “Expense Offset” on the Statements of Operations.
G. Portfolio Investment Activity:
1. Security Transactions: During the year ended December 31, 2008, purchases and sales of investment securities, other than long-term U.S. Government securities and short-term investments, were:
| | Purchases | | Sales | |
Portfolio | | (000) | | (000) | |
Active International Allocation | | $ | 259,782 | | $ | 326,844 | |
Emerging Markets | | 2,343,997 | | 2,740,278 | |
Global Franchise | | 36,208 | | 30,565 | |
Global Real Estate | | 651,622 | | 279,419 | |
Global Value Equity | | 47,010 | | 69,515 | |
International Equity | | 1,579,382 | | 2,590,254 | |
International Growth Active Extension | | 5,923 | | 5,752 | |
International Growth Equity | | | 90,646 | | | 29,720 | |
International Real Estate | | 490,776 | | 658,103 | |
International Small Cap | | 263,953 | | 482,645 | |
Capital Growth | | 495,113 | | 684,778 | |
Focus Growth | | 4,388 | | 6,610 | |
Large Cap Relative Value | | 117,131 | | 131,151 | |
Small Company Growth | | 494,398 | | 603,655 | |
U.S. Real Estate | | 341,251 | | 464,858 | |
U.S. Small/Mid Cap Value | | 19,659 | | 13,780 | |
Emerging Markets Debt | | 86,171 | | 106,659 | |
There were no purchases and sales of long-term U.S. Government securities for the year ended December 31, 2008.
2. Transactions with Affiliates: The Portfolios invest in the Institutional Class of portfolios within the Morgan Stanley Institutional Liquidity Funds (the “Liquidity Funds”), an open-end management investment company managed by the Adviser, both directly, and as a portion of the securities held as collateral on loaned securities. A summary of the Portfolio’s transactions in the shares of the Liquidity Funds during the year ended December 31, 2008 is set forth below:
| | Market Value | | Purchases | | Sales | | Dividend | | Market Value | |
| | December 31, 2007 | | at Cost | | Proceeds | | Income | | December 31, 2008 | |
Portfolio | | (000) | | (000) | | (000) | | (000) | | (000) | |
Active International Allocation | | $ | 71,488 | | $ | 602,581 | | $ | 576,309 | | $3,097 | | $ | 97,760 | |
Emerging Markets | | 35,567 | | 1,117,135 | | 980,528 | | 2,320 | | 172,174 | |
Global Franchise | | 2,268 | | 52,797 | | 52,168 | | 89 | | 2,897 | |
Global Real Estate | | — | | 559,235 | | 510,769 | | 762 | | 48,466 | |
Global Value Equity | | 783 | | 27,751 | | 25,035 | | 56 | | 3,499 | |
International Equity | | 108,256 | | 2,260,205 | | 1,992,338 | | 8,215 | | 376,123 | |
International Growth Active Extension | | 43 | | 5,131 | | 5,162 | | 4 | | 12 | |
International Growth Equity | | 13,311 | | 98,130 | | 103,631 | | 129 | | 7,810 | |
International Real Estate | | — | | 483,863 | | 439,445 | | 938 | | 44,418 | |
International Small Cap | | — | | 244,465 | | 232,436 | | 267 | | 12,029 | |
Capital Growth | | 24,808 | | 461,999 | | 474,835 | | 564 | | 11,972 | |
Focus Growth | | 1,147 | | 4,215 | | 5,311 | | 14 | | 51 | |
Large Cap Relative Value | | 4,943 | | 98,894 | | 93,834 | | 302 | | 10,003 | |
Small Company Growth | | 13,933 | | 378,942 | | 375,640 | | 578 | | 17,235 | |
U.S. Real Estate | | — | | 574,043 | | 463,200 | | 1,557 | | 110,843 | |
U.S. Small/Mid Cap Value | | 1,278 | | 14,422 | | 14,839 | | 36 | | 861 | |
Emerging Markets Debt | | 1,887 | | 70,253 | | 68,475 | | 74 | | 3,665 | |
| | | | | | | | | | | | | | | |
Investment Advisory fees paid by the Portfolios are reduced by an amount equal to their pro-rata share of the advisory and administration fees paid by the Liquidity Funds (“Rebate”). For the year ended December31, 2008, advisory fees paid were reduced as follows:
| | Rebate | |
Portfolio | | (000) | |
Active International Allocation | | $ 83 | |
Emerging Markets | | 54 | |
Global Franchise | | 5 | |
Global Real Estate | | 27 | |
Global Value Equity | | 1 | |
International Equity | | 187 | |
International Growth Active Extension | | — | @ |
International Growth Equity | | 2 | |
International Real Estate | | 24 | |
International Small Cap | | 11 | |
Capital Growth | | 21 | |
Focus Growth | | — | @ |
Large Cap Relative Value | | 12 | |
Small Company Growth | | 20 | |
U.S. Real Estate | | 37 | |
U.S. Small/Mid Cap Value | | 1 | |
Emerging Markets Debt | | 3 | |
@ Amount is less than $500.
153
2008 Annual Report | |
| |
December 31, 2008 | |
Notes to Financial Statements (cont’d)
The Emerging Markets Equity Portfolio invests in Morgan Stanley Growth Fund., a closed-end management investment company advised by an affiliate of the Adviser. The Morgan Stanley Growth Fund was acquired at a cost of $3,415,000.
A summary of the Portfolio’s transactions in shares of the affiliated issuer during the the year ended December 31, 2008 is as follows.
Market Value | | | | Market Value |
December 31, | Purchases | Sales | Dividend | December 31, |
2007 | at Cost | Proceeds | Income | 2008 |
(000) | (000) | (000) | (000) | (000) |
$28,374 | — | — | — | $11,192 |
The Active International Allocation Portfolio invests in Mitsubishi UFJ Financial Group, Inc and Mitsubishi UFL Lease & Finance Co., Ltd.., affiliates of the Adviser. The Mitsubishi UFJ Financial Group, Inc. and Mitsubishi UFL Lease & Finance Co., Ltd., were acquired at a cost of $8,810,000 and $28,000, respectively.
A summary of the Portfolio’s transactions in shares of The Mitsubishi UFJ Financial Group, Inc. and Mitsubishi UFL Lease & Finance Co., Ltd. during the the year ended December 31, 2008 is as follows.
Market Value | | | | Market Value |
December 31, | Purchases | Sales | Dividend | December 31, |
2007 | at Cost | Proceeds | Income | 2008 |
(000) | (000) | (000) | (000) | (000) |
$7,897 | $133 | $2,105 | $117 | $5,087 |
— | 28 | — | — | @ | 15 |
The Large Cap Relative Value Portfolio invests in Mitsubishi UFJ Financial Group, Inc. ADR, an affiliate of the Adviser. The Mitsubishi UFJ Financial Group, Inc. ADR, was acquired at a cost of $550,000.
A summary of the Portfolio’s transactions in shares of the affiliated issuer during the the year ended December 31, 2008 is as follows.
Market Value | | | | Market Value |
December 31, | Purchases | Sales | Dividend | December 31, |
2007 | at Cost | Proceeds | Income | 2008 |
(000) | (000) | (000) | (000) | (000) |
$— | $550 | — | $4 | $368 |
During the year ended December 31, 2008, the following Portfolios incurred brokerage commissions with Morgan Stanley & Co. Incorporated, an affiliated broker/dealer:
| | Broker | |
| | Commissions | |
Portfolio | | (000) | |
Emerging Markets | | $68 | |
Global Franchise | | — | @ |
Global Real Estate | | 91 | |
Global Value Equity | | 2 | |
International Growth Active Extension | | — | @ |
International Real Estate | | 77 | |
Capital Growth | | 6 | |
Large Cap Relative Value | | 2 | |
Small Company Growth | | 2 | |
U.S. Small/Mid Cap Value | | 3 | |
U.S. Real Estate | | 24 | |
@ Amount is less than $500.
Additionally, during the year ended December 31, 2008, Emerging Markets Portfolio incurred approximately $44,000 in brokerage commissions with China International Capital Corporation (Hong Kong) Limited (CICC), an affiliated broker/dealer.
H. Federal Income Taxes: It is each Portfolio’s intention to qualify as a regulated investment company and distribute all of its taxable and tax-exempt income. Accordingly, no provision for Federal income taxes is required in the financial statements. Dividend income and distributions to shareholders are recorded on the ex-dividend date.
A Portfolio may be subject to taxes imposed by countries in which it invests. Such taxes are generally based on income and/or capital gains earned or repatriated. Taxes are accrued based on net investment income, net realized gains and net unrealized appreciation as income and/or capital gains are earned. Taxes may also be based on the movement of foreign currency and are accrued based on the value of investments denominated in such currency.
Financial Accounting Standards Board Interpretation No. 48 Accounting for Uncertainty in Income Taxes (FIN 48) sets forth a minimum threshold for financial statement recognition of the benefit of a tax position taken or expected to be taken in a tax return. Management has concluded there are no significant un-certain tax positions that would require recognition in the financial statements. If applicable, the Portfolios recognize interest accrued related to unrecognized tax benefits in “Interest Expense” and penalties in “Other” expenses on the Statement of Operations. The Portfolios file tax returns with the U.S. Internal Revenue Service, New York and various states. Generally, each of the tax years in the four year period ended December 31, 2008, remains subject to examination by taxing authorities.
The tax character of distributions paid may differ from the character of distributions shown on the Statements of Changes in Net Assets due to short-term capital gains being treated as
154
| 2008 Annual Report |
| |
| December 31, 2008 |
Notes to Financial Statements (cont’d)
ordinary income for tax purposes. The tax character of distributions paid during fiscal 2008 and 2007 were as follows:
| | 2008 | | 2007 | |
| | Distributions | | Distributions | |
| | Paid From: | | Paid From: | |
| | Ordinary | | Long-term | | Ordinary | | Long-term | |
| | Income | | Capital Gain | | Income | | Capital Gain | |
Portfolio | | (000) | | (000) | | (000) | | (000) | |
Active International Allocation | | $ 9,170 | | $ 40,185 | | $ 43,168 | | $ 50,249 | |
Emerging Markets | | 46,243 | | 110,850 | | 111,228 | | 501,698 | |
Global Franchise | | 6,027 | | 1,482 | | 1,348 | | 17,751 | |
Global Real Estate | | 1,678 | | 2,130 | | 31,622 | | 3,308 | |
Global Value Equity | | 2,472 | | 712 | | 2,759 | | 13,384 | |
International Equity* | | 105,453 | | 309,605 | | 205,097 | | 800,160 | |
International Growth Active Extension | | 151 | | — | | — | | — | |
International Growth Equity | | 1,891 | | 267 | | 127 | | 260 | |
International Real Estate | | 152 | | 5,259 | | 91,243 | | 63,755 | |
International Small Cap | | 13,263 | | 30,493 | | 21,636 | | 212,655 | |
Capital Growth | | 4,769 | | 1,427 | | 5,423 | | — | |
Focus Growth | | 24 | | — | | 22 | | — | |
Large Cap Relative Value | | 4,799 | | 1,219 | | 5,050 | | 11,838 | |
Small Company Growth | | — | | — | | — | | 82,806 | |
U.S. Real Estate | | 20,213 | | 70,297 | | 69,511 | | 339,875 | |
U.S. Small/Mid Cap Value | | 31 | | — | | 18 | | — | |
Emerging Markets Debt | | 989 | | — | | 4,283 | | — | |
*Amounts based on October 31 tax year end.
The amount and character of income and gains to be distributed are determined in accordance with income tax regulations which may differ from U.S. generally accepted accounting principles. These book/tax differences are either considered temporary or permanent in nature.
Temporary differences are generally due to differing book and tax treatments for the timing of the recognition of gains (losses) on certain investment transactions and the timing and the deductibility of certain expenses.
Permanent differences, primarily due to differing treatments of gains (losses) related to REIT adjustments, foreign currency transactions, foreign futures and options transactions, short sales, defaulted bonds, paydown adjustments, return of capital from certain securities, expiring capital losses, distribution redesignations, foreign taxes paid on capital gains, net operating losses, nondeductible expenses, certain equity securities designated as issued by “passive foreign investment companies” and excess distributions resulted in the following reclassifications among the Portfolios’ components of net assets at December 31, 2008:
| | Accumulated | | | | | |
| | Undistributed | | | | | |
| | (Distributions in | | | | | |
| | Excess of) Net | | Accumulated | | | |
| | Investment | | Net Realized | | Paid-in | |
| | Income (Loss) | | Gain (Loss) | | Capital | |
Portfolio | | (000) | | (000) | | (000) | |
Active International Allocation | | $(10,538 | ) | $10,538 | | $ — | @ |
Emerging Markets | | (2,191 | ) | 5,759 | | (3,568 | ) |
Global Franchise | | 3,607 | | (3,607 | ) | — | |
Global Real Estate | | 476 | | (267 | ) | (209 | ) |
Global Value Equity | | 957 | | (955 | ) | (2 | ) |
International Equity | | (12,811 | ) | 6,509 | | 6,302 | |
International Growth Active Extension | | 16 | | (1 | ) | (15 | ) |
International Growth Equity | | 23 | | (23 | ) | — | |
International Real Estate | | 7,426 | | (6,001 | ) | (1,425 | ) |
International Small Cap | | 763 | | (763 | ) | — | |
Capital Growth | | 2,188 | | (51 | ) | (2,137 | ) |
Focus Growth | | 30 | | (3 | ) | (27 | ) |
Large Cap Relative Value | | (1 | ) | 1 | | — | |
Small Company Growth | | 2,515 | | 98 | | (2,613 | ) |
U.S. Real Estate | | (1,006 | ) | 3,810 | | (2,804 | ) |
U.S. Small/Mid Cap Value | | 1 | | — | @ | (1 | ) |
Emerging Markets Debt | | (1,963 | ) | 2,411 | | (448 | ) |
@ Amount is less than $500.
At December 31, 2008, the components of distributable earnings on a tax basis were as follows:
| | Undistributed | | Undistributed | |
| | Ordinary | | Long-term | |
| | Income | | Capital Gain | |
Portfolio | | (000) | | (000) | |
Active International Allocation | | $ 1,349 | | $ — | |
Global Franchise | | 1,058 | | — | |
Global Real Estate | | 210 | | — | |
Global Value Equity | | 312 | | 5 | |
International Growth Equity | | 11 | | — | |
International Small Cap | | 768 | | — | |
Large Cap Relative Value | | 30 | | — | |
U.S. Real Estate | | 283 | | — | |
Emerging Markets Debt | | 353 | | — | |
Any Portfolios not shown above had no distributable earnings on a tax basis at December 31, 2008.
At December 31, 2008, cost, unrealized appreciation, unrealized depreciation, and net unrealized appreciation (depreciation) for U.S. Federal income tax purposes of the investments of each of the Portfolios were:
| | | | | | | | Net | |
| | | | | | | | Appreciation | |
| | Cost | | Appreciation | | Depreciation | | (Depreciation) | |
Portfolio | | (000) | | (000) | | (000) | | (000) | |
Active International Allocation | | $ | 827,982 | | $ | 26,940 | | $ | (177,289 | ) | $ (150,349 | ) |
Emerging Markets | | 2,029,918 | | 34,955 | | (649,113 | ) | (614,158 | ) |
Global Franchise | | 95,100 | | 3,847 | | (17,886 | ) | (14,039 | ) |
Global Real Estate | | 1,023,759 | | 1,442 | | (462,900 | ) | (461,458 | ) |
Global Value Equity | | 37,023 | | 2,628 | | (395 | ) | 2,233 | |
International Equity | | 4,304,732 | | 198,286 | | (979,681 | ) | (781,395 | ) |
International Growth Active Extension | | 11,053 | | 76 | | (4,564 | ) | (4,488 | ) |
International Growth Equity | | 81,353 | | 359 | | (31,452 | ) | (31,093 | ) |
International Real Estate | | 1,093,832 | | 6 | | (610,240 | ) | (610,234 | ) |
International Small Cap | | 462,496 | | 15,315 | | (160,191 | ) | (144,876 | ) |
| | | | | | | | | | | | |
155
2008 Annual Report | |
| |
December 31, 2008 | |
Notes to Financial Statements (cont’d)
| | | | | | | | Net | |
| | | | | | | | Appreciation | |
| | Cost | | Appreciation | | Depreciation | | (Depreciation) | |
Portfolio | | (000) | | (000) | | (000) | | (000) | |
Capital Growth | | $ | 905,650 | | $ 23,264 | | $(323,571 | ) | $(300,307 | ) |
Focus Growth | | 9,833 | | 157 | | (3,966 | ) | (3,809 | ) |
Large Cap Relative Value | | 234,089 | | 5,879 | | (54,584 | ) | (48,705 | ) |
Small Company Growth | | 1,467,403 | | 90,653 | | (564,005 | ) | (473,352 | ) |
U.S. Real Estate | | 957,567 | | 4,499 | | (291,525 | ) | (287,026 | ) |
U.S. Small/Mid Cap Value | | 22,982 | | 194 | | (6,673 | ) | (6,479 | ) |
Emerging Markets Debt | | 33,525 | | 113 | | (4,289 | ) | (4,176 | ) |
| | | | | | | | | | |
At December 31, 2008, the following Portfolios had available capital loss carryforwards to offset future net capital gains, to the extent provided by regulations, through the indicated expiration dates:
Portfolio | | 2009 | | 2010 | | 2011 | | 2012 | | 2015 | | 2016 | | Total | |
Active International Allocation | | $ | — | | $ | — | | $ | — | | $ | — | | $ | — | | $ | 1,241 | | $ | 1,241 | |
Global Franchise | | — | | — | | — | | — | | — | | 275 | | 275 | |
Global Real Estate | | — | | — | | — | | — | | — | | 54,045 | | 54,045 | |
International Growth Active Extension | | — | | — | | — | | — | | 52 | | 1,194 | | 1,246 | |
International Growth Equity | | — | | — | | — | | — | | — | | 5,211 | | 5,211 | |
International Real Estate | | — | | — | | — | | — | | — | | 98,798 | | 98,798 | |
International Small Cap | | — | | — | | — | | — | | — | | 31,842 | | 31,842 | |
Capital Growth | | — | | — | | — | | — | | — | | 61,044 | | 61,044 | |
Focus Growth | | — | | 15,905 | | — | | 296 | | — | | 334 | | 16,535 | |
Large Cap Relative Value* | | 16,090 | | 32,107 | | — | | — | | — | | 2,911 | | 51,108 | |
Small Company Growth* | | — | | 14,422 | | — | | — | | — | | 5,069 | | 19,491 | |
U.S. Real Estate | | — | | — | | — | | — | | — | | 10,379 | | 10,379 | |
U.S. Small Mid Cap Value | | — | | — | | — | | — | | — | | 1,751 | | 1,751 | |
| | | | | | | | | | | | | | | | | | | | | | |
* Capital loss carryover from target fund.
The amounts reflected in the capital loss carryforward table for Large Cap Relative Value Portfolio represent capital loss carryforward brought forward as a result of the Portfolio’s merger with the MSIFT Equity Portfolio. Based on certain provisions in the Internal Revenue Code, various limitations regarding the future utilization of these carryforwards may apply. This acquired capital loss carryforward is expected to expire between 2009-2010.
In addition, the amounts reflected in the capital loss carryforward table above for the Small Company Growth Portfolio represent capital loss carryforward acquired from MSIFT Small Cap Growth Portfolio after limitations pursuant to Internal Revenue Code, Section 383. This aquired capital loss carryforward is expected to expire in 2010.
During the year ended December 31, 2008, the following Portfolios utilized capital loss carryforwards for U.S. Federal income tax purposes of approximately:
| Capital Loss |
| Carryforward |
| Utilized |
Portfolio | (000) |
Emerging Markets Debt | 778 |
To the extent that capital loss carryovers are used to offset any future capital gains realized during the carryover period as provided by U.S. Federal income tax regulations, no capital gains tax liability will be incurred by a Portfolio for gains realized and not distributed. To the extent that capital gains are offset, such gains will not be distributed to the shareholders.
Net capital, passive investment company (PFIC), and currency losses incurred after October 31, and within the taxable year are deemed to arise on the first day of the Portfolio’s next taxable year. For the year ended December 31, 2008, the Portfolio deferred to January 2, 2009 for U.S. Federal income tax purposes, post-October capital, PFIC and currency losses as indicated:
| | Capital | | Currency | | PFIC | |
| | Losses | | Losses | | Losses | |
Portfolio | | (000) | | (000) | | (000) | |
Active International Allocation | | $ 10,760 | | $ — | | $ — | |
Emerging Markets | | 196,824 | | — | | — | |
Global Real Estate | | 44,620 | | — | | — | |
Global Value Equity | | 14,730 | | — | | 25 | |
International Growth Active Extension | | 584 | | — | | — | |
International Growth Equity | | 4,363 | | 24 | | — | |
International Real Estate | | 42,341 | | 135 | | — | |
International Small Cap | | 32,177 | | — | | — | |
Capital Growth | | 46,658 | | — | | — | |
Focus Growth | | 308 | | — | @ | — | |
Large Cap Relative Value | | 11,498 | | — | | — | |
U.S. Real Estate | | 64,021 | | — | @ | — | |
U.S. Small/Mid Cap Value | | 2,220 | | — | | — | |
Emerging Markets Debt | | 442 | | 221 | | — | |
@ Amount is less than $500.
For the year ended December 31, 2008, the Emerging Markets Debt Portfolio realized losses from in-kind redemptions of approximately $669,000. The losses are not taxable income to the Portfolio.
I. Contractual Obligations: The Fund enters into contracts that contain a variety of indemnifications. The Fund’s maximum exposure under these arrangements is unknown. However, the Fund has not had prior claims or losses pursuant to these contracts and expects the risk of loss to be remote.
J. Other: The net assets of certain Portfolios include foreign denominated securities and currency. Changes in currency exchange rates will affect the U.S. dollar value of and investment income from such securities. Further, at times certain of the Portfolios’ investments are concentrated in a
156
| 2008 Annual Report |
| |
| December 31, 2008 |
Notes to Financial Statements (cont’d)
limited number of countries and regions. This concentration may further increase the risk of the Portfolio.
Global Real Estate, International Real Estate and U.S. Real Estate Portfolios invest a significant portion of their assets in securities of real estate investment trusts (REIT). The market’s perception of prospective declines in private real estate values and other financial assets may result in increased volatility of market prices that can negatively impact the valuation of certain issuers held by the Portfolios.
The Emerging Markets Debt Portfolio holds a significant portion of its investments in securities which are traded by a small number of market makers who may also be utilized by the Portfolio to provide pricing information used to value such investments. The amounts realized upon disposition of these securities may differ from the value reflected on the Statements of Assets and Liabilities.
Settlement and registration of foreign securities transactions may be subject to significant risks not normally associated with investments in the United States. In certain markets, including Russia, ownership of shares is defined according to entries in the issuer’s share register. In Russia, currently no central registration system exists and the share registrars may not be subject to effective state supervision. It is possible that a Portfolio could lose its share registration through fraud, negligence or even mere oversight. In addition, shares being delivered for sales and cash being paid for purchases may be delivered before the exchange is complete. This may subject the Portfolio to further risk of loss in the event of counterparty’s failure to complete the transaction.
At December 31, 2008, certain Portfolios had otherwise unaffiliated record owners of 10% or greater. Investment activities of these shareholders could have a material impact on these Portfolios.
These Portfolios and the aggregate percentage of such owners were as follows:
| | Percentage of Ownership | |
Portfolio | | Class I | | Class P | | Class H | | Class L | |
Active International Allocation | | — | % | 17.1 | % | — | % | — | % |
Emerging Markets | | 50.1 | | 86.0 | | — | | — | |
Global Franchise | | 80.0 | | — | | — | | — | |
Global Real Estate | | 34.7 | | 86.4 | | — | | — | |
Global Value Equity | | 66.0 | | 93.2 | | — | | — | |
International Equity | | 11.0 | | 73.7 | | — | | — | |
International Growth Active Extension | | — | | — | | — | | — | |
International Growth Equity | | 98.9 | | 27.8 | | — | | — | |
International Real Estate | | 48.5 | | 15.1 | | — | | — | |
International Small Cap | | 24.9 | | — | | — | | — | |
Capital Growth | | 32.4 | | 80.7 | | — | | — | |
Focus Growth | | — | | 22.3 | | — | | — | |
Large Cap Relative Value | | 80.7 | | 97.8 | | — | | — | |
Small Company Growth | | 35.2 | | 63.2 | | — | | — | |
U.S. Real Estate | | 36.9 | | 74.7 | | — | | — | |
U.S. Small/Mid Cap Value | | 22.6 | | — | | — | | — | |
Emerging Markets Debt | | 15.6 | | 59.2 | | — | | — | |
K. Subsequent Event: On November 19, 2008, the Board of Directors of the Fund approved, subject to shareholder approval, the merger of Global Value Equity Portfolio into Global Franchise Portfolio. Completion of the merger is subject to a number of conditions, including approval by the shareholders of the Fund.
157
2008 Annual Report | |
| |
December 31, 2008 | |
Report of Independent Registered Public Accounting Firm
To the Shareholders and Board of Directors of
Morgan Stanley Institutional Fund, Inc.
We have audited the accompanying statements of assets and liabilities of Active International Allocation Portfolio, Emerging Markets Portfolio, Global Franchise Portfolio, Global Real Estate Portfolio, Global Value Equity Portfolio, International Equity Portfolio, International Growth Active Extension Portfolio, International Growth Equity Portfolio, International Real Estate Portfolio, International Small Cap Portfolio, Capital Growth Portfolio, Focus Growth Portfolio, Large Cap Relative Value Portfolio, Small Company Growth Portfolio, U.S. Real Estate Portfolio, Emerging Markets Debt Portfolio, and U.S. Small/Mid Cap Value Portfolio (the “Portfolios”) (seventeen of the Portfolios comprising Morgan Stanley Institutional Fund, Inc.), including the portfolios of investments, as of December 31, 2008, and the related statements of operations for the year then ended, the statement of cash flows for the International Growth Active Extension Portfolio for the year then ended and the statements of changes in net assets and financial highlights for each of the periods indicated therein. These financial statements and financial highlights are the responsibility of the Portfolios’ management. Our responsibility is to express an opinion on these financial statements and financial highlights based on our audits.
We conducted our audits in accordance with the standards of the Public Company Accounting Oversight Board (United States). Those standards require that we plan and perform the audit to obtain reasonable assurance about whether the financial statements and financial highlights are free of material misstatement. We were not engaged to perform an audit of the Portfolios’ internal control over financial reporting. Our audits included consideration of internal control over financial reporting as a basis for designing audit procedures that are appropriate in the circumstances, but not for the purpose of expressing an opinion on the effectiveness of the Portfolios’ internal control over financial reporting. Accordingly, we express no such opinion. An audit also includes examining, on a test basis, evidence supporting the amounts and disclosures in the financial statements and financial highlights, assessing the accounting principles used and significant estimates made by management, and evaluating the overall financial statement presentation. Our procedures included confirmation of securities owned as of December 31, 2008, by correspondence with the custodian and brokers, or by other appropriate auditing procedures where replies from brokers were not received. We believe that our audits provide a reasonable basis for our opinion.
In our opinion, the financial statements and financial highlights referred to above present fairly, in all material respects, the financial position of each of the aforementioned portfolios comprising Morgan Stanley Institutional Fund, Inc. at December 31, 2008, the results of their operations for the year then ended, the cash flows for the aforementioned portfolio for the year then ended and the statements of changes in net assets and financial highlights for each of the periods indicated therein, in conformity with U.S. generally accepted accounting principles.

Boston, Massachusetts
February 20, 2009
158
| 2008 Annual Report |
| |
| December 31, 2008 |
Federal Income Tax Information: (unaudited)
For Federal income tax purposes, the following information is furnished with respect to the distributions paid by each applicable Portfolio during the taxable year ended December 31, 2008.
For corporate shareholders, the following percentages of dividends paid by each Portfolio qualified for the dividends received deduction. Additionally, the following percentages of each Portfolio’s dividends was attributable to qualifying U.S. Government obligations. (Please consult your tax advisor to determine if any portion of the dividends you received is exempt from state income tax.):
| | Div. Received | | Qualifying U.S. | |
Portfolio | | Deduction % | | Govt. Income % | |
Active International Allocation | | 19.6 | % | — | % |
Global Franchise | | 20.0 | | — | |
Global Real Estate | | 34.0 | | — | |
Global Value Equity | | 20.2 | | — | |
International Growth Active Extension | | 1.7 | | — | |
Capital Growth | | 96.4 | | — | |
Focus Growth | | 100.0 | | — | |
Large Cap Relative Value | | 100.0 | | — | |
U.S. Real Estate | | 9.9 | | — | |
U.S. Small/Mid Cap Value | | 80.8 | | — | |
Each of the applicable Portfolios designated and paid the following amounts as a long-term capital gain distribution:
| | Amount | |
Portfolio | | (000) | |
Active International Allocation | | $ | 40,186 | |
Emerging Markets | | 110,850 | |
Global Franchise | | 1,482 | |
Global Real Estate | | 2,130 | |
Global Value Equity | | 712 | |
International Equity | | 309,605 | |
International Growth Equity | | 267 | |
International Real Estate | | 5,259 | |
International Small Cap | | 30,493 | |
Capital Growth | | 1,427 | |
Large Cap Relative Value | | 1,219 | |
U.S. Real Estate | | 70,297 | |
| | | | |
159
2008 Annual Report | |
| |
December 31, 2008 | |
Federal Income Tax Information: (cont’d)
For Federal income tax purposes, the following information is furnished with respect to the earnings of each applicable Portfolio for the taxable year ended December 31, 2008.
When distributed, certain earnings may be subject to a maximum tax rate of 15% as provided for the Jobs and Growth Tax Relief Reconciliation Act of 2004. Each of the applicable Portfolios designated up to the following maximum amounts as taxable at this lower rate:
| | Amount | |
Portfolio | | (000) | |
Active International Allocation | | $ | 9,351 | |
Emerging Markets | | 3,210 | |
Global Franchise | | 4,669 | |
Global Real Estate | | 1,929 | |
Global Value Equity | | 1,572 | |
International Growth Equity | | 1,585 | |
International Small Cap | | 14,539 | |
Capital Growth | | 4,764 | |
Focus Growth | | 24 | |
Large Cap Relative Value | | 4,798 | |
U.S. Small/Mid Cap Value | | 21 | |
| | | | |
The following Portfolios intend to pass through foreign tax credits and have derived net income from sources within foreign countries amounting to:
| | Foreign Tax | | Net Foreign | |
| | Credits | | Source Income | |
Portfolio | | (000) | | (000) | |
Active International Allocation | | $ | 1,046 | | $ | 28,882 | |
Emerging Markets | | 3,204 | | 55,334 | |
Global Franchise | | 229 | | 3,019 | |
Global Real Estate | | 345 | | 13,977 | |
Global Value Equity | | 47 | | 1,412 | |
International Equity | | 435 | | 181,732 | |
International Growth Active Extension | | 28 | | 426 | |
International Growth Equity | | 52 | | 2,504 | |
International Small Cap | | 1,277 | | 19,203 | |
| | | | | | | |
In January, each applicable Portfolio provides tax information to shareholders for the preceding calendar year.
160
| 2008 Annual Report |
| |
| December 31, 2008 |
U.S. Privacy Policy (unaudited)
AN IMPORTANT NOTICE CONCERNING OUR U.S. PRIVACY POLICY
Morgan Stanley Institutional Fund, Inc. (collectively, the “Fund”) is required by federal law to provide you with a copy of their Privacy Policy (“the Policy”) annually.
This Policy applies to individual clients who are current and former advisory clients of certain Morgan Stanley Investment Management’s U.S. investment advisers and to current and former individual investors in the Fund. This Policy is not applicable to partnerships, corporations, trusts or other non-individual clients or account holders, nor is this Policy applicable to individuals who are either beneficiaries of a trust for which we serve as trustee or participants in an employee benefit plan administered or advised by us. This Policy is, however, applicable to individuals who select us to be a custodian of securities or assets in individual retirement accounts, 401(k) accounts, or accounts subject to the Uniform Gifts to Minors Act.
Please note that we may amend this Policy at any time, and will inform you of any changes to this Policy as required by law.
WE RESPECT YOUR PRIVACY
We appreciate that you have provided us with your personal financial information and understand your concerns about safeguarding such information. We strive to maintain the privacy of such information while we help you achieve your financial objectives.
This Policy describes what nonpublic personal information we collect about you, how we collect it, when we may share it with others, and how others may use it. It discusses the steps you may take to limit our sharing of information about you with affiliated Morgan Stanley companies (“other Morgan Stanley companies”), including but not limited to our global financial services affiliates that are part of our integrated securities and investment management business, and our credit services affiliates. It also discloses how you may limit our affiliates’ use of shared information for marketing purposes.
Throughout this Policy, we refer to the nonpublic information that personally identifies you or your accounts as “personal information.”
1. WHAT PERSONAL INFORMATION DO WE COLLECT ABOUT YOU?
To better serve you and manage our business, it is important that we collect and maintain accurate information about you. We obtain this information from applications and other forms you submit to us, from your dealings with us, from consumer reporting agencies and from third parties and other sources. For example:
· We collect information such as your name, address, e-mail address, phone number and account title.
· We may obtain information about account balances, your use of account(s) and the types of products and services you prefer to receive from us through your dealings and transactions with us and other sources.
· We may obtain information about your creditworthiness and credit history from consumer reporting agencies.
· We may collect background information from and through third-party vendors to verify representations you have made and to comply with various regulatory requirements.
2. WHEN DO WE DISCLOSE PERSONAL INFORMATION WE COLLECT ABOUT YOU?
To provide you with the products and services you request, to better serve you, to manage our business and as otherwise required or permitted by law, we may disclose personal information we collect about you to other Morgan Stanley companies and to nonaffiliated third parties.
a. Information we disclose to other Morgan Stanley companies:
In order to manage your account(s) effectively, including servicing and processing your transactions, to let you know about products and services offered by us and other Morgan Stanley companies, to manage our business, and as otherwise required or permitted by law, we may disclose personal information to other Morgan Stanley companies. Offers for products and services from other Morgan Stanley companies are developed under conditions designed to safeguard your personal information.
161
2008 Annual Report | |
| |
December 31, 2008 | |
U.S. Privacy Policy (cont’d)
b. Information we discloses to third parties:
We do not disclose personal information that we collect about you to nonaffiliated third parties except to enable them to provide marketing services on our behalf, to perform joint marketing agreements with other financial institutions, and as otherwise required or permitted by law. For example, some instances where we may disclose information about you to third parties include: for servicing and processing transactions, to offer our own products and services, to protect against fraud, for institutional risk control, to respond to judicial process or to perform services on our behalf.
Morgan Stanley recognizes that your relationship with your Financial Advisor is important. If your Financial Advisor’s affiliation with Morgan Stanley ends and he/she joins a nonaffiliated securities broker-dealer with which Morgan Stanley has entered into an agreement limiting the use of information, Morgan Stanley will permit your Financial Advisor to retain certain of your contact information, limited to your name, address, e-mail address, phone number and account title.
When we share personal information with a nonaffiliated third party, they are required to limit their use of personal information to the particular purpose for which it was shared and they are not allowed to share personal information with others except to fulfill that limited purpose.
3. HOW DO WE PROTECT THE SECURITY AND CONFIDENTIALITY OF PERSONAL INFORMATION WE COLLECT ABOUT YOU?
We maintain physical, electronic and procedural security measures to help safeguard the personal information we collect about you. We have internal policies governing the proper handling of client information. Third parties that provide support or marketing services on our behalf may also receive personal information, and we require them to adhere to confidentiality standards with respect to such information.
4. HOW CAN YOU LIMIT THE SHARING OF CERTAIN TYPES OF PERSONAL INFORMATION WITH OTHER MORGAN STANLEY COMPANIES?
We respect your privacy and offer you choices as to whether we share with other Morgan Stanley companies personal information that was collected to determine your eligibility for products and services you request (“eligibility information”). Please note that, even if you direct us not to share eligibility information with other Morgan Stanley companies (“opt-out”), we may still share personal information, including eligibility information, with those companies in circumstances excluded from the opt-out under applicable law, such as to process transactions or to service your account. We may also share certain other types of personal information with other Morgan Stanley companies—such as your name, address, telephone number, e-mail address and account number(s), and information about your transactions and experiences with us.
5. HOW CAN YOU LIMIT THE USE OF CERTAIN TYPES OF PERSONAL INFORMATION BY OTHER MORGAN STANLEY COMPANIES FOR MARKETING?
You may limit other Morgan Stanley companies from marketing their products or services to you based on your personal information that they receive from other Morgan Stanley companies. This information includes your income, assets and account history. Your choice to limit marketing offers from other Morgan Stanley companies will apply until you tell us to change your choice.
162
| 2008 Annual Report |
| |
| December 31, 2008 |
U.S. Privacy Policy (cont’d)
If you wish to opt-out of sharing and to limit marketing offers, you may do so by:
· Calling us at (800) 548-7786
Monday—Friday between 8 a.m. and 5 p.m. (ET)
· Writing to us at the following address:
Morgan Stanley Institutional Fund, Inc.
c/o Morgan Stanley Services Company, Inc.
PO Box 219804
Kansas City, MO 64121-9804
If you choose to write to us, your written request should include your name, address, telephone number and account number(s) to which the opt-out applies and should not be sent with any other correspondence. In order to process your request, we require that the request be provided by you directly and not through a third party.
If you have previously notified us about your privacy preferences, it is not necessary to do so again unless you decide to change your preferences. Your opt-out preference will remain in effect with respect to this Policy (as it may be amended) until you notify us otherwise in writing. If you have a joint account, your direction for us not to share this information with other Morgan Stanley companies and for those Morgan Stanley companies not to use your personal information for marketing will be applied to all account holders on that account.
Please understand that if you opt-out, you and any joint account holders may not receive information about Morgan Stanley products and services that could help you manage your financial resources and achieve your investment objectives.
If you hold more than one account with Morgan Stanley, you may receive multiple privacy policies from us, and would need to follow the directions stated in each particular policy for each account you have with us.
SPECIAL NOTICE TO RESIDENTS OF VERMONT
This section supplements our Policy with respect to our individual clients who have a Vermont address and supersedes anything to the contrary in the above Policy with respect to those clients only.
The State of Vermont requires financial institutions to obtain your consent prior to sharing personal information that they
collect about you with affiliated companies and nonaffiliated third parties other than in certain limited circumstances. Except as permitted by law, we will not share personal information we collect about you with nonaffiliated third parties or other Morgan Stanley companies unless you provide us with your written consent to share such information (“opt-in”).
If you wish to receive offers for investment products and services offered by or through other Morgan Stanley companies, please notify us in writing at the following address:
Morgan Stanley Institutional Fund, Inc.
c/o Morgan Stanley Services Company, Inc.
PO Box 219804
Kansas City, MO 64121-9804
Your authorization should include your name, address, telephone number and account number(s) to which the opt-in applies and should not be sent with any other correspondence. In order to process your authorization, we require that the authorization be provided by you directly and not through a third-party.
© 2009 Morgan Stanley Institutional Fund, Inc.
163
2008 Annual Report | |
| |
December 31, 2008 | |
Director and Officer Information (unaudited)
Independent Directors:
Name, Age and Address of
Independent Director | | Position(s) Held
with Registrant | | Length of
Time Served* | | Principal Occupation(s) During Past 5 Years | | Number of
Portfolios in
Fund Complex
Overseen by
Independent
Director** | | Other Directorships Held by
Independent Directors |
Frank L. Bowman (64)
c/o Kramer Levin Naftalis &
Frankel LLP
Counsel to the Independent
Trustees
1177 Avenue of the Americas
New York, NY 10036 | | Director | | Since August 2006 | | President, Strategic Decisions, LLC (consulting) (since February 2009); Director or Trustee of various Retail Funds and Institutional Funds (since August 2006); Chairperson of the Insurance Sub-Committee of the Insurance, Valuation and Compliance Committee (since February 2007); served as President and Chief Executive Officer of the Nuclear Institute (policy organization) through November 2008; retired as Admiral in the U.S. Navy in January 2005 after serving over 8 years as Director of the Naval Nuclear Propulsion Program and Deputy Administrator—Naval Reactors in the National Nuclear Security Administration at the U.S. Department of Energy (1996-2004). Knighted as Honary Knight Commander of the Most Excellent Order of the British Empire; awarded the Officer de l’Orde National du Mérite by the French Government. | | 161 | | Director of Armed Services YMCA of the USA; member, BP America External Advisory Council (energy); member, National Academy of Engineers. |
| | | | | | | | | | |
Michael Bozic (68
c/o Kramer Levin Naftalis &
Frankel LLP
Counsel to the Independent
Directors
1177 Avenue of the Americas
New York, NY 10036 | | Director | | Since April 1994 | | Private investor; Chairperson of the Insurance, Valuation and Compliance Committee (since October 2006); Director or Trustee of the Retail Funds (since April 1994) and Institutional Funds (since July 2003); formerly, Chairperson of the Insurance Committee (July 2006-September 2006), Vice Chairman of Kmart Corporation (December 1998-October 2000), Chairman and Chief Executive Officer of Levitz Furniture Corporation (November 1995-November 1998) and President and Chief Executive Officer of Hills Department Stores (May 1991-July 1995); variously Chairman, Chief Executive Officer, President and Chief Operating Officer (1987-1991) of the Sears Merchandise Group of Sears Roebuck & Co. | | 163 | | Director of various business organizations. |
| | | | | | | | | | |
Kathleen A. Dennis (55)
c/o Kramer Levin Naftalis &
Frankel LLP
Counsel to the Independent
Directors
1177 Avenue of the Americas
New York, NY 10036 | | Director | | Since August 2006 | | President, Cedarwood Associates (mutual fund and investment management) (since July 2006); Chairperson of the Money Market and Alternatives Sub-Committee of the Investment Committee (since October 2006) and Director or Trustee of various Retail Funds and Institutional Funds (since August 2006); formerly, Senior Managing Director of Victory Capital Management (1993-2006). | | 161 | | Director of various non-profit organizations. |
| | | | | | | | | | |
Dr. Manuel H. Johnson (60
c/o Johnson Smick
Group, Inc.
888 16th Street, N.W.
Suite 740
Washington, D.C. 20006 | | Director | | Since July 1991 | | Senior Partner, Johnson Smick International, Inc. (consulting firm); Chairperson of the Investment Committee (since October 2006) and Director or Trustee of the Retail Funds (since July 1991) and Institutional Funds (since July 2003); Co-Chairman and a founder of the Group of Seven Council (G7C) (international economic commission); formerly, Chairperson of the Audit Committee (July 1991- September 2006); Vice Chairman of the Board of Governors of the Federal Reserve System and Assistant Secretary of the U.S. Treasury. | | 163 | | Director of NVR, Inc. (home construction); Director of Evergreen Energy. |
| | | | | | | | | | |
Joseph J. Kearns (66)
c/o Kearns & Associates LLC
PMB754
23852 Pacific Coast Highway
Malibu, CA 90265 | | Director | | Since August 1994 | | President, Kearns & Associates LLC (investment consulting); Chairperson of the Audit Committee (since October 2006) and Director or Trustee of the Retail Funds (since July 2003) and the Institutional Funds (since August 1994); formerly Deputy Chairperson of the Audit Committee (July 2003-September 2006) and Chairperson of the Audit Committee of the Institutional Funds (October 2001- July 2003); CFO of the J. Paul Getty Trust. | | 164 | | Director of Electro Rent Corporation (equipment leasing) and The Ford Family Foundation. |
164
| 2008 Annual Report |
| |
| December 31, 2008 |
Director and Officer Information (cont’d)
Independent Directors: (cont’d)
Name, Age and Address of Independent Director | | Position(s) Held
with Registrant | | Length of
Time Served* | | Principal Occupation(s) During Past 5 Years | | Number of Portfolios in Fund Complex Overseen by Independent Director** | | Other Directorships Held by
Independent Directors |
Michael F. Klein (50)
c/o Kramer Levin Naftalis &
Frankel LLP
Counsel to the
Independent Directors
1177 Avenue of the Americas
New York, NY 10036 | | Director | | Since August 2006 | | Chief Operating Officer and Managing Director, Aetos Capital, LLC (since March 2000) and Co-President, Aetos Alternatives Management, LLC (since January 2004); Chairperson of the Fixed Income Sub-Committee of the Investment Committee (since October 2006) and Director or Trustee of various Retail Funds and Institutional Funds (since August 2006); formerly, Managing Director, Morgan Stanley & Co. Inc. and Morgan Stanley Dean Witter Investment Management, President, Morgan Stanley Institutional Funds (June 1998-March 2000) and Principal, Morgan Stanley & Co. Inc. and Morgan Stanley Dean Witter Investment Management (August 1997-December 1999). | | 161 | | Director of certain investment funds managed or sponsored by Aetos Capital LLC; Director of Sanitized AG and Sanitized Marketing AG (specialty chemicals). |
| | | | | | | | | | |
Michael E. Nugent (72)
c/o Triumph Capital, L.P.
445 Park Avenue
New York, NY 10022 | | Chairperson of the Board and Director | | Chairperson of the Boards since July 2006 and Director since July 1991 | | General Partner, Triumph Capital, L.P. (private investment partnership); Chairman of the Boards of the Retail Funds and Institutional Funds (since July 2006); Director or Trustee of the Retail Funds (since July 1991) and Institutional Funds (since July 2001); formerly, Chairperson of the Insurance Committee (until July 2006). | | 163 | | None. |
| | | | | | | | | | |
W. Allen Reed (61)†
c/o Kramer Levin Naftalis &
Frankel LLP
Counsel to the
Independent Directors
1177 Avenue of the Americas
New York, NY 10036 | | Director | | Since August 2006 | | Chairperson of the Equity Sub-Committee of the Investment Committee (since October 2006) and Director or Trustee of various Retail and Institutional Funds (since August 2006); formerly, President and CEO of General Motors Asset Management; Chairman and Chief Executive Officer of the GM Trust Bank and Corporate Vice President of General Motors Corporation (July 1994-December 2005). | | 161 | | Director of Temple-Inland Industries (packaging and forest products); Director of Legg Mason, Inc. and Director of the Auburn University Foundation. |
| | | | | | | | | | |
Fergus Reid (76)
c/o Lumelite Plastics
Corporation
85 Charles Coleman Blvd.
Pawling, NY 12564 | | Director | | Since June 1992 | | Chairman of Lumelite Plastics Corporation; Chairperson of the Governance Committee and Director or Trustee of the Retail Funds (since July 2003) and Institutional Funds (since June 1992). | | 164 | | Trustee and Director of certain investment companies in the JPMorgan Funds complex managed by JP Morgan Investment Management Inc. |
165
2008 Annual Report | |
| |
December 31, 2008 | |
Director and Officer Information (cont’d)
Interested Directors:
Name, Age and Address of Interested Director | | Position(s) Held with
Registrant | | Term of Office
and Length of
Time Served* | | Principal Occupation(s) During Past 5 Years | | Number of Portfolios in Fund Complex Overseen by Interested Director** | | Other Directorships Held by
Interested Director |
James F. Higgins (61) c/o Morgan Stanley Trust Harborside Financial Center Plaza Two Jersey City, NJ 07311 | | Director | | Since June 2000 | | Director or Trustee of the Retail Funds (since June 2000) and Institutional Funds (since July 2003); Senior Advisor of Morgan Stanley (since August 2000). | | 162 | | Director of AXA Financial, Inc. and The Equitable Life Assurance Society of the United States (financial services). |
* This is the earliest date the Director began serving the Retail Funds or Institutional Funds. Each Director serves an indefinite term, until his or her successor is elected.
** The Fund Complex includes all funds advised by Morgan Stanley Investment Management Inc. (“MSIM”) that have an investment advisor that is an affiliated entity of MSIM (including but not limited to, Morgan Stanley Investment Advisors Inc. (“MSIA”) and Morgan Stanley AIP GP LP). The Retail Funds are those funds advised by MSIA. The Institutional Funds are certain U.S. registered funds advised by MSIM and Morgan Stanley AIP GP LP.
† For the period September 26, 2008 through February 5, 2009 W. Allen Reed was an Interested Director. At all other times covered by this report, Mr. Reed was an Independent Director.
166
| 2008 Annual Report |
| |
| December 31, 2008 |
Director and Officer Information (cont’d)
Officers:
Name, Age and Address of Executive Officer | | Position(s)
Held with
Registrant | | Term of Office
and Length of
Time Served* | | Principal Occupation(s) During Past 5 Years |
Randy Takian (34)
Morgan Stanley Investment Management Inc.
522 Fifth Avenue
New York, NY 10036 | | President and Principal Executive Officer | | Since September 2008 | | President and Principal Executive Officer (since September 2008) of funds in the Fund Complex; President and Chief Executive Officer of Morgan Stanley Services Company Inc. (since September 2008). President of Morgan Stanley Investment Advisors Inc. (since July 2008). Head of the Retail and Intermediary business within Morgan Stanley Investment Management (since July 2008). Head of Liquidity and Bank Trust business (since July 2008) and the Latin American franchise (since July 2008) at Morgan Stanley Investment Management. Managing Director, Director and/or Officer of the Adviser and various entities affiliated with the Adviser. Formerly, Head of Strategy and Product Development for the Alternatives Group and Senior Loan Investment Management. Formerly with Bank of America (July 1996 - March 2006), most recently as Head of the Strategy, Mergers and Acquisitions team for Global Wealth and Investment Management. |
| | | | | | |
Kevin Klingert (46)
Morgan Stanley Investment Management Inc.
522 Fifth Avenue
New York, NY 10036 | | Vice President | | Since June 2008 | | Global Head, Chief Operating Officer and acting Chief Investment Officer of the Global Fixed Income Group of the Adviser and Morgan Stanley Investment Advisors Inc. (since April 2008). Head of Global Liquidity Portfolio Management and co-Head of Liquidity Credit Research of Morgan Stanley Investment Management (since December 2007). Managing Director of the Adviser and Morgan Stanley Investment Advisors Inc. (since December 2007). Previously, Managing Director on the Management Committee and head of Municipal Portfolio Management and Liquidity at BlackRock (October 1991 to January 2007). |
| | | | | | |
Amy R. Doberman (46)
Morgan Stanley Investment Management Inc.
522 Fifth Avenue
New York, NY 10036 | | Vice President | | Since July 2004 | | Managing Director of Morgan Stanley Investment Management (since July 2004); Vice President of the Retail Funds and Institutional Funds (since July 2004); Vice President of the Van Kampen Funds (since August 2004); Secretary (since February 2006) and Managing Director (since July 2004) of the Adviser and various entities affiliated with the Adviser. Formerly, Managing Director and General Counsel—Americas, UBS Global Asset Management (July 2000 - July 2004). |
| | | | | | |
Carsten Otto (45)
Morgan Stanley Investment Management Inc.
522 Fifth Avenue
New York, NY 10036 | | Chief Compliance Officer | | Since October 2004 | | Managing Director and Global Head of Compliance for Morgan Stanley Investment Management (since April 2007) and Chief Compliance Officer of the Retail Funds and Institutional Funds (since October 2004). Formerly, U.S. Director of Compliance (October 2004 - April 2007) and Assistant Secretary and Assistant General Counsel of the Retail Funds. |
| | | | | | |
Stefanie V. Chang Yu (42)
Morgan Stanley Investment Management Inc.
522 Fifth Avenue
New York, NY 10036 | | Vice President | | Since December 1997 | | Managing Director of the Adviser and various entities affiliated with the Adviser; Vice President of the Retail Funds (since July 2002) and Institutional Funds (since December 1997). Formerly, Secretary of various entities affiliated with the Adviser. |
| | | | | | |
Mary E. Mullin (41)
Morgan Stanley Investment Management Inc.
522 Fifth Avenue
New York, NY 10036 | | Secretary | | Since June 1999 | | Executive Director of the Adviser and various entities affiliated with the Adviser; Secretary of the Retail Funds (since July 2003) and Institutional Funds (since June 1999). |
| | | | | | |
James W. Garrett (40)
Morgan Stanley Investment Management Inc.
522 Fifth Avenue
New York, NY 10036 | | Treasurer and Chief Financial Officer | | Treasurer since February 2002 and Chief Financial Officer since July 2003 | | Head of Global Fund Administration; Managing Director of the Adviser and various entities affiliated with the Adviser; Treasurer and Chief Financial Officer of the Institutional Funds. |
* | This is the earliest date the Officer began serving the Retail Funds or Institutional Funds. Each Officer serves an indefinite term, until his or her successor is elected. |
167
2008 Annual Report |
|
December 31, 2008 |
Investment Adviser and Administrator
Morgan Stanley Investment Management Inc.
522 Fifth Avenue
New York, NY 10036
Distributor
Morgan Stanley Distribution, Inc.
One Tower Bridge Road
100 Front Street, Suite 1100
West Conshohocken, PA 19428-2899
Dividend Disbursing and Transfer Agent
Morgan Stanley Services Company Inc.
P.O. Box 219804
Kansas City, MO 64121-9804
Custodian
JPMorgan Chase Bank, N.A.
270 Park Avenue
New York, NY 10017
Legal Counsel
Clifford Chance US LLP
31 West 52nd Street
New York, NY 10019-6131
Independent Registered Public Accounting Firm
Ernst & Young LLP
200 Clarendon Street
Boston, MA 02116-5072
Reporting to Shareholders
Each Morgan Stanley Fund provides a complete schedule of portfolio holdings in its semi-annual and annual reports within 60 days of the end of the Fund’s second and fourth fiscal quarters. The semi-annual reports and the annual reports are filed electronically with the Securities and Exchange Commission (SEC) on Form N-CSRS and Form N-CSR, respectively. Morgan Stanley also delivers the semi-annual and annual reports to Fund shareholders and makes these reports available on its public website, www.morganstanley.com/msim. Each Morgan Stanley Fund also files a complete schedule of portfolio holdings with the SEC for the Fund’s first and third fiscal quarters on Form N-Q. Morgan Stanley does not deliver the reports for the first and third fiscal quarters to shareholders, nor are the reports posted to the Morgan Stanley public website. You may, however, obtain the Form N-Q filings (as well as the Form N-CSR and N-CSRS filings) by accessing the SEC’s website, www.sec.gov. You may also review and copy them at the SEC’s public reference room in Washington, DC. Information on the operation of the SEC’s Public Reference Room may be obtained by calling the SEC at 1(800) SEC-0330. You can also request copies of these materials, upon payment of a duplicating fee, by electronic request at the SEC’s email address (publicinfo@sec.gov) or by writing the Public Reference section of the SEC, Washington, DC 20549-0102.
The Fund’s Statement of Additional Information contains additional information about the Fund, including its Directors. It is available, without charge, by calling 1-800-281-2715
Proxy Voting Policies and Procedures and Proxy Voting Record
You may obtain a copy of the Fund’s Proxy Voting Policy and Procedures and information regarding how the Fund voted proxies relating to portfolio securities during the most recent twelve-month period ended June 30, without charge, upon request, by calling 1(800) 548-7786 or by visiting our website at www.morganstanley.com/msim. This information is also available on the SEC’s website at www.sec.gov.
This report is authorized for distribution only when preceded or accompanied by a prospectus of the Morgan Stanley Institutional Fund, Inc. which describes in detail each Investment Portfolio’s investment policies, risks, fees and expenses. Please read the prospectus carefully before you invest or send money. For additional information, including information regarding the investments comprising the Portfolio, please visit our website at www.morganstanley.com/msim or call 1(800) 548-7786.
168
Printed in U.S.A.
This Report has been prepared for shareholders and may be distributed
to others only if preceded or accompanied by a current prospectus.
Morgan Stanley Investment Management Inc.
522 Fifth Avenue
New York, NY 10036
MSIF: (800) 548-7786
© 2009 Morgan Stanley

| MSIFTANN
IU09-00533P-Y12/08 |
Item 2. Code of Ethics.
(a) The Fund has adopted a code of ethics (the “Code of Ethics”) that applies to its principal executive officer, principal financial officer, principal accounting officer or controller, or persons performing similar functions, regardless of whether these individuals are employed by the Fund or a third party.
(b) No information need be disclosed pursuant to this paragraph.
(c) Not applicable.
(d) Not applicable.
(e) Not applicable.
(f)
(1) The Fund’s Code of Ethics is attached hereto as Exhibit 12 A.
(2) Not applicable.
(3) Not applicable.
Item 3. Audit Committee Financial Expert.
The Fund’s Board of Trustees has determined that Joseph J. Kearns, an “independent” Trustee, is an “audit committee financial expert” serving on its audit committee. Under applicable securities laws, a person who is determined to be an audit committee financial expert will not be deemed an “expert” for any purpose, including without limitation for the purposes of Section 11 of the Securities Act of 1933, as a result of being designated or identified as an audit committee financial expert. The designation or identification of a person as an audit committee financial expert does not impose on such person any duties, obligations, or liabilities that are greater than the duties, obligations, and liabilities imposed on such person as a member of the audit committee and Board of Trustees in the absence of such designation or identification.
Item 4. Principal Accountant Fees and Services.
(a)(b)(c)(d) and (g). Based on fees billed for the periods shown:
2008
| | Registrant | | Covered Entities(1) | |
Audit Fees | | $ | 619,350 | | N/A | |
| | | | | |
Non-Audit Fees | | | | | |
Audit-Related Fees | | | | $ | 742,276 | (2) |
Tax Fees | | $ | 77,990 | (3) | $ | 99,522 | (4) |
All Other Fees | | | | $ | 246,887 | (5) |
Total Non-Audit Fees | | $ | 77,990 | | $ | 1,088,685 | |
| | | | | |
Total | | $ | 697,340 | | $ | 1,088,685 | |
2007
| | Registrant | | Covered Entities(1) | |
Audit Fees | | $ | 724,100 | | N/A | |
| | | | | |
Non-Audit Fees | | | | | |
Audit-Related Fees | | $ | | | $ | 731,800 | (2) |
Tax Fees | | $ | 71,650 | (3) | $ | 104,020 | (4) |
All Other Fees | | $ | | | $ | 166,270 | (5) |
Total Non-Audit Fees | | $ | 71,650 | | $ | 1,002,090 | |
| | | | | |
Total | | $ | 795,750 | | $ | 1,002,090 | |
N/A- Not applicable, as not required by Item 4.
(1) | Covered Entities include the Adviser (excluding sub-advisors) and any entity controlling, controlled by or under common control with the Adviser that provides ongoing services to the Registrant. |
| |
(2) | Audit-Related Fees represent assurance and related services provided that are reasonably related to the performance of the audit of the financial statements of the Covered Entities and funds advised by the Adviser or its affiliates, specifically attestation services provided in connection with a SAS 70 Report and advisory consulting work. |
| |
(3) | Tax Fees represent tax advice and compliance services provided in connection with the review of the Registrant’s tax returns. |
| |
(4) | Tax Fees represent tax advice services provided to Covered Entities, including research and identification of PFIC entities. |
| |
(5) | All Other Fees represent attestation services provided in connection with performance presentation standards and a compliance review project performed |
1
(e)(1) The audit committee’s pre-approval policies and procedures are as follows:
APPENDIX A
AUDIT COMMITTEE
AUDIT AND NON-AUDIT SERVICES
PRE-APPROVAL POLICY AND PROCEDURES
OF THE
MORGAN STANLEY RETAIL AND INSTITUTIONAL FUNDS
AS ADOPTED AND AMENDED JULY 23, 2004,(1)
1. Statement of Principles
The Audit Committee of the Board is required to review and, in its sole discretion, pre-approve all Covered Services to be provided by the Independent Auditors to the Fund and Covered Entities in order to assure that services performed by the Independent Auditors do not impair the auditor’s independence from the Fund.
The SEC has issued rules specifying the types of services that an independent auditor may not provide to its audit client, as well as the audit committee’s administration of the engagement of the independent auditor. The SEC’s rules establish two different approaches to pre-approving services, which the SEC considers to be equally valid. Proposed services either: may be pre-approved without consideration of specific case-by-case services by the Audit Committee (“general pre-approval”); or require the specific pre-approval of the Audit Committee or its delegate (“specific pre-approval”). The Audit Committee believes that the combination of these two approaches in this Policy will result in an effective and efficient procedure to pre-approve services performed by the Independent Auditors. As set forth in this Policy, unless a type of service has received general pre-approval, it will require specific pre-approval by the Audit Committee (or by any member of the Audit Committee to which pre-approval authority has been delegated) if it is to be provided by the Independent Auditors. Any proposed services exceeding pre-approved cost levels or budgeted amounts will also require specific pre-approval by the Audit Committee.
The appendices to this Policy describe the Audit, Audit-related, Tax and All Other services that have the general pre-approval of the Audit Committee. The term of any general pre-approval is 12 months from the date of pre-approval, unless the Audit Committee considers and provides a different period and states otherwise. The Audit Committee will annually review and pre-approve the services that may be provided by the Independent Auditors without obtaining specific pre-approval from the Audit
(1) This Audit Committee Audit and Non-Audit Services Pre-Approval Policy and Procedures (the “Policy”), adopted as of the date above, supersedes and replaces all prior versions that may have been adopted from time to time.
2
Committee. The Audit Committee will add to or subtract from the list of general pre-approved services from time to time, based on subsequent determinations.
The purpose of this Policy is to set forth the policy and procedures by which the Audit Committee intends to fulfill its responsibilities. It does not delegate the Audit Committee’s responsibilities to pre-approve services performed by the Independent Auditors to management.
The Fund’s Independent Auditors have reviewed this Policy and believes that implementation of the Policy will not adversely affect the Independent Auditors’ independence.
2. �� Delegation
As provided in the Act and the SEC’s rules, the Audit Committee may delegate either type of pre-approval authority to one or more of its members. The member to whom such authority is delegated must report, for informational purposes only, any pre-approval decisions to the Audit Committee at its next scheduled meeting.
3. Audit Services
The annual Audit services engagement terms and fees are subject to the specific pre-approval of the Audit Committee. Audit services include the annual financial statement audit and other procedures required to be performed by the Independent Auditors to be able to form an opinion on the Fund’s financial statements. These other procedures include information systems and procedural reviews and testing performed in order to understand and place reliance on the systems of internal control, and consultations relating to the audit. The Audit Committee will approve, if necessary, any changes in terms, conditions and fees resulting from changes in audit scope, Fund structure or other items.
In addition to the annual Audit services engagement approved by the Audit Committee, the Audit Committee may grant general pre-approval to other Audit services, which are those services that only the Independent Auditors reasonably can provide. Other Audit services may include statutory audits and services associated with SEC registration statements (on Forms N-1A, N-2, N-3, N-4, etc.), periodic reports and other documents filed with the SEC or other documents issued in connection with securities offerings.
The Audit Committee has pre-approved the Audit services in Appendix B.1. All other Audit services not listed in Appendix B.1 must be specifically pre-approved by the Audit Committee (or by any member of the Audit Committee to which pre-approval has been delegated).
4. Audit-related Services
Audit-related services are assurance and related services that are reasonably related to the performance of the audit or review of the Fund’s financial statements and, to the extent they are Covered Services, the Covered Entities or that are traditionally performed by the Independent Auditors. Because the Audit Committee believes that the provision of Audit-related services does not impair the independence of the auditor and is consistent with the SEC’s rules on auditor independence, the Audit Committee may grant general
3
pre-approval to Audit-related services. Audit-related services include, among others, accounting consultations related to accounting, financial reporting or disclosure matters not classified as “Audit services”; assistance with understanding and implementing new accounting and financial reporting guidance from rulemaking authorities; agreed-upon or expanded audit procedures related to accounting and/or billing records required to respond to or comply with financial, accounting or regulatory reporting matters; and assistance with internal control reporting requirements under Forms N-SAR and/or N-CSR.
The Audit Committee has pre-approved the Audit-related services in Appendix B.2. All other Audit-related services not listed in Appendix B.2 must be specifically pre-approved by the Audit Committee (or by any member of the Audit Committee to which pre-approval has been delegated).
5. Tax Services
The Audit Committee believes that the Independent Auditors can provide Tax services to the Fund and, to the extent they are Covered Services, the Covered Entities, such as tax compliance, tax planning and tax advice without impairing the auditor’s independence, and the SEC has stated that the Independent Auditors may provide such services.
Pursuant to the preceding paragraph, the Audit Committee has pre-approved the Tax Services in Appendix B.3. All Tax services in Appendix B.3 must be specifically pre-approved by the Audit Committee (or by any member of the Audit Committee to which pre-approval has been delegated).
6. All Other Services
The Audit Committee believes, based on the SEC’s rules prohibiting the Independent Auditors from providing specific non-audit services, that other types of non-audit services are permitted. Accordingly, the Audit Committee believes it may grant general pre-approval to those permissible non-audit services classified as All Other services that it believes are routine and recurring services, would not impair the independence of the auditor and are consistent with the SEC’s rules on auditor independence.
The Audit Committee has pre-approved the All Other services in Appendix B.4. Permissible All Other services not listed in Appendix B.4 must be specifically pre-approved by the Audit Committee (or by any member of the Audit Committee to which pre-approval has been delegated).
7. Pre-Approval Fee Levels or Budgeted Amounts
Pre-approval fee levels or budgeted amounts for all services to be provided by the Independent Auditors will be established annually by the Audit Committee. Any proposed services exceeding these levels or amounts will require specific pre-approval by the Audit Committee. The Audit Committee is mindful of the overall relationship of fees for audit and non-audit services in determining whether to pre-approve any such services.
4
8. Procedures
All requests or applications for services to be provided by the Independent Auditors that do not require specific approval by the Audit Committee will be submitted to the Fund’s Chief Financial Officer and must include a detailed description of the services to be rendered. The Fund’s Chief Financial Officer will determine whether such services are included within the list of services that have received the general pre-approval of the Audit Committee. The Audit Committee will be informed on a timely basis of any such services rendered by the Independent Auditors. Requests or applications to provide services that require specific approval by the Audit Committee will be submitted to the Audit Committee by both the Independent Auditors and the Fund’s Chief Financial Officer, and must include a joint statement as to whether, in their view, the request or application is consistent with the SEC’s rules on auditor independence.
The Audit Committee has designated the Fund’s Chief Financial Officer to monitor the performance of all services provided by the Independent Auditors and to determine whether such services are in compliance with this Policy. The Fund’s Chief Financial Officer will report to the Audit Committee on a periodic basis on the results of its monitoring. Both the Fund’s Chief Financial Officer and management will immediately report to the chairman of the Audit Committee any breach of this Policy that comes to the attention of the Fund’s Chief Financial Officer or any member of management.
9. Additional Requirements
The Audit Committee has determined to take additional measures on an annual basis to meet its responsibility to oversee the work of the Independent Auditors and to assure the auditor’s independence from the Fund, such as reviewing a formal written statement from the Independent Auditors delineating all relationships between the Independent Auditors and the Fund, consistent with Independence Standards Board No. 1, and discussing with the Independent Auditors its methods and procedures for ensuring independence.
10. Covered Entities
Covered Entities include the Fund’s investment adviser(s) and any entity controlling, controlled by or under common control with the Fund’s investment adviser(s) that provides ongoing services to the Fund(s). Beginning with non-audit service contracts entered into on or after May 6, 2003, the Fund’s audit committee must pre-approve non-audit services provided not only to the Fund but also to the Covered Entities if the engagements relate directly to the operations and financial reporting of the Fund. This list of Covered Entities would include:
Morgan Stanley Retail Funds
Morgan Stanley Investment Advisors Inc.
Morgan Stanley & Co. Incorporated
Morgan Stanley DW Inc.
Morgan Stanley Investment Management Inc.
Morgan Stanley Investment Management Limited
Morgan Stanley Investment Management Private Limited
Morgan Stanley Asset & Investment Trust Management Co., Limited
Morgan Stanley Investment Management Company
Van Kampen Asset Management
5
Morgan Stanley Services Company, Inc.
Morgan Stanley Distributors Inc.
Morgan Stanley Trust FSB
Morgan Stanley Institutional Funds
Morgan Stanley Investment Management Inc.
Morgan Stanley Investment Advisors Inc.
Morgan Stanley Investment Management Limited
Morgan Stanley Investment Management Private Limited
Morgan Stanley Asset & Investment Trust Management Co., Limited
Morgan Stanley Investment Management Company
Morgan Stanley & Co. Incorporated
Morgan Stanley Distribution, Inc.
Morgan Stanley AIP GP LP
Morgan Stanley Alternative Investment Partners LP
(e)(2) Beginning with non-audit service contracts entered into on or after May 6, 2003, the audit committee also is required to pre-approve services to Covered Entities to the extent that the services are determined to have a direct impact on the operations or financial reporting of the Registrant. 100% of such services were pre-approved by the audit committee pursuant to the Audit Committee’s pre-approval policies and procedures (attached hereto).
(f) Not applicable.
(g) See table above.
(h) The audit committee of the Board of Trustees has considered whether the provision of services other than audit services performed by the auditors to the Registrant and Covered Entities is compatible with maintaining the auditors’ independence in performing audit services.
Item 5. Audit Committee of Listed Registrants.
(a) The Fund has a separately-designated standing audit committee established in accordance with Section 3(a)(58)(A) of the Exchange Act whose members are: Frank Joseph Kearns, Michael Nugent and Allen Reed.
(b) Not applicable.
Item 6. Schedule of Investments
(a) Refer to Item 1.
(b) Not used.
6
Item 7. Disclosure of Proxy Voting Policies and Procedures for Closed-End Management Investment Companies.
Applicable only to reports filed by closed-end funds.
Item 8. Portfolio Managers of Closed-End Management Investment Companies
Applicable only to reports filed by closed-end funds.
Item 9. Closed-End Fund Repurchases
Applicable only to reports filed by closed-end funds.
Item 10. Submission of Matters to a Vote of Security Holders
Not applicable.
Item 11. Controls and Procedures
(a) The Fund’s principal executive officer and principal financial officer have concluded that the Fund’s disclosure controls and procedures are sufficient to ensure that information required to be disclosed by the Fund in this Form N-CSR was recorded, processed, summarized and reported within the time periods specified in the Securities and Exchange Commission’s rules and forms, based upon such officers’ evaluation of these controls and procedures as of a date within 90 days of the filing date of the report.
(b) There were no changes in the registrant’s internal control over financial reporting that occurred during the second fiscal quarter of the period covered by this report that has materially affected, or is reasonably likely to materially affect, the registrant’s internal control over financial reporting.
Item 12. Exhibits
(a) The Code of Ethics for Principal Executive and Senior Financial Officers is attached hereto.
(b) A separate certification for each principal executive officer and principal financial officer of the registrant are attached hereto as part of EX-99.CERT.
7
SIGNATURES
Pursuant to the requirements of the Securities Exchange Act of 1934 and the Investment Company Act of 1940, the registrant has duly caused this report to be signed on its behalf by the undersigned, thereunto duly authorized.
(Registrant) | Morgan Stanley Institutional Fund, Inc. | |
| |
By: | /s/ Randy Takian | |
| |
Name: | Randy Takian |
Title: | Principal Executive Officer |
Date: | February 19, 2009 |
| | | | | |
Pursuant to the requirements of the Securities Exchange Act of 1934 and the Investment Company Act of 1940, this report has been signed by the following persons on behalf of the registrant and in the capacities and on the dates indicated.
By: | /s/ Randy Takian | |
| |
Name: | Randy Takian |
Title: | Principal Executive Officer |
Date: | February 19, 2009 |
| | | | |
By: | /s/ James W. Garrett | |
| |
Name: | James W. Garrett |
Title: | Principal Financial Officer |
Date: | February 19, 2009 |
| | | | |