UNITED STATES
SECURITIES AND EXCHANGE COMMISSION
Washington, D.C. 20549
FORM N-CSR
CERTIFIED SHAREHOLDER REPORT
OF
REGISTERED MANAGEMENT INVESTMENT COMPANIES
Investment Company Act file number: 811-05628
Name of Registrant: Vanguard Malvern Funds
Address of Registrant:
P.O. Box 2600
Valley Forge, PA 19482
Name and address of agent for service:
Anne E. Robinson, Esquire
P.O. Box 876
Valley Forge, PA 19482
Registrant’s telephone number, including area code: (610) 669-1000
Date of fiscal year end: September 30
Date of reporting period: October 1, 2015 – September 30, 2016
Item 1: Reports to Shareholders
Annual Report | September 30, 2016
Vanguard U.S. Value Fund
A new format, unwavering commitment
As you begin reading this report, you’ll notice that we’ve made some improvements to the opening sections—based on feedback from you, our clients.
Page 1 starts with a new ”Your Fund’s Performance at a Glance,” a concise, handy summary of how your fund performed during the period.
In the renamed ”Chairman’s Perspective,” Bill McNabb will focus on enduring principles and investment insights.
We’ve modified some tables, and eliminated some redundancy, but we haven’t removed any information.
At Vanguard, we’re always looking for better ways to communicate and to help you make sound investment decisions. Thank you for entrusting your assets to us.
| |
| Contents | |
| Your Fund’s Performance at a Glance. | 1 |
| Chairman’s Perspective. | 3 |
| Advisor’s Report. | 6 |
| Fund Profile. | 8 |
| Performance Summary. | 9 |
| Financial Statements. | 11 |
| Your Fund’s After-Tax Returns. | 23 |
| About Your Fund’s Expenses. | 24 |
| Glossary. | 26 |
Please note: The opinions expressed in this report are just that—informed opinions. They should not be considered promises or advice. Also, please keep in mind that the information and opinions cover the period through the date on the front of this report. Of course, the risks of investing in your fund are spelled out in the prospectus.
See the Glossary for definitions of investment terms used in this report.
About the cover: No matter what language you speak, Vanguard has one consistent message and set of principles. Our primary focus is on you, our clients. We conduct our business with integrity as a faithful steward of your assets. This message is shown translated into seven languages, reflecting our expanding global presence.
Your Fund’s Performance at a Glance
• For the 12 months ended September 30, 2016, Vanguard U.S. Value Fund returned about 11%, trailing both its benchmark index and the average return of its peer group. In general, value stocks outpaced their growth counterparts.
• All but one of the fund’s industry sectors posted positive results. The advisor’s stock selection contributed to the fund’s underperformance relative to its benchmark.
• Energy, the fund’s second-largest sector holding, weighed most on its result.
Industrials, health care, and materials were among sectors that also detracted from relative performance. Information technology and telecommunication services were the only sectors to beat the benchmark.
• Over the decade ended September 30, the fund’s average annual return was in line with that of its benchmark and slightly ahead of the average return of its peers.
| |
| Total Returns: Fiscal Year Ended September 30, 2016 | |
| | Total |
| | Returns |
| Vanguard U.S. Value Fund | 11.09% |
| Russell 3000 Value Index | 16.38 |
| Multi-Cap Value Funds Average | 12.39 |
| Multi-Cap Value Funds Average: Derived from data provided by Lipper, a Thomson Reuters Company. | |
| |
| |
| Total Returns: Ten Years Ended September 30, 2016 | |
| | Average |
| | Annual Return |
| U.S. Value Fund | 5.85% |
| Russell 3000 Value Index | 5.84 |
| Multi-Cap Value Funds Average | 5.10 |
| Multi-Cap Value Funds Average: Derived from data provided by Lipper, a Thomson Reuters Company. | |
The figures shown represent past performance, which is not a guarantee of future results. (Current performance may be lower or higher than the performance data cited. For performance data current to the most recent month-end, visit our website at vanguard.com/performance.) Note, too, that both investment returns and principal value can fluctuate widely, so an investor’s shares, when sold, could be worth more or less than their original cost.
1
| | |
| Expense Ratios | | |
| Your Fund Compared With Its Peer Group | | |
| | | Peer Group |
| | Fund | Average |
| U.S. Value Fund | 0.26% | 1.15% |
The fund expense ratio shown is from the prospectus dated January 27, 2016, and represents estimated costs for the current fiscal year. For the fiscal year ended September 30, 2016, the fund’s expense ratio was 0.23%. The peer-group expense ratio is derived from data provided by Lipper, a Thomson Reuters Company, and captures information through year-end 2015.
Peer group: Multi-Cap Value Funds.
2
Chairman’s Perspective

Bill McNabb
Chairman and Chief Executive Officer
Dear Shareholder,
If you think you’ve had reason to feel uneasy about the investment environment lately, you’re not imagining things. In just the past few months, we’ve seen economic uncertainty, intense political polarization, and super-low bond yields. Yet at the same time, the stock market kept pushing higher.
In this confusing and sometimes contradictory climate, you may be asking yourself a question that I hear often: How do I make sense of all this, keep investing, and still get a good night’s sleep?
As with any problem, there are multiple ways to go at it. But there’s one approach in particular that is simple, straightforward, and nearly foolproof: Save more money. Not only can saving more give you a greater sense of control over your investment plan, it can help compensate for long-term returns that, in our estimation, could fall short of historical averages.
I love the way one of our investment pros put it. Fran Kinniry this summer told The Wall Street Journal, “Investing is always a partnership between you and the markets.” He explained that the markets carried more than their fair share of the weight for a couple of decades, through the 1990s, providing outsized returns that made the investor’s half of the partnership relatively light work. “But now you are going to have to be the majority partner.”
Sobering? Sure. Hopeless? Definitely not.
3
Over the 12 months since last September, U.S. stocks returned 15%, though the rise has not been a one-way ticket straight up. International markets have also posted strong returns, but lower than those of the broad U.S. market. The decision by United Kingdom voters in June to exit the European Union came as a surprise but caused market heartburn for only a few days.
In fixed income, yields remained extremely low—about 1.60% on the 10-year U.S. Treasury note at the end of September, after dipping below 1.40% over the summer. And bond yields in some international markets were negative.
Even this relatively small window of time illustrates a truism of the financial markets: There will always be segments that perform well and others that don’t. Saving more saves you from trying to control the uncontrollable—how economies and the markets perform. And it keeps you in control of one of the most vital parts of your investment program.
Although the “save more” logic is easy to grasp, it’s not always easy to follow. Bills, illness, the loss of a job—these can affect any of us.
But whatever our circumstances, figuring out how to save more is worth the effort. It requires that we make difficult decisions to forgo some consumption today to increase the likelihood of consuming (or consuming more) in the future. This is the very heart of investing. Sacrifices are never fun, so consider carrying them out systematically and in doses that you
| | | |
| Market Barometer | | | |
| | | Average Annual Total Returns |
| | | Periods Ended September 30, 2016 |
| | One | Three | Five |
| | Year | Years | Years |
| Stocks | | | |
| Russell 1000 Index (Large-caps) | 14.93% | 10.78% | 16.41% |
| Russell 2000 Index (Small-caps) | 15.47 | 6.71 | 15.82 |
| Russell 3000 Index (Broad U.S. market) | 14.96 | 10.44 | 16.36 |
| FTSE All-World ex US Index (International) | 9.62 | 0.71 | 6.50 |
| |
| Bonds | | | |
| Bloomberg Barclays U.S. Aggregate Bond Index | | | |
| (Broad taxable market) | 5.19% | 4.03% | 3.08% |
| Bloomberg Barclays Municipal Bond Index | | | |
| (Broad tax-exempt market) | 5.58 | 5.54 | 4.48 |
| Citigroup Three-Month U.S. Treasury Bill Index | 0.20 | 0.06 | 0.06 |
| |
| CPI | | | |
| Consumer Price Index | 1.46% | 1.03% | 1.25% |
4
can be comfortable with—for instance, gradually getting up to the max in your IRA, or adding a percentage point or so to the amount you stash in your employer’s retirement plan. As a point of reference, we generally suggest that investors strive for a retirement savings rate of 12%–15%, including any employer contributions.
If you need more convincing about the wisdom of the “save more” course of action, it might be helpful to examine your alternatives. This list is by no means exhaustive, but it hits on a few of the big ones, and none are without risk.
• Reach for yield. With yields so low on many types of bonds, it’s tempting to find the corners of the fixed income market where payouts are juicier. But with the juice comes considerable risk. You need to be aware that you’d be taking on more risk—and how much more.
• Go all-in on a hot-performing asset class or fund. By now, you know better than that, right?
• Sit tight. This approach isn’t a terrible idea; it’s better than panicking and deciding to just “do something,” particularly if that means changing your approach in response to the market’s movements.
Here’s the inescapably challenging part of your partnership with the markets: In the short run, your “partner” is fickle, emotional, and wildly unpredictable. But in the long run, your partner is mostly rational and extremely helpful.
The best way to minimize your vulnerability to the market’s mood swings, and to maximize the benefit of your partner’s longer-term strengths, is to expect less and save more. Maybe the markets will deliver better-than-expected returns. Maybe they’ll be consistent with our more modest expectations. In either case, a higher savings rate can help put you in a better position to reach your goals.
As always, thank you for investing with Vanguard.

F. William McNabb III
Chairman and Chief Executive Officer October 18, 2016
5
Advisor’s Report
For the fiscal year ended September 30, 2016, the U.S. Value Fund returned 11.09%. It lagged the benchmark Russell 3000 Value Index by more than 5 percentage points.
The broad U.S. equity market was up 14.96%. U.S. growth stocks, which returned 13.64%, lagged the 16.38% result for their value counterparts. Small-capitalization stocks returned 15.47%, outperforming large- and mid-cap stocks, which returned 14.93%.
Globally, developed markets performed more weakly, with the MSCI EAFE Index returning 6.52%. In comparison, emerging markets, as measured by the MSCI Emerging Markets Index, rose 16.78%. Each of the 11 industry sectors in the Russell 3000 Value Index generated positive returns. Results were best among materials, information technology, and industrial companies, but they were only mildly positive among consumer discretionary and financial firms.
Growth around the globe remained subdued. The U.S. economy grew at an annual rate of 0.8% in the first quarter of 2016 and 1.4% in the second. The second-quarter increase reflected positive contributions from personal consumption expenditures, exports, and nonresidential fixed investments, but declines in private inventory investment and residential fixed investment weighed on the economy.
The International Monetary Fund estimated global growth at 2.9% for the first half of 2016, slightly weaker than for the second half of 2015. Brexit is still unfolding, as the long-term arrangements between the United Kingdom and the European Union will be uncertain for some time. Commodity prices have partly recovered. After hitting a ten-year low in January 2016, oil prices rallied by 50 percent to $45 in August, mostly because of production outages. Nonfuel commodity prices have also increased, with metals prices rising 12% and agricultural commodity prices up 9%.
Although it’s important to understand how overall portfolio performance is affected by these macroeconomic factors, we emphasize that our investment process focuses on specific stock fundamentals and portfolio characteristics. Our stock selection model evaluates companies within our investment universe to identify those with attractive characteristics that we believe will outperform over the long run.
To do this, we use a strict quantitative process that focuses on a combination of five key themes: high quality—healthy balance sheets and consistent cash-flow generation; effective use of capital—sound investment policies that favor internal over external funding; consistent earnings growth—a demonstrated ability to grow earnings year after year; strong market sentiment—market confirmation of our view; and reasonable valuation—avoidance of overpriced stocks.
The interaction of these themes generates an opinion on all the stocks in our universe each day. Using the results of our model, we then construct our portfolio with the goal of maximizing expected return, while minimizing exposure to risks that our
6
research indicates do not improve returns, such as industry selection and other risks relative to our benchmark.
Our portfolio focuses on the attractive stocks identified by the model that we expect will exhibit future outperformance; however, as with any investment management process, there will be periods when our model does not perform as expected. Unfortunately, over the latest fiscal year, the stocks that outperformed had characteristics that our model does not pursue. Although we are disappointed with the performance results, it is important to remind our investors that through different market environments, we maintain our commitment to invest in stocks with attractive fundamentals that we believe will outperform in the long run.
For the 12-month period, our valuation and management decisions models helped performance, while our growth and quality models were weaker. However, our sentiment model was a large detractor from the fund’s performance. We always maintain a positive view of each of our five submodels, but we recently introduced a dynamic weighting process that shifts their relative importance through time. This process successfully underweighted the sentiment component and increased the weight of the management decisions component, which mitigated our underperformance over the period.
Our stock selection results across sectors were disappointing, as we were able to produce positive selections only in real estate, information technology, and telecommunication services. In real estate, our most successful positions included Government Properties Income Trust (+59.2%), Digital Realty Trust (+68.4%), and Communications Sales & Leasing (+82.1%). Performance in IT was driven by AMD (+191.6%), NeoPhotonics (+139.9%), and NVIDIA (+181.3%). Telecom benefited from our positions in Verizon (+25.1%) and Cincinnati Bell (+30.8%).
We were not able to match the outperformance across the remaining sectors, and our stock selection results were the most disappointing in energy, industrials, and financials. In energy, Alon USA Energy (–62.2%), Teekay Tankers (–56.2%), and Noble (–39.9%) significantly detracted. Industrial holdings JetBlue Airways (–33.1%), Alaska Air Group (–15.9%), and Spirit AeroSystems (–7.9%) similarly did not perform as expected. In financials, Santander (–42.4%), MGIC Investment (–37.9%), and Heritage Insurance (–25.9%) hurt results.
Portfolio Managers:
James P. Stetler, Principal
Anatoly Shtekhman, CFA
Binbin Guo, Principal, Head of Equity
Research and Portfolio Strategies
Vanguard Quantitative Equity Group
October 18, 2016
7
| | | |
| U.S. Value Fund | | |
| |
| |
| Fund Profile | | | |
| As of September 30, 2016 | | |
| |
| Portfolio Characteristics | | |
| | | Russell | DJ |
| | | 3000 | U.S. Total |
| | | Value | Market |
| | Fund | Index | FA Index |
| Number of Stocks | 240 | 2,025 | 3,850 |
| Median Market Cap | $23.3B | $48.8B | $51.8B |
| Price/Earnings Ratio | 16.3x | 21.9x | 23.7x |
| Price/Book Ratio | 1.8x | 1.8x | 2.8x |
| Return on Equity | 11.0% | 12.4% | 16.6% |
| Earnings Growth Rate | 7.0% | 3.0% | 7.6% |
| Dividend Yield | 2.6% | 2.5% | 2.0% |
| Foreign Holdings | 1.0% | 0.0% | 0.0% |
| Turnover Rate | 76% | — | — |
| Ticker Symbol | VUVLX | — | — |
| Expense Ratio1 | 0.26% | — | — |
| 30-Day SEC Yield | 2.49% | — | — |
| Short-Term Reserves | 0.0% | — | — |
Sector Diversification (% of equity exposure)
| | | |
| | | | DJ |
| | | | U.S. |
| | | Russell | Total |
| | | 3000 | Market |
| | | Value | FA |
| | Fund | Index | Index |
| Consumer | | | |
| Discretionary | 5.3% | 5.3% | 12.8% |
| Consumer Staples | 8.5 | 8.4 | 8.7 |
| Energy | 12.8 | 12.8 | 6.7 |
| Financials | 23.8 | 23.9 | 13.3 |
| Health Care | 11.1 | 11.0 | 14.2 |
| Industrials | 9.7 | 9.7 | 10.3 |
| Information | | | |
| Technology | 10.2 | 10.1 | 20.7 |
| Materials | 3.0 | 3.0 | 3.3 |
| Real Estate | 5.5 | 5.6 | 4.3 |
| Telecommunication | | | |
| Services | 3.6 | 3.7 | 2.4 |
| Utilities | 6.5 | 6.5 | 3.3 |
| | |
| Volatility Measures | | |
| | Russell | DJ |
| | 3000 | U.S. Total |
| | Value | Market |
| | Index | FA Index |
| R-Squared | 0.97 | 0.95 |
| Beta | 0.95 | 0.93 |
These measures show the degree and timing of the fund’s fluctuations compared with the indexes over 36 months.
Ten Largest Holdings (% of total net assets)
| | |
| Exxon Mobil Corp. | Integrated Oil & Gas | 3.4% |
| Johnson & Johnson | Pharmaceuticals | 2.9 |
| JPMorgan Chase & Co. | Diversified Banks | 2.7 |
| General Electric Co. | Industrial | |
| | Conglomerates | 2.4 |
| Bank of America Corp. | Diversified Banks | 2.0 |
| Berkshire Hathaway Inc. Multi-Sector Holdings | 1.9 |
| Citigroup Inc. | Diversified Banks | 1.8 |
| AT&T Inc. | Integrated | |
| | Telecommunication | |
| | Services | 1.7 |
| Procter & Gamble Co. | Household Products | 1.6 |
| Merck & Co. Inc. | Pharmaceuticals | 1.5 |
| Top Ten | | 21.9% |
The holdings listed exclude any temporary cash investments and equity index products.

1 The expense ratio shown is from the prospectus dated January 27, 2016, and represents estimated costs for the current fiscal year. For the fiscal year ended September 30, 2016, the expense ratio was 0.23%.
8
U.S. Value Fund
Performance Summary
All of the returns in this report represent past performance, which is not a guarantee of future results that may be achieved by the fund. (Current performance may be lower or higher than the performance data cited. For performance data current to the most recent month-end, visit our website at vanguard.com/performance.) Note, too, that both investment returns and principal value can fluctuate widely, so an investor’s shares, when sold, could be worth more or less than their original cost. The returns shown do not reflect taxes that a shareholder would pay on fund distributions or on the sale of fund shares.
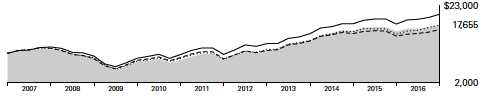
Cumulative Performance: September 30, 2006, Through September 30, 2016
Initial Investment of $10,000
| | | | | |
| | | Average Annual Total Returns | |
| | | Periods Ended September 30, 2016 | |
| | | | | | Final Value |
| | | One | Five | Ten | of a $10,000 |
| | | Year | Years | Years | Investment |
| | U.S. Value Fund | 11.09% | 16.64% | 5.85% | $17,655 |
| •••••••• | Russell 3000 Value Index | 16.38 | 16.09 | 5.84 | 17,647 |
| |
| – – – – | Dow Multi-Cap Jones Value U.S. Funds Total Stock Average Market | 12.39 | 14.24 | 5.10 | 16,443 |
| | Float Adjusted Index | 14.93 | 16.30 | 7.49 | 20,592 |
| Multi-Cap Value Funds Average: Derived from data provided by Lipper, a Thomson Reuters Company. | | |
See Financial Highlights for dividend and capital gains information.
9
U.S. Value Fund
Fiscal-Year Total Returns (%): September 30, 2006, Through September 30, 2016

U.S. Value Fund
Russell 3000 Value Index
10
U.S. Value Fund
Financial Statements
Statement of Net Assets
As of September 30, 2016
The fund reports a complete list of its holdings in regulatory filings four times in each fiscal year, at the quarter-ends. For the second and fourth fiscal quarters, the lists appear in the fund’s semiannual and annual reports to shareholders. For the first and third fiscal quarters, the fund files the lists with the Securities and Exchange Commission on Form N-Q. Shareholders can look up the fund’s Forms N-Q on the SEC’s website at sec.gov. Forms N-Q may also be reviewed and copied at the SEC’s Public Reference Room (see the back cover of this report for further information).
| | | |
| | | | Market |
| | | | Value• |
| | | Shares | ($000) |
| Common Stocks (99.6%)1 | | |
| Consumer Discretionary (5.3%) | | |
| | Target Corp. | 128,262 | 8,809 |
| | Lear Corp. | 64,472 | 7,815 |
| | Whirlpool Corp. | 42,946 | 6,964 |
| | Best Buy Co. Inc. | 178,889 | 6,830 |
| | International Game | | |
| | Technology plc | 196,228 | 4,784 |
| * | Liberty SiriusXM Group | | |
| | Class A | 134,387 | 4,567 |
| * | Cooper-Standard Holding | | |
| | Inc. | 41,879 | 4,138 |
| | Darden Restaurants Inc. | 66,735 | 4,092 |
| | News Corp. Class B | 271,403 | 3,859 |
| | PVH Corp. | 30,420 | 3,361 |
| * | Discovery Communications | | |
| | Inc. Class A | 108,622 | 2,924 |
| | Carnival Corp. | 50,461 | 2,464 |
| | Ford Motor Co. | 193,509 | 2,336 |
| | Cooper Tire & Rubber Co. | 50,061 | 1,903 |
| * | MSG Networks Inc. | 89,867 | 1,672 |
| | Children’s Place Inc. | 20,317 | 1,623 |
| | Rent-A-Center Inc. | 84,459 | 1,068 |
| | Barnes & Noble Inc. | 62,888 | 711 |
| | Dana Inc. | 44,583 | 695 |
| * | Liberty SiriusXM Group | | |
| | Class C | 20,395 | 681 |
| | General Motors Co. | 16,842 | 535 |
| | Nordstrom Inc. | 7,400 | 384 |
| | | | 72,215 |
| Consumer Staples (8.4%) | | |
| ^ | Procter & Gamble Co. | 243,404 | 21,845 |
| | Wal-Mart Stores Inc. | 276,872 | 19,968 |
| | Philip Morris International | | |
| | Inc. | 97,887 | 9,517 |
| | Tyson Foods Inc. Class A | 116,937 | 8,732 |
| | ConAgra Foods Inc. | 167,966 | 7,913 |
| | Energizer Holdings Inc. | 148,671 | 7,428 |
| ^,* | Herbalife Ltd. | 116,326 | 7,211 |
| | | |
| | | | Market |
| | | | Value• |
| | | Shares | ($000) |
| | Dean Foods Co. | 396,467 | 6,502 |
| | JM Smucker Co. | 38,700 | 5,245 |
| | Ingredion Inc. | 29,460 | 3,920 |
| | Universal Corp. | 59,514 | 3,465 |
| * | Post Holdings Inc. | 36,095 | 2,785 |
| | Fresh Del Monte Produce | | |
| | Inc. | 41,372 | 2,478 |
| | PepsiCo Inc. | 21,590 | 2,348 |
| | Ingles Markets Inc. Class A | 53,005 | 2,096 |
| * | Omega Protein Corp. | 48,477 | 1,133 |
| | Mondelez International Inc. | | |
| | Class A | 21,801 | 957 |
| | SpartanNash Co. | 27,582 | 798 |
| | Nu Skin Enterprises Inc. | | |
| | Class A | 10,895 | 706 |
| | Avon Products Inc. | 120,312 | 681 |
| | | | 115,728 |
| Energy (12.9%) | | |
| | Exxon Mobil Corp. | 528,020 | 46,086 |
| | Chevron Corp. | 159,169 | 16,382 |
| | Devon Energy Corp. | 218,356 | 9,632 |
| | Apache Corp. | 136,602 | 8,725 |
| | Ensco plc Class A | 974,604 | 8,284 |
| * | Newfield Exploration Co. | 189,330 | 8,228 |
| | Rowan Cos. plc Class A | 541,316 | 8,206 |
| | Energen Corp. | 137,158 | 7,917 |
| | Valero Energy Corp. | 149,173 | 7,906 |
| | Tesoro Corp. | 86,319 | 6,867 |
| ^ | Ship Finance International | | |
| | Ltd. | 443,204 | 6,528 |
| | Schlumberger Ltd. | 76,777 | 6,038 |
| * | Transocean Ltd. | 468,686 | 4,996 |
| ^,* | EP Energy Corp. Class A | 1,023,365 | 4,482 |
| | Cimarex Energy Co. | 25,065 | 3,368 |
| | Diamond Offshore | | |
| | Drilling Inc. | 188,112 | 3,313 |
| ^ | Nordic American Tankers | | |
| | Ltd. | 264,069 | 2,670 |
| | Baker Hughes Inc. | 44,148 | 2,228 |
| * | Denbury Resources Inc. | 632,122 | 2,042 |
11
| | | |
| U.S. Value Fund | | |
| |
| |
| |
| | | | Market |
| | | | Value• |
| | | Shares | ($000) |
| | Spectra Energy Corp. | 43,259 | 1,849 |
| | DHT Holdings Inc. | 439,907 | 1,843 |
| | Scorpio Tankers Inc. | 369,702 | 1,712 |
| * | Overseas Shipholding | | |
| | Group Inc. Class A | 154,160 | 1,629 |
| * | Laredo Petroleum Inc. | 87,229 | 1,125 |
| ^,* | Seadrill Ltd. | 440,832 | 1,045 |
| * | Sanchez Energy Corp. | 111,781 | 988 |
| | Noble Corp. plc | 125,659 | 797 |
| * | RPC Inc. | 44,973 | 756 |
| * | McDermott International | | |
| | Inc. | 145,119 | 727 |
| | | | 176,369 |
| Financials (23.8%) | | |
| | JPMorgan Chase & Co. | 551,781 | 36,743 |
| | Bank of America Corp. | 1,717,469 | 26,878 |
| * | Berkshire Hathaway Inc. | | |
| | Class B | 180,935 | 26,140 |
| | Citigroup Inc. | 514,133 | 24,282 |
| | Wells Fargo & Co. | 423,950 | 18,773 |
| | American Express Co. | 201,487 | 12,903 |
| | Prudential Financial Inc. | 145,879 | 11,911 |
| | Capital One Financial Corp. | 163,427 | 11,739 |
| | Bank of New York Mellon | | |
| | Corp. | 289,405 | 11,541 |
| | Travelers Cos. Inc. | 95,600 | 10,951 |
| | Aflac Inc. | 149,667 | 10,757 |
| | SunTrust Banks Inc. | 213,745 | 9,362 |
| | Fifth Third Bancorp | 452,104 | 9,250 |
| | Discover Financial Services | 162,805 | 9,207 |
| | Ameriprise Financial Inc. | 86,845 | 8,665 |
| | PNC Financial Services | | |
| | Group Inc. | 93,141 | 8,391 |
| | Navient Corp. | 570,454 | 8,254 |
| | Unum Group | 220,137 | 7,773 |
| | Assured Guaranty Ltd. | 263,118 | 7,302 |
| | Universal Insurance | | |
| | Holdings Inc. | 269,680 | 6,796 |
| | US Bancorp | 141,686 | 6,077 |
| * | Walker & Dunlop Inc. | 236,382 | 5,971 |
| * | INTL. FCStone Inc. | 147,113 | 5,715 |
| | State Street Corp. | 80,074 | 5,576 |
| | Heritage Insurance | | |
| | Holdings Inc. | 291,905 | 4,206 |
| | Goldman Sachs Group Inc. | 25,096 | 4,047 |
| * | Flagstar Bancorp Inc. | 124,030 | 3,442 |
| | Regions Financial Corp. | 259,420 | 2,560 |
| * | KCG Holdings Inc. Class A | 146,980 | 2,283 |
| | Primerica Inc. | 39,153 | 2,076 |
| | Maiden Holdings Ltd. | 137,547 | 1,745 |
| | Reinsurance Group of | | |
| | America Inc. Class A | 14,058 | 1,517 |
| | Ally Financial Inc. | 62,229 | 1,212 |
| | Torchmark Corp. | 15,113 | 966 |
| | | |
| | | | Market |
| | | | Value• |
| | | Shares | ($000) |
| | Popular Inc. | 20,736 | 793 |
| * | World Acceptance Corp. | 12,400 | 608 |
| | American International | | |
| | Group Inc. | 8,017 | 476 |
| | | | 326,888 |
| Health Care (11.0%) | | |
| | Johnson & Johnson | 335,926 | 39,683 |
| | Merck & Co. Inc. | 339,768 | 21,205 |
| | Pfizer Inc. | 477,662 | 16,178 |
| | Baxter International Inc. | 205,379 | 9,776 |
| * | HCA Holdings Inc. | 106,713 | 8,071 |
| | Aetna Inc. | 67,438 | 7,786 |
| * | Express Scripts Holding Co. | 106,366 | 7,502 |
| | Medtronic plc | 86,443 | 7,469 |
| * | WellCare Health Plans Inc. | 59,951 | 7,020 |
| * | Quintiles Transnational | | |
| | Holdings Inc. | 66,196 | 5,366 |
| | Anthem Inc. | 41,972 | 5,259 |
| | Bristol-Myers Squibb Co. | 91,216 | 4,918 |
| | Eli Lilly & Co. | 51,929 | 4,168 |
| * | INC Research Holdings Inc. | | |
| | Class A | 55,800 | 2,487 |
| * | Charles River Laboratories | | |
| | International Inc. | 26,153 | 2,180 |
| * | Healthways Inc. | 39,530 | 1,046 |
| | Abbott Laboratories | 16,493 | 697 |
| | Universal American Corp. | 25,000 | 191 |
| | | | 151,002 |
| Industrials (9.6%) | | |
| | General Electric Co. | 1,124,086 | 33,295 |
| | Delta Air Lines Inc. | 212,701 | 8,372 |
| | BWX Technologies Inc. | 191,732 | 7,357 |
| | Owens Corning | 136,188 | 7,271 |
| | Global Brass & Copper | | |
| | Holdings Inc. | 249,871 | 7,219 |
| | Masco Corp. | 202,787 | 6,958 |
| | SkyWest Inc. | 260,632 | 6,883 |
| | General Cable Corp. | 453,807 | 6,798 |
| | Huntington Ingalls | | |
| | Industries Inc. | 38,489 | 5,905 |
| | Alaska Air Group Inc. | 88,215 | 5,810 |
| | L-3 Communications | | |
| | Holdings Inc. | 29,277 | 4,413 |
| * | JetBlue Airways Corp. | 244,319 | 4,212 |
| | GATX Corp. | 90,927 | 4,051 |
| * | Wabash National Corp. | 238,647 | 3,398 |
| * | ACCO Brands Corp. | 349,183 | 3,366 |
| | United Technologies Corp. | 27,219 | 2,766 |
| * | United Rentals Inc. | 32,937 | 2,585 |
| | Quad/Graphics Inc. | 96,108 | 2,568 |
| * | Spirit AeroSystems | | |
| | Holdings Inc. Class A | 52,094 | 2,320 |
| | Universal Forest Products | | |
| | Inc. | 19,890 | 1,959 |
12
| | | |
| U.S. Value Fund | | |
| |
| |
| |
| | | | Market |
| | | | Value• |
| | | Shares | ($000) |
| | Comfort Systems USA Inc. | 42,042 | 1,232 |
| | Union Pacific Corp. | 7,758 | 757 |
| | Briggs & Stratton Corp. | 40,278 | 751 |
| | West Corp. | 33,879 | 748 |
| | Southwest Airlines Co. | 18,384 | 715 |
| | Ennis Inc. | 40,828 | 688 |
| | | | 132,397 |
| Information Technology (10.0%) | |
| | Intel Corp. | 322,367 | 12,169 |
| | Cisco Systems Inc. | 379,527 | 12,039 |
| | HP Inc. | 706,845 | 10,977 |
| | Computer Sciences Corp. | 161,180 | 8,415 |
| * | Advanced Micro Devices | | |
| | Inc. | 1,175,692 | 8,124 |
| | SYNNEX Corp. | 68,718 | 7,841 |
| * | Tech Data Corp. | 90,788 | 7,691 |
| | Booz Allen Hamilton | | |
| | Holding Corp. Class A | 233,000 | 7,365 |
| | NVIDIA Corp. | 99,859 | 6,842 |
| | CDW Corp. | 144,824 | 6,623 |
| * | NeoPhotonics Corp. | 396,790 | 6,484 |
| * | Sykes Enterprises Inc. | 212,762 | 5,985 |
| | Oracle Corp. | 143,966 | 5,655 |
| * | Sigma Designs Inc. | 694,160 | 5,407 |
| | EarthLink Holdings Corp. | 514,300 | 3,189 |
| * | Extreme Networks Inc. | 638,887 | 2,869 |
| * | NETGEAR Inc. | 41,239 | 2,495 |
| | Leidos Holdings Inc. | 57,170 | 2,474 |
| * | First Data Corp. Class A | 164,927 | 2,170 |
| | Avnet Inc. | 48,712 | 2,000 |
| * | TTM Technologies Inc. | 164,896 | 1,888 |
| | QUALCOMM Inc. | 23,381 | 1,602 |
| * | VMware Inc. Class A | 20,449 | 1,500 |
| * | CACI International Inc. | | |
| | Class A | 14,039 | 1,417 |
| * | NCR Corp. | 39,289 | 1,265 |
| * | Cirrus Logic Inc. | 19,477 | 1,035 |
| * | Alpha & Omega | | |
| | Semiconductor Ltd. | 40,622 | 882 |
| | Applied Materials Inc. | 22,197 | 669 |
| * | Amkor Technology Inc. | 43,300 | 421 |
| | | | 137,493 |
| Materials (3.0%) | | |
| | Steel Dynamics Inc. | 300,178 | 7,501 |
| | Commercial Metals Co. | 444,528 | 7,197 |
| * | AK Steel Holding Corp. | 1,347,512 | 6,509 |
| | Cabot Corp. | 120,468 | 6,314 |
| | Rayonier Advanced | | |
| | Materials Inc. | 251,740 | 3,366 |
| | Dow Chemical Co. | 55,580 | 2,881 |
| | Schnitzer Steel Industries | | |
| | Inc. | 82,575 | 1,726 |
| * | Coeur Mining Inc. | 129,864 | 1,536 |
| | LyondellBasell Industries | | |
| | NV Class A | 18,743 | 1,512 |
| | | |
| | | | Market |
| | | | Value• |
| | | Shares | ($000) |
| | Avery Dennison Corp. | 10,765 | 837 |
| | United States Steel Corp. | 37,908 | 715 |
| | Greif Inc. Class A | 13,936 | 691 |
| * | Ryerson Holding Corp. | 57,407 | 648 |
| | | | 41,433 |
| Real Estate (5.5%) | | |
| | Hospitality Properties Trust | 256,239 | 7,615 |
| | Government Properties | | |
| | Income Trust | 322,912 | 7,304 |
| | Lexington Realty Trust | 675,609 | 6,959 |
| | CBL & Associates | | |
| | Properties Inc. | 565,875 | 6,870 |
| | Washington Prime Group | | |
| | Inc. | 533,909 | 6,610 |
| | DuPont Fabros Technology | | |
| | Inc. | 116,570 | 4,809 |
| | Senior Housing Properties | | |
| | Trust | 200,451 | 4,552 |
| | Select Income REIT | 147,878 | 3,978 |
| | Communications Sales & | | |
| | Leasing Inc. | 123,920 | 3,892 |
| | Apple Hospitality REIT Inc. | 200,051 | 3,703 |
| | Macerich Co. | 41,243 | 3,335 |
| | VEREIT Inc. | 305,670 | 3,170 |
| | NorthStar Realty Finance | | |
| | Corp. | 128,377 | 1,691 |
| | GEO Group Inc. | 68,794 | 1,636 |
| | Summit Hotel Properties | | |
| | Inc. | 122,604 | 1,613 |
| | Omega Healthcare | | |
| | Investors Inc. | 43,238 | 1,533 |
| | Piedmont Office Realty | | |
| | Trust Inc. Class A | 56,019 | 1,220 |
| | Brandywine Realty Trust | 65,561 | 1,024 |
| | Global Net Lease Inc. | 117,266 | 957 |
| | WP Carey Inc. | 14,000 | 903 |
| | Care Capital Properties Inc. | 29,299 | 835 |
| | Sabra Health Care REIT Inc. | 29,210 | 735 |
| | Sunstone Hotel Investors | | |
| | Inc. | 49,267 | 630 |
| | | | 75,574 |
| Telecommunication Services (3.6%) | |
| | AT&T Inc. | 574,846 | 23,345 |
| | Verizon Communications | | |
| | Inc. | 274,648 | 14,276 |
| | CenturyLink Inc. | 316,926 | 8,693 |
| * | Cincinnati Bell Inc. | 636,851 | 2,599 |
| ^ | Windstream Holdings Inc. | 71,277 | 716 |
| | | | 49,629 |
| Utilities (6.5%) | | |
| | Edison International | 130,795 | 9,450 |
| | PPL Corp. | 270,908 | 9,365 |
| | FirstEnergy Corp. | 264,203 | 8,740 |
| | Entergy Corp. | 109,979 | 8,439 |
| | CenterPoint Energy Inc. | 341,938 | 7,943 |
13
| | | |
| U.S. Value Fund | | |
| |
| |
| |
| | | | Market |
| | | | Value• |
| | | Shares | ($000) |
| | UGI Corp. | 168,004 | 7,601 |
| | NiSource Inc. | 312,840 | 7,543 |
| | MDU Resources Group Inc. | 294,043 | 7,480 |
| | Great Plains Energy Inc. | 151,039 | 4,122 |
| | AES Corp. | 319,849 | 4,110 |
| | National Fuel Gas Co. | 62,335 | 3,370 |
| | Southwest Gas Corp. | 37,180 | 2,597 |
| | ONE Gas Inc. | 40,905 | 2,530 |
| | NRG Energy Inc. | 211,551 | 2,371 |
| | DTE Energy Co. | 10,622 | 995 |
| | Ameren Corp. | 16,080 | 791 |
| | NRG Yield Inc. | 39,053 | 662 |
| | NextEra Energy Inc. | 5,004 | 612 |
| | | | 88,721 |
| Total Common Stocks | | |
| (Cost $1,218,339) | | 1,367,449 |
| Temporary Cash Investments (1.7%)1 | |
| Money Market Fund (1.7%) | | |
| 2,3 | Vanguard Market Liquidity | | |
| | Fund, 0.640% | 230,400 | 23,042 |
| |
| | | Face | |
| | | Amount | |
| | | ($000) | |
| U.S. Government and Agency Obligations (0.0%) |
| 4,5 | Federal Home Loan | | |
| | Bank Discount Notes, | | |
| | 0.339%, 11/4/16 | 300 | 300 |
| 5 | United States Treasury Bill, | | |
| | 0.341%, 12/8/16 | 100 | 100 |
| | | | 400 |
| Total Temporary Cash Investments | |
| (Cost $23,440) | | 23,442 |
| Total Investments (101.3%) | | |
| (Cost $1,241,779) | | 1,390,891 |
| |
| | Amount |
| | ($000) |
| Other Assets and Liabilities (-1.3%) | |
| Other Assets | |
| Receivables for Investment Securities Sold 3,295 |
| Investment in Vanguard | 106 |
| Receivables for Accrued Income | 1,844 |
| Receivables for Capital Shares Issued | 798 |
| Other Assets | 145 |
| Total Other Assets | 6,188 |
| Liabilities | |
| Payables for Investment Securities | |
| Purchased | (655) |
| Collateral for Securities on Loan | (17,706) |
| Payables for Capital Shares Redeemed | (1,126) |
| Payables to Vanguard | (1,278) |
| Other Liabilities | (2,657) |
| Total Liabilities | (23,422) |
| Net Assets (100%) | |
| Applicable to 79,611,907 outstanding | |
| $.001 par value shares of beneficial | |
| interest (unlimited authorization) | 1,373,657 |
| Net Asset Value Per Share | $17.25 |
| |
| |
| At September 30, 2016, net assets consisted of: |
| | Amount |
| | ($000) |
| Paid-in Capital | 1,183,106 |
| Undistributed Net Investment Income | 20,151 |
| Accumulated Net Realized Gains | 21,272 |
| Unrealized Appreciation (Depreciation) | |
| Investment Securities | 149,112 |
| Futures Contracts | 16 |
| Net Assets | 1,373,657 |
• See Note A in Notes to Financial Statements.
* Non-income-producing security.
^ Includes partial security positions on loan to broker-dealers. The total value of securities on loan is $16,588,000.
1 The fund invests a portion of its cash reserves in equity markets through the use of index futures contracts. After giving effect to futures investments, the fund’s effective common stock and temporary cash investment positions represent 100.0% and 1.3%, respectively, of net assets.
2 Affiliated money market fund available only to Vanguard funds and certain trusts and accounts managed by Vanguard. Rate shown is the 7-day yield.
3 Includes $17,706,000 of collateral received for securities on loan.
4 The issuer operates under a congressional charter; its securities are generally neither guaranteed by the U.S. Treasury nor backed by the full faith and credit of the U.S. government.
5 Securities with a value of $400,000 have been segregated as initial margin for open futures contracts.
REIT—Real Estate Investment Trust.
See accompanying Notes, which are an integral part of the Financial Statements.
14
| |
| U.S. Value Fund | |
| |
| |
| Statement of Operations | |
| |
| | Year Ended |
| | September 30, 2016 |
| | ($000) |
| Investment Income | |
| Income | |
| Dividends | 36,211 |
| Interest1 | 29 |
| Securities Lending—Net | 1,369 |
| Total Income | 37,609 |
| Expenses | |
| The Vanguard Group—Note B | |
| Investment Advisory Services | 722 |
| Management and Administrative | 2,014 |
| Marketing and Distribution | 247 |
| Custodian Fees | 21 |
| Auditing Fees | 34 |
| Shareholders’ Reports | 24 |
| Trustees’ Fees and Expenses | 1 |
| Total Expenses | 3,063 |
| Net Investment Income | 34,546 |
| Realized Net Gain (Loss) | |
| Investment Securities Sold1 | 22,402 |
| Futures Contracts | 688 |
| Realized Net Gain (Loss) | 23,090 |
| Change in Unrealized Appreciation (Depreciation) | |
| Investment Securities | 81,399 |
| Futures Contracts | 127 |
| Change in Unrealized Appreciation (Depreciation) | 81,526 |
| Net Increase (Decrease) in Net Assets Resulting from Operations | 139,162 |
1 Interest income and realized net gain (loss) from an affiliated company of the fund were $27,000 and $0, respectively.
See accompanying Notes, which are an integral part of the Financial Statements.
15
| | |
| U.S. Value Fund | | |
| |
| |
| Statement of Changes in Net Assets | | |
| |
| | Year Ended September 30, |
| | 2016 | 2015 |
| | ($000) | ($000) |
| Increase (Decrease) in Net Assets | | |
| Operations | | |
| Net Investment Income | 34,546 | 25,998 |
| Realized Net Gain (Loss) | 23,090 | 63,327 |
| Change in Unrealized Appreciation (Depreciation) | 81,526 | (107,756) |
| Net Increase (Decrease) in Net Assets Resulting from Operations | 139,162 | (18,431) |
| Distributions | | |
| Net Investment Income | (26,754) | (19,263) |
| Realized Capital Gain1 | (48,800) | — |
| Total Distributions | (75,554) | (19,263) |
| Capital Share Transactions | | |
| Issued | 306,212 | 436,088 |
| Issued in Lieu of Cash Distributions | 71,550 | 18,266 |
| Redeemed | (282,648) | (318,266) |
| Net Increase (Decrease) from Capital Share Transactions | 95,114 | 136,088 |
| Total Increase (Decrease) | 158,722 | 98,394 |
| Net Assets | | |
| Beginning of Period | 1,214,935 | 1,116,541 |
| End of Period2 | 1,373,657 | 1,214,935 |
1 Includes fiscal 2016 short-term gain distributions totaling $0. Short-term gain distributions are treated as ordinary income dividends for tax purposes.
2 Net Assets—End of Period includes undistributed (overdistributed) net investment income of $20,151,000 and $15,799,000.
See accompanying Notes, which are an integral part of the Financial Statements.
16
| | | | | |
| U.S. Value Fund | | | | | |
| |
| |
| Financial Highlights | | | | | |
| |
| |
| For a Share Outstanding | | | Year Ended September 30, |
| Throughout Each Period | 2016 | 2015 | 2014 | 2013 | 2012 |
| Net Asset Value, Beginning of Period | $16.48 | $16.95 | $14.41 | $11.89 | $9.20 |
| Investment Operations | | | | | |
| Net Investment Income | .440 | .355 | .299 | .304 | .2761 |
| Net Realized and Unrealized Gain (Loss) | | | | | |
| on Investments | 1.341 | (.543) | 2.531 | 2.506 | 2.632 |
| Total from Investment Operations | 1.781 | (.188) | 2.830 | 2.810 | 2.908 |
| Distributions | | | | | |
| Dividends from Net Investment Income | (. 358) | (. 282) | (. 290) | (. 290) | (. 218) |
| Distributions from Realized Capital Gains | (.653) | — | — | — | — |
| Total Distributions | (1.011) | (. 282) | (. 290) | (. 290) | (. 218) |
| Net Asset Value, End of Period | $17.25 | $16.48 | $16.95 | $14.41 | $11.89 |
| |
| Total Return2 | 11.09% | -1.18% | 19.89% | 24.16% | 32.10% |
| |
| Ratios/Supplemental Data | | | | | |
| Net Assets, End of Period (Millions) | $1,374 | $1,215 | $1,117 | $829 | $602 |
| Ratio of Total Expenses to Average Net Assets | 0.23% | 0.26% | 0.29% | 0.29% | 0.29% |
| Ratio of Net Investment Income to | | | | | |
| Average Net Assets | 2.63% | 2.10% | 1.92% | 2.26% | 2.54% |
| Portfolio Turnover Rate | 76% | 66% | 57% | 75% | 69% |
1 Calculated based on average shares outstanding.
2 Total returns do not include account service fees that may have applied in the periods shown. Fund prospectuses provide information about any applicable account service fees.
See accompanying Notes, which are an integral part of the Financial Statements.
17
U.S. Value Fund
Notes to Financial Statements
Vanguard U.S. Value Fund is registered under the Investment Company Act of 1940 as an open-end investment company, or mutual fund.
A. The following significant accounting policies conform to generally accepted accounting principles for U.S. investment companies. The fund consistently follows such policies in preparing its financial statements.
1. Security Valuation: Securities are valued as of the close of trading on the New York Stock Exchange (generally 4 p.m., Eastern time) on the valuation date. Equity securities are valued at the latest quoted sales prices or official closing prices taken from the primary market in which each security trades; such securities not traded on the valuation date are valued at the mean of the latest quoted bid and asked prices. Securities for which market quotations are not readily available, or whose values have been materially affected by events occurring before the fund’s pricing time but after the close of the securities’ primary markets, are valued by methods deemed by the board of trustees to represent fair value. Investments in Vanguard Market Liquidity Fund are valued at that fund’s net asset value. Temporary cash investments acquired over 60 days to maturity are valued using the latest bid prices or using valuations based on a matrix system (which considers such factors as security prices, yields, maturities, and ratings), both as furnished by independent pricing services. Other temporary cash investments are valued at amortized cost, which approximates market value.
2. Futures Contracts: The fund uses index futures contracts to a limited extent, with the objective of maintaining full exposure to the stock market while maintaining liquidity. The fund may purchase or sell futures contracts to achieve a desired level of investment, whether to accommodate portfolio turnover or cash flows from capital share transactions. The primary risks associated with the use of futures contracts are imperfect correlation between changes in market values of stocks held by the fund and the prices of futures contracts, and the possibility of an illiquid market. Counterparty risk involving futures is mitigated because a regulated clearinghouse is the counterparty instead of the clearing broker. To further mitigate counterparty risk, the fund trades futures contracts on an exchange, monitors the financial strength of its clearing brokers and clearinghouse, and has entered into clearing agreements with its clearing brokers. The clearinghouse imposes initial margin requirements to secure the fund’s performance and requires daily settlement of variation margin representing changes in the market value of each contract.
Futures contracts are valued at their quoted daily settlement prices. The aggregate settlement values of the contracts are not recorded in the Statement of Net Assets. Fluctuations in the value of the contracts are recorded in the Statement of Net Assets as an asset (liability) and in the Statement of Operations as unrealized appreciation (depreciation) until the contracts are closed, when they are recorded as realized futures gains (losses).
During the year ended September 30, 2016, the fund’s average investments in long and short futures contracts represented less than 1% and 0% of net assets, respectively, based on the average of aggregate settlement values at each quarter-end during the period.
3. Federal Income Taxes: The fund intends to continue to qualify as a regulated investment company and distribute all of its taxable income. Management has analyzed the fund’s tax positions taken for all open federal income tax years (September 30, 2013–2016), and has concluded that no provision for federal income tax is required in the fund’s financial statements.
4. Distributions: Distributions to shareholders are recorded on the ex-dividend date.
18
U.S. Value Fund
5. Securities Lending: To earn additional income, the fund lends its securities to qualified institutional borrowers. Security loans are subject to termination by the fund at any time, and are required to be secured at all times by collateral in an amount at least equal to the market value of securities loaned. Daily market fluctuations could cause the value of loaned securities to be more or less than the value of the collateral received. When this occurs, the collateral is adjusted and settled on the next business day. The fund further mitigates its counterparty risk by entering into securities lending transactions only with a diverse group of prequalified counterparties, monitoring their financial strength, and entering into master securities lending agreements with its counterparties. The master securities lending agreements provide that, in the event of a counterparty’s default (including bankruptcy), the fund may terminate any loans with that borrower, determine the net amount owed, and sell or retain the collateral up to the net amount owed to the fund; however, such actions may be subject to legal proceedings. While collateral mitigates counterparty risk, in the absence of a default the fund may experience delays and costs in recovering the securities loaned. The fund invests cash collateral received in Vanguard Market Liquidity Fund, and records a liability in the Statement of Net Assets for the return of the collateral, during the period the securities are on loan. Securities lending income represents fees charged to borrowers plus income earned on invested cash collateral, less expenses associated with the loan. During the term of the loan, the fund is entitled to all distributions made on or in respect of the loaned securities.
6. Credit Facility: The fund and certain other funds managed by The Vanguard Group (“Vanguard”) participate in a $3.1 billion committed credit facility provided by a syndicate of lenders pursuant to a credit agreement that may be renewed annually; each fund is individually liable for its borrowings, if any, under the credit facility. Borrowings may be utilized for temporary and emergency purposes, and are subject to the fund’s regulatory and contractual borrowing restrictions. The participating funds are charged administrative fees and an annual commitment fee of 0.10% of the undrawn amount of the facility; these fees are allocated to the funds based on a method approved by the fund’s board of trustees and included in Management and Administrative expenses on the fund’s Statement of Operations. Any borrowings under this facility bear interest at a rate based upon the higher of the one-month London Interbank Offered Rate, federal funds effective rate, or overnight bank funding rate plus an agreed-upon spread.
The fund had no borrowings outstanding at September 30, 2016, or at any time during the period then ended.
7. Other: Dividend income is recorded on the ex-dividend date. Interest income includes income distributions received from Vanguard Market Liquidity Fund and is accrued daily. Premiums and discounts on debt securities purchased are amortized and accreted, respectively, to interest income over the lives of the respective securities. Security transactions are accounted for on the date securities are bought or sold. Costs used to determine realized gains (losses) on the sale of investment securities are those of the specific securities sold.
B. In accordance with the terms of a Funds’ Service Agreement (the “FSA”) between Vanguard and the fund, Vanguard furnishes to the fund investment advisory, corporate management, administrative, marketing, and distribution services at Vanguard’s cost of operations (as defined by the FSA). These costs of operations are allocated to the fund based on methods and guidelines approved by the board of trustees. Vanguard does not require reimbursement in the current period for certain costs of operations (such as deferred compensation/benefits and risk/insurance costs); the fund’s liability for these costs of operations is included in Payables to Vanguard on the Statement of Net Assets.
19
U.S. Value Fund
Upon the request of Vanguard, the fund may invest up to 0.40% of its net assets as capital in Vanguard. At September 30, 2016, the fund had contributed to Vanguard capital in the amount of $106,000, representing 0.01% of the fund’s net assets and 0.04% of Vanguard’s capitalization. The fund’s trustees and officers are also directors and employees, respectively, of Vanguard.
C. Various inputs may be used to determine the value of the fund’s investments. These inputs are summarized in three broad levels for financial statement purposes. The inputs or methodologies used to value securities are not necessarily an indication of the risk associated with investing in those securities.
Level 1—Quoted prices in active markets for identical securities.
Level 2—Other significant observable inputs (including quoted prices for similar securities, interest rates, prepayment speeds, credit risk, etc.).
Level 3—Significant unobservable inputs (including the fund’s own assumptions used to determine the fair value of investments).
The following table summarizes the market value of the fund’s investments as of September 30, 2016, based on the inputs used to value them:
| | | |
| | Level 1 | Level 2 | Level 3 |
| Investments | ($000) | ($000) | ($000) |
| Common Stocks | 1,367,449 | — | — |
| Temporary Cash Investments | 23,042 | 400 | — |
| Futures Contracts—Assets1 | 40 | — | — |
| Futures Contracts—Liabilities1 | (3) | — | — |
| Total | 1,390,528 | 400 | — |
| 1 Represents variation margin on the last day of the reporting period. | | | |
D. At September 30, 2016, the aggregate settlement value of open futures contracts and the related unrealized appreciation (depreciation) were:
| | | | |
| | | | | ($000) |
| | | | Aggregate | |
| | | Number of | Settlement | Unrealized |
| | | Long (Short) | Value | Appreciation |
| Futures Contracts | Expiration | Contracts | Long (Short) | (Depreciation) |
| E-mini S&P 500 Index | December 2016 | 56 | 6,049 | 16 |
Unrealized appreciation (depreciation) on open futures contracts is required to be treated as realized gain (loss) for tax purposes.
E. Distributions are determined on a tax basis and may differ from net investment income and realized capital gains for financial reporting purposes. Differences may be permanent or temporary. Permanent differences are reclassified among capital accounts in the financial statements to reflect their tax character. Temporary differences arise when certain items of income, expense, gain, or loss are recognized in different periods for financial statement and tax purposes. These differences will reverse at some time in the future. Differences in classification may also result from the treatment of short-term gains as ordinary income for tax purposes.
20
U.S. Value Fund
The fund used a tax accounting practice to treat a portion of the price of capital shares redeemed during the year as distributions from net investment income and realized capital gains. Accordingly, the fund has reclassified $3,447,000 from undistributed net investment income, and $2,415,000 from accumulated net realized gains, to paid-in capital.
For tax purposes, at September 30, 2016, the fund had $21,845,000 of ordinary income and $20,894,000 of long-term capital gains available for distribution.
At September 30, 2016, the cost of investment securities for tax purposes was $1,241,840,000. Net unrealized appreciation of investment securities for tax purposes was $149,051,000, consisting of unrealized gains of $175,851,000 on securities that had risen in value since their purchase and $26,800,000 in unrealized losses on securities that had fallen in value since their purchase.
F. During the year ended September 30, 2016, the fund purchased $1,050,186,000 of investment securities and sold $993,559,000 of investment securities, other than temporary cash investments.
| | |
| G. Capital shares issued and redeemed were: | | |
| | Year Ended September 30, |
| | 2016 | 2015 |
| | Shares | Shares |
| | (000) | (000) |
| Issued | 18,669 | 24,986 |
| Issued in Lieu of Cash Distributions | 4,339 | 1,064 |
| Redeemed | (17,113) | (18,195) |
| Net Increase (Decrease) in Shares Outstanding | 5,895 | 7,855 |
H. Management has determined that no material events or transactions occurred subsequent to September 30, 2016, that would require recognition or disclosure in these financial statements.
21
Report of Independent Registered Public Accounting Firm
To the Board of Trustees of Vanguard Malvern Funds and the Shareholders of Vanguard U.S. Value Fund:
In our opinion, the accompanying statement of net assets and the related statements of operations and of changes in net assets and the financial highlights present fairly, in all material respects, the financial position of Vanguard U.S. Value Fund (constituting a separate portfolio of Vanguard Malvern Funds, hereafter referred to as the “Fund”) at September 30, 2016, the results of its operations for the year then ended, the changes in its net assets for each of the two years in the period then ended, and the financial highlights for each of the five years in the period then ended, in conformity with accounting principles generally accepted in the United States of America. These financial statements and financial highlights (hereafter referred to as “financial statements”) are the responsibility of the Fund’s management. Our responsibility is to express an opinion on these financial statements based on our audits. We conducted our audits of these financial statements in accordance with the standards of the Public Company Accounting Oversight Board (United States). Those standards require that we plan and perform the audit to obtain reasonable assurance about whether the financial statements are free of material misstatement. An audit includes examining, on a test basis, evidence supporting the amounts and disclosures in the financial statements, assessing the accounting principles used and significant estimates made by management, and evaluating the overall financial statement presentation. We believe that our audits, which included confirmation of securities at September 30, 2016 by correspondence with the custodian and brokers and by agreement to the underlying ownership records of the transfer agent, provide a reasonable basis for our opinion.
/s/PricewaterhouseCoopers LLP
Philadelphia, Pennsylvania
November 10, 2016
Special 2016 tax information (unaudited) for Vanguard U.S. Value Fund
This information for the fiscal year ended September 30, 2016, is included pursuant to provisions of the Internal Revenue Code.
The fund distributed $51,216,000 as capital gain dividends (20% rate gain distributions) to shareholders during the fiscal year.
The fund distributed $26,754,000 of qualified dividend income to shareholders during the fiscal year.
For corporate shareholders, 81.8% of investment income (dividend income plus short-term gains, if any) qualifies for the dividends-received deduction.
22
Your Fund’s After-Tax Returns
This table presents returns for your fund both before and after taxes. The after-tax returns are shown in two ways: (1) assuming that an investor owned the fund during the entire period and paid taxes on the fund’s distributions, and (2) assuming that an investor paid taxes on the fund’s distributions and sold all shares at the end of each period.
Calculations are based on the highest individual federal income tax and capital gains tax rates in effect at the times of the distributions and the hypothetical sales. State and local taxes were not considered. After-tax returns reflect any qualified dividend income, using actual prior-year figures and estimates for 2016. (In the example, returns after the sale of fund shares may be higher than those assuming no sale. This occurs when the sale would have produced a capital loss. The calculation assumes that the investor received a tax deduction for the loss.)
Please note that your actual after-tax returns will depend on your tax situation and may differ from those shown. Also note that if you own the fund in a tax-deferred account, such as an individual retirement account or a 401(k) plan, this information does not apply to you. Such accounts are not subject to current taxes.
Finally, keep in mind that a fund’s performance—whether before or after taxes—does not guarantee future results.
| | | |
| Average Annual Total Returns: U.S. Value Fund | | | |
| Periods Ended September 30, 2016 | | | |
| | One | Five | Ten |
| | Year | Years | Years |
| Returns Before Taxes | 11.09% | 16.64% | 5.85% |
| Returns After Taxes on Distributions | 9.56 | 15.96 | 5.05 |
| Returns After Taxes on Distributions and Sale of Fund Shares | 7.44 | 13.45 | 4.57 |
23
About Your Fund’s Expenses
As a shareholder of the fund, you incur ongoing costs, which include costs for portfolio management, administrative services, and shareholder reports (like this one), among others. Operating expenses, which are deducted from a fund’s gross income, directly reduce the investment return of the fund.
A fund’s expenses are expressed as a percentage of its average net assets. This figure is known as the expense ratio. The following examples are intended to help you understand the ongoing costs (in dollars) of investing in your fund and to compare these costs with those of other mutual funds. The examples are based on an investment of $1,000 made at the beginning of the period shown and held for the entire period.
The accompanying table illustrates your fund’s costs in two ways:
• Based on actual fund return. This section helps you to estimate the actual expenses that you paid over the period. The ”Ending Account Value“ shown is derived from the fund‘s actual return, and the third column shows the dollar amount that would have been paid by an investor who started with $1,000 in the fund. You may use the information here, together with the amount you invested, to estimate the expenses that you paid over the period.
To do so, simply divide your account value by $1,000 (for example, an $8,600 account value divided by $1,000 = 8.6), then multiply the result by the number given for your fund under the heading ”Expenses Paid During Period.“
• Based on hypothetical 5% yearly return. This section is intended to help you compare your fund‘s costs with those of other mutual funds. It assumes that the fund had a yearly return of 5% before expenses, but that the expense ratio is unchanged. In this case—because the return used is not the fund’s actual return—the results do not apply to your investment. The example is useful in making comparisons because the Securities and Exchange Commission requires all mutual funds to calculate expenses based on a 5% return. You can assess your fund’s costs by comparing this hypothetical example with the hypothetical examples that appear in shareholder reports of other funds.
Note that the expenses shown in the table are meant to highlight and help you compare ongoing costs only and do not reflect transaction costs incurred by the fund for buying and selling securities. Further, the expenses do not include any purchase, redemption, or account service fees described in the fund prospectus. If such fees were applied to your account, your costs would be higher. Your fund does not carry a “sales load.”
The calculations assume no shares were bought or sold during the period. Your actual costs may have been higher or lower, depending on the amount of your investment and the timing of any purchases or redemptions.
You can find more information about the fund’s expenses, including annual expense ratios, in the Financial Statements section of this report. For additional information on operating expenses and other shareholder costs, please refer to your fund’s current prospectus.
24
| | | |
| Six Months Ended September 30, 2016 | | | |
| | Beginning | Ending | Expenses |
| | Account Value | Account Value | Paid During |
| U.S. Value Fund | 3/31/2016 | 9/30/2016 | Period |
| Based on Actual Fund Return | $1,000.00 | $1,060.23 | $1.18 |
| Based on Hypothetical 5% Yearly Return | 1,000.00 | 1,023.85 | 1.16 |
The calculations are based on expenses incurred in the most recent six-month period. The fund’s annualized six-month expense ratio for that period is 0.23%. The dollar amounts shown as “Expenses Paid” are equal to the annualized expense ratio multiplied by the average account value over the period, multiplied by the number of days in the most recent six-month period, then divided by the number of days in the most recent 12-month period (183/366).
25
Glossary
30-Day SEC Yield. A fund’s 30-day SEC yield is derived using a formula specified by the U.S. Securities and Exchange Commission. Under the formula, data related to the fund’s security holdings in the previous 30 days are used to calculate the fund’s hypothetical net income for that period, which is then annualized and divided by the fund’s estimated average net assets over the calculation period. For the purposes of this calculation, a security’s income is based on its current market yield to maturity (for bonds), its actual income (for asset-backed securities), or its projected dividend yield (for stocks). Because the SEC yield represents hypothetical annualized income, it will differ—at times significantly—from the fund’s actual experience. As a result, the fund’s income distributions may be higher or lower than implied by the SEC yield.
Beta. A measure of the magnitude of a fund’s past share-price fluctuations in relation to the ups and downs of a given market index. The index is assigned a beta of 1.00. Compared with a given index, a fund with a beta of 1.20 typically would have seen its share price rise or fall by 12% when the index rose or fell by 10%. For this report, beta is based on returns over the past 36 months for both the fund and the index. Note that a fund’s beta should be reviewed in conjunction with its R-squared (see definition). The lower the R-squared, the less correlation there is between the fund and the index, and the less reliable beta is as an indicator of volatility.
Dividend Yield. Dividend income earned by stocks, expressed as a percentage of the aggregate market value (or of net asset value, for a fund). The yield is determined by dividing the amount of the annual dividends by the aggregate value (or net asset value) at the end of the period. For a fund, the dividend yield is based solely on stock holdings and does not include any income produced by other investments.
Earnings Growth Rate. The average annual rate of growth in earnings over the past five years for the stocks now in a fund.
Equity Exposure. A measure that reflects a fund’s investments in stocks and stock futures. Any holdings in short-term reserves are excluded.
Expense Ratio. A fund’s total annual operating expenses expressed as a percentage of the fund’s average net assets. The expense ratio includes management and administrative expenses, but does not include the transaction costs of buying and selling portfolio securities.
Foreign Holdings. The percentage of a fund represented by securities or depositary receipts of companies based outside the United States.
Inception Date. The date on which the assets of a fund (or one of its share classes) are first invested in accordance with the fund’s investment objective. For funds with a subscription period, the inception date is the day after that period ends. Investment performance is measured from the inception date.
Median Market Cap. An indicator of the size of companies in which a fund invests; the midpoint of market capitalization (market price x shares outstanding) of a fund’s stocks, weighted by the proportion of the fund’s assets invested in each stock. Stocks representing half of the fund’s assets have market capitalizations above the median, and the rest are below it.
Price/Book Ratio. The share price of a stock divided by its net worth, or book value, per share. For a fund, the weighted average price/book ratio of the stocks it holds.
26
Price/Earnings Ratio. The ratio of a stock’s current price to its per-share earnings over the past year. For a fund, the weighted average P/E of the stocks it holds. P/E is an indicator of market expectations about corporate prospects; the higher the P/E, the greater the expectations for a company’s future growth.
R-Squared. A measure of how much of a fund’s past returns can be explained by the returns from the market in general, as measured by a given index. If a fund’s total returns were precisely synchronized with an index’s returns, its R-squared would be 1.00. If the fund’s returns bore no relationship to the index’s returns, its R-squared would be 0. For this report, R-squared is based on returns over the past 36 months for both the fund and the index.
Return on Equity. The annual average rate of return generated by a company during the past five years for each dollar of shareholder’s equity (net income divided by shareholder’s equity). For a fund, the weighted average return on equity for the companies whose stocks it holds.
Short-Term Reserves. The percentage of a fund invested in highly liquid, short-term securities that can be readily converted to cash.
Turnover Rate. An indication of the fund’s trading activity. Funds with high turnover rates incur higher transaction costs and may be more likely to distribute capital gains (which may be taxable to investors). The turnover rate excludes in-kind transactions, which have minimal impact on costs.
27
The People Who Govern Your Fund
The trustees of your mutual fund are there to see that the fund is operated and managed in your best interests since, as a shareholder, you are a part owner of the fund. Your fund’s trustees also serve on the board of directors of The Vanguard Group, Inc., which is owned by the Vanguard funds and provides services to them on an at-cost basis.
A majority of Vanguard’s board members are independent, meaning that they have no affiliation with Vanguard or the funds they oversee, apart from the sizable personal investments they have made as private individuals. The independent board members have distinguished backgrounds in business, academia, and public service. Each of the trustees and executive officers oversees 198 Vanguard funds.
The following table provides information for each trustee and executive officer of the fund. The mailing address of the trustees and officers is P.O. Box 876, Valley Forge, PA 19482. More information about the trustees is in the Statement of Additional Information, which can be obtained, without charge, by contacting Vanguard at 800-662-7447, or online at vanguard.com.
InterestedTrustee1
F. William McNabb III
Born 1957. Trustee Since July 2009. Chairman of the Board. Principal Occupation(s) During the Past Five Years and Other Experience: Chairman of the Board of The Vanguard Group, Inc., and of each of the investment companies served by The Vanguard Group, since January 2010; Director of The Vanguard Group since 2008; Chief Executive Officer and President of The Vanguard Group, and of each of the investment companies served by The Vanguard Group, since 2008; Director of Vanguard Marketing Corporation; Managing Director of The Vanguard Group (1995–2008).
IndependentTrustees
Emerson U. Fullwood
Born 1948. Trustee Since January 2008. Principal Occupation(s) During the Past Five Years and Other Experience: Executive Chief Staff and Marketing Officer for North America and Corporate Vice President (retired 2008) of Xerox Corporation (document management products and services); Executive in Residence and 2009–2010 Distinguished Minett Professor at the Rochester Institute of Technology; Lead Director of SPX FLOW, Inc. (multi-industry manufacturing); Director of the United Way of Rochester, the University of Rochester Medical Center, Monroe Community College Foundation, North Carolina A&T University, and Roberts Wesleyan College.
Rajiv L. Gupta
Born 1945. Trustee Since December 2001.2 Principal Occupation(s) During the Past Five Years and Other Experience: Chairman and Chief Executive Officer (retired 2009) and President (2006–2008) of Rohm and Haas Co. (chemicals); Director of Tyco International plc (diversified manufacturing and services), HP Inc. (printer and personal computer manufacturing), and Delphi Automotive plc (automotive components); Senior Advisor at New Mountain Capital.
Amy Gutmann
Born 1949. Trustee Since June 2006. Principal Occupation(s) During the Past Five Years and Other Experience: President of the University of Pennsylvania; Christopher H. Browne Distinguished Professor of Political Science, School of Arts and Sciences, and Professor of Communication, Annenberg School for Communication, with secondary faculty appointments in the Department of Philosophy, School of Arts and Sciences, and at the Graduate School of Education, University of Pennsylvania; Trustee of the National Constitution Center; Chair of the Presidential Commission for the Study of Bioethical Issues.
JoAnn Heffernan Heisen
Born 1950. Trustee Since July 1998. Principal Occupation(s) During the Past Five Years and Other Experience: Corporate Vice President and Chief Global Diversity Officer (retired 2008) and Member of the Executive Committee (1997–2008) of Johnson & Johnson (pharmaceuticals/medical devices/consumer products); Director of Skytop Lodge Corporation (hotels) and the Robert Wood Johnson Foundation; Member of the Advisory Board of the Institute for Women’s Leadership at Rutgers University.
F. Joseph Loughrey
Born 1949. Trustee Since October 2009. Principal Occupation(s) During the Past Five Years and Other Experience: President and Chief Operating Officer (retired 2009) of Cummins Inc. (industrial machinery); Chairman of the Board of Hillenbrand, Inc. (specialized consumer services), and of Oxfam America; Director of SKF AB (industrial machinery), Hyster-Yale Materials Handling, Inc. (forklift trucks), the Lumina Foundation for Education, and the V Foundation for Cancer Research; Member of the Advisory Council for the College of Arts and Letters and of the Advisory Board to the Kellogg Institute for International Studies, both at the University of Notre Dame.
Mark Loughridge
Born 1953. Trustee Since March 2012. Principal Occupation(s) During the Past Five Years and Other Experience: Senior Vice President and Chief Financial Officer (retired 2013) at IBM (information technology services); Fiduciary Member of IBM’s Retirement Plan Committee (2004–2013); Director of the Dow Chemical Company; Member of the Council on Chicago Booth.
Scott C. Malpass
Born 1962. Trustee Since March 2012. Principal Occupation(s) During the Past Five Years and Other Experience: Chief Investment Officer and Vice President at the University of Notre Dame; Assistant Professor of Finance at the Mendoza College of Business at Notre Dame; Member of the Notre Dame 403(b) Investment Committee, the Board of Advisors for Spruceview Capital Partners, and the Investment Advisory Committee of Major League Baseball; Board Member of TIFF Advisory Services, Inc., and Catholic Investment Services, Inc. (investment advisors).
André F. Perold
Born 1952. Trustee Since December 2004. Principal Occupation(s) During the Past Five Years and Other Experience: George Gund Professor of Finance and Banking, Emeritus at the Harvard Business School (retired 2011); Chief Investment Officer and Managing Partner of HighVista Strategies LLC (private investment firm); Director of Rand Merchant Bank; Overseer of the Museum of Fine Arts Boston.
Peter F. Volanakis
Born 1955. Trustee Since July 2009. Principal Occupation(s) During the Past Five Years and Other Experience: President and Chief Operating Officer (retired 2010) of Corning Incorporated (communications equipment); Chairman of the Board of Trustees of Colby-Sawyer College; Member of the Advisory Board of the Norris Cotton Cancer Center.
Executive Officers
Glenn Booraem
Born 1967. Treasurer Since May 2015. Principal Occupation(s) During the Past Five Years and Other Experience: Principal of The Vanguard Group, Inc.; Treasurer of each of the investment companies served by The Vanguard Group; Controller of each of the investment companies served by The Vanguard Group (2010–2015); Assistant Controller of each of the investment companies served by The Vanguard Group (2001–2010).
Thomas J. Higgins
Born 1957. Chief Financial Officer Since September 2008. Principal Occupation(s) During the Past Five Years and Other Experience: Principal of The Vanguard Group, Inc.; Chief Financial Officer of each of the investment companies served by The Vanguard Group; Treasurer of each of the investment companies served by The Vanguard Group (1998–2008).
Peter Mahoney
Born 1974. Controller Since May 2015. Principal Occupation(s) During the Past Five Years and Other Experience: Head of Global Fund Accounting at The Vanguard Group, Inc.; Controller of each of the investment companies served by The Vanguard Group; Head of International Fund Services at The Vanguard Group (2008–2014).
Anne E. Robinson
Born 1970. Secretary Since September 2016. Principal Occupation(s) During the Past Five Years and Other Experience: Managing Director of The Vanguard Group, Inc.; General Counsel of The Vanguard Group; Secretary of The Vanguard Group and of each of the investment companies served by The Vanguard Group; Director and Senior Vice President of Vanguard Marketing Corporation; Managing Director and General Counsel of Global Cards and Consumer Services at Citigroup (2014–2016); Counsel at American Express (2003–2014).
Vanguard Senior Management Team
| |
Mortimer J. Buckley Kathleen C. Gubanich Martha G. King John T. Marcante Chris D. McIsaac | James M. Norris Thomas M. Rampulla Glenn W. Reed Karin A. Risi Michael Rollings |
Chairman Emeritus and Senior Advisor John J. Brennan
Chairman, 1996–2009
Chief Executive Officer and President, 1996–2008
Founder
John C. Bogle
Chairman and Chief Executive Officer, 1974–1996
1 Mr. McNabb is considered an “interested person,” as defined in the Investment Company Act of 1940, because he is an officer of the Vanguard funds.
2 December 2002 for Vanguard Equity Income Fund, the Vanguard Municipal Bond Funds, and the Vanguard State Tax-Exempt Funds.

|
| P.O. Box 2600 |
| Valley Forge, PA 19482-2600 |
Connect with Vanguard® > vanguard.com
| |
| Fund Information > 800-662-7447 | CFA® is a registered trademark owned by CFA Institute. |
| Direct Investor Account Services > 800-662-2739 | |
| Institutional Investor Services > 800-523-1036 | |
| Text Telephone for People | |
| Who Are Deaf or Hard of Hearing> 800-749-7273 | |
| |
| This material may be used in conjunction | |
| with the offering of shares of any Vanguard | |
| fund only if preceded or accompanied by | |
| the fund’s current prospectus. | |
| |
| All comparative mutual fund data are from Lipper, a | |
| Thomson Reuters Company, or Morningstar, Inc., unless | |
| otherwise noted. | |
| |
| You can obtain a free copy of Vanguard’s proxy voting | |
| guidelines by visiting vanguard.com/proxyreporting or by | |
| calling Vanguard at 800-662-2739. The guidelines are | |
| also available from the SEC’s website, sec.gov. In | |
| addition, you may obtain a free report on how your fund | |
| voted the proxies for securities it owned during the 12 | |
| months ended June 30. To get the report, visit either | |
| vanguard.com/proxyreporting or sec.gov. | |
| |
| You can review and copy information about your fund at | |
| the SEC’s Public Reference Room in Washington, D.C. To | |
| find out more about this public service, call the SEC at | |
| 202-551-8090. Information about your fund is also | |
| available on the SEC’s website, and you can receive | |
| copies of this information, for a fee, by sending a | |
| request in either of two ways: via email addressed to | |
| publicinfo@sec.gov or via regular mail addressed to the | |
| Public Reference Section, Securities and Exchange | |
| Commission, Washington, DC 20549-1520. | |
| |
| | © 2016 The Vanguard Group, Inc. |
| | All rights reserved. |
| | Vanguard Marketing Corporation, Distributor. |
| |
| | Q1240 112016 |

Annual Report | September 30, 2016
Vanguard Capital Value Fund
A new format, unwavering commitment
As you begin reading this report, you’ll notice that we’ve made some improvements to the opening sections—based on feedback from you, our clients.
Page 1 starts with a new ”Your Fund’s Performance at a Glance,” a concise, handy summary of how your fund performed during the period.
In the renamed ”Chairman’s Perspective,” Bill McNabb will focus on enduring principles and investment insights.
We’ve modified some tables, and eliminated some redundancy, but we haven’t removed any information.
At Vanguard, we’re always looking for better ways to communicate and to help you make sound investment decisions. Thank you for entrusting your assets to us.
| |
| Contents | |
| Your Fund’s Performance at a Glance. | 1 |
| Chairman’s Perspective. | 3 |
| Advisor’s Report. | 6 |
| Fund Profile. | 9 |
| Performance Summary. | 10 |
| Financial Statements. | 12 |
| Your Fund’s After-Tax Returns. | 24 |
| About Your Fund’s Expenses. | 25 |
| Glossary. | 27 |
Please note: The opinions expressed in this report are just that—informed opinions. They should not be considered promises or advice. Also, please keep in mind that the information and opinions cover the period through the date on the front of this report. Of course, the risks of investing in your fund are spelled out in the prospectus.
See the Glossary for definitions of investment terms used in this report.
About the cover: No matter what language you speak, Vanguard has one consistent message and set of principles. Our primary focus is on you, our clients. We conduct our business with integrity as a faithful steward of your assets. This message is shown translated into seven languages, reflecting our expanding global presence.
Your Fund’s Performance at a Glance
• The fund returned 11.36% for the 12 months ended September 30, 2016, trailing its
benchmark (+16.38%) and the average return of its peers (+12.39%).
• All industry sectors represented in the fund posted positive results.
• The fund’s information technology (+14%) and health care (+2%) stocks underperformed
compared with their benchmark counterparts, pulling down its relative performance.
In health care, the shortfall was driven mainly by some of the fund’s pharmaceutical
holdings, which declined amid regulatory and drug market issues.
• The fund’s materials portfolio (+32%) outperformed because of the advisor’s
overweighting of the sector. Its consumer discretionary stocks (+18%) also bested those
in the benchmark.
• Financial stocks returned a modest 4% for the fund, trailing their counterparts in the
benchmark. However, an underweighting of this sector—the fund’s largest—helped its
relative performance.
• The fund’s average annual return for the ten years ended September 30, 2016, closely
trailed that of its benchmark index and outdistanced that of its fund peers.
| |
| Total Returns: Fiscal Year Ended September 30, 2016 | |
| | Total |
| | Returns |
| Vanguard Capital Value Fund | 11.36% |
| Russell 3000 Value Index | 16.38 |
| Multi-Cap Value Funds Average | 12.39 |
| Multi-Cap Value Funds Average: Derived from data provided by Lipper, a Thomson Reuters Company. | |
| |
| |
| Total Returns: Ten Years Ended September 30, 2016 | |
| | Average |
| | Annual Return |
| Capital Value Fund | 5.72% |
| Russell 3000 Value Index | 5.84 |
| Multi-Cap Value Funds Average | 5.10 |
| Multi-Cap Value Funds Average: Derived from data provided by Lipper, a Thomson Reuters Company. | |
The figures shown represent past performance, which is not a guarantee of future results. (Current performance may be lower or higher than the performance data cited. For performance data current to the most recent month-end, visit our website at vanguard.com/performance.) Note, too, that both investment returns and principal value can fluctuate widely, so an investor’s shares, when sold, could be worth more or less than their original cost.
1
| | |
| Expense Ratios | | |
| Your Fund Compared With Its Peer Group | | |
| | | Peer Group |
| | Fund | Average |
| Capital Value Fund | 0.50% | 1.15% |
The fund expense ratio shown is from the prospectus dated January 27, 2016, and represents estimated costs for the current fiscal year. For the fiscal year ended September 30, 2016, the fund’s expense ratio was 0.25%. This decrease from the estimated expense ratio reflects a performance-based investment advisory fee adjustment. When the performance adjustment is positive, the fund’s expenses increase; when it is negative, expenses decrease. The peer-group expense ratio is derived from data provided by Lipper, a Thomson Reuters Company, and captures information through year-end 2015.
Peer group: Multi-Cap Value Funds.
2
Chairman’s Perspective

Bill McNabb
Chairman and Chief Executive Officer
Dear Shareholder,
If you think you’ve had reason to feel uneasy about the investment environment lately, you’re not imagining things. In just the past few months, we’ve seen economic uncertainty, intense political polarization, and super-low bond yields. Yet at the same time, the stock market kept pushing higher.
In this confusing and sometimes contradictory climate, you may be asking yourself a question that I hear often: How do I make sense of all this, keep investing, and still get a good night’s sleep?
As with any problem, there are multiple ways to go at it. But there’s one approach in particular that is simple, straightforward, and nearly foolproof: Save more money. Not only can saving more give you a greater sense of control over your investment plan, it can help compensate for long-term returns that, in our estimation, could fall short of historical averages.
I love the way one of our investment pros put it. Fran Kinniry this summer told The Wall Street Journal, “Investing is always a partnership between you and the markets.” He explained that the markets carried more than their fair share of the weight for a couple of decades, through the 1990s, providing outsized returns that made the investor’s half of the partnership relatively light work. “But now you are going to have to be the majority partner.”
Sobering? Sure. Hopeless? Definitely not.
3
Over the 12 months since last September, U.S. stocks returned 15%, though the rise has not been a one-way ticket straight up. International markets have also posted strong returns, but lower than those of the broad U.S. market. The decision by United Kingdom voters in June to exit the European Union came as a surprise but caused market heartburn for only a few days.
In fixed income, yields remained extremely low—about 1.60% on the 10-year U.S. Treasury note at the end of September, after dipping below 1.40% over the summer. And bond yields in some international markets were negative.
Even this relatively small window of time illustrates a truism of the financial markets: There will always be segments that perform well and others that don’t. Saving more saves you from trying to control the uncontrollable—how economies and the markets perform. And it keeps you in control of one of the most vital parts of your investment program.
Although the “save more” logic is easy to grasp, it’s not always easy to follow. Bills, illness, the loss of a job—these can affect any of us.
But whatever our circumstances, figuring out how to save more is worth the effort. It requires that we make difficult decisions to forgo some consumption today to increase the likelihood of consuming (or consuming more) in the future. This is the very heart of investing. Sacrifices are never fun, so consider carrying them out systematically and in doses that you
| | | |
| Market Barometer | | | |
| | | Average Annual Total Returns |
| | | Periods Ended September 30, 2016 |
| | One | Three | Five |
| | Year | Years | Years |
| Stocks | | | |
| Russell 1000 Index (Large-caps) | 14.93% | 10.78% | 16.41% |
| Russell 2000 Index (Small-caps) | 15.47 | 6.71 | 15.82 |
| Russell 3000 Index (Broad U.S. market) | 14.96 | 10.44 | 16.36 |
| FTSE All-World ex US Index (International) | 9.62 | 0.71 | 6.50 |
| |
| Bonds | | | |
| Bloomberg Barclays U.S. Aggregate Bond Index | | | |
| (Broad taxable market) | 5.19% | 4.03% | 3.08% |
| Bloomberg Barclays Municipal Bond Index | | | |
| (Broad tax-exempt market) | 5.58 | 5.54 | 4.48 |
| Citigroup Three-Month U.S. Treasury Bill Index | 0.20 | 0.06 | 0.06 |
| |
| CPI | | | |
| Consumer Price Index | 1.46% | 1.03% | 1.25% |
4
can be comfortable with—for instance, gradually getting up to the max in your IRA, or adding a percentage point or so to the amount you stash in your employer’s retirement plan. As a point of reference, we generally suggest that investors strive for a retirement savings rate of 12%–15%, including any employer contributions.
If you need more convincing about the wisdom of the “save more” course of action, it might be helpful to examine your alternatives. This list is by no means exhaustive, but it hits on a few of the big ones, and none are without risk.
• Reach for yield. With yields so low on many types of bonds, it’s tempting to find the corners of the fixed income market where payouts are juicier. But with the juice comes considerable risk. You need to be aware that you’d be taking on more risk—and how much more.
• Go all-in on a hot-performing asset class or fund. By now, you know better than that, right?
• Sit tight. This approach isn’t a terrible idea; it’s better than panicking and deciding to just “do something,” particularly if that means changing your approach in response to the market’s movements.
Here’s the inescapably challenging part of your partnership with the markets: In the short run, your “partner” is fickle, emotional, and wildly unpredictable. But in the long run, your partner is mostly rational and extremely helpful.
The best way to minimize your vulnerability to the market’s mood swings, and to maximize the benefit of your partner’s longer-term strengths, is to expect less and save more. Maybe the markets will deliver better-than-expected returns. Maybe they’ll be consistent with our more modest expectations. In either case, a higher savings rate can help put you in a better position to reach your goals.
As always, thank you for investing with Vanguard.
Sincerely,

F. William McNabb III
Chairman and Chief Executive Officer
October 18, 2016
5
Advisor’s Report
For the fiscal year ended September 30, 2016, the Capital Value Fund returned 11.36%. The fund’s performance reflects the management of the fund by Wellington Management Company llp, which will mark its 15th anniversary as the fund’s advisor in December.
As was announced in July, Peter Higgins, one of the two Wellington managers who had independently overseen a portion of the portfolio, no longer serves as an advisor. The remaining manager, David W. Palmer, now has sole responsibility for the portfolio.
Mr. Palmer has prepared the following discussion of the investment environment that existed during the 12-month period and of how the portfolio positioning reflects his assessment. These comments were prepared on October 17, 2016.
Portfolio Manager: David W. Palmer, CFA Senior Managing Director
We focus on stocks that trade at a discounted multiple to the broad market, based on current earnings or those we expect to materialize within a reasonable time horizon. Our approach searches for companies with pronounced negative sentiment, controversy, or perceived event risk that we believe, as a result of fundamental research and analysis, to be temporary or overstated. Because individual holdings can be out of phase with the market for extended periods, we seek to build a portfolio of stocks with unique drivers, diversified across capitalization sizes and industries.
Investors experienced a wide range of economic and market ups and downs over the 12 months, culminating in a double-digit total return. The year included many mixed messages on the pace of global activity, such as when the European Central Bank and the Bank of Japan felt the need to push through additional policy easing—including negative interest rates and purchases of domestic securities—to encourage borrowing and spending in those regions.
Meanwhile, the U.S. Federal Reserve initiated its first interest rate increase in December, a move that was well-telegraphed. Stock prices started calendar 2016 on shaky footing, particularly for cyclical industries and financials, as investors worried about news from China, including the potential for a significant devaluation of the nation’s currency, the renminbi. Those concerns have abated since the February lows, and despite the temporary shock to equities from the June vote by the United Kingdom to exit the European Union, improving sentiment helped lift stocks nicely through the end of September.
In recent months, as the two separately managed portfolios were consolidated into one, we reduced the total number of holdings from 150 to 87.
6
The primary driver of the fund’s performance gap versus the Russell 3000 Value Index was security selection in the information technology, health care, and energy sectors. Strong stock selection in the consumer discretionary and materials sectors helped to offset some of the drag. Sector allocation helped relative returns, particularly the underweight allocation to financials and overweight allocations to materials and information technology. (Note that for the attribution analysis, real estate was included in the financial sector through August 31, when a new real estate sector was created under the Global Industry Classification Standard, bringing the number of GICS sectors to 11.)
Among individual stocks, Cobalt International Energy, an offshore energy explorer; SunEdison, a renewable energy producer; and Portola Pharmaceuticals, a developer of hematology-focused drugs, were the primary detractors from relative results. SunEdison and Portola Pharmaceuticals were eliminated from the portfolio. Top contributors to relative performance included Las Vegas Sands, the casino operator; Pioneer Natural Resources, a Permian Basin energy producer; and Tesaro, a developer of oncology drugs. Avoiding Wells Fargo, a large benchmark constituent, also benefited results; the banking and financial services provider has been scrutinized lately for its sales tactics.
Portfolio positioning shifted during the year, in part because of the fund structure changes, although we have also pivoted weightings to track where we see the greatest value emerging. At period-end, the largest portfolio overweights relative to the Russell 3000 Value benchmark were in the health care, consumer discretionary, and materials sectors. Health care stocks, in particular many in the pharmaceutical and biotech subsectors, have fallen notably out of favor with investors in 2016 as market participants have focused on industry-wide pricing pressures and as volume benefits from implementation of the Affordable Care Act have tailed off.
In addition, a more skeptical attitude toward future innovation potential has taken hold as some high-profile clinical trials have produced more nuanced or, in some cases, unexpected negative results. Our team’s outlook for health care is that companies demonstrating real innovation and those who can reduce systemic costs will reap benefits, to the detriment of companies offering me-too solutions or purely pricing-driven earnings growth.
Amid sharp swings in stock prices, we have built up our larger health care exposures along these twin fronts, favoring companies such as Bristol-Myers Squibb, Tesaro, Biogen, and Regeneron on the drug discovery side. On the cost-savings theme, we have identified attractive risk-reward balance in generics producers such as Teva Pharmaceutical and the recently controversial Mylan, and in urgent care outsourcer Envision Healthcare.
7
Within the consumer discretionary area, we have initiated holdings in several stocks, all of which have declined to attractively discounted valuation multiples for reasons we consider to be only temporary. For example, SES, the Luxembourg-based satellite communications concern, has come under pressure from sellers worried about the future of broadcast video and overcapacity in certain segments of the broadband data transmission market. We see the company as a good value for its legacy business, with high-growth potential coming out of its unique medium Earth orbit satellites, which are closer to the ground than geostationary satellites for TV. This technology provides fast broadband to cruise ships, offshore energy platforms, and other remote locations.
Delphi Automotive, an auto parts and systems supplier, also declined off its highs amid concerns about slowing global car sales. We believe that Delphi, which is trading at a wide discount to the market on consensus 2017 earnings, is attractively positioned in next-generation technologies for assisted driving and fully autonomous vehicles. The company’s balance sheet and cash generation capabilities, as a result of restructuring its legacy liabilities during the financial crisis, leave Delphi in solid shape to weather a downturn if current softness is a harbinger of lower industry demand. Ultimately, we believe Delphi stacks up well against other cyclicals, many of which have seen their year-to-date share price performance run well ahead of their earnings-growth prospects.
Our base case outlook for the coming year, in consultation with Wellington’s macroeconomics team, is for modest positive near-term growth, with incremental acceleration to a more constructive environment in 2017. At this late stage of the economic expansion, however, we acknowledge the many potential global shocks, policy missteps, and risk-off sentiment swings that could pop up at any time to derail this more favorable scenario.
For those reasons, we continue to monitor the debt levels and access to liquidity of the companies in the portfolio, with the goal of steering away from the market’s more highly levered companies. In the same way, we are also less charitable in our thinking toward those stocks that require significant sales volume recovery to navigate their way through any current difficulties.
We firmly believe that the portfolio today attractively balances an appropriate level of downside risk with a highly appealing level of upside revaluation potential, and we are grateful to the Capital Value shareholders for the opportunity to prove that balance will be a winning one in the future.
8
| | | |
| Capital Value Fund | | |
| |
| |
| Fund Profile | | | |
| As of September 30, 2016 | | |
| |
| |
| Portfolio Characteristics | | |
| | | | DJ |
| | | | U.S. |
| | | Russell | Total |
| | | 3000 | Market |
| | | Value | FA |
| | Fund | Index | Index |
| Number of Stocks | 87 | 2,025 | 3,850 |
| Median Market Cap | $26.7B | $48.8B | $51.8B |
| Price/Earnings Ratio | 28.0x | 21.9x | 23.7x |
| Price/Book Ratio | 1.7x | 1.8x | 2.8x |
| Return on Equity | 13.2% | 12.4% | 16.6% |
| Earnings Growth | | | |
| Rate | 5.6% | 3.0% | 7.6% |
| Dividend Yield | 2.1% | 2.5% | 2.0% |
| Foreign Holdings | 9.8% | 0.0% | 0.0% |
| Turnover Rate | 134% | — | — |
| Ticker Symbol | VCVLX | — | — |
| Expense Ratio1 | 0.50% | — | — |
| 30-Day SEC Yield | 1.76% | — | — |
| Short-Term Reserves | 1.4% | — | — |
Sector Diversification (% of equity exposure)
| | | |
| | | | DJ |
| | | | U.S. |
| | | Russell | Total |
| | | 3000 | Market |
| | | Value | FA |
| | Fund | Index | Index |
| Consumer Discretionary | 7.9% | 5.3% | 12.8% |
| Consumer Staples | 1.2 | 8.4 | 8.7 |
| Energy | 13.6 | 12.8 | 6.7 |
| Financials | 22.3 | 23.9 | 13.3 |
| Health Care | 14.9 | 11.0 | 14.2 |
| Industrials | 8.0 | 9.7 | 10.3 |
| Information Technology | 11.2 | 10.1 | 20.7 |
| Materials | 5.7 | 3.0 | 3.3 |
| Other | 0.9 | 0.0 | 0.0 |
| Real Estate | 6.7 | 5.6 | 4.3 |
| Telecommunication | | | |
| Services | 1.6 | 3.7 | 2.4 |
| Utilities | 6.0 | 6.5 | 3.3 |
| | |
| Volatility Measures | | |
| | Russell | DJ |
| | 3000 | U.S. Total |
| | Value | Market |
| | Index | FA Index |
| R-Squared | 0.83 | 0.81 |
| Beta | 1.31 | 1.28 |
These measures show the degree and timing of the fund’s fluctuations compared with the indexes over 36 months.
Ten Largest Holdings (% of total net assets)
| | |
| MetLife Inc. | Life & Health | |
| | Insurance | 3.8% |
| Citigroup Inc. | Diversified Banks | 3.1 |
| PNC Financial Services | | |
| Group Inc. | Regional Banks | 2.5 |
| Principal Financial Group Life & Health | |
| Inc. | Insurance | 2.4 |
| Raymond James | Investment Banking | |
| Financial Inc. | & Brokerage | 2.3 |
| Cisco Systems Inc. | Communications | |
| | Equipment | 2.3 |
| American Tower Corp. | Specialized REITs | 2.3 |
| Mylan NV | Pharmaceuticals | 2.2 |
| Anadarko Petroleum | Oil & Gas Exploration | |
| Corp. | & Production | 2.2 |
| CSX Corp. | Railroads | 2.1 |
| Top Ten | | 25.2% |
The holdings listed exclude any temporary cash investments and equity index products.
Investment Focus
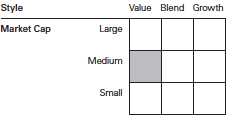
1 The expense ratio shown is from the prospectus dated January 27, 2016, and represents estimated costs for the current fiscal year. For the fiscal year ended September 30, 2016, the expense ratio was 0.25%.
9
Capital Value Fund
Performance Summary
All of the returns in this report represent past performance, which is not a guarantee of future results that may be achieved by the fund. (Current performance may be lower or higher than the performance data cited. For performance data current to the most recent month-end, visit our website at vanguard.com/performance.) Note, too, that both investment returns and principal value can fluctuate widely, so an investor’s shares, when sold, could be worth more or less than their original cost. The returns shown do not reflect taxes that a shareholder would pay on fund distributions or on the sale of fund shares.
Cumulative Performance: September 30, 2006, Through September 30, 2016
Initial Investment of $10,000

See Financial Highlights for dividend and capital gains information.
10
Capital Value Fund
Fiscal-Year Total Returns (%): September 30, 2006, Through September 30, 2016

Capital Value Fund
Russell 3000 Value Index
11
Capital Value Fund
Financial Statements
Statement of Net Assets
As of September 30, 2016
The fund reports a complete list of its holdings in regulatory filings four times in each fiscal year, at the quarter-ends. For the second and fourth fiscal quarters, the lists appear in the fund’s semiannual and annual reports to shareholders. For the first and third fiscal quarters, the fund files the lists with the Securities and Exchange Commission on Form N-Q. Shareholders can look up the fund’s Forms N-Q on the SEC’s website at sec.gov. Forms N-Q may also be reviewed and copied at the SEC’s Public Reference Room (see the back cover of this report for further information).
| | | | |
| | | | | Market |
| | | | | Value• |
| | | | Shares | ($000) |
| Common Stocks (98.5%) | | |
| Consumer Discretionary (7.8%) | |
| | Las Vegas Sands Corp. | 286,831 | 16,504 |
| | SES SA Class A | | 555,506 | 13,626 |
| | John Wiley & Sons Inc. | | |
| | Class A | | 185,188 | 9,557 |
| | Ralph Lauren Corp. Class A | 89,928 | 9,095 |
| | Delphi Automotive plc | 117,100 | 8,352 |
| * | Toll Brothers Inc. | | 194,700 | 5,814 |
| * | Global Brands Group | | | |
| | Holding Ltd. | 39,552,000 | 4,055 |
| | Sky plc | | 300,240 | 3,479 |
| | Melco Crown | | | |
| | Entertainment Ltd. ADR | 146,200 | 2,355 |
| | | | | 72,837 |
| Consumer Staples (1.9%) | | |
| | British American | | | |
| | Tobacco plc | | 168,732 | 10,791 |
| | Coty Inc. Class A | | 279,094 | 6,559 |
| | | | | 17,350 |
| Energy (13.3%) | | | |
| | Anadarko Petroleum Corp. | 320,427 | 20,302 |
| | Halliburton Co. | | 366,220 | 16,436 |
| | Canadian Natural | | | |
| | Resources Ltd. | | 378,491 | 12,127 |
| | Marathon Oil Corp. | | 728,808 | 11,522 |
| | Cabot Oil & Gas Corp. | 436,232 | 11,255 |
| | Pioneer Natural | | | |
| | Resources Co. | | 60,459 | 11,224 |
| | Helmerich & Payne Inc. | 115,018 | 7,741 |
| * | Diamondback Energy Inc. | 72,732 | 7,022 |
| * | Southwestern Energy Co. | 475,875 | 6,586 |
| | HollyFrontier Corp. | | 215,572 | 5,281 |
| | QEP Resources Inc. | | 262,026 | 5,117 |
| | Hess Corp. | | 82,898 | 4,445 |
| | National Oilwell Varco Inc. | 65,051 | 2,390 |
| *,^ | Trican Well Service Ltd. | 858,696 | 1,761 |
| * | Cobalt International | | | |
| | Energy Inc. | | 1,039,354 | 1,289 |
| | | | | 124,498 |
| | | |
| | | | Market |
| | | | Value• |
| | | Shares | ($000) |
| Financials (22.0%) | | |
| | MetLife Inc. | 796,736 | 35,399 |
| | Citigroup Inc. | 606,986 | 28,668 |
| | PNC Financial Services | | |
| | Group Inc. | 262,635 | 23,661 |
| | Principal Financial | | |
| | Group Inc. | 430,234 | 22,161 |
| | Raymond James | | |
| | Financial Inc. | 374,745 | 21,814 |
| | American International | | |
| | Group Inc. | 289,662 | 17,189 |
| | Arthur J Gallagher & Co. | 321,911 | 16,376 |
| | M&T Bank Corp. | 123,602 | 14,350 |
| | JPMorgan Chase & Co. | 198,086 | 13,191 |
| | Unum Group | 294,855 | 10,411 |
| | Torchmark Corp. | 32,172 | 2,055 |
| | | | 205,275 |
| Health Care (14.7%) | | |
| * | Mylan NV | 544,386 | 20,752 |
| | McKesson Corp. | 99,782 | 16,639 |
| | Bristol-Myers Squibb Co. | 292,326 | 15,762 |
| * | Allergan plc | 62,252 | 14,337 |
| | Teva Pharmaceutical | | |
| | Industries Ltd. ADR | 234,721 | 10,799 |
| * | Envision Healthcare | | |
| | Holdings Inc. | 473,335 | 10,541 |
| | Merck & Co. Inc. | 168,846 | 10,538 |
| * | Biogen Inc. | 28,058 | 8,783 |
| * | TESARO Inc. | 78,370 | 7,856 |
| * | Regeneron | | |
| | Pharmaceuticals Inc. | 15,000 | 6,030 |
| | Eli Lilly & Co. | 60,100 | 4,824 |
| * | MEDNAX Inc. | 65,361 | 4,330 |
| * | Alder | | |
| | Biopharmaceuticals Inc. | 125,258 | 4,105 |
| *,^ | Novavax Inc. | 852,396 | 1,773 |
| | | | 137,069 |
12
| | | |
| Capital Value Fund | | |
| |
| |
| |
| | | | Market |
| | | | Value• |
| | | Shares | ($000) |
| Industrials (7.9%) | | |
| | CSX Corp. | 639,039 | 19,491 |
| * | IHS Markit Ltd. | 403,947 | 15,168 |
| * | Genesee & Wyoming Inc. | | |
| | Class A | 194,660 | 13,422 |
| | Eaton Corp. plc | 139,691 | 9,179 |
| | Sanwa Holdings Corp. | 789,600 | 7,640 |
| * | Generac Holdings Inc. | 122,935 | 4,463 |
| | United Parcel Service Inc. | | |
| | Class B | 35,893 | 3,925 |
| | | | 73,288 |
| Information Technology (11.0%) | |
| | Cisco Systems Inc. | 677,382 | 21,486 |
| * | Alphabet Inc. Class A | 20,640 | 16,596 |
| | Skyworks Solutions Inc. | 202,744 | 15,437 |
| | Western Digital Corp. | 182,006 | 10,642 |
| | Samsung Electronics | | |
| | Co. Ltd. | 6,300 | 9,182 |
| * | ARRIS International plc | 277,859 | 7,872 |
| * | Envestnet Inc. | 205,167 | 7,478 |
| | Silicon Motion Technology | | |
| | Corp. ADR | 95,129 | 4,927 |
| | Lam Research Corp. | 50,545 | 4,787 |
| * | Genpact Ltd. | 195,700 | 4,687 |
| | | | 103,094 |
| Materials (5.6%) | | |
| | Celanese Corp. Class A | 242,968 | 16,172 |
| | Reliance Steel | | |
| | & Aluminum Co. | 178,631 | 12,867 |
| | CF Industries Holdings Inc. | 359,034 | 8,742 |
| | CRH plc | 214,974 | 7,128 |
| | Bemis Co. Inc. | 76,983 | 3,927 |
| * | Constellium NV Class A | 520,383 | 3,747 |
| | | | 52,583 |
| Other (0.2%) | | |
| *,1 | Allstar Co-Invest LLC | | |
| | Private Placement | NA | 1,861 |
| |
| Real Estate (6.6%) | | |
| | American Tower Corp. | 189,567 | 21,484 |
| | Columbia Property | | |
| | Trust Inc. | 533,512 | 11,945 |
| | Host Hotels & Resorts Inc. | 741,759 | 11,549 |
| | STORE Capital Corp. | 345,235 | 10,174 |
| * | Gores Holdings Inc. | | |
| | Class A | 448,300 | 4,842 |
| | Boston Properties Inc. | 12,000 | 1,636 |
| | | | 61,630 |
| | |
| | | Market |
| | | Value• |
| | Shares | ($000) |
| Telecommunication Services (1.6%) | |
| Verizon | | |
| Communications Inc. | 284,840 | 14,806 |
| |
| Utilities (5.9%) | | |
| PG&E Corp. | 305,950 | 18,715 |
| Exelon Corp. | 496,609 | 16,532 |
| OGE Energy Corp. | 346,168 | 10,946 |
| Sempra Energy | 80,000 | 8,575 |
| | | 54,768 |
| Total Common Stocks | | |
| (Cost $844,073) | | 919,059 |
| Preferred Stocks (0.7%) | | |
| *,2 Lithium Technologies | | |
| Inc. Pfd. (Cost $5,828) | 1,195,700 | 6,600 |
| Temporary Cash Investments (1.6%) | |
| Money Market Fund (0.2%) | | |
| 3,4 Vanguard Market | | |
| Liquidity Fund, | | |
| 0.640% | 17,419 | 1,742 |
| |
| | Face | |
| | Amount | |
| | ($000) | |
| Repurchase Agreement (1.4%) | |
| RBS Securities, Inc. | | |
| 0.460%, 10/3/16 (Dated | | |
| 9/30/16, Repurchase Value | |
| $13,101,000, collateralized | |
| by U.S. Treasury Note/Bond | |
| 0.500%, 1/31/17, with a | | |
| value of $13,365,000) | 13,100 | 13,100 |
| Total Temporary Cash Investments | |
| (Cost $14,842) | | 14,842 |
| Total Investments (100.8%) | | |
| (Cost $864,743) | | 940,501 |
13
| |
| Capital Value Fund | |
| |
| |
| |
| |
| | Amount |
| | ($000) |
| Other Assets and Liabilities (-0.8%) | |
| Other Assets | |
| Investment in Vanguard | 72 |
| Receivables for Investment Securities Sold | 6,897 |
| Receivables for Accrued Income | 1,485 |
| Receivables for Capital Shares Issued | 331 |
| Other Assets | 210 |
| Total Other Assets | 8,995 |
| Liabilities | |
| Payables for Investment Securities | |
| Purchased | (11,642) |
| Collateral for Securities on Loan | (1,742) |
| Payables to Investment Advisor | (45) |
| Payables for Capital Shares Redeemed | (726) |
| Payables to Vanguard | (2,143) |
| Other Liabilities | (41) |
| Total Liabilities | (16,339) |
| Net Assets (100%) | |
| Applicable to 81,151,995 outstanding | |
| $.001 par value shares of beneficial | |
| interest (unlimited authorization) | 933,157 |
| Net Asset Value Per Share | $11.50 |
| |
| At September 30, 2016, net assets consisted of: |
| | Amount |
| | ($000) |
| Paid-in Capital | 1,015,394 |
| Undistributed Net Investment Income | 9,068 |
| Accumulated Net Realized Losses | (167,195) |
| Unrealized Appreciation (Depreciation) | |
| Investment Securities | 75,758 |
| Forward Currency Contracts | 143 |
| Foreign Currencies | (11) |
| Net Assets | 933,157 |
• See Note A in Notes to Financial Statements. * Non-income-producing security.
^ Includes partial security positions on loan to broker-dealers. The total value of securities on loan is $1,196,000.
1 Restricted security represents 0.2% of net assets. Shares not applicable for this private placement.
2 Restricted security represents 0.7% of net assets.
3 Affiliated money market fund available only to Vanguard funds and certain trusts and accounts managed by Vanguard. Rate shown is the 7-day yield.
4 Includes $1,742,000 of collateral received for securities on loan. ADR—American Depositary Receipt.
See accompanying Notes, which are an integral part of the Financial Statements.
14
| |
| Capital Value Fund | |
| |
| |
| Statement of Operations | |
| |
| | Year Ended |
| | September 30, 2016 |
| | ($000) |
| Investment Income | |
| Income | |
| Dividends1 | 16,139 |
| Interest | 7 |
| Securities Lending—Net | 1,278 |
| Total Income | 17,424 |
| Expenses | |
| Investment Advisory Fees—Note B | |
| Basic Fee | 2,203 |
| Performance Adjustment | (1,956) |
| The Vanguard Group—Note C | |
| Management and Administrative | 1,914 |
| Marketing and Distribution | 219 |
| Custodian Fees | 73 |
| Auditing Fees | 35 |
| Shareholders’ Reports | 18 |
| Trustees’ Fees and Expenses | 2 |
| Total Expenses | 2,508 |
| Expenses Paid Indirectly | (16) |
| Net Expenses | 2,492 |
| Net Investment Income | 14,932 |
| Realized Net Gain (Loss) | |
| Investment Securities Sold | (165,668) |
| Foreign Currencies and Forward Currency Contracts | 820 |
| Realized Net Gain (Loss) | (164,848) |
| Change in Unrealized Appreciation (Depreciation) | |
| Investment Securities | 254,347 |
| Foreign Currencies and Forward Currency Contracts | (45) |
| Change in Unrealized Appreciation (Depreciation) | 254,302 |
| Net Increase (Decrease) in Net Assets Resulting from Operations | 104,386 |
| 1 Dividends are net of foreign withholding taxes of $248,000. | |
See accompanying Notes, which are an integral part of the Financial Statements.
15
| | |
| Capital Value Fund | | |
| |
| |
| Statement of Changes in Net Assets | | |
| |
| | Year Ended September 30, |
| | 2016 | 2015 |
| | ($000) | ($000) |
| Increase (Decrease) in Net Assets | | |
| Operations | | |
| Net Investment Income | 14,932 | 13,256 |
| Realized Net Gain (Loss) | (164,848) | 130,824 |
| Change in Unrealized Appreciation (Depreciation) | 254,302 | (352,612) |
| Net Increase (Decrease) in Net Assets Resulting from Operations | 104,386 | (208,532) |
| Distributions | | |
| Net Investment Income | (12,846) | (18,062) |
| Realized Capital Gain1 | (93,310) | (154,201) |
| Total Distributions | (106,156) | (172,263) |
| Capital Share Transactions | | |
| Issued | 100,481 | 216,336 |
| Issued in Lieu of Cash Distributions | 99,619 | 162,455 |
| Redeemed | (323,723) | (723,255) |
| Net Increase (Decrease) from Capital Share Transactions | (123,623) | (344,464) |
| Total Increase (Decrease) | (125,393) | (725,259) |
| Net Assets | | |
| Beginning of Period | 1,058,550 | 1,783,809 |
| End of Period2 | 933,157 | 1,058,550 |
1 Includes fiscal 2016 and 2015 short-term gain distributions totaling $27,386,000 and $99,085,000, respectively. Short-term gain distributions are treated as ordinary income dividends for tax purposes.
2 Net Assets—End of Period includes undistributed (overdistributed) net investment income of $9,068,000 and $6,757,000.
See accompanying Notes, which are an integral part of the Financial Statements.
16
| | | | | |
| Capital Value Fund | | | | | |
| |
| |
| Financial Highlights | | | | | |
| |
| |
| For a Share Outstanding | | | Year Ended September 30, |
| Throughout Each Period | 2016 | 2015 | 2014 | 2013 | 2012 |
| Net Asset Value, Beginning of Period | $11.45 | $15.32 | $14.57 | $10.58 | $8.59 |
| Investment Operations | | | | | |
| Net Investment Income | .180 | .1291 | .1782 | .138 | .155 |
| Net Realized and Unrealized Gain (Loss) | | | | | |
| on Investments | 1.060 | (2.330) | 2.055 | 4.051 | 2.075 |
| Total from Investment Operations | 1.240 | (2.201) | 2.233 | 4.189 | 2.230 |
| Distributions | | | | | |
| Dividends from Net Investment Income | (.144) | (.175) | (.111) | (.199) | (.100) |
| Distributions from Realized Capital Gains | (1.046) | (1.494) | (1.372) | — | (.140) |
| Total Distributions | (1.190) | (1.669) | (1.483) | (.199) | (.240) |
| Net Asset Value, End of Period | $11.50 | $11.45 | $15.32 | $14.57 | $10.58 |
| |
| Total Return3 | 11.36% | -15.67% | 16.50% | 40.21% | 26.50% |
| |
| Ratios/Supplemental Data | | | | | |
| Net Assets, End of Period (Millions) | $933 | $1,059 | $1,784 | $1,249 | $659 |
| Ratio of Total Expenses to Average Net Assets4 | 0.25% | 0.50% | 0.47% | 0.41% | 0.47% |
| Ratio of Net Investment Income to | | | | | |
| Average Net Assets | 1.51% | 0.93% | 1.19%2 | 1.03% | 1.42% |
| Portfolio Turnover Rate | 134% | 90% | 90% | 132% | 123% |
1 Calculated based on average shares outstanding.
2 Net investment income per share and the ratio of net investment income to average net assets include $.018 and 0.12%, respectively, resulting from income received from Vodafone Group plc in the form of cash and shares in Verizon Communications Inc. in February 2014.
3 Total returns do not include account service fees that may have applied in the periods shown. Fund prospectuses provide information about any applicable account service fees.
4 Includes performance-based investment advisory fee increases (decreases) of (0.20%), 0.06%, 0.02%, (0.05%), and 0.01%.
See accompanying Notes, which are an integral part of the Financial Statements.
17
Capital Value Fund
Notes to Financial Statements
Vanguard Capital Value Fund is registered under the Investment Company Act of 1940 as an open-end investment company, or mutual fund.
A. The following significant accounting policies conform to generally accepted accounting principles for U.S. investment companies. The fund consistently follows such policies in preparing its financial statements.
1. Security Valuation: Securities are valued as of the close of trading on the New York Stock Exchange (generally 4 p.m., Eastern time) on the valuation date. Equity securities are valued at the latest quoted sales prices or official closing prices taken from the primary market in which each security trades; such securities not traded on the valuation date are valued at the mean of the latest quoted bid and asked prices. Securities for which market quotations are not readily available, or whose values have been affected by events occurring before the fund’s pricing time but after the close of the securities’ primary markets, are valued at their fair values calculated according to procedures adopted by the board of trustees. These procedures include obtaining quotations from an independent pricing service, monitoring news to identify significant market- or security-specific events, and evaluating changes in the values of foreign market proxies (for example, ADRs, futures contracts, or exchange-traded funds), between the time the foreign markets close and the fund’s pricing time. When fair-value pricing is employed, the prices of securities used by a fund to calculate its net asset value may differ from quoted or published prices for the same securities. Investments in Vanguard Market Liquidity Fund are valued at that fund’s net asset value. Temporary cash investments acquired over 60 days to maturity are valued using the latest bid prices or using valuations based on a matrix system (which considers such factors as security prices, yields, maturities, and ratings), both as furnished by independent pricing services. Other temporary cash investments are valued at amortized cost, which approximates market value.
2. Foreign Currency: Securities and other assets and liabilities denominated in foreign currencies are translated into U.S. dollars using exchange rates obtained from an independent third party as of the fund’s pricing time on the valuation date. Realized gains (losses) and unrealized appreciation (depreciation) on investment securities include the effects of changes in exchange rates since the securities were purchased, combined with the effects of changes in security prices. Fluctuations in the value of other assets and liabilities resulting from changes in exchange rates are recorded as unrealized foreign currency gains (losses) until the assets or liabilities are settled in cash, at which time they are recorded as realized foreign currency gains (losses).
3. Forward Currency Contracts: The fund enters into forward currency contracts to protect the value of securities and related receivables and payables against changes in future foreign exchange rates. The fund’s risks in using these contracts include movement in the values of the foreign currencies relative to the U.S. dollar and the ability of the counterparties to fulfill their obligations under the contracts. The fund mitigates its counterparty risk by entering into forward currency contracts only with a diverse group of prequalified counterparties, monitoring their financial strength, entering into master netting arrangements with its counterparties, and requiring its counterparties to transfer collateral as security for their performance. In the absence of a default, the collateral pledged or received by the fund cannot be repledged, resold or rehypothecated. The master netting arrangements provide that, in the event of a counterparty’s default (including bankruptcy), the fund may terminate the forward currency contracts, determine the net amount owed by either party in accordance with its master netting arrangements, and sell or retain any collateral held up to the net amount owed to the fund under the master netting arrangements. The forward currency contracts contain provisions whereby a counter-party may terminate open contracts if the fund’s net assets decline below a certain level, triggering a payment by the fund if the fund is in a net liability position at the time of the termination. The payment
18
Capital Value Fund
amount would be reduced by any collateral the fund has pledged. Any assets pledged as collateral for open contracts are noted in the Statement of Net Assets. The value of collateral received or pledged is compared daily to the value of the forward currency contracts exposure with each counterparty, and any difference, if in excess of a specified minimum transfer amount, is adjusted and settled within two business days.
Forward currency contracts are valued at their quoted daily prices obtained from an independent third party, adjusted for currency risk based on the expiration date of each contract. The notional amounts of the contracts are not recorded in the Statement of Net Assets. Fluctuations in the value of the contracts are recorded in the Statement of Net Assets as an asset (liability) and in the Statement of Operations as unrealized appreciation (depreciation) until the contracts are closed, when they are recorded as realized forward currency contract gains (losses).
During the year ended September 30, 2016, the fund’s average investment in forward currency contracts represented 1% of net assets, based on the average of notional amounts at each quarter-end during the period.
4. Repurchase Agreements: The fund enters into repurchase agreements with institutional counter-parties. Securities pledged as collateral to the fund under repurchase agreements are held by a custodian bank until the agreements mature, and in the absence of a default, such collateral cannot be repledged, resold or rehypothecated. Each agreement requires that the market value of the collateral be sufficient to cover payments of interest and principal. The fund further mitigates its counterparty risk by entering into repurchase agreements only with a diverse group of prequalified counterparties, monitoring their financial strength, and entering into master repurchase agreements with its counter-parties. The master repurchase agreements provide that, in the event of a counterparty’s default (including bankruptcy), the fund may terminate any repurchase agreements with that counterparty, determine the net amount owed, and sell or retain the collateral up to the net amount owed to the fund. Such action may be subject to legal proceedings, which may delay or limit the disposition of collateral.
5. Federal Income Taxes: The fund intends to continue to qualify as a regulated investment company and distribute all of its taxable income. Management has analyzed the fund’s tax positions taken for all open federal income tax years (September 30, 2013–2016), and has concluded that no provision for federal income tax is required in the fund’s financial statements.
6. Distributions: Distributions to shareholders are recorded on the ex-dividend date.
7. Securities Lending: To earn additional income, the fund lends its securities to qualified institutional borrowers. Security loans are subject to termination by the fund at any time, and are required to be secured at all times by collateral in an amount at least equal to the market value of securities loaned. Daily market fluctuations could cause the value of loaned securities to be more or less than the value of the collateral received. When this occurs, the collateral is adjusted and settled on the next business day. The fund further mitigates its counterparty risk by entering into securities lending transactions only with a diverse group of prequalified counterparties, monitoring their financial strength, and entering into master securities lending agreements with its counterparties. The master securities lending agreements provide that, in the event of a counterparty’s default (including bankruptcy), the fund may terminate any loans with that borrower, determine the net amount owed, and sell or retain the collateral up to the net amount owed to the fund; however, such actions may be subject to legal proceedings. While collateral mitigates counterparty risk, in the absence of a default the fund may experience delays and costs in recovering the securities loaned. The fund invests cash collateral received in Vanguard Market Liquidity Fund, and records a liability in the Statement of Net Assets
19
Capital Value Fund
for the return of the collateral, during the period the securities are on loan. Securities lending income represents fees charged to borrowers plus income earned on invested cash collateral, less expenses associated with the loan. During the term of the loan, the fund is entitled to all distributions made on or in respect of the loaned securities.
8. Credit Facility: The fund and certain other funds managed by The Vanguard Group (“Vanguard”) participate in a $3.1 billion committed credit facility provided by a syndicate of lenders pursuant to a credit agreement that may be renewed annually; each fund is individually liable for its borrowings, if any, under the credit facility. Borrowings may be utilized for temporary and emergency purposes, and are subject to the fund’s regulatory and contractual borrowing restrictions. The participating funds are charged administrative fees and an annual commitment fee of 0.10% of the undrawn amount of the facility; these fees are allocated to the funds based on a method approved by the fund’s board of trustees and included in Management and Administrative expenses on the fund’s Statement of Operations. Any borrowings under this facility bear interest at a rate based upon the higher of the one-month London Interbank Offered Rate, federal funds effective rate, or overnight bank funding rate plus an agreed-upon spread.
The fund had no borrowings outstanding at September 30, 2016, or at any time during the period then ended.
9. Other: Dividend income is recorded on the ex-dividend date. Interest income is accrued daily. Premiums and discounts on debt securities purchased are amortized and accreted, respectively, to interest income over the lives of the respective securities. Security transactions are accounted for on the date securities are bought or sold. Costs used to determine realized gains (losses) on the sale of investment securities are those of the specific securities sold.
B. Wellington Management Company LLP provides investment advisory services to the fund for a fee calculated at an annual percentage rate of average net assets. The basic fee is subject to quarterly adjustments based on the fund’s performance relative to the Dow Jones U.S. Total Stock Market Float Adjusted Index for the preceding three years. For the year ended September 30, 2016, the investment advisory fee represented an effective annual basic rate of 0.22% of the fund’s average net assets before a decrease of $1,956,000 (0.20%) based on performance.
C. In accordance with the terms of a Funds’ Service Agreement (the “FSA”) between Vanguard and the fund, Vanguard furnishes to the fund corporate management, administrative, marketing, and distribution services at Vanguard’s cost of operations (as defined by the FSA). These costs of operations are allocated to the fund based on methods and guidelines approved by the board of trustees. Vanguard does not require reimbursement in the current period for certain costs of operations (such as deferred compensation/benefits and risk/insurance costs); the fund’s liability for these costs of operations is included in Payables to Vanguard on the Statement of Net Assets.
Upon the request of Vanguard, the fund may invest up to 0.40% of its net assets as capital in Vanguard. At September 30, 2016, the fund had contributed to Vanguard capital in the amount of $72,000, representing 0.01% of the fund’s net assets and 0.03% of Vanguard’s capitalization. The fund’s trustees and officers are also directors and employees, respectively, of Vanguard.
D. The fund has asked its investment advisor to direct certain security trades, subject to obtaining the best price and execution, to brokers who have agreed to rebate to the fund part of the commissions generated. Such rebates are used solely to reduce the fund’s management and administrative expenses. For the year ended September 30, 2016, these arrangements reduced the fund’s expenses by $16,000 (an annual rate of 0.00% of average net assets).
20
Capital Value Fund
E. Various inputs may be used to determine the value of the fund’s investments. These inputs are summarized in three broad levels for financial statement purposes. The inputs or methodologies used to value securities are not necessarily an indication of the risk associated with investing in those securities.
Level 1—Quoted prices in active markets for identical securities.
Level 2—Other significant observable inputs (including quoted prices for similar securities, interest rates, prepayment speeds, credit risk, etc.).
Level 3—Significant unobservable inputs (including the fund’s own assumptions used to determine the fair value of investments).
The following table summarizes the market value of the fund’s investments as of September 30, 2016, based on the inputs used to value them:
| | | |
| | Level 1 | Level 2 | Level 3 |
| Investments | ($000) | ($000) | ($000) |
| Common Stocks | 861,297 | 55,901 | 1,861 |
| Preferred Stocks | — | — | 6,600 |
| Temporary Cash Investments | 1,742 | 13,100 | — |
| Forward Currency Contracts—Assets | — | 153 | — |
| Forward Currency Contracts—Liabilities | — | (10) | — |
| Total | 863,039 | 69,144 | 8,461 |
F. At September 30, 2016, the fund had open forward currency contracts to receive and deliver currencies as follows. Unrealized appreciation (depreciation) on open forward currency contracts is treated as realized gain (loss) for tax purposes.
| | | | | | |
| | | | | | | |
| | | | | | | Unrealized |
| | Contract | | | Contract Amount (000) | Appreciation |
| | Settlement | | | | | (Depreciation) |
| Counterparty | Date | | Receive | | Deliver | ($000) |
| Deutsche Bank AG | 12/21/16 | USD | 7,109 | EUR | 6,310 | (8) |
| Barclays Bank plc | 12/21/16 | USD | 5,788 | GBP | 4,340 | 153 |
| Credit Suisse International | 12/21/16 | USD | 2,369 | EUR | 2,103 | (2) |
| | | | | | | 143 |
| EUR—Euro. | | | | | | |
| GBP—British pound. | | | | | | |
| USD—U.S. dollar. | | | | | | |
G. Distributions are determined on a tax basis and may differ from net investment income and realized capital gains for financial reporting purposes. Differences may be permanent or temporary. Permanent differences are reclassified among capital accounts in the financial statements to reflect their tax character. Temporary differences arise when certain items of income, expense, gain, or loss are recognized in different periods for financial statement and tax purposes. These differences will reverse at some time in the future. Differences in classification may also result from the treatment of short-term gains as ordinary income for tax purposes.
21
Capital Value Fund
During the year ended September 30, 2016, the fund realized net foreign currency losses of $51,000, which decreased distributable net income for tax purposes; accordingly, such losses have been reclassified from accumulated net realized losses to undistributed net investment income. Certain of the fund’s investments are in securities considered to be passive foreign investment companies, for which any unrealized appreciation and/or realized gains are required to be included in distributable net income for tax purposes. During the year ended September 30, 2016, the fund realized gains on the sale of passive foreign investment companies of $276,000, which have been included in current and prior periods’ taxable income; accordingly, such gains have been reclassified from accumulated net realized losses to undistributed net investment income.
For tax purposes, at September 30, 2016, the fund had $11,307,000 of ordinary income available for distribution. The fund had available capital losses totaling $167,264,000 that may be carried forward indefinitely to offset future net capital gains.
At September 30, 2016, the cost of investment securities for tax purposes was $864,743,000. Net unrealized appreciation of investment securities for tax purposes was $75,758,000, consisting of unrealized gains of $112,450,000 on securities that had risen in value since their purchase and $36,692,000 in unrealized losses on securities that had fallen in value since their purchase.
H. During the year ended September 30, 2016, the fund purchased $1,317,966,000 of investment securities and sold $1,526,808,000 of investment securities, other than temporary cash investments.
| | |
| I. Capital shares issued and redeemed were: | | |
| | Year Ended September 30, |
| | 2016 | 2015 |
| | Shares | Shares |
| | (000) | (000) |
| Issued | 9,076 | 15,385 |
| Issued in Lieu of Cash Distributions | 9,106 | 12,497 |
| Redeemed | (29,458) | (51,913) |
| Net Increase (Decrease) in Shares Outstanding | (11,276) | (24,031) |
J. Management has determined that no material events or transactions occurred subsequent to September 30, 2016, that would require recognition or disclosure in these financial statements.
22
Report of Independent Registered Public Accounting Firm
To the Board of Trustees of Vanguard Malvern Funds and the Shareholders of Vanguard Capital Value Fund: In our opinion, the accompanying statement of net assets and the related statements of operations and of changes in net assets and the financial highlights present fairly, in all material respects, the financial position of Vanguard Capital Value Fund (constituting a separate portfolio of Vanguard Malvern Funds, hereafter referred to as the “Fund”) at September 30, 2016, the results of its operations for the year then ended, the changes in its net assets for each of the two years in the period then ended, and the financial highlights for each of the five years in the period then ended, in conformity with accounting principles generally accepted in the United States of America. These financial statements and financial highlights (hereafter referred to as “financial statements”) are the responsibility of the Fund’s management. Our responsibility is to express an opinion on these financial statements based on our audits. We conducted our audits of these financial statements in accordance with the standards of the Public Company Accounting Oversight Board (United States). Those standards require that we plan and perform the audit to obtain reasonable assurance about whether the financial statements are free of material misstatement. An audit includes examining, on a test basis, evidence supporting the amounts and disclosures in the financial statements, assessing the accounting principles used and significant estimates made by management, and evaluating the overall financial statement presentation. We believe that our audits, which included confirmation of securities at September 30, 2016 by correspondence with the custodians and brokers and by agreement to the underlying ownership records of the transfer agent, provide a reasonable basis for our opinion.
/s/PricewaterhouseCoopers LLP
Philadelphia, Pennsylvania
November 10, 2016
Special 2016 tax information (unaudited) for Vanguard Capital Value Fund
This information for the fiscal year ended September 30, 2016, is included pursuant to provisions of the Internal Revenue Code.
The fund distributed $66,042,000 as capital gain dividends (20% rate gain distributions) to shareholders during the fiscal year.
For nonresident alien shareholders, 100% of short-term capital gain dividends distributed by the fund are qualified short-term capital gains.
The fund distributed $14,768,000 of qualified dividend income to shareholders during the fiscal year.
For corporate shareholders, 78.9% of investment income (dividend income plus short-term gains, if any) qualifies for the dividends-received deduction.
23
Your Fund’s After-Tax Returns
This table presents returns for your fund both before and after taxes. The after-tax returns are shown in two ways: (1) assuming that an investor owned the fund during the entire period and paid taxes on the fund’s distributions, and (2) assuming that an investor paid taxes on the fund’s distributions and sold all shares at the end of each period.
Calculations are based on the highest individual federal income tax and capital gains tax rates in effect at the times of the distributions and the hypothetical sales. State and local taxes were not considered. After-tax returns reflect any qualified dividend income, using actual prior-year figures and estimates for 2016. (In the example, returns after the sale of fund shares may be higher than those assuming no sale. This occurs when the sale would have produced a capital loss. The calculation assumes that the investor received a tax deduction for the loss.)
Please note that your actual after-tax returns will depend on your tax situation and may differ from those shown. Also note that if you own the fund in a tax-deferred account, such as an individual retirement account or a 401(k) plan, this information does not apply to you. Such accounts are not subject to current taxes.
Finally, keep in mind that a fund’s performance—whether before or after taxes—does not guarantee future results.
| | | |
| Average Annual Total Returns: Capital Value Fund | | | |
| Periods Ended September 30, 2016 | | | |
| | One | Five | Ten |
| | Year | Years | Years |
| Returns Before Taxes | 11.36% | 14.18% | 5.72% |
| Returns After Taxes on Distributions | 8.25 | 11.65 | 4.08 |
| Returns After Taxes on Distributions and Sale of Fund Shares | 7.89 | 10.64 | 4.20 |
24
About Your Fund’s Expenses
As a shareholder of the fund, you incur ongoing costs, which include costs for portfolio management, administrative services, and shareholder reports (like this one), among others. Operating expenses, which are deducted from a fund’s gross income, directly reduce the investment return of the fund.
A fund’s expenses are expressed as a percentage of its average net assets. This figure is known as the expense ratio. The following examples are intended to help you understand the ongoing costs (in dollars) of investing in your fund and to compare these costs with those of other mutual funds. The examples are based on an investment of $1,000 made at the beginning of the period shown and held for the entire period.
The accompanying table illustrates your fund’s costs in two ways:
• Based on actual fund return. This section helps you to estimate the actual expenses that you paid over the period. The ”Ending Account Value“ shown is derived from the fund‘s actual return, and the third column shows the dollar amount that would have been paid by an investor who started with $1,000 in the fund. You may use the information here, together with the amount you invested, to estimate the expenses that you paid over the period.
To do so, simply divide your account value by $1,000 (for example, an $8,600 account value divided by $1,000 = 8.6), then multiply the result by the number given for your fund under the heading ”Expenses Paid During Period.“
• Based on hypothetical 5% yearly return. This section is intended to help you compare your fund‘s costs with those of other mutual funds. It assumes that the fund had a yearly return of 5% before expenses, but that the expense ratio is unchanged. In this case—because the return used is not the fund’s actual return—the results do not apply to your investment. The example is useful in making comparisons because the Securities and Exchange Commission requires all mutual funds to calculate expenses based on a 5% return. You can assess your fund’s costs by comparing this hypothetical example with the hypothetical examples that appear in shareholder reports of other funds.
Note that the expenses shown in the table are meant to highlight and help you compare ongoing costs only and do not reflect transaction costs incurred by the fund for buying and selling securities. Further, the expenses do not include any purchase, redemption, or account service fees described in the fund prospectus. If such fees were applied to your account, your costs would be higher. Your fund does not carry a “sales load.”
The calculations assume no shares were bought or sold during the period. Your actual costs may have been higher or lower, depending on the amount of your investment and the timing of any purchases or redemptions.
You can find more information about the fund’s expenses, including annual expense ratios, in the Financial Statements section of this report. For additional information on operating expenses and other shareholder costs, please refer to your fund’s current prospectus.
25
| | | |
| Six Months Ended September 30, 2016 | | | |
| | Beginning | Ending | Expenses |
| | Account Value | Account Value | Paid During |
| Capital Value Fund | 3/31/2016 | 9/30/2016 | Period |
| Based on Actual Fund Return | $1,000.00 | $1,100.48 | $1.47 |
| Based on Hypothetical 5% Yearly Return | 1,000.00 | 1,023.60 | 1.42 |
The calculations are based on expenses incurred in the most recent six-month period. The fund’s annualized six-month expense ratio for that period is 0.28%. The dollar amounts shown as “Expenses Paid” are equal to the annualized expense ratio multiplied by the average account value over the period, multiplied by the number of days in the most recent six-month period, then divided by the number of days in the most recent 12-month period (183/366).
26
Glossary
30-Day SEC Yield. A fund’s 30-day SEC yield is derived using a formula specified by the U.S. Securities and Exchange Commission. Under the formula, data related to the fund’s security holdings in the previous 30 days are used to calculate the fund’s hypothetical net income for that period, which is then annualized and divided by the fund’s estimated average net assets over the calculation period. For the purposes of this calculation, a security’s income is based on its current market yield to maturity (for bonds), its actual income (for asset-backed securities), or its projected dividend yield (for stocks). Because the SEC yield represents hypothetical annualized income, it will differ—at times significantly—from the fund’s actual experience. As a result, the fund’s income distributions may be higher or lower than implied by the SEC yield.
Beta. A measure of the magnitude of a fund’s past share-price fluctuations in relation to the ups and downs of a given market index. The index is assigned a beta of 1.00. Compared with a given index, a fund with a beta of 1.20 typically would have seen its share price rise or fall by 12% when the index rose or fell by 10%. For this report, beta is based on returns over the past 36 months for both the fund and the index. Note that a fund’s beta should be reviewed in conjunction with its R-squared (see definition). The lower the R-squared, the less correlation there is between the fund and the index, and the less reliable beta is as an indicator of volatility.
Dividend Yield. Dividend income earned by stocks, expressed as a percentage of the aggregate market value (or of net asset value, for a fund). The yield is determined by dividing the amount of the annual dividends by the aggregate value (or net asset value) at the end of the period. For a fund, the dividend yield is based solely on stock holdings and does not include any income produced by other investments.
Earnings Growth Rate. The average annual rate of growth in earnings over the past five years for the stocks now in a fund.
Equity Exposure. A measure that reflects a fund’s investments in stocks and stock futures. Any holdings in short-term reserves are excluded.
Expense Ratio. A fund’s total annual operating expenses expressed as a percentage of the fund’s average net assets. The expense ratio includes management and administrative expenses, but does not include the transaction costs of buying and selling portfolio securities.
Foreign Holdings. The percentage of a fund represented by securities or depositary receipts of companies based outside the United States.
Inception Date. The date on which the assets of a fund (or one of its share classes) are first invested in accordance with the fund’s investment objective. For funds with a subscription period, the inception date is the day after that period ends. Investment performance is measured from the inception date.
Median Market Cap. An indicator of the size of companies in which a fund invests; the midpoint of market capitalization (market price x shares outstanding) of a fund’s stocks, weighted by the proportion of the fund’s assets invested in each stock. Stocks representing half of the fund’s assets have market capitalizations above the median, and the rest are below it.
Price/Book Ratio. The share price of a stock divided by its net worth, or book value, per share. For a fund, the weighted average price/book ratio of the stocks it holds.
27
Price/Earnings Ratio. The ratio of a stock’s current price to its per-share earnings over the past year. For a fund, the weighted average P/E of the stocks it holds. P/E is an indicator of market expectations about corporate prospects; the higher the P/E, the greater the expectations for a company’s future growth.
R-Squared. A measure of how much of a fund’s past returns can be explained by the returns from the market in general, as measured by a given index. If a fund’s total returns were precisely synchronized with an index’s returns, its R-squared would be 1.00. If the fund’s returns bore no relationship to the index’s returns, its R-squared would be 0. For this report, R-squared is based on returns over the past 36 months for both the fund and the index.
Return on Equity. The annual average rate of return generated by a company during the past five years for each dollar of shareholder’s equity (net income divided by shareholder’s equity). For a fund, the weighted average return on equity for the companies whose stocks it holds.
Short-Term Reserves. The percentage of a fund invested in highly liquid, short-term securities that can be readily converted to cash.
Turnover Rate. An indication of the fund’s trading activity. Funds with high turnover rates incur higher transaction costs and may be more likely to distribute capital gains (which may be taxable to investors). The turnover rate excludes in-kind transactions, which have minimal impact on costs.
28
This page intentionally left blank.
This page intentionally left blank.
This page intentionally left blank.
The People Who Govern Your Fund
The trustees of your mutual fund are there to see that the fund is operated and managed in your best interests since, as a shareholder, you are a part owner of the fund. Your fund’s trustees also serve on the board of directors of The Vanguard Group, Inc., which is owned by the Vanguard funds and provides services to them on an at-cost basis.
A majority of Vanguard’s board members are independent, meaning that they have no affiliation with Vanguard or the funds they oversee, apart from the sizable personal investments they have made as private individuals. The independent board members have distinguished backgrounds in business, academia, and public service. Each of the trustees and executive officers oversees 198 Vanguard funds.
The following table provides information for each trustee and executive officer of the fund. The mailing address of the trustees and officers is P.O. Box 876, Valley Forge, PA 19482. More information about the trustees is in the Statement of Additional Information, which can be obtained, without charge, by contacting Vanguard at 800-662-7447, or online at vanguard.com.
InterestedTrustee1
F. William McNabb III
Born 1957. Trustee Since July 2009. Chairman of the Board. Principal Occupation(s) During the Past Five Years and Other Experience: Chairman of the Board of The Vanguard Group, Inc., and of each of the investment companies served by The Vanguard Group, since January 2010; Director of The Vanguard Group since 2008; Chief Executive Officer and President of The Vanguard Group, and of each of the investment companies served by The Vanguard Group, since 2008; Director of Vanguard Marketing Corporation; Managing Director of The Vanguard Group (1995–2008).
IndependentTrustees
Emerson U. Fullwood
Born 1948. Trustee Since January 2008. Principal Occupation(s) During the Past Five Years and Other Experience: Executive Chief Staff and Marketing Officer for North America and Corporate Vice President (retired 2008) of Xerox Corporation (document management products and services); Executive in Residence and 2009–2010 Distinguished Minett Professor at the Rochester Institute of Technology; Lead Director of SPX FLOW, Inc. (multi-industry manufacturing); Director of the United Way of Rochester, the University of Rochester Medical Center, Monroe Community College Foundation, North Carolina A&T University, and Roberts Wesleyan College.
Rajiv L. Gupta
Born 1945. Trustee Since December 2001.2 Principal Occupation(s) During the Past Five Years and Other Experience: Chairman and Chief Executive Officer (retired 2009) and President (2006–2008) of Rohm and Haas Co. (chemicals); Director of Tyco International plc (diversified manufacturing and services), HP Inc. (printer and personal computer manufacturing), and Delphi Automotive plc (automotive components); Senior Advisor at New Mountain Capital.
Amy Gutmann
Born 1949. Trustee Since June 2006. Principal Occupation(s) During the Past Five Years and Other Experience: President of the University of Pennsylvania; Christopher H. Browne Distinguished Professor of Political Science, School of Arts and Sciences, and Professor of Communication, Annenberg School for Communication, with secondary faculty appointments in the Department of Philosophy, School of Arts and Sciences, and at the Graduate School of Education, University of Pennsylvania; Trustee of the National Constitution Center; Chair of the Presidential Commission for the Study of Bioethical Issues.
JoAnn Heffernan Heisen
Born 1950. Trustee Since July 1998. Principal Occupation(s) During the Past Five Years and Other Experience: Corporate Vice President and Chief Global Diversity Officer (retired 2008) and Member of the Executive Committee (1997–2008) of Johnson & Johnson (pharmaceuticals/medical devices/consumer products); Director of Skytop Lodge Corporation (hotels) and the Robert Wood Johnson Foundation; Member of the Advisory Board of the Institute for Women’s Leadership at Rutgers University.
F. Joseph Loughrey
Born 1949. Trustee Since October 2009. Principal Occupation(s) During the Past Five Years and Other Experience: President and Chief Operating Officer (retired 2009) of Cummins Inc. (industrial machinery); Chairman of the Board of Hillenbrand, Inc. (specialized consumer services), and of Oxfam America; Director of SKF AB (industrial machinery), Hyster-Yale Materials Handling, Inc. (forklift trucks), the Lumina Foundation for Education, and the V Foundation for Cancer Research; Member of the Advisory Council for the College of Arts and Letters and of the Advisory Board to the Kellogg Institute for International Studies, both at the University of Notre Dame.
Mark Loughridge
Born 1953. Trustee Since March 2012. Principal Occupation(s) During the Past Five Years and Other Experience: Senior Vice President and Chief Financial Officer (retired 2013) at IBM (information technology services); Fiduciary Member of IBM’s Retirement Plan Committee (2004–2013); Director of the Dow Chemical Company; Member of the Council on Chicago Booth.
Scott C. Malpass
Born 1962. Trustee Since March 2012. Principal Occupation(s) During the Past Five Years and Other Experience: Chief Investment Officer and Vice President at the University of Notre Dame; Assistant Professor of Finance at the Mendoza College of Business at Notre Dame; Member of the Notre Dame 403(b) Investment Committee, the Board of Advisors for Spruceview Capital Partners, and the Investment Advisory Committee of Major League Baseball; Board Member of TIFF Advisory Services, Inc., and Catholic Investment Services, Inc. (investment advisors).
André F. Perold
Born 1952. Trustee Since December 2004. Principal Occupation(s) During the Past Five Years and Other Experience: George Gund Professor of Finance and Banking, Emeritus at the Harvard Business School (retired 2011); Chief Investment Officer and Managing Partner of HighVista Strategies LLC (private investment firm); Director of Rand Merchant Bank; Overseer of the Museum of Fine Arts Boston.
Peter F. Volanakis
Born 1955. Trustee Since July 2009. Principal Occupation(s) During the Past Five Years and Other Experience: President and Chief Operating Officer (retired 2010) of Corning Incorporated (communications equipment); Chairman of the Board of Trustees of Colby-Sawyer College; Member of the Advisory Board of the Norris Cotton Cancer Center.
Executive Officers
Glenn Booraem
Born 1967. Treasurer Since May 2015. Principal Occupation(s) During the Past Five Years and Other Experience: Principal of The Vanguard Group, Inc.; Treasurer of each of the investment companies served by The Vanguard Group; Controller of each of the investment companies served by The Vanguard Group (2010–2015); Assistant Controller of each of the investment companies served by The Vanguard Group (2001–2010).
Thomas J. Higgins
Born 1957. Chief Financial Officer Since September 2008. Principal Occupation(s) During the Past Five Years and Other Experience: Principal of The Vanguard Group, Inc.; Chief Financial Officer of each of the investment companies served by The Vanguard Group; Treasurer of each of the investment companies served by The Vanguard Group (1998–2008).
Peter Mahoney
Born 1974. Controller Since May 2015. Principal Occupation(s) During the Past Five Years and Other Experience: Head of Global Fund Accounting at The Vanguard Group, Inc.; Controller of each of the investment companies served by The Vanguard Group; Head of International Fund Services at The Vanguard Group (2008–2014).
Anne E. Robinson
Born 1970. Secretary Since September 2016. Principal Occupation(s) During the Past Five Years and Other Experience: Managing Director of The Vanguard Group, Inc.; General Counsel of The Vanguard Group; Secretary of The Vanguard Group and of each of the investment companies served by The Vanguard Group; Director and Senior Vice President of Vanguard Marketing Corporation; Managing Director and General Counsel of Global Cards and Consumer Services at Citigroup (2014–2016); Counsel at American Express (2003–2014).
Vanguard Senior Management Team
| |
Mortimer J. Buckley Kathleen C. Gubanich Martha G. King John T. Marcante Chris D. McIsaac | James M. Norris Thomas M. Rampulla Glenn W. Reed Karin A. Risi Michael Rollings |
Chairman Emeritus and Senior Advisor John J. Brennan
Chairman, 1996–2009
Chief Executive Officer and President, 1996–2008
Founder
John C. Bogle
Chairman and Chief Executive Officer, 1974–1996
1 Mr. McNabb is considered an “interested person,” as defined in the Investment Company Act of 1940, because he is an officer of the Vanguard funds.
2 December 2002 for Vanguard Equity Income Fund, the Vanguard Municipal Bond Funds, and the Vanguard State Tax-Exempt Funds.
 |
| P.O. Box 2600 |
| Valley Forge, PA 19482-2600 |
Connect with Vanguard® > vanguard.com
| |
| Fund Information > 800-662-7447 | CFA® is a registered trademark owned by CFA Institute. |
| Direct Investor Account Services > 800-662-2739 | |
| Institutional Investor Services > 800-523-1036 | |
| Text Telephone for People | |
| Who Are Deaf or Hard of Hearing> 800-749-7273 | |
| |
| This material may be used in conjunction | |
| with the offering of shares of any Vanguard | |
| fund only if preceded or accompanied by | |
| the fund’s current prospectus. | |
| |
| All comparative mutual fund data are from Lipper, a | |
| Thomson Reuters Company, or Morningstar, Inc., unless | |
| otherwise noted. | |
| |
| You can obtain a free copy of Vanguard’s proxy voting | |
| guidelines by visiting vanguard.com/proxyreporting or by | |
| calling Vanguard at 800-662-2739. The guidelines are | |
| also available from the SEC’s website, sec.gov. In | |
| addition, you may obtain a free report on how your fund | |
| voted the proxies for securities it owned during the 12 | |
| months ended June 30. To get the report, visit either | |
| vanguard.com/proxyreporting or sec.gov. | |
| |
| You can review and copy information about your fund at | |
| the SEC’s Public Reference Room in Washington, D.C. To | |
| find out more about this public service, call the SEC at | |
| 202-551-8090. Information about your fund is also | |
| available on the SEC’s website, and you can receive | |
| copies of this information, for a fee, by sending a | |
| request in either of two ways: via email addressed to | |
| publicinfo@sec.gov or via regular mail addressed to the | |
| Public Reference Section, Securities and Exchange | |
| Commission, Washington, DC 20549-1520. | |
| |
| | © 2016 The Vanguard Group, Inc. |
| | All rights reserved. |
| | Vanguard Marketing Corporation, Distributor. |
| |
| | Q3280 112016 |

Annual Report | September 30, 2016
Vanguard Short-Term Inflation-Protected
Securities Index Fund
A new format, unwavering commitment
As you begin reading this report, you’ll notice that we’ve made some improvements to the opening sections—based on feedback from you, our clients.
Page 1 starts with a new ”Your Fund’s Performance at a Glance,” a concise, handy summary of how your fund performed during the period.
In the renamed ”Chairman’s Perspective,” Bill McNabb will focus on enduring principles and investment insights.
We’ve modified some tables, and eliminated some redundancy, but we haven’t removed any information.
At Vanguard, we’re always looking for better ways to communicate and to help you make sound investment decisions. Thank you for entrusting your assets to us.
| |
| Contents | |
| Your Fund’s Performance at a Glance. | 1 |
| Chairman’s Perspective. | 3 |
| Fund Profile. | 6 |
| Performance Summary. | 7 |
| Financial Statements. | 10 |
| About Your Fund’s Expenses. | 24 |
| Glossary. | 26 |
Please note: The opinions expressed in this report are just that—informed opinions. They should not be considered promises or advice. Also, please keep in mind that the information and opinions cover the period through the date on the front of this report. Of course, the risks of investing in your fund are spelled out in the prospectus.
See the Glossary for definitions of investment terms used in this report.
About the cover: No matter what language you speak, Vanguard has one consistent message and set of principles. Our primary focus is on you, our clients. We conduct our business with integrity as a faithful steward of your assets. This message is shown translated into seven languages, reflecting our expanding global presence.
Your Fund’s Performance at a Glance
• For the year ended September 30, 2016, Vanguard Short-Term Inflation-Protected Securities Index Fund returned 2.48% for Investor Shares, slightly behind its benchmark (+2.62%). The fund’s return was behind that of peer funds, a group that includes longer-maturity holdings, which returned more than shorter-maturity Treasury inflation-protected securities (TIPS).
• Global investors sought higher yields from U.S.-backed bonds, compared with those from sovereign bonds in other developed nations. TIPS’ popularity lifted their prices and lowered their yields. Investor Shares’ 30-day SEC yield began the fiscal year at 0.37% and ended at –0.40%.
• A measure of expected inflation over the next five years (the gap between nominal and TIPS yields) widened from 1.12% to 1.42%.
• To minimize the risk of overdistributing income—a recordkeeping headache for investors—the fund has withheld income distributions since December 2014. Distributions will resume when sufficient income is available.
| | | | |
| Total Returns: Fiscal Year Ended September 30, 2016 | | | | |
| | 30-Day SEC | Income | Capital | Total |
| | Yield | Returns | Returns | Returns |
| Vanguard Short-Term Inflation-Protected Securities Index Fund | | | |
| Investor Shares | -0.40% | 0.43% | 2.05% | 2.48% |
| ETF Shares | -0.29 | | | |
| Market Price | | | | 2.56 |
| Net Asset Value | | | | 2.54 |
| Admiral™ Shares | -0.31 | 0.51 | 2.00 | 2.51 |
| Institutional Shares | -0.27 | 0.53 | 2.02 | 2.55 |
| Bloomberg Barclays U.S. Treasury Inflation-Protected | | | | |
| Securities (TIPS) 0–5 Year Index | | | | 2.62 |
| Inflation-Protected Bond Funds Average | | | | 5.78 |
Inflation-Protected Bond Funds Average: Derived from data provided by Lipper, a Thomson Reuters Company.
Admiral Shares carry lower expenses and are available to investors who meet certain account-balance requirements. Institutional Shares are available to certain institutional investors who meet specific administrative, service, and account-size criteria. The Vanguard ETF® Shares shown are traded on the Nasdaq exchange and are available only through brokers. The table provides ETF returns based on both the Nasdaq market price and the net asset value for a share. U.S. Pat. Nos. 6,879,964; 7,337,138; 7,720,749; 7,925,573; 8,090,646; and 8,417,623.
For the ETF Shares, the market price is determined by the midpoint of the bid-offer spread as of the closing time of the New York Stock Exchange (generally 4 p.m., Eastern time). The net asset value is also determined as of the NYSE closing time. For more information about how the ETF Shares' market prices have compared with their net asset value, visit vanguard.com, select your ETF, and then select the Price and Performance tab. The ETF premium/discount analysis there shows the percentages of days on which the ETF Shares' market price was above or below the NAV.
1
| |
| Total Returns: Inception Through September 30, 2016 | |
| | Average |
| | Annual Return |
| Short-Term Inflation-Protected Securities Index Fund Investor Shares (Returns since inception: | |
| 10/16/2012) | 0.04% |
| Bloomberg Barclays U.S. Treasury Inflation-Protected Securities (TIPS) 0–5 Year Index | 0.10 |
| Inflation-Protected Bond Funds Average | -0.64 |
| Inflation-Protected Bond Funds Average: Derived from data provided by Lipper, a Thomson Reuters Company. | |
The figures shown represent past performance, which is not a guarantee of future results. (Current performance may be lower or higher than the performance data cited. For performance data current to the most recent month-end, visit our website at vanguard.com/performance.) Note, too, that both investment returns and principal value can fluctuate widely, so an investor’s shares, when sold, could be worth more or less than their original cost.
| | | | | |
| Expense Ratios | | | | | |
| Your Fund Compared With Its Peer Group | | | | | |
| | Investor | ETF | Admiral | Institutional | Peer Group |
| | Shares | Shares | Shares | Shares | Average |
| Short-Term Inflation-Protected | | | | | |
| Securities Index Fund | 0.17% | 0.08% | 0.08% | 0.05% | 0.75% |
The fund expense ratios shown are from the prospectus dated January 27, 2016, and represent estimated costs for the current fiscal year. For the fiscal year ended September 30, 2016, the expense ratios were 0.16% for Investor Shares, 0.07% for ETF Shares, 0.07% for Admiral Shares, and 0.04% for Institutional Shares. The peer-group expense ratio is derived from data provided by Lipper, a Thomson Reuters Company, and captures information through year-end 2015.
Peer group: Inflation-Protected Bond Funds.
2
Chairman’s Perspective

Bill McNabb
Chairman and Chief Executive Officer
Dear Shareholder,
If you think you’ve had reason to feel uneasy about the investment environment lately, you’re not imagining things. In just the past few months, we’ve seen economic uncertainty, intense political polarization, and super-low bond yields. Yet at the same time, the stock market kept pushing higher.
In this confusing and sometimes contradictory climate, you may be asking yourself a question that I hear often: How do I make sense of all this, keep investing, and still get a good night’s sleep?
As with any problem, there are multiple ways to go at it. But there’s one approach in particular that is simple, straightforward, and nearly foolproof: Save more money. Not only can saving more give you a greater sense of control over your investment plan, it can help compensate for long-term returns that, in our estimation, could fall short of historical averages.
I love the way one of our investment pros put it. Fran Kinniry this summer told The Wall Street Journal, “Investing is always a partnership between you and the markets.” He explained that the markets carried more than their fair share of the weight for a couple of decades, through the 1990s, providing outsized returns that made the investor’s half of the partnership relatively light work. “But now you are going to have to be the majority partner.”
Sobering? Sure. Hopeless? Definitely not.
3
Over the 12 months since last September, U.S. stocks returned 15%, though the rise has not been a one-way ticket straight up. International markets have also posted strong returns, but lower than those of the broad U.S. market. The decision by United Kingdom voters in June to exit the European Union came as a surprise but caused market heartburn for only a few days.
In fixed income, yields remained extremely low—about 1.60% on the 10-year U.S. Treasury note at the end of September, after dipping below 1.40% over the summer. And bond yields in some international markets were negative.
Even this relatively small window of time illustrates a truism of the financial markets: There will always be segments that perform well and others that don’t. Saving more saves you from trying to control the uncontrollable—how economies and the markets perform. And it keeps you in control of one of the most vital parts of your investment program.
Although the “save more” logic is easy to grasp, it’s not always easy to follow. Bills, illness, the loss of a job—these can affect any of us.
But whatever our circumstances, figuring out how to save more is worth the effort. It requires that we make difficult decisions to forgo some consumption today to increase the likelihood of consuming (or consuming more) in the future. This is the very heart of investing. Sacrifices are never fun, so consider carrying them out systematically and in doses that you
| | | |
| Market Barometer | | | |
| | | Average Annual Total Returns |
| | | Periods Ended September 30, 2016 |
| | One | Three | Five |
| | Year | Years | Years |
| Stocks | | | |
| Russell 1000 Index (Large-caps) | 14.93% | 10.78% | 16.41% |
| Russell 2000 Index (Small-caps) | 15.47 | 6.71 | 15.82 |
| Russell 3000 Index (Broad U.S. market) | 14.96 | 10.44 | 16.36 |
| FTSE All-World ex US Index (International) | 9.62 | 0.71 | 6.50 |
| |
| Bonds | | | |
| Bloomberg Barclays U.S. Aggregate Bond Index | | | |
| (Broad taxable market) | 5.19% | 4.03% | 3.08% |
| Bloomberg Barclays Municipal Bond Index | | | |
| (Broad tax-exempt market) | 5.58 | 5.54 | 4.48 |
| Citigroup Three-Month U.S. Treasury Bill Index | 0.20 | 0.06 | 0.06 |
| |
| CPI | | | |
| Consumer Price Index | 1.46% | 1.03% | 1.25% |
4
can be comfortable with—for instance, gradually getting up to the max in your IRA, or adding a percentage point or so to the amount you stash in your employer’s retirement plan. As a point of reference, we generally suggest that investors strive for a retirement savings rate of 12%–15%, including any employer contributions.
If you need more convincing about the wisdom of the “save more” course of action, it might be helpful to examine your alternatives. This list is by no means exhaustive, but it hits on a few of the big ones, and none are without risk.
• Reach for yield. With yields so low on many types of bonds, it’s tempting to find the corners of the fixed income market where payouts are juicier. But with the juice comes considerable risk. You need to be aware that you’d be taking on more risk—and how much more.
• Go all-in on a hot-performing asset class or fund. By now, you know better than that, right?
• Sit tight. This approach isn’t a terrible idea; it’s better than panicking and deciding to just “do something,” particularly if that means changing your approach in response to the market’s movements.
Here’s the inescapably challenging part of your partnership with the markets: In the short run, your “partner” is fickle, emotional, and wildly unpredictable. But in the long run, your partner is mostly rational and extremely helpful.
The best way to minimize your vulnerability to the market’s mood swings, and to maximize the benefit of your partner’s longer-term strengths, is to expect less and save more. Maybe the markets will deliver better-than-expected returns. Maybe they’ll be consistent with our more modest expectations. In either case, a higher savings rate can help put you in a better position to reach your goals.
As always, thank you for investing with Vanguard.
Sincerely,

F. William McNabb III
Chairman and Chief Executive Officer
October 18, 2016
5
Short-Term Inflation-Protected Securities Index Fund
Fund Profile
As of September 30, 2016
| | | | |
| Share-Class Characteristics | | | | |
| | Investor | | Admiral | Institutional |
| | Shares | ETF Shares | Shares | Shares |
| Ticker Symbol | VTIPX | VTIP | VTAPX | VTSPX |
| Expense Ratio1 | 0.17% | 0.08% | 0.08% | 0.05% |
| 30-Day SEC Yield2 | -0.40% | -0.29% | -0.31% | -0.27% |
| | | |
| Financial Attributes | | |
| | | Bloomberg | |
| | | Barclays | Bloomberg |
| | | TIPS | Barclays |
| | | 0-5 Year | Aggregate |
| | Fund | Index | Bond Index |
| Number of Bonds | 15 | 15 | 9,908 |
| Yield to Maturity | | | |
| (before expenses) | 1.1% | 0.9% | 2.0% |
| Average Coupon | 0.8% | 0.8% | 3.1% |
| Average Duration | 2.7 years | 2.7 years | 5.5 years |
| Average Effective | | | |
| Maturity | 2.7 years | 2.7 years | 7.7 years |
| Short-Term | | | |
| Reserves | 0.0% | — | — |
| |
| Sector Diversification (% of portfolio) | |
| Treasury/Agency | | | 100.0% |
| | |
| Volatility Measures | | |
| | Bloomberg | |
| | Barclays | Bloomberg |
| | TIPS | Barclays |
| | 0-5 Year | Aggregate Bond |
| | Index | Index |
| R-Squared | 0.99 | 0.31 |
| Beta | 1.00 | 0.37 |
These measures show the degree and timing of the fund’s fluctuations compared with the indexes over 36 months.
| |
| Distribution by Credit Quality (% of portfolio) |
| U.S. Government | 100.0% |
Credit-quality ratings are obtained from Barclays and are from Moody's, Fitch, and S&P. When ratings from all three agencies are used, the median rating is shown. When ratings from two of the agencies are used, the lower rating for each issue is shown. "Not Rated" is used to classify securities for which a rating is not available. For more information about these ratings, see the Glossary entry for Credit Quality.
The agency and mortgage-backed securities sectors may include issues from government-sponsored enterprises; such issues are generally not backed by the full faith and credit of the U.S. government.
| |
| Distribution by Effective Maturity | |
| (% of portfolio) | |
| Under 1 Year | 17.7% |
| 1 - 3 Years | 36.5 |
| 3 - 5 Years | 45.8 |
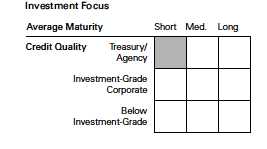
1 The expense ratios shown are from the prospectus dated January 27, 2016, and represent estimated costs for the current fiscal year. For the fiscal
year ended September 30, 2016, the expense ratios were 0.16% for Investor Shares, 0.07% for ETF Shares, 0.07% for Admiral Shares, and 0.04% for
Institutional Shares.
2 Yields of inflation-protected securities tend to be lower than those of nominal bonds, because the former do not incorporate market expectations
about inflation. The principal amounts—and thus the interest payments—of inflation-protected securities are adjusted over time to reflect inflation.
6
Short-Term Inflation-Protected Securities Index Fund
Performance Summary
All of the returns in this report represent past performance, which is not a guarantee of future results that may be achieved by the fund. (Current performance may be lower or higher than the performance data cited. For performance data current to the most recent month-end, visit our website at vanguard.com/performance.) Note, too, that both investment returns and principal value can fluctuate widely, so an investor’s shares, when sold, could be worth more or less than their original cost. The returns shown do not reflect taxes that a shareholder would pay on fund distributions or on the sale of fund shares.

Inflation-Protected Bond Funds Average: Derived from data provided by Lipper, a Thomson Reuters Company.
"Since Inception" performance is calculated from the Investor Shares’ inception date for both the fund and its comparative standards.
| | | |
| | | Since | Final Value |
| | One | Inception | of a $10,000 |
| | Year | (10/12/2012) | Investment |
| Short-Term Inflation-Protected Securities | | | |
| Index Fund ETF Shares Net Asset Value | 2.54% | 0.12% | $10,048 |
| Bloomberg Barclays U.S. Treasury | | | |
| Inflation-Protected Securities (TIPS) 0–5 Year | | | |
| Index | 2.62 | 0.09 | 10,037 |
| Bloomberg Barclays U.S. Aggregate Bond | | | |
| Index | 5.19 | 2.55 | 11,050 |
"Since Inception" performance is calculated from the ETF Shares’ inception date for both the fund and its comparative standards.
See Financial Highlights for dividend and capital gains information.
7
| | | |
| Short-Term Inflation-Protected Securities Index Fund | | | |
| |
| |
| |
| |
| | Average Annual Total Returns | |
| | Periods Ended September 30, 2016 | |
| | | Since | Final Value |
| | One | Inception | of a $10,000 |
| | Year | (10/16/2012) | Investment |
| Short-Term Inflation-Protected Securities | | | |
| Index Fund Admiral Shares | 2.51% | 0.12% | $10,049 |
| Bloomberg Barclays U.S. Treasury | | | |
| Inflation-Protected Securities (TIPS) 0–5 Year | | | |
| Index | 2.62 | 0.10 | 10,039 |
| Bloomberg Barclays U.S. Aggregate Bond | | | |
| Index | 5.19 | 2.59 | 11,066 |
"Since Inception" performance is calculated from the Admiral Shares’ inception date for both the fund and its comparative standards.
| | | |
| | | Since | Final Value |
| | One | Inception | of a $5,000,000 |
| | Year | (10/17/2012) | Investment |
| Short-Term Inflation-Protected Securities | | | |
| Index Fund Institutional Shares | 2.55% | 0.16% | $5,032,606 |
| Bloomberg Barclays U.S. Treasury | | | |
| Inflation-Protected Securities (TIPS) 0–5 Year | | | |
| Index | 2.62 | 0.12 | 5,022,804 |
| Bloomberg Barclays U.S. Aggregate Bond | | | |
| Index | 5.19 | 2.65 | 5,545,592 |
"Since Inception" performance is calculated from the Institutional Shares’ inception date for both the fund and its comparative standards.
| | |
| Cumulative Returns of ETF Shares: October 12, 2012, Through September 30, 2016 | |
| |
| | | Since |
| | One | Inception |
| | Year | (10/12/2012) |
| Short-Term Inflation-Protected Securities Index Fund | | |
| ETF Shares Market Price | 2.56% | 0.60% |
| Short-Term Inflation-Protected Securities Index Fund | | |
| ETF Shares Net Asset Value | 2.54 | 0.48 |
| Bloomberg Barclays U.S. Treasury | | |
| Inflation-Protected Securities (TIPS) 0–5 Year Index | 2.62 | 0.37 |
"Since Inception" performance is calculated from the ETF Shares’ inception date for both the fund and its comparative standards.
8
| | | | |
| Short-Term Inflation-Protected Securities Index Fund | | | |
| |
| |
| |
| Fiscal-Year Total Returns (%): October 16, 2012, Through September 30, 2016 | |
| | | | | Bloomberg |
| | | | | Barclays |
| | | | | TIPS |
| | | | | 0-5 Year |
| | | | Investor Shares | Index |
| Fiscal Year | Income Returns | Capital Returns | Total Returns | Total Returns |
| 2013 | 0.09% | -1.00% | -0.91% | -1.20% |
| 2014 | 0.02 | -0.04 | -0.02 | 0.21 |
| 2015 | 0.70 | -2.06 | -1.36 | -1.19 |
| 2016 | 0.43 | 2.05 | 2.48 | 2.62 |
9
Short-Term Inflation-Protected Securities Index Fund
Financial Statements
Statement of Net Assets
As of September 30, 2016
The fund reports a complete list of its holdings in regulatory filings four times in each fiscal year, at the quarter-ends. For the second and fourth fiscal quarters, the lists appear in the fund’s semiannual and annual reports to shareholders. For the first and third fiscal quarters, the fund files the lists with the Securities and Exchange Commission on Form N-Q. Shareholders can look up the fund’s Forms N-Q on the SEC’s website at sec.gov. Forms N-Q may also be reviewed and copied at the SEC’s Public Reference Room (see the back cover of this report for further information).
| | | | |
| | | | Face | Market |
| | | Maturity | Amount | Value• |
| | Coupon | Date | ($000) | ($000) |
| U.S. Government and Agency Obligations (99.8%) | | | | |
| U.S. Government Securities (99.8%) | | | | |
| United States Treasury Inflation Indexed Bonds | 2.375% | 1/15/17 | 515,943 | 621,062 |
| United States Treasury Inflation Indexed Bonds | 0.125% | 4/15/17 | 1,554,295 | 1,651,172 |
| United States Treasury Inflation Indexed Bonds | 2.625% | 7/15/17 | 455,252 | 544,783 |
| United States Treasury Inflation Indexed Bonds | 1.625% | 1/15/18 | 486,113 | 575,407 |
| United States Treasury Inflation Indexed Bonds | 0.125% | 4/15/18 | 1,759,586 | 1,851,253 |
| United States Treasury Inflation Indexed Bonds | 1.375% | 7/15/18 | 493,055 | 573,361 |
| United States Treasury Inflation Indexed Bonds | 2.125% | 1/15/19 | 456,791 | 545,115 |
| United States Treasury Inflation Indexed Bonds | 0.125% | 4/15/19 | 1,766,730 | 1,845,331 |
| United States Treasury Inflation Indexed Bonds | 1.875% | 7/15/19 | 517,381 | 626,125 |
| United States Treasury Inflation Indexed Bonds | 1.375% | 1/15/20 | 633,560 | 748,567 |
| United States Treasury Inflation Indexed Bonds | 0.125% | 4/15/20 | 1,766,486 | 1,850,711 |
| United States Treasury Inflation Indexed Bonds | 1.250% | 7/15/20 | 986,839 | 1,163,791 |
| United States Treasury Inflation Indexed Bonds | 1.125% | 1/15/21 | 1,131,429 | 1,325,192 |
| United States Treasury Inflation Indexed Bonds | 0.125% | 4/15/21 | 1,057,995 | 1,097,406 |
| United States Treasury Inflation Indexed Bonds | 0.625% | 7/15/21 | 1,236,985 | 1,387,201 |
| Total U.S. Government and Agency Obligations (Cost $16,283,343) | | | 16,406,477 |
| |
| | | | Shares | |
| Temporary Cash Investment (0.0%) | | | | |
| Money Market Fund (0.0%) | | | | |
| 1 Vanguard Market Liquidity Fund (Cost $7,332) | 0.640% | | 73,315 | 7,332 |
| Total Investments (99.8%) (Cost $16,290,675) | | | | 16,413,809 |
10
| |
| Short-Term Inflation-Protected Securities Index Fund | |
| |
| |
| |
| | Amount |
| | ($000) |
| Other Assets and Liabilities (0.2%) | |
| Other Assets | |
| Investment in VGI | 1,240 |
| Receivables for Accrued Income | 28,578 |
| Receivables for Capital Shares Issued | 66,966 |
| Total Other Assets | 96,784 |
| Liabilities | |
| Payables for Investment Securities Purchased | (54,904) |
| Payables for Capital Shares Redeemed | (9,121) |
| Payables to Vanguard | (3,472) |
| Other Liabilities | (3,820) |
| Total Liabilities | (71,317) |
| Net Assets (100%) | 16,439,276 |
| |
| |
| At September 30, 2016, net assets consisted of: | |
| | Amount |
| | ($000) |
| Paid-in Capital | 16,343,344 |
| Undistributed Net Investment Income | 60,698 |
| Accumulated Net Realized Losses | (87,900) |
| Unrealized Appreciation (Depreciation) | 123,134 |
| Net Assets | 16,439,276 |
| |
| Investor Shares—Net Assets | |
| Applicable to 204,971,094 outstanding $.001 par value shares of | |
| beneficial interest (unlimited authorization) | 5,088,425 |
| Net Asset Value Per Share—Investor Shares | $24.83 |
| |
| ETF Shares—Net Assets | |
| Applicable to 49,966,620 outstanding $.001 par value shares of | |
| beneficial interest (unlimited authorization) | 2,477,915 |
| Net Asset Value Per Share—ETF Shares | $49.59 |
| |
| Admiral Shares—Net Assets | |
| Applicable to 135,582,158 outstanding $.001 par value shares of | |
| beneficial interest (unlimited authorization) | 3,373,410 |
| Net Asset Value Per Share—Admiral Shares | $24.88 |
11
| |
| Short-Term Inflation-Protected Securities Index Fund | |
| |
| |
| |
| | Amount |
| | ($000) |
| Institutional Shares—Net Assets | |
| Applicable to 220,862,912 outstanding $.001 par value shares of | |
| beneficial interest (unlimited authorization) | 5,499,526 |
| Net Asset Value Per Share—Institutional Shares | $24.90 |
• See Note A in Notes to Financial Statements.
1 Affiliated money market fund available only to Vanguard funds and certain trusts and accounts managed by Vanguard. Rate shown is the
7-day yield.
See accompanying Notes, which are an integral part of the Financial Statements.
12
| |
| Short-Term Inflation-Protected Securities Index Fund | |
| |
| |
| Statement of Operations | |
| |
| | Year Ended |
| | September 30, 2016 |
| | ($000) |
| Investment Income | |
| Income | |
| Interest1 | 83,024 |
| Total Income | 83,024 |
| Expenses | |
| The Vanguard Group—Note B | |
| Investment Advisory Services | 391 |
| Management and Administrative—Investor Shares | 6,298 |
| Management and Administrative—ETF Shares | 1,127 |
| Management and Administrative—Admiral Shares | 1,585 |
| Management and Administrative—Institutional Shares | 1,552 |
| Marketing and Distribution—Investor Shares | 970 |
| Marketing and Distribution—ETF Shares | 165 |
| Marketing and Distribution—Admiral Shares | 304 |
| Marketing and Distribution—Institutional Shares | 128 |
| Custodian Fees | 81 |
| Auditing Fees | 76 |
| Shareholders’ Reports—Investor Shares | 54 |
| Shareholders’ Reports—ETF Shares | 58 |
| Shareholders’ Reports—Admiral Shares | 43 |
| Shareholders’ Reports—Institutional Shares | 5 |
| Trustees’ Fees and Expenses | 7 |
| Total Expenses | 12,844 |
| Net Investment Income | 70,180 |
| Realized Net Gain (Loss) | |
| Investment Securities Sold1 | (8,553) |
| Futures Contracts | (3,611) |
| Realized Net Gain (Loss) | (12,164) |
| Change in Unrealized Appreciation (Depreciation) of Investment Securities | 307,524 |
| Net Increase (Decrease) in Net Assets Resulting from Operations | 365,540 |
1 Interest income and realized net gain (loss) from an affiliated company of the fund were $671,000 and $1,000, respectively.
See accompanying Notes, which are an integral part of the Financial Statements.
13
| | |
| Short-Term Inflation-Protected Securities Index Fund | | |
| |
| |
| Statement of Changes in Net Assets | | |
| |
| | Year Ended September 30, |
| | 2016 | 2015 |
| | ($000) | ($000) |
| Increase (Decrease) in Net Assets | | |
| Operations | | |
| Net Investment Income | 70,180 | (52,791) |
| Realized Net Gain (Loss) | (12,164) | (12,913) |
| Change in Unrealized Appreciation (Depreciation) | 307,524 | (73,400) |
| Net Increase (Decrease) in Net Assets Resulting from Operations | 365,540 | (139,104) |
| Distributions | | |
| Net Investment Income | | |
| Investor Shares | — | (32,095) |
| ETF Shares | — | (11,618) |
| Admiral Shares | — | (12,111) |
| Institutional Shares | — | (25,014) |
| Realized Capital Gain | | |
| Investor Shares | — | — |
| ETF Shares | — | — |
| Admiral Shares | — | — |
| Institutional Shares | — | — |
| Total Distributions | | (80,838) |
| Capital Share Transactions | | |
| Investor Shares | 443,641 | 110,230 |
| ETF Shares | 583,428 | 532,047 |
| Admiral Shares | 1,173,766 | 640,240 |
| Institutional Shares | 1,539,781 | 1,193,894 |
| Net Increase (Decrease) from Capital Share Transactions | 3,740,616 | 2,476,411 |
| Total Increase (Decrease) | 4,106,156 | 2,256,469 |
| Net Assets | | |
| Beginning of Period | 12,333,120 | 10,076,651 |
| End of Period1 | 16,439,276 | 12,333,120 |
1 Net Assets—End of Period includes undistributed (overdistributed) net investment income of $60,698,000 and ($11,083,000).
See accompanying Notes, which are an integral part of the Financial Statements.
14
| | | | |
| Short-Term Inflation-Protected Securities Index Fund | | | | |
| |
| |
| Financial Highlights | | | | |
| |
| |
| Investor Shares | | | | |
| | | | | Oct. 16, |
| | | | | 20121 to |
| | Year Ended September 30, | Sept. 30, |
| For a Share Outstanding Throughout Each Period | 2016 | 2015 | 2014 | 2013 |
| Net Asset Value, Beginning of Period | $24.23 | $24.74 | $24.75 | $25.00 |
| Investment Operations | | | | |
| Net Investment Income | . 080 2 | (.131) | .183 | .015 |
| Net Realized and Unrealized Gain (Loss) on Investments | .520 | (.206) | (.189) | (.241) |
| Total from Investment Operations | .600 | (.337) | (.006) | (.226) |
| Distributions | | | | |
| Dividends from Net Investment Income | — | (.173) | (.004) | (.024) |
| Distributions from Realized Capital Gains | — | — | — | — |
| Total Distributions | — | (.173) | (.004) | (.024) |
| Net Asset Value, End of Period | $24.83 | $24.23 | $24.74 | $24.75 |
| |
| Total Return 3 | 2.48% | -1.36% | -0.02% | -0.91% |
| |
| Ratios/Supplemental Data | | | | |
| Net Assets, End of Period (Millions) | $5,088 | $4,532 | $4,517 | $3,702 |
| Ratio of Total Expenses to Average Net Assets | 0.16% | 0.17% | 0.20% | 0.20%4 |
| Ratio of Net Investment Income to Average Net Assets | 0.42% | (0.53%) | 0.88% | 0.01%4 |
| Portfolio Turnover Rate5 | 28% | 26% | 18% | 13% |
| 1 | Inception. |
| 2 | Calculated based on average shares outstanding. |
| 3 | Total returns do not include transaction or account service fees that may have applied in the periods shown. Fund prospectuses provide information about any applicable transaction and account service fees. |
| 4 | Annualized. |
| 5 | Excludes the value of portfolio securities received or delivered as a result of in-kind purchases or redemptions of the fund’s capital shares, including ETF Creation Units. |
See accompanying Notes, which are an integral part of the Financial Statements.
15
| | | | |
| Short-Term Inflation-Protected Securities Index Fund | | | | |
| |
| |
| Financial Highlights | | | | |
| |
| |
| ETF Shares | | | | |
| | | | | Oct. 12, |
| | | | | 20121 to |
| | Year Ended September 30, | Sept. 30, |
| For a Share Outstanding Throughout Each Period | 2016 | 2015 | 2014 | 2013 |
| Net Asset Value, Beginning of Period | $48.36 | $49.38 | $49.36 | $49.83 |
| Investment Operations | | | | |
| Net Investment Income | . 2512 | (.210) | .414 | .065 |
| Net Realized and Unrealized Gain (Loss) on Investments | .979 | (.415) | (.371) | (.483) |
| Total from Investment Operations | 1.230 | (.625) | .043 | (.418) |
| Distributions | | | | |
| Dividends from Net Investment Income | — | (.395) | (.023) | (.052) |
| Distributions from Realized Capital Gains | — | — | — | — |
| Total Distributions | — | (.395) | (.023) | (.052) |
| Net Asset Value, End of Period | $49.59 | $48.36 | $49.38 | $49.36 |
| |
| Total Return | 2.54% | -1.26% | 0.09% | -0.84% |
| |
| Ratios/Supplemental Data | | | | |
| Net Assets, End of Period (Millions) | $2,478 | $1,838 | $1,336 | $967 |
| Ratio of Total Expenses to Average Net Assets | 0.07% | 0.08% | 0.10% | 0.10%3 |
| Ratio of Net Investment Income to Average Net Assets | 0.51% | (0.44%) | 0.98% | 0.11%3 |
| Portfolio Turnover Rate4 | 28% | 26% | 18% | 13% |
| 1 | Inception. |
| 2 | Calculated based on average shares outstanding. |
| 3 | Annualized. |
| 4 | Excludes the value of portfolio securities received or delivered as a result of in-kind purchases or redemptions of the fund’s capital shares, including ETF Creation Units. |
See accompanying Notes, which are an integral part of the Financial Statements.
16
| | | | |
| Short-Term Inflation-Protected Securities Index Fund | | | | |
| |
| |
| Financial Highlights | | | | |
| |
| |
| Admiral Shares | | | | |
| | | | | Oct. 16, |
| | | | | 20121 to |
| | Year Ended September 30, | Sept. 30, |
| For a Share Outstanding Throughout Each Period | 2016 | 2015 | 2014 | 2013 |
| Net Asset Value, Beginning of Period | $24.27 | $24.77 | $24.77 | $25.00 |
| Investment Operations | | | | |
| Net Investment Income | .149 2 | (.105) | .209 | .025 |
| Net Realized and Unrealized Gain (Loss) on Investments | .461 | (.197) | (.195) | (.229) |
| Total from Investment Operations | .610 | (.302) | .014 | (.204) |
| Distributions | | | | |
| Dividends from Net Investment Income | — | (.198) | (.014) | (.026) |
| Distributions from Realized Capital Gains | — | — | — | — |
| Total Distributions | — | (.198) | (.014) | (.026) |
| Net Asset Value, End of Period | $24.88 | $24.27 | $24.77 | $24.77 |
| |
| Total Return 3 | 2.51% | -1.22% | 0.06% | -0.82% |
| |
| Ratios/Supplemental Data | | | | |
| Net Assets, End of Period (Millions) | $3,373 | $2,126 | $1,518 | $776 |
| Ratio of Total Expenses to Average Net Assets | 0.07% | 0.08% | 0.10% | 0.10%4 |
| Ratio of Net Investment Income to Average Net Assets | 0.51% | (0.44%) | 0.98% | 0.11%4 |
| Portfolio Turnover Rate5 | 28% | 26% | 18% | 13% |
| 1 | Inception. |
| 2 | Calculated based on average shares outstanding. |
| 3 | Total returns do not include transaction or account service fees that may have applied in the periods shown. Fund prospectuses provide information about any applicable transaction and account service fees. |
| 4 | Annualized. |
| 5 | Excludes the value of portfolio securities received or delivered as a result of in-kind purchases or redemptions of the fund’s capital shares, including ETF Creation Units. |
See accompanying Notes, which are an integral part of the Financial Statements.
17
| | | | |
| Short-Term Inflation-Protected Securities Index Fund | | | | |
| |
| |
| Financial Highlights | | | | |
| |
| |
| Institutional Shares | | | | |
| | | | | Oct. 17, |
| | | | | 20121 to |
| | Year Ended September 30, | Sept. 30, |
| For a Share Outstanding Throughout Each Period | 2016 | 2015 | 2014 | 2013 |
| Net Asset Value, Beginning of Period | $24.28 | $24.78 | $24.77 | $24.99 |
| Investment Operations | | | | |
| Net Investment Income | .139 2 | (.099) | .215 | .026 |
| Net Realized and Unrealized Gain (Loss) on Investments | .481 | (.196) | (.189) | (.220) |
| Total from Investment Operations | .620 | (.295) | .026 | (.194) |
| Distributions | | | | |
| Dividends from Net Investment Income | — | (.205) | (.016) | (.026) |
| Distributions from Realized Capital Gains | — | — | — | — |
| Total Distributions | — | (.205) | (.016) | (.026) |
| Net Asset Value, End of Period | $24.90 | $24.28 | $24.78 | $24.77 |
| |
| Total Return 3 | 2.55% | -1.19% | 0.11% | -0.78% |
| |
| Ratios/Supplemental Data | | | | |
| Net Assets, End of Period (Millions) | $5,500 | $3,837 | $2,706 | $1,262 |
| Ratio of Total Expenses to Average Net Assets | 0.04% | 0.05% | 0.07% | 0.07%4 |
| Ratio of Net Investment Income to Average Net Assets | 0.54% | (0.41%) | 1.01% | 0.14%4 |
| Portfolio Turnover Rate5 | 28% | 26% | 18% | 13% |
| 1 | Inception. |
| 2 | Calculated based on average shares outstanding. |
| 3 | Total returns do not include transaction fees that may have applied in the periods shown. Fund prospectuses provide information about any applicable transaction fees. |
| 4 | Annualized. |
| 5 | Excludes the value of portfolio securities received or delivered as a result of in-kind purchases or redemptions of the fund’s capital shares, including ETF Creation Units. |
See accompanying Notes, which are an integral part of the Financial Statements.
18
Short-Term Inflation-Protected Securities Index Fund
Notes to Financial Statements
Vanguard Short-Term Inflation-Protected Securities Index Fund is registered under the Investment Company Act of 1940 as an open-end investment company, or mutual fund. The fund offers four classes of shares: Investor Shares, ETF Shares, Admiral Shares, and Institutional Shares. Investor Shares are available to any investor who meets the fund’s minimum purchase requirements. ETF Shares are listed for trading on Nasdaq; they can be purchased and sold through a broker. Admiral Shares and Institutional Shares are designed for investors who meet certain administrative, service, and account-size criteria.
A. The following significant accounting policies conform to generally accepted accounting principles for U.S. investment companies. The fund consistently follows such policies in preparing its financial statements.
1. Security Valuation: Securities are valued as of the close of trading on the New York Stock Exchange (generally 4 p.m., Eastern time) on the valuation date. Bonds and temporary cash investments acquired over 60 days to maturity are valued using the latest bid prices or using valuations based on a matrix system (which considers such factors as security prices, yields, maturities, and ratings), both as furnished by independent pricing services. Investments in Vanguard Market Liquidity Fund are valued at that fund’s net asset value. Other temporary cash investments are valued at amortized cost, which approximates market value. Securities for which market quotations are not readily available, or whose values have been affected by events occurring before the fund’s pricing time but after the close of the securities’ primary markets, are valued by methods deemed by the board of trustees to represent fair value.
2. Futures Contracts: The fund uses futures contracts to invest in fixed income asset classes with greater efficiency and lower cost than is possible through direct investment, to add value when these instruments are attractively priced, or to adjust sensitivity to changes in interest rates. The primary risks associated with the use of futures contracts are imperfect correlation between changes in market values of bonds held by the fund and the prices of futures contracts, and the possibility of an illiquid market. Counterparty risk involving futures is mitigated because a regulated clearinghouse is the counterparty instead of the clearing broker. To further mitigate counterparty risk, the fund trades futures contracts on an exchange, monitors the financial strength of its clearing brokers and clearinghouse, and has entered into clearing agreements with its clearing brokers. The clearinghouse imposes initial margin requirements to secure the fund’s performance and requires daily settlement of variation margin representing changes in the market value of each contract.
Futures contracts are valued at their quoted daily settlement prices. The aggregate settlement values of the contracts are not recorded in the Statement of Net Assets. Fluctuations in the value of the contracts are recorded in the Statement of Net Assets as an asset (liability) and in the Statement of Operations as unrealized appreciation (depreciation) until the contracts are closed, when they are recorded as realized futures gains (losses).
During the year ended September 30, 2016, the fund’s average investments in long and short futures contracts represented 0% of net assets, based on the average of aggregate settlement values at each quarter-end during the period. The fund had no open futures contracts at September 30, 2016.
3. Federal Income Taxes: The fund intends to continue to qualify as a regulated investment company and distribute all of its taxable income. Management has analyzed the fund’s tax positions taken for all open federal income tax years (September 30, 2013–2016), and has concluded that no provision for federal income tax is required in the fund’s financial statements.
19
Short-Term Inflation-Protected Securities Index Fund
4. Distributions: Distributions to shareholders are recorded on the ex-dividend date.
5. Credit Facility: The fund and certain other funds managed by The Vanguard Group (“Vanguard”) participate in a $3.1 billion committed credit facility provided by a syndicate of lenders pursuant to a credit agreement that may be renewed annually; each fund is individually liable for its borrowings, if any, under the credit facility. Borrowings may be utilized for temporary and emergency purposes, and are subject to the fund’s regulatory and contractual borrowing restrictions. The participating funds are charged administrative fees and an annual commitment fee of 0.10% of the undrawn amount of the facility; these fees are allocated to the funds based on a method approved by the fund’s board of trustees and included in Management and Administrative expenses on the fund’s Statement of Operations. Any borrowings under this facility bear interest at a rate based upon the higher of the one-month London Interbank Offered Rate, federal funds effective rate, or overnight bank funding rate plus an agreed-upon spread.
The fund had no borrowings outstanding at September 30, 2016, or at any time during the period then ended.
6. Other: Interest income includes income distributions received from Vanguard Market Liquidity Fund and is accrued daily. Premiums and discounts on debt securities purchased are amortized and accreted, respectively, to interest income over the lives of the respective securities. Inflation adjustments to the face amount of inflation-indexed securities are included in interest income. Security transactions are accounted for on the date securities are bought or sold. Costs used to determine realized gains (losses) on the sale of investment securities are those of the specific securities sold.
Each class of shares has equal rights as to assets and earnings, except that each class separately bears certain class-specific expenses related to maintenance of shareholder accounts (included in Management and Administrative expenses) and shareholder reporting. Marketing and distribution expenses are allocated to each class of shares based on a method approved by the board of trustees. Income, other non-class-specific expenses, and gains and losses on investments are allocated to each class of shares based on its relative net assets.
B. In accordance with the terms of a Funds’ Service Agreement (the “FSA”) between Vanguard and the fund, Vanguard furnishes to the fund investment advisory, corporate management, administrative, marketing, and distribution services at Vanguard’s cost of operations (as defined by the FSA). These costs of operations are allocated to the fund based on methods and guidelines approved by the board of trustees. Vanguard does not require reimbursement in the current period for certain costs of operations (such as deferred compensation/benefits and risk/insurance costs); the fund’s liability for these costs of operations is included in Payables to Vanguard on the Statement of Net Assets.
Upon the request of Vanguard, the fund may invest up to 0.40% of its net assets as capital in Vanguard. At September 30, 2016, the fund had contributed to Vanguard capital in the amount of $1,240,000, representing 0.01% of the fund’s net assets and 0.50% of Vanguard’s capitalization. The fund’s trustees and officers are also directors and employees, respectively, of Vanguard.
20
Short-Term Inflation-Protected Securities Index Fund
C. Various inputs may be used to determine the value of the fund’s investments. These inputs are summarized in three broad levels for financial statement purposes. The inputs or methodologies used to value securities are not necessarily an indication of the risk associated with investing in those securities.
Level 1—Quoted prices in active markets for identical securities.
Level 2—Other significant observable inputs (including quoted prices for similar securities, interest rates, prepayment speeds, credit risk, etc.).
Level 3—Significant unobservable inputs (including the fund’s own assumptions used to determine the fair value of investments).
The following table summarizes the market value of the fund’s investments as of September 30, 2016, based on the inputs used to value them:
| | | |
| | Level 1 | Level 2 | Level 3 |
| Investments | ($000) | ($000) | ($000) |
| U.S. Government and Agency Obligations | — | 16,406,477 | — |
| Temporary Cash Investments | 7,332 | — | — |
| Total | 7,332 | 16,406,477 | — |
D. Distributions are determined on a tax basis and may differ from net investment income and realized capital gains for financial reporting purposes. Differences may be permanent or temporary. Permanent differences are reclassified among capital accounts in the financial statements to reflect their tax character. Temporary differences arise when certain items of income, expense, gain, or loss are recognized in different periods for financial statement and tax purposes. These differences will reverse at some time in the future. Differences in classification may also result from the treatment of short-term gains as ordinary income for tax purposes.
Certain of the fund’s U.S. Treasury inflation-indexed securities experienced deflation and amortization adjustments that reduced interest income and the cost of investments for financial statement purposes by an amount greater than the reduction of taxable income; the additional income reduction will be deferred for tax purposes until it is used to offset future inflation adjustments that increase taxable income. The difference becomes permanent if the securities are sold. During the year ended September 30, 2016, the fund realized gains of $1,585,000 that were included in ordinary income for tax purposes as a result of deferred deflation and amortization adjustments; accordingly, such gains have been reclassified from accumulated net realized losses to undistributed net investment income. Deferred inflation and amortization adjustments to securities held at September 30, 2016, totaling $3,759,000 are reflected as a reduction of the amount of tax-basis unrealized appreciation of investment securities.
During the year ended September 30, 2016, the fund realized $27,979,000 of net capital gains resulting from in-kind redemptions—in which shareholders exchanged fund shares for securities held by the fund rather than for cash. Because such gains are not taxable to the fund, and are not distributed to shareholders, they have been reclassified from accumulated net realized losses to paid-in capital.
21
Short-Term Inflation-Protected Securities Index Fund
For tax purposes, at September 30, 2016, the fund had $67,282,000 of ordinary income available for distribution and available capital losses totaling $85,072,000 that may be carried forward indefinitely to offset future net capital gains.
At September 30, 2016, the cost of investment securities for tax purposes was $16,297,230,000. Net unrealized appreciation of investment securities for tax purposes was $116,579,000, consisting of unrealized gains of $122,385,000 on securities that had risen in value since their purchase and $5,806,000 in unrealized losses on securities that had fallen in value since their purchase.
E. During the year ended September 30, 2016, the fund purchased $7,861,740,000 of investment securities and sold $4,318,089,000 of investment securities, other than temporary cash investments. Purchases and sales include $912,178,000 and $321,172,000, respectively, in connection with in-kind purchases and redemptions of the fund’s capital shares.
| | | | |
| F. Capital share transactions for each class of shares were: | | | |
| | | | Year Ended September 30, |
| | | 2016 | | 2015 |
| | Amount | Shares | Amount | Shares |
| | ($000) | (000) | ($000) | (000) |
| Investor Shares | | | | |
| Issued | 873,920 | 35,645 | 829,293 | 34,019 |
| Issued in Lieu of Cash Distributions | — | — | 31,998 | 1,322 |
| Redeemed | (430,279) | (17,713) | (751,061) | (30,890) |
| Net Increase (Decrease)—Investor Shares | 443,641 | 17,932 | 110,230 | 4,451 |
| ETF Shares | | | | |
| Issued | 955,615 | 19,579 | 738,501 | 15,206 |
| Issued in Lieu of Cash Distributions | — | — | — | — |
| Redeemed | (372,187) | (7,625) | (206,454) | (4,250) |
| Net Increase (Decrease)—ETF Shares | 583,428 | 11,954 | 532,047 | 10,956 |
| Admiral Shares | | | | |
| Issued | 1,743,525 | 71,273 | 1,106,772 | 45,451 |
| Issued in Lieu of Cash Distributions | — | — | 10,779 | 445 |
| Redeemed | (569,759) | (23,298) | (477,311) | (19,565) |
| Net Increase (Decrease)—Admiral Shares | 1,173,766 | 47,975 | 640,240 | 26,331 |
| Institutional Shares | | | | |
| Issued | 2,316,657 | 94,659 | 1,866,248 | 76,449 |
| Issued in Lieu of Cash Distributions | — | — | 24,697 | 1,019 |
| Redeemed | (776,876) | (31,833) | (697,051) | (28,609) |
| Net Increase (Decrease)—Institutional Shares | 1,539,781 | 62,826 | 1,193,894 | 48,859 |
G. Management has determined that no material events or transactions occurred subsequent to September 30, 2016, that would require recognition or disclosure in these financial statements.
22
Report of Independent Registered Public Accounting Firm
To the Board of Trustees of Vanguard Malvern Funds and the Shareholders of Vanguard Short-Term Inflation-Protected Securities Index Fund: In our opinion, the accompanying statement of net assets and the related statements of operations and of changes in net assets and the financial highlights present fairly, in all material respects, the financial position of Vanguard Short-Term Inflation-Protected Securities Index Fund (constituting a separate portfolio of Vanguard Malvern Funds, hereafter referred to as the “Fund”) at September 30, 2016, the results of its operations for the year then ended, the changes in its net assets for each of the two years in the period then ended, and the financial highlights for each of the periods indicated, in conformity with accounting principles generally accepted in the United States of America. These financial statements and financial highlights (hereafter referred to as “financial statements”) are the responsibility of the Fund’s management. Our responsibility is to express an opinion on these financial statements based on our audits. We conducted our audits of these financial statements in accordance with the standards of the Public Company Accounting Oversight Board (United States). Those standards require that we plan and perform the audit to obtain reasonable assurance about whether the financial statements are free of material misstatement. An audit includes examining, on a test basis, evidence supporting the amounts and disclosures in the financial statements, assessing the accounting principles used and significant estimates made by management, and evaluating the overall financial statement presentation. We believe that our audits, which included confirmation of securities at September 30, 2016 by correspondence with the custodian and brokers and by agreement to the underlying ownership records of the transfer agent, provide a reasonable basis for our opinion.
/s/PricewaterhouseCoopers LLP
Philadelphia, Pennsylvania
November 15, 2016
23
About Your Fund’s Expenses
As a shareholder of the fund, you incur ongoing costs, which include costs for portfolio management, administrative services, and shareholder reports (like this one), among others. Operating expenses, which are deducted from a fund’s gross income, directly reduce the investment return of the fund.
A fund’s expenses are expressed as a percentage of its average net assets. This figure is known as the expense ratio. The following examples are intended to help you understand the ongoing costs (in dollars) of investing in your fund and to compare these costs with those of other mutual funds. The examples are based on an investment of $1,000 made at the beginning of the period shown and held for the entire period.
The accompanying table illustrates your fund’s costs in two ways:
• Based on actual fund return. This section helps you to estimate the actual expenses that you paid over the period. The ”Ending Account Value“ shown is derived from the fund‘s actual return, and the third column shows the dollar amount that would have been paid by an investor who started with $1,000 in the fund. You may use the information here, together with the amount you invested, to estimate the expenses that you paid over the period.
To do so, simply divide your account value by $1,000 (for example, an $8,600 account value divided by $1,000 = 8.6), then multiply the result by the number given for your fund under the heading ”Expenses Paid During Period.“
• Based on hypothetical 5% yearly return. This section is intended to help you compare your fund‘s costs with those of other mutual funds. It assumes that the fund had a yearly return of 5% before expenses, but that the expense ratio is unchanged. In this case—because the return used is not the fund’s actual return—the results do not apply to your investment. The example is useful in making comparisons because the Securities and Exchange Commission requires all mutual funds to calculate expenses based on a 5% return. You can assess your fund’s costs by comparing this hypothetical example with the hypothetical examples that appear in shareholder reports of other funds.
Note that the expenses shown in the table are meant to highlight and help you compare ongoing costs only and do not reflect transaction costs incurred by the fund for buying and selling securities. Further, the expenses do not include any purchase, redemption, or account service fees described in the fund prospectus. If such fees were applied to your account, your costs would be higher. Your fund does not carry a “sales load.”
The calculations assume no shares were bought or sold during the period. Your actual costs may have been higher or lower, depending on the amount of your investment and the timing of any purchases or redemptions.
You can find more information about the fund’s expenses, including annual expense ratios, in the Financial Statements section of this report. For additional information on operating expenses and other shareholder costs, please refer to your fund’s current prospectus.
24
| | | |
| Six Months Ended September 30, 2016 | | | |
| | Beginning | Ending | Expenses |
| | Account Value | Account Value | Paid During |
| Short-Term Inflation-Protected Securities Index Fund | 3/31/2016 | 9/30/2016 | Period |
| Based on Actual Fund Return | | | |
| Investor Shares | $1,000.00 | $1,010.58 | $0.85 |
| ETF Shares | 1,000.00 | 1,011.01 | 0.30 |
| Admiral Shares | 1,000.00 | 1,010.97 | 0.35 |
| Institutional Shares | 1,000.00 | 1,011.37 | 0.15 |
| Based on Hypothetical 5% Yearly Return | | | |
| Investor Shares | $1,000.00 | $1,024.15 | $0.86 |
| ETF Shares | 1,000.00 | 1,024.70 | 0.30 |
| Admiral Shares | 1,000.00 | 1,024.65 | 0.35 |
| Institutional Shares | 1,000.00 | 1,024.85 | 0.15 |
The calculations are based on expenses incurred in the most recent six-month period. The fund’s annualized six-month expense ratios for that period are 0.17% for Investor Shares, 0.06% for ETF Shares, 0.07% for Admiral Shares, and 0.03% for Institutional Shares. The dollar amounts shown as “Expenses Paid” are equal to the annualized expense ratio multiplied by the average account value over the period, multiplied by the number of days in the most recent six-month period, then divided by the number of days in the most recent 12-month period (183/366).
25
Glossary
30-Day SEC Yield. A fund’s 30-day SEC yield is derived using a formula specified by the U.S. Securities and Exchange Commission. Under the formula, data related to the fund’s security holdings in the previous 30 days are used to calculate the fund’s hypothetical net income for that period, which is then annualized and divided by the fund’s estimated average net assets over the calculation period. For the purposes of this calculation, a security’s income is based on its current market yield to maturity (for bonds), its actual income (for asset-backed securities), or its projected dividend yield (for stocks). Because the SEC yield represents hypothetical annualized income, it will differ—at times significantly—from the fund’s actual experience. As a result, the fund’s income distributions may be higher or lower than implied by the SEC yield.
Average Coupon. The average interest rate paid on the fixed income securities held by a fund. It is expressed as a percentage of face value.
Average Duration. An estimate of how much the value of the fund’s bonds will fluctuate in response to a change in “real” interest rates—meaning rates without inflation expectations built in. Real interest rates are reflected in market yields for inflation-adjusted securities. To see how the fund’s bond values could change, multiply the average duration by the change in real rates. For example, if the average duration were five years, then the value of the fund’s bonds would decline by about 5% if real interest rates rose by 1 percentage point. Conversely, if real rates fell by a percentage point, the value of the bonds would rise about 5%.
Average Effective Maturity. The average length of time until fixed income securities held by a fund reach maturity and are repaid, taking into consideration the possibility that the issuer may call the bond before its maturity date. The figure reflects the proportion of fund assets represented by each security; it also reflects any futures contracts held. In general, the longer the average effective maturity, the more a fund’s share price will fluctuate in response to changes in market interest rates.
Credit Quality. Credit-quality ratings are measured on a scale that generally ranges from AAA (highest) to D (lowest). U.S. Treasury, U.S. Agency, and U.S. Agency mortgage-backed securities appear under “U.S. Government.” Credit-quality ratings are obtained from Barclays and are from Moody’s, Fitch, and S&P. When ratings from all three agencies are used, the median rating is shown. When ratings from two of the agencies are used, the lower rating for each issue is shown. “Not Rated” is used to classify securities for which a rating is not available.
Expense Ratio. A fund’s total annual operating expenses expressed as a percentage of the fund’s average net assets. The expense ratio includes management and administrative expenses, but does not include the transaction costs of buying and selling portfolio securities.
Inception Date. The date on which the assets of a fund (or one of its share classes) are first invested in accordance with the fund’s investment objective. For funds with a subscription period, the inception date is the day after that period ends. Investment performance is measured from the inception date.
Short-Term Reserves. The percentage of a fund invested in highly liquid, short-term securities that can be readily converted to cash.
26
Yield to Maturity. This term generally refers to the rate of return an investor would receive if the fixed income securities held by a fund were held to their maturity dates. For the Short-Term Inflation-Protected Securities Index Fund, the calculation is modified by adding in the inflation adjustment made over the past 12 months. This change results in a figure more directly comparable to the yield-to-maturity figures for other types of bond funds. (An unmodified yield to maturity is used in calculating the fund’s 30-Day SEC Yield.)
27
Vanguard Short-Term Inflation-Protected Securities Index Fund is not sponsored, endorsed, issued, sold, or promoted by Barclays Risk Analytics and Index Solutions Limited or any of its affiliates (“Barclays”). Barclays makes no representation or warranty, express or implied, to the owners or purchasers of the fund or any member of the public regarding the advisability of investing in securities generally or in the fund particularly or the ability of the Barclays index to track general bond market performance. Barclays has not passed on the legality or suitability of the fund with respect to any person or entity. Barclays’ only relationship to Vanguard and the fund is the licensing of the Barclays index, which is determined, composed, and calculated by Barclays without regard to Vanguard or the fund or any owners or purchasers of the fund. Barclays has no obligation to take the needs of Vanguard, the fund, or the owners of the fund into consideration in determining, composing, or calculating the Barclays index. Barclays is not responsible for and has not participated in the determination of the timing of, prices at, or quantities of the fund to be issued. Barclays has no obligation or liability in connection with the administration, marketing, or trading of the fund.
Barclays shall have no liability to third parties for the quality, accuracy, and/or completeness of the index or any data included therein or for interruptions in the delivery of the index. Barclays makes no warranty, express or implied, as to results to be obtained by owners of the fund or any other person or entity from the use of the index or any data included therein in connection with the rights licensed hereunder or for any other use. Barclays reserves the right to change the methods of calculation or publication, or to cease the calculation or publication of the Bloomberg Barclays U.S. Treasury Inflation-Protected Securities (TIPS) 0–5 Year Index, and Barclays shall not be liable for any miscalculation of or any incorrect, delayed, or interrupted publication with respect to the index. Barclays makes no express or implied warranties, and hereby expressly disclaims all warranties of merchantability or fitness for a particular purpose or use with respect to the index or any data included therein. Barclays shall not be liable for any damages, including, without limitation, any indirect or consequential damages resulting from the use of the index or any data included therein.
28
This page intentionally left blank.
This page intentionally left blank.
This page intentionally left blank.
The People Who Govern Your Fund
The trustees of your mutual fund are there to see that the fund is operated and managed in your best interests since, as a shareholder, you are a part owner of the fund. Your fund’s trustees also serve on the board of directors of The Vanguard Group, Inc., which is owned by the Vanguard funds and provides services to them on an at-cost basis.
A majority of Vanguard’s board members are independent, meaning that they have no affiliation with Vanguard or the funds they oversee, apart from the sizable personal investments they have made as private individuals. The independent board members have distinguished backgrounds in business, academia, and public service. Each of the trustees and executive officers oversees 198 Vanguard funds.
The following table provides information for each trustee and executive officer of the fund. The mailing address of the trustees and officers is P.O. Box 876, Valley Forge, PA 19482. More information about the trustees is in the Statement of Additional Information, which can be obtained, without charge, by contacting Vanguard at 800-662-7447, or online at vanguard.com.
InterestedTrustee1
F. William McNabb III
Born 1957. Trustee Since July 2009. Chairman of the Board. Principal Occupation(s) During the Past Five Years and Other Experience: Chairman of the Board of The Vanguard Group, Inc., and of each of the investment companies served by The Vanguard Group, since January 2010; Director of The Vanguard Group since 2008; Chief Executive Officer and President of The Vanguard Group, and of each of the investment companies served by The Vanguard Group, since 2008; Director of Vanguard Marketing Corporation; Managing Director of The Vanguard Group (1995–2008).
IndependentTrustees
Emerson U. Fullwood
Born 1948. Trustee Since January 2008. Principal Occupation(s) During the Past Five Years and Other Experience: Executive Chief Staff and Marketing Officer for North America and Corporate Vice President (retired 2008) of Xerox Corporation (document management products and services); Executive in Residence and 2009–2010 Distinguished Minett Professor at the Rochester Institute of Technology; Lead Director of SPX FLOW, Inc. (multi-industry manufacturing); Director of the United Way of Rochester, the University of Rochester Medical Center, Monroe Community College Foundation, North Carolina A&T University, and Roberts Wesleyan College.
Rajiv L. Gupta
Born 1945. Trustee Since December 2001.2 Principal Occupation(s) During the Past Five Years and Other Experience: Chairman and Chief Executive Officer (retired 2009) and President (2006–2008) of Rohm and Haas Co. (chemicals); Director of Tyco International plc (diversified manufacturing and services), HP Inc. (printer and personal computer manufacturing), and Delphi Automotive plc (automotive components); Senior Advisor at New Mountain Capital.
Amy Gutmann
Born 1949. Trustee Since June 2006. Principal Occupation(s) During the Past Five Years and Other Experience: President of the University of Pennsylvania; Christopher H. Browne Distinguished Professor of Political Science, School of Arts and Sciences, and Professor of Communication, Annenberg School for Communication, with secondary faculty appointments in the Department of Philosophy, School of Arts and Sciences, and at the Graduate School of Education, University of Pennsylvania; Trustee of the National Constitution Center; Chair of the Presidential Commission for the Study of Bioethical Issues.
JoAnn Heffernan Heisen
Born 1950. Trustee Since July 1998. Principal Occupation(s) During the Past Five Years and Other Experience: Corporate Vice President and Chief Global Diversity Officer (retired 2008) and Member of the Executive Committee (1997–2008) of Johnson & Johnson (pharmaceuticals/medical devices/consumer products); Director of Skytop Lodge Corporation (hotels) and the Robert Wood Johnson Foundation; Member of the Advisory Board of the Institute for Women’s Leadership at Rutgers University.
F. Joseph Loughrey
Born 1949. Trustee Since October 2009. Principal Occupation(s) During the Past Five Years and Other Experience: President and Chief Operating Officer (retired 2009) of Cummins Inc. (industrial machinery); Chairman of the Board of Hillenbrand, Inc. (specialized consumer services), and of Oxfam America; Director of SKF AB (industrial machinery), Hyster-Yale Materials Handling, Inc. (forklift trucks), the Lumina Foundation for Education, and the V Foundation for Cancer Research; Member of the Advisory Council for the College of Arts and Letters and of the Advisory Board to the Kellogg Institute for International Studies, both at the University of Notre Dame.
Mark Loughridge
Born 1953. Trustee Since March 2012. Principal Occupation(s) During the Past Five Years and Other Experience: Senior Vice President and Chief Financial Officer (retired 2013) at IBM (information technology services); Fiduciary Member of IBM’s Retirement Plan Committee (2004–2013); Director of the Dow Chemical Company; Member of the Council on Chicago Booth.
Scott C. Malpass
Born 1962. Trustee Since March 2012. Principal Occupation(s) During the Past Five Years and Other Experience: Chief Investment Officer and Vice President at the University of Notre Dame; Assistant Professor of Finance at the Mendoza College of Business at Notre Dame; Member of the Notre Dame 403(b) Investment Committee, the Board of Advisors for Spruceview Capital Partners, and the Investment Advisory Committee of Major League Baseball; Board Member of TIFF Advisory Services, Inc., and Catholic Investment Services, Inc. (investment advisors).
André F. Perold
Born 1952. Trustee Since December 2004. Principal Occupation(s) During the Past Five Years and Other Experience: George Gund Professor of Finance and Banking, Emeritus at the Harvard Business School (retired 2011); Chief Investment Officer and Managing Partner of HighVista Strategies LLC (private investment firm); Director of Rand Merchant Bank; Overseer of the Museum of Fine Arts Boston.
Peter F. Volanakis
Born 1955. Trustee Since July 2009. Principal Occupation(s) During the Past Five Years and Other Experience: President and Chief Operating Officer (retired 2010) of Corning Incorporated (communications equipment); Chairman of the Board of Trustees of Colby-Sawyer College; Member of the Advisory Board of the Norris Cotton Cancer Center.
Executive Officers
Glenn Booraem
Born 1967. Treasurer Since May 2015. Principal Occupation(s) During the Past Five Years and Other Experience: Principal of The Vanguard Group, Inc.; Treasurer of each of the investment companies served by The Vanguard Group; Controller of each of the investment companies served by The Vanguard Group (2010–2015); Assistant Controller of each of the investment companies served by The Vanguard Group (2001–2010).
Thomas J. Higgins
Born 1957. Chief Financial Officer Since September 2008. Principal Occupation(s) During the Past Five Years and Other Experience: Principal of The Vanguard Group, Inc.; Chief Financial Officer of each of the investment companies served by The Vanguard Group; Treasurer of each of the investment companies served by The Vanguard Group (1998–2008).
Peter Mahoney
Born 1974. Controller Since May 2015. Principal Occupation(s) During the Past Five Years and Other Experience: Head of Global Fund Accounting at The Vanguard Group, Inc.; Controller of each of the investment companies served by The Vanguard Group; Head of International Fund Services at The Vanguard Group (2008–2014).
Anne E. Robinson
Born 1970. Secretary Since September 2016. Principal Occupation(s) During the Past Five Years and Other Experience: Managing Director of The Vanguard Group, Inc.; General Counsel of The Vanguard Group; Secretary of The Vanguard Group and of each of the investment companies served by The Vanguard Group; Director and Senior Vice President of Vanguard Marketing Corporation; Managing Director and General Counsel of Global Cards and Consumer Services at Citigroup (2014–2016); Counsel at American Express (2003–2014).
Vanguard Senior Management Team
| |
Mortimer J. Buckley Kathleen C. Gubanich Martha G. King John T. Marcante Chris D. McIsaac | James M. Norris Thomas M. Rampulla Glenn W. Reed Karin A. Risi Michael Rollings |
Chairman Emeritus and Senior Advisor John J. Brennan
Chairman, 1996–2009
Chief Executive Officer and President, 1996–2008
Founder
John C. Bogle
Chairman and Chief Executive Officer, 1974–1996
1 Mr. McNabb is considered an “interested person,” as defined in the Investment Company Act of 1940, because he is an officer of the Vanguard funds.
2 December 2002 for Vanguard Equity Income Fund, the Vanguard Municipal Bond Funds, and the Vanguard State Tax-Exempt Funds.
 |
| P.O. Box 2600 |
| Valley Forge, PA 19482-2600 |
Connect with Vanguard® > vanguard.com
| |
| Fund Information > 800-662-7447 | |
| Direct Investor Account Services > 800-662-2739 | |
| Institutional Investor Services > 800-523-1036 | |
| Text Telephone for People | |
| Who Are Deaf or Hard of Hearing> 800-749-7273 | |
| |
| This material may be used in conjunction | |
| with the offering of shares of any Vanguard | |
| fund only if preceded or accompanied by | |
| the fund’s current prospectus. | |
| |
| All comparative mutual fund data are from Lipper, a | |
| Thomson Reuters Company, or Morningstar, Inc., unless | |
| otherwise noted. | |
| |
| You can obtain a free copy of Vanguard’s proxy voting | |
| guidelines by visiting vanguard.com/proxyreporting or by | |
| calling Vanguard at 800-662-2739. The guidelines are | |
| also available from the SEC’s website, sec.gov. In | |
| addition, you may obtain a free report on how your fund | |
| voted the proxies for securities it owned during the 12 | |
| months ended June 30. To get the report, visit either | |
| vanguard.com/proxyreporting or sec.gov. | |
| |
| You can review and copy information about your fund at | |
| the SEC’s Public Reference Room in Washington, D.C. To | |
| find out more about this public service, call the SEC at | |
| 202-551-8090. Information about your fund is also | |
| available on the SEC’s website, and you can receive | |
| copies of this information, for a fee, by sending a | |
| request in either of two ways: via email addressed to | |
| publicinfo@sec.gov or via regular mail addressed to the | |
| Public Reference Section, Securities and Exchange | |
| Commission, Washington, DC 20549-1520. | |
| |
| | © 2016 The Vanguard Group, Inc. |
| | All rights reserved. |
| | Vanguard Marketing Corporation, Distributor. |
| |
| | Q19670 112016 |

Annual Report | September 30, 2016
Vanguard Core Bond Fund
A new format, unwavering commitment
As you begin reading this report, you’ll notice that we’ve made some improvements to the opening sections—based on feedback from you, our clients.
Page 1 starts with a new ”Your Fund’s Performance at a Glance,” a concise, handy summary of how your fund performed during the period.
In the renamed ”Chairman’s Perspective,” Bill McNabb will focus on enduring principles and investment insights.
We’ve modified some tables, and eliminated some redundancy, but we haven’t removed any information.
At Vanguard, we’re always looking for better ways to communicate and to help you make sound investment decisions. Thank you for entrusting your assets to us.
| |
| Contents | |
| Your Fund’s Performance at a Glance. | 1 |
| Chairman’s Perspective. | 2 |
| Advisor’s Report. | 5 |
| Fund Profile. | 8 |
| Performance Summary. | 9 |
| Financial Statements. | 11 |
| About Your Fund’s Expenses. | 49 |
| Glossary. | 51 |
Please note: The opinions expressed in this report are just that—informed opinions. They should not be considered promises or advice. Also, please keep in mind that the information and opinions cover the period through the date on the front of this report. Of course, the risks of investing in your fund are spelled out in the prospectus.
See the Glossary for definitions of investment terms used in this report.
About the cover: No matter what language you speak, Vanguard has one consistent message and set of principles. Our primary focus is on you, our clients. We conduct our business with integrity as a faithful steward of your assets. This message is shown translated into seven languages, reflecting our expanding global presence.
Your Fund’s Performance at a Glance
• Vanguard Core Bond Fund has returned well over 3% since its launch this spring, outpacing its benchmark and edging ahead of the average return of its peers.
• Demand for U.S. taxable bonds benefited from concerns about global growth, the ability of central banks to lift inflation, and the “Brexit” vote. The Federal Reserve’s decision to leave rates unchanged and U.S. bonds’ comparatively high yields for international investors also helped.
• The fund’s holdings in asset-backed securities and commercial mortgage-backed securities boosted relative performance.
• Its favoring of BBB-rated bonds also contributed.
• Corporate bonds did well as yields fell and credit spreads tightened. Selection among the bonds of banks, insurance companies, real estate investment trusts, and technology companies added value.
• The fund’s allocation to inflation-protected securities was modestly positive.
| | | | |
| Total Returns: Period Ended September 30, 2016 | | | | |
| | 30-Day SEC | Income | Capital | Since |
| | Yield | Returns | Returns | Inception |
| Vanguard Core Bond Fund | | | | |
| Investor Shares (Inception: 3/28/2016) | 1.81% | 0.97% | 2.60% | 3.57% |
| Admiral™ Shares (Inception: 3/28/2016) | 1.91 | 1.02 | 2.65 | 3.67 |
| Bloomberg Barclays U.S. Aggregate Float Adjusted Index | | | | 3.31 |
| Core Bond Funds Average | | | | 3.54 |
Core Bond Funds Average: Derived from data provided by Lipper, a Thomson Reuters Company.
Admiral Shares carry lower expenses and are available to investors who meet certain account-balance requirements.
Benchmark returns are calculated from the fund's inception date.
Expense Ratios
Your Fund Compared With Its Peer Group
| | | |
| | Investor | Admiral | Peer Group |
| | Shares | Shares | Average |
| Core Bond Fund | 0.25% | 0.15% | 0.80% |
The fund expense ratios shown are from the prospectus dated March 10, 2016, and represent estimated costs for the current fiscal year. For the period from inception through September 30, 2016, the fund’s expense ratios were 0.25% for Investor Shares and 0.15% for Admiral Shares. The peer-group expense ratio is derived from data provided by Lipper, a Thomson Reuters Company, and captures information through year-end 2015.
Peer group: Core Bond Funds.
1
Chairman’s Perspective

Bill McNabb
Chairman and Chief Executive Officer
Dear Shareholder,
If you think you’ve had reason to feel uneasy about the investment environment lately, you’re not imagining things. In just the past few months, we’ve seen economic uncertainty, intense political polarization, and super-low bond yields. Yet at the same time, the stock market kept pushing higher.
In this confusing and sometimes contradictory climate, you may be asking yourself a question that I hear often: How do I make sense of all this, keep investing, and still get a good night’s sleep?
As with any problem, there are multiple ways to go at it. But there’s one approach in particular that is simple, straightforward, and nearly foolproof: Save more money. Not only can saving more give you a greater sense of control over your investment plan, it can help compensate for long-term returns that, in our estimation, could fall short of historical averages.
I love the way one of our investment pros put it. Fran Kinniry this summer told The Wall Street Journal, “Investing is always a partnership between you and the markets.” He explained that the markets carried more than their fair share of the weight for a couple of decades, through the 1990s, providing outsized returns that made the investor’s half of the partnership relatively light work. “But now you are going to have to be the majority partner.”
Sobering? Sure. Hopeless? Definitely not.
2
Over the 12 months since last September, U.S. stocks returned 15%, though the rise has not been a one-way ticket straight up. International markets have also posted strong returns, but lower than those of the broad U.S. market. The decision by United Kingdom voters in June to exit the European Union came as a surprise but caused market heartburn for only a few days.
In fixed income, yields remained extremely low—about 1.60% on the 10-year U.S. Treasury note at the end of September, after dipping below 1.40% over the summer. And bond yields in some international markets were negative.
Even this relatively small window of time illustrates a truism of the financial markets: There will always be segments that perform well and others that don’t. Saving more saves you from trying to control the uncontrollable—how economies and the markets perform. And it keeps you in control of one of the most vital parts of your investment program.
Although the “save more” logic is easy to grasp, it’s not always easy to follow. Bills, illness, the loss of a job—these can affect any of us.
But whatever our circumstances, figuring out how to save more is worth the effort. It requires that we make difficult decisions to forgo some consumption today to increase the likelihood of consuming (or consuming more) in the future. This is the very heart of investing. Sacrifices are never fun, so consider carrying them out systematically and in doses that you
| | | |
| Market Barometer | | | |
| | | Average Annual Total Returns |
| | | Periods Ended September 30, 2016 |
| | One | Three | Five |
| | Year | Years | Years |
| Stocks | | | |
| Russell 1000 Index (Large-caps) | 14.93% | 10.78% | 16.41% |
| Russell 2000 Index (Small-caps) | 15.47 | 6.71 | 15.82 |
| Russell 3000 Index (Broad U.S. market) | 14.96 | 10.44 | 16.36 |
| FTSE All-World ex US Index (International) | 9.62 | 0.71 | 6.50 |
| |
| Bonds | | | |
| Bloomberg Barclays U.S. Aggregate Bond Index | | | |
| (Broad taxable market) | 5.19% | 4.03% | 3.08% |
| Bloomberg Barclays Municipal Bond Index | | | |
| (Broad tax-exempt market) | 5.58 | 5.54 | 4.48 |
| Citigroup Three-Month U.S. Treasury Bill Index | 0.20 | 0.06 | 0.06 |
| |
| CPI | | | |
| Consumer Price Index | 1.46% | 1.03% | 1.25% |
3
can be comfortable with—for instance, gradually getting up to the max in your IRA, or adding a percentage point or so to the amount you stash in your employer’s retirement plan. As a point of reference, we generally suggest that investors strive for a retirement savings rate of 12%–15%, including any employer contributions.
If you need more convincing about the wisdom of the “save more” course of action, it might be helpful to examine your alternatives. This list is by no means exhaustive, but it hits on a few of the big ones, and none are without risk.
• Reach for yield. With yields so low on many types of bonds, it’s tempting to find the corners of the fixed income market where payouts are juicier. But with the juice comes considerable risk. You need to be aware that you’d be taking on more risk—and how much more.
• Go all-in on a hot-performing asset class or fund. By now, you know better than that, right?
• Sit tight. This approach isn’t a terrible idea; it’s better than panicking and deciding to just “do something,” particularly if that means changing your approach in response to the market’s movements.
Here’s the inescapably challenging part of your partnership with the markets: In the short run, your “partner” is fickle, emotional, and wildly unpredictable. But in the long run, your partner is mostly rational and extremely helpful.
The best way to minimize your vulnerability to the market’s mood swings, and to maximize the benefit of your partner’s longer-term strengths, is to expect less and save more. Maybe the markets will deliver better-than-expected returns. Maybe they’ll be consistent with our more modest expectations. In either case, a higher savings rate can help put you in a better position to reach your goals.
As always, thank you for investing with Vanguard.
Sincerely,

F. William McNabb III
Chairman and Chief Executive Officer
October 18, 2016
4
Advisor’s Report
Since its launch on March 28, 2016, Vanguard Core Bond Fund returned 3.57% for Investor Shares and 3.67% for Admiral Shares. Those performances were a little better than the 3.31% return of the benchmark (the Bloomberg Barclays U.S. Aggregate Float Adjusted Index) and the average return of 3.54% for peer funds.
The investment environment
Britain’s vote to leave the European Union caught global capital markets off guard. Stocks showed some nervousness ahead of the referendum, then tumbled in the immediate aftermath of the vote, known as “Brexit,” before regaining much of their lost ground by the end of June. Despite credit rating agency downgrades, yields of U.K. government bonds headed lower. So did those of most developed-market government bonds as investors sought out assets perceived to be less risky.
Another support for bonds over the period was accommodative monetary policy. The European Central Bank kept its overnight interest rate on banks’ excess reserves below zero and continued buying sovereign and corporate bonds with the aim of keeping borrowing costs low. In July, the Bank of Japan increased its asset purchases. And in August, the Bank of England cut interest rates to an all-time low and expanded its bond-buying program.
Stateside, the Federal Reserve pushed out the timing of further short-term rate hikes. Ongoing concerns about weak growth abroad and uncertainty about the ramifications of Brexit helped stay the Fed’s hand in June. Although the markets thought rates might rise in September, policymakers again chose to stand pat, citing further scope for improvement in employment and inflation.
This environment was positive for U.S. government bonds. Demand from yield-starved investors—both domestic and international—drove U.S. Treasury yields lower, especially those of longer-dated securities. From the fund’s inception to the close of the period, the bellwether 10-year U.S. Treasury yield fell about 30 basis points to 1.60%.
Investment-grade corporate bonds also did well; the average spread between their yields and those of Treasuries ground 26 basis points tighter to 138 basis points. (A basis point is one-hundredth of a percentage point.) The spreads of bonds issued by companies in basic industries and energy in particular narrowed significantly.
Management of the fund
An overweighted allocation to securitized debt added value. Included in that category are commercial mortgage-backed securities—pooled mortgages on commercial properties, which performed well. Asset-backed securities, another segment of securitized debt typically backed by auto loans, credit-card debt, and student loans, made a smaller contribution.
5
The spread in yields between corporate bonds and Treasuries narrowed as investors grew comfortable with taking on higher risk for more yield. Lower-rated investment-grade bonds outperformed their higher-rated counterparts, which favored our tilt toward BBB-rated bonds.
Overall, our corporate bond holdings made a solid contribution. Security selection in financials was strong, notably among banks, insurance companies, and real estate investment trusts.
We also benefited from the strength in industrials early on by adding debt issued by energy and metals and mining companies. These became attractively valued because of the slump in commodity prices and the dimmer outlook for global growth. Although our timing was good, our underweighted allocation to industrials dragged on the relative performance of our corporate bond holdings. A slight overweighting of emerging-market bonds made a positive contribution even though their spreads had already tightened significantly before the launch of the fund.
Our portfolio also included Treasury Inflation-Protected Securities, which are not part of the benchmark index. Because we believed inflation would edge higher, we felt TIPS offered value relative to nominal Treasury bonds. Some of the factors supporting that view included the Fed’s holding rates lower for longer, wages ticking higher, some improvement in the price of oil, and the prospect of fiscal stimulus through infrastructure spending. The return from this allocation was modestly positive.
We kept the fund’s average duration close to that of the benchmark index. (Duration is a measure of sensitivity, measured in years, of a fund’s holdings to changes in interest rates.) It stood at 5.8 years at the end of the period.
Outlook
The U.S. economy looks set to remain on relatively solid footing. The labor market should achieve the Fed’s full employment target. Job creation has slowed from last year, but continuing wage gains could boost demand and push inflation higher. Current low mortgage rates and muted inflation are likely to support home buying, mortgage refinancing, and consumer spending. These trends should help the economy grow at a modest rate.
In formulating our inflation outlook, we remain positive about underlying trends when we exclude the highly volatile commodity prices from most measures. Oil market imbalances have depressed energy prices during the past two years but appear to be moving toward balance. They should provide a modest uplift to headline inflation in the coming year.
U.S. monetary policy should remain cautious and accommodative. No matter when the Fed makes its next rate hike, we believe its short-term rate target isn’t likely to go above 1% over the next few years.
6
Central bank policy in the United Kingdom, the Eurozone, and China looks set to remain accommodative in the face of weak or slowing growth. This should keep U.S. yields attractive to international investors. Given that, and our outlook for modest growth and inflation at home, we also don’t expect to see a material rise in government bond yields farther out along the curve.
With regard to corporate bonds, we continue to hold significant positions in very liquid assets. This should give us the flexibility to take advantage of any dislocations in pricing that may arise if volatility picks up.
Whatever the markets may bring, our experienced team of portfolio managers, traders, and credit analysts will continue to seek out opportunities to add to the fund’s performance.
Portfolio Managers:
Brian W. Quigley
Gemma Wright-Casparius, Principal
Gregory S. Nassour, CFA, Principal
Vanguard Fixed Income Group
October 25, 2016
7
| | |
| Core Bond Fund | |
| |
| |
| Fund Profile | | |
| As of September 30, 2016 | | |
| |
| Share-Class Characteristics | |
| |
| | Investor | Admiral |
| | Shares | Shares |
| Ticker Symbol | VCORX | VCOBX |
| Expense Ratio1 | 0.25% | 0.15% |
| 30-Day SEC Yield | 1.81% | 1.91% |
| |
| |
| Financial Attributes | | |
| | | Bloomberg |
| | | Barclays U.S. |
| | | Aggregate |
| | | Float Adjusted |
| | Fund | Index |
| Number of Bonds | 789 | 9,908 |
| Yield to Maturity | | |
| (before expenses) | 2.1% | 2.0% |
| Average Coupon | 3.0% | 3.1% |
| Average Duration | 5.8 years | 5.8 years |
| Average Effective | | |
| Maturity | 7.6 years | 8.0 years |
| Short-Term | | |
| Reserves | 5.9% | — |
| |
| Sector Diversification (% of portfolio) | |
| Asset-Backed | 7.5% |
| Commercial Mortgage-Backed | 4.1 |
| Finance | 10.8 |
| Foreign | 3.5 |
| Government Mortgage-Backed | 22.2 |
| Industrial | 12.8 |
| Treasury/Agency | 36.3 |
| Utilities | 2.5 |
| Other | 0.3 |
The agency and mortgage-backed securities sectors may include issues from government-sponsored enterprises; such issues are generally not backed by the full faith and credit of the U.S. government.
| |
| Distribution by Effective Maturity | |
| (% of portfolio) | |
| Under 1 Year | 4.1% |
| 1 - 3 Years | 17.9 |
| 3 - 5 Years | 32.9 |
| 5 - 7 Years | 12.5 |
| 7 - 10 Years | 17.3 |
| 10 - 20 Years | 5.1 |
| 20 - 30 Years | 10.0 |
| Over 30 Years | 0.2 |
Distribution by Credit Quality (% of portfolio)
| |
| U.S. Government | 51.2% |
| Aaa | 10.2 |
| Aa | 3.9 |
| A | 10.2 |
| Baa | 17.1 |
| Ba | 0.4 |
| B | 0.2 |
| Not Rated | 6.8 |
Credit-quality ratings are obtained from Moody's and S&P, and the higher rating for each issue is shown. "Not Rated" is used to classify securities for which a rating is not available. Not rated securities include a fund's investment in Vanguard Market Liquidity Fund or Vanguard Municipal Cash Management Fund, each of which invests in high-quality money market instruments and may serve as a cash management vehicle for the Vanguard funds, trusts, and accounts. For more information about these ratings, see the Glossary entry for Credit Quality.
Investment Focus

1 The expense ratios shown are from the prospectus dated March 10, 2016, and represent estimated costs for the current fiscal year. For the period from inception through September 30, 2016, the expense ratios were 0.25% for Investor Shares and 0.15% for Admiral Shares.
8
Core Bond Fund
Performance Summary
All of the returns in this report represent past performance, which is not a guarantee of future results that may be achieved by the fund. (Current performance may be lower or higher than the performance data cited. For performance data current to the most recent month-end, visit our website at vanguard.com/performance.) Note, too, that both investment returns and principal value can fluctuate widely, so an investor’s shares, when sold, could be worth more or less than their original cost. The returns shown do not reflect taxes that a shareholder would pay on fund distributions or on the sale of fund shares.

Core Bond Funds Average: Derived from data provided by Lipper, a Thomson Reuters Company.
"Since Inception" performance is calculated from the Investor Shares’ inception date for both the fund and its comparative standards.
| | |
| | Since | Final Value |
| | Inception | of a $50,000 |
| | (3/28/2016) | Investment |
| Core Bond Fund Admiral Shares | 3.67% | $51,837 |
| Bloomberg Barclays U.S. Aggregate Float | | |
| Adjusted Index | 3.31 | 51,653 |
"Since Inception" performance is calculated from the Admiral Shares’ inception date for both the fund and its comparative standards.
See Financial Highlights for dividend and capital gains information.
9
Core Bond Fund
Fiscal-Period Total Returns (%): March 28, 2016, Through September 30, 2016
| | | | |
| | | | | Bloomberg |
| | | | | Barclays U.S. |
| | | | | Aggregate |
| | | | | Float Adjusted |
| | | | Investor Shares | Index |
| Fiscal Year | Income Returns | Capital Returns | Total Returns | Total Returns |
| 2016 | 0.97% | 2.60% | 3.57% | 3.31% |
10
Core Bond Fund
Financial Statements
Statement of Net Assets
As of September 30, 2016
The fund reports a complete list of its holdings in regulatory filings four times in each fiscal year, at the quarter-ends. For the second and fourth fiscal quarters, the lists appear in the fund’s semiannual and annual reports to shareholders. For the first and third fiscal quarters, the fund files the lists with the Securities and Exchange Commission on Form N-Q. Shareholders can look up the fund’s Forms N-Q on the SEC’s website at sec.gov. Forms N-Q may also be reviewed and copied at the SEC’s Public Reference Room (see the back cover of this report for further information).
| | | | |
| | | | Face | Market |
| | | Maturity | Amount | Value• |
| | Coupon | Date | ($000) | ($000) |
| U.S. Government and Agency Obligations (58.8%) | | | | |
| U.S. Government Securities (26.4%) | | | | |
| United States Treasury Inflation Indexed Bonds | 0.125% | 4/15/17 | 22,000 | 23,371 |
| United States Treasury Inflation Indexed Bonds | 2.625% | 7/15/17 | 6,144 | 7,352 |
| United States Treasury Inflation Indexed Bonds | 0.125% | 4/15/21 | 4,661 | 4,835 |
| United States Treasury Inflation Indexed Bonds | 0.625% | 1/15/26 | 7,843 | 8,365 |
| United States Treasury Inflation Indexed Bonds | 0.125% | 7/15/26 | 193 | 196 |
| United States Treasury Note/Bond | 0.875% | 11/15/17 | 8,500 | 8,516 |
| United States Treasury Note/Bond | 0.875% | 5/31/18 | 50 | 50 |
| United States Treasury Note/Bond | 2.250% | 7/31/18 | 44 | 45 |
| United States Treasury Note/Bond | 0.750% | 8/31/18 | 950 | 950 |
| United States Treasury Note/Bond | 1.500% | 12/31/18 | 1,200 | 1,218 |
| United States Treasury Note/Bond | 1.125% | 1/15/19 | 6,000 | 6,039 |
| United States Treasury Note/Bond | 1.500% | 1/31/19 | 800 | 812 |
| United States Treasury Note/Bond | 0.750% | 2/15/19 | 6,600 | 6,587 |
| United States Treasury Note/Bond | 1.375% | 2/28/19 | 1,500 | 1,519 |
| United States Treasury Note/Bond | 1.000% | 3/15/19 | 4,500 | 4,517 |
| United States Treasury Note/Bond | 1.625% | 3/31/19 | 432 | 440 |
| United States Treasury Note/Bond | 0.875% | 4/15/19 | 3,400 | 3,402 |
| United States Treasury Note/Bond | 1.375% | 8/31/20 | 1,025 | 1,038 |
| United States Treasury Note/Bond | 1.375% | 9/30/20 | 650 | 658 |
| United States Treasury Note/Bond | 2.000% | 9/30/20 | 2,500 | 2,590 |
| United States Treasury Note/Bond | 1.375% | 10/31/20 | 650 | 658 |
| United States Treasury Note/Bond | 1.750% | 10/31/20 | 3,900 | 4,002 |
| United States Treasury Note/Bond | 1.625% | 11/30/20 | 650 | 664 |
| United States Treasury Note/Bond | 2.000% | 11/30/20 | 1,000 | 1,037 |
| United States Treasury Note/Bond | 1.750% | 12/31/20 | 1,586 | 1,628 |
| United States Treasury Note/Bond | 1.375% | 1/31/21 | 2,400 | 2,426 |
| United States Treasury Note/Bond | 2.125% | 1/31/21 | 700 | 729 |
| United States Treasury Note/Bond | 2.000% | 2/28/21 | 800 | 830 |
| United States Treasury Note/Bond | 1.250% | 3/31/21 | 2,000 | 2,011 |
| United States Treasury Note/Bond | 2.250% | 4/30/21 | 2,300 | 2,413 |
| United States Treasury Note/Bond | 2.000% | 5/31/21 | 2,050 | 2,128 |
| United States Treasury Note/Bond | 2.125% | 8/15/21 | 3,000 | 3,133 |
| United States Treasury Note/Bond | 1.750% | 1/31/23 | 500 | 512 |
| United States Treasury Note/Bond | 1.500% | 2/28/23 | 1,000 | 1,008 |
| United States Treasury Note/Bond | 1.500% | 3/31/23 | 980 | 987 |
| United States Treasury Note/Bond | 1.750% | 5/15/23 | 5,500 | 5,625 |
| United States Treasury Note/Bond | 1.625% | 5/31/23 | 1,000 | 1,015 |
11
| | | | |
| Core Bond Fund | | | | |
| |
| |
| |
| | | | Face | Market |
| | | Maturity | Amount | Value• |
| | Coupon | Date | ($000) | ($000) |
| United States Treasury Note/Bond | 2.500% | 8/15/23 | 6,500 | 6,966 |
| United States Treasury Note/Bond | 2.750% | 11/15/23 | 244 | 266 |
| United States Treasury Note/Bond | 2.125% | 5/15/25 | 1,650 | 1,726 |
| United States Treasury Note/Bond | 2.000% | 8/15/25 | 500 | 518 |
| United States Treasury Note/Bond | 2.250% | 11/15/25 | 4,560 | 4,817 |
| United States Treasury Note/Bond | 1.625% | 2/15/26 | 2,468 | 2,474 |
| United States Treasury Note/Bond | 1.625% | 5/15/26 | 4,735 | 4,745 |
| United States Treasury Note/Bond | 6.500% | 11/15/26 | 200 | 292 |
| United States Treasury Note/Bond | 6.125% | 8/15/29 | 1,000 | 1,505 |
| United States Treasury Note/Bond | 6.250% | 5/15/30 | 400 | 618 |
| United States Treasury Note/Bond | 5.375% | 2/15/31 | 400 | 584 |
| United States Treasury Note/Bond | 4.500% | 2/15/36 | 1,450 | 2,044 |
| 1 United States Treasury Note/Bond | 4.750% | 2/15/37 | 2,850 | 4,143 |
| United States Treasury Note/Bond | 5.000% | 5/15/37 | 608 | 912 |
| United States Treasury Note/Bond | 4.250% | 5/15/39 | 600 | 824 |
| United States Treasury Note/Bond | 3.750% | 8/15/41 | 650 | 838 |
| United States Treasury Note/Bond | 3.125% | 11/15/41 | 600 | 700 |
| United States Treasury Note/Bond | 3.125% | 2/15/42 | 650 | 759 |
| United States Treasury Note/Bond | 3.000% | 5/15/42 | 6,600 | 7,545 |
| United States Treasury Note/Bond | 3.625% | 8/15/43 | 200 | 255 |
| United States Treasury Note/Bond | 2.875% | 8/15/45 | 1,550 | 1,732 |
| United States Treasury Note/Bond | 3.000% | 11/15/45 | 2,742 | 3,139 |
| 2 United States Treasury Note/Bond | 2.500% | 2/15/46 | 4,150 | 4,305 |
| United States Treasury Note/Bond | 2.500% | 5/15/46 | 2,800 | 2,908 |
| United States Treasury Note/Bond | 2.250% | 8/15/46 | 1,900 | 1,872 |
| | | | | 169,793 |
| Agency Bonds and Notes (10.2%) | | | | |
| † AID-Ukraine | 1.471% | 9/29/21 | 2,100 | 2,109 |
| 3 Federal Home Loan Banks | 0.875% | 6/29/18 | 2,200 | 2,201 |
| 3 Federal Home Loan Banks | 0.625% | 8/7/18 | 100 | 100 |
| 3 Federal Home Loan Banks | 0.875% | 10/1/18 | 2,500 | 2,499 |
| 3 Federal Home Loan Banks | 0.875% | 8/5/19 | 3,700 | 3,687 |
| 3 Federal Home Loan Banks | 1.000% | 9/26/19 | 3,250 | 3,248 |
| 3 Federal Home Loan Banks | 1.125% | 7/14/21 | 1,500 | 1,490 |
| 4 Federal Home Loan Mortgage Corp. | 0.750% | 4/9/18 | 300 | 300 |
| 4 Federal Home Loan Mortgage Corp. | 0.875% | 10/12/18 | 870 | 869 |
| 4 Federal Home Loan Mortgage Corp. | 0.875% | 7/19/19 | 6,050 | 6,031 |
| 4 Federal Home Loan Mortgage Corp. | 1.125% | 8/12/21 | 2,000 | 1,983 |
| 4 Federal National Mortgage Assn. | 1.000% | 2/26/19 | 2,500 | 2,504 |
| 4 Federal National Mortgage Assn. | 1.000% | 8/28/19 | 1,900 | 1,899 |
| 4 Federal National Mortgage Assn. | 0.000% | 10/9/19 | 9,600 | 9,240 |
| 4 Federal National Mortgage Assn. | 1.875% | 12/28/20 | 600 | 617 |
| 4 Federal National Mortgage Assn. | 1.250% | 8/17/21 | 2,900 | 2,892 |
| 4 Federal National Mortgage Assn. | 1.875% | 9/24/26 | 5,600 | 5,578 |
| 3 Financing Corp. | 0.000% | 11/11/17 | 3,000 | 2,973 |
| Private Export Funding Corp. | 5.450% | 9/15/17 | 500 | 522 |
| Private Export Funding Corp. | 2.250% | 12/15/17 | 3,000 | 3,048 |
| Private Export Funding Corp. | 4.375% | 3/15/19 | 128 | 138 |
| Private Export Funding Corp. | 1.450% | 8/15/19 | 2,715 | 2,741 |
| Private Export Funding Corp. | 2.300% | 9/15/20 | 150 | 156 |
| Private Export Funding Corp. | 3.550% | 1/15/24 | 1,300 | 1,446 |
| Residual Funding Corp. Principal Strip | 0.000% | 10/15/20 | 2,000 | 1,900 |
| Resolution Funding Corp. Interest Strip | 0.000% | 1/15/27 | 600 | 480 |
| Resolution Funding Corp. Interest Strip | 0.000% | 4/15/27 | 1,800 | 1,427 |
| Resolution Funding Corp. Interest Strip | 0.000% | 7/15/27 | 794 | 623 |
12
| | | | | |
| Core Bond Fund | | | | |
| |
| |
| |
| | | | | Face | Market |
| | | | Maturity | Amount | Value• |
| | | Coupon | Date | ($000) | ($000) |
| | Resolution Funding Corp. Interest Strip | 0.000% | 10/15/27 | 794 | 619 |
| | Resolution Funding Corp. Interest Strip | 0.000% | 4/15/28 | 3,000 | 2,289 |
| | | | | | 65,609 |
| Conventional Mortgage-Backed Securities (20.3%) | | | | |
| 4,5,6 Fannie Mae Pool | 2.000% | 11/1/31 | 5,000 | 5,062 |
| 4,5,6 Fannie Mae Pool | 2.500% | 2/1/28–11/1/31 | 12,696 | 13,133 |
| 4,5,6 Fannie Mae Pool | 3.000% | 2/1/27–11/25/46 | 7,466 | 7,841 |
| 4,5 | Fannie Mae Pool | 3.500% | 3/1/27–11/1/46 | 14,031 | 14,873 |
| 4,5 | Fannie Mae Pool | 4.000% | 8/1/39–7/1/46 | 19,195 | 20,714 |
| 4,5,6 Fannie Mae Pool | 4.500% | 1/1/41–10/1/46 | 4,561 | 5,065 |
| 4,5 | Fannie Mae Pool | 5.000% | 3/1/38–2/1/45 | 8,718 | 9,814 |
| 4,5 | Fannie Mae Pool | 6.000% | 5/1/37 | 1,134 | 1,313 |
| 4,5,6 Freddie Mac Gold Pool | 2.500% | 11/1/31 | 2,550 | 2,637 |
| 4,5,6 Freddie Mac Gold Pool | 3.000% | 10/1/31–10/1/46 | 14,250 | 14,889 |
| 4,5,6 Freddie Mac Gold Pool | 3.500% | 10/1/46–11/1/46 | 1,750 | 1,844 |
| 4,5 | Freddie Mac Gold Pool | 4.000% | 1/1/46 | 187 | 203 |
| 5 | Ginnie Mae I Pool | 4.000% | 7/15/45–8/15/45 | 419 | 450 |
| 5,6 | Ginnie Mae I Pool | 4.500% | 2/15/39–11/1/46 | 3,448 | 3,835 |
| 5 | Ginnie Mae I Pool | 5.000% | 3/15/38–2/15/40 | 4,182 | 4,718 |
| 5,6 | Ginnie Mae II Pool | 3.000% | 1/20/45–11/1/46 | 7,568 | 7,954 |
| 5 | Ginnie Mae II Pool | 3.500% | 10/20/43–10/1/46 | 12,710 | 13,615 |
| 5 | Ginnie Mae II Pool | 4.000% | 11/20/42 | 427 | 461 |
| 5 | Ginnie Mae II Pool | 4.500% | 11/20/44 | 1,871 | 2,068 |
| | | | | | 130,489 |
| Nonconventional Mortgage-Backed Securities (1.9%) | | | | |
| 4,5,7 Fannie Mae Pool | 2.657% | 9/1/37 | 1,798 | 1,902 |
| 4,5,7 Fannie Mae Pool | 2.696% | 8/1/35 | 411 | 434 |
| 4,5,7 Fannie Mae Pool | 2.756% | 12/1/40 | 243 | 257 |
| 4,5,7 Fannie Mae Pool | 2.758% | 4/1/40 | 1,534 | 1,637 |
| 4,5,7 Fannie Mae Pool | 2.927% | 8/1/36 | 519 | 548 |
| 4,5,7 Fannie Mae REMICS | 0.775% | 9/25/46 | 867 | 864 |
| 4,5,7 Fannie Mae REMICS | 0.825% | 9/25/41–4/25/45 | 464 | 462 |
| 4,5,7 Fannie Mae REMICS | 0.845% | 6/25/36 | 496 | 495 |
| 4,5,7 Fannie Mae REMICS | 0.875% | 5/25/43 | 250 | 249 |
| 4,5,7 Fannie Mae REMICS | 0.895% | 6/25/35 | 136 | 136 |
| 4,5,7 Fannie Mae REMICS | 0.925% | 11/25/42–9/25/46 | 1,005 | 1,007 |
| 4,5,7 Fannie Mae REMICS | 0.935% | 11/25/35 | 178 | 178 |
| 4,5,7 Fannie Mae REMICS | 0.970% | 2/25/37 | 103 | 103 |
| 4,5,7 Fannie Mae REMICS | 1.025% | 8/25/46 | 384 | 384 |
| 4,5,7 Freddie Mac Non Gold Pool | 2.663% | 11/1/35 | 738 | 785 |
| 4,5,7 Freddie Mac Non Gold Pool | 2.745% | 7/1/35–9/1/37 | 1,813 | 1,920 |
| 4,5 | Freddie Mac Non Gold Pool | 2.890% | 7/1/33 | 119 | 126 |
| 4,5,7 Freddie Mac REMICS | 0.874% | 11/15/36–8/15/43 | 413 | 413 |
| 4,5,7 Freddie Mac REMICS | 0.884% | 11/15/36 | 136 | 136 |
| 4,5,7 Freddie Mac REMICS | 0.974% | 6/15/42 | 84 | 83 |
| | | | | | 12,119 |
| Total U.S. Government and Agency Obligations (Cost $375,349) | | 378,010 |
| Asset-Backed/Commercial Mortgage-Backed Securities (12.3%) | | |
| 5 | Ally Master Owner Trust Series 2015-3 | 1.630% | 5/15/20 | 1,500 | 1,509 |
| 5,8 | American Homes 4 Rent 2014-SFR3 | 3.678% | 12/17/36 | 97 | 104 |
| 5 | AmeriCredit Automobile Receivables Trust 2014-1 | 2.150% | 3/9/20 | 90 | 91 |
| 5 | AmeriCredit Automobile Receivables Trust 2014-2 | 2.180% | 6/8/20 | 60 | 61 |
| 5 | AmeriCredit Automobile Receivables Trust 2015-3 | 3.340% | 8/8/21 | 285 | 293 |
13
| | | | | |
| Core Bond Fund | | | | |
| |
| |
| |
| | | | | Face | Market |
| | | | Maturity | Amount | Value• |
| | | Coupon | Date | ($000) | ($000) |
| 5 | AmeriCredit Automobile Receivables Trust 2016-2 | 1.600% | 11/9/20 | 170 | 170 |
| 5 | AmeriCredit Automobile Receivables Trust 2016-2 | 2.210% | 5/10/21 | 30 | 30 |
| 5 | AmeriCredit Automobile Receivables Trust 2016-2 | 2.870% | 11/8/21 | 20 | 20 |
| 5 | AmeriCredit Automobile Receivables Trust 2016-2 | 3.650% | 5/9/22 | 125 | 130 |
| 5 | AmeriCredit Automobile Receivables Trust 2016-3 | 1.460% | 5/8/21 | 70 | 70 |
| 5 | AmeriCredit Automobile Receivables Trust 2016-3 | 2.710% | 9/8/22 | 200 | 201 |
| 5,8 | Applebee’s Funding LLC/IHOP Funding LLC 2014-1 | 4.277% | 9/5/44 | 60 | 61 |
| 5,8 | ARL Second LLC 2014-1A | 2.920% | 6/15/44 | 77 | 75 |
| 5,8 | Aventura Mall Trust 2013-AVM | 3.867% | 12/5/32 | 800 | 860 |
| 5,8 | Avis Budget Rental Car Funding AESOP LLC | | | | |
| | 2013-2A | 2.970% | 2/20/20 | 575 | 587 |
| 5,8 | Avis Budget Rental Car Funding AESOP LLC | | | | |
| | 2015-2A | 2.630% | 12/20/21 | 380 | 385 |
| 5,8 | Avis Budget Rental Car Funding AESOP LLC | | | | |
| | 2016-1A | 2.990% | 6/20/22 | 200 | 205 |
| 5,8 | Avis Budget Rental Car Funding AESOP LLC | | | | |
| | 2016-2 | 2.720% | 11/20/22 | 420 | 425 |
| 8 | Bank of Montreal | 1.750% | 6/15/21 | 305 | 305 |
| | Bank of Nova Scotia | 1.875% | 4/26/21 | 330 | 332 |
| 8 | Bank of Nova Scotia | 1.875% | 9/20/21 | 110 | 111 |
| 5,7,8 BMW Floorplan Master Owner Trust 2015-1A | 1.024% | 7/15/20 | 700 | 701 |
| 5,7 | Cabela’s Credit Card Master Note Trust 2016-1 | 1.374% | 6/15/22 | 1,100 | 1,100 |
| 5,8 | California Republic Auto Receivables Trust 2015-4 | 2.580% | 6/15/21 | 81 | 83 |
| 5 | California Republic Auto Receivables Trust 2016-2 | 1.560% | 7/15/20 | 160 | 161 |
| 5 | California Republic Auto Receivables Trust 2016-2 | 1.830% | 12/15/21 | 130 | 131 |
| 5 | California Republic Auto Receivables Trust 2016-2 | 2.520% | 5/16/22 | 210 | 211 |
| 5 | California Republic Auto Receivables Trust 2016-2 | 3.510% | 3/15/23 | 210 | 210 |
| 5 | Capital Auto Receivables Asset Trust 2013-4 | 2.670% | 2/20/19 | 360 | 364 |
| 5 | Capital Auto Receivables Asset Trust 2016-2 | 1.630% | 1/20/21 | 570 | 570 |
| 5 | Capital Auto Receivables Asset Trust 2016-2 | 3.160% | 11/20/23 | 220 | 224 |
| 5 | Capital Auto Receivables Asset Trust 2016-3 | 1.540% | 8/20/20 | 70 | 70 |
| 5 | Capital Auto Receivables Asset Trust 2016-3 | 1.690% | 3/20/21 | 20 | 20 |
| 5 | Capital Auto Receivables Asset Trust 2016-3 | 2.350% | 9/20/21 | 50 | 50 |
| 5 | Capital Auto Receivables Asset Trust 2016-3 | 2.650% | 1/20/24 | 40 | 40 |
| 5,7 | Capital One Multi-Asset Execution Trust 2016-A1 | 0.974% | 2/15/22 | 800 | 804 |
| 5,7 | Capital One Multi-Asset Execution Trust 2016-A2 | 1.154% | 2/15/24 | 410 | 412 |
| 5,7,8 CARDS II Trust 2016-1A | 1.224% | 7/15/21 | 750 | 751 |
| 5 | CarMax Auto Owner Trust 2013-3 | 2.850% | 2/18/20 | 750 | 755 |
| 5 | CarMax Auto Owner Trust 2016-2 | 2.160% | 12/15/21 | 100 | 101 |
| 5 | CarMax Auto Owner Trust 2016-2 | 3.250% | 11/15/22 | 100 | 101 |
| 5 | CarMax Auto Owner Trust 2016-3 | 1.900% | 4/15/22 | 200 | 199 |
| 5 | CarMax Auto Owner Trust 2016-3 | 2.200% | 6/15/22 | 190 | 189 |
| 5 | CarMax Auto Owner Trust 2016-3 | 2.940% | 1/17/23 | 190 | 189 |
| 5 | CFCRE Commercial Mortgage Trust 2016-C4 | 3.283% | 5/10/58 | 350 | 370 |
| 5,7 | Chase Issuance Trust 2016-A1 | 0.934% | 5/17/21 | 700 | 702 |
| 5,8 | Chesapeake Funding II LLC 2016-2A | 1.880% | 6/15/28 | 610 | 612 |
| 5,8 | Chrysler Capital Auto Receivables Trust 2014-BA | 3.440% | 8/16/21 | 200 | 202 |
| 5,8 | Chrysler Capital Auto Receivables Trust 2016-AA | 1.960% | 1/18/22 | 600 | 601 |
| 5,8 | Chrysler Capital Auto Receivables Trust 2016-AA | 2.880% | 2/15/22 | 90 | 90 |
| 5,8 | Chrysler Capital Auto Receivables Trust 2016-AA | 4.220% | 2/15/23 | 90 | 90 |
| 5 | Citigroup Commercial Mortgage Trust 2014-GC19 | 4.023% | 3/10/47 | 350 | 389 |
| 5 | Citigroup Commercial Mortgage Trust 2014-GC21 | 3.575% | 5/10/47 | 350 | 380 |
| 5 | Citigroup Commercial Mortgage Trust 2014-GC23 | 3.622% | 7/10/47 | 350 | 381 |
| 5 | Citigroup Commercial Mortgage Trust 2014-GC23 | 4.175% | 7/10/47 | 230 | 252 |
| 5 | Citigroup Commercial Mortgage Trust 2014-GC25 | 3.635% | 10/10/47 | 350 | 378 |
14
| | | | | |
| Core Bond Fund | | | | |
| |
| |
| |
| | | | | Face | Market |
| | | | Maturity | Amount | Value• |
| | | Coupon | Date | ($000) | ($000) |
| 5 | Citigroup Commercial Mortgage Trust 2014-GC25 | 4.345% | 10/10/47 | 140 | 151 |
| 5 | Citigroup Commercial Mortgage Trust 2014-GC25 | 4.683% | 10/10/47 | 175 | 181 |
| 5 | Citigroup Commercial Mortgage Trust 2015-GC27 | 3.137% | 2/10/48 | 350 | 366 |
| 5 | Citigroup Commercial Mortgage Trust 2016-C1 | 3.209% | 5/10/49 | 450 | 476 |
| 5,8 | CKE Restaurant Holdings Inc. 2013-1A | 4.474% | 3/20/43 | 82 | 82 |
| 5 | CNH Equipment Trust 2016-B | 1.970% | 11/15/21 | 600 | 605 |
| 5,7,8 Colony American Homes 2015-1 | 2.031% | 7/17/32 | 70 | 70 |
| 5,7,8 Colony American Homes 2015-1A | 1.731% | 7/17/32 | 184 | 183 |
| 5,7,8 Colony Starwood Homes 2016-1A Trust | 2.031% | 7/17/33 | 494 | 500 |
| 5,7,8 Colony Starwood Homes 2016-1A Trust | 2.681% | 7/17/33 | 185 | 187 |
| 5 | COMM 2012-CCRE4 Mortgage Trust | 3.251% | 10/15/45 | 500 | 523 |
| 5 | COMM 2013-CCRE12 Mortgage Trust | 4.046% | 10/10/46 | 500 | 557 |
| 5,8 | COMM 2013-CCRE6 Mortgage Trust | 3.397% | 3/10/46 | 210 | 218 |
| 5,8 | COMM 2013-CCRE9 Mortgage Trust | 4.398% | 7/10/45 | 230 | 243 |
| 5 | COMM 2014-CCRE15 Mortgage Trust | 4.074% | 2/10/47 | 350 | 392 |
| 5 | COMM 2014-CCRE17 Mortgage Trust | 3.977% | 5/10/47 | 350 | 389 |
| 5 | COMM 2014-CCRE17 Mortgage Trust | 4.895% | 5/10/47 | 190 | 206 |
| 5 | COMM 2014-CCRE20 Mortgage Trust | 3.590% | 11/10/47 | 350 | 380 |
| 5 | COMM 2015-CCRE22 Mortgage Trust | 3.309% | 3/10/48 | 350 | 373 |
| 5 | COMM 2015-LC19 Mortgage Trust | 3.183% | 2/10/48 | 350 | 371 |
| 5 | CSAIL 2015-C1 Commercial Mortgage Trust | 3.505% | 4/15/50 | 350 | 378 |
| 5 | CSAIL 2015-C4 Commercial Mortgage Trust | 3.808% | 11/15/48 | 350 | 384 |
| 5,8 | DB Master Finance LLC 2015-1A | 3.980% | 2/20/45 | 59 | 60 |
| 5 | DBJPM 16-C1 Mortgage Trust | 3.505% | 5/10/49 | 140 | 135 |
| 5,8 | Drive Auto Receivables Trust 2015-AA | 3.060% | 5/17/21 | 500 | 505 |
| 5,8 | Drive Auto Receivables Trust 2015-DA | 4.590% | 1/17/23 | 132 | 136 |
| 5,8 | Drive Auto Receivables Trust 2016-BA | 1.670% | 7/15/19 | 1,000 | 1,000 |
| 5,8 | Drive Auto Receivables Trust 2016-BA | 2.560% | 6/15/20 | 420 | 424 |
| 5,8 | Drive Auto Receivables Trust 2016-BA | 3.190% | 7/15/22 | 270 | 273 |
| 5,8 | Drive Auto Receivables Trust 2016-BA | 4.530% | 8/15/23 | 200 | 204 |
| 5,8 | Enterprise Fleet Financing LLC Series 2016-2 | 2.040% | 2/22/22 | 450 | 451 |
| 5,7,8 Evergreen Credit Card Trust 2016-1 | 1.244% | 4/15/20 | 1,175 | 1,178 |
| 4,5,7 Fannie Mae Connecticut Avenue Securities | | | | |
| | 2016-C04 | 1.975% | 1/25/29 | 183 | 184 |
| 4,5,7 Fannie Mae Connecticut Avenue Securities | | | | |
| | 2016-C05 | 1.875% | 1/25/29 | 495 | 497 |
| 5,8 | Ford Credit Auto Owner Trust 2014-REV1 | 2.260% | 11/15/25 | 190 | 194 |
| 5,8 | Ford Credit Auto Owner Trust 2014-REV1 | 2.410% | 11/15/25 | 250 | 253 |
| 5,8 | Ford Credit Auto Owner Trust 2014-REV2 | 2.310% | 4/15/26 | 1,050 | 1,074 |
| 5,8 | Ford Credit Auto Owner Trust 2014-REV2 | 2.510% | 4/15/26 | 200 | 203 |
| 5 | Ford Credit Auto Owner Trust 2016-B | 1.850% | 9/15/21 | 200 | 201 |
| 5,8 | Ford Credit Auto Owner Trust 2016-REV1 | 2.310% | 8/15/27 | 100 | 102 |
| 5,8 | Ford Credit Auto Owner Trust 2016-REV2 | 2.030% | 12/15/27 | 200 | 202 |
| 5 | Ford Credit Floorplan Master Owner Trust A | | | | |
| | Series 2012-5 | 2.730% | 9/15/19 | 600 | 603 |
| 5,7 | Ford Credit Floorplan Master Owner Trust A | | | | |
| | Series 2014-2 | 1.024% | 2/15/21 | 1,000 | 1,002 |
| 5 | Ford Credit Floorplan Master Owner Trust A | | | | |
| | Series 2014-2 | 2.310% | 2/15/21 | 200 | 203 |
| 5,7 | Ford Credit Floorplan Master Owner Trust A | | | | |
| | Series 2015-2 | 1.094% | 1/15/22 | 630 | 633 |
| 5,7 | Ford Credit Floorplan Master Owner Trust A | | | | |
| | Series 2016-1 | 1.424% | 2/15/21 | 400 | 404 |
| 5,7 | Ford Credit Floorplan Master Owner Trust A | | | | |
| | Series 2016-3 | 1.144% | 7/15/21 | 50 | 50 |
15
| | | | | |
| Core Bond Fund | | | | |
| |
| |
| |
| | | | | Face | Market |
| | | | Maturity | Amount | Value• |
| | | Coupon | Date | ($000) | ($000) |
| 5,7 | Ford Credit Floorplan Master Owner Trust A | | | | |
| | Series 2016-4 | 1.054% | 7/15/20 | 40 | 40 |
| 4,5,7 Freddie Mac Structured Agency Credit Risk | | | | |
| | Debt Notes 2016-DNA2 | 1.775% | 10/25/28 | 240 | 240 |
| 4,5,7 Freddie Mac Structured Agency Credit Risk | | | | |
| | Debt Notes 2016-DNA3 | 1.625% | 12/25/28 | 245 | 245 |
| 4,5,7 Freddie Mac Structured Agency Credit Risk | | | | |
| | Debt Notes 2016-DNA3 | 2.525% | 12/25/28 | 250 | 255 |
| 5,8 | FRS I LLC 2013-1A | 3.080% | 4/15/43 | 184 | 181 |
| 5,7 | GE Dealer Floorplan Master Note Trust Series | | | | |
| | 2015-2 | 1.182% | 1/20/22 | 370 | 370 |
| 5 | GM Financial Automobile Leasing Trust 2015-2 | 2.420% | 7/22/19 | 420 | 425 |
| 5 | GM Financial Automobile Leasing Trust 2015-2 | 2.990% | 7/22/19 | 50 | 51 |
| 5 | GM Financial Automobile Leasing Trust 2016-2 | 1.620% | 9/20/19 | 130 | 131 |
| 5 | GM Financial Automobile Leasing Trust 2016-2 | 1.760% | 3/20/20 | 900 | 906 |
| 5 | GM Financial Automobile Leasing Trust 2016-2 | 2.580% | 3/20/20 | 190 | 192 |
| 5 | GM Financial Automobile Leasing Trust 2016-3 | 1.610% | 12/20/19 | 40 | 40 |
| 5 | GM Financial Automobile Leasing Trust 2016-3 | 1.780% | 5/20/20 | 40 | 40 |
| 5,8 | GMF Floorplan Owner Revolving Trust 2015-1 | 1.970% | 5/15/20 | 450 | 451 |
| 5,7,8 GMF Floorplan Owner Revolving Trust 2016-1 | 1.374% | 5/17/21 | 800 | 802 |
| 5,8 | GMF Floorplan Owner Revolving Trust 2016-1 | 2.410% | 5/17/21 | 330 | 332 |
| 5,8 | GMF Floorplan Owner Revolving Trust 2016-1 | 2.850% | 5/17/21 | 330 | 331 |
| 5,7,8 Golden Credit Card Trust 2014-2A | 0.974% | 3/15/21 | 680 | 679 |
| 5,8 | Golden Credit Card Trust 2016-5A | 1.600% | 9/15/21 | 270 | 271 |
| 5 | GS Mortgage Securities Trust 2013-GCJ12 | 3.135% | 6/10/46 | 350 | 368 |
| 5 | GS Mortgage Securities Trust 2014-GC20 | 3.998% | 4/10/47 | 350 | 387 |
| 5 | GS Mortgage Securities Trust 2014-GC24 | 3.931% | 9/10/47 | 350 | 386 |
| 5 | GS Mortgage Securities Trust 2014-GC24 | 4.641% | 9/10/47 | 170 | 187 |
| 5 | GS Mortgage Securities Trust 2014-GC24 | 4.662% | 9/10/47 | 150 | 159 |
| 5 | GS Mortgage Securities Trust 2015-GC28 | 3.396% | 2/10/48 | 350 | 372 |
| 5 | GS Mortgage Securities Trust 2015-GC30 | 3.382% | 5/10/50 | 350 | 373 |
| 5,8 | Hertz Vehicle Financing LLC 2013-1A | 1.830% | 8/25/19 | 680 | 678 |
| 5,8 | Hertz Vehicle Financing LLC 2015-1A | 2.730% | 3/25/21 | 850 | 861 |
| 5,8 | Hertz Vehicle Financing LLC 2016-3 | 2.270% | 7/25/20 | 120 | 120 |
| 5,8 | Hertz Vehicle Financing LLC 2016-4 | 2.650% | 7/25/22 | 290 | 293 |
| 5,8 | Hyundai Auto Lease Securitization Trust 2016-B | 1.680% | 4/15/20 | 1,000 | 1,009 |
| 5,8 | Hyundai Auto Lease Securitization Trust 2016-C | 1.490% | 2/18/20 | 50 | 50 |
| 5,8 | Hyundai Auto Lease Securitization Trust 2016-C | 1.650% | 7/15/20 | 20 | 20 |
| 5,8 | Hyundai Floorplan Master Owner Trust Series | | | | |
| | 2016-1A | 1.810% | 3/15/21 | 110 | 111 |
| 5,7,8 Invitation Homes 2014-SFR1 Trust | 2.031% | 6/17/31 | 275 | 274 |
| 5,7,8 Invitation Homes 2015-SFR2 Trust | 2.177% | 6/17/32 | 70 | 70 |
| 5,7,8 Invitation Homes 2015-SFR3 Trust | 2.281% | 8/17/32 | 70 | 70 |
| 5 | John Deere Owner Trust 2016-B | 1.490% | 5/15/23 | 500 | 500 |
| 5,8 | JP Morgan Chase Commercial Mortgage | | | | |
| | Securities Trust 2011-C3 | 4.717% | 2/15/46 | 1,700 | 1,877 |
| 5,8 | JP Morgan Chase Commercial Mortgage | | | | |
| | Securities Trust 2011-C5 | 5.562% | 8/15/46 | 550 | 626 |
| 5,8 | JP Morgan Chase Commercial Mortgage | | | | |
| | Securities Trust 2012-C8 | 3.424% | 10/15/45 | 90 | 95 |
| 5 | JP Morgan Chase Commercial Mortgage | | | | |
| | Securities Trust 2013-C13 | 4.189% | 1/15/46 | 230 | 240 |
| 5 | JPMBB Commercial Mortgage Securities Trust | | | | |
| | 2013-C12 | 3.363% | 7/15/45 | 1,600 | 1,711 |
16
| | | | | |
| Core Bond Fund | | | | |
| |
| |
| |
| | | | | Face | Market |
| | | | Maturity | Amount | Value• |
| | | Coupon | Date | ($000) | ($000) |
| 5 | JPMBB Commercial Mortgage Securities Trust | | | | |
| | 2013-C14 | 4.133% | 8/15/46 | 30 | 34 |
| 5 | JPMBB Commercial Mortgage Securities Trust | | | | |
| | 2013-C15 | 5.214% | 11/15/45 | 30 | 33 |
| 5 | JPMBB Commercial Mortgage Securities Trust | | | | |
| | 2014-C18 | 4.079% | 2/15/47 | 350 | 391 |
| 5 | JPMBB Commercial Mortgage Securities Trust | | | | |
| | 2014-C26 | 3.231% | 1/15/48 | 350 | 370 |
| 5 | JPMBB Commercial Mortgage Securities Trust | | | | |
| | 2014-C26 | 3.494% | 1/15/48 | 350 | 376 |
| 5 | JPMBB Commercial Mortgage Securities Trust | | | | |
| | 2015-C27 | 3.179% | 2/15/48 | 350 | 368 |
| 5,7,8 Mercedes-Benz Master Owner Trust 2016-B | 1.224% | 5/17/21 | 800 | 804 |
| 5,8 | MMAF Equipment Finance LLC 2016-AA | 2.210% | 12/15/32 | 290 | 291 |
| 5 | Morgan Stanley Bank of America Merrill Lynch | | | | |
| | Trust 2012-C5 | 3.792% | 8/15/45 | 100 | 108 |
| 5 | Morgan Stanley Bank of America Merrill Lynch | | | | |
| | Trust 2013-C10 | 4.219% | 7/15/46 | 200 | 210 |
| 5 | Morgan Stanley Bank of America Merrill Lynch | | | | |
| | Trust 2013-C12 | 4.259% | 10/15/46 | 400 | 451 |
| 5 | Morgan Stanley Bank of America Merrill Lynch | | | | |
| | Trust 2014-C15 | 3.773% | 4/15/47 | 350 | 384 |
| 5 | Morgan Stanley Bank of America Merrill Lynch | | | | |
| | Trust 2014-C15 | 5.058% | 4/15/47 | 150 | 163 |
| 5 | Morgan Stanley Bank of America Merrill Lynch | | | | |
| | Trust 2014-C17 | 3.741% | 8/15/47 | 350 | 382 |
| 5 | Morgan Stanley Bank of America Merrill Lynch | | | | |
| | Trust 2014-C18 | 3.923% | 10/15/47 | 350 | 390 |
| 5 | Morgan Stanley Bank of America Merrill Lynch | | | | |
| | Trust 2014-C19 | 3.526% | 12/15/47 | 450 | 488 |
| 5 | Morgan Stanley Bank of America Merrill Lynch | | | | |
| | Trust 2015-C20 | 3.249% | 2/15/48 | 350 | 371 |
| 5 | Morgan Stanley Bank of America Merrill Lynch | | | | |
| | Trust 2015-C22 | 3.306% | 4/15/48 | 350 | 371 |
| 5 | Morgan Stanley Bank of America Merrill Lynch | | | | |
| | Trust 2015-C24 | 3.732% | 5/15/48 | 350 | 384 |
| 5 | Morgan Stanley Bank of America Merrill Lynch | | | | |
| | Trust 2016-C29 | 4.912% | 5/15/49 | 160 | 167 |
| 5 | Morgan Stanley Capital I Trust 2015-UBS8 | 3.809% | 12/15/48 | 350 | 388 |
| 5,8 | MSBAM Commercial Mortgage Securities Trust | | | | |
| | 2012-CKSV | 3.277% | 10/15/30 | 1,700 | 1,752 |
| 8 | National Australia Bank Ltd. | 2.250% | 3/16/21 | 50 | 51 |
| 5,7,8 Navient Student Loan Trust 2016-2 | 1.575% | 6/25/65 | 200 | 201 |
| 5,7,8 Navient Student Loan Trust 2016-3 | 1.375% | 6/25/65 | 60 | 60 |
| 5,7,8 Navistar Financial Dealer Note Master Trust | | | | |
| | 2016-1A | 0.000% | 9/27/21 | 220 | 220 |
| 5,8 | NextGear Floorplan Master Owner Trust 2016-1A | 2.740% | 4/15/21 | 580 | 581 |
| 5 | Nissan Auto Lease Trust 2016-A | 1.650% | 10/15/21 | 1,000 | 1,004 |
| 5 | Nissan Auto Lease Trust 2016-B | 1.500% | 7/15/19 | 140 | 140 |
| 5 | Nissan Auto Lease Trust 2016-B | 1.610% | 1/18/22 | 30 | 30 |
| 5,7 | Nissan Master Owner Trust Receivables Series | | | | |
| | 2016-A | 1.164% | 6/15/21 | 500 | 501 |
| 5,8 | Palisades Center Trust 2016-PLSD | 2.713% | 4/13/33 | 700 | 714 |
| 5,8 | Progress Residential 2015-SFR3 Trust | 3.067% | 11/12/32 | 414 | 425 |
| 5,7,8 Resimac Premier Series 2016-1A | 1.908% | 10/10/47 | 766 | 767 |
17
| | | | | |
| Core Bond Fund | | | | |
| |
| |
| |
| | | | | Face | Market |
| | | | Maturity | Amount | Value• |
| | | Coupon | Date | ($000) | ($000) |
| | Royal Bank of Canada | 2.100% | 10/14/20 | 390 | 397 |
| | Royal Bank of Canada | 2.300% | 3/22/21 | 600 | 616 |
| 5 | Santander Drive Auto Receivables Trust 2016-2 | 1.560% | 5/15/20 | 870 | 870 |
| 5 | Santander Drive Auto Receivables Trust 2016-2 | 2.080% | 2/16/21 | 215 | 216 |
| 5 | Santander Drive Auto Receivables Trust 2016-2 | 2.660% | 11/15/21 | 170 | 172 |
| 5 | Santander Drive Auto Receivables Trust 2016-2 | 3.390% | 4/15/22 | 140 | 144 |
| 5,8 | SMB Private Education Loan Trust 2016-A | 2.700% | 5/15/31 | 440 | 448 |
| 5,7,8 SMB Private Education Loan Trust 2016-B | 1.974% | 2/17/32 | 280 | 283 |
| 5,8 | SoFi Professional Loan Program 2016-B LLC | 2.740% | 10/25/32 | 470 | 482 |
| 5,8 | SoFi Professional Loan Program 2016-C LLC | 2.360% | 12/27/32 | 500 | 505 |
| 5,8 | SoFi Professional Loan Program 2016-D LLC | 2.340% | 4/25/33 | 100 | 100 |
| 5,7,8 SoFi Professional Loan Program 2016-D LLC | 1.600% | 1/25/39 | 100 | 100 |
| 5,8 | SpareBank 1 Boligkreditt AS | 1.750% | 11/15/20 | 250 | 251 |
| 5 | Synchrony Credit Card Master Note Trust 2015-1 | 2.370% | 3/15/23 | 385 | 396 |
| 5 | Synchrony Credit Card Master Note Trust 2015-4 | 2.380% | 9/15/23 | 337 | 345 |
| 5 | Synchrony Credit Card Master Note Trust 2016-1 | 2.390% | 3/15/22 | 345 | 350 |
| 5 | Synchrony Credit Card Master Note Trust 2016-2 | 2.210% | 5/15/24 | 470 | 479 |
| 5 | Synchrony Credit Card Master Note Trust 2016-3 | 1.580% | 9/15/22 | 150 | 150 |
| 5 | Synchrony Credit Card Master Note Trust 2016-3 | 1.910% | 9/15/22 | 100 | 100 |
| 5,8 | Taco Bell Funding LLC 2016-1A | 3.832% | 5/25/46 | 59 | 60 |
| 5,8 | Taco Bell Funding LLC 2016-1A | 4.377% | 5/25/46 | 36 | 37 |
| 5,8 | Taco Bell Funding LLC 2016-1A | 4.970% | 5/25/46 | 31 | 32 |
| 8 | Toronto-Dominion Bank | 2.250% | 3/15/21 | 350 | 357 |
| 5,7,8 Trillium Credit Card Trust II 2016-1A | 1.242% | 5/26/21 | 760 | 762 |
| 5,8 | Volkswagen Credit Auto Master Owner Trust | | | | |
| | 2014-1A | 1.400% | 7/22/19 | 300 | 300 |
| 5 | Wells Fargo Commercial Mortgage Trust | | | | |
| | 2012-LC5 | 3.539% | 10/15/45 | 40 | 43 |
| 5 | Wells Fargo Commercial Mortgage Trust | | | | |
| | 2013-LC12 | 4.218% | 7/15/46 | 350 | 393 |
| 5 | Wells Fargo Commercial Mortgage Trust | | | | |
| | 2013-LC12 | 4.432% | 7/15/46 | 450 | 499 |
| 5 | Wells Fargo Commercial Mortgage Trust | | | | |
| | 2015-C26 | 3.166% | 2/15/48 | 70 | 73 |
| 5 | Wells Fargo Commercial Mortgage Trust | | | | |
| | 2015-C27 | 3.190% | 2/15/48 | 350 | 369 |
| 5 | Wells Fargo Commercial Mortgage Trust | | | | |
| | 2015-C30 | 4.646% | 9/15/58 | 200 | 206 |
| 5 | Wells Fargo Commercial Mortgage Trust | | | | |
| | 2015-LC22 | 4.691% | 9/15/58 | 160 | 168 |
| 5,8 | Wendys Funding LLC 2015-1A | 3.371% | 6/15/45 | 228 | 229 |
| 5,8 | Wendys Funding LLC 2015-1A | 4.080% | 6/15/45 | 56 | 57 |
| 5,8 | Wendys Funding LLC 2015-1A | 4.497% | 6/15/45 | 50 | 50 |
| 8 | Westpac Banking Corp. | 2.250% | 11/9/20 | 365 | 373 |
| 5 | WFRBS Commercial Mortgage Trust 2014-C20 | 3.995% | 5/15/47 | 20 | 22 |
| 5 | WFRBS Commercial Mortgage Trust 2014-C21 | 3.678% | 8/15/47 | 350 | 381 |
| 5 | WFRBS Commercial Mortgage Trust 2014-C24 | 3.607% | 11/15/47 | 350 | 379 |
| 5 | WFRBS Commercial Mortgage Trust 2014-LC14 | 4.045% | 3/15/47 | 350 | 391 |
| 5 | World Financial Network Credit Card Master Note | | | | |
| | Trust Series 2012-D | 2.150% | 4/17/23 | 1,000 | 1,018 |
| 5 | World Financial Network Credit Card Master Note | | | | |
| | Trust Series 2015-B | 2.550% | 6/17/24 | 220 | 228 |
| 5 | World Financial Network Credit Card Master Note | | | | |
| | Trust Series 2016-A | 2.030% | 4/15/25 | 220 | 221 |
| 5 | World Omni Auto Receivables Trust 2015-B | 2.150% | 8/15/22 | 175 | 176 |
18
| | | | | |
| Core Bond Fund | | | | |
| |
| |
| |
| | | | | Face | Market |
| | | | Maturity | Amount | Value• |
| | | Coupon | Date | ($000) | ($000) |
| 5 | World Omni Auto Receivables Trust 2016-B | 1.300% | 2/15/22 | 100 | 100 |
| 5 | World Omni Automobile Lease Securitization | | | | |
| | Trust 2016-A | 1.610% | 1/15/22 | 575 | 574 |
| Total Asset-Backed/Commercial Mortgage-Backed Securities (Cost $78,501) | | 79,385 |
| Corporate Bonds (26.0%) | | | | |
| Finance (10.6%) | | | | |
| | Banking (4.7%) | | | | |
| 8 | ABN AMRO Bank NV | 4.750% | 7/28/25 | 150 | 158 |
| 8 | ABN AMRO Bank NV | 4.800% | 4/18/26 | 200 | 212 |
| 9 | Bank of America Corp. | 5.500% | 11/22/21 | 138 | 207 |
| | Bank of America Corp. | 3.300% | 1/11/23 | 546 | 566 |
| | Bank of America Corp. | 4.000% | 4/1/24 | 500 | 539 |
| | Bank of America Corp. | 3.875% | 8/1/25 | 400 | 428 |
| 8 | Bank of Tokyo-Mitsubishi UFJ Ltd. | 2.300% | 3/5/20 | 450 | 454 |
| 9 | BPCE SA | 5.250% | 4/16/29 | 100 | 149 |
| | Citigroup Inc. | 3.700% | 1/12/26 | 450 | 474 |
| | Citigroup Inc. | 4.450% | 9/29/27 | 1,000 | 1,043 |
| 8 | Commonwealth Bank of Australia | 2.000% | 9/6/21 | 490 | 489 |
| 8 | Commonwealth Bank of Australia | 4.500% | 12/9/25 | 200 | 213 |
| 8 | Commonwealth Bank of Australia | 2.850% | 5/18/26 | 215 | 217 |
| 10 | Coventry Building Society | 2.500% | 11/18/20 | 212 | 256 |
| 8 | Credit Suisse Group Funding Guernsey Ltd. | 3.800% | 6/9/23 | 410 | 415 |
| 8 | Danske Bank A/S | 2.000% | 9/8/21 | 660 | 658 |
| | Discover Financial Services | 5.200% | 4/27/22 | 370 | 407 |
| | First Republic Bank | 2.375% | 6/17/19 | 510 | 514 |
| 9 | Goldman Sachs Group Inc. | 6.125% | 5/14/17 | 100 | 133 |
| 9 | Goldman Sachs Group Inc. | 5.500% | 10/12/21 | 96 | 142 |
| 10 | Goldman Sachs Group Inc. | 2.125% | 9/30/24 | 77 | 94 |
| | Goldman Sachs Group Inc. | 3.750% | 5/22/25 | 1,050 | 1,103 |
| 9 | Goldman Sachs Group Inc. | 4.250% | 1/29/26 | 450 | 666 |
| | Goldman Sachs Group Inc. | 6.125% | 2/15/33 | 480 | 606 |
| | Goldman Sachs Group Inc. | 5.150% | 5/22/45 | 550 | 602 |
| 5,10 HBOS plc | 4.500% | 3/18/30 | 40 | 50 |
| | HSBC Holdings plc | 3.400% | 3/8/21 | 200 | 207 |
| | HSBC Holdings plc | 2.650% | 1/5/22 | 710 | 708 |
| | HSBC Holdings plc | 3.600% | 5/25/23 | 480 | 496 |
| | HSBC Holdings plc | 4.300% | 3/8/26 | 1,000 | 1,071 |
| | HSBC Holdings plc | 3.900% | 5/25/26 | 440 | 457 |
| | HSBC USA Inc. | 2.750% | 8/7/20 | 600 | 608 |
| | JPMorgan Chase & Co. | 2.400% | 6/7/21 | 250 | 253 |
| | JPMorgan Chase & Co. | 2.295% | 8/15/21 | 1,495 | 1,496 |
| | JPMorgan Chase & Co. | 2.700% | 5/18/23 | 182 | 184 |
| | JPMorgan Chase & Co. | 3.200% | 6/15/26 | 340 | 349 |
| | JPMorgan Chase & Co. | 5.500% | 10/15/40 | 216 | 275 |
| 10 | Leeds Building Society | 1.375% | 5/5/22 | 325 | 366 |
| | Lloyds Banking Group plc | 4.650% | 3/24/26 | 1,030 | 1,065 |
| 8 | Macquarie Bank Ltd. | 2.600% | 6/24/19 | 78 | 79 |
| | Mitsubishi UFJ Financial Group Inc. | 2.950% | 3/1/21 | 310 | 319 |
| | Mitsubishi UFJ Financial Group Inc. | 2.190% | 9/13/21 | 430 | 428 |
| 8 | Mitsubishi UFJ Trust & Banking Corp. | 2.450% | 10/16/19 | 285 | 289 |
| | Morgan Stanley | 3.875% | 1/27/26 | 1,420 | 1,509 |
| | Morgan Stanley | 3.125% | 7/27/26 | 675 | 679 |
| | MUFG Americas Holdings Corp. | 2.250% | 2/10/20 | 570 | 576 |
| 5,10 Nationwide Building Society | 4.125% | 3/20/23 | 200 | 234 |
19
| | | | | |
| Core Bond Fund | | | | |
| |
| |
| |
| | | | | Face | Market |
| | | | Maturity | Amount | Value• |
| | | Coupon | Date | ($000) | ($000) |
| 9 | Nationwide Building Society | 3.250% | 1/20/28 | 100 | 142 |
| | Royal Bank of Canada | 1.500% | 7/29/19 | 340 | 340 |
| 8 | Santander UK Group Holdings plc | 4.750% | 9/15/25 | 1,320 | 1,318 |
| 9 | Santander UK Group Holdings plc | 3.625% | 1/14/26 | 165 | 227 |
| | Skandinaviska Enskilda Banken AB | 1.875% | 9/13/21 | 580 | 575 |
| | Sumitomo Mitsui Financial Group Inc. | 2.058% | 7/14/21 | 335 | 332 |
| | Svenska Handelsbanken AB | 1.875% | 9/7/21 | 185 | 184 |
| | Synchrony Financial | 4.500% | 7/23/25 | 1,650 | 1,745 |
| | Synchrony Financial | 3.700% | 8/4/26 | 394 | 390 |
| | Toronto-Dominion Bank | 1.800% | 7/13/21 | 350 | 349 |
| | Wells Fargo & Co. | 2.600% | 7/22/20 | 210 | 214 |
| | Wells Fargo & Co. | 3.000% | 2/19/25 | 258 | 261 |
| | Wells Fargo & Co. | 5.375% | 2/7/35 | 150 | 185 |
| | Wells Fargo & Co. | 4.400% | 6/14/46 | 110 | 112 |
| | Westpac Banking Corp. | 2.000% | 8/19/21 | 590 | 590 |
| | Westpac Banking Corp. | 2.700% | 8/19/26 | 405 | 403 |
| 10 | Yorkshire Building Society | 1.250% | 3/17/22 | 690 | 779 |
| |
| | Brokerage (0.2%) | | | | |
| | Affiliated Managers Group Inc. | 4.250% | 2/15/24 | 250 | 262 |
| 8 | Apollo Management Holdings LP | 4.400% | 5/27/26 | 525 | 551 |
| | Invesco Finance plc | 4.000% | 1/30/24 | 180 | 198 |
| | Stifel Financial Corp. | 4.250% | 7/18/24 | 250 | 252 |
| |
| | Finance Companies (0.9%) | | | | |
| | AerCap Ireland Capital Ltd. / AerCap Global | | | | |
| | Aviation Trust | 3.750% | 5/15/19 | 150 | 153 |
| | AerCap Ireland Capital Ltd. / AerCap Global | | | | |
| | Aviation Trust | 3.950% | 2/1/22 | 150 | 154 |
| | Air Lease Corp. | 2.125% | 1/15/18 | 2,110 | 2,121 |
| | Air Lease Corp. | 3.375% | 1/15/19 | 1,824 | 1,874 |
| | GE Capital International Funding Co. | 4.418% | 11/15/35 | 100 | 113 |
| | International Lease Finance Corp. | 4.625% | 4/15/21 | 1,000 | 1,047 |
| 8 | SMBC Aviation Capital Finance DAC | 2.650% | 7/15/21 | 260 | 261 |
| |
| | Insurance (2.9%) | | | | |
| | Aetna Inc. | 2.400% | 6/15/21 | 75 | 76 |
| 8 | AIA Group Ltd. | 3.200% | 3/11/25 | 200 | 204 |
| 5,10 Allianz Finance II BV | 5.750% | 7/8/41 | 100 | 130 |
| | Allied World Assurance Co. Holdings Ltd. | 4.350% | 10/29/25 | 432 | 452 |
| | American Financial Group Inc. | 3.500% | 8/15/26 | 275 | 275 |
| | American International Group Inc. | 4.875% | 6/1/22 | 132 | 148 |
| | American International Group Inc. | 3.900% | 4/1/26 | 230 | 243 |
| | American International Group Inc. | 3.875% | 1/15/35 | 275 | 270 |
| | Aon plc | 3.500% | 6/14/24 | 500 | 519 |
| 5,10 Aquarius and Investments plc for Zurich | | | | |
| | Insurance Co. Ltd. | 4.250% | 10/2/43 | 260 | 325 |
| 5,10 AXA SA | 5.125% | 7/4/43 | 200 | 261 |
| | Berkshire Hathaway Inc. | 2.750% | 3/15/23 | 2,310 | 2,396 |
| 5 | Chubb Corp. | 6.375% | 3/29/67 | 10 | 9 |
| 5,9 | CNP Assurances | 7.375% | 9/30/41 | 100 | 146 |
| 5,10 Credit Agricole Assurances SA | 4.250% | 1/29/49 | 200 | 221 |
| 5,10 Credit Agricole Assurances SA | 4.500% | 10/31/49 | 200 | 222 |
| | First American Financial Corp. | 4.600% | 11/15/24 | 290 | 300 |
| 8 | Five Corners Funding Trust | 4.419% | 11/15/23 | 828 | 895 |
20
| | | | | |
| Core Bond Fund | | | | |
| |
| |
| |
| | | | | Face | Market |
| | | | Maturity | Amount | Value• |
| | | Coupon | Date | ($000) | ($000) |
| | Hanover Insurance Group Inc. | 4.500% | 4/15/26 | 100 | 104 |
| | Infinity Property & Casualty Corp. | 5.000% | 9/19/22 | 520 | 549 |
| 10 | Liberty Mutual Group Inc. | 2.750% | 5/4/26 | 100 | 121 |
| | Manulife Financial Corp. | 4.150% | 3/4/26 | 1,305 | 1,434 |
| | Marsh & McLennan Cos. Inc. | 2.350% | 9/10/19 | 180 | 183 |
| | Marsh & McLennan Cos. Inc. | 3.500% | 6/3/24 | 1,580 | 1,676 |
| | Marsh & McLennan Cos. Inc. | 3.500% | 3/10/25 | 900 | 942 |
| | MetLife Inc. | 4.050% | 3/1/45 | 105 | 104 |
| | Old Republic International Corp. | 3.875% | 8/26/26 | 370 | 370 |
| | Progressive Corp. | 2.450% | 1/15/27 | 460 | 458 |
| 5 | Progressive Corp. | 6.700% | 6/15/67 | 380 | 367 |
| | Prudential Financial Inc. | 4.500% | 11/15/20 | 20 | 22 |
| | Reinsurance Group of America Inc. | 4.700% | 9/15/23 | 170 | 186 |
| | Reinsurance Group of America Inc. | 3.950% | 9/15/26 | 2,095 | 2,174 |
| 8 | Reliance Standard Life Global Funding II | 2.375% | 5/4/20 | 240 | 243 |
| 8 | Swiss Re Treasury US Corp. | 2.875% | 12/6/22 | 130 | 133 |
| 8 | TIAA Asset Management Finance Co. LLC | 4.125% | 11/1/24 | 246 | 259 |
| 10 | Trinity Acquisition plc | 2.125% | 5/26/22 | 379 | 440 |
| | Trinity Acquisition plc | 4.625% | 8/15/23 | 350 | 373 |
| | Trinity Acquisition plc | 6.125% | 8/15/43 | 102 | 114 |
| | XLIT Ltd. | 6.375% | 11/15/24 | 948 | 1,126 |
| |
| | Real Estate Investment Trusts (1.9%) | | | | |
| | Alexandria Real Estate Equities Inc. | 3.950% | 1/15/27 | 345 | 361 |
| | Boston Properties LP | 2.750% | 10/1/26 | 95 | 94 |
| | Brandywine Operating Partnership LP | 3.950% | 2/15/23 | 113 | 116 |
| | Brandywine Operating Partnership LP | 4.100% | 10/1/24 | 294 | 303 |
| | Brandywine Operating Partnership LP | 4.550% | 10/1/29 | 1,213 | 1,269 |
| | Brixmor Operating Partnership LP | 3.850% | 2/1/25 | 60 | 61 |
| | Brixmor Operating Partnership LP | 4.125% | 6/15/26 | 825 | 854 |
| 8 | Care Capital Properties LP | 5.125% | 8/15/26 | 400 | 401 |
| | Columbia Property Trust Operating Partnership LP | 3.650% | 8/15/26 | 350 | 353 |
| 8 | Goodman Australia Industrial Fund Bond Issuer | | | | |
| | Pty Ltd. | 3.400% | 9/30/26 | 500 | 497 |
| | Healthcare Trust of America Holdings LP | 3.700% | 4/15/23 | 759 | 781 |
| | Healthcare Trust of America Holdings LP | 3.500% | 8/1/26 | 200 | 203 |
| | Kilroy Realty LP | 4.375% | 10/1/25 | 1,925 | 2,082 |
| | Liberty Property LP | 4.400% | 2/15/24 | 1,250 | 1,364 |
| | Mid-America Apartments LP | 4.000% | 11/15/25 | 380 | 406 |
| | Omega Healthcare Investors Inc. | 4.500% | 1/15/25 | 500 | 510 |
| | Omega Healthcare Investors Inc. | 5.250% | 1/15/26 | 1,275 | 1,364 |
| | Omega Healthcare Investors Inc. | 4.500% | 4/1/27 | 625 | 631 |
| | Ventas Realty LP | 3.250% | 10/15/26 | 150 | 152 |
| 9 | Welltower Inc. | 4.800% | 11/20/28 | 122 | 193 |
| | | | | | 68,040 |
| Industrial (12.9%) | | | | |
| | Basic Industry (0.6%) | | | | |
| | Agrium Inc. | 3.375% | 3/15/25 | 600 | 619 |
| | Agrium Inc. | 5.250% | 1/15/45 | 400 | 444 |
| 8 | Air Liquide Finance SA | 2.500% | 9/27/26 | 200 | 201 |
| 8 | Air Liquide Finance SA | 3.500% | 9/27/46 | 200 | 205 |
| | Barrick North America Finance LLC | 5.700% | 5/30/41 | 300 | 345 |
| | BHP Billiton Finance USA Ltd. | 2.050% | 9/30/18 | 300 | 303 |
| | Dow Chemical Co. | 8.550% | 5/15/19 | 187 | 219 |
| | Goldcorp Inc. | 3.700% | 3/15/23 | 300 | 311 |
21
| | | | |
| Core Bond Fund | | | | |
| |
| |
| |
| | | | Face | Market |
| | | Maturity | Amount | Value• |
| | Coupon | Date | ($000) | ($000) |
| International Paper Co. | 4.800% | 6/15/44 | 150 | 159 |
| International Paper Co. | 4.400% | 8/15/47 | 200 | 201 |
| LYB International Finance BV | 4.000% | 7/15/23 | 360 | 391 |
| Potash Corp. of Saskatchewan Inc. | 3.250% | 12/1/17 | 100 | 102 |
| Potash Corp. of Saskatchewan Inc. | 6.500% | 5/15/19 | 100 | 111 |
| Potash Corp. of Saskatchewan Inc. | 3.625% | 3/15/24 | 200 | 209 |
| Vale Overseas Ltd. | 5.625% | 9/15/19 | 30 | 32 |
| Vale Overseas Ltd. | 5.875% | 6/10/21 | 95 | 99 |
| |
| Capital Goods (0.8%) | | | | |
| Caterpillar Inc. | 4.300% | 5/15/44 | 365 | 408 |
| 8 CRH America Inc. | 5.125% | 5/18/45 | 300 | 337 |
| Embraer Netherlands Finance BV | 5.050% | 6/15/25 | 1,600 | 1,612 |
| General Electric Capital Corp. | 6.750% | 3/15/32 | 657 | 922 |
| General Electric Capital Corp. | 6.150% | 8/7/37 | 300 | 415 |
| John Deere Capital Corp. | 2.800% | 3/6/23 | 450 | 468 |
| 8 LafargeHolcim Finance US LLC | 4.750% | 9/22/46 | 450 | 463 |
| Spirit AeroSystems Inc. | 3.850% | 6/15/26 | 235 | 245 |
| |
| Communication (1.9%) | | | | |
| 21st Century Fox America Inc. | 3.000% | 9/15/22 | 120 | 125 |
| 21st Century Fox America Inc. | 4.950% | 10/15/45 | 120 | 136 |
| America Movil SAB de CV | 5.000% | 3/30/20 | 500 | 551 |
| America Movil SAB de CV | 6.375% | 3/1/35 | 300 | 364 |
| American Tower Corp. | 4.700% | 3/15/22 | 610 | 678 |
| American Tower Corp. | 3.375% | 10/15/26 | 400 | 406 |
| 9 AT&T Inc. | 5.875% | 4/28/17 | 100 | 133 |
| AT&T Inc. | 5.350% | 9/1/40 | 200 | 223 |
| AT&T Inc. | 4.800% | 6/15/44 | 600 | 631 |
| 8 Charter Communications Operating LLC / | | | | |
| Charter Communications Operating Capital | 4.908% | 7/23/25 | 120 | 132 |
| 8 Charter Communications Operating LLC / | | | | |
| Charter Communications Operating Capital | 6.384% | 10/23/35 | 200 | 235 |
| Crown Castle International Corp. | 2.250% | 9/1/21 | 1,000 | 998 |
| Deutsche Telekom International Finance BV | 8.750% | 6/15/30 | 250 | 390 |
| Electronic Arts Inc. | 4.800% | 3/1/26 | 120 | 132 |
| Grupo Televisa SAB | 6.125% | 1/31/46 | 600 | 667 |
| Moody’s Corp. | 5.250% | 7/15/44 | 460 | 568 |
| Orange SA | 5.375% | 1/13/42 | 160 | 192 |
| Time Warner Cable Inc. | 5.500% | 9/1/41 | 120 | 128 |
| Verizon Communications Inc. | 5.150% | 9/15/23 | 435 | 507 |
| Verizon Communications Inc. | 4.150% | 3/15/24 | 920 | 1,012 |
| Verizon Communications Inc. | 2.625% | 8/15/26 | 900 | 887 |
| Verizon Communications Inc. | 5.050% | 3/15/34 | 450 | 507 |
| Verizon Communications Inc. | 4.400% | 11/1/34 | 450 | 478 |
| Verizon Communications Inc. | 3.850% | 11/1/42 | 950 | 911 |
| Verizon Communications Inc. | 4.862% | 8/21/46 | 200 | 223 |
| Verizon Communications Inc. | 5.012% | 8/21/54 | 525 | 582 |
| Viacom Inc. | 3.450% | 10/4/26 | 100 | 100 |
| Viacom Inc. | 4.375% | 3/15/43 | 500 | 460 |
| |
| Consumer Cyclical (1.5%) | | | | |
| AutoZone Inc. | 3.125% | 4/21/26 | 250 | 256 |
| 8 BMW US Capital LLC | 2.000% | 4/11/21 | 170 | 170 |
| 8 BMW US Capital LLC | 2.800% | 4/11/26 | 175 | 178 |
22
| | | | | |
| Core Bond Fund | | | | |
| |
| |
| |
| | | | | Face | Market |
| | | | Maturity | Amount | Value• |
| | | Coupon | Date | ($000) | ($000) |
| | CVS Health Corp. | 2.800% | 7/20/20 | 10 | 10 |
| 10 | FCA Capital Ireland plc | 1.250% | 9/23/20 | 200 | 230 |
| | Ford Motor Co. | 4.750% | 1/15/43 | 420 | 434 |
| | Ford Motor Credit Co. LLC | 3.336% | 3/18/21 | 1,200 | 1,235 |
| | General Motors Co. | 4.000% | 4/1/25 | 240 | 246 |
| | General Motors Co. | 6.600% | 4/1/36 | 300 | 361 |
| | General Motors Financial Co. Inc. | 3.500% | 7/10/19 | 510 | 527 |
| | General Motors Financial Co. Inc. | 4.200% | 3/1/21 | 300 | 315 |
| | General Motors Financial Co. Inc. | 5.250% | 3/1/26 | 650 | 714 |
| 8 | Harley-Davidson Financial Services Inc. | 2.150% | 2/26/20 | 300 | 302 |
| | Kohl’s Corp. | 4.250% | 7/17/25 | 175 | 180 |
| | Kohl’s Corp. | 5.550% | 7/17/45 | 250 | 246 |
| | Lowe’s Cos. Inc. | 5.800% | 10/15/36 | 200 | 261 |
| | Lowe’s Cos. Inc. | 5.800% | 4/15/40 | 100 | 132 |
| | Lowe’s Cos. Inc. | 4.375% | 9/15/45 | 150 | 171 |
| | McDonald’s Corp. | 3.500% | 7/15/20 | 240 | 256 |
| | McDonald’s Corp. | 4.700% | 12/9/35 | 420 | 474 |
| | TJX Cos. Inc. | 2.750% | 6/15/21 | 20 | 21 |
| | Visa Inc. | 3.150% | 12/14/25 | 355 | 375 |
| | Visa Inc. | 4.150% | 12/14/35 | 240 | 272 |
| | Wal-Mart Stores Inc. | 2.550% | 4/11/23 | 300 | 312 |
| | Wal-Mart Stores Inc. | 5.250% | 9/1/35 | 480 | 638 |
| | Wal-Mart Stores Inc. | 5.625% | 4/1/40 | 210 | 284 |
| 9 | Walgreens Boots Alliance Inc. | 2.875% | 11/20/20 | 100 | 137 |
| | Walgreens Boots Alliance Inc. | 2.600% | 6/1/21 | 180 | 184 |
| | Walgreens Boots Alliance Inc. | 3.450% | 6/1/26 | 390 | 405 |
| | Walgreens Boots Alliance Inc. | 4.650% | 6/1/46 | 500 | 543 |
| |
| | Consumer Noncyclical (3.4%) | | | | |
| | AbbVie Inc. | 2.300% | 5/14/21 | 205 | 207 |
| | AbbVie Inc. | 3.600% | 5/14/25 | 1,225 | 1,282 |
| | AbbVie Inc. | 4.700% | 5/14/45 | 285 | 308 |
| | Actavis Funding SCS | 3.000% | 3/12/20 | 450 | 465 |
| | Actavis Funding SCS | 3.850% | 6/15/24 | 300 | 319 |
| | Actavis Funding SCS | 4.550% | 3/15/35 | 1,200 | 1,281 |
| | Actavis Funding SCS | 4.750% | 3/15/45 | 150 | 164 |
| | Altria Group Inc. | 5.375% | 1/31/44 | 225 | 285 |
| | Anheuser-Busch InBev Finance Inc. | 3.650% | 2/1/26 | 300 | 321 |
| | Anheuser-Busch InBev Finance Inc. | 4.700% | 2/1/36 | 750 | 864 |
| | Anheuser-Busch InBev Finance Inc. | 4.900% | 2/1/46 | 650 | 778 |
| 10 | Anheuser-Busch InBev SA/NV | 2.750% | 3/17/36 | 200 | 269 |
| 5,10 Bayer AG | 2.375% | 4/2/75 | 215 | 232 |
| | Biogen Inc. | 4.050% | 9/15/25 | 135 | 147 |
| | Biogen Inc. | 5.200% | 9/15/45 | 190 | 224 |
| 10 | Bunge Finance Europe BV | 1.850% | 6/16/23 | 700 | 830 |
| | Celgene Corp. | 5.250% | 8/15/43 | 300 | 342 |
| | ConAgra Foods Inc. | 3.250% | 9/15/22 | 500 | 520 |
| 10 | DH Europe Finance SA | 2.500% | 7/8/25 | 200 | 258 |
| | Express Scripts Holding Co. | 3.900% | 2/15/22 | 200 | 216 |
| | Express Scripts Holding Co. | 4.500% | 2/25/26 | 910 | 996 |
| | Express Scripts Holding Co. | 4.800% | 7/15/46 | 300 | 313 |
| | Gilead Sciences Inc. | 5.650% | 12/1/41 | 610 | 755 |
| | Gilead Sciences Inc. | 4.750% | 3/1/46 | 180 | 201 |
| 8 | Grupo Bimbo SAB de CV | 3.875% | 6/27/24 | 1,000 | 1,040 |
| 8 | Grupo Bimbo SAB de CV | 4.875% | 6/27/44 | 400 | 406 |
23
| | | | | |
| Core Bond Fund | | | | |
| |
| |
| |
| | | | | Face | Market |
| | | | Maturity | Amount | Value• |
| | | Coupon | Date | ($000) | ($000) |
| | JM Smucker Co. | 3.500% | 3/15/25 | 240 | 257 |
| | Kraft Heinz Foods Co. | 3.000% | 6/1/26 | 100 | 101 |
| 10 | Kraft Heinz Foods Co. | 2.250% | 5/25/28 | 300 | 365 |
| | Kraft Heinz Foods Co. | 4.375% | 6/1/46 | 100 | 106 |
| | Mead Johnson Nutrition Co. | 3.000% | 11/15/20 | 450 | 468 |
| | Mead Johnson Nutrition Co. | 4.600% | 6/1/44 | 300 | 321 |
| | Medtronic Inc. | 3.500% | 3/15/25 | 250 | 270 |
| | Medtronic Inc. | 4.375% | 3/15/35 | 150 | 170 |
| | Medtronic Inc. | 5.550% | 3/15/40 | 240 | 304 |
| 10 | Molson Coors Brewing Co. | 1.250% | 7/15/24 | 100 | 116 |
| | Mondelez International Inc. | 6.500% | 2/9/40 | 150 | 203 |
| 8 | Mylan NV | 3.950% | 6/15/26 | 500 | 504 |
| | Newell Brands Inc. | 5.500% | 4/1/46 | 180 | 219 |
| | Northwell Healthcare Inc. | 3.979% | 11/1/46 | 20 | 20 |
| | Perrigo Co. plc | 5.300% | 11/15/43 | 300 | 311 |
| | Quest Diagnostics Inc. | 3.450% | 6/1/26 | 100 | 104 |
| | Reynolds American Inc. | 4.450% | 6/12/25 | 150 | 167 |
| | Reynolds American Inc. | 5.700% | 8/15/35 | 400 | 496 |
| | Reynolds American Inc. | 7.250% | 6/15/37 | 300 | 412 |
| | Reynolds American Inc. | 5.850% | 8/15/45 | 150 | 195 |
| | Shire Acquisitions Investments Ireland DAC | 3.200% | 9/23/26 | 750 | 756 |
| | Stryker Corp. | 4.625% | 3/15/46 | 210 | 236 |
| | Teva Pharmaceutical Finance Co. LLC | 6.150% | 2/1/36 | 442 | 562 |
| 10 | Thermo Fisher Scientific Inc. | 2.000% | 4/15/25 | 200 | 244 |
| 10 | Thermo Fisher Scientific Inc. | 1.375% | 9/12/28 | 318 | 359 |
| | Tyson Foods Inc. | 4.875% | 8/15/34 | 150 | 166 |
| | Tyson Foods Inc. | 5.150% | 8/15/44 | 400 | 472 |
| 8 | Whole Foods Market Inc. | 5.200% | 12/3/25 | 815 | 883 |
| |
| | Energy (2.3%) | | | | |
| | Anadarko Petroleum Corp. | 3.450% | 7/15/24 | 550 | 545 |
| | Anadarko Petroleum Corp. | 5.550% | 3/15/26 | 250 | 284 |
| | Anadarko Petroleum Corp. | 6.600% | 3/15/46 | 600 | 734 |
| | Apache Corp. | 3.625% | 2/1/21 | 240 | 251 |
| | Apache Corp. | 5.100% | 9/1/40 | 100 | 104 |
| | BP Capital Markets plc | 2.112% | 9/16/21 | 200 | 201 |
| | BP Capital Markets plc | 3.245% | 5/6/22 | 300 | 316 |
| | BP Capital Markets plc | 2.750% | 5/10/23 | 450 | 458 |
| | BP Capital Markets plc | 3.506% | 3/17/25 | 300 | 318 |
| | Columbia Pipeline Group Inc. | 4.500% | 6/1/25 | 240 | 261 |
| | ConocoPhillips Co. | 4.200% | 3/15/21 | 300 | 324 |
| | ConocoPhillips Co. | 4.950% | 3/15/26 | 475 | 536 |
| | ConocoPhillips Co. | 5.950% | 3/15/46 | 180 | 228 |
| | Devon Energy Corp. | 4.000% | 7/15/21 | 200 | 209 |
| | Devon Energy Corp. | 3.250% | 5/15/22 | 300 | 298 |
| | Devon Energy Corp. | 5.850% | 12/15/25 | 800 | 908 |
| | Devon Energy Corp. | 5.000% | 6/15/45 | 325 | 316 |
| | Energy Transfer Partners LP | 6.700% | 7/1/18 | 230 | 247 |
| | Energy Transfer Partners LP | 9.700% | 3/15/19 | 260 | 298 |
| | Energy Transfer Partners LP | 5.200% | 2/1/22 | 642 | 696 |
| | Energy Transfer Partners LP | 4.750% | 1/15/26 | 500 | 517 |
| | EnLink Midstream Partners LP | 4.850% | 7/15/26 | 200 | 201 |
| | Enterprise Products Operating LLC | 6.650% | 10/15/34 | 180 | 216 |
| | EOG Resources Inc. | 2.625% | 3/15/23 | 180 | 180 |
| | EOG Resources Inc. | 3.900% | 4/1/35 | 120 | 119 |
24
| | | | | |
| Core Bond Fund | | | | |
| |
| |
| |
| | | | | Face | Market |
| | | | Maturity | Amount | Value• |
| | | Coupon | Date | ($000) | ($000) |
| | Marathon Oil Corp. | 3.850% | 6/1/25 | 200 | 191 |
| | Occidental Petroleum Corp. | 2.600% | 4/15/22 | 255 | 260 |
| | Occidental Petroleum Corp. | 4.400% | 4/15/46 | 100 | 110 |
| | Plains All American Pipeline LP / PAA Finance | | | | |
| | Corp. | 6.500% | 5/1/18 | 150 | 160 |
| | Schlumberger Investment SA | 3.650% | 12/1/23 | 450 | 486 |
| | Shell International Finance BV | 2.250% | 1/6/23 | 210 | 210 |
| | Shell International Finance BV | 2.875% | 5/10/26 | 500 | 508 |
| | Shell International Finance BV | 2.500% | 9/12/26 | 350 | 345 |
| | Shell International Finance BV | 3.625% | 8/21/42 | 150 | 145 |
| | Shell International Finance BV | 4.000% | 5/10/46 | 300 | 306 |
| | Spectra Energy Partners LP | 4.750% | 3/15/24 | 150 | 165 |
| | Spectra Energy Partners LP | 3.500% | 3/15/25 | 180 | 183 |
| | Sunoco Logistics Partners Operations LP | 3.450% | 1/15/23 | 350 | 349 |
| | Total Capital Canada Ltd. | 2.750% | 7/15/23 | 150 | 155 |
| | Total Capital International SA | 3.750% | 4/10/24 | 360 | 396 |
| | Transocean Inc. | 3.750% | 10/15/17 | 750 | 754 |
| | Williams Partners LP | 4.125% | 11/15/20 | 180 | 187 |
| | Williams Partners LP | 3.900% | 1/15/25 | 817 | 816 |
| | Williams Partners LP | 4.000% | 9/15/25 | 270 | 271 |
| |
| | Other Industrial (0.1%) | | | | |
| | CBRE Services Inc. | 4.875% | 3/1/26 | 500 | 524 |
| 10 | CK Hutchison Finance 16 Ltd. | 1.250% | 4/6/23 | 100 | 116 |
| 8 | CK Hutchison International 16 Ltd. | 2.750% | 10/3/26 | 240 | 237 |
| 10 | Kennedy Wilson Europe Real Estate plc | 3.250% | 11/12/25 | 100 | 118 |
| |
| | Technology (1.4%) | | | | |
| | Apple Inc. | 3.850% | 5/4/43 | 860 | 879 |
| | Apple Inc. | 3.450% | 2/9/45 | 170 | 163 |
| | Applied Materials Inc. | 5.100% | 10/1/35 | 125 | 146 |
| 8 | Diamond 1 Finance Corp. / Diamond 2 Finance | | | | |
| | Corp. | 4.420% | 6/15/21 | 530 | 554 |
| 8 | Diamond 1 Finance Corp. / Diamond 2 Finance | | | | |
| | Corp. | 5.875% | 6/15/21 | 95 | 101 |
| 8 | Diamond 1 Finance Corp. / Diamond 2 Finance | | | | |
| | Corp. | 5.450% | 6/15/23 | 490 | 525 |
| 8 | Diamond 1 Finance Corp. / Diamond 2 Finance | | | | |
| | Corp. | 7.125% | 6/15/24 | 95 | 105 |
| 8 | Diamond 1 Finance Corp. / Diamond 2 Finance | | | | |
| | Corp. | 6.020% | 6/15/26 | 410 | 448 |
| 8 | Diamond 1 Finance Corp. / Diamond 2 Finance | | | | |
| | Corp. | 8.100% | 7/15/36 | 450 | 530 |
| 8 | Diamond 1 Finance Corp. / Diamond 2 Finance | | | | |
| | Corp. | 8.350% | 7/15/46 | 50 | 60 |
| | EMC Corp. | 3.375% | 6/1/23 | 40 | 37 |
| | Equifax Inc. | 3.250% | 6/1/26 | 75 | 77 |
| | Fidelity National Information Services Inc. | 1.450% | 6/5/17 | 75 | 75 |
| | Fidelity National Information Services Inc. | 4.500% | 10/15/22 | 500 | 552 |
| | Fidelity National Information Services Inc. | 4.500% | 8/15/46 | 500 | 505 |
| 8 | Hewlett Packard Enterprise Co. | 4.900% | 10/15/25 | 500 | 533 |
| 8 | Hewlett Packard Enterprise Co. | 6.350% | 10/15/45 | 700 | 724 |
| | Lam Research Corp. | 3.450% | 6/15/23 | 1,000 | 1,023 |
| | Pitney Bowes Inc. | 3.375% | 10/1/21 | 145 | 145 |
| | Total System Services Inc. | 4.800% | 4/1/26 | 500 | 555 |
25
| | | | | |
| Core Bond Fund | | | | |
| |
| |
| |
| | | | | Face | Market |
| | | | Maturity | Amount | Value• |
| | | Coupon | Date | ($000) | ($000) |
| | Tyco Electronics Group SA | 4.875% | 1/15/21 | 65 | 72 |
| | Tyco Electronics Group SA | 3.500% | 2/3/22 | 90 | 94 |
| | Verisk Analytics Inc. | 5.800% | 5/1/21 | 84 | 96 |
| | Verisk Analytics Inc. | 4.000% | 6/15/25 | 300 | 319 |
| | Verisk Analytics Inc. | 5.500% | 6/15/45 | 525 | 565 |
| |
| | Transportation (0.9%) | | | | |
| | Burlington Northern Santa Fe LLC | 5.400% | 6/1/41 | 200 | 254 |
| 5,11 Delta Air Lines 2002-1 Class G-1 Pass Through | | | | |
| | Trust | 6.718% | 7/2/24 | 42 | 49 |
| 5 | Delta Air Lines 2007-1 Class A Pass Through Trust | 6.821% | 2/10/24 | 899 | 1,060 |
| 5 | Delta Air Lines 2007-1 Class B Pass Through Trust | 8.021% | 8/10/22 | 68 | 78 |
| 8 | ERAC USA Finance LLC | 7.000% | 10/15/37 | 250 | 341 |
| | Kansas City Southern | 3.125% | 6/1/26 | 230 | 233 |
| | Kansas City Southern | 4.300% | 5/15/43 | 650 | 674 |
| 5 | Southwest Airlines Co. 2007-1 Pass Through Trust | 6.650% | 8/1/22 | 89 | 99 |
| 5 | UAL 2007-1 Pass Through Trust | 6.636% | 7/2/22 | 1,698 | 1,804 |
| | Union Pacific Corp. | 4.821% | 2/1/44 | 200 | 242 |
| 5 | United Airlines 2014-2 Class B Pass Through Trust | 4.625% | 3/3/24 | 316 | 321 |
| 5 | US Airways 2001-1C Pass Through Trust | 7.346% | 9/20/23 | 49 | 55 |
| 8 | WestJet Airlines Ltd. | 3.500% | 6/16/21 | 320 | 329 |
| | | | | | 83,035 |
| Utilities (2.5%) | | | | |
| | Electric (2.1%) | | | | |
| | Arizona Public Service Co. | 2.550% | 9/15/26 | 165 | 166 |
| | Baltimore Gas & Electric Co. | 6.350% | 10/1/36 | 150 | 207 |
| 8 | Cleco Corporate Holdings LLC | 4.973% | 5/1/46 | 250 | 273 |
| | CMS Energy Corp. | 3.600% | 11/15/25 | 150 | 160 |
| | CMS Energy Corp. | 3.000% | 5/15/26 | 100 | 102 |
| | CMS Energy Corp. | 4.875% | 3/1/44 | 150 | 176 |
| | Commonwealth Edison Co. | 6.450% | 1/15/38 | 223 | 317 |
| | Commonwealth Edison Co. | 4.350% | 11/15/45 | 110 | 126 |
| 8 | EDP Finance BV | 4.125% | 1/15/20 | 1,200 | 1,243 |
| 8 | EDP Finance BV | 5.250% | 1/14/21 | 100 | 108 |
| 8 | Emera US Finance LP | 2.700% | 6/15/21 | 110 | 112 |
| 8 | Emera US Finance LP | 4.750% | 6/15/46 | 700 | 753 |
| | Entergy Louisiana LLC | 2.400% | 10/1/26 | 320 | 317 |
| | Entergy Louisiana LLC | 3.050% | 6/1/31 | 350 | 359 |
| | Entergy Louisiana LLC | 4.950% | 1/15/45 | 300 | 320 |
| | Entergy Mississippi Inc. | 2.850% | 6/1/28 | 590 | 602 |
| | Exelon Corp. | 3.950% | 6/15/25 | 250 | 271 |
| | FirstEnergy Corp. | 4.250% | 3/15/23 | 1,105 | 1,172 |
| 8 | Fortis Inc. | 3.055% | 10/4/26 | 725 | 722 |
| | Georgia Power Co. | 5.650% | 3/1/37 | 180 | 227 |
| | LG&E & KU Energy LLC | 4.375% | 10/1/21 | 150 | 165 |
| | MidAmerican Energy Co. | 5.800% | 10/15/36 | 230 | 303 |
| | MidAmerican Funding LLC | 6.927% | 3/1/29 | 100 | 140 |
| | Oncor Electric Delivery Co. LLC | 7.000% | 9/1/22 | 15 | 19 |
| | Oncor Electric Delivery Co. LLC | 7.250% | 1/15/33 | 290 | 421 |
| | Oncor Electric Delivery Co. LLC | 7.500% | 9/1/38 | 197 | 307 |
| | Pacific Gas & Electric Co. | 6.050% | 3/1/34 | 200 | 267 |
| | Pacific Gas & Electric Co. | 6.250% | 3/1/39 | 300 | 412 |
| | Pacific Gas & Electric Co. | 5.400% | 1/15/40 | 150 | 190 |
| | PacifiCorp | 5.250% | 6/15/35 | 275 | 339 |
| | PacifiCorp | 6.100% | 8/1/36 | 200 | 270 |
26
| | | | | |
| Core Bond Fund | | | | |
| |
| |
| |
| | | | | Face | Market |
| | | | Maturity | Amount | Value• |
| | | Coupon | Date | ($000) | ($000) |
| | PacifiCorp | 6.000% | 1/15/39 | 235 | 321 |
| | Puget Energy Inc. | 3.650% | 5/15/25 | 350 | 365 |
| | Puget Sound Energy Inc. | 6.274% | 3/15/37 | 100 | 137 |
| | Puget Sound Energy Inc. | 5.795% | 3/15/40 | 120 | 162 |
| | South Carolina Electric & Gas Co. | 6.050% | 1/15/38 | 100 | 132 |
| | South Carolina Electric & Gas Co. | 4.350% | 2/1/42 | 150 | 164 |
| 10 | Southern Power Co. | 1.000% | 6/20/22 | 300 | 344 |
| | Southwestern Electric Power Co. | 2.750% | 10/1/26 | 445 | 443 |
| | Southwestern Public Service Co. | 3.300% | 6/15/24 | 150 | 159 |
| | Southwestern Public Service Co. | 4.500% | 8/15/41 | 210 | 245 |
| | Westar Energy Inc. | 2.550% | 7/1/26 | 240 | 240 |
| |
| | Natural Gas (0.4%) | | | | |
| | CenterPoint Energy Resources Corp. | 5.850% | 1/15/41 | 955 | 1,156 |
| | Southern Co. Gas Capital Corp. | 2.450% | 10/1/23 | 75 | 75 |
| | Southern Co. Gas Capital Corp. | 3.950% | 10/1/46 | 200 | 202 |
| | Southwest Gas Corp. | 3.800% | 9/29/46 | 1,515 | 1,526 |
| | | | | | 16,237 |
| Total Corporate Bonds (Cost $163,401) | | | | 167,312 |
| Sovereign Bonds (U.S. Dollar-Denominated) (3.6%) | | | | |
| | BOC Aviation Ltd. | 3.875% | 5/9/19 | 200 | 209 |
| 8 | CDP Financial Inc. | 4.400% | 11/25/19 | 600 | 655 |
| | Corp. Andina de Fomento | 2.125% | 9/27/21 | 750 | 750 |
| 8 | Corp. Nacional del Cobre de Chile | 3.000% | 7/17/22 | 570 | 568 |
| 8 | CPPIB Capital Inc. | 1.250% | 9/20/19 | 200 | 200 |
| | Ecopetrol SA | 5.875% | 9/18/23 | 150 | 161 |
| | Electricite de France SA | 3.625% | 10/13/25 | 600 | 628 |
| | Export-Import Bank of Korea | 2.250% | 1/21/20 | 1,200 | 1,219 |
| | Export-Import Bank of Korea | 5.125% | 6/29/20 | 500 | 561 |
| 8 | ICBCIL Finance Co. Ltd. | 2.375% | 5/19/19 | 300 | 302 |
| | Nexen Energy ULC | 6.400% | 5/15/37 | 300 | 395 |
| 8 | NongHyup Bank | 1.875% | 9/12/21 | 500 | 497 |
| 5 | Oriental Republic of Uruguay | 5.100% | 6/18/50 | 200 | 207 |
| | Petrobras Global Finance BV | 4.875% | 3/17/20 | 130 | 130 |
| | Petrobras Global Finance BV | 7.250% | 3/17/44 | 200 | 182 |
| | Petrobras International Finance Co. SA | 7.875% | 3/15/19 | 418 | 450 |
| | Petrobras International Finance Co. SA | 5.375% | 1/27/21 | 110 | 109 |
| 8 | Petroleos Mexicanos | 5.500% | 2/4/19 | 600 | 633 |
| | Petroleos Mexicanos | 6.375% | 2/4/21 | 1,348 | 1,467 |
| | Petroleos Mexicanos | 6.875% | 8/4/26 | 480 | 540 |
| 8 | Province of Alberta | 2.050% | 8/17/26 | 500 | 496 |
| | Province of Ontario | 1.625% | 1/18/19 | 1,000 | 1,009 |
| | Province of Ontario | 2.000% | 1/30/19 | 500 | 508 |
| | Province of Ontario | 2.500% | 4/27/26 | 50 | 52 |
| | Quebec | 7.125% | 2/9/24 | 200 | 263 |
| | Quebec | 7.500% | 9/15/29 | 75 | 113 |
| | Republic of Colombia | 4.375% | 7/12/21 | 200 | 216 |
| | Republic of Colombia | 6.125% | 1/18/41 | 100 | 122 |
| | Republic of Hungary | 6.250% | 1/29/20 | 1,200 | 1,348 |
| 10 | Republic of Indonesia | 3.750% | 6/14/28 | 500 | 615 |
| | Republic of Indonesia | 5.125% | 1/15/45 | 600 | 682 |
| | Republic of Kazakhstan | 3.875% | 10/14/24 | 300 | 313 |
| 8 | Republic of Lithuania | 7.375% | 2/11/20 | 300 | 356 |
| | Republic of Lithuania | 7.375% | 2/11/20 | 300 | 356 |
27
| | | | | |
| Core Bond Fund | | | | |
| |
| |
| |
| | | | | Face | Market |
| | | | Maturity | Amount | Value• |
| | | Coupon | Date | ($000) | ($000) |
| | Republic of Lithuania | 6.125% | 3/9/21 | 365 | 431 |
| 5 | Republic of Panama | 4.000% | 9/22/24 | 600 | 656 |
| 5 | Republic of Panama | 6.700% | 1/26/36 | 200 | 274 |
| | Republic of Poland | 5.125% | 4/21/21 | 615 | 695 |
| | Republic of Poland | 5.000% | 3/23/22 | 70 | 80 |
| | Republic of South Africa | 5.000% | 10/12/46 | 230 | 231 |
| | Republic of Turkey | 5.125% | 3/25/22 | 800 | 833 |
| | Republic of Turkey | 7.375% | 2/5/25 | 175 | 207 |
| | Republic of Turkey | 4.875% | 4/16/43 | 950 | 884 |
| | State of Israel | 5.125% | 3/26/19 | 240 | 263 |
| | State of Israel | 4.500% | 1/30/43 | 200 | 228 |
| | Statoil ASA | 2.450% | 1/17/23 | 600 | 610 |
| | United Mexican States | 6.050% | 1/11/40 | 500 | 610 |
| | YPF SA | 8.875% | 12/19/18 | 600 | 665 |
| Total Sovereign Bonds (Cost $22,440) | | | | 22,979 |
| Taxable Municipal Bonds (0.3%) | | | | |
| | California GO | 7.550% | 4/1/39 | 500 | 799 |
| | Illinois GO | 5.100% | 6/1/33 | 900 | 866 |
| Total Taxable Municipal Bonds (Cost $1,616) | | | | 1,665 |
| |
| | | | | Shares | |
| Temporary Cash Investment (6.4%) | | | | |
| Money Market Fund (6.4%) | | | | |
| 12 | Vanguard Market Liquidity Fund (Cost $40,818) | 0.640% | | 408,165 | 40,820 |
| Total Investments (107.4%) (Cost $682,125) | | | | 690,171 |
| |
| | | | Expiration Date | Contracts | |
| Liability for Options Written (0.0%) | | | | |
| | Call Options on 10-year U.S. Treaury Note | | | | |
| | Futures Contracts, Strike Price $133.00 | | 11/25/16 | 15 | (4) |
| | Put Options on 10-year U.S. Treasury Note | | | | |
| | Futures Contracts, Strike Price $129.00 | | 11/25/16 | 15 | (4) |
| Total Liability for Options Written (Premiums Received $9) | | | (8) |
| |
| | | | | | Amount |
| | | | | | ($000) |
| Other Assets and Liabilities (-7.4%) | | | | |
| Other Assets | | | | 60,134 |
| Other Liabilities | | | | (107,403) |
| | | | | | (47,269) |
| Net Assets (100%) | | | | 642,894 |
28
| |
| Core Bond Fund | |
| |
| |
| |
| |
| | Amount |
| | ($000) |
| Statement of Assets and Liabilities | |
| Assets | |
| Investments in Securities, at Value | |
| Unaffiliated Issuers | 649,351 |
| Affiliated Vanguard Funds | 40,820 |
| Total Investments in Securities | 690,171 |
| Investment in Vanguard | 49 |
| Receivables for Investment Securities Sold | 55,151 |
| Receivables for Accrued Income | 3,201 |
| Receivables for Capital Shares Issued | 981 |
| Other Assets | 752 |
| Total Assets | 750,305 |
| Liabilities | |
| Payables for Investment Securities Purchased | 105,790 |
| Payables for Capital Shares Redeemed | 561 |
| Payables for Distributions | 152 |
| Payables to Vanguard | 75 |
| Option Contracts Written | 8 |
| Other Liabilities | 825 |
| Total Liabilities | 107,411 |
| Net Assets | 642,894 |
| |
| |
| At September 30, 2016, net assets consisted of: | |
| | Amount |
| | ($000) |
| Paid-in Capital | 631,187 |
| Undistributed Net Investment Income | 66 |
| Accumulated Net Realized Gains | 3,678 |
| Unrealized Appreciation (Depreciation) | |
| Investment Securities | 8,046 |
| Futures Contracts | (167) |
| Options on Futures Contracts | 1 |
| Swap Contracts | (10) |
| Forward Currency Contracts | 94 |
| Foreign Currencies | (1) |
| Net Assets | 642,894 |
| |
| |
| Investor Shares—Net Assets | |
| Applicable to 6,315,897 outstanding $.001 par value shares of | |
| beneficial interest (unlimited authorization) | 64,831 |
| Net Asset Value Per Share—Investor Shares | $10.26 |
29
| |
| Core Bond Fund | |
| |
| |
| |
| | Amount |
| | ($000) |
| Admiral Shares—Net Assets | |
| Applicable to 28,158,844 outstanding $.001 par value shares of | |
| beneficial interest (unlimited authorization) | 578,063 |
| Net Asset Value Per Share—Admiral Shares | $20.53 |
• See Note A in Notes to Financial Statements. † U.S. government-guaranteed.
1 Securities with a value of $465,000 have been segregated as initial margin for open cleared swap contracts. 2 Securities with a value of $1,037,000 have been segregated as initial margin for open futures contracts.
3 The issuer operates under a congressional charter; its securities are generally neither guaranteed by the U.S. Treasury nor backed by the full faith and credit of the U.S. government.
4 The issuer was placed under federal conservatorship in September 2008; since that time, its daily operations have been managed by the Federal Housing Finance Agency and it receives capital from the U.S. Treasury, as needed to maintain a positive net worth, in exchange for senior preferred stock.
5 The average or expected maturity is shorter than the final maturity shown because of the possibility of interim principal payments and prepayments or the possibility of the issue being called.
6 Includes securities purchased on a when-issued or delayed-delivery basis for which the fund has not taken delivery as of September 30, 2016.
7 Adjustable-rate security.
8 Security exempt from registration under Rule 144A of the Securities Act of 1933. Such securities may be sold in transactions exempt from registration, normally to qualified institutional buyers. At September 30, 2016, the aggregate value of these securities was $57,890,000, representing 9.0% of net assets.
9 Face amount denominated in British pounds. 10 Face amount denominated in euro.
11 Scheduled principal and interest payments are guaranteed by Municipal Bond Insurance Association.
12 Affiliated money market fund available only to Vanguard funds and certain trusts and accounts managed by Vanguard. Rate shown is the 7-day yield.
GO—General Obligation Bond.
See accompanying Notes, which are an integral part of the Financial Statements.
30
| |
| Core Bond Fund | |
| |
| |
| Statement of Operations | |
| |
| | March 10, 20161 to |
| | September 30, 2016 |
| | ($000) |
| Investment Income | |
| Income | |
| Interest2 | 5,925 |
| Total Income | 5,925 |
| Expenses | |
| The Vanguard Group—Note B | |
| Investment Advisory Services | 31 |
| Management and Administrative—Investor Shares | 52 |
| Management and Administrative—Admiral Shares | 252 |
| Marketing and Distribution—Investor Shares | 6 |
| Marketing and Distribution—Admiral Shares | 25 |
| Custodian Fees | 11 |
| Auditing Fees | 41 |
| Shareholders’ Reports—Investor Shares | 4 |
| Shareholders’ Reports—Admiral Shares | 3 |
| Total Expenses | 425 |
| Net Investment Income | 5,500 |
| Realized Net Gain (Loss) | |
| Investment Securities Sold2 | 4,501 |
| Futures Contracts | (678) |
| Swap Contracts | 76 |
| Foreign Currencies and Forward Currency Contracts | 24 |
| Realized Net Gain (Loss) | 3,923 |
| Change in Unrealized Appreciation (Depreciation) | |
| Investment Securities | 8,046 |
| Futures Contracts | (167) |
| Options on Futures Contracts | 1 |
| Swap Contracts | (10) |
| Foreign Currencies and Forward Currency Contracts | 93 |
| Change in Unrealized Appreciation (Depreciation) | 7,963 |
| Net Increase (Decrease) in Net Assets Resulting from Operations | 17,386 |
1 Commencement of subscription period for the fund.
2 Interest income and realized net gain (loss) from an affiliated company of the fund was $162,000 and $0, respectively.
See accompanying Notes, which are an integral part of the Financial Statements.
31
| |
| Core Bond Fund | |
| |
| |
| Statement of Changes in Net Assets | |
| |
| | March 10, 20161 to |
| | September 30, 2016 |
| | ($000) |
| Increase (Decrease) in Net Assets | |
| Operations | |
| Net Investment Income | 5,500 |
| Realized Net Gain (Loss) | 3,923 |
| Change in Unrealized Appreciation (Depreciation) | 7,963 |
| Net Increase (Decrease) in Net Assets Resulting from Operations | 17,386 |
| Distributions | |
| Net Investment Income | |
| Investor Shares | (546) |
| Admiral Shares | (4,920) |
| Realized Capital Gain | |
| Investor Shares | — |
| Admiral Shares | — |
| Total Distributions | (5,466) |
| Capital Share Transactions | |
| Investor Shares | 63,514 |
| Admiral Shares | 567,460 |
| Net Increase (Decrease) from Capital Share Transactions | 630,974 |
| Total Increase (Decrease) | 642,894 |
| Net Assets | |
| Beginning of Period | — |
| End of Period2 | 642,894 |
| 1 Commencement of subscription period for the fund. | |
| 2 Net Assets—End of Period includes undistributed (overdistributed) net investment income of $66,000. | |
See accompanying Notes, which are an integral part of the Financial Statements.
32
| |
| Core Bond Fund | |
| |
| |
| Financial Highlights | |
| |
| |
| Investor Shares | |
| | March 10, |
| | 20161 to |
| | September 30, |
| For a Share Outstanding Throughout the Period | 2016 |
| Net Asset Value, Beginning of Period | $10.00 |
| Investment Operations | |
| Net Investment Income | .097 |
| Net Realized and Unrealized Gain (Loss) on Investments | .259 |
| Total from Investment Operations | .356 |
| Distributions | |
| Dividends from Net Investment Income | (.096) |
| Distributions from Realized Capital Gains | — |
| Total Distributions | (. 096) |
| Net Asset Value, End of Period | $10.26 |
| |
| Total Return2 | 3.57% |
| |
| Ratios/Supplemental Data | |
| Net Assets, End of Period (Millions) | $65 |
| Ratio of Total Expenses to Average Net Assets | 0.25% |
| Ratio of Net Investment Income to Average Net Assets | 2.00% |
| Portfolio Turnover Rate | 229%3 |
1 Subscription period for the fund was March 10, 2016, to March 24, 2016, during which time all assets were held in money market instruments. Performance measurement began March 28, 2016, the first business day after the subscription period, at a net asset value of $10.00.
2 Total returns do not include account service fees that may have applied in the periods shown. Fund prospectuses provide information about any applicable account service fees.
3 Includes 58% attributed to mortgage-dollar-roll activity.
See accompanying Notes, which are an integral part of the Financial Statements.
33
| |
| Core Bond Fund | |
| |
| |
| Financial Highlights | |
| |
| |
| Admiral Shares | |
| | March 10, |
| | 20161 to |
| | September 30, |
| For a Share Outstanding Throughout the Period | 2016 |
| Net Asset Value, Beginning of Period | $20.00 |
| Investment Operations | |
| Net Investment Income | .205 |
| Net Realized and Unrealized Gain (Loss) on Investments | .528 |
| Total from Investment Operations | .733 |
| Distributions | |
| Dividends from Net Investment Income | (.203) |
| Distributions from Realized Capital Gains | — |
| Total Distributions | (. 203) |
| Net Asset Value, End of Period | $20.53 |
| |
| Total Return2 | 3.67% |
| |
| Ratios/Supplemental Data | |
| Net Assets, End of Period (Millions) | $578 |
| Ratio of Total Expenses to Average Net Assets | 0.15% |
| Ratio of Net Investment Income to Average Net Assets | 2.10% |
| Portfolio Turnover Rate | 229%3 |
1 Subscription period for the fund was March 10, 2016, to March 24, 2016, during which time all assets were held in money market instruments. Performance measurement began March 28, 2016, the first business day after the subscription period, at a net asset value of $20.00.
2 Total returns do not include account service fees that may have applied in the periods shown. Fund prospectuses provide information about any applicable account service fees.
3 Includes 58% attibuted to mortgage-dollar-roll activity.
See accompanying Notes, which are an integral part of the Financial Statements.
34
Core Bond Fund
Notes to Financial Statements
Vanguard Core Bond Fund is registered under the Investment Company Act of 1940 as an open-end investment company, or mutual fund. Certain of the fund’s investments are in corporate debt instruments; the issuers’ abilities to meet their obligations may be affected by economic developments in their respective industries. The fund invests in securities of foreign issuers, which may subject it to investment risks not normally associated with investing in securities of U.S. corporations. To minimize the currency risk associated with investment in bonds denominated in currencies other than the U.S. dollar, the fund attempts to hedge its currency exposures. The fund offers two classes of shares: Investor Shares and Admiral Shares. Investor Shares are available to any investor who meets the fund’s minimum purchase requirements. Admiral Shares are designed for investors who meet certain administrative, service, and account-size criteria.
A. The following significant accounting policies conform to generally accepted accounting principles for U.S. investment companies. The fund consistently follows such policies in preparing its financial statements.
1. Security Valuation: Securities are valued as of the close of trading on the New York Stock Exchange (generally 4 p.m., Eastern time) on the valuation date. Bonds and temporary cash investments acquired over 60 days to maturity are valued using the latest bid prices or using valuations based on a matrix system (which considers such factors as security prices, yields, maturities, and ratings), both as furnished by independent pricing services. Structured debt securities, including mortgages and asset-backed securities, are valued using the latest bid prices or using valuations based on a matrix system that considers such factors as issuer, tranche, nominal or option-adjusted spreads, weighted average coupon, weighted average maturity, credit enhancements, and collateral. Investments in Vanguard Market Liquidity Fund are valued at that fund’s net asset value. Other temporary cash investments are valued at amortized cost, which approximates market value. Securities for which market quotations are not readily available, or whose values have been affected by events occurring before the fund’s pricing time but after the close of the securities’ primary markets, are valued at their fair values calculated according to procedures adopted by the board of trustees. These procedures include obtaining quotations from an independent pricing service, monitoring news to identify significant market- or security-specific events, and evaluating changes in the values of foreign market proxies (for example, ADRs, futures contracts, or exchange-traded funds), between the time the foreign markets close and the fund’s pricing time. When fair-value pricing is employed, the prices of securities used by a fund to calculate its net asset value may differ from quoted or published prices for the same securities.
2. Foreign Currency: Securities and other assets and liabilities denominated in foreign currencies are translated into U.S. dollars using exchange rates obtained from an independent third party as of the fund’s pricing time on the valuation date. Realized gains (losses) and unrealized appreciation (depreciation) on investment securities include the effects of changes in exchange rates since the securities were purchased, combined with the effects of changes in security prices. Fluctuations in the value of other assets and liabilities resulting from changes in exchange rates are recorded as unrealized foreign currency gains (losses) until the assets or liabilities are settled in cash, at which time they are recorded as realized foreign currency gains (losses).
3. Futures Contracts: The fund uses futures contracts to invest in fixed income asset classes with greater efficiency and lower cost than is possible through direct investment, to add value when these instruments are attractively priced, or to adjust sensitivity to changes in interest rates. The primary risks associated with the use of futures contracts are imperfect correlation between changes in market values of bonds held by the fund and the prices of futures contracts, and the possibility
35
Core Bond Fund
of an illiquid market. Counterparty risk involving futures is mitigated because a regulated clearing-house is the counterparty instead of the clearing broker. To further mitigate counterparty risk, the fund trades futures contracts on an exchange, monitors the financial strength of its clearing brokers and clearinghouse, and has entered into clearing agreements with its clearing brokers. The clearinghouse imposes initial margin requirements to secure the fund’s performance and requires daily settlement of variation margin representing changes in the market value of each contract.
Futures contracts are valued at their quoted daily settlement prices. The aggregate settlement values of the contracts are not recorded in the Statement of Assets and Liabilities. Fluctuations in the value of the contracts are recorded in the Statement of Assets and Liabilities as an asset (liability) and in the Statement of Operations as unrealized appreciation (depreciation) until the contracts are closed, when they are recorded as realized futures gains (losses).
During the period ended September 30, 2016, the fund’s average investments in long and short futures contracts represented 11% and 6% of net assets, respectively, based on the average of aggregate settlement values at each quarter-end during the period.
4. Forward Currency Contracts: The fund enters into forward currency contracts to protect the value of securities and related receivables and payables against changes in future foreign exchange rates. The fund’s risks in using these contracts include movement in the values of the foreign currencies relative to the U.S. dollar and the ability of the counterparties to fulfill their obligations under the contracts. The fund mitigates its counterparty risk by entering into forward currency contracts only with a diverse group of prequalified counterparties, monitoring their financial strength, entering into master netting arrangements with its counterparties, and requiring its counterparties to transfer collateral as security for their performance. In the absence of a default, the collateral pledged or received by the fund cannot be repledged, resold or rehypothecated. The master netting arrangements provide that, in the event of a counterparty’s default (including bankruptcy), the fund may terminate the forward currency contracts, determine the net amount owed by either party in accordance with its master netting arrangements, and sell or retain any collateral held up to the net amount owed to the fund under the master netting arrangements. The forward currency contracts contain provisions whereby a counterparty may terminate open contracts if the fund’s net assets decline below a certain level, triggering a payment by the fund if the fund is in a net liability position at the time of the termination. The payment amount would be reduced by any collateral the fund has pledged. Any assets pledged as collateral for open contracts are noted in the Statement of Assets and Liabilities. The value of collateral received or pledged is compared daily to the value of the forward currency contracts exposure with each counterparty, and any difference, if in excess of a specified minimum transfer amount, is adjusted and settled within two business days.
Forward currency contracts are valued at their quoted daily prices obtained from an independent third party, adjusted for currency risk based on the expiration date of each contract. The notional amounts of the contracts are not recorded in the Statement of Assets and Liabilities. Fluctuations in the value of the contracts are recorded in the Statement of Assets and Liabilities as an asset (liability) and in the Statement of Operations as unrealized appreciation (depreciation) until the contracts are closed, when they are recorded as realized forward currency contract gains (losses).
During the period ended September 30, 2016, the fund’s average investment in forward currency contracts represented 3% of net assets, based on the average of notional amounts at each quarter-end during the period.
36
Core Bond Fund
5. Swap Contracts: The fund invests in credit default swaps to adjust the overall credit risk of the fund or to actively overweight or underweight credit risk to a specific issuer or group of issuers. The fund may sell credit protection through credit default swaps to simulate investments in long positions that are either unavailable or considered to be less attractively priced in the bond market. The fund may purchase credit protection through credit default swaps to reduce credit exposure to a given issuer or issuers. Under the terms of the swaps, an up-front payment may be exchanged between the seller and buyer. In addition, the seller of the credit protection receives a periodic payment of premium from the buyer that is a fixed percentage applied to a notional amount. If, for example, the reference entity is subject to a credit event (such as bankruptcy, failure to pay, or obligation acceleration) during the term of the swap, the seller agrees to either physically settle or cash settle the swap contract. If the swap is physically settled, the seller agrees to pay the buyer an amount equal to the notional amount and take delivery of a debt instrument of the reference issuer with a par amount equal to such notional amount. If the swap is cash settled, the seller agrees to pay the buyer the difference between the notional amount and the final price for the relevant debt instrument, as determined either in a market auction or pursuant to a pre-agreed-upon valuation procedure.
The fund enters into interest rate swap transactions to adjust the fund’s sensitivity to changes in interest rates and maintain the ability to generate income at prevailing market rates. Under the terms of the swaps, one party pays the other an amount that is a fixed percentage rate applied to a notional amount. In return, the counterparty agrees to pay a floating rate, which is reset periodically based on short-term interest rates, applied to the same notional amount.
The notional amounts of swap contracts are not recorded in the Statement of Assets and Liabilities. Swaps are valued daily based on market quotations received from independent pricing services or recognized dealers and the change in value is recorded in the Statement of Assets and Liabilities as an asset (liability) and in the Statement of Operations as unrealized appreciation (depreciation) until the seller of credit protection is required to take delivery (or, in a cash settled swap, pay the settlement amount determined) upon occurrence of a credit event, periodic payments are made, or the swap terminates, at which time realized gain (loss) is recorded. The net premium to be received or paid by the fund under swap contracts is accrued daily and recorded as realized gain (loss) over the life of the contract.
The primary risk associated with selling credit protection is that, upon the occurrence of a defined credit event, the market value of the debt instrument received by the fund (or, in a cash settled swap, the debt instruments used to determine the settlement payment by the fund) will be significantly less than the amount paid by the fund and, in a physically settled swap, the fund may receive an illiquid debt instrument. A risk associated with all types of swaps is the possibility that a counterparty may default on its obligation to pay net amounts due to the fund. The fund’s maximum amount subject to counterparty risk is the unrealized appreciation on the swap contract. The fund mitigates its counterparty risk by entering into swaps only with a diverse group of prequalified counterparties, monitoring their financial strength, entering into master netting arrangements with its counterparties, and requiring its counterparties to transfer collateral as security for their performance. In the absence of a default, the collateral pledged or received by the fund cannot be repledged, resold or rehypoth-ecated. In the event of a counterparty’s default (including bankruptcy), the fund may terminate any swap contracts with that counterparty, determine the net amount owed by either party in accordance with its master netting arrangements, and sell or retain any collateral held up to the net amount owed to the fund under the master netting arrangements. The swap contracts contain provisions whereby a counterparty may terminate open contracts if the fund’s net assets decline below a certain level, triggering a payment by the fund if the fund is in a net liability position at the time of the termination.
37
Core Bond Fund
The payment amount would be reduced by any collateral the fund has pledged. Any securities pledged as collateral for open contracts are noted in the Statement of Net Assets. The value of collateral received or pledged is compared daily to the value of the swap contracts exposure with each counterparty, and any difference, if in excess of a specified minimum transfer amount, is adjusted and settled within two business days.
The fund enters into centrally cleared interest rate and credit default swaps to achieve the same objectives specified with respect to the equivalent over-the-counter swaps but with less counterparty risk because a regulated clearinghouse is the counterparty instead of the clearing broker or executing broker. The clearinghouse imposes initial margin requirements to secure the fund’s performance, and requires daily settlement of variation margin representing changes in the market value of each contract. To further mitigate counterparty risk, the fund trades with a diverse group of prequalified executing brokers; monitors the financial strength of its clearing brokers, executing brokers, and clearinghouse; and has entered into agreements with its clearing brokers and executing brokers.
During the period ended September 30, 2016, the fund’s average amounts of investments in credit protection sold and credit protection purchased represented less than 1% and 2% of net assets, respectively, based on the average of notional amounts at each quarter-end during the period. The average amount of investments in interest rate swaps represented 2% of net assets, based on the average of notional amounts at each quarter-end during the period.
6. Options: The fund invests in options contracts on futures and swaps to adjust its exposure to the underlying investments. The primary risk associated with purchasing options is that the value of the underlying investments may move in such a way that the option is out-of-the-money (the exercise price of the option exceeds the value of the underlying investment), the position is worthless at expiration, and the fund loses the premium paid. The primary risk associated with selling options is that the value of the underlying investments may move in such a way that the option is in-the-money (the exercise price of the option exceeds the value of the underlying investment), the counterparty exercises the option, and the fund loses an amount equal to the market value of the option written less the premium received.
The fund invests in options on futures, which are exchange-traded. Counterparty risk involving exchange-traded options on futures is mitigated because a regulated clearinghouse is the counterparty instead of the clearing broker. To further mitigate counterparty risk, the fund trades options on futures on an exchange, monitors the financial strength of its clearing brokers and clearinghouses, and has entered into clearing agreements with its clearing brokers.
The fund invests in options on swaps (swaptions), which are transacted over-the-counter (OTC) and not on an exchange. A receiver swaption gives the owner the right to receive the total return of a specified asset, reference rate, or index. A payer swaption gives the owner the right to pay the total return of a specified asset, reference rate, or index. Swaptions also include options that allow an existing swap to be terminated or extended by one of the counterparties. Unlike exchange-traded options, which are standardized with respect to the underlying instrument, expiration date, contract size, and strike price, the terms of OTC options generally are established through negotiation with the other party to the option contract. Although this type of arrangement allows the purchaser or writer greater flexibility to tailor an option to its needs, OTC options generally involve greater credit risk than exchange-traded options. Credit risk involves the possibility that a counterparty may default on its obligation to pay net amounts due to the fund. The fund mitigates its counterparty risk by entering into swaptions with a diverse group of prequalified counterparties and monitoring their financial strength.
38
Core Bond Fund
Options on futures contracts are valued at their quoted daily settlement prices. Swaptions are valued daily based on market quotations received from independent pricing services or recognized dealers. The premium paid for a purchased option is recorded in the Statement of Assets and Liabilities as an asset that is subsequently adjusted daily to the current market value of the option purchased. The premium received for a written option is recorded in the Statement of Assets and Liabilities as an asset with an equal liability that is subsequently adjusted daily to the current market value of the option written. Fluctuations in the value of the options are recorded in the Statement of Operations as unrealized appreciation (depreciation) until expired, closed, or exercised, at which time realized gains (losses) are recognized.
During the period ended September 30, 2016, the fund’s average value of options purchased and options written represented less than 1% of net assets, respectively, based on the average market values at each quarter-end during the period.
7. To Be Announced (TBA) Transactions: A TBA transaction is an agreement to buy or sell mortgage-backed securities with agreed-upon characteristics (face amount, coupon, maturity) for settlement at a future date. The fund may be a seller of TBA transactions to reduce its exposure to the mortgage-backed securities market or in order to sell mortgage-backed securities it owns under delayed-delivery arrangements. When the fund is a buyer of TBA transactions, it maintains cash or short-term investments in an amount sufficient to meet the purchase price at the settlement date of the TBA transaction. The primary risk associated with TBA transactions is that a counterparty may default on its obligations. The fund mitigates its counterparty risk by, among other things, performing a credit analysis of counterparties, allocating transactions among numerous counterparties, and monitoring its exposure to each counterparty. The fund may also enter into a Master Securities Forward Transaction Agreement (MSFTA) with certain counterparties and require them to transfer collateral as security for their performance. In the absence of a default, the collateral pledged or received by the fund cannot be repledged, resold or rehypothecated. Under an MSFTA, upon a counterparty default (including bankruptcy), the fund may terminate any TBA transactions with that counterparty, determine the net amount owed by either party in accordance with its master netting arrangements, and sell or retain any collateral held up to the net amount owed to the fund under the master netting arrangements.
8. Mortgage Dollar Rolls: The fund enters into mortgage-dollar-roll transactions, in which the fund sells mortgage-backed securities to a dealer and simultaneously agrees to purchase similar securities in the future at a predetermined price. The proceeds of the securities sold in mortgage-dollar-roll transactions are typically invested in high-quality short-term fixed income securities. The fund forgoes principal and interest paid on the securities sold, and is compensated by interest earned on the proceeds of the sale and by a lower price on the securities to be repurchased. The fund has also entered into mortgage-dollar-roll transactions in which the fund buys mortgage-backed securities from a dealer pursuant to a TBA transaction and simultaneously agrees to sell similar securities in the future at a predetermined price. The securities bought in mortgage-dollar-roll transactions are used to cover an open TBA sell position. The fund continues to earn interest on mortgage-backed security pools already held and receives a lower price on the securities to be sold in the future. The fund accounts for mortgage-dollar-roll transactions as purchases and sales; as such, these transactions may increase the fund’s portfolio turnover rate. Amounts to be received or paid in connection with open mortgage dollar rolls are included in Receivables for Investment Securities Sold or Payables for Investment Securities Purchased in the Statement of Assets and Liabilities.
39
Core Bond Fund
9. Federal Income Taxes: The fund intends to qualify as a regulated investment company and distribute all of its taxable income. Management has analyzed the fund’s tax positions taken for its open federal income tax period ended September 30, 2016, and has concluded that no provision for federal income tax is required in the fund’s financial statements.
10. Distributions: Distributions to shareholders are recorded on the ex-dividend date.
11. Credit Facility: The fund and certain other funds managed by The Vanguard Group (“Vanguard”) participate in a $3.1 billion committed credit facility provided by a syndicate of lenders pursuant to a credit agreement that may be renewed annually; each fund is individually liable for its borrowings, if any, under the credit facility. Borrowings may be utilized for temporary and emergency purposes, and are subject to the fund’s regulatory and contractual borrowing restrictions. The participating funds are charged administrative fees and an annual commitment fee of 0.10% of the undrawn amount of the facility; these fees are allocated to the funds based on a method approved by the fund’s board of trustees and included in Management and Administrative expenses on the fund’s Statement of Operations. Any borrowings under this facility bear interest at a rate based upon the higher of the one-month London Interbank Offered Rate, federal funds effective rate, or overnight bank funding rate plus an agreed-upon spread.
The fund had no borrowings outstanding at September 30, 2016, or at any time during the period then ended.
12. Other: Interest income includes income distributions received from Vanguard Market Liquidity Fund and is accrued daily. Premiums and discounts on debt securities purchased are amortized and accreted, respectively, to interest income over the lives of the respective securities. Security transactions are accounted for on the date securities are bought or sold. Costs used to determine realized gains (losses) on the sale of investment securities are those of the specific securities sold.
Each class of shares has equal rights as to assets and earnings, except that each class separately bears certain class-specific expenses related to maintenance of shareholder accounts (included in Management and Administrative expenses) and shareholder reporting. Marketing and distribution expenses are allocated to each class of shares based on a method approved by the board of trustees. Income, other non-class-specific expenses, and gains and losses on investments are allocated to each class of shares based on its relative net assets.
B. In accordance with the terms of a Funds’ Service Agreement (the “FSA”) between Vanguard and the fund, Vanguard furnishes to the fund investment advisory, corporate management, administrative, marketing, and distribution services at Vanguard’s cost of operations (as defined by the FSA). These costs of operations are allocated to the fund based on methods and guidelines approved by the board of trustees. Vanguard does not require reimbursement in the current period for certain costs of operations (such as deferred compensation/benefits and risk/insurance costs); the fund’s liability for these costs of operations is included in Payables to Vanguard on the Statement of Assets and Liabilities.
Upon the request of Vanguard, the fund may invest up to 0.40% of its net assets as capital in Vanguard. At September 30, 2016, the fund had contributed to Vanguard capital in the amount of $49,000, representing 0.01% of the fund’s net assets and 0.02% of Vanguard’s capitalization. The fund’s trustees and officers are also directors and employees, respectively, of Vanguard.
40
Core Bond Fund
C. Various inputs may be used to determine the value of the fund’s investments. These inputs are summarized in three broad levels for financial statement purposes. The inputs or methodologies used to value securities are not necessarily an indication of the risk associated with investing in those securities.
Level 1—Quoted prices in active markets for identical securities.
Level 2—Other significant observable inputs (including quoted prices for similar securities, interest rates, prepayment speeds, credit risk, etc.).
Level 3—Significant unobservable inputs (including the fund’s own assumptions used to determine the fair value of investments).
The following table summarizes the market value of the fund’s investments as of September 30, 2016, based on the inputs used to value them:
| | | |
| | Level 1 | Level 2 | Level 3 |
| Investments | ($000) | ($000) | ($000) |
| U.S. Government and Agency Obligations | — | 378,010 | — |
| Asset-Backed/Commercial Mortgage-Backed Securities | — | 79,165 | 220 |
| Corporate Bonds | — | 167,312 | — |
| Sovereign Bonds | — | 22,979 | — |
| Taxable Municipal Bonds | — | 1,665 | — |
| Temporary Cash Investments | 40,820 | — | — |
| Liability for Options Written | (8) | — | — |
| Futures Contracts—Assets1 | 209 | — | — |
| Futures Contracts—Liabilities1 | (330) | — | — |
| Forward Currency Contracts—Assets | — | 113 | — |
| Forward Currency Contracts—Liabilities | — | (19) | — |
| Swap Contracts—Assets | 31 | 50 | — |
| Swap Contracts—Liabilities | (42)1 | (43) | — |
| Total | 40,652 | 649,232 | 220 |
| 1 Represents variation margin on the last day of the reporting period. | | | |
D. At September 30, 2016, the fair values of derivatives were reflected in the Statement of Assets and Liabilities as follows:
| | | | |
| | Interest Rate | Currency | Credit | |
| Statement of Assets | Contracts | Contracts | Contracts | Total |
| and Liabilities Caption | ($000) | ($000) | ($000) | ($000) |
| Other Assets | 212 | 113 | 50 | 375 |
| Liability for Options Written | (8) | — | — | (8) |
| Other Liabilities | (343) | (19) | (72) | (434) |
41
Core Bond Fund
Realized net gain (loss) and the change in unrealized appreciation (depreciation) on derivatives for the period ended September 30, 2016, were:
| | | | |
| | Interest Rate | Currency | Credit | |
| | Contracts | Contracts | Contracts | Total |
| Realized Net Gain (Loss) on Derivatives | ($000) | ($000) | ($000) | ($000) |
| Futures Contracts | (678) | — | — | (678) |
| Swap Contracts | (68) | — | 144 | 76 |
| Forward Currency Contracts | — | 31 | — | 31 |
| Realized Net Gain (Loss) on Derivatives | (746) | 31 | 144 | (571) |
| |
| Change in Unrealized Appreciation | | | | |
| (Depreciation) on Derivatives | | | | |
| Futures Contracts | (167) | — | — | (167) |
| Options on Futures Contracts | 1 | — | — | 1 |
| Swap Contracts | 28 | — | (38) | (10) |
| Forward Currency Contracts | — | 94 | — | 94 |
| Change in Unrealized Appreciation | | | | |
| (Depreciation) on Derivatives | (138) | 94 | (38) | (82) |
At September 30, 2016, the aggregate settlement value of open futures contracts and the related unrealized appreciation (depreciation) were:
| | | | |
| | | | | ($000) |
| | | | Aggregate | |
| | | Number of | Settlement | Unrealized |
| | | Long (Short) | Value | Appreciation |
| Futures Contracts | Expiration | Contracts | Long (Short) | (Depreciation) |
| Ultra 10-Year U.S. Treasury Note | December 2016 | (214) | (30,849) | 42 |
| Ultra Long U.S. Treasury Bond | December 2016 | 121 | 22,249 | (199) |
| 2-Year U. S. Treasury Note | December 2016 | 91 | 19,881 | 15 |
| 5-Year U.S. Treasury Note | December 2016 | 137 | 16,648 | 35 |
| Euro-Buxl | December 2016 | (23) | (4,965) | (52) |
| Euro-Bund | December 2016 | (21) | (3,909) | (29) |
| 30-Year U. S. Treasury Bond | December 2016 | 17 | 2,859 | 19 |
| Euro-Bobl | December 2016 | (18) | (2,671) | (10) |
| Long Gilt | December 2016 | (9) | (1,519) | 12 |
| 10-Year U.S. Treasury Note | December 2016 | 11 | 1,442 | — |
| | | | | (167) |
Unrealized appreciation (depreciation) on open futures contracts is required to be treated as realized gain (loss) for tax purposes.
42
Core Bond Fund
At September 30, 2016, the fund had open forward currency contracts to receive and deliver currencies as follows. Unrealized appreciation (depreciation) on open forward currency contracts is treated as ordinary income for tax purposes.
| | | | | | |
| | | | | | | Unrealized |
| | Contract | | | | | Appreciation |
| | | | | Contract Amount (000) | |
| | Settlement | | | | | (Depreciation) |
| Counterparty | Date | | Receive | | Deliver | ($000) |
| Citibank, N.A. | 10/4/16 | EUR | 7,416 | USD | 8,322 | 11 |
| Citibank, N.A. | 10/4/16 | GBP | 1,841 | USD | 2,390 | (4) |
| BNP Paribas | 10/4/16 | EUR | 611 | USD | 687 | — |
| JPMorgan Chase Bank N.A. | 11/2/16 | EUR | 308 | USD | 347 | 1 |
| BNP Paribas | 10/4/16 | EUR | 218 | USD | 244 | 1 |
| Deutsche Bank AG | 10/4/16 | EUR | 100 | USD | 113 | — |
| BNP Paribas | 11/2/16 | EUR | 55 | USD | 62 | — |
| Morgan Stanley Capital Services LLC | 10/4/16 | EUR | 45 | USD | 50 | — |
| JPMorgan Chase Bank N.A. | 10/4/16 | EUR | 35 | USD | 40 | — |
| Morgan Stanley Capital Services LLC | 11/2/16 | EUR | 31 | USD | 35 | — |
| JPMorgan Chase Bank N.A. | 10/4/16 | GBP | 23 | USD | 30 | (1) |
| Bank of America N.A | 10/4/16 | EUR | 21 | USD | 24 | — |
| Deutsche Bank AG | 10/4/16 | USD | 8,722 | EUR | 7,713 | 55 |
| Citibank, N.A. | 11/2/16 | USD | 8,332 | EUR | 7,416 | (12) |
| Morgan Stanley Capital Services LLC | 10/4/16 | USD | 2,458 | GBP | 1,863 | 42 |
| Citibank, N.A. | 11/2/16 | USD | 2,391 | GBP | 1,841 | 3 |
| BNP Paribas | 10/4/16 | USD | 363 | EUR | 323 | — |
| Morgan Stanley Capital Services LLC | 10/4/16 | USD | 271 | EUR | 241 | (2) |
| JPMorgan Chase Bank N.A. | 10/4/16 | USD | 71 | EUR | 63 | — |
| Morgan Stanley Capital Services LLC | 10/4/16 | USD | 70 | EUR | 62 | — |
| BNP Paribas | 10/4/16 | USD | 50 | EUR | 44 | — |
| | | | | | | 94 |

43
| | | | | | |
| Core Bond Fund | | | | | | |
| |
| |
| |
| |
| At September 30, 2016, the fund had the following open swap contracts: | | |
| Centrally Cleared Credit Default Swaps | | | | | |
| | | | | Remaining | | |
| | | | | Up-Front | Periodic | |
| | | | | Premium | Premium | Unrealized |
| | | | Notional | Received | Received | Appreciation |
| | Termination | | Amount | (Paid) | (Paid) | (Depreciation) |
| Reference Entity | Date | Clearinghouse | ($000) | ($000) | (%) | ($000) |
| Credit Protection Purchased | | | | | | |
| CDX.NA.IG.S26.V1 | 6/20/21 | ICE | 12,340 | 148 | (1.000) | (27) |
| CDX.NA.IG.S27.V2 | 12/20/21 | ME | 6,250 | 60 | (1.000) | (18) |
| | | | 18,590 | | | (45) |
| ICE—Intercontinental Exchange. | | | | | | |
| CME—Chicago Mercantile Exchange. | | | | | | |
| |
| Over-the-Counter Credit Default Swaps | | | | | |
| | | | | Remaining | | |
| | | | | Up-Front | Periodic | |
| | | | | Premium | Premium | Unrealized |
| | | | Notional | Received | Received | Appreciation |
| | Termination | | Amount | (Paid) | (Paid) | (Depreciation) |
| Reference Entity | Date | Counterparty | ($000) | ($000) | (%) | ($000) |
| Credit Protection Sold/ | | | | | | |
| Moody’s Rating | | | | | | |
| Berkshire Hathaway Inc./Aa2 | 6/20/21 | BARC | 160 | 1 | 1.000 | 2 |
| Berkshire Hathaway Inc./Aa2 | 6/20/21 | BARC | 125 | (1) | 1.000 | — |
| Berkshire Hathaway Inc./Aa2 | 6/20/21 | GSI | 55 | — | 1.000 | — |
| Berkshire Hathaway Inc./Aa2 | 6/20/21 | JPMC | 70 | — | 1.000 | — |
| Kohls Corp./Baa2 | 6/20/21 | GSI | 70 | 2 | 1.000 | (1) |
| Kohls Corp./Baa2 | 6/20/21 | GSI | 35 | 1 | 1.000 | — |
| Kohls Corp./Baa2 | 6/20/21 | GSI | 35 | 1 | 1.000 | — |
| Republic of Colombia/Baa2 | 12/20/21 | BNPSW | 1,910 | 84 | 1.000 | 20 |
| Republic of Peru/A3 | 12/20/21 | CITNA | 2,200 | 24 | 1.000 | 20 |
| United Mexican States/A3 | 12/20/21 | BARC | 300 | 10 | 1.000 | 1 |
| United Mexican States/A3 | 12/20/21 | GSI | 1,950 | 68 | 1.000 | 5 |
| United Mexican States/A3 | 12/20/21 | JPMC | 200 | 7 | 1.000 | — |
| | | | 7,110 | | | 47 |
44
| | | | | | |
| Core Bond Fund | | | | | | |
| |
| |
| |
| |
| Over-the-Counter Credit Default Swaps (continued) | | | | |
| | | | | Remaining | | |
| | | | | Up-Front | Periodic | |
| | | | | Premium | Premium | Unrealized |
| | | | Notional | Received | Received | Appreciation |
| | Termination | | Amount | (Paid) | (Paid) | (Depreciation) |
| Reference Entity | Date | Counterparty | ($000) | ($000) | (%) | ($000) |
| Credit Protection Purchased | | | | | | |
| Banco Bilbao Vizcaya | | | | | | |
| Argentaria SA | 6/20/21 | BOANA | 505 | (15) | (1.000) | (11) |
| CMBX.NA.AAA.9 | 9/17/58 | CSFBI | 170 | (7) | (0.500) | (1) |
| CMBX.NA.AAA.9 | 9/17/58 | CSFBI | 280 | (16) | (0.500) | (5) |
| CMBX.NA.AAA.9 | 9/17/58 | CSFBI | 90 | (4) | (0.500) | (1) |
| CMBX.NA.AAA.9 | 9/17/58 | CSFBI | 110 | (4) | (0.500) | — |
| CMBX.NA.AAA.9 | 9/17/58 | CSFBI | 660 | (27) | (0.500) | (2) |
| CMBX.NA.AAA.9 | 9/17/58 | GSI | 130 | (5) | (0.500) | (1) |
| CMBX.NA.AAA.9 | 9/17/58 | GSI | 170 | (6) | (0.500) | — |
| CMBX.NA.AAA.9 | 9/17/58 | GSI | 20 | (1) | (0.500) | — |
| CMBX.NA.AAA.9 | 9/17/58 | GSI | 160 | (10) | (0.500) | (4) |
| CMBX.NA.AAA.9 | 9/17/58 | JPMC | 90 | (3) | (0.500) | — |
| CMBX.NA.AAA.9 | 9/17/58 | JPMC | 90 | (5) | (0.500) | (1) |
| CMBX.NA.AAA.9 | 9/17/58 | MSCS | 90 | (5) | (0.500) | (2) |
| CMBX.NA.AAA.9 | 9/17/58 | MSCS | 100 | (4) | (0.500) | (1) |
| Commerzbank AG | 6/20/21 | BOANA | 505 | (9) | (1.000) | (5) |
| Federative Republic of Brazil | 6/20/21 | GSI | 150 | (17) | (1.000) | (8) |
| Intesa Sanpaolo SpA | 6/20/21 | BARC | 170 | (2) | (1.000) | 1 |
| Lincoln National Corp. | 6/20/21 | BARC | 35 | — | (1.000) | 1 |
| Lincoln National Corp. | 6/20/21 | BARC | 25 | (1) | (1.000) | — |
| Standard Chartered Bank | 6/20/21 | BOANA | 180 | — | (1.000) | — |
| | | | 3,730 | | | (40) |
| | | | | | | 7 |
The notional amount represents the maximum potential amount the fund could be required to pay as a seller of credit protection if the reference entity was subject to a credit event.
BARC—Barclays Bank plc. BNPSW—BNP Paribas. BOANA—Bank of America, N.A. CITNA—Citibank, N.A.
CSFBI—Credit Suisse First Boston International. GSI—Goldman Sachs International.
JPMC—JP Morgan Chase Bank.
MSCS—Morgan Stanley Capital Services LLC.
45
| | | | | | |
| Core Bond Fund | | | | | | |
| |
| |
| |
| |
| Centrally Cleared Interest Rate Swaps | | | | |
| | | | | Fixed | Floating | |
| | | | | Interest Rate | Interest Rate | Unrealized |
| | Future | | Notional | Received | Received | Appreciation |
| | Effective | | Amount | (Paid) | (Paid) | (Depreciation) |
| Termination Date | Date | Clearinghouse | ($000) | (%) | (%) | ($000) |
| 12/21/17 | 12/21/161 | CME | 66 | 1.000 | (0.000)2 | — |
| 12/21/18 | 12/21/161 | CME | 5,614 | 1.250 | (0.000)2 | 6 |
| 12/21/19 | 12/21/161 | CME | 6,640 | 1.250 | (0.000)2 | 12 |
| 12/21/20 | 12/21/161 | CME | 1,724 | 1.250 | (0.000)2 | 5 |
| 2/28/21 | 2/28/171 | LCH | 2,000 | (1.177) | (0.000)2 | (1) |
| 12/21/21 | 12/21/161 | CME | 1,419 | 1.500 | (0.000)2 | 6 |
| | | | | | | 28 |
CME—Chicago Mercantile Exchange. LCH—London Clearing House.
1 Forward interest rate swap. In a forwad interest rate swap, the fund and the counterparty agree to make periodic net payments beginning on a specified future effective date.
2 Based on 3-month London Interbank Offered Rate (LIBOR) as of the most recent payment date.
E. Distributions are determined on a tax basis and may differ from realized capital gains for financial reporting purposes. Differences may be permanent or temporary. Permanent differences are reclassified among capital accounts in the financial statements to reflect their tax character. Temporary differences arise when gains or losses are recognized in different periods for financial statement and tax purposes. These differences will reverse at some time in the future.
During the period ended September 30, 2016, the fund realized net foreign currency gains of $40,000, (including gains and losses on forward currency contracts and the foreign currency component on sales of foreign currency denominated bonds), which increased distributable net income for tax purposes; accordingly, such gains have been reclassified from accumulated net realized gains to undistributed net investment income.
The fund used a tax accounting practice to treat a portion of the price of capital shares redeemed during the year as distributions from realized capital gains. Accordingly, the fund has reclassified $213,000 from accumulated net realized gains to paid-in capital.
Realized and unrealized gains (losses) on certain of the fund’s swap contracts are treated as ordinary income (loss) for tax purposes; the effect on the fund’s income dividends to shareholders is offset by a change in principal return. Realized losses of $8,000 on swap contracts have been reclassified from accumulated net realized gains to undistributed net investment income.
For tax purposes, at September 30, 2016, the fund had $3,967,000 of ordinary income available for distribution.
At September 30, 2016, the cost of investment securities for tax purposes was $682,239,000. Net unrealized appreciation of investment securities for tax purposes was $7,932,000, consisting of unrealized gains of $8,571,000 on securities that had risen in value since their purchase and $639,000 in unrealized losses on securities that had fallen in value since their purchase.
46
Core Bond Fund
F. During the period ended September 30, 2016, the fund purchased $337,875,000 of investment securities and sold $95,312,000 of investment securities, other than U.S. government securities and temporary cash investments. Purchases and sales of U.S. government securities were $1,395,902,000 and $1,046,755,000, respectively.
The fund purchased securities from and sold securities to other Vanguard funds or accounts managed by Vanguard or its affiliates, in accordance with procedures adopted by the board of trustees in compliance with Rule 17a-7 of the Investment Company Act of 1940. For the period ended September 30, 2016, such purchases and sales were $5,428,000 and $10,240,000, respectively; these amounts are included in the purchases and sales of investment securities noted above.
The following table summarizes the fund’s options written during the period ended September 30, 2016.
| | | | |
| | | Options on | | |
| | Futures Contracts | | Swaptions |
| | | Premiums | Notional | Premiums |
| | Number of | Received | Amount | Received |
| Options Written | Contracts | ($000) | ($000) | ($000) |
| Balance at March 10, 20161 | — | — | — | — |
| Options Written | 216 | 69 | 4,770 | 5 |
| Options Expired | (2) | (1) | (3,750) | (4) |
| Options Closed | (184) | (59) | (1,020) | (1) |
| Options Exercised | — | — | — | — |
| Balance at September 30, 2016 | 30 | 9 | — | — |
| 1 Commencement of subscription period for the fund. | | | | |
| |
| G. Capital share transactions for each class of shares were: | | | |
| | | | March 10, 20161 to |
| | | | September 30, 2016 |
| | | | Amount | Shares |
| | | | ($000) | (000) |
| Investor Shares | | | | |
| Issued | | | 89,670 | 8,892 |
| Issued in Lieu of Cash Distributions | | | 482 | 47 |
| Redeemed | | | (26,638) | (2,623) |
| Net Increase (Decrease)—Investor Shares | | | 63,514 | 6,316 |
| Admiral Shares | | | | |
| Issued | | | 614,186 | 30,451 |
| Issued in Lieu of Cash Distributions | | | 4,207 | 206 |
| Redeemed | | | (50,933) | (2,498) |
| Net Increase (Decrease) —Admiral Shares | | | 567,460 | 28,159 |
| 1 Commencement of subscription period for the fund. | | | | |
H. Management has determined that no material events or transactions occurred subsequent to September 30, 2016, that would require recognition or disclosure in these financial statements.
47
Report of Independent Registered Public Accounting Firm
To the Board of Trustees of Vanguard Malvern Funds and the Shareholders of Vanguard Core Bond Fund: In our opinion, the accompanying statement of net assets, statement of assets and liabilities and the related statements of operations and of changes in net assets and the financial highlights present fairly, in all material respects, the financial position of Vanguard Core Bond Fund (constituting a separate portfolio of Vanguard Malvern Funds, hereafter referred to as the “Fund”) at September 30, 2016, and the results of its operations, the changes in its net assets, and the financial highlights for the period March 10, 2016 (commencement of subscription period) through September 30, 2016, in conformity with accounting principles generally accepted in the United States of America. These financial statements and financial highlights (hereafter referred to as “financial statements”) are the responsibility of the Fund’s management. Our responsibility is to express an opinion on these financial statements based on our audit. We conducted our audit of these financial statements in accordance with the standards of the Public Company Accounting Oversight Board (United States). Those standards require that we plan and perform the audit to obtain reasonable assurance about whether the financial statements are free of material misstatement. An audit includes examining, on a test basis, evidence supporting the amounts and disclosures in the financial statements, assessing the accounting principles used and significant estimates made by management, and evaluating the overall financial statement presentation. We believe that our audit, which included confirmation of securities at September 30, 2016 by correspondence with the custodian and brokers and by agreement to the underlying ownership records of the transfer agent, provide a reasonable basis for our opinion.
/s/PricewaterhouseCoopers LLP
Philadelphia, Pennsylvania
November 15, 2016
Special 2016 tax information (unaudited) for Vanguard Core Bond Fund
This information for the fiscal period ended September 30, 2016, is included pursuant to provisions of the Internal Revenue Code.
For nonresident alien shareholders, 82.3% of income dividends are interest-related dividends.
48
About Your Fund’s Expenses
As a shareholder of the fund, you incur ongoing costs, which include costs for portfolio management, administrative services, and shareholder reports (like this one), among others. Operating expenses, which are deducted from a fund’s gross income, directly reduce the investment return of the fund.
A fund’s expenses are expressed as a percentage of its average net assets. This figure is known as the expense ratio. The following examples are intended to help you understand the ongoing costs (in dollars) of investing in your fund and to compare these costs with those of other mutual funds. The examples are based on an investment of $1,000 made at the beginning of the period shown and held for the entire period.
The accompanying table illustrates your fund’s costs in two ways:
• Based on actual fund return. This section helps you to estimate the actual expenses that you paid over the period. The ”Ending Account Value“ shown is derived from the fund‘s actual return, and the third column shows the dollar amount that would have been paid by an investor who started with $1,000 in the fund. You may use the information here, together with the amount you invested, to estimate the expenses that you paid over the period.
To do so, simply divide your account value by $1,000 (for example, an $8,600 account value divided by $1,000 = 8.6), then multiply the result by the number given for your fund under the heading ”Expenses Paid During Period.“
• Based on hypothetical 5% yearly return. This section is intended to help you compare your fund‘s costs with those of other mutual funds. It assumes that the fund had a yearly return of 5% before expenses, but that the expense ratio is unchanged. In this case—because the return used is not the fund’s actual return—the results do not apply to your investment. The example is useful in making comparisons because the Securities and Exchange Commission requires all mutual funds to calculate expenses based on a 5% return. You can assess your fund’s costs by comparing this hypothetical example with the hypothetical examples that appear in shareholder reports of other funds.
Note that the expenses shown in the table are meant to highlight and help you compare ongoing costs only and do not reflect transaction costs incurred by the fund for buying and selling securities. Further, the expenses do not include any purchase, redemption, or account service fees described in the fund prospectus. If such fees were applied to your account, your costs would be higher. Your fund does not carry a “sales load.”
The calculations assume no shares were bought or sold during the period. Your actual costs may have been higher or lower, depending on the amount of your investment and the timing of any purchases or redemptions.
You can find more information about the fund’s expenses, including annual expense ratios, in the Financial Statements section of this report. For additional information on operating expenses and other shareholder costs, please refer to your fund’s current prospectus.
49
| | | |
| Six Months Ended September 30, 2016 | | | |
| | Beginning | Ending | Expenses |
| | Account Value | Account Value | Paid During |
| Core Bond Fund | 3/31/2016 | 9/30/2016 | Period |
| Based on Actual Fund Return | | | |
| Investor Shares | $1,000.00 | $1,031.46 | $0.66 |
| Admiral Shares | 1,000.00 | 1,032.51 | 0.41 |
| Based on Hypothetical 5% Yearly Return | | | |
| Investor Shares | $1,000.00 | $1,024.35 | $0.66 |
| Admiral Shares | 1,000.00 | 1,024.60 | 0.40 |
The calculations are based on expenses incurred in the current period. The fund’s annualized expense ratios for that period are 0.13% for Investor Shares and 0.08% for Admiral Shares. The dollar amounts shown as “Expenses Paid” are equal to the annualized expense ratio multiplied by the average account value over the period, multiplied by the number of days in the current period, then divided by the number of days in the most recent 12-month period (183/366).
50
Glossary
30-Day SEC Yield. A fund’s 30-day SEC yield is derived using a formula specified by the U.S. Securities and Exchange Commission. Under the formula, data related to the fund’s security holdings in the previous 30 days are used to calculate the fund’s hypothetical net income for that period, which is then annualized and divided by the fund’s estimated average net assets over the calculation period. For the purposes of this calculation, a security’s income is based on its current market yield to maturity (for bonds), its actual income (for asset-backed securities), or its projected dividend yield (for stocks). Because the SEC yield represents hypothetical annualized income, it will differ—at times significantly—from the fund’s actual experience. As a result, the fund’s income distributions may be higher or lower than implied by the SEC yield.
Average Coupon. The average interest rate paid on the fixed income securities held by a fund. It is expressed as a percentage of face value.
Average Duration. An estimate of how much the value of the bonds held by a fund will fluctuate in response to a change in interest rates. To see how the value could change, multiply the average duration by the change in rates. If interest rates rise by 1 percentage point, the value of the bonds in a fund with an average duration of five years would decline by about 5%. If rates decrease by a percentage point, the value would rise by 5%.
Average Effective Maturity. The average length of time until fixed income securities held by a fund reach maturity and are repaid, taking into consideration the possibility that the issuer may call the bond before its maturity date. The figure reflects the proportion of fund assets represented by each security; it also reflects any futures contracts held. In general, the longer the average effective maturity, the more a fund’s share price will fluctuate in response to changes in market interest rates.
Credit Quality. Credit-quality ratings are measured on a scale that generally ranges from AAA (highest) to D (lowest). U.S. Treasury, U.S. Agency, and U.S. Agency mortgage-backed securities appear under “U.S. Government.” Credit-quality ratings are obtained from Moody’s and S&P, and the higher rating for each issue is shown. ”Not Rated” is used to classify securities for which a rating is not available. Not rated securities include a fund’s investment in Vanguard Market Liquidity Fund or Vanguard Municipal Cash Management Fund, each of which invests in high-quality money market instruments and may serve as a cash management vehicle for the Vanguard funds, trusts, and accounts.
Expense Ratio. A fund’s total annual operating expenses expressed as a percentage of the fund’s average net assets. The expense ratio includes management and administrative expenses, but does not include the transaction costs of buying and selling portfolio securities.
Inception Date. The date on which the assets of a fund (or one of its share classes) are first invested in accordance with the fund’s investment objective. For funds with a subscription period, the inception date is the day after that period ends. Investment performance is measured from the inception date.
Short-Term Reserves. The percentage of a fund invested in highly liquid, short-term securities that can be readily converted to cash.
Yield to Maturity. The rate of return an investor would receive if the fixed income securities held by a fund were held to their maturity dates.
51
The People Who Govern Your Fund
The trustees of your mutual fund are there to see that the fund is operated and managed in your best interests since, as a shareholder, you are a part owner of the fund. Your fund’s trustees also serve on the board of directors of The Vanguard Group, Inc., which is owned by the Vanguard funds and provides services to them on an at-cost basis.
A majority of Vanguard’s board members are independent, meaning that they have no affiliation with Vanguard or the funds they oversee, apart from the sizable personal investments they have made as private individuals. The independent board members have distinguished backgrounds in business, academia, and public service. Each of the trustees and executive officers oversees 198 Vanguard funds.
The following table provides information for each trustee and executive officer of the fund. The mailing address of the trustees and officers is P.O. Box 876, Valley Forge, PA 19482. More information about the trustees is in the Statement of Additional Information, which can be obtained, without charge, by contacting Vanguard at 800-662-7447, or online at vanguard.com.
InterestedTrustee1
F. William McNabb III
Born 1957. Trustee Since July 2009. Chairman of the Board. Principal Occupation(s) During the Past Five Years and Other Experience: Chairman of the Board of The Vanguard Group, Inc., and of each of the investment companies served by The Vanguard Group, since January 2010; Director of The Vanguard Group since 2008; Chief Executive Officer and President of The Vanguard Group, and of each of the investment companies served by The Vanguard Group, since 2008; Director of Vanguard Marketing Corporation; Managing Director of The Vanguard Group (1995–2008).
IndependentTrustees
Emerson U. Fullwood
Born 1948. Trustee Since January 2008. Principal Occupation(s) During the Past Five Years and Other Experience: Executive Chief Staff and Marketing Officer for North America and Corporate Vice President (retired 2008) of Xerox Corporation (document management products and services); Executive in Residence and 2009–2010 Distinguished Minett Professor at the Rochester Institute of Technology; Lead Director of SPX FLOW, Inc. (multi-industry manufacturing); Director of the United Way of Rochester, the University of Rochester Medical Center, Monroe Community College Foundation, North Carolina A&T University, and Roberts Wesleyan College.
Rajiv L. Gupta
Born 1945. Trustee Since December 2001.2 Principal Occupation(s) During the Past Five Years and Other Experience: Chairman and Chief Executive Officer (retired 2009) and President (2006–2008) of Rohm and Haas Co. (chemicals); Director of Tyco International plc (diversified manufacturing and services), HP Inc. (printer and personal computer manufacturing), and Delphi Automotive plc (automotive components); Senior Advisor at New Mountain Capital.
Amy Gutmann
Born 1949. Trustee Since June 2006. Principal Occupation(s) During the Past Five Years and Other Experience: President of the University of Pennsylvania; Christopher H. Browne Distinguished Professor of Political Science, School of Arts and Sciences, and Professor of Communication, Annenberg School for Communication, with secondary faculty appointments in the Department of Philosophy, School of Arts and Sciences, and at the Graduate School of Education, University of Pennsylvania; Trustee of the National Constitution Center; Chair of the Presidential Commission for the Study of Bioethical Issues.
JoAnn Heffernan Heisen
Born 1950. Trustee Since July 1998. Principal Occupation(s) During the Past Five Years and Other Experience: Corporate Vice President and Chief Global Diversity Officer (retired 2008) and Member of the Executive Committee (1997–2008) of Johnson & Johnson (pharmaceuticals/medical devices/consumer products); Director of Skytop Lodge Corporation (hotels) and the Robert Wood Johnson Foundation; Member of the Advisory Board of the Institute for Women’s Leadership at Rutgers University.
F. Joseph Loughrey
Born 1949. Trustee Since October 2009. Principal Occupation(s) During the Past Five Years and Other Experience: President and Chief Operating Officer (retired 2009) of Cummins Inc. (industrial machinery); Chairman of the Board of Hillenbrand, Inc. (specialized consumer services), and of Oxfam America; Director of SKF AB (industrial machinery), Hyster-Yale Materials Handling, Inc. (forklift trucks), the Lumina Foundation for Education, and the V Foundation for Cancer Research; Member of the Advisory Council for the College of Arts and Letters and of the Advisory Board to the Kellogg Institute for International Studies, both at the University of Notre Dame.
Mark Loughridge
Born 1953. Trustee Since March 2012. Principal Occupation(s) During the Past Five Years and Other Experience: Senior Vice President and Chief Financial Officer (retired 2013) at IBM (information technology services); Fiduciary Member of IBM’s Retirement Plan Committee (2004–2013); Director of the Dow Chemical Company; Member of the Council on Chicago Booth.
Scott C. Malpass
Born 1962. Trustee Since March 2012. Principal Occupation(s) During the Past Five Years and Other Experience: Chief Investment Officer and Vice President at the University of Notre Dame; Assistant Professor of Finance at the Mendoza College of Business at Notre Dame; Member of the Notre Dame 403(b) Investment Committee, the Board of Advisors for Spruceview Capital Partners, and the Investment Advisory Committee of Major League Baseball; Board Member of TIFF Advisory Services, Inc., and Catholic Investment Services, Inc. (investment advisors).
André F. Perold
Born 1952. Trustee Since December 2004. Principal Occupation(s) During the Past Five Years and Other Experience: George Gund Professor of Finance and Banking, Emeritus at the Harvard Business School (retired 2011); Chief Investment Officer and Managing Partner of HighVista Strategies LLC (private investment firm); Director of Rand Merchant Bank; Overseer of the Museum of Fine Arts Boston.
Peter F. Volanakis
Born 1955. Trustee Since July 2009. Principal Occupation(s) During the Past Five Years and Other Experience: President and Chief Operating Officer (retired 2010) of Corning Incorporated (communications equipment); Chairman of the Board of Trustees of Colby-Sawyer College; Member of the Advisory Board of the Norris Cotton Cancer Center.
Executive Officers
Glenn Booraem
Born 1967. Treasurer Since May 2015. Principal Occupation(s) During the Past Five Years and Other Experience: Principal of The Vanguard Group, Inc.; Treasurer of each of the investment companies served by The Vanguard Group; Controller of each of the investment companies served by The Vanguard Group (2010–2015); Assistant Controller of each of the investment companies served by The Vanguard Group (2001–2010).
Thomas J. Higgins
Born 1957. Chief Financial Officer Since September 2008. Principal Occupation(s) During the Past Five Years and Other Experience: Principal of The Vanguard Group, Inc.; Chief Financial Officer of each of the investment companies served by The Vanguard Group; Treasurer of each of the investment companies served by The Vanguard Group (1998–2008).
Peter Mahoney
Born 1974. Controller Since May 2015. Principal Occupation(s) During the Past Five Years and Other Experience: Head of Global Fund Accounting at The Vanguard Group, Inc.; Controller of each of the investment companies served by The Vanguard Group; Head of International Fund Services at The Vanguard Group (2008–2014).
Anne E. Robinson
Born 1970. Secretary Since September 2016. Principal Occupation(s) During the Past Five Years and Other Experience: Managing Director of The Vanguard Group, Inc.; General Counsel of The Vanguard Group; Secretary of The Vanguard Group and of each of the investment companies served by The Vanguard Group; Director and Senior Vice President of Vanguard Marketing Corporation; Managing Director and General Counsel of Global Cards and Consumer Services at Citigroup (2014–2016); Counsel at American Express (2003–2014).
Vanguard Senior Management Team
| |
Mortimer J. Buckley Kathleen C. Gubanich Martha G. King John T. Marcante Chris D. McIsaac | James M. Norris Thomas M. Rampulla Glenn W. Reed Karin A. Risi Michael Rollings |
Chairman Emeritus and Senior Advisor John J. Brennan
Chairman, 1996–2009
Chief Executive Officer and President, 1996–2008
Founder
John C. Bogle
Chairman and Chief Executive Officer, 1974–1996
1 Mr. McNabb is considered an “interested person,” as defined in the Investment Company Act of 1940, because he is an officer of the Vanguard funds.
2 December 2002 for Vanguard Equity Income Fund, the Vanguard Municipal Bond Funds, and the Vanguard State Tax-Exempt Funds.
 |
| P.O. Box 2600 |
| Valley Forge, PA 19482-2600 |
Connect with Vanguard® > vanguard.com
| |
| Fund Information > 800-662-7447 | CFA® is a registered trademark owned by CFA Institute. |
| Direct Investor Account Services > 800-662-2739 | |
| Institutional Investor Services > 800-523-1036 | |
| Text Telephone for People | |
| Who Are Deaf or Hard of Hearing> 800-749-7273 | |
| |
| This material may be used in conjunction | |
| with the offering of shares of any Vanguard | |
| fund only if preceded or accompanied by | |
| the fund’s current prospectus. | |
| |
| All comparative mutual fund data are from Lipper, a | |
| Thomson Reuters Company, or Morningstar, Inc., unless | |
| otherwise noted. | |
| |
| You can obtain a free copy of Vanguard’s proxy voting | |
| guidelines by visiting vanguard.com/proxyreporting or by | |
| calling Vanguard at 800-662-2739. The guidelines are | |
| also available from the SEC’s website, sec.gov. In | |
| addition, you may obtain a free report on how your fund | |
| voted the proxies for securities it owned during the 12 | |
| months ended June 30. To get the report, visit either | |
| vanguard.com/proxyreporting or sec.gov. | |
| |
| You can review and copy information about your fund at | |
| the SEC’s Public Reference Room in Washington, D.C. To | |
| find out more about this public service, call the SEC at | |
| 202-551-8090. Information about your fund is also | |
| available on the SEC’s website, and you can receive | |
| copies of this information, for a fee, by sending a | |
| request in either of two ways: via email addressed to | |
| publicinfo@sec.gov or via regular mail addressed to the | |
| Public Reference Section, Securities and Exchange | |
| Commission, Washington, DC 20549-1520. | |
| |
| | © 2016 The Vanguard Group, Inc. |
| | All rights reserved. |
| | Vanguard Marketing Corporation, Distributor. |
| |
| | Q13200 112016 |

Annual Report | September 30, 2016
Vanguard Emerging Markets Bond Fund
A new format, unwavering commitment
As you begin reading this report, you’ll notice that we’ve made some improvements to the opening sections—based on feedback from you, our clients.
Page 1 starts with a new “Your Fund’s Performance at a Glance,” a concise, handy summary of how your fund performed during the period.
In the renamed “Chairman’s Perspective,” Bill McNabb will focus on enduring principles and investment insights.
We’ve modified some tables, and eliminated some redundancy, but we haven’t removed any information.
At Vanguard, we’re always looking for better ways to communicate and to help you make sound investment decisions. Thank you for entrusting your assets to us.
| |
| Contents | |
| |
| Your Fund’s Performance at a Glance | 1 |
| Chairman’s Perspective | 2 |
| Advisor’s Report | 5 |
| Fund Profile | 8 |
| Performance Summary | 10 |
| Financial Statements | 11 |
| About Your Fund’s Expenses | 30 |
| Glossary | 32 |
Please note: The opinions expressed in this report are just that—informed opinions. They should not be considered promises or advice. Also, please keep in mind that the information and opinions cover the period through the date on the front of this report. Of course, the risks of investing in your fund are spelled out in the prospectus.
See the Glossary for definitions of investment terms used in this report.
About the cover: No matter what language you speak, Vanguard has one consistent message and set of principles. Our primary focus is on you, our clients. We conduct our business with integrity as a faithful steward of your assets. This message is shown translated into seven languages, reflecting our expanding global presence.
Your Fund’s Performance at a Glance
• Vanguard Emerging Markets Bond Fund returned more than 13% for the nearly seven months from its inception through September 30, 2016, well ahead of its benchmark and the average return of its peers.
• Monetary policy among the world’s largest central banks remained supportive of global bonds. The Federal Reserve, despite some mixed signals in June and September, didn’t raise interest rates. The Bank of England cut interest rates, and monetary policy at both the European Central Bank and the Bank of Japan remained accommodative.
• Performance of emerging-market debt was supported by investor inflows throughout the period.
• Because the advisor focuses on relative value opportunities, security selection—especially among quasi-sovereign issuers—accounted for a good part of the fund’s outperformance.
• By country, the sovereign bonds of Argentina and Indonesia were among those producing the fund’s strongest returns.
| | | | |
| Total Returns: Period Ended September 30, 2016 | | | | |
| 30-Day SEC | Income | Capital | Total |
| Yield | Returns | Returns | Returns |
| Vanguard Emerging Markets Bond Fund | | | | |
| (Inception: 3/10/2016) | 4.20% | 2.81% | 10.70% | 13.51% |
| J.P. Morgan EMBI Global Diversified Index | | | | 11.36 |
| Emerging Markets Hard Currency Debt Funds Average | | | | 10.40 |
Emerging Markets Hard Currency Debt Funds Average: Derived from data provided by Lipper, a Thomson Reuters Company.
Benchmark returns are calculated from the start of the reporting period or from the fund’s inception date.
Expense Ratios
Your Fund Compared With Its Peer Group
| | |
| Peer Group |
| Fund | Average |
| Emerging Markets Bond Fund | 0.60% | 1.18% |
The fund expense ratio shown is from the prospectus dated March 10, 2016, and represents estimated costs for the current fiscal year. For the period from inception through September 30, 2016, the fund’s annualized expense ratio was 0.60%. The peer-group expense ratio is derived from data provided by Lipper Inc., a Thomson Reuters Company, and captures information through year-end 2015.
Peer group: Emerging Markets Hard Currency Debt Funds.
1
Chairman’s Perspective

Bill McNabb
Chairman and Chief Executive Officer
Dear Shareholder,
If you think you’ve had reason to feel uneasy about the investment environment lately, you’re not imagining things. In just the past few months, we’ve seen economic uncertainty, intense political polarization, and super-low bond yields. Yet at the same time, the stock market kept pushing higher.
In this confusing and sometimes contradictory climate, you may be asking yourself a question that I hear often: How do I make sense of all this, keep investing, and still get a good night’s sleep?
As with any problem, there are multiple ways to go at it. But there’s one approach in particular that is simple, straightforward, and nearly foolproof: Save more money. Not only can saving more give you a greater sense of control over your investment plan, it can help compensate for long-term returns that, in our estimation, could fall short of historical averages.
I love the way one of our investment pros put it. Fran Kinniry this summer told The Wall Street Journal, “Investing is always a partnership between you and the markets.” He explained that the markets carried more than their fair share of the weight for a couple of decades, through the 1990s, providing outsized returns that made the investor’s half of the partnership relatively light work. “But now you are going to have to be the majority partner.”
Sobering? Sure. Hopeless? Definitely not.
2
Over the 12 months since last September, U.S. stocks returned 15%, though the rise has not been a one-way ticket straight up. International markets have also posted strong returns, but lower than those of the broad U.S. market. The decision by United Kingdom voters in June to exit the European Union came as a surprise but caused market heartburn for only a few days.
In fixed income, yields remained extremely low—about 1.60% on the 10-year U.S. Treasury note at the end of September, after dipping below 1.40% over the summer. And bond yields in some international markets were negative.
Even this relatively small window of time illustrates a truism of the financial markets: There will always be segments that perform well and others that don’t. Saving more saves you from trying to control the uncontrollable—how economies and the markets perform. And it keeps you in control of one of the most vital parts of your investment program.
Although the “save more” logic is easy to grasp, it’s not always easy to follow. Bills, illness, the loss of a job—these can affect any of us.
But whatever our circumstances, figuring out how to save more is worth the effort. It requires that we make difficult decisions to forgo some consumption today to increase the likelihood of consuming (or consuming more) in the future. This is the very heart of investing. Sacrifices are never fun, so consider carrying them out systematically and in doses that you
| | | |
| Market Barometer | | | |
| | Average Annual Total Returns |
| | Periods Ended September 30, 2016 |
| One | Three | Five |
| Year | Years | Years |
| Stocks | | | |
| Russell 1000 Index (Large-caps) | 14.93% | 10.78% | 16.41% |
| Russell 2000 Index (Small-caps) | 15.47 | 6.71 | 15.82 |
| Russell 3000 Index (Broad U.S. market) | 14.96 | 10.44 | 16.36 |
| FTSE All-World ex US Index (International) | 9.62 | 0.71 | 6.50 |
| |
| Bonds | | | |
| Bloomberg Barclays U.S. Aggregate Bond Index | | | |
| (Broad taxable market) | 5.19% | 4.03% | 3.08% |
| Bloomberg Barclays Municipal Bond Index | | | |
| (Broad tax-exempt market) | 5.58 | 5.54 | 4.48 |
| Citigroup Three-Month U.S. Treasury Bill Index | 0.20 | 0.06 | 0.06 |
| |
| CPI | | | |
| Consumer Price Index | 1.46% | 1.03% | 1.25% |
3
can be comfortable with—for instance, gradually getting up to the max in your IRA, or adding a percentage point or so to the amount you stash in your employer’s retirement plan. As a point of reference, we generally suggest that investors strive for a retirement savings rate of 12%–15%, including any employer contributions.
If you need more convincing about the wisdom of the “save more” course of action, it might be helpful to examine your alternatives. This list is by no means exhaustive, but it hits on a few of the big ones, and none are without risk.
• Reach for yield. With yields so low on many types of bonds, it’s tempting to find the corners of the fixed income market where payouts are juicier. But with the juice comes considerable risk. You need to be aware that you’d be taking on more risk—and how much more.
• Go all-in on a hot-performing asset class or fund. By now, you know better than that, right?
• Sit tight. This approach isn’t a terrible idea; it’s better than panicking and deciding to just “do something,” particularly if that means changing your approach in response to the market’s movements.
Here’s the inescapably challenging part of your partnership with the markets: In the short run, your “partner” is fickle, emotional, and wildly unpredictable. But in the long run, your partner is mostly rational and extremely helpful.
The best way to minimize your vulnerability to the market’s mood swings, and to maximize the benefit of your partner’s longer-term strengths, is to expect less and save more. Maybe the markets will deliver better-than-expected returns. Maybe they’ll be consistent with our more modest expectations. In either case, a higher savings rate can help put you in a better position to reach your goals.
As always, thank you for investing with Vanguard.
Sincerely,

F. William McNabb III
Chairman and Chief Executive Officer
October 18, 2016
4
Advisor’s Report
From its inception on March 10, 2016, through the close of its fiscal year on September 30, 2016, Vanguard Emerging Markets Bond Fund returned 13.51%. Its benchmark, the J.P. Morgan EMBI Global Diversified Index, returned 11.36%. The average return of its peer group of emerging-market hard currency debt funds was 10.40%. (A “hard currency” is one that is issued by an economically and politically stable country and is widely used around the world as payment for goods and services.)
The investment environment
Emerging markets performed strongly, supported in part by accommodative monetary policy. The resulting search for yield taking place against the backdrop of mostly improving fundamentals in these economics drove investor cash flows into emerging markets, which helped performance.
In the period leading up to 2016, emerging-market economies as a whole had been going through a rough patch. Their fundamentals were showing some weakening and stewardship of their economies was deteriorating. Then in late 2015 and early 2016, they were hit by a further downturn in commodity prices.
More recently, however, some emerging-market countries have cut their budgets and we’ve seen some improvement in the quality of macroeconomic policies. The newly elected government in Argentina, for example, has normalized relations with bond holders and moved swiftly to implement reforms including reducing subsidies, allowing its currency to float freely, and lowering trade barriers.
In Brazil, business and consumer confidence have picked up since the formation of a new government determined to clean up the mismanagement of the previous administration. Russia has allowed the ruble to depreciate and has moved to cut government spending, helping to keep its budget and current account in check. There has also been reform momentum in Mexico, Colombia, and Indonesia.
A few emerging economies, including Venezuela, and some frontier economies remain distressed with no light yet at the end of the tunnel. Overall, however, the growth prospects for emerging markets are picking up, while growth rates for developed markets seem likely to remain below past levels. That has been one of the drivers behind strong cash flows into emerging-market debt.
The fall in commodity prices since 2014 has certainly weighed on emerging markets exporting those goods. Although this has weakened these countries’ currencies, an advantage is that emerging-market central banks in the resulting global disinflationary environment have had to be less aggressive in hiking local-currency interest rates, putting less pressure on economic growth. In recent months, with financial markets stable and inflation in check, a number of central banks have begun easing monetary policy, adding to investment opportunities in local-currency interest rates.
5
Management of the fund
The track record of Vanguard’s first stand-alone, actively–managed emerging markets fund is short but encouraging. Behind its smooth launch is the same team of 17 portfolio managers, traders, analysts, economists, risk managers, and research professionals in the United States, London, Melbourne, and Hong Kong that manages more than $3 billion in emerging-market debt for Vanguard’s actively managed multi-sector funds.
The fund has also benefited from many of the strategies that have worked well for us in the past in this segment of the global bond market. Key among them has been focusing on relative value opportunities. Because emerging-market debt experienced a strong run in February and March as commodity prices rebounded, we concentrated on bonds that we felt had the most room for spread compression on a risk-adjusted basis. That approach was successful, as was our overweighting of countries including Indonesia and Poland.
We were positive on Mexico, expressing our view through a tactical overweight to Pemex debt. We felt that, in focusing on its significant future financing needs, the market was mispricing the additional risk of investing in the quasi-sovereign issuer. The trade did well for the fund, and we have since reduced our exposure.
Another good relative value call was short-dated Argentinian securities. After holding them for several months, we sold them at a profit after their yields compressed until they no longer offered compelling value.
In some cases, we held bonds denominated in local currencies when they seemed to offer more value. That worked out well for us in South Africa, where we expected the greater liquidity of the local-currency market, cheaper valuations, and solid central bank governance would result in local-currency bonds compensating us more than external debt bonds would have. A long position in local-currency interest rates in Mexico, on the other hand, didn’t pay off.
Another item in our toolkit was credit default swaps. Using them as a substitute for cash securities at times allowed us to arbitrage the inefficiencies between the two markets.
Similarly, on a few occasions we added value by purchasing euro-denominated debt when it appeared more attractive than its U.S. dollar-denominated equivalent on a currency-hedged basis.
Outlook
We expect demand to remain solid. Strong cash flows into emerging-market bonds should continue, with international buyers showing an increasing appetite for local-currency debt.
6
On the supply side, we could see some shifts in the countries coming to market. A few of the more established, larger issuers, such as Russia, have been absent of late. In that country’s case, international sanctions and curtailed government spending have played a large role. On the other hand, Argentina reentered the global bond markets this spring for the first time since defaulting on its sovereign debt more than a decade ago. We expect the government to rely on external borrowing to finance significant budget deficits for the next three to five years as it tries to steer the economy toward a more open-market model.
Outside of traditional emerging markets, Saudi Arabia stands to become an important issuer. Persistently low oil prices have prompted the country to focus on diversifying its economy and bringing spending more in line with revenues. This is likely to be a multiyear undertaking. Shortly after the close of the fund’s fiscal year, the Saudi government sold more than $17 billion in its first bond issue, the largest emerging-market bond offering to date.
Yields of emerging-market bonds should remain attractive if weak global growth and tepid inflation keep developed-market interest rates low. A significant rise in those rates, however, could lead to negative returns for developed-market bonds.
It could also lower returns for emerging-market debt, although the comparatively high yields should help cushion performance. And if the reason for rates moving higher is an upturn in global economic growth, we could see an accompanying compression in emerging-market spreads. Any improvement in global growth could provide opportunities for the fund to generate additional profit from an appreciation in emerging currencies via ex-index positions.
Whatever the markets may bring, our experienced team of portfolio managers, traders, and credit analysts will continue to seek out opportunities to add to the fund’s performance.
Daniel Shaykevich, Portfolio Manager Vanguard Fixed Income Group October 25, 2016
7
Emerging Markets Bond Fund
Fund Profile
As of September 30, 2016
| | |
| Financial Attributes | | |
| J.P. Morgan |
| EMBI Global |
| Diversified |
| Fund | Index |
| Number of Bonds | 58 | 533 |
| Yield to Maturity | | |
| (before expenses) | 4.9% | 5.0% |
| Average Coupon | 8.3% | 6.1% |
| Average Duration | 6.6 years | 6.9 years |
| Average Effective Maturity | 9.7 years | 10.3 years |
| Ticker Symbol | VEMBX | — |
| Expense Ratio1 | 0.60% | — |
| 30-Day SEC Yield | 4.20% | — |
| Short-Term Reserves | 3.2% | — |
| |
| |
| Sector Diversification (% of portfolio) | |
| |
| Foreign Government | | 100.0% |
The agency and mortgage-backed securities sectors may include issues from government-sponsored enterprises; such issues are generally not backed by the full faith and credit of the U.S. government.
Distribution by Credit Quality (% of portfolio)
| |
| Aa | 3.4% |
| A | 12.4 |
| Baa | 29.1 |
| Ba | 26.1 |
| Less than Ba | 25.6 |
| Not Rated | 3.4 |
Credit-quality ratings are obtained from Moody’s and S&P, and the higher rating for each issue is shown. “Not Rated” is used to classify securities for which a rating is not available. Not rated securities include a fund’s investment in Vanguard Market Liquidity Fund or Vanguard Municipal Cash Management Fund, each of which invests in high-quality money market instruments and may serve as a cash management vehicle for the Vanguard funds, trusts, and accounts. For more information about these ratings, see the Glossary entry for Credit Quality.
| |
| Distribution by Effective Maturity | |
| (% of portfolio) | |
| |
| Under 1 Year | 5.3% |
| 1–3 Years | 6.9 |
| 3–5 Years | 25.3 |
| 5–7 Years | 17.9 |
| 7–10 Years | 15.8 |
| 10–20 Years | 11.8 |
| 20–30 Years | 14.9 |
| Over 30 Years | 2.1 |
1 The fund expense ratio shown is from the prospectus dated March 10, 2016, and represents estimated costs for the current fiscal year.
For the period from inception through September 30, 2016, the fund’s annualized expense ratio was 0.60%.
8
Emerging Markets Bond Fund
| | |
| Market Diversification (% of portfolio) | |
| |
| Fund |
| Emerging Markets | |
| Turkey | 6.4% |
| Mexico | 6.3 |
| Indonesia | 6.2 |
| Brazil | 5.9 |
| Peru | 4.0 |
| Russia | 4.0 |
| Dominican Republic | 3.9 |
| Serbia | 3.9 |
| Hungary | 3.8 |
| Lithuania | 3.7 |
| China | 3.5 |
| Kazakhstan | 3.5 |
| Jamaica | 3.3 |
| Ukraine | 3.2 |
| Poland | 3.2 |
| Venezuela | 3.1 |
| Argentina | 3.0 |
| South Africa | 3.0 |
| Supranational | 2.9 |
| Colombia | 2.8 |
| Pakistan | 2.0 |
| Armenia | 2.0 |
| Guatemala | 1.9 |
| Panama | 1.9 |
| Ecuador | 1.9 |
| El Salvador | 1.9 |
| Cote d’Ivore | 1.8 |
| Tunisia | 1.8 |
| Costa Rica | 1.7 |
| Croatia | 1.5 |
| Romania | 1.0 |
| Uruguay | 1.0 |
9
Emerging Markets Bond Fund
Performance Summary
All of the returns in this report represent past performance, which is not a guarantee of future results that may be achieved by the fund. (Current performance may be lower or higher than the performance data cited. For performance data current to the most recent month-end, visit our website at vanguard.com/performance.) Note, too, that both investment returns and principal value can fluctuate widely, so an investor’s shares, when sold, could be worth more or less than their original cost. The returns shown do not reflect taxes that a shareholder would pay on fund distributions or on the sale of fund shares.
Cumulative Performance: March 10, 2016, Through September 30, 2016
Initial Investment of $10,000

| | | |
| | Total Returns | Final Value |
| Period Ended September 30, 2016 | of a $10,000 |
| Since Inception | Investment |
| Emerging Markets Bond Fund Investor Shares | 13.51% | $11,351 |
| JP Morgan EMBI Global Diversified Index | 11.36 | 11,136 |
| Emerging Markets Hard Currency Debt Funds Average | 10.40 | 11,040 |
| | | | |
| Fiscal-Period Total Returns (%): March 10, 2016, Through September 30, 2016 | | |
| J.P. Morgan |
| EMBI Global |
| Diversified |
| Investor Shares | Index |
| Income | Capital | Total | Total |
| Fiscal Year | Returns | Returns | Returns | Returns |
| 2016 | 2.81% | 10.70% | 13.51% | 11.36% |
See Financial Highlights for dividend and capital gains information.
10
Emerging Markets Bond Fund
Financial Statements
Statement of Net Assets
As of September 30, 2016
The fund reports a complete list of its holdings in regulatory filings four times in each fiscal year, at the quarter-ends. For the second and fourth fiscal quarters, the lists appear in the fund’s semiannual and annual reports to shareholders. For the first and third fiscal quarters, the fund files the lists with the Securities and Exchange Commission on Form N-Q. Shareholders can look up the fund’s Forms N-Q on the SEC’s website at sec.gov. Forms N-Q may also be reviewed and copied at the SEC’s Public Reference Room (see the back cover of this report for further information).
| | | | | |
| Face | Market |
| Maturity | Amount | Value• |
| | Coupon | Date | ($000) | ($000) |
| Argentina (2.9%) | | | | |
| Sovereign Bonds (2.9%) | | | | |
| Argentine Republic | 7.000% | 4/17/17 | 200 | 204 |
| 1 | Argentine Republic | 2.500% | 12/31/38 | 100 | 71 |
| YPF SA | 8.500% | 7/28/25 | 50 | 55 |
| Total Argentina (Cost $322) | | | | 330 |
| Armenia (1.9%) | | | | |
| Sovereign Bond (1.9%) | | | | |
| Republic of Armenia | 7.150% | 3/26/25 | 200 | 212 |
| Total Armenia (Cost $217) | | | | 212 |
| Brazil (5.7%) | | | | |
| Corporate Bond (1.8%) | | | | |
| 2 | Marfrig Holdings Europe BV | 8.000% | 6/8/23 | 200 | 205 |
| |
| Sovereign Bonds (3.9%) | | | | |
| Petrobras Global Finance BV | 4.875% | 3/17/20 | 64 | 64 |
| Petrobras International Finance Co. SA | 7.875% | 3/15/19 | 200 | 216 |
| Petrobras International Finance Co. SA | 5.750% | 1/20/20 | 100 | 102 |
| Petrobras International Finance Co. SA | 5.375% | 1/27/21 | 56 | 55 |
| 437 |
| Total Brazil (Cost $611) | | | | 642 |
| China (3.3%) | | | | |
| Sovereign Bonds (3.3%) | | | | |
| Nexen Energy ULC | 6.400% | 5/15/37 | 100 | 132 |
| Sinopec Group Overseas Development 2013 Ltd. | 4.375% | 10/17/23 | 225 | 249 |
| Total China (Cost $353) | | | | 381 |
| Colombia (2.7%) | | | | |
| Sovereign Bonds (2.7%) | | | | |
| Ecopetrol SA | 5.875% | 9/18/23 | 171 | 184 |
| Republic of Colombia | 6.125% | 1/18/41 | 100 | 122 |
| Total Colombia (Cost $288) | | | | 306 |
11
| | | | | |
| Emerging Markets Bond Fund | | | | |
| |
| |
| Face | Market |
| Maturity | Amount | Value• |
| | Coupon | Date | ($000) | ($000) |
| Costa Rica (1.6%) | | | | |
| Sovereign Bond (1.6%) | | | | |
| Republic of Costa Rica | 5.625% | 4/30/43 | 200 | 182 |
| Total Costa Rica (Cost $154) | | | | 182 |
| Cote d’Ivoire (1.7%) | | | | |
| Sovereign Bond (1.7%) | | | | |
| 1 | Republic of Cote d’Ivoire | 5.750% | 12/31/32 | 198 | 195 |
| Total Cote d’Ivoire (Cost $178) | | | | 195 |
| Croatia (1.5%) | | | | |
| Sovereign Bond (1.5%) | | | | |
| Republic of Croatia | 6.750% | 11/5/19 | 150 | 166 |
| Total Croatia (Cost $162) | | | | 166 |
| Dominican Republic (3.7%) | | | | |
| Sovereign Bonds (3.7%) | | | | |
| 1 | Dominican Republic | 7.500% | 5/6/21 | 125 | 140 |
| 1 | Dominican Republic | 5.875% | 4/18/24 | 150 | 162 |
| Dominican Republic | 7.450% | 4/30/44 | 100 | 119 |
| Total Dominican Republic (Cost $394) | | | | 421 |
| Ecuador (1.8%) | | | | |
| Sovereign Bond (1.8%) | | | | |
| Republic of Ecuador | 10.750% | 3/28/22 | 200 | 204 |
| Total Ecuador (Cost $200) | | | | 204 |
| El Salvador (1.8%) | | | | |
| Sovereign Bond (1.8%) | | | | |
| Republic of El Salvador | 6.375% | 1/18/27 | 200 | 202 |
| Total El Salvador (Cost $195) | | | | 202 |
| Guatemala (1.8%) | | | | |
| Sovereign Bond (1.8%) | | | | |
| Republic of Guatemala | 4.500% | 5/3/26 | 200 | 208 |
| Total Guatemala (Cost $198) | | | | 208 |
| Hungary (3.7%) | | | | |
| Sovereign Bonds (3.7%) | | | | |
| Republic of Hungary | 6.375% | 3/29/21 | 250 | 290 |
| Republic of Hungary | 7.625% | 3/29/41 | 80 | 125 |
| Total Hungary (Cost $391) | | | | 415 |
| Indonesia (5.9%) | | | | |
| Sovereign Bonds (5.9%) | | | | |
| 3 | Republic of Indonesia | 8.375% | 9/15/26 | 930,000 | 78 |
| 4 | Republic of Indonesia | 3.750% | 6/14/28 | 200 | 246 |
| Republic of Indonesia | 5.250% | 1/17/42 | 300 | 343 |
| Total Indonesia (Cost $607) | | | | 667 |
12
| | | | | |
| Emerging Markets Bond Fund | | | | |
| |
| |
| Face | Market |
| Maturity | Amount | Value• |
| | Coupon | Date | ($000) | ($000) |
| Jamaica (3.1%) | | | | |
| Sovereign Bonds (3.1%) | | | | |
| 1 | Jamaica | 8.000% | 3/15/39 | 200 | 239 |
| Jamaica | 7.875% | 7/28/45 | 100 | 118 |
| Total Jamaica (Cost $346) | | | | 357 |
| Kazakhstan (3.3%) | | | | |
| Sovereign Bonds (3.3%) | | | | |
| KazMunayGas National Co. JSC | 9.125% | 7/2/18 | 130 | 143 |
| Republic of Kazakhstan | 3.875% | 10/14/24 | 225 | 235 |
| Total Kazakhstan (Cost $357) | | | | 378 |
| Lithuania (3.5%) | | | | |
| Sovereign Bonds (3.5%) | | | | |
| 2 | Republic of Lithuania | 7.375% | 2/11/20 | 165 | 196 |
| Republic of Lithuania | 6.125% | 3/9/21 | 170 | 201 |
| Total Lithuania (Cost $387) | | | | 397 |
| Mexico (6.2%) | | | | |
| Sovereign Bonds (6.2%) | | | | |
| Petroleos Mexicanos | 5.500% | 1/21/21 | 230 | 245 |
| United Mexican States | 3.625% | 3/15/22 | 435 | 458 |
| Total Mexico (Cost $683) | | | | 703 |
| Pakistan (2.0%) | | | | |
| Sovereign Bond (2.0%) | | | | |
| Islamic Republic of Pakistan | 8.250% | 4/15/24 | 200 | 219 |
| Total Pakistan (Cost $208) | | | | 219 |
| Panama (1.8%) | | | | |
| Sovereign Bond (1.8%) | | | | |
| 1 | Republic of Panama | 6.700% | 1/26/36 | 150 | 206 |
| Total Panama (Cost $203) | | | | 206 |
| Peru (3.8%) | | | | |
| Sovereign Bonds (3.8%) | | | | |
| Corp. Financiera de Desarrollo SA | 4.750% | 2/8/22 | 200 | 218 |
| Republic of Peru | 8.750% | 11/21/33 | 50 | 82 |
| Republic of Peru | 5.625% | 11/18/50 | 100 | 133 |
| Total Peru (Cost $393) | | | | 433 |
| Poland (3.0%) | | | | |
| Sovereign Bonds (3.0%) | | | | |
| Republic of Poland | 5.125% | 4/21/21 | 50 | 56 |
| Republic of Poland | 5.000% | 3/23/22 | 250 | 285 |
| Total Poland (Cost $333) | | | | 341 |
| Romania (1.0%) | | | | |
| Sovereign Bond (1.0%) | | | | |
| Republic of Romania | 6.125% | 1/22/44 | 80 | 108 |
| Total Romania (Cost $97) | | | | 108 |
13
| | | | | |
| Emerging Markets Bond Fund | | | | |
| |
| |
| Face | Market |
| Maturity | Amount | Value• |
| | Coupon | Date | ($000) | ($000) |
| Russia (3.8%) | | | | |
| Sovereign Bond (3.8%) | | | | |
| Russian Federation | 5.000% | 4/29/20 | 400 | 431 |
| Total Russia (Cost $421) | | | | 431 |
| Serbia, Republic of (3.7%) | | | | |
| Sovereign Bonds (3.7%) | | | | |
| Republic of Serbia | 5.875% | 12/3/18 | 200 | 212 |
| Republic of Serbia | 4.875% | 2/25/20 | 200 | 209 |
| Total Serbia, Republic of (Cost $413) | | | | 421 |
| South Africa (2.8%) | | | | |
| Sovereign Bond (2.8%) | | | | |
| 5 | Republic of South Africa | 6.250% | 3/31/36 | 6,000 | 321 |
| Total South Africa (Cost $285) | | | | 321 |
| Supranational (2.8%) | | | | |
| Sovereign Bond (2.8%) | | | | |
| 2 | Banque Ouest Africaine de Developpement | 5.500% | 5/6/21 | 300 | 319 |
| Total Supranational (Cost $297) | | | | 319 |
| Tunisia (1.7%) | | | | |
| Sovereign Bond (1.7%) | | | | |
| Banque Centrale de Tunisie SA | 5.750% | 1/30/25 | 200 | 196 |
| Total Tunisia (Cost $178) | | | | 196 |
| Turkey (6.2%) | | | | |
| Sovereign Bonds (6.2%) | | | | |
| Republic of Turkey | 5.125% | 3/25/22 | 500 | 521 |
| Republic of Turkey | 4.875% | 4/16/43 | 200 | 186 |
| Total Turkey (Cost $702) | | | | 707 |
| Ukraine (3.0%) | | | | |
| Sovereign Bonds (3.0%) | | | | |
| Ukraine | 7.750% | 9/1/19 | 200 | 197 |
| 1 | Ukreximbank Via Biz Finance plc | 9.625% | 4/27/22 | 150 | 147 |
| Total Ukraine (Cost $326) | | | | 344 |
| Uruguay (0.9%) | | | | |
| Sovereign Bond (0.9%) | | | | |
| 1 | Oriental Republic of Uruguay | 5.100% | 6/18/50 | 100 | 103 |
| Total Uruguay (Cost $102) | | | | 103 |
| Venezuela (3.0%) | | | | |
| Sovereign Bonds (3.0%) | | | | |
| Bolivarian Republic of Venezuela | 7.750% | 10/13/19 | 50 | 31 |
| Bolivarian Republic of Venezuela | 7.650% | 4/21/25 | 230 | 110 |
| 1 | Bolivarian Republic of Venezuela | 11.950% | 8/5/31 | 50 | 30 |
| Petroleos de Venezuela SA | 5.375% | 4/12/27 | 387 | 162 |
| Total Venezuela (Cost $254) | | | | 333 |
14
Emerging Markets Bond Fund
| | | | | |
| Market |
| Maturity | Value• |
| | Coupon | Date | Shares | ($000) |
| Temporary Cash Investments (3.2%) | | | | |
| Money Market Fund (3.2%) | | | | |
| 6 | Vanguard Market Liquidity Fund (Cost $361) | 0.640% | 3,616 | 361 |
| |
| Notional | |
| Expiration | Amount | |
| Counterparty | Date | (000) | |
| Options on Foreign Currency (0.0%) | | | | |
| Call options on USD, Strike Price: MXN 18.8689 | JPMC | 11/10/16 | USD 200 | 8 |
| Put options on AUD, Strike Price: USD 0.7340 | JPMC | 11/10/16 | AUD 275 | 1 |
| Total Options on Foreign Currency (Cost $6) | | | | 9 |
| Total Investments (98.8%) (Cost $10,622) | 11,218 |
| Other Assets and Liabilities (1.2%) | | | | |
| Other Assets7 | | | | 1,151 |
| Liabilities | | | | (1,022) |
| 129 |
| Net Assets (100%) | 11,347 |
| |
| Amount |
| ($000) |
| Statement of Assets and Liabilities | | | | |
| Assets | | | | |
| Investments in Securities, at Value |
| Unaffiliated Issuers | | | | 10,848 |
| Affiliated Vanguard Funds | | | | 361 |
| Options Purchased | | | | 9 |
| Total Investments in Securities | 11,218 |
| Investment in Vanguard | | | | 1 |
| Receivables for Investment Securities Sold | | | | 926 |
| Receivables for Accrued Income | | | | 155 |
| Other Assets7 | | | | 69 |
| Total Assets | | | | 12,369 |
| Liabilities | | | | |
| Payables for Investment Securities Purchased | | | | 924 |
| Payables to Vanguard | | | | 3 |
| Other Liabilities | | | | 95 |
| Total Liabilities | | | | 1,022 |
| Net Assets | 11,347 |
15
Emerging Markets Bond Fund
| |
| At September 30, 2016, net assets consisted of: | |
| Amount |
| ($000) |
| Paid-in Capital | 10,268 |
| Undistributed Net Investment Income | 25 |
| Accumulated Net Realized Gains | 448 |
| Unrealized Appreciation (Depreciation) | |
| Investment Securities | 593 |
| Futures Contracts | 3 |
| Options | 3 |
| Swap Contracts | 27 |
| Forward Currency Contracts | (20) |
| Foreign Currencies | — |
| Net Assets | 11,347 |
| |
| |
| Net Assets | |
| Applicable to 1,025,425 outstanding $.001 par value shares of | |
| beneficial interest (unlimited authorization) | 11,347 |
| Net Asset Value Per Share | $11.07 |
• See Note A in Notes to Financial Statements.
1 The average or expected maturity is shorter than the final maturity shown because of the possibility of interim principal payments and prepayments or the possibility of the issue being called.
2 Security exempt from registration under Rule 144A of the Securities Act of 1933. Such securities may be sold in transactions exempt from registration, normally to qualified institutional buyers. At September 30, 2016, the aggregate value of these securities was $720,000, representing 6.3% of net assets.
3 Face amount denominated in Indonesian rupiah. 4 Face amount denominated in euro.
5 Face amount denominated in South African rand.
6 Affiliated money market fund available only to Vanguard funds and certain trusts and accounts managed by Vanguard. Rate shown is the 7-day yield.
7 Cash of $4,000 has been segregated as initial margin for open futures contracts.
See accompanying Notes, which are an integral part of the Financial Statements.
16
| | | |
| Emerging Markets Bond Fund | | |
| |
| |
| Statement of Operations | | |
| |
| March 10, 20161 to |
| September 30, 2016 |
| | ($000) |
| Investment Income | | |
| Income | | |
| Interest2 | | 326 |
| Expenses | | |
| The Vanguard Group—Note B | | |
| Management and Administrative | | 6 |
| Marketing and Distribution | | — |
| Custodian Fees | | 5 |
| Auditing Fees | | 25 |
| Total Expenses | | 36 |
| Net Investment Income | | 290 |
| Realized Net Gain (Loss)2 | | |
| Investment Securities Sold | | 375 |
| Futures Contracts | | 39 |
| Options | | (2) |
| Swap Contracts | | 51 |
| Foreign Currencies and Forward Currency Contracts | | (11) |
| Realized Net Gain (Loss) | | 452 |
| Change in Unrealized Appreciation (Depreciation) | | |
| Investment Securities | | 593 |
| Futures Contracts | | 3 |
| Options | | 3 |
| Swap Contracts | | 27 |
| Foreign Currencies and Forward Currency Contracts | | (20) |
| Change in Unrealized Appreciation (Depreciation) | | 606 |
| Net Increase (Decrease) in Net Assets Resulting from Operations | 1,348 |
| 1 Inception. | | |
| 2 Interest income and realized net gain (loss) from an affiliated company of the fund was $2,000 and $0. | | |
- See accompanying Notes, which are an integral part of the Financial Statements.
17
| | |
| Emerging Markets Bond Fund | | |
| |
| |
| Statement of Changes in Net Assets | | |
| |
| March 10, 20161 to |
| September 30, 2016 |
| ($000) |
| Increase (Decrease) in Net Assets | | |
| Operations | | |
| Net Investment Income | 290 |
| Realized Net Gain (Loss) | 452 |
| Change in Unrealized Appreciation (Depreciation) | 606 |
| Net Increase (Decrease) in Net Assets Resulting from Operations | 1,348 |
| Distributions | | |
| Net Investment Income | (269) |
| Realized Capital Gain | — |
| Total Distributions | (269) |
| Capital Share Transactions | | |
| Issued | 10,000 |
| Issued in Lieu of Cash Distributions | 268 |
| Redeemed | — |
| Net Increase (Decrease) from Capital Share Transactions | 10,268 |
| Net Assets | | |
| Beginning of Period | — |
| End of Period2 | 11,347 |
| 1 Inception. | | |
| 2 Net Assets—End of Period includes undistributed (overdistributed) net investment income of $25,000. | | |
See accompanying Notes, which are an integral part of the Financial Statements.
18
| | |
| Emerging Markets Bond Fund | | |
| |
| |
| Financial Highlights | | |
| |
| |
| March 10, 20161 to |
| For a Share Outstanding Throughout the Period | September 30, 2016 |
| Net Asset Value, Beginning of Period | $10.00 |
| Investment Operations | | |
| Net Investment Income | . 286 |
| Net Realized and Unrealized Gain (Loss) on Investments | 1.050 |
| Total from Investment Operations | 1.336 |
| Distributions | | |
| Dividends from Net Investment Income | (.266) |
| Distributions from Realized Capital Gains | — |
| Total Distributions | (. 266) |
| Net Asset Value, End of Period | $11.07 |
| |
| Total Return2 | 13.51% |
| |
| Ratios/Supplemental Data | | |
| Net Assets, End of Period (Millions) | $11 |
| Ratio of Total Expenses to Average Net Assets | 0.60%3 |
| Ratio of Net Investment Income to Average Net Assets | 4.85%3 |
| Portfolio Turnover Rate | 153% |
1 Inception.
2 Total returns do not include account service fees that may have applied in the period shown. Fund prospectuses provide information about any applicable account service fees.
3 Annualized.
See accompanying Notes, which are an integral part of the Financial Statements.
19
Emerging Markets Bond Fund
Notes to Financial Statements
Vanguard Emerging Markets Bond Fund is registered under the Investment Company Act of 1940 as an open-end investment company, or mutual fund. The fund invests in securities of foreign issuers, which may subject it to investment risks not normally associated with investing in securities of U.S. corporations. To minimize the currency risk associated with investment in bonds denominated in currencies other than the U.S. dollar, the fund attempts to hedge its currency exposures. The fund offers two classes of shares: Investor Shares and Admiral Shares. Investor Shares are available to any investor who meets the fund’s minimum purchase requirements. Admiral Shares are designed for investors who meet certain administrative, service, and account-size criteria. The fund has not issued any Admiral Shares through September 30, 2016.
A. The following significant accounting policies conform to generally accepted accounting principles for U.S. investment companies. The fund consistently follows such policies in preparing its financial statements.
1. Security Valuation: Securities are valued as of the close of trading on the New York Stock Exchange (generally 4 p.m., Eastern time) on the valuation date. Bonds, and temporary cash investments acquired over 60 days to maturity, are valued using the latest bid prices or using valuations based on a matrix system (which considers such factors as security prices, yields, maturities, and ratings), both as furnished by independent pricing services. Investments in Vanguard Market Liquidity Fund are valued at that fund’s net asset value. Other temporary cash investments are valued at amortized cost, which approximates market value. Securities for which market quotations are not readily available, or whose values have been affected by events occurring before the fund’s pricing time but after the close of the securities’ primary markets, are valued at their fair values calculated according to procedures adopted by the board of trustees. These procedures include obtaining quotations from an independent pricing service, monitoring news to identify significant market- or security-specific events, and evaluating changes in the values of foreign market proxies (for example, ADRs, futures contracts, or exchange-traded funds), between the time the foreign markets close and the fund’s pricing time. When fair-value pricing is employed, the prices of securities used by a fund to calculate its net asset value may differ from quoted or published prices for the same securities.
2. Foreign Currency: Securities and other assets and liabilities denominated in foreign currencies are translated into U.S. dollars using exchange rates obtained from an independent third party as of the fund’s pricing time on the valuation date. Realized gains (losses) and unrealized appreciation (depreciation) on investment securities include the effects of changes in exchange rates since the securities were purchased, combined with the effects of changes in security prices. Fluctuations in the value of other assets and liabilities resulting from changes in exchange rates are recorded as unrealized foreign currency gains (losses) until the assets or liabilities are settled in cash, at which time they are recorded as realized foreign currency gains (losses).
3. Futures Contracts: The fund uses futures contracts to invest in fixed income asset classes with greater efficiency and lower cost than is possible through direct investment, to add value when these instruments are attractively priced, or to adjust sensitivity to changes in interest rates. The primary risks associated with the use of futures contracts are imperfect correlation between changes in market values of bonds held by the fund and the prices of futures contracts, and the possibility of an illiquid market. Counterparty risk involving futures is mitigated because a regulated clearinghouse is the counterparty instead of the clearing broker. To further mitigate counterparty risk, the fund
20
Emerging Markets Bond Fund
trades futures contracts on an exchange, monitors the financial strength of its clearing brokers and clearinghouse, and has entered into clearing agreements with its clearing brokers. The clearinghouse imposes initial margin requirements to secure the fund’s performance and requires daily settlement of variation margin representing changes in the market value of each contract.
Futures contracts are valued at their quoted daily settlement prices. The aggregate settlement values of the contracts are not recorded in the Statement of Assets and Liabilities. Fluctuations in the value of the contracts are recorded in the Statement of Assets and Liabilities as an asset (liability) and in the Statement of Operations as unrealized appreciation (depreciation) until the contracts are closed, when they are recorded as realized futures gains (losses).
During the period ended September 30, 2016, the fund’s average investments in long and short futures contracts represented 3% and less than 1% of net assets, respectively, based on the average of aggregate settlement values at each quarter-end during the period.
4. Forward Currency Contracts: The fund enters into forward currency contracts to protect the value of securities and related receivables and payables against changes in future foreign exchange rates. The fund’s risks in using these contracts include movement in the values of the foreign currencies relative to the U.S. dollar and the ability of the counterparties to fulfill their obligations under the contracts. The fund mitigates its counterparty risk by entering into forward currency contracts only with a diverse group of prequalified counterparties, monitoring their financial strength, entering into master netting arrangements with its counterparties, and requiring its counterparties to transfer collateral as security for their performance. In the absence of a default, the collateral pledged or received by the fund cannot be repledged, resold or rehypothecated. The master netting arrangements provide that, in the event of a counterparty’s default (including bankruptcy), the fund may terminate the forward currency contracts, determine the net amount owed by either party in accordance with its master netting arrangements, and sell or retain any collateral held up to the net amount owed to the fund under the master netting arrangements. The forward currency contracts contain provisions whereby a counterparty may terminate open contracts if the fund’s net assets decline below a certain level, triggering a payment by the fund if the fund is in a net liability position at the time of the termination. The payment amount would be reduced by any collateral the fund has pledged. Any assets pledged as collateral for open contracts are noted in the Statement of Assets and Liabilities. The value of collateral received or pledged is compared daily to the value of the forward currency contracts exposure with each counterparty, and any difference, if in excess of a specified minimum transfer amount, is adjusted and settled within two business days.
Forward currency contracts are valued at their quoted daily prices obtained from an independent third party, adjusted for currency risk based on the expiration date of each contract. The notional amounts of the contracts are not recorded in the Statement of Assets and Liabilities. Fluctuations in the value of the contracts are recorded in the Statement of Assets and Liabilities as an asset (liability) and in the Statement of Operations as unrealized appreciation (depreciation) until the contracts are closed, when they are recorded as realized forward currency contract gains (losses).
During the period ended September 30, 2016, the fund’s average investment in forward currency contracts represented 23% of net assets, based on the average of notional amounts at each quarter-end during the period.
21
Emerging Markets Bond Fund
5. Swap Contracts: The fund invests in credit default swaps to adjust the overall credit risk of the fund or to actively overweight or underweight credit risk to a specific issuer or group of issuers. The fund may sell credit protection through credit default swaps to simulate investments in long positions that are either unavailable or considered to be less attractively priced in the bond market. The fund may purchase credit protection through credit default swaps to reduce credit exposure to a given issuer or issuers. Under the terms of the swaps, an up-front payment may be exchanged between the seller and buyer. In addition, the seller of the credit protection receives a periodic payment of premium from the buyer that is a fixed percentage applied to a notional amount. If, for example, the reference entity is subject to a credit event (such as bankruptcy, failure to pay, or obligation acceleration) during the term of the swap, the seller agrees to either physically settle or cash settle the swap contract. If the swap is physically settled, the seller agrees to pay the buyer an amount equal to the notional amount and take delivery of a debt instrument of the reference issuer with a par amount equal to such notional amount. If the swap is cash settled, the seller agrees to pay the buyer the difference between the notional amount and the final price for the relevant debt instrument, as determined either in a market auction or pursuant to a pre-agreed-upon valuation procedure.
The fund enters into interest rate swap transactions to adjust the fund’s sensitivity to changes in interest rates and maintain the ability to generate income at prevailing market rates. Under the terms of the swaps, one party pays the other an amount that is a fixed percentage rate applied to a notional amount. In return, the counterparty agrees to pay a floating rate, which is reset periodically based on short-term interest rates, applied to the same notional amount.
The notional amounts of swap contracts are not recorded in the Statement of Assets and Liabilities. Swaps are valued daily based on market quotations received from independent pricing services or recognized dealers and the change in value is recorded in the Statement of Assets and Liabilities as an asset (liability) and in the Statement of Operations as unrealized appreciation (depreciation) until the seller of credit protection is required to take delivery (or, in a cash settled swap, pay the settlement amount determined) upon occurrence of a credit event, periodic payments are made, or the swap terminates, at which time realized gain (loss) is recorded. The net premium to be received or paid by the fund under swap contracts is accrued daily and recorded as realized gain (loss) over the life of the contract.
The primary risk associated with selling credit protection is that, upon the occurrence of a defined credit event, the market value of the debt instrument received by the fund (or, in a cash settled swap, the debt instruments used to determine the settlement payment by the fund) will be significantly less than the amount paid by the fund and, in a physically settled swap, the fund may receive an illiquid debt instrument. A risk associated with all types of swaps is the possibility that a counterparty may default on its obligation to pay net amounts due to the fund. The fund’s maximum amount subject to counterparty risk is the unrealized appreciation on the swap contract. The fund mitigates its counterparty risk by entering into swaps only with a diverse group of prequalified counterparties, monitoring their financial strength, entering into master netting arrangements with its counterparties, and requiring its counterparties to transfer collateral as security for their performance. In the absence of a default, the collateral pledged or received by the fund cannot be repledged, resold or rehypothecated. In the event of a counterparty’s default (including bankruptcy), the fund may terminate any swap contracts with that counterparty, determine the net amount owed by either party in accordance with its master netting arrangements, and sell or retain any collateral held up to the net amount owed to the fund under the master netting arrangements. The swap contracts contain provisions whereby a counterparty may
22
Emerging Markets Bond Fund
terminate open contracts if the fund’s net assets decline below a certain level, triggering a payment by the fund if the fund is in a net liability position at the time of the termination. The payment amount would be reduced by any collateral the fund has pledged. Any securities pledged as collateral for open contracts are noted in the Statement of Net Assets. The value of collateral received or pledged is compared daily to the value of the swap contracts exposure with each counterparty, and any difference, if in excess of a specified minimum transfer amount, is adjusted and settled within two business days.
During the period ended September 30, 2016, the fund’s average amounts of investments in credit protection sold and credit protection purchased represented 17% and less than 1% of net assets, respectively, based on the average of notional amounts at each quarter-end during the period. The average amount of interest rate swaps represented less than 1% of net assets, based on the average of notional amounts at each quarter-end during the period.
6. Options: The fund invests in options on foreign currency which are transacted over-the-counter (OTC) and not on an exchange. Unlike exchange-traded options, which are standardized with respect to the underlying instrument, expiration date, contract size, and strike price, the terms of OTC options generally are established through negotiation with the other party to the option contract. Although this type of arrangement allows the purchaser or writer greater flexibility to tailor an option to its needs, OTC options generally involve greater credit risk than exchange-traded options. Credit risk involves the possibility that a counterparty may default on its obligation to pay net amounts due to the fund. The fund mitigates its counterparty risk by entering into options with a diverse group of prequalified counterparties and monitoring their financial strength. The primary risk associated with purchasing options on foreign currency is that the value of the underlying foreign currencies may move in such a way that the option is out-of-the-money (the exercise price of the option exceeds the value of the underlying investment), the position is worthless at expiration, and the fund loses the premium paid. The primary risk associated with selling options on foreign currency is that the value of the underlying foreign currencies may move in such a way that the option is in-the-money (the exercise price of the option exceeds the value of the underlying investment), the counterparty exercises the option, and the fund loses an amount equal to the market value of the option written less the premium received. Options on foreign currency are valued daily based on market quotations received from independent pricing services or recognized dealers. The premium paid for a purchased option is recorded in the Statement of Assets and Liabilities as an asset that is subsequently adjusted daily to the current market value of the option purchased. The premium received for a written option is recorded in the Statement of Assets and Liabilities as an asset with an equal liability that is subsequently adjusted daily to the current market value of the option written. Fluctuations in the value of the options are recorded as unrealized appreciation (depreciation) until expired, closed, or exercised, at which time realized gains (losses) are recognized.
During the period ended September 30, 2016, the fund’s average value of investments in options purchased and options written represented less than 1% and 0% of net assets, respectively, based on the average of market values at each quarter-end during the period.
7. Federal Income Taxes: The fund intends to qualify as a regulated investment company and distribute all of its taxable income. Management has analyzed the fund’s tax positions taken for its open federal income tax period ended September 30, 2016, and has concluded that no provision for federal income tax is required in the fund’s financial statements.
8. Distributions: Distributions to shareholders are recorded on the ex-dividend date.
23
Emerging Markets Bond Fund
9. Credit Facility: The fund and certain other funds managed by The Vanguard Group (“Vanguard”) participate in a $3.1 billion committed credit facility provided by a syndicate of lenders pursuant to a credit agreement that may be renewed annually; each fund is individually liable for its borrowings, if any, under the credit facility. Borrowings may be utilized for temporary and emergency purposes, and are subject to the fund’s regulatory and contractual borrowing restrictions. The participating funds are charged administrative fees and an annual commitment fee of 0.10% of the undrawn amount of the facility; these fees are allocated to the funds based on a method approved by the fund’s board of trustees and included in Management and Administrative expenses on the fund’s Statement of Operations. Any borrowings under this facility bear interest at a rate based upon the higher of the one-month London Interbank Offered Rate, federal funds effective rate, or overnight bank funding rate plus an agreed-upon spread.
The fund had no borrowings outstanding at September 30, 2016, or at any time during the period then ended.
10. Other: Interest income includes income distributions received from Vanguard Market Liquidity Fund and is accrued daily. Premiums and discounts on debt securities purchased are amortized and accreted, respectively, to interest income over the lives of the respective securities. Security transactions are accounted for on the date securities are bought or sold. Costs used to determine realized gains (losses) on the sale of investment securities are those of the specific securities sold. Fees assessed on capital share transactions are credited to paid-in capital.
B. In accordance with the terms of a Funds’ Service Agreement (the “FSA”) between Vanguard and the fund, Vanguard furnishes to the fund investment advisory, corporate management, administrative, marketing, and distribution services at Vanguard’s cost of operations (as defined by the FSA). These costs of operations are allocated to the fund based on methods and guidelines approved by the board of trustees. Vanguard does not require reimbursement in the current period for certain costs of operations (such as deferred compensation/benefits and risk/insurance costs); the fund’s liability for these costs of operations is included in Payables to Vanguard on the Statement of Assets and Liabilities.
Upon the request of Vanguard, the fund may invest up to 0.40% of its net assets as capital in Vanguard. At September 30, 2016, the fund had contributed to Vanguard capital in the amount of $1,000, representing 0.01% of the fund’s net assets and 0.00% of Vanguard’s capitalization. The fund’s trustees and officers are also directors and employees, respectively, of Vanguard.
C. Various inputs may be used to determine the value of the fund’s investments. These inputs are summarized in three broad levels for financial statement purposes. The inputs or methodologies used to value securities are not necessarily an indication of the risk associated with investing in those securities.
Level 1—Quoted prices in active markets for identical securities.
Level 2—Other significant observable inputs (including quoted prices for similar securities, interest rates, prepayment speeds, credit risk, etc.).
Level 3—Significant unobservable inputs (including the fund’s own assumptions used to determine the fair value of investments).
24
Emerging Markets Bond Fund
The following table summarizes the market value of the fund’s investments as of September 30, 2016, based on the inputs used to value them:
| | | |
| Level 1 | Level 2 | Level 3 |
| Investments | ($000) | ($000) | ($000) |
| Corporate Bonds | — | 205 | — |
| Sovereign Bonds | — | 10,643 | — |
| Temporary Cash Investments | 361 | — | — |
| Options Purchased | — | 9 | — |
| Futures Contracts—Assets1 | 1 | — | — |
| Futures Contracts—Liabilities1 | (2) | — | — |
| Forward Currency Contracts—Assets | — | 13 | — |
| Forward Currency Contracts—Liabilities | — | (33) | — |
| Swap Contracts—Assets | — | 33 | — |
| Swap Contracts—Liabilities | — | (6) | — |
| Total | 360 | 10,864 | — |
| 1 Represents variation margin on the last day of the reporting period. | | | |
D. At September 30, 2016, the fair values of derivatives were reflected in the Statement of Assets and Liabilities as follows:
| | | | |
| Interest Rate | Currency | Credit | |
| Statement of Assets and | Contracts | Contracts | Contracts | Total |
| Liabilities Caption | ($000) | ($000) | ($000) | ($000) |
| Options Purchased | — | 9 | — | 9 |
| Other Assets | 1 | 13 | 33 | 47 |
| Liabilities | (6) | (33) | (2) | (41) |
Realized net gain (loss) and the change in unrealized appreciation (depreciation) on derivatives for the period ended September 30, 2016, were:
| | | | |
| Interest Rate | Currency | Credit | |
| Contracts | Contracts | Contracts | Total |
| Realized Net Gain (Loss) on Derivatives | ($000) | ($000) | ($000) | ($000) |
| Futures Contracts | 39 | — | — | 39 |
| Options | — | (2) | — | (2) |
| Swap Contracts | (3) | — | 54 | 51 |
| Forward Currency Contracts | — | (11) | — | (11) |
| Realized Net Gain (Loss) on Derivatives | 36 | (13) | 54 | 77 |
| |
| Change in Unrealized Appreciation | | | | |
| (Depreciation) on Derivatives | |
| Futures Contracts | 3 | — | — | 3 |
| Options | — | 3 | — | 3 |
| Swap Contracts | (4) | — | 31 | 27 |
| Forward Currency Contracts | — | (20) | — | (20) |
| Change in Unrealized Appreciation | | | | |
| (Depreciation) on Derivatives | (1) | (17) | 31 | 13 |
25
Emerging Markets Bond Fund
At September 30, 2016, the aggregate settlement value of open futures contracts and the related unrealized appreciation (depreciation) were:
| | | | |
| | | | ($000) |
| Aggregate |
| Number of | Settlement | Unrealized |
| Long (Short) | Value | Appreciation |
| Futures Contracts | Expiration | Contracts | Long (Short) | (Depreciation) |
| Ultra Long U.S. Treasury Bond | December 2016 | 1 | 184 | 3 |
| Ultra 10-Year U.S. Treasury Note | December 2016 | (1) | (144) | — |
| 3 |
Unrealized appreciation (depreciation) on open futures contracts is required to be treated as realized gain (loss) for tax purposes.
At September 30, 2016, the fund had open forward currency contracts to receive and deliver currencies as follows. Unrealized appreciation (depreciation) on open forward currency contracts is treated as ordinary income for tax purposes.
| | | | | | |
| Unrealized |
| Contract | Appreciation |
| Settlement | | Contract Amount (000) | (Depreciation) |
| Counterparty | Date | | Receive | | Deliver | ($000) |
| Barclays Capital | 10/5/16 | ZAR | 4,487 | USD | 330 | (4) |
| JPMorgan Chase Bank N.A. | 10/4/16 | MXN | 3,416 | USD | 175 | 1 |
| JPMorgan Chase Bank N.A. | 10/5/16 | EUR | 144 | USD | 162 | — |
| Citibank, N.A. | 10/4/16 | MXN | 2,489 | USD | 125 | 3 |
| JPMorgan Chase Bank N.A. | 11/15/16 | MXN | 1,297 | USD | 70 | (3) |
| JPMorgan Chase Bank N.A. | 11/14/16 | AUD | 60 | USD | 46 | — |
| Credit Suisse International | 10/7/16 | PLN | 4 | USD | 1 | — |
| Deutsche Bank AG | 10/7/16 | PLN | 4 | USD | 1 | — |
| Morgan Stanley Capital Services LLC | 11/2/16 | EUR | 70 | PLN | 302 | — |
| Barclays Capital | 11/2/16 | USD | 329 | ZAR | 4,487 | 4 |
| Morgan Stanley Capital Services LLC | 10/5/16 | USD | 303 | ZAR | 4,487 | (24) |
| JPMorgan Chase Bank N.A. | 11/2/16 | USD | 256 | EUR | 228 | — |
| Barclays Capital | 10/5/16 | USD | 161 | EUR | 144 | (1) |
| JPMorgan Chase Bank N.A. | 10/4/16 | USD | 126 | MXN | 2,452 | (1) |
| BNP Paribas | 11/15/16 | USD | 70 | MXN | 1,294 | 4 |
| JPMorgan Chase Bank N.A. | 11/14/16 | USD | 46 | AUD | 60 | — |
| JPMorgan Chase Bank N.A. | 10/6/16 | USD | 42 | TRY | 124 | 1 |
| Deutsche Bank AG | 11/2/16 | USD | 1 | PLN | 4 | — |
| Morgan Stanley Capital Services LLC | 10/7/16 | USD | 1 | PLN | 4 | — |
| | | | | | (20) |
| AUD—Australian dollar. | | | | | | |
| EUR—euro. | | | | | | |
| MXN—Mexican peso. | | | | | | |
| PLN—Polish new zloty. | | | | | | |
| TRY—Turkish new lira. | | | | | | |
| USD—U.S. dollar. | | | | | | |
| ZAR—South African rand. | | | | | | |
26
Emerging Markets Bond Fund
| | | | | | |
| At September 30, 2016, the fund had the following open swap contracts: | | |
| Over-the-Counter Credit Default Swaps | | | | | |
| Remaining | | |
| Up-Front | Periodic | |
| Premium | Premium | Unrealized |
| Notional | Received | Received | Appreciation |
| Termination | Amount | (Paid) | (Paid) | (Depreciation) |
| Reference Entity | Date | Counterparty | ($000) | ($000) | (%) | ($000) |
| Credit Protection Sold/Moody’s Rating | | | | | |
| Federation of Malaysia/A3 | 12/20/21 | BARC | 350 | 3 | 1.000 | 1 |
| Federative Republic of Brazil/Ba2 6/20/21 | BNPSW | 250 | 26 | 1.000 | 10 |
| Republic of Colombia/Baa2 | 12/20/21 | BNPSW | 300 | 13 | 1.000 | 3 |
| Republic of Peru/A3 | 12/20/21 | CITNA | 480 | 5 | 1.000 | 4 |
| Russian Federation/Ba1 | 12/20/20 | GSI | 350 | 26 | 1.000 | 15 |
| United Mexican States/A3 | 12/20/21 | BNPSW | 150 | 5 | 1.000 | — |
| 1,880 | 33 |
| |
| Credit Protection Purchased | | | | | | |
| Republic of Turkey | 6/20/21 | JPMC | 100 | (8) | (1.000) | (2) |
| 31 |
| The notional amount represents the maximum potential amount the fund could be required to pay as a seller of credit protection if the |
| reference entity was subject to a credit event. | | | | | |
| BARC—Barclays Bank plc. | | | | | | |
| BNPSW—BNP Paribas. | | | | | | |
| CITNA—Citibank, N.A. | | | | | | |
| GSI—Goldman Sachs International. | | | | | | |
| JPMC—JP Morgan Chase Bank. | | | | | | |
| | | | | |
| Over-the-Counter Interest Rate Swaps | | | | |
| Fixed | Floating | |
| Interest Rate | Interest Rate | Unrealized |
| Notional | Received | Received | Appreciation |
| Amount | (Paid) | (Paid) | (Depreciation) |
| Termination Date | Counterparty | (000) | (%) | (%) | ($000) |
| 8/6/2026 | BDAG | MXN 3,000 | 6.075 | (4.595)1 | (4) |
| BDAG—Deutsche Bank AG. | | | | | |
| MXN—Mexican peso. | | | | | |
| 1 Based on 28-day Mexican Interbank Rate (TIIE) as of the most recent reset date. | | | |
E. Distributions are determined on a tax basis and may differ from net investment income and realized capital gains for financial reporting purposes. Differences may be permanent or temporary. Permanent differences are reclassified among capital accounts in the financial statements to reflect their tax character. Temporary differences arise when certain items of income, expense, gain, or loss are recognized in different periods for financial statement and tax purposes. These differences will reverse at some time in the future. Differences in classification may also result from the treatment of short-term gains as ordinary income for tax purposes.
27
Emerging Markets Bond Fund
During the period ended September 30, 2016, the fund realized net foreign currency losses of $9,000 (including gains and losses on forward currency contracts and the foreign currency component on sales of foreign currency denominated bonds), which decreased distributable net income for tax purposes; accordingly, such losses have been reclassified from accumulated net realized gains to undistributed net investment income.
Realized and unrealized gains (losses) on certain of the fund’s swap contracts are treated as ordinary income (loss) for tax purposes; the effect on the fund’s income dividends to shareholders is offset by a change in principal return. Realized gains of $13,000 on swap contracts have been reclassified from accumulated net realized gains to undistributed net investment income.
For tax purposes, at September 30, 2016, the fund had $432,000 of ordinary income and $24,000 of long-term capital gains available for distribution.
At September 30, 2016, the cost of investment securities for tax purposes was $10,616,000. Net unrealized appreciation of investment securities for tax purposes was $593,000, consisting of unrealized gains of $600,000 on securities that had risen in value since their purchase and $7,000 in unrealized losses on securities that had fallen in value since their purchase.
F. During the period ended September 30, 2016, the fund purchased $24,065,000 of investment securities and sold $14,776,000 of investment securities, other than U.S. government securities and temporary cash investments. Purchases and sales of U.S. government securities were $257,000 and $255,000, respectively.
G. Capital shares issued and redeemed were:
| | |
| March 10, 20161 to |
| September 30, 2016 |
| Shares |
| (000) |
| Issued | 1,000 |
| Issued in Lieu of Cash Distributions | 25 |
| Redeemed | — |
| Net Increase (Decrease) in Shares Outstanding | 1,025 |
| 1 Inception. | | |
At September 30, 2016, a subsidiary of Vanguard was the record or beneficial owner of 100% of the fund’s net assets. If the shareholder were to redeem its investment in the fund, the redemption might result in an increase in the fund’s expense ratio, cause the fund to incur higher transaction costs, or lead to the realization of taxable capital gains.
H. Management has determined that no material events or transactions occurred subsequent to September 30, 2016, that would require recognition or disclosure in these financial statements.
28
Report of Independent Registered Public Accounting Firm
To the Board of Trustees of Vanguard Malvern Funds and the Shareholders of Vanguard Emerging Markets Bond Fund: In our opinion, the accompanying statement of net assets, statement of assets and liabilities and the related statements of operations and of changes in net assets and the financial highlights present fairly, in all material respects, the financial position of Vanguard Emerging Markets Bond Fund (constituting a separate portfolio of Vanguard Malvern Funds, hereafter referred to as the “Fund”) at September 30, 2016, and the results of its operations, the changes in its net assets, and the financial highlights for the period March 10, 2016 (commencement of operations) through September 30, 2016, in conformity with accounting principles generally accepted in the United States of America. These financial statements and financial highlights (hereafter referred to as “financial statements”) are the responsibility of the Fund’s management. Our responsibility is to express an opinion on these financial statements based on our audit. We conducted our audit of these financial statements in accordance with the standards of the Public Company Accounting Oversight Board (United States). Those standards require that we plan and perform the audit to obtain reasonable assurance about whether the financial statements are free of material misstatement. An audit includes examining, on a test basis, evidence supporting the amounts and disclosures in the financial statements, assessing the accounting principles used and significant estimates made by management, and evaluating the overall financial statement presentation. We believe that our audit, which included confirmation of securities at September 30, 2016 by correspondence with the custodian and brokers and by agreement to the underlying ownership records of the transfer agent, provide a reasonable basis for our opinion.
/s/PricewaterhouseCoopers LLP
Philadelphia, Pennsylvania
November 15, 2016
29
About Your Fund’s Expenses
As a shareholder of the fund, you incur ongoing costs, which include costs for portfolio management, administrative services, and shareholder reports (like this one), among others. Operating expenses, which are deducted from a fund’s gross income, directly reduce the investment return of the fund.
A fund’s expenses are expressed as a percentage of its average net assets. This figure is known as the expense ratio. The following examples are intended to help you understand the ongoing costs (in dollars) of investing in your fund and to compare these costs with those of other mutual funds. The examples are based on an investment of $1,000 made at the beginning of the period shown and held for the entire period.
The accompanying table illustrates your fund’s costs in two ways:
• Based on actual fund return. This section helps you to estimate the actual expenses that you paid over the period. The ”Ending Account Value“ shown is derived from the fund‘s actual return, and the third column shows the dollar amount that would have been paid by an investor who started with $1,000 in the fund. You may use the information here, together with the amount you invested, to estimate the expenses that you paid over the period.
To do so, simply divide your account value by $1,000 (for example, an $8,600 account value divided by $1,000 = 8.6), then multiply the result by the number given for your fund under the heading ”Expenses Paid During Period.“
• Based on hypothetical 5% yearly return. This section is intended to help you compare your fund‘s costs with those of other mutual funds. It assumes that the fund had a yearly return of 5% before expenses, but that the expense ratio is unchanged. In this case—because the return used is not the fund’s actual return—the results do not apply to your investment. The example is useful in making comparisons because the Securities and Exchange Commission requires all mutual funds to calculate expenses based on a 5% return. You can assess your fund’s costs by comparing this hypothetical example with the hypothetical examples that appear in shareholder reports of other funds.
Note that the expenses shown in the table are meant to highlight and help you compare ongoing costs only and do not reflect transaction costs incurred by the fund for buying and selling securities. Further, the expenses do not include any purchase, redemption, or account service fees described in the fund prospectus. If such fees were applied to your account, your costs would be higher. Your fund does not carry a “sales load.” The calculations assume no shares were bought or sold during the period. Your actual costs may have been higher or lower, depending on the amount of your investment and the timing of any purchases or redemptions.
You can find more information about the fund’s expenses, including annual expense ratios, in the Financial Statements section of this report. For additional information on operating expenses and other shareholder costs, please refer to your fund’s current prospectus.
30
| | | |
| Six Months Ended September 30, 2016 | | | |
| Beginning | Ending | Expenses |
| Account Value | Account Value | Paid During |
| Emerging Markets Government Bond Fund | 3/31/2016 | 9/30/2016 | Period1 |
| Based on Actual Portfolio Return | $1,000.00 | $1,117.94 | $3.18 |
| Based on Hypothetical 5% Yearly Return | 1,000.00 | 1,022.00 | 3.03 |
1 The calculations are based on expenses incurred in the most recent six-month period. The fund’s annualized six-month expense ratio for that period is 0.60%. The dollar amounts shown as “Expenses Paid” are equal to the annualized expense ratio multiplied by the average account value over the period, multiplied by the number of days in the most recent six-month period, then divided by the number of days in the most recent 12-month period (183/366).
31
Glossary
30-Day SEC Yield. A fund’s 30-day SEC yield is derived using a formula specified by the U.S. Securities and Exchange Commission. Under the formula, data related to the fund’s security holdings in the previous 30 days are used to calculate the fund’s hypothetical net income for that period, which is then annualized and divided by the fund’s estimated average net assets over the calculation period. For the purposes of this calculation, a security’s income is based on its current market yield to maturity (for bonds), its actual income (for asset-backed securities), or its projected dividend yield (for stocks). Because the SEC yield represents hypothetical annualized income, it will differ—at times significantly—from the fund’s actual experience. As a result, the fund’s income distributions may be higher or lower than implied by the SEC yield.
Average Coupon. The average interest rate paid on the fixed income securities held by a fund. It is expressed as a percentage of face value.
Average Duration. An estimate of how much the value of the bonds held by a fund will fluctuate in response to a change in interest rates. To see how the value could change, multiply the average duration by the change in rates. If interest rates rise by 1 percentage point, the value of the bonds in a fund with an average duration of five years would decline by about 5%. If rates decrease by a percentage point, the value would rise by 5%.
Average Effective Maturity. The average length of time until fixed income securities held by a fund reach maturity and are repaid, taking into consideration the possibility that the issuer may call the bond before its maturity date. The figure reflects the proportion of fund assets represented by each security; it also reflects any futures contracts held. In general, the longer the average effective maturity, the more a fund’s share price will fluctuate in response to changes in market interest rates.
Credit Quality. Credit-quality ratings are measured on a scale that generally ranges from AAA (highest) to D (lowest). U.S. Treasury, U.S. Agency, and U.S. Agency mortgage-backed securities appear under “U.S. Government.” Credit-quality ratings are obtained from Moody’s and S&P, and the higher rating for each issue is shown. “Not Rated” is used to classify securities for which a rating is not available. Not rated securities include a fund’s investment in Vanguard Market Liquidity Fund or Vanguard Municipal Cash Management Fund, each of which invests in high-quality money market instruments and may serve as a cash management vehicle for the Vanguard funds, trusts, and accounts.
Expense Ratio. A fund’s total annual operating expenses expressed as a percentage of the fund’s average net assets. The expense ratio includes management and administrative expenses, but does not include the transaction costs of buying and selling portfolio securities.
Inception Date. The date on which the assets of a fund (or one of its share classes) are first invested in accordance with the fund’s investment objective. For funds with a subscription period, the inception date is the day after that period ends. Investment performance is measured from the inception date.
Short-Term Reserves. The percentage of a fund invested in highly liquid, short-term securities that can be readily converted to cash.
Yield to Maturity. The rate of return an investor would receive if the fixed income securities held by a fund were held to their maturity dates.
32
This page intentionally left blank.
This page intentionally left blank.
This page intentionally left blank.
The People Who Govern Your Fund
The trustees of your mutual fund are there to see that the fund is operated and managed in your best interests since, as a shareholder, you are a part owner of the fund. Your fund’s trustees also serve on the board of directors of The Vanguard Group, Inc., which is owned by the Vanguard funds and provides services to them on an at-cost basis.
A majority of Vanguard’s board members are independent, meaning that they have no affiliation with Vanguard or the funds they oversee, apart from the sizable personal investments they have made as private individuals. The independent board members have distinguished backgrounds in business, academia, and public service. Each of the trustees and executive officers oversees 198 Vanguard funds.
The following table provides information for each trustee and executive officer of the fund. The mailing address of the trustees and officers is P.O. Box 876, Valley Forge, PA 19482. More information about the trustees is in the Statement of Additional Information, which can be obtained, without charge, by contacting Vanguard at 800-662-7447, or online at vanguard.com.
InterestedTrustee1 F. William McNabb III
Born 1957. Trustee Since July 2009. Chairman of the Board. Principal Occupation(s) During the Past Five Years and Other Experience: Chairman of the Board of The Vanguard Group, Inc., and of each of the investment companies served by The Vanguard Group, since January 2010; Director of The Vanguard Group since 2008; Chief Executive Officer and President of The Vanguard Group, and of each of the investment companies served by The Vanguard Group, since 2008; Director of Vanguard Marketing Corporation; Managing Director of The Vanguard Group (1995–2008).
IndependentTrustees Emerson U. Fullwood
Born 1948. Trustee Since January 2008. Principal Occupation(s) During the Past Five Years and Other Experience: Executive Chief Staff and Marketing Officer for North America and Corporate Vice President (retired 2008) of Xerox Corporation (document management products and services); Executive in Residence and 2009–2010 Distinguished Minett Professor at the Rochester Institute of Technology; Lead Director of SPX FLOW, Inc. (multi-industry manufacturing); Director of the United Way of Rochester, the University of Rochester Medical Center, Monroe Community College Foundation, North Carolina A&T University, and Roberts Wesleyan College.
Rajiv L. Gupta
Born 1945. Trustee Since December 2001.2 Principal Occupation(s) During the Past Five Years and Other Experience: Chairman and Chief Executive Officer (retired 2009) and President (2006–2008) of Rohm and Haas Co. (chemicals); Director of Tyco International plc (diversified manufacturing and services), HP Inc. (printer and personal computer manufacturing), and Delphi Automotive plc (automotive components); Senior Advisor at New Mountain Capital.
Amy Gutmann
Born 1949. Trustee Since June 2006. Principal Occupation(s) During the Past Five Years and Other Experience: President of the University of Pennsylvania; Christopher H. Browne Distinguished Professor of Political Science, School of Arts and Sciences, and Professor of Communication, Annenberg School for Communication, with secondary faculty appointments in the Department of Philosophy, School of Arts and Sciences, and at the Graduate School of Education, University of Pennsylvania; Trustee of the National Constitution Center; Chair of the Presidential Commission for the Study of Bioethical Issues.
JoAnn Heffernan Heisen
Born 1950. Trustee Since July 1998. Principal Occupation(s) During the Past Five Years and Other Experience: Corporate Vice President and Chief Global Diversity Officer (retired 2008) and Member of the Executive Committee (1997–2008) of Johnson & Johnson (pharmaceuticals/medical devices/consumer products); Director of Skytop Lodge Corporation (hotels) and the Robert Wood Johnson Foundation; Member of the Advisory Board of the Institute for Women’s Leadership at Rutgers University.
F. Joseph Loughrey
Born 1949. Trustee Since October 2009. Principal Occupation(s) During the Past Five Years and Other Experience: President and Chief Operating Officer (retired 2009) of Cummins Inc. (industrial machinery); Chairman of the Board of Hillenbrand, Inc. (specialized consumer services), and of Oxfam America; Director of SKF AB (industrial machinery), Hyster-Yale Materials Handling, Inc. (forklift trucks), the Lumina Foundation for Education, and the V Foundation for Cancer Research; Member of the Advisory Council for the College of Arts and Letters and of the Advisory Board to the Kellogg Institute for International Studies, both at the University of Notre Dame.
Mark Loughridge
Born 1953. Trustee Since March 2012. Principal Occupation(s) During the Past Five Years and Other Experience: Senior Vice President and Chief Financial Officer (retired 2013) at IBM (information technology services); Fiduciary Member of IBM’s Retirement Plan Committee (2004–2013); Director of the Dow Chemical Company; Member of the Council on Chicago Booth.
Scott C. Malpass
Born 1962. Trustee Since March 2012. Principal Occupation(s) During the Past Five Years and Other Experience: Chief Investment Officer and Vice President at the University of Notre Dame; Assistant Professor of Finance at the Mendoza College of Business at Notre Dame; Member of the Notre Dame 403(b) Investment Committee, the Board of Advisors for Spruceview Capital Partners, and the Investment Advisory Committee of Major League Baseball; Board Member of TIFF Advisory Services, Inc., and Catholic Investment Services, Inc. (investment advisors).
André F. Perold
Born 1952. Trustee Since December 2004. Principal Occupation(s) During the Past Five Years and Other Experience: George Gund Professor of Finance and Banking, Emeritus at the Harvard Business School (retired 2011); Chief Investment Officer and Managing Partner of HighVista Strategies LLC (private investment firm); Director of Rand Merchant Bank; Overseer of the Museum of Fine Arts Boston.
Peter F. Volanakis
Born 1955. Trustee Since July 2009. Principal Occupation(s) During the Past Five Years and Other Experience: President and Chief Operating Officer (retired 2010) of Corning Incorporated (communications equipment); Chairman of the Board of Trustees of Colby-Sawyer College; Member of the Advisory Board of the Norris Cotton Cancer Center.
Executive Officers Glenn Booraem
Born 1967. Treasurer Since May 2015. Principal Occupation(s) During the Past Five Years and Other Experience: Principal of The Vanguard Group, Inc.; Treasurer of each of the investment companies served by The Vanguard Group; Controller of each of the investment companies served by The Vanguard Group (2010–2015); Assistant Controller of each of the investment companies served by The Vanguard Group (2001–2010).
Thomas J. Higgins
Born 1957. Chief Financial Officer Since September 2008. Principal Occupation(s) During the Past Five Years and Other Experience: Principal of The Vanguard Group, Inc.; Chief Financial Officer of each of the investment companies served by The Vanguard Group; Treasurer of each of the investment companies served by The Vanguard Group (1998–2008).
Peter Mahoney
Born 1974. Controller Since May 2015. Principal Occupation(s) During the Past Five Years and Other Experience: Head of Global Fund Accounting at The Vanguard Group, Inc.; Controller of each of the investment companies served by The Vanguard Group; Head of International Fund Services at The Vanguard Group (2008–2014).
Anne E. Robinson
Born 1970. Secretary Since September 2016. Principal Occupation(s) During the Past Five Years and Other Experience: Managing Director of The Vanguard Group, Inc.; General Counsel of The Vanguard Group; Secretary of The Vanguard Group and of each of the investment companies served by The Vanguard Group; Director and Senior Vice President of Vanguard Marketing Corporation; Managing Director and General Counsel of Global Cards and Consumer Services at Citigroup (2014–2016); Counsel at American Express (2003–2014).
Vanguard Senior Management Team
| |
Mortimer J. Buckley Kathleen C. Gubanich Martha G. King John T. Marcante Chris D. McIsaac | James M. Norris Thomas M. Rampulla Glenn W. Reed Karin A. Risi Michael Rollings |
Chairman Emeritus and Senior Advisor John J. Brennan
Chairman, 1996–2009
Chief Executive Officer and President, 1996–2008
Founder John C. Bogle
Chairman and Chief Executive Officer, 1974–1996
1 Mr. McNabb is considered an “interested person,” as defined in the Investment Company Act of 1940, because he is an officer of the Vanguard funds.
2 December 2002 for Vanguard Equity Income Fund, the Vanguard Municipal Bond Funds, and the Vanguard State Tax-Exempt Funds.
 |
| P.O. Box 2600 |
| Valley Forge, PA 19482-2600 |
Connect with Vanguard® > vanguard.com
| |
| Fund Information > 800-662-7447 | |
| |
| Direct Investor Account Services > 800-662-2739 | |
| |
| Institutional Investor Services > 800-523-1036 | |
| |
| Text Telephone for People | |
| Who Are Deaf or Hard of Hearing > 800-749-7273 | |
| |
| This material may be used in conjunction | |
| with the offering of shares of any Vanguard | |
| fund only if preceded or accompanied by | |
| the fund’s current prospectus. | |
| |
| All comparative mutual fund data are from Lipper, a | |
| Thomson Reuters Company, or Morningstar, Inc., unless | |
| otherwise noted. | |
| |
| You can obtain a free copy of Vanguard’s proxy voting | |
| guidelines by visiting vanguard.com/proxyreporting or by | |
| calling Vanguard at 800-662-2739. The guidelines are | |
| also available from the SEC’s website, sec.gov. In | |
| addition, you may obtain a free report on how your fund | |
| voted the proxies for securities it owned during the 12 | |
| months ended June 30. To get the report, visit either | |
| vanguard.com/proxyreporting or sec.gov. | |
| |
| You can review and copy information about your fund at | |
| the SEC’s Public Reference Room in Washington, D.C. To | |
| find out more about this public service, call the SEC at | |
| 202-551-8090. Information about your fund is also | |
| available on the SEC’s website, and you can receive | |
| copies of this information, for a fee, by sending a | |
| request in either of two ways: via email addressed to | |
| publicinfo@sec.gov or via regular mail addressed to the | |
| Public Reference Section, Securities and Exchange | |
| Commission, Washington, DC 20549-1520. | |
| | © 2016 The Vanguard Group, Inc. |
| | All rights reserved. |
| | Vanguard Marketing Corporation, Distributor. |
| | Q14310 112016 |

Annual Report | September 30, 2016
Vanguard Institutional Bond Funds
Vanguard Institutional Short-Term Bond Fund
Vanguard Institutional Intermediate-Term Bond Fund
A new format, unwavering commitment
As you begin reading this report, you’ll notice that we’ve made some improvements to the opening sections—based on feedback from you, our clients.
Page 1 starts with a new ”Your Fund’s Performance at a Glance,” a concise, handy summary of how your fund performed during the period.
In the renamed ”Chairman’s Perspective,” Bill McNabb will focus on enduring principles and investment insights.
We’ve modified some tables, and eliminated some redundancy, but we haven’t removed any information.
At Vanguard, we’re always looking for better ways to communicate and to help you make sound investment decisions. Thank you for entrusting your assets to us.
| |
| Contents | |
| Your Fund’s Performance at a Glance. | 1 |
| Chairman’s Perspective. | 3 |
| Institutional Short-Term Bond Fund. | 6 |
| Institutional Intermediate-Term Bond Fund. | 39 |
| About Your Fund’s Expenses. | 80 |
| Glossary. | 82 |
Please note: The opinions expressed in this report are just that—informed opinions. They should not be considered promises or advice. Also, please keep in mind that the information and opinions cover the period through the date on the front of this report. Of course, the risks of investing in your fund are spelled out in the prospectus.
See the Glossary for definitions of investment terms used in this report.
About the cover: No matter what language you speak, Vanguard has one consistent message and set of principles. Our primary focus is on you, our clients. We conduct our business with integrity as a faithful steward of your assets. This message is shown translated into seven languages, reflecting our expanding global presence.
Your Fund’s Performance at a Glance
• Vanguard Institutional Short-Term Bond Fund returned almost 2% and Vanguard Institutional Intermediate-Term Bond Fund returned close to 4% for the 12 months ended September 30, 2016. Both funds outpaced their benchmarks; the Short-Term Fund fell short of the average return of its peers.
• Demand for U.S. taxable bonds benefited from ongoing concerns about global growth and the ability of central banks to lift inflation, as well as uncertainty stemming from the United Kingdom’s vote to leave the European Union. The Federal Reserve’s decision to leave rates unchanged and the comparatively high yields on U.S. bonds for international investors helped as well.
• The funds’ holdings in asset-backed securities boosted relative performance.
• Over the ten years ended September 30, 2016, the Short-Term Fund’s average annual return was almost 3% and the Intermediate-Term Fund’s average annual return was more than 4%. Both funds bested their comparative standards.
| | | | |
| Total Returns: Fiscal Year Ended September 30, 2016 | | | | |
| | 30-Day SEC | Income | Capital | Total |
| | Yield | Returns | Returns | Returns |
| Vanguard Institutional Short-Term Bond Fund | | | | |
| Institutional Plus Shares | 1.24% | 1.37% | 0.38% | 1.75% |
| Bloomberg Barclays U.S. 1-3 Year Government/Credit ex | | | | |
| Baa Index | | | | 1.11 |
| 1–5 Year Investment-Grade Debt Funds Average | | | | 2.24 |
| 1–5 Year Investment-Grade Debt Funds Average: Derived from data provided by Lipper, a Thomson Reuters Company. | |
| |
| Vanguard Institutional Intermediate-Term Bond Fund | | | | |
| Institutional Plus Shares | 1.47% | 2.06% | 1.64% | 3.70% |
| Bloomberg Barclays U.S. Intermediate Aggregate ex Baa | | | | |
| Index | | | | 3.24 |
Institutional Plus Shares are available to certain institutional investors who meet specific administrative, service, and account-size criteria.
1
| |
| Total Returns: Ten Years Ended September 30, 2016 | |
| | Average |
| | Annual Return |
| Institutional Short-Term Bond Fund Institutional Plus Shares | 2.89% |
| Bloomberg Barclays U.S. 1-3 Year Government/Credit ex Baa Index | 2.47 |
| 1–5 Year Investment-Grade Debt Funds Average | 2.42 |
| 1–5 Year Investment-Grade Debt Funds Average: Derived from data provided by Lipper, a Thomson Reuters Company. | |
| |
| Institutional Intermediate-Term Bond Fund Institutional Plus Shares | 4.22% |
| Bloomberg Barclays U.S. Intermediate Aggregate ex Baa Index | 4.20 |
The figures shown represent past performance, which is not a guarantee of future results. (Current performance may be lower or higher than the performance data cited. For performance data current to the most recent month-end, visit our website at vanguard.com/performance.) Note, too, that both investment returns and principal value can fluctuate widely, so an investor’s shares, when sold, could be worth more or less than their original cost.
2
Chairman’s Perspective

Bill McNabb
Chairman and Chief Executive Officer
Dear Shareholder,
If you think you’ve had reason to feel uneasy about the investment environment lately, you’re not imagining things. In just the past few months, we’ve seen economic uncertainty, intense political polarization, and super-low bond yields. Yet at the same time, the stock market kept pushing higher.
In this confusing and sometimes contradictory climate, you may be asking yourself a question that I hear often: How do I make sense of all this, keep investing, and still get a good night’s sleep?
As with any problem, there are multiple ways to go at it. But there’s one approach in particular that is simple, straightforward, and nearly foolproof: Save more money. Not only can saving more give you a greater sense of control over your investment plan, it can help compensate for long-term returns that, in our estimation, could fall short of historical averages.
I love the way one of our investment pros put it. Fran Kinniry this summer told The Wall Street Journal, “Investing is always a partnership between you and the markets.” He explained that the markets carried more than their fair share of the weight for a couple of decades, through the 1990s, providing outsized returns that made the investor’s half of the partnership relatively light work. “But now you are going to have to be the majority partner.”
Sobering? Sure. Hopeless? Definitely not.
3
Over the 12 months since last September, U.S. stocks returned 15%, though the rise has not been a one-way ticket straight up. International markets have also posted strong returns, but lower than those of the broad U.S. market. The decision by United Kingdom voters in June to exit the European Union came as a surprise but caused market heartburn for only a few days.
In fixed income, yields remained extremely low—about 1.60% on the 10-year U.S. Treasury note at the end of September, after dipping below 1.40% over the summer. And bond yields in some international markets were negative.
Even this relatively small window of time illustrates a truism of the financial markets: There will always be segments that perform well and others that don’t. Saving more saves you from trying to control the uncontrollable—how economies and the markets perform. And it keeps you in control of one of the most vital parts of your investment program.
Although the “save more” logic is easy to grasp, it’s not always easy to follow. Bills, illness, the loss of a job—these can affect any of us.
But whatever our circumstances, figuring out how to save more is worth the effort. It requires that we make difficult decisions to forgo some consumption today to increase the likelihood of consuming (or consuming more) in the future. This is the very heart of investing. Sacrifices are never fun, so consider carrying them out systematically and in doses that you
| | | |
| Market Barometer | | | |
| | | Average Annual Total Returns |
| | | Periods Ended September 30, 2016 |
| | One | Three | Five |
| | Year | Years | Years |
| Stocks | | | |
| Russell 1000 Index (Large-caps) | 14.93% | 10.78% | 16.41% |
| Russell 2000 Index (Small-caps) | 15.47 | 6.71 | 15.82 |
| Russell 3000 Index (Broad U.S. market) | 14.96 | 10.44 | 16.36 |
| FTSE All-World ex US Index (International) | 9.62 | 0.71 | 6.50 |
| |
| Bonds | | | |
| Bloomberg Barclays U.S. Aggregate Bond Index | | | |
| (Broad taxable market) | 5.19% | 4.03% | 3.08% |
| Bloomberg Barclays Municipal Bond Index | | | |
| (Broad tax-exempt market) | 5.58 | 5.54 | 4.48 |
| Citigroup Three-Month U.S. Treasury Bill Index | 0.20 | 0.06 | 0.06 |
| |
| CPI | | | |
| Consumer Price Index | 1.46% | 1.03% | 1.25% |
4
can be comfortable with—for instance, gradually getting up to the max in your IRA, or adding a percentage point or so to the amount you stash in your employer’s retirement plan. As a point of reference, we generally suggest that investors strive for a retirement savings rate of 12%–15%, including any employer contributions.
If you need more convincing about the wisdom of the “save more” course of action, it might be helpful to examine your alternatives. This list is by no means exhaustive, but it hits on a few of the big ones, and none are without risk.
• Reach for yield. With yields so low on many types of bonds, it’s tempting to find the corners of the fixed income market where payouts are juicier. But with the juice comes considerable risk. You need to be aware that you’d be taking on more risk—and how much more.
• Go all-in on a hot-performing asset class or fund. By now, you know better than that, right?
• Sit tight. This approach isn’t a terrible idea; it’s better than panicking and deciding to just “do something,” particularly if that means changing your approach in response to the market’s movements.
Here’s the inescapably challenging part of your partnership with the markets: In the short run, your “partner” is fickle, emotional, and wildly unpredictable. But in the long run, your partner is mostly rational and extremely helpful.
The best way to minimize your vulnerability to the market’s mood swings, and to maximize the benefit of your partner’s longer-term strengths, is to expect less and save more. Maybe the markets will deliver better-than-expected returns. Maybe they’ll be consistent with our more modest expectations. In either case, a higher savings rate can help put you in a better position to reach your goals.
As always, thank you for investing with Vanguard.
Sincerely,

F. William McNabb III
Chairman and Chief Executive Officer
October 18, 2016
5
Institutional Short-Term Bond Fund
Fund Profile
As of September 30, 2016
| | | |
| Financial Attributes | | |
| | | | Bloomberg |
| | | Bloomberg | Barclays |
| | | Barclays | U.S. |
| | | U.S. 1-3 | Aggregate |
| | | Year | Float |
| | | Gov/Credit | Adjusted |
| | Fund ex Baa Index | Index |
| Number of Bonds | 776 | 1,207 | 9,908 |
| Yield to Maturity | | | |
| (before expenses) | 1.2% | 0.9% | 2.0% |
| Average Coupon | 1.9% | 1.8% | 3.1% |
| Average Duration | 1.8 years | 1.9 years | 5.8 years |
| Average Effective | | | |
| Maturity | 2.2 years | 2.0 years | 8.0 years |
| Ticker Symbol | VISTX | — | — |
| Expense Ratio1 | 0.02% | — | — |
| 30-Day SEC Yield | 1.24% | — | — |
| Short-Term | | | |
| Reserves | 7.0% | — | — |
| | |
| Volatility Measures | | |
| | Bloomberg | |
| | Barclays | Bloomberg |
| | U.S. 1-3 Year | Barclays U.S. |
| | Gov/Credit | Aggregate Float |
| | ex Baa Index | Adjusted Index |
| R-Squared | 0.91 | 0.66 |
| Beta | 0.92 | 0.21 |
| These measures show the degree and timing of the fund’s |
| fluctuations compared with the indexes over 36 months. |
| |
| Sector Diversification (% of portfolio) |
| Asset-Backed | | 29.2% |
| Commercial Mortgage-Backed | 1.9 |
| Finance | | 19.9 |
| Foreign | | 9.9 |
| Industrial | | 9.9 |
| Treasury/Agency | | 27.6 |
| Utilities | | 1.5 |
| Other | | 0.1 |
The agency and mortgage-backed securities sectors may include issues from government-sponsored enterprises; such issues are generally not backed by the full faith and credit of the U.S. government.
| |
| Distribution by Credit Quality (% of portfolio) |
| U.S. Government | 22.6% |
| Aaa | 35.0 |
| Aa | 14.8 |
| A | 20.4 |
| Ba | 0.1 |
| Not Rated | 7.1 |
Credit-quality ratings are obtained from Moody’s and S&P, and the higher rating for each issue is shown. “Not Rated” is used to classify securities for which a rating is not available. Not rated securities include a fund’s investment in Vanguard Market Liquidity Fund or Vanguard Municipal Cash Management Fund, each of which invests in high-quality money market instruments and may serve as a cash management vehicle for the Vanguard funds, trusts, and accounts. For more information about these ratings, see the Glossary entry for Credit Quality.
| |
| Distribution by Effective Maturity | |
| (% of portfolio) | |
| Under 1 Year | 16.5% |
| 1 - 3 Years | 66.1 |
| 3 - 5 Years | 14.5 |
| 5 - 7 Years | 2.2 |
| 7 - 10 Years | 0.7 |
1 The expense ratio shown is from the prospectus dated January 27, 2016, and represents estimated costs for the current fiscal year. For the fiscal year ended September 30, 2016, the expense ratio was 0.02%.
6
Institutional Short-Term Bond Fund
Performance Summary
All of the returns in this report represent past performance, which is not a guarantee of future results that may be achieved by the fund. (Current performance may be lower or higher than the performance data cited. For performance data current to the most recent month-end, visit our website at vanguard.com/performance.) Note, too, that both investment returns and principal value can fluctuate widely, so an investor’s shares, when sold, could be worth more or less than their original cost. The returns shown do not reflect taxes that a shareholder would pay on fund distributions or on the sale of fund shares.
Cumulative Performance: September 30, 2006, Through September 30, 2016
Initial Investment of $10,000,000

| | | | | |
| | | Average Annual Total Returns | |
| | | Periods Ended September 30, 2016 | |
| |
| | | | | | Final Value |
| | | One | Five | Ten | of a $10,000,000 |
| | | Year | Years | Years | Investment |
| | Institutional Short-Term Bond Fund | | | | |
| | Institutional Plus Shares | 1.75% | 1.39% | 2.89% | $13,296,300 |
| | Bloomberg Barclays U.S. 1-3 Year | | | | |
| •••••••• | | | | | |
| | Government/Credit ex Baa Index | 1.11 | 0.93 | 2.47 | 12,758,699 |
| |
| – – – – | 1–5 Year Investment-Grade Debt Funds | | | | |
| | Average | 2.24 | 1.73 | 2.42 | 12,701,964 |
| | Spliced Bloomberg Barclays U.S. | | | | |
| | Aggregate Float Adjusted Index | 5.34 | 3.11 | 4.81 | 16,001,432 |
For a benchmark description, see the Glossary.
1–5 Year Investment-Grade Debt Funds Average: Derived from data provided by Lipper, a Thomson Reuters Company.
The fund is the successor to VFTC Short-Term Bond Trust (the predecessor trust), a collective trust managed by Vanguard Fiduciary Trust Company, an affiliate of The Vanguard Group, Inc. The predecessor trust transferred its assets to the fund in connection with the fund’s commencement of operations on or about June 19, 2015. The performance of the fund’s Institutional Plus Shares includes the performance of the predecessor trust prior to the commencement of the fund’s operations. The performance of the predecessor trust has not been adjusted to reflect the expenses of the fund’s Institutional Plus Shares. If the performance of the predecessor trust had been adjusted to reflect the expenses of the fund’s Institutional Plus Shares, the predecessor trust’s performance would have been lower. The fund is managed with the same investment objective, strategies, policies, and risks as the predecessor trust. The predecessor trust was not an investment company and, therefore, was not subject to certain investment restrictions imposed on investment companies by the Investment Company Act of 1940. If the predecessor trust had been an investment company, its performance may have been different.
See Financial Highlights for dividend and capital gains information.
7
Institutional Short-Term Bond Fund
Fiscal-Year Total Returns (%): September 30, 2006, Through September 30, 2016
| | | | |
| | | | | Bloomberg |
| | | | | Barclays |
| | | | | U.S. 1-3 Year |
| | | | | Gov/Credit |
| | | Institutional Plus Shares | ex Baa Index |
| Fiscal Year | Income Returns | Capital Returns | Total Returns | Total Returns |
| 2007 | 0.00% | 5.57% | 5.57% | 5.67% |
| 2008 | 0.00 | 2.86 | 2.86 | 4.57 |
| 2009 | 0.00 | 8.70 | 8.70 | 5.70 |
| 2010 | 0.00 | 3.76 | 3.76 | 3.03 |
| 2011 | 0.00 | 1.31 | 1.31 | 1.23 |
| 2012 | 0.00 | 2.21 | 2.21 | 1.16 |
| 2013 | 0.00 | 0.67 | 0.67 | 0.50 |
| 2014 | 0.00 | 1.04 | 1.04 | 0.65 |
| 2015 | 0.35 | 0.95 | 1.30 | 1.24 |
| 2016 | 1.37 | 0.38 | 1.75 | 1.11 |
The fund is the successor to VFTC Short-Term Bond Trust (the predecessor trust), a collective trust managed by Vanguard Fiduciary Trust Company, an affiliate of The Vanguard Group, Inc. The predecessor trust transferred its assets to the fund in connection with the fund’s commencement of operations on or about June 19, 2015. The performance of the fund’s Institutional Plus Shares includes the performance of the predecessor trust prior to the commencement of the fund’s operations. The performance of the predecessor trust has not been adjusted to reflect the expenses of the fund’s Institutional Plus Shares. If the performance of the predecessor trust had been adjusted to reflect the expenses of the fund’s Institutional Plus Shares, the predecessor trust’s performance would have been lower. The fund is managed with the same investment objective, strategies, policies, and risks as the predecessor trust. The predecessor trust was not an investment company and, therefore, was not subject to certain investment restrictions imposed on investment companies by the Investment Company Act of 1940. If the predecessor trust had been an investment company, its performance may have been different.
8
Institutional Short-Term Bond Fund
Financial Statements
Statement of Net Assets
As of September 30, 2016
The fund reports a complete list of its holdings in regulatory filings four times in each fiscal year, at the quarter-ends. For the second and fourth fiscal quarters, the lists appear in the fund’s semiannual and annual reports to shareholders. For the first and third fiscal quarters, the fund files the lists with the Securities and Exchange Commission on Form N-Q. Shareholders can look up the fund’s Forms N-Q on the SEC’s website at sec.gov. Forms N-Q may also be reviewed and copied at the SEC’s Public Reference Room (see the back cover of this report for further information).
| | | | | |
| | | | | Face | Market |
| | | | Maturity | Amount | Value• |
| | | Coupon | Date | ($000) | ($000) |
| U.S. Government and Agency Obligations (26.7%) | | | | |
| U.S. Government Securities (9.4%) | | | | |
| | United States Treasury Note/Bond | 1.875% | 9/30/17 | 100,000 | 101,172 |
| 1 | United States Treasury Note/Bond | 0.875% | 11/15/17 | 42,247 | 42,326 |
| | United States Treasury Note/Bond | 0.625% | 11/30/17 | 94,900 | 94,811 |
| 2 | United States Treasury Note/Bond | 2.250% | 11/30/17 | 27,200 | 27,680 |
| | United States Treasury Note/Bond | 0.750% | 1/31/18 | 20,000 | 20,006 |
| | United States Treasury Note/Bond | 0.875% | 5/31/18 | 950 | 952 |
| | United States Treasury Note/Bond | 0.750% | 8/31/18 | 50,000 | 49,992 |
| | United States Treasury Note/Bond | 1.000% | 3/15/19 | 145,500 | 146,046 |
| | United States Treasury Note/Bond | 0.875% | 4/15/19 | 40,000 | 40,025 |
| | United States Treasury Note/Bond | 1.250% | 4/30/19 | 100,000 | 101,000 |
| | United States Treasury Note/Bond | 1.625% | 4/30/19 | 100,000 | 101,938 |
| | United States Treasury Note/Bond | 0.875% | 5/15/19 | 120,000 | 120,037 |
| | United States Treasury Note/Bond | 1.375% | 3/31/20 | 200 | 203 |
| | United States Treasury Note/Bond | 1.375% | 4/30/20 | 30 | 30 |
| | United States Treasury Note/Bond | 2.125% | 8/31/20 | 75,000 | 78,023 |
| | United States Treasury Note/Bond | 2.000% | 9/30/20 | 30,000 | 31,078 |
| | United States Treasury Note/Bond | 1.125% | 6/30/21 | 16,100 | 16,083 |
| | | | | | 971,402 |
| Agency Bonds and Notes (17.3%) | | | | |
| 3 | AID-Jordan | 2.578% | 6/30/22 | 13,750 | 14,510 |
| 4 | Federal Farm Credit Banks | 1.110% | 2/20/18 | 26,000 | 26,108 |
| 4 | Federal Home Loan Banks | 0.625% | 5/30/17 | 18,750 | 18,758 |
| 4 | Federal Home Loan Banks | 0.750% | 8/28/17 | 83,500 | 83,566 |
| 4 | Federal Home Loan Banks | 2.250% | 9/8/17 | 44,205 | 44,855 |
| 4 | Federal Home Loan Banks | 1.000% | 12/19/17 | 9,000 | 9,029 |
| 4 | Federal Home Loan Banks | 0.875% | 3/19/18 | 84,550 | 84,623 |
| 4 | Federal Home Loan Banks | 1.125% | 4/25/18 | 24,000 | 24,111 |
| 4 | Federal Home Loan Banks | 0.875% | 6/29/18 | 87,150 | 87,208 |
| 4 | Federal Home Loan Banks | 0.625% | 8/7/18 | 5,720 | 5,696 |
| 4 | Federal Home Loan Banks | 0.875% | 10/1/18 | 34,500 | 34,493 |
| 4 | Federal Home Loan Banks | 5.375% | 5/15/19 | 23,000 | 25,617 |
| 4 | Federal Home Loan Banks | 0.875% | 8/5/19 | 36,750 | 36,621 |
| 4 | Federal Home Loan Banks | 1.000% | 9/26/19 | 61,500 | 61,463 |
| 4 | Federal Home Loan Banks | 1.375% | 2/18/21 | 25,900 | 26,059 |
| 4 | Federal Home Loan Banks | 1.125% | 7/14/21 | 5,750 | 5,711 |
| 5 | Federal Home Loan Mortgage Corp. | 1.250% | 5/12/17 | 22,000 | 22,094 |
| 5 | Federal Home Loan Mortgage Corp. | 1.000% | 9/29/17 | 9,500 | 9,531 |
9
| | | | | |
| Institutional Short-Term Bond Fund | | | | |
| |
| |
| |
| | | | | Face | Market |
| | | | Maturity | Amount | Value• |
| | | Coupon | Date | ($000) | ($000) |
| 5 | Federal Home Loan Mortgage Corp. | 1.000% | 12/15/17 | 47,800 | 47,951 |
| 5 | Federal Home Loan Mortgage Corp. | 0.750% | 1/12/18 | 80,100 | 80,063 |
| 5 | Federal Home Loan Mortgage Corp. | 0.875% | 3/7/18 | 10,500 | 10,509 |
| 5 | Federal Home Loan Mortgage Corp. | 0.750% | 4/9/18 | 66,200 | 66,125 |
| 5 | Federal Home Loan Mortgage Corp. | 0.850% | 7/27/18 | 41,800 | 41,803 |
| 5 | Federal Home Loan Mortgage Corp. | 0.875% | 10/12/18 | 246,180 | 245,978 |
| 5 | Federal Home Loan Mortgage Corp. | 1.125% | 4/15/19 | 152,850 | 153,478 |
| 5 | Federal Home Loan Mortgage Corp. | 0.875% | 7/19/19 | 27,750 | 27,662 |
| 5 | Federal Home Loan Mortgage Corp. | 1.250% | 10/2/19 | 25,900 | 26,068 |
| 5 | Federal Home Loan Mortgage Corp. | 1.125% | 8/12/21 | 14,100 | 13,977 |
| 5 | Federal National Mortgage Assn. | 5.000% | 5/11/17 | 19,000 | 19,511 |
| 5 | Federal National Mortgage Assn. | 5.375% | 6/12/17 | 35,600 | 36,776 |
| 5 | Federal National Mortgage Assn. | 1.000% | 9/27/17 | 18,500 | 18,559 |
| 5 | Federal National Mortgage Assn. | 0.875% | 10/26/17 | 3,150 | 3,155 |
| 5 | Federal National Mortgage Assn. | 0.875% | 3/28/18 | 12,500 | 12,511 |
| 5 | Federal National Mortgage Assn. | 1.125% | 10/19/18 | 28,700 | 28,839 |
| 5 | Federal National Mortgage Assn. | 1.125% | 12/14/18 | 91,850 | 92,267 |
| 5 | Federal National Mortgage Assn. | 1.375% | 1/28/19 | 46,000 | 46,473 |
| 5 | Federal National Mortgage Assn. | 1.000% | 2/26/19 | 104,025 | 104,183 |
| 5 | Federal National Mortgage Assn. | 1.000% | 8/28/19 | 15,600 | 15,595 |
| 5 | Federal National Mortgage Assn. | 1.500% | 11/30/20 | 29,500 | 29,881 |
| 5 | Federal National Mortgage Assn. | 1.875% | 12/28/20 | 4,800 | 4,933 |
| 5 | Federal National Mortgage Assn. | 1.375% | 2/26/21 | 6,000 | 6,039 |
| 5 | Federal National Mortgage Assn. | 1.250% | 8/17/21 | 31,800 | 31,709 |
| 5 | Federal National Mortgage Assn. | 1.875% | 9/24/26 | 13,750 | 13,697 |
| 4 | Financing Corp. | 0.000% | 11/2/18 | 3,090 | 3,027 |
| | | | | | 1,800,822 |
| Conventional Mortgage-Backed Securities (0.0%) | | | | |
| 5,6 | Freddie Mac Gold Pool | 6.000% | 4/1/28 | 12 | 13 |
| Total U.S. Government and Agency Obligations (Cost $2,767,111) | | | 2,772,237 |
| Asset-Backed/Commercial Mortgage-Backed Securities (31.0%) | | | |
| 6 | Ally Auto Receivables Trust 2015-1 | 1.750% | 5/15/20 | 6,230 | 6,267 |
| 6 | Ally Auto Receivables Trust 2015-2 | 1.840% | 6/15/20 | 10,990 | 11,093 |
| 6 | Ally Auto Receivables Trust 2016-1 | 1.730% | 11/16/20 | 19,500 | 19,527 |
| 6 | Ally Master Owner Trust Series 2014-5 | 1.600% | 10/15/19 | 24,060 | 24,167 |
| 6 | Ally Master Owner Trust Series 2015-3 | 1.630% | 5/15/20 | 72,490 | 72,913 |
| 6,7 | American Express Credit Account Master Trust | | | | |
| | 2013-1 | 0.944% | 2/16/21 | 12,751 | 12,803 |
| 6,7 | American Express Credit Account Master Trust | | | | |
| | 2013-2 | 0.944% | 5/17/21 | 12,663 | 12,689 |
| 6,7 | American Express Credit Account Master Trust | | | | |
| | 2014-1 | 0.894% | 12/15/21 | 38,834 | 38,965 |
| 6,8 | Americold 2010 LLC Trust Series 2010-ARTA | 4.954% | 1/14/29 | 3,671 | 4,043 |
| 6,8 | Aventura Mall Trust 2013-AVM | 3.867% | 12/5/32 | 559 | 601 |
| 6,7 | BA Credit Card Trust 2014-A1 | 0.904% | 6/15/21 | 77,298 | 77,564 |
| 6 | Banc of America Commercial Mortgage Trust | | | | |
| | 2015-UBS7 | 3.705% | 9/15/48 | 530 | 584 |
| 6,7,8 Bank of America Student Loan Trust 2010-1A | 1.514% | 2/25/43 | 4,990 | 4,926 |
| 8 | Bank of Montreal | 1.750% | 6/15/21 | 15,060 | 15,066 |
| | Bank of Nova Scotia | 1.850% | 4/14/20 | 20,490 | 20,699 |
| | Bank of Nova Scotia | 1.875% | 4/26/21 | 17,070 | 17,155 |
| 8 | Bank of Nova Scotia | 1.875% | 9/20/21 | 27,900 | 28,039 |
| 6 | Bear Stearns Commercial Mortgage Securities | | | | |
| | Trust 2007-PWR16 | 5.910% | 6/11/40 | 4,403 | 4,462 |
10
| | | | | |
| Institutional Short-Term Bond Fund | | | | |
| |
| |
| |
| | | | | Face | Market |
| | | | Maturity | Amount | Value• |
| | | Coupon | Date | ($000) | ($000) |
| 6,7,8 BMW Floorplan Master Owner Trust 2015-1A | 1.024% | 7/15/20 | 28,865 | 28,896 |
| 6 | BMW Vehicle Lease Trust 2015-2 | 1.550% | 2/20/19 | 12,160 | 12,227 |
| 6,7 | Brazos Higher Education Authority Inc. Series | | | | |
| | 2005-3 | 1.057% | 6/25/26 | 3,479 | 3,364 |
| 6,7 | Brazos Higher Education Authority Inc. Series | | | | |
| | 2011-1 | 1.625% | 2/25/30 | 4,697 | 4,655 |
| 6 | Cabela’s Credit Card Master Note Trust 2015-1A | 2.260% | 3/15/23 | 5,500 | 5,573 |
| 6,7 | Cabela’s Credit Card Master Note Trust 2015-2 | 1.194% | 7/17/23 | 12,475 | 12,345 |
| 6,7 | Cabela’s Credit Card Master Note Trust 2016-1 | 1.374% | 6/15/22 | 55,030 | 55,055 |
| 8 | Canadian Imperial Bank of Commerce | 2.250% | 7/21/20 | 15,060 | 15,402 |
| 6 | Capital One Multi-Asset Execution Trust 2015-A2 | 2.080% | 3/15/23 | 38,740 | 39,634 |
| 6 | Capital One Multi-Asset Execution Trust 2015-A4 | 2.750% | 5/15/25 | 30,370 | 32,061 |
| 6,7 | Capital One Multi-Asset Execution Trust 2016-A2 | 1.154% | 2/15/24 | 10,720 | 10,779 |
| 6,7,8 CARDS II Trust 2016-1A | 1.224% | 7/15/21 | 19,670 | 19,695 |
| 6 | CarMax Auto Owner Trust 2014-4 | 1.810% | 7/15/20 | 8,300 | 8,382 |
| 6 | CarMax Auto Owner Trust 2015-2 | 1.800% | 3/15/21 | 6,530 | 6,598 |
| 6 | CarMax Auto Owner Trust 2015-3 | 1.980% | 2/16/21 | 5,075 | 5,155 |
| 6 | CarMax Auto Owner Trust 2016-1 | 1.880% | 6/15/21 | 11,970 | 12,146 |
| 6 | CenterPoint Energy Transition Bond Co. IV LLC | | | | |
| | 2012-1 | 2.161% | 10/15/21 | 11,516 | 11,745 |
| 6,8 | CFCRE Commercial Mortgage Trust 2011-C2 | 5.885% | 12/15/47 | 1,609 | 1,890 |
| 6,7 | Chase Issuance Trust 2013-A9 | 0.944% | 11/16/20 | 46,901 | 47,080 |
| 6 | Chase Issuance Trust 2014-A2 | 2.770% | 3/15/23 | 2,012 | 2,121 |
| 6,7 | Chase Issuance Trust 2016-A1 | 0.934% | 5/17/21 | 2,575 | 2,584 |
| 6,8 | Chrysler Capital Auto Receivables Trust 2015-BA | 2.260% | 10/15/20 | 11,170 | 11,306 |
| 6,8 | Chrysler Capital Auto Receivables Trust 2016-AA | 1.960% | 1/18/22 | 21,280 | 21,332 |
| 6,8 | Cit Equipment Collateral 2013-VT1 | 1.130% | 7/20/20 | 352 | 352 |
| 6,7 | Citibank Credit Card Issuance Trust 2013-A2 | 0.805% | 5/26/20 | 54,482 | 54,560 |
| 6,7 | Citibank Credit Card Issuance Trust 2013-A7 | 0.948% | 9/10/20 | 73,946 | 74,290 |
| 6 | Citibank Credit Card Issuance Trust 2014-A1 | 2.880% | 1/23/23 | 37,086 | 39,277 |
| 6 | Citibank Credit Card Issuance Trust 2014-A6 | 2.150% | 7/15/21 | 43,615 | 44,595 |
| 6 | Citigroup Commercial Mortgage Trust 2012-GC8 | 3.024% | 9/10/45 | 1,295 | 1,363 |
| 6,8 | Citigroup Commercial Mortgage Trust 2012-GC8 | 3.683% | 9/10/45 | 349 | 375 |
| 6 | Citigroup Commercial Mortgage Trust 2013-GC11 | 1.987% | 4/10/46 | 3,883 | 3,908 |
| 6 | Citigroup Commercial Mortgage Trust 2013-GC11 | 3.093% | 4/10/46 | 1,270 | 1,337 |
| 6 | Citigroup Commercial Mortgage Trust 2013-GC15 | 3.942% | 9/10/46 | 355 | 382 |
| 6 | Citigroup Commercial Mortgage Trust 2014-GC19 | 4.023% | 3/10/47 | 3,420 | 3,799 |
| 6 | Citigroup Commercial Mortgage Trust 2014-GC21 | 3.477% | 5/10/47 | 66 | 71 |
| 6 | Citigroup Commercial Mortgage Trust 2014-GC21 | 3.575% | 5/10/47 | 1,190 | 1,293 |
| 6 | Citigroup Commercial Mortgage Trust 2014-GC21 | 3.855% | 5/10/47 | 2,627 | 2,877 |
| 6 | Citigroup Commercial Mortgage Trust 2014-GC23 | 3.622% | 7/10/47 | 655 | 714 |
| 6 | Citigroup Commercial Mortgage Trust 2014-GC23 | 3.863% | 7/10/47 | 205 | 220 |
| 6 | Citigroup Commercial Mortgage Trust 2014-GC25 | 3.372% | 10/10/47 | 490 | 524 |
| 6 | Citigroup Commercial Mortgage Trust 2014-GC25 | 3.635% | 10/10/47 | 3,380 | 3,654 |
| 6 | Citigroup Commercial Mortgage Trust 2015-GC33 | 3.778% | 9/10/58 | 2,585 | 2,828 |
| 6 | Citigroup Commercial Mortgage Trust 2016-C1 | 3.209% | 5/10/49 | 20 | 21 |
| 6 | CNH Equipment Trust 2014-A | 1.500% | 5/15/20 | 15,196 | 15,218 |
| 6 | CNH Equipment Trust 2016-B | 1.970% | 11/15/21 | 8,340 | 8,406 |
| 6 | COBALT CMBS Commercial Mortgage Trust | | | | |
| | 2007-C2 | 5.484% | 4/15/47 | 5,253 | 5,305 |
| 6 | COMM 2006-C8 Mortgage Trust | 5.292% | 12/10/46 | 197 | 197 |
| 6 | COMM 2012-CCRE2 Mortgage Trust | 3.147% | 8/15/45 | 492 | 524 |
| 6 | COMM 2012-CCRE2 Mortgage Trust | 3.791% | 8/15/45 | 700 | 753 |
| 6 | COMM 2012-CCRE3 Mortgage Trust | 2.822% | 10/15/45 | 1,287 | 1,345 |
| 6 | COMM 2012-CCRE4 Mortgage Trust | 2.853% | 10/15/45 | 1,075 | 1,126 |
11
| | | | | |
| Institutional Short-Term Bond Fund | | | | |
| |
| |
| |
| | | | | Face | Market |
| | | | Maturity | Amount | Value• |
| | | Coupon | Date | ($000) | ($000) |
| 6 | COMM 2012-CCRE5 Mortgage Trust | 2.771% | 12/10/45 | 396 | 413 |
| 6 | COMM 2013-CCRE11 Mortgage Trust | 3.983% | 10/10/46 | 760 | 846 |
| 6 | COMM 2013-CCRE11 Mortgage Trust | 4.258% | 10/10/46 | 665 | 750 |
| 6 | COMM 2013-CCRE12 Mortgage Trust | 3.623% | 10/10/46 | 673 | 717 |
| 6 | COMM 2013-CCRE12 Mortgage Trust | 4.046% | 10/10/46 | 975 | 1,086 |
| 6 | COMM 2013-CCRE13 Mortgage Trust | 4.194% | 11/10/23 | 1,025 | 1,156 |
| 6 | COMM 2013-CCRE9 Mortgage Trust | 4.375% | 7/10/45 | 3,495 | 3,955 |
| 6,8 | COMM 2013-CCRE9 Mortgage Trust | 4.398% | 7/10/45 | 2,461 | 2,723 |
| 6,8 | COMM 2013-LC13 Mortgage Trust | 3.774% | 8/10/46 | 516 | 552 |
| 6 | COMM 2013-LC13 Mortgage Trust | 4.205% | 8/10/46 | 130 | 146 |
| 6 | COMM 2013-LC6 Mortgage Trust | 2.941% | 1/10/46 | 828 | 870 |
| 6,8 | COMM 2013-SFS Mortgage Trust | 3.086% | 4/12/35 | 1,009 | 1,049 |
| 6 | COMM 2014-CCRE14 Mortgage Trust | 3.743% | 2/10/47 | 349 | 372 |
| 6 | COMM 2014-CCRE14 Mortgage Trust | 4.236% | 2/10/47 | 347 | 392 |
| 6 | COMM 2014-CCRE17 Mortgage Trust | 3.977% | 5/10/47 | 871 | 967 |
| 6 | COMM 2014-CCRE17 Mortgage Trust | 4.174% | 5/10/47 | 272 | 300 |
| 6 | COMM 2014-CCRE18 Mortgage Trust | 3.452% | 7/15/47 | 100 | 105 |
| 6 | COMM 2014-CCRE18 Mortgage Trust | 3.828% | 7/15/47 | 3,190 | 3,511 |
| 6 | COMM 2014-CCRE20 Mortgage Trust | 3.590% | 11/10/47 | 2,580 | 2,798 |
| 6 | COMM 2014-CCRE21 Mortgage Trust | 3.528% | 12/10/47 | 1,100 | 1,191 |
| 6 | COMM 2014-LC17 Mortgage Trust | 3.917% | 10/10/47 | 1,400 | 1,554 |
| 6 | COMM 2015-CCRE22 Mortgage Trust | 3.309% | 3/10/48 | 440 | 468 |
| 6 | COMM 2015-CCRE24 Mortgage Trust | 3.445% | 8/10/48 | 300 | 320 |
| 6 | COMM 2015-CCRE25 Mortgage Trust | 3.759% | 8/10/48 | 525 | 577 |
| 6 | COMM 2015-CCRE27 Mortgage Trust | 3.612% | 10/10/48 | 2,800 | 3,056 |
| 6 | COMM 2015-LC19 Mortgage Trust | 3.040% | 2/10/48 | 30 | 31 |
| 6 | COMM 2015-LC19 Mortgage Trust | 3.183% | 2/10/48 | 30 | 32 |
| 8 | Commonwealth Bank of Australia | 2.000% | 6/18/19 | 21,387 | 21,643 |
| 8 | Commonwealth Bank of Australia | 2.125% | 7/22/20 | 15,300 | 15,537 |
| 6 | CSAIL 2015-C1 Commercial Mortgage Trust | 3.505% | 4/15/50 | 20 | 22 |
| 6 | CSAIL 2015-C4 Commercial Mortgage Trust | 3.808% | 11/15/48 | 650 | 713 |
| 6 | Discover Card Execution Note Trust 2012-A6 | 1.670% | 1/18/22 | 40,670 | 41,096 |
| 6,7 | Discover Card Execution Note Trust 2013-A1 | 0.824% | 8/17/20 | 14,272 | 14,294 |
| 6 | Discover Card Execution Note Trust 2015-A4 | 2.190% | 4/17/23 | 24,030 | 24,663 |
| 6 | Discover Card Execution Note Trust 2016-A1 | 1.640% | 7/15/21 | 51,290 | 51,750 |
| 6,7 | Discover Card Execution Note Trust 2016-A2 | 1.064% | 9/15/21 | 14,310 | 14,418 |
| 8 | DNB Boligkreditt AS | 1.450% | 3/21/18 | 4,035 | 4,044 |
| 6,8 | Enterprise Fleet Financing LLC Series 2013-2 | 1.510% | 3/20/19 | 4,554 | 4,545 |
| 6,8 | Enterprise Fleet Financing LLC Series 2015-2 | 2.090% | 2/22/21 | 12,450 | 12,562 |
| 6,8 | Enterprise Fleet Financing LLC Series 2016-2 | 2.040% | 2/22/22 | 4,580 | 4,588 |
| 6,7,8 Evergreen Credit Card Trust 2016-1 | 1.244% | 4/15/20 | 17,410 | 17,461 |
| 6,7 | First National Master Note Trust 2013-2 | 1.054% | 10/15/19 | 13,527 | 13,528 |
| 6,7 | First National Master Note Trust 2015-1 | 1.294% | 9/15/20 | 10,640 | 10,669 |
| 6 | Ford Credit Auto Lease Trust 2015-B | 1.540% | 2/15/19 | 9,300 | 9,347 |
| 6 | Ford Credit Auto Lease Trust 2016-A | 1.850% | 7/15/19 | 24,460 | 24,722 |
| 6,8 | Ford Credit Auto Owner Trust 2014-REV1 | 2.260% | 11/15/25 | 14,450 | 14,739 |
| 6,8 | Ford Credit Auto Owner Trust 2014-REV2 | 2.310% | 4/15/26 | 1,120 | 1,146 |
| 6 | Ford Credit Auto Owner Trust 2015-C | 1.740% | 2/15/21 | 16,855 | 17,057 |
| 6,8 | Ford Credit Auto Owner Trust 2015-REV2 | 2.440% | 1/15/27 | 37,000 | 38,029 |
| 6 | Ford Credit Auto Owner Trust 2016-A | 1.600% | 6/15/21 | 12,130 | 12,239 |
| 6 | Ford Credit Auto Owner Trust 2016-B | 1.520% | 8/15/21 | 11,260 | 11,319 |
| 6,8 | Ford Credit Auto Owner Trust 2016-REV1 | 2.310% | 8/15/27 | 35,255 | 36,110 |
| 6,8 | Ford Credit Auto Owner Trust 2016-REV2 | 2.030% | 12/15/27 | 25,450 | 25,712 |
| 6 | Ford Credit Floorplan Master Owner Trust A | | | | |
| | Series 2012-5 | 1.490% | 9/15/19 | 20,331 | 20,396 |
12
| | | | | |
| Institutional Short-Term Bond Fund | | | | |
| |
| |
| |
| | | | | Face | Market |
| | | | Maturity | Amount | Value• |
| | | Coupon | Date | ($000) | ($000) |
| 6,7 | Ford Credit Floorplan Master Owner Trust A | | | | |
| | Series 2014-2 | 1.024% | 2/15/21 | 42,840 | 42,941 |
| 6 | Ford Credit Floorplan Master Owner Trust A | | | | |
| | Series 2015-2 | 1.980% | 1/15/22 | 4,410 | 4,474 |
| 6 | Ford Credit Floorplan Master Owner Trust A | | | | |
| | Series 2015-5 | 2.390% | 8/15/22 | 36,500 | 37,378 |
| 6,7 | Ford Credit Floorplan Master Owner Trust A | | | | |
| | Series 2016-3 | 1.144% | 7/15/21 | 24,830 | 24,839 |
| 6,7 | Ford Credit Floorplan Master Owner Trust A | | | | |
| | Series 2016-4 | 1.054% | 7/15/20 | 19,200 | 19,262 |
| 6 | GE Capital Credit Card Master Note Trust Series | | | | |
| | 2012-2 | 2.220% | 1/15/22 | 16,577 | 16,822 |
| 6 | GE Capital Credit Card Master Note Trust Series | | | | |
| | 2012-6 | 1.360% | 8/17/20 | 25,772 | 25,836 |
| 6,7 | GE Dealer Floorplan Master Note Trust Series | | | | |
| | 2012-2 | 1.282% | 4/22/19 | 5,326 | 5,340 |
| 6,7 | GE Dealer Floorplan Master Note Trust Series | | | | |
| | 2014-1 | 0.912% | 7/20/19 | 38,600 | 38,596 |
| 6,7 | GE Dealer Floorplan Master Note Trust Series | | | | |
| | 2014-2 | 0.982% | 10/20/19 | 20,200 | 20,206 |
| 6,7 | GE Dealer Floorplan Master Note Trust Series | | | | |
| | 2015-2 | 1.182% | 1/20/22 | 18,460 | 18,452 |
| 6 | GM Financial Automobile Leasing Trust 2015-1 | 1.730% | 6/20/19 | 3,120 | 3,132 |
| 6 | GM Financial Automobile Leasing Trust 2015-3 | 1.690% | 3/20/19 | 14,430 | 14,494 |
| 6 | GM Financial Automobile Leasing Trust 2015-3 | 1.810% | 11/20/19 | 1,490 | 1,500 |
| 6 | GM Financial Automobile Leasing Trust 2016-2 | 1.620% | 9/20/19 | 10,700 | 10,756 |
| 6 | GM Financial Automobile Leasing Trust 2016-2 | 1.760% | 3/20/20 | 6,800 | 6,848 |
| 6 | GM Financial Automobile Leasing Trust 2016-3 | 1.610% | 12/20/19 | 13,140 | 13,206 |
| 6 | GM Financial Automobile Leasing Trust 2016-3 | 1.780% | 5/20/20 | 10,350 | 10,358 |
| 6,7,8 GMF Floorplan Owner Revolving Trust 2016-1 | 1.374% | 5/17/21 | 28,850 | 28,911 |
| 6,8 | Golden Credit Card Trust 2012-2A | 1.770% | 1/15/19 | 18,827 | 18,865 |
| 6,8 | Golden Credit Card Trust 2012-4A | 1.390% | 7/15/19 | 8,985 | 9,002 |
| 6,7,8 Golden Credit Card Trust 2014-2A | 0.974% | 3/15/21 | 25,433 | 25,388 |
| 6,7,8 Golden Credit Card Trust 2016-1A | 1.124% | 1/15/20 | 93,590 | 93,918 |
| 6,8 | Golden Credit Card Trust 2016-5A | 1.600% | 9/15/21 | 72,300 | 72,512 |
| 6,7,8 Gosforth Funding 2016-1A plc | 1.517% | 2/15/58 | 39,485 | 39,499 |
| 6,8 | GreatAmerica Leasing Receivables Funding LLC | | | | |
| | Series 2013-1 | 1.160% | 5/15/18 | 1,301 | 1,301 |
| 6,8 | GreatAmerica Leasing Receivables Funding LLC | | | | |
| | Series 2014-1 | 1.470% | 8/15/20 | 4,690 | 4,690 |
| 6,8 | GS Mortgage Securities Trust 2012-GC6 | 4.948% | 1/10/45 | 117 | 132 |
| 6 | GS Mortgage Securities Trust 2013-GC13 | 4.168% | 7/10/46 | 1,790 | 2,006 |
| 6 | GS Mortgage Securities Trust 2013-GCJ12 | 3.135% | 6/10/46 | 1,558 | 1,636 |
| 6 | GS Mortgage Securities Trust 2014-GC20 | 3.998% | 4/10/47 | 3,995 | 4,417 |
| 6 | GS Mortgage Securities Trust 2014-GC26 | 3.629% | 11/10/47 | 150 | 163 |
| 6 | Harley-Davidson Motorcycle Trust 2014-1 | 1.550% | 10/15/21 | 23,451 | 23,570 |
| 6,8 | Hertz Vehicle Financing LLC 2015-3A | 2.670% | 9/25/21 | 21,050 | 21,229 |
| 6,8 | Hertz Vehicle Financing LLC 2016-2A | 2.950% | 3/25/22 | 21,830 | 22,278 |
| 6,8 | Hertz Vehicle Financing LLC 2016-3 | 2.270% | 7/25/20 | 13,460 | 13,481 |
| 6,8 | Hertz Vehicle Financing LLC 2016-4 | 2.650% | 7/25/22 | 14,450 | 14,616 |
| 6,8 | Hilton USA Trust 2013-HLT | 2.662% | 11/5/30 | 746 | 746 |
| 6 | Honda Auto Receivables 2015-4 Owner Trust | 1.440% | 1/21/22 | 23,540 | 23,623 |
| 6,8 | Hyundai Auto Lease Securitization Trust 2014-A | 1.010% | 9/15/17 | 1,010 | 1,010 |
| 6,8 | Hyundai Auto Lease Securitization Trust 2016-A | 1.800% | 12/16/19 | 9,760 | 9,848 |
| 6,8 | Hyundai Auto Lease Securitization Trust 2016-B | 1.680% | 4/15/20 | 3,380 | 3,410 |
13
| | | | | |
| Institutional Short-Term Bond Fund | | | | |
| |
| |
| |
| | | | | Face | Market |
| | | | Maturity | Amount | Value• |
| | | Coupon | Date | ($000) | ($000) |
| 6,8 | Hyundai Auto Lease Securitization Trust 2016-C | 1.490% | 2/18/20 | 9,680 | 9,683 |
| 6,8 | Hyundai Auto Lease Securitization Trust 2016-C | 1.650% | 7/15/20 | 4,270 | 4,272 |
| 6 | Hyundai Auto Receivables Trust 2015-C | 1.780% | 11/15/21 | 11,030 | 11,093 |
| 6,8 | Hyundai Floorplan Master Owner Trust Series | | | | |
| | 2016-1A | 1.810% | 3/15/21 | 8,360 | 8,418 |
| 7 | Illinois Student Assistance Commission Series | | | | |
| | 2010-1 | 1.765% | 4/25/22 | 2,178 | 2,180 |
| 6,8 | Irvine Core Office Trust 2013-IRV | 3.279% | 5/15/48 | 2,382 | 2,524 |
| 6 | John Deere Owner Trust 2015-B | 1.780% | 6/15/22 | 1,845 | 1,862 |
| 6 | John Deere Owner Trust 2016-B | 1.490% | 5/15/23 | 1,935 | 1,934 |
| 6 | JP Morgan Chase Commercial Mortgage | | | | |
| | Securities Trust 2007-LDP10 | 5.439% | 1/15/49 | 2,575 | 2,598 |
| 6,8 | JP Morgan Chase Commercial Mortgage | | | | |
| | Securities Trust 2010-C1 | 4.608% | 6/15/43 | 112 | 119 |
| 6,8 | JP Morgan Chase Commercial Mortgage | | | | |
| | Securities Trust 2010-C2 | 3.616% | 11/15/43 | 218 | 222 |
| 6,8 | JP Morgan Chase Commercial Mortgage | | | | |
| | Securities Trust 2010-C2 | 4.070% | 11/15/43 | 478 | 514 |
| 6,8 | JP Morgan Chase Commercial Mortgage | | | | |
| | Securities Trust 2011-C3 | 4.388% | 2/15/46 | 2,143 | 2,215 |
| 6,8 | JP Morgan Chase Commercial Mortgage | | | | |
| | Securities Trust 2011-C3 | 4.717% | 2/15/46 | 4,070 | 4,494 |
| 6,8 | JP Morgan Chase Commercial Mortgage | | | | |
| | Securities Trust 2011-C5 | 5.562% | 8/15/46 | 673 | 766 |
| 6,8 | JP Morgan Chase Commercial Mortgage | | | | |
| | Securities Trust 2011-RR1 | 4.717% | 3/16/46 | 6,791 | 7,366 |
| 6 | JP Morgan Chase Commercial Mortgage | | | | |
| | Securities Trust 2012-C8 | 2.829% | 10/15/45 | 559 | 582 |
| 6,8 | JP Morgan Chase Commercial Mortgage | | | | |
| | Securities Trust 2012-C8 | 3.424% | 10/15/45 | 1,283 | 1,349 |
| 6,8 | JP Morgan Chase Commercial Mortgage | | | | |
| | Securities Trust 2012-HSBC | 3.093% | 7/5/32 | 1,062 | 1,119 |
| 6 | JP Morgan Chase Commercial Mortgage | | | | |
| | Securities Trust 2013-C13 | 3.994% | 1/15/46 | 3,009 | 3,333 |
| 6 | JP Morgan Chase Commercial Mortgage | | | | |
| | Securities Trust 2013-C16 | 3.674% | 12/15/46 | 469 | 505 |
| 6 | JP Morgan Chase Commercial Mortgage | | | | |
| | Securities Trust 2013-C16 | 3.881% | 12/15/46 | 205 | 227 |
| 6 | JP Morgan Chase Commercial Mortgage | | | | |
| | Securities Trust 2013-C16 | 4.166% | 12/15/46 | 1,000 | 1,121 |
| 6 | JP Morgan Chase Commercial Mortgage | | | | |
| | Securities Trust 2013-LC11 | 1.855% | 4/15/46 | 3,883 | 3,911 |
| 6 | JP Morgan Chase Commercial Mortgage | | | | |
| | Securities Trust 2013-LC11 | 2.960% | 4/15/46 | 1,351 | 1,412 |
| 6 | JPMBB Commercial Mortgage Securities Trust | | | | |
| | 2013-C12 | 3.664% | 7/15/45 | 2,719 | 2,962 |
| 6 | JPMBB Commercial Mortgage Securities Trust | | | | |
| | 2013-C12 | 4.160% | 7/15/45 | 1,425 | 1,558 |
| 6 | JPMBB Commercial Mortgage Securities Trust | | | | |
| | 2013-C14 | 3.761% | 8/15/46 | 342 | 370 |
| 6 | JPMBB Commercial Mortgage Securities Trust | | | | |
| | 2013-C14 | 4.133% | 8/15/46 | 280 | 313 |
| 6 | JPMBB Commercial Mortgage Securities Trust | | | | |
| | 2013-C15 | 3.659% | 11/15/45 | 194 | 209 |
14
| | | | | |
| Institutional Short-Term Bond Fund | | | | |
| |
| |
| |
| | | | | Face | Market |
| | | | Maturity | Amount | Value• |
| | | Coupon | Date | ($000) | ($000) |
| 6 | JPMBB Commercial Mortgage Securities Trust | | | | |
| | 2013-C17 | 4.199% | 1/15/47 | 1,856 | 2,089 |
| 6 | JPMBB Commercial Mortgage Securities Trust | | | | |
| | 2014-C18 | 4.079% | 2/15/47 | 1,165 | 1,301 |
| 6 | JPMBB Commercial Mortgage Securities Trust | | | | |
| | 2014-C18 | 4.439% | 2/15/47 | 544 | 606 |
| 6 | JPMBB Commercial Mortgage Securities Trust | | | | |
| | 2014-C19 | 3.997% | 4/15/47 | 100 | 111 |
| 6 | JPMBB Commercial Mortgage Securities Trust | | | | |
| | 2014-C21 | 3.428% | 8/15/47 | 60 | 64 |
| 6 | JPMBB Commercial Mortgage Securities Trust | | | | |
| | 2014-C21 | 3.493% | 8/15/47 | 190 | 205 |
| 6 | JPMBB Commercial Mortgage Securities Trust | | | | |
| | 2014-C24 | 3.639% | 11/15/47 | 970 | 1,054 |
| 6 | JPMBB Commercial Mortgage Securities Trust | | | | |
| | 2015-C32 | 3.598% | 11/15/48 | 2,820 | 3,056 |
| 6 | JPMBB Commercial Mortgage Securities Trust | | | | |
| | 2015-C33 | 3.562% | 12/15/48 | 150 | 162 |
| 6 | LB-UBS Commercial Mortgage Trust 2008-C1 | 6.287% | 4/15/41 | 2,998 | 3,132 |
| 6,7,8 Master Credit Card Trust II Series 2016-1A | 1.286% | 9/23/19 | 43,020 | 43,153 |
| 6,7,8 Mercedes-Benz Master Owner Trust 2016-B | 1.224% | 5/17/21 | 9,730 | 9,784 |
| 6 | ML-CFC Commercial Mortgage Trust 2007-6 | 5.331% | 3/12/51 | 100 | 100 |
| 6,8 | MMAF Equipment Finance LLC 2011-AA | 3.040% | 8/15/28 | 8,105 | 8,176 |
| 6,8 | MMAF Equipment Finance LLC 2012-AA | 1.980% | 6/10/32 | 3,988 | 4,014 |
| 6,8 | MMAF Equipment Finance LLC 2013-AA | 1.680% | 5/11/20 | 8,508 | 8,539 |
| 6,8 | MMAF Equipment Finance LLC 2013-AA | 2.570% | 6/9/33 | 7,037 | 7,204 |
| 6,8 | MMAF Equipment Finance LLC 2016-AA | 2.210% | 12/15/32 | 7,480 | 7,509 |
| 6 | Morgan Stanley Bank of America Merrill Lynch | | | | |
| | Trust 2012-C5 | 3.176% | 8/15/45 | 1,670 | 1,772 |
| 6 | Morgan Stanley Bank of America Merrill Lynch | | | | |
| | Trust 2012-C5 | 3.792% | 8/15/45 | 387 | 417 |
| 6 | Morgan Stanley Bank of America Merrill Lynch | | | | |
| | Trust 2012-C6 | 2.858% | 11/15/45 | 896 | 937 |
| 6 | Morgan Stanley Bank of America Merrill Lynch | | | | |
| | Trust 2013-C10 | 4.219% | 7/15/46 | 4,024 | 4,499 |
| 6 | Morgan Stanley Bank of America Merrill Lynch | | | | |
| | Trust 2013-C11 | 3.960% | 8/15/46 | 970 | 1,074 |
| 6 | Morgan Stanley Bank of America Merrill Lynch | | | | |
| | Trust 2013-C11 | 4.360% | 8/15/46 | 130 | 147 |
| 6 | Morgan Stanley Bank of America Merrill Lynch | | | | |
| | Trust 2013-C12 | 3.824% | 10/15/46 | 388 | 420 |
| 6 | Morgan Stanley Bank of America Merrill Lynch | | | | |
| | Trust 2013-C12 | 4.259% | 10/15/46 | 50 | 56 |
| 6 | Morgan Stanley Bank of America Merrill Lynch | | | | |
| | Trust 2013-C13 | 4.039% | 11/15/46 | 75 | 84 |
| 6 | Morgan Stanley Bank of America Merrill Lynch | | | | |
| | Trust 2014-C14 | 4.064% | 2/15/47 | 194 | 217 |
| 6 | Morgan Stanley Bank of America Merrill Lynch | | | | |
| | Trust 2014-C14 | 4.384% | 2/15/47 | 194 | 216 |
| 6 | Morgan Stanley Bank of America Merrill Lynch | | | | |
| | Trust 2014-C15 | 3.773% | 4/15/47 | 1,380 | 1,513 |
| 6 | Morgan Stanley Bank of America Merrill Lynch | | | | |
| | Trust 2014-C15 | 4.051% | 4/15/47 | 1,870 | 2,081 |
| 6 | Morgan Stanley Bank of America Merrill Lynch | | | | |
| | Trust 2014-C16 | 3.892% | 6/15/47 | 2,104 | 2,328 |
15
| | | | | |
| Institutional Short-Term Bond Fund | | | | |
| |
| |
| |
| | | | | Face | Market |
| | | | Maturity | Amount | Value• |
| | | Coupon | Date | ($000) | ($000) |
| 6 | Morgan Stanley Bank of America Merrill Lynch | | | | |
| | Trust 2014-C16 | 4.094% | 6/15/47 | 361 | 396 |
| 6 | Morgan Stanley Bank of America Merrill Lynch | | | | |
| | Trust 2015-C22 | 3.306% | 4/15/48 | 1,015 | 1,077 |
| 6 | Morgan Stanley Bank of America Merrill Lynch | | | | |
| | Trust 2015-C25 | 3.383% | 10/15/48 | 2,010 | 2,147 |
| 6 | Morgan Stanley Bank of America Merrill Lynch | | | | |
| | Trust 2015-C25 | 3.635% | 10/15/48 | 3,920 | 4,282 |
| 6 | Morgan Stanley Capital I Trust 2006-IQ12 | 5.319% | 12/15/43 | 999 | 999 |
| 6,8 | Morgan Stanley Capital I Trust 2012-STAR | 3.201% | 8/5/34 | 1,578 | 1,652 |
| 6 | Morgan Stanley Capital I Trust 2015-UBS8 | 3.809% | 12/15/48 | 2,050 | 2,273 |
| 8 | National Australia Bank Ltd. | 2.250% | 3/16/21 | 21,700 | 22,161 |
| 6,7 | Navient Student Loan Trust 2014-1 | 1.035% | 6/25/31 | 8,000 | 7,716 |
| 6,7 | Navient Student Loan Trust 2014-8 | 0.965% | 4/25/23 | 30,970 | 30,921 |
| 6,7 | Navient Student Loan Trust 2015-3 | 1.175% | 6/26/56 | 16,600 | 16,104 |
| 6,7,8 Navient Student Loan Trust 2016-2 | 1.575% | 6/25/65 | 5,810 | 5,832 |
| 6,7,8 Navient Student Loan Trust 2016-3 | 1.375% | 6/25/65 | 5,140 | 5,116 |
| 6,8 | NextGear Floorplan Master Owner Trust 2016-1A | 2.740% | 4/15/21 | 8,250 | 8,259 |
| 6 | Nissan Auto Lease Trust 2016-A | 1.650% | 10/15/21 | 11,570 | 11,614 |
| 6 | Nissan Auto Lease Trust 2016-B | 1.500% | 7/15/19 | 36,150 | 36,182 |
| 6 | Nissan Auto Lease Trust 2016-B | 1.610% | 1/18/22 | 6,500 | 6,506 |
| 6 | Nissan Auto Receivables 2015-A Owner Trust | 1.500% | 9/15/21 | 27,560 | 27,767 |
| 6 | Nissan Auto Receivables 2016-B Owner Trust | 1.540% | 10/17/22 | 14,030 | 14,122 |
| 6 | Nissan Master Owner Trust Receivables Series | | | | |
| | 2015-A | 1.440% | 1/15/20 | 2,400 | 2,406 |
| 6,7 | Nissan Master Owner Trust Receivables Series | | | | |
| | 2016-A | 1.164% | 6/15/21 | 41,710 | 41,793 |
| 8 | Norddeutsche Landesbank Girozentrale | 2.000% | 2/5/19 | 15,050 | 15,142 |
| 7 | North Carolina State Education Assistance | | | | |
| | Authority 2011-1 | 1.614% | 1/26/26 | 2,111 | 2,108 |
| 6,8 | OBP Depositor LLC Trust 2010-OBP | 4.646% | 7/15/45 | 602 | 655 |
| 6,8 | Palisades Center Trust 2016-PLSD | 2.713% | 4/13/33 | 250 | 255 |
| | Royal Bank of Canada | 2.200% | 9/23/19 | 14,165 | 14,460 |
| | Royal Bank of Canada | 2.100% | 10/14/20 | 23,750 | 24,173 |
| 6 | Royal Bank of Canada | 1.875% | 2/5/21 | 4,900 | 4,955 |
| | Royal Bank of Canada | 2.300% | 3/22/21 | 12,175 | 12,493 |
| 6,7 | SLM Student Loan Trust 2003-14 | 0.944% | 1/25/23 | 7,725 | 7,688 |
| 6,7 | SLM Student Loan Trust 2005-5 | 0.815% | 4/25/25 | 8,229 | 8,169 |
| 6,7 | SLM Student Loan Trust 2005-6 | 0.825% | 7/27/26 | 2,250 | 2,230 |
| 6,7 | SLM Student Loan Trust 2013-6 | 1.025% | 2/25/21 | 12,273 | 12,265 |
| 6,7 | SLM Student Loan Trust 2014-1 | 0.905% | 7/26/21 | 11,915 | 11,893 |
| 6 | SMART ABS Series 2013-1US Trust | 1.050% | 10/14/18 | 2,209 | 2,203 |
| 6 | SMART ABS Series 2014-1US Trust | 1.680% | 12/14/19 | 4,409 | 4,402 |
| 8 | SpareBank 1 Boligkreditt AS | 1.250% | 5/2/18 | 3,097 | 3,091 |
| 6,8 | SpareBank 1 Boligkreditt AS | 1.750% | 11/15/20 | 8,341 | 8,376 |
| 8 | Swedbank Hypotek AB | 1.375% | 3/28/18 | 3,868 | 3,871 |
| 6 | Synchrony Credit Card Master Note Trust 2014-1 | 1.610% | 11/15/20 | 44,200 | 44,412 |
| 6 | Synchrony Credit Card Master Note Trust 2015-1 | 2.370% | 3/15/23 | 13,760 | 14,136 |
| 6 | Synchrony Credit Card Master Note Trust 2015-2 | 1.600% | 4/15/21 | 14,360 | 14,434 |
| 6 | Synchrony Credit Card Master Note Trust 2015-4 | 2.380% | 9/15/23 | 22,600 | 23,117 |
| 6 | Synchrony Credit Card Master Note Trust 2016-3 | 1.580% | 9/15/22 | 19,410 | 19,442 |
| 6 | Toyota Auto Receivables 2016-B Owner Trust | 1.520% | 8/16/21 | 3,520 | 3,525 |
| 6,7,8 Trillium Credit Card Trust II 2016-1A | 1.242% | 5/26/21 | 66,330 | 66,474 |
| 6 | UBS Commercial Mortgage Trust 2012-C1 | 4.171% | 5/10/45 | 192 | 210 |
| 6,8 | UBS-BAMLL Trust 2012-WRM | 3.663% | 6/10/30 | 2,772 | 2,958 |
16
| | | | | |
| Institutional Short-Term Bond Fund | | | | |
| |
| |
| |
| | | | | Face | Market |
| | | | Maturity | Amount | Value• |
| | | Coupon | Date | ($000) | ($000) |
| 6 | UBS-Barclays Commercial Mortgage Trust | | | | |
| | 2012-C4 | 2.850% | 12/10/45 | 1,018 | 1,065 |
| 6,8 | VNDO 2012-6AVE Mortgage Trust | 2.996% | 11/15/30 | 2,552 | 2,673 |
| 6,8 | Volkswagen Credit Auto Master Owner Trust | | | | |
| | 2014-1A | 1.400% | 7/22/19 | 5,080 | 5,076 |
| 6,8 | Volvo Financial Equipment LLC Series 2016-1A | 1.890% | 9/15/20 | 5,160 | 5,210 |
| 6 | Wachovia Bank Commercial Mortgage Trust | | | | |
| | Series 2006-C29 | 5.297% | 11/15/48 | 1,956 | 1,959 |
| 6 | Wells Fargo Commercial Mortgage Trust | | | | |
| | 2012-LC5 | 2.918% | 10/15/45 | 725 | 761 |
| 6 | Wells Fargo Commercial Mortgage Trust | | | | |
| | 2012-LC5 | 3.539% | 10/15/45 | 279 | 297 |
| 6 | Wells Fargo Commercial Mortgage Trust | | | | |
| | 2013-LC12 | 3.928% | 7/15/46 | 407 | 442 |
| 6 | Wells Fargo Commercial Mortgage Trust | | | | |
| | 2013-LC12 | 4.218% | 7/15/46 | 1,743 | 1,955 |
| 6 | Wells Fargo Commercial Mortgage Trust | | | | |
| | 2013-LC12 | 4.432% | 7/15/46 | 272 | 302 |
| 6 | Wells Fargo Commercial Mortgage Trust | | | | |
| | 2015-C26 | 2.991% | 2/15/48 | 120 | 126 |
| 6 | Wells Fargo Commercial Mortgage Trust | | | | |
| | 2015-C26 | 3.166% | 2/15/48 | 240 | 252 |
| 6 | Wells Fargo Commercial Mortgage Trust | | | | |
| | 2015-C29 | 3.400% | 6/15/48 | 400 | 427 |
| 6 | Wells Fargo Commercial Mortgage Trust | | | | |
| | 2015-LC22 | 3.839% | 9/15/58 | 2,520 | 2,789 |
| 6 | Wells Fargo Commercial Mortgage Trust | | | | |
| | 2015-SG1 | 3.556% | 12/15/47 | 250 | 268 |
| 6 | Wells Fargo Commercial Mortgage Trust | | | | |
| | 2015-SG1 | 3.789% | 12/15/47 | 745 | 818 |
| 8 | Westpac Banking Corp. | 1.850% | 11/26/18 | 13,270 | 13,397 |
| 8 | Westpac Banking Corp. | 2.000% | 3/3/20 | 10,646 | 10,794 |
| 8 | Westpac Banking Corp. | 2.250% | 11/9/20 | 13,440 | 13,725 |
| 6,8 | WFRBS Commercial Mortgage Trust 2011-C3 | 4.375% | 3/15/44 | 1,199 | 1,318 |
| 6 | WFRBS Commercial Mortgage Trust 2012-C7 | 3.431% | 6/15/45 | 1,166 | 1,252 |
| 6 | WFRBS Commercial Mortgage Trust 2012-C7 | 4.090% | 6/15/45 | 584 | 639 |
| 6 | WFRBS Commercial Mortgage Trust 2012-C8 | 3.001% | 8/15/45 | 751 | 790 |
| 6 | WFRBS Commercial Mortgage Trust 2012-C9 | 2.870% | 11/15/45 | 3,180 | 3,326 |
| 6 | WFRBS Commercial Mortgage Trust 2012-C9 | 3.388% | 11/15/45 | 440 | 466 |
| 6 | WFRBS Commercial Mortgage Trust 2013-C15 | 3.720% | 8/15/46 | 464 | 501 |
| 6 | WFRBS Commercial Mortgage Trust 2013-C15 | 4.153% | 8/15/46 | 440 | 493 |
| 6 | WFRBS Commercial Mortgage Trust 2013-C17 | 3.558% | 12/15/46 | 167 | 179 |
| 6 | WFRBS Commercial Mortgage Trust 2013-C18 | 3.676% | 12/15/46 | 442 | 478 |
| 6 | WFRBS Commercial Mortgage Trust 2013-C18 | 4.162% | 12/15/46 | 878 | 990 |
| 6 | WFRBS Commercial Mortgage Trust 2014-C19 | 4.101% | 3/15/47 | 70 | 78 |
| 6 | WFRBS Commercial Mortgage Trust 2014-C23 | 3.917% | 10/15/57 | 720 | 799 |
| 6 | WFRBS Commercial Mortgage Trust 2014-C24 | 3.607% | 11/15/47 | 1,695 | 1,836 |
| 6 | WFRBS Commercial Mortgage Trust 2014-LC14 | 3.522% | 3/15/47 | 20 | 21 |
| 6 | WFRBS Commercial Mortgage Trust 2014-LC14 | 3.766% | 3/15/47 | 40 | 44 |
| 6 | WFRBS Commercial Mortgage Trust 2014-LC14 | 4.045% | 3/15/47 | 668 | 746 |
| 6,8 | Wheels SPV 2 LLC 2016-1A | 1.870% | 5/20/25 | 1,945 | 1,946 |
| 6 | World Financial Network Credit Card Master Note | | | | |
| | Trust Series 2012-D | 2.150% | 4/17/23 | 20,637 | 21,000 |
| 6 | World Financial Network Credit Card Master Note | | | | |
| | Trust Series 2013-A | 1.610% | 12/15/21 | 6,191 | 6,219 |
17
| | | | | |
| Institutional Short-Term Bond Fund | | | | |
| |
| |
| |
| | | | | Face | Market |
| | | | Maturity | Amount | Value• |
| | | Coupon | Date | ($000) | ($000) |
| 6,7 | World Financial Network Credit Card Master | | | | |
| | Note Trust Series 2015-A | 1.004% | 2/15/22 | 11,160 | 11,181 |
| 6 | World Financial Network Credit Card Master | | | | |
| | Note Trust Series 2015-B | 2.550% | 6/17/24 | 3,030 | 3,135 |
| 6 | World Financial Network Credit Card Master | | | | |
| | Note Trust Series 2016-A | 2.030% | 4/15/25 | 9,555 | 9,619 |
| 6 | World Omni Auto Receivables Trust 2014-B | 1.680% | 12/15/20 | 12,760 | 12,860 |
| 6 | World Omni Auto Receivables Trust 2016-A | 1.770% | 9/15/21 | 13,950 | 14,095 |
| 6 | World Omni Auto Receivables Trust 2016-B | 1.300% | 2/15/22 | 26,830 | 26,848 |
| 6 | World Omni Automobile Lease Securitization | | | | |
| | Trust 2015-A | 1.730% | 12/15/20 | 3,200 | 3,221 |
| 6 | World Omni Automobile Lease Securitization | | | | |
| | Trust 2016-A | 1.610% | 1/15/22 | 12,600 | 12,581 |
| Total Asset-Backed/Commercial Mortgage-Backed Securities (Cost $3,193,008) | | 3,224,589 |
| Corporate Bonds (29.0%) | | | | |
| Finance (18.0%) | | | | |
| | Banking (17.1%) | | | | |
| 8 | ABN AMRO Bank NV | 2.500% | 10/30/18 | 2,750 | 2,802 |
| | American Express Credit Corp. | 1.550% | 9/22/17 | 3,000 | 3,004 |
| | American Express Credit Corp. | 1.875% | 11/5/18 | 7,642 | 7,704 |
| 8 | ANZ New Zealand Int’l Ltd./London | 2.250% | 2/1/19 | 13,630 | 13,797 |
| | Australia & New Zealand Banking Group Ltd. | 1.600% | 7/15/19 | 9,085 | 9,070 |
| | Bank of America NA | 1.250% | 2/14/17 | 37,470 | 37,479 |
| | Bank of America NA | 1.650% | 3/26/18 | 15,965 | 16,035 |
| | Bank of America NA | 1.750% | 6/5/18 | 1,221 | 1,228 |
| | Bank of America NA | 2.050% | 12/7/18 | 16,080 | 16,293 |
| | Bank of Montreal | 1.300% | 7/14/17 | 6,000 | 6,005 |
| | Bank of Montreal | 1.800% | 7/31/18 | 6,855 | 6,914 |
| | Bank of Montreal | 1.500% | 7/18/19 | 9,085 | 9,095 |
| | Bank of Montreal | 1.900% | 8/27/21 | 9,520 | 9,480 |
| | Bank of New York Mellon Corp. | 4.600% | 1/15/20 | 2,300 | 2,514 |
| | Bank of Nova Scotia | 1.700% | 6/11/18 | 11,630 | 11,689 |
| | Bank of Nova Scotia | 2.050% | 10/30/18 | 9,095 | 9,285 |
| | Bank of Nova Scotia | 1.650% | 6/14/19 | 18,170 | 18,217 |
| | Bank of Nova Scotia | 2.350% | 10/21/20 | 3,890 | 3,974 |
| 8 | Bank of Tokyo-Mitsubishi UFJ Ltd. | 1.700% | 3/5/18 | 2,270 | 2,273 |
| 8 | Bank of Tokyo-Mitsubishi UFJ Ltd. | 2.700% | 9/9/18 | 300 | 306 |
| 8 | Bank of Tokyo-Mitsubishi UFJ Ltd. | 2.150% | 9/14/18 | 6,240 | 6,294 |
| 8 | Bank of Tokyo-Mitsubishi UFJ Ltd. | 2.300% | 3/10/19 | 4,860 | 4,920 |
| 8 | Bank of Tokyo-Mitsubishi UFJ Ltd. | 2.300% | 3/5/20 | 1,960 | 1,977 |
| 8 | Bank of Tokyo-Mitsubishi UFJ Ltd. | 2.750% | 9/14/20 | 5,392 | 5,534 |
| 8 | Banque Federative du Credit Mutuel SA | 2.000% | 4/12/19 | 17,540 | 17,622 |
| | BNP Paribas SA | 1.375% | 3/17/17 | 22,217 | 22,245 |
| | BPCE SA | 1.625% | 2/10/17 | 27,385 | 27,419 |
| | BPCE SA | 1.625% | 1/26/18 | 11,489 | 11,517 |
| | BPCE SA | 2.500% | 12/10/18 | 3,670 | 3,738 |
| | Canadian Imperial Bank of Commerce | 1.550% | 1/23/18 | 1,255 | 1,258 |
| | Commonwealth Bank of Australia | 1.125% | 3/13/17 | 27,520 | 27,520 |
| | Commonwealth Bank of Australia | 1.400% | 9/8/17 | 22,300 | 22,299 |
| | Commonwealth Bank of Australia | 1.900% | 9/18/17 | 7,680 | 7,718 |
| | Commonwealth Bank of Australia | 1.625% | 3/12/18 | 5,310 | 5,323 |
| | Commonwealth Bank of Australia | 2.500% | 9/20/18 | 7,220 | 7,355 |
| | Commonwealth Bank of Australia | 1.750% | 11/2/18 | 6,137 | 6,160 |
| | Commonwealth Bank of Australia | 2.300% | 9/6/19 | 19,150 | 19,481 |
18
| | | | |
| Institutional Short-Term Bond Fund | | | | |
| |
| |
| |
| | | | Face | Market |
| | | Maturity | Amount | Value• |
| | Coupon | Date | ($000) | ($000) |
| Commonwealth Bank of Australia | 2.550% | 3/15/21 | 4,780 | 4,918 |
| 8 Commonwealth Bank of Australia | 2.000% | 9/6/21 | 8,090 | 8,078 |
| Cooperatieve Rabobank UA | 3.375% | 1/19/17 | 9,730 | 9,791 |
| Cooperatieve Rabobank UA | 1.700% | 3/19/18 | 5,500 | 5,527 |
| Cooperatieve Rabobank UA | 2.250% | 1/14/19 | 11,020 | 11,197 |
| Cooperatieve Rabobank UA | 2.500% | 1/19/21 | 1,795 | 1,842 |
| Credit Suisse AG | 1.375% | 5/26/17 | 9,470 | 9,455 |
| Credit Suisse AG | 1.750% | 1/29/18 | 12,090 | 12,086 |
| Credit Suisse AG | 1.700% | 4/27/18 | 13,685 | 13,683 |
| 8 Danske Bank A/S | 2.000% | 9/8/21 | 10,925 | 10,899 |
| Fifth Third Bank | 2.150% | 8/20/18 | 6,448 | 6,522 |
| Fifth Third Bank | 2.300% | 3/15/19 | 5,252 | 5,341 |
| Fifth Third Bank | 1.625% | 9/27/19 | 8,940 | 8,933 |
| Goldman Sachs Group Inc. | 5.950% | 1/18/18 | 21,905 | 23,110 |
| Goldman Sachs Group Inc. | 2.375% | 1/22/18 | 39,705 | 40,109 |
| Goldman Sachs Group Inc. | 6.150% | 4/1/18 | 24,760 | 26,374 |
| Goldman Sachs Group Inc. | 2.900% | 7/19/18 | 34,109 | 34,883 |
| Goldman Sachs Group Inc. | 2.625% | 1/31/19 | 11,570 | 11,804 |
| Goldman Sachs Group Inc. | 2.550% | 10/23/19 | 9,769 | 9,982 |
| HSBC Bank USA NA | 6.000% | 8/9/17 | 4,605 | 4,779 |
| HSBC Holdings plc | 2.650% | 1/5/22 | 11,630 | 11,589 |
| HSBC USA Inc. | 1.500% | 11/13/17 | 9,630 | 9,623 |
| HSBC USA Inc. | 1.625% | 1/16/18 | 25,090 | 25,095 |
| HSBC USA Inc. | 1.700% | 3/5/18 | 4,343 | 4,350 |
| Huntington National Bank | 2.200% | 11/6/18 | 5,527 | 5,590 |
| 8 ING Bank NV | 2.000% | 11/26/18 | 5,810 | 5,846 |
| 8 ING Bank NV | 2.300% | 3/22/19 | 8,191 | 8,313 |
| JPMorgan Chase & Co. | 2.000% | 8/15/17 | 58,085 | 58,407 |
| JPMorgan Chase & Co. | 6.000% | 1/15/18 | 46,352 | 48,963 |
| JPMorgan Chase & Co. | 1.800% | 1/25/18 | 12,966 | 13,025 |
| JPMorgan Chase & Co. | 1.700% | 3/1/18 | 37,910 | 38,026 |
| JPMorgan Chase & Co. | 2.200% | 10/22/19 | 18,791 | 19,080 |
| JPMorgan Chase & Co. | 2.250% | 1/23/20 | 3,915 | 3,962 |
| JPMorgan Chase & Co. | 2.550% | 10/29/20 | 23,757 | 24,177 |
| JPMorgan Chase & Co. | 2.550% | 3/1/21 | 10,241 | 10,419 |
| JPMorgan Chase Bank NA | 6.000% | 10/1/17 | 11,790 | 12,298 |
| JPMorgan Chase Bank NA | 1.650% | 9/23/19 | 11,940 | 11,967 |
| KeyBank NA | 2.350% | 3/8/19 | 6,798 | 6,925 |
| Lloyds Bank plc | 4.200% | 3/28/17 | 3,210 | 3,258 |
| Lloyds Bank plc | 1.750% | 5/14/18 | 6,160 | 6,183 |
| Manufacturers & Traders Trust Co. | 1.250% | 1/30/17 | 9,180 | 9,182 |
| Mitsubishi UFJ Financial Group Inc. | 2.950% | 3/1/21 | 8,395 | 8,636 |
| Mitsubishi UFJ Financial Group Inc. | 2.190% | 9/13/21 | 7,105 | 7,075 |
| 8 Mitsubishi UFJ Trust & Banking Corp. | 2.450% | 10/16/19 | 2,625 | 2,663 |
| 8 Mitsubishi UFJ Trust & Banking Corp. | 2.650% | 10/19/20 | 5,960 | 6,093 |
| Morgan Stanley | 5.550% | 4/27/17 | 9,044 | 9,253 |
| Morgan Stanley | 1.875% | 1/5/18 | 6,400 | 6,430 |
| Morgan Stanley | 2.125% | 4/25/18 | 41,310 | 41,643 |
| Morgan Stanley | 2.200% | 12/7/18 | 1,088 | 1,100 |
| Morgan Stanley | 2.500% | 1/24/19 | 10,235 | 10,426 |
| Morgan Stanley | 2.375% | 7/23/19 | 8,621 | 8,760 |
| Morgan Stanley | 5.625% | 9/23/19 | 1,721 | 1,906 |
| Morgan Stanley | 2.500% | 4/21/21 | 18,165 | 18,341 |
| MUFG Americas Holdings Corp. | 1.625% | 2/9/18 | 4,800 | 4,807 |
| MUFG Union Bank NA | 2.625% | 9/26/18 | 5,970 | 6,081 |
19
| | | | |
| Institutional Short-Term Bond Fund | | | | |
| |
| |
| |
| | | | Face | Market |
| | | Maturity | Amount | Value• |
| | Coupon | Date | ($000) | ($000) |
| MUFG Union Bank NA | 2.250% | 5/6/19 | 4,580 | 4,634 |
| National Australia Bank Ltd. | 1.875% | 7/23/18 | 9,070 | 9,126 |
| National Australia Bank Ltd. | 2.300% | 7/25/18 | 3,860 | 3,918 |
| National Australia Bank Ltd. | 2.000% | 1/14/19 | 6,293 | 6,355 |
| National Australia Bank Ltd. | 1.375% | 7/12/19 | 13,000 | 12,931 |
| National Bank of Canada | 2.100% | 12/14/18 | 6,815 | 6,911 |
| 8 Nordea Bank AB | 1.625% | 9/30/19 | 3,750 | 3,747 |
| PNC Bank NA | 1.500% | 10/18/17 | 15,560 | 15,575 |
| PNC Bank NA | 1.500% | 2/23/18 | 11,800 | 11,836 |
| PNC Bank NA | 1.600% | 6/1/18 | 15,200 | 15,240 |
| PNC Bank NA | 1.800% | 11/5/18 | 15,736 | 15,849 |
| PNC Bank NA | 1.950% | 3/4/19 | 22,720 | 22,950 |
| PNC Bank NA | 1.450% | 7/29/19 | 8,535 | 8,523 |
| Royal Bank of Canada | 1.400% | 10/13/17 | 7,320 | 7,325 |
| Royal Bank of Canada | 2.200% | 7/27/18 | 10,136 | 10,279 |
| Royal Bank of Canada | 1.800% | 7/30/18 | 2,411 | 2,429 |
| Royal Bank of Canada | 2.000% | 12/10/18 | 5,235 | 5,289 |
| Royal Bank of Canada | 2.150% | 3/15/19 | 5,365 | 5,444 |
| Royal Bank of Canada | 1.500% | 7/29/19 | 13,015 | 13,008 |
| Royal Bank of Canada | 2.350% | 10/30/20 | 8,389 | 8,586 |
| Royal Bank of Canada | 2.500% | 1/19/21 | 3,945 | 4,100 |
| Santander UK plc | 1.375% | 3/13/17 | 22,170 | 22,170 |
| Santander UK plc | 1.650% | 9/29/17 | 15,910 | 15,920 |
| Santander UK plc | 3.050% | 8/23/18 | 11,250 | 11,514 |
| Santander UK plc | 2.000% | 8/24/18 | 7,787 | 7,816 |
| Santander UK plc | 2.500% | 3/14/19 | 10,220 | 10,370 |
| Santander UK plc | 2.350% | 9/10/19 | 2,328 | 2,359 |
| 8 Skandinaviska Enskilda Banken AB | 1.750% | 3/19/18 | 9,085 | 9,118 |
| Skandinaviska Enskilda Banken AB | 1.875% | 9/13/21 | 9,435 | 9,362 |
| Sumitomo Mitsui Banking Corp. | 1.950% | 7/23/18 | 2,153 | 2,166 |
| Sumitomo Mitsui Banking Corp. | 2.450% | 1/10/19 | 5,765 | 5,858 |
| Sumitomo Mitsui Banking Corp. | 2.250% | 7/11/19 | 1,250 | 1,264 |
| Svenska Handelsbanken AB | 2.250% | 6/17/19 | 5,500 | 5,595 |
| Svenska Handelsbanken AB | 1.500% | 9/6/19 | 13,625 | 13,586 |
| Svenska Handelsbanken AB | 1.875% | 9/7/21 | 3,015 | 2,997 |
| 8 Swedbank AB | 1.750% | 3/12/18 | 17,350 | 17,415 |
| Toronto-Dominion Bank | 1.125% | 5/2/17 | 11,020 | 11,029 |
| Toronto-Dominion Bank | 1.625% | 3/13/18 | 31,935 | 32,230 |
| Toronto-Dominion Bank | 1.450% | 8/13/19 | 22,525 | 22,500 |
| UBS AG | 1.800% | 3/26/18 | 23,725 | 23,770 |
| US Bank NA | 1.375% | 9/11/17 | 7,810 | 7,820 |
| US Bank NA | 1.350% | 1/26/18 | 6,175 | 6,185 |
| Wachovia Corp. | 5.750% | 6/15/17 | 12,900 | 13,275 |
| Wachovia Corp. | 5.750% | 2/1/18 | 12,660 | 13,376 |
| Wells Fargo & Co. | 2.100% | 5/8/17 | 8,870 | 8,908 |
| Wells Fargo & Co. | 1.400% | 9/8/17 | 14,380 | 14,375 |
| Wells Fargo & Co. | 5.625% | 12/11/17 | 3,210 | 3,367 |
| Wells Fargo & Co. | 1.500% | 1/16/18 | 21,106 | 21,130 |
| Wells Fargo & Co. | 2.150% | 1/15/19 | 9,122 | 9,234 |
| Wells Fargo & Co. | 2.125% | 4/22/19 | 6,430 | 6,514 |
| Wells Fargo & Co. | 2.150% | 1/30/20 | 4,953 | 4,987 |
| Wells Fargo Bank NA | 1.650% | 1/22/18 | 21,087 | 21,147 |
| Westpac Banking Corp. | 1.200% | 5/19/17 | 17,804 | 17,803 |
| Westpac Banking Corp. | 2.000% | 8/14/17 | 12,860 | 12,924 |
| Westpac Banking Corp. | 1.600% | 1/12/18 | 3,390 | 3,402 |
20
| | | | |
| Institutional Short-Term Bond Fund | | | | |
| |
| |
| |
| | | | Face | Market |
| | | Maturity | Amount | Value• |
| | Coupon | Date | ($000) | ($000) |
| Westpac Banking Corp. | 2.250% | 7/30/18 | 9,010 | 9,133 |
| Westpac Banking Corp. | 2.250% | 1/17/19 | 13,390 | 13,599 |
| Westpac Banking Corp. | 1.600% | 8/19/19 | 28,105 | 28,081 |
| Westpac Banking Corp. | 4.875% | 11/19/19 | 25,460 | 27,866 |
| Westpac Banking Corp. | 2.000% | 8/19/21 | 4,540 | 4,538 |
| |
| Brokerage (0.2%) | | | | |
| Charles Schwab Corp. | 1.500% | 3/10/18 | 9,125 | 9,168 |
| NYSE Euronext | 2.000% | 10/5/17 | 6,965 | 7,013 |
| |
| Insurance (0.7%) | | | | |
| Aetna Inc. | 1.900% | 6/7/19 | 10,870 | 10,969 |
| Aetna Inc. | 2.400% | 6/15/21 | 2,865 | 2,899 |
| Berkshire Hathaway Finance Corp. | 1.700% | 3/15/19 | 7,900 | 7,968 |
| Berkshire Hathaway Finance Corp. | 1.300% | 8/15/19 | 6,720 | 6,714 |
| Chubb INA Holdings Inc. | 2.300% | 11/3/20 | 6,294 | 6,462 |
| 8 MassMutual Global Funding II | 2.100% | 8/2/18 | 3,113 | 3,161 |
| MetLife Inc. | 1.903% | 12/15/17 | 18,000 | 18,095 |
| 8 Metropolitan Life Global Funding I | 3.000% | 1/10/23 | 1,000 | 1,032 |
| 8 Reliance Standard Life Global Funding II | 2.150% | 10/15/18 | 15,550 | 15,692 |
| 8 Reliance Standard Life Global Funding II | 3.050% | 1/20/21 | 1,610 | 1,647 |
| UnitedHealth Group Inc. | 1.900% | 7/16/18 | 2,610 | 2,635 |
| |
| Real Estate Investment Trusts (0.0%) | | | | |
| Simon Property Group LP | 3.375% | 3/15/22 | 2,230 | 2,369 |
| | | | | 1,878,931 |
| Industrial (9.6%) | | | | |
| Basic Industry (0.4%) | | | | |
| 8 Air Liquide Finance SA | 1.375% | 9/27/19 | 3,835 | 3,832 |
| Air Products & Chemicals Inc. | 1.200% | 10/15/17 | 920 | 922 |
| Air Products & Chemicals Inc. | 4.375% | 8/21/19 | 5,050 | 5,478 |
| BHP Billiton Finance USA Ltd. | 1.625% | 2/24/17 | 23,815 | 23,845 |
| BHP Billiton Finance USA Ltd. | 5.400% | 3/29/17 | 3,320 | 3,382 |
| BHP Billiton Finance USA Ltd. | 2.050% | 9/30/18 | 4,590 | 4,641 |
| BHP Billiton Finance USA Ltd. | 6.500% | 4/1/19 | 2,060 | 2,304 |
| |
| Capital Goods (1.9%) | | | | |
| Caterpillar Financial Services Corp. | 7.150% | 2/15/19 | 10,575 | 11,977 |
| Caterpillar Financial Services Corp. | 2.250% | 12/1/19 | 13,660 | 13,940 |
| Caterpillar Financial Services Corp. | 2.500% | 11/13/20 | 4,410 | 4,545 |
| 8 Caterpillar Financial Services Corp. | 1.931% | 10/1/21 | 5,785 | 5,776 |
| General Electric Capital Corp. | 5.625% | 9/15/17 | 10,423 | 10,868 |
| General Electric Capital Corp. | 2.200% | 1/9/20 | 1,465 | 1,503 |
| General Electric Capital Corp. | 5.550% | 5/4/20 | 3,480 | 3,966 |
| General Electric Capital Corp. | 4.375% | 9/16/20 | 10,650 | 11,783 |
| General Electric Co. | 5.250% | 12/6/17 | 38,586 | 40,432 |
| Illinois Tool Works Inc. | 6.250% | 4/1/19 | 2,725 | 3,047 |
| John Deere Capital Corp. | 5.350% | 4/3/18 | 3,660 | 3,885 |
| John Deere Capital Corp. | 5.750% | 9/10/18 | 12,315 | 13,379 |
| John Deere Capital Corp. | 1.950% | 1/8/19 | 15,070 | 15,307 |
| John Deere Capital Corp. | 2.375% | 7/14/20 | 6,140 | 6,306 |
| Precision Castparts Corp. | 1.250% | 1/15/18 | 12,225 | 12,236 |
| Raytheon Co. | 6.750% | 3/15/18 | 4,400 | 4,755 |
| Raytheon Co. | 6.400% | 12/15/18 | 16,055 | 17,877 |
21
| | | | |
| Institutional Short-Term Bond Fund | | | | |
| |
| |
| |
| | | | Face | Market |
| | | Maturity | Amount | Value• |
| | Coupon | Date | ($000) | ($000) |
| 8 Siemens Financieringsmaatschappij NV | 1.300% | 9/13/19 | 11,355 | 11,287 |
| 8 Siemens Financieringsmaatschappij NV | 2.350% | 10/15/26 | 1,990 | 1,969 |
| |
| Communication (0.7%) | | | | |
| America Movil SAB de CV | 5.625% | 11/15/17 | 32,700 | 34,271 |
| America Movil SAB de CV | 5.000% | 3/30/20 | 1,265 | 1,395 |
| Comcast Corp. | 6.500% | 1/15/17 | 5,635 | 5,721 |
| Comcast Corp. | 5.875% | 2/15/18 | 11,900 | 12,639 |
| Comcast Corp. | 5.700% | 5/15/18 | 12,455 | 13,338 |
| |
| Consumer Cyclical (1.4%) | | | | |
| Alibaba Group Holding Ltd. | 1.625% | 11/28/17 | 2,500 | 2,500 |
| American Honda Finance Corp. | 0.950% | 5/5/17 | 2,975 | 2,975 |
| American Honda Finance Corp. | 1.550% | 12/11/17 | 4,238 | 4,259 |
| American Honda Finance Corp. | 1.500% | 3/13/18 | 4,560 | 4,581 |
| American Honda Finance Corp. | 1.600% | 7/13/18 | 2,910 | 2,927 |
| American Honda Finance Corp. | 2.125% | 10/10/18 | 11,670 | 11,868 |
| 8 BMW US Capital LLC | 1.500% | 4/11/19 | 13,810 | 13,823 |
| 8 Daimler Finance North America LLC | 1.125% | 3/10/17 | 6,145 | 6,143 |
| 8 Harley-Davidson Financial Services Inc. | 2.700% | 3/15/17 | 11,968 | 12,058 |
| 8 Harley-Davidson Financial Services Inc. | 2.250% | 1/15/19 | 1,097 | 1,111 |
| 8 Harley-Davidson Financial Services Inc. | 2.400% | 9/15/19 | 6,360 | 6,467 |
| 8 Harley-Davidson Funding Corp. | 6.800% | 6/15/18 | 415 | 450 |
| Lowe’s Cos. Inc. | 1.150% | 4/15/19 | 2,320 | 2,316 |
| 8 Nissan Motor Acceptance Corp. | 2.000% | 3/8/19 | 6,090 | 6,139 |
| PACCAR Financial Corp. | 1.400% | 11/17/17 | 4,565 | 4,585 |
| PACCAR Financial Corp. | 1.750% | 8/14/18 | 910 | 920 |
| TJX Cos. Inc. | 6.950% | 4/15/19 | 4,130 | 4,693 |
| Toyota Motor Credit Corp. | 1.375% | 1/10/18 | 9,375 | 9,389 |
| Toyota Motor Credit Corp. | 1.450% | 1/12/18 | 10,965 | 10,998 |
| Toyota Motor Credit Corp. | 1.200% | 4/6/18 | 8,180 | 8,178 |
| Toyota Motor Credit Corp. | 1.550% | 7/13/18 | 3,900 | 3,922 |
| Visa Inc. | 1.200% | 12/14/17 | 27,405 | 27,467 |
| |
| Consumer Noncyclical (1.4%) | | | | |
| Anheuser-Busch InBev Finance Inc. | 1.250% | 1/17/18 | 240 | 241 |
| Anheuser-Busch InBev Finance Inc. | 1.900% | 2/1/19 | 44,238 | 44,629 |
| Anheuser-Busch InBev Worldwide Inc. | 7.750% | 1/15/19 | 4,475 | 5,090 |
| Coca-Cola Co. | 3.150% | 11/15/20 | 3,700 | 3,972 |
| Gilead Sciences Inc. | 1.850% | 9/4/18 | 4,115 | 4,158 |
| Gilead Sciences Inc. | 2.350% | 2/1/20 | 24,985 | 25,642 |
| Hershey Co. | 1.600% | 8/21/18 | 780 | 787 |
| Medtronic Inc. | 1.500% | 3/15/18 | 9,000 | 9,039 |
| Medtronic Inc. | 1.375% | 4/1/18 | 11,700 | 11,732 |
| PepsiCo Inc. | 1.250% | 4/30/18 | 13,500 | 13,549 |
| PepsiCo Inc. | 5.000% | 6/1/18 | 7,250 | 7,703 |
| Philip Morris International Inc. | 1.875% | 1/15/19 | 3,937 | 3,980 |
| 8 Roche Holdings Inc. | 2.250% | 9/30/19 | 8,575 | 8,803 |
| 8 Takeda Pharmaceutical Co. Ltd. | 1.625% | 3/17/17 | 6,430 | 6,438 |
| |
| Energy (2.6%) | | | | |
| BP Capital Markets plc | 1.846% | 5/5/17 | 5,756 | 5,780 |
| BP Capital Markets plc | 1.375% | 11/6/17 | 6,500 | 6,497 |
| BP Capital Markets plc | 1.674% | 2/13/18 | 18,727 | 18,804 |
| BP Capital Markets plc | 1.375% | 5/10/18 | 9,000 | 8,998 |
22
| | | | |
| Institutional Short-Term Bond Fund | | | | |
| |
| |
| |
| | | | Face | Market |
| | | Maturity | Amount | Value• |
| | Coupon | Date | ($000) | ($000) |
| BP Capital Markets plc | 2.241% | 9/26/18 | 13,800 | 14,005 |
| BP Capital Markets plc | 1.676% | 5/3/19 | 17,700 | 17,756 |
| BP Capital Markets plc | 4.500% | 10/1/20 | 2,750 | 3,020 |
| Chevron Corp. | 1.344% | 11/9/17 | 25,400 | 25,443 |
| Chevron Corp. | 1.365% | 3/2/18 | 13,330 | 13,355 |
| Chevron Corp. | 1.718% | 6/24/18 | 6,810 | 6,861 |
| Chevron Corp. | 2.193% | 11/15/19 | 4,500 | 4,590 |
| Chevron Corp. | 2.427% | 6/24/20 | 4,000 | 4,118 |
| Dominion Gas Holdings LLC | 2.500% | 12/15/19 | 1,830 | 1,879 |
| Exxon Mobil Corp. | 1.305% | 3/6/18 | 9,125 | 9,153 |
| Shell International Finance BV | 1.625% | 11/10/18 | 13,750 | 13,798 |
| Shell International Finance BV | 2.000% | 11/15/18 | 9,200 | 9,311 |
| Shell International Finance BV | 1.375% | 5/10/19 | 59,000 | 58,812 |
| Total Capital International SA | 1.000% | 1/10/17 | 6,500 | 6,500 |
| Total Capital International SA | 1.500% | 2/17/17 | 3,670 | 3,674 |
| Total Capital International SA | 1.550% | 6/28/17 | 12,470 | 12,500 |
| Total Capital International SA | 2.125% | 1/10/19 | 4,150 | 4,220 |
| Total Capital SA | 2.125% | 8/10/18 | 17,254 | 17,508 |
| Total Capital SA | 4.450% | 6/24/20 | 5,000 | 5,491 |
| |
| Other Industrial (0.2%) | | | | |
| 8 Hutchison Whampoa International 09 Ltd. | 7.625% | 4/9/19 | 14,665 | 16,792 |
| |
| Technology (0.8%) | | | | |
| Apple Inc. | 1.000% | 5/3/18 | 21,008 | 20,979 |
| Apple Inc. | 1.700% | 2/22/19 | 23,845 | 24,113 |
| Baidu Inc. | 3.250% | 8/6/18 | 10,100 | 10,350 |
| EMC Corp. | 1.875% | 6/1/18 | 6,900 | 6,786 |
| Intel Corp. | 1.350% | 12/15/17 | 18,910 | 18,968 |
| |
| Transportation (0.2%) | | | | |
| Burlington Northern Santa Fe LLC | 4.700% | 10/1/19 | 15,227 | 16,726 |
| 6 Northwest Airlines 2007-1 Class A Pass | | | | |
| Through Trust | 7.027% | 5/1/21 | 4,273 | 4,828 |
| 6 UAL 2009-2A Pass Through Trust | 9.750% | 7/15/18 | 4,000 | 4,095 |
| | | | | 995,848 |
| Utilities (1.4%) | | | | |
| Electric (1.3%) | | | | |
| Arizona Public Service Co. | 8.750% | 3/1/19 | 760 | 888 |
| Commonwealth Edison Co. | 6.150% | 9/15/17 | 8,360 | 8,738 |
| Commonwealth Edison Co. | 5.800% | 3/15/18 | 5,390 | 5,743 |
| Connecticut Light & Power Co. | 5.500% | 2/1/19 | 2,230 | 2,435 |
| Georgia Power Co. | 5.700% | 6/1/17 | 12,860 | 13,208 |
| Georgia Power Co. | 1.950% | 12/1/18 | 6,205 | 6,309 |
| MidAmerican Energy Co. | 2.400% | 3/15/19 | 2,785 | 2,857 |
| National Rural Utilities Cooperative Finance Corp. | 10.375% | 11/1/18 | 39,312 | 46,477 |
| Pacific Gas & Electric Co. | 5.625% | 11/30/17 | 20,020 | 21,022 |
| Pacific Gas & Electric Co. | 8.250% | 10/15/18 | 2,280 | 2,585 |
| Pacific Gas & Electric Co. | 3.500% | 10/1/20 | 7,305 | 7,826 |
| PacifiCorp | 3.850% | 6/15/21 | 1,150 | 1,259 |
| Public Service Electric & Gas Co. | 2.000% | 8/15/19 | 7,300 | 7,441 |
| Public Service Electric & Gas Co. | 3.500% | 8/15/20 | 1,182 | 1,264 |
| South Carolina Electric & Gas Co. | 6.500% | 11/1/18 | 1,240 | 1,371 |
| Wisconsin Electric Power Co. | 1.700% | 6/15/18 | 4,660 | 4,700 |
23
| | | | | |
| Institutional Short-Term Bond Fund | | | | |
| |
| |
| |
| | | | | Face | Market |
| | | | Maturity | Amount | Value• |
| | | Coupon | Date | ($000) | ($000) |
| | Natural Gas (0.1%) | | | | |
| | Atmos Energy Corp. | 8.500% | 3/15/19 | 8,720 | 10,148 |
| | | | | | 144,271 |
| Total Corporate Bonds (Cost $3,004,328) | | | | 3,019,050 |
| Sovereign Bonds (U.S. Dollar-Denominated) (9.6%) | | | | |
| | Asian Development Bank | 0.750% | 1/11/17 | 25,000 | 25,004 |
| 8 | Avi Funding Co. Ltd. | 2.850% | 9/16/20 | 6,700 | 6,876 |
| 8 | Banco del Estado de Chile | 2.000% | 11/9/17 | 7,095 | 7,123 |
| 8 | Bank Nederlandse Gemeenten NV | 0.875% | 2/21/17 | 14,700 | 14,700 |
| 8 | Bank Nederlandse Gemeenten NV | 1.125% | 5/25/18 | 36,700 | 36,741 |
| 8 | Bank Nederlandse Gemeenten NV | 1.000% | 9/20/18 | 10,000 | 9,979 |
| | Bermuda | 5.603% | 7/20/20 | 4,225 | 4,740 |
| 8 | Caisse d’Amortissement de la Dette Sociale | 1.125% | 1/30/17 | 4,350 | 4,356 |
| 8 | Caisse d’Amortissement de la Dette Sociale | 1.375% | 1/29/18 | 1,825 | 1,838 |
| | CNOOC Finance 2013 Ltd. | 1.750% | 5/9/18 | 16,820 | 16,818 |
| | CNOOC Finance 2015 Australia Pty Ltd. | 2.625% | 5/5/20 | 1,050 | 1,069 |
| | CNOOC Nexen Finance 2014 ULC | 1.625% | 4/30/17 | 16,425 | 16,483 |
| | Corp. Andina de Fomento | 1.500% | 8/8/17 | 14,590 | 14,608 |
| 8 | Corp. Nacional del Cobre de Chile | 3.875% | 11/3/21 | 7,275 | 7,593 |
| | Corp. Nacional del Cobre de Chile | 3.000% | 7/17/22 | 2,520 | 2,514 |
| 8 | Corp. Nacional del Cobre de Chile | 3.000% | 7/17/22 | 2,375 | 2,365 |
| 8 | Corp. Nacional del Cobre de Chile | 4.500% | 8/13/23 | 6,875 | 7,326 |
| 8 | CPPIB Capital Inc. | 1.250% | 9/20/19 | 20,000 | 20,006 |
| 8,9 | Development Bank of Japan Inc. | 1.625% | 10/5/16 | 2,750 | 2,750 |
| 9 | Development Bank of Japan Inc. | 5.125% | 2/1/17 | 2,750 | 2,785 |
| 8,10 Dexia Credit Local SA | 1.250% | 10/18/16 | 5,500 | 5,500 |
| 8,10 Dexia Credit Local SA | 1.875% | 9/15/21 | 9,080 | 9,069 |
| 8 | Electricite de France SA | 1.150% | 1/20/17 | 13,775 | 13,775 |
| 8 | Electricite de France SA | 6.500% | 1/26/19 | 1,825 | 2,021 |
| | European Investment Bank | 1.750% | 3/15/17 | 8,275 | 8,306 |
| | European Investment Bank | 1.625% | 6/15/17 | 2,300 | 2,311 |
| | European Investment Bank | 1.000% | 3/15/18 | 13,775 | 13,792 |
| | European Investment Bank | 1.875% | 3/15/19 | 18,375 | 18,717 |
| | European Investment Bank | 2.500% | 4/15/21 | 11,025 | 11,560 |
| | Export-Import Bank of Korea | 4.000% | 1/11/17 | 50,806 | 51,186 |
| | Export-Import Bank of Korea | 5.125% | 6/29/20 | 1,375 | 1,542 |
| | Export-Import Bank of Korea | 4.000% | 1/29/21 | 4,775 | 5,205 |
| | FMS Wertmanagement AoeR | 1.125% | 9/5/17 | 4,580 | 4,588 |
| | FMS Wertmanagement AoeR | 1.625% | 11/20/18 | 9,175 | 9,282 |
| | Hydro-Quebec | 1.375% | 6/19/17 | 15,327 | 15,382 |
| 8 | ICBCIL Finance Co. Ltd. | 2.375% | 5/19/19 | 6,360 | 6,400 |
| | Industrial & Commercial Bank of China Ltd. | 2.351% | 11/13/17 | 4,500 | 4,531 |
| | Inter-American Development Bank | 0.875% | 11/15/16 | 9,175 | 9,175 |
| | Inter-American Development Bank | 1.125% | 3/15/17 | 4,600 | 4,606 |
| | Inter-American Development Bank | 2.375% | 8/15/17 | 6,425 | 6,505 |
| | Inter-American Development Bank | 2.125% | 11/9/20 | 1,800 | 1,860 |
| | Inter-American Development Bank | 1.250% | 9/14/21 | 18,165 | 18,095 |
| | International Bank for Reconstruction & | | | | |
| | Development | 0.625% | 10/14/16 | 20,000 | 20,000 |
| | International Finance Corp. | 1.125% | 11/23/16 | 4,400 | 4,404 |
| | International Finance Corp. | 1.750% | 9/4/18 | 15,600 | 15,771 |
| 8 | IPIC GMTN Ltd. | 3.750% | 3/1/17 | 1,700 | 1,715 |
| 9 | Japan Bank for International Cooperation | 1.750% | 7/31/18 | 4,600 | 4,634 |
| 9 | Japan Bank for International Cooperation | 1.750% | 11/13/18 | 7,575 | 7,620 |
24
| | | | | |
| Institutional Short-Term Bond Fund | | | | |
| |
| |
| |
| | | | | Face | Market |
| | | | Maturity | Amount | Value• |
| | | Coupon | Date | ($000) | ($000) |
| 8 | Japan Finance Organization for Municipalities | 2.125% | 3/6/19 | 13,775 | 13,916 |
| 11 | KFW | 1.250% | 10/5/16 | 4,600 | 4,598 |
| 11 | KFW | 1.250% | 2/15/17 | 9,175 | 9,192 |
| 11 | KFW | 1.000% | 6/11/18 | 11,475 | 11,481 |
| 11 | KFW | 1.000% | 9/7/18 | 10,000 | 9,994 |
| 11 | KFW | 1.875% | 4/1/19 | 4,600 | 4,687 |
| 11 | KFW | 4.000% | 1/27/20 | 4,125 | 4,492 |
| 11 | KFW | 2.625% | 1/25/22 | 4,600 | 4,866 |
| 11 | KFW | 2.125% | 1/17/23 | 1,825 | 1,880 |
| 8 | Kingdom of Sweden | 1.000% | 11/15/16 | 6,425 | 6,425 |
| 8 | Kommunalbanken AS | 1.000% | 3/15/18 | 2,750 | 2,750 |
| 8 | Kommunalbanken AS | 1.125% | 5/23/18 | 7,350 | 7,358 |
| 8 | Kommunalbanken AS | 2.125% | 3/15/19 | 12,850 | 13,135 |
| 8 | Kommunalbanken AS | 1.750% | 5/28/19 | 13,775 | 13,961 |
| 8 | Kommuninvest I Sverige AB | 0.875% | 12/13/16 | 6,425 | 6,428 |
| 8 | Kommuninvest I Sverige AB | 1.000% | 10/24/17 | 2,750 | 2,752 |
| | Korea Development Bank | 3.875% | 5/4/17 | 9,200 | 9,338 |
| | Korea Development Bank | 2.250% | 8/7/17 | 12,700 | 12,804 |
| | Korea Development Bank | 3.500% | 8/22/17 | 23,130 | 23,563 |
| | Korea Development Bank | 4.625% | 11/16/21 | 1,800 | 2,044 |
| 8 | Korea East-West Power Co. Ltd. | 2.500% | 7/16/17 | 2,050 | 2,065 |
| 8 | Korea Expressway Corp. | 1.625% | 4/28/17 | 32,150 | 32,153 |
| 8 | Korea Expressway Corp. | 1.875% | 10/22/17 | 1,800 | 1,808 |
| 8 | Korea Gas Corp. | 2.875% | 7/29/18 | 7,350 | 7,530 |
| 8 | Korea Land & Housing Corp. | 1.875% | 8/2/17 | 4,600 | 4,617 |
| | Korea National Oil Corp. | 3.125% | 4/3/17 | 4,600 | 4,640 |
| 8 | Korea National Oil Corp. | 2.750% | 1/23/19 | 18,375 | 18,812 |
| 8 | Korea Resources Corp. | 2.125% | 5/2/18 | 2,750 | 2,768 |
| 8 | Municipality Finance plc | 1.125% | 4/17/18 | 2,300 | 2,302 |
| 8 | Nederlandse Waterschapsbank NV | 1.875% | 3/13/19 | 7,350 | 7,467 |
| 8 | Nederlandse Waterschapsbank NV | 1.250% | 9/9/19 | 11,000 | 10,994 |
| | North American Development Bank | 2.300% | 10/10/18 | 2,400 | 2,451 |
| 8 | Province of Alberta | 1.000% | 6/21/17 | 2,750 | 2,752 |
| 8 | Province of Alberta | 1.750% | 8/26/20 | 8,600 | 8,700 |
| | Province of Manitoba | 2.100% | 9/6/22 | 1,275 | 1,310 |
| | Province of Ontario | 1.100% | 10/25/17 | 21,125 | 21,163 |
| | Province of Ontario | 1.625% | 1/18/19 | 34,665 | 34,964 |
| | Province of Ontario | 2.000% | 1/30/19 | 8,630 | 8,775 |
| | Province of Ontario | 1.250% | 6/17/19 | 27,250 | 27,235 |
| | Province of Ontario | 4.000% | 10/7/19 | 2,375 | 2,560 |
| | Province of Ontario | 4.400% | 4/14/20 | 1,375 | 1,514 |
| | Quebec | 2.750% | 8/25/21 | 5,825 | 6,141 |
| | Republic of Korea | 5.125% | 12/7/16 | 19,800 | 19,945 |
| | Republic of Poland | 6.375% | 7/15/19 | 17,261 | 19,419 |
| | Republic of Poland | 5.125% | 4/21/21 | 1,240 | 1,401 |
| | Republic of Poland | 5.000% | 3/23/22 | 18,925 | 21,574 |
| 8 | Sinopec Group Overseas Development 2012 Ltd. | 2.750% | 5/17/17 | 2,000 | 2,015 |
| 8 | State Grid Overseas Investment 2014 Ltd. | 2.750% | 5/7/19 | 9,175 | 9,437 |
| | State of Israel | 3.150% | 6/30/23 | 1,800 | 1,913 |
| 8 | State of Qatar | 3.125% | 1/20/17 | 2,300 | 2,306 |
| | Statoil ASA | 1.250% | 11/9/17 | 25,000 | 24,977 |
| | Statoil ASA | 1.200% | 1/17/18 | 1,550 | 1,548 |
| | Statoil ASA | 1.950% | 11/8/18 | 13,775 | 13,909 |
| | Statoil ASA | 3.150% | 1/23/22 | 2,700 | 2,856 |
| | Statoil ASA | 2.650% | 1/15/24 | 1,825 | 1,870 |
25
| | | | | |
| Institutional Short-Term Bond Fund | | | | |
| |
| |
| |
| | | | | Face | Market |
| | | | Maturity | Amount | Value• |
| | | Coupon | Date | ($000) | ($000) |
| | Svensk Exportkredit AB | 1.125% | 4/5/18 | 5,475 | 5,481 |
| 8 | Temasek Financial I Ltd. | 4.300% | 10/25/19 | 2,250 | 2,451 |
| 8 | Temasek Financial I Ltd. | 2.375% | 1/23/23 | 4,600 | 4,705 |
| Total Sovereign Bonds (Cost $987,878) | | | | 997,418 |
| Taxable Municipal Bonds (0.2%) | | | | |
| | Florida Hurricane Catastrophe Fund Finance | | | | |
| | Corp. Revenue | 2.107% | 7/1/18 | 1,825 | 1,852 |
| | Louisiana Local Government Environmental | | | | |
| | Facilities & Community Development Authority | | | | |
| | Revenue 2010-EGSL | 3.220% | 2/1/21 | 3,949 | 4,022 |
| | Louisiana Local Government Environmental | | | | |
| | Facilities & Community Development Authority | | | | |
| | Revenue 2010-ELL | 3.450% | 2/1/22 | 10,837 | 11,143 |
| | Princeton University New Jersey GO | 4.950% | 3/1/19 | 5,975 | 6,514 |
| Total Taxable Municipal Bonds (Cost $23,190) | | | | 23,531 |
| |
| | | | | Shares | |
| Temporary Cash Investments (7.2%) | | | | |
| Money Market Fund (6.9%) | | | | |
| 12 | Vanguard Market Liquidity Fund | 0.640% | | 7,134,426 | 713,514 |
| |
| | | | | Face | |
| | | | | Amount | |
| | | | | ($000) | |
| Certificates of Deposit (0.3%) | | | | |
| | Bank of Tokyo-Mitsubishi UFJ Ltd. (New York Branch) | 1.520% | 8/9/17 | 22,070 | 22,179 |
| | Toronto Dominion Bank (New York Branch) | 1.350% | 8/11/17 | 14,230 | 14,281 |
| | | | | | 36,460 |
| Total Temporary Cash Investments (Cost $749,810) | | | | 749,974 |
| Total Investments (103.7%) (Cost $10,725,325) | | | | 10,786,799 |
| |
| | | | | | Amount |
| | | | | | ($000) |
| Other Assets and Liabilities (-3.7%) | | | | |
| Other Assets | | | | |
| Investment in Vanguard | | | | 798 |
| Receivables for Investment Securities Sold | | | | 121,256 |
| Receivables for Accrued Income | | | | 36,628 |
| Other Assets | | | | 2,673 |
| Total Other Assets | | | | 161,355 |
| Liabilities | | | | |
| Payables for Investment Securities Purchased | | | | (544,849) |
| Payables to Vanguard | | | | (1,177) |
| Other Liabilities | | | | (4,686) |
| Total Liabilities | | | | (550,712) |
| Net Assets (100%) | | | | |
| Applicable to 751,511,910 outstanding $.001 par value shares of | | | |
| beneficial interest (unlimited authorization) | | | | 10,397,442 |
| Net Asset Value Per Share | | | | $13.84 |
26
| |
| Institutional Short-Term Bond Fund | |
| |
| |
| |
| At September 30, 2016, net assets consisted of: | |
| | Amount |
| | ($000) |
| Paid-in Capital | 10,332,544 |
| Undistributed Net Investment Income | 640 |
| Accumulated Net Realized Gains | 3,094 |
| Unrealized Appreciation (Depreciation) | |
| Investment Securities | 61,474 |
| Futures Contracts | (919) |
| Swap Contracts | 609 |
| Net Assets | 10,397,442 |
• See Note A in Notes to Financial Statements.
1 Securities with a value of $2,680,000 have been segregated as initial margin for open futures contracts.
2 Securities with a value of $2,233,000 have been segregated as initial margin for open cleared swap contracts. 3 U.S. government-guaranteed.
4 The issuer operates under a congressional charter; its securities are generally neither guaranteed by the U.S. Treasury nor backed by the full faith and credit of the U.S. government.
5 The issuer was placed under federal conservatorship in September 2008; since that time, its daily operations have been managed by the Federal Housing Finance Agency and it receives capital from the U.S. Treasury, as needed to maintain a positive net worth, in exchange for senior preferred stock.
6 The average or expected maturity is shorter than the final maturity shown because of the possibility of interim principal payments and prepayments or the possibility of the issue being called.
7 Adjustable-rate security.
8 Security exempt from registration under Rule 144A of the Securities Act of 1933. Such securities may be sold in transactions exempt from registration, normally to qualified institutional buyers. At September 30, 2016, the aggregate value of these securities was $1,662,677,000, representing 16.0% of net assets.
9 Guaranteed by the Government of Japan. 10 Guaranteed by multiple countries.
11 Guaranteed by the Federal Republic of Germany.
12 Affiliated money market fund available only to Vanguard funds and certain trusts and accounts managed by Vanguard. Rate shown is the 7-day yield.
GO—General Obligation Bond.
See accompanying Notes, which are an integral part of the Financial Statements
27
| |
| Institutional Short-Term Bond Fund | |
| |
| |
| Statement of Operations | |
| |
| | Year Ended |
| | September 30, 2016 |
| | ($000) |
| Investment Income | |
| Income | |
| Interest1 | 143,010 |
| Total Income | 143,010 |
| Expenses | |
| The Vanguard Group—Note B | |
| Investment Advisory Services | 275 |
| Management and Administrative | 1,467 |
| Marketing and Distribution | 180 |
| Custodian Fees | 128 |
| Auditing Fees | 36 |
| Trustees’ Fees and Expenses | 5 |
| Total Expenses | 2,091 |
| Net Investment Income | 140,919 |
| Realized Net Gain (Loss) | |
| Investment Securities Sold1 | 14,564 |
| Futures Contracts | (5,293) |
| Swap Contracts | (6,960) |
| Realized Net Gain (Loss) | 2,311 |
| Change in Unrealized Appreciation (Depreciation) | |
| Investment Securities | 26,817 |
| Futures Contracts | 835 |
| Swap Contracts | 3,849 |
| Change in Unrealized Appreciation (Depreciation) | 31,501 |
| Net Increase (Decrease) in Net Assets Resulting from Operations | 174,731 |
1 Interest income and realized net gain (loss) from an affiliated company of the fund were $703,000 and $0, respectively.
See accompanying Notes, which are an integral part of the Financial Statements.
28
| | |
| Institutional Short-Term Bond Fund | | |
| |
| |
| Statement of Changes in Net Assets | | |
| |
| | | June 19, |
| | Year Ended | 20151 to |
| | September 30, | September 30, |
| | 2016 | 2015 |
| | ($000) | ($000) |
| Increase (Decrease) in Net Assets | | |
| Operations | | |
| Net Investment Income | 140,919 | 34,425 |
| Realized Net Gain (Loss) | 2,311 | 4,586 |
| Change in Unrealized Appreciation (Depreciation) | 31,501 | 29,663 |
| Net Increase (Decrease) in Net Assets Resulting from Operations | 174,731 | 68,674 |
| Distributions | | |
| Net Investment Income | (139,853) | (35,129) |
| Realized Capital Gain2 | (2,233) | — |
| Total Distributions | (142,086) | (35,129) |
| Capital Share Transactions | | |
| Issued | 100,988 | 10,243,5973 |
| Issued in Lieu of Cash Distributions | 142,087 | 35,129 |
| Redeemed | (148,693) | (41,856) |
| Net Increase (Decrease) from Capital Share Transactions | 94,382 | 10,236,870 |
| Total Increase (Decrease) | 127,027 | 10,270,415 |
| Net Assets | | |
| Beginning of Period | 10,270,415 | — |
| End of Period4 | 10,397,442 | 10,270,415 |
1 Commencement of operations as a registered investment company.
2 Includes fiscal 2016 and 2015 short-term gain distributions totaling $2,233,000 and $0. Short-term gain distributions are treated as ordinary income dividends for tax purposes.
3 Includes shares converted from the net assets of Vanguard Fiduciary Trust Company Short-Term Bond Trust. See Note G in Notes to Financial Statements.
4 Net Assets—End of Period includes undistributed (overdistributed) net investment income of $640,000 and ($209,000).
See accompanying Notes, which are an integral part of the Financial Statements.
29
| | |
| Institutional Short-Term Bond Fund | | |
| |
| |
| Financial Highlights | | |
| |
| | Year | June 19, |
| | Ended | 20151 to |
| | Sept. 30, | Sept. 30, |
| For a Share Outstanding Throughout Each Period | 2016 | 2015 |
| Net Asset Value, Beginning of Period | $13.79 | $13.79 |
| Investment Operations | | |
| Net Investment Income | .188 | . 047 |
| Net Realized and Unrealized Gain (Loss) on Investments | .052 | .001 |
| Total from Investment Operations | .240 | .048 |
| Distributions | | |
| Dividends from Net Investment Income | (.187) | (.048) |
| Distributions from Realized Capital Gains | (.003) | — |
| Total Distributions | (.190) | (.048) |
| Net Asset Value, End of Period | $13.84 | $13.79 |
| |
| Total Return | 1.75% | 0.35% |
| |
| Ratios/Supplemental Data | | |
| Net Assets, End of Period (Millions) | $10,397 | $10,270 |
| Ratio of Total Expenses to Average Net Assets | 0.02% | 0.02%2 |
| Ratio of Net Investment Income to Average Net Assets | 1.37% | 1.22%2 |
| Portfolio Turnover Rate | 119% | 28% |
| 1 Commencement of operations as a registered investment company. | | |
| 2 Annualized. | | |
See accompanying Notes, which are an integral part of the Financial Statements.
30
Institutional Short-Term Bond Fund
Notes to Financial Statements
Vanguard Institutional Short-Term Bond Fund is registered under the Investment Company Act of 1940 as an open-end investment company, or mutual fund. The fund has been established by Vanguard as an investment vehicle for certain collective trusts and other accounts managed by Vanguard or its affiliates, and qualifying education savings plans. The fund is offered to investors who meet certain administrative and service criteria and invest a minimum of $10 million. Certain of the fund’s investments are in corporate debt instruments; the issuers’ abilities to meet their obligations may be affected by economic developments in their respective industries.
A. The following significant accounting policies conform to generally accepted accounting principles for U.S. investment companies. The fund consistently follows such policies in preparing its financial statements.
1. Security Valuation: Securities are valued as of the close of trading on the New York Stock Exchange (generally 4 p.m., Eastern time) on the valuation date. Bonds and temporary cash investments acquired over 60 days to maturity are valued using the latest bid prices or using valuations based on a matrix system (which considers such factors as security prices, yields, maturities, and ratings), both as furnished by independent pricing services. Structured debt securities, including mortgages and asset-backed securities, are valued using the latest bid prices or using valuations based on a matrix system that considers such factors as issuer, tranche, nominal or option-adjusted spreads, weighted average coupon, weighted average maturity, credit enhancements, and collateral. Investments in Vanguard Market Liquidity Fund are valued at that fund’s net asset value. Other temporary cash investments are valued at amortized cost, which approximates market value. Securities for which market quotations are not readily available, or whose values have been affected by events occurring before the fund’s pricing time but after the close of the securities’ primary markets, are valued by methods deemed by the board of trustees to represent fair value.
2. Futures Contracts: The fund uses futures contracts to invest in fixed income asset classes with greater efficiency and lower cost than is possible through direct investment, to add value when these instruments are attractively priced, or to adjust sensitivity to changes in interest rates. The primary risks associated with the use of futures contracts are imperfect correlation between changes in market values of bonds held by the fund and the prices of futures contracts, and the possibility of an illiquid market. Counterparty risk involving futures is mitigated because a regulated clearinghouse is the counterparty instead of the clearing broker. To further mitigate counterparty risk, the fund trades futures contracts on an exchange, monitors the financial strength of its clearing brokers and clearinghouse, and has entered into clearing agreements with its clearing brokers. The clearinghouse imposes initial margin requirements to secure the fund’s performance and requires daily settlement of variation margin representing changes in the market value of each contract.
Futures contracts are valued at their quoted daily settlement prices. The aggregate settlement values of the contracts are not recorded in the Statement of Net Assets. Fluctuations in the value of the contracts are recorded in the Statement of Net Assets as an asset (liability) and in the Statement of Operations as unrealized appreciation (depreciation) until the contracts are closed, when they are recorded as realized futures gains (losses).
During the year ended September 30, 2016, the fund’s average investments in long and short futures contracts represented 14% and 5% of net assets, respectively, based on the average of aggregate settlement values at each quarter-end during the period.
3. Swap Contracts: The fund invests in credit default swaps to adjust the overall credit risk of the fund or to actively overweight or underweight credit risk to a specific issuer or group of issuers. The fund may sell credit protection through credit default swaps to simulate investments in long positions that are either unavailable or considered to be less attractively priced in the bond market. The fund may purchase credit protection through credit default swaps to reduce credit exposure to a given issuer
31
Institutional Short-Term Bond Fund
or issuers. Under the terms of the swaps, an up-front payment may be exchanged between the seller and buyer. In addition, the seller of the credit protection receives a periodic payment of premium from the buyer that is a fixed percentage applied to a notional amount. If, for example, the reference entity is subject to a credit event (such as bankruptcy, failure to pay, or obligation acceleration) during the term of the swap, the seller agrees to either physically settle or cash settle the swap contract. If the swap is physically settled, the seller agrees to pay the buyer an amount equal to the notional amount and take delivery of a debt instrument of the reference issuer with a par amount equal to such notional amount. If the swap is cash settled, the seller agrees to pay the buyer the difference between the notional amount and the final price for the relevant debt instrument, as determined either in a market auction or pursuant to a pre-agreed-upon valuation procedure.
The fund enters into interest rate swap transactions to adjust the fund’s sensitivity to changes in interest rates and maintain the ability to generate income at prevailing market rates. Under the terms of the swaps, one party pays the other an amount that is a fixed percentage rate applied to a notional amount. In return, the counterparty agrees to pay a floating rate, which is reset periodically based on short-term interest rates, applied to the same notional amount.
The notional amounts of swap contracts are not recorded in the Statement of Net Assets. Swaps are valued daily based on market quotations received from independent pricing services or recognized dealers and the change in value is recorded in the Statement of Net Assets as an asset (liability) and in the Statement of Operations as unrealized appreciation (depreciation) until the seller of credit protection is required to take delivery (or, in a cash settled swap, pay the settlement amount determined) upon occurrence of a credit event, periodic payments are made, or the swap terminates, at which time realized gain (loss) is recorded. The net premium to be received or paid by the fund under swap contracts is accrued daily and recorded as realized gain (loss) over the life of the contract.
The primary risk associated with selling credit protection is that, upon the occurrence of a defined credit event, the market value of the debt instrument received by the fund (or, in a cash settled swap, the debt instruments used to determine the settlement payment by the fund) will be significantly less than the amount paid by the fund and, in a physically settled swap, the fund may receive an illiquid debt instrument. A risk associated with all types of swaps is the possibility that a counterparty may default on its obligation to pay net amounts due to the fund. The fund’s maximum amount subject to counterparty risk is the unrealized appreciation on the swap contract. The fund mitigates its counterparty risk by entering into swaps only with a diverse group of prequalified counterparties, monitoring their financial strength, entering into master netting arrangements with its counterparties, and requiring its counterparties to transfer collateral as security for their performance. In the absence of a default, the collateral pledged or received by the fund cannot be repledged, resold or rehypoth-ecated. In the event of a counterparty’s default (including bankruptcy), the fund may terminate any swap contracts with that counterparty, determine the net amount owed by either party in accordance with its master netting arrangements, and sell or retain any collateral held up to the net amount owed to the fund under the master netting arrangements. The swap contracts contain provisions whereby a counterparty may terminate open contracts if the fund’s net assets decline below a certain level, triggering a payment by the fund if the fund is in a net liability position at the time of the termination. The payment amount would be reduced by any collateral the fund has pledged. Any securities pledged as collateral for open contracts are noted in the Statement of Net Assets. The value of collateral received or pledged is compared daily to the value of the swap contracts exposure with each counterparty, and any difference, if in excess of a specified minimum transfer amount, is adjusted and settled within two business days.
32
Institutional Short-Term Bond Fund
The fund enters into centrally cleared interest rate swaps to achieve the same objectives specified with respect to the equivalent over-the-counter swaps but with less counterparty risk because a regulated clearinghouse is the counterparty instead of the clearing broker or executing broker. The clearinghouse imposes initial margin requirements to secure the fund’s performance, and requires daily settlement of variation margin representing changes in the market value of each contract. To further mitigate counterparty risk, the fund trades with a diverse group of prequalified executing brokers; monitors the financial strength of its clearing brokers, executing brokers, and clearinghouse; and has entered into agreements with its clearing brokers and executing brokers.
During the year ended September 30, 2016, the fund’s average amounts of investments in credit protection sold and credit protection purchased each represented less than 1% of net assets, respectively, based on the average of notional amounts at each quarter-end during the period. The average amount of investments in interest rate swaps represented 12% of net assets, based on the average of notional amounts at each quarter-end during the period.
4. Federal Income Taxes: The fund intends to continue to qualify as a regulated investment company and distribute all of its taxable income. Management has analyzed the fund’s tax positions taken for all open federal income tax years (September 30, 2015–2016), and has concluded that no provision for federal income tax is required in the fund’s financial statements.
5. Distributions: Distributions to shareholders are recorded on the ex-dividend date.
6. Credit Facility: The fund and certain other funds managed by The Vanguard Group (“Vanguard”) participate in a $3.1 billion committed credit facility provided by a syndicate of lenders pursuant to a credit agreement that may be renewed annually; each fund is individually liable for its borrowings, if any, under the credit facility. Borrowings may be utilized for temporary and emergency purposes, and are subject to the fund’s regulatory and contractual borrowing restrictions. The participating funds are charged administrative fees and an annual commitment fee of 0.10% of the undrawn amount of the facility; these fees are allocated to the funds based on a method approved by the fund’s board of trustees and included in Management and Administrative expenses on the fund’s Statement of Operations. Any borrowings under this facility bear interest at a rate based upon the higher of the one-month London Interbank Offered Rate, federal funds effective rate, or overnight bank funding rate plus an agreed-upon spread.
The fund had no borrowings outstanding at September 30, 2016, or at any time during the period then ended.
7. Other: Interest income includes income distributions received from Vanguard Market Liquidity Fund and is accrued daily. Premiums and discounts on debt securities purchased are amortized and accreted, respectively, to interest income over the lives of the respective securities. Security transactions are accounted for on the date securities are bought or sold. Costs used to determine realized gains (losses) on the sale of investment securities are those of the specific securities sold.
B. In accordance with the terms of a Funds’ Service Agreement (the “FSA”) between Vanguard and the fund, Vanguard furnishes to the fund investment advisory, corporate management, administrative, marketing, and distribution services at Vanguard’s cost of operations (as defined by the FSA). These costs of operations are allocated to the fund based on methods and guidelines approved by the board of trustees. Vanguard does not require reimbursement in the current period for certain costs of operations (such as deferred compensation/benefits and risk/insurance costs); the fund’s liability for these costs of operations is included in Payables to Vanguard on the Statement of Net Assets.
33
Institutional Short-Term Bond Fund
Upon the request of Vanguard, the fund may invest up to 0.40% of its net assets as capital in Vanguard. At September 30, 2016, the fund had contributed to Vanguard capital in the amount of $798,000, representing 0.01% of the fund’s net assets and 0.32% of Vanguard’s capitalization. The fund’s trustees and officers are also directors and employees, respectively, of Vanguard.
C. Various inputs may be used to determine the value of the fund’s investments. These inputs are summarized in three broad levels for financial statement purposes. The inputs or methodologies used to value securities are not necessarily an indication of the risk associated with investing in those securities.
Level 1—Quoted prices in active markets for identical securities.
Level 2—Other significant observable inputs (including quoted prices for similar securities, interest rates, prepayment speeds, credit risk, etc.).
Level 3—Significant unobservable inputs (including the fund’s own assumptions used to determine the fair value of investments).
The following table summarizes the market value of the fund’s investments as of September 30, 2016, based on the inputs used to value them:
| | | |
| | Level 1 | Level 2 | Level 3 |
| Investments | ($000) | ($000) | ($000) |
| U.S. Government and Agency Obligations | — | 2,772,237 | — |
| Asset-Backed/Commercial Mortgage-Backed Securities | — | 3,224,589 | — |
| Corporate Bonds | — | 3,019,050 | — |
| Sovereign Bonds | — | 997,418 | — |
| Taxable Municipal Bonds | — | 23,531 | — |
| Temporary Cash Investments | 713,514 | 36,460 | — |
| Futures Contracts—Assets1 | 1,670 | — | — |
| Futures Contracts—Liabilities1 | (998) | — | — |
| Swap Contracts—Assets | 2411 | 171 | — |
| Swap Contracts—Liabilities | (197)1 | (76) | — |
| Total | 714,230 | 10,073,380 | — |
| 1 Represents variation margin on the last day of the reporting period. | | | |
| | | |
| D. At September 30, 2016, the fair values of derivatives were reflected in the Statement of Net Assets as follows: | |
| | | |
| | Interest Rate | Credit | |
| | Contracts | Contracts | Total |
| Statement of Net Assets Caption | ($000) | ($000) | ($000) |
| Other Assets | 1,911 | 171 | 2,082 |
| Liabilities | (1,195) | (76) | (1,271) |
34
Institutional Short-Term Bond Fund
Realized net gain (loss) and the change in unrealized appreciation (depreciation) on derivatives for the year ended September 30, 2016, were:
| | | |
| Interest Rate | Credit | |
| | Contracts | Contracts | Total |
| Realized Net Gain (Loss) on Derivatives | ($000) | ($000) | ($000) |
| Futures Contracts | (5,293) | — | (5,293) |
| Swap Contracts | (9,957) | 2,997 | (6,960) |
| Realized Net Gain (Loss) on Derivatives | (15,250) | 2,997 | (12,253) |
| |
| Change in Unrealized Appreciation (Depreciation) on Derivatives | | | |
| Futures Contracts | 835 | — | 835 |
| Swap Contracts | 2,449 | 1,400 | 3,489 |
| Change in Unrealized Appreciation (Depreciation) on Derivatives | 3,284 | 1,400 | 4,684 |
At September 30, 2016, the aggregate settlement value of open futures contracts and the related unrealized appreciation (depreciation) were:
| | | | |
| | | | | ($000) |
| | | | Aggregate | |
| | | Number of | Settlement | Unrealized |
| | | Long (Short) | Value | Appreciation |
| Futures Contracts | Expiration | Contracts | Long (Short) | (Depreciation) |
| 2-Year U.S. Treasury Note | December 2016 | 7,772 | 1,697,939 | 411 |
| 5-Year U.S. Treasury Note | December 2016 | (6,687) | (812,575) | (1,241) |
| 10-Year U.S. Treasury Note | December 2016 | (693) | (90,870) | 89 |
| 10-Year Ultra U.S. Treasury Note | December 2016 | (177) | (25,516) | 26 |
| 30-Year U.S. Treasury Bond | December 2016 | 59 | 9,921 | (113) |
| Ultra Long U. S. Treasury Bond | December 2016 | 23 | 4,229 | (91) |
| | | | | (919) |
Unrealized appreciation (depreciation) on open futures contracts is required to be treated as realized gain (loss) for tax purposes.
35
| | | | | | |
| Institutional Short-Term Bond Fund | | | | | |
| |
| |
| |
| |
| At September 30, 2016, the fund had the following open swap contracts: | | |
| Over-the-Counter Credit Default Swaps | | | | | |
| | | | | Remaining | | |
| | | | | Up-Front | Periodic | |
| | | | | Premium | Premium | Unrealized |
| | | | Notional | Received | Received | Appreciation |
| | Termination | | Amount | (Paid) | (Paid) (Depreciation) |
| Reference Entity | Date | Counterparty | ($000) | ($000) | (%) | ($000) |
| Credit Protection Sold/ | | | | | | |
| Moody’s Rating | | | | | | |
| Federation of Malaysia/A3 | 12/20/21 | JPMC | 3,400 | 46 | 1.000 | 26 |
| Federation of Malaysia/A3 | 12/20/21 | BNPSW | 9,600 | 122 | 1.000 | 64 |
| Federation of Malaysia/A3 | 12/20/21 | BARC | 9,900 | 87 | 1.000 | 27 |
| People’s Republic of China/Aa3 | 12/20/21 | BNPSW | 6,100 | 26 | 1.000 | 2 |
| People’s Republic of China/Aa3 | 12/20/21 | JPMC | 6,200 | 25 | 1.000 | 1 |
| Republic of Chile/Aa3 | 12/20/21 | BOANA | 3,750 | (16) | 1.000 | 7 |
| Republic of Chile/Aa3 | 12/20/21 | JPMC | 7,600 | (30) | 1.000 | 16 |
| Republic of Chile/Aa3 | 12/20/21 | JPMC | 7,200 | (54) | 1.000 | (10) |
| Republic of Chile/Aa3 | 12/20/21 | BNPSW | 7,500 | (83) | 1.000 | (37) |
| Republic of Chile/Aa3 | 12/20/21 | BARC | 3,750 | (9) | 1.000 | 13 |
| Republic of Chile/Aa3 | 12/20/21 | BARC | 7,500 | (30) | 1.000 | 15 |
| | | | 72,500 | | | 124 |
| |
| Credit Protection Purchased | | | | | | |
| EI du Pont de Nemours & Co. | 12/20/20 | JPMC | 4,915 | 100 | (1.000) | (29) |
| | | | | | | 95 |
The notional amount represents the maximum potential amount the fund could be required to pay as a seller of credit protection if the reference entity was subject to a credit event.
BNPSW—BNP Paribas. BOANA—Bank of America, N.A. GSCM—Goldman Sachs Bank USA. JPMC—JP Morgan Chase Bank.
36
| | | | | | |
| Institutional Short-Term Bond Fund | | | | | |
| |
| |
| |
| |
| Centrally Cleared Interest Rate Swaps | | | | |
| | | | | Fixed | Floating | |
| | | | | Interest Rate | Interest Rate | Unrealized |
| | Future | | Notional | Received | Received | Appreciation |
| | Effective | | Amount | (Paid) | (Paid) | (Depreciation) |
| Termination Date | Date | Clearinghouse | ($000) | (%) | (%) | ($000) |
| 8/15/17 | NA | LCH | 150,000 | 0.981 | (0.524)2 | 396 |
| 12/21/17 | 12/21/161 | CME | 72,926 | (1.000) | 0.0003 | (30) |
| 3/15/18 | NA | CME | 84,500 | 0.899 | (0.524)2 | 203 |
| 12/21/18 | 12/21/161 | CME | 68,847 | 1.250 | (0.000)3 | 70 |
| 12/21/19 | 12/21/161 | CME | 175,114 | 1.250 | (0.000)3 | 325 |
| 2/28/21 | 2/28/171 | LCH | 31,900 | (1.177) | 0.0003 | (24) |
| 12/21/21 | 12/21/161 | CME | 32,615 | (1.500) | 0.0003 | (143) |
| 12/21/23 | 12/21/161 | CME | 39,717 | (1.750) | 0.0003 | (283) |
| | | | | | | 514 |
CME—Chicago Mercantile Exchange. LCH—London Clearing House.
1 Forward interest rate swap. In a forward interest rate swap, the fund and the counterparty agree to make periodic net payments beginning on a specified future effective date.
2 Based on 1-month London Interbank Offered Rate (LIBOR) as of the most recent payment date. 3 Based on 3-month London Interbank Offered Rate (LIBOR) as of the most recent payment date.
E. Distributions are determined on a tax basis and may differ from net investment income and realized capital gains for financial reporting purposes. Differences may be permanent or temporary. Permanent differences are reclassified among capital accounts in the financial statements to reflect their tax character. Temporary differences arise when certain items of income, expense, gain, or loss are recognized in different periods for financial statement and tax purposes. These differences will reverse at some time in the future. Differences in classification may also result from the treatment of short-term gains as ordinary income for tax purposes.
The fund used a tax accounting practice to treat a portion of the price of capital shares redeemed during the year as distributions from realized capital gains. Accordingly, the fund has reclassified $49,000 from accumulated net realized gains to paid-in capital.
Realized and unrealized gains (losses) on certain of the fund’s swap contracts are treated as ordinary income (loss) for tax purposes; the effect on the fund’s income dividends to shareholders is offset by a change in principal return. Realized losses of $217,000 on swap contracts have been reclassified from accumulated net realized gains to undistributed net investment income.
For tax purposes, at September 30, 2016, the fund had $1,035,000 of ordinary income and $3,999,000 of long-term capital gains available for distribution.
At September 30, 2016, the cost of investment securities for tax purposes was $10,726,462,000. Net unrealized appreciation of investment securities for tax purposes was $60,337,000, consisting of unrealized gains of $64,561,000 on securities that had risen in value since their purchase and $4,224,000 in unrealized losses on securities that had fallen in value since their purchase.
37
Institutional Short-Term Bond Fund
F. During the year ended September 30, 2016, the fund purchased $3,244,760,000 of investment securities and sold $3,420,298,000 of investment securities, other than U.S. government securities and temporary cash investments. Purchases and sales of U.S. government securities were $8,584,241,000 and $9,159,825,000, respectively.
G. On June 19, 2015, the fund acquired all of the net assets of Vanguard Fiduciary Trust Company Short-Term Bond Trust (the “trust”). The trust’s net assets transferred to the fund were $9,958,882,000, including $33,986,000 of unrealized appreciation. These net assets were exchanged on a tax-free basis for 722,013,000 shares of the fund. Immediately following the transfer on June 19, 2015, unitholders of the trust received those 722,013,000 shares of the fund in exchange for their 722,013,000 units of the trust, and the trust ceased operations.
| | |
| H. Capital shares issued and redeemed were: | | |
| | Year Ended | June 19, 20151 to |
| | September 30, 2016 | September 30, 2015 |
| | Shares | Shares |
| | (000) | (000) |
| Issued | 7,323 | 745,145 |
| Issued in Lieu of Cash Distributions | 10,301 | 2,549 |
| Redeemed | (10,767) | (3,039) |
| Net Increase (Decrease) in Shares Outstanding | 6,857 | 744,655 |
| 1 Commencement of operations as a registered investment company. | | |
I. Management has determined that no material events or transactions occurred subsequent to September 30, 2016, that would require recognition or disclosure in these financial statements.
38
Institutional Intermediate-Term Bond Fund
| | | |
| Fund Profile | | |
| As of September 30, 2016 | | |
| |
| Financial Attributes | | |
| | | Bloomberg Bloomberg |
| | | Barclays Barclays |
| | | U.S. | U.S. |
| | | Intermediate | Aggregate |
| | | Aggregate | Bond |
| | Fund | ex Baa Index | Index |
| Number of Bonds | 1,043 | 5,298 | 9,908 |
| Yield to Maturity | | | |
| (before expenses) | 1.5% | 1.6% | 2.0% |
| Average Coupon | 2.6% | 2.7% | 3.1% |
| Average Duration | 3.5 years | 3.5 years | 5.5 years |
| Average Effective | | | |
| Maturity | 4.1 years | 4.6 years | 7.7 years |
| Ticker Symbol | VIITX | — | — |
| Expense Ratio1 | 0.02% | — | — |
| 30-Day SEC Yield | 1.47% | — | — |
| Short-Term | | | |
| Reserves | 7.0% | — | — |
| |
| Volatility Measures | | |
| | Bloomberg | | |
| | Barclays U.S. | | Bloomberg |
| | Intermediate | Barclays U.S. |
| | Aggregate ex | Aggregate Bond |
| | Baa Index | | Index |
| R-Squared | | | 0.94 |
| Beta | | | 0.65 |
These measures show the degree and timing of the fund’s fluctuations compared with the indexes over 36 months.
| |
| Sector Diversification (% of portfolio) | |
| Asset-Backed | 11.0% |
| Commercial Mortgage-Backed | 2.4 |
| Finance | 12.0 |
| Foreign | 6.6 |
| Government Mortgage-Backed | 27.0 |
| Industrial | 8.3 |
| Treasury/Agency | 31.6 |
| Utilities | 1.1 |
The agency and mortgage-backed securities sectors may include issues from government-sponsored enterprises; such issues are generally not backed by the full faith and credit of the U.S. government.
Distribution by Credit Quality (% of portfolio)
| |
| U.S. Government | 51.3% |
| Aaa | 16.0 |
| Aa | 8.7 |
| A | 16.6 |
| Not Rated | 7.4 |
Credit-quality ratings are obtained from Moody’s and S&P, and the higher rating for each issue is shown. “Not Rated” is used to classify securities for which a rating is not available. Not rated securities include a fund’s investment in Vanguard Market Liquidity Fund or Vanguard Municipal Cash Management Fund, each of which invests in high-quality money market instruments and may serve as a cash management vehicle for the Vanguard funds, trusts, and accounts. For more information about these ratings, see the Glossary entry for Credit Quality.
| |
| Distribution by Effective Maturity | |
| (% of portfolio) | |
| Under 1 Year | 10.8% |
| 1 - 3 Years | 22.7 |
| 3 - 5 Years | 40.6 |
| 5 - 7 Years | 14.3 |
| 7 - 10 Years | 11.0 |
| 10 - 20 Years | 0.6 |
1 The expense ratio shown is from the prospectus dated January 27, 2016, and represents estimated costs for the current fiscal year. For the fiscal year ended September 30, 2016, the expense ratio was 0.02%.
39
Institutional Intermediate-Term Bond Fund
Performance Summary
All of the returns in this report represent past performance, which is not a guarantee of future results that may be achieved by the fund. (Current performance may be lower or higher than the performance data cited. For performance data current to the most recent month-end, visit our website at vanguard.com/performance.) Note, too, that both investment returns and principal value can fluctuate widely, so an investor’s shares, when sold, could be worth more or less than their original cost. The returns shown do not reflect taxes that a shareholder would pay on fund distributions or on the sale of fund shares.
Cumulative Performance: September 30, 2006, Through September 30, 2016
Initial Investment of $10,000,000

| | | | | |
| | | Average Annual Total Returns | |
| | | Periods Ended September 30, 2016 | |
| |
| | | | | | Final Value |
| | | One | Five | Ten | of a $10,000,000 |
| | | Year | Years | Years | Investment |
| | Institutional Intermediate-Term Bond | | | | |
| | Fund Institutional Plus Shares | 3.70% | 2.58% | 4.22% | $15,117,188 |
| | Bloomberg Barclays U.S. Intermediate | | | | |
| •••••••• | | | | | |
| | Aggregate ex Baa Index | 3.24 | 2.36 | 4.20 | 15,083,973 |
| | Bloomberg Barclays U.S. Aggregate | | | | |
| | Bond Index | 5.19 | 3.08 | 4.79 | 15,964,941 |
The fund is the successor to VFTC Intermediate-Term Bond Trust (the predecessor trust), a collective trust managed by Vanguard Fiduciary Trust Company, an affiliate of The Vanguard Group, Inc. The predecessor trust transferred its assets to the fund in connection with the fund’s commencement of operations on or about June 19, 2015. The performance of the fund’s Institutional Plus Shares includes the performance of the predecessor trust prior to the commencement of the fund’s operations. The performance of the predecessor trust has not been adjusted to reflect the expenses of the fund’s Institutional Plus Shares. If the performance of the predecessor trust had been adjusted to reflect the expenses of the fund’s Institutional Plus Shares, the predecessor trust’s performance would have been lower. The fund is managed with the same investment objective, strategies, policies, and risks as the predecessor trust. The predecessor trust was not an investment company and, therefore, was not subject to certain investment restrictions imposed on investment companies by the Investment Company Act of 1940. If the predecessor trust had been an investment company, its performance may have been different.
See Financial Highlights for dividend and capital gains information.
40
Institutional Intermediate-Term Bond Fund
| | | | |
| Fiscal-Year Total Returns (%): September 30, 2006, Through September 30, 2016 | |
| | | | | Bloomberg |
| | | | | Barclays |
| | | | | U.S. |
| | | | | Intermediate |
| | | | | Aggregate |
| | | Institutional Plus Shares | ex Baa Index |
| Fiscal Year | Income Returns | Capital Returns | Total Returns | Total Returns |
| 2007 | 0.00% | 5.32% | 5.32% | 5.37% |
| 2008 | 0.00 | 3.46 | 3.46 | 4.54 |
| 2009 | 0.00 | 9.36 | 9.36 | 9.18 |
| 2010 | 0.00 | 7.42 | 7.42 | 7.07 |
| 2011 | 0.00 | 3.96 | 3.96 | 4.24 |
| 2012 | 0.00 | 4.58 | 4.58 | 3.83 |
| 2013 | 0.00 | -0.76 | -0.76 | -0.81 |
| 2014 | 0.00 | 2.50 | 2.50 | 2.46 |
| 2015 | 0.56 | 2.43 | 2.99 | 3.16 |
| 2016 | 2.06 | 1.64 | 3.70 | 3.24 |
The fund is the successor to VFTC Intermediate-Term Bond Trust (the predecessor trust), a collective trust managed by Vanguard Fiduciary Trust Company, an affiliate of The Vanguard Group, Inc. The predecessor trust transferred its assets to the fund in connection with the fund’s commencement of operations on or about June 19, 2015. The performance of the fund’s Institutional Plus Shares includes the performance of the predecessor trust prior to the commencement of the fund’s operations. The performance of the predecessor trust has not been adjusted to reflect the expenses of the fund’s Institutional Plus Shares. If the performance of the predecessor trust had been adjusted to reflect the expenses of the fund’s Institutional Plus Shares, the predecessor trust’s performance would have been lower. The fund is managed with the same investment objective, strategies, policies, and risks as the predecessor trust. The predecessor trust was not an investment company and, therefore, was not subject to certain investment restrictions imposed on investment companies by the Investment Company Act of 1940. If the predecessor trust had been an investment company, its performance may have been different.
41
Institutional Intermediate-Term Bond Fund
Financial Statements
Statement of Net Assets
As of September 30, 2016
The fund reports a complete list of its holdings in regulatory filings four times in each fiscal year, at the quarter-ends. For the second and fourth fiscal quarters, the lists appear in the fund’s semiannual and annual reports to shareholders. For the first and third fiscal quarters, the fund files the lists with the Securities and Exchange Commission on Form N-Q. Shareholders can look up the fund’s Forms N-Q on the SEC’s website at sec.gov. Forms N-Q may also be reviewed and copied at the SEC’s Public Reference Room (see the back cover of this report for further information).
| | | | | |
| | | | | Face | Market |
| | | | Maturity | Amount | Value• |
| | | Coupon | Date | ($000) | ($000) |
| U.S. Government and Agency Obligations (57.9%) | | | | |
| U.S. Government Securities (27.9%) | | | | |
| | United States Treasury Inflation Indexed Bonds | 2.375% | 1/15/17 | 147,805 | 177,919 |
| 1 | United States Treasury Inflation Indexed Bonds | 0.125% | 4/15/17 | 276,738 | 293,987 |
| | United States Treasury Inflation Indexed Bonds | 2.625% | 7/15/17 | 97,984 | 117,254 |
| | United States Treasury Inflation Indexed Bonds | 0.125% | 4/15/21 | 77,680 | 80,574 |
| | United States Treasury Inflation Indexed Bonds | 0.625% | 1/15/26 | 120,977 | 129,032 |
| | United States Treasury Inflation Indexed Bonds | 0.125% | 7/15/26 | 3,104 | 3,155 |
| | United States Treasury Note/Bond | 2.250% | 11/30/17 | 650 | 661 |
| 2 | United States Treasury Note/Bond | 1.000% | 12/31/17 | 116,400 | 116,800 |
| | United States Treasury Note/Bond | 0.750% | 1/31/18 | 79,000 | 79,024 |
| | United States Treasury Note/Bond | 1.000% | 2/15/18 | 750 | 753 |
| | United States Treasury Note/Bond | 0.875% | 3/31/18 | 30,000 | 30,061 |
| | United States Treasury Note/Bond | 1.000% | 5/31/18 | 34,281 | 34,420 |
| | United States Treasury Note/Bond | 1.125% | 6/15/18 | 3,000 | 3,018 |
| | United States Treasury Note/Bond | 1.000% | 8/15/18 | 1,500 | 1,506 |
| | United States Treasury Note/Bond | 0.750% | 8/31/18 | 126,500 | 126,480 |
| | United States Treasury Note/Bond | 1.000% | 9/15/18 | 1,000 | 1,004 |
| | United States Treasury Note/Bond | 1.125% | 1/15/19 | 11,900 | 11,978 |
| | United States Treasury Note/Bond | 0.750% | 2/15/19 | 97,330 | 97,133 |
| | United States Treasury Note/Bond | 1.375% | 2/28/19 | 9,131 | 9,247 |
| | United States Treasury Note/Bond | 1.000% | 3/15/19 | 83,700 | 84,014 |
| | United States Treasury Note/Bond | 0.875% | 4/15/19 | 5,300 | 5,303 |
| | United States Treasury Note/Bond | 1.625% | 4/30/19 | 16,173 | 16,486 |
| | United States Treasury Note/Bond | 1.125% | 5/31/19 | 64,083 | 64,544 |
| | United States Treasury Note/Bond | 1.500% | 5/31/19 | 42,200 | 42,899 |
| | United States Treasury Note/Bond | 0.875% | 6/15/19 | 25,000 | 25,004 |
| | United States Treasury Note/Bond | 0.875% | 7/31/19 | 8,100 | 8,100 |
| | United States Treasury Note/Bond | 0.750% | 8/15/19 | 5,125 | 5,106 |
| | United States Treasury Note/Bond | 3.625% | 8/15/19 | 706 | 761 |
| | United States Treasury Note/Bond | 1.000% | 8/31/19 | 39,984 | 40,103 |
| | United States Treasury Note/Bond | 0.875% | 9/15/19 | 28,100 | 28,096 |
| | United States Treasury Note/Bond | 1.750% | 9/30/19 | 16,600 | 17,012 |
| | United States Treasury Note/Bond | 3.375% | 11/15/19 | 15,086 | 16,215 |
| | United States Treasury Note/Bond | 1.125% | 12/31/19 | 60,000 | 60,319 |
| | United States Treasury Note/Bond | 1.625% | 12/31/19 | 21,600 | 22,062 |
| | United States Treasury Note/Bond | 1.375% | 4/30/20 | 50 | 51 |
| | United States Treasury Note/Bond | 1.375% | 5/31/20 | 15,800 | 15,997 |
| | United States Treasury Note/Bond | 1.625% | 6/30/20 | 21,300 | 21,766 |
42
| | | | | |
| Institutional Intermediate-Term Bond Fund | | | | |
| |
| |
| |
| | | | | Face | Market |
| | | | Maturity | Amount | Value• |
| | | Coupon | Date | ($000) | ($000) |
| | United States Treasury Note/Bond | 2.625% | 8/15/20 | 20,000 | 21,181 |
| | United States Treasury Note/Bond | 2.125% | 8/31/20 | 35,000 | 36,411 |
| | United States Treasury Note/Bond | 1.375% | 9/30/20 | 51,400 | 52,011 |
| | United States Treasury Note/Bond | 1.375% | 10/31/20 | 19,350 | 19,577 |
| | United States Treasury Note/Bond | 1.750% | 10/31/20 | 41,300 | 42,384 |
| | United States Treasury Note/Bond | 1.625% | 11/30/20 | 17,218 | 17,592 |
| | United States Treasury Note/Bond | 2.000% | 11/30/20 | 4,300 | 4,457 |
| | United States Treasury Note/Bond | 1.750% | 12/31/20 | 134,350 | 137,940 |
| | United States Treasury Note/Bond | 2.125% | 1/31/21 | 3,594 | 3,745 |
| | United States Treasury Note/Bond | 1.125% | 2/28/21 | 2,340 | 2,341 |
| | United States Treasury Note/Bond | 1.375% | 4/30/21 | 68,100 | 68,823 |
| | United States Treasury Note/Bond | 1.125% | 6/30/21 | 142,827 | 142,671 |
| | United States Treasury Note/Bond | 1.125% | 8/31/21 | 37,000 | 36,965 |
| | United States Treasury Note/Bond | 1.500% | 1/31/22 | 10,000 | 10,133 |
| | United States Treasury Note/Bond | 1.750% | 5/15/22 | 10,333 | 10,595 |
| | United States Treasury Note/Bond | 2.125% | 6/30/22 | 36,100 | 37,758 |
| | United States Treasury Note/Bond | 1.750% | 9/30/22 | 51,500 | 52,772 |
| | United States Treasury Note/Bond | 1.625% | 11/15/22 | 15,050 | 15,304 |
| | United States Treasury Note/Bond | 2.000% | 2/15/23 | 20,000 | 20,781 |
| | United States Treasury Note/Bond | 1.750% | 5/15/23 | 41,300 | 42,242 |
| | United States Treasury Note/Bond | 1.375% | 6/30/23 | 10,800 | 10,785 |
| | United States Treasury Note/Bond | 2.500% | 8/15/23 | 19,860 | 21,284 |
| | United States Treasury Note/Bond | 2.750% | 2/15/24 | 4,820 | 5,261 |
| | United States Treasury Note/Bond | 2.375% | 8/15/24 | 43,550 | 46,422 |
| | United States Treasury Note/Bond | 2.250% | 11/15/25 | 36,000 | 38,025 |
| | United States Treasury Note/Bond | 1.625% | 2/15/26 | 3,950 | 3,960 |
| | United States Treasury Note/Bond | 1.625% | 5/15/26 | 30,941 | 31,003 |
| | United States Treasury Note/Bond | 1.500% | 8/15/26 | 20,000 | 19,822 |
| | United States Treasury Note/Bond | 5.375% | 2/15/31 | 3,300 | 4,819 |
| | | | | | 2,744,908 |
| Agency Bonds and Notes (3.2%) | | | | |
| 3 | AID-Jordan | 2.578% | 6/30/22 | 24,000 | 25,326 |
| 4 | Federal Home Loan Banks | 0.750% | 8/28/17 | 36,700 | 36,729 |
| 4 | Federal Home Loan Banks | 1.000% | 12/19/17 | 2,800 | 2,809 |
| 4 | Federal Home Loan Banks | 0.875% | 10/1/18 | 8,500 | 8,498 |
| 4 | Federal Home Loan Banks | 0.875% | 8/5/19 | 16,000 | 15,944 |
| 5,6 | Federal Home Loan Mortgage Corp. | 0.875% | 6/16/17 | 50,000 | 50,103 |
| 6 | Federal Home Loan Mortgage Corp. | 1.000% | 12/15/17 | 4,600 | 4,614 |
| 6 | Federal Home Loan Mortgage Corp. | 0.750% | 1/12/18 | 24,800 | 24,789 |
| 6 | Federal Home Loan Mortgage Corp. | 0.875% | 3/7/18 | 1,750 | 1,751 |
| 6 | Federal Home Loan Mortgage Corp. | 0.875% | 7/19/19 | 58,500 | 58,315 |
| 6 | Federal National Mortgage Assn. | 1.125% | 12/14/18 | 21,250 | 21,346 |
| 6 | Federal National Mortgage Assn. | 1.875% | 9/24/26 | 65,000 | 64,748 |
| | | | | | 314,972 |
| Conventional Mortgage-Backed Securities (25.0%) | | | | |
| 5,6,7 Fannie Mae Pool | 2.000% | 5/1/28–11/1/31 | 79,872 | 80,884 |
| 5,6,7 Fannie Mae Pool | 2.500% | 2/1/28–2/1/43 | 110,172 | 114,013 |
| 5,6 | Fannie Mae Pool | 3.000% | 5/1/27–10/1/46 | 168,676 | 176,853 |
| 5,6 | Fannie Mae Pool | 3.500% | 8/1/20–11/1/46 | 229,168 | 242,587 |
| 5,6 | Fannie Mae Pool | 4.000% | 7/1/18–7/1/46 | 241,518 | 260,509 |
| 5,6 | Fannie Mae Pool | 4.500% | 10/1/17–11/1/46 | 75,019 | 82,428 |
| 5,6 | Fannie Mae Pool | 5.000% | 12/1/16–11/1/44 | 53,872 | 60,028 |
| 5,6 | Fannie Mae Pool | 5.500% | 1/1/17–6/1/40 | 33,005 | 37,126 |
| 5,6 | Fannie Mae Pool | 6.000% | 12/1/16–11/1/39 | 18,046 | 20,692 |
43
| | | | | |
| Institutional Intermediate-Term Bond Fund | | | | |
| |
| |
| |
| | | | | Face | Market |
| | | | Maturity | Amount | Value• |
| | | Coupon | Date | ($000) | ($000) |
| 5,6 | Fannie Mae Pool | 6.500% | 2/1/17–8/1/39 | 10,362 | 11,881 |
| 5,6 | Fannie Mae Pool | 7.000% | 9/1/28–9/1/38 | 4,828 | 5,558 |
| 5,6 | Fannie Mae Pool | 7.500% | 8/1/30–6/1/32 | 417 | 464 |
| 5,6 | Fannie Mae Pool | 8.000% | 7/1/30–1/1/31 | 20 | 22 |
| 5,6 | Fannie Mae Pool | 8.500% | 12/1/30 | 10 | 12 |
| 5,6 | Freddie Mac Gold Pool | 2.000% | 9/1/28–6/1/30 | 6,523 | 6,622 |
| 5,6,7 Freddie Mac Gold Pool | 2.500% | 9/1/27–4/1/43 | 58,551 | 60,534 |
| 5,6 | Freddie Mac Gold Pool | 3.000% | 8/1/26–10/1/46 | 204,623 | 213,950 |
| 5,6,7 Freddie Mac Gold Pool | 3.500% | 8/1/20–11/1/46 | 225,352 | 238,427 |
| 5,6 | Freddie Mac Gold Pool | 4.000% | 5/1/18–1/1/46 | 27,311 | 29,210 |
| 5,6 | Freddie Mac Gold Pool | 4.500% | 10/1/18–12/1/45 | 34,910 | 38,183 |
| 5,6 | Freddie Mac Gold Pool | 5.000% | 12/1/17–4/1/41 | 16,111 | 17,656 |
| 5,6 | Freddie Mac Gold Pool | 5.500% | 9/1/17–11/1/46 | 12,943 | 14,715 |
| 5,6 | Freddie Mac Gold Pool | 6.000% | 7/1/20–5/1/40 | 26,691 | 30,719 |
| 5,6 | Freddie Mac Gold Pool | 6.500% | 10/1/16–9/1/38 | 5,827 | 6,649 |
| 5,6 | Freddie Mac Gold Pool | 7.000% | 5/1/28–6/1/38 | 2,991 | 3,444 |
| 5,6 | Freddie Mac Gold Pool | 7.500% | 3/1/30–5/1/32 | 303 | 354 |
| 5,6 | Freddie Mac Gold Pool | 8.000% | 4/1/30–1/1/31 | 28 | 33 |
| 5 | Ginnie Mae I Pool | 2.500% | 1/15/43–6/15/43 | 1,208 | 1,233 |
| 5 | Ginnie Mae I Pool | 3.000% | 9/15/42–8/15/45 | 19,383 | 20,357 |
| 5 | Ginnie Mae I Pool | 3.500% | 1/15/42–7/15/45 | 16,146 | 17,203 |
| 5 | Ginnie Mae I Pool | 4.000% | 4/15/39–1/15/45 | 3,238 | 3,483 |
| 5,7 | Ginnie Mae I Pool | 4.500% | 2/15/39–11/1/46 | 71,338 | 79,065 |
| 5 | Ginnie Mae I Pool | 5.000% | 2/15/33–10/1/46 | 18,569 | 21,092 |
| 5 | Ginnie Mae I Pool | 5.500% | 3/15/31–7/15/40 | 10,567 | 12,041 |
| 5 | Ginnie Mae I Pool | 6.000% | 12/15/28–3/15/40 | 4,919 | 5,644 |
| 5 | Ginnie Mae I Pool | 6.500% | 12/15/27–6/15/38 | 4,860 | 5,587 |
| 5 | Ginnie Mae I Pool | 7.000% | 8/15/24–11/15/31 | 281 | 302 |
| 5 | Ginnie Mae I Pool | 7.500% | 4/15/17–3/15/32 | 51 | 58 |
| 5 | Ginnie Mae I Pool | 8.000% | 4/15/30–10/15/30 | 57 | 65 |
| 5 | Ginnie Mae I Pool | 8.500% | 7/15/30 | 22 | 23 |
| 5 | Ginnie Mae I Pool | 9.000% | 1/15/20–7/15/21 | 4 | 4 |
| 5 | Ginnie Mae II Pool | 2.500% | 3/20/43–4/20/43 | 3,813 | 3,908 |
| 5,7 | Ginnie Mae II Pool | 3.000% | 6/20/43–11/1/46 | 133,639 | 140,500 |
| 5,7 | Ginnie Mae II Pool | 3.500% | 8/20/42–10/1/46 | 235,588 | 251,915 |
| 5 | Ginnie Mae II Pool | 4.000% | 2/20/34–8/20/46 | 92,099 | 100,559 |
| 5 | Ginnie Mae II Pool | 4.500% | 3/20/33–10/1/46 | 1,065 | 1,156 |
| 5 | Ginnie Mae II Pool | 5.000% | 5/20/39–10/1/46 | 17,967 | 19,925 |
| 5 | Ginnie Mae II Pool | 5.500% | 4/20/37–3/20/41 | 5,043 | 5,582 |
| 5 | Ginnie Mae II Pool | 6.000% | 5/20/36–10/20/41 | 7,632 | 8,695 |
| 5 | Ginnie Mae II Pool | 6.500% | 3/20/38–7/20/39 | 93 | 111 |
| | | | | | 2,452,061 |
| Nonconventional Mortgage-Backed Securities (1.8%) | | | | |
| 5,6,8 Fannie Mae Pool | 2.344% | 12/1/32 | 9 | 9 |
| 5,6,8 Fannie Mae Pool | 2.465% | 9/1/32 | 1 | 2 |
| 5,6,8 Fannie Mae Pool | 2.657% | 9/1/37 | 8,459 | 8,950 |
| 5,6,8 Fannie Mae Pool | 2.696% | 8/1/35 | 6,488 | 6,855 |
| 5,6,8 Fannie Mae Pool | 2.756% | 12/1/40 | 3,974 | 4,205 |
| 5,6,8 Fannie Mae Pool | 2.758% | 4/1/40 | 24,621 | 26,267 |
| 5,6,8 Fannie Mae Pool | 2.780% | 5/1/33 | 71 | 76 |
| 5,6,8 Fannie Mae Pool | 2.927% | 8/1/36 | 8,122 | 8,584 |
| 5,6,8 Fannie Mae Pool | 3.035% | 8/1/33 | 107 | 112 |
| 5,6,8 Fannie Mae Pool | 3.050% | 7/1/33 | 168 | 173 |
| 5,6,8 Fannie Mae Pool | 3.145% | 5/1/33 | 15 | 16 |
| 5,6,8 Fannie Mae REMICS | 0.775% | 9/25/46 | 13,600 | 13,542 |
44
| | | | | |
| Institutional Intermediate-Term Bond Fund | | | | |
| |
| |
| |
| | | | | Face | Market |
| | | | Maturity | Amount | Value• |
| | | Coupon | Date | ($000) | ($000) |
| 5,6,8 Fannie Mae REMICS | 0.825% | 9/25/41–4/25/45 | 7,341 | 7,301 |
| 5,6,8 Fannie Mae REMICS | 0.845% | 6/25/36 | 7,829 | 7,818 |
| 5,6,8 Fannie Mae REMICS | 0.875% | 5/25/43 | 3,951 | 3,935 |
| 5,6,8 Fannie Mae REMICS | 0.895% | 6/25/35 | 2,146 | 2,144 |
| 5,6,8 Fannie Mae REMICS | 0.925% | 11/25/42–9/25/46 | 15,752 | 15,795 |
| 5,6,8 Fannie Mae REMICS | 0.935% | 11/25/35 | 2,788 | 2,789 |
| 5,6,8 Fannie Mae REMICS | 0.970% | 2/25/37 | 1,622 | 1,622 |
| 5,6,8 Fannie Mae REMICS | 1.025% | 8/25/46 | 6,017 | 6,011 |
| 5,6,8 Freddie Mac Non Gold Pool | 2.663% | 11/1/35 | 11,665 | 12,406 |
| 5,6,8 Freddie Mac Non Gold Pool | 2.745% | 7/1/35–9/1/37 | 29,654 | 31,390 |
| 5,6,8 Freddie Mac Non Gold Pool | 2.823% | 10/1/32 | 24 | 26 |
| 5,6,8 Freddie Mac Non Gold Pool | 2.836% | 1/1/33 | 13 | 14 |
| 5,6,8 Freddie Mac Non Gold Pool | 2.890% | 7/1/33 | 1,987 | 2,100 |
| 5,6,8 Freddie Mac Non Gold Pool | 3.000% | 8/1/37 | 102 | 107 |
| 5,6,8 Freddie Mac Non Gold Pool | 3.086% | 2/1/33 | 40 | 42 |
| 5,6,8 Freddie Mac REMICS | 0.874% | 11/15/36–8/15/43 | 6,523 | 6,512 |
| 5,6,8 Freddie Mac REMICS | 0.884% | 11/15/36 | 2,154 | 2,151 |
| 5,6,8 Freddie Mac REMICS | 0.974% | 6/15/42 | 1,319 | 1,318 |
| | | | | | 172,272 |
| Total U.S. Government and Agency Obligations (Cost $5,630,381) | | 5,684,213 |
| Asset-Backed/Commercial Mortgage-Backed Securities (13.7%) | | |
| 5 | Ally Auto Receivables Trust 2014-SN2 | 1.210% | 2/20/19 | 5,000 | 5,002 |
| 5 | Ally Auto Receivables Trust 2015-1 | 1.750% | 5/15/20 | 1,600 | 1,609 |
| 5 | Ally Auto Receivables Trust 2015-2 | 1.840% | 6/15/20 | 2,920 | 2,947 |
| 5 | Ally Master Owner Trust Series 2012-5 | 1.540% | 9/15/19 | 2,360 | 2,369 |
| 5,8 | Ally Master Owner Trust Series 2014-1 | 0.994% | 1/15/19 | 2,781 | 2,783 |
| 5 | Ally Master Owner Trust Series 2014-5 | 1.600% | 10/15/19 | 8,920 | 8,960 |
| 5 | Ally Master Owner Trust Series 2015-3 | 1.630% | 5/15/20 | 19,270 | 19,383 |
| 5,8 | American Express Credit Account Master Trust | | | | |
| | 2014-1 | 0.894% | 12/15/21 | 12,202 | 12,243 |
| 5,8 | American Express Issuance Trust II 2013-2 | 0.954% | 8/15/19 | 3,317 | 3,327 |
| 5,9 | Americold 2010 LLC Trust Series 2010-ARTA | 4.954% | 1/14/29 | 4,682 | 5,157 |
| 9 | Australia & New Zealand Banking Group Ltd. | 2.400% | 11/23/16 | 5,077 | 5,090 |
| 5,9 | Aventura Mall Trust 2013-AVM | 3.743% | 12/5/32 | 400 | 430 |
| 5,8 | BA Credit Card Trust 2014-A1 | 0.904% | 6/15/21 | 15,428 | 15,481 |
| 5 | Banc of America Commercial Mortgage Trust | | | | |
| | 2015-UBS7 | 3.705% | 9/15/48 | 715 | 788 |
| 5,8,9 Bank of America Student Loan Trust 2010-1A | 1.514% | 2/25/43 | 5,409 | 5,341 |
| 9 | Bank of Montreal | 1.750% | 6/15/21 | 5,835 | 5,837 |
| | Bank of Nova Scotia | 1.850% | 4/14/20 | 4,365 | 4,410 |
| | Bank of Nova Scotia | 1.875% | 4/26/21 | 10,260 | 10,311 |
| 5 | Barclays Dryrock Issuance Trust 2014-3 | 2.410% | 7/15/22 | 9,200 | 9,474 |
| 5 | Bear Stearns Commercial Mortgage Securities | | | | |
| | Trust 2007-PWR16 | 5.910% | 6/11/40 | 9,222 | 9,345 |
| 5,8,9 BMW Floorplan Master Owner Trust 2015-1A | 1.024% | 7/15/20 | 8,115 | 8,124 |
| 5 | BMW Vehicle Lease Trust 2015-2 | 1.550% | 2/20/19 | 3,160 | 3,177 |
| 5,8 | Brazos Higher Education Authority Inc. Series | | | | |
| | 2005-3 | 1.057% | 6/25/26 | 3,410 | 3,297 |
| 5,8 | Brazos Higher Education Authority Inc. Series | | | | |
| | 2011-1 | 1.625% | 2/25/30 | 2,073 | 2,055 |
| 5 | Cabela’s Credit Card Master Note Trust 2015-1A | 2.260% | 3/15/23 | 1,430 | 1,449 |
| 5,8 | Cabela’s Credit Card Master Note Trust 2015-2 | 1.194% | 7/17/23 | 3,225 | 3,191 |
| 5,8 | Cabela’s Credit Card Master Note Trust 2016-1 | 1.374% | 6/15/22 | 3,440 | 3,442 |
| 9 | Canadian Imperial Bank of Commerce | 2.250% | 7/21/20 | 3,120 | 3,191 |
45
| | | | | |
| Institutional Intermediate-Term Bond Fund | | | | |
| |
| |
| |
| | | | | Face | Market |
| | | | Maturity | Amount | Value• |
| | | Coupon | Date | ($000) | ($000) |
| 5,8 | Capital One Multi-Asset Execution Trust 2014-A3 | 0.904% | 1/18/22 | 11,094 | 11,126 |
| 5 | Capital One Multi-Asset Execution Trust 2015-A2 | 2.080% | 3/15/23 | 6,480 | 6,629 |
| 5 | Capital One Multi-Asset Execution Trust 2015-A4 | 2.750% | 5/15/25 | 7,765 | 8,197 |
| 5 | Capital One Multi-Asset Execution Trust 2015-A8 | 2.050% | 8/15/23 | 11,390 | 11,596 |
| 5,8 | Capital One Multi-Asset Execution Trust 2016-A1 | 0.974% | 2/15/22 | 33,200 | 33,359 |
| 5,8 | Capital One Multi-Asset Execution Trust 2016-A2 | 1.154% | 2/15/24 | 2,900 | 2,916 |
| 5,8,9 CARDS II Trust 2016-1A | 1.224% | 7/15/21 | 9,200 | 9,212 |
| 5 | CarMax Auto Owner Trust 2014-4 | 1.810% | 7/15/20 | 2,100 | 2,121 |
| 5 | CarMax Auto Owner Trust 2015-1 | 1.830% | 7/15/20 | 1,860 | 1,881 |
| 5 | CarMax Auto Owner Trust 2015-2 | 1.800% | 3/15/21 | 1,690 | 1,708 |
| 5 | CarMax Auto Owner Trust 2015-3 | 1.980% | 2/16/21 | 1,265 | 1,285 |
| 5 | CarMax Auto Owner Trust 2016-1 | 1.880% | 6/15/21 | 3,080 | 3,125 |
| 5 | CenterPoint Energy Transition Bond Co. IV LLC | | | | |
| | 2012-1 | 2.161% | 10/15/21 | 5,853 | 5,969 |
| 5,9 | CFCRE Commercial Mortgage Trust 2011-C2 | 5.885% | 12/15/47 | 2,054 | 2,413 |
| 5 | CFCRE Commercial Mortgage Trust 2016-C4 | 3.283% | 5/10/58 | 3,220 | 3,403 |
| 5 | Chase Issuance Trust 2014-A2 | 2.770% | 3/15/23 | 2,333 | 2,459 |
| 5,8 | Chase Issuance Trust 2016-A1 | 0.934% | 5/17/21 | 30,978 | 31,083 |
| 5,9 | Chrysler Capital Auto Receivables Trust 2015-BA | 2.260% | 10/15/20 | 2,790 | 2,824 |
| 5,9 | Chrysler Capital Auto Receivables Trust 2016-AA | 1.960% | 1/18/22 | 5,360 | 5,373 |
| 5,9 | Cit Equipment Collateral 2013-VT1 | 1.130% | 7/20/20 | 47 | 47 |
| 5,8 | Citibank Credit Card Issuance Trust 2008-A7 | 1.907% | 5/20/20 | 3,898 | 3,973 |
| 5,8 | Citibank Credit Card Issuance Trust 2013-A2 | 0.805% | 5/26/20 | 14,014 | 14,034 |
| 5,8 | Citibank Credit Card Issuance Trust 2013-A7 | 0.948% | 9/10/20 | 6,379 | 6,409 |
| 5 | Citibank Credit Card Issuance Trust 2014-A1 | 2.880% | 1/23/23 | 4,486 | 4,751 |
| 5 | Citibank Credit Card Issuance Trust 2014-A6 | 2.150% | 7/15/21 | 11,400 | 11,656 |
| 5 | Citigroup Commercial Mortgage Trust 2012-GC8 | 3.024% | 9/10/45 | 1,280 | 1,348 |
| 5,9 | Citigroup Commercial Mortgage Trust 2012-GC8 | 3.683% | 9/10/45 | 400 | 429 |
| 5 | Citigroup Commercial Mortgage Trust 2013-GC11 | 3.093% | 4/10/46 | 1,309 | 1,379 |
| 5 | Citigroup Commercial Mortgage Trust 2013-GC15 | 3.942% | 9/10/46 | 333 | 359 |
| 5 | Citigroup Commercial Mortgage Trust 2014-GC19 | 3.753% | 3/10/47 | 160 | 174 |
| 5 | Citigroup Commercial Mortgage Trust 2014-GC19 | 4.023% | 3/10/47 | 4,850 | 5,387 |
| 5 | Citigroup Commercial Mortgage Trust 2014-GC21 | 3.477% | 5/10/47 | 65 | 70 |
| 5 | Citigroup Commercial Mortgage Trust 2014-GC21 | 3.575% | 5/10/47 | 1,290 | 1,401 |
| 5 | Citigroup Commercial Mortgage Trust 2014-GC21 | 3.855% | 5/10/47 | 3,658 | 4,007 |
| 5 | Citigroup Commercial Mortgage Trust 2014-GC23 | 3.622% | 7/10/47 | 1,380 | 1,504 |
| 5 | Citigroup Commercial Mortgage Trust 2014-GC23 | 3.863% | 7/10/47 | 240 | 258 |
| 5 | Citigroup Commercial Mortgage Trust 2014-GC25 | 3.372% | 10/10/47 | 480 | 513 |
| 5 | Citigroup Commercial Mortgage Trust 2014-GC25 | 3.635% | 10/10/47 | 3,810 | 4,119 |
| 5 | Citigroup Commercial Mortgage Trust 2015-GC33 | 3.778% | 9/10/58 | 2,670 | 2,921 |
| 5 | Citigroup Commercial Mortgage Trust 2016-C1 | 3.209% | 5/10/49 | 120 | 127 |
| 5 | CNH Equipment Trust 2014-A | 1.500% | 5/15/20 | 3,409 | 3,414 |
| 5 | CNH Equipment Trust 2016-B | 1.970% | 11/15/21 | 3,090 | 3,115 |
| 5 | COBALT CMBS Commercial Mortgage Trust | | | | |
| | 2007-C2 | 5.484% | 4/15/47 | 5,019 | 5,068 |
| 5 | COMM 2006-C8 Mortgage Trust | 5.292% | 12/10/46 | 199 | 199 |
| 5 | COMM 2012-CCRE2 Mortgage Trust | 3.147% | 8/15/45 | 595 | 634 |
| 5 | COMM 2012-CCRE2 Mortgage Trust | 3.791% | 8/15/45 | 893 | 961 |
| 5 | COMM 2012-CCRE3 Mortgage Trust | 2.822% | 10/15/45 | 1,531 | 1,599 |
| 5 | COMM 2012-CCRE4 Mortgage Trust | 2.853% | 10/15/45 | 1,221 | 1,278 |
| 5 | COMM 2012-CCRE4 Mortgage Trust | 3.251% | 10/15/45 | 30 | 31 |
| 5 | COMM 2012-CCRE5 Mortgage Trust | 2.771% | 12/10/45 | 518 | 540 |
| 5 | COMM 2013-CCRE11 Mortgage Trust | 3.983% | 10/10/46 | 1,835 | 2,042 |
| 5 | COMM 2013-CCRE11 Mortgage Trust | 4.258% | 10/10/46 | 842 | 949 |
| 5 | COMM 2013-CCRE12 Mortgage Trust | 3.623% | 10/10/46 | 655 | 697 |
46
| | | | | |
| Institutional Intermediate-Term Bond Fund | | | | |
| |
| |
| |
| | | | | Face | Market |
| | | | Maturity | Amount | Value• |
| | | Coupon | Date | ($000) | ($000) |
| 5 | COMM 2013-CCRE12 Mortgage Trust | 3.765% | 10/10/46 | 310 | 340 |
| 5 | COMM 2013-CCRE12 Mortgage Trust | 4.046% | 10/10/46 | 1,895 | 2,111 |
| 5 | COMM 2013-CCRE13 Mortgage Trust | 4.194% | 11/10/23 | 3,194 | 3,602 |
| 5 | COMM 2013-CCRE9 Mortgage Trust | 4.375% | 7/10/45 | 3,603 | 4,076 |
| 5,9 | COMM 2013-CCRE9 Mortgage Trust | 4.398% | 7/10/45 | 2,083 | 2,305 |
| 5,9 | COMM 2013-LC13 Mortgage Trust | 3.774% | 8/10/46 | 546 | 585 |
| 5 | COMM 2013-LC13 Mortgage Trust | 4.205% | 8/10/46 | 150 | 169 |
| 5 | COMM 2013-LC6 Mortgage Trust | 2.941% | 1/10/46 | 834 | 876 |
| 5,9 | COMM 2013-SFS Mortgage Trust | 3.086% | 4/12/35 | 500 | 519 |
| 5 | COMM 2014-CCRE14 Mortgage Trust | 3.743% | 2/10/47 | 470 | 502 |
| 5 | COMM 2014-CCRE14 Mortgage Trust | 4.236% | 2/10/47 | 593 | 670 |
| 5 | COMM 2014-CCRE17 Mortgage Trust | 3.977% | 5/10/47 | 1,182 | 1,312 |
| 5 | COMM 2014-CCRE17 Mortgage Trust | 4.174% | 5/10/47 | 295 | 325 |
| 5 | COMM 2014-CCRE18 Mortgage Trust | 3.452% | 7/15/47 | 100 | 105 |
| 5 | COMM 2014-CCRE18 Mortgage Trust | 3.828% | 7/15/47 | 3,325 | 3,659 |
| 5 | COMM 2014-CCRE20 Mortgage Trust | 3.326% | 11/10/47 | 650 | 693 |
| 5 | COMM 2014-CCRE20 Mortgage Trust | 3.590% | 11/10/47 | 3,390 | 3,676 |
| 5 | COMM 2014-CCRE21 Mortgage Trust | 3.528% | 12/10/47 | 2,470 | 2,675 |
| 5 | COMM 2014-LC17 Mortgage Trust | 3.917% | 10/10/47 | 1,375 | 1,527 |
| 5 | COMM 2015-CCRE22 Mortgage Trust | 3.309% | 3/10/48 | 460 | 490 |
| 5 | COMM 2015-CCRE24 Mortgage Trust | 3.445% | 8/10/48 | 310 | 331 |
| 5 | COMM 2015-CCRE24 Mortgage Trust | 3.696% | 8/10/48 | 2,450 | 2,688 |
| 5 | COMM 2015-CCRE25 Mortgage Trust | 3.759% | 8/10/48 | 850 | 934 |
| 5 | COMM 2015-CCRE27 Mortgage Trust | 3.612% | 10/10/48 | 4,260 | 4,649 |
| 5 | COMM 2015-LC19 Mortgage Trust | 3.040% | 2/10/48 | 25 | 26 |
| 5 | COMM 2015-LC19 Mortgage Trust | 3.183% | 2/10/48 | 170 | 180 |
| 9 | Commonwealth Bank of Australia | 2.000% | 6/18/19 | 2,602 | 2,633 |
| 9 | Commonwealth Bank of Australia | 2.125% | 7/22/20 | 2,720 | 2,762 |
| 5 | CSAIL 2015-C1 Commercial Mortgage Trust | 3.505% | 4/15/50 | 140 | 151 |
| 5 | CSAIL 2015-C4 Commercial Mortgage Trust | 3.808% | 11/15/48 | 145 | 159 |
| 5 | Discover Card Execution Note Trust 2012-A6 | 1.670% | 1/18/22 | 13,138 | 13,276 |
| 5,8 | Discover Card Execution Note Trust 2013-A1 | 0.824% | 8/17/20 | 3,294 | 3,299 |
| 5 | Discover Card Execution Note Trust 2014-A4 | 2.120% | 12/15/21 | 6,500 | 6,633 |
| 5 | Discover Card Execution Note Trust 2015-A4 | 2.190% | 4/17/23 | 9,500 | 9,750 |
| 5 | Discover Card Execution Note Trust 2016-A1 | 1.640% | 7/15/21 | 3,200 | 3,229 |
| 5,8 | Discover Card Execution Note Trust 2016-A2 | 1.064% | 9/15/21 | 3,670 | 3,698 |
| 9 | DNB Boligkreditt AS | 1.450% | 3/21/18 | 1,198 | 1,201 |
| 5,9 | Enterprise Fleet Financing LLC Series 2013-2 | 1.510% | 3/20/19 | 626 | 624 |
| 5,9 | Enterprise Fleet Financing LLC Series 2015-2 | 2.090% | 2/22/21 | 3,300 | 3,330 |
| 5,9 | Enterprise Fleet Financing LLC Series 2016-1 | 2.080% | 9/20/21 | 7,640 | 7,658 |
| 5,9 | Enterprise Fleet Financing LLC Series 2016-2 | 2.040% | 2/22/22 | 1,390 | 1,392 |
| 5,8,9 Evergreen Credit Card Trust 2016-1 | 1.244% | 4/15/20 | 36,000 | 36,106 |
| 5 | Fifth Third Auto 2013-1 | 1.300% | 2/18/20 | 6,665 | 6,670 |
| 5,8 | First National Master Note Trust 2013-2 | 1.054% | 10/15/19 | 4,108 | 4,108 |
| 5,8 | First National Master Note Trust 2015-1 | 1.294% | 9/15/20 | 2,790 | 2,797 |
| 5 | Ford Credit Auto Lease Trust 2015-A | 1.310% | 8/15/18 | 1,450 | 1,453 |
| 5 | Ford Credit Auto Lease Trust 2015-B | 1.540% | 2/15/19 | 2,285 | 2,297 |
| 5 | Ford Credit Auto Lease Trust 2016-A | 1.850% | 7/15/19 | 5,790 | 5,852 |
| 5,9 | Ford Credit Auto Owner Trust 2014-REV1 | 2.260% | 11/15/25 | 4,089 | 4,171 |
| 5 | Ford Credit Auto Owner Trust 2015-C | 1.740% | 2/15/21 | 4,455 | 4,508 |
| 5,9 | Ford Credit Auto Owner Trust 2015-REV2 | 2.440% | 1/15/27 | 9,700 | 9,970 |
| 5 | Ford Credit Auto Owner Trust 2016-B | 1.520% | 8/15/21 | 4,510 | 4,534 |
| 5,9 | Ford Credit Auto Owner Trust 2016-REV1 | 2.310% | 8/15/27 | 11,910 | 12,199 |
| 5,9 | Ford Credit Auto Owner Trust 2016-REV2 | 2.030% | 12/15/27 | 12,230 | 12,356 |
47
| | | | | |
| Institutional Intermediate-Term Bond Fund | | | | |
| |
| |
| |
| | | | | Face | Market |
| | | | Maturity | Amount | Value• |
| | | Coupon | Date | ($000) | ($000) |
| 5,8 | Ford Credit Floorplan Master Owner Trust A Series | | | | |
| | 2014-2 | 1.024% | 2/15/21 | 6,191 | 6,206 |
| 5,8 | Ford Credit Floorplan Master Owner Trust A Series | | | | |
| | 2015-2 | 1.094% | 1/15/22 | 7,310 | 7,346 |
| 5 | Ford Credit Floorplan Master Owner Trust A Series | | | | |
| | 2015-2 | 1.980% | 1/15/22 | 8,705 | 8,832 |
| 5 | Ford Credit Floorplan Master Owner Trust A Series | | | | |
| | 2015-5 | 2.390% | 8/15/22 | 9,340 | 9,565 |
| 5,8 | Ford Credit Floorplan Master Owner Trust A Series | | | | |
| | 2016-1 | 1.424% | 2/15/21 | 11,720 | 11,846 |
| 5 | Ford Credit Floorplan Master Owner Trust A Series | | | | |
| | 2016-1 | 1.760% | 2/15/21 | 13,270 | 13,379 |
| 5,8 | Ford Credit Floorplan Master Owner Trust A Series | | | | |
| | 2016-3 | 1.144% | 7/15/21 | 4,500 | 4,502 |
| 5,8 | Ford Credit Floorplan Master Owner Trust A Series | | | | |
| | 2016-4 | 1.054% | 7/15/20 | 3,480 | 3,491 |
| 5 | GE Capital Credit Card Master Note Trust Series | | | | |
| | 2012-2 | 2.220% | 1/15/22 | 2,986 | 3,030 |
| 5,8 | GE Capital Credit Card Master Note Trust Series | | | | |
| | 2012-3 | 0.974% | 3/15/20 | 23,000 | 23,026 |
| 5 | GE Capital Credit Card Master Note Trust Series | | | | |
| | 2012-6 | 1.360% | 8/17/20 | 6,931 | 6,948 |
| 5,8 | GE Dealer Floorplan Master Note Trust Series | | | | |
| | 2012-2 | 1.282% | 4/22/19 | 6,570 | 6,587 |
| 5,8 | GE Dealer Floorplan Master Note Trust Series | | | | |
| | 2014-1 | 0.912% | 7/20/19 | 9,800 | 9,799 |
| 5,8 | GE Dealer Floorplan Master Note Trust Series | | | | |
| | 2014-2 | 0.982% | 10/20/19 | 2,600 | 2,601 |
| 5,8 | GE Dealer Floorplan Master Note Trust Series | | | | |
| | 2015-2 | 1.182% | 1/20/22 | 12,080 | 12,074 |
| 5 | GM Financial Automobile Leasing Trust 2015-1 | 1.730% | 6/20/19 | 950 | 954 |
| 5 | GM Financial Automobile Leasing Trust 2015-3 | 1.690% | 3/20/19 | 3,880 | 3,897 |
| 5 | GM Financial Automobile Leasing Trust 2015-3 | 1.810% | 11/20/19 | 400 | 403 |
| 5 | GM Financial Automobile Leasing Trust 2016-1 | 1.790% | 3/20/20 | 7,100 | 7,122 |
| 5 | GM Financial Automobile Leasing Trust 2016-2 | 1.620% | 9/20/19 | 21,390 | 21,503 |
| 5 | GM Financial Automobile Leasing Trust 2016-2 | 1.760% | 3/20/20 | 5,010 | 5,046 |
| 5 | GM Financial Automobile Leasing Trust 2016-3 | 1.610% | 12/20/19 | 2,530 | 2,543 |
| 5 | GM Financial Automobile Leasing Trust 2016-3 | 1.780% | 5/20/20 | 2,250 | 2,252 |
| 5,8,9 GMF Floorplan Owner Revolving Trust 2016-1 | 1.374% | 5/17/21 | 10,260 | 10,282 |
| 5,9 | Golden Credit Card Trust 2012-2A | 1.770% | 1/15/19 | 6,021 | 6,033 |
| 5,8,9 Golden Credit Card Trust 2014-2A | 0.974% | 3/15/21 | 2,921 | 2,916 |
| 5,9 | Golden Credit Card Trust 2016-5A | 1.600% | 9/15/21 | 20,130 | 20,189 |
| 5,9 | GreatAmerica Leasing Receivables Funding LLC | | | | |
| | Series 2013-1 | 1.160% | 5/15/18 | 523 | 523 |
| 5,9 | GreatAmerica Leasing Receivables Funding LLC | | | | |
| | Series 2014-1 | 1.470% | 8/15/20 | 1,077 | 1,077 |
| 5,9 | GreatAmerica Leasing Receivables Funding LLC | | | | |
| | Series 2016-1 | 1.990% | 4/20/22 | 3,770 | 3,792 |
| 5,9 | GS Mortgage Securities Trust 2012-GC6 | 4.948% | 1/10/45 | 233 | 262 |
| 5 | GS Mortgage Securities Trust 2013-GCJ12 | 3.135% | 6/10/46 | 899 | 945 |
| 5 | GS Mortgage Securities Trust 2014-GC20 | 3.998% | 4/10/47 | 4,835 | 5,346 |
| 5 | GS Mortgage Securities Trust 2014-GC26 | 3.629% | 11/10/47 | 280 | 305 |
| 5 | Harley-Davidson Motorcycle Trust 2014-1 | 1.550% | 10/15/21 | 2,692 | 2,706 |
| 5,9 | Hertz Vehicle Financing LLC 2015-3A | 2.670% | 9/25/21 | 5,580 | 5,627 |
| 5,9 | Hertz Vehicle Financing LLC 2016-2A | 2.950% | 3/25/22 | 5,510 | 5,623 |
48
| | | | | |
| Institutional Intermediate-Term Bond Fund | | | | |
| |
| |
| |
| | | | | Face | Market |
| | | | Maturity | Amount | Value• |
| | | Coupon | Date | ($000) | ($000) |
| 5,9 | Hertz Vehicle Financing LLC 2016-3 | 2.270% | 7/25/20 | 7,110 | 7,121 |
| 5,9 | Hertz Vehicle Financing LLC 2016-4 | 2.650% | 7/25/22 | 7,340 | 7,424 |
| 5,9 | Hilton USA Trust 2013-HLT | 2.662% | 11/5/30 | 699 | 699 |
| 5 | Honda Auto Receivables 2015-4 Owner Trust | 1.440% | 1/21/22 | 6,140 | 6,162 |
| 5,9 | Hyundai Auto Lease Securitization Trust 2014-A | 1.010% | 9/15/17 | 53 | 53 |
| 5,9 | Hyundai Auto Lease Securitization Trust 2016-A | 1.800% | 12/16/19 | 2,590 | 2,613 |
| 5,9 | Hyundai Auto Lease Securitization Trust 2016-B | 1.680% | 4/15/20 | 4,110 | 4,147 |
| 5,9 | Hyundai Auto Lease Securitization Trust 2016-C | 1.490% | 2/18/20 | 4,450 | 4,452 |
| 5,9 | Hyundai Auto Lease Securitization Trust 2016-C | 1.650% | 7/15/20 | 1,960 | 1,961 |
| 5 | Hyundai Auto Receivables Trust 2015-C | 1.780% | 11/15/21 | 2,910 | 2,927 |
| 5,9 | Hyundai Floorplan Master Owner Trust Series | | | | |
| | 2016-1A | 1.810% | 3/15/21 | 2,090 | 2,104 |
| 8 | Illinois Student Assistance Commission Series | | | | |
| | 2010-1 | 1.765% | 4/25/22 | 1,416 | 1,417 |
| 5,9 | Irvine Core Office Trust 2013-IRV | 3.279% | 5/15/48 | 1,906 | 2,019 |
| 5 | John Deere Owner Trust 2015-B | 1.780% | 6/15/22 | 480 | 485 |
| 5 | John Deere Owner Trust 2016-B | 1.490% | 5/15/23 | 880 | 879 |
| 5 | JP Morgan Chase Commercial Mortgage | | | | |
| | Securities Trust 2007-LDP10 | 5.439% | 1/15/49 | 2,612 | 2,636 |
| 5,9 | JP Morgan Chase Commercial Mortgage | | | | |
| | Securities Trust 2011-C3 | 4.717% | 2/15/46 | 2,819 | 3,113 |
| 5,9 | JP Morgan Chase Commercial Mortgage | | | | |
| | Securities Trust 2011-C5 | 5.562% | 8/15/46 | 833 | 947 |
| 5,9 | JP Morgan Chase Commercial Mortgage | | | | |
| | Securities Trust 2011-RR1 | 4.717% | 3/16/46 | 8,782 | 9,525 |
| 5 | JP Morgan Chase Commercial Mortgage | | | | |
| | Securities Trust 2012-C6 | 3.507% | 5/15/45 | 425 | 457 |
| 5 | JP Morgan Chase Commercial Mortgage | | | | |
| | Securities Trust 2012-C8 | 2.829% | 10/15/45 | 944 | 981 |
| 5,9 | JP Morgan Chase Commercial Mortgage | | | | |
| | Securities Trust 2012-C8 | 3.424% | 10/15/45 | 1,373 | 1,443 |
| 5,9 | JP Morgan Chase Commercial Mortgage | | | | |
| | Securities Trust 2012-HSBC | 3.093% | 7/5/32 | 1,548 | 1,631 |
| 5 | JP Morgan Chase Commercial Mortgage | | | | |
| | Securities Trust 2013-C13 | 3.994% | 1/15/46 | 2,453 | 2,716 |
| 5 | JP Morgan Chase Commercial Mortgage | | | | |
| | Securities Trust 2013-C16 | 3.674% | 12/15/46 | 452 | 488 |
| 5 | JP Morgan Chase Commercial Mortgage | | | | |
| | Securities Trust 2013-C16 | 3.881% | 12/15/46 | 100 | 111 |
| 5 | JP Morgan Chase Commercial Mortgage | | | | |
| | Securities Trust 2013-C16 | 4.166% | 12/15/46 | 1,120 | 1,256 |
| 5 | JP Morgan Chase Commercial Mortgage | | | | |
| | Securities Trust 2013-LC11 | 2.960% | 4/15/46 | 1,676 | 1,752 |
| 5 | JPMBB Commercial Mortgage Securities Trust | | | | |
| | 2013-C12 | 3.363% | 7/15/45 | 1,310 | 1,401 |
| 5 | JPMBB Commercial Mortgage Securities Trust | | | | |
| | 2013-C12 | 3.664% | 7/15/45 | 2,680 | 2,918 |
| 5 | JPMBB Commercial Mortgage Securities Trust | | | | |
| | 2013-C12 | 4.160% | 7/15/45 | 1,309 | 1,432 |
| 5 | JPMBB Commercial Mortgage Securities Trust | | | | |
| | 2013-C14 | 3.761% | 8/15/46 | 358 | 387 |
| 5 | JPMBB Commercial Mortgage Securities Trust | | | | |
| | 2013-C14 | 4.133% | 8/15/46 | 450 | 503 |
| 5 | JPMBB Commercial Mortgage Securities Trust | | | | |
| | 2013-C15 | 3.659% | 11/15/45 | 179 | 193 |
49
| | | | | |
| Institutional Intermediate-Term Bond Fund | | | | |
| |
| |
| |
| | | | | Face | Market |
| | | | Maturity | Amount | Value• |
| | | Coupon | Date | ($000) | ($000) |
| 5 | JPMBB Commercial Mortgage Securities Trust | | | | |
| | 2013-C17 | 4.199% | 1/15/47 | 3,606 | 4,058 |
| 5 | JPMBB Commercial Mortgage Securities Trust | | | | |
| | 2014-C18 | 4.079% | 2/15/47 | 2,232 | 2,492 |
| 5 | JPMBB Commercial Mortgage Securities Trust | | | | |
| | 2014-C18 | 4.439% | 2/15/47 | 402 | 448 |
| 5 | JPMBB Commercial Mortgage Securities Trust | | | | |
| | 2014-C21 | 3.428% | 8/15/47 | 580 | 620 |
| 5 | JPMBB Commercial Mortgage Securities Trust | | | | |
| | 2014-C21 | 3.493% | 8/15/47 | 170 | 184 |
| 5 | JPMBB Commercial Mortgage Securities Trust | | | | |
| | 2014-C24 | 3.639% | 11/15/47 | 970 | 1,054 |
| 5 | JPMBB Commercial Mortgage Securities Trust | | | | |
| | 2015-C32 | 3.598% | 11/15/48 | 4,280 | 4,638 |
| 5 | JPMBB Commercial Mortgage Securities Trust | | | | |
| | 2015-C33 | 3.562% | 12/15/48 | 155 | 168 |
| 5 | LB-UBS Commercial Mortgage Trust 2008-C1 | 6.287% | 4/15/41 | 6,883 | 7,190 |
| 5,8,9 Master Credit Card Trust II Series 2016-1A | 1.286% | 9/23/19 | 10,790 | 10,823 |
| 5,8 | MBNA Credit Card Master Note Trust 2004-A3 | 0.784% | 8/16/21 | 15,215 | 15,222 |
| 5 | Mercedes-Benz Auto Lease Trust 2015-B | 1.530% | 5/17/21 | 2,670 | 2,684 |
| 5 | Mercedes-Benz Auto Lease Trust 2016-A | 1.690% | 11/15/21 | 5,400 | 5,432 |
| 5,8,9 Mercedes-Benz Master Owner Trust 2016-B | 1.224% | 5/17/21 | 12,000 | 12,066 |
| 5 | ML-CFC Commercial Mortgage Trust 2007-6 | 5.331% | 3/12/51 | 230 | 230 |
| 5,9 | MMAF Equipment Finance LLC 2011-AA | 3.040% | 8/15/28 | 5,697 | 5,746 |
| 5,9 | MMAF Equipment Finance LLC 2012-AA | 1.980% | 6/10/32 | 599 | 603 |
| 5,9 | MMAF Equipment Finance LLC 2013-AA | 1.680% | 5/11/20 | 1,732 | 1,739 |
| 5,9 | MMAF Equipment Finance LLC 2013-AA | 2.570% | 6/9/33 | 895 | 917 |
| 5,9 | MMAF Equipment Finance LLC 2016-AA | 2.210% | 12/15/32 | 5,240 | 5,260 |
| 5 | Morgan Stanley Bank of America Merrill Lynch | | | | |
| | Trust 2012-C5 | 3.176% | 8/15/45 | 2,328 | 2,469 |
| 5 | Morgan Stanley Bank of America Merrill Lynch | | | | |
| | Trust 2012-C5 | 3.792% | 8/15/45 | 896 | 966 |
| 5 | Morgan Stanley Bank of America Merrill Lynch | | | | |
| | Trust 2012-C6 | 2.858% | 11/15/45 | 1,132 | 1,183 |
| 5 | Morgan Stanley Bank of America Merrill Lynch | | | | |
| | Trust 2013-C10 | 4.219% | 7/15/46 | 4,581 | 5,121 |
| 5 | Morgan Stanley Bank of America Merrill Lynch | | | | |
| | Trust 2013-C11 | 3.960% | 8/15/46 | 1,160 | 1,285 |
| 5 | Morgan Stanley Bank of America Merrill Lynch | | | | |
| | Trust 2013-C11 | 4.360% | 8/15/46 | 350 | 394 |
| 5 | Morgan Stanley Bank of America Merrill Lynch | | | | |
| | Trust 2013-C12 | 3.824% | 10/15/46 | 375 | 406 |
| 5 | Morgan Stanley Bank of America Merrill Lynch | | | | |
| | Trust 2013-C12 | 4.259% | 10/15/46 | 130 | 146 |
| 5 | Morgan Stanley Bank of America Merrill Lynch | | | | |
| | Trust 2013-C13 | 4.039% | 11/15/46 | 75 | 84 |
| 5 | Morgan Stanley Bank of America Merrill Lynch | | | | |
| | Trust 2014-C14 | 4.064% | 2/15/47 | 358 | 400 |
| 5 | Morgan Stanley Bank of America Merrill Lynch | | | | |
| | Trust 2014-C14 | 4.384% | 2/15/47 | 179 | 199 |
| 5 | Morgan Stanley Bank of America Merrill Lynch | | | | |
| | Trust 2014-C15 | 3.773% | 4/15/47 | 1,960 | 2,148 |
| 5 | Morgan Stanley Bank of America Merrill Lynch | | | | |
| | Trust 2014-C15 | 4.051% | 4/15/47 | 4,350 | 4,841 |
50
| | | | | |
| Institutional Intermediate-Term Bond Fund | | | | |
| |
| |
| |
| | | | | Face | Market |
| | | | Maturity | Amount | Value• |
| | | Coupon | Date | ($000) | ($000) |
| 5 | Morgan Stanley Bank of America Merrill Lynch | | | | |
| | Trust 2014-C16 | 3.892% | 6/15/47 | 2,464 | 2,726 |
| 5 | Morgan Stanley Bank of America Merrill Lynch | | | | |
| | Trust 2014-C16 | 4.094% | 6/15/47 | 295 | 323 |
| 5 | Morgan Stanley Bank of America Merrill Lynch | | | | |
| | Trust 2015-C22 | 3.306% | 4/15/48 | 1,090 | 1,157 |
| 5 | Morgan Stanley Bank of America Merrill Lynch | | | | |
| | Trust 2015-C25 | 3.383% | 10/15/48 | 2,640 | 2,820 |
| 5 | Morgan Stanley Bank of America Merrill Lynch | | | | |
| | Trust 2015-C25 | 3.635% | 10/15/48 | 4,345 | 4,746 |
| 5 | Morgan Stanley Capital I Trust 2006-IQ12 | 5.319% | 12/15/43 | 1,027 | 1,027 |
| 5,9 | Morgan Stanley Capital I Trust 2012-STAR | 3.201% | 8/5/34 | 1,982 | 2,075 |
| 5 | Morgan Stanley Capital I Trust 2016-UBS9 | 3.594% | 3/15/49 | 1,760 | 1,926 |
| 9 | National Australia Bank Ltd. | 2.250% | 3/16/21 | 13,870 | 14,165 |
| 5,8 | Navient Student Loan Trust 2014-8 | 0.965% | 4/25/23 | 8,100 | 8,087 |
| 5,8 | Navient Student Loan Trust 2015-3 | 1.175% | 6/26/56 | 4,800 | 4,657 |
| 5,8,9 Navient Student Loan Trust 2016-2 | 1.575% | 6/25/65 | 1,450 | 1,455 |
| 5,8,9 Navient Student Loan Trust 2016-3 | 1.375% | 6/25/65 | 1,880 | 1,871 |
| 5,9 | NextGear Floorplan Master Owner Trust 2016-1A | 2.740% | 4/15/21 | 2,950 | 2,953 |
| 5 | Nissan Auto Lease Trust 2015-A | 1.580% | 5/17/21 | 875 | 880 |
| 5 | Nissan Auto Lease Trust 2016-A | 1.650% | 10/15/21 | 14,700 | 14,756 |
| 5 | Nissan Auto Lease Trust 2016-B | 1.500% | 7/15/19 | 10,060 | 10,069 |
| 5 | Nissan Auto Lease Trust 2016-B | 1.610% | 1/18/22 | 1,810 | 1,812 |
| 5 | Nissan Auto Receivables 2015-A Owner Trust | 1.500% | 9/15/21 | 6,990 | 7,043 |
| 5 | Nissan Auto Receivables 2015-B Owner Trust | 1.790% | 1/17/22 | 775 | 787 |
| 5 | Nissan Auto Receivables 2015-C Owner Trust | 1.670% | 2/15/22 | 15,000 | 15,121 |
| 5 | Nissan Auto Receivables 2016-A Owner Trust | 1.590% | 7/15/22 | 9,120 | 9,168 |
| 5 | Nissan Auto Receivables 2016-B Owner Trust | 1.540% | 10/17/22 | 2,910 | 2,929 |
| 5 | Nissan Master Owner Trust Receivables Series | | | | |
| | 2015-A | 1.440% | 1/15/20 | 7,500 | 7,519 |
| 5,8 | Nissan Master Owner Trust Receivables Series | | | | |
| | 2016-A | 1.164% | 6/15/21 | 13,480 | 13,507 |
| 9 | Norddeutsche Landesbank Girozentrale | 2.000% | 2/5/19 | 3,200 | 3,220 |
| 8 | North Carolina State Education Assistance | | | | |
| | Authority 2011-1 | 1.614% | 1/26/26 | 859 | 858 |
| 5,9 | Palisades Center Trust 2016-PLSD | 2.713% | 4/13/33 | 840 | 857 |
| | Royal Bank of Canada | 2.200% | 9/23/19 | 3,072 | 3,136 |
| | Royal Bank of Canada | 2.100% | 10/14/20 | 4,360 | 4,438 |
| 5 | Royal Bank of Canada | 1.875% | 2/5/21 | 4,800 | 4,853 |
| | Royal Bank of Canada | 2.300% | 3/22/21 | 2,903 | 2,979 |
| 5,8 | SLM Student Loan Trust 2005-5 | 0.815% | 4/25/25 | 8,005 | 7,948 |
| 5,8 | SLM Student Loan Trust 2014-1 | 0.905% | 7/26/21 | 3,624 | 3,618 |
| 5 | SMART ABS Series 2013-1US Trust | 1.050% | 10/14/18 | 718 | 716 |
| 5 | SMART ABS Series 2014-1US Trust | 1.680% | 12/14/19 | 269 | 269 |
| 9 | SpareBank 1 Boligkreditt AS | 1.250% | 5/2/18 | 998 | 996 |
| 5,9 | SpareBank 1 Boligkreditt AS | 1.750% | 11/15/20 | 5,077 | 5,098 |
| 9 | Swedbank Hypotek AB | 1.375% | 3/28/18 | 1,131 | 1,132 |
| 5 | Synchrony Credit Card Master Note Trust 2015-1 | 2.370% | 3/15/23 | 2,955 | 3,036 |
| 5 | Synchrony Credit Card Master Note Trust 2015-2 | 1.600% | 4/15/21 | 3,500 | 3,518 |
| 5 | Synchrony Credit Card Master Note Trust 2015-4 | 2.380% | 9/15/23 | 6,363 | 6,508 |
| 5 | Synchrony Credit Card Master Note Trust 2016-2 | 2.210% | 5/15/24 | 5,840 | 5,957 |
| 5 | Synchrony Credit Card Master Note Trust 2016-3 | 1.580% | 9/15/22 | 16,370 | 16,397 |
| 5 | Toyota Auto Receivables 2016-B Owner Trust | 1.520% | 8/16/21 | 2,470 | 2,473 |
| 5,8,9 Trillium Credit Card Trust II 2016-1A | 1.242% | 5/26/21 | 23,940 | 23,992 |
| 5 | UBS Commercial Mortgage Trust 2012-C1 | 4.171% | 5/10/45 | 244 | 267 |
51
| | | | | |
| Institutional Intermediate-Term Bond Fund | | | | |
| |
| |
| |
| | | | | Face | Market |
| | | | Maturity | Amount | Value• |
| | | Coupon | Date | ($000) | ($000) |
| 5,9 | UBS-BAMLL Trust 2012-WRM | 3.663% | 6/10/30 | 3,870 | 4,129 |
| 5 | UBS-Barclays Commercial Mortgage Trust | | | | |
| | 2012-C4 | 2.850% | 12/10/45 | 1,340 | 1,401 |
| 5,9 | VNDO 2012-6AVE Mortgage Trust | 2.996% | 11/15/30 | 2,470 | 2,588 |
| 5,9 | Volkswagen Credit Auto Master Owner Trust | | | | |
| | 2014-1A | 1.400% | 7/22/19 | 1,300 | 1,299 |
| 5,9 | Volvo Financial Equipment LLC Series 2016-1A | 1.890% | 9/15/20 | 1,280 | 1,292 |
| 5 | Wachovia Bank Commercial Mortgage Trust | | | | |
| | Series 2006-C29 | 5.297% | 11/15/48 | 2,043 | 2,046 |
| 5 | Wells Fargo Commercial Mortgage Trust | | | | |
| | 2012-LC5 | 2.918% | 10/15/45 | 863 | 905 |
| 5 | Wells Fargo Commercial Mortgage Trust | | | | |
| | 2012-LC5 | 3.539% | 10/15/45 | 517 | 552 |
| 5 | Wells Fargo Commercial Mortgage Trust | | | | |
| | 2013-LC12 | 3.928% | 7/15/46 | 416 | 452 |
| 5 | Wells Fargo Commercial Mortgage Trust | | | | |
| | 2013-LC12 | 4.218% | 7/15/46 | 290 | 325 |
| 5 | Wells Fargo Commercial Mortgage Trust | | | | |
| | 2015-C26 | 2.991% | 2/15/48 | 90 | 94 |
| 5 | Wells Fargo Commercial Mortgage Trust | | | | |
| | 2015-C26 | 3.166% | 2/15/48 | 215 | 226 |
| 5 | Wells Fargo Commercial Mortgage Trust | | | | |
| | 2015-C29 | 3.400% | 6/15/48 | 550 | 586 |
| 5 | Wells Fargo Commercial Mortgage Trust | | | | |
| | 2015-C30 | 3.664% | 9/15/58 | 1,870 | 2,034 |
| 5 | Wells Fargo Commercial Mortgage Trust | | | | |
| | 2015-LC22 | 3.839% | 9/15/58 | 3,340 | 3,697 |
| 5 | Wells Fargo Commercial Mortgage Trust | | | | |
| | 2015-SG1 | 3.556% | 12/15/47 | 240 | 257 |
| 5 | Wells Fargo Commercial Mortgage Trust | | | | |
| | 2015-SG1 | 3.789% | 12/15/47 | 720 | 791 |
| 9 | Westpac Banking Corp. | 2.450% | 11/28/16 | 4,837 | 4,849 |
| 9 | Westpac Banking Corp. | 1.850% | 11/26/18 | 1,028 | 1,038 |
| 9 | Westpac Banking Corp. | 2.000% | 3/3/20 | 3,280 | 3,325 |
| 9 | Westpac Banking Corp. | 2.250% | 11/9/20 | 3,460 | 3,533 |
| 5,9 | WFRBS Commercial Mortgage Trust 2011-C3 | 4.375% | 3/15/44 | 1,221 | 1,342 |
| 5 | WFRBS Commercial Mortgage Trust 2012-C7 | 3.431% | 6/15/45 | 1,072 | 1,151 |
| 5 | WFRBS Commercial Mortgage Trust 2012-C7 | 4.090% | 6/15/45 | 610 | 667 |
| 5 | WFRBS Commercial Mortgage Trust 2012-C8 | 3.001% | 8/15/45 | 208 | 219 |
| 5 | WFRBS Commercial Mortgage Trust 2012-C9 | 2.870% | 11/15/45 | 2,428 | 2,540 |
| 5 | WFRBS Commercial Mortgage Trust 2012-C9 | 3.388% | 11/15/45 | 566 | 599 |
| 5 | WFRBS Commercial Mortgage Trust 2013-C15 | 3.720% | 8/15/46 | 476 | 513 |
| 5 | WFRBS Commercial Mortgage Trust 2013-C15 | 4.153% | 8/15/46 | 225 | 252 |
| 5 | WFRBS Commercial Mortgage Trust 2013-C17 | 3.558% | 12/15/46 | 161 | 172 |
| 5 | WFRBS Commercial Mortgage Trust 2013-C18 | 3.676% | 12/15/46 | 595 | 644 |
| 5 | WFRBS Commercial Mortgage Trust 2013-C18 | 4.162% | 12/15/46 | 1,488 | 1,679 |
| 5 | WFRBS Commercial Mortgage Trust 2014-C19 | 4.101% | 3/15/47 | 971 | 1,088 |
| 5 | WFRBS Commercial Mortgage Trust 2014-C23 | 3.917% | 10/15/57 | 775 | 860 |
| 5 | WFRBS Commercial Mortgage Trust 2014-C24 | 3.607% | 11/15/47 | 2,040 | 2,210 |
| 5 | WFRBS Commercial Mortgage Trust 2014-LC14 | 3.522% | 3/15/47 | 140 | 149 |
| 5 | WFRBS Commercial Mortgage Trust 2014-LC14 | 3.766% | 3/15/47 | 60 | 65 |
| 5 | WFRBS Commercial Mortgage Trust 2014-LC14 | 4.045% | 3/15/47 | 1,272 | 1,420 |
| 5,9 | Wheels SPV 2 LLC 2016-1A | 1.870% | 5/20/25 | 665 | 665 |
| 5 | World Financial Network Credit Card Master Note | | | | |
| | Trust Series 2013-A | 1.610% | 12/15/21 | 1,732 | 1,740 |
52
| | | | | |
| Institutional Intermediate-Term Bond Fund | | | | |
| |
| |
| |
| | | | | Face | Market |
| | | | Maturity | Amount | Value• |
| | | Coupon | Date | ($000) | ($000) |
| 5,8 | World Financial Network Credit Card Master Note | | | | |
| | Trust Series 2015-A | 1.004% | 2/15/22 | 2,585 | 2,590 |
| 5 | World Financial Network Credit Card Master Note | | | | |
| | Trust Series 2015-B | 2.550% | 6/17/24 | 1,330 | 1,376 |
| 5 | World Financial Network Credit Card Master Note | | | | |
| | Trust Series 2016-A | 2.030% | 4/15/25 | 4,365 | 4,394 |
| 5 | World Omni Auto Receivables Trust 2014-B | 1.680% | 12/15/20 | 3,360 | 3,386 |
| 5 | World Omni Auto Receivables Trust 2015-B | 1.840% | 1/17/22 | 15,000 | 15,217 |
| 5 | World Omni Auto Receivables Trust 2016-A | 1.770% | 9/15/21 | 1,390 | 1,404 |
| 5 | World Omni Auto Receivables Trust 2016-B | 1.300% | 2/15/22 | 7,410 | 7,415 |
| 5 | World Omni Automobile Lease Securitization | | | | |
| | Trust 2015-A | 1.730% | 12/15/20 | 850 | 856 |
| 5 | World Omni Automobile Lease Securitization | | | | |
| | Trust 2016-A | 1.610% | 1/15/22 | 1,560 | 1,558 |
| Total Asset-Backed/Commercial Mortgage-Backed Securities (Cost $1,323,327) | | 1,341,708 |
| Corporate Bonds (20.8%) | | | | |
| Finance (11.5%) | | | | |
| | Banking (9.6%) | | | | |
| 9 | ABN AMRO Bank NV | 2.500% | 10/30/18 | 5,390 | 5,491 |
| | American Express Bank FSB | 6.000% | 9/13/17 | 1,000 | 1,043 |
| | American Express Centurion Bank | 6.000% | 9/13/17 | 1,731 | 1,805 |
| | American Express Credit Corp. | 1.875% | 11/5/18 | 4,107 | 4,140 |
| | American Express Credit Corp. | 2.250% | 8/15/19 | 1,800 | 1,837 |
| | American Express Credit Corp. | 2.375% | 5/26/20 | 4,900 | 4,991 |
| | Australia & New Zealand Banking Group Ltd. | 2.000% | 11/16/18 | 3,640 | 3,676 |
| 9 | Australia & New Zealand Banking Group Ltd. | 4.500% | 3/19/24 | 2,270 | 2,398 |
| | Bank of Montreal | 1.900% | 8/27/21 | 7,700 | 7,667 |
| | Bank of New York Mellon Corp. | 1.969% | 6/20/17 | 2,880 | 2,895 |
| | Bank of New York Mellon Corp. | 4.600% | 1/15/20 | 3,770 | 4,120 |
| | Bank of New York Mellon Corp. | 2.150% | 2/24/20 | 590 | 600 |
| | Bank of New York Mellon Corp. | 2.600% | 8/17/20 | 1,246 | 1,286 |
| | Bank of New York Mellon Corp. | 4.150% | 2/1/21 | 2,000 | 2,183 |
| | Bank of New York Mellon Corp. | 2.050% | 5/3/21 | 3,685 | 3,703 |
| | Bank of New York Mellon Corp. | 3.400% | 5/15/24 | 1,890 | 2,021 |
| | Bank of New York Mellon Corp. | 3.000% | 2/24/25 | 600 | 627 |
| | Bank of New York Mellon Corp. | 2.800% | 5/4/26 | 3,685 | 3,786 |
| | Bank of Nova Scotia | 2.050% | 10/30/18 | 11,240 | 11,475 |
| | Bank of Nova Scotia | 1.650% | 6/14/19 | 4,090 | 4,101 |
| | Bank of Nova Scotia | 4.375% | 1/13/21 | 4,490 | 4,989 |
| 9 | Bank of Nova Scotia | 1.875% | 9/20/21 | 7,770 | 7,809 |
| 9 | Bank of Tokyo-Mitsubishi UFJ Ltd. | 2.300% | 3/5/20 | 2,220 | 2,240 |
| 9 | Bank of Tokyo-Mitsubishi UFJ Ltd. | 2.750% | 9/14/20 | 4,192 | 4,302 |
| 9 | Banque Federative du Credit Mutuel SA | 2.750% | 10/15/20 | 7,230 | 7,484 |
| 9 | Banque Federative du Credit Mutuel SA | 2.500% | 4/13/21 | 8,860 | 9,081 |
| | Bear Stearns Cos. LLC | 6.400% | 10/2/17 | 7,190 | 7,530 |
| | Bear Stearns Cos. LLC | 7.250% | 2/1/18 | 5,050 | 5,423 |
| | BNP Paribas SA | 1.375% | 3/17/17 | 1,800 | 1,802 |
| | BNP Paribas SA | 2.700% | 8/20/18 | 3,590 | 3,662 |
| | BNP Paribas SA | 2.400% | 12/12/18 | 5,350 | 5,436 |
| | BPCE SA | 2.500% | 12/10/18 | 7,485 | 7,625 |
| | BPCE SA | 2.500% | 7/15/19 | 2,225 | 2,271 |
| | BPCE SA | 2.650% | 2/3/21 | 2,550 | 2,631 |
| | BPCE SA | 4.000% | 4/15/24 | 5,750 | 6,323 |
| | Branch Banking & Trust Co. | 3.625% | 9/16/25 | 1,525 | 1,628 |
53
| | | | |
| Institutional Intermediate-Term Bond Fund | | | | |
| |
| |
| |
| | | | Face | Market |
| | | Maturity | Amount | Value• |
| | Coupon | Date | ($000) | ($000) |
| Commonwealth Bank of Australia | 1.625% | 3/12/18 | 990 | 992 |
| Commonwealth Bank of Australia | 2.500% | 9/20/18 | 9,260 | 9,433 |
| Commonwealth Bank of Australia | 1.750% | 11/2/18 | 710 | 713 |
| Commonwealth Bank of Australia | 2.250% | 3/13/19 | 2,000 | 2,032 |
| Commonwealth Bank of Australia | 2.300% | 9/6/19 | 6,329 | 6,438 |
| 9 Commonwealth Bank of Australia | 5.000% | 3/19/20 | 2,970 | 3,282 |
| Commonwealth Bank of Australia | 2.400% | 11/2/20 | 1,355 | 1,384 |
| 9 Commonwealth Bank of Australia | 2.000% | 9/6/21 | 7,335 | 7,324 |
| 9 Commonwealth Bank of Australia | 4.500% | 12/9/25 | 3,125 | 3,336 |
| 9 Commonwealth Bank of Australia | 2.850% | 5/18/26 | 6,625 | 6,687 |
| 9 Commonwealth Bank of Australia | 2.625% | 9/6/26 | 6,115 | 6,045 |
| Cooperatieve Rabobank UA | 2.250% | 1/14/19 | 2,380 | 2,418 |
| Cooperatieve Rabobank UA | 2.250% | 1/14/20 | 3,610 | 3,673 |
| Cooperatieve Rabobank UA | 2.500% | 1/19/21 | 740 | 759 |
| Cooperatieve Rabobank UA | 3.875% | 2/8/22 | 4,187 | 4,583 |
| Cooperatieve Rabobank UA | 3.375% | 5/21/25 | 1,292 | 1,373 |
| Credit Suisse AG | 2.300% | 5/28/19 | 5,990 | 6,069 |
| Credit Suisse AG | 3.000% | 10/29/21 | 3,000 | 3,079 |
| Credit Suisse AG | 3.625% | 9/9/24 | 2,800 | 2,921 |
| 9 Danske Bank A/S | 2.750% | 9/17/20 | 1,105 | 1,142 |
| 9 Danske Bank A/S | 2.800% | 3/10/21 | 3,539 | 3,666 |
| 9 Danske Bank A/S | 2.000% | 9/8/21 | 9,920 | 9,896 |
| Fifth Third Bank | 2.300% | 3/15/19 | 1,360 | 1,383 |
| Fifth Third Bank | 1.625% | 9/27/19 | 5,820 | 5,816 |
| Fifth Third Bank | 2.250% | 6/14/21 | 5,364 | 5,449 |
| Goldman Sachs Group Inc. | 5.250% | 7/27/21 | 1,200 | 1,357 |
| Goldman Sachs Group Inc. | 5.750% | 1/24/22 | 8,970 | 10,397 |
| Goldman Sachs Group Inc. | 4.000% | 3/3/24 | 5,130 | 5,512 |
| Goldman Sachs Group Inc. | 3.850% | 7/8/24 | 1,880 | 1,997 |
| Goldman Sachs Group Inc. | 3.500% | 1/23/25 | 16,675 | 17,261 |
| Goldman Sachs Group Inc. | 3.750% | 5/22/25 | 950 | 998 |
| 9 HSBC Bank plc | 1.500% | 5/15/18 | 2,250 | 2,244 |
| HSBC Bank USA NA | 4.875% | 8/24/20 | 3,896 | 4,230 |
| HSBC Holdings plc | 3.400% | 3/8/21 | 2,430 | 2,515 |
| HSBC Holdings plc | 5.100% | 4/5/21 | 3,410 | 3,773 |
| HSBC Holdings plc | 2.950% | 5/25/21 | 680 | 690 |
| HSBC Holdings plc | 2.650% | 1/5/22 | 10,990 | 10,951 |
| HSBC Holdings plc | 4.000% | 3/30/22 | 4,400 | 4,697 |
| HSBC Holdings plc | 3.600% | 5/25/23 | 4,520 | 4,674 |
| HSBC Holdings plc | 4.300% | 3/8/26 | 7,389 | 7,916 |
| HSBC Holdings plc | 3.900% | 5/25/26 | 14,210 | 14,768 |
| HSBC USA Inc. | 2.625% | 9/24/18 | 2,700 | 2,739 |
| HSBC USA Inc. | 2.375% | 11/13/19 | 2,960 | 2,992 |
| HSBC USA Inc. | 2.750% | 8/7/20 | 780 | 790 |
| Huntington National Bank | 2.200% | 11/6/18 | 1,812 | 1,833 |
| 9 ING Bank NV | 2.500% | 10/1/19 | 2,670 | 2,726 |
| JPMorgan Chase & Co. | 2.000% | 8/15/17 | 4,490 | 4,515 |
| JPMorgan Chase & Co. | 1.700% | 3/1/18 | 2,400 | 2,407 |
| JPMorgan Chase & Co. | 1.625% | 5/15/18 | 545 | 546 |
| JPMorgan Chase & Co. | 2.250% | 1/23/20 | 8,352 | 8,452 |
| JPMorgan Chase & Co. | 4.950% | 3/25/20 | 3,995 | 4,398 |
| JPMorgan Chase & Co. | 2.750% | 6/23/20 | 4,475 | 4,605 |
| JPMorgan Chase & Co. | 4.400% | 7/22/20 | 4,720 | 5,129 |
| JPMorgan Chase & Co. | 4.250% | 10/15/20 | 4,784 | 5,184 |
| JPMorgan Chase & Co. | 2.550% | 10/29/20 | 25,165 | 25,609 |
54
| | | | |
| Institutional Intermediate-Term Bond Fund | | | | |
| |
| |
| |
| | | | Face | Market |
| | | Maturity | Amount | Value• |
| | Coupon | Date | ($000) | ($000) |
| JPMorgan Chase & Co. | 2.550% | 3/1/21 | 23,009 | 23,409 |
| JPMorgan Chase & Co. | 4.625% | 5/10/21 | 2,740 | 3,030 |
| JPMorgan Chase & Co. | 2.400% | 6/7/21 | 3,635 | 3,673 |
| JPMorgan Chase & Co. | 2.295% | 8/15/21 | 6,720 | 6,726 |
| JPMorgan Chase & Co. | 4.350% | 8/15/21 | 7,155 | 7,859 |
| JPMorgan Chase & Co. | 4.500% | 1/24/22 | 9,891 | 10,927 |
| JPMorgan Chase & Co. | 3.250% | 9/23/22 | 3,140 | 3,294 |
| JPMorgan Chase & Co. | 3.200% | 1/25/23 | 10,053 | 10,486 |
| JPMorgan Chase & Co. | 2.700% | 5/18/23 | 5,337 | 5,393 |
| JPMorgan Chase & Co. | 3.875% | 2/1/24 | 1,500 | 1,613 |
| JPMorgan Chase & Co. | 3.625% | 5/13/24 | 3,350 | 3,557 |
| JPMorgan Chase & Co. | 3.125% | 1/23/25 | 700 | 713 |
| JPMorgan Chase & Co. | 3.300% | 4/1/26 | 6,105 | 6,307 |
| JPMorgan Chase & Co. | 3.200% | 6/15/26 | 3,170 | 3,256 |
| JPMorgan Chase & Co. | 2.950% | 10/1/26 | 6,500 | 6,484 |
| JPMorgan Chase Bank NA | 6.000% | 10/1/17 | 7,190 | 7,500 |
| KeyBank NA | 1.650% | 2/1/18 | 2,400 | 2,409 |
| KeyBank NA | 2.350% | 3/8/19 | 881 | 897 |
| Lloyds Bank plc | 1.750% | 5/14/18 | 3,080 | 3,091 |
| Lloyds Bank plc | 2.050% | 1/22/19 | 4,160 | 4,175 |
| Lloyds Bank plc | 2.350% | 9/5/19 | 1,960 | 1,987 |
| Lloyds Bank plc | 2.700% | 8/17/20 | 1,545 | 1,588 |
| Lloyds Bank plc | 3.500% | 5/14/25 | 460 | 487 |
| 9 Macquarie Bank Ltd. | 3.900% | 1/15/26 | 5,875 | 6,180 |
| Manufacturers & Traders Trust Co. | 2.300% | 1/30/19 | 6,062 | 6,165 |
| Manufacturers & Traders Trust Co. | 2.250% | 7/25/19 | 3,400 | 3,458 |
| Manufacturers & Traders Trust Co. | 2.900% | 2/6/25 | 1,400 | 1,439 |
| Mitsubishi UFJ Financial Group Inc. | 2.950% | 3/1/21 | 9,985 | 10,272 |
| Mitsubishi UFJ Financial Group Inc. | 2.190% | 9/13/21 | 6,645 | 6,617 |
| Mitsubishi UFJ Financial Group Inc. | 2.527% | 9/13/23 | 825 | 828 |
| 9 Mitsubishi UFJ Trust & Banking Corp. | 2.650% | 10/19/20 | 4,665 | 4,769 |
| Morgan Stanley | 2.500% | 1/24/19 | 4,973 | 5,066 |
| Morgan Stanley | 2.375% | 7/23/19 | 10,356 | 10,523 |
| Morgan Stanley | 5.625% | 9/23/19 | 2,868 | 3,176 |
| Morgan Stanley | 5.750% | 1/25/21 | 6,800 | 7,752 |
| Morgan Stanley | 2.500% | 4/21/21 | 329 | 332 |
| Morgan Stanley | 3.875% | 4/29/24 | 7,500 | 7,995 |
| Morgan Stanley | 4.000% | 7/23/25 | 7,400 | 7,940 |
| Morgan Stanley | 3.875% | 1/27/26 | 2,504 | 2,660 |
| MUFG Americas Holdings Corp. | 3.500% | 6/18/22 | 6,290 | 6,662 |
| MUFG Americas Holdings Corp. | 3.000% | 2/10/25 | 1,800 | 1,836 |
| MUFG Union Bank NA | 2.625% | 9/26/18 | 1,460 | 1,487 |
| National Australia Bank Ltd. | 2.300% | 7/25/18 | 3,140 | 3,187 |
| National Australia Bank Ltd. | 2.000% | 1/14/19 | 728 | 735 |
| National Australia Bank Ltd. | 2.500% | 7/12/26 | 4,550 | 4,465 |
| National Bank of Canada | 2.100% | 12/14/18 | 2,525 | 2,560 |
| 9 Nationwide Building Society | 2.450% | 7/27/21 | 11,845 | 11,968 |
| 9 Nordea Bank AB | 1.625% | 9/30/19 | 3,535 | 3,532 |
| 9 Nordea Bank AB | 2.500% | 9/17/20 | 1,865 | 1,907 |
| PNC Bank NA | 2.200% | 1/28/19 | 3,300 | 3,370 |
| PNC Bank NA | 2.450% | 11/5/20 | 1,707 | 1,746 |
| PNC Bank NA | 2.150% | 4/29/21 | 7,133 | 7,206 |
| PNC Bank NA | 2.700% | 11/1/22 | 4,900 | 4,984 |
| PNC Bank NA | 3.300% | 10/30/24 | 1,450 | 1,540 |
| PNC Bank NA | 2.950% | 2/23/25 | 4,610 | 4,746 |
55
| | | | |
| Institutional Intermediate-Term Bond Fund | | | | |
| |
| |
| |
| | | | Face | Market |
| | | Maturity | Amount | Value• |
| | Coupon | Date | ($000) | ($000) |
| PNC Bank NA | 3.250% | 6/1/25 | 597 | 628 |
| PNC Financial Services Group Inc. | 2.854% | 11/9/22 | 1,200 | 1,237 |
| PNC Funding Corp. | 5.125% | 2/8/20 | 2,550 | 2,835 |
| PNC Funding Corp. | 3.300% | 3/8/22 | 3,590 | 3,813 |
| Royal Bank of Canada | 1.500% | 7/29/19 | 6,250 | 6,246 |
| Royal Bank of Canada | 2.500% | 1/19/21 | 1,770 | 1,839 |
| Santander UK plc | 1.375% | 3/13/17 | 760 | 760 |
| Santander UK plc | 1.650% | 9/29/17 | 4,500 | 4,503 |
| Santander UK plc | 3.050% | 8/23/18 | 3,410 | 3,490 |
| Santander UK plc | 2.500% | 3/14/19 | 3,118 | 3,164 |
| Santander UK plc | 2.350% | 9/10/19 | 3,950 | 4,003 |
| Santander UK plc | 4.000% | 3/13/24 | 1,384 | 1,509 |
| Skandinaviska Enskilda Banken AB | 2.625% | 3/15/21 | 980 | 1,007 |
| Skandinaviska Enskilda Banken AB | 1.875% | 9/13/21 | 9,570 | 9,496 |
| State Street Corp. | 1.350% | 5/15/18 | 1,800 | 1,804 |
| State Street Corp. | 3.300% | 12/16/24 | 1,790 | 1,904 |
| State Street Corp. | 3.550% | 8/18/25 | 2,611 | 2,826 |
| State Street Corp. | 2.650% | 5/19/26 | 5,552 | 5,609 |
| Sumitomo Mitsui Financial Group Inc. | 2.058% | 7/14/21 | 9,914 | 9,828 |
| Sumitomo Mitsui Financial Group Inc. | 3.784% | 3/9/26 | 1,296 | 1,405 |
| Sumitomo Mitsui Financial Group Inc. | 2.632% | 7/14/26 | 3,585 | 3,540 |
| Svenska Handelsbanken AB | 2.450% | 3/30/21 | 4,610 | 4,718 |
| Svenska Handelsbanken AB | 1.875% | 9/7/21 | 5,450 | 5,418 |
| 9 Swedbank AB | 2.375% | 2/27/19 | 3,770 | 3,835 |
| Toronto-Dominion Bank | 1.450% | 8/13/19 | 700 | 699 |
| Toronto-Dominion Bank | 2.500% | 12/14/20 | 6,580 | 6,768 |
| Toronto-Dominion Bank | 2.125% | 4/7/21 | 9,125 | 9,233 |
| Toronto-Dominion Bank | 1.800% | 7/13/21 | 5,045 | 5,029 |
| UBS AG | 1.800% | 3/26/18 | 8,560 | 8,576 |
| US Bancorp | 2.350% | 1/29/21 | 1,350 | 1,388 |
| US Bancorp | 3.100% | 4/27/26 | 1,212 | 1,251 |
| US Bank NA | 1.350% | 1/26/18 | 601 | 602 |
| Wachovia Corp. | 5.750% | 6/15/17 | 3,390 | 3,489 |
| Wachovia Corp. | 5.750% | 2/1/18 | 6,740 | 7,121 |
| Wells Fargo & Co. | 5.625% | 12/11/17 | 7,020 | 7,364 |
| Wells Fargo & Co. | 2.150% | 1/15/19 | 75 | 76 |
| Wells Fargo & Co. | 2.125% | 4/22/19 | 2,400 | 2,431 |
| Wells Fargo & Co. | 2.150% | 1/30/20 | 6,490 | 6,535 |
| Wells Fargo & Co. | 2.600% | 7/22/20 | 6,635 | 6,771 |
| Wells Fargo & Co. | 2.550% | 12/7/20 | 4,863 | 4,953 |
| Wells Fargo & Co. | 3.000% | 1/22/21 | 2,240 | 2,323 |
| Wells Fargo & Co. | 4.600% | 4/1/21 | 5,670 | 6,276 |
| Wells Fargo & Co. | 2.100% | 7/26/21 | 9,705 | 9,659 |
| Wells Fargo & Co. | 3.450% | 2/13/23 | 7,460 | 7,697 |
| Wells Fargo & Co. | 3.300% | 9/9/24 | 8,943 | 9,351 |
| Wells Fargo & Co. | 3.000% | 2/19/25 | 4,700 | 4,756 |
| Wells Fargo & Co. | 3.550% | 9/29/25 | 9,029 | 9,536 |
| Wells Fargo Bank NA | 6.000% | 11/15/17 | 7,190 | 7,548 |
| Westpac Banking Corp. | 2.250% | 7/30/18 | 5,575 | 5,651 |
| Westpac Banking Corp. | 1.950% | 11/23/18 | 2,376 | 2,397 |
| Westpac Banking Corp. | 4.875% | 11/19/19 | 7,190 | 7,870 |
| Westpac Banking Corp. | 2.600% | 11/23/20 | 6,430 | 6,616 |
| Westpac Banking Corp. | 2.100% | 5/13/21 | 9,365 | 9,422 |
| Westpac Banking Corp. | 2.000% | 8/19/21 | 9,665 | 9,660 |
| Westpac Banking Corp. | 2.850% | 5/13/26 | 1,000 | 1,014 |
| Westpac Banking Corp. | 2.700% | 8/19/26 | 6,725 | 6,686 |
56
| | | | |
| Institutional Intermediate-Term Bond Fund | | | | |
| |
| |
| |
| | | | Face | Market |
| | | Maturity | Amount | Value• |
| | Coupon | Date | ($000) | ($000) |
| Brokerage (0.2%) | | | | |
| Charles Schwab Corp. | 2.200% | 7/25/18 | 450 | 458 |
| Charles Schwab Corp. | 4.450% | 7/22/20 | 1,350 | 1,487 |
| CME Group Inc. | 3.000% | 3/15/25 | 1,340 | 1,405 |
| Invesco Finance plc | 3.125% | 11/30/22 | 4,490 | 4,613 |
| Invesco Finance plc | 3.750% | 1/15/26 | 3,060 | 3,278 |
| TD Ameritrade Holding Corp. | 2.950% | 4/1/22 | 60 | 62 |
| TD Ameritrade Holding Corp. | 3.625% | 4/1/25 | 3,220 | 3,453 |
| |
| Finance Companies (0.2%) | | | | |
| GE Capital International Funding Co. | 2.342% | 11/15/20 | 15,782 | 16,211 |
| GE Capital International Funding Co. | 3.373% | 11/15/25 | 6,433 | 6,966 |
| |
| Insurance (1.3%) | | | | |
| Aetna Inc. | 2.400% | 6/15/21 | 1,145 | 1,159 |
| Aetna Inc. | 2.750% | 11/15/22 | 1,700 | 1,729 |
| Aetna Inc. | 2.800% | 6/15/23 | 2,050 | 2,099 |
| Aetna Inc. | 3.200% | 6/15/26 | 4,415 | 4,489 |
| 9 AIA Group Ltd. | 3.200% | 3/11/25 | 1,070 | 1,092 |
| Berkshire Hathaway Inc. | 2.750% | 3/15/23 | 27,590 | 28,619 |
| Berkshire Hathaway Inc. | 3.125% | 3/15/26 | 5,970 | 6,278 |
| Chubb INA Holdings Inc. | 2.875% | 11/3/22 | 680 | 715 |
| Chubb INA Holdings Inc. | 2.700% | 3/13/23 | 1,000 | 1,034 |
| Chubb INA Holdings Inc. | 3.350% | 5/15/24 | 3,860 | 4,125 |
| Chubb INA Holdings Inc. | 3.150% | 3/15/25 | 5,109 | 5,381 |
| Chubb INA Holdings Inc. | 3.350% | 5/3/26 | 3,200 | 3,428 |
| 9 Jackson National Life Global Funding | 4.700% | 6/1/18 | 2,250 | 2,364 |
| Manulife Financial Corp. | 4.900% | 9/17/20 | 6,695 | 7,396 |
| Manulife Financial Corp. | 4.150% | 3/4/26 | 10,779 | 11,847 |
| Marsh & McLennan Cos. Inc. | 4.800% | 7/15/21 | 4,820 | 5,398 |
| Marsh & McLennan Cos. Inc. | 3.500% | 6/3/24 | 1,995 | 2,116 |
| Marsh & McLennan Cos. Inc. | 3.500% | 3/10/25 | 740 | 774 |
| MetLife Inc. | 3.600% | 4/10/24 | 995 | 1,056 |
| MetLife Inc. | 3.600% | 11/13/25 | 2,480 | 2,616 |
| 9 Metropolitan Life Global Funding I | 3.000% | 1/10/23 | 4,794 | 4,947 |
| PartnerRe Finance A LLC | 6.875% | 6/1/18 | 2,250 | 2,441 |
| PartnerRe Finance B LLC | 5.500% | 6/1/20 | 1,740 | 1,938 |
| 9 Pricoa Global Funding I | 2.550% | 11/24/20 | 2,130 | 2,195 |
| Progressive Corp. | 2.450% | 1/15/27 | 6,945 | 6,921 |
| 9 Reliance Standard Life Global Funding II | 3.050% | 1/20/21 | 1,270 | 1,300 |
| 9 Swiss Re Treasury US Corp. | 2.875% | 12/6/22 | 6,555 | 6,689 |
| UnitedHealth Group Inc. | 1.900% | 7/16/18 | 1,020 | 1,030 |
| UnitedHealth Group Inc. | 2.700% | 7/15/20 | 1,010 | 1,050 |
| UnitedHealth Group Inc. | 3.350% | 7/15/22 | 2,080 | 2,233 |
| UnitedHealth Group Inc. | 2.875% | 3/15/23 | 2,700 | 2,816 |
| UnitedHealth Group Inc. | 3.750% | 7/15/25 | 1,290 | 1,419 |
| |
| Real Estate Investment Trusts (0.2%) | | | | |
| Federal Realty Investment Trust | 3.000% | 8/1/22 | 2,300 | 2,392 |
| Federal Realty Investment Trust | 2.750% | 6/1/23 | 4,490 | 4,575 |
| Simon Property Group LP | 5.650% | 2/1/20 | 3,860 | 4,317 |
| Simon Property Group LP | 2.500% | 9/1/20 | 727 | 749 |
| Simon Property Group LP | 4.375% | 3/1/21 | 4,400 | 4,865 |
| Simon Property Group LP | 3.750% | 2/1/24 | 2,661 | 2,888 |
57
| | | | |
| Institutional Intermediate-Term Bond Fund | | | | |
| |
| |
| |
| | | | Face | Market |
| | | Maturity | Amount | Value• |
| | Coupon | Date | ($000) | ($000) |
| Simon Property Group LP | 3.500% | 9/1/25 | 891 | 956 |
| Simon Property Group LP | 3.300% | 1/15/26 | 894 | 944 |
| | | | | 1,134,321 |
| Industrial (8.2%) | | | | |
| Basic Industry (0.3%) | | | | |
| 9 Air Liquide Finance SA | 2.250% | 9/27/23 | 5,020 | 5,040 |
| 9 Air Liquide Finance SA | 2.500% | 9/27/26 | 4,970 | 5,002 |
| Air Products & Chemicals Inc. | 3.000% | 11/3/21 | 1,100 | 1,174 |
| Air Products & Chemicals Inc. | 2.750% | 2/3/23 | 1,040 | 1,080 |
| BHP Billiton Finance USA Ltd. | 5.400% | 3/29/17 | 1,070 | 1,090 |
| BHP Billiton Finance USA Ltd. | 3.250% | 11/21/21 | 5,885 | 6,289 |
| BHP Billiton Finance USA Ltd. | 3.850% | 9/30/23 | 1,170 | 1,276 |
| BHP Billiton Finance USA Ltd. | 6.420% | 3/1/26 | 545 | 681 |
| Praxair Inc. | 3.000% | 9/1/21 | 3,600 | 3,819 |
| Praxair Inc. | 2.450% | 2/15/22 | 2,455 | 2,534 |
| Praxair Inc. | 2.200% | 8/15/22 | 1,120 | 1,142 |
| Sherwin-Williams Co. | 3.450% | 8/1/25 | 900 | 935 |
| |
| Capital Goods (1.4%) | | | | |
| 9 Airbus Group Finance BV | 2.700% | 4/17/23 | 9,486 | 9,839 |
| Caterpillar Financial Services Corp. | 1.700% | 8/9/21 | 6,800 | 6,730 |
| Caterpillar Financial Services Corp. | 2.850% | 6/1/22 | 6,000 | 6,289 |
| Caterpillar Financial Services Corp. | 3.250% | 12/1/24 | 7,070 | 7,546 |
| Caterpillar Inc. | 2.600% | 6/26/22 | 1,250 | 1,296 |
| Deere & Co. | 2.600% | 6/8/22 | 5,220 | 5,417 |
| Dover Corp. | 3.150% | 11/15/25 | 1,825 | 1,937 |
| General Electric Capital Corp. | 6.000% | 8/7/19 | 1,441 | 1,628 |
| General Electric Capital Corp. | 5.500% | 1/8/20 | 4,137 | 4,686 |
| General Electric Capital Corp. | 2.200% | 1/9/20 | 961 | 985 |
| General Electric Capital Corp. | 5.550% | 5/4/20 | 391 | 446 |
| General Electric Capital Corp. | 4.375% | 9/16/20 | 1,604 | 1,775 |
| General Electric Capital Corp. | 4.625% | 1/7/21 | 12,962 | 14,594 |
| General Electric Capital Corp. | 5.300% | 2/11/21 | 1,286 | 1,475 |
| General Electric Capital Corp. | 4.650% | 10/17/21 | 7,785 | 8,870 |
| General Electric Capital Corp. | 3.150% | 9/7/22 | 3,306 | 3,528 |
| General Electric Capital Corp. | 3.100% | 1/9/23 | 8,336 | 8,854 |
| Illinois Tool Works Inc. | 3.500% | 3/1/24 | 2,650 | 2,904 |
| John Deere Capital Corp. | 2.450% | 9/11/20 | 5,175 | 5,323 |
| John Deere Capital Corp. | 2.800% | 3/4/21 | 3,475 | 3,626 |
| John Deere Capital Corp. | 2.750% | 3/15/22 | 1,980 | 2,059 |
| John Deere Capital Corp. | 2.800% | 1/27/23 | 1,925 | 2,004 |
| John Deere Capital Corp. | 2.800% | 3/6/23 | 10,985 | 11,412 |
| Parker-Hannifin Corp. | 3.500% | 9/15/22 | 1,885 | 2,051 |
| Parker-Hannifin Corp. | 3.300% | 11/21/24 | 815 | 875 |
| Precision Castparts Corp. | 2.500% | 1/15/23 | 6,800 | 7,013 |
| Precision Castparts Corp. | 3.250% | 6/15/25 | 6,765 | 7,259 |
| Raytheon Co. | 3.150% | 12/15/24 | 2,750 | 2,950 |
| 9 Siemens Financieringsmaatschappij NV | 2.350% | 10/15/26 | 1,850 | 1,831 |
| |
| Communication (0.5%) | | | | |
| America Movil SAB de CV | 5.000% | 10/16/19 | 1,800 | 1,965 |
| America Movil SAB de CV | 5.000% | 3/30/20 | 4,800 | 5,293 |
| America Movil SAB de CV | 3.125% | 7/16/22 | 7,364 | 7,578 |
| Comcast Cable Communications Holdings Inc. | 9.455% | 11/15/22 | 1,530 | 2,151 |
| Comcast Corp. | 5.875% | 2/15/18 | 2,100 | 2,231 |
58
| | | | |
| Institutional Intermediate-Term Bond Fund | | | | |
| |
| |
| |
| | | | Face | Market |
| | | Maturity | Amount | Value• |
| | Coupon | Date | ($000) | ($000) |
| Comcast Corp. | 5.700% | 5/15/18 | 2,220 | 2,378 |
| Comcast Corp. | 2.850% | 1/15/23 | 2,700 | 2,827 |
| Comcast Corp. | 3.600% | 3/1/24 | 3,600 | 3,933 |
| Comcast Corp. | 3.375% | 2/15/25 | 2,885 | 3,088 |
| Comcast Corp. | 3.375% | 8/15/25 | 1,815 | 1,951 |
| NBCUniversal Media LLC | 5.150% | 4/30/20 | 8,090 | 9,072 |
| NBCUniversal Media LLC | 2.875% | 1/15/23 | 4,390 | 4,571 |
| Walt Disney Co. | 3.150% | 9/17/25 | 2,500 | 2,709 |
| Walt Disney Co. | 3.000% | 2/13/26 | 1,500 | 1,588 |
| |
| Consumer Cyclical (1.3%) | | | | |
| Alibaba Group Holding Ltd. | 3.125% | 11/28/21 | 1,030 | 1,070 |
| Alibaba Group Holding Ltd. | 3.600% | 11/28/24 | 1,285 | 1,337 |
| American Honda Finance Corp. | 1.600% | 7/13/18 | 700 | 704 |
| American Honda Finance Corp. | 2.250% | 8/15/19 | 6,590 | 6,754 |
| American Honda Finance Corp. | 2.450% | 9/24/20 | 2,225 | 2,287 |
| American Honda Finance Corp. | 1.700% | 9/9/21 | 2,790 | 2,765 |
| Automatic Data Processing Inc. | 3.375% | 9/15/25 | 475 | 519 |
| 9 BMW US Capital LLC | 2.000% | 4/11/21 | 4,740 | 4,752 |
| 9 BMW US Capital LLC | 2.800% | 4/11/26 | 4,915 | 5,013 |
| Cummins Inc. | 3.650% | 10/1/23 | 1,350 | 1,461 |
| Harley-Davidson Inc. | 3.500% | 7/28/25 | 2,665 | 2,812 |
| Home Depot Inc. | 4.400% | 4/1/21 | 2,030 | 2,260 |
| Home Depot Inc. | 2.625% | 6/1/22 | 2,700 | 2,804 |
| Lowe’s Cos. Inc. | 4.625% | 4/15/20 | 2,070 | 2,260 |
| Lowe’s Cos. Inc. | 3.800% | 11/15/21 | 355 | 390 |
| Lowe’s Cos. Inc. | 3.120% | 4/15/22 | 4,440 | 4,707 |
| Lowe’s Cos. Inc. | 3.875% | 9/15/23 | 3,775 | 4,191 |
| Lowe’s Cos. Inc. | 3.375% | 9/15/25 | 775 | 836 |
| Lowe’s Cos. Inc. | 2.500% | 4/15/26 | 4,200 | 4,211 |
| MasterCard Inc. | 3.375% | 4/1/24 | 1,350 | 1,456 |
| 9 Nissan Motor Acceptance Corp. | 2.550% | 3/8/21 | 5,415 | 5,556 |
| PACCAR Financial Corp. | 1.750% | 8/14/18 | 740 | 748 |
| PACCAR Financial Corp. | 2.200% | 9/15/19 | 450 | 460 |
| Starbucks Corp. | 2.100% | 2/4/21 | 1,980 | 2,021 |
| Starbucks Corp. | 2.450% | 6/15/26 | 3,645 | 3,702 |
| Target Corp. | 2.500% | 4/15/26 | 1,750 | 1,783 |
| TJX Cos. Inc. | 6.950% | 4/15/19 | 6,740 | 7,658 |
| TJX Cos. Inc. | 2.750% | 6/15/21 | 3,150 | 3,304 |
| TJX Cos. Inc. | 2.500% | 5/15/23 | 900 | 924 |
| TJX Cos. Inc. | 2.250% | 9/15/26 | 2,650 | 2,609 |
| Toyota Motor Credit Corp. | 1.550% | 7/13/18 | 500 | 503 |
| Toyota Motor Credit Corp. | 2.800% | 7/13/22 | 600 | 631 |
| Visa Inc. | 2.200% | 12/14/20 | 4,465 | 4,580 |
| Visa Inc. | 2.800% | 12/14/22 | 4,465 | 4,681 |
| Visa Inc. | 3.150% | 12/14/25 | 17,825 | 18,834 |
| Wal-Mart Stores Inc. | 3.625% | 7/8/20 | 1,365 | 1,479 |
| Wal-Mart Stores Inc. | 3.250% | 10/25/20 | 1,485 | 1,598 |
| Wal-Mart Stores Inc. | 4.250% | 4/15/21 | 2,852 | 3,199 |
| Wal-Mart Stores Inc. | 2.550% | 4/11/23 | 6,290 | 6,532 |
| |
| Consumer Noncyclical (1.5%) | | | | |
| Altria Group Inc. | 2.850% | 8/9/22 | 9,340 | 9,752 |
| Altria Group Inc. | 4.000% | 1/31/24 | 5,305 | 5,925 |
| Anheuser-Busch Cos. LLC | 5.500% | 1/15/18 | 5,840 | 6,148 |
59
| | | | |
| Institutional Intermediate-Term Bond Fund | | | | |
| |
| |
| |
| | | | Face | Market |
| | | Maturity | Amount | Value• |
| | Coupon | Date | ($000) | ($000) |
| Anheuser-Busch InBev Finance Inc. | 1.250% | 1/17/18 | 970 | 974 |
| Anheuser-Busch InBev Finance Inc. | 2.150% | 2/1/19 | 2,050 | 2,084 |
| Anheuser-Busch InBev Finance Inc. | 2.650% | 2/1/21 | 6,300 | 6,502 |
| Anheuser-Busch InBev Finance Inc. | 2.625% | 1/17/23 | 2,355 | 2,404 |
| Anheuser-Busch InBev Finance Inc. | 3.300% | 2/1/23 | 4,900 | 5,167 |
| Anheuser-Busch InBev Worldwide Inc. | 5.375% | 1/15/20 | 1,990 | 2,223 |
| Anheuser-Busch InBev Worldwide Inc. | 2.500% | 7/15/22 | 2,725 | 2,779 |
| Archer-Daniels-Midland Co. | 2.500% | 8/11/26 | 8,000 | 7,967 |
| Coca-Cola Femsa SAB de CV | 2.375% | 11/26/18 | 2,655 | 2,679 |
| Coca-Cola Femsa SAB de CV | 3.875% | 11/26/23 | 1,350 | 1,453 |
| Colgate-Palmolive Co. | 2.100% | 5/1/23 | 1,200 | 1,213 |
| Covidien International Finance SA | 4.200% | 6/15/20 | 4,126 | 4,512 |
| Gilead Sciences Inc. | 3.700% | 4/1/24 | 15,760 | 16,957 |
| Gilead Sciences Inc. | 3.500% | 2/1/25 | 9,095 | 9,635 |
| Gilead Sciences Inc. | 3.650% | 3/1/26 | 4,505 | 4,851 |
| Kaiser Foundation Hospitals | 3.500% | 4/1/22 | 1,105 | 1,184 |
| Kimberly-Clark Corp. | 3.625% | 8/1/20 | 630 | 684 |
| Kimberly-Clark Corp. | 2.650% | 3/1/25 | 3,000 | 3,122 |
| McCormick & Co. Inc. | 3.500% | 9/1/23 | 2,500 | 2,683 |
| McCormick & Co. Inc. | 3.250% | 11/15/25 | 485 | 517 |
| Medtronic Inc. | 5.600% | 3/15/19 | 1,800 | 1,981 |
| Medtronic Inc. | 3.150% | 3/15/22 | 12,000 | 12,750 |
| Medtronic Inc. | 3.500% | 3/15/25 | 4,400 | 4,744 |
| PepsiCo Inc. | 7.900% | 11/1/18 | 900 | 1,021 |
| PepsiCo Inc. | 4.500% | 1/15/20 | 2,250 | 2,473 |
| PepsiCo Inc. | 3.000% | 8/25/21 | 1,360 | 1,444 |
| PepsiCo Inc. | 3.100% | 7/17/22 | 6,318 | 6,755 |
| PepsiCo Inc. | 2.750% | 3/1/23 | 900 | 943 |
| PepsiCo Inc. | 3.600% | 3/1/24 | 6,536 | 7,183 |
| PepsiCo Inc. | 2.850% | 2/24/26 | 2,615 | 2,736 |
| 9 Roche Holdings Inc. | 2.875% | 9/29/21 | 1,590 | 1,671 |
| 9 Roche Holdings Inc. | 3.350% | 9/30/24 | 3,860 | 4,175 |
| |
| Energy (1.5%) | | | | |
| BP Capital Markets plc | 1.375% | 5/10/18 | 1,800 | 1,800 |
| BP Capital Markets plc | 2.241% | 9/26/18 | 3,780 | 3,836 |
| BP Capital Markets plc | 4.750% | 3/10/19 | 7,640 | 8,225 |
| BP Capital Markets plc | 4.500% | 10/1/20 | 4,040 | 4,436 |
| BP Capital Markets plc | 3.561% | 11/1/21 | 6,917 | 7,461 |
| BP Capital Markets plc | 3.062% | 3/17/22 | 915 | 958 |
| BP Capital Markets plc | 3.245% | 5/6/22 | 2,600 | 2,743 |
| BP Capital Markets plc | 2.500% | 11/6/22 | 3,140 | 3,169 |
| BP Capital Markets plc | 2.750% | 5/10/23 | 6,630 | 6,751 |
| BP Capital Markets plc | 3.994% | 9/26/23 | 900 | 982 |
| BP Capital Markets plc | 3.814% | 2/10/24 | 3,590 | 3,870 |
| BP Capital Markets plc | 3.535% | 11/4/24 | 915 | 970 |
| BP Capital Markets plc | 3.119% | 5/4/26 | 6,600 | 6,771 |
| Chevron Corp. | 2.193% | 11/15/19 | 450 | 459 |
| Dominion Gas Holdings LLC | 2.500% | 12/15/19 | 2,690 | 2,763 |
| Dominion Gas Holdings LLC | 2.800% | 11/15/20 | 2,685 | 2,783 |
| Exxon Mobil Corp. | 2.397% | 3/6/22 | 1,100 | 1,128 |
| Occidental Petroleum Corp. | 1.500% | 2/15/18 | 2,250 | 2,257 |
| Occidental Petroleum Corp. | 4.100% | 2/1/21 | 5,815 | 6,317 |
| Occidental Petroleum Corp. | 3.125% | 2/15/22 | 2,695 | 2,825 |
| Occidental Petroleum Corp. | 2.600% | 4/15/22 | 1,920 | 1,960 |
60
| | | | |
| Institutional Intermediate-Term Bond Fund | | | | |
| |
| |
| |
| | | | Face | Market |
| | | Maturity | Amount | Value• |
| | Coupon | Date | ($000) | ($000) |
| Occidental Petroleum Corp. | 2.700% | 2/15/23 | 1,800 | 1,835 |
| Occidental Petroleum Corp. | 3.500% | 6/15/25 | 3,000 | 3,197 |
| Occidental Petroleum Corp. | 3.400% | 4/15/26 | 250 | 265 |
| 9 Schlumberger Holdings Corp. | 3.625% | 12/21/22 | 6,000 | 6,431 |
| Schlumberger Investment SA | 3.650% | 12/1/23 | 3,590 | 3,877 |
| Shell International Finance BV | 4.375% | 3/25/20 | 1,840 | 2,010 |
| Shell International Finance BV | 3.250% | 5/11/25 | 8,800 | 9,288 |
| Shell International Finance BV | 2.875% | 5/10/26 | 9,500 | 9,649 |
| Shell International Finance BV | 2.500% | 9/12/26 | 7,150 | 7,046 |
| Total Capital Canada Ltd. | 2.750% | 7/15/23 | 2,700 | 2,795 |
| Total Capital International SA | 2.750% | 6/19/21 | 7,190 | 7,490 |
| Total Capital International SA | 2.875% | 2/17/22 | 4,040 | 4,224 |
| Total Capital International SA | 2.700% | 1/25/23 | 1,350 | 1,393 |
| Total Capital SA | 4.450% | 6/24/20 | 8,800 | 9,665 |
| Total Capital SA | 4.125% | 1/28/21 | 805 | 883 |
| TransCanada PipeLines Ltd. | 2.500% | 8/1/22 | 1,200 | 1,206 |
| |
| Other Industrial (0.0%) | | | | |
| 9 CK Hutchison International 16 Ltd. | 2.750% | 10/3/26 | 3,690 | 3,636 |
| |
| Technology (1.0%) | | | | |
| Apple Inc. | 2.000% | 5/6/20 | 3,705 | 3,786 |
| Apple Inc. | 2.250% | 2/23/21 | 1,500 | 1,538 |
| Apple Inc. | 2.850% | 5/6/21 | 5,840 | 6,155 |
| Apple Inc. | 2.150% | 2/9/22 | 895 | 910 |
| Apple Inc. | 2.850% | 2/23/23 | 4,780 | 5,029 |
| Apple Inc. | 2.400% | 5/3/23 | 3,590 | 3,656 |
| Apple Inc. | 3.450% | 5/6/24 | 5,385 | 5,830 |
| Apple Inc. | 2.500% | 2/9/25 | 4,105 | 4,161 |
| Apple Inc. | 3.200% | 5/13/25 | 1,360 | 1,442 |
| Apple Inc. | 3.250% | 2/23/26 | 6,360 | 6,763 |
| Apple Inc. | 2.450% | 8/4/26 | 3,000 | 2,988 |
| Applied Materials Inc. | 2.625% | 10/1/20 | 1,735 | 1,795 |
| Applied Materials Inc. | 3.900% | 10/1/25 | 427 | 474 |
| Baidu Inc. | 3.250% | 8/6/18 | 7,075 | 7,250 |
| Cisco Systems Inc. | 4.450% | 1/15/20 | 590 | 645 |
| Cisco Systems Inc. | 2.200% | 9/20/23 | 2,210 | 2,227 |
| Cisco Systems Inc. | 2.950% | 2/28/26 | 4,290 | 4,514 |
| Cisco Systems Inc. | 2.500% | 9/20/26 | 2,210 | 2,238 |
| EMC Corp. | 2.650% | 6/1/20 | 1,315 | 1,259 |
| EMC Corp. | 3.375% | 6/1/23 | 565 | 529 |
| Intel Corp. | 2.450% | 7/29/20 | 885 | 915 |
| Intel Corp. | 3.300% | 10/1/21 | 5,810 | 6,240 |
| Intel Corp. | 2.700% | 12/15/22 | 3,005 | 3,137 |
| International Business Machines Corp. | 3.625% | 2/12/24 | 1,800 | 1,961 |
| Microsoft Corp. | 2.375% | 2/12/22 | 445 | 458 |
| Microsoft Corp. | 2.650% | 11/3/22 | 700 | 729 |
| Microsoft Corp. | 2.700% | 2/12/25 | 2,685 | 2,777 |
| Oracle Corp. | 2.375% | 1/15/19 | 2,920 | 2,988 |
| Oracle Corp. | 2.500% | 5/15/22 | 8,180 | 8,372 |
| Oracle Corp. | 3.625% | 7/15/23 | 290 | 314 |
| Oracle Corp. | 3.400% | 7/8/24 | 4,000 | 4,273 |
| Oracle Corp. | 2.950% | 5/15/25 | 1,400 | 1,446 |
| QUALCOMM Inc. | 2.250% | 5/20/20 | 2,315 | 2,364 |
| Xilinx Inc. | 3.000% | 3/15/21 | 1,390 | 1,449 |
61
| | | | |
| Institutional Intermediate-Term Bond Fund | | | | |
| |
| |
| |
| | | | Face | Market |
| | | Maturity | Amount | Value• |
| | Coupon | Date | ($000) | ($000) |
| Transportation (0.7%) | | | | |
| 5 American Airlines 2016-1 Class AA Pass Through | | | | |
| Trust | 3.575% | 1/15/28 | 4,664 | 4,908 |
| Burlington Northern Santa Fe LLC | 3.000% | 3/15/23 | 3,665 | 3,848 |
| Burlington Northern Santa Fe LLC | 3.400% | 9/1/24 | 9,470 | 10,192 |
| Burlington Northern Santa Fe LLC | 6.875% | 12/1/27 | 4,965 | 6,722 |
| 5 CSX Transportation Inc. | 6.251% | 1/15/23 | 1,268 | 1,493 |
| 5 Delta Air Lines 2007-1 Class A Pass Through Trust | 6.821% | 2/10/24 | 4,043 | 4,765 |
| 5 Northwest Airlines 2007-1 Class A Pass Through | | | | |
| Trust | 7.027% | 5/1/21 | 3,346 | 3,781 |
| 5 Southwest Airlines Co. 2007-1 Pass Through | | | | |
| Trust | 6.150% | 2/1/24 | 3,764 | 4,253 |
| Union Pacific Corp. | 4.163% | 7/15/22 | 10,530 | 11,825 |
| Union Pacific Corp. | 2.750% | 4/15/23 | 4,555 | 4,730 |
| Union Pacific Corp. | 3.646% | 2/15/24 | 3,550 | 3,880 |
| Union Pacific Corp. | 3.750% | 3/15/24 | 3,770 | 4,159 |
| 5 United Airlines 2013-1 Class A Pass Through Trust | 4.300% | 2/15/27 | 1,236 | 1,347 |
| | | | | 803,150 |
| Utilities (1.1%) | | | | |
| Electric (1.1%) | | | | |
| Alabama Power Co. | 2.800% | 4/1/25 | 2,400 | 2,489 |
| Ameren Illinois Co. | 2.700% | 9/1/22 | 1,827 | 1,901 |
| Arizona Public Service Co. | 2.550% | 9/15/26 | 2,555 | 2,573 |
| Berkshire Hathaway Energy Co. | 3.750% | 11/15/23 | 4,600 | 5,023 |
| Berkshire Hathaway Energy Co. | 8.480% | 9/15/28 | 3,653 | 5,627 |
| Commonwealth Edison Co. | 3.400% | 9/1/21 | 8,700 | 9,349 |
| Commonwealth Edison Co. | 2.550% | 6/15/26 | 3,775 | 3,834 |
| Connecticut Light & Power Co. | 2.500% | 1/15/23 | 5,550 | 5,667 |
| Consumers Energy Co. | 2.850% | 5/15/22 | 4,380 | 4,597 |
| Consumers Energy Co. | 3.125% | 8/31/24 | 1,350 | 1,426 |
| Entergy Louisiana LLC | 3.300% | 12/1/22 | 1,300 | 1,364 |
| Entergy Louisiana LLC | 2.400% | 10/1/26 | 4,920 | 4,878 |
| Entergy Louisiana LLC | 3.050% | 6/1/31 | 2,230 | 2,286 |
| Entergy Mississippi Inc. | 2.850% | 6/1/28 | 4,280 | 4,366 |
| MidAmerican Energy Co. | 5.300% | 3/15/18 | 3,326 | 3,520 |
| MidAmerican Energy Co. | 3.700% | 9/15/23 | 1,350 | 1,480 |
| National Rural Utilities Cooperative Finance Corp. | 10.375% | 11/1/18 | 4,242 | 5,015 |
| National Rural Utilities Cooperative Finance Corp. | 2.350% | 6/15/20 | 3,500 | 3,586 |
| Pacific Gas & Electric Co. | 3.250% | 9/15/21 | 550 | 584 |
| Pacific Gas & Electric Co. | 3.750% | 2/15/24 | 2,185 | 2,394 |
| Pacific Gas & Electric Co. | 3.500% | 6/15/25 | 1,980 | 2,147 |
| PacifiCorp | 5.500% | 1/15/19 | 2,665 | 2,907 |
| PacifiCorp | 3.600% | 4/1/24 | 3,600 | 3,923 |
| Southwestern Public Service Co. | 3.300% | 6/15/24 | 13,616 | 14,474 |
| Virginia Electric & Power Co. | 2.950% | 1/15/22 | 7,700 | 8,114 |
| Westar Energy Inc. | 2.550% | 7/1/26 | 5,745 | 5,746 |
| | | | | 109,270 |
| Total Corporate Bonds (Cost $1,992,342) | | | | 2,046,741 |
| Sovereign Bonds (U.S. Dollar-Denominated) (6.4%) | | | | |
| 9 Avi Funding Co. Ltd. | 2.850% | 9/16/20 | 9,400 | 9,647 |
| 9 Banco del Estado de Chile | 2.000% | 11/9/17 | 1,450 | 1,456 |
| 9 Bank Nederlandse Gemeenten NV | 1.375% | 9/27/17 | 2,725 | 2,735 |
| 9 Bermuda | 4.854% | 2/6/24 | 2,725 | 3,012 |
62
| | | | | |
| Institutional Intermediate-Term Bond Fund | | | | |
| |
| |
| |
| | | | | Face | Market |
| | | | Maturity | Amount | Value• |
| | | Coupon | Date | ($000) | ($000) |
| | Canada | 0.875% | 2/14/17 | 1,825 | 1,826 |
| 9 | CDP Financial Inc. | 4.400% | 11/25/19 | 17,160 | 18,729 |
| | CNOOC Finance 2013 Ltd. | 1.750% | 5/9/18 | 5,860 | 5,859 |
| 9 | CNPC General Capital Ltd. | 3.400% | 4/16/23 | 800 | 832 |
| | Corp. Andina de Fomento | 4.375% | 6/15/22 | 7,161 | 7,931 |
| 9 | Corp. Nacional del Cobre de Chile | 3.875% | 11/3/21 | 2,950 | 3,079 |
| | Corp. Nacional del Cobre de Chile | 3.875% | 11/3/21 | 1,300 | 1,361 |
| | Corp. Nacional del Cobre de Chile | 3.000% | 7/17/22 | 970 | 968 |
| 9 | CPPIB Capital Inc. | 1.250% | 9/20/19 | 17,700 | 17,705 |
| 10 | Development Bank of Japan Inc. | 2.750% | 9/16/25 | 7,580 | 8,028 |
| 9,11 Dexia Credit Local SA | 1.250% | 10/18/16 | 2,725 | 2,725 |
| 9,11 Dexia Credit Local SA | 1.875% | 9/15/21 | 13,260 | 13,244 |
| 9 | Electricite de France SA | 3.625% | 10/13/25 | 9,110 | 9,512 |
| | European Investment Bank | 1.750% | 3/15/17 | 5,450 | 5,470 |
| | European Investment Bank | 1.625% | 6/15/17 | 2,275 | 2,286 |
| | European Investment Bank | 1.625% | 12/15/20 | 35,715 | 36,157 |
| | European Investment Bank | 4.000% | 2/16/21 | 9,100 | 10,110 |
| | European Investment Bank | 2.500% | 4/15/21 | 7,275 | 7,628 |
| | Export-Import Bank of Korea | 3.750% | 10/20/16 | 16,250 | 16,265 |
| | Export-Import Bank of Korea | 4.000% | 1/11/17 | 14,430 | 14,538 |
| | Export-Import Bank of Korea | 1.750% | 2/27/18 | 3,935 | 3,953 |
| | Export-Import Bank of Korea | 2.250% | 1/21/20 | 5,390 | 5,477 |
| | Export-Import Bank of Korea | 4.000% | 1/29/21 | 2,550 | 2,780 |
| | Export-Import Bank of Korea | 4.000% | 1/14/24 | 2,000 | 2,241 |
| 9 | ICBCIL Finance Co. Ltd. | 2.375% | 5/19/19 | 8,000 | 8,050 |
| | Industrial & Commercial Bank of China Ltd. | 3.231% | 11/13/19 | 1,000 | 1,038 |
| | Inter-American Development Bank | 1.125% | 3/15/17 | 2,275 | 2,278 |
| | Inter-American Development Bank | 2.375% | 8/15/17 | 2,725 | 2,759 |
| | Inter-American Development Bank | 3.875% | 2/14/20 | 4,550 | 4,954 |
| | Inter-American Development Bank | 3.000% | 2/21/24 | 3,250 | 3,552 |
| | International Bank for Reconstruction & | | | | |
| | Development | 1.375% | 5/24/21 | 18,250 | 18,295 |
| | International Finance Corp. | 1.125% | 11/23/16 | 2,900 | 2,902 |
| 10 | Japan Bank for International Cooperation | 1.750% | 11/13/18 | 2,725 | 2,741 |
| 10 | Japan Bank for International Cooperation | 2.125% | 2/7/19 | 2,725 | 2,776 |
| 12 | KFW | 1.250% | 10/5/16 | 4,550 | 4,548 |
| 12 | KFW | 1.250% | 2/15/17 | 20,000 | 20,036 |
| 12 | KFW | 1.000% | 6/11/18 | 5,225 | 5,228 |
| | Korea Development Bank | 3.875% | 5/4/17 | 4,000 | 4,060 |
| | Korea Development Bank | 3.500% | 8/22/17 | 6,155 | 6,270 |
| | Korea Development Bank | 2.500% | 1/13/21 | 4,750 | 4,886 |
| 9 | Korea East-West Power Co. Ltd. | 2.500% | 7/16/17 | 2,050 | 2,065 |
| | Korea East-West Power Co. Ltd. | 2.625% | 11/27/18 | 4,755 | 4,858 |
| 9 | Korea Expressway Corp. | 1.625% | 4/28/17 | 4,750 | 4,750 |
| 9 | Korea Gas Corp. | 2.875% | 7/29/18 | 3,650 | 3,739 |
| 9 | Korea Land & Housing Corp. | 1.875% | 8/2/17 | 4,750 | 4,768 |
| 12 | Landwirtschaftliche Rentenbank | 2.375% | 9/13/17 | 5,000 | 5,068 |
| 9 | Municipality Finance plc | 1.125% | 4/17/18 | 2,275 | 2,277 |
| 9 | Nederlandse Waterschapsbank NV | 1.875% | 3/13/19 | 1,800 | 1,829 |
| 9 | Nederlandse Waterschapsbank NV | 1.250% | 9/9/19 | 32,000 | 31,981 |
| | North American Development Bank | 2.300% | 10/10/18 | 3,750 | 3,829 |
| 9 | Ooredoo International Finance Ltd. | 3.375% | 10/14/16 | 900 | 900 |
| 9 | Province of Alberta | 1.000% | 6/21/17 | 1,825 | 1,826 |
| 9 | Province of Alberta | 1.750% | 8/26/20 | 1,500 | 1,518 |
| 9 | Province of Alberta | 2.050% | 8/17/26 | 5,000 | 4,957 |
63
| | | | | |
| Institutional Intermediate-Term Bond Fund | | | | |
| |
| |
| |
| | | | | Face | Market |
| | | | Maturity | Amount | Value• |
| | | Coupon | Date | ($000) | ($000) |
| | Province of Manitoba | 2.100% | 9/6/22 | 1,900 | 1,952 |
| | Province of New Brunswick | 2.750% | 6/15/18 | 1,145 | 1,178 |
| | Province of Ontario | 1.100% | 10/25/17 | 11,625 | 11,646 |
| | Province of Ontario | 1.200% | 2/14/18 | 2,275 | 2,279 |
| | Province of Ontario | 3.000% | 7/16/18 | 11,926 | 12,309 |
| | Province of Ontario | 1.625% | 1/18/19 | 42,130 | 42,494 |
| | Province of Ontario | 4.000% | 10/7/19 | 5,475 | 5,903 |
| | Province of Ontario | 4.400% | 4/14/20 | 3,175 | 3,496 |
| | Province of Ontario | 2.500% | 4/27/26 | 1,135 | 1,173 |
| | Quebec | 3.500% | 7/29/20 | 10,575 | 11,373 |
| | Quebec | 2.750% | 8/25/21 | 9,225 | 9,726 |
| | Quebec | 7.500% | 7/15/23 | 1,335 | 1,762 |
| | Quebec | 7.125% | 2/9/24 | 670 | 879 |
| | Quebec | 7.500% | 9/15/29 | 8,805 | 13,287 |
| 5,9 | Ras Laffan Liquefied Natural Gas Co. Ltd. II | 5.298% | 9/30/20 | 508 | 543 |
| | Republic of Korea | 5.125% | 12/7/16 | 2,275 | 2,292 |
| | Republic of Korea | 7.125% | 4/16/19 | 3,175 | 3,636 |
| 9 | Republic of Lithuania | 7.375% | 2/11/20 | 1,520 | 1,805 |
| | Republic of Lithuania | 7.375% | 2/11/20 | 14,920 | 17,717 |
| | Republic of Lithuania | 6.125% | 3/9/21 | 1,815 | 2,144 |
| | Republic of Poland | 6.375% | 7/15/19 | 15,000 | 16,875 |
| | Republic of Poland | 5.125% | 4/21/21 | 10,205 | 11,532 |
| | Republic of Poland | 5.000% | 3/23/22 | 18,192 | 20,739 |
| 9 | Republic of Slovakia | 4.375% | 5/21/22 | 2,275 | 2,591 |
| 9 | Sinopec Group Overseas Development 2012 Ltd. | 2.750% | 5/17/17 | 1,450 | 1,461 |
| | State of Israel | 5.125% | 3/26/19 | 6,825 | 7,471 |
| | State of Israel | 2.875% | 3/16/26 | 15,265 | 15,838 |
| 9 | State of Qatar | 3.125% | 1/20/17 | 2,275 | 2,281 |
| | Statoil ASA | 5.250% | 4/15/19 | 4,550 | 4,973 |
| | Statoil ASA | 3.150% | 1/23/22 | 7,065 | 7,473 |
| | Statoil ASA | 2.450% | 1/17/23 | 1,825 | 1,856 |
| | Statoil ASA | 3.700% | 3/1/24 | 6,300 | 6,880 |
| 9 | Temasek Financial I Ltd. | 2.375% | 1/23/23 | 1,750 | 1,790 |
| Total Sovereign Bonds (Cost $620,916) | | | | 633,646 |
| Taxable Municipal Bonds (0.1%) | | | | |
| | Florida Hurricane Catastrophe Fund Finance | | | | |
| | Corp. Revenue | 2.995% | 7/1/20 | 2,050 | 2,151 |
| | Louisiana Local Government Environmental | | | | |
| | Facilities & Community Development Authority | | | | |
| | Revenue 2010-EGSL | 3.220% | 2/1/21 | 2,236 | 2,277 |
| | Louisiana Local Government Environmental | | | | |
| | Facilities & Community Development Authority | | | | |
| | Revenue 2010-ELL | 3.450% | 2/1/22 | 1,433 | 1,474 |
| | University of California Revenue | 2.054% | 5/15/18 | 900 | 915 |
| Total Taxable Municipal Bonds (Cost $6,618) | | | | 6,817 |
| |
| | | | | Shares | |
| Temporary Cash Investment (7.4%) | | | | |
| Money Market Fund (7.4%) | | | | |
| 13 | Vanguard Market Liquidity Fund, 0.640% (Cost $727,553) | | 7,274,857 | 727,558 |
| Total Investments (106.3%) (Cost $10,301,137) | | | | 10,440,683 |
64
| |
| Institutional Intermediate-Term Bond Fund | |
| |
| |
| |
| | Market |
| | Value• |
| | ($000) |
| Other Assets and Liabilities (-6.3%) | |
| Other Assets | 761,982 |
| Liabilities | (1,381,851) |
| | (619,869) |
| Net Assets (100%) | |
| Applicable to 412,759,050 outstanding $.001 par value shares of | |
| beneficial interest (unlimited authorization) | 9,820,814 |
| Net Asset Value Per Share | $23.79 |
| |
| | Amount |
| | ($000) |
| Statement of Assets and Liabilities | |
| Assets | |
| Investments in Securities, at Value | |
| Unaffiliated Issuers | 9,713,125 |
| Affiliated Vanguard Funds | 727,558 |
| Total Investments in Securities | 10,440,683 |
| Investment in Vanguard | 724 |
| Receivables for Investment Securities Sold | 722,259 |
| Receivables for Accrued Income | 37,698 |
| Other Assets | 1,301 |
| Total Assets | 11,202,665 |
| Liabilities | |
| Payables for Investment Securities Purchased | 1,376,228 |
| Payables to Vanguard | 909 |
| Other Liabilities | 4,714 |
| Total Liabilities | 1,381,851 |
| Net Assets | 9,820,814 |
65
| |
| Institutional Intermediate-Term Bond Fund | |
| |
| |
| |
| At September 30, 2016, net assets consisted of: | |
| | Amount |
| | ($000) |
| Paid-in Capital | 9,587,787 |
| Undistributed Net Investment Income | 524 |
| Accumulated Net Realized Gains | 92,960 |
| Unrealized Appreciation (Depreciation) | |
| Investment Securities | 139,546 |
| Futures Contracts | (299) |
| Swap Contracts | 296 |
| Net Assets | 9,820,814 |
• See Note A in Notes to Financial Statements.
1 Securities with a value of $1,148,000 have been segregated as initial margin for open cleared swap contracts. 2 Securities with a value of $6,297,000 have been segregated as initial margin for open futures contracts.
3 U.S. government-guaranteed.
4 The issuer operates under a congressional charter; its securities are generally neither guaranteed by the U.S. Treasury nor backed by the full faith and credit of the U.S. government.
5 The average or expected maturity is shorter than the final maturity shown because of the possibility of interim principal payments and prepayments or the possibility of the issue being called.
6 The issuer was placed under federal conservatorship in September 2008; since that time, its daily operations have been managed by the Federal Housing Finance Agency and it receives capital from the U.S. Treasury, as needed to maintain a positive net worth, in exchange for senior preferred stock.
7 Includes securities purchased on a when-issued or delayed-delivery basis for which the fund has not taken delivery as of September 30, 2016.
8 Adjustable-rate security.
9 Security exempt from registration under Rule 144A of the Securities Act of 1933. Such securities may be sold in transactions exempt from registration, normally to qualified institutional buyers. At September 30, 2016, the aggregate value of these securities was $726,567,000, representing 7.4% of net assets.
10 Guaranteed by the Government of Japan. 11 Guaranteed by multiple countries.
12 Guaranteed by the Federal Republic of Germany.
13 Affiliated money market fund available only to Vanguard funds and certain trusts and accounts managed by Vanguard. Rate shown is the 7-day yield.
See accompanying Notes, which are an integral part of the Financial Statements.
66
| |
| Institutional Intermediate-Term Bond Fund | |
| |
| |
| Statement of Operations | |
| |
| | Year Ended |
| | September 30, 2016 |
| | ($000) |
| Investment Income | |
| Income | |
| Interest1 | 175,884 |
| Total Income | 175,884 |
| Expenses | |
| The Vanguard Group—Note B | |
| Investment Advisory Services | 231 |
| Management and Administrative | 1,182 |
| Marketing and Distribution | 152 |
| Custodian Fees | 122 |
| Auditing Fees | 48 |
| Trustees’ Fees and Expenses | 4 |
| Total Expenses | 1,739 |
| Net Investment Income | 174,145 |
| Realized Net Gain (Loss) | |
| Investment Securities Sold1 | 90,055 |
| Futures Contracts | 11,276 |
| Swap Contracts | (1,906) |
| Realized Net Gain (Loss) | 99,425 |
| Change in Unrealized Appreciation (Depreciation) | |
| Investment Securities | 46,441 |
| Futures Contracts | (3,790) |
| Swap Contracts | 1,177 |
| Change in Unrealized Appreciation (Depreciation) | 43,828 |
| Net Increase (Decrease) in Net Assets Resulting from Operations | 317,398 |
1 Interest income and realized net gain (loss) from affiliated companies of the fund were $1,793,000, and ($1,000), respectively.
See accompanying Notes, which are an integral part of the Financial Statements.
67
| | |
| Institutional Intermediate-Term Bond Fund | | |
| |
| |
| Statement of Changes in Net Assets | | |
| |
| | | June 19, |
| | Year Ended | 20151 to |
| | September 30, | September 30, |
| | 2016 | 2015 |
| | ($000) | ($000) |
| Increase (Decrease) in Net Assets | | |
| Operations | | |
| Net Investment Income | 174,145 | 41,979 |
| Realized Net Gain (Loss) | 99,425 | 12,355 |
| Change in Unrealized Appreciation (Depreciation) | 43,828 | 95,715 |
| Net Increase (Decrease) in Net Assets Resulting from Operations | 317,398 | 150,049 |
| Distributions | | |
| Net Investment Income | (174,092) | (42,421) |
| Realized Capital Gain2 | (18,223) | — |
| Total Distributions | (192,315) | (42,421) |
| Capital Share Transactions | | |
| Issued | 1,479,396 | 7,910,8493 |
| Issued in Lieu of Cash Distributions | 192,315 | 42,421 |
| Redeemed | (11,057) | (25,821) |
| Net Increase (Decrease) from Capital Share Transactions | 1,660,654 | 7,927,449 |
| Total Increase (Decrease) | 1,785,737 | 8,035,077 |
| Net Assets | | |
| Beginning of Period | 8,035,077 | — |
| End of Period4 | 9,820,814 | 8,035,077 |
1 Commencement of operations as a registered investment company.
2 Includes fiscal 2016 and 2015 short-term gain distributions totaling $4,126,000 and $0. Short-term gain distributions are treated as ordinary income dividends for tax purposes.
3 Includes shares converted from the net assets of Vanguard Fiduciary Trust Company Intermediate-Term Bond Trust. See Note G in Notes to Financial Statements.
4 Net Assets—End of Period includes undistributed (overdistributed) net investment income of $524,000 and ($105,000).
See accompanying Notes, which are an integral part of the Financial Statements.
68
| | |
| Institutional Intermediate-Term Bond Fund | | |
| |
| |
| Financial Highlights | | |
| |
| | Year | June 19, |
| | Ended | 20151 to |
| | Sept. 30, | Sept. 30, |
| For a Share Outstanding Throughout Each Period | 2016 | 2015 |
| Net Asset Value, Beginning of Period | $23.46 | $23.36 |
| Investment Operations | | |
| Net Investment Income | .473 | .126 |
| Net Realized and Unrealized Gain (Loss) on Investments | .383 | .101 |
| Total from Investment Operations | .856 | .227 |
| Distributions | | |
| Dividends from Net Investment Income | (.473) | (.127) |
| Distributions from Realized Capital Gains | (.053) | — |
| Total Distributions | (.526) | (.127) |
| Net Asset Value, End of Period | $23.79 | $23.46 |
| |
| Total Return | 3.70% | 0.97% |
| |
| Ratios/Supplemental Data | | |
| Net Assets, End of Period (Millions) | $9,821 | $8,035 |
| Ratio of Total Expenses to Average Net Assets | 0.02% | 0.02%2 |
| Ratio of Net Investment Income to Average Net Assets | 2.02% | 1.92%2 |
| Portfolio Turnover Rate3 | 251% | 45% |
1 Commencement of operations as a registered investment company.
| 2 | Annualized. |
| 3 | Includes 67% and 12% attributable to mortgage-dollar-roll activity. |
See accompanying Notes, which are an integral part of the Financial Statements.
69
Institutional Intermediate-Term Bond Fund
Notes to Financial Statements
Vanguard Institutional Intermediate-Term Bond Fund is registered under the Investment Company Act of 1940 as an open-end investment company, or mutual fund. The fund has been established by Vanguard as an investment vehicle for certain collective trusts and other accounts managed by Vanguard or its affiliates, and qualifying education savings plans. The fund is offered to investors who meet certain administrative and service criteria and invest a minimum of $10 million. Certain of the fund’s investments are in corporate debt instruments; the issuers’ abilities to meet their obligations may be affected by economic developments in their respective industries.
A. The following significant accounting policies conform to generally accepted accounting principles for U.S. investment companies. The fund consistently follows such policies in preparing its financial statements.
1. Security Valuation: Securities are valued as of the close of trading on the New York Stock Exchange (generally 4 p.m., Eastern time) on the valuation date. Bonds and temporary cash investments acquired over 60 days to maturity are valued using the latest bid prices or using valuations based on a matrix system (which considers such factors as security prices, yields, maturities, and ratings), both as furnished by independent pricing services. Structured debt securities, including mortgages and asset-backed securities, are valued using the latest bid prices or using valuations based on a matrix system that considers such factors as issuer, tranche, nominal or option-adjusted spreads, weighted average coupon, weighted average maturity, credit enhancements, and collateral. Investments in Vanguard Market Liquidity Fund are valued at that fund’s net asset value. Other temporary cash investments are valued at amortized cost, which approximates market value. Securities for which market quotations are not readily available, or whose values have been affected by events occurring before the fund’s pricing time but after the close of the securities’ primary markets, are valued by methods deemed by the board of trustees to represent fair value.
2. Futures Contracts: The fund uses futures contracts to invest in fixed income asset classes with greater efficiency and lower cost than is possible through direct investment, to add value when these instruments are attractively priced, or to adjust sensitivity to changes in interest rates. The primary risks associated with the use of futures contracts are imperfect correlation between changes in market values of bonds held by the fund and the prices of futures contracts, and the possibility of an illiquid market. Counterparty risk involving futures is mitigated because a regulated clearinghouse is the counterparty instead of the clearing broker. To further mitigate counterparty risk, the fund trades futures contracts on an exchange, monitors the financial strength of its clearing brokers and clearinghouse, and has entered into clearing agreements with its clearing brokers. The clearinghouse imposes initial margin requirements to secure the fund’s performance and requires daily settlement of variation margin representing changes in the market value of each contract.
Futures contracts are valued at their quoted daily settlement prices. The aggregate settlement values of the contracts are not recorded in the Statement of Assets and Liabilities. Fluctuations in the value of the contracts are recorded in the Statement of Assets and Liabilities as an asset (liability) and in the Statement of Operations as unrealized appreciation (depreciation) until the contracts are closed, when they are recorded as realized futures gains (losses).
During the year ended September 30, 2016, the fund’s average investments in long and short futures contracts represented 9% and less than 1% of net assets, respectively, based on the average of aggregate settlement values at each quarter-end during the period.
3. Swap Contracts: The fund invests in credit default swaps to adjust the overall credit risk of the fund or to actively overweight or underweight credit risk to a specific issuer or group of issuers. The fund may sell credit protection through credit default swaps to simulate investments in long positions that are either unavailable or considered to be less attractively priced in the bond market. The fund may purchase credit protection through credit default swaps to reduce credit exposure to a given issuer
70
Institutional Intermediate-Term Bond Fund
or issuers. Under the terms of the swaps, an up-front payment may be exchanged between the seller and buyer. In addition, the seller of the credit protection receives a periodic payment of premium from the buyer that is a fixed percentage applied to a notional amount. If, for example, the reference entity is subject to a credit event (such as bankruptcy, failure to pay, or obligation acceleration) during the term of the swap, the seller agrees to either physically settle or cash settle the swap contract. If the swap is physically settled, the seller agrees to pay the buyer an amount equal to the notional amount and take delivery of a debt instrument of the reference issuer with a par amount equal to such notional amount. If the swap is cash settled, the seller agrees to pay the buyer the difference between the notional amount and the final price for the relevant debt instrument, as determined either in a market auction or pursuant to a pre-agreed-upon valuation procedure.
The fund enters into interest rate swap transactions to adjust the fund’s sensitivity to changes in interest rates and maintain the ability to generate income at prevailing market rates. Under the terms of the swaps, one party pays the other an amount that is a fixed percentage rate applied to a notional amount. In return, the counterparty agrees to pay a floating rate, which is reset periodically based on short-term interest rates, applied to the same notional amount.
The notional amounts of swap contracts are not recorded in the Statement of Assets and Liabilities. Swaps are valued daily based on market quotations received from independent pricing services or recognized dealers and the change in value is recorded in the Statement of Assets and Liabilities as an asset (liability) and in the Statement of Operations as unrealized appreciation (depreciation) until the seller of credit protection is required to take delivery (or, in a cash settled swap, pay the settlement amount determined) upon occurrence of a credit event, periodic payments are made, or the swap terminates, at which time realized gain (loss) is recorded. The net premium to be received or paid by the fund under swap contracts is accrued daily and recorded as realized gain (loss) over the life of the contract.
The primary risk associated with selling credit protection is that, upon the occurrence of a defined credit event, the market value of the debt instrument received by the fund (or, in a cash settled swap, the debt instruments used to determine the settlement payment by the fund) will be significantly less than the amount paid by the fund and, in a physically settled swap, the fund may receive an illiquid debt instrument. A risk associated with all types of swaps is the possibility that a counterparty may default on its obligation to pay net amounts due to the fund. The fund’s maximum amount subject to counterparty risk is the unrealized appreciation on the swap contract. The fund mitigates its counterparty risk by entering into swaps only with a diverse group of prequalified counterparties, monitoring their financial strength, entering into master netting arrangements with its counterpar-ties, and requiring its counterparties to transfer collateral as security for their performance. In the absence of a default, the collateral pledged or received by the fund cannot be repledged, resold or rehypothecated. In the event of a counterparty’s default (including bankruptcy), the fund may terminate any swap contracts with that counterparty, determine the net amount owed by either party in accordance with its master netting arrangements, and sell or retain any collateral held up to the net amount owed to the fund under the master netting arrangements. The swap contracts contain provisions whereby a counterparty may terminate open contracts if the fund’s net assets decline below a certain level, triggering a payment by the fund if the fund is in a net liability position at the time of the termination. The payment amount would be reduced by any collateral the fund has pledged. Any securities pledged as collateral for open contracts are noted in the Statement of Assets and Liabilities. The value of collateral received or pledged is compared daily to the value of the swap contracts exposure with each counterparty, and any difference, if in excess of a specified minimum transfer amount, is adjusted and settled within two business days.
71
Institutional Intermediate-Term Bond Fund
The fund enters into centrally cleared interest rate swaps to achieve the same objectives specified with respect to the equivalent over-the-counter swaps but with less counterparty risk because a regulated clearinghouse is the counterparty instead of the clearing broker or executing broker. The clearinghouse imposes initial margin requirements to secure the fund’s performance, and requires daily settlement of variation margin representing changes in the market value of each contract. To further mitigate counterparty risk, the fund trades with a diverse group of prequalified executing brokers; monitors the financial strength of its clearing brokers, executing brokers, and clearinghouse; and has entered into agreements with its clearing brokers and executing brokers.
During the year ended September 30, 2016, the fund’s average amounts of investments in credit protection sold and credit protection purchased each represented less than 1% of net assets, based on the average of notional amounts at each quarter-end during the period. The average amount of investments in interest rate swaps represented 5% of net assets, based on the average of notional amounts at each quarter-end during the period.
4. To Be Announced (TBA) Transactions: A TBA transaction is an agreement to buy or sell mortgage-backed securities with agreed-upon characteristics (face amount, coupon, maturity) for settlement at a future date. The fund may be a seller of TBA transactions to reduce its exposure to the mortgage-backed securities market or in order to sell mortgage-backed securities it owns under delayed-delivery arrangements. When the fund is a buyer of TBA transactions, it maintains cash or short-term investments in an amount sufficient to meet the purchase price at the settlement date of the TBA transaction. The primary risk associated with TBA transactions is that a counterparty may default on its obligations. The fund mitigates its counterparty risk by, among other things, performing a credit analysis of counterparties, allocating transactions among numerous counterparties, and monitoring its exposure to each counterparty. The fund may also enter into a Master Securities Forward Transaction Agreement (MSFTA) with certain counterparties and require them to transfer collateral as security for their performance. In the absence of a default, the collateral pledged or received by the fund cannot be pledged, resold or rehypothecated. Under an MSFTA, upon a counterparty default (including bankruptcy), the fund may terminate any TBA transactions with that counterparty, determine the net amount owed by either party in accordance with its master netting arrangements, and sell or retain any collateral held up to the net amount owed to the fund under the master netting arrangements.
At September 30, 2016, counterparties had deposited in segregated accounts securities and cash with a value of $1,556,000 in connection with TBA transactions.
5. Mortgage Dollar Rolls: The fund enters into mortgage-dollar-roll transactions, in which the fund sells mortgage-backed securities to a dealer and simultaneously agrees to purchase similar securities in the future at a predetermined price. The proceeds of the securities sold in mortgage-dollar-roll transactions are typically invested in high-quality short-term fixed income securities. The fund forgoes principal and interest paid on the securities sold, and is compensated by interest earned on the proceeds of the sale and by a lower price on the securities to be repurchased. The fund has also entered into mortgage-dollar-roll transactions in which the fund buys mortgage-backed securities from a dealer pursuant to a TBA transaction and simultaneously agrees to sell similar securities in the future at a predetermined price. The securities bought in mortgage-dollar-roll transactions are used to cover an open TBA sell position. The fund continues to earn interest on mortgage-backed security pools already held and receives a lower price on the securities to be sold in the future.
The fund accounts for mortgage-dollar-roll transactions as purchases and sales; as such, these transactions may increase the fund’s portfolio turnover rate. Amounts to be received or paid in connection with open mortgage dollar rolls are included in Receivables for Investment Securities Sold or Payables for Investment Securities Purchased in the Statement of Assets and Liabilities.
72
Institutional Intermediate-Term Bond Fund
6. Federal Income Taxes: The fund intends to continue to qualify as a regulated investment company and distribute all of its taxable income. Management has analyzed the fund’s tax positions taken for all open federal income tax years (September 30, 2015–2016), and has concluded that no provision for federal income tax is required in the fund’s financial statements.
7. Distributions: Distributions to shareholders are recorded on the ex-dividend date.
8. Credit Facility: The fund and certain other funds managed by The Vanguard Group (“Vanguard”) participate in a $3.1 billion committed credit facility provided by a syndicate of lenders pursuant to a credit agreement that may be renewed annually; each fund is individually liable for its borrowings, if any, under the credit facility. Borrowings may be utilized for temporary and emergency purposes, and are subject to the fund’s regulatory and contractual borrowing restrictions. The participating funds are charged administrative fees and an annual commitment fee of 0.10% of the undrawn amount of the facility; these fees are allocated to the funds based on a method approved by the fund’s board of trustees and included in Management and Administrative expenses on the fund’s Statement of Operations. Any borrowings under this facility bear interest at a rate based upon the higher of the one-month London Interbank Offered Rate, federal funds effective rate, or overnight bank funding rate plus an agreed-upon spread.
The fund had no borrowings outstanding at September 30, 2016, or at any time during the period then ended.
9. Other: Interest income includes income distributions received from Vanguard Market Liquidity Fund and is accrued daily. Premiums and discounts on debt securities purchased are amortized and accreted, respectively, to interest income over the lives of the respective securities. Security transactions are accounted for on the date securities are bought or sold. Costs used to determine realized gains (losses) on the sale of investment securities are those of the specific securities sold.
B. In accordance with the terms of a Funds’ Service Agreement (the “FSA”) between Vanguard and the fund, Vanguard furnishes to the fund investment advisory, corporate management, administrative, marketing, and distribution services at Vanguard’s cost of operations (as defined by the FSA). These costs of operations are allocated to the fund based on methods and guidelines approved by the board of trustees. Vanguard does not require reimbursement in the current period for certain costs of operations (such as deferred compensation/benefits and risk/insurance costs); the fund’s liability for these costs of operations is included in Payables to Vanguard on the Statement of Assets and Liabilities.
Upon the request of Vanguard, the fund may invest up to 0.40% of its net assets as capital in Vanguard. At September 30, 2016, the fund had contributed to Vanguard capital in the amount of $724,000, representing 0.01% of the fund’s net assets and 0.29% of Vanguard’s capitalization. The fund’s trustees and officers are also directors and employees, respectively, of Vanguard.
C. Various inputs may be used to determine the value of the fund’s investments. These inputs are summarized in three broad levels for financial statement purposes. The inputs or methodologies used to value securities are not necessarily an indication of the risk associated with investing in those securities.
Level 1—Quoted prices in active markets for identical securities.
Level 2—Other significant observable inputs (including quoted prices for similar securities, interest rates, prepayment speeds, credit risk, etc.).
Level 3—Significant unobservable inputs (including the fund’s own assumptions used to determine the fair value of investments).
73
Institutional Intermediate-Term Bond Fund
The following table summarizes the market value of the fund’s investments as of September 30, 2016, based on the inputs used to value them:
| | | |
| | Level 1 | Level 2 | Level 3 |
| Investments | ($000) | ($000) | ($000) |
| U.S. Government and Agency Obligations | — | 5,684,213 | — |
| Asset-Backed/Commercial Mortgage-Backed Securities | — | 1,341,708 | — |
| Corporate Bonds | — | 2,046,741 | — |
| Sovereign Bonds | — | 633,646 | — |
| Taxable Municipal Bonds | — | 6,817 | — |
| Temporary Cash Investments | 727,558 | — | — |
| Futures Contracts—Assets1 | 303 | — | — |
| Futures Contracts—Liabilities1 | (1,245) | — | — |
| Swap Contracts—Assets | 1141 | 105 | — |
| Swap Contracts—Liabilities | (100)1 | (62) | — |
| Total | 726,630 | 9,713,168 | — |
| 1 Represents variation margin on the last day of the reporting period. | | | |
D. At September 30, 2016, the fair values of derivatives were reflected in the Statement of Assets and Liabilities as follows:
| | | |
| | Interest Rate | Credit | |
| | Contracts | Contracts | Total |
| Statement of Assets and Liabilities Caption | ($000) | ($000) | ($000) |
| Other Assets | 417 | 105 | 522 |
| Liabilities | (1,345) | (62) | (1,407) |
Realized net gain (loss) and the change in unrealized appreciation (depreciation) on derivatives for the year ended September 30, 2016, were:
| | | |
| Interest Rate | Credit | |
| | Contracts | Contracts | Total |
| Realized Net Gain (Loss) on Derivatives | ($000) | ($000) | ($000) |
| Futures Contracts | 11,276 | — | 11,276 |
| Swap Contracts | (3,731) | 1,825 | (1,906) |
| Realized Net Gain (Loss) on Derivatives | 7,545 | 1,825 | 9,370 |
| |
| Change in Unrealized Appreciation (Depreciation) on Derivatives | | | |
| Futures Contracts | (3,790) | — | (3,790) |
| Swap Contracts | 275 | 902 | 1,177 |
| Change in Unrealized Appreciation (Depreciation) on Derivatives | (3,515) | 902 | (2,613) |
74
Institutional Intermediate-Term Bond Fund
At September 30, 2016, the aggregate settlement value of open futures contracts and the related unrealized appreciation (depreciation) were:
| | | | |
| | | | | ($000) |
| | | | Aggregate | |
| | | Number of | Settlement | Unrealized |
| | | Long (Short) | Value | Appreciation |
| Futures Contracts | Expiration | Contracts | Long (Short) | (Depreciation) |
| 2-Year U.S. Treasury Note | December 2016 | 2,808 | 613,460 | 280 |
| 10-Year U.S. Treasury Note | December 2016 | 2,357 | 309,062 | (562) |
| Ultra 10-Year U.S. Treasury Note | December 2016 | (692) | (99,756) | 9 |
| 5-Year U.S. Treasury Note | December 2016 | 114 | 13,853 | (2) |
| Ultra Long U. S. Treasury Bond | December 2016 | (14) | (2,574) | (25) |
| 30-Year U.S. Treasury Bond | December 2016 | 4 | 672 | 1 |
| | | | | (299) |
Unrealized appreciation (depreciation) on open futures contracts is required to be treated as realized gain (loss) for tax purposes.
| | | | | | |
| At September 30, 2016, the fund had the following open swap contracts: | | |
| Over-the-Counter Credit Default Swaps | | | | | |
| | | | | Remaining | | |
| | | | | Up-Front | Periodic | |
| | | | | Premium | Premium | Unrealized |
| | | | Notional | Received | Received | Appreciation |
| | Termination | | Amount | (Paid) | (Paid) | (Depreciation) |
| Reference Entity | Date | Counterparty | ($000) | ($000) | (%) | ($000) |
| Credit Protection Sold/ | | | | | | |
| Moody’s Rating | | | | | | |
| Federation of Malaysia/A3 | 12/20/21 | BARC | 2,322 | 20 | 1.000 | 6 |
| Federation of Malaysia/A3 | 12/20/21 | BNPSW | 7,800 | 99 | 1.000 | 52 |
| Federation of Malaysia/A3 | 12/20/21 | JPMC | 2,700 | 37 | 1.000 | 21 |
| People’s Republic of China/Aa3 | 12/20/21 | BNPSW | 3,000 | 13 | 1.000 | 1 |
| People’s Republic of China/Aa3 | 12/20/21 | BOANA | 5,000 | 15 | 1.000 | (5) |
| People’s Republic of China/Aa3 | 12/20/21 | BOANA | 5,000 | 15 | 1.000 | (4) |
| People’s Republic of China/Aa3 | 12/20/21 | JPMC | 6,400 | 26 | 1.000 | 1 |
| Republic of Chile/Aa3 | 12/20/21 | BARC | 500 | (2) | 1.000 | 1 |
| Republic of Chile/Aa3 | 12/20/21 | BARC | 8,000 | (44) | 1.000 | 5 |
| Republic of Chile/Aa3 | 12/20/21 | BARC | 250 | (1) | 1.000 | 1 |
| Republic of Chile/Aa3 | 12/20/21 | BNPSW | 500 | (6) | 1.000 | (3) |
| Republic of Chile/Aa3 | 12/20/21 | BOANA | 1,250 | (5) | 1.000 | 2 |
| Republic of Chile/Aa3 | 12/20/21 | JPMC | 5,000 | (38) | 1.000 | (7) |
| Republic of Chile/Aa3 | 12/20/21 | JPMC | 7,400 | (30) | 1.000 | 15 |
| | | | 55,122 | | | 86 |
75
| | | | | | |
| Institutional Intermediate-Term Bond Fund | | | | | |
| |
| |
| |
| |
| Over-the-Counter Credit Default Swaps (continued) | | | | |
| | | | | Remaining | | |
| | | | | Up-Front | Periodic | |
| | | | | Premium | Premium | Unrealized |
| | | | Notional | Received | Received | Appreciation |
| | Termination | | Amount | (Paid) | (Paid) | (Depreciation) |
| Reference Entity | Date | Counterparty | ($000) | ($000) | (%) | ($000) |
| Credit Protection Purchased | | | | | | |
| El du Pont de Nemours & Co. | 12/20/20 | JPMC | 4,015 | 82 | (1.000) | (23) |
| Wells Fargo & Co. | 9/20/20 | BOANA | 3,740 | 60 | (1.000) | (20) |
| | | | 7,755 | | | (43) |
| | | | | | | 43 |
The notional amount represents the maximum potential amount the fund could be required to pay as a seller of credit protection if the reference entity was subject to a credit event.
| | | | | | |
| BARC—Barclays Bank plc. | | | | | | |
| BNPSW—BNP Paribas. | | | | | | |
| BOANA—Bank of America, N.A. | | | | | |
| JPMC—JP Morgan Chase Bank. | | | | | |
| |
| Centrally Cleared Interest Rate Swaps | | | | |
| | | | | Fixed | Floating | |
| | | | | Interest Rate | Interest Rate | Unrealized |
| | Future | | Notional | Received | Received | Appreciation |
| | Effective | | Amount | (Paid) | (Paid) | (Depreciation) |
| Termination Date | Date | Clearinghouse | ($000) | (%) | (%) | ($000) |
| 8/15/17 | NA | LCH | 80,000 | 0.981 | (0.524)2 | 211 |
| 12/21/17 | 12/21/161 | CME | 36,018 | (1.000) | 0.0003 | (15) |
| 3/15/18 | NA | CME | 13,000 | 0.899 | (0.524)2 | 31 |
| 12/21/19 | 12/21/161 | CME | 89,679 | 1.250 | (0.000)3 | 167 |
| 12/21/20 | 12/21/161 | CME | 12,169 | 1.250 | (0.000)3 | 37 |
| 2/28/21 | 2/28/171 | LCH | 29,800 | (1.177) | 0.0003 | (22) |
| 12/21/21 | 12/21/161 | CME | 12,236 | (1.500) | 0.0003 | (54) |
| 12/21/23 | 12/21/161 | CME | 14,299 | (1.750) | 0.0003 | (102) |
| | | | | | | 253 |
CME—Chicago Mercantile Exchange. LCH—London Clearing House.
1 Forward interest rate swap. In a forward interest rate swap, the fund and the counterparty agree to make periodic net payments beginning on a specified future effective date.
2 Based on 1-month London Interbank Offered Rate (LIBOR) as of the most recent payment date. 3 Based on 3-month London Interbank Offered Rate (LIBOR) as of the most recent payment date.
E. Distributions are determined on a tax basis and may differ from net investment income and realized capital gains for financial reporting purposes. Differences may be permanent or temporary. Permanent differences are reclassified among capital accounts in the financial statements to reflect their tax character. Temporary differences arise when certain items of income, expense, gain, or loss
76
Institutional Intermediate-Term Bond Fund
are recognized in different periods for financial statement and tax purposes. These differences will reverse at some time in the future. Differences in classification may also result from the treatment of short-term gains as ordinary income for tax purposes.
The fund used a tax accounting practice to treat a portion of the price of capital shares redeemed during the year as distributions from realized capital gains. Accordingly, the fund has reclassified $26,000 from accumulated net realized gains to paid-in capital.
Realized and unrealized gains (losses) on certain of the fund’s swap contracts are treated as ordinary income (loss) for tax purposes; the effect on the fund’s income dividends to shareholders is offset by a change in principal return. Realized gains of $576,000 on swap contracts have been reclassified from accumulated net realized gains to undistributed net investment income.
For tax purposes, at September 30, 2016, the fund had $48,803,000 of ordinary income and $46,476,000 of long-term capital gains available for distribution.
At September 30, 2016, the cost of investment securities for tax purposes was $10,302,413,000. Net unrealized appreciation of investment securities for tax purposes was $138,270,000, consisting of unrealized gains of $146,372,000 on securities that had risen in value since their purchase and $8,102,000 in unrealized losses on securities that had fallen in value since their purchase.
F. During the year ended September 30, 2016, the fund purchased $2,298,299,000 of investment securities and sold $1,575,943,000 of investment securities, other than U.S. government securities and temporary cash investments. Purchases and sales of U.S. government securities were $19,615,293,000 and $19,085,223,000, respectively.
G. On June 19, 2015, the fund acquired all of the net assets of Vanguard Fiduciary Trust Company Intermediate-Term Bond Trust (the “trust”). The trust’s net assets transferred to the fund were $7,659,070,000, including $74,381,000 of unrealized appreciation. These net assets were exchanged on a tax-free basis for 327,868,000 shares of the fund. Immediately following the transfer on June 19, 2015, unitholders of the trust received those 327,868,000 shares of the fund in exchange for their 327,868,000 units of the trust, and the trust ceased operations.
| | |
| H. Capital shares issued and redeemed were: | | |
| | Year Ended | June 19, 20151 to |
| | September 30, 2016 | September 30, 2015 |
| | Shares | Shares |
| | (000) | (000) |
| Issued | 62,521 | 341,833 |
| Issued in Lieu of Cash Distributions | 8,169 | 1,815 |
| Redeemed | (474) | (1,105) |
| Net Increase (Decrease) in Shares Outstanding | 70,216 | 342,543 |
| 1 Commencement of operations as a registered investment company. | | |
I. Management has determined that no material events or transactions occurred subsequent to September 30, 2016, that would require recognition or disclosure in these financial statements.
77
Report of Independent Registered Public Accounting Firm
To the Board of Trustees of Vanguard Malvern Funds and the Shareholders of Vanguard Institutional Short-Term Bond Fund and Vanguard Institutional Intermediate-Term Bond Fund:
In our opinion, the accompanying statements of net assets, statement of assets and liabilities and the related statements of operations and of changes in net assets and the financial highlights present fairly, in all material respects, the financial position of Vanguard Institutional Short-Term Bond Fund and Vanguard Institutional Intermediate-Term Bond Fund (constituting separate portfolios of Vanguard Malvern Funds, hereafter referred to as the “Funds”) at September 30, 2016, and the results of each of their operations, the changes in each of their net assets, and the financial highlights for the periods indicated, in conformity with accounting principles generally accepted in the United States of America. These financial statements and financial highlights (hereafter referred to as “financial statements”) are the responsibility of the Funds’ management. Our responsibility is to express an opinion on these financial statements based on our audits. We conducted our audits of these financial statements in accordance with the standards of the Public Company Accounting Oversight Board (United States). Those standards require that we plan and perform the audit to obtain reasonable assurance about whether the financial statements are free of material misstatement. An audit includes examining, on a test basis, evidence supporting the amounts and disclosures in the financial statements, assessing the accounting principles used and significant estimates made by management, and evaluating the overall financial statement presentation. We believe that our audits, which included confirmation of securities at September 30, 2016 by correspondence with the custodian and brokers and by agreement to the underlying ownership records of the transfer agent, provide a reasonable basis for our opinion.
/s/PricewaterhouseCoopers LLP
Philadelphia, Pennsylvania
November 15, 2016
78
Special 2016 tax information (unaudited) for Vanguard Institutional Short-Term Bond Fund
This information for the fiscal year ended September 30, 2016, is included pursuant to provisions of the Internal Revenue Code.
The fund distributed $45,000 as capital gain dividends (20% rate gain distributions) to shareholders during the fiscal year.
For nonresident alien shareholders, 100% of short-term capital gain dividends distributed by the fund are qualified short-term capital gains.
For nonresident alien shareholders, 63.0% of income dividends are interest-related dividends.
Special 2016 tax information (unaudited) for Vanguard Institutional Intermediate-Term Bond Fund
This information for the fiscal year ended September 30, 2016, is included pursuant to provisions of the Internal Revenue Code.
The fund distributed $14,110,000 as capital gain dividends (20% rate gain distributions) to shareholders during the fiscal year.
For nonresident alien shareholders, 100% of short-term capital gain dividends distributed by the fund are qualified short-term capital gains.
For nonresident alien shareholders, 74.0% of income dividends are interest related dividends.
79
About Your Fund’s Expenses
As a shareholder of the fund, you incur ongoing costs, which include costs for portfolio management, administrative services, and shareholder reports (like this one), among others. Operating expenses, which are deducted from a fund’s gross income, directly reduce the investment return of the fund.
A fund’s expenses are expressed as a percentage of its average net assets. This figure is known as the expense ratio. The following examples are intended to help you understand the ongoing costs (in dollars) of investing in your fund and to compare these costs with those of other mutual funds. The examples are based on an investment of $1,000 made at the beginning of the period shown and held for the entire period.
The accompanying table illustrates your fund’s costs in two ways:
• Based on actual fund return. This section helps you to estimate the actual expenses that you paid over the period. The ”Ending Account Value“ shown is derived from the fund‘s actual return, and the third column shows the dollar amount that would have been paid by an investor who started with $1,000 in the fund. You may use the information here, together with the amount you invested, to estimate the expenses that you paid over the period.
To do so, simply divide your account value by $1,000 (for example, an $8,600 account value divided by $1,000 = 8.6), then multiply the result by the number given for your fund under the heading ”Expenses Paid During Period.“
• Based on hypothetical 5% yearly return. This section is intended to help you compare your fund‘s costs with those of other mutual funds. It assumes that the fund had a yearly return of 5% before expenses, but that the expense ratio is unchanged. In this case—because the return used is not the fund’s actual return—the results do not apply to your investment. The example is useful in making comparisons because the Securities and Exchange Commission requires all mutual funds to calculate expenses based on a 5% return. You can assess your fund’s costs by comparing this hypothetical example with the hypothetical examples that appear in shareholder reports of other funds.
Note that the expenses shown in the table are meant to highlight and help you compare ongoing costs only and do not reflect transaction costs incurred by the fund for buying and selling securities. Further, the expenses do not include any purchase, redemption, or account service fees described in the fund prospectus. If such fees were applied to your account, your costs would be higher. Your fund does not carry a “sales load.”
The calculations assume no shares were bought or sold during the period. Your actual costs may have been higher or lower, depending on the amount of your investment and the timing of any purchases or redemptions.
You can find more information about the fund’s expenses, including annual expense ratios, in the Financial Statements section of this report. For additional information on operating expenses and other shareholder costs, please refer to your fund’s current prospectus.
80
| | | |
| Six Months Ended September 30, 2016 | | | |
| | Beginning | Ending | Expenses |
| | Account Value | Account Value | Paid During |
| | 3/31/2016 | 9/30/2016 | Period |
| Based on Actual Fund Return | | | |
| Institutional Short-Term Bond Fund | | | |
| Institutional Plus Shares | $1,000.00 | $1,009.81 | $0.10 |
| Institutional Intermediate-Term Bond Fund | | | |
| Institutional Plus Shares | $1,000.00 | $1,017.69 | $0.10 |
| Based on Hypothetical 5% Yearly Return | | | |
| Institutional Short-Term Bond Fund | | | |
| Institutional Plus Shares | $1,000.00 | $1,024.90 | $0.10 |
| Institutional Intermediate-Term Bond Fund | | | |
| Institutional Plus Shares | $1,000.00 | $1,024.90 | $0.10 |
The calculations are based on expenses incurred in the most recent six-month period. The funds’ annualized six-month expense ratios for that period are: for the Institutional Short-Term Bond Fund Institutional Plus Shares, 0.02%; and for the Institutional Intermediate-Term Bond Fund Institutional Plus Shares, 0.02%. The dollar amounts shown as “Expenses Paid” are equal to the annualized expense ratio multiplied by the average account value over the period, multiplied by the number of days in the most recent six-month period, then divided by the number of days in the most recent 12-month period (183/366).
81
Glossary
30-Day SEC Yield. A fund’s 30-day SEC yield is derived using a formula specified by the U.S. Securities and Exchange Commission. Under the formula, data related to the fund’s security holdings in the previous 30 days are used to calculate the fund’s hypothetical net income for that period, which is then annualized and divided by the fund’s estimated average net assets over the calculation period. For the purposes of this calculation, a security’s income is based on its current market yield to maturity (for bonds), its actual income (for asset-backed securities), or its projected dividend yield (for stocks). Because the SEC yield represents hypothetical annualized income, it will differ—at times significantly—from the fund’s actual experience. As a result, the fund’s income distributions may be higher or lower than implied by the SEC yield.
Average Coupon. The average interest rate paid on the fixed income securities held by a fund. It is expressed as a percentage of face value.
Average Duration. An estimate of how much the value of the bonds held by a fund will fluctuate in response to a change in interest rates. To see how the value could change, multiply the average duration by the change in rates. If interest rates rise by 1 percentage point, the value of the bonds in a fund with an average duration of five years would decline by about 5%. If rates decrease by a percentage point, the value would rise by 5%.
Average Effective Maturity. The average length of time until fixed income securities held by a fund reach maturity and are repaid, taking into consideration the possibility that the issuer may call the bond before its maturity date. The figure reflects the proportion of fund assets represented by each security; it also reflects any futures contracts held. In general, the longer the average effective maturity, the more a fund’s share price will fluctuate in response to changes in market interest rates.
Beta. A measure of the magnitude of a fund’s past share-price fluctuations in relation to the ups and downs of a given market index. The index is assigned a beta of 1.00. Compared with a given index, a fund with a beta of 1.20 typically would have seen its share price rise or fall by 12% when the index rose or fell by 10%. For this report, beta is based on returns over the past 36 months for both the fund and the index. Note that a fund’s beta should be reviewed in conjunction with its R-squared (see definition). The lower the R-squared, the less correlation there is between the fund and the index, and the less reliable beta is as an indicator of volatility.
Credit Quality. Credit-quality ratings are measured on a scale that generally ranges from AAA (highest) to D (lowest). U.S. Treasury, U.S. Agency, and U.S. Agency mortgage-backed securities appear under “U.S. Government.” Credit-quality ratings are obtained from Moody’s and S&P, and the higher rating for each issue is shown. ”Not Rated” is used to classify securities for which a rating is not available. Not rated securities include a fund’s investment in Vanguard Market Liquidity Fund or Vanguard Municipal Cash Management Fund, each of which invests in high-quality money market instruments and may serve as a cash management vehicle for the Vanguard funds, trusts, and accounts.
Expense Ratio. A fund’s total annual operating expenses expressed as a percentage of the fund’s average net assets. The expense ratio includes management and administrative expenses, but does not include the transaction costs of buying and selling portfolio securities.
82
Inception Date. The date on which the assets of a fund (or one of its share classes) are first invested in accordance with the fund’s investment objective. For funds with a subscription period, the inception date is the day after that period ends. Investment performance is measured from the inception date.
R-Squared. A measure of how much of a fund’s past returns can be explained by the returns from the market in general, as measured by a given index. If a fund’s total returns were precisely synchronized with an index’s returns, its R-squared would be 1.00. If the fund’s returns bore no relationship to the index’s returns, its R-squared would be 0. For this report, R-squared is based on returns over the past 36 months for both the fund and the index.
Short-Term Reserves. The percentage of a fund invested in highly liquid, short-term securities that can be readily converted to cash.
Yield to Maturity. The rate of return an investor would receive if the fixed income securities held by a fund were held to their maturity dates.
Benchmark Information
Spliced Bloomberg Barclays U.S. Aggregate Float Adjusted Index: Bloomberg Barclays U.S. Aggregate Bond Index through December 31, 2009; Bloomberg Barclays U.S. Aggregate Float Adjusted Index thereafter.
83
The People Who Govern Your Fund
The trustees of your mutual fund are there to see that the fund is operated and managed in your best interests since, as a shareholder, you are a part owner of the fund. Your fund’s trustees also serve on the board of directors of The Vanguard Group, Inc., which is owned by the Vanguard funds and provides services to them on an at-cost basis.
A majority of Vanguard’s board members are independent, meaning that they have no affiliation with Vanguard or the funds they oversee, apart from the sizable personal investments they have made as private individuals. The independent board members have distinguished backgrounds in business, academia, and public service. Each of the trustees and executive officers oversees 198 Vanguard funds.
The following table provides information for each trustee and executive officer of the fund. The mailing address of the trustees and officers is P.O. Box 876, Valley Forge, PA 19482. More information about the trustees is in the Statement of Additional Information, which can be obtained, without charge, by contacting Vanguard at 800-662-7447, or online at vanguard.com.
InterestedTrustee1
F. William McNabb III
Born 1957. Trustee Since July 2009. Chairman of the Board. Principal Occupation(s) During the Past Five Years and Other Experience: Chairman of the Board of The Vanguard Group, Inc., and of each of the investment companies served by The Vanguard Group, since January 2010; Director of The Vanguard Group since 2008; Chief Executive Officer and President of The Vanguard Group, and of each of the investment companies served by The Vanguard Group, since 2008; Director of Vanguard Marketing Corporation; Managing Director of The Vanguard Group (1995–2008).
IndependentTrustees
Emerson U. Fullwood
Born 1948. Trustee Since January 2008. Principal Occupation(s) During the Past Five Years and Other Experience: Executive Chief Staff and Marketing Officer for North America and Corporate Vice President (retired 2008) of Xerox Corporation (document management products and services); Executive in Residence and 2009–2010 Distinguished Minett Professor at the Rochester Institute of Technology; Lead Director of SPX FLOW, Inc. (multi-industry manufacturing); Director of the United Way of Rochester, the University of Rochester Medical Center, Monroe Community College Foundation, North Carolina A&T University, and Roberts Wesleyan College.
Rajiv L. Gupta
Born 1945. Trustee Since December 2001.2 Principal Occupation(s) During the Past Five Years and Other Experience: Chairman and Chief Executive Officer (retired 2009) and President (2006–2008) of Rohm and Haas Co. (chemicals); Director of Tyco International plc (diversified manufacturing and services), HP Inc. (printer and personal computer manufacturing), and Delphi Automotive plc (automotive components); Senior Advisor at New Mountain Capital.
Amy Gutmann
Born 1949. Trustee Since June 2006. Principal Occupation(s) During the Past Five Years and Other Experience: President of the University of Pennsylvania; Christopher H. Browne Distinguished Professor of Political Science, School of Arts and Sciences, and Professor of Communication, Annenberg School for Communication, with secondary faculty appointments in the Department of Philosophy, School of Arts and Sciences, and at the Graduate School of Education, University of Pennsylvania; Trustee of the National Constitution Center; Chair of the Presidential Commission for the Study of Bioethical Issues.
JoAnn Heffernan Heisen
Born 1950. Trustee Since July 1998. Principal Occupation(s) During the Past Five Years and Other Experience: Corporate Vice President and Chief Global Diversity Officer (retired 2008) and Member of the Executive Committee (1997–2008) of Johnson & Johnson (pharmaceuticals/medical devices/consumer products); Director of Skytop Lodge Corporation (hotels) and the Robert Wood Johnson Foundation; Member of the Advisory Board of the Institute for Women’s Leadership at Rutgers University.
F. Joseph Loughrey
Born 1949. Trustee Since October 2009. Principal Occupation(s) During the Past Five Years and Other Experience: President and Chief Operating Officer (retired 2009) of Cummins Inc. (industrial machinery); Chairman of the Board of Hillenbrand, Inc. (specialized consumer services), and of Oxfam America; Director of SKF AB (industrial machinery), Hyster-Yale Materials Handling, Inc. (forklift trucks), the Lumina Foundation for Education, and the V Foundation for Cancer Research; Member of the Advisory Council for the College of Arts and Letters and of the Advisory Board to the Kellogg Institute for International Studies, both at the University of Notre Dame.
Mark Loughridge
Born 1953. Trustee Since March 2012. Principal Occupation(s) During the Past Five Years and Other Experience: Senior Vice President and Chief Financial Officer (retired 2013) at IBM (information technology services); Fiduciary Member of IBM’s Retirement Plan Committee (2004–2013); Director of the Dow Chemical Company; Member of the Council on Chicago Booth.
Scott C. Malpass
Born 1962. Trustee Since March 2012. Principal Occupation(s) During the Past Five Years and Other Experience: Chief Investment Officer and Vice President at the University of Notre Dame; Assistant Professor of Finance at the Mendoza College of Business at Notre Dame; Member of the Notre Dame 403(b) Investment Committee, the Board of Advisors for Spruceview Capital Partners, and the Investment Advisory Committee of Major League Baseball; Board Member of TIFF Advisory Services, Inc., and Catholic Investment Services, Inc. (investment advisors).
André F. Perold
Born 1952. Trustee Since December 2004. Principal Occupation(s) During the Past Five Years and Other Experience: George Gund Professor of Finance and Banking, Emeritus at the Harvard Business School (retired 2011); Chief Investment Officer and Managing Partner of HighVista Strategies LLC (private investment firm); Director of Rand Merchant Bank; Overseer of the Museum of Fine Arts Boston.
Peter F. Volanakis
Born 1955. Trustee Since July 2009. Principal Occupation(s) During the Past Five Years and Other Experience: President and Chief Operating Officer (retired 2010) of Corning Incorporated (communications equipment); Chairman of the Board of Trustees of Colby-Sawyer College; Member of the Advisory Board of the Norris Cotton Cancer Center.
Executive Officers
Glenn Booraem
Born 1967. Treasurer Since May 2015. Principal Occupation(s) During the Past Five Years and Other Experience: Principal of The Vanguard Group, Inc.; Treasurer of each of the investment companies served by The Vanguard Group; Controller of each of the investment companies served by The Vanguard Group (2010–2015); Assistant Controller of each of the investment companies served by The Vanguard Group (2001–2010).
Thomas J. Higgins
Born 1957. Chief Financial Officer Since September 2008. Principal Occupation(s) During the Past Five Years and Other Experience: Principal of The Vanguard Group, Inc.; Chief Financial Officer of each of the investment companies served by The Vanguard Group; Treasurer of each of the investment companies served by The Vanguard Group (1998–2008).
Peter Mahoney
Born 1974. Controller Since May 2015. Principal Occupation(s) During the Past Five Years and Other Experience: Head of Global Fund Accounting at The Vanguard Group, Inc.; Controller of each of the investment companies served by The Vanguard Group; Head of International Fund Services at The Vanguard Group (2008–2014).
Anne E. Robinson
Born 1970. Secretary Since September 2016. Principal Occupation(s) During the Past Five Years and Other Experience: Managing Director of The Vanguard Group, Inc.; General Counsel of The Vanguard Group; Secretary of The Vanguard Group and of each of the investment companies served by The Vanguard Group; Director and Senior Vice President of Vanguard Marketing Corporation; Managing Director and General Counsel of Global Cards and Consumer Services at Citigroup (2014–2016); Counsel at American Express (2003–2014).
Vanguard Senior Management Team
| |
Mortimer J. Buckley Kathleen C. Gubanich Martha G. King John T. Marcante Chris D. McIsaac | James M. Norris Thomas M. Rampulla Glenn W. Reed Karin A. Risi Michael Rollings |
Chairman Emeritus and Senior Advisor John J. Brennan
Chairman, 1996–2009
Chief Executive Officer and President, 1996–2008
Founder
John C. Bogle
Chairman and Chief Executive Officer, 1974–1996
1 Mr. McNabb is considered an “interested person,” as defined in the Investment Company Act of 1940, because he is an officer of the Vanguard funds.
2 December 2002 for Vanguard Equity Income Fund, the Vanguard Municipal Bond Funds, and the Vanguard State Tax-Exempt Funds.
 |
| P.O. Box 2600 |
| Valley Forge, PA 19482-2600 |
Connect with Vanguard® > vanguard.com
| |
| Fund Information > 800-662-7447 | |
| Direct Investor Account Services > 800-662-2739 | |
| Institutional Investor Services > 800-523-1036 | |
| Text Telephone for People | |
| Who Are Deaf or Hard of Hearing> 800-749-7273 | |
| |
| This material may be used in conjunction | |
| with the offering of shares of any Vanguard | |
| fund only if preceded or accompanied by | |
| the fund’s current prospectus. | |
| |
| All comparative mutual fund data are from Lipper, a | |
| Thomson Reuters Company, or Morningstar, Inc., unless | |
| otherwise noted. | |
| |
| You can obtain a free copy of Vanguard’s proxy voting | |
| guidelines by visiting vanguard.com/proxyreporting or by | |
| calling Vanguard at 800-662-2739. The guidelines are | |
| also available from the SEC’s website, sec.gov. In | |
| addition, you may obtain a free report on how your fund | |
| voted the proxies for securities it owned during the 12 | |
| months ended June 30. To get the report, visit either | |
| vanguard.com/proxyreporting or sec.gov. | |
| |
| You can review and copy information about your fund at | |
| the SEC’s Public Reference Room in Washington, D.C. To | |
| find out more about this public service, call the SEC at | |
| 202-551-8090. Information about your fund is also | |
| available on the SEC’s website, and you can receive | |
| copies of this information, for a fee, by sending a | |
| request in either of two ways: via email addressed to | |
| publicinfo@sec.gov or via regular mail addressed to the | |
| Public Reference Section, Securities and Exchange | |
| Commission, Washington, DC 20549-1520. | |
| |
| | © 2016 The Vanguard Group, Inc. |
| | All rights reserved. |
| | Vanguard Marketing Corporation, Distributor. |
| |
| | Q4720 112016 |
Item 2: Code of Ethics. The Registrant has adopted a code of ethics that applies to the Registrant’s principal executive officer, principal financial officer, principal accounting officer or controller or persons performing similar functions. The Code of Ethics was amended during the reporting period covered by this report to make certain technical, non-material changes.
Item 3: Audit Committee Financial Expert. All members of the Audit Committee have been determined by the Registrant’s Board of Trustees to be Audit Committee Financial Experts and to be independent: Rajiv L. Gupta, JoAnn Heffernan Heisen, F. Joseph Loughrey, Mark Loughridge, and Peter F. Volanakis.
Item 4: Principal Accountant Fees and Services.
(a) Audit Fees.
Audit Fees of the Registrant
Fiscal Year Ended September 30, 2016: $295,000
Fiscal Year Ended September 30, 2015: $190,000
Aggregate Audit Fees of Registered Investment Companies in the Vanguard Group.
Fiscal Year Ended September 30, 2016: $9,629,849
Fiscal Year Ended September 30, 2015: $7,000,200
Includes fees billed in connection with audits of the Registrant, other registered investment companies in the Vanguard complex, The Vanguard Group, Inc. and Vanguard Marketing Corporation.
(b) Audit-Related Fees.
Fiscal Year Ended September 30, 2016: $2,717,627
Fiscal Year Ended September 30, 2015: $2,899,096
Includes fees billed in connection with assurance and related services provided to the Registrant, other registered investment companies in the Vanguard complex, The Vanguard Group, Inc., and Vanguard Marketing Corporation.
(c) Tax Fees.
Fiscal Year Ended September 30, 2016: $254,050
Fiscal Year Ended September 30, 2015: $353,389
Includes fees billed in connection with tax compliance, planning, and advice services provided to the Registrant, other registered investment companies in the Vanguard complex, The Vanguard Group, Inc., and Vanguard Marketing Corporation.
(d) All Other Fees.
Fiscal Year Ended September 30, 2016: $214,225
Fiscal Year Ended September 30, 2015: $202,313
Includes fees billed for services related to tax reported information provided to the Registrant, other registered investment companies in the Vanguard complex, The Vanguard Group, Inc., and Vanguard Marketing Corporation.
(e) (1) Pre-Approval Policies. The policy of the Registrant’s Audit Committee is to consider and, if appropriate, approve before the principal accountant is engaged for such services, all specific audit and non-audit services provided to: the Registrant, other registered investment companies in the Vanguard complex, The Vanguard Group, Inc., and entities controlled by The Vanguard Group, Inc. that provide ongoing services to the Registrant. In making a determination, the Audit Committee considers whether the services are consistent with maintaining the principal accountant’s independence.
In the event of a contingency situation in which the principal accountant is needed to provide services in between scheduled Audit Committee meetings, the Chairman of the Audit Committee would be called on to consider and, if appropriate, pre-approve audit or permitted non-audit services in an amount sufficient to complete services through the next Audit Committee meeting, and to determine if such services would be consistent with maintaining the accountant’s independence. At the next scheduled Audit Committee meeting, services and fees would be presented to the Audit Committee for formal consideration, and, if appropriate, approval by the entire Audit Committee. The Audit Committee would again consider whether such services and fees are consistent with maintaining the principal accountant’s independence.
The Registrant’s Audit Committee is informed at least annually of all audit and non-audit services provided by the principal accountant to the Vanguard complex, whether such services are provided to: the Registrant, other registered investment companies in the Vanguard complex, The Vanguard Group, Inc., or other entities controlled by The Vanguard Group, Inc. that provide ongoing services to the Registrant.
(2) No percentage of the principal accountant’s fees or services were approved pursuant to the waiver provision of paragraph (c)(7)(i)(C) of Rule 2-01 of Regulation S-X.
(f) For the most recent fiscal year, over 50% of the hours worked under the principal accountant’s engagement were not performed by persons other than full-time, permanent employees of the principal accountant.
(g) Aggregate Non-Audit Fees.
Fiscal Year Ended September 30, 2016: $468,275
Fiscal Year Ended September 30, 2015: $555,702
Includes fees billed for non-audit services provided to the Registrant, other registered investment companies in the Vanguard complex, The Vanguard Group, Inc., and Vanguard Marketing Corporation.
(h) For the most recent fiscal year, the Audit Committee has determined that the provision of all non-audit services was consistent with maintaining the principal accountant’s independence.
Item 5: Audit Committee of Listed Registrants.
The Registrant is a listed issuer as defined in rule 10A-3 under the Securities Exchange Act of 1934 (“Exchange Act”). The Registrant has a separately-designated standing audit committee established in accordance with Section 3(a)(58)(A) of the Exchange Act. The Registrant’s audit committee members are: Emerson U. Fullwood, Rajiv L. Gupta, Amy Gutmann, JoAnn Heffernan Heisen, F. Joseph Loughrey, Mark Loughridge, Scott C. Malpass, André F. Perold, and Peter F. Volanakis.
Item 6: Investments.
Not Applicable.
Item 7: Disclosure of Proxy Voting Policies and Procedures for Closed-End Management Investment Companies.
Not Applicable.
Item 8: Portfolio Managers of Closed-End Management Investment Companies.
Not Applicable.
Item 9: Purchase of Equity Securities by Closed-End Management Investment Company and Affiliated Purchasers.
Not Applicable.
Item 10: Submission of Matters to a Vote of Security Holders.
Not Applicable.
Item 11: Controls and Procedures.
(a) Disclosure Controls and Procedures. The Principal Executive and Financial Officers concluded that the Registrant’s Disclosure Controls and Procedures are effective based on their evaluation of the Disclosure Controls and Procedures as of a date within 90 days of the filing date of this report.
(b) Internal Control Over Financial Reporting. There were no significant changes in Registrant’s Internal Control Over Financial Reporting or in other factors that could significantly affect this control subsequent to the date of the evaluation, including any corrective actions with regard to significant deficiencies and material weaknesses.
Item 12: Exhibits.
(a) Code of Ethics.
(b) Certifications.
Pursuant to the requirements of the Securities Exchange Act of 1934 and the Investment Company Act of 1940, the registrant has duly caused this report to be signed on its behalf by the undersigned, thereunto duly authorized.
| |
| | VANGUARD MALVERN FUNDS |
| |
| By: | /s/ F. WILLIAM MCNABB III* |
| | F. WILLIAM MCNABB III |
| | CHIEF EXECUTIVE OFFICER |
| |
| Date: November 17, 2016 |
Pursuant to the requirements of the Securities Exchange Act of 1934 and the Investment Company Act of 1940, this report has been signed below by the following persons on behalf of the registrant and in the capacities and on the dates indicated.
| |
| | VANGUARD MALVERN FUNDS |
| |
| By: | /s/ F. WILLIAM MCNABB III* |
| | F. WILLIAM MCNABB III |
| | CHIEF EXECUTIVE OFFICER |
| |
| Date: November 17, 2016 |
| |
| | VANGUARD MALVERN FUNDS |
| |
| By: | /s/ THOMAS J. HIGGINS* |
| | THOMAS J. HIGGINS |
| | CHIEF FINANCIAL OFFICER |
| |
| Date: November 17, 2016 |
* By: /s/ Anne E. Robinson
Anne E. Robinson, pursuant to a Power of Attorney filed on October 4, 2016 see file Number 33-32548, Incorporated by Reference.