UNITED STATES
SECURITIES AND EXCHANGE COMMISSION
Washington, D.C. 20549
FORM N-CSR
CERTIFIED SHAREHOLDER REPORT
OF
REGISTERED MANAGEMENT INVESTMENT COMPANIES
Investment Company Act file number: 811-05628
| |
| Name of Registrant: | Vanguard Malvern Funds |
| Address of Registrant: | P.O. Box 2600 |
| | Valley Forge, PA 19482 |
| |
| Name and address of agent for service: | Anne E. Robinson, Esquire |
| | P.O. Box 876 |
| | Valley Forge, PA 19482 |
Registrant’s telephone number, including area code: (610) 669-1000
Date of fiscal year end: September 30
Date of reporting period: October 1, 2017 – September 30, 2018
Item 1: Reports to Shareholders

Annual Report | September 30, 2018
Vanguard U.S. Value Fund
Vanguard’s Principles for Investing Success
We want to give you the best chance of investment success. These principles, grounded in Vanguard’s research and experience, can put you on the right path.
Goals. Create clear, appropriate investment goals.
Balance. Develop a suitable asset allocation using broadly diversified funds. Cost. Minimize cost.
Discipline. Maintain perspective and long-term discipline.
A single theme unites these principles: Focus on the things you can control.
We believe there is no wiser course for any investor.
| |
| Contents | |
| Your Fund’s Performance at a Glance. | 1 |
| CEO’s Perspective. | 3 |
| Advisor’s Report. | 5 |
| Fund Profile. | 7 |
| Performance Summary. | 8 |
| Financial Statements. | 10 |
| Your Fund’s After-Tax Returns. | 24 |
| About Your Fund’s Expenses. | 25 |
| Glossary. | 27 |
Please note: The opinions expressed in this report are just that—informed opinions. They should not be considered promises or advice. Also, please keep in mind that the information and opinions cover the period through the date on the front of this report. Of course, the risks of investing in your fund are spelled out in the prospectus.
See the Glossary for definitions of investment terms used in this report.
Your Fund’s Performance at a Glance
• Vanguard U.S. Value Fund returned more than 10% for the 12 months ended September 30, 2018, a bit ahead of both its benchmark index and the average return of its peer group.
• The broad U.S. stock market returned more than 17% as corporate earnings remained strong and the U.S. economy continued to show signs of growth. Stocks endured a stretch of volatility in the first quarter of 2018 before rebounding.
• Growth stocks outperformed their value brethren, and large- and small-capitalization stocks generally surpassed mid-caps.
• Your fund’s stock selection model generated broad-based performance. The model focuses on five signals that rank a universe of stocks. Four of those signals—valuation, growth, sentiment, and management decisions—contributed to relative performance.
• Energy, health care, and information technology stocks contributed most to relative returns, while consumer staples, telecommunication services, and real estate stocks detracted most.
| |
| Total Returns: Fiscal Year Ended September 30, 2018 | |
| | Total |
| | Returns |
| Vanguard U.S. Value Fund | 10.22% |
| Russell 3000 Value Index | 9.46 |
| Multi-Cap Value Funds Average | 9.60 |
| Multi-Cap Value Funds Average: Derived from data provided by Lipper, a Thomson Reuters Company. | |
| |
| |
| Total Returns: Ten Years Ended September 30, 2018 | |
| | Average |
| | Annual Return |
| U.S. Value Fund | 10.09% |
| Russell 3000 Value Index | 9.76 |
| Multi-Cap Value Funds Average | 9.49 |
| Multi-Cap Value Funds Average: Derived from data provided by Lipper, a Thomson Reuters Company. | |
The figures shown represent past performance, which is not a guarantee of future results. (Current performance may be lower or higher than the performance data cited. For performance data current to the most recent month-end, visit our website at vanguard.com/performance.) Note, too, that both investment returns and principal value can fluctuate widely, so an investor’s shares, when sold, could be worth more or less than their original cost.
1
| | |
| Expense Ratios | | |
| Your Fund Compared With Its Peer Group | | |
| | | Peer Group |
| | Fund | Average |
| U.S. Value Fund | 0.23% | 1.06% |
The fund expense ratio shown is from the prospectus dated January 26, 2018, and represents estimated costs for the current fiscal year. For the fiscal year ended September 30, 2018, the fund’s expense ratio was 0.22%. The peer-group expense ratio is derived from data provided by Lipper, a Thomson Reuters Company, and captures information through year-end 2017.
Peer group: Multi-Cap Value Funds.
2
CEO’s Perspective

Tim Buckley
President and Chief Executive Officer
Dear Shareholder,
Over the years, I’ve found that prudent investors exhibit a common trait: discipline. No matter how the markets move or what new investing fad hits the headlines, those who stay focused on their goals and tune out the noise are set up for long-term success.
The prime gateway to investing is saving, and you don’t usually become a saver without a healthy dose of discipline. Savers make the decision to sock away part of their income, which means spending less and delaying gratification, no matter how difficult that may be.
Of course, disciplined investing extends beyond diligent saving. The financial markets, in the short term especially, are unpredictable; I have yet to meet the investor who can time them perfectly. It takes discipline to resist the urge to go all-in when markets are frothy or to retreat when things look bleak.
Staying put with your investments is one strategy for handling volatility. Another, rebalancing, requires even more discipline because it means steering your money away from strong performers and toward poorer performers.
Patience—a form of discipline—is also the friend of long-term investors. Higher returns are the potential reward for weathering the market’s turbulence and uncertainty.
3
We have been enjoying one of the longest bull markets in history, but it won’t continue forever. Prepare yourself now for how you will react when volatility comes back. Don’t panic. Don’t chase returns or look for answers outside the asset classes you trust. And be sure to rebalance periodically, even when there’s turmoil.
Whether you’re a master of self-control, get a boost from technology, or work with a professional advisor, know that discipline
is necessary to get the most out of your investment portfolio. And know that Vanguard is with you for the entire ride.
Thank you for your continued loyalty.

Mortimer J. Buckley
President and Chief Executive Officer
October 18, 2018
| | | |
| Market Barometer | | | |
| | | Average Annual Total Returns |
| | Periods Ended September 30, 2018 |
| | One Year | Three Years | Five Years |
| Stocks | | | |
| Russell 1000 Index (Large-caps) | 17.76% | 17.07% | 13.67% |
| Russell 2000 Index (Small-caps) | 15.24 | 17.12 | 11.07 |
| Russell 3000 Index (Broad U.S. market) | 17.58 | 17.07 | 13.46 |
| FTSE All-World ex US Index (International) | 2.13 | 10.18 | 4.51 |
| |
| Bonds | | | |
| Bloomberg Barclays U.S. Aggregate Bond Index | | | |
| (Broad taxable market) | -1.22% | 1.31% | 2.16% |
| Bloomberg Barclays Municipal Bond Index | | | |
| (Broad tax-exempt market) | 0.35 | 2.24 | 3.54 |
| FTSE Three-Month U. S. Treasury Bill Index | 1.57 | 0.80 | 0.48 |
| |
| CPI | | | |
| Consumer Price Index | 2.28% | 1.99% | 1.52% |
4
Advisor’s Report
For the 12 months ended September 30, 2018, Vanguard U.S. Value Fund returned more than 10%, ahead of its benchmark index, the Russell 3000 Value Index, which returned over 9%. It also slightly outperformed the average return of its peer group.
Investment environment
United States gross domestic product (GDP) grew at annual rate of 4.2% in the second quarter of 2018, powered by a rebound in consumer spending, exports, and business investment. The unemployment rate declined to 3.7% in September, and total nonfarm payroll employment increased by 134,000. Job gains occurred in professional and business services, in health care, and in transportation and warehousing.
In its September meeting, the Federal Reserve increased interest rates by 25 basis points to a target range of 2.00% to 2.25%. Along with the rate increase, the Fed projected one more hike before the end of the year and three in 2019. In June, the European Central Bank (ECB) announced plans to end bond purchases at the end of the year and keep interest rates at record low levels at least through the summer of 2019. The ECB also confirmed it will halve bond purchases to 15 billion euros ($17.4 billion) per month in the fourth quarter.
Over the period, the broad U.S. equity market, as measured by the Russell 3000 Index, returned more than 17%. U.S. stock market performance was broad-based; most market sectors advanced, led by
information technology, consumer discretionary, and health care. Growth stocks outperformed their value counterparts, small- and large-capitalization stocks outpaced small-caps, and U.S. stocks outpaced their international brethren. Developed Pacific markets surpassed emerging markets and developed European markets.
Investment objective and strategy
Although it’s important to understand how overall performance is affected by the macroeconomic factors we’ve described, our strategy focuses on company-specific fundamentals—not technical analysis. Our stock selection model evaluates companies within our investment universe to identify those with attractive characteristics that we believe will outperform over the long run.
To do this, we use a strict quantitative process that focuses on a combination of five key themes: high quality—healthy balance sheets and consistent cash-flow generation; effective use of capital by management—sound investment policies that favor internal over external funding; consistent earnings growth—a demonstrated ability to grow earnings year after year; strong market sentiment—market confirmation of our view; and reasonable valuation—avoidance of overpriced stocks.
The interaction of these themes generates an opinion on all the stocks in our universe each day. Using the results of our model, we then construct our portfolio with the
5
goal of maximizing expected return, while minimizing exposure to risks that our research indicates do not improve returns, such as industry selection and other risks relative to our benchmark.
Our successes and failures
The fund’s outperformance was driven by our sentiment and growth signals. The valuation and management decisions signals contributed to a lesser degree, while our quality signal detracted significantly.
Results exceeded or equaled the benchmark in almost all sectors. The top relative performer was energy, followed by health care and information technology. Consumer staples, telecommunication services, and real estate were the weakest relative performers.
The portfolio benefited from Advanced Micro Devices in information technology, Denbury Resources and W&T Offshore in energy, and WellCare Health Plans in health care, as well as an underweighted allocation to General Electric in industrials. The greatest shortfalls came from PG&E in utilities, Sanderson Farms in consumer staples, and Unum Group in financials, along with underweighted allocations to Cisco Systems and Intel in information technology.
Portfolio Managers:
James P. Stetler
Binbin Guo, Principal,
Head of Alpha Equity Investments
Vanguard Quantitative Equity Group
October 18, 2018
6
U.S. Value Fund
Fund Profile
As of September 30, 2018
| | | |
| Portfolio Characteristics | | |
| | | Russell | DJ |
| | | 3000 | U.S. Total |
| | | Value | Market |
| | Fund | Index | FA Index |
| Number of Stocks | 255 | 2,113 | 3,825 |
| Median Market Cap | $34.2B | $58.1B | $73.9B |
| Price/Earnings Ratio | 15.3x | 16.3x | 21.0x |
| Price/Book Ratio | 2.2x | 2.0x | 3.1x |
| Return on Equity | 11.3% | 11.6% | 14.9% |
| Earnings Growth Rate | 4.7% | 5.7% | 8.5% |
| Dividend Yield | 2.1% | 2.3% | 1.7% |
| Foreign Holdings | 0.0% | 0.0% | 0.0% |
| Turnover Rate | 75% | — | — |
| Ticker Symbol | VUVLX | — | — |
| Expense Ratio1 | 0.23% | — | — |
| 30-Day SEC Yield | 1.87% | — | — |
| Short-Term Reserves | -0.1% | — | — |
| |
| Sector Diversification (% of equity exposure) |
| | Fund |
| Consumer Discretionary | 8.3% |
| Consumer Staples | 6.7 |
| Energy | 10.7 |
| Financials | 23.1 |
| Health Care | 14.8 |
| Industrials | 8.5 |
| Information Technology | 10.1 |
| Materials | 3.7 |
| Real Estate | 5.2 |
| Telecommunication Services | 3.3 |
| Utilities | 5.6 |
Sector categories are based on the Global Industry Classification Standard (“GICS”), except for the “Other” category (if applicable), which includes securities that have not been provided a GICS classification as of the effective reporting period.
| | |
| Volatility Measures | | |
| | Russell | DJ |
| | 3000 | U.S. Total |
| | Value | Market |
| | Index | FA Index |
| R-Squared | 0.95 | 0.84 |
| Beta | 1.07 | 1.03 |
These measures show the degree and timing of the fund’s fluctuations compared with the indexes over 36 months.
| | |
| Ten Largest Holdings (% of total net assets) |
| JPMorgan Chase & Co. | Diversified Banks | 3.1% |
| Pfizer Inc. | Pharmaceuticals | 2.2 |
| Chevron Corp. | Integrated Oil & Gas | 2.2 |
| Berkshire Hathaway Inc. Multi-Sector Holdings | 2.0 |
| Exxon Mobil Corp. | Integrated Oil & Gas | 1.9 |
| Johnson & Johnson | Pharmaceuticals | 1.8 |
| AT&T Inc. | Integrated | |
| | Telecommunication | |
| | Services | 1.8 |
| Bank of America Corp. | Diversified Banks | 1.7 |
| Merck & Co. Inc. | Pharmaceuticals | 1.5 |
| Intel Corp. | Semiconductors | 1.5 |
| Top Ten | | 19.7% |
The holdings listed exclude any temporary cash investments and equity index products.
Investment Focus
1 The expense ratio shown is from the prospectus dated January 26, 2018, and represents estimated costs for the current fiscal year. For the fiscal year ended September 30, 2018, the expense ratio was 0.22%.
7
U.S. Value Fund
Performance Summary
All of the returns in this report represent past performance, which is not a guarantee of future results that may be achieved by the fund. (Current performance may be lower or higher than the performance data cited. For performance data current to the most recent month-end, visit our website at vanguard.com/performance.) Note, too, that both investment returns and principal value can fluctuate widely, so an investor’s shares, when sold, could be worth more or less than their original cost. The returns shown do not reflect taxes that a shareholder would pay on fund distributions or on the sale of fund shares.
Cumulative Performance: September 30, 2008, Through September 30, 2018
Initial Investment of $10,000

| | | | |
| | Average Annual Total Returns | |
| | Periods Ended September 30, 2018 | |
| | | | | Final Value |
| | One | Five | Ten | of a $10,000 |
| | Year | Years | Years | Investment |
| U.S. Value Fund* | 10.22% | 11.33% | 10.09% | $26,154 |
| Russell 3000 Value Index | 9.46 | 10.65 | 9.76 | 25,383 |
| Multi-Cap Value Funds Average | 9.60 | 9.54 | 9.49 | 24,763 |
| Dow Jones U.S. Total Stock Market | | | | |
| Float Adjusted Index | 17.58 | 13.42 | 12.05 | 31,191 |
Multi-Cap Value Funds Average: Derived from data provided by Lipper, a Thomson Reuters Company.
See Financial Highlights for dividend and capital gains information.
8
U.S. Value Fund
Fiscal-Year Total Returns (%): September 30, 2008, Through September 30, 2018
9
U.S. Value Fund
Financial Statements
Statement of Net Assets
As of September 30, 2018
The fund reports a complete list of its holdings in regulatory filings four times in each fiscal year, at the quarter-ends. For the second and fourth fiscal quarters, the lists appear in the fund’s semiannual and annual reports to shareholders. For the first and third fiscal quarters, the fund files the lists with the Securities and Exchange Commission on Form N-Q. Shareholders can look up the fund’s Forms N-Q on the SEC’s website at sec.gov. Forms N-Q may also be reviewed and copied at the SEC’s Public Reference Room (see the back cover of this report for further information).
| | | |
| | | | Market |
| | | | Value• |
| | | Shares | ($000) |
| Common Stocks (99.5%)1 | | |
| Consumer Discretionary (8.2%) | |
| | Comcast Corp. Class A | 294,371 | 10,424 |
| * | Liberty Media Corp-Liberty | | |
| | SiriusXM Class A | 228,503 | 9,926 |
| | Darden Restaurants Inc. | 81,725 | 9,087 |
| * | Weight Watchers | | |
| | International Inc. | 116,666 | 8,399 |
| * | Deckers Outdoor Corp. | 69,282 | 8,215 |
| | New York Times Co. | | |
| | Class A | 346,317 | 8,017 |
| | Tailored Brands Inc. | 300,150 | 7,561 |
| * | Urban Outfitters Inc. | 175,944 | 7,196 |
| | Lear Corp. | 49,519 | 7,180 |
| ^ | Sirius XM Holdings Inc. | 1,117,139 | 7,060 |
| | Las Vegas Sands Corp. | 114,758 | 6,809 |
| * | Crocs Inc. | 311,837 | 6,639 |
| | Abercrombie & Fitch Co. | 279,499 | 5,903 |
| | Best Buy Co. Inc. | 73,952 | 5,869 |
| | Walt Disney Co. | 48,896 | 5,718 |
| | Ralph Lauren Corp. Class A | 30,562 | 4,204 |
| | Dine Brands Global Inc. | 45,528 | 3,702 |
| * | Madison Square | | |
| | Garden Co. Class A | 8,789 | 2,771 |
| * | Visteon Corp. | 24,759 | 2,300 |
| | McDonald’s Corp. | 13,406 | 2,243 |
| * | Stoneridge Inc. | 69,859 | 2,076 |
| | AMC Entertainment | | |
| | Holdings Inc. Class A | 90,166 | 1,848 |
| | Aptiv plc | 16,984 | 1,425 |
| * | Modine Manufacturing Co. | 47,761 | 712 |
| | Winnebago Industries Inc. | 20,611 | 683 |
| * | American Public Education | | |
| | Inc. | 19,814 | 655 |
| * | Fossil Group Inc. | 24,750 | 576 |
| *,^ | Conn’s Inc. | 14,150 | 500 |
| | PulteGroup Inc. | 18,348 | 455 |
| * | Denny’s Corp. | 30,377 | 447 |
| | | |
| | | | Market |
| | | | Value• |
| | | Shares | ($000) |
| * | Cambium Learning | | |
| | Group Inc. | 34,779 | 412 |
| | Johnson Outdoors Inc. | | |
| | Class A | 3,564 | 331 |
| | | | 139,343 |
| Consumer Staples (6.6%) | | |
| | Procter & Gamble Co. | 199,976 | 16,644 |
| | Archer-Daniels-Midland Co. | 233,900 | 11,758 |
| | Kroger Co. | 380,375 | 11,073 |
| | PepsiCo Inc. | 90,422 | 10,109 |
| | Lamb Weston Holdings Inc. | 142,826 | 9,512 |
| * | Herbalife Nutrition Ltd. | 163,079 | 8,896 |
| | Conagra Brands Inc. | 216,796 | 7,364 |
| * | US Foods Holding Corp. | 226,491 | 6,980 |
| | Walmart Inc. | 74,174 | 6,966 |
| | Philip Morris International | | |
| | Inc. | 77,177 | 6,293 |
| | Nu Skin Enterprises Inc. | | |
| | Class A | 62,133 | 5,121 |
| | Cal-Maine Foods Inc. | 85,906 | 4,149 |
| | Tyson Foods Inc. Class A | 69,557 | 4,141 |
| * | Simply Good Foods Co. | 90,159 | 1,754 |
| | JM Smucker Co. | 8,488 | 871 |
| * | Chefs’ Warehouse Inc. | 13,531 | 492 |
| | Flowers Foods Inc. | 22,608 | 422 |
| | | | 112,545 |
| Energy (10.7%) | | |
| | Chevron Corp. | 299,882 | 36,669 |
| | Exxon Mobil Corp. | 382,516 | 32,521 |
| | ConocoPhillips | 264,127 | 20,443 |
| | Occidental Petroleum | | |
| | Corp. | 191,163 | 15,708 |
| | Valero Energy Corp. | 134,539 | 15,304 |
| | PBF Energy Inc. Class A | 209,550 | 10,459 |
| * | Whiting Petroleum Corp. | 184,858 | 9,805 |
| | HollyFrontier Corp. | 134,502 | 9,402 |
| * | Denbury Resources Inc. | 1,415,317 | 8,775 |
| * | Continental Resources Inc. | 128,335 | 8,763 |
10
U.S. Value Fund
| | | |
| | | | Market |
| | | | Value• |
| | | Shares | ($000) |
| * | W&T Offshore Inc. | 591,555 | 5,703 |
| | Phillips 66 | 27,425 | 3,091 |
| * | California Resources Corp. | 57,278 | 2,780 |
| | Schlumberger Ltd. | 26,099 | 1,590 |
| | | | 181,013 |
| Financials (22.9%) | | |
| | JPMorgan Chase & Co. | 469,623 | 52,992 |
| * | Berkshire Hathaway Inc. | | |
| | Class B | 156,952 | 33,605 |
| | Bank of America Corp. | 980,304 | 28,880 |
| | Wells Fargo & Co. | 343,335 | 18,046 |
| | Aflac Inc. | 299,721 | 14,108 |
| | Morgan Stanley | 290,457 | 13,527 |
| | Capital One Financial Corp. | 138,994 | 13,195 |
| | Allstate Corp. | 130,313 | 12,862 |
| | Citigroup Inc. | 170,436 | 12,227 |
| | SunTrust Banks Inc. | 179,624 | 11,997 |
| | Regions Financial Corp. | 614,456 | 11,275 |
| | T. Rowe Price Group Inc. | 93,716 | 10,232 |
| | Fifth Third Bancorp | 363,719 | 10,155 |
| | Citizens Financial Group Inc. | 260,476 | 10,047 |
| | Comerica Inc. | 110,027 | 9,924 |
| | Torchmark Corp. | 111,509 | 9,667 |
| | Ally Financial Inc. | 359,583 | 9,511 |
| * | SVB Financial Group | 27,770 | 8,632 |
| | Zions Bancorporation | 169,442 | 8,497 |
| | CME Group Inc. | 47,279 | 8,047 |
| * | E*TRADE Financial Corp. | 153,341 | 8,034 |
| | TCF Financial Corp. | 335,346 | 7,985 |
| | Ameriprise Financial Inc. | 54,042 | 7,980 |
| | Universal Insurance | | |
| | Holdings Inc. | 162,706 | 7,899 |
| | Unum Group | 160,881 | 6,286 |
| | Popular Inc. | 107,904 | 5,530 |
| | Kemper Corp. | 57,467 | 4,623 |
| | Santander Consumer USA | | |
| | Holdings Inc. | 129,783 | 2,601 |
| | Bank of NT Butterfield & | | |
| | Son Ltd. | 48,605 | 2,521 |
| | Alleghany Corp. | 3,703 | 2,416 |
| | MetLife Inc. | 48,340 | 2,258 |
| | Goldman Sachs Group Inc. | 9,508 | 2,132 |
| | Hanover Insurance Group | | |
| | Inc. | 16,822 | 2,075 |
| | Greenhill & Co. Inc. | 76,020 | 2,003 |
| | Assured Guaranty Ltd. | 45,620 | 1,927 |
| | OFG Bancorp | 113,403 | 1,831 |
| * | Axos Financial Inc. | 43,873 | 1,509 |
| | Federal Agricultural | | |
| | Mortgage Corp. | 18,311 | 1,322 |
| | Primerica Inc. | 10,922 | 1,317 |
| | BB&T Corp. | 25,620 | 1,244 |
| * | Blucora Inc. | 27,421 | 1,104 |
| * | Enova International Inc. | 37,962 | 1,093 |
| | US Bancorp | 15,262 | 806 |
| | | |
| | Brown & Brown Inc. | 25,040 | 740 |
| * | MBIA Inc. | 68,074 | 728 |
| | First American Financial | | |
| | Corp. | 11,417 | 589 |
| | BankUnited Inc. | 16,023 | 567 |
| | Nelnet Inc. Class A | 9,310 | 532 |
| | Fidelity National Financial | | |
| | Inc. | 12,681 | 499 |
| * | On Deck Capital Inc. | 50,527 | 382 |
| * | Ambac Financial Group Inc. | 17,704 | 361 |
| | Hamilton Lane Inc. Class A | 7,676 | 340 |
| | | | 388,660 |
| Health Care (14.7%) | | |
| | Pfizer Inc. | 832,727 | 36,698 |
| | Johnson & Johnson | 220,594 | 30,479 |
| | Merck & Co. Inc. | 362,941 | 25,747 |
| | Anthem Inc. | 66,774 | 18,299 |
| | Bristol-Myers Squibb Co. | 242,227 | 15,037 |
| | Cigna Corp. | 64,754 | 13,485 |
| | Abbott Laboratories | 181,567 | 13,320 |
| | Humana Inc. | 31,117 | 10,534 |
| * | WellCare Health Plans Inc. | 32,675 | 10,472 |
| * | Haemonetics Corp. | 88,419 | 10,131 |
| | HCA Healthcare Inc. | 67,342 | 9,369 |
| * | Molina Healthcare Inc. | 57,786 | 8,593 |
| * | IQVIA Holdings Inc. | 46,495 | 6,032 |
| * | Express Scripts Holding Co. | 58,494 | 5,558 |
| * | Enanta Pharmaceuticals Inc. | 61,561 | 5,261 |
| | Medtronic plc | 52,587 | 5,173 |
| | Baxter International Inc. | 55,288 | 4,262 |
| | Amgen Inc. | 16,037 | 3,324 |
| * | REGENXBIO Inc. | 40,515 | 3,059 |
| * | CareDx Inc. | 82,979 | 2,394 |
| * | Medpace Holdings Inc. | 35,233 | 2,111 |
| * | Centene Corp. | 14,316 | 2,073 |
| * | Spectrum Pharmaceuticals | | |
| | Inc. | 108,777 | 1,827 |
| * | ArQule Inc. | 207,601 | 1,175 |
| * | PTC Therapeutics Inc. | 19,894 | 935 |
| * | MacroGenics Inc. | 34,537 | 741 |
| * | Acorda Therapeutics Inc. | 31,862 | 626 |
| | Thermo Fisher Scientific Inc. | 2,130 | 520 |
| * | Triple-S Management Corp. | | |
| | Class B | 26,102 | 493 |
| * | Endo International plc | 22,794 | 384 |
| * | Avanos Medical Inc. | 5,155 | 353 |
| | | | 248,465 |
| Industrials (8.5%) | | |
| | Lockheed Martin Corp. | 29,453 | 10,189 |
| | Raytheon Co. | 49,101 | 10,147 |
| | WW Grainger Inc. | 28,276 | 10,106 |
| | SkyWest Inc. | 169,951 | 10,010 |
| | Caterpillar Inc. | 65,272 | 9,953 |
| * | HD Supply Holdings Inc. | 208,755 | 8,933 |
| * | United Rentals Inc. | 53,548 | 8,760 |
11
U.S. Value Fund
| | | |
| | | | Market |
| | | | Value• |
| | | Shares | ($000) |
| | Terex Corp. | 218,143 | 8,706 |
| | Honeywell International Inc. | 41,112 | 6,841 |
| * | FTI Consulting Inc. | 67,998 | 4,977 |
| * | United Continental | | |
| | Holdings Inc. | 52,106 | 4,640 |
| | Quad/Graphics Inc. | 202,916 | 4,229 |
| | ArcBest Corp. | 84,142 | 4,085 |
| ^ | ADT Inc. | 428,725 | 4,026 |
| | Spirit AeroSystems | | |
| | Holdings Inc. Class A | 36,548 | 3,350 |
| | United Technologies Corp. | 20,867 | 2,917 |
| | General Electric Co. | 247,254 | 2,791 |
| *,^ | Enphase Energy Inc. | 537,254 | 2,606 |
| | GrafTech International Ltd. | 131,808 | 2,572 |
| * | Vicor Corp. | 55,778 | 2,566 |
| | Global Brass & Copper | | |
| | Holdings Inc. | 60,757 | 2,242 |
| | Expeditors International of | | |
| | Washington Inc. | 30,014 | 2,207 |
| | Harris Corp. | 12,414 | 2,101 |
| | Allison Transmission | | |
| | Holdings Inc. | 32,313 | 1,681 |
| * | XPO Logistics Inc. | 13,811 | 1,577 |
| * | Harsco Corp. | 54,845 | 1,566 |
| | Union Pacific Corp. | 8,452 | 1,376 |
| * | Meritor Inc. | 69,335 | 1,342 |
| | Delta Air Lines Inc. | 21,576 | 1,248 |
| | Schneider National Inc. | | |
| | Class B | 40,390 | 1,009 |
| | PACCAR Inc. | 13,678 | 933 |
| | Heidrick & Struggles | | |
| | International Inc. | 27,371 | 926 |
| | DMC Global Inc. | 22,273 | 909 |
| * | Textainer Group Holdings | | |
| | Ltd. | 66,932 | 857 |
| | Insteel Industries Inc. | 11,168 | 401 |
| * | BMC Stock Holdings Inc. | 17,542 | 327 |
| * | Echo Global Logistics Inc. | 10,242 | 317 |
| | | | 143,423 |
| Information Technology (10.0%) | |
| | Intel Corp. | 525,848 | 24,867 |
| | Cisco Systems Inc. | 373,716 | 18,181 |
| | HP Inc. | 572,066 | 14,742 |
| | QUALCOMM Inc. | 162,749 | 11,723 |
| | Microsoft Corp. | 95,970 | 10,976 |
| | Booz Allen Hamilton | | |
| | Holding Corp. Class A | 202,924 | 10,071 |
| * | Advanced Micro Devices | | |
| | Inc. | 313,060 | 9,670 |
| | NetApp Inc. | 107,139 | 9,202 |
| | CDW Corp. | 87,054 | 7,741 |
| * | CACI International Inc. | | |
| | Class A | 41,486 | 7,640 |
| | Oracle Corp. | 125,160 | 6,453 |
| * | VMware Inc. Class A | 41,256 | 6,438 |
| | | |
| * | ON Semiconductor Corp. | 332,688 | 6,132 |
| * | Electro Scientific Industries | | |
| | Inc. | 257,984 | 4,502 |
| | Hewlett Packard Enterprise | | |
| | Co. | 185,142 | 3,020 |
| * | Glu Mobile Inc. | 368,621 | 2,746 |
| * | Unisys Corp. | 128,390 | 2,619 |
| * | SMART Global Holdings | | |
| | Inc. | 86,156 | 2,476 |
| | ManTech International Corp. | | |
| | Class A | 32,645 | 2,067 |
| * | Dell Technologies Inc. | | |
| | Class V | 20,691 | 2,010 |
| | Comtech | | |
| | Telecommunications Corp. | 48,147 | 1,746 |
| * | Micron Technology Inc. | 25,554 | 1,156 |
| * | Insight Enterprises Inc. | 20,187 | 1,092 |
| * | eGain Corp. | 126,191 | 1,022 |
| * | Cardtronics plc Class A | 12,970 | 410 |
| | PC Connection Inc. | 9,593 | 373 |
| | | | 169,075 |
| Materials (3.8%) | | |
| | CF Industries Holdings Inc. | 210,225 | 11,445 |
| | Freeport-McMoRan Inc. | 764,977 | 10,648 |
| | Huntsman Corp. | 293,377 | 7,989 |
| | DowDuPont Inc. | 120,699 | 7,762 |
| | LyondellBasell Industries | | |
| | NV Class A | 58,380 | 5,985 |
| | Warrior Met Coal Inc. | 220,042 | 5,950 |
| | Louisiana-Pacific Corp. | 204,951 | 5,429 |
| | Westlake Chemical Corp. | 56,069 | 4,660 |
| * | Alcoa Corp. | 49,373 | 1,995 |
| | Boise Cascade Co. | 37,017 | 1,362 |
| * | Verso Corp. | 10,524 | 354 |
| * | Cleveland-Cliffs Inc. | 26,534 | 336 |
| | | | 63,915 |
| Real Estate (5.2%) | | |
| | Weyerhaeuser Co. | 343,941 | 11,099 |
| | Xenia Hotels & Resorts | | |
| | Inc. | 402,120 | 9,530 |
| | Park Hotels & Resorts Inc. | 283,584 | 9,307 |
| | Jones Lang LaSalle Inc. | 63,131 | 9,111 |
| | Prologis Inc. | 132,120 | 8,956 |
| | Spirit Realty Capital Inc. 1,032,013 | 8,318 |
| | Rayonier Inc. | 232,520 | 7,862 |
| | CubeSmart | 177,101 | 5,053 |
| *,^ | Forestar Group Inc. | 215,108 | 4,560 |
| | Pebblebrook Hotel Trust | 111,197 | 4,044 |
| | CorEnergy Infrastructure | | |
| | Trust Inc. | 91,941 | 3,455 |
| * | CBRE Group Inc. Class A | 65,808 | 2,902 |
| | Hersha Hospitality Trust | | |
| | Class A | 55,726 | 1,263 |
| | NorthStar Realty Europe | | |
| | Corp. | 68,919 | 976 |
12
U.S. Value Fund
| | | |
| | | | Market |
| | | | Value• |
| | | Shares | ($000) |
| | Hospitality Properties Trust | 22,662 | 654 |
| | Uniti Group Inc. | 29,899 | 603 |
| | | | 87,693 |
| Telecommunication Services (3.3%) | |
| | AT&T Inc. | 881,815 | 29,612 |
| | Verizon Communications | | |
| | Inc. | 283,182 | 15,119 |
| * | T-Mobile US Inc. | 72,902 | 5,116 |
| ^ | Frontier Communications | | |
| | Corp. | 371,541 | 2,411 |
| | Telephone & Data Systems | | |
| | Inc. | 70,233 | 2,137 |
| * | United States Cellular Corp. | 20,817 | 932 |
| | ATN International Inc. | 4,927 | 364 |
| | | | 55,691 |
| Utilities (5.6%) | | |
| | NextEra Energy Inc. | 113,785 | 19,070 |
| | Exelon Corp. | 347,380 | 15,167 |
| | FirstEnergy Corp. | 331,921 | 12,338 |
| | NRG Energy Inc. | 317,967 | 11,892 |
| | Entergy Corp. | 136,932 | 11,109 |
| | AES Corp. | 715,240 | 10,013 |
| * | Vistra Energy Corp. | 319,462 | 7,948 |
| * | Clearway Energy Inc. | | |
| | Class C | 174,982 | 3,368 |
| | National Fuel Gas Co. | 34,775 | 1,950 |
| | Otter Tail Corp. | 19,101 | 915 |
| * | Clearway Energy Inc. | | |
| | Class A | 31,020 | 591 |
| | | | 94,361 |
| Total Common Stocks | | |
| (Cost $1,374,307) | | 1,684,184 |
| Temporary Cash Investments (1.2%)1 | |
| Money Market Fund (1.1%) | | |
| 2,3 | Vanguard Market Liquidity | | |
| | Fund, 2.209% | 191,918 | 19,192 |
| |
| | | Face | |
| | | Amount | |
| | | ($000) | |
| U. S. Government and Agency Obligations (0.1%) |
| 4 | United States Treasury Bill, | | |
| | 1.962%, 10/11/18 | 202 | 202 |
| 4 | United States Treasury Bill, | | |
| | 2.078%, 11/15/18 | 400 | 399 |
| | | | 601 |
| Total Temporary Cash Investments | |
| (Cost $19,792) | | 19,793 |
| Total Investments (100.7%) | | |
| (Cost $1,394,099) | | 1,703,977 |
| |
| | Amount |
| | ($000) |
| Other Assets and Liabilities (-0.7%) | |
| Other Assets | |
| Investment in Vanguard | 87 |
| Receivables for Investment Securities Sold 61,722 |
| Receivables for Accrued Income | 1,525 |
| Receivables for Capital Shares Issued | 1,109 |
| Other Assets | 59 |
| Total Other Assets | 64,502 |
| Liabilities | |
| Payables for Investment Securities | |
| Purchased | (60,066) |
| Collateral for Securities on Loan | (14,218) |
| Payables for Capital Shares Redeemed | (1,095) |
| Payables to Vanguard | (1,093) |
| Variation Margin Payable—Futures | |
| Contracts | (3) |
| Total Liabilities | (76,475) |
| Net Assets (100%) | |
| Applicable to 84,475,233 outstanding | |
| $.001 par value shares of beneficial | |
| interest (unlimited authorization) | 1,692,004 |
| Net Asset Value Per Share | $20.03 |
13
U.S. Value Fund
| |
| At September 30, 2018, net assets consisted of: |
| | Amount |
| | ($000) |
| Paid-in Capital | 1,289,507 |
| Undistributed Net Investment Income | 21,478 |
| Accumulated Net Realized Gains | 71,149 |
| Unrealized Appreciation (Depreciation) | |
| Investment Securities | 309,878 |
| Futures Contracts | (8) |
| Net Assets | 1,692,004 |
• See Note A in Notes to Financial Statements.
* Non-income-producing security.
^ Includes partial security positions on loan to broker-dealers.
The total value of securities on loan is $12,939,000.
1 The fund invests a portion of its cash reserves in equity
markets through the use of index futures contracts. After
giving effect to futures investments, the fund’s effective
common stock and temporary cash investment positions
represent 100.0% and 0.7%, respectively, of net assets.
2 Affiliated money market fund available only to Vanguard funds
and certain trusts and accounts managed by Vanguard. Rate
shown is the 7-day yield.
3 Includes $14,218,000 of collateral received for securities
on loan.
4 Securities with a value of $419,000 have been segregated as
initial margin for open futures contracts.
| | | | |
| Derivative Financial Instruments Outstanding as of Period End | | |
| |
| Futures Contracts | | | | |
| | | | | ($000) |
| | | | | Value and |
| | | Number of | | Unrealized |
| | | Long (Short) | Notional | Appreciation |
| | Expiration | Contracts | Amount | (Depreciation) |
| Long Futures Contracts | | | | |
| E-mini S&P 500 Index | December 2018 | 51 | 7,443 | (8) |
See accompanying Notes, which are an integral part of the Financial Statements.
14
| |
| U.S. Value Fund | |
| |
| |
| Statement of Operations | |
| |
| | Year Ended |
| | September 30, 2018 |
| | ($000) |
| Investment Income | |
| Income | |
| Dividends | 35,730 |
| Interest1 | 114 |
| Securities Lending—Net | 278 |
| Total Income | 36,122 |
| Expenses | |
| The Vanguard Group—Note B | |
| Investment Advisory Services | 1,077 |
| Management and Administrative | 2,272 |
| Marketing and Distribution | 276 |
| Custodian Fees | 27 |
| Auditing Fees | 32 |
| Shareholders’ Reports and Proxy | 35 |
| Trustees’ Fees and Expenses | 1 |
| Total Expenses | 3,720 |
| Net Investment Income | 32,402 |
| Realized Net Gain (Loss) | |
| Investment Securities Sold1 | 80,175 |
| Futures Contracts | 1,333 |
| Realized Net Gain (Loss) | 81,508 |
| Change in Unrealized Appreciation (Depreciation) | |
| Investment Securities1 | 50,928 |
| Futures Contracts | (62) |
| Change in Unrealized Appreciation (Depreciation) | 50,866 |
| Net Increase (Decrease) in Net Assets Resulting from Operations | 164,776 |
1 Interest income, realized net gain (loss), and change in unrealized appreciation (depreciation) from an affiliated company of the fund were $100,000, $1,000, and ($2,000), respectively. Purchases and sales are for temporary cash investment purposes.
See accompanying Notes, which are an integral part of the Financial Statements.
15
| | |
| U.S. Value Fund | | |
| |
| |
| Statement of Changes in Net Assets | | |
| |
| | Year Ended September 30, |
| | 2018 | 2017 |
| | ($000) | ($000) |
| Increase (Decrease) in Net Assets | | |
| Operations | | |
| Net Investment Income | 32,402 | 36,922 |
| Realized Net Gain (Loss) | 81,508 | 100,791 |
| Change in Unrealized Appreciation (Depreciation) | 50,866 | 109,876 |
| Net Increase (Decrease) in Net Assets Resulting from Operations | 164,776 | 247,589 |
| Distributions | | |
| Net Investment Income | (32,253) | (30,933) |
| Realized Capital Gain1 | (97,416) | (22,230) |
| Total Distributions | (129,669) | (53,163) |
| Capital Share Transactions | | |
| Issued | 214,440 | 422,683 |
| Issued in Lieu of Cash Distributions | 121,791 | 50,256 |
| Redeemed | (354,645) | (365,711) |
| Net Increase (Decrease) from Capital Share Transactions | (18,414) | 107,228 |
| Total Increase (Decrease) | 16,693 | 301,654 |
| Net Assets | | |
| Beginning of Period | 1,675,311 | 1,373,657 |
| End of Period2 | 1,692,004 | 1,675,311 |
1 Includes fiscal 2018 and 2017 short-term gain distributions totaling $22,953,000 and $0, respectively. Short-term gain distributions are treated as ordinary income dividends for tax purposes.
2 Net Assets—End of Period includes undistributed (overdistributed) net investment income of $21,478,000 and $23,033,000.
See accompanying Notes, which are an integral part of the Financial Statements.
16
| | | | | |
| U.S. Value Fund | | | | | |
| |
| |
| Financial Highlights | | | | | |
| |
| |
| For a Share Outstanding | | | Year Ended September 30, |
| Throughout Each Period | 2018 | 2017 | 2016 | 2015 | 2014 |
| Net Asset Value, Beginning of Period | $19.63 | $17.25 | $16.48 | $16.95 | $14.41 |
| Investment Operations | | | | | |
| Net Investment Income | . 3731 | .4371 | .440 | .355 | .299 |
| Net Realized and Unrealized Gain (Loss) | | | | | |
| on Investments | 1.563 | 2.606 | 1.341 | (.543) | 2.531 |
| Total from Investment Operations | 1.936 | 3.043 | 1.781 | (.188) | 2.830 |
| Distributions | | | | | |
| Dividends from Net Investment Income | (. 382) | (. 386) | (. 358) | (. 282) | (. 290) |
| Distributions from Realized Capital Gains | (1.154) | (.277) | (.653) | — | — |
| Total Distributions | (1.536) | (.663) | (1.011) | (.282) | (.290) |
| Net Asset Value, End of Period | $20.03 | $19.63 | $17.25 | $16.48 | $16.95 |
| |
| Total Return2 | 10.22% | 17.87% | 11.09% | -1.18% | 19.89% |
| |
| Ratios/Supplemental Data | | | | | |
| Net Assets, End of Period (Millions) | $1,692 | $1,675 | $1,374 | $1,215 | $1,117 |
| Ratio of Total Expenses to Average Net Assets | 0.22% | 0.23% | 0.23% | 0.26% | 0.29% |
| Ratio of Net Investment Income to | | | | | |
| Average Net Assets | 1.92% | 2.36% | 2.63% | 2.10% | 1.92% |
| Portfolio Turnover Rate | 75% | 95% | 76% | 66% | 57% |
1 Calculated based on average shares outstanding.
2 Total returns do not include account service fees that may have applied in the periods shown. Fund prospectuses provide information about any applicable account service fees.
See accompanying Notes, which are an integral part of the Financial Statements.
17
U.S. Value Fund
Notes to Financial Statements
Vanguard U.S. Value Fund is registered under the Investment Company Act of 1940 as an open-end investment company, or mutual fund.
A. The following significant accounting policies conform to generally accepted accounting principles for U.S. investment companies. The fund consistently follows such policies in preparing its financial statements.
1. Security Valuation: Securities are valued as of the close of trading on the New York Stock Exchange (generally 4 p.m., Eastern time) on the valuation date. Equity securities are valued at the latest quoted sales prices or official closing prices taken from the primary market in which each security trades; such securities not traded on the valuation date are valued at the mean of the latest quoted bid and asked prices. Securities for which market quotations are not readily available, or whose values have been materially affected by events occurring before the fund’s pricing time but after the close of the securities’ primary markets, are valued by methods deemed by the board of trustees to represent fair value. Investments in Vanguard Market Liquidity Fund are valued at that fund’s net asset value. Temporary cash investments are valued using the latest bid prices or using valuations based on a matrix system (which considers such factors as security prices, yields, maturities, and ratings), both as furnished by independent pricing services.
2. Futures Contracts: The fund uses index futures contracts to a limited extent, with the objective of maintaining full exposure to the stock market while maintaining liquidity. The fund may purchase or sell futures contracts to achieve a desired level of investment, whether to accommodate portfolio turnover or cash flows from capital share transactions. The primary risks associated with the use of futures contracts are imperfect correlation between changes in market values of stocks held by the fund and the prices of futures contracts, and the possibility of an illiquid market. Counterparty risk involving futures is mitigated because a regulated clearinghouse is the counterparty instead of the clearing broker. To further mitigate counterparty risk, the fund trades futures contracts on an exchange, monitors the financial strength of its clearing brokers and clearinghouse, and has entered into clearing agreements with its clearing brokers. The clearinghouse imposes initial margin requirements to secure the fund’s performance and requires daily settlement of variation margin representing changes in the market value of each contract. Any assets pledged as initial margin for open contracts are noted in the Statement of Net Assets.
Futures contracts are valued at their quoted daily settlement prices. The notional amounts of the contracts are not recorded in the Statement of Net Assets. Fluctuations in the value of the contracts are recorded in the Statement of Net Assets as an asset (liability) and in the Statement of Operations as unrealized appreciation (depreciation) until the contracts are closed, when they are recorded as realized futures gains (losses).
During the year ended September 30, 2018, the fund’s average investments in long and short futures contracts represented less than 1% and 0% of net assets, respectively, based on the average of the notional amounts at each quarter-end during the period.
3. Federal Income Taxes: The fund intends to continue to qualify as a regulated investment company and distribute all of its taxable income. Management has analyzed the fund’s tax positions taken for all open federal income tax years (September 30, 2015–2018), and has concluded that no provision for federal income tax is required in the fund’s financial statements.
4. Distributions: Distributions to shareholders are recorded on the ex-dividend date. Distributions are determined on a tax basis and may differ from net investment income and realized capital gains for financial reporting purposes.
18
U.S. Value Fund
5. Securities Lending: To earn additional income, the fund lends its securities to qualified institutional borrowers. Security loans are subject to termination by the fund at any time, and are required to be secured at all times by collateral in an amount at least equal to the market value of securities loaned. Daily market fluctuations could cause the value of loaned securities to be more or less than the value of the collateral received. When this occurs, the collateral is adjusted and settled before the opening of the market on the next business day. The fund further mitigates its counterparty risk by entering into securities lending transactions only with a diverse group of prequalified counterparties, monitoring their financial strength, and entering into master securities lending agreements with its counterparties. The master securities lending agreements provide that, in the event of a counterparty’s default (including bankruptcy), the fund may terminate any loans with that borrower, determine the net amount owed, and sell or retain the collateral up to the net amount owed to the fund; however, such actions may be subject to legal proceedings. While collateral mitigates counterparty risk, in the event of a default, the fund may experience delays and costs in recovering the securities loaned. The fund invests cash collateral received in Vanguard Market Liquidity Fund, and records a liability in the Statement of Net Assets for the return of the collateral, during the period the securities are on loan. Securities lending income represents fees charged to borrowers plus income earned on invested cash collateral, less expenses associated with the loan. During the term of the loan, the fund is entitled to all distributions made on or in respect of the loaned securities.
6. Credit Facility: The fund and certain other funds managed by The Vanguard Group (“Vanguard”) participate in a $3.1 billion committed credit facility provided by a syndicate of lenders pursuant to a credit agreement that may be renewed annually; each fund is individually liable for its borrowings, if any, under the credit facility. Borrowings may be utilized for temporary and emergency purposes, and are subject to the fund’s regulatory and contractual borrowing restrictions. The participating funds are charged administrative fees and an annual commitment fee of 0.10% of the undrawn amount of the facility; these fees are allocated to the funds based on a method approved by the fund’s board of trustees and included in Management and Administrative expenses on the fund’s Statement of Operations. Any borrowings under this facility bear interest at a rate based upon the higher of the one-month London Interbank Offered Rate, federal funds effective rate, or overnight bank funding rate plus an agreed-upon spread.
The fund had no borrowings outstanding at September 30, 2018, or at any time during the period then ended.
7. Other: Dividend income is recorded on the ex-dividend date. Interest income includes income distributions received from Vanguard Market Liquidity Fund and is accrued daily. Premiums and discounts on debt securities purchased are amortized and accreted, respectively, to interest income over the lives of the respective securities. Security transactions are accounted for on the date securities are bought or sold. Costs used to determine realized gains (losses) on the sale of investment securities are those of the specific securities sold.
B. In accordance with the terms of a Funds’ Service Agreement (the “FSA”) between Vanguard and the fund, Vanguard furnishes to the fund investment advisory, corporate management, administrative, marketing, and distribution services at Vanguard’s cost of operations (as defined by the FSA). These costs of operations are allocated to the fund based on methods and guidelines approved by the board of trustees. Vanguard does not require reimbursement in the current period for certain costs of
19
U.S. Value Fund
operations (such as deferred compensation/benefits and risk/insurance costs); the fund’s liability for these costs of operations is included in Payables to Vanguard on the Statement of Net Assets. All other costs of operations payable to Vanguard are generally settled twice a month.
Upon the request of Vanguard, the fund may invest up to 0.40% of its net assets as capital in Vanguard. At September 30, 2018, the fund had contributed to Vanguard capital in the amount of $87,000, representing 0.01% of the fund’s net assets and 0.03% of Vanguard’s capitalization. The fund’s trustees and officers are also directors and employees, respectively, of Vanguard.
C. Various inputs may be used to determine the value of the fund’s investments. These inputs are summarized in three broad levels for financial statement purposes. The inputs or methodologies used to value securities are not necessarily an indication of the risk associated with investing in those securities.
Level 1—Quoted prices in active markets for identical securities.
Level 2—Other significant observable inputs (including quoted prices for similar securities, interest rates, prepayment speeds, credit risk, etc.).
Level 3—Significant unobservable inputs (including the fund’s own assumptions used to determine the fair value of investments). Any investments valued with significant unobservable inputs are noted on the Statement of Net Assets.
The following table summarizes the market value of the fund’s investments as of September 30, 2018, based on the inputs used to value them:
| | | |
| | Level 1 | Level 2 | Level 3 |
| Investments | ($000) | ($000) | ($000) |
| Common Stocks | 1,684,184 | — | — |
| Temporary Cash Investments | 19,192 | 601 | — |
| Futures Contracts—Liabilities1 | (3) | — | — |
| Total | 1,703,373 | 601 | — |
| 1 Represents variation margin on the last day of the reporting period. | | | |
D. Permanent differences between book-basis and tax-basis components of net assets are reclassified among capital accounts in the financial statements to reflect their tax character. These reclassifications have no effect on net assets or net asset value per share. As of period end, the
| |
| following permanent differences primarily attributable to the accounting for distributions in | |
| connection with fund share redemptions were reclassified to the following accounts: | |
| | Amount |
| | ($000) |
| Paid-in Capital | 6,009 |
| Undistributed (Overdistributed) Net Investment Income | (1,704) |
| Accumulated Net Realized Gains (Losses) | (4,305) |
20
U.S. Value Fund
Temporary differences between book-basis and tax-basis components of accumulated net earnings (losses) arise when certain items of income, gain, or loss are recognized in different periods for financial statement and tax purposes; these differences will reverse at some time in the future. The differences are primarily related to the tax deferral of losses on wash sales and the realization of unrealized gains or losses on certain futures contracts. As of period end, the tax-basis components of accumulated net earnings (losses) are detailed in the table as follows:
| |
| | Amount |
| | ($000) |
| Undistributed Ordinary Income | 22,412 |
| Undistributed Long-Term Gains | 71,142 |
| Capital Loss Carryforwards (Non-expiring) | — |
| Net Unrealized Gains (Losses) | 309,878 |
As of September 30, 2018, gross unrealized appreciation and depreciation for investments and derivatives based on cost for U.S. federal income tax purposes were as follows:
| |
| | Amount |
| | ($000) |
| Tax Cost | 1,394,099 |
| Gross Unrealized Appreciation | 345,418 |
| Gross Unrealized Depreciation | (35,540) |
| Net Unrealized Appreciation (Depreciation) | 309,878 |
E. During the year ended September 30, 2018, the fund purchased $1,253,681,000 of investment securities and sold $1,365,282,000 of investment securities, other than temporary cash investments.
| | |
| F. Capital shares issued and redeemed were: | | |
| | Year Ended September 30, |
| | 2018 | 2017 |
| | Shares | Shares |
| | (000) | (000) |
| Issued | 11,008 | 22,746 |
| Issued in Lieu of Cash Distributions | 6,353 | 2,714 |
| Redeemed | (18,245) | (19,713) |
| Net Increase (Decrease) in Shares Outstanding | (884) | 5,747 |
G. Management has determined that no events or transactions occurred subsequent to September 30, 2018, that would require recognition or disclosure in these financial statements.
21
Report of Independent Registered Public Accounting Firm
To the Board of Trustees of Vanguard Malvern Funds and Shareholders of Vanguard U.S. Value Fund
Opinion on the Financial Statements
We have audited the accompanying statement of net assets of Vanguard U.S. Value Fund (one of the funds constituting Vanguard Malvern Funds, referred to hereafter as the “Fund”) as of September 30, 2018, the related statement of operations for the year ended September 30, 2018, the statement of changes in net assets for each of the two years in the period ended September 30, 2018, including the related notes, and the financial highlights for each of the five years in the period ended September 30, 2018 (collectively referred to as the “financial statements”). In our opinion, the financial statements present fairly, in all material respects, the financial position of the Fund as of September 30, 2018, the results of its operations for the year then ended, the changes in its net assets for each of the two years in the period ended September 30, 2018 and the financial highlights for each of the five years in the period ended September 30, 2018 in conformity with accounting principles generally accepted in the United States of America.
Basis for Opinion
These financial statements are the responsibility of the Fund’s management. Our responsibility is to express an opinion on the Fund’s financial statements based on our audits. We are a public accounting firm registered with the Public Company Accounting Oversight Board (United States) (“PCAOB”) and are required to be independent with respect to the Fund in accordance with the U.S. federal securities laws and the applicable rules and regulations of the Securities and Exchange Commission and the PCAOB.
We conducted our audits of these financial statements in accordance with the standards of the PCAOB. Those standards require that we plan and perform the audit to obtain reasonable assurance about whether the financial statements are free of material misstatement, whether due to error or fraud.
Our audits included performing procedures to assess the risks of material misstatement of the financial statements, whether due to error or fraud, and performing procedures that respond to those risks. Such procedures included examining, on a test basis, evidence regarding the amounts and disclosures in the financial statements. Our audits also included evaluating the accounting principles used and significant estimates made by management, as well as evaluating the overall presentation of the financial statements. Our procedures included confirmation of securities owned as of September 30, 2018 by correspondence with the custodians and brokers and by agreement to the underlying ownership records of the transfer agent; when replies were not received from brokers, we performed other auditing procedures. We believe that our audits provide a reasonable basis for our opinion.
/s/PricewaterhouseCoopers LLP
Philadelphia, Pennsylvania
November 15, 2018
We have served as the auditor of one or more investment companies in The Vanguard Group of Funds since 1975.
22
Special 2018 tax information (unaudited) for Vanguard U.S. Value Fund
This information for the fiscal year ended September 30, 2018, is included pursuant to provisions of the Internal Revenue Code.
The fund distributed $78,768,000 as capital gain dividends (20% rate gain distributions) to shareholders during the fiscal year.
For nonresident alien shareholders, 100% of short-term capital gain dividends distributed by the fund are qualified short-term capital gains.
The fund distributed $30,624,000 of qualified dividend income to shareholders during the fiscal year.
For corporate shareholders, 97.5% of investment income (dividend income plus short-term gains, if any) qualifies for the dividends-received deduction.
23
Your Fund’s After-Tax Returns
This table presents returns for your fund both before and after taxes. The after-tax returns are shown in two ways: (1) assuming that an investor owned the fund during the entire period and paid taxes on the fund’s distributions, and (2) assuming that an investor paid taxes on the fund’s distributions and sold all shares at the end of each period.
Calculations are based on the highest individual federal income tax and capital gains tax rates in effect at the times of the distributions and the hypothetical sales. State and local taxes were not considered. After-tax returns reflect any qualified dividend income, using actual prior-year figures and estimates for 2018. (In the example, returns after the sale of fund shares may be higher than those assuming no sale. This occurs when the sale would have produced a capital loss. The calculation assumes that the investor received a tax deduction for the loss.)
Please note that your actual after-tax returns will depend on your tax situation and may differ from those shown. Also note that if you own the fund in a tax-deferred account, such as an individual retirement account or a 401(k) plan, this information does not apply to you. Such accounts are not subject to current taxes.
Finally, keep in mind that a fund’s performance—whether before or after taxes—does not guarantee future results.
| | | |
| Average Annual Total Returns: U.S. Value Fund | | | |
| Periods Ended September 30, 2018 | | | |
| | One | Five | Ten |
| | Year | Years | Years |
| Returns Before Taxes | 10.22% | 11.33% | 10.09% |
| Returns After Taxes on Distributions | 7.97 | 10.18 | 9.33 |
| Returns After Taxes on Distributions and Sale of Fund Shares | 7.03 | 8.80 | 8.17 |
24
About Your Fund’s Expenses
As a shareholder of the fund, you incur ongoing costs, which include costs for portfolio management, administrative services, and shareholder reports (like this one), among others. Operating expenses, which are deducted from a fund’s gross income, directly reduce the investment return of the fund.
A fund’s expenses are expressed as a percentage of its average net assets. This figure is known as the expense ratio. The following examples are intended to help you understand the ongoing costs (in dollars) of investing in your fund and to compare these costs with those of other mutual funds. The examples are based on an investment of $1,000 made at the beginning of the period shown and held for the entire period.
The accompanying table illustrates your fund’s costs in two ways:
• Based on actual fund return. This section helps you to estimate the actual expenses that you paid over the period. The ”Ending Account Value“ shown is derived from the fund‘s actual return, and the third column shows the dollar amount that would have been paid by an investor who started with $1,000 in the fund. You may use the information here, together with the amount you invested, to estimate the expenses that you paid over the period.
To do so, simply divide your account value by $1,000 (for example, an $8,600 account value divided by $1,000 = 8.6), then multiply the result by the number given for your fund under the heading ”Expenses Paid During Period.“
• Based on hypothetical 5% yearly return. This section is intended to help you compare your fund‘s costs with those of other mutual funds. It assumes that the fund had a yearly return of 5% before expenses, but that the expense ratio is unchanged. In this case—because the return used is not the fund’s actual return—the results do not apply to your investment. The example is useful in making comparisons because the Securities and Exchange Commission requires all mutual funds to calculate expenses based on a 5% return. You can assess your fund’s costs by comparing this hypothetical example with the hypothetical examples that appear in shareholder reports of other funds.
Note that the expenses shown in the table are meant to highlight and help you compare ongoing costs only and do not reflect transaction costs incurred by the fund for buying and selling securities. Further, the expenses do not include any purchase, redemption, or account service fees described in the fund prospectus. If such fees were applied to your account, your costs would be higher. Your fund does not carry a “sales load.”
The calculations assume no shares were bought or sold during the period. Your actual costs may have been higher or lower, depending on the amount of your investment and the timing of any purchases or redemptions.
You can find more information about the fund’s expenses, including annual expense ratios, in the Financial Statements section of this report. For additional information on operating expenses and other shareholder costs, please refer to your fund’s current prospectus.
25
| | | |
| Six Months Ended September 30, 2018 | | | |
| | Beginning | Ending | Expenses |
| | Account Value | Account Value | Paid During |
| U.S. Value Fund | 3/31/2018 | 9/30/2018 | Period |
| Based on Actual Fund Return | $1,000.00 | $1,074.57 | $1.09 |
| Based on Hypothetical 5% Yearly Return | 1,000.00 | 1,024.02 | 1.07 |
The calculations are based on expenses incurred in the most recent six-month period. The fund’s annualized six-month expense ratio for that period is 0.21%. The dollar amounts shown as “Expenses Paid” are equal to the annualized expense ratio multiplied by the average account value over the period, multiplied by the number of days in the most recent six-month period, then divided by the number of days in the most recent 12-month period (183/365).
26
Glossary
30-Day SEC Yield. A fund’s 30-day SEC yield is derived using a formula specified by the U.S. Securities and Exchange Commission. Under the formula, data related to the fund’s security holdings in the previous 30 days are used to calculate the fund’s hypothetical net income for that period, which is then annualized and divided by the fund’s estimated average net assets over the calculation period. For the purposes of this calculation, a security’s income is based on its current market yield to maturity (for bonds), its actual income (for asset-backed securities), or its projected dividend yield (for stocks). Because the SEC yield represents hypothetical annualized income, it will differ—at times significantly—from the fund’s actual experience. As a result, the fund’s income distributions may be higher or lower than implied by the SEC yield.
Beta. A measure of the magnitude of a fund’s past share-price fluctuations in relation to the ups and downs of a given market index. The index is assigned a beta of 1.00. Compared with a given index, a fund with a beta of 1.20 typically would have seen its share price rise or fall by 12% when the index rose or fell by 10%. For this report, beta is based on returns over the past 36 months for both the fund and the index. Note that a fund’s beta should be reviewed in conjunction with its R-squared (see definition). The lower the R-squared, the less correlation there is between the fund and the index, and the less reliable beta is as an indicator of volatility.
Dividend Yield. Dividend income earned by stocks, expressed as a percentage of the aggregate market value (or of net asset value, for a fund). The yield is determined by dividing the amount of the annual dividends by the aggregate value (or net asset value) at the end of the period. For a fund, the dividend yield is based solely on stock holdings and does not include any income produced by other investments.
Earnings Growth Rate. The average annual rate of growth in earnings over the past five years for the stocks now in a fund.
Equity Exposure. A measure that reflects a fund’s investments in stocks and stock futures. Any holdings in short-term reserves are excluded.
Expense Ratio. A fund’s total annual operating expenses expressed as a percentage of the fund’s average net assets. The expense ratio includes management and administrative expenses, but does not include the transaction costs of buying and selling portfolio securities.
Foreign Holdings. The percentage of a fund represented by securities or depositary receipts of companies based outside the United States.
Inception Date. The date on which the assets of a fund (or one of its share classes) are first invested in accordance with the fund’s investment objective. For funds with a subscription period, the inception date is the day after that period ends. Investment performance is measured from the inception date.
Median Market Cap. An indicator of the size of companies in which a fund invests; the midpoint of market capitalization (market price x shares outstanding) of a fund’s stocks, weighted by the proportion of the fund’s assets invested in each stock. Stocks representing half of the fund’s assets have market capitalizations above the median, and the rest are below it.
Price/Book Ratio. The share price of a stock divided by its net worth, or book value, per share.
For a fund, the weighted average price/book ratio of the stocks it holds.
27
Price/Earnings Ratio. The ratio of a stock’s current price to its per-share earnings over the past year. For a fund, the weighted average P/E of the stocks it holds. P/E is an indicator of market expectations about corporate prospects; the higher the P/E, the greater the expectations for a company’s future growth.
R-Squared. A measure of how much of a fund’s past returns can be explained by the returns from the market in general, as measured by a given index. If a fund’s total returns were precisely synchronized with an index’s returns, its R-squared would be 1.00. If the fund’s returns bore no relationship to the index’s returns, its R-squared would be 0. For this report, R-squared is based on returns over the past 36 months for both the fund and the index.
Return on Equity. The annual average rate of return generated by a company during the past five years for each dollar of shareholder’s equity (net income divided by shareholder’s equity). For a fund, the weighted average return on equity for the companies whose stocks it holds.
Short-Term Reserves. The percentage of a fund invested in highly liquid, short-term securities that can be readily converted to cash.
Turnover Rate. An indication of the fund’s trading activity. Funds with high turnover rates incur higher transaction costs and may be more likely to distribute capital gains (which may be taxable to investors). The turnover rate excludes in-kind transactions, which have minimal impact on costs.
28
The Global Industry Classification Standard (“GICS”) was developed by and is the exclusive property and a service mark of MSCI Inc. (“MSCI”) and Standard and Poor’s, a division of McGraw-Hill Companies, Inc. (“S&P”), and is licensed for use by Vanguard. Neither MSCI, S&P nor any third party involved in making or compiling the GICS or any GICS classification makes any express or implied warranties or representations with respect to such standard or classification (or the results to be obtained by the use thereof), and all such parties hereby expressly disclaim all warranties of originality, accuracy, completeness, merchantability or fitness for a particular purpose with respect to any such standard or classification. Without limiting any of the foregoing, in no event shall MSCI, S&P, any of its affiliates or any third party involved in making or compiling the GICS or any GICS classification have any liability for any direct, indirect, special, punitive, consequential or any other damages (including lost profits) even if notified of the possibility of such damages.
29
This page intentionally left blank.
The People Who Govern Your Fund
The trustees of your mutual fund are there to see that the fund is operated and managed in your best interests since, as a shareholder, you are a part owner of the fund. Your fund’s trustees also serve on the board of directors of The Vanguard Group, Inc., which is owned by the Vanguard funds and provides services to them on an at-cost basis.
A majority of Vanguard’s board members are independent, meaning that they have no affiliation with Vanguard or the funds they oversee, apart from the sizable personal investments they have made as private individuals. The independent board members have distinguished backgrounds in business, academia, and public service. Each of the trustees and executive officers oversees 211 Vanguard funds.
Information for each trustee and executive officer of the fund appears below. The mailing address of the trustees and officers is P.O. Box 876, Valley Forge, PA 19482. More information about the trustees is in the Statement of Additional Information, which can be obtained, without charge, by contacting Vanguard at 800-662-7447, or online at vanguard.com.
Interested Trustees1
F. William McNabb III
Born in 1957. Trustee since July 2009. Principal occupation(s) during the past five years and other experience: chairman of the board (January 2010–present) of Vanguard and of each of the investment companies served by Vanguard, trustee (2009–present) of each of the investment companies served by Vanguard, and director (2008–present) of Vanguard. Chief executive officer and president (2008–2017) of Vanguard and each of the investment companies served by Vanguard, managing director (1995–2008) of Vanguard, and director (1997–2018) of Vanguard Marketing Corporation. Director (2018–present) of UnitedHealth Group.
Mortimer J. Buckley
Born in 1969. Trustee since January 2018. Principal occupation(s) during the past five years and other experience: chief executive officer (January 2018–present) of Vanguard; chief executive officer, president, and trustee (January 2018–present) of each of the investment companies served by Vanguard; president and director (2017–present) of Vanguard; and president (February 2018–present) of Vanguard Marketing Corporation. Chief investment officer (2013–2017), managing director (2002–2017), head of the Retail Investor Group (2006–2012), and chief information officer (2001–2006) of Vanguard. Chairman of the board (2011–2017) of the Children’s Hospital of Philadelphia.
Independent Trustees
Emerson U. Fullwood
Born in 1948. Trustee since January 2008. Principal occupation(s) during the past five years and other experience: executive chief staff and marketing officer for North America and corporate vice president (retired 2008) of Xerox Corporation (document management products and services). Former president of the Worldwide Channels Group, Latin America, and Worldwide Customer Service and executive chief staff officer of Developing Markets of Xerox. Executive in residence and 2009–2010 Distinguished Minett Professor at the Rochester Institute of Technology. Lead director of SPX FLOW, Inc. (multi-industry manufacturing). Director of the University of Rochester Medical Center, the Monroe Community College Foundation, the United Way of Rochester, North Carolina A&T University, and Roberts Wesleyan College. Trustee of the University of Rochester.
Amy Gutmann
Born in 1949. Trustee since June 2006. Principal occupation(s) during the past five years and other experience: president (2004–present) of the University of Pennsylvania. Christopher H. Browne Distinguished Professor of Political Science, School of Arts and Sciences, and professor of communication, Annenberg School for Communication, with secondary faculty appointments in the Department of Philosophy, School of Arts and Sciences, and at the Graduate School of Education, University of Pennsylvania. Trustee of the National Constitution Center.
1 Mr. McNabb and Mr. Buckley are considered “interested persons,” as defined in the Investment Company Act of 1940, because they are officers of the Vanguard funds.
JoAnn Heffernan Heisen
Born in 1950. Trustee since July 1998. Principal occupation(s) during the past five years and other experience: corporate vice president of Johnson & Johnson (pharmaceuticals/medical devices/consumer products) and member of its executive committee (1997–2008). Chief global diversity officer (retired 2008), vice president and chief information officer (1997–2006), controller (1995–1997), treasurer (1991–1995), and assistant treasurer (1989–1991) of Johnson & Johnson. Director of Skytop Lodge Corporation (hotels) and the Robert Wood Johnson Foundation. Member of the advisory board of the Institute for Women’s Leadership at Rutgers University.
F. Joseph Loughrey
Born in 1949. Trustee since October 2009. Principal occupation(s) during the past five years and other experience: president and chief operating officer (retired 2009) and vice chairman of the board (2008–2009) of Cummins Inc. (industrial machinery). Chairman of the board of Hillenbrand, Inc. (specialized consumer services), Oxfam America, and the Lumina Foundation for Education. Director of the V Foundation for Cancer Research. Member of the advisory council for the College of Arts and Letters and chair of the advisory board to the Kellogg Institute for International Studies, both at the University of Notre Dame.
Mark Loughridge
Born in 1953. Trustee since March 2012. Principal occupation(s) during the past five years and other experience: senior vice president and chief financial officer (retired 2013) of IBM (information technology services). Fiduciary member of IBM’s Retirement Plan Committee (2004–2013), senior vice president and general manager (2002–2004) of IBM Global Financing, vice president and controller (1998–2002) of IBM, and a variety of other prior management roles at IBM. Member of the Council on Chicago Booth.
Scott C. Malpass
Born in 1962. Trustee since March 2012. Principal occupation(s) during the past five years and other experience: chief investment officer (1989–present) and vice president (1996–present) of the University of Notre Dame. Assistant professor of finance at the Mendoza College of Business, University of Notre Dame, and member of the Notre Dame 403(b) Investment Committee. Chairman of the board of TIFF Advisory Services, Inc. Member of the board of Catholic Investment Services, Inc. (investment advisors), the board of advisors for Spruceview Capital Partners, and the board of superintendence of the Institute for the Works of Religion.
Deanna Mulligan
Born in 1963. Trustee since January 2018. Principal occupation(s) during the past five years and other experience: president (2010–present) and chief executive officer (2011–present) of The Guardian Life Insurance Company of America. Chief operating officer (2010–2011) and executive vice president (2008–2010) of Individual Life and Disability of The Guardian Life Insurance Company of America. Member of the board of The Guardian Life Insurance Company of America, the American Council of Life Insurers, the Partnership for New York City (business leadership), and the Committee Encouraging Corporate Philanthropy. Trustee of the Economic Club of New York and the Bruce Museum (arts and science). Member of the Advisory Council for the Stanford Graduate School of Business.
André F. Perold
Born in 1952. Trustee since December 2004. Principal occupation(s) during the past five years and other experience: George Gund Professor of Finance and Banking, Emeritus at the Harvard Business School (retired 2011). Chief investment officer and co-managing partner of HighVista Strategies LLC (private investment firm). Overseer of the Museum of Fine Arts Boston.
Sarah Bloom Raskin
Born in 1961. Trustee since January 2018. Principal occupation(s) during the past five years and other experience: deputy secretary (2014–2017) of the United States Department of the Treasury. Governor (2010–2014) of the Federal Reserve Board. Commissioner (2007–2010) of financial regulation for the State of Maryland. Member of the board of directors (2012–2014) of Neighborhood Reinvestment Corporation. Director of i(x) Investments, LLC.
Peter F. Volanakis
Born in 1955. Trustee since July 2009. Principal occupation(s) during the past five years and other experience: president and chief operating officer (retired 2010) of Corning Incorporated (communications equipment) and director of Corning Incorporated (2000–2010) and Dow Corning (2001–2010). Director (2012) of SPX Corporation (multi-industry manufacturing). Overseer of the Amos Tuck School of Business Administration, Dartmouth College (2001–2013). Chairman of the board of trustees of Colby-Sawyer College. Member of the Board of Hypertherm Inc. (industrial cutting systems, software, and consumables).
Executive Officers
Glenn Booraem
Born in 1967. Principal occupation(s) during the past five years and other experience: principal of Vanguard. Investment stewardship officer (2017–present), treasurer (2015–2017), controller (2010–2015), and assistant controller (2001–2010) of each of the investment companies served by Vanguard.
Christine M. Buchanan
Born in 1970. Principal occupation(s) during the past five years and other experience: principal of Vanguard and global head of Fund Administration at Vanguard. Treasurer (2017–present) of each of the investment companies served by Vanguard. Partner (2005–2017) at KPMG LLP (audit, tax, and advisory services).
Brian Dvorak
Born in 1973. Principal occupation(s) during the past five years and other experience: principal of Vanguard. Chief compliance officer (2017–present) of Vanguard and each of the investment companies served by Vanguard. Assistant vice president (2017–present) of Vanguard Marketing Corporation. Vice president and director of Enterprise Risk Management (2011–2013) at Oppenheimer Funds, Inc.
Thomas J. Higgins
Born in 1957. Principal occupation(s) during the past five years and other experience: principal of Vanguard. Chief financial officer (2008–present) and treasurer (1998–2008) of each of the investment companies served by Vanguard.
Peter Mahoney
Born in 1974. Principal occupation(s) during the past five years and other experience: principal of Vanguard. Controller (2015–present) of each of the investment companies served by Vanguard. Head of International Fund Services (2008–2014) at Vanguard.
Anne E. Robinson
Born in 1970. Principal occupation(s) during the past five years and other experience: general counsel (2016–present) of Vanguard. Secretary (2016–present) of Vanguard and of each of the investment companies served by Vanguard. Managing director (2016–present) of Vanguard. Director and senior vice president (2016–2018) of Vanguard Marketing Corporation. Managing director and general counsel of Global Cards and Consumer Services (2014–2016) at Citigroup. Counsel (2003–2014) at American Express.
Michael Rollings
Born in 1963. Principal occupation(s) during the past five years and other experience: finance director (2017–present) and treasurer (2017) of each of the investment companies served by Vanguard. Managing director (2016–present) of Vanguard. Chief financial officer (2016–present) of Vanguard. Director (2016–present) of Vanguard Marketing Corporation. Executive vice president and chief financial officer (2006–2016) of MassMutual Financial Group.
| |
| Vanguard Senior Management Team |
| |
| Joseph Brennan | Chris D. McIsaac |
| Mortimer J. Buckley | James M. Norris |
| Gregory Davis | Thomas M. Rampulla |
| John James | Karin A. Risi |
| Martha G. King | Anne E. Robinson |
| John T. Marcante | Michael Rollings |
Chairman Emeritus and Senior Advisor
John J. Brennan
Chairman, 1996–2009
Chief Executive Officer and President, 1996–2008
Founder
John C. Bogle
Chairman and Chief Executive Officer, 1974–1996

P.O. Box 2600
Valley Forge, PA 19482-2600
Connect with Vanguard® > vanguard.com
Fund Information > 800-662-7447
Direct Investor Account Services > 800-662-2739 Institutional Investor Services > 800-523-1036 Text Telephone for People Who Are Deaf or Hard of Hearing > 800-749-7273
This material may be used in conjunction with the offering of shares of any Vanguard fund only if preceded or accompanied by the fund’s current prospectus.
All comparative mutual fund data are from Lipper, a Thomson Reuters Company, or Morningstar, Inc., unless otherwise noted.
You can obtain a free copy of Vanguard’s proxy voting guidelines by visiting vanguard.com/proxyreporting or by calling Vanguard at 800-662-2739. The guidelines are also available from the SEC’s website, sec.gov. In addition, you may obtain a free report on how your fund voted the proxies for securities it owned during the 12 months ended June 30. To get the report, visit either vanguard.com/proxyreporting or sec.gov.
You can review and copy information about your fund at the SEC’s Public Reference Room in Washington, D.C. To find out more about this public service, call the SEC at 202-551-8090. Information about your fund is also available on the SEC’s website, and you can receive copies of this information, for a fee, by sending a request in either of two ways: via email addressed to publicinfo@sec.gov or via regular mail addressed to the Public Reference Section, Securities and Exchange Commission, Washington, DC 20549-1520.
Source for Bloomberg Barclays indexes: Bloomberg Index Services Limited. Copyright 2018, Bloomberg. All rights reserved.
© 2018 The Vanguard Group, Inc. All rights reserved.
Vanguard Marketing Corporation, Distributor.
Q1240 112018

Annual Report | September 30, 2018
Vanguard Capital Value Fund
Vanguard’s Principles for Investing Success
We want to give you the best chance of investment success. These principles, grounded in Vanguard’s research and experience, can put you on the right path.
Goals. Create clear, appropriate investment goals.
Balance. Develop a suitable asset allocation using broadly diversified funds. Cost. Minimize cost.
Discipline. Maintain perspective and long-term discipline.
A single theme unites these principles: Focus on the things you can control.
We believe there is no wiser course for any investor.
| |
| Contents | |
| Your Fund’s Performance at a Glance. | 1 |
| CEO’s Perspective. | 3 |
| Advisor’s Report. | 5 |
| Fund Profile. | 8 |
| Performance Summary. | 9 |
| Financial Statements. | 11 |
| Your Fund’s After-Tax Returns. | 25 |
| About Your Fund’s Expenses. | 26 |
| Glossary. | 28 |
Please note: The opinions expressed in this report are just that—informed opinions. They should not be considered promises or advice. Also, please keep in mind that the information and opinions cover the period through the date on the front of this report. Of course, the risks of investing in your fund are spelled out in the prospectus.
See the Glossary for definitions of investment terms used in this report.
Your Fund’s Performance at a Glance
• Vanguard Capital Value Fund returned 8.48% for the 12 months ended September 30,
2018. It trailed its benchmark and the average return of its peers.
• The advisor’s strong selections in the consumer staples, real estate, industrial,
and consumer discretionary sectors helped relative returns.
• The fund’s holdings in health care, financials, and information technology lagged
their benchmark counterparts and detracted from results.
• The fund’s average annual return for the ten years ended September 30, 2018,
outpaced those of its benchmark and its peers.
| |
| Total Returns: Fiscal Year Ended September 30, 2018 | |
| | Total |
| | Returns |
| Vanguard Capital Value Fund | 8.48% |
| Russell 3000 Value Index | 9.46 |
| Multi-Cap Value Funds Average | 9.60 |
Multi-Cap Value Funds Average: Derived from data provided by Lipper, a Thomson Reuters Company.
| |
| Total Returns: Ten Years Ended September 30, 2018 | |
| | Average |
| | Annual Return |
| Capital Value Fund | 12.17% |
| Russell 3000 Value Index | 9.76 |
| Multi-Cap Value Funds Average | 9.49 |
Multi-Cap Value Funds Average: Derived from data provided by Lipper, a Thomson Reuters Company.
The figures shown represent past performance, which is not a guarantee of future results. (Current performance may be lower or higher than the performance data cited. For performance data current to the most recent month-end, visit our website at vanguard.com/performance.) Note, too, that both investment returns and principal value can fluctuate widely, so an investor’s shares, when sold, could be worth more or less than their original cost.
1
| | |
| Expense Ratios | | |
| Your Fund Compared With Its Peer Group | | |
| | | Peer Group |
| | Fund | Average |
| Capital Value Fund | 0.27% | 1.06% |
The fund expense ratio shown is from the prospectus dated January 26, 2018, and represents estimated costs for the current fiscal year. For the fiscal year ended September 30, 2018, the fund’s expense ratio was 0.29%. The peer-group expense ratio is derived from data provided by Lipper, a Thomson Reuters Company, and captures information through year-end 2017.
Peer group: Multi-Cap Value Funds.
2
CEO’s Perspective

Tim Buckley
President and Chief Executive Officer
Dear Shareholder,
Over the years, I’ve found that prudent investors exhibit a common trait: discipline. No matter how the markets move or what new investing fad hits the headlines, those who stay focused on their goals and tune out the noise are set up for long-term success.
The prime gateway to investing is saving, and you don’t usually become a saver without a healthy dose of discipline. Savers make the decision to sock away part of their income, which means spending less and delaying gratification, no matter how difficult that may be.
Of course, disciplined investing extends beyond diligent saving. The financial markets, in the short term especially, are unpredictable; I have yet to meet the investor who can time them perfectly. It takes discipline to resist the urge to go all-in when markets are frothy or to retreat when things look bleak.
Staying put with your investments is one strategy for handling volatility. Another, rebalancing, requires even more discipline because it means steering your money away from strong performers and toward poorer performers.
Patience—a form of discipline—is also the friend of long-term investors. Higher returns are the potential reward for weathering the market’s turbulence and uncertainty.
3
We have been enjoying one of the longest bull markets in history, but it won’t continue forever. Prepare yourself now for how you will react when volatility comes back. Don’t panic. Don’t chase returns or look for answers outside the asset classes you trust. And be sure to rebalance periodically, even when there’s turmoil.
Whether you’re a master of self-control, get a boost from technology, or work with a professional advisor, know that discipline
is necessary to get the most out of your investment portfolio. And know that Vanguard is with you for the entire ride.
Thank you for your continued loyalty.

Mortimer J. Buckley
President and Chief Executive Officer
October 18, 2018
| | | |
| Market Barometer | | | |
| | | Average Annual Total Returns |
| | Periods Ended September 30, 2018 |
| | One Year | Three Years | Five Years |
| Stocks | | | |
| Russell 1000 Index (Large-caps) | 17.76% | 17.07% | 13.67% |
| Russell 2000 Index (Small-caps) | 15.24 | 17.12 | 11.07 |
| Russell 3000 Index (Broad U.S. market) | 17.58 | 17.07 | 13.46 |
| FTSE All-World ex US Index (International) | 2.13 | 10.18 | 4.51 |
| |
| Bonds | | | |
| Bloomberg Barclays U.S. Aggregate Bond Index | | | |
| (Broad taxable market) | -1.22% | 1.31% | 2.16% |
| Bloomberg Barclays Municipal Bond Index | | | |
| (Broad tax-exempt market) | 0.35 | 2.24 | 3.54 |
| FTSE Three-Month U. S. Treasury Bill Index | 1.57 | 0.80 | 0.48 |
| |
| CPI | | | |
| Consumer Price Index | 2.28% | 1.99% | 1.52% |
4
Advisor’s Report
For the 12 months ended September 30, 2018, Vanguard Capital Value Fund returned 8.48%, lagging its benchmark, the Russell 3000 Value Index.
Investment environment
Ten of the 11 sectors in the index posted positive absolute total returns. The information technology, health care, and energy sectors exceeded the overall benchmark return by a wide margin. All other sectors trailed the overall benchmark’s result, while the less-cyclical consumer staples sector was the only one to post a negative absolute total return.
We reduced the fund’s holdings in financials and consumer discretionary as we felt the benefits to their earnings from rising interest rates and consumer discretionary income were becoming well-appreciated by investors. We found more interesting value among companies with idiosyncratic challenges in other segments of the market. For example, we added to industrials, telecommunication services, energy, and materials, where we saw attractive risk-reward opportunities in specific stocks.
Our shortfalls
Our security selections were strongest in real estate, consumer staples, and industrials but proved more difficult in financials, health care, and information technology. Positive sector allocation, particularly overweighting information technology and underweighting financials, partially offset the weakness from stock selection.
Shares of British American Tobacco (BAT) were the fund’s largest detractors during the year, despite generally positive performance from consumer staples overall. BAT’s earnings growth trajectory slowed because of weakness in certain foreign currencies, including the Russian ruble, Brazilian real, and South African rand. However, most of the stock’s decline came from compression of the valuation investors placed on those earnings based on concerns over competitive threats from nontraditional entrants such as the e-cigarette maker JUUL.
The stock price of disk-drive and flash-memory producer Western Digital (WD) stumbled. Market participants sold out amid early evidence that the company’s extended string of above-normal earnings reports and guidance raises was coming to a cyclical end. While we were aware that the company’s profits would slide from their recent peak, the drop in valuation has been stunning.
At the time of this writing, WD shares traded for less than four times the earnings the company reported in the last 12 months through June 2018. By comparison, the Standard & Poor’s 500 Index stocks traded at almost 20 times their earnings for the same period. The collapse in profitability implied by that comparison is massive, even if WD’s stock is usually valued at some discount to the market at most points in the economic cycle. We believe the stock is significantly undervalued. It remains a holding in the
5
fund, although we recognize others may wait for earnings to bottom out and turn positive before returning.
Insurer MetLife also underperformed, despite benefiting from rising long-term interest rates. The company disclosed two material weaknesses (one of them unfavorable to prior reported earnings, the other favorable) in its accounting practices. The net effect was not large relative to shareholders’ equity or ongoing earnings prospects. We continue to hold the stock, although its valuation was hurt as the company’s internal controls were called into question.
Our successes
On the positive side, the timely purchase of grocery retailer Kroger in the face of rising competitive threats from Amazon, Walmart, and others made it the fund’s top contributor. (The decision to avoid struggling industrial conglomerate General Electric was actually even more favorable in terms of performance relative to the Russell 3000 Value Index.)
Kroger benefited nicely from the reduction in corporate tax rates, allowing the company to appease several of its constituencies. It let some earnings flow through to shareholders, some to workers in the form of higher wages and benefits, and a third portion to customers through targeted price reductions. Along with an uptick in same-store sales growth, these decisions helped improve investor sentiment about future earnings prospects, and the valuation increased accordingly.
Bermuda-based insurer XL Group was among the fund’s top contributors after the company agreed to a takeover approach from AXA, Europe’s second-largest insurance provider. Athletic apparel-maker Under Armour also appreciated strongly as the company made progress toward streamlining its product offering, improving its operations, and gaining more control over its cost structure. In both cases, our team felt the shares had reached a fair value, and the fund sold its holdings.
Fund positioning and outlook
At the end of September, the fund’s most significant overweightings relative to the Russell 3000 Value Index were in materials, real estate, energy, information technology, and industrials.
In industrials, we added holdings in Delta Air Lines and Southwest Airlines. Outsized capacity additions by competitor United Airlines spread worries of a market-share battle, particularly in some of Delta’s markets. Southwest also took a hit to its earnings in the aftermath of a tragic engine failure that caused the death of a passenger. Price cuts to attract passengers back following that accident, along with some struggles in implementing a new reservation system, caused difficult temporary revenue comparisons.
Airline earnings can be volatile, and their stocks have traded at sizable discounts to the broad market even during good times. However, we believe that both Delta and Southwest are in good positions to
6
generate and distribute high free cash flow to shareholders because of their clean balance sheets and controlled capital-spending plans.
In energy, we initiated positions in Chevron and Concho Resources. We believe that Chevron has an attractive free-cash-flow yield and dividend, as well as less country risk than other major oil companies. In Texas, Permian Basin producers have temporarily outgrown the available capacity of pipelines to transport oil and gas to the market. But we believe Concho is well-positioned to outperform over the longer term, particularly after announcing its agreement to acquire RSP Permian in an all-stock transaction. We believe this will boost future free-cash-flow generation.
The economy is moving at a steady clip. However, we recognize the potential for negative surprises, especially as a result of trade frictions with China, the lagging effect of interest rate hikes, Brexit, and other factors. The net result of purchases and sales during the year has moderately reduced the fund’s exposure—as measured by sector weights, market beta, financial leverage, and other metrics—to an unfavorable shift in expectations.
We will, as contrarian value investors, look to areas of the market characterized by investor unease and a wide range of potential outcomes as fertile fishing ponds for new ideas. We are focusing more intently today on companies with the potential to help themselves out of temporary difficulty rather than those needing a big boost from an accelerating economy. We appreciate the trust of the Capital Value Fund’s shareholders and believe that your confidence will be justified by the performance of the fund’s holdings over a full market cycle.
Respectfully,
David W. Palmer, CFA
Senior Managing Director
and Equity Portfolio Manager
Wellington Management Company llp
October 10, 2018
7
Capital Value Fund
Fund Profile
As of September 30, 2018
| | | |
| Portfolio Characteristics | | |
| | | Russell | DJ |
| | | 3000 | U.S. Total |
| | | Value | Market |
| | Fund | Index | FA Index |
| Number of Stocks | 88 | 2,113 | 3,825 |
| Median Market Cap | $27.4B | $58.1B | $73.9B |
| Price/Earnings Ratio | 13.0x | 16.3x | 21.0x |
| Price/Book Ratio | 1.8x | 2.0x | 3.1x |
| Return on Equity | 10.6% | 11.6% | 14.9% |
| Earnings Growth Rate | 14.0% | 5.7% | 8.5% |
| Dividend Yield | 2.4% | 2.3% | 1.7% |
| Foreign Holdings | 11.4% | 0.0% | 0.0% |
| Turnover Rate | 47% | — | — |
| Ticker Symbol | VCVLX | — | — |
| Expense Ratio1 | 0.27% | — | — |
| 30-Day SEC Yield | 2.23% | — | — |
| Short-Term Reserves | 0.7% | — | — |
| |
| Sector Diversification (% of equity exposure) |
| | Fund |
| Consumer Discretionary | 6.3% |
| Consumer Staples | 7.5 |
| Energy | 12.4 |
| Financials | 19.4 |
| Health Care | 10.4 |
| Industrials | 9.4 |
| Information Technology | 11.2 |
| Materials | 7.2 |
| Real Estate | 7.8 |
| Telecommunication Services | 3.0 |
| Utilities | 5.4 |
Sector categories are based on the Global Industry Classification Standard (“GICS”), except for the “Other” category (if applicable), which includes securities that have not been provided a GICS classification as of the effective reporting period.
| | |
| Volatility Measures | | |
| | Russell | DJ |
| | 3000 | U.S. Total |
| | Value | Market |
| | Index | FA Index |
| R-Squared | 0.90 | 0.81 |
| Beta | 1.21 | 1.17 |
These measures show the degree and timing of the fund’s fluctuations compared with the indexes over 36 months.
| | |
| Ten Largest Holdings (% of total net assets) |
| MetLife Inc. | Life & Health | |
| | Insurance | 3.2% |
| Citigroup Inc. | Diversified Banks | 3.2 |
| Verizon Communications Integrated | |
| Inc. | Telecommunication | |
| | Services | 3.0 |
| Wells Fargo & Co. | Diversified Banks | 2.6 |
| Comcast Corp. | Cable & Satellite | 2.4 |
| PNC Financial Services | | |
| Group Inc. | Regional Banks | 2.1 |
| Chevron Corp. | Integrated Oil & Gas | 2.0 |
| Celanese Corp. | Specialty Chemicals | 1.9 |
| Canadian Natural | Oil & Gas Exploration | |
| Resources Ltd. | & Production | 1.8 |
| Host Hotels & Resorts | | |
| Inc. | Hotel & Resort REITs | 1.8 |
| Top Ten | | 24.0% |
The holdings listed exclude any temporary cash investments and equity index products.
Investment Focus

1 The expense ratio shown is from the prospectus dated January 26, 2018, and represents estimated costs for the current fiscal year. For the fiscal year ended September 30, 2018, the expense ratio was 0.29%.
8
Capital Value Fund
Performance Summary
All of the returns in this report represent past performance, which is not a guarantee of future results that may be achieved by the fund. (Current performance may be lower or higher than the performance data cited. For performance data current to the most recent month-end, visit our website at vanguard.com/performance.) Note, too, that both investment returns and principal value can fluctuate widely, so an investor’s shares, when sold, could be worth more or less than their original cost. The returns shown do not reflect taxes that a shareholder would pay on fund distributions or on the sale of fund shares.
Cumulative Performance: September 30, 2008, Through September 30, 2018
Initial Investment of $10,000
| | | | |
| | Average Annual Total Returns | |
| | Periods Ended September 30, 2018 | |
| | | | | Final Value |
| | One | Five | Ten | of a $10,000 |
| | Year | Years | Years | Investment |
| Capital Value Fund* | 8.48% | 6.34% | 12.17% | $31,546 |
| Russell 3000 Value Index | 9.46 | 10.65 | 9.76 | 25,383 |
| Multi-Cap Value Funds Average | 9.60 | 9.54 | 9.49 | 24,763 |
| Dow Jones U.S. Total Stock Market | | | | |
| Float Adjusted Index | 17.58 | 13.42 | 12.05 | 31,191 |
Multi-Cap Value Funds Average: Derived from data provided by Lipper, a Thomson Reuters Company.
See Financial Highlights for dividend and capital gains information.
9
Capital Value Fund
Fiscal-Year Total Returns (%): September 30, 2008, Through September 30, 2018

10
Capital Value Fund
Financial Statements
Statement of Net Assets
As of September 30, 2018
The fund reports a complete list of its holdings in regulatory filings four times in each fiscal year, at the quarter-ends. For the second and fourth fiscal quarters, the lists appear in the fund’s semiannual and annual reports to shareholders. For the first and third fiscal quarters, the fund files the lists with the Securities and Exchange Commission on Form N-Q. Shareholders can look up the fund’s Forms N-Q on the SEC’s website at sec.gov. Forms N-Q may also be reviewed and copied at the SEC’s Public Reference Room (see the back cover of this report for further information).
| | | |
| | | | Market |
| | | | Value• |
| | | Shares | ($000) |
| Common Stocks (99.5%) | | |
| Consumer Discretionary (6.2%) | |
| | Comcast Corp. Class A | 581,506 | 20,591 |
| | Newell Brands Inc. | 531,523 | 10,790 |
| * | Skechers U. S. A. Inc. | | |
| | Class A | 297,400 | 8,307 |
| | General Motors Co. | 239,329 | 8,058 |
| | Expedia Group Inc. | 51,335 | 6,698 |
| | | | 54,444 |
| Consumer Staples (7.5%) | | |
| | Walgreens Boots | | |
| | Alliance Inc. | 195,511 | 14,253 |
| | British American | | |
| | Tobacco plc | 264,747 | 12,343 |
| | Philip Morris | | |
| | International Inc. | 141,729 | 11,556 |
| | Hormel Foods Corp. | 188,600 | 7,431 |
| | Kroger Co. | 242,559 | 7,061 |
| | Coty Inc. Class A | 523,201 | 6,571 |
| | Archer-Daniels-Midland | | |
| | Co. | 118,400 | 5,952 |
| | | | 65,167 |
| Energy (12.3%) | | |
| | Chevron Corp. | 142,181 | 17,386 |
| | Canadian Natural | | |
| | Resources Ltd. | 493,983 | 16,133 |
| | Cimarex Energy Co. | 120,664 | 11,214 |
| | Halliburton Co. | 270,022 | 10,944 |
| | Anadarko Petroleum | | |
| | Corp. | 144,543 | 9,744 |
| * | Concho Resources Inc. | 59,500 | 9,089 |
| | Marathon Oil Corp. | 358,643 | 8,349 |
| | Tenaris SA ADR | 223,500 | 7,492 |
| | Diamondback Energy Inc. | 53,731 | 7,264 |
| | Pioneer Natural | | |
| | Resources Co. | 30,341 | 5,285 |
| * | Laredo Petroleum Inc. | 575,300 | 4,700 |
| | | | 107,600 |
| | | |
| Financials (19.2%) | | |
| | MetLife Inc. | 604,873 | 28,260 |
| | Citigroup Inc. | 384,996 | 27,620 |
| | Wells Fargo & Co. | 435,316 | 22,880 |
| | PNC Financial Services | | |
| | Group Inc. | 137,281 | 18,696 |
| | American International | | |
| | Group Inc. | 285,302 | 15,189 |
| | RenaissanceRe | | |
| | Holdings Ltd. | 105,968 | 14,155 |
| * | Bank OZK | 283,865 | 10,776 |
| | Unum Group | 250,585 | 9,790 |
| | CNO Financial Group Inc. | 377,100 | 8,002 |
| | Arthur J Gallagher & Co. | 95,266 | 7,092 |
| | Lancashire Holdings Ltd. | 675,641 | 5,352 |
| | | | 167,812 |
| Health Care (10.4%) | | |
| * | Mylan NV | 386,418 | 14,143 |
| | Bristol-Myers Squibb Co. | 225,097 | 13,974 |
| | McKesson Corp. | 96,363 | 12,783 |
| | Allergan plc | 53,956 | 10,277 |
| * | Biogen Inc. | 29,035 | 10,258 |
| | Koninklijke Philips NV | 214,600 | 9,766 |
| * | Seattle Genetics Inc. | 88,000 | 6,787 |
| * | Incyte Corp. | 88,400 | 6,107 |
| | AstraZeneca plc ADR | 128,100 | 5,069 |
| * | Five Prime Therapeutics | | |
| | Inc. | 91,300 | 1,271 |
| | | | 90,435 |
| Industrials (9.3%) | | |
| | Southwest Airlines Co. | 200,200 | 12,502 |
| | Steelcase Inc. Class A | 640,343 | 11,846 |
| | Herman Miller Inc. | 269,015 | 10,330 |
| | Delta Air Lines Inc. | 170,000 | 9,831 |
| * | Genesee & Wyoming | | |
| | Inc. Class A | 99,404 | 9,045 |
| | Sanwa Holdings Corp. | 755,500 | 8,996 |
11
| | | |
| Capital Value Fund | | |
| |
| |
| |
| | | | Market |
| | | | Value• |
| | | Shares | ($000) |
| | Johnson Controls | | |
| | International plc | 234,600 | 8,211 |
| | Fortune Brands Home | | |
| | & Security Inc. | 156,400 | 8,189 |
| * | JELD-WEN Holding Inc. | 98,199 | 2,422 |
| | | | 81,372 |
| Information Technology (11.2%) | |
| | QUALCOMM Inc. | 181,075 | 13,043 |
| | Western Digital Corp. | 205,369 | 12,022 |
| | KLA-Tencor Corp. | 117,997 | 12,001 |
| | Broadcom Inc. | 46,500 | 11,473 |
| | Genpact Ltd. | 350,784 | 10,738 |
| | Amdocs Ltd. | 136,200 | 8,987 |
| | Samsung Electronics | | |
| | Co. Ltd. | 174,624 | 7,308 |
| * | Coherent Inc. | 38,100 | 6,560 |
| | Marvell Technology | | |
| | Group Ltd. | 327,300 | 6,317 |
| *,^ | Acacia | | |
| | Communications Inc. | 110,371 | 4,566 |
| | Teradyne Inc. | 120,168 | 4,444 |
| | Silicon Motion | | |
| | Technology Corp. ADR | 3,589 | 193 |
| | | | 97,652 |
| Materials (7.1%) | | |
| | Celanese Corp. Class A | 142,245 | 16,216 |
| | Reliance Steel & | | |
| | Aluminum Co. | 184,286 | 15,718 |
| ^ | Nutrien Ltd. | 137,400 | 7,934 |
| | CRH plc | 229,083 | 7,497 |
| * | Alcoa Corp. | 155,900 | 6,298 |
| | Cabot Corp. | 73,700 | 4,622 |
| | Randgold Resources | | |
| | Ltd. ADR | 56,100 | 3,958 |
| | | | 62,243 |
| Other (0.2%) | | |
| *,§,1 Allstar Co-Invest LLC | | |
| | Private Placement | NA | 1,169 |
| |
| Real Estate (7.7%) | | |
| | Host Hotels & Resorts | | |
| | Inc. | 762,591 | 16,091 |
| | STORE Capital Corp. | 334,163 | 9,286 |
| | Columbia Property | | |
| | Trust Inc. | 380,883 | 9,004 |
| | Brixmor Property Group | | |
| | Inc. | 494,116 | 8,652 |
| | Simon Property Group | | |
| | Inc. | 45,238 | 7,996 |
| | American Tower Corp. | 46,259 | 6,722 |
| | Acadia Realty Trust | 187,700 | 5,261 |
| | Taubman Centers Inc. | 75,500 | 4,517 |
| | | | 67,529 |
| Telecommunication Services (3.0%) | |
| Verizon | | |
| Communications Inc. | 489,200 | 26,118 |
| |
| Utilities (5.4%) | | |
| Exelon Corp. | 282,211 | 12,321 |
| Edison International | 150,559 | 10,190 |
| OGE Energy Corp. | 253,065 | 9,191 |
| Sempra Energy | 68,085 | 7,745 |
| * Iberdrola SA | 1,026,659 | 7,541 |
| | | 46,988 |
| Total Common Stocks | | |
| (Cost $780,951) | | 868,529 |
| Temporary Cash Investments (1.8%) | |
| Money Market Fund (1.1%) | | |
| 2,3 Vanguard Market Liquidity | |
| Fund, 2.209% | 94,957 | 9,496 |
| |
| | Face | |
| | Amount | |
| | ($000) | |
| Repurchase Agreement (0.7%) | |
| RBS Securities, Inc. | | |
| 2.240%, 10/1/18 | | |
| (Dated 9/28/18, | | |
| Repurchase Value | | |
| $6,401,000, collateralized | |
| by U. S. Treasury | | |
| Note/Bond 1.625%, | | |
| 5/15/26, with a value of | | |
| $6,528,000) | 6,400 | 6,400 |
| Total Temporary Cash Investments | |
| (Cost $15,896) | | 15,896 |
| Total Investments (101.3%) | | |
| (Cost $796,847) | | 884,425 |
12
| |
| Capital Value Fund | |
| |
| |
| |
| |
| | Amount |
| | ($000) |
| Other Assets and Liabilities (-1.3%) | |
| Other Assets | |
| Investment in Vanguard | 45 |
| Receivables for Investment Securities Sold | 1,281 |
| Receivables for Accrued Income | 1,529 |
| Receivables for Capital Shares Issued | 212 |
| Unrealized Appreciation— | |
| Forward Currency Contracts | 150 |
| Other Assets | 184 |
| Total Other Assets | 3,401 |
| Liabilities | |
| Payables for Investment Securities | |
| Purchased | (2,377) |
| Collateral for Securities on Loan | (9,495) |
| Payables to Investment Advisor | (142) |
| Payables for Capital Shares Redeemed | (703) |
| Payables to Vanguard | (1,602) |
| Unrealized Depreciation— | |
| Forward Currency Contracts | (13) |
| Total Liabilities | (14,332) |
| Net Assets (100%) | |
| Applicable to 63,336,437 outstanding | |
| $.001 par value shares of beneficial | |
| interest (unlimited authorization) | 873,494 |
| Net Asset Value Per Share | $13.79 |
| |
| At September 30, 2018, net assets consisted of: |
| | Amount |
| | ($000) |
| Paid-in Capital | 789,611 |
| Undistributed Net Investment Income | 11,929 |
| Accumulated Net Realized Losses | (15,756) |
| Unrealized Appreciation (Depreciation) | |
| Investment Securities | 87,578 |
| Forward Currency Contracts | 137 |
| Foreign Currencies | (5) |
| Net Assets | 873,494 |
• See Note A in Notes to Financial Statements.
* Non-income-producing security.
^ Includes partial security positions on loan to broker-dealers.
The total value of securities on loan is $9,007,000.
§ Security value determined using significant unobservable
inputs.
1 Restricted security represents 0.2% of net assets. Shares not
applicable for this private placement. See Restricted Security
table for additional information.
2 Affiliated money market fund available only to Vanguard funds
and certain trusts and accounts managed by Vanguard. Rate
shown is the 7-day yield.
3 Includes $9,495,000 of collateral received for securities on loan.
ADR—American Depositary Receipt.
13
Capital Value Fund
| | |
| Restricted Securities as of Period End | | |
| |
| | | Acquisition |
| | Acquisition | Cost |
| Security Name | Date | ($000) |
| Allstar Co-Invest LLC Private Placement | August 2011 | 1,677 |
| | | | | | |
| Derivative Financial Instruments Outstanding as of Period End | | | |
| |
| Forward Currency Contracts | | | | | | |
| | | | | | | Unrealized |
| | Contract | | | | | Appreciation |
| | | | Contract Amount (000) | |
| | Settlement | | | | | (Depreciation) |
| Counterparty | Date | | Receive | | Deliver | ($000) |
| J.P. Morgan Securities LLC | 12/19/18 | USD | 7,250 | JPY | 801,276 | 150 |
| J.P. Morgan Securities LLC | 12/19/18 | USD | 5,071 | EUR | 4,348 | (13) |
| | | | | | | 137 |
| EUR—Euro. | | | | | | |
| JPY—Japanese yen. | | | | | | |
| USD—U.S. dollar. | | | | �� | | |
See accompanying Notes, which are an integral part of the Financial Statements.
14
Capital Value Fund
Statement of Operations
| |
| | Year Ended |
| | September 30, 2018 |
| | ($000) |
| Investment Income | |
| Income | |
| Dividends1 | 20,095 |
| Interest 2 | 113 |
| Securities Lending—Net | 488 |
| Total Income | 20,696 |
| Expenses | |
| Investment Advisory Fees—Note B | |
| Basic Fee | 1,996 |
| Performance Adjustment | (1,479) |
| The Vanguard Group—Note C | |
| Management and Administrative | 1,840 |
| Marketing and Distribution | 112 |
| Custodian Fees | 29 |
| Auditing Fees | 34 |
| Shareholders’ Reports and Proxy | 21 |
| Trustees’ Fees and Expenses | 2 |
| Total Expenses | 2,555 |
| Net Investment Income | 18,141 |
| Realized Net Gain (Loss) | |
| Investment Securities Sold 2 | 81,410 |
| Forward Currency Contracts | 592 |
| Foreign Currencies | (67) |
| Realized Net Gain (Loss) | 81,935 |
| Change in Unrealized Appreciation (Depreciation) | |
| Investment Securities 2 | (26,951) |
| Forward Currency Contracts | (115) |
| Foreign Currencies | 5 |
| Change in Unrealized Appreciation (Depreciation) | (27,061) |
| Net Increase (Decrease) in Net Assets Resulting from Operations | 73,015 |
1 Dividends are net of foreign withholding taxes of $167,000.
2 Interest income, realized net gain (loss), and change in unrealized appreciation (depreciation) from an affiliated company of the fund were $0, ($1,000), and ($1,000), respectively.
See accompanying Notes, which are an integral part of the Financial Statements.
15
Capital Value Fund
Statement of Changes in Net Assets
| | |
| | Year Ended September 30, |
| | 2018 | 2017 |
| | ($000) | ($000) |
| Increase (Decrease) in Net Assets | | |
| Operations | | |
| Net Investment Income | 18,141 | 18,261 |
| Realized Net Gain (Loss) | 81,935 | 69,458 |
| Change in Unrealized Appreciation (Depreciation) | (27,061) | 38,881 |
| Net Increase (Decrease) in Net Assets Resulting from Operations | 73,015 | 126,600 |
| Distributions | | |
| Net Investment Income | (17,678) | (15,817) |
| Realized Capital Gain | — | — |
| Total Distributions | (17,678) | (15,817) |
| Capital Share Transactions | | |
| Issued | 57,634 | 80,436 |
| Issued in Lieu of Cash Distributions | 16,300 | 14,657 |
| Redeemed | (159,126) | (235,684) |
| Net Increase (Decrease) from Capital Share Transactions | (85,192) | (140,591) |
| Total Increase (Decrease) | (29,855) | (29,808) |
| Net Assets | | |
| Beginning of Period | 903,349 | 933,157 |
| End of Period1 | 873,494 | 903,349 |
1 Net Assets—End of Period includes undistributed (overdistributed) net investment income of $11,929,000 and $11,533,000.
See accompanying Notes, which are an integral part of the Financial Statements.
16
Capital Value Fund
Financial Highlights
| | | | | |
| For a Share Outstanding | | | Year Ended September 30, |
| Throughout Each Period | 2018 | 2017 | 2016 | 2015 | 2014 |
| Net Asset Value, Beginning of Period | $12.96 | $11.50 | $11.45 | $15.32 | $14.57 |
| Investment Operations | | | | | |
| Net Investment Income | . 2731 | .2411 | .180 | .1291 | .1782 |
| Net Realized and Unrealized Gain (Loss) | | | | | |
| on Investments | .817 | 1.420 | 1.060 | (2.330) | 2.055 |
| Total from Investment Operations | 1.090 | 1.661 | 1.240 | (2.201) | 2.233 |
| Distributions | | | | | |
| Dividends from Net Investment Income | (. 260) | (. 201) | (.144) | (.175) | (.111) |
| Distributions from Realized Capital Gains | — | — | (1.046) | (1.494) | (1.372) |
| Total Distributions | (.260) | (.201) | (1.190) | (1.669) | (1.483) |
| Net Asset Value, End of Period | $13.79 | $12.96 | $11.50 | $11.45 | $15.32 |
| |
| Total Return3 | 8.48% | 14.56% | 11.36% | -15.67% | 16.50% |
| |
| Ratios/Supplemental Data | | | | | |
| Net Assets, End of Period (Millions) | $873 | $903 | $933 | $1,059 | $1,784 |
| Ratio of Total Expenses to Average Net Assets4 | 0.29% | 0.27% | 0.25% | 0.50% | 0.47% |
| Ratio of Net Investment Income to | | | | | |
| Average Net Assets | 2.04% | 1.97% | 1.51% | 0.93% | 1.19%2 |
| Portfolio Turnover Rate | 47% | 41% | 134% | 90% | 90% |
1 Calculated based on average shares outstanding.
2 Net investment income per share and the ratio of net investment income to average net assets include $0.18 and 0.12%,
respectively, resulting from a special dividend from Vodafone Group plc in the form of cash and shares in Verizon Communications
Inc. in February 2014.
3 Total returns do not include account service fees that may have applied in the periods shown. Fund prospectuses provide
information about any applicable account service fees.
4 Includes performance-based investment advisory fee increases (decreases) of (0.17%), (0.19%), (0.20%), 0.06%, and 0.02%.
See accompanying Notes, which are an integral part of the Financial Statements.
17
Capital Value Fund
Notes to Financial Statements
Vanguard Capital Value Fund is registered under the Investment Company Act of 1940 as an open-end investment company, or mutual fund.
A. The following significant accounting policies conform to generally accepted accounting principles for U.S. investment companies. The fund consistently follows such policies in preparing its financial statements.
1. Security Valuation: Securities are valued as of the close of trading on the New York Stock Exchange (generally 4 p.m., Eastern time) on the valuation date. Equity securities are valued at the latest quoted sales prices or official closing prices taken from the primary market in which each security trades; such securities not traded on the valuation date are valued at the mean of the latest quoted bid and asked prices. Securities for which market quotations are not readily available, or whose values have been affected by events occurring before the fund’s pricing time but after the close of the securities’ primary markets, are valued at their fair values calculated according to procedures adopted by the board of trustees. These procedures include obtaining quotations from an independent pricing service, monitoring news to identify significant market- or security-specific events, and evaluating changes in the values of foreign market proxies (for example, ADRs, futures contracts, or exchange-traded funds), between the time the foreign markets close and the fund’s pricing time. When fair-value pricing is employed, the prices of securities used by a fund to calculate its net asset value may differ from quoted or published prices for the same securities. Investments in Vanguard Market Liquidity Fund are valued at that fund’s net asset value. Temporary cash investments are valued using the latest bid prices or using valuations based on a matrix system (which considers such factors as security prices, yields, maturities, and ratings), both as furnished by independent pricing services.
2. Foreign Currency: Securities and other assets and liabilities denominated in foreign currencies are translated into U.S. dollars using exchange rates obtained from an independent third party as of the fund’s pricing time on the valuation date. Realized gains (losses) and unrealized appreciation (depreciation) on investment securities include the effects of changes in exchange rates since the securities were purchased, combined with the effects of changes in security prices. Fluctuations in the value of other assets and liabilities resulting from changes in exchange rates are recorded as unrealized foreign currency gains (losses) until the assets or liabilities are settled in cash, at which time they are recorded as realized foreign currency gains (losses).
3. Forward Currency Contracts: The fund enters into forward currency contracts to protect the value of securities and related receivables and payables against changes in future foreign exchange rates. The fund’s risks in using these contracts include movement in the values of the foreign currencies relative to the U.S. dollar and the ability of the counterparties to fulfill their obligations under the contracts. The fund mitigates its counterparty risk by entering into forward currency contracts only with a diverse group of prequalified counterparties, monitoring their financial strength, entering into master netting arrangements with its counterparties, and requiring its counterparties to transfer collateral as security for their performance. In the absence of a default, the collateral pledged or received by the fund cannot be repledged, resold, or rehypothecated. The master netting arrangements provide that, in the event of a counterparty’s default (including bankruptcy), the fund may terminate the forward currency contracts, determine the net amount owed by either party in accordance with its master netting arrangements, and sell or retain any collateral held up to the net amount owed to the fund under the master netting arrangements. The forward currency contracts contain provisions whereby a counterparty may terminate open contracts if the fund’s net assets
18
Capital Value Fund
decline below a certain level, triggering a payment by the fund if the fund is in a net liability position at the time of the termination. The payment amount would be reduced by any collateral the fund has pledged. Any assets pledged as collateral for open contracts are noted in the Statement of Net Assets. The value of collateral received or pledged is compared daily to the value of the forward currency contracts exposure with each counterparty, and any difference, if in excess of a specified minimum transfer amount, is adjusted and settled within two business days.
Forward currency contracts are valued at their quoted daily prices obtained from an independent third party, adjusted for currency risk based on the expiration date of each contract. The notional amounts of the contracts are not recorded in the Statement of Net Assets. Fluctuations in the value of the contracts are recorded in the Statement of Net Assets as an asset (liability) and in the Statement of Operations as unrealized appreciation (depreciation) until the contracts are closed, when they are recorded as realized forward currency contract gains (losses).
During the year ended September 30, 2018, the fund’s average investment in forward currency contracts represented 2% of net assets, based on the average of notional amounts at each quarter-end during the period.
4. Repurchase Agreements: The fund enters into repurchase agreements with institutional counter-parties. Securities pledged as collateral to the fund under repurchase agreements are held by a custodian bank until the agreements mature, and in the absence of a default, such collateral cannot be repledged, resold, or rehypothecated. Each agreement requires that the market value of the collateral be sufficient to cover payments of interest and principal. The fund further mitigates its counterparty risk by entering into repurchase agreements only with a diverse group of prequalified counterparties, monitoring their financial strength, and entering into master repurchase agreements with its counterparties. The master repurchase agreements provide that, in the event of a counter-party’s default (including bankruptcy), the fund may terminate any repurchase agreements with that counterparty, determine the net amount owed, and sell or retain the collateral up to the net amount owed to the fund. Such action may be subject to legal proceedings, which may delay or limit the disposition of collateral.
5. Federal Income Taxes: The fund intends to continue to qualify as a regulated investment company and distribute all of its taxable income. Management has analyzed the fund’s tax positions taken for all open federal income tax years (September 30, 2015–2018), and has concluded that no provision for federal income tax is required in the fund’s financial statements.
6. Distributions: Distributions to shareholders are recorded on the ex-dividend date. Distributions are determined on a tax basis and may differ from net investment income and realized capital gains for financial reporting purposes.
7. Securities Lending: To earn additional income, the fund lends its securities to qualified institutional borrowers. Security loans are subject to termination by the fund at any time, and are required to be secured at all times by collateral in an amount at least equal to the market value of securities loaned. Daily market fluctuations could cause the value of loaned securities to be more or less than the value of the collateral received. When this occurs, the collateral is adjusted and settled before the opening of the market on the next business day. The fund further mitigates its counterparty risk by entering into securities lending transactions only with a diverse group of prequalified counterparties, monitoring their financial strength, and entering into master securities lending
19
Capital Value Fund
agreements with its counterparties. The master securities lending agreements provide that, in the event of a counterparty’s default (including bankruptcy), the fund may terminate any loans with that borrower, determine the net amount owed, and sell or retain the collateral up to the net amount owed to the fund; however, such actions may be subject to legal proceedings. While collateral mitigates counterparty risk, in the event of a default, the fund may experience delays and costs in recovering the securities loaned. The fund invests cash collateral received in Vanguard Market Liquidity Fund, and records a liability in the Statement of Net Assets for the return of the collateral, during the period the securities are on loan. Securities lending income represents fees charged to borrowers plus income earned on invested cash collateral, less expenses associated with the loan. During the term of the loan, the fund is entitled to all distributions made on or in respect of the loaned securities.
8. Credit Facility: The fund and certain other funds managed by The Vanguard Group (“Vanguard”) participate in a $3.1 billion committed credit facility provided by a syndicate of lenders pursuant to a credit agreement that may be renewed annually; each fund is individually liable for its borrowings, if any, under the credit facility. Borrowings may be utilized for temporary and emergency purposes, and are subject to the fund’s regulatory and contractual borrowing restrictions. The participating funds are charged administrative fees and an annual commitment fee of 0.10% of the undrawn amount of the facility; these fees are allocated to the funds based on a method approved by the fund’s board of trustees and included in Management and Administrative expenses on the fund’s Statement of Operations. Any borrowings under this facility bear interest at a rate based upon the higher of the one-month London Interbank Offered Rate, federal funds effective rate, or overnight bank funding rate plus an agreed-upon spread.
The fund had no borrowings outstanding at September 30, 2018, or at any time during the period then ended.
9. Other: Dividend income is recorded on the ex-dividend date. Interest income is accrued daily. Premiums and discounts on debt securities purchased are amortized and accreted, respectively, to interest income over the lives of the respective securities. Security transactions are accounted for on the date securities are bought or sold. Costs used to determine realized gains (losses) on the sale of investment securities are those of the specific securities sold.
B. Wellington Management Company LLP provides investment advisory services to the fund for a fee calculated at an annual percentage rate of average net assets. The basic fee is subject to quarterly adjustments based on the fund’s performance relative to the Dow Jones U.S. Total Stock Market Float Adjusted Index for the preceding three years. For the year ended September 30, 2018, the investment advisory fee represented an effective annual basic rate of 0.23% of the fund’s average net assets before a decrease of $1,479,000 (0.17%) based on performance.
C. In accordance with the terms of a Funds’ Service Agreement (the “FSA”) between Vanguard and the fund, Vanguard furnishes to the fund corporate management, administrative, marketing, and distribution services at Vanguard’s cost of operations (as defined by the FSA). These costs of operations are allocated to the fund based on methods and guidelines approved by the board of trustees. Vanguard does not require reimbursement in the current period for certain costs of operations (such as deferred compensation/benefits and risk/insurance costs); the fund’s liability for these costs of operations is included in Payables to Vanguard on the Statement of Net Assets. All other costs of operations payable to Vanguard are generally settled twice a month.
20
Capital Value Fund
Upon the request of Vanguard, the fund may invest up to 0.40% of its net assets as capital in Vanguard. At September 30, 2018, the fund had contributed to Vanguard capital in the amount of $45,000, representing 0.01% of the fund’s net assets and 0.02% of Vanguard’s capitalization. The fund’s trustees and officers are also directors and employees, respectively, of Vanguard.
D. Various inputs may be used to determine the value of the fund’s investments. These inputs are summarized in three broad levels for financial statement purposes. The inputs or methodologies used to value securities are not necessarily an indication of the risk associated with investing in those securities.
Level 1—Quoted prices in active markets for identical securities.
Level 2—Other significant observable inputs (including quoted prices for similar securities, interest rates, prepayment speeds, credit risk, etc.).
Level 3—Significant unobservable inputs (including the fund’s own assumptions used to determine the fair value of investments). Any investments valued with significant unobservable inputs are noted on the Statement of Net Assets.
The following table summarizes the market value of the fund’s investments as of September 30, 2018, based on the inputs used to value them:
| | | |
| | Level 1 | Level 2 | Level 3 |
| Investments | ($000) | ($000) | ($000) |
| Common Stocks | 818,323 | 49,037 | 1,169 |
| Temporary Cash Investments | 9,496 | 6,400 | — |
| Forward Currency Contracts—Assets | — | 150 | — |
| Forward Currency Contracts—Liabilities | — | (13) | — |
| Total | 827,819 | 55,574 | 1,169 |
E. Permanent differences between book-basis and tax-basis components of net assets are reclassified among capital accounts in the financial statements to reflect their tax character. These reclassifications have no effect on net assets or net asset value per share. As of period end, the following permanent differences primarily attributable to the accounting for foreign currency transactions were reclassified to the following accounts:
| |
| | Amount |
| | ($000) |
| Paid-in Capital | — |
| Undistributed (Overdistributed) Net Investment Income | (67) |
| Accumulated Net Realized Gains (Losses) | 67 |
21
Capital Value Fund
Temporary differences between book-basis and tax-basis components of accumulated net earnings (losses) arise when certain items of income, gain, or loss are recognized in different periods for financial statement and tax purposes; these differences will reverse at some time in the future. The differences are primarily related to the tax deferral of losses on wash sales and forward currency contracts. As of period end, the tax-basis components of accumulated net earnings (losses) are detailed in the table as follows:
| |
| | Amount |
| | ($000) |
| Undistributed Ordinary Income | 13,648 |
| Undistributed Long-term Gains | — |
| Capital Loss Carryforwards (Non-expiring)* | (15,830) |
| Net Unrealized Gains (Losses) | 87,573 |
* The fund used capital loss carryforwards of $81,887,000 to offset taxable capital gains realized during the year ended
September 30, 2018, reducing the amount of capital gains that would otherwise be available to distribute to shareholders.
As of September 30, 2018, gross unrealized appreciation and depreciation for investments and derivatives based on cost for U.S. federal income tax purposes were as follows:
| |
| | Amount |
| | ($000) |
| Tax Cost | 796,847 |
| Gross Unrealized Appreciation | 123,037 |
| Gross Unrealized Depreciation | (35,459) |
| Net Unrealized Appreciation (Depreciation) | 87,578 |
F. During the year ended September 30, 2018, the fund purchased $416,951,000 of investment securities and sold $499,441,000 of investment securities, other than temporary cash investments.
| | |
| G. Capital shares issued and redeemed were: | | |
| | Year Ended September 30, |
| | 2018 | 2017 |
| | Shares | Shares |
| | (000) | (000) |
| Issued | 4,316 | 6,622 |
| Issued in Lieu of Cash Distributions | 1,227 | 1,209 |
| Redeemed | (11,915) | (19,274) |
| Net Increase (Decrease) in Shares Outstanding | (6,372) | (11,443) |
H. Management has determined that no events or transactions occurred subsequent to September 30, 2018, that would require recognition or disclosure in these financial statements.
22
Report of Independent Registered
Public Accounting Firm
To the Board of Trustees of Vanguard Malvern Funds and Shareholders of Vanguard Capital Value Fund
Opinion on the Financial Statements
We have audited the accompanying statement of net assets of Vanguard Capital Value Fund (one of the funds constituting Vanguard Malvern Funds, referred to hereafter as the “Fund”) as of September 30, 2018, the related statement of operations for the year ended September 30, 2018, the statement of changes in net assets for each of the two years in the period ended September 30, 2018, including the related notes, and the financial highlights for each of the five years in the period ended September 30, 2018 (collectively referred to as the “financial statements”). In our opinion, the financial statements present fairly, in all material respects, the financial position of the Fund as of September 30, 2018, the results of its operations for the year then ended, the changes in its net assets for each of the two years in the period ended September 30, 2018 and the financial highlights for each of the five years in the period ended September 30, 2018 in conformity with accounting principles generally accepted in the United States of America.
Basis for Opinion
These financial statements are the responsibility of the Fund’s management. Our responsibility is to express an opinion on the Fund’s financial statements based on our audits. We are a public accounting firm registered with the Public Company Accounting Oversight Board (United States) (“PCAOB”) and are required to be independent with respect to the Fund in accordance with the U.S. federal securities laws and the applicable rules and regulations of the Securities and Exchange Commission and the PCAOB.
We conducted our audits of these financial statements in accordance with the standards of the PCAOB. Those standards require that we plan and perform the audit to obtain reasonable assurance about whether the financial statements are free of material misstatement, whether due to error or fraud.
Our audits included performing procedures to assess the risks of material misstatement of the financial statements, whether due to error or fraud, and performing procedures that respond to those risks. Such procedures included examining, on a test basis, evidence regarding the amounts and disclosures in the financial statements. Our audits also included evaluating the accounting principles used and significant estimates made by management, as well as evaluating the overall presentation of the financial statements. Our procedures included confirmation of securities owned as of September 30, 2018 by correspondence with the custodians and brokers and by agreement to the underlying ownership records of the transfer agent; when replies were not received from brokers, we performed other auditing procedures. We believe that our audits provide a reasonable basis for our opinion.
/s/PricewaterhouseCoopers LLP
Philadelphia, Pennsylvania
November 15, 2018
We have served as the auditor of one or more investment companies in The Vanguard Group of Funds since 1975.
23
Special 2018 tax information (unaudited) for Vanguard Capital Value Fund
This information for the fiscal year ended September 30, 2018, is included pursuant to provisions of the Internal Revenue Code.
The fund distributed $17,678,000 of qualified dividend income to shareholders during the fiscal year.
For corporate shareholders, 85.3% of investment income (dividend income plus short-term gains, if any) qualifies for the dividends-received deduction.
24
Your Fund’s After-Tax Returns
This table presents returns for your fund both before and after taxes. The after-tax returns are shown in two ways: (1) assuming that an investor owned the fund during the entire period and paid taxes on the fund’s distributions, and (2) assuming that an investor paid taxes on the fund’s distributions and sold all shares at the end of each period.
Calculations are based on the highest individual federal income tax and capital gains tax rates in effect at the times of the distributions and the hypothetical sales. State and local taxes were not considered. After-tax returns reflect any qualified dividend income, using actual prior-year figures and estimates for 2018. (In the example, returns after the sale of fund shares may be higher than those assuming no sale. This occurs when the sale would have produced a capital loss. The calculation assumes that the investor received a tax deduction for the loss.)
Please note that your actual after-tax returns will depend on your tax situation and may differ from those shown. Also note that if you own the fund in a tax-deferred account, such as an individual retirement account or a 401(k) plan, this information does not apply to you. Such accounts are not subject to current taxes.
Finally, keep in mind that a fund’s performance—whether before or after taxes—does not guarantee future results.
| | | |
| Average Annual Total Returns: Capital Value Fund | | | |
| Periods Ended September 30, 2018 | | | |
| | One | Five | Ten |
| | Year | Years | Years |
| Returns Before Taxes | 8.48% | 6.34% | 12.17% |
| Returns After Taxes on Distributions | 7.99 | 3.94 | 10.78 |
| Returns After Taxes on Distributions and Sale of Fund Shares | 5.35 | 4.06 | 9.65 |
25
About Your Fund’s Expenses
As a shareholder of the fund, you incur ongoing costs, which include costs for portfolio management, administrative services, and shareholder reports (like this one), among others. Operating expenses, which are deducted from a fund’s gross income, directly reduce the investment return of the fund.
A fund’s expenses are expressed as a percentage of its average net assets. This figure is known as the expense ratio. The following examples are intended to help you understand the ongoing costs (in dollars) of investing in your fund and to compare these costs with those of other mutual funds. The examples are based on an investment of $1,000 made at the beginning of the period shown and held for the entire period.
The accompanying table illustrates your fund’s costs in two ways:
• Based on actual fund return. This section helps you to estimate the actual expenses that you paid over the period. The ”Ending Account Value“ shown is derived from the fund‘s actual return, and the third column shows the dollar amount that would have been paid by an investor who started with $1,000 in the fund. You may use the information here, together with the amount you invested, to estimate the expenses that you paid over the period.
To do so, simply divide your account value by $1,000 (for example, an $8,600 account value divided by $1,000 = 8.6), then multiply the result by the number given for your fund under the heading ”Expenses Paid During Period.“
• Based on hypothetical 5% yearly return. This section is intended to help you compare your fund‘s costs with those of other mutual funds. It assumes that the fund had a yearly return of 5% before expenses, but that the expense ratio is unchanged. In this case—because the return used is not the fund’s actual return—the results do not apply to your investment. The example is useful in making comparisons because the Securities and Exchange Commission requires all mutual funds to calculate expenses based on a 5% return. You can assess your fund’s costs by comparing this hypothetical example with the hypothetical examples that appear in shareholder reports of other funds.
Note that the expenses shown in the table are meant to highlight and help you compare ongoing costs only and do not reflect transaction costs incurred by the fund for buying and selling securities. Further, the expenses do not include any purchase, redemption, or account service fees described in the fund prospectus. If such fees were applied to your account, your costs would be higher. Your fund does not carry a “sales load.”
The calculations assume no shares were bought or sold during the period. Your actual costs may have been higher or lower, depending on the amount of your investment and the timing of any purchases or redemptions.
You can find more information about the fund’s expenses, including annual expense ratios, in the Financial Statements section of this report. For additional information on operating expenses and other shareholder costs, please refer to your fund’s current prospectus.
26
| | | |
| Six Months Ended September 30, 2018 | | | |
| | Beginning | Ending | Expenses |
| | Account Value | Account Value | Paid During |
| Capital Value Fund | 3/31/2018 | 9/30/2018 | Period |
| Based on Actual Fund Return | $1,000.00 | $1,064.04 | $1.50 |
| Based on Hypothetical 5% Yearly Return | 1,000.00 | 1,023.61 | 1.47 |
The calculations are based on expenses incurred in the most recent six-month period. The fund’s annualized six-month expense ratio for that period is 0.29%. The dollar amounts shown as “Expenses Paid” are equal to the annualized expense ratio multiplied by the average account value over the period, multiplied by the number of days in the most recent six-month period, then divided by the number of days in the most recent 12-month period (183/365).
27
Glossary
30-Day SEC Yield. A fund’s 30-day SEC yield is derived using a formula specified by the U.S. Securities and Exchange Commission. Under the formula, data related to the fund’s security holdings in the previous 30 days are used to calculate the fund’s hypothetical net income for that period, which is then annualized and divided by the fund’s estimated average net assets over the calculation period. For the purposes of this calculation, a security’s income is based on its current market yield to maturity (for bonds), its actual income (for asset-backed securities), or its projected dividend yield (for stocks). Because the SEC yield represents hypothetical annualized income, it will differ—at times significantly—from the fund’s actual experience. As a result, the fund’s income distributions may be higher or lower than implied by the SEC yield.
Beta. A measure of the magnitude of a fund’s past share-price fluctuations in relation to the ups and downs of a given market index. The index is assigned a beta of 1.00. Compared with a given index, a fund with a beta of 1.20 typically would have seen its share price rise or fall by 12% when the index rose or fell by 10%. For this report, beta is based on returns over the past 36 months for both the fund and the index. Note that a fund’s beta should be reviewed in conjunction with its R-squared (see definition). The lower the R-squared, the less correlation there is between the fund and the index, and the less reliable beta is as an indicator of volatility.
Dividend Yield. Dividend income earned by stocks, expressed as a percentage of the aggregate market value (or of net asset value, for a fund). The yield is determined by dividing the amount of the annual dividends by the aggregate value (or net asset value) at the end of the period. For a fund, the dividend yield is based solely on stock holdings and does not include any income produced by other investments.
Earnings Growth Rate. The average annual rate of growth in earnings over the past five years for the stocks now in a fund.
Equity Exposure. A measure that reflects a fund’s investments in stocks and stock futures. Any holdings in short-term reserves are excluded.
Expense Ratio. A fund’s total annual operating expenses expressed as a percentage of the fund’s average net assets. The expense ratio includes management and administrative expenses, but does not include the transaction costs of buying and selling portfolio securities.
Foreign Holdings. The percentage of a fund represented by securities or depositary receipts of companies based outside the United States.
Inception Date. The date on which the assets of a fund (or one of its share classes) are first invested in accordance with the fund’s investment objective. For funds with a subscription period, the inception date is the day after that period ends. Investment performance is measured from the inception date.
Median Market Cap. An indicator of the size of companies in which a fund invests; the midpoint of market capitalization (market price x shares outstanding) of a fund’s stocks, weighted by the proportion of the fund’s assets invested in each stock. Stocks representing half of the fund’s assets have market capitalizations above the median, and the rest are below it.
Price/Book Ratio. The share price of a stock divided by its net worth, or book value, per share.
For a fund, the weighted average price/book ratio of the stocks it holds.
28
Price/Earnings Ratio. The ratio of a stock’s current price to its per-share earnings over the past year. For a fund, the weighted average P/E of the stocks it holds. P/E is an indicator of market expectations about corporate prospects; the higher the P/E, the greater the expectations for a company’s future growth.
R-Squared. A measure of how much of a fund’s past returns can be explained by the returns from the market in general, as measured by a given index. If a fund’s total returns were precisely synchronized with an index’s returns, its R-squared would be 1.00. If the fund’s returns bore no relationship to the index’s returns, its R-squared would be 0. For this report, R-squared is based on returns over the past 36 months for both the fund and the index.
Return on Equity. The annual average rate of return generated by a company during the past five years for each dollar of shareholder’s equity (net income divided by shareholder’s equity). For a fund, the weighted average return on equity for the companies whose stocks it holds.
Short-Term Reserves. The percentage of a fund invested in highly liquid, short-term securities that can be readily converted to cash.
Turnover Rate. An indication of the fund’s trading activity. Funds with high turnover rates incur higher transaction costs and may be more likely to distribute capital gains (which may be taxable to investors). The turnover rate excludes in-kind transactions, which have minimal impact on costs.
29
The Global Industry Classification Standard (“GICS”) was developed by and is the exclusive property and a service mark of MSCI Inc. (“MSCI”) and Standard and Poor’s, a division of McGraw-Hill Companies, Inc. (“S&P”), and is licensed for use by Vanguard. Neither MSCI, S&P nor any third party involved in making or compiling the GICS or any GICS classification makes any express or implied warranties or representations with respect to such standard or classification (or the results to be obtained by the use thereof), and all such parties hereby expressly disclaim all warranties of originality, accuracy, completeness, merchantability or fitness for a particular purpose with respect to any such standard or classification. Without limiting any of the foregoing, in no event shall MSCI, S&P, any of its affiliates or any third party involved in making or compiling the GICS or any GICS classification have any liability for any direct, indirect, special, punitive, consequential or any other damages (including lost profits) even if notified of the possibility of such damages.
30
The People Who Govern Your Fund
The trustees of your mutual fund are there to see that the fund is operated and managed in your best interests since, as a shareholder, you are a part owner of the fund. Your fund’s trustees also serve on the board of directors of The Vanguard Group, Inc., which is owned by the Vanguard funds and provides services to them on an at-cost basis.
A majority of Vanguard’s board members are independent, meaning that they have no affiliation with Vanguard or the funds they oversee, apart from the sizable personal investments they have made as private individuals. The independent board members have distinguished backgrounds in business, academia, and public service. Each of the trustees and executive officers oversees 211 Vanguard funds.
Information for each trustee and executive officer of the fund appears below. The mailing address of the trustees and officers is P.O. Box 876, Valley Forge, PA 19482. More information about the trustees is in the Statement of Additional Information, which can be obtained, without charge, by contacting Vanguard at 800-662-7447, or online at vanguard.com.
Interested Trustees1
F. William McNabb III
Born in 1957. Trustee since July 2009. Principal occupation(s) during the past five years and other experience: chairman of the board (January 2010–present) of Vanguard and of each of the investment companies served by Vanguard, trustee (2009–present) of each of the investment companies served by Vanguard, and director (2008–present) of Vanguard. Chief executive officer and president (2008–2017) of Vanguard and each of the investment companies served by Vanguard, managing director (1995–2008) of Vanguard, and director (1997–2018) of Vanguard Marketing Corporation. Director (2018–present) of UnitedHealth Group.
Mortimer J. Buckley
Born in 1969. Trustee since January 2018. Principal occupation(s) during the past five years and other experience: chief executive officer (January 2018–present) of Vanguard; chief executive officer, president, and trustee (January 2018–present) of each of the investment companies served by Vanguard; president and director (2017–present) of Vanguard; and president (February 2018–present) of Vanguard Marketing Corporation. Chief investment officer (2013–2017), managing director (2002–2017), head of the Retail Investor Group (2006–2012), and chief information officer (2001–2006) of Vanguard. Chairman of the board (2011–2017) of the Children’s Hospital of Philadelphia.
Independent Trustees
Emerson U. Fullwood
Born in 1948. Trustee since January 2008. Principal occupation(s) during the past five years and other experience: executive chief staff and marketing officer for North America and corporate vice president (retired 2008) of Xerox Corporation (document management products and services). Former president of the Worldwide Channels Group, Latin America, and Worldwide Customer Service and executive chief staff officer of Developing Markets of Xerox. Executive in residence and 2009–2010 Distinguished Minett Professor at the Rochester Institute of Technology. Lead director of SPX FLOW, Inc. (multi-industry manufacturing). Director of the University of Rochester Medical Center, the Monroe Community College Foundation, the United Way of Rochester, North Carolina A&T University, and Roberts Wesleyan College. Trustee of the University of Rochester.
Amy Gutmann
Born in 1949. Trustee since June 2006. Principal occupation(s) during the past five years and other experience: president (2004–present) of the University of Pennsylvania. Christopher H. Browne Distinguished Professor of Political Science, School of Arts and Sciences, and professor of communication, Annenberg School for Communication, with secondary faculty appointments in the Department of Philosophy, School of Arts and Sciences, and at the Graduate School of Education, University of Pennsylvania. Trustee of the National Constitution Center.
1 Mr. McNabb and Mr. Buckley are considered “interested persons,” as defined in the Investment Company Act of 1940, because they are officers of the Vanguard funds.
JoAnn Heffernan Heisen
Born in 1950. Trustee since July 1998. Principal occupation(s) during the past five years and other experience: corporate vice president of Johnson & Johnson (pharmaceuticals/medical devices/consumer products) and member of its executive committee (1997–2008). Chief global diversity officer (retired 2008), vice president and chief information officer (1997–2006), controller (1995–1997), treasurer (1991–1995), and assistant treasurer (1989–1991) of Johnson & Johnson. Director of Skytop Lodge Corporation (hotels) and the Robert Wood Johnson Foundation. Member of the advisory board of the Institute for Women’s Leadership at Rutgers University.
F. Joseph Loughrey
Born in 1949. Trustee since October 2009. Principal occupation(s) during the past five years and other experience: president and chief operating officer (retired 2009) and vice chairman of the board (2008–2009) of Cummins Inc. (industrial machinery). Chairman of the board of Hillenbrand, Inc. (specialized consumer services), Oxfam America, and the Lumina Foundation for Education. Director of the V Foundation for Cancer Research. Member of the advisory council for the College of Arts and Letters and chair of the advisory board to the Kellogg Institute for International Studies, both at the University of Notre Dame.
Mark Loughridge
Born in 1953. Trustee since March 2012. Principal occupation(s) during the past five years and other experience: senior vice president and chief financial officer (retired 2013) of IBM (information technology services). Fiduciary member of IBM’s Retirement Plan Committee (2004–2013), senior vice president and general manager (2002–2004) of IBM Global Financing, vice president and controller (1998–2002) of IBM, and a variety of other prior management roles at IBM. Member of the Council on Chicago Booth.
Scott C. Malpass
Born in 1962. Trustee since March 2012. Principal occupation(s) during the past five years and other experience: chief investment officer (1989–present) and vice president (1996–present) of the University of Notre Dame. Assistant professor of finance at the Mendoza College of Business, University of Notre Dame, and member of the Notre Dame 403(b) Investment Committee. Chairman of the board of TIFF Advisory Services, Inc. Member of the board of Catholic Investment Services, Inc. (investment advisors), the board of advisors for Spruceview Capital Partners, and the board of superintendence of the Institute for the Works of Religion.
Deanna Mulligan
Born in 1963. Trustee since January 2018. Principal occupation(s) during the past five years and other experience: president (2010–present) and chief executive officer (2011–present) of The Guardian Life Insurance Company of America. Chief operating officer (2010–2011) and executive vice president (2008–2010) of Individual Life and Disability of The Guardian Life Insurance Company of America. Member of the board of The Guardian Life Insurance Company of America, the American Council of Life Insurers, the Partnership for New York City (business leadership), and the Committee Encouraging Corporate Philanthropy. Trustee of the Economic Club of New York and the Bruce Museum (arts and science). Member of the Advisory Council for the Stanford Graduate School of Business.
André F. Perold
Born in 1952. Trustee since December 2004. Principal occupation(s) during the past five years and other experience: George Gund Professor of Finance and Banking, Emeritus at the Harvard Business School (retired 2011). Chief investment officer and co-managing partner of HighVista Strategies LLC (private investment firm). Overseer of the Museum of Fine Arts Boston.
Sarah Bloom Raskin
Born in 1961. Trustee since January 2018. Principal occupation(s) during the past five years and other experience: deputy secretary (2014–2017) of the United States Department of the Treasury. Governor (2010–2014) of the Federal Reserve Board. Commissioner (2007–2010) of financial regulation for the State of Maryland. Member of the board of directors (2012–2014) of Neighborhood Reinvestment Corporation. Director of i(x) Investments, LLC.
Peter F. Volanakis
Born in 1955. Trustee since July 2009. Principal occupation(s) during the past five years and other experience: president and chief operating officer (retired 2010) of Corning Incorporated (communications equipment) and director of Corning Incorporated (2000–2010) and Dow Corning (2001–2010). Director (2012) of SPX Corporation (multi-industry manufacturing). Overseer of the Amos Tuck School of Business Administration, Dartmouth College (2001–2013). Chairman of the board of trustees of Colby-Sawyer College. Member of the Board of Hypertherm Inc. (industrial cutting systems, software, and consumables).
Executive Officers
Glenn Booraem
Born in 1967. Principal occupation(s) during the past five years and other experience: principal of Vanguard. Investment stewardship officer (2017–present), treasurer (2015–2017), controller (2010–2015), and assistant controller (2001–2010) of each of the investment companies served by Vanguard.
Christine M. Buchanan
Born in 1970. Principal occupation(s) during the past five years and other experience: principal of Vanguard and global head of Fund Administration at Vanguard. Treasurer (2017–present) of each of the investment companies served by Vanguard. Partner (2005–2017) at KPMG LLP (audit, tax, and advisory services).
Brian Dvorak
Born in 1973. Principal occupation(s) during the past five years and other experience: principal of Vanguard. Chief compliance officer (2017–present) of Vanguard and each of the investment companies served by Vanguard. Assistant vice president (2017–present) of Vanguard Marketing Corporation. Vice president and director of Enterprise Risk Management (2011–2013) at Oppenheimer Funds, Inc.
Thomas J. Higgins
Born in 1957. Principal occupation(s) during the past five years and other experience: principal of Vanguard. Chief financial officer (2008–present) and treasurer (1998–2008) of each of the investment companies served by Vanguard.
Peter Mahoney
Born in 1974. Principal occupation(s) during the past five years and other experience: principal of Vanguard. Controller (2015–present) of each of the investment companies served by Vanguard. Head of International Fund Services (2008–2014) at Vanguard.
Anne E. Robinson
Born in 1970. Principal occupation(s) during the past five years and other experience: general counsel (2016–present) of Vanguard. Secretary (2016–present) of Vanguard and of each of the investment companies served by Vanguard. Managing director (2016–present) of Vanguard. Director and senior vice president (2016–2018) of Vanguard Marketing Corporation. Managing director and general counsel of Global Cards and Consumer Services (2014–2016) at Citigroup. Counsel (2003–2014) at American Express.
Michael Rollings
Born in 1963. Principal occupation(s) during the past five years and other experience: finance director (2017–present) and treasurer (2017) of each of the investment companies served by Vanguard. Managing director (2016–present) of Vanguard. Chief financial officer (2016–present) of Vanguard. Director (2016–present) of Vanguard Marketing Corporation. Executive vice president and chief financial officer (2006–2016) of MassMutual Financial Group.
| |
| Vanguard Senior Management Team |
| |
| Joseph Brennan | Chris D. McIsaac |
| Mortimer J. Buckley | James M. Norris |
| Gregory Davis | Thomas M. Rampulla |
| John James | Karin A. Risi |
| Martha G. King | Anne E. Robinson |
| John T. Marcante | Michael Rollings |
Chairman Emeritus and Senior Advisor
John J. Brennan
Chairman, 1996–2009
Chief Executive Officer and President, 1996–2008
Founder
John C. Bogle
Chairman and Chief Executive Officer, 1974–1996

| |
| | P.O. Box 2600 |
| | Valley Forge, PA 19482-2600 |
| |
| |
| |
| Connect with Vanguard® > vanguard.com |
| |
| |
| |
| Fund Information > 800-662-7447 | Source for Bloomberg Barclays indexes: Bloomberg |
| Direct Investor Account Services > 800-662-2739 | Index Services Limited. Copyright 2018, Bloomberg. All |
| | rights reserved. |
| Institutional Investor Services > 800-523-1036 | |
| | CFA® is a registered trademark owned by CFA Institute. |
| Text Telephone for People | |
| Who Are Deaf or Hard of Hearing > 800-749-7273 | |
| |
| This material may be used in conjunction | |
| with the offering of shares of any Vanguard | |
| fund only if preceded or accompanied by | |
| the fund’s current prospectus. | |
| |
| All comparative mutual fund data are from Lipper, a | |
| Thomson Reuters Company, or Morningstar, Inc., unless | |
| otherwise noted. | |
| |
| You can obtain a free copy of Vanguard’s proxy voting | |
| guidelines by visiting vanguard.com/proxyreporting or by | |
| calling Vanguard at 800-662-2739. The guidelines are | |
| also available from the SEC’s website, sec.gov. In | |
| addition, you may obtain a free report on how your fund | |
| voted the proxies for securities it owned during the 12 | |
| months ended June 30. To get the report, visit either | |
| vanguard.com/proxyreporting or sec.gov. | |
| |
| You can review and copy information about your fund at | |
| the SEC’s Public Reference Room in Washington, D.C. To | |
| find out more about this public service, call the SEC at | |
| 202-551-8090. Information about your fund is also | |
| available on the SEC’s website, and you can receive | |
| copies of this information, for a fee, by sending a | |
| request in either of two ways: via email addressed to | |
| publicinfo@sec.gov or via regular mail addressed to the | |
| Public Reference Section, Securities and Exchange | |
| Commission, Washington, DC 20549-1520. | |
| | © 2018 The Vanguard Group, Inc. |
| | All rights reserved. |
| | Vanguard Marketing Corporation, Distributor. |
| |
| | Q3280 112018 |

Annual Report | September 30, 2018
Vanguard Short-Term Inflation-Protected
Securities Index Fund
Vanguard’s Principles for Investing Success
We want to give you the best chance of investment success. These principles, grounded in Vanguard’s research and experience, can put you on the right path.
Goals. Create clear, appropriate investment goals.
Balance. Develop a suitable asset allocation using broadly diversified funds. Cost. Minimize cost.
Discipline. Maintain perspective and long-term discipline.
A single theme unites these principles: Focus on the things you can control.
We believe there is no wiser course for any investor.
| |
| Contents | |
| Your Fund’s Performance at a Glance. | 1 |
| CEO’s Perspective. | 3 |
| Fund Profile. | 5 |
| Performance Summary. | 6 |
| Financial Statements. | 9 |
| About Your Fund’s Expenses. | 25 |
| Glossary. | 27 |
Please note: The opinions expressed in this report are just that—informed opinions. They should not be considered promises or advice. Also, please keep in mind that the information and opinions cover the period through the date on the front of this report. Of course, the risks of investing in your fund are spelled out in the prospectus.
See the Glossary for definitions of investment terms used in this report.
Your Fund’s Performance at a Glance
• For the 12 months ended September 30, 2018, Vanguard Short-Term Inflation-Protected Securities Index Fund returned 0.91% for Investor Shares, tracking its benchmark (+1.01%) and ahead of the average return of its peer funds (+0.33%). The 30-day SEC yield for Investor Shares began the period at –0.20% and ended at 0.79%.
• Prices of regular U.S. Treasury securities fell during the period as economic prospects brightened and interest rates rose. Treasury inflation-protected securities (TIPS) outperformed regular Treasuries as inflation expectations increased, a development that typically favors TIPS over nominal Treasuries.
• A measure of expected inflation over the next five years (the gap between nominal and TIPS yields) widened from 1.82% to 2.04%.
• Since inception, the fund’s average annual return has been in line with that of its benchmark and has exceeded that of its peers.
| | | | |
| Total Returns: Fiscal Year Ended September 30, 2018 | | | |
| | 30-Day SEC | Income | Capital | Total |
| | Yield | Returns | Returns | Returns |
| Vanguard Short-Term Inflation-Protected Securities Index Fund | | | |
| Investor Shares | 0.79% | 3.09% | -2.18% | 0.91% |
| ETF Shares | 0.85 | | | |
| Market Price | | | | 0.97 |
| Net Asset Value | | | | 1.01 |
| Admiral™ Shares | 0.85 | 3.18 | -2.18 | 1.00 |
| Institutional Shares | 0.87 | 3.20 | -2.18 | 1.02 |
| Bloomberg Barclays U.S. Treasury Inflation-Protected | | | | |
| Securities (TIPS) 0–5 Year Index | | | | 1.01 |
| Inflation-Protected Bond Funds Average | | | | 0.33 |
Inflation-Protected Bond Funds Average: Derived from data provided by Lipper, a Thomson Reuters Company.
Admiral Shares carry lower expenses and are available to investors who meet certain account-balance requirements. Institutional Shares are available to certain institutional investors who meet specific administrative, service, and account-size criteria. The Vanguard ETF® Shares shown are traded on the Nasdaq exchange and are available only through brokers. The table provides ETF returns based on both the Nasdaq market price and the net asset value for a share. U.S. Pat. Nos. 6,879,964; 7,337,138; 7,720,749; 7,925,573; 8,090,646; and 8,417,623.
For the ETF Shares, the market price is determined by the midpoint of the bid-offer spread as of the closing time of the New York Stock Exchange (generally 4 p.m., Eastern time). The net asset value is also determined as of the NYSE closing time. For more information about how the ETF Shares' market prices have compared with their net asset value, visit vanguard.com, select your ETF, and then select the Price and Performance tab. The ETF premium/discount analysis there shows the percentages of days on which the ETF Shares' market price was above or below the NAV.
1
| |
| Total Returns: Inception Through September 30, 2018 | |
| | Average |
| | Annual Return |
| Short-Term Inflation-Protected Securities Index Fund Investor Shares (Returns since inception: | |
| 10/16/2012) | 0.23% |
| Bloomberg Barclays U.S. Treasury Inflation-Protected Securities (TIPS) 0–5 Year Index | 0.32 |
| Inflation-Protected Bond Funds Average | -0.40 |
| Inflation-Protected Bond Funds Average: Derived from data provided by Lipper, a Thomson Reuters Company. | |
The figures shown represent past performance, which is not a guarantee of future results. (Current performance may be lower or higher than the performance data cited. For performance data current to the most recent month-end, visit our website at vanguard.com/performance.) Note, too, that both investment returns and principal value can fluctuate widely, so an investor’s shares, when sold, could be worth more or less than their original cost.
| | | | | |
| Expense Ratios | | | | | |
| Your Fund Compared With Its Peer Group | | | | | |
| | Investor | ETF | Admiral | Institutional | Peer Group |
| | Shares | Shares | Shares | Shares | Average |
| Short-Term Inflation-Protected Securities Index | | | | | |
| Fund | 0.15% | 0.06% | 0.06% | 0.04% | 0.71% |
The fund expense ratios shown are from the prospectus dated January 26, 2018, and represent estimated costs for the current fiscal year. For the fiscal year ended September 30, 2018, the expense ratios were 0.14% for Investor Shares, 0.06% for ETF Shares, 0.06% for Admiral Shares, and 0.04% for Institutional Shares. The peer-group expense ratio is derived from data provided by Lipper, a Thomson Reuters Company, and captures information through year-end 2017.
Peer group: Inflation-Protected Bond Funds.
2
CEO’s Perspective

Tim Buckley
President and Chief Executive Officer
Dear Shareholder,
Over the years, I’ve found that prudent investors exhibit a common trait: discipline. No matter how the markets move or what new investing fad hits the headlines, those who stay focused on their goals and tune out the noise are set up for long-term success.
The prime gateway to investing is saving, and you don’t usually become a saver without a healthy dose of discipline. Savers make the decision to sock away part of their income, which means spending less and delaying gratification, no matter how difficult that may be.
Of course, disciplined investing extends beyond diligent saving. The financial markets, in the short term especially, are unpredictable; I have yet to meet the investor who can time them perfectly. It takes discipline to resist the urge to go all-in when markets are frothy or to retreat when things look bleak.
Staying put with your investments is one strategy for handling volatility. Another, rebalancing, requires even more discipline because it means steering your money away from strong performers and toward poorer performers.
Patience—a form of discipline—is also the friend of long-term investors. Higher returns are the potential reward for weathering the market’s turbulence and uncertainty.
3
We have been enjoying one of the longest bull markets in history, but it won’t continue forever. Prepare yourself now for how you will react when volatility comes back. Don’t panic. Don’t chase returns or look for answers outside the asset classes you trust. And be sure to rebalance periodically, even when there’s turmoil.
Whether you’re a master of self-control, get a boost from technology, or work with a professional advisor, know that discipline
is necessary to get the most out of your investment portfolio. And know that Vanguard is with you for the entire ride.
Thank you for your continued loyalty.

Mortimer J. Buckley
President and Chief Executive Officer
October 18, 2018
| | | |
| Market Barometer | | | |
| | | Average Annual Total Returns |
| | Periods Ended September 30, 2018 |
| | One Year | Three Years | Five Years |
| Stocks | | | |
| Russell 1000 Index (Large-caps) | 17.76% | 17.07% | 13.67% |
| Russell 2000 Index (Small-caps) | 15.24 | 17.12 | 11.07 |
| Russell 3000 Index (Broad U.S. market) | 17.58 | 17.07 | 13.46 |
| FTSE All-World ex US Index (International) | 2.13 | 10.18 | 4.51 |
| |
| Bonds | | | |
| Bloomberg Barclays U.S. Aggregate Bond Index | | | |
| (Broad taxable market) | -1.22% | 1.31% | 2.16% |
| Bloomberg Barclays Municipal Bond Index | | | |
| (Broad tax-exempt market) | 0.35 | 2.24 | 3.54 |
| FTSE Three-Month U. S. Treasury Bill Index | 1.57 | 0.80 | 0.48 |
| |
| CPI | | | |
| Consumer Price Index | 2.28% | 1.99% | 1.52% |
4
Short-Term Inflation-Protected Securities Index Fund
Fund Profile
As of September 30, 2018
| | | | |
| Share-Class Characteristics | | | | |
| | Investor | | Admiral | Institutional |
| | Shares | ETF Shares | Shares | Shares |
| Ticker Symbol | VTIPX | VTIP | VTAPX | VTSPX |
| Expense Ratio1 | 0.15% | 0.06% | 0.06% | 0.04% |
| 30-Day SEC Yield2 | 0.79% | 0.85% | 0.85% | 0.87% |
| | | |
| Financial Attributes | | |
| |
| | | Bloomberg | |
| | | Barclays | Bloomberg |
| | | U.S. TIPS | Barclays |
| | | 0–5 Year | Aggregate |
| | Fund | Index Bond Index |
| |
| Number of Bonds | 15 | 15 | 10,112 |
| |
| Yield to Maturity | | | |
| (before expenses) | 2.7% | 2.7% | 3.5% |
| |
| Average Coupon | 0.5% | 0.5% | 3.2% |
| |
| Average Duration | 2.7 years | 2.7 years | 6.0 years |
| |
| Average Effective | | | |
| Maturity | 2.7 years | 2.7 years | 8.4 years |
| |
| Short-Term | | | |
| Reserves | 0.1% | — | — |
| |
| Sector Diversification (% of portfolio) | |
| Treasury/Agency | 100.0% |
| | |
| Volatility Measures | | |
| | Bloomberg | Bloomberg |
| | Barclays U.S. | Barclays |
| | TIPS 0–5 | Aggregate |
| | Year Index | Bond Index |
| R-Squared | 0.99 | 0.45 |
| Beta | 1.03 | 0.32 |
These measures show the degree and timing of the fund’s fluctuations compared with the indexes over 36 months.
| |
| Distribution by Credit Quality (% of portfolio) |
| U.S. Government | 100.0% |
Credit-quality ratings are obtained from Barclays and are from Moody's, Fitch, and S&P. When ratings from all three agencies are used, the median rating is shown. When ratings from two of the agencies are used, the lower rating for each issue is shown. "Not Rated" is used to classify securities for which a rating is not available. For more information about these ratings, see the Glossary entry for Credit Quality.
The agency and mortgage-backed securities sectors may include issues from government-sponsored enterprises; such issues are generally not backed by the full faith and credit of the U.S. government.
| |
| Distribution by Effective Maturity | |
| (% of portfolio) | |
| Under 1 Year | 15.3% |
| 1 - 3 Years | 40.7 |
| 3 - 5 Years | 44.0 |
Investment Focus
1 The expense ratios shown are from the prospectus dated January 26, 2018, and represent estimated costs for the current fiscal year. For the fiscal year ended September 30, 2018, the expense ratios were 0.14% for Investor Shares, 0.06% for ETF Shares, 0.06% for Admiral Shares, and 0.04% for Institutional Shares.
2 Yields of inflation-protected securities tend to be lower than those of nominal bonds, because the former do not incorporate market expectations about inflation. The principal amounts—and thus the interest payments—of inflation-protected securities are adjusted over time to reflect inflation.
5
Short-Term Inflation-Protected Securities Index Fund
Performance Summary
All of the returns in this report represent past performance, which is not a guarantee of future results that may be achieved by the fund. (Current performance may be lower or higher than the performance data cited. For performance data current to the most recent month-end, visit our website at vanguard.com/performance.) Note, too, that both investment returns and principal value can fluctuate widely, so an investor’s shares, when sold, could be worth more or less than their original cost. The returns shown do not reflect taxes that a shareholder would pay on fund distributions or on the sale of fund shares.
Cumulative Performance: October 16, 2012, Through September 30, 2018
Initial Investment of $10,000

| | | | |
| | Average Annual Total Returns | |
| | Periods Ended September 30, 2018 | |
| |
| | | | Since | Final Value |
| | One | Five | Inception | of a $10,000 |
| | Year | Years | (10/16/2012) | Investment |
| Short-Term Inflation-Protected | | | | |
| Securities Index Fund Investor Shares | 0.91% | 0.45% | 0.23% | $10,136 |
| Bloomberg Barclays U.S. Treasury | | | | |
| | | | | |
| Inflation-Protected Securities (TIPS) 0–5 | | | | |
| Year Index | 1.01 | 0.63 | 0.32 | 10,192 |
| |
| Inflation-Protected Bond Funds Average | 0.33 | 0.80 | -0.40 | 9,766 |
| Bloomberg Barclays U.S. Aggregate | | | | |
| Bond Index | -1.22 | 2.16 | 1.52 | 10,939 |
Inflation-Protected Bond Funds Average: Derived from data provided by Lipper, a Thomson Reuters Company.
"Since Inception" performance is calculated from the Investor Shares’ inception date for both the fund and its comparative standards.
| | | | |
| | | | Since | Final Value |
| | One | Five | Inception | of a $10,000 |
| | Year | Years | (10/12/2012) | Investment |
| Short-Term Inflation-Protected Securities | | | | |
| Index Fund ETF Shares Net Asset Value | 1.01% | 0.55% | 0.32% | $10,190 |
| Bloomberg Barclays U.S. Treasury | | | | |
| Inflation-Protected Securities (TIPS) 0–5 Year | | | | |
| Index | 1.01 | 0.63 | 0.32 | 10,191 |
| Bloomberg Barclays U.S. Aggregate Bond | | | | |
| Index | -1.22 | 2.16 | 1.49 | 10,924 |
"Since Inception" performance is calculated from the ETF Shares’ inception date for both the fund and its comparative standards.
See Financial Highlights for dividend and capital gains information.
6
Short-Term Inflation-Protected Securities Index Fund
| | | | |
| | | Average Annual Total Returns | |
| | Periods Ended September 30, 2018 | |
| | | | Since | Final Value |
| | One | Five | Inception | of a $10,000 |
| | Year | Years | (10/16/2012) | Investment |
| Short-Term Inflation-Protected Securities | | | | |
| Index Fund Admiral Shares | 1.00% | 0.54% | 0.32% | $10,190 |
| Bloomberg Barclays U.S. Treasury | | | | |
| Inflation-Protected Securities (TIPS) 0–5 Year | | | | |
| Index | 1.01 | 0.63 | 0.32 | 10,192 |
| Bloomberg Barclays U.S. Aggregate Bond | | | | |
| Index | -1.22 | 2.16 | 1.52 | 10,939 |
"Since Inception" performance is calculated from the Admiral Shares’ inception date for both the fund and its comparative standards.
| | | | |
| | | | Since | Final Value |
| | One | Five | Inception | of a $5,000,000 |
| | Year | Years | (10/17/2012) | Investment |
| Short-Term Inflation-Protected Securities | | | | |
| Index Fund Institutional Shares | 1.02% | 0.58% | 0.35% | $5,106,110 |
| Bloomberg Barclays U.S. Treasury | | | | |
| Inflation-Protected Securities (TIPS) 0–5 Year | | | | |
| Index | 1.01 | 0.63 | 0.33 | 5,099,649 |
| Bloomberg Barclays U.S. Aggregate Bond | | | | |
| Index | -1.22 | 2.16 | 1.56 | 5,482,127 |
"Since Inception" performance is calculated from the Institutional Shares’ inception date for both the fund and its comparative standards.
| | | |
| Cumulative Returns of ETF Shares: October 12, 2012, Through September 30, 2018 | |
| |
| | | | Since |
| | One | Five | Inception |
| | Year | Years | (10/12/2012) |
| Short-Term Inflation-Protected Securities Index Fund | | | |
| ETF Shares Market Price | 0.97% | 2.68% | 1.95% |
| Short-Term Inflation-Protected Securities Index Fund | | | |
| ETF Shares Net Asset Value | 1.01 | 2.77 | 1.90 |
| Bloomberg Barclays U.S. Treasury | | | |
| Inflation-Protected Securities (TIPS) 0–5 Year Index | 1.01 | 3.17 | 1.91 |
"Since Inception" performance is calculated from the ETF Shares’ inception date for both the fund and its comparative standards.
7
Short-Term Inflation-Protected Securities Index Fund
| | | | |
| Fiscal-Year Total Returns (%): October 16, 2012, Through September 30, 2018 | |
| | | | | Bloomberg |
| | | | | Barclays |
| | | | | U.S. TIPS |
| | | | | 0–5 Year |
| | | | Investor Shares | Index |
| Fiscal Year | Income Returns | Capital Returns | Total Returns | Total Returns |
| 2013 | 0.09% | -1.00% | -0.91% | -1.20% |
| 2014 | 0.02 | -0.04 | -0.02 | 0.21 |
| 2015 | 0.70 | -2.06 | -1.36 | -1.19 |
| 2016 | 0.43 | 2.05 | 2.48 | 2.62 |
| 2017 | 0.55 | -0.24 | 0.31 | 0.51 |
| 2018 | 3.09 | -2.18 | 0.91 | 1.01 |
8
Short-Term Inflation-Protected Securities Index Fund
Financial Statements
Statement of Net Assets
As of September 30, 2018
The fund reports a complete list of its holdings in regulatory filings four times in each fiscal year, at the quarter-ends. For the second and fourth fiscal quarters, the lists appear in the fund’s semiannual and annual reports to shareholders. For the first and third fiscal quarters, the fund files the lists with the Securities and Exchange Commission on Form N-Q. Shareholders can look up the fund’s Forms N-Q on the SEC’s website at sec.gov. Forms N-Q may also be reviewed and copied at the SEC’s Public Reference Room (see the back cover of this report for further information).
| | | | |
| | | | Face | Market |
| | | Maturity | Amount | Value • |
| | Coupon | Date | ($000) | ($000) |
| U. S. Government and Agency Obligations (99.8%) | | | |
| U. S. Government Securities (99.8%) | | | | |
| United States Treasury Inflation Indexed Bonds | 2.125% | 1/15/19 | 611,359 | 719,383 |
| United States Treasury Inflation Indexed Bonds | 0.125% | 4/15/19 | 2,368,971 | 2,532,265 |
| United States Treasury Inflation Indexed Bonds | 1.875% | 7/15/19 | 691,566 | 826,300 |
| United States Treasury Inflation Indexed Bonds | 1.375% | 1/15/20 | 854,400 | 1,002,692 |
| United States Treasury Inflation Indexed Bonds | 0.125% | 4/15/20 | 2,373,265 | 2,521,202 |
| United States Treasury Inflation Indexed Bonds | 1.250% | 7/15/20 | 1,316,264 | 1,538,578 |
| United States Treasury Inflation Indexed Bonds | 1.125% | 1/15/21 | 1,524,576 | 1,766,478 |
| United States Treasury Inflation Indexed Bonds | 0.125% | 4/15/21 | 2,086,324 | 2,173,312 |
| United States Treasury Inflation Indexed Bonds | 0.625% | 7/15/21 | 1,661,078 | 1,852,344 |
| United States Treasury Inflation Indexed Bonds | 0.125% | 1/15/22 | 1,840,130 | 1,997,945 |
| United States Treasury Inflation Indexed Bonds | 0.125% | 4/15/22 | 2,082,192 | 2,096,612 |
| United States Treasury Inflation Indexed Bonds | 0.125% | 7/15/22 | 1,928,722 | 2,062,399 |
| United States Treasury Inflation Indexed Bonds | 0.125% | 1/15/23 | 1,944,537 | 2,055,325 |
| United States Treasury Inflation Indexed Bonds | 0.625% | 4/15/23 | 1,471,333 | 1,473,843 |
| United States Treasury Inflation Indexed Bonds | 0.375% | 7/15/23 | 1,942,808 | 2,062,740 |
| Total U.S. Government and Agency Obligations (Cost $27,125,074) | | 26,681,418 |
| |
| | | | Shares | |
| Temporary Cash Investment (0.1%) | | | | |
| Money Market Fund (0.1%) | | | | |
| 1 Vanguard Market Liquidity Fund (Cost $16,415) 2.209% | | 164,149 | 16,415 |
| Total Investments (99.9%) (Cost $27,141,489) | | | | 26,697,833 |
9
Short-Term Inflation-Protected Securities Index Fund
| |
| | Amount |
| | ($000) |
| Other Assets and Liabilities (0.1%) | |
| Other Assets | |
| Investment in Vanguard | 1,342 |
| Receivables for Accrued Income | 33,204 |
| Receivables for Capital Shares Issued | 157,442 |
| Total Other Assets | 191,988 |
| Liabilities | |
| Payables for Investment Securities Purchased | (150,428) |
| Payables for Capital Shares Redeemed | (12,415) |
| Payables to Vanguard | (3,753) |
| Other Liabilities | (24) |
| Total Liabilities | (166,620) |
| Net Assets (100%) | 26,723,201 |
| |
| At September 30, 2018, net assets consisted of: | |
| | Amount |
| | ($000) |
| Paid-in Capital | 27,246,405 |
| Undistributed Net Investment Income | 93,720 |
| Accumulated Net Realized Losses | (173,268) |
| Unrealized Appreciation (Depreciation) | (443,656) |
| Net Assets | 26,723,201 |
| |
| Investor Shares—Net Assets | |
| Applicable to 275,641,114 outstanding $.001 par value shares of | |
| beneficial interest (unlimited authorization) | 6,678,915 |
| Net Asset Value Per Share—Investor Shares | $24.23 |
| |
| ETF Shares—Net Assets | |
| Applicable to 112,792,013 outstanding $.001 par value shares of | |
| beneficial interest (unlimited authorization) | 5,452,562 |
| Net Asset Value Per Share—ETF Shares | $48.34 |
| |
| Admiral Shares—Net Assets | |
| Applicable to 269,015,939 outstanding $.001 par value shares of | |
| beneficial interest (unlimited authorization) | 6,524,944 |
| Net Asset Value Per Share—Admiral Shares | $24.25 |
10
Short-Term Inflation-Protected Securities Index Fund
| |
| | Amount |
| | ($000) |
| Institutional Shares—Net Assets | |
| Applicable to 332,379,281 outstanding $.001 par value shares of | |
| beneficial interest (unlimited authorization) | 8,066,780 |
| Net Asset Value Per Share—Institutional Shares | $24.27 |
• See Note A in Notes to Financial Statements.
1 Affiliated money market fund available only to Vanguard funds and certain trusts and accounts managed by Vanguard. Rate shown
is the 7-day yield.
See accompanying Notes, which are an integral part of the Financial Statements.
11
Short-Term Inflation-Protected Securities Index Fund
Statement of Operations
| |
| | Year Ended |
| | September 30, 2018 |
| | ($000) |
| Investment Income | |
| Income | |
| Interest1 | 702,385 |
| Total Income | 702,385 |
| Expenses | |
| The Vanguard Group—Note B | |
| Investment Advisory Services | 764 |
| Management and Administrative—Investor Shares | 7,543 |
| Management and Administrative—ETF Shares | 2,194 |
| Management and Administrative—Admiral Shares | 2,677 |
| Management and Administrative—Institutional Shares | 2,514 |
| Marketing and Distribution—Investor Shares | 1,011 |
| Marketing and Distribution—ETF Shares | 281 |
| Marketing and Distribution—Admiral Shares | 456 |
| Marketing and Distribution—Institutional Shares | 221 |
| Custodian Fees | 130 |
| Auditing Fees | 64 |
| Shareholders’ Reports and Proxy—Investor Shares | 71 |
| Shareholders’ Reports and Proxy—ETF Shares | 222 |
| Shareholders’ Reports and Proxy—Admiral Shares | 111 |
| Shareholders’ Reports and Proxy—Institutional Shares | 7 |
| Trustees’ Fees and Expenses | 15 |
| Total Expenses | 18,281 |
| Net Investment Income | 684,104 |
| Realized Net Gain (Loss) | |
| Investment Securities Sold1,2 | (41,881) |
| Futures Contracts | 1,884 |
| Realized Net Gain (Loss) | (39,997) |
| Change in Unrealized Appreciation (Depreciation) of Investment Securities1 | (398,504) |
| Net Increase (Decrease) in Net Assets Resulting from Operations | 245,603 |
1 Interest income, realized net gain (loss), and change in unrealized appreciation (depreciation) from an affiliated company of the fund were $3,306,000, $186,000, and $1,000, respectively. Purchases and sales are for temporary cash investment purposes.
2 Includes $29,083,000 of net gains resulting from in-kind redemptions; such gains are not taxable to the fund.
See accompanying Notes, which are an integral part of the Financial Statements.
12
Short-Term Inflation-Protected Securities Index Fund
Statement of Changes in Net Assets
| | |
| | Year Ended September 30, |
| | 2018 | 2017 |
| | ($000) | ($000) |
| Increase (Decrease) in Net Assets | | |
| Operations | | |
| Net Investment Income | 684,104 | 254,685 |
| Realized Net Gain (Loss) | (39,997) | (7,041) |
| Change in Unrealized Appreciation (Depreciation) | (398,504) | (168,286) |
| Net Increase (Decrease) in Net Assets Resulting from Operations | 245,603 | 79,358 |
| Distributions | | |
| Net Investment Income | | |
| Investor Shares | (196,531) | (27,992) |
| ETF Shares | (158,959) | (21,465) |
| Admiral Shares | (186,081) | (26,937) |
| Institutional Shares | (242,955) | (44,908) |
| Realized Capital Gain | | |
| Investor Shares | — | — |
| ETF Shares | — | — |
| Admiral Shares | — | — |
| Institutional Shares | — | — |
| Total Distributions | (784,526) | (121,302) |
| Capital Share Transactions | | |
| Investor Shares | 912,377 | 826,514 |
| ETF Shares | 1,681,666 | 1,409,404 |
| Admiral Shares | 1,573,157 | 1,712,740 |
| Institutional Shares | 1,245,525 | 1,503,409 |
| Net Increase (Decrease) from Capital Share Transactions | 5,412,725 | 5,452,067 |
| Total Increase (Decrease) | 4,873,802 | 5,410,123 |
| Net Assets | | |
| Beginning of Period | 21,849,399 | 16,439,276 |
| End of Period1 | 26,723,201 | 21,849,399 |
1 Net Assets—End of Period includes undistributed (overdistributed) net investment income of $93,720,000 and $194,124,000.
See accompanying Notes, which are an integral part of the Financial Statements.
13
Short-Term Inflation-Protected Securities Index Fund
Financial Highlights
| | | | | |
| Investor Shares | | | | | |
| |
| For a Share Outstanding | | | Year Ended September 30, |
| Throughout Each Period | 2018 | 2017 | 2016 | 2015 | 2014 |
| Net Asset Value, Beginning of Period | $24.77 | $24.83 | $24.23 | $24.74 | $24.75 |
| Investment Operations | | | | | |
| Net Investment Income | . 6691 | .3121 | .0801 | (.131) | .183 |
| Net Realized and Unrealized Gain (Loss) | | | | | |
| on Investments | (. 448) | (. 237) | . 520 | (. 206) | (.189) |
| Total from Investment Operations | . 221 | . 075 | . 600 | (. 337) | (. 006) |
| Distributions | | | | | |
| Dividends from Net Investment Income | (.761) | (.135) | — | (.173) | (. 004) |
| Distributions from Realized Capital Gains | — | — | — | — | — |
| Total Distributions | (.761) | (.135) | — | (.173) | (. 004) |
| Net Asset Value, End of Period | $24.23 | $24.77 | $24.83 | $24.23 | $24.74 |
| |
| Total Return2 | 0.91% | 0.31% | 2.48% | -1.36% | -0.02% |
| |
| Ratios/Supplemental Data | | | | | |
| Net Assets, End of Period (Millions) | $6,679 | $5,904 | $5,088 | $4,532 | $4,517 |
| Ratio of Total Expenses to Average Net Assets | 0.14% | 0.15% | 0.16% | 0.17% | 0.20% |
| Ratio of Net Investment Income to | | | | | |
| Average Net Assets | 2.73% | 1.26% | 0.42% | (0.53%) | 0.88% |
| Portfolio Turnover Rate 3 | 25% | 27% | 28% | 26% | 18% |
1 Calculated based on average shares outstanding.
2 Total returns do not include account service fees that may have applied in the periods shown. Fund prospectuses provide information about any applicable account service fees.
3 Excludes the value of portfolio securities received or delivered as a result of in-kind purchases or redemptions of the fund’s capital shares, including ETF Creation Units.
See accompanying Notes, which are an integral part of the Financial Statements.
14
Short-Term Inflation-Protected Securities Index Fund
Financial Highlights
| | | | | |
| ETF Shares | | | | | |
| |
| For a Share Outstanding | | | Year Ended September 30, |
| Throughout Each Period | 2018 | 2017 | 2016 | 2015 | 2014 |
| Net Asset Value, Beginning of Period | $49.41 | $49.59 | $48.36 | $49.38 | $49.36 |
| Investment Operations | | | | | |
| Net Investment Income | 1.3581 | .6711 | .2511 | (. 210) | . 414 |
| Net Realized and Unrealized Gain (Loss) | | | | | |
| on Investments | (. 869) | (. 477) | . 979 | (. 415) | (. 371) |
| Total from Investment Operations | .489 | .194 | 1.230 | (.625) | .043 |
| Distributions | | | | | |
| Dividends from Net Investment Income | (1.559) | (.374) | — | (.395) | (.023) |
| Distributions from Realized Capital Gains | — | — | — | — | — |
| Total Distributions | (1.559) | (.374) | — | (.395) | (.023) |
| Net Asset Value, End of Period | $48.34 | $49.41 | $49.59 | $48.36 | $49.38 |
| |
| Total Return | 1.01% | 0.40% | 2.54% | -1.26% | 0.09% |
| |
| Ratios/Supplemental Data | | | | | |
| Net Assets, End of Period (Millions) | $5,453 | $3,881 | $2,478 | $1,838 | $1,336 |
| Ratio of Total Expenses to Average Net Assets | 0.06% | 0.06% | 0.07% | 0.08% | 0.10% |
| Ratio of Net Investment Income to | | | | | |
| Average Net Assets | 2.81% | 1.35% | 0.51% | (0.44%) | 0.98% |
| Portfolio Turnover Rate2 | 25% | 27% | 28% | 26% | 18% |
1 Calculated based on average shares outstanding.
2 Excludes the value of portfolio securities received or delivered as a result of in-kind purchases or redemptions of the fund’s capital shares, including ETF Creation Units.
See accompanying Notes, which are an integral part of the Financial Statements.
15
Short-Term Inflation-Protected Securities Index Fund
Financial Highlights
| | | | | |
| Admiral Shares | | | | | |
| |
| For a Share Outstanding | | | Year Ended September 30, |
| Throughout Each Period | 2018 | 2017 | 2016 | 2015 | 2014 |
| Net Asset Value, Beginning of Period | $24.79 | $24.88 | $24.27 | $24.77 | $24.77 |
| Investment Operations | | | | | |
| Net Investment Income | . 6921 | .3381 | .1491 | (.105) | . 209 |
| Net Realized and Unrealized Gain (Loss) | | | | | |
| on Investments | (. 450) | (. 241) | . 461 | (.197) | (.195) |
| Total from Investment Operations | . 242 | .097 | .610 | (. 302) | .014 |
| Distributions | | | | | |
| Dividends from Net Investment Income | (.782) | (.187) | — | (.198) | (. 014) |
| Distributions from Realized Capital Gains | — | — | — | — | — |
| Total Distributions | (.782) | (.187) | — | (.198) | (. 014) |
| Net Asset Value, End of Period | $24.25 | $24.79 | $24.88 | $24.27 | $24.77 |
| |
| Total Return2 | 1.00% | 0.40% | 2.51% | -1.22% | 0.06% |
| |
| Ratios/Supplemental Data | | | | | |
| Net Assets, End of Period (Millions) | $6,525 | $5,078 | $3,373 | $2,126 | $1,518 |
| Ratio of Total Expenses to Average Net Assets | 0.06% | 0.06% | 0.07% | 0.08% | 0.10% |
| Ratio of Net Investment Income to | | | | | |
| Average Net Assets | 2.81% | 1.35% | 0.51% | (0.44%) | 0.98% |
| Portfolio Turnover Rate 3 | 25% | 27% | 28% | 26% | 18% |
1 Calculated based on average shares outstanding.
2 Total returns do not include account service fees that may have applied in the periods shown. Fund prospectuses provide information about any applicable account service fees.
3 Excludes the value of portfolio securities received or delivered as a result of in-kind purchases or redemptions of the fund’s capital shares, including ETF Creation Units.
See accompanying Notes, which are an integral part of the Financial Statements.
16
Short-Term Inflation-Protected Securities Index Fund
Financial Highlights
| | | | | |
| Institutional Shares | | | | | |
| |
| For a Share Outstanding | | | Year Ended September 30, |
| Throughout Each Period | 2018 | 2017 | 2016 | 2015 | 2014 |
| Net Asset Value, Beginning of Period | $24.81 | $24.90 | $24.28 | $24.78 | $24.77 |
| Investment Operations | | | | | |
| Net Investment Income | . 6961 | . 3331 | .1391 | (. 099) | . 215 |
| Net Realized and Unrealized Gain (Loss) | | | | | |
| on Investments | (. 449) | (. 225) | . 481 | (.196) | (.189) |
| Total from Investment Operations | . 247 | .108 | .620 | (. 295) | .026 |
| Distributions | | | | | |
| Dividends from Net Investment Income | (.787) | (.198) | — | (. 205) | (. 016) |
| Distributions from Realized Capital Gains | — | — | — | — | — |
| Total Distributions | (.787) | (.198) | — | (. 205) | (. 016) |
| Net Asset Value, End of Period | $24.27 | $24.81 | $24.90 | $24.28 | $24.78 |
| |
| Total Return | 1.02% | 0.44% | 2.55% | -1.19% | 0.11% |
| |
| Ratios/Supplemental Data | | | | | |
| Net Assets, End of Period (Millions) | $8,067 | $6,986 | $5,500 | $3,837 | $2,706 |
| Ratio of Total Expenses to Average Net Assets | 0.04% | 0.04% | 0.04% | 0.05% | 0.07% |
| Ratio of Net Investment Income to | | | | | |
| Average Net Assets | 2.83% | 1.37% | 0.54% | (0.41%) | 1.01% |
| Portfolio Turnover Rate2 | 25% | 27% | 28% | 26% | 18% |
1 Calculated based on average shares outstanding.
2 Excludes the value of portfolio securities received or delivered as a result of in-kind purchases or redemptions of the fund’s capital shares, including ETF Creation Units.
See accompanying Notes, which are an integral part of the Financial Statements.
17
Short-Term Inflation-Protected Securities Index Fund
Notes to Financial Statements
Vanguard Short-Term Inflation-Protected Securities Index Fund is registered under the Investment Company Act of 1940 as an open-end investment company, or mutual fund. The fund offers four classes of shares: Investor Shares, ETF Shares, Admiral Shares, and Institutional Shares. Investor Shares are available to any investor who meets the fund’s minimum purchase requirements. ETF Shares are listed for trading on Nasdaq; they can be purchased and sold through a broker. Admiral Shares and Institutional Shares are designed for investors who meet certain administrative, service, and account-size criteria.
A. The following significant accounting policies conform to generally accepted accounting principles for U.S. investment companies. The fund consistently follows such policies in preparing its financial statements.
1. Security Valuation: Securities are valued as of the close of trading on the New York Stock Exchange (generally 4 p.m., Eastern time) on the valuation date. Bonds and temporary cash investments are valued using the latest bid prices or using valuations based on a matrix system (which considers such factors as security prices, yields, maturities, and ratings), both as furnished by independent pricing services. Investments in Vanguard Market Liquidity Fund are valued at that fund’s net asset value. Securities for which market quotations are not readily available, or whose values have been affected by events occurring before the fund’s pricing time but after the close of the securities’ primary markets, are valued by methods deemed by the board of trustees to represent fair value.
2. Futures Contracts: The fund uses futures contracts to invest in fixed income asset classes with greater efficiency and lower cost than is possible through direct investment, to add value when these instruments are attractively priced, or to adjust sensitivity to changes in interest rates. The primary risks associated with the use of futures contracts are imperfect correlation between changes in market values of bonds held by the fund and the prices of futures contracts, and the possibility of an illiquid market. Counterparty risk involving futures is mitigated because a regulated clearing-house is the counterparty instead of the clearing broker. To further mitigate counterparty risk, the fund trades futures contracts on an exchange, monitors the financial strength of its clearing brokers and clearinghouse, and has entered into clearing agreements with its clearing brokers. The clearing-house imposes initial margin requirements to secure the fund’s performance and requires daily settlement of variation margin representing changes in the market value of each contract. Any assets pledged as initial margin for open contracts are noted in the Statement of Net Assets.
Futures contracts are valued at their quoted daily settlement prices. The notional amounts of the contracts are not recorded in the Statement of Net Assets. Fluctuations in the value of the contracts are recorded in the Statement of Net Assets as an asset (liability) and in the Statement of Operations as unrealized appreciation (depreciation) until the contracts are closed, when they are recorded as realized futures gains (losses).
During the year ended September 30, 2018, the fund’s average investments in long and short futures contracts each represented less than 1% of net assets, respectively, based on the average of the notional amounts at each quarter-end during the period. The fund had no open futures contracts at September 30, 2018.
3. Federal Income Taxes: The fund intends to continue to qualify as a regulated investment company and distribute all of its taxable income. Management has analyzed the fund’s tax positions taken for all open federal income tax years (September 30, 2015–2018), and has concluded that no provision for federal income tax is required in the fund’s financial statements.
18
Short-Term Inflation-Protected Securities Index Fund
4. Distributions: Distributions to shareholders are recorded on the ex-dividend date. Distributions are determined on a tax basis and may differ from net investment income and realized capital gains for financial reporting purposes.
5. Credit Facility: The fund and certain other funds managed by The Vanguard Group (“Vanguard”) participate in a $3.1 billion committed credit facility provided by a syndicate of lenders pursuant to a credit agreement that may be renewed annually; each fund is individually liable for its borrowings, if any, under the credit facility. Borrowings may be utilized for temporary and emergency purposes, and are subject to the fund’s regulatory and contractual borrowing restrictions. The participating funds are charged administrative fees and an annual commitment fee of 0.10% of the undrawn amount of the facility; these fees are allocated to the funds based on a method approved by the fund’s board of trustees and included in Management and Administrative expenses on the fund’s Statement of Operations. Any borrowings under this facility bear interest at a rate based upon the higher of the one-month London Interbank Offered Rate, federal funds effective rate, or overnight bank funding rate plus an agreed-upon spread.
The fund had no borrowings outstanding at September 30, 2018, or at any time during the period then ended.
6. Other: Interest income includes income distributions received from Vanguard Market Liquidity Fund and is accrued daily. Premiums and discounts on debt securities purchased are amortized and accreted, respectively, to interest income over the lives of the respective securities. Inflation adjustments to the face amount of inflation-indexed securities are included in interest income. Security transactions are accounted for on the date securities are bought or sold. Costs used to determine realized gains (losses) on the sale of investment securities are those of the specific securities sold.
Each class of shares has equal rights as to assets and earnings, except that each class separately bears certain class-specific expenses related to maintenance of shareholder accounts (included in Management and Administrative expenses), shareholder reporting, and the proxy. Marketing and distribution expenses are allocated to each class of shares based on a method approved by the board of trustees. Income, other non-class-specific expenses, and gains and losses on investments are allocated to each class of shares based on its relative net assets.
B. In accordance with the terms of a Funds’ Service Agreement (the “FSA”) between Vanguard and the fund, Vanguard furnishes to the fund investment advisory, corporate management, administrative, marketing, and distribution services at Vanguard’s cost of operations (as defined by the FSA). These costs of operations are allocated to the fund based on methods and guidelines approved by the board of trustees. Vanguard does not require reimbursement in the current period for certain costs of operations (such as deferred compensation/benefits and risk/insurance costs); the fund’s liability for these costs of operations is included in Payables to Vanguard on the Statement of Net Assets. All other costs of operations payable to Vanguard are generally settled twice a month.
Upon the request of Vanguard, the fund may invest up to 0.40% of its net assets as capital in Vanguard. At September 30, 2018, the fund had contributed to Vanguard capital in the amount of $1,342,000, representing 0.01% of the fund’s net assets and 0.54% of Vanguard’s capitalization. The fund’s trustees and officers are also directors and employees, respectively, of Vanguard.
19
Short-Term Inflation-Protected Securities Index Fund
C. Various inputs may be used to determine the value of the fund’s investments. These inputs are summarized in three broad levels for financial statement purposes. The inputs or methodologies used to value securities are not necessarily an indication of the risk associated with investing in those securities.
Level 1—Quoted prices in active markets for identical securities.
Level 2—Other significant observable inputs (including quoted prices for similar securities, interest rates, prepayment speeds, credit risk, etc.).
Level 3—Significant unobservable inputs (including the fund’s own assumptions used to determine the fair value of investments). Any investments valued with significant unobservable inputs are noted on the Statement of Net Assets.
The following table summarizes the market value of the fund’s investments as of September 30, 2018, based on the inputs used to value them:
| | | |
| | Level 1 | Level 2 | Level 3 |
| Investments | ($000) | ($000) | ($000) |
| U.S. Government and Agency Obligations | — | 26,681,418 | — |
| Temporary Cash Investments | 16,415 | — | — |
| Total | 16,415 | 26,681,418 | — |
D. Permanent differences between book-basis and tax-basis components of net assets are reclassified among capital accounts in the financial statements to reflect their tax character. These reclassifications have no effect on net assets or net asset value per share. As of period end, the following permanent differences primarily attributable to the accounting for in-kind redemptions and inflation adjustments were reclassified to the following accounts:
| |
| | Amount |
| | ($000) |
| Paid-in Capital | 29,067 |
| Undistributed (Overdistributed) Net Investment Income | 18 |
| Accumulated Net Realized Gains (Losses) | (29,085) |
Temporary differences between book-basis and tax-basis components of accumulated net earnings (losses) arise when certain items of income, gain, or loss are recognized in different periods for financial statement and tax purposes; these differences will reverse at some time in the future. The differences are primarily related to the tax deferral of losses on wash sales. As of period end, the tax-basis components of accumulated net earnings (losses) are detailed in the table as follows:
| |
| | Amount |
| | ($000) |
| Undistributed Ordinary Income | 96,606 |
| Undistributed Long-Term Gains | — |
| Capital Loss Carryforwards (Non-expiring) | (173,251) |
| Net Unrealized Gains (Losses) | (443,656) |
20
Short-Term Inflation-Protected Securities Index Fund
As of September 30, 2018, gross unrealized appreciation and depreciation for investments and derivatives based on cost for U.S. federal income tax purposes were as follows:
| |
| | Amount |
| | ($000) |
| Tax Cost | 27,141,489 |
| Gross Unrealized Appreciation | — |
| Gross Unrealized Depreciation | (443,656) |
| Net Unrealized Appreciation (Depreciation) | (443,656) |
E. During the year ended September 30, 2018, the fund purchased $10,983,028,000 of investment securities and sold $6,371,883,000 of investment securities, other than temporary cash investments. Purchases and sales include $1,641,452,000 and $336,914,000, respectively, in connection with in-kind purchases and redemptions of the fund’s capital shares.
| | | | |
| F. Capital share transactions for each class of shares were: | | | |
| | | | Year Ended September 30, |
| | | 2018 | | 2017 |
| | Amount | Shares | Amount | Shares |
| | ($000) | (000) | ($000) | (000) |
| Investor Shares | | | | |
| Issued | 938,053 | 38,252 | 1,069,872 | 43,271 |
| Issued in Lieu of Cash Distributions | 196,139 | 8,067 | 27,936 | 1,136 |
| Redeemed | (221,815) | (9,082) | (271,294) | (10,974) |
| Net Increase (Decrease)—Investor Shares | 912,377 | 37,237 | 826,514 | 33,433 |
| ETF Shares | | | | |
| Issued | 2,079,941 | 42,425 | 1,524,321 | 30,900 |
| Issued in Lieu of Cash Distributions | — | — | — | — |
| Redeemed | (398,275) | (8,175) | (114,917) | (2,325) |
| Net Increase (Decrease)—ETF Shares | 1,681,666 | 34,250 | 1,409,404 | 28,575 |
| Admiral Shares | | | | |
| Issued | 2,310,017 | 94,161 | 2,400,906 | 97,067 |
| Issued in Lieu of Cash Distributions | 170,230 | 6,995 | 25,001 | 1,016 |
| Redeemed | (907,090) | (36,988) | (713,167) | (28,817) |
| Net Increase (Decrease)—Admiral Shares | 1,573,157 | 64,168 | 1,712,740 | 69,266 |
| Institutional Shares | | | | |
| Issued | 1,960,417 | 79,837 | 2,636,078 | 106,487 |
| Issued in Lieu of Cash Distributions | 238,639 | 9,799 | 44,322 | 1,801 |
| Redeemed | (953,531) | (38,884) | (1,176,991) | (47,524) |
| Net Increase (Decrease)—Institutional Shares | 1,245,525 | 50,752 | 1,503,409 | 60,764 |
21
Short-Term Inflation-Protected Securities Index Fund
At September 30, 2018, one shareholder was the record or beneficial owner of 36% of the fund’s net assets. If the shareholder were to redeem its investment in the fund, the redemption might result in an increase in the fund’s expense ratio, cause the fund to incur higher transaction costs, or lead to the realization of taxable capital gains.
G. Management has determined that no events or transactions occurred subsequent to September 30, 2018, that would require recognition or disclosure in these financial statements.
22
Report of Independent Registered
Public Accounting Firm
To the Board of Trustees of Vanguard Malvern Funds and Shareholders of Vanguard Short-Term
Inflation-Protected Securities Index Fund
Opinion on the Financial Statements
We have audited the accompanying statement of net assets of Vanguard Short-Term Inflation-Protected Securities Index Fund (one of the funds constituting Vanguard Malvern Funds, referred to hereafter as the “Fund”) as of September 30, 2018, the related statement of operations for the year ended September 30, 2018, the statement of changes in net assets for each of the two years in the period ended September 30, 2018, including the related notes, and the financial highlights for each of the five years in the period ended September 30, 2018 (collectively referred to as the “financial statements”). In our opinion, the financial statements present fairly, in all material respects, the financial position of the Fund as of September 30, 2018, the results of its operations for the year then ended, the changes in its net assets for each of the two years in the period ended September 30, 2018 and the financial highlights for each of the five years in the period ended September 30, 2018 in conformity with accounting principles generally accepted in the United States of America.
Basis for Opinion
These financial statements are the responsibility of the Fund’s management. Our responsibility is to express an opinion on the Fund’s financial statements based on our audits. We are a public accounting firm registered with the Public Company Accounting Oversight Board (United States) (“PCAOB”) and are required to be independent with respect to the Fund in accordance with the U.S. federal securities laws and the applicable rules and regulations of the Securities and Exchange Commission and the PCAOB.
We conducted our audits of these financial statements in accordance with the standards of the PCAOB. Those standards require that we plan and perform the audit to obtain reasonable assurance about whether the financial statements are free of material misstatement, whether due to error or fraud.
Our audits included performing procedures to assess the risks of material misstatement of the financial statements, whether due to error or fraud, and performing procedures that respond to those risks. Such procedures included examining, on a test basis, evidence regarding the amounts and disclosures in the financial statements. Our audits also included evaluating the accounting principles used and significant estimates made by management, as well as evaluating the overall presentation of the financial statements. Our procedures included confirmation of securities owned as of September 30, 2018 by correspondence with the custodians and brokers and by agreement to the underlying ownership records of the transfer agent; when replies were not received from brokers, we performed other auditing procedures. We believe that our audits provide a reasonable basis for our opinion.
/s/PricewaterhouseCoopers LLP
Philadelphia, Pennsylvania
November 15, 2018
We have served as the auditor of one or more investment companies in The Vanguard Group of Funds since 1975.
23
Special 2018 tax information (unaudited) for Vanguard Short-Term Inflation-Protected Securities Index Fund
This information for the fiscal year ended September 30, 2018, is included pursuant to provisions of the Internal Revenue Code.
For nonresident alien shareholders, 99.9% of income dividends are interest-related dividends.
24
About Your Fund’s Expenses
As a shareholder of the fund, you incur ongoing costs, which include costs for portfolio management, administrative services, and shareholder reports (like this one), among others. Operating expenses, which are deducted from a fund’s gross income, directly reduce the investment return of the fund.
A fund’s expenses are expressed as a percentage of its average net assets. This figure is known as the expense ratio. The following examples are intended to help you understand the ongoing costs (in dollars) of investing in your fund and to compare these costs with those of other mutual funds. The examples are based on an investment of $1,000 made at the beginning of the period shown and held for the entire period.
The accompanying table illustrates your fund’s costs in two ways:
• Based on actual fund return. This section helps you to estimate the actual expenses that you paid over the period. The ”Ending Account Value“ shown is derived from the fund‘s actual return, and the third column shows the dollar amount that would have been paid by an investor who started with $1,000 in the fund. You may use the information here, together with the amount you invested, to estimate the expenses that you paid over the period.
To do so, simply divide your account value by $1,000 (for example, an $8,600 account value divided by $1,000 = 8.6), then multiply the result by the number given for your fund under the heading ”Expenses Paid During Period.“
• Based on hypothetical 5% yearly return. This section is intended to help you compare your fund‘s costs with those of other mutual funds. It assumes that the fund had a yearly return of 5% before expenses, but that the expense ratio is unchanged. In this case—because the return used is not the fund’s actual return—the results do not apply to your investment. The example is useful in making comparisons because the Securities and Exchange Commission requires all mutual funds to calculate expenses based on a 5% return. You can assess your fund’s costs by comparing this hypothetical example with the hypothetical examples that appear in shareholder reports of other funds.
Note that the expenses shown in the table are meant to highlight and help you compare ongoing costs only and do not reflect transaction costs incurred by the fund for buying and selling securities. Further, the expenses do not include any purchase, redemption, or account service fees described in the fund prospectus. If such fees were applied to your account, your costs would be higher. Your fund does not carry a “sales load.”
The calculations assume no shares were bought or sold during the period. Your actual costs may have been higher or lower, depending on the amount of your investment and the timing of any purchases or redemptions.
You can find more information about the fund’s expenses, including annual expense ratios, in the Financial Statements section of this report. For additional information on operating expenses and other shareholder costs, please refer to your fund’s current prospectus.
25
| | | |
| Six Months Ended September 30, 2018 | | | |
| | Beginning | Ending | Expenses |
| Short-Term Inflation-Protected Securities Index | Account Value | Account Value | Paid During |
| Fund | 3/31/2018 | 9/30/2018 | Period |
| Based on Actual Fund Return | | | |
| Investor Shares | $1,000.00 | $1,005.57 | $0.65 |
| ETF Shares | 1,000.00 | 1,005.92 | 0.30 |
| Admiral Shares | 1,000.00 | 1,005.76 | 0.30 |
| Institutional Shares | 1,000.00 | 1,006.31 | 0.20 |
| Based on Hypothetical 5% Yearly Return | | | |
| Investor Shares | $1,000.00 | $1,024.42 | $0.66 |
| ETF Shares | 1,000.00 | 1,024.77 | 0.30 |
| Admiral Shares | 1,000.00 | 1,024.77 | 0.30 |
| Institutional Shares | 1,000.00 | 1,024.87 | 0.20 |
The calculations are based on expenses incurred in the most recent six-month period. The fund’s annualized six-month expense ratios for that period are 0.13% for Investor Shares, 0.06% for ETF Shares, 0.06% for Admiral Shares, and 0.04% for Institutional Shares. The dollar amounts shown as “Expenses Paid” are equal to the annualized expense ratio multiplied by the average account value over the period, multiplied by the number of days in the most recent six-month period, then divided by the number of days in the most recent 12-month period (183/365).
26
Glossary
30-Day SEC Yield. A fund’s 30-day SEC yield is derived using a formula specified by the U.S. Securities and Exchange Commission. Under the formula, data related to the fund’s security holdings in the previous 30 days are used to calculate the fund’s hypothetical net income for that period, which is then annualized and divided by the fund’s estimated average net assets over the calculation period. For the purposes of this calculation, a security’s income is based on its current market yield to maturity (for bonds), its actual income (for asset-backed securities), or its projected dividend yield (for stocks). Because the SEC yield represents hypothetical annualized income, it will differ—at times significantly—from the fund’s actual experience. As a result, the fund’s income distributions may be higher or lower than implied by the SEC yield.
Average Coupon. The average interest rate paid on the fixed income securities held by a fund. It is expressed as a percentage of face value.
Average Duration. An estimate of how much the value of the fund’s bonds will fluctuate in response to a change in “real” interest rates—meaning rates without inflation expectations built in. Real interest rates are reflected in market yields for inflation-adjusted securities. To see how the fund’s bond values could change, multiply the average duration by the change in real rates. For example, if the average duration were five years, then the value of the fund’s bonds would decline by about 5% if real interest rates rose by 1 percentage point. Conversely, if real rates fell by a percentage point, the value of the bonds would rise about 5%.
Average Effective Maturity. The average length of time until fixed income securities held by a fund reach maturity and are repaid, taking into consideration the possibility that the issuer may call the bond before its maturity date. The figure reflects the proportion of fund assets represented by each security; it also reflects any futures contracts held. In general, the longer the average effective maturity, the more a fund’s share price will fluctuate in response to changes in market interest rates.
Credit Quality. Credit-quality ratings are measured on a scale that generally ranges from AAA (highest) to D (lowest). U.S. Treasury, U.S. Agency, and U.S. Agency mortgage-backed securities appear under “U.S. Government.” Credit-quality ratings are obtained from Barclays and are from Moody’s, Fitch, and S&P. When ratings from all three agencies are used, the median rating is shown. When ratings from two of the agencies are used, the lower rating for each issue is shown. “Not Rated” is used to classify securities for which a rating is not available.
Expense Ratio. A fund’s total annual operating expenses expressed as a percentage of the fund’s average net assets. The expense ratio includes management and administrative expenses, but does not include the transaction costs of buying and selling portfolio securities.
Inception Date. The date on which the assets of a fund (or one of its share classes) are first invested in accordance with the fund’s investment objective. For funds with a subscription period, the inception date is the day after that period ends. Investment performance is measured from the inception date.
Short-Term Reserves. The percentage of a fund invested in highly liquid, short-term securities that can be readily converted to cash.
27
Yield to Maturity. This term generally refers to the rate of return an investor would receive if the fixed income securities held by a fund were held to their maturity dates. For the Short-Term Inflation-Protected Securities Index Fund, the calculation is modified by adding in the inflation adjustment made over the past 12 months. This change results in a figure more directly comparable to the yield-to-maturity figures for other types of bond funds. (An unmodified yield to maturity is used in calculating the fund’s 30-Day SEC Yield.)
28
BLOOMBERG is a trademark and service mark of Bloomberg Finance L.P. BARCLAYS is a trademark and service mark of Barclays Bank Plc, used under license. Bloomberg Finance L.P. and its affiliates, including Bloomberg Index Services Limited (BISL) (collectively, Bloomberg), or Bloomberg’s licensors, own all proprietary rights in the Bloomberg Barclays U.S. Treasury Inflation-Protected Securities (Tips) 0–5 Year Index (Index or Bloomberg Barclays Index).
Neither Barclays Bank Plc, Barclays Capital Inc., or any affiliate (collectively Barclays) or Bloomberg is the issuer or producer of the Short-Term Inflation-Protected Securities Index Fund and neither Bloomberg nor Barclays has any responsibilities, obligations or duties to investors in the Short-Term Inflation-Protected Securities Index Fund. The Index is licensed for use by The Vanguard Group, Inc. (Vanguard) as the sponsor of the Short-Term Inflation-Protected Securities Index Fund. Bloomberg and Barclays’ only relationship with Vanguard in respect of the Index is the licensing of the Index, which is determined, composed and calculated by BISL, or any successor thereto, without regard to the Issuer or the Short-Term Inflation-Protected Securities Index Fund or the owners of the Short-Term Inflation-Protected Securities Index Fund.
Additionally, Vanguard may for itself execute transaction(s) with Barclays in or relating to the Index in connection with the Short-Term Inflation-Protected Securities Index Fund. Investors acquire the Short-Term Inflation-Protected Securities Index Fund from Vanguard and investors neither acquire any interest in the Index nor enter into any relationship of any kind whatsoever with Bloomberg or Barclays upon making an investment in the Short-Term Inflation-Protected Securities Index Fund. The Short-Term Inflation-Protected Securities Index Fund is not sponsored, endorsed, sold or promoted by Bloomberg or Barclays. Neither Bloomberg nor Barclays makes any representation or warranty, express or implied regarding the advisability of investing in the Short-Term Inflation-Protected Securities Index Fund or the advisability of investing in securities generally or the ability of the Index to track corresponding or relative market performance. Neither Bloomberg nor Barclays has passed on the legality or suitability of the Short-Term Inflation-Protected Securities Index Fund with respect to any person or entity. Neither Bloomberg nor Barclays is responsible for and has not participated in the determination of the timing of, prices at, or quantities of the Short-Term Inflation-Protected Securities Index Fund to be issued. Neither Bloomberg nor Barclays has any obligation to take the needs of the Issuer or the owners of the Short-Term Inflation-Protected Securities Index Fund or any other third party into consideration in determining, composing or calculating the Index. Neither Bloomberg nor Barclays has any obligation or liability in connection with administration, marketing or trading of the Short-Term Inflation-Protected Securities Index Fund.
29
The licensing agreement between Bloomberg and Barclays is solely for the benefit of Bloomberg and Barclays and not for the benefit of the owners of the Short-Term Inflation-Protected Securities Index Fund, investors or other third parties. In addition, the licensing agreement between Vanguard and Bloomberg is solely for the benefit of Vanguard and Bloomberg and not for the benefit of the owners of the Short-Term Inflation-Protected Securities Index Fund, investors or other third parties.
NEITHER BLOOMBERG NOR BARCLAYS SHALL HAVE ANY LIABILITY TO THE ISSUER, INVESTORS OR TO OTHER THIRD PARTIES FOR THE QUALITY, ACCURACY AND/OR COMPLETENESS OF THE BLOOMBERG BARCLAYS INDEX OR ANY DATA INCLUDED THEREIN OR FOR INTERRUPTIONS IN THE DELIVERY OF THE BLOOMBERG BARCLAYS INDEX. NEITHER BLOOMBERG NOR BARCLAYS MAKES ANY WARRANTY, EXPRESS OR IMPLIED, AS TO RESULTS TO BE OBTAINED BY THE ISSUER, THE INVESTORS OR ANY OTHER PERSON OR ENTITY FROM THE USE OF THE BLOOMBERG BARCLAYS INDEX OR ANY DATA INCLUDED THEREIN. NEITHER BLOOMBERG NOR BARCLAYS MAKES ANY EXPRESS OR IMPLIED WARRANTIES, AND EACH HEREBY EXPRESSLY DISCLAIMS ALL WARRANTIES OF MERCHANTABILITY OR FITNESS FOR A PARTICULAR PURPOSE OR USE WITH RESPECT TO THE BLOOMBERG BARCLAYS INDEX OR ANY DATA INCLUDED THEREIN. BLOOMBERG RESERVES THE RIGHT TO CHANGE THE METHODS OF CALCULATION OR PUBLICATION, OR
TO CEASE THE CALCULATION OR PUBLICATION OF THE BLOOMBERG BARCLAYS INDEX, AND NEITHER BLOOMBERG NOR BARCLAYS SHALL BE LIABLE FOR ANY MISCALCULATION OF OR ANY INCORRECT, DELAYED OR INTERRUPTED PUBLICATION WITH RESPECT TO ANY OF THE BLOOMBERG BARCLAYS INDEX. NEITHER BLOOMBERG NOR BARCLAYS SHALL BE LIABLE FOR ANY DAMAGES, INCLUDING, WITHOUT LIMITATION, ANY SPECIAL, INDIRECT
OR CONSEQUENTIAL DAMAGES, OR ANY LOST PROFITS AND EVEN IF ADVISED OF THE POSSIBILITY OF SUCH, RESULTING FROM THE USE OF THE BLOOMBERG BARCLAYS INDEX OR ANY DATA INCLUDED THEREIN OR WITH RESPECT TO THE SHORT-TERM INFLATION-PROTECTED SECURITIES INDEX FUND.
None of the information supplied by Bloomberg or Barclays and used in this publication may be reproduced in any manner without the prior written permission of both Bloomberg and Barclays Capital, the investment banking division of Barclays Bank Plc. Barclays Bank Plc is registered in England No. 1026167. Registered office 1 Churchill Place London E14 5HP.
© 2018 Bloomberg. Used with Permission.
Source: Bloomberg Index Services Limited. Copyright 2018, Bloomberg. All rights reserved.
30
The People Who Govern Your Fund
The trustees of your mutual fund are there to see that the fund is operated and managed in your best interests since, as a shareholder, you are a part owner of the fund. Your fund’s trustees also serve on the board of directors of The Vanguard Group, Inc., which is owned by the Vanguard funds and provides services to them on an at-cost basis.
A majority of Vanguard’s board members are independent, meaning that they have no affiliation with Vanguard or the funds they oversee, apart from the sizable personal investments they have made as private individuals. The independent board members have distinguished backgrounds in business, academia, and public service. Each of the trustees and executive officers oversees 211 Vanguard funds.
Information for each trustee and executive officer of the fund appears below. The mailing address of the trustees and officers is P.O. Box 876, Valley Forge, PA 19482. More information about the trustees is in the Statement of Additional Information, which can be obtained, without charge, by contacting Vanguard at 800-662-7447, or online at vanguard.com.
Interested Trustees1
F. William McNabb III
Born in 1957. Trustee since July 2009. Principal occupation(s) during the past five years and other experience: chairman of the board (January 2010–present) of Vanguard and of each of the investment companies served by Vanguard, trustee (2009–present) of each of the investment companies served by Vanguard, and director (2008–present) of Vanguard. Chief executive officer and president (2008–2017) of Vanguard and each of the investment companies served by Vanguard, managing director (1995–2008) of Vanguard, and director (1997–2018) of Vanguard Marketing Corporation. Director (2018–present) of UnitedHealth Group.
Mortimer J. Buckley
Born in 1969. Trustee since January 2018. Principal occupation(s) during the past five years and other experience: chief executive officer (January 2018–present) of Vanguard; chief executive officer, president, and trustee (January 2018–present) of each of the investment companies served by Vanguard; president and director (2017–present) of Vanguard; and president (February 2018–present) of Vanguard Marketing Corporation. Chief investment officer (2013–2017), managing director (2002–2017), head of the Retail Investor Group (2006–2012), and chief information officer (2001–2006) of Vanguard. Chairman of the board (2011–2017) of the Children’s Hospital of Philadelphia.
Independent Trustees
Emerson U. Fullwood
Born in 1948. Trustee since January 2008. Principal occupation(s) during the past five years and other experience: executive chief staff and marketing officer for North America and corporate vice president (retired 2008) of Xerox Corporation (document management products and services). Former president of the Worldwide Channels Group, Latin America, and Worldwide Customer Service and executive chief staff officer of Developing Markets of Xerox. Executive in residence and 2009–2010 Distinguished Minett Professor at the Rochester Institute of Technology. Lead director of SPX FLOW, Inc. (multi-industry manufacturing). Director of the University of Rochester Medical Center, the Monroe Community College Foundation, the United Way of Rochester, North Carolina A&T University, and Roberts Wesleyan College. Trustee of the University of Rochester.
Amy Gutmann
Born in 1949. Trustee since June 2006. Principal occupation(s) during the past five years and other experience: president (2004–present) of the University of Pennsylvania. Christopher H. Browne Distinguished Professor of Political Science, School of Arts and Sciences, and professor of communication, Annenberg School for Communication, with secondary faculty appointments in the Department of Philosophy, School of Arts and Sciences, and at the Graduate School of Education, University of Pennsylvania. Trustee of the National Constitution Center.
1 Mr. McNabb and Mr. Buckley are considered “interested persons,” as defined in the Investment Company Act of 1940, because they are officers of the Vanguard funds.
JoAnn Heffernan Heisen
Born in 1950. Trustee since July 1998. Principal occupation(s) during the past five years and other experience: corporate vice president of Johnson & Johnson (pharmaceuticals/medical devices/consumer products) and member of its executive committee (1997–2008). Chief global diversity officer (retired 2008), vice president and chief information officer (1997–2006), controller (1995–1997), treasurer (1991–1995), and assistant treasurer (1989–1991) of Johnson & Johnson. Director of Skytop Lodge Corporation (hotels) and the Robert Wood Johnson Foundation. Member of the advisory board of the Institute for Women’s Leadership at Rutgers University.
F. Joseph Loughrey
Born in 1949. Trustee since October 2009. Principal occupation(s) during the past five years and other experience: president and chief operating officer (retired 2009) and vice chairman of the board (2008–2009) of Cummins Inc. (industrial machinery). Chairman of the board of Hillenbrand, Inc. (specialized consumer services), Oxfam America, and the Lumina Foundation for Education. Director of the V Foundation for Cancer Research. Member of the advisory council for the College of Arts and Letters and chair of the advisory board to the Kellogg Institute for International Studies, both at the University of Notre Dame.
Mark Loughridge
Born in 1953. Trustee since March 2012. Principal occupation(s) during the past five years and other experience: senior vice president and chief financial officer (retired 2013) of IBM (information technology services). Fiduciary member of IBM’s Retirement Plan Committee (2004–2013), senior vice president and general manager (2002–2004) of IBM Global Financing, vice president and controller (1998–2002) of IBM, and a variety of other prior management roles at IBM. Member of the Council on Chicago Booth.
Scott C. Malpass
Born in 1962. Trustee since March 2012. Principal occupation(s) during the past five years and other experience: chief investment officer (1989–present) and vice president (1996–present) of the University of Notre Dame. Assistant professor of finance at the Mendoza College of Business, University of Notre Dame, and member of the Notre Dame 403(b) Investment Committee. Chairman of the board of TIFF Advisory Services, Inc. Member of the board of Catholic Investment Services, Inc. (investment advisors), the board of advisors for Spruceview Capital Partners, and the board of superintendence of the Institute for the Works of Religion.
Deanna Mulligan
Born in 1963. Trustee since January 2018. Principal occupation(s) during the past five years and other experience: president (2010–present) and chief executive officer (2011–present) of The Guardian Life Insurance Company of America. Chief operating officer (2010–2011) and executive vice president (2008–2010) of Individual Life and Disability of The Guardian Life Insurance Company of America. Member of the board of The Guardian Life Insurance Company of America, the American Council of Life Insurers, the Partnership for New York City (business leadership), and the Committee Encouraging Corporate Philanthropy. Trustee of the Economic Club of New York and the Bruce Museum (arts and science). Member of the Advisory Council for the Stanford Graduate School of Business.
André F. Perold
Born in 1952. Trustee since December 2004. Principal occupation(s) during the past five years and other experience: George Gund Professor of Finance and Banking, Emeritus at the Harvard Business School (retired 2011). Chief investment officer and co-managing partner of HighVista Strategies LLC (private investment firm). Overseer of the Museum of Fine Arts Boston.
Sarah Bloom Raskin
Born in 1961. Trustee since January 2018. Principal occupation(s) during the past five years and other experience: deputy secretary (2014–2017) of the United States Department of the Treasury. Governor (2010–2014) of the Federal Reserve Board. Commissioner (2007–2010) of financial regulation for the State of Maryland. Member of the board of directors (2012–2014) of Neighborhood Reinvestment Corporation. Director of i(x) Investments, LLC.
Peter F. Volanakis
Born in 1955. Trustee since July 2009. Principal occupation(s) during the past five years and other experience: president and chief operating officer (retired 2010) of Corning Incorporated (communications equipment) and director of Corning Incorporated (2000–2010) and Dow Corning (2001–2010). Director (2012) of SPX Corporation (multi-industry manufacturing). Overseer of the Amos Tuck School of Business Administration, Dartmouth College (2001–2013). Chairman of the board of trustees of Colby-Sawyer College. Member of the Board of Hypertherm Inc. (industrial cutting systems, software, and consumables).
Executive Officers
Glenn Booraem
Born in 1967. Principal occupation(s) during the past five years and other experience: principal of Vanguard. Investment stewardship officer (2017–present), treasurer (2015–2017), controller (2010–2015), and assistant controller (2001–2010) of each of the investment companies served by Vanguard.
Christine M. Buchanan
Born in 1970. Principal occupation(s) during the past five years and other experience: principal of Vanguard and global head of Fund Administration at Vanguard. Treasurer (2017–present) of each of the investment companies served by Vanguard. Partner (2005–2017) at KPMG LLP (audit, tax, and advisory services).
Brian Dvorak
Born in 1973. Principal occupation(s) during the past five years and other experience: principal of Vanguard. Chief compliance officer (2017–present) of Vanguard and each of the investment companies served by Vanguard. Assistant vice president (2017–present) of Vanguard Marketing Corporation. Vice president and director of Enterprise Risk Management (2011–2013) at Oppenheimer Funds, Inc.
Thomas J. Higgins
Born in 1957. Principal occupation(s) during the past five years and other experience: principal of Vanguard. Chief financial officer (2008–present) and treasurer (1998–2008) of each of the investment companies served by Vanguard.
Peter Mahoney
Born in 1974. Principal occupation(s) during the past five years and other experience: principal of Vanguard. Controller (2015–present) of each of the investment companies served by Vanguard. Head of International Fund Services (2008–2014) at Vanguard.
Anne E. Robinson
Born in 1970. Principal occupation(s) during the past five years and other experience: general counsel (2016–present) of Vanguard. Secretary (2016–present) of Vanguard and of each of the investment companies served by Vanguard. Managing director (2016–present) of Vanguard. Director and senior vice president (2016–2018) of Vanguard Marketing Corporation. Managing director and general counsel of Global Cards and Consumer Services (2014–2016) at Citigroup. Counsel (2003–2014) at American Express.
Michael Rollings
Born in 1963. Principal occupation(s) during the past five years and other experience: finance director (2017–present) and treasurer (2017) of each of the investment companies served by Vanguard. Managing director (2016–present) of Vanguard. Chief financial officer (2016–present) of Vanguard. Director (2016–present) of Vanguard Marketing Corporation. Executive vice president and chief financial officer (2006–2016) of MassMutual Financial Group.
| |
| Vanguard Senior Management Team |
| |
| Joseph Brennan | Chris D. McIsaac |
| Mortimer J. Buckley | James M. Norris |
| Gregory Davis | Thomas M. Rampulla |
| John James | Karin A. Risi |
| Martha G. King | Anne E. Robinson |
| John T. Marcante | Michael Rollings |
Chairman Emeritus and Senior Advisor
John J. Brennan
Chairman, 1996–2009
Chief Executive Officer and President, 1996–2008
Founder
John C. Bogle
Chairman and Chief Executive Officer, 1974–1996
 |
| P.O. Box 2600 |
| Valley Forge, PA 19482-2600 |
| |
| |
| |
| Connect with Vanguard® > vanguard.com |
| |
| |
| |
| Fund Information > 800-662-7447 |
| Direct Investor Account Services > 800-662-2739 |
| Institutional Investor Services > 800-523-1036 |
| Text Telephone for People |
| Who Are Deaf or Hard of Hearing > 800-749-7273 |
| |
| This material may be used in conjunction |
| with the offering of shares of any Vanguard |
| fund only if preceded or accompanied by |
| the fund’s current prospectus. |
| |
| All comparative mutual fund data are from Lipper, a |
| Thomson Reuters Company, or Morningstar, Inc., unless |
| otherwise noted. |
| |
| You can obtain a free copy of Vanguard’s proxy voting |
| guidelines by visiting vanguard.com/proxyreporting or by |
| calling Vanguard at 800-662-2739. The guidelines are |
| also available from the SEC’s website, sec.gov. In |
| addition, you may obtain a free report on how your fund |
| voted the proxies for securities it owned during the 12 |
| months ended June 30. To get the report, visit either |
| vanguard.com/proxyreporting or sec.gov. |
| |
| You can review and copy information about your fund at |
| the SEC’s Public Reference Room in Washington, D.C. To |
| find out more about this public service, call the SEC at |
| 202-551-8090. Information about your fund is also |
| available on the SEC’s website, and you can receive |
| copies of this information, for a fee, by sending a |
| request in either of two ways: via email addressed to |
| publicinfo@sec.gov or via regular mail addressed to the |
| Public Reference Section, Securities and Exchange |
| Commission, Washington, DC 20549-1520. |
| © 2018 The Vanguard Group, Inc. |
| All rights reserved. |
| Vanguard Marketing Corporation, Distributor. |
| |
| Q19670 112018 |

Annual Report | September 30, 2018
Vanguard Core Bond Fund
Vanguard’s Principles for Investing Success
We want to give you the best chance of investment success. These principles, grounded in Vanguard’s research and experience, can put you on the right path.
Goals. Create clear, appropriate investment goals.
Balance. Develop a suitable asset allocation using broadly diversified funds. Cost. Minimize cost.
Discipline. Maintain perspective and long-term discipline.
A single theme unites these principles: Focus on the things you can control.
We believe there is no wiser course for any investor.
| |
| Contents | |
| Your Fund’s Performance at a Glance. | 1 |
| CEO’s Perspective. | 2 |
| Advisor’s Report. | 4 |
| Fund Profile. | 7 |
| Performance Summary. | 8 |
| Financial Statements. | 10 |
| About Your Fund’s Expenses. | 55 |
| Glossary. | 57 |
Please note: The opinions expressed in this report are just that—informed opinions. They should not be considered promises or advice. Also, please keep in mind that the information and opinions cover the period through the date on the front of this report. Of course, the risks of investing in your fund are spelled out in the prospectus.
See the Glossary for definitions of investment terms used in this report.
Your Fund’s Performance at a Glance
• Vanguard Core Bond Fund returned –1.32% for Investor Shares and –1.19% for Admiral Shares for the 12 months ended September 30, 2018. Those results were roughly in line with the –1.23% return of its benchmark as well as the –1.25% average return for peer funds.
• Bond yields across the maturity spectrum closed higher. Shorter-term yields climbed as the Federal Reserve continued raising rates, and longer-term yields rose on brighter prospects for growth and inflation. The average spread in corporate bond yields fluctuated but finished the period slightly wider.
• An underweight allocation to U.S. Treasuries in favor of investment-grade credit and a modest overweight allocation to BBB-rated bonds helped the fund, as did security selection in financial services, foreign sovereign bonds, and industrials.
• Primary detractors included a slightly longer duration than the benchmark for part of the period and security selection in mortgage-backed securities.
| | | | |
| Total Returns: Fiscal Year Ended September 30, 2018 | | | |
| | 30-Day SEC | Income | Capital | Total |
| | Yield | Returns | Returns | Returns |
| Vanguard Core Bond Fund | | | | |
| Investor Shares | 3.31% | 2.78% | -4.10% | -1.32% |
| Admiral™ Shares | 3.50 | 2.91 | -4.10 | -1.19 |
| Bloomberg Barclays U.S. Aggregate Float Adjusted | | | | |
| Index | | | | -1.23 |
| Core Bond Funds Average | | | | -1.25 |
Core Bond Funds Average: Derived from data provided by Lipper, a Thomson Reuters Company.
Admiral Shares carry lower expenses and are available to investors who meet certain account-balance requirements.
| | | |
| Expense Ratios | | | |
| Your Fund Compared With Its Peer Group | | | |
| | Investor | Admiral | Peer Group |
| | Shares | Shares | Average |
| Core Bond Fund | 0.25% | 0.15% | 0.74% |
The fund expense ratios shown are from the prospectus dated January 26, 2018, and represent estimated costs for the current fiscal year. For the fiscal year ended September 30, 2018, the fund’s expense ratios were 0.25% for Investor Shares and 0.13% for Admiral Shares. The peer-group expense ratio is derived from data provided by Lipper, a Thomson Reuters Company, and captures information through year-end 2017.
Peer group: Core Bond Funds.
1
CEO’s Perspective

Tim Buckley
President and Chief Executive Officer
Dear Shareholder,
Over the years, I’ve found that prudent investors exhibit a common trait: discipline. No matter how the markets move or what new investing fad hits the headlines, those who stay focused on their goals and tune out the noise are set up for long-term success.
The prime gateway to investing is saving, and you don’t usually become a saver without a healthy dose of discipline. Savers make the decision to sock away part of their income, which means spending less and delaying gratification, no matter how difficult that may be.
Of course, disciplined investing extends beyond diligent saving. The financial markets, in the short term especially, are unpredictable; I have yet to meet the investor who can time them perfectly. It takes discipline to resist the urge to go all-in when markets are frothy or to retreat when things look bleak.
Staying put with your investments is one strategy for handling volatility. Another, rebalancing, requires even more discipline because it means steering your money away from strong performers and toward poorer performers.
Patience—a form of discipline—is also the friend of long-term investors. Higher returns are the potential reward for weathering the market’s turbulence and uncertainty.
2
We have been enjoying one of the longest bull markets in history, but it won’t continue forever. Prepare yourself now for how you will react when volatility comes back. Don’t panic. Don’t chase returns or look for answers outside the asset classes you trust. And be sure to rebalance periodically, even when there’s turmoil.
Whether you’re a master of self-control, get a boost from technology, or work with a professional advisor, know that discipline
is necessary to get the most out of your investment portfolio. And know that Vanguard is with you for the entire ride.
Thank you for your continued loyalty.

Mortimer J. Buckley
President and Chief Executive Officer
October 18, 2018
| | | |
| Market Barometer | | | |
| | | Average Annual Total Returns |
| | Periods Ended September 30, 2018 |
| | One Year | Three Years | Five Years |
| Stocks | | | |
| Russell 1000 Index (Large-caps) | 17.76% | 17.07% | 13.67% |
| Russell 2000 Index (Small-caps) | 15.24 | 17.12 | 11.07 |
| Russell 3000 Index (Broad U.S. market) | 17.58 | 17.07 | 13.46 |
| FTSE All-World ex US Index (International) | 2.13 | 10.18 | 4.51 |
| |
| Bonds | | | |
| Bloomberg Barclays U.S. Aggregate Bond Index | | | |
| (Broad taxable market) | -1.22% | 1.31% | 2.16% |
| Bloomberg Barclays Municipal Bond Index | | | |
| (Broad tax-exempt market) | 0.35 | 2.24 | 3.54 |
| FTSE Three-Month U. S. Treasury Bill Index | 1.57 | 0.80 | 0.48 |
| |
| CPI | | | |
| Consumer Price Index | 2.28% | 1.99% | 1.52% |
3
Advisor’s Report
For the 12 months ended September 30, 2018, Vanguard Core Bond Fund returned –1.32% for Investor Shares and –1.19% for Admiral Shares. The –1.23% return of the benchmark, the Bloomberg Barclays U.S. Aggregate Float Adjusted Index, fell between these results, as did the –1.25% average return for peer funds.
With interest rates climbing, the 30-day SEC yield for Investor Shares rose 113 basis points from a year earlier to 3.31%. The 30-day SEC yield for Admiral Shares climbed 122 basis points to 3.50% over the same time frame. (A basis point is one-hundredth of a percentage point.)
Investment environment
Macroeconomic fundamentals were robust throughout the 12 months. Despite two brief federal government shutdowns early in 2018 and a significant escalation in trade tensions, business confidence persisted and consumer spending remained solid. Unemployment hit an almost 50-year low, finishing the period at 3.7%. Tax-cut legislation enacted in late 2017, the March passage of a bill increasing federal spending, and deregulation all added to optimism about growth. Inflation moved up to hover near the Federal Reserve’s 2% target, with some help from an increase in oil prices.
| | |
| Yields of U.S. Treasury Securities | | |
| | September 30, | September 30, |
| Maturity | 2017 | 2018 |
| 2 years | 1.48% | 2.82% |
| 5 years | 1.94 | 2.95 |
| 10 years | 2.33 | 3.06 |
| 30 years | 2.86 | 3.21 |
| Source: Vanguard. | | |
4
Acknowledging the economy’s health, the Fed moved further down the path toward monetary policy normalization. It continued shrinking the $4.5 trillion balance sheet it had amassed as part of the monetary stimulus it began after the 2008 global financial crisis. The Fed raised the federal funds target rate in December, March, June, and September, putting it at 2%–2.25% at the close of the fiscal year.
Fed action pushed shorter-term yields higher. The yield of the 2-year Treasury note climbed 134 basis points over the period to 2.82%.
Demand for longer-term Treasury bonds was supported at times by escalating trade tensions, geopolitical flare-ups, and political uncertainties in Europe about Brexit and national elections in Germany and Italy. However, the outlook for continuing growth and rising inflation expectations led yields on these securities to end the period higher. The yield of the bellwether 10-year Treasury note ended the period 73 basis points higher at 3.06%.
Corporate fundamentals remained strong, and corporate earnings were very robust—the tax cuts helped with that—but valuations were high and technical support weakened. With the tax changes for corporations, a number of large multinational companies that had been investing overseas money in high-quality corporate bonds withdrew from the market. The average yield spread of investment-grade corporate bonds over Treasuries started the period very tight,
then widened significantly before narrowing slightly. The average spread stood at 106 basis points at the end of the period, up from 101 basis points a year earlier.
Management of the fund
The fund maintained an underweight allocation to Treasuries, favoring credit sectors. We were overweighted in financials. We believed they could benefit from improved balance sheets, less regulation, and rising interest rates, which tend to lift their profitability. Although concerns about the health of Italian banks weighed on returns from this sector in the United States, our bond selection among banks and insurance companies added value. Selection also was positive in industrials, notably in the energy segment, thanks to an upturn in oil prices.
Our overweight to BBB-rated bonds helped the fund. So did an outsize allocation to asset-backed securities, which are typically high-quality, liquid investments made up of pooled auto loans, credit-card debt, and student loans.
Our relatively small allocation to high-quality sovereign debt outside the United States modestly boosted relative performance. We were more defensive on these securities early in the period but selectively increased our exposure later on as relative value opportunities arose.
The fund’s duration (a measure of its sensitivity to changes in interest rates) was modestly longer than that of its benchmark in late 2017 and early 2018,
5
although we brought it back in line by the end of the fiscal year. That positioning detracted from relative performance.
We expected the Fed to keep pushing short-term rates higher, but longer rates rose as well when the market began pricing in a stronger U.S. growth scenario.
Security selection in the mortgage-backed securities (MBS) segment also weighed on performance. We favored collateralized mortgage obligations, but their spreads widening more than those of agency MBS as a whole meant they detracted from performance.
The outlook
In the absence of any external shocks, the U.S. economy is on pace to break above its long-term potential growth rate in 2018, given the tax cuts and increased government spending coming on top of solid fundamentals. That, along with some upward pressure on wages because of the tightening labor market, may push the U.S. Core Personal Consumption Expenditure Price Index a little above 2% by the end of 2018. Against this backdrop, the Fed is likely to keep raising rates and trimming the amount of Treasuries and MBS on its balance sheet through 2019.
We see this bounce as cyclical, however, and still expect long-term structural pressures from an aging population, global sourcing of goods and labor, and technological disruptions to result in moderate long-run growth and inflation.
We may continue to see bouts of volatility related to inflation and interest rate expectations. Other potential triggers include the U.S. midterm elections, an intensification of trade disputes, geopolitical tensions, Brexit uncertainty, government spending in Italy, and missteps by central banks.
It’s worth restating that investors should look beyond short-term volatility and adhere to their long-term investment strategies. And keep in mind the silver lining in higher rates for long-term investors—coupon payments and proceeds from maturing bonds can be reinvested at these rates.
Whatever the markets may bring, our experienced team of portfolio managers, credit analysts, and traders will continue to seek out opportunities to add to the fund’s performance.
Portfolio Managers:
Brian W. Quigley
Gemma Wright-Casparius, Principal
Daniel Shaykevich, Principal
Samuel C. Martinez, CFA
Vanguard Fixed Income Group
October 23, 2018
6
Core Bond Fund
Fund Profile
As of September 30, 2018
| | |
| Share-Class Characteristics | |
| | Investor | Admiral |
| | Shares | Shares |
| Ticker Symbol | VCORX | VCOBX |
| Expense Ratio1 | 0.25% | 0.15% |
| 30-Day SEC Yield | 3.31% | 3.50% |
| | |
| Financial Attributes | | |
| |
| | | Bloomberg |
| | | Barclays U.S. |
| | | Aggregate |
| | | Float Adjusted |
| | Fund | Index |
| |
| Number of Bonds | 738 | 10,112 |
| |
| Yield to Maturity | | |
| (before expenses) | 3.9% | 3.5% |
| |
| Average Coupon | 3.2% | 3.1% |
| |
| Average Duration | 6.1 years | 6.1 years |
| |
| Average Effective | | |
| Maturity | 7.4 years | 8.5 years |
| |
| Short-Term | | |
| Reserves | 6.4% | — |
| |
| Sector Diversification (% of portfolio) | |
| Asset-Backed | 9.8% |
| Commercial Mortgage-Backed | 4.1 |
| Finance | 11.9 |
| Foreign | 6.1 |
| Government Mortgage-Backed | 25.1 |
| Industrial | 15.5 |
| Treasury/Agency | 26.3 |
| Utilities | 1.1 |
| Other | 0.1 |
The agency and mortgage-backed securities sectors may include issues from government-sponsored enterprises; such issues are generally not backed by the full faith and credit of the U.S. government.
| |
| Distribution by Effective Maturity | |
| (% of portfolio) | |
| Under 1 Year | 6.9% |
| 1 - 3 Years | 17.3 |
| 3 - 5 Years | 16.4 |
| 5 - 7 Years | 20.4 |
| 7 - 10 Years | 26.0 |
| 10 - 20 Years | 5.8 |
| 20 - 30 Years | 6.5 |
| Over 30 Years | 0.7 |
| |
| Distribution by Credit Quality (% of portfolio) |
| U.S. Government | 51.3% |
| Aaa | 8.3 |
| Aa | 3.5 |
| A | 11.9 |
| Baa | 19.8 |
| Ba | 2.2 |
| B | 0.8 |
| Not Rated | 2.2 |
Credit-quality ratings are obtained from Moody's and S&P, and the higher rating for each issue is shown. "Not Rated" is used to classify securities for which a rating is not available. Not rated securities include a fund's investment in Vanguard Market Liquidity Fund or Vanguard Municipal Cash Management Fund, each of which invests in high-quality money market instruments and may serve as a cash management vehicle for the Vanguard funds, trusts, and accounts. For more information about these ratings, see the Glossary entry for Credit Quality.
Investment Focus

1 The expense ratios shown are from the prospectus dated January 26, 2018, and represent estimated costs for the current fiscal year. For the fiscal year ended September 30, 2018, the expense ratios were 0.25% for Investor Shares and 0.13% for Admiral Shares.
7
Core Bond Fund
Performance Summary
All of the returns in this report represent past performance, which is not a guarantee of future results that may be achieved by the fund. (Current performance may be lower or higher than the performance data cited. For performance data current to the most recent month-end, visit our website at vanguard.com/performance.) Note, too, that both investment returns and principal value can fluctuate widely, so an investor’s shares, when sold, could be worth more or less than their original cost. The returns shown do not reflect taxes that a shareholder would pay on fund distributions or on the sale of fund shares.
Cumulative Performance: March 28, 2016, Through September 30, 2018
Initial Investment of $10,000

| | | |
| | Average Annual Total Returns | |
| | Periods Ended September 30, 2018 | |
| |
| | | Since | Final Value |
| | One | Inception | of a $10,000 |
| | Year | (3/28/2016) | Investment |
| |
| Core Bond Fund Investor Shares | -1.32% | 0.89% | $10,224 |
| Bloomberg Barclays U.S. | | | |
| Aggregate Float Adjusted Index | -1.23 | 0.83 | 10,209 |
| |
| Core Bond Funds Average | -1.25 | 1.07 | 10,270 |
Core Bond Funds Average: Derived from data provided by Lipper, a Thomson Reuters Company.
"Since Inception" performance is calculated from the Investor Shares’ inception date for both the fund and its comparative standards.
| | | |
| | | Since | Final Value |
| | One | Inception | of a $50,000 |
| | Year | (3/28/2016) | Investment |
| |
| Core Bond Fund Admiral Shares | -1.19% | 1.01% | $51,271 |
| Bloomberg Barclays U.S. Aggregate Float | | | |
| Adjusted Index | -1.23 | 0.83 | 51,044 |
"Since Inception" performance is calculated from the Admiral Shares’ inception date for both the fund and its comparative standards.
See Financial Highlights for dividend and capital gains information.
8
Core Bond Fund
| | | | |
| Fiscal-Year Total Returns (%): March 28, 2016, Through September 30, 2018 | |
| | | | | Bloomberg |
| | | | | Barclays U.S. |
| | | | | Aggregate |
| | | | | Float Adjusted |
| | | | Investor Shares | Index |
| Fiscal Year | Income Returns | Capital Returns | Total Returns | Total Returns |
| 2016 | 0.97% | 2.60% | 3.57% | 3.31% |
| 2017 | 1.96 | -1.93 | 0.03 | 0.06 |
| 2018 | 2.78 | -4.10 | -1.32 | -1.23 |
9
Core Bond Fund
Financial Statements
Statement of Net Assets
As of September 30, 2018
The fund reports a complete list of its holdings in regulatory filings four times in each fiscal year, at the quarter-ends. For the second and fourth fiscal quarters, the lists appear in the fund’s semiannual and annual reports to shareholders. For the first and third fiscal quarters, the fund files the lists with the Securities and Exchange Commission on Form N-Q. Shareholders can look up the fund’s Forms N-Q on the SEC’s website at sec.gov. Forms N-Q may also be reviewed and copied at the SEC’s Public Reference Room (see the back cover of this report for further information).
| | | | | |
| | | | | Face | Market |
| | | | Maturity | Amount | Value • |
| | | Coupon | Date | ($000) | ($000) |
| U. S. Government and Agency Obligations (46.5%) | | | |
| U. S. Government Securities (16.5%) | | | | |
| | United States Treasury Note/Bond | 1.125% | 2/28/19 | 3,800 | 3,781 |
| | United States Treasury Note/Bond | 1.500% | 2/28/19 | 1,200 | 1,196 |
| | United States Treasury Note/Bond | 1.250% | 3/31/19 | 11,100 | 11,036 |
| | United States Treasury Note/Bond | 1.625% | 3/31/19 | 1,700 | 1,693 |
| | United States Treasury Note/Bond | 1.250% | 4/30/19 | 600 | 596 |
| | United States Treasury Note/Bond | 1.625% | 6/30/19 | 2,250 | 2,235 |
| | United States Treasury Note/Bond | 1.000% | 10/15/19 | 5,000 | 4,915 |
| | United States Treasury Note/Bond | 1.000% | 11/30/19 | 1,700 | 1,667 |
| | United States Treasury Note/Bond | 1.500% | 11/30/19 | 2,500 | 2,466 |
| | United States Treasury Note/Bond | 1.875% | 12/31/19 | 2,920 | 2,890 |
| | United States Treasury Note/Bond | 2.000% | 1/31/20 | 1,100 | 1,089 |
| | United States Treasury Note/Bond | 1.625% | 3/15/20 | 5,200 | 5,117 |
| | United States Treasury Note/Bond | 1.125% | 3/31/20 | 2,500 | 2,440 |
| | United States Treasury Note/Bond | 1.375% | 3/31/20 | 2,200 | 2,155 |
| | United States Treasury Note/Bond | 2.375% | 4/30/20 | 2,800 | 2,783 |
| | United States Treasury Note/Bond | 1.625% | 6/30/20 | 1,500 | 1,470 |
| | United States Treasury Note/Bond | 1.375% | 8/31/20 | 1,025 | 998 |
| | United States Treasury Note/Bond | 1.250% | 3/31/21 | 1,000 | 962 |
| | United States Treasury Note/Bond | 2.250% | 4/30/21 | 2,300 | 2,265 |
| | United States Treasury Note/Bond | 1.375% | 5/31/21 | 5,000 | 4,809 |
| | United States Treasury Note/Bond | 2.625% | 6/15/21 | 330 | 328 |
| | United States Treasury Note/Bond | 1.125% | 7/31/21 | 800 | 762 |
| | United States Treasury Note/Bond | 2.125% | 8/15/21 | 6,600 | 6,463 |
| | United States Treasury Note/Bond | 2.000% | 8/31/21 | 900 | 878 |
| | United States Treasury Note/Bond | 2.125% | 9/30/21 | 7,000 | 6,848 |
| | United States Treasury Note/Bond | 1.250% | 10/31/21 | 4,000 | 3,808 |
| | United States Treasury Note/Bond | 2.000% | 10/31/21 | 18,900 | 18,407 |
| | United States Treasury Note/Bond | 1.875% | 9/30/22 | 1,800 | 1,729 |
| | United States Treasury Note/Bond | 2.000% | 11/30/22 | 5,076 | 4,890 |
| | United States Treasury Note/Bond | 2.375% | 1/31/23 | 7,500 | 7,329 |
| | United States Treasury Note/Bond | 2.750% | 4/30/23 | 8,100 | 8,034 |
| | United States Treasury Note/Bond | 2.750% | 7/31/23 | 700 | 694 |
| | United States Treasury Note/Bond | 1.625% | 10/31/23 | 2,000 | 1,875 |
| | United States Treasury Note/Bond | 2.250% | 12/31/23 | 2,300 | 2,221 |
| 1 | United States Treasury Note/Bond | 2.750% | 2/15/24 | 1,900 | 1,880 |
| | United States Treasury Note/Bond | 2.125% | 9/30/24 | 1,800 | 1,715 |
10
| | | | | |
| Core Bond Fund | | | | |
| |
| |
| |
| | | | | Face | Market |
| | | | Maturity | Amount | Value • |
| | | Coupon | Date | ($000) | ($000) |
| | United States Treasury Note/Bond | 2.750% | 6/30/25 | 3,000 | 2,953 |
| | United States Treasury Note/Bond | 1.625% | 2/15/26 | 3 | 3 |
| | United States Treasury Note/Bond | 1.625% | 5/15/26 | 3,000 | 2,714 |
| | United States Treasury Note/Bond | 2.250% | 8/15/27 | 200 | 188 |
| | United States Treasury Note/Bond | 2.875% | 5/15/28 | 2,479 | 2,442 |
| | United States Treasury Note/Bond | 6.125% | 8/15/29 | 1,500 | 1,922 |
| | United States Treasury Note/Bond | 4.500% | 5/15/38 | 1,000 | 1,200 |
| | United States Treasury Note/Bond | 3.500% | 2/15/39 | 350 | 369 |
| | United States Treasury Note/Bond | 4.375% | 11/15/39 | 630 | 747 |
| | United States Treasury Note/Bond | 4.625% | 2/15/40 | 425 | 521 |
| | United States Treasury Note/Bond | 3.750% | 8/15/41 | 650 | 709 |
| | United States Treasury Note/Bond | 3.125% | 11/15/41 | 600 | 594 |
| | United States Treasury Note/Bond | 3.125% | 2/15/42 | 650 | 643 |
| | United States Treasury Note/Bond | 2.750% | 8/15/42 | 130 | 120 |
| | United States Treasury Note/Bond | 3.625% | 8/15/43 | 2,200 | 2,360 |
| | United States Treasury Note/Bond | 2.875% | 8/15/45 | 1,550 | 1,459 |
| | United States Treasury Note/Bond | 2.750% | 11/15/47 | 9,000 | 8,236 |
| 2 | United States Treasury Note/Bond | 3.125% | 5/15/48 | 11,500 | 11,342 |
| | | | | | 162,946 |
| Agency Bonds and Notes (5.3%) | | | | |
| 3 | AID-Israel | 0.000% | 11/1/24 | 1,300 | 1,064 |
| 3 | AID-Ukraine | 1.844% | 5/16/19 | 1,700 | 1,702 |
| 4 | Federal Home Loan Banks | 1.250% | 1/16/19 | 100 | 100 |
| 4 | Federal Home Loan Banks | 1.375% | 5/28/19 | 300 | 298 |
| 5 | Federal National Mortgage Assn. | 0.000% | 2/1/19 | 800 | 794 |
| 5 | Federal National Mortgage Assn. | 0.875% | 8/2/19 | 450 | 444 |
| 5 | Federal National Mortgage Assn. | 0.000% | 10/9/19 | 9,600 | 9,333 |
| 5 | Federal National Mortgage Assn. | 2.875% | 9/12/23 | 2,400 | 2,383 |
| 5 | Federal National Mortgage Assn. | 1.875% | 9/24/26 | 5,600 | 5,087 |
| | Government Trust Certificate | 0.000% | 10/1/20 | 1,479 | 1,390 |
| | Private Export Funding Corp. | 4.375% | 3/15/19 | 128 | 129 |
| | Private Export Funding Corp. | 1.450% | 8/15/19 | 2,715 | 2,686 |
| | Private Export Funding Corp. | 2.250% | 3/15/20 | 567 | 562 |
| | Private Export Funding Corp. | 2.300% | 9/15/20 | 150 | 148 |
| | Private Export Funding Corp. | 3.550% | 1/15/24 | 1,000 | 1,017 |
| | Residual Funding Corp. Principal Strip | 0.000% | 1/15/21 | 1,700 | 1,589 |
| | Resolution Funding Corp. Interest Strip | 0.000% | 4/15/26 | 2,480 | 1,930 |
| | Resolution Funding Corp. Interest Strip | 0.000% | 1/15/27 | 2,760 | 2,080 |
| | Resolution Funding Corp. Interest Strip | 0.000% | 4/15/27 | 1,800 | 1,347 |
| | Resolution Funding Corp. Interest Strip | 0.000% | 7/15/27 | 794 | 589 |
| | Resolution Funding Corp. Interest Strip | 0.000% | 10/15/27 | 794 | 583 |
| | Resolution Funding Corp. Interest Strip | 0.000% | 4/15/28 | 3,000 | 2,160 |
| | Resolution Funding Corp. Principal Strip | 0.000% | 10/15/19 | 1,300 | 1,264 |
| | Resolution Funding Corp. Principal Strip | 0.000% | 7/15/20 | 6,520 | 6,199 |
| | Resolution Funding Corp. Principal Strip | 0.000% | 10/15/20 | 3,000 | 2,832 |
| 4 | Tennessee Valley Authority | 2.250% | 3/15/20 | 1,700 | 1,685 |
| 4 | Tennessee Valley Authority Principal Strip | 0.000% | 11/1/25 | 3,000 | 2,362 |
| | | | | | 51,757 |
| Conventional Mortgage-Backed Securities (18.7%) | | | |
| 5,6 | Fannie Mae Pool | 2.000% | 1/1/32 | 2,098 | 1,968 |
| 5,6 | Fannie Mae Pool | 2.500% | 2/1/28–10/1/33 | 10,227 | 9,871 |
| 5,6 | Fannie Mae Pool | 3.000% | 2/1/27–10/1/48 | 16,105 | 15,512 |
| 5,6,7 Fannie Mae Pool | 3.500% | 3/1/27–10/1/48 | 19,307 | 19,108 |
| 5,6,7 Fannie Mae Pool | 4.000% | 10/1/33–10/1/48 | 15,001 | 15,213 |
11
| | | | | |
| Core Bond Fund | | | | |
| |
| |
| |
| | | | | Face | Market |
| | | | Maturity | Amount | Value • |
| | | Coupon | Date | ($000) | ($000) |
| 5,6,7 Fannie Mae Pool | 4.500% | 1/1/41–10/1/48 | 14,465 | 14,970 |
| 5,6 | Fannie Mae Pool | 5.000% | 3/1/38–10/1/48 | 6,127 | 6,510 |
| 5,6 | Fannie Mae Pool | 6.000% | 5/1/37 | 696 | 768 |
| 5,6 | Freddie Mac Gold Pool | 2.500% | 8/1/31–10/1/33 | 1,641 | 1,585 |
| 5,6,7 Freddie Mac Gold Pool | 3.000% | 9/1/32–12/1/47 | 14,145 | 13,751 |
| 5,6,7 Freddie Mac Gold Pool | 3.500% | 3/1/45–10/1/48 | 20,599 | 20,325 |
| 5,6,7 Freddie Mac Gold Pool | 4.000% | 1/1/46–10/1/48 | 8,697 | 8,791 |
| 5,6 | Freddie Mac Gold Pool | 4.500% | 7/1/47 | 2,261 | 2,351 |
| 6 | Ginnie Mae I Pool | 3.000% | 4/15/45 | 466 | 452 |
| 6 | Ginnie Mae I Pool | 3.500% | 6/15/47 | 1,726 | 1,725 |
| 6 | Ginnie Mae I Pool | 4.000% | 7/15/45–8/15/45 | 203 | 207 |
| 6 | Ginnie Mae I Pool | 4.500% | 2/15/39–9/15/46 | 1,141 | 1,205 |
| 6 | Ginnie Mae I Pool | 5.000% | 3/15/38–10/1/48 | 2,647 | 2,840 |
| 6 | Ginnie Mae II Pool | 3.000% | 5/20/43–10/1/48 | 6,991 | 6,791 |
| 6 | Ginnie Mae II Pool | 3.500% | 10/20/43–11/1/48 | 22,066 | 21,996 |
| 6,7 Ginnie Mae II Pool | 4.000% | 11/20/42–10/1/48 | 11,269 | 11,459 |
| 6,7 Ginnie Mae II Pool | 4.500% | 11/20/44–10/1/48 | 6,460 | 6,703 |
| | | | | | 184,101 |
| Nonconventional Mortgage-Backed Securities (6.0%) | | | |
| 5,6,8 | Fannie Mae Pool | 4.048% | 12/1/40 | 144 | 152 |
| 5,6 | Fannie Mae REMICS | 3.000% | 5/25/47–9/25/48 | 4,146 | 3,994 |
| 5,6,9 | Fannie Mae REMICS 2005-45 | 2.586% | 6/25/35 | 95 | 95 |
| 5,6,9 | Fannie Mae REMICS 2005-95 | 2.626% | 11/25/35 | 101 | 102 |
| 5,6,9 | Fannie Mae REMICS 2006-46 | 2.536% | 6/25/36 | 353 | 354 |
| 5,6,9 | Fannie Mae REMICS 2007-4 | 2.661% | 2/25/37 | 40 | 40 |
| 5,6,9 | Fannie Mae REMICS 2012-122 | 2.616% | 11/25/42 | 131 | 132 |
| 5,10 | Fannie Mae REMICS 2012-125 | 3.500% | 11/25/42 | 29,509 | 6,194 |
| 5,6,9 | Fannie Mae REMICS 2013-19 | 2.516% | 9/25/41 | 172 | 172 |
| 5,6,9 | Fannie Mae REMICS 2013-39 | 2.566% | 5/25/43 | 167 | 167 |
| 5,6,9 | Fannie Mae REMICS 2015-22 | 2.516% | 4/25/45 | 138 | 138 |
| 5,6,11 Fannie Mae REMICS 2015-8 | 3.884% | 3/25/45 | 19,663 | 3,446 |
| 5,6,9 | Fannie Mae REMICS 2016-55 | 2.716% | 8/25/46 | 285 | 289 |
| 5,6,9 | Fannie Mae REMICS 2016-60 | 2.466% | 9/25/46 | 561 | 560 |
| 5,6,9 | Fannie Mae REMICS 2016-62 | 2.616% | 9/25/46 | 576 | 575 |
| 5,6,9 | Fannie Mae REMICS 2016-93 | 2.566% | 12/25/46 | 1,136 | 1,134 |
| 5,6 | Fannie Mae REMICS 2017-109 | 3.500% | 11/25/45 | 777 | 775 |
| 5,6 | Fannie Mae REMICS 2018-13 | 3.000% | 3/25/48 | 1,932 | 1,875 |
| 5,6 | Fannie Mae REMICS 2018-15 | 3.500% | 10/25/44 | 906 | 902 |
| 5,6 | Fannie Mae REMICS 2018-58 | 3.000% | 8/25/48 | 2,734 | 2,605 |
| 5,6 | Fannie Mae REMICS 2018-65 | 3.000% | 9/25/48 | 2,546 | 2,429 |
| 5,6 | Freddie Mac Non Gold Pool | 4.060% | 7/1/33 | 76 | 80 |
| 5,6,8 | Freddie Mac Non Gold Pool | 4.082% | 9/1/37 | 482 | 508 |
| 5,6,8 | Freddie Mac Non Gold Pool | 4.448% | 7/1/35 | 563 | 594 |
| 5,6,9 | Freddie Mac REMICS | 2.508% | 11/15/36–8/15/43 | 265 | 266 |
| 5,6,9 | Freddie Mac REMICS | 2.518% | 11/15/36 | 95 | 95 |
| 5,6,9 | Freddie Mac REMICS | 2.608% | 6/15/42 | 48 | 48 |
| 5,6 | Freddie Mac REMICS | 3.000% | 11/25/47–12/15/47 | 3,298 | 3,207 |
| 5,6,11 Freddie Mac REMICS | 3.992% | 9/15/47 | 32,762 | 5,469 |
| 6 | Ginnie Mae REMICS | 3.000% | 12/20/47 | 1,280 | 1,254 |
| 6,11 | Ginnie Mae REMICS | 3.985% | 6/20/47 | 4,814 | 772 |
| 10 | Ginnie Mae REMICS | 4.000% | 1/20/45–8/20/46 | 29,758 | 5,537 |
| 10 | Ginnie Mae REMICS | 4.500% | 5/20/45 | 17,536 | 3,766 |
| 6 | Government National Mortgage Association | | | | |
| | GNR_18-14 | 3.000% | 12/20/47 | 1,005 | 980 |
12
| | | | | |
| Core Bond Fund | | | | |
| |
| |
| |
| | | | | Face | Market |
| | | | Maturity | Amount | Value • |
| | | Coupon | Date | ($000) | ($000) |
| 6 | Government National Mortgage Association | | | | |
| | GNR_18-92 | 3.500% | 7/20/48 | 2,786 | 2,769 |
| 6 | Government National Mortgage Association | | | | |
| | GNR_18-94 | 3.000% | 7/20/48 | 5,086 | 4,924 |
| 6 | Government National Mortgage Association | | | | |
| | GNR_18-97 | 3.500% | 7/20/48 | 2,786 | 2,770 |
| | | | | | 59,169 |
| Total U.S. Government and Agency Obligations (Cost $472,504) | | | 457,973 |
| Asset-Backed/Commercial Mortgage-Backed Securities (13.7%) | | | |
| 6 | Ally Auto Receivables Trust 2017-5 | 2.220% | 10/17/22 | 180 | 176 |
| 6 | Ally Master Owner Trust Series 2017-3 | 2.040% | 6/15/22 | 350 | 343 |
| 6 | Ally Master Owner Trust Series 2018-2 | 3.290% | 5/15/23 | 860 | 860 |
| 6,12 American Homes 4 Rent 2014-SFR3 | 3.678% | 12/17/36 | 93 | 92 |
| 12 | American Tower Trust #1 | 3.652% | 3/23/48 | 260 | 255 |
| 6 | AmeriCredit Automobile Receivables | | | | |
| | Trust 2014-2 | 2.180% | 6/8/20 | 9 | 9 |
| 6 | AmeriCredit Automobile Receivables | | | | |
| | Trust 2015-3 | 3.340% | 8/8/21 | 285 | 286 |
| 6 | AmeriCredit Automobile Receivables | | | | |
| | Trust 2016-2 | 3.650% | 5/9/22 | 125 | 125 |
| 6 | AmeriCredit Automobile Receivables | | | | |
| | Trust 2016-3 | 2.710% | 9/8/22 | 200 | 197 |
| 6 | AmeriCredit Automobile Receivables | | | | |
| | Trust 2016-4 | 2.410% | 7/8/22 | 225 | 221 |
| 6 | AmeriCredit Automobile Receivables | | | | |
| | Trust 2018-2 | 4.010% | 7/18/24 | 390 | 390 |
| 6,12 Applebee’s Funding LLC/IHOP Funding LLC | 4.277% | 9/5/44 | 35 | 34 |
| 6,12 ARL Second LLC 2014-1A | 2.920% | 6/15/44 | 55 | 54 |
| 6,12 Aventura Mall Trust 2013-AVM | 3.867% | 12/5/32 | 800 | 809 |
| 6,12 Aventura Mall Trust 2018-AVM | 4.112% | 7/5/40 | 700 | 713 |
| 6,12 Avis Budget Rental Car Funding AESOP | | | | |
| | LLC 2013-2A | 2.970% | 2/20/20 | 479 | 479 |
| 6,12 Avis Budget Rental Car Funding AESOP | | | | |
| | LLC 2015-2A | 2.630% | 12/20/21 | 380 | 374 |
| 6,12 Avis Budget Rental Car Funding AESOP | | | | |
| | LLC 2016-1A | 2.990% | 6/20/22 | 500 | 493 |
| 6,12 Avis Budget Rental Car Funding AESOP | | | | |
| | LLC 2017-1A | 3.070% | 9/20/23 | 355 | 346 |
| 6,12 Avis Budget Rental Car Funding AESOP | | | | |
| | LLC 2017-2A | 2.970% | 3/20/24 | 180 | 174 |
| 6,12 Avis Budget Rental Car Funding AESOP | | | | |
| | LLC 2018-1A | 3.700% | 9/20/24 | 270 | 269 |
| 6,12 Avis Budget Rental Car Funding AESOP | | | | |
| | LLC 2018-1A | 4.730% | 9/20/24 | 100 | 100 |
| 6 | Banc of America Commercial Mortgage | | | | |
| | Trust 2015-UBS7 | 3.705% | 9/15/48 | 160 | 160 |
| 6 | Banc of America Commercial Mortgage | | | | |
| | Trust 2017-BNK3 | 3.574% | 2/15/50 | 20 | 20 |
| 6 | BANK 2017 - BNK4 | 3.625% | 5/15/50 | 45 | 45 |
| 6 | BANK 2017 - BNK5 | 3.390% | 6/15/60 | 60 | 58 |
| 6 | BANK 2017 - BNK6 | 3.254% | 7/15/60 | 90 | 86 |
| 6 | BANK 2017 - BNK6 | 3.518% | 7/15/60 | 100 | 98 |
| 6 | BANK 2017 - BNK6 | 3.741% | 7/15/60 | 50 | 49 |
13
| | | | | |
| Core Bond Fund | | | | |
| |
| |
| |
| | | | | Face | Market |
| | | | Maturity | Amount | Value • |
| | | Coupon | Date | ($000) | ($000) |
| 6 | BANK 2017 - BNK7 | 3.435% | 9/15/60 | 100 | 97 |
| 6 | BANK 2017 - BNK8 | 3.488% | 11/15/50 | 230 | 224 |
| 6 | BANK 2017 - BNK9 | 3.538% | 11/15/54 | 655 | 638 |
| 6 | BANK 2018 - BN13 | 4.217% | 8/15/61 | 240 | 246 |
| 6 | BANK 2018 - BNK10 | 3.688% | 2/15/61 | 240 | 237 |
| 6 | BANK 2018-BN14 | 4.185% | 9/15/60 | 25 | 26 |
| 6 | BANK 2018-BN14 | 4.231% | 9/15/60 | 300 | 310 |
| | Bank of Nova Scotia | 1.875% | 4/26/21 | 610 | 589 |
| 6 | BENCHMARK 2018-B1 Mortgage Trust | 3.666% | 1/15/51 | 140 | 139 |
| 6 | BENCHMARK 2018-B1 Mortgage Trust | 3.878% | 1/15/51 | 70 | 70 |
| 6 | BENCHMARK 2018-B1 Mortgage Trust | 4.059% | 1/15/51 | 220 | 219 |
| 6 | BENCHMARK 2018-B1 Mortgage Trust | 4.256% | 1/15/51 | 340 | 334 |
| 6 | BENCHMARK 2018-B2 Mortgage Trust | 3.882% | 2/15/51 | 800 | 805 |
| 6 | BENCHMARK 2018-B3 Mortgage Trust | 4.025% | 4/10/51 | 140 | 142 |
| 6 | BENCHMARK 2018-B5 Mortgage Trust | 4.208% | 7/15/51 | 190 | 196 |
| 6 | Benchmark 2018-B6 Mortgage Trust | 4.170% | 11/10/51 | 69 | 71 |
| 6 | Benchmark 2018-B6 Mortgage Trust | 4.261% | 11/10/51 | 300 | 311 |
| 6 | BMW Vehicle Lease Trust 2017-2 | 2.070% | 10/20/20 | 280 | 277 |
| 6 | BMW Vehicle Lease Trust 2017-2 | 2.190% | 3/22/21 | 90 | 89 |
| 6,12 CAL Funding II Ltd. Series 2018-2A | 4.340% | 9/25/43 | 280 | 281 |
| 6 | California Republic Auto Receivables | | | | |
| | Trust 2016-2 | 2.520% | 5/16/22 | 210 | 206 |
| 6 | California Republic Auto Receivables | | | | |
| | Trust 2016-2 | 3.510% | 3/15/23 | 210 | 208 |
| 6,12 Canadian Pacer Auto Receivables Trust A | | | | |
| | Series 2017 | 2.050% | 3/19/21 | 140 | 139 |
| 6,12 Canadian Pacer Auto Receivables Trust A | | | | |
| | Series 2017 | 2.286% | 1/19/22 | 100 | 98 |
| 6,12 Canadian Pacer Auto Receivables Trust A | | | | |
| | Series 2018 | 3.220% | 9/19/22 | 140 | 139 |
| | Capital Auto Receivables Asset Trust 2016-2 | 3.160% | 11/20/23 | 220 | 219 |
| 6 | Capital Auto Receivables Asset Trust 2016-3 | 2.350% | 9/20/21 | 50 | 49 |
| 6 | Capital Auto Receivables Asset Trust 2016-3 | 2.650% | 1/20/24 | 40 | 40 |
| 6,12 Capital Auto Receivables Asset Trust 2017-1 | 2.220% | 3/21/22 | 130 | 128 |
| 6 | CarMax Auto Owner Trust 2016-2 | 2.160% | 12/15/21 | 100 | 98 |
| 6 | CarMax Auto Owner Trust 2016-2 | 3.250% | 11/15/22 | 100 | 99 |
| 6 | CarMax Auto Owner Trust 2016-3 | 1.900% | 4/15/22 | 200 | 194 |
| 6 | CarMax Auto Owner Trust 2016-3 | 2.200% | 6/15/22 | 190 | 185 |
| 6 | CarMax Auto Owner Trust 2016-3 | 2.940% | 1/17/23 | 190 | 187 |
| 6 | CarMax Auto Owner Trust 2017-4 | 2.110% | 10/17/22 | 150 | 148 |
| 6 | CarMax Auto Owner Trust 2017-4 | 2.330% | 5/15/23 | 90 | 88 |
| 6 | CarMax Auto Owner Trust 2017-4 | 2.460% | 8/15/23 | 40 | 39 |
| 6 | CarMax Auto Owner Trust 2017-4 | 2.700% | 10/16/23 | 40 | 39 |
| 6 | CarMax Auto Owner Trust 2018-1 | 2.640% | 6/15/23 | 50 | 49 |
| 6 | CarMax Auto Owner Trust 2018-1 | 2.830% | 9/15/23 | 90 | 88 |
| 6 | CarMax Auto Owner Trust 2018-1 | 2.950% | 11/15/23 | 50 | 49 |
| 6 | CarMax Auto Owner Trust 2018-2 | 3.370% | 10/16/23 | 90 | 90 |
| 6 | CarMax Auto Owner Trust 2018-2 | 3.570% | 12/15/23 | 130 | 129 |
| 6 | CarMax Auto Owner Trust 2018-2 | 3.990% | 4/15/25 | 100 | 99 |
| 6 | CD 2016-CD1 Commercial Mortgage Trust | 3.631% | 8/10/49 | 270 | 252 |
| 6 | CD 2017-CD3 Commercial Mortgage Trust | 3.631% | 2/10/50 | 140 | 139 |
| 6 | CD 2017-CD4 Commercial Mortgage Trust | 3.514% | 5/10/50 | 80 | 78 |
| 6 | CD 2017-CD5 Commercial Mortgage Trust | 3.431% | 8/15/50 | 105 | 102 |
| 6 | CD 2017-CD6 Commercial Mortgage Trust | 3.456% | 11/13/50 | 45 | 44 |
14
| | | | | |
| Core Bond Fund | | | | |
| |
| |
| |
| | | | | Face | Market |
| | | | Maturity | Amount | Value • |
| | | Coupon | Date | ($000) | ($000) |
| 6 | CFCRE Commercial Mortgage Trust 2016-C4 | 3.283% | 5/10/58 | 61 | 58 |
| 6,12 | Chesapeake Funding II LLC 2016-2A | 1.880% | 6/15/28 | 266 | 265 |
| 6,12 | Chesapeake Funding II LLC 2018-1 | 3.040% | 4/15/30 | 600 | 598 |
| 6,12 | Chrysler Capital Auto Receivables | | | | |
| | Trust 2014-BA | 3.440% | 8/16/21 | 200 | 200 |
| 6,12 | Chrysler Capital Auto Receivables | | | | |
| | Trust 2016-AA | 2.880% | 6/15/22 | 90 | 90 |
| 6,12 | Chrysler Capital Auto Receivables | | | | |
| | Trust 2016-AA | 4.220% | 2/15/23 | 90 | 91 |
| 6,12 | Chrysler Capital Auto Receivables | | | | |
| | Trust 2016-BA | 1.870% | 2/15/22 | 20 | 20 |
| 6 | Citigroup Commercial Mortgage | | | | |
| | Trust 2013-GC15 | 4.371% | 9/10/46 | 30 | 31 |
| 6 | Citigroup Commercial Mortgage | | | | |
| | Trust 2014-GC19 | 4.023% | 3/10/47 | 370 | 378 |
| 6 | Citigroup Commercial Mortgage | | | | |
| | Trust 2014-GC21 | 3.575% | 5/10/47 | 311 | 313 |
| 6 | Citigroup Commercial Mortgage | | | | |
| | Trust 2014-GC23 | 3.622% | 7/10/47 | 350 | 350 |
| 6 | Citigroup Commercial Mortgage | | | | |
| | Trust 2014-GC23 | 4.175% | 7/10/47 | 230 | 232 |
| 6 | Citigroup Commercial Mortgage | | | | |
| | Trust 2014-GC25 | 3.372% | 10/10/47 | 10 | 10 |
| 6 | Citigroup Commercial Mortgage | | | | |
| | Trust 2014-GC25 | 3.635% | 10/10/47 | 360 | 359 |
| 6 | Citigroup Commercial Mortgage | | | | |
| | Trust 2014-GC25 | 4.345% | 10/10/47 | 140 | 139 |
| 6 | Citigroup Commercial Mortgage | | | | |
| | Trust 2014-GC25 | 4.680% | 10/10/47 | 175 | 168 |
| 6 | Citigroup Commercial Mortgage | | | | |
| | Trust 2015-GC27 | 3.137% | 2/10/48 | 228 | 221 |
| 6 | Citigroup Commercial Mortgage | | | | |
| | Trust 2015-GC31 | 3.762% | 6/10/48 | 110 | 110 |
| 6 | Citigroup Commercial Mortgage | | | | |
| | Trust 2015-GC33 | 3.778% | 9/10/58 | 410 | 412 |
| 6 | Citigroup Commercial Mortgage | | | | |
| | Trust 2016-C1 | 3.209% | 5/10/49 | 141 | 135 |
| 6 | Citigroup Commercial Mortgage | | | | |
| | Trust 2017-C4 | 3.471% | 10/12/50 | 100 | 97 |
| 6 | Citigroup Commercial Mortgage | | | | |
| | Trust 2017-P8 | 3.465% | 9/15/50 | 230 | 223 |
| 6 | Citigroup Commercial Mortgage | | | | |
| | Trust 2017-P8 | 4.192% | 9/15/50 | 60 | 60 |
| 6 | Citigroup Commercial Mortgage | | | | |
| | Trust 2017-P8 | 4.413% | 9/15/50 | 60 | 59 |
| 6 | Citigroup Commercial Mortgage | | | | |
| | Trust 2018-C5 | 4.228% | 6/10/51 | 110 | 113 |
| 6,12 | CKE Restaurants Holdings Inc 2018-1A | 5.710% | 6/20/48 | 580 | 582 |
| 6,9,12 Colony American Homes 2015-1 | 3.658% | 7/17/32 | 70 | 70 |
| 6,9,12 Colony American Homes 2015-1A | 3.358% | 7/17/32 | 172 | 172 |
| 6,9,12 Colony Starwood Homes 2016-1A Trust | 3.658% | 7/17/33 | 298 | 298 |
| 6,9,12 Colony Starwood Homes 2016-1A Trust | 4.308% | 7/17/33 | 115 | 115 |
| 6,12 | COMM 2012-CCRE3 Mortgage Trust | 3.416% | 10/15/45 | 40 | 39 |
| 6 | COMM 2012-CCRE4 Mortgage Trust | 3.251% | 10/15/45 | 500 | 488 |
15
| | | | | |
| Core Bond Fund | | | | |
| |
| |
| |
| | | | | Face | Market |
| | | | Maturity | Amount | Value • |
| | | Coupon | Date | ($000) | ($000) |
| 6 | COMM 2013-CCRE12 Mortgage Trust | 3.765% | 10/10/46 | 60 | 61 |
| 6 | COMM 2013-CCRE12 Mortgage Trust | 4.046% | 10/10/46 | 500 | 512 |
| 6 | COMM 2013-CCRE13 Mortgage Trust | 4.194% | 11/10/46 | 230 | 237 |
| 6,12 COMM 2013-CCRE6 Mortgage Trust | 3.147% | 3/10/46 | 150 | 145 |
| 6,12 COMM 2013-CCRE6 Mortgage Trust | 3.397% | 3/10/46 | 210 | 205 |
| 6 | COMM 2013-CCRE8 Mortgage Trust | 3.612% | 6/10/46 | 10 | 10 |
| 6,12 COMM 2013-CCRE9 Mortgage Trust | 4.399% | 7/10/45 | 230 | 229 |
| 6,12 COMM 2014-277P Mortgage Trust | 3.732% | 8/10/49 | 100 | 100 |
| 6 | COMM 2014-CCRE14 Mortgage Trust | 4.236% | 2/10/47 | 20 | 21 |
| 6 | COMM 2014-CCRE15 Mortgage Trust | 4.074% | 2/10/47 | 350 | 359 |
| 6 | COMM 2014-CCRE17 Mortgage Trust | 3.700% | 5/10/47 | 20 | 20 |
| 6 | COMM 2014-CCRE17 Mortgage Trust | 3.977% | 5/10/47 | 350 | 357 |
| 6 | COMM 2014-CCRE17 Mortgage Trust | 4.898% | 5/10/47 | 190 | 191 |
| 6 | COMM 2014-CCRE18 Mortgage Trust | 3.550% | 7/15/47 | 30 | 30 |
| | COMM 2014-CCRE20 Mortgage Trust | 3.326% | 11/10/47 | 20 | 20 |
| 6 | COMM 2014-CCRE20 Mortgage Trust | 3.590% | 11/10/47 | 350 | 350 |
| 6 | COMM 2014-CCRE21 Mortgage Trust | 3.528% | 12/10/47 | 50 | 50 |
| 6 | COMM 2015-CCRE22 Mortgage Trust | 3.309% | 3/10/48 | 228 | 223 |
| 6 | COMM 2015-CCRE25 Mortgage Trust | 3.759% | 8/10/48 | 120 | 121 |
| 6 | COMM 2015-LC19 Mortgage Trust | 3.183% | 2/10/48 | 124 | 121 |
| 6 | CSAIL 2015-C4 Commercial Mortgage Trust | 3.808% | 11/15/48 | 358 | 359 |
| 6 | CSAIL 2016-C7 Commercial Mortgage Trust | 3.502% | 11/15/49 | 60 | 58 |
| 6 | CSAIL 2017-C8 Commercial Mortgage Trust | 3.392% | 6/15/50 | 115 | 111 |
| 6 | CSAIL 2018-CX12 Commercial Mortgage | | | | |
| | Trust | 4.224% | 8/15/51 | 540 | 555 |
| 6,12 DB Master Finance LLC 2015-1A | 3.980% | 2/20/45 | 58 | 58 |
| 6 | DBJPM 16-C1 Mortgage Trust | 3.503% | 5/10/49 | 140 | 130 |
| 6 | DBJPM 17-C6 Mortgage Trust | 3.328% | 6/10/50 | 160 | 155 |
| 6,12 Dell Equipment Finance Trust 2017-2 | 1.970% | 2/24/20 | 148 | 148 |
| 6,12 Dell Equipment Finance Trust 2017-2 | 2.190% | 10/24/22 | 130 | 129 |
| 12 | DNB Boligkreditt AS | 2.500% | 3/28/22 | 340 | 330 |
| 6,12 DRB Prime Student Loan Trust 2017-C | 2.810% | 11/25/42 | 370 | 359 |
| 6,12 Drive Auto Receivables Trust 2015-AA | 3.060% | 5/17/21 | 63 | 63 |
| 6,12 Drive Auto Receivables Trust 2015-DA | 4.590% | 1/17/23 | 132 | 134 |
| 6,12 Drive Auto Receivables Trust 2016-BA | 4.530% | 8/15/23 | 200 | 203 |
| 6,12 Drive Auto Receivables Trust 2016-C | 2.370% | 11/16/20 | 4 | 4 |
| 6,12 Drive Auto Receivables Trust 2016-C | 4.180% | 3/15/24 | 90 | 91 |
| 6 | Drive Auto Receivables Trust 2017-1 | 3.840% | 3/15/23 | 50 | 50 |
| 6 | Drive Auto Receivables Trust 2017-3 | 2.300% | 5/17/21 | 260 | 260 |
| 6 | Drive Auto Receivables Trust 2017-3 | 2.800% | 7/15/22 | 330 | 329 |
| 6 | Drive Auto Receivables Trust 2018-2 | 3.220% | 4/15/22 | 360 | 360 |
| 6 | Drive Auto Receivables Trust 2018-2 | 3.630% | 8/15/24 | 560 | 561 |
| 6 | Drive Auto Receivables Trust 2018-2 | 4.140% | 8/15/24 | 390 | 391 |
| 6 | Drive Auto Receivables Trust 2018-3 | 3.370% | 9/15/22 | 490 | 490 |
| 6 | Drive Auto Receivables Trust 2018-3 | 3.720% | 9/16/24 | 480 | 481 |
| 6 | Drive Auto Receivables Trust 2018-3 | 4.300% | 9/16/24 | 260 | 262 |
| 6,12 ELFI Graduate Loan Program 2018-A LLC | 3.430% | 8/25/42 | 310 | 308 |
| 5,6,9 Fannie Mae Connecticut Avenue Securities | | | | |
| | 2016-C04 | 3.666% | 1/25/29 | 83 | 83 |
| 5,6,9 Fannie Mae Connecticut Avenue Securities | | | | |
| | 2016-C05 | 3.566% | 1/25/29 | 125 | 125 |
| 5,6 | Fannie Mae Grantor Trust 2017-T1 | 2.898% | 6/25/27 | 20 | 19 |
| 6,9 | First National Master Note Trust 2017-2 | 2.598% | 10/16/23 | 250 | 250 |
| 6,12 Flagship Credit Auto Trust 2016-4 | 1.960% | 2/16/21 | 84 | 84 |
16
| | | | | |
| Core Bond Fund | | | | |
| |
| |
| |
| | | | | Face | Market |
| | | | Maturity | Amount | Value • |
| | | Coupon | Date | ($000) | ($000) |
| 6 | Ford Credit Auto Lease Trust 2017-B | 2.170% | 2/15/21 | 240 | 237 |
| 6 | Ford Credit Auto Lease Trust 2018-A | 3.170% | 9/15/21 | 220 | 219 |
| 6,12 | Ford Credit Auto Owner Trust 2014-REV1 | 2.410% | 11/15/25 | 250 | 249 |
| 6,12 | Ford Credit Auto Owner Trust 2014-REV2 | 2.510% | 4/15/26 | 200 | 199 |
| 6 | Ford Credit Auto Owner Trust 2016-B | 1.850% | 9/15/21 | 200 | 197 |
| 6,12 | Ford Credit Auto Owner Trust 2017-1 | 2.620% | 8/15/28 | 450 | 438 |
| 6,12 | Ford Credit Auto Owner Trust 2017-2 | 2.360% | 3/15/29 | 650 | 624 |
| 6,12 | Ford Credit Auto Owner Trust 2017-2 | 2.600% | 3/15/29 | 120 | 115 |
| 6,12 | Ford Credit Auto Owner Trust 2017-2 | 2.750% | 3/15/29 | 250 | 239 |
| 6,12 | Ford Credit Auto Owner Trust 2018-2 | 3.470% | 1/15/30 | 430 | 429 |
| 6,12 | Ford Credit Auto Owner Trust 2018-2 | 3.610% | 1/15/30 | 260 | 258 |
| 6,12 | Ford Credit Auto Owner Trust 2018-2 | 3.760% | 1/15/30 | 120 | 119 |
| 6,12 | Ford Credit Auto Owner Trust 2018-REV1 | 3.190% | 7/15/31 | 250 | 243 |
| 6,12 | Ford Credit Auto Owner Trust 2018-REV1 | 3.340% | 7/15/31 | 100 | 97 |
| 6 | Ford Credit Floorplan Master Owner Trust A | | | | |
| | Series 2014-2 | 2.310% | 2/15/21 | 200 | 200 |
| 6 | Ford Credit Floorplan Master Owner Trust A | | | | |
| | Series 2017-1 | 2.070% | 5/15/22 | 1,050 | 1,033 |
| 6 | Ford Credit Floorplan Master Owner Trust A | | | | |
| | Series 2017-2 | 2.160% | 9/15/22 | 1,030 | 1,011 |
| 5,6,9 | Freddie Mac Structured Agency Credit Risk | | | | |
| | Debt Notes 2016-DNA3 | 4.216% | 12/25/28 | 206 | 209 |
| 5,6,12 Freddie Mac Structured Agency Credit Risk | | | | |
| | Debt Notes 2018-SPI1 | 3.745% | 2/25/48 | 158 | 157 |
| 5,6,12 Freddie Mac Structured Agency Credit Risk | | | | |
| | Debt Notes 2018-SPI2 | 3.820% | 5/25/48 | 188 | 187 |
| 5,6,12 Freddie Mac Structured Agency Credit Risk | | | | |
| | Debt Notes 2018-SPI3 | 4.168% | 8/25/48 | 120 | 120 |
| 6,12 | FRS I LLC 2013-1A | 3.080% | 4/15/43 | 181 | 181 |
| 6 | GM Financial Automobile Leasing Trust | | | | |
| | 2016-2 | 2.580% | 3/20/20 | 190 | 190 |
| 6 | GM Financial Automobile Leasing Trust | | | | |
| | 2017-2 | 2.180% | 6/21/21 | 90 | 89 |
| 6 | GM Financial Automobile Leasing Trust | | | | |
| | 2017-3 | 2.010% | 11/20/20 | 200 | 198 |
| 6 | GM Financial Automobile Leasing Trust | | | | |
| | 2017-3 | 2.120% | 9/20/21 | 80 | 79 |
| 6 | GM Financial Automobile Leasing Trust | | | | |
| | 2017-3 | 2.400% | 9/20/21 | 80 | 79 |
| 6 | GM Financial Automobile Leasing Trust | | | | |
| | 2017-3 | 2.730% | 9/20/21 | 40 | 39 |
| 6,12 | GM Financial Consumer Automobile 2017-3 | 2.130% | 3/16/23 | 150 | 146 |
| 6,12 | GM Financial Consumer Automobile 2017-3 | 2.330% | 3/16/23 | 40 | 39 |
| 6,12 | GMF Floorplan Owner Revolving Trust | | | | |
| | 2016-1 | 2.410% | 5/17/21 | 330 | 329 |
| 6,12 | GMF Floorplan Owner Revolving Trust | | | | |
| | 2016-1 | 2.850% | 5/17/21 | 330 | 329 |
| 6,12 | GMF Floorplan Owner Revolving Trust | | | | |
| | 2017-2 | 2.440% | 7/15/22 | 260 | 256 |
| 6,12 | GMF Floorplan Owner Revolving Trust | | | | |
| | 2017-2 | 2.630% | 7/15/22 | 140 | 138 |
| 6,12 | Golden Credit Card Trust 2016-5A | 1.600% | 9/15/21 | 150 | 148 |
| 6,12 | Golden Credit Card Trust 2018-1A | 2.620% | 1/15/23 | 630 | 621 |
| 6,12 | Golden Credit Card Trust 2018-4A | 3.440% | 10/15/25 | 1,700 | 1,693 |
17
| | | | | |
| Core Bond Fund | | | | |
| |
| |
| |
| | | | | Face | Market |
| | | | Maturity | Amount | Value • |
| | | Coupon | Date | ($000) | ($000) |
| 6,12,13Gosforth Funding GFUND_18-1A PLC | 2.714% | 8/25/60 | 310 | 310 |
| 6,12 | GreatAmerica Leasing Receivables Funding | | | | |
| | LLC Series 2018-1 | 2.600% | 6/15/21 | 170 | 168 |
| 6,12 | GreatAmerica Leasing Receivables Funding | | | | |
| | LLC Series 2018-1 | 2.830% | 6/17/24 | 110 | 108 |
| 6 | GS Mortgage Securities Corporation II | | | | |
| | 2015-GC30 | 3.382% | 5/10/50 | 113 | 110 |
| 6 | GS Mortgage Securities Trust 2013-GCJ12 | 3.135% | 6/10/46 | 350 | 345 |
| 6 | GS Mortgage Securities Trust 2013-GCJ14 | 3.955% | 8/10/46 | 30 | 31 |
| 6 | GS Mortgage Securities Trust 2014-GC20 | 3.998% | 4/10/47 | 350 | 357 |
| 6 | GS Mortgage Securities Trust 2014-GC24 | 3.931% | 9/10/47 | 390 | 395 |
| 6 | GS Mortgage Securities Trust 2014-GC24 | 4.642% | 9/10/47 | 170 | 173 |
| 6 | GS Mortgage Securities Trust 2014-GC24 | 4.663% | 9/10/47 | 150 | 148 |
| 6 | GS Mortgage Securities Trust 2014-GC26 | 3.364% | 11/10/47 | 150 | 147 |
| 6 | GS Mortgage Securities Trust 2014-GC26 | 3.629% | 11/10/47 | 140 | 140 |
| 6 | GS Mortgage Securities Trust 2015-GC28 | 3.136% | 2/10/48 | 30 | 29 |
| 6 | GS Mortgage Securities Trust 2015-GC28 | 3.396% | 2/10/48 | 203 | 199 |
| 6 | GS Mortgage Securities Trust 2015-GC34 | 3.506% | 10/10/48 | 50 | 49 |
| 6 | GS Mortgage Securities Trust 2016-GS3 | 2.850% | 10/10/49 | 30 | 28 |
| 6 | GS Mortgage Securities Trust 2018-GS10 | 4.155% | 7/10/51 | 300 | 306 |
| 6,12 | Harley Marine Financing LLC Barge 2018-1 | 5.682% | 5/15/43 | 188 | 186 |
| 6,12 | Hertz Fleet Lease Funding LP 2018-1 | 3.230% | 5/10/32 | 710 | 709 |
| 6,12 | Hertz Vehicle Financing II LP 2015-1A | 2.730% | 3/25/21 | 850 | 842 |
| 6,12 | Hertz Vehicle Financing II LP 2016-2A | 2.950% | 3/25/22 | 100 | 98 |
| 6,12 | Hertz Vehicle Financing II LP 2016-3A | 2.270% | 7/25/20 | 25 | 25 |
| 6,12 | Hertz Vehicle Financing II LP 2018-1A | 3.290% | 2/25/24 | 120 | 117 |
| 6,12 | Hertz Vehicle Financing II LP 2018-1A | 3.600% | 2/25/24 | 110 | 107 |
| 6,12 | Hertz Vehicle Financing II LP 2018-1A | 4.390% | 2/25/24 | 100 | 98 |
| 6,12 | Hertz Vehicle Financing LLC 2017-2A | 3.290% | 10/25/23 | 100 | 97 |
| 6,12 | Hertz Vehicle Financing LLC 2017-2A | 4.200% | 10/25/23 | 350 | 351 |
| 6,12 | Hilton USA Trust 2016-HHV | 3.719% | 11/5/38 | 20 | 20 |
| 6,12,13Holmes Master Issuer PLC 2018-1 | 2.699% | 10/15/54 | 530 | 529 |
| 6,12,13Holmes Master Issuer PLC 2018-2A | 2.561% | 10/15/54 | 390 | 388 |
| 6 | Honda Auto Receivables 2017-4 Owner Trust | 2.210% | 3/21/24 | 80 | 78 |
| 6,12 | Houston Galleria Mall Trust 2015-HGLR | 3.087% | 3/5/37 | 250 | 240 |
| 6,12 | Hyundai Auto Lease Securitization Trust | | | | |
| | 2017-B | 2.130% | 3/15/21 | 200 | 198 |
| 6,12 | Hyundai Auto Lease Securitization Trust | | | | |
| | 2017-C | 2.120% | 2/16/21 | 480 | 476 |
| 6,12 | Hyundai Auto Lease Securitization Trust | | | | |
| | 2017-C | 2.210% | 9/15/21 | 100 | 99 |
| 6,12 | Hyundai Auto Lease Securitization Trust | | | | |
| | 2017-C | 2.460% | 7/15/22 | 200 | 197 |
| 6,9,12 Invitation Homes 2017-SFR2 Trust | 3.008% | 12/17/36 | 378 | 377 |
| 6,9,12 Invitation Homes 2017-SFR2 Trust | 3.309% | 12/17/36 | 130 | 130 |
| 6,9,12 Invitation Homes 2018-SFR1 Trust | 2.859% | 3/17/37 | 288 | 286 |
| 6,9,12 Invitation Homes 2018-SFR1 Trust | 3.109% | 3/17/37 | 100 | 99 |
| 6 | John Deere Owner Trust 2018-B | 3.230% | 6/16/25 | 180 | 179 |
| 6,12 | JP Morgan Chase Commercial Mortgage | | | | |
| | Securities Trust 2011-C3 | 4.717% | 2/15/46 | 1,688 | 1,733 |
| 6,12 | JP Morgan Chase Commercial Mortgage | | | | |
| | Securities Trust 2011-C5 | 5.586% | 8/15/46 | 550 | 573 |
| 6,12 | JP Morgan Chase Commercial Mortgage | | | | |
| | Securities Trust 2011-RR1 | 4.717% | 3/16/46 | 20 | 20 |
18
| | | | | |
| Core Bond Fund | | | | |
| |
| |
| |
| | | | | Face | Market |
| | | | Maturity | Amount | Value • |
| | | Coupon | Date | ($000) | ($000) |
| 6,12 | JP Morgan Chase Commercial Mortgage | | | | |
| | Securities Trust 2012-C8 | 3.424% | 10/15/45 | 90 | 89 |
| 6 | JP Morgan Chase Commercial Mortgage | | | | |
| | Securities Trust 2013-C13 | 4.125% | 1/15/46 | 230 | 227 |
| 6 | JP Morgan Chase Commercial Mortgage | | | | |
| | Securities Trust 2013-C16 | 3.881% | 12/15/46 | 10 | 10 |
| 6 | JP Morgan Chase Commercial Mortgage | | | | |
| | Securities Trust 2013-LC11 | 2.960% | 4/15/46 | 80 | 78 |
| 6 | JP Morgan Chase Commercial Mortgage | | | | |
| | Securities Trust 2016-JP3 | 2.870% | 8/15/49 | 50 | 47 |
| 6 | JP Morgan Chase Commercial Mortgage | | | | |
| | Securities Trust 2016-JP4 | 3.648% | 12/15/49 | 90 | 89 |
| 6 | JP Morgan Chase Commercial Mortgage | | | | |
| | Securities Trust 2017-JP6 | 3.490% | 7/15/50 | 70 | 68 |
| 6 | JPMBB Commercial Mortgage Securities | | | | |
| | Trust 2013-C12 | 3.363% | 7/15/45 | 1,579 | 1,567 |
| 6 | JPMBB Commercial Mortgage Securities | | | | |
| | Trust 2013-C14 | 4.133% | 8/15/46 | 30 | 31 |
| 6 | JPMBB Commercial Mortgage Securities | | | | |
| | Trust 2013-C15 | 5.265% | 11/15/45 | 30 | 31 |
| 6 | JPMBB Commercial Mortgage Securities | | | | |
| | Trust 2014-C18 | 4.079% | 2/15/47 | 380 | 389 |
| 6 | JPMBB Commercial Mortgage Securities | | | | |
| | Trust 2014-C26 | 3.231% | 1/15/48 | 350 | 342 |
| 6 | JPMBB Commercial Mortgage Securities | | | | |
| | Trust 2014-C26 | 3.494% | 1/15/48 | 350 | 347 |
| 6 | JPMBB Commercial Mortgage Securities | | | | |
| | Trust 2015-C27 | 3.179% | 2/15/48 | 258 | 250 |
| 6 | JPMBB Commercial Mortgage Securities | | | | |
| | Trust 2015-C30 | 3.822% | 7/15/48 | 80 | 80 |
| 6 | JPMBB Commercial Mortgage Securities | | | | |
| | Trust 2015-C31 | 3.801% | 8/15/48 | 100 | 100 |
| 6 | JPMCC Commercial Mortgage Securities | | | | |
| | Trust 2017-JP5 | 3.723% | 3/15/50 | 160 | 159 |
| 6 | JPMCC Commercial Mortgage Securities | | | | |
| | Trust 2017-JP7 | 3.454% | 9/15/50 | 80 | 78 |
| 6 | JPMDB Commercial Mortgage Securities | | | | |
| | Trust 2017-C7 | 3.409% | 10/15/50 | 60 | 58 |
| 6 | JPMDB Commercial Mortgage Securities | | | | |
| | Trust 2018-C8 | 4.211% | 6/15/51 | 50 | 51 |
| 6,12,13Lanark Master Issuer plc 2018-1A | 2.730% | 12/22/69 | 167 | 167 |
| 6,9,12 Lanark Master Issuer plc 2018-2A | 2.844% | 12/22/69 | 260 | 260 |
| 6,12 | Laurel Road Prime Student Loan Trust | | | | |
| | 2018-B | 3.540% | 5/26/43 | 580 | 577 |
| 6,9,12 Master Credit Card Trust II Series 2018-1A | 2.672% | 7/22/24 | 250 | 249 |
| 6 | Mercedes-Benz Auto Lease Trust 2018-A | 2.510% | 10/16/23 | 30 | 30 |
| 6,12 | MMAF Equipment Finance LLC 2018-A | 3.390% | 1/10/25 | 120 | 120 |
| 6,12 | MMAF Equipment Finance LLC 2018-A | 3.610% | 3/10/42 | 100 | 100 |
| 6 | Morgan Stanley Bank of America Merrill | | | | |
| | Lynch Trust 2012-C5 | 3.792% | 8/15/45 | 100 | 99 |
| 6 | Morgan Stanley Bank of America Merrill | | | | |
| | Lynch Trust 2013-C10 | 4.219% | 7/15/46 | 200 | 191 |
| 6 | Morgan Stanley Bank of America Merrill | | | | |
| | Lynch Trust 2013-C12 | 4.259% | 10/15/46 | 400 | 411 |
19
| | | | | |
| Core Bond Fund | | | | |
| |
| |
| |
| | | | | Face | Market |
| | | | Maturity | Amount | Value • |
| | | Coupon | Date | ($000) | ($000) |
| 6 | Morgan Stanley Bank of America Merrill | | | | |
| | Lynch Trust 2014-C15 | 3.773% | 4/15/47 | 350 | 353 |
| 6 | Morgan Stanley Bank of America Merrill | | | | |
| | Lynch Trust 2014-C15 | 4.051% | 4/15/47 | 10 | 10 |
| 6 | Morgan Stanley Bank of America Merrill | | | | |
| | Lynch Trust 2014-C15 | 5.053% | 4/15/47 | 150 | 153 |
| 6 | Morgan Stanley Bank of America Merrill | | | | |
| | Lynch Trust 2014-C16 | 3.892% | 6/15/47 | 20 | 20 |
| 6 | Morgan Stanley Bank of America Merrill | | | | |
| | Lynch Trust 2014-C16 | 4.479% | 6/15/47 | 80 | 81 |
| 6 | Morgan Stanley Bank of America Merrill | | | | |
| | Lynch Trust 2014-C17 | 3.741% | 8/15/47 | 350 | 352 |
| 6 | Morgan Stanley Bank of America Merrill | | | | |
| | Lynch Trust 2014-C18 | 3.923% | 10/15/47 | 350 | 353 |
| 6 | Morgan Stanley Bank of America Merrill | | | | |
| | Lynch Trust 2014-C19 | 3.526% | 12/15/47 | 450 | 448 |
| 6 | Morgan Stanley Bank of America Merrill | | | | |
| | Lynch Trust 2015-C20 | 3.249% | 2/15/48 | 188 | 182 |
| 6 | Morgan Stanley Bank of America Merrill | | | | |
| | Lynch Trust 2015-C24 | 3.732% | 5/15/48 | 975 | 975 |
| 6 | Morgan Stanley Bank of America Merrill | | | | |
| | Lynch Trust 2015-C25 | 3.635% | 10/15/48 | 180 | 179 |
| 6 | Morgan Stanley Bank of America Merrill | | | | |
| | Lynch Trust 2016-C29 | 3.325% | 5/15/49 | 70 | 68 |
| 6 | Morgan Stanley Bank of America Merrill | | | | |
| | Lynch Trust 2016-C29 | 4.909% | 5/15/49 | 160 | 160 |
| 6 | Morgan Stanley Bank of America Merrill | | | | |
| | Lynch Trust 2016-C32 | 3.720% | 12/15/49 | 260 | 258 |
| 6 | Morgan Stanley Bank of America Merrill | | | | |
| | Lynch Trust 2017-C34 | 3.536% | 11/15/52 | 120 | 117 |
| 6 | Morgan Stanley Capital I Trust 2015-UBS8 | 3.809% | 12/15/48 | 499 | 498 |
| 6 | Morgan Stanley Capital I Trust 2016-UBS9 | 3.594% | 3/15/49 | 100 | 99 |
| 6 | Morgan Stanley Capital I Trust 2017-HR2 | 3.587% | 12/15/50 | 75 | 73 |
| 6,9,12 Motor PLC 2017 1A | 2.746% | 9/25/24 | 850 | 849 |
| 6,12 | MSBAM Commercial Mortgage Securities | | | | |
| | Trust 2012-CKSV | 3.277% | 10/15/30 | 1,700 | 1,637 |
| 6,9,12 Navient Student Loan Trust 2016-2 | 3.266% | 6/25/65 | 200 | 202 |
| 6,9,12 Navient Student Loan Trust 2016-3 | 3.066% | 6/25/65 | 59 | 59 |
| 6,9,12 Navient Student Loan Trust 2016-6A | 2.966% | 3/25/66 | 100 | 101 |
| 6,9,12 Navient Student Loan Trust 2017-4A | 2.716% | 9/27/66 | 180 | 181 |
| 6,9,12 Navient Student Loan Trust 2017-A | 2.558% | 12/16/58 | 141 | 141 |
| 6,12 | Navient Student Loan Trust 2017-A | 2.880% | 12/16/58 | 240 | 234 |
| 6,9,12 Navient Student Loan Trust 2018-1 | 2.936% | 3/25/67 | 110 | 111 |
| 6,12 | Navient Student Loan Trust 2018-BA | 3.610% | 12/15/59 | 230 | 229 |
| 6,12 | Navient Student Loan Trust 2018-CA | 3.010% | 6/16/42 | 115 | 115 |
| 6,12 | Navient Student Loan Trust 2018-CA | 3.520% | 6/16/42 | 550 | 547 |
| 6,12 | NextGear Floorplan Master Owner Trust | | | | |
| | 2016-1A | 2.740% | 4/15/21 | 580 | 579 |
| 6 | Nissan Auto Lease Trust 2017-A | 1.910% | 4/15/20 | 510 | 507 |
| 6 | Nissan Auto Lease Trust 2017-A | 2.040% | 9/15/22 | 190 | 188 |
| 6 | Nissan Auto Lease Trust 2017-B | 2.050% | 9/15/20 | 520 | 516 |
| 6 | Nissan Auto Lease Trust 2017-B | 2.170% | 12/15/21 | 140 | 138 |
| 6 | Nissan Auto Receivables 2017-C Owner | | | | |
| | Trust | 2.280% | 2/15/24 | 320 | 312 |
20
| | | | | |
| Core Bond Fund | | | | |
| |
| |
| |
| | | | | Face | Market |
| | | | Maturity | Amount | Value • |
| | | Coupon | Date | ($000) | ($000) |
| 6,9 | Nissan Master Owner Trust Receivables | | | | |
| | Series 2017-C | 2.478% | 10/17/22 | 735 | 736 |
| 6,12 | Palisades Center Trust 2016-PLSD | 2.713% | 4/13/33 | 700 | 683 |
| 6,9,12 Pepper Residential Securities Trust | | | | |
| | 2017A-A1UA | 3.233% | 3/10/58 | 75 | 75 |
| 6,9,12 Pepper Residential Securities Trust | | | | |
| | 2019A-A1U1 | 2.489% | 10/12/18 | 500 | 500 |
| 6,9,12 Pepper Residential Securities Trust | | | | |
| | 2021-A1U | 3.038% | 1/16/60 | 717 | 716 |
| 6,12,13Permanent Master Issuer PLC 2018-1A | 2.747% | 7/15/58 | 250 | 250 |
| 6,12 | PFS Financing Corp 2017-B | 2.220% | 7/15/22 | 340 | 333 |
| 6,9,12 PFS Financing Corp. 2017-C | 2.628% | 10/15/21 | 410 | 410 |
| 6,12 | PFS Financing Corp. 2017-D | 2.400% | 10/17/22 | 430 | 422 |
| 6,12 | PFS Financing Corp. 2018-D | 3.190% | 4/17/23 | 250 | 248 |
| 6,9,12 PHEAA Student Loan Trust 2016-2A | 3.166% | 11/25/65 | 173 | 175 |
| 6,12 | Progress Residential 2015-SFR3 Trust | 3.067% | 11/12/32 | 411 | 404 |
| 6,12 | Progress Residential 2017-SFR2 Trust | 2.897% | 12/17/34 | 200 | 193 |
| 6,12 | Progress Residential 2017-SFR2 Trust | 3.196% | 12/17/34 | 100 | 97 |
| 6,12 | Progress Residential 2018-SFR1 Trust | 3.255% | 3/17/35 | 390 | 382 |
| 6,12 | Progress Residential 2018-SFR1 Trust | 3.484% | 3/17/35 | 100 | 98 |
| 6,12 | Progress Residential 2018-SFR3 Trust | 3.880% | 10/17/35 | 580 | 582 |
| 6 | Public Service New Hampshire Funding LLC | | | | |
| | 2018-1 | 3.094% | 2/1/26 | 220 | 219 |
| 6 | Public Service New Hampshire Funding LLC | | | | |
| | 2018-1 | 3.506% | 8/1/28 | 100 | 100 |
| 6 | Public Service New Hampshire Funding LLC | | | | |
| | 2018-1 | 3.814% | 2/1/35 | 100 | 100 |
| 6,9,12 Resimac Premier Series 2016-1A | 3.523% | 10/10/47 | 437 | 440 |
| 6,9,12 Resimac Premier Series 2018-1A | 2.933% | 11/10/49 | 628 | 627 |
| 6,9,12 Resimac Premier Series 2018-1NCA | 2.987% | 12/16/59 | 1,050 | 1,049 |
| 6 | Santander Drive Auto Receivables Trust | | | | |
| | 2016-2 | 2.080% | 2/16/21 | 102 | 101 |
| 6 | Santander Drive Auto Receivables Trust | | | | |
| | 2016-2 | 2.660% | 11/15/21 | 170 | 170 |
| 6 | Santander Drive Auto Receivables Trust | | | | |
| | 2016-2 | 3.390% | 4/15/22 | 140 | 140 |
| 6 | Santander Drive Auto Receivables Trust | | | | |
| | 2016-3 | 2.460% | 3/15/22 | 260 | 258 |
| 6 | Santander Drive Auto Receivables Trust | | | | |
| | 2017-3 | 1.870% | 6/15/21 | 220 | 219 |
| 6 | Santander Drive Auto Receivables Trust | | | | |
| | 2017-3 | 2.760% | 12/15/22 | 110 | 109 |
| 6 | Santander Drive Auto Receivables Trust | | | | |
| | 2018-1 | 2.630% | 7/15/22 | 360 | 358 |
| 6 | Santander Drive Auto Receivables Trust | | | | |
| | 2018-1 | 2.960% | 3/15/24 | 310 | 306 |
| 6 | Santander Drive Auto Receivables Trust | | | | |
| | 2018-1 | 3.320% | 3/15/24 | 140 | 137 |
| 6 | Santander Drive Auto Receivables Trust | | | | |
| | 2018-3 | 3.290% | 10/17/22 | 460 | 459 |
| 6 | Santander Drive Auto Receivables Trust | | | | |
| | 2018-3 | 4.070% | 8/15/24 | 760 | 759 |
| 6 | Santander Drive Auto Receivables Trust | | | | |
| | 2018-4 | 3.980% | 12/15/25 | 470 | 469 |
21
| | | | | |
| Core Bond Fund | | | | |
| |
| |
| |
| | | | | Face | Market |
| | | | Maturity | Amount | Value • |
| | | Coupon | Date | ($000) | ($000) |
| 6,12 | Santander Retail Auto Lease Trust 2017-A | 2.370% | 1/20/22 | 100 | 99 |
| 6,12 | Santander Retail Auto Lease Trust 2017-A | 2.680% | 1/20/22 | 100 | 99 |
| 6,12 | Santander Retail Auto Lease Trust 2018-A | 3.490% | 5/20/22 | 325 | 323 |
| 6,12 | Securitized Term Auto Receivables Trust | | | | |
| | 2016-1A | 1.524% | 3/25/20 | 22 | 22 |
| 6,12 | Securitized Term Auto Receivables Trust | | | | |
| | 2016-1A | 1.794% | 2/25/21 | 40 | 40 |
| 6,12 | Securitized Term Auto Receivables Trust | | | | |
| | 2017-2A | 2.289% | 3/25/22 | 180 | 175 |
| 6 | Small Business Administration Participation | | | | |
| | Certs 2017-20 | 2.850% | 10/1/37 | 3,922 | 3,747 |
| 6 | Small Business Administration Participation | | | | |
| | Certs 2017-20 | 2.790% | 11/1/37 | 4,486 | 4,299 |
| 6 | Small Business Administration Participation | | | | |
| | Certs 2017-20 | 2.780% | 12/1/37 | 3,921 | 3,754 |
| 6 | Small Business Administration Participation | | | | |
| | Certs 2018-20 | 2.920% | 1/1/38 | 3,618 | 3,465 |
| 6 | Small Business Administration Participation | | | | |
| | Certs 2018-20 | 3.220% | 2/1/38 | 3,962 | 3,866 |
| 6 | Small Business Administration Participation | | | | |
| | Certs 2018-20C | 3.200% | 3/1/38 | 8,313 | 8,076 |
| 6 | SMART ABS Series 2016-2US Trust | 2.050% | 12/14/22 | 40 | 39 |
| 6,12 | SMB Private Education Loan Trust 2016-A | 2.700% | 5/15/31 | 371 | 364 |
| 6,9,12 SMB Private Education Loan Trust 2016-B | 3.608% | 2/17/32 | 242 | 248 |
| 6,9,12 SMB Private Education Loan Trust 2016-C | 3.258% | 9/15/34 | 100 | 101 |
| 6,9,12 SMB Private Education Loan Trust 2017-A | 3.058% | 9/15/34 | 120 | 121 |
| 6,12 | SMB Private Education Loan Trust 2017-B | 2.820% | 10/15/35 | 260 | 252 |
| 6,12 | SMB Private Education Loan Trust 2018-B | 3.600% | 1/15/37 | 450 | 449 |
| 6,12 | SMB Private Education Loan Trust 2018-C | 3.630% | 11/15/35 | 570 | 570 |
| 6,12 | SoFi Professional Loan Program 2016-B LLC | 2.740% | 10/25/32 | 428 | 424 |
| 6,12 | SoFi Professional Loan Program 2016-C LLC | 2.360% | 12/27/32 | 500 | 488 |
| 6,12 | SoFi Professional Loan Program 2016-D LLC | 2.340% | 4/25/33 | 100 | 97 |
| 6,9,12 SoFi Professional Loan Program 2016-D LLC | 3.166% | 1/25/39 | 39 | 40 |
| 6,12 | SoFi Professional Loan Program 2017-B LLC | 2.740% | 5/25/40 | 10 | 10 |
| 6,12 | SoFi Professional Loan Program 2017-D LLC | 2.650% | 9/25/40 | 120 | 116 |
| 6,12 | SoFi Professional Loan Program 2017-E LLC | 1.860% | 11/26/40 | 375 | 369 |
| 6,12 | SoFi Professional Loan Program 2017-E LLC | 2.720% | 11/26/40 | 130 | 126 |
| 6,12 | SoFi Professional Loan Program 2017-F LLC | 2.840% | 1/25/41 | 180 | 175 |
| 6,12 | SoFi Professional Loan Program 2018-A LLC | 2.950% | 2/25/42 | 100 | 97 |
| 6,12 | SoFi Professional Loan Program 2018-C LLC | 3.590% | 1/25/48 | 820 | 818 |
| 6,12 | SoFi Professional Loan Program 2018-D LLC | 3.600% | 2/25/48 | 400 | 399 |
| 12 | Stadshypotek AB | 2.500% | 4/5/22 | 500 | 486 |
| 6 | Synchrony Credit Card Master Note Trust | | | | |
| | 2016-1 | 2.390% | 3/15/22 | 345 | 344 |
| 6 | Synchrony Credit Card Master Note Trust | | | | |
| | 2016-2 | 2.950% | 5/15/24 | 140 | 137 |
| 6 | Synchrony Credit Card Master Note Trust | | | | |
| | 2016-3 | 1.910% | 9/15/22 | 100 | 99 |
| 6 | Synchrony Credit Card Master Note Trust | | | | |
| | 2017-2 | 2.620% | 10/15/25 | 560 | 543 |
| 6 | Synchrony Credit Card Master Note Trust | | | | |
| | 2017-2 | 2.820% | 10/15/25 | 170 | 164 |
| 6 | Synchrony Credit Card Master Note Trust | | | | |
| | 2017-2 | 3.010% | 10/15/25 | 230 | 223 |
22
| | | | | |
| Core Bond Fund | | | | |
| |
| |
| |
| | | | | Face | Market |
| | | | Maturity | Amount | Value • |
| | | Coupon | Date | ($000) | ($000) |
| 6,12 | Taco Bell Funding LLC 2016-1A | 4.377% | 5/25/46 | 35 | 36 |
| 6,12 | Taco Bell Funding LLC 2016-1A | 4.970% | 5/25/46 | 31 | 31 |
| 6,12 | Tesla Auto Lease Trust 2018-A | 2.320% | 12/20/19 | 320 | 319 |
| 6,12 | Tidewater Auto Receivables Trust 2018-AA | 3.120% | 7/15/22 | 390 | 390 |
| 6,12 | Tidewater Auto Receivables Trust 2018-AA | 3.450% | 11/15/24 | 100 | 100 |
| 6,12 | Tidewater Auto Receivables Trust 2018-AA | 3.840% | 11/15/24 | 100 | 100 |
| 6,12 | Tidewater Auto Receivables Trust 2018-AA | 4.300% | 11/15/24 | 100 | 100 |
| 6,12 | TMSQ 2014-1500 Mortgage Trust | 3.680% | 10/10/36 | 100 | 98 |
| 12 | Toronto-Dominion Bank | 2.250% | 3/15/21 | 30 | 29 |
| 6,12 | Trafigura Securitisation Finance plc 2017-1A | 2.470% | 12/15/20 | 890 | 873 |
| 6,12 | Trafigura Securitisation Finance plc 2018-1A | 3.730% | 3/15/22 | 490 | 490 |
| 6,12 | Trinity Rail Leasing LP TRL_18-1 | 4.620% | 6/17/48 | 440 | 444 |
| 6,12 | Trip Rail Master Funding LLC 2017-1A | 2.709% | 8/15/47 | 80 | 78 |
| 6,12 | Triton Container Finance LLC 2018-A2 | 4.190% | 6/22/43 | 653 | 652 |
| 6 | UBS Commercial Mortgage Trust 2017-C7 | 3.679% | 12/15/50 | 30 | 30 |
| 6 | UBS-Barclays Commercial Mortgage Trust | | | | |
| | 2013-C6 | 3.469% | 4/10/46 | 10 | 10 |
| 6,12 | Vantage Data Centers Issuer, LLC 2018-1A | 4.072% | 2/16/43 | 119 | 120 |
| 6,12 | Verizon Owner Trust 2017-3 | 2.060% | 4/20/22 | 410 | 404 |
| 6,12 | Verizon Owner Trust 2017-3 | 2.380% | 4/20/22 | 240 | 236 |
| 6,12 | Verizon Owner Trust 2017-3 | 2.530% | 4/20/22 | 250 | 245 |
| 6,12 | Verizon Owner Trust 2018-1 | 3.050% | 9/20/22 | 350 | 347 |
| 6,9,12 Volvo Financial Equipment Master Owner | | | | |
| | Trust 2017-A | 2.568% | 11/15/22 | 130 | 130 |
| 6 | Wells Fargo Commercial Mortgage Trust | | | | |
| | 2012-LC5 | 3.539% | 10/15/45 | 40 | 40 |
| 6 | Wells Fargo Commercial Mortgage Trust | | | | |
| | 2013-LC12 | 4.218% | 7/15/46 | 350 | 360 |
| 6 | Wells Fargo Commercial Mortgage Trust | | | | |
| | 2013-LC12 | 4.423% | 7/15/46 | 450 | 459 |
| 6 | Wells Fargo Commercial Mortgage Trust | | | | |
| | 2015-C26 | 3.166% | 2/15/48 | 110 | 107 |
| 6 | Wells Fargo Commercial Mortgage Trust | | | | |
| | 2015-C27 | 3.190% | 2/15/48 | 388 | 380 |
| 6 | Wells Fargo Commercial Mortgage Trust | | | | |
| | 2015-C27 | 3.451% | 2/15/48 | 2,530 | 2,496 |
| 6 | Wells Fargo Commercial Mortgage Trust | | | | |
| | 2015-C29 | 3.637% | 6/15/48 | 680 | 678 |
| 6 | Wells Fargo Commercial Mortgage Trust | | | | |
| | 2015-C30 | 4.646% | 9/15/58 | 200 | 198 |
| 6 | Wells Fargo Commercial Mortgage Trust | | | | |
| | 2015-LC22 | 3.839% | 9/15/58 | 50 | 50 |
| 6 | Wells Fargo Commercial Mortgage Trust | | | | |
| | 2015-LC22 | 4.694% | 9/15/58 | 160 | 158 |
| 6 | Wells Fargo Commercial Mortgage Trust | | | | |
| | 2015-SG1 | 3.789% | 9/15/48 | 90 | 90 |
| 6 | Wells Fargo Commercial Mortgage Trust | | | | |
| | 2016-C37 | 3.525% | 12/15/49 | 20 | 20 |
| 6 | Wells Fargo Commercial Mortgage Trust | | | | |
| | 2016-C37 | 3.794% | 12/15/49 | 70 | 70 |
| 6 | Wells Fargo Commercial Mortgage Trust | | | | |
| | 2017-C38 | 3.453% | 7/15/50 | 120 | 117 |
| 6 | Wells Fargo Commercial Mortgage Trust | | | | |
| | 2017-C39 | 3.157% | 9/15/50 | 10 | 9 |
23
| | | | | |
| Core Bond Fund | | | | |
| |
| |
| |
| | | | | Face | Market |
| | | | Maturity | Amount | Value • |
| | | Coupon | Date | ($000) | ($000) |
| 6 | Wells Fargo Commercial Mortgage Trust | | | | |
| | 2017-C39 | 3.418% | 9/15/50 | 240 | 232 |
| 6 | Wells Fargo Commercial Mortgage Trust | | | | |
| | 2017-C40 | 3.581% | 10/15/50 | 280 | 274 |
| 6 | Wells Fargo Commercial Mortgage Trust | | | | |
| | 2017-C41 | 3.472% | 11/15/50 | 100 | 97 |
| 6 | Wells Fargo Commercial Mortgage Trust | | | | |
| | 2017-C42 | 3.589% | 12/15/50 | 195 | 191 |
| 6 | Wells Fargo Commercial Mortgage Trust | | | | |
| | 2017-RC1 | 3.631% | 1/15/60 | 32 | 32 |
| 6 | Wells Fargo Commercial Mortgage Trust | | | | |
| | 2018-C46 | 4.152% | 8/15/51 | 230 | 235 |
| 6,12 Wendys Funding LLC 2015-1A | 4.497% | 6/15/45 | 49 | 49 |
| 6,12 Wendys Funding LLC 2018-1 | 3.573% | 3/15/48 | 99 | 95 |
| 6,12 Wendys Funding LLC 2018-1 | 3.884% | 3/15/48 | 139 | 134 |
| 12 | Westpac Banking Corp. | 2.100% | 2/25/21 | 40 | 39 |
| 6 | WFRBS Commercial Mortgage Trust | | | | |
| | 2013-C15 | 4.153% | 8/15/46 | 100 | 103 |
| 6 | WFRBS Commercial Mortgage Trust | | | | |
| | 2013-C18 | 4.162% | 12/15/46 | 20 | 21 |
| 6 | WFRBS Commercial Mortgage Trust | | | | |
| | 2014-C19 | 3.829% | 3/15/47 | 200 | 201 |
| 6 | WFRBS Commercial Mortgage Trust | | | | |
| | 2014-C20 | 3.995% | 5/15/47 | 20 | 20 |
| 6 | WFRBS Commercial Mortgage Trust | | | | |
| | 2014-C21 | 3.410% | 8/15/47 | 10 | 10 |
| 6 | WFRBS Commercial Mortgage Trust | | | | |
| | 2014-C21 | 3.678% | 8/15/47 | 360 | 362 |
| 6 | WFRBS Commercial Mortgage Trust | | | | |
| | 2014-C23 | 3.650% | 10/15/57 | 286 | 285 |
| 6 | WFRBS Commercial Mortgage Trust | | | | |
| | 2014-C24 | 3.607% | 11/15/47 | 380 | 378 |
| 6 | WFRBS Commercial Mortgage Trust | | | | |
| | 2014-LC14 | 4.045% | 3/15/47 | 410 | 419 |
| 6 | World Omni Auto Receivables Trust 2015-B | 2.150% | 8/15/22 | 175 | 173 |
| 6 | World Omni Auto Receivables Trust 2018-A | 2.890% | 4/15/25 | 40 | 39 |
| 6 | World Omni Automobile Lease Securitization | | | | |
| | Trust 2018-A | 2.830% | 7/15/21 | 610 | 607 |
| 6 | World Omni Automobile Lease Securitization | | | | |
| | Trust 2018-A | 2.940% | 5/15/23 | 180 | 179 |
| 6 | World Omni Automobile Lease Securitization | | | | |
| | Trust 2018-B | 3.300% | 3/15/24 | 80 | 80 |
| Total Asset-Backed/Commercial Mortgage-Backed Securities (Cost $137,859) | | 134,922 |
| Corporate Bonds (24.5%) | | | | |
| Finance (10.4%) | | | | |
| | Banking (8.4%) | | | | |
| | American Express Co. | 3.700% | 8/3/23 | 4,465 | 4,446 |
| 6 | Bank of America Corp. | 3.550% | 3/5/24 | 8,610 | 8,507 |
| | Bank of America Corp. | 3.875% | 8/1/25 | 205 | 203 |
| 12 | Banque Federative du Credit Mutuel SA | 3.750% | 7/20/23 | 5,200 | 5,167 |
| 12 | BNP Paribas SA | 4.400% | 8/14/28 | 2,600 | 2,546 |
| 14,15 BPCE SA | 3.268% | 4/24/20 | 2,000 | 1,457 |
| 6,14 | BPCE SA | 5.400% | 10/27/25 | 1,070 | 800 |
24
| | | | | |
| Core Bond Fund | | | | |
| |
| |
| |
| | | | | Face | Market |
| | | | Maturity | Amount | Value • |
| | | Coupon | Date | ($000) | ($000) |
| 6 | Citigroup Inc. | 4.044% | 6/1/24 | 2,125 | 2,130 |
| | Comerica Inc. | 3.700% | 7/31/23 | 4,670 | 4,652 |
| 14,15 | Cooperatieve Rabobank UA | 4.600% | 7/2/25 | 6,550 | 4,821 |
| 6 | Goldman Sachs Group Inc. | 2.908% | 6/5/23 | 2,575 | 2,490 |
| 6 | HSBC Holdings plc | 3.950% | 5/18/24 | 2,850 | 2,829 |
| 6,16 | HSBC Holdings plc | 2.256% | 11/13/26 | 417 | 517 |
| 6 | HSBC Holdings plc | 4.583% | 6/19/29 | 3,000 | 3,000 |
| 6 | HSBC Holdings plc | 6.000% | 11/22/65 | 360 | 343 |
| 6,16 | HSBC Holdings plc | 5.875% | 9/28/46 | 1,965 | 2,568 |
| 6 | HSBC Holdings plc | 6.500% | 9/23/66 | 2,750 | 2,646 |
| 12 | Intesa Sanpaolo SPA | 3.875% | 7/14/27 | 825 | 708 |
| | JPMorgan Chase & Co. | 3.125% | 1/23/25 | 175 | 167 |
| | JPMorgan Chase & Co. | 3.900% | 7/15/25 | 410 | 409 |
| 6 | JPMorgan Chase & Co. | 3.509% | 1/23/29 | 850 | 802 |
| 6 | JPMorgan Chase & Co. | 4.005% | 4/23/29 | 2,865 | 2,805 |
| 14,15 | Lloyds Banking Group plc | 3.331% | 3/7/25 | 1,000 | 712 |
| 13 | Morgan Stanley | 3.563% | 5/8/24 | 385 | 392 |
| 6 | Royal Bank of Scotland Group plc | 5.076% | 1/27/30 | 1,600 | 1,602 |
| | Santander Holdings USA Inc. | 3.700% | 3/28/22 | 3,555 | 3,504 |
| | Santander Holdings USA Inc. | 3.400% | 1/18/23 | 1,650 | 1,590 |
| | Santander Holdings USA Inc. | 4.400% | 7/13/27 | 1,705 | 1,628 |
| 6 | Skandinaviska Enskilda Banken AB | 5.750% | 12/31/49 | 2,200 | 2,211 |
| | Synchrony Bank | 3.000% | 6/15/22 | 770 | 738 |
| | Synchrony Financial | 3.700% | 8/4/26 | 3,160 | 2,853 |
| | Synchrony Financial | 3.950% | 12/1/27 | 3,865 | 3,502 |
| 14,15 | Wells Fargo & Co. | 3.065% | 4/27/22 | 1,500 | 1,085 |
| | Wells Fargo Bank NA | 3.550% | 8/14/23 | 3,435 | 3,414 |
| | ZB NA | 3.500% | 8/27/21 | 4,930 | 4,902 |
| |
| | Finance Companies (0.4%) | | | | |
| | GE Capital International Funding Co. | | | | |
| | Unlimited Co. | 4.418% | 11/15/35 | 4,500 | 4,232 |
| |
| | Insurance (0.2%) | | | | |
| 17 | Chubb INA Holdings Inc. | 2.500% | 3/15/38 | 1,500 | 1,752 |
| |
| | Real Estate Investment Trusts (1.4%) | | | | |
| | Brixmor Operating Partnership LP | 3.650% | 6/15/24 | 285 | 274 |
| | Brixmor Operating Partnership LP | 3.850% | 2/1/25 | 60 | 58 |
| | Brixmor Operating Partnership LP | 4.125% | 6/15/26 | 855 | 829 |
| | Camden Property Trust | 4.625% | 6/15/21 | 20 | 20 |
| | Camden Property Trust | 4.875% | 6/15/23 | 25 | 26 |
| | Camden Property Trust | 4.250% | 1/15/24 | 65 | 66 |
| | Camden Property Trust | 3.500% | 9/15/24 | 30 | 29 |
| | Physicians Realty LP | 3.950% | 1/15/28 | 6,285 | 5,868 |
| | VEREIT Operating Partnership LP | 4.875% | 6/1/26 | 200 | 202 |
| | VEREIT Operating Partnership LP | 3.950% | 8/15/27 | 3,400 | 3,197 |
| 12 | WEA Finance LLC | 4.125% | 9/20/28 | 3,620 | 3,588 |
| | | | | | 102,287 |
| Industrial (13.3%) | | | | |
| | Basic Industry (0.2%) | | | | |
| | Celulosa Arauco y Constitucion SA | 5.500% | 11/2/47 | 225 | 220 |
| 12 | Eagle Intermediate Global Holding BV/Ruyi | | | | |
| | US Finance LLC | 7.500% | 5/1/25 | 550 | 538 |
25
| | | | | |
| Core Bond Fund | | | | |
| |
| |
| |
| | | | | Face | Market |
| | | | Maturity | Amount | Value • |
| | | Coupon | Date | ($000) | ($000) |
| 12 | Hi-Crush Partners LP | 9.500% | 8/1/26 | 250 | 232 |
| | Nutrien Ltd. | 6.500% | 5/15/19 | 100 | 102 |
| 12 | Suzano Austria GmbH | 6.000% | 1/15/29 | 1,000 | 1,002 |
| |
| | Capital Goods (1.5%) | | | | |
| 12 | Berry Global Inc. | 4.500% | 2/15/26 | 338 | 321 |
| | Embraer Netherlands Finance BV | 5.050% | 6/15/25 | 100 | 100 |
| | Embraer SA | 5.150% | 6/15/22 | 400 | 414 |
| 17 | General Electric Co. | 2.125% | 5/17/37 | 2,500 | 2,661 |
| 6 | General Electric Co. | 5.000% | 12/31/49 | 10,435 | 10,161 |
| 12 | Mueller Water Products Inc. | 5.500% | 6/15/26 | 850 | 854 |
| 18 | Reynolds Group Issuer Inc. / Reynolds Group | | | | |
| | Issuer LLC / Reynolds Group Issuer Lu | 6.875% | 2/15/21 | 260 | 263 |
| | United Rentals North America Inc. | 5.500% | 5/15/27 | 365 | 362 |
| | United Rentals North America Inc. | 4.875% | 1/15/28 | 61 | 58 |
| |
| | Communication (1.8%) | | | | |
| 12 | Cequel Communications Holdings I LLC / | | | | |
| | Cequel Capital Corp. | 7.500% | 4/1/28 | 250 | 262 |
| | Comcast Corp. | 3.375% | 8/15/25 | 7,375 | 7,120 |
| | Interpublic Group of Cos. Inc. | 4.650% | 10/1/28 | 585 | 586 |
| | Interpublic Group of Cos. Inc. | 5.400% | 10/1/48 | 450 | 447 |
| | Qwest Corp. | 6.750% | 12/1/21 | 468 | 501 |
| | Qwest Corp. | 7.250% | 9/15/25 | 200 | 215 |
| | T-Mobile USA Inc. | 4.500% | 2/1/26 | 500 | 476 |
| | T-Mobile USA Inc. | 4.750% | 2/1/28 | 250 | 235 |
| 14 | Verizon Communications Inc. | 4.050% | 2/17/25 | 1,250 | 910 |
| | Viacom Inc. | 4.375% | 3/15/43 | 5,575 | 4,867 |
| | Viacom Inc. | 5.850% | 9/1/43 | 2,025 | 2,114 |
| |
| | Consumer Cyclical (2.1%) | | | | |
| 12 | 1011778 BC ULC / New Red Finance Inc. | 4.250% | 5/15/24 | 155 | 147 |
| 12 | 1011778 BC ULC / New Red Finance Inc. | 5.000% | 10/15/25 | 565 | 541 |
| | Boyd Gaming Corp. | 6.000% | 8/15/26 | 250 | 252 |
| 12 | Churchill Downs Inc. | 4.750% | 1/15/28 | 350 | 327 |
| | General Motors Co. | 4.875% | 10/2/23 | 8,000 | 8,189 |
| | General Motors Financial Co. Inc. | 4.200% | 3/1/21 | 300 | 304 |
| | General Motors Financial Co. Inc. | 4.375% | 9/25/21 | 510 | 518 |
| | General Motors Financial Co. Inc. | 3.500% | 11/7/24 | 295 | 278 |
| | General Motors Financial Co. Inc. | 5.250% | 3/1/26 | 650 | 664 |
| 12 | Hilton Domestic Operating Co. Inc. | 5.125% | 5/1/26 | 950 | 944 |
| 12 | Hyundai Capital America | 3.100% | 4/5/22 | 220 | 213 |
| 12 | International Game Technology plc | 6.250% | 1/15/27 | 250 | 253 |
| 12 | Live Nation Entertainment Inc. | 5.625% | 3/15/26 | 217 | 219 |
| | MGM Resorts International | 5.750% | 6/15/25 | 659 | 661 |
| 12 | Nissan Motor Acceptance Corp. | 3.875% | 9/21/23 | 5,500 | 5,502 |
| 12 | Performance Food Group Inc. | 5.500% | 6/1/24 | 1,370 | 1,356 |
| |
| | Consumer Noncyclical (1.4%) | | | | |
| | Anheuser-Busch InBev Worldwide Inc. | 4.600% | 4/15/48 | 3,745 | 3,622 |
| 12 | Aramark Services Inc. | 5.000% | 2/1/28 | 715 | 701 |
| | Campbell Soup Co. | 4.800% | 3/15/48 | 3,285 | 3,000 |
| | CVS Health Corp. | 4.300% | 3/25/28 | 4,700 | 4,663 |
26
| | | | | |
| Core Bond Fund | | | | |
| |
| |
| |
| | | | | Face | Market |
| | | | Maturity | Amount | Value • |
| | | Coupon | Date | ($000) | ($000) |
| | HCA Inc. | 5.625% | 9/1/28 | 1,032 | 1,037 |
| 12 | Hologic Inc. | 4.375% | 10/15/25 | 325 | 310 |
| 12 | Hologic Inc. | 4.625% | 2/1/28 | 300 | 281 |
| |
| | Energy (4.1%) | | | | |
| | Andeavor | 4.750% | 12/15/23 | 1,000 | 1,035 |
| | Baker Hughes a GE Co. LLC / Baker Hughes | | | | |
| | Co-Obligor Inc. | 3.337% | 12/15/27 | 3,000 | 2,812 |
| | BP Capital Markets plc | 3.814% | 2/10/24 | 3,000 | 3,029 |
| | Buckeye Partners LP | 4.125% | 12/1/27 | 375 | 346 |
| | Buckeye Partners LP | 5.600% | 10/15/44 | 900 | 837 |
| | Cenovus Energy Inc. | 3.000% | 8/15/22 | 3,000 | 2,876 |
| | Cenovus Energy Inc. | 4.450% | 9/15/42 | 1,500 | 1,314 |
| | Continental Resources Inc. | 4.500% | 4/15/23 | 5,500 | 5,596 |
| | Enable Midstream Partners LP | 4.950% | 5/15/28 | 1,480 | 1,471 |
| 12 | Enbridge Energy Partners LP | 3.116% | 10/2/18 | 250 | 250 |
| 12 | Enbridge Energy Partners LP | 3.119% | 10/26/18 | 375 | 374 |
| | Energy Transfer Equity LP | 5.500% | 6/1/27 | 1,028 | 1,065 |
| | Energy Transfer LP | 9.700% | 3/15/19 | 260 | 268 |
| | Energy Transfer Partners LP | 6.000% | 6/15/48 | 1,025 | 1,092 |
| 12 | Eni SPA | 4.750% | 9/12/28 | 4,880 | 4,821 |
| | Sabine Pass Liquefaction LLC | 5.625% | 3/1/25 | 5,432 | 5,792 |
| | Sunoco Logistics Partners Operations LP | 5.950% | 12/1/25 | 6,245 | 6,723 |
| 12 | Tallgrass Energy Partners LP / Tallgrass | | | | |
| | Energy Finance Corp. | 4.750% | 10/1/23 | 243 | 243 |
| | Western Gas Partners LP | 4.750% | 8/15/28 | 105 | 103 |
| | Western Gas Partners LP | 5.500% | 8/15/48 | 105 | 99 |
| |
| | Other Industrial (0.1%) | | | | |
| 17 | Aroundtown SA | 1.875% | 1/19/26 | 500 | 570 |
| 16 | Aroundtown SA | 3.000% | 10/16/29 | 622 | 760 |
| |
| | Technology (1.0%) | | | | |
| | Broadcom Corp. / Broadcom Cayman | | | | |
| | Finance Ltd. | 3.625% | 1/15/24 | 1,555 | 1,512 |
| | Broadcom Corp. / Broadcom Cayman | | | | |
| | Finance Ltd. | 3.125% | 1/15/25 | 500 | 464 |
| | Broadcom Corp. / Broadcom Cayman | | | | |
| | Finance Ltd. | 3.875% | 1/15/27 | 2,500 | 2,359 |
| | Broadcom Corp. / Broadcom Cayman | | | | |
| | Finance Ltd. | 3.500% | 1/15/28 | 900 | 817 |
| 12 | Diamond 1 Finance Corp. / Diamond 2 | | | | |
| | Finance Corp. | 6.020% | 6/15/26 | 1,245 | 1,327 |
| 12 | Diamond 1 Finance Corp. / Diamond 2 | | | | |
| | Finance Corp. | 8.100% | 7/15/36 | 1,500 | 1,792 |
| 12 | Vantiv LLC / Vanity Issuer Corp. | 4.375% | 11/15/25 | 480 | 455 |
| | Western Digital Corp. | 4.750% | 2/15/26 | 1,100 | 1,062 |
| |
| | Transportation (1.1%) | | | | |
| 6,12 Air Canada 2013-1 Class B Pass Through | | | | |
| | Trust | 5.375% | 5/15/21 | 2,192 | 2,238 |
| 14 | Asciano Finance Ltd. | 5.400% | 5/12/27 | 1,000 | 748 |
| 14 | Aurizon Network Pty Ltd. | 4.000% | 6/21/24 | 2,500 | 1,803 |
27
| | | | | |
| Core Bond Fund | | | | |
| |
| |
| |
| | | | | Face | Market |
| | | | Maturity | Amount | Value • |
| | | Coupon | Date | ($000) | ($000) |
| 6 | Continental Airlines 2005-ERJ1 Pass Through | | | | |
| | Trust | 9.798% | 10/1/22 | 152 | 159 |
| 14 | Qantas Airways Ltd. | 7.500% | 6/11/21 | 5,000 | 4,003 |
| 6 | UAL 2007-1 Pass Through Trust | 6.636% | 7/2/22 | 1,419 | 1,483 |
| | | | | | 130,701 |
| Utilities (0.8%) | | | | |
| | Electric (0.7%) | | | | |
| 12 | Berkshire Hathaway Energy Co. | 4.450% | 1/15/49 | 2,100 | 2,090 |
| 12 | EDP Finance BV | 4.125% | 1/15/20 | 794 | 798 |
| 12 | EDP Finance BV | 5.250% | 1/14/21 | 1,600 | 1,642 |
| 12 | EDP Finance BV | 3.625% | 7/15/24 | 2,750 | 2,633 |
| | Exelon Corp. | 3.950% | 6/15/25 | 130 | 130 |
| |
| | Other Utility (0.1%) | | | | |
| 14 | DBNGP Finance Co. Pty Ltd. | 4.225% | 5/28/25 | 750 | 548 |
| | | | | | 7,841 |
| Total Corporate Bonds (Cost $245,506) | | | | 240,829 |
| Sovereign Bonds (7.2%) | | | | |
| 12 | Arab Petroleum Investments Corp. | 4.125% | 9/18/23 | 2,800 | 2,815 |
| | Argentine Republic | 4.625% | 1/11/23 | 1,132 | 955 |
| | Argentine Republic | 6.875% | 1/26/27 | 1,695 | 1,441 |
| | Bermuda | 5.603% | 7/20/20 | 500 | 517 |
| | Bermuda | 4.854% | 2/6/24 | 320 | 333 |
| | BOC Aviation Ltd. | 3.875% | 5/9/19 | 200 | 200 |
| 12 | CDP Financial Inc. | 4.400% | 11/25/19 | 600 | 610 |
| | Corp. Andina de Fomento | 2.125% | 9/27/21 | 750 | 722 |
| | Corp. Financiera de Desarrollo SA | 4.750% | 2/8/22 | 1,000 | 1,020 |
| | Corp. Nacional del Cobre de Chile | 4.500% | 9/16/25 | 200 | 203 |
| 12 | CPPIB Capital Inc. | 1.250% | 9/20/19 | 200 | 197 |
| | Dominican Republic | 6.600% | 1/28/24 | 1,900 | 2,009 |
| | Equinor ASA | 2.450% | 1/17/23 | 600 | 578 |
| 12 | Export-Import Bank of India | 3.875% | 2/1/28 | 240 | 223 |
| | Export-Import Bank of Korea | 2.250% | 1/21/20 | 1,200 | 1,181 |
| | Export-Import Bank of Korea | 5.125% | 6/29/20 | 500 | 513 |
| | Export-Import Bank of Korea | 3.000% | 11/1/22 | 200 | 195 |
| 12 | ICBCIL Finance Co. Ltd. | 2.375% | 5/19/19 | 300 | 297 |
| 19 | Japan Bank for International Cooperation | 2.125% | 11/16/20 | 2,400 | 2,346 |
| 12,17 | Kingdom of Spain | 2.700% | 10/31/48 | 2,273 | 2,705 |
| | Korea Hydro & Nuclear Power Co. Ltd. | 3.000% | 9/19/22 | 200 | 194 |
| | NTPC Ltd. | 4.250% | 2/26/26 | 250 | 239 |
| 12 | Ontario Teachers’ Cadillac Fairview | | | | |
| | Properties Trust | 3.125% | 3/20/22 | 200 | 196 |
| 12 | Ontario Teachers’ Cadillac Fairview | | | | |
| | Properties Trust | 3.875% | 3/20/27 | 200 | 199 |
| | Petroleos Mexicanos | 8.000% | 5/3/19 | 5,000 | 5,138 |
| | Petroleos Mexicanos | 5.500% | 1/21/21 | 2,775 | 2,865 |
| | Petroleos Mexicanos | 6.875% | 8/4/26 | 1,350 | 1,418 |
| | Petroleos Mexicanos | 6.500% | 3/13/27 | 1,270 | 1,295 |
| | Petroleos Mexicanos | 5.625% | 1/23/46 | 500 | 424 |
| 12,17 | Portugal Obrigacoes do Tesouro OT | 2.125% | 10/17/28 | 900 | 1,068 |
| | Province of Ontario | 1.625% | 1/18/19 | 1,000 | 997 |
| | Province of Ontario | 2.000% | 1/30/19 | 500 | 499 |
28
| | | | | |
| Core Bond Fund | | | | |
| |
| |
| |
| | | | | Face | Market |
| | | | Maturity | Amount | Value • |
| | | Coupon | Date | ($000) | ($000) |
| | Province of Ontario | 4.400% | 4/14/20 | 160 | 163 |
| | Province of Quebec | 7.125% | 2/9/24 | 200 | 234 |
| | Republic of Colombia | 7.375% | 3/18/19 | 6,500 | 6,627 |
| | Republic of Colombia | 10.375% | 1/28/33 | 1,652 | 2,513 |
| | Republic of Croatia | 6.750% | 11/5/19 | 1,500 | 1,553 |
| | Republic of Guatemala | 5.750% | 6/6/22 | 900 | 934 |
| | Republic of Hungary | 6.250% | 1/29/20 | 1,200 | 1,247 |
| 17 | Republic of Hungary | 1.250% | 10/22/25 | 1,250 | 1,440 |
| | Republic of Latvia | 2.750% | 1/12/20 | 2,000 | 1,983 |
| | Republic of Lithuania | 6.125% | 3/9/21 | 365 | 389 |
| | Republic of Panama | 8.125% | 4/28/34 | 150 | 201 |
| | Republic of Poland | 5.125% | 4/21/21 | 615 | 643 |
| | Republic of Poland | 5.000% | 3/23/22 | 70 | 74 |
| | Republic of Serbia | 5.875% | 12/3/18 | 1,000 | 1,003 |
| | Russian Federation | 5.250% | 6/23/47 | 400 | 384 |
| 12 | Sinopec Group Overseas Development | | | | |
| | 2018 Ltd. | 4.250% | 9/12/28 | 693 | 682 |
| | Socialist Republic of Vietnam | 6.750% | 1/29/20 | 800 | 830 |
| | State of Israel | 4.500% | 1/30/43 | 200 | 203 |
| | State of Israel | 4.125% | 1/17/48 | 300 | 285 |
| | State of Qatar | 5.250% | 1/20/20 | 4,000 | 4,103 |
| 20 | United Mexican States | 8.000% | 12/7/23 | 210,000 | 11,326 |
| 20 | United Mexican States | 10.000% | 12/5/24 | 5,000 | 296 |
| | YPF SA | 8.875% | 12/19/18 | 600 | 601 |
| Total Sovereign Bonds (Cost $71,720) | | | | 71,306 |
| Taxable Municipal Bonds (0.1%) | | | | |
| | California GO | 7.550% | 4/1/39 | 500 | 730 |
| | Chicago IL Board of Education GO | 6.319% | 11/1/29 | 100 | 99 |
| | Wisconsin Annual Appropriation Revenue | 3.954% | 5/1/36 | 500 | 494 |
| Total Taxable Municipal Bonds (Cost $1,337) | | | | 1,323 |
| |
| | | | | Shares | |
| Temporary Cash Investments (6.3%) | | | | |
| Money Market Fund (6.2%) | | | | |
| 21 | Vanguard Market Liquidity Fund | 2.209% | | 615,774 | 61,577 |
| |
| | | | | Face | |
| | | | | Amount | |
| | | | | ($000) | |
| Commercial Paper (0.1%) | | | | |
| 22 | Enbridge Energy Partners LP | 3.073% | 10/9/18 | 625 | 624 |
| Total Temporary Cash Investments (Cost $62,203) | | | 62,201 |
29
| | | | | |
| Core Bond Fund | | | | | |
| |
| |
| |
| | | | | Notional | Market |
| | Expiration | Exercise | | Amount | Value • |
| | Date | Price | Contracts | ($000) | ($000) |
| Options Purchased (0.0%) | | | | | |
| Exchange-Traded Options Purchased | | | | |
| Call Options | | | | | |
| 10-Year U.S. Treasury Note | | | | |
| Futures Contracts | 10/26/18 | 120.00 | 17 | 2,040 | 2 |
| | | | | |
| | | | | Notional | |
| | | | | Amount on | |
| | | | | Underlying | |
| | | Expiration | Exercise | Swap | |
| | Counterparty | Date | Rate | ($000) | |
| OTC Credit Default Swaptions Purchased (0.0%) | | | |
| Put Swaptions | | | | | |
| CDX-NA-IG-S30-V1, Pays | | | | |
| 1.00% Quarterly | DBAG | 10/17/18 | 67.50% | 3,155 | — |
| Total Options Purchased (Cost $4) | | | | 2 |
| Total Investments (98.3%) (Cost $991,133) | | | | 968,556 |
| Other Assets and Liabilities (1.7%) | | | | |
| Other Assets | | | | | 124,181 |
| Liabilities | | | | | (107,831) |
| | | | | | 16,350 |
| Net Assets (100%) | | | | | 984,906 |
30
| |
| Core Bond Fund | |
| |
| |
| |
| |
| | Amount |
| | ($000) |
| Statement of Assets and Liabilities | |
| Assets | |
| Investments in Securities, at Value | |
| Unaffiliated Issuers | 906,977 |
| Affiliated Issuers | 61,577 |
| Options Purchased | 2 |
| Total Investments in Securities | 968,556 |
| Investment in Vanguard | 50 |
| Receivables for Investment Securities Sold | 115,718 |
| Receivables for Accrued Income | 6,160 |
| Receivables for Capital Shares Issued | 1,173 |
| Variation Margin Receivable—Futures Contracts | 24 |
| Variation Margin Receivable—CC Swap Contracts | 3 |
| Unrealized Appreciation—Forward Currency Contracts | 631 |
| Unrealized Appreciation—OTC Swap Contracts | 47 |
| Other Assets | 375 |
| Total Assets | 1,092,737 |
| Liabilities | |
| Payables for Investment Securities Purchased | 105,057 |
| Payables for Capital Shares Redeemed | 1,401 |
| Payables for Distributions | 411 |
| Payables to Vanguard | 102 |
| Options Written, at Value23 | 107 |
| Variation Margin Payable—Futures Contracts | 178 |
| Variation Margin Payable—CC Swap Contracts | 1 |
| Unrealized Depreciation—Forward Currency Contracts | 213 |
| Unrealized Depreciation—OTC Swap Contracts | 148 |
| Other Liabilities | 213 |
| Total Liabilities | 107,831 |
| Net Assets | 984,906 |
| |
| At September 30, 2018, net assets consisted of: | |
| | Amount |
| | ($000) |
| Paid-in Capital | 1,029,096 |
| Undistributed Net Investment Income | 637 |
| Accumulated Net Realized Losses | (20,205) |
| Unrealized Appreciation (Depreciation) | |
| Investment Securities | (22,575) |
| Futures Contracts | (2,295) |
| Options | (4) |
| Swap Contracts | (183) |
| Forward Currency Contracts | 418 |
| Foreign Currencies | 17 |
| Net Assets | 984,906 |
31
| |
| Core Bond Fund | |
| |
| |
| | Amount |
| | ($000) |
| Investor Shares—Net Assets | |
| Applicable to 8,327,530 outstanding $.001 par value shares of | |
| beneficial interest (unlimited authorization) | 79,865 |
| Net Asset Value Per Share—Investor Shares | $9.59 |
| |
| Admiral Shares—Net Assets | |
| Applicable to 47,198,495 outstanding $.001 par value shares of | |
| beneficial interest (unlimited authorization) | 905,041 |
| Net Asset Value Per Share—Admiral Shares | $19.18 |
• See Note A in Notes to Financial Statements.
1 Securities with a value of $610,000 have been segregated as initial margin for open cleared swap contracts.
2 Securities with a value of $3,235,000 have been segregated as initial margin for open futures contracts.
3 U.S. government-guaranteed.
4 The issuer operates under a congressional charter; its securities are generally neither guaranteed by the U.S. Treasury nor backed
by the full faith and credit of the U.S. government.
5 The issuer was placed under federal conservatorship in September 2008; since that time, its daily operations have been managed
by the Federal Housing Finance Agency and it receives capital from the U.S. Treasury, as needed to maintain a positive net worth,
in exchange for senior preferred stock.
6 The average or expected maturity is shorter than the final maturity shown because of the possibility of interim principal payments
and prepayments or the possibility of the issue being called.
7 Includes securities purchased on a when-issued or delayed-delivery basis for which the fund has not taken delivery as of
September 30, 2018.
8 Adjustable-rate security based upon one-year Constant Maturity Treasury yield plus spread.
9 Adjustable-rate security based upon 1-month USD LIBOR plus spread.
10 Interest-only security.
11 Inverse floating rate interest-only security whose interest rate is derived by subtracting 1-month USD LIBOR from a cap.
12 Security exempt from registration under Rule 144A of the Securities Act of 1933. Such securities may be sold in transactions
exempt from registration, normally to qualified institutional buyers. At September 30, 2018, the aggregate value of these
securities was $105,987,000, representing 10.8% of net assets.
13 Adjustable-rate security based upon 3-month USD LIBOR plus spread.
14 Face amount denominated in Australian dollars.
15 Adjustable-rate security based upon 3-month AUD Australian Bank Bill Rate plus spread.
16 Face amount denominated in British pounds.
17 Face amount denominated in euro.
18 Scheduled principal and interest payments are guaranteed by bank letter of credit.
19 Guaranteed by the Government of Japan.
20 Face amount denominated in Mexican peso.
21 Affiliated money market fund available only to Vanguard funds and certain trusts and accounts managed by Vanguard. Rate shown
is the 7-day yield.
22 Security exempt from registration under Section 4(2) of the Securities Act of 1933. Such securities may be sold in transactions
exempt from registration only to dealers in that program or other “accredited investors.” At September 30, 2018, the value of
these securities was $624,000, representing 0.1% of net assets.
23 Includes premium received of $105,000.
CC—Centrally Cleared.
DBAG—Deutsche Beteiligungs AG.
GO—General Obligation Bond.
OTC—Over-the-Counter.
REMICS—Real Estate Mortgage Investment Conduits.
32
| | | | | |
| Core Bond Fund | | | | | |
| |
| |
| Derivative Financial Instruments Outstanding as of Period End | | | |
| Options Written | | | | | |
| | | | | Notional | Market |
| | Expiration | | Exercise | Amount | Value |
| | Date | Contracts | Price | ($000) | ($000) |
| Exchange-Traded Options | | | | | |
| Call Options | | | | | |
| 10-Year U.S. Treasury Note Futures Contract | 10/26/18 | 17 | 118.50 | 2,015 | (9) |
| 10-Year U.S. Treasury Note Futures Contract | 10/26/18 | 34 | 119.00 | 4,046 | (11) |
| 10-Year U.S. Treasury Note Futures Contract | 10/26/18 | 17 | 119.50 | 2,032 | (3) |
| 10-Year U.S. Treasury Note Futures Contract | 10/26/18 | 34 | 120.50 | 4,097 | (1) |
| | | | | | (24) |
| |
| Put Options | | | | | |
| 10-Year U.S. Treasury Note Futures Contract | 10/26/18 | 17 | 118.50 | 2,015 | (5) |
| 10-Year U.S. Treasury Note Futures Contract | 10/26/18 | 34 | 119.00 | 4,046 | (18) |
| 10-Year U.S. Treasury Note Futures Contract | 10/26/18 | 17 | 119.50 | 2,032 | (15) |
| 10-Year U.S. Treasury Note Futures Contract | 10/26/18 | 17 | 120.00 | 2,040 | (22) |
| 10-Year U.S. Treasury Note Futures Contract | 11/23/18 | 18 | 118.50 | 2,133 | (8) |
| | | | | | (68) |
| | | | | | (92) |
| | | | | |
| | | | | Notional | |
| | | | | Amount on | |
| | | | | Underlying | Market |
| | Expiration | Exercise | Swap | Value |
| | Counterparty | Date | Rate | ($000) | ($000) |
| OTC Credit Default Swaptions Written | | | | | |
| Call Options | | | | | |
| CDX-NA-IG-S30-V1, Receives 1.00% Quarterly | DBAG | 10/17/18 | 60.00% | 3,155 | (7) |
| CDX-NA-IG-S31-V1, Receives 1.00% Quarterly | DBAG | 11/21/18 | 62.50% | 2,080 | (4) |
| | | | | | (11) |
| |
| Put Options | | | | | |
| CDX-NA-IG-S30-V1, Pays 1.00% Quarterly | DBAG | 10/17/18 | 60.00% | 3,155 | (1) |
| CDX-NA-IG-S31-V1, Pays 1.00% Quarterly | DBAG | 11/21/18 | 62.50% | 2,080 | (3) |
| | | | | | (4) |
| | | | | | (15) |
| Total Options Written | | | | | (107) |
| DBAG—Deutsche Beteiligungs AG. | | | | | |
33
| | | | |
| Core Bond Fund | | | | |
| |
| |
| Futures Contracts | | | | |
| | | | | ($000) |
| | | | | Value and |
| | | Number of | | Unrealized |
| | | Long (Short) | Notional | Appreciation |
| | Expiration | Contracts | Amount | (Depreciation) |
| Long Futures Contracts | | | | |
| Ultra Long U. S. Treasury Bond | December 2018 | 386 | 59,553 | (1,774) |
| 30-Year U. S. Treasury Bond | December 2018 | 273 | 38,357 | (734) |
| 5-Year U. S. Treasury Note | December 2018 | 250 | 28,119 | 7 |
| 2-Year U. S. Treasury Note | December 2018 | 113 | 23,813 | (22) |
| 10-Year U. S. Treasury Note | December 2018 | 173 | 20,549 | 30 |
| Euro-Buxl | December 2018 | 56 | 10,324 | 17 |
| | | | | (2,476) |
| |
| Short Futures Contracts | | | | |
| Euro-Buxl | December 2018 | (33) | (6,679) | 101 |
| Long Gilt | December 2018 | (35) | (5,517) | 20 |
| AUD 3-Year Treasury Bond | December 2018 | (60) | (4,826) | 9 |
| AUD 10-Year Treasury Bond | December 2018 | (26) | (2,422) | 20 |
| Ultra 10-Year U.S. Treasury Note | December 2018 | (15) | (1,890) | 27 |
| Euro-Bobl | December 2018 | (7) | (1,062) | 4 |
| | | | | 181 |
| | | | | (2,295) |
| | | | | | |
| Forward Currency Contracts | | | | | | |
| | | | | | | Unrealized |
| | Contract | | | | | Appreciation |
| | | | Contract Amount (000) | |
| | Settlement | | | | | (Depreciation) |
| Counterparty | Date | | Receive | | Deliver | ($000) |
| Goldman Sachs Bank AG | 10/15/18 | EUR | 14,951 | USD | 17,478 | (99) |
| BNP Paribas | 10/15/18 | GBP | 1,625 | USD | 2,130 | (11) |
| Bank of America, N.A. | 10/15/18 | EUR | 607 | USD | 711 | (6) |
| JPMorgan Chase Bank, N.A. | 10/15/18 | EUR | 125 | USD | 145 | — |
| Deutsche Bank AG | 10/15/18 | EUR | 49 | USD | 58 | (1) |
| Citibank, N.A. | 11/15/18 | AUD | 71 | USD | 51 | — |
| Bank of America, N.A. | 11/15/18 | AUD | 70 | USD | 51 | — |
| Deutsche Bank AG | 10/15/18 | USD | 25,634 | EUR | 21,878 | 202 |
| Toronto-Dominion Bank | 11/15/18 | USD | 13,418 | AUD | 18,099 | 330 |
| JPMorgan Chase Bank, N.A. | 10/15/18 | USD | 11,629 | MXN | 219,996 | (96) |
34
| | | | | | |
| Core Bond Fund | | | | | | |
| |
| |
| Forward Currency Contracts (continued) | | | | | |
| | | | | | | Unrealized |
| | Contract | | | | | Appreciation |
| | | | Contract Amount (000) | |
| | Settlement | | | | | (Depreciation) |
| Counterparty | Date | | Receive | | Deliver | ($000) |
| Bank of America, N.A. | 10/15/18 | USD | 5,872 | GBP | 4,465 | 49 |
| Goldman Sachs Bank AG | 11/15/18 | USD | 3,072 | AUD | 4,215 | 24 |
| JPMorgan Chase Bank, N.A. | 10/15/18 | USD | 2,779 | EUR | 2,373 | 21 |
| HSBC | 11/15/18 | USD | 796 | AUD | 1,094 | 5 |
| Goldman Sachs Bank AG | 10/15/18 | USD | 116 | EUR | 100 | — |
| JPMorgan Chase Bank, N.A. | 11/15/18 | USD | 50 | AUD | 70 | — |
| Citibank, N.A. | 11/15/18 | USD | 39 | AUD | 54 | — |
| JPMorgan Chase Bank, N.A. | 11/15/18 | USD | 26 | AUD | 37 | — |
| | | | | | | 418 |
| AUD—Australian dollar. | | | | | | |
| EUR—euro. | | | | | | |
| GBP—British pound. | | | | | | |
| MXN—Mexican peso. | | | | | | |
| USD—U.S. dollar. | | | | | | |
| | | | | | |
| Centrally Cleared Credit Default Swaps | | | | | |
| | | | | Periodic | | |
| | | | | Premium | | Unrealized |
| | | | | Received | | Appreciation |
| | Termination | Notional Amount | (Paid)1 | Value | (Depreciation) |
| Reference Entity | Date | | (000) | (%) | ($000) | ($000) |
| Credit Protection Sold | | | | | | |
| CDX-NA-HY-S30-V1 | 6/20/23 | USD | 424 | 5.000 | 33 | 1 |
| CDX-NA-IG-S30-V1 | 6/20/23 | USD | 2,092 | 1.000 | 42 | 3 |
| iTraxx Europe-S30-V1 | 12/20/23 | EUR | 1,062 | 1.000 | 20 | — |
| | | | | | | 4 |
| |
| Credit Protection Purchased | | | | | | |
| CDX-NA-IG-S30-V1 | 12/20/23 | USD | 40,210 | (1.000) | (777) | (70) |
| | | | | | | (66) |
| 1 Periodic premium received/paid quarterly. | | | | | |
| EUR—euro. | | | | | | |
| USD—U.S. dollar. | | | | | | |
35
| | | | | | | |
| Core Bond Fund | | | | | | | |
| |
| |
| Over-the-Counter Credit Default Swaps | | | | | |
| | | | | | | Remaining | |
| | | | | Periodic | | Up-Front | |
| | | | | Premium | | Premium | Unrealized |
| | | | Notional | Received | | Received | Appreciation |
| Termination | | Amount | (Paid)2 | Value | (Paid) | (Depreciation) |
| Reference Entity | Date | Counterparty | ($000) | (%) | ($000) | ($000) | ($000) |
| Credit Protection Sold/Moody’s Rating | | | | | |
| Berkshire Hathaway | | | | | | | |
| Inc./Aa2 | 6/20/21 | JPMC | 70 | 1.000 | 1 | — | 1 |
| Berkshire Hathaway | | | | | | | |
| Inc./Aa2 | 6/20/21 | GSI | 55 | 1.000 | 1 | — | 1 |
| Berkshire Hathaway | | | | | | | |
| Inc./Aa2 | 6/20/22 | BARC | 450 | 1.000 | 9 | (6) | 3 |
| Berkshire Hathaway | | | | | | | |
| Inc./Aa2 | 12/20/22 | BARC | 400 | 1.000 | 8 | (6) | 2 |
| Berkshire Hathaway | | | | | | | |
| Inc./Aa2 | 6/20/24 | BARC | 600 | 1.000 | 8 | (6) | 2 |
| Berkshire Hathaway | | | | | | | |
| Inc./Aa2 | 6/20/24 | JPMC | 600 | 1.000 | 8 | (5) | 3 |
| Metlife Inc./A3 | 12/20/21 | BARC | 100 | 1.000 | 2 | — | 2 |
| Metlife Inc./A3 | 6/20/24 | BARC | 700 | 1.000 | 7 | (1) | 6 |
| People’s Republic of | | | | | | | |
| China/A3 | 6/20/22 | BNPSW | 200 | 1.000 | 4 | (1) | 3 |
| Petroleos Mexicanos/ | | | | | | | |
| Baa3 | 12/20/23 | DBAG | 930 | 1.000 | (58) | 56 | (2) |
| Republic of Peru/A3 | 12/20/23 | BOANA | 1,400 | 1.000 | 17 | (12) | 5 |
| Russian Federation/Ba1 12/20/23 | JPMC | 275 | 1.000 | (6) | 8 | 2 |
| Russian Federation/Ba1 12/20/23 | JPMC | 550 | 1.000 | (12) | 16 | 4 |
| Southern Co. /Baa2 | 6/20/22 | JPMC | 1,725 | 1.000 | 32 | (22) | 10 |
| Valeo SA/Baa2 | 6/20/23 | GSI | 2,460 | 1.000 | 1 | (3) | (2) |
| Valeo SA/Baa2 | 6/20/23 | JPMC | 2,100 | 1.000 | 1 | (6) | (5) |
| Valeo SA/Baa2 | 12/20/23 | GSI | 500 | 1.000 | (3) | 1 | (2) |
| | | | | | 20 | 13 | 33 |
| | | | | | | |
| Credit Protection Purchased | | | | | | |
| Bank of China Ltd. | 12/20/21 | BNPSW | 100 | (1.000) | (2) | — | (2) |
| Bank of China Ltd. | 6/20/22 | BNPSW | 200 | (1.000) | (4) | — | (4) |
| Barclays Bank plc | 6/20/22 | CSFBI | 4251 | (1.000) | (9) | 7 | (2) |
| Barclays Bank plc | 6/20/22 | BOANA | 4251 | (1.000) | (9) | 7 | (2) |
| Barclays Bank plc | 12/20/22 | CITNA | 1861 | (1.000) | 6 | (6) | — |
| CECONOMY AG | 6/20/22 | BARC | 2101 | (1.000) | — | (1) | (1) |
| CECONOMY AG | 6/20/22 | BARC | 851 | (1.000) | — | — | — |
| CECONOMY AG | 6/20/22 | BARC | 851 | (1.000) | — | — | — |
| CECONOMY AG | 6/20/22 | BARC | 2901 | (1.000) | (1) | — | (1) |
| CECONOMY AG | 6/20/22 | BARC | 2101 | (1.000) | — | (1) | (1) |
| CECONOMY AG | 6/20/22 | BARC | 851 | (1.000) | — | — | — |
36
| | | | | | | |
| Core Bond Fund | | | | | | | |
| |
| |
| Over-the-Counter Credit Default Swaps (continued) | | | | |
| | | | | | | Remaining | |
| | | | | Periodic | | Up-Front | |
| | | | | Premium | | Premium | Unrealized |
| | | | Notional | Received | | Received | Appreciation |
| Termination | | Amount | (Paid)2 | Value | (Paid) | (Depreciation) |
| Reference Entity | Date | Counterparty | ($000) | (%) | ($000) | ($000) | ($000) |
| Commerzbank AG | 6/20/21 | BOANA | 505 | (1.000) | (7) | (5) | (12) |
| Deutsche Bank AG | 12/20/22 | JPMC | 440 | (1.000) | 2 | 1 | 3 |
| Dominion Energy Inc. | 6/20/22 | JPMC | 215 | (1.000) | (6) | 6 | — |
| Exelon Corp. | 6/20/22 | JPMC | 345 | (1.000) | (9) | 8 | (1) |
| Exelon Corp. | 6/20/22 | JPMC | 215 | (1.000) | (6) | 5 | (1) |
| Lincoln National Corp. | 6/20/21 | BARC | 35 | (1.000) | (1) | 1 | — |
| Lincoln National Corp. | 6/20/21 | BARC | 25 | (1.000) | — | (1) | (1) |
| Lincoln National Corp. | 12/20/21 | BARC | 100 | (1.000) | (2) | — | (2) |
| McDonald’s Corp. | 6/20/22 | GSI | 325 | (1.000) | (10) | 8 | (2) |
| People’s Republic of | | | | | | | |
| China | 6/20/23 | GSI | 1,200 | (1.000) | (27) | 16 | (11) |
| Republic of Colombia | 6/20/23 | GSI | 650 | (1.000) | (1) | (9) | (10) |
| Sempra Energy | 6/20/22 | JPMC | 345 | (1.000) | (9) | 8 | (1) |
| Sempra Energy | 6/20/22 | JPMC | 215 | (1.000) | (5) | 5 | — |
| Societe Generale SA | 12/20/21 | JPMC | 325 | (1.000) | (7) | 1 | (6) |
| Standard Chartered | | | | | | | |
| Bank | 12/20/21 | JPMC | 185 | (1.000) | (4) | — | (4) |
| State of Qatar | 6/20/22 | BOANA | 340 | (1.000) | (7) | (3) | (10) |
| State of Qatar | 6/20/22 | CITNA | 660 | (1.000) | (14) | (6) | (20) |
| Telia Company AB | 6/20/23 | BARC | 5,9001 | (1.000) | (210) | 171 | (39) |
| United Mexican States 12/20/23 | JPMC | 1,575 | (1.000) | 8 | (12) | (4) |
| | | | | | (334) | 200 | (134) |
| | | | | | (314) | 213 | (101) |
The notional amount represents the maximum potential amount the fund could be required to pay as a seller of credit protection if the reference entity was subject to a credit event.
1 Notional amount denominated in euro.
2 Periodic premium received/paid quarterly.
BARC—BarclaysBankplc.
BNPSW—BNP Paribas.
BOANA—BankofAmerica,N.A.
CITNA—CitibankN.A.
CSFBI—Credit Suisse First Boston International.
DBAG—Deutsche Beteiligungs AG.
GSI—Goldman Sachs International.
JPMC—JP Morgan Chase Bank.
At September 30, 2018, the counterparties had deposited in segregated accounts securities with a value of $568,000 in connection with forward currency contracts and over-the-counter swap contracts.
37
| | | | | | |
| Core Bond Fund | | | | | | |
| |
| |
| Centrally Cleared Interest Rate Swaps | | | | | |
| | | | Fixed | Floating | | |
| | | | Interest | Interest | | |
| | | | Rate | Rate | | Unrealized |
| | Future | Notional | Received | Received | | Appreciation |
| | Effective | Amount | (Paid)2 | (Paid) 3 | Value | (Depreciation) |
| Termination Date | Date | ($000) | (%) | (%) | ($000) | ($000) |
| 12/19/19 | 12/19/181 | 2,298 | 2.500 | (0.000) | (10) | (1) |
| 12/21/20 | 12/19/181 | 5,332 | 2.750 | (0.000) | (34) | (6) |
| 12/20/21 | 12/19/181 | 1,884 | 2.750 | (0.000) | (19) | (4) |
| 12/19/22 | 12/19/181 | 1,098 | 2.750 | (0.000) | (15) | (2) |
| 12/19/23 | 12/19/181 | 774 | 2.750 | (0.000) | (13) | (3) |
| 12/19/28 | 12/19/181 | 113 | 2.750 | (0.000) | (3) | — |
| | | | | | | (16) |
1 Forward interest rate swap. In a forward interest rate swap, the fund and the counterparty agree to make periodic net payments beginning on a specified future effective date.
2 Fixed interest payment received/paid semiannually.
3 Based on 3-month London Interbank Offered Rate (LIBOR) as of the most recent payment date. Floating interest payment received/ paidquarterly.
See accompanying Notes, which are an integral part of the Financial Statements.
38
Core Bond Fund
Statement of Operations
| |
| | Year Ended |
| | September 30, 2018 |
| | ($000) |
| Investment Income | |
| Income | |
| Interest1 | 28,403 |
| Total Income | 28,403 |
| Expenses | |
| The Vanguard Group—Note B | |
| Investment Advisory Services | 118 |
| Management and Administrative—Investor Shares | 176 |
| Management and Administrative—Admiral Shares | 877 |
| Marketing and Distribution—Investor Shares | 19 |
| Marketing and Distribution—Admiral Shares | 67 |
| Custodian Fees | 29 |
| Auditing Fees | 44 |
| Shareholders’ Reports and Proxy—Investor Shares | 7 |
| Shareholders’ Reports and Proxy—Admiral Shares | 10 |
| Trustees’ Fees and Expenses | 1 |
| Total Expenses | 1,348 |
| Net Investment Income | 27,055 |
| Realized Net Gain (Loss) | |
| Investment Securities Sold1 | (14,566) |
| Futures Contracts | (2,314) |
| Purchased Options | (142) |
| Written Options | 208 |
| Swap Contracts | (253) |
| Forward Currency Contracts | 861 |
| Foreign Currencies | 42 |
| Realized Net Gain (Loss) | (16,164) |
| Change in Unrealized Appreciation (Depreciation) | |
| Investment Securities1 | (21,288) |
| Futures Contracts | (1,785) |
| Purchased Options | 4 |
| Written Options | 11 |
| Swap Contracts | 149 |
| Forward Currency Contracts | 132 |
| Foreign Currencies | 14 |
| Change in Unrealized Appreciation (Depreciation) | (22,763) |
| Net Increase (Decrease) in Net Assets Resulting from Operations | (11,872) |
1 Interest income, realized net gain (loss), and change in unrealized appreciation (depreciation) from an affiliated company of the fund were $466,000, ($1,000), and ($5,000), respectively. Purchases and sales are for temporary cash investment purposes.
See accompanying Notes, which are an integral part of the Financial Statements.
39
Core Bond Fund
Statement of Changes in Net Assets
| | |
| | Year Ended September 30, |
| | 2018 | 2017 |
| | ($000) | ($000) |
| Increase (Decrease) in Net Assets | | |
| Operations | | |
| Net Investment Income | 27,055 | 16,282 |
| Realized Net Gain (Loss) | (16,164) | (3,532) |
| Change in Unrealized Appreciation (Depreciation) | (22,763) | (9,822) |
| Net Increase (Decrease) in Net Assets Resulting from Operations | (11,872) | 2,928 |
| Distributions | | |
| Net Investment Income | | |
| Investor Shares | (2,501) | (1,458) |
| Admiral Shares | (25,700) | (13,502) |
| Realized Capital Gain1 | | |
| Investor Shares | — | (378) |
| Admiral Shares | — | (3,414) |
| Total Distributions | (28,201) | (18,752) |
| Capital Share Transactions | | |
| Investor Shares | (7,025) | 27,383 |
| Admiral Shares | 147,597 | 229,954 |
| Net Increase (Decrease) from Capital Share Transactions | 140,572 | 257,337 |
| Total Increase (Decrease) | 100,499 | 241,513 |
| Net Assets | | |
| Beginning of Period | 884,407 | 642,894 |
| End of Period2 | 984,906 | 884,407 |
1 Includes fiscal 2018 and 2017 short-term gain distributions totaling $0 and $3,792,000, respectively. Short-term gain distributions are treated as ordinary income dividends for tax purposes.
2 Net Assets—End of Period includes undistributed (overdistributed) net investment income of $637,000 and $404,000.
See accompanying Notes, which are an integral part of the Financial Statements.
40
Core Bond Fund
Financial Highlights
| | | |
| Investor Shares | | | |
| | | March 10, |
| | Year Ended | 20161 to |
| | September 30, | Sept. 30, |
| For a Share Outstanding Throughout Each Period | 2018 | 2017 | 2016 |
| Net Asset Value, Beginning of Period | $10.00 | $10.26 | $10.00 |
| Investment Operations | | | |
| Net Investment Income | . 269 2 | .2172 | .097 |
| Net Realized and Unrealized Gain (Loss) on Investments | (.400) | (.219) | .259 |
| Total from Investment Operations | (.131) | (. 002) | . 356 |
| Distributions | | | |
| Dividends from Net Investment Income | (. 279) | (.197) | (. 096) |
| Distributions from Realized Capital Gains | — | (.061) | — |
| Total Distributions | (. 279) | (. 258) | (. 096) |
| Net Asset Value, End of Period | $9.59 | $10.00 | $10.26 |
| |
| Total Return3 | -1.32% | 0.03% | 3.57% |
| |
| Ratios/Supplemental Data | | | |
| Net Assets, End of Period (Millions) | $80 | $91 | $65 |
| Ratio of Total Expenses to Average Net Assets | 0.25% | 0.25% | 0.25%5 |
| Ratio of Net Investment Income to Average Net Assets | 2.76% | 2.18% | 2.00%5 |
| Portfolio Turnover Rate 4 | 263% | 232% | 229% |
1 Subscription period for the fund was March 10, 2016, to March 24, 2016, during which time all assets were held in money market instruments. Performance measurement began March 28, 2016, the first business day after the subscription period, at a net asset value of $10.00.
2 Calculated based on average shares outstanding.
3 Total returns do not include account service fees that may have applied in the periods shown. Fund prospectuses provide information about any applicable account service fees.
4 Includes 60%, 81%, and 58% attributable to mortgage-dollar-roll activity.
5 Annualized.
See accompanying Notes, which are an integral part of the Financial Statements.
41
Core Bond Fund
Financial Highlights
| | | |
| Admiral Shares | | | |
| | | March 10, |
| | Year Ended | 20161 to |
| | September 30, | Sept. 30, |
| For a Share Outstanding Throughout Each Period | 2018 | 2017 | 2016 |
| Net Asset Value, Beginning of Period | $20.00 | $20.53 | $20.00 |
| Investment Operations | | | |
| Net Investment Income | . 563 2 | .4542 | .205 |
| Net Realized and Unrealized Gain (Loss) on Investments | (.800) | (.445) | .528 |
| Total from Investment Operations | (.237) | .009 | .733 |
| Distributions | | | |
| Dividends from Net Investment Income | (. 583) | (. 417) | (. 203) |
| Distributions from Realized Capital Gains | — | (.122) | — |
| Total Distributions | (. 583) | (. 539) | (. 203) |
| Net Asset Value, End of Period | $19.18 | $20.00 | $20.53 |
| |
| Total Return3 | -1.19% | 0.10% | 3.67% |
| |
| Ratios/Supplemental Data | | | |
| Net Assets, End of Period (Millions) | $905 | $794 | $578 |
| Ratio of Total Expenses to Average Net Assets | 0.13% | 0.15% | 0.15%5 |
| Ratio of Net Investment Income to Average Net Assets | 2.88% | 2.28% | 2.10%5 |
| Portfolio Turnover Rate 4 | 263% | 232% | 229% |
1 Subscription period for the fund was March 10, 2016, to March 24, 2016, during which time all assets were held in money market instruments. Performance measurement began March 28, 2016, the first business day after the subscription period, at a net asset value of $20.00.
2 Calculated based on average shares outstanding.
3 Total returns do not include account service fees that may have applied in the periods shown. Fund prospectuses provide information about any applicable account service fees.
4 Includes 60%, 81%, and 58% attributable to mortgage-dollar-roll activity.
5 Annualized.
See accompanying Notes, which are an integral part of the Financial Statements.
42
Core Bond Fund
Notes to Financial Statements
Vanguard Core Bond Fund is registered under the Investment Company Act of 1940 as an open-end investment company, or mutual fund. Certain of the fund’s investments are in corporate debt instruments; the issuers’ abilities to meet their obligations may be affected by economic developments in their respective industries. The fund invests in securities of foreign issuers, which may subject it to investment risks not normally associated with investing in securities of U.S. corporations. To minimize the currency risk associated with investment in bonds denominated in currencies other than the U.S. dollar, the fund attempts to hedge its currency exposures.
The fund offers two classes of shares: Investor Shares and Admiral Shares. Investor Shares are available to any investor who meets the fund’s minimum purchase requirements. Admiral Shares are designed for investors who meet certain administrative, service, and account-size criteria.
A. The following significant accounting policies conform to generally accepted accounting principles for U.S. investment companies. The fund consistently follows such policies in preparing its financial statements.
1. Security Valuation: Securities are valued as of the close of trading on the New York Stock Exchange (generally 4 p.m., Eastern time) on the valuation date. Bonds and temporary cash investments are valued using the latest bid prices or using valuations based on a matrix system (which considers such factors as security prices, yields, maturities, and ratings), both as furnished by independent pricing services. Structured debt securities, including mortgages and asset-backed securities, are valued using the latest bid prices or using valuations based on a matrix system that considers such factors as issuer, tranche, nominal or option-adjusted spreads, weighted average coupon, weighted average maturity, credit enhancements, and collateral. Investments in Vanguard Market Liquidity Fund are valued at that fund’s net asset value. Securities for which market quotations are not readily available, or whose values have been affected by events occurring before the fund’s pricing time but after the close of the securities’ primary markets, are valued at their fair values calculated according to procedures adopted by the board of trustees. These procedures include obtaining quotations from an independent pricing service, monitoring news to identify significant market- or security-specific events, and evaluating changes in the values of foreign market proxies (for example, ADRs, futures contracts, or exchange-traded funds), between the time the foreign markets close and the fund’s pricing time. When fair-value pricing is employed, the prices of securities used by a fund to calculate its net asset value may differ from quoted or published prices for the same securities.
2. Foreign Currency: Securities and other assets and liabilities denominated in foreign currencies are translated into U.S. dollars using exchange rates obtained from an independent third party as of the fund’s pricing time on the valuation date. Realized gains (losses) and unrealized appreciation (depreciation) on investment securities include the effects of changes in exchange rates since the securities were purchased, combined with the effects of changes in security prices. Fluctuations in the value of other assets and liabilities resulting from changes in exchange rates are recorded as unrealized foreign currency gains (losses) until the assets or liabilities are settled in cash, at which time they are recorded as realized foreign currency gains (losses).
3. Futures Contracts: The fund uses futures contracts to invest in fixed income asset classes with greater efficiency and lower cost than is possible through direct investment, to add value when these instruments are attractively priced, or to adjust sensitivity to changes in interest rates. The primary risks associated with the use of futures contracts are imperfect correlation between changes in market values of bonds held by the fund and the prices of futures contracts, and the
43
Core Bond Fund
possibility of an illiquid market. Counterparty risk involving futures is mitigated because a regulated clearinghouse is the counterparty instead of the clearing broker. To further mitigate counterparty risk, the fund trades futures contracts on an exchange, monitors the financial strength of its clearing brokers and clearinghouse, and has entered into clearing agreements with its clearing brokers. The clearinghouse imposes initial margin requirements to secure the fund’s performance and requires daily settlement of variation margin representing changes in the market value of each contract. Any assets pledged as initial margin for open contracts are noted in the Statement of Net Assets.
Futures contracts are valued at their quoted daily settlement prices. The notional amounts of the contracts are not recorded in the Statement of Net Assets. Fluctuations in the value of the contracts are recorded in the Statement of Assets and Liabilities as an asset (liability) and in the Statement of Operations as unrealized appreciation (depreciation) until the contracts are closed, when they are recorded as realized futures gains (losses).
During the year ended September 30, 2018, the fund’s average investments in long and short futures contracts represented 17% and 8% of net assets, respectively, based on the average of the notional amounts at each quarter-end during the period.
4. Forward Currency Contracts: The fund enters into forward currency contracts to protect the value of securities and related receivables and payables against changes in future foreign exchange rates. The fund’s risks in using these contracts include movement in the values of the foreign currencies relative to the U.S. dollar and the ability of the counterparties to fulfill their obligations under the contracts. The fund mitigates its counterparty risk by entering into forward currency contracts only with a diverse group of prequalified counterparties, monitoring their financial strength, entering into master netting arrangements with its counterparties, and requiring its counterparties to transfer collateral as security for their performance. In the absence of a default, the collateral pledged or received by the fund cannot be repledged, resold, or rehypothecated. The master netting arrangements provide that, in the event of a counterparty’s default (including bankruptcy), the fund may terminate the forward currency contracts, determine the net amount owed by either party in accordance with its master netting arrangements, and sell or retain any collateral held up to the net amount owed to the fund under the master netting arrangements. The forward currency contracts contain provisions whereby a counterparty may terminate open contracts if the fund’s net assets decline below a certain level, triggering a payment by the fund if the fund is in a net liability position at the time of the termination. The payment amount would be reduced by any collateral the fund has pledged. Any assets pledged as collateral for open contracts are noted in the Statement of Net Assets. The value of collateral received or pledged is compared daily to the value of the forward currency contracts exposure with each counterparty, and any difference, if in excess of a specified minimum transfer amount, is adjusted and settled within two business days.
Forward currency contracts are valued at their quoted daily prices obtained from an independent third party, adjusted for currency risk based on the expiration date of each contract. The notional amounts of the contracts are not recorded in the Statement of Net Assets. Fluctuations in the value of the contracts are recorded in the Statement of Assets and Liabilities as an asset (liability) and in the Statement of Operations as unrealized appreciation (depreciation) until the contracts are closed, when they are recorded as realized forward currency contract gains (losses).
During the year ended September 30, 2018, the fund’s average investment in forward currency contracts represented 4% of net assets, based on the average of notional amounts at each quarter-end during the period.
44
Core Bond Fund
5. Swap Contracts: The fund invests in credit default swaps to adjust the overall credit risk of the fund or to actively overweight or underweight credit risk to a specific issuer or group of issuers. The fund may sell credit protection through credit default swaps to simulate investments in long positions that are either unavailable or considered to be less attractively priced in the bond market. The fund may purchase credit protection through credit default swaps to reduce credit exposure to a given issuer or issuers. Under the terms of the swaps, an up-front payment may be exchanged between the seller and buyer. In addition, the seller of the credit protection receives a periodic payment of premium from the buyer that is a fixed percentage applied to a notional amount. If, for example, the reference entity is subject to a credit event (such as bankruptcy, failure to pay, or obligation acceleration) during the term of the swap, the seller agrees to either physically settle or cash settle the swap contract. If the swap is physically settled, the seller agrees to pay the buyer an amount equal to the notional amount and take delivery of a debt instrument of the reference issuer with a par amount equal to such notional amount. If the swap is cash settled, the seller agrees to pay the buyer the difference between the notional amount and the final price for the relevant debt instrument, as determined either in a market auction or pursuant to a pre-agreed-upon valuation procedure.
The fund enters into interest rate swap transactions to adjust the fund’s sensitivity to changes in interest rates and maintain the ability to generate income at prevailing market rates. Under the terms of the swaps, one party pays the other an amount that is a fixed percentage rate applied to a notional amount. In return, the counterparty agrees to pay a floating rate, which is reset periodically based on short-term interest rates, applied to the same notional amount.
The notional amounts of swap contracts are not recorded in the Statement of Net Assets. Swaps are valued daily based on market quotations received from independent pricing services or recognized dealers and the change in value is recorded in the Statement of Assets and Liabilities as an asset (liability) and in the Statement of Operations as unrealized appreciation (depreciation) until the seller of credit protection is required to take delivery (or, in a cash settled swap, pay the settlement amount determined) upon occurrence of a credit event, periodic payments are made, or the swap terminates, at which time realized gain (loss) is recorded. The net premium to be received or paid by the fund under swap contracts is accrued daily and recorded as realized gain (loss) over the life of the contract.
The primary risk associated with selling credit protection is that, upon the occurrence of a defined credit event, the market value of the debt instrument received by the fund (or, in a cash settled swap, the debt instruments used to determine the settlement payment by the fund) will be significantly less than the amount paid by the fund and, in a physically settled swap, the fund may receive an illiquid debt instrument. A risk associated with all types of swaps is the possibility that a counterparty may default on its obligation to pay net amounts due to the fund. The fund’s maximum amount subject to counterparty risk is the unrealized appreciation on the swap contract. The fund mitigates its counterparty risk by entering into swaps only with a diverse group of prequalified counterparties, monitoring their financial strength, entering into master netting arrangements with its counterparties, and requiring its counterparties to transfer collateral as security for their performance. In the absence of a default, the collateral pledged or received by the fund cannot be repledged, resold, or rehypothecated. In the event of a counterparty’s default (including bankruptcy), the fund may terminate any swap contracts with that counterparty, determine the net amount owed by either party in accordance with its master netting arrangements, and sell or retain any collateral held up to the net amount owed to the fund under the master netting arrangements. The swap contracts contain provisions whereby a counterparty may terminate open contracts if the fund’s net assets
45
Core Bond Fund
decline below a certain level, triggering a payment by the fund if the fund is in a net liability position at the time of the termination. The payment amount would be reduced by any collateral the fund has pledged. Any securities pledged as collateral for open contracts are noted in the Statement of Net Assets. The value of collateral received or pledged is compared daily to the value of the swap contracts exposure with each counterparty, and any difference, if in excess of a specified minimum transfer amount, is adjusted and settled within two business days.
The fund enters into centrally cleared interest rate and credit default swaps to achieve the same objectives specified with respect to the equivalent over-the-counter swaps but with less counterparty risk because a regulated clearinghouse is the counterparty instead of the clearing broker or executing broker. The clearinghouse imposes initial margin requirements to secure the fund’s performance, and requires daily settlement of variation margin representing changes in the market value of each contract. To further mitigate counterparty risk, the fund trades with a diverse group of prequalified executing brokers; monitors the financial strength of its clearing brokers, executing brokers, and clearinghouse; and has entered into agreements with its clearing brokers and executing brokers.
During the year ended September 30, 2018, the fund’s average amounts of investments in credit protection sold and credit protection purchased represented 1% and 4% of net assets, respectively, based on the average of notional amounts at each quarter-end during the period. The average amount of investments in interest rate swaps represented 2% of net assets, based on the average of notional amounts at each quarter-end during the period.
6. Options: The fund invests in options contracts on futures and swaps to adjust its exposure to the underlying investments. The primary risk associated with purchasing options is that the value of the underlying investments may move in such a way that the option is out-of-the-money (the exercise price of the option exceeds the value of the underlying investment), the position is worthless at expiration, and the fund loses the premium paid. The primary risk associated with selling options is that the value of the underlying investments may move in such a way that the option is in-the-money (the exercise price of the option exceeds the value of the underlying investment), the counterparty exercises the option, and the fund loses an amount equal to the market value of the option written less the premium received.
The fund invests in options on futures, which are exchange-traded. Counterparty risk involving exchange-traded options on futures is mitigated because a regulated clearinghouse is the counterparty instead of the clearing broker. To further mitigate counterparty risk, the fund trades options on futures on an exchange, monitors the financial strength of its clearing brokers and clearinghouses, and has entered into clearing agreements with its clearing brokers.
The fund invests in options on swaps (swaptions), which are transacted over-the-counter (OTC) and not on an exchange. A receiver swaption gives the owner the right to receive the total return of a specified asset, reference rate, or index. A payer swaption gives the owner the right to pay the total return of a specified asset, reference rate, or index. Swaptions also include options that allow an existing swap to be terminated or extended by one of the counterparties. Unlike exchange-traded options, which are standardized with respect to the underlying instrument, expiration date, contract size, and strike price, the terms of OTC options generally are established through negotiation with the other party to the option contract. Although this type of arrangement allows the purchaser or writer greater flexibility to tailor an option to its needs, OTC options generally involve greater credit risk than exchange-traded options. Credit risk involves the possibility that a counterparty may default
46
Core Bond Fund
on its obligation to pay net amounts due to the fund. The fund mitigates its counterparty risk by entering into swaptions with a diverse group of prequalified counterparties and monitoring their financial strength.
Options on futures contracts are valued at their quoted daily settlement prices. Swaptions are valued daily based on market quotations received from independent pricing services or recognized dealers. The premium paid for a purchased option is recorded in the Statement of Assets and Liabilities as an asset that is subsequently adjusted daily to the current market value of the option purchased. The premium received for a written option is recorded in the Statement of Assets and Liabilities as an asset with an equal liability that is subsequently adjusted daily to the current market value of the option written. Fluctuations in the value of the options are recorded in the Statement of Operations as unrealized appreciation (depreciation) until expired, closed, or exercised, at which time realized gains (losses) are recognized.
During the year ended September 30, 2018, the fund’s average value of options purchased and options written each represented less than 1% of net assets, based on the average market values at each quarter-end during the period.
7. To Be Announced (TBA) Transactions: A TBA transaction is an agreement to buy or sell mortgage-backed securities with agreed-upon characteristics (face amount, coupon, maturity) for settlement at a future date. The fund may be a seller of TBA transactions to reduce its exposure to the mortgage-backed securities market or in order to sell mortgage-backed securities it owns under delayed-delivery arrangements. When the fund is a buyer of TBA transactions, it maintains cash or short-term investments in an amount sufficient to meet the purchase price at the settlement date of the TBA transaction. The primary risk associated with TBA transactions is that a counterparty may default on its obligations. The fund mitigates its counterparty risk by, among other things, performing a credit analysis of counterparties, allocating transactions among numerous counterparties, and monitoring its exposure to each counterparty. The fund may also enter into a Master Securities Forward Transaction Agreement (MSFTA) with certain counterparties and require them to transfer collateral as security for their performance. In the absence of a default, the collateral pledged or received by the fund cannot be repledged, resold, or rehypothecated. Under an MSFTA, upon a counterparty default (including bankruptcy), the fund may terminate any TBA transactions with that counterparty, determine the net amount owed by either party in accordance with its master netting arrangements, and sell or retain any collateral held up to the net amount owed to the fund under the master netting arrangements.
8. Mortgage Dollar Rolls: The fund enters into mortgage-dollar-roll transactions, in which the fund sells mortgage-backed securities to a dealer and simultaneously agrees to purchase similar securities in the future at a predetermined price. The proceeds of the securities sold in mortgage-dollar-roll transactions are typically invested in high-quality short-term fixed income securities. The fund forgoes principal and interest paid on the securities sold, and is compensated by interest earned on the proceeds of the sale and by a lower price on the securities to be repurchased. The fund has also entered into mortgage-dollar-roll transactions in which the fund buys mortgage-backed securities from a dealer pursuant to a TBA transaction and simultaneously agrees to sell similar securities in the future at a predetermined price. The securities bought in mortgage-dollar-roll transactions are used to cover an open TBA sell position. The fund continues to earn interest on mortgage-backed security pools already held and receives a lower price on the securities to be sold in the future. The fund accounts for mortgage-dollar-roll transactions as purchases and sales; as such, these transactions
47
Core Bond Fund
may increase the fund’s portfolio turnover rate. Amounts to be received or paid in connection with open mortgage dollar rolls are included in Receivables for Investment Securities Sold or Payables for Investment Securities Purchased in the Statement of Assets and Liabilities.
9. Federal Income Taxes: The fund intends to continue to qualify as a regulated investment company and distribute all of its taxable income. Management has analyzed the fund’s tax positions taken for all open federal income tax years (September 30, 2016–2018), and has concluded that no provision for federal income tax is required in the fund’s financial statements.
10. Distributions: Distributions to shareholders are recorded on the ex-dividend date. Distributions are determined on a tax basis and may differ from net investment income and realized capital gains for financial reporting purposes.
11. Credit Facility: The fund and certain other funds managed by The Vanguard Group (“Vanguard”) participate in a $3.1 billion committed credit facility provided by a syndicate of lenders pursuant to a credit agreement that may be renewed annually; each fund is individually liable for its borrowings, if any, under the credit facility. Borrowings may be utilized for temporary and emergency purposes, and are subject to the fund’s regulatory and contractual borrowing restrictions. The participating funds are charged administrative fees and an annual commitment fee of 0.10% of the undrawn amount of the facility; these fees are allocated to the funds based on a method approved by the fund’s board of trustees and included in Management and Administrative expenses on the fund’s Statement of Operations. Any borrowings under this facility bear interest at a rate based upon the higher of the one-month London Interbank Offered Rate, federal funds effective rate, or overnight bank funding rate plus an agreed-upon spread.
The fund had no borrowings outstanding at September 30, 2018, or at any time during the period then ended.
12. Other: Interest income includes income distributions received from Vanguard Market Liquidity Fund and is accrued daily. Premiums and discounts on debt securities purchased are amortized and accreted, respectively, to interest income over the lives of the respective securities. Security transactions are accounted for on the date securities are bought or sold. Costs used to determine realized gains (losses) on the sale of investment securities are those of the specific securities sold.
Each class of shares has equal rights as to assets and earnings, except that each class separately bears certain class-specific expenses related to maintenance of shareholder accounts (included in Management and Administrative expenses), shareholder reporting, and the proxy. Marketing and distribution expenses are allocated to each class of shares based on a method approved by the board of trustees. Income, other non-class-specific expenses, and gains and losses on investments are allocated to each class of shares based on its relative net assets.
B. In accordance with the terms of a Funds’ Service Agreement (the “FSA”) between Vanguard and the fund, Vanguard furnishes to the fund investment advisory, corporate management, administrative, marketing, and distribution services at Vanguard’s cost of operations (as defined by the FSA). These costs of operations are allocated to the fund based on methods and guidelines approved by the board of trustees. Vanguard does not require reimbursement in the current period for certain costs of operations (such as deferred compensation/benefits and risk/insurance costs); the fund’s liability for these costs of operations is included in Payables to Vanguard on the Statement of Net Assets. All other costs of operations payable to Vanguard are generally settled twice a month.
48
Core Bond Fund
Upon the request of Vanguard, the fund may invest up to 0.40% of its net assets as capital in Vanguard. At September 30, 2018, the fund had contributed to Vanguard capital in the amount of $50,000, representing 0.01% of the fund’s net assets and 0.02% of Vanguard’s capitalization. The fund’s trustees and officers are also directors and employees, respectively, of Vanguard.
C. Various inputs may be used to determine the value of the fund’s investments. These inputs are summarized in three broad levels for financial statement purposes. The inputs or methodologies used to value securities are not necessarily an indication of the risk associated with investing in those securities.
Level 1—Quoted prices in active markets for identical securities.
Level 2—Other significant observable inputs (including quoted prices for similar securities, interest rates, prepayment speeds, credit risk, etc.).
Level 3—Significant unobservable inputs (including the fund’s own assumptions used to determine the fair value of investments). Any investments valued with significant unobservable inputs are noted on the Statement of Net Assets.
The following table summarizes the market value of the fund’s investments as of September 30, 2018, based on the inputs used to value them:
| | | |
| | Level 1 | Level 2 | Level 3 |
| Investments | ($000) | ($000) | ($000) |
| U.S. Government and Agency Obligations | — | 457,973 | — |
| Asset-Backed/Commercial Mortgage-Backed Securities | — | 134,922 | — |
| Corporate Bonds | — | 240,829 | — |
| Sovereign Bonds | — | 71,306 | — |
| Taxable Municipal Bonds | — | 1,323 | — |
| Temporary Cash Investments | 61,577 | 624 | — |
| Options Purchased | 2 | — | — |
| Options Written | (92) | (15) | — |
| Futures Contracts—Assets1 | 24 | — | — |
| Futures Contracts—Liabilities1 | (178) | — | — |
| Forward Currency Contracts—Assets | — | 631 | — |
| Forward Currency Contracts—Liabilities | — | (213) | — |
| Swap Contracts—Assets | 31 | 47 | — |
| Swap Contracts—Liabilities | (1)1 | (148) | — |
| Total | 61,335 | 907,279 | — |
| 1 Represents variation margin on the last day of the reporting period. | | | |
49
Core Bond Fund
D. At September 30, 2018, the fair values of derivatives were reflected in the Statement of Assets and Liabilities as follows:
| | | | |
| Interest Rate | Currency | Credit | |
| | Contracts | Contracts | Contracts | Total |
| Statement of Assets and Liabilities Caption | ($000) | ($000) | ($000) | ($000) |
| Options Purchased | 2 | — | — | 2 |
| Variation Margin Receivable—Futures Contracts | 24 | — | — | 24 |
| Variation Margin Receivable—CC Swap Contracts | 3 | — | — | 3 |
| Unrealized Appreciation—Forwards Contracts | — | 631 | — | 631 |
| Unrealized Appreciation—OTC Swap Contracts | — | — | 47 | 47 |
| Total Assets | 29 | 631 | 47 | 707 |
| |
| Options Written | (92) | — | (15) | (107) |
| Variation Margin Payable—Futures Contracts | (178) | — | — | (178) |
| Variation Margin Payable—CC Swap Contracts | — | — | (1) | (1) |
| Unrealized Depreciation—Forwards Contracts | — | (213) | — | (213) |
| Unrealized Depreciation—OTC Swap Contracts | — | — | (148) | (148) |
| Total Liabilities | (270) | (213) | (164) | (647) |
Realized net gain (loss) and the change in unrealized appreciation (depreciation) on derivatives for the year ended September 30, 2018, were:
| | | | |
| | Interest Rate | Currency | Credit | |
| | Contracts | Contracts | Contracts | Total |
| Realized Net Gain (Loss) on Derivatives | ($000) | ($000) | ($000) | ($000) |
| Futures Contracts | (2,314) | — | — | (2,314) |
| Options Purchased | (120) | — | (22) | (142) |
| Options Written | 109 | — | 99 | 208 |
| Forward Currency Contracts | — | 861 | — | 861 |
| Swap Contracts | (280) | — | 27 | (253) |
| Realized Net Gain (Loss) on Derivatives | (2,605) | 861 | 104 | (1,640) |
| |
| Change in Unrealized Appreciation (Depreciation) on Derivatives | | | |
| Futures Contracts | (1,785) | — | — | (1,785) |
| Options Purchased | 3 | — | 1 | 4 |
| Options Written | 13 | — | (2) | 11 |
| Forward Currency Contracts | — | 132 | — | 132 |
| Swap Contracts | (5) | — | 154 | 149 |
| Change in Unrealized Appreciation | | | | |
| (Depreciation) on Derivatives | (1,774) | 132 | 153 | (1,489) |
50
Core Bond Fund
E. Permanent differences between book-basis and tax-basis components of net assets are reclassified among capital accounts in the financial statements to reflect their tax character. These reclassifications have no effect on net assets or net asset value per share. As of period end, the following permanent differences primarily attributable to the accounting for foreign currency transactions and swap agreements were reclassified to the following accounts:
| |
| | Amount |
| | ($000) |
| Paid-in Capital | — |
| Undistributed (Overdistributed) Net Investment Income | 1,379 |
| Accumulated Net Realized Gains (Losses) | (1,379) |
Temporary differences between book-basis and tax-basis components of accumulated net earnings (losses) arise when certain items of income, gain, or loss are recognized in different periods for financial statement and tax purposes; these differences will reverse at some time in the future. The differences are primarily related to the tax deferral of losses on wash sales; the realization of unrealized gains or losses on certain futures contracts, forward currency contracts, and options and payables for distributions. As of period end, the tax-basis components of accumulated net earnings (losses) are detailed in the table as follows:
| |
| | Amount |
| | ($000) |
| Undistributed Ordinary Income | 570 |
| Undistributed Long-Term Gains | — |
| Capital Loss Carryforwards (Non-expiring) | (22,525) |
| Net Unrealized Gains (Losses) | (22,713) |
As of September 30, 2018, gross unrealized appreciation and depreciation for investments and derivatives based on cost for U.S. federal income tax purposes were as follows:
| |
| | Amount |
| | ($000) |
| Tax Cost | 990,815 |
| Gross Unrealized Appreciation | 1,435 |
| Gross Unrealized Depreciation | (24,165) |
| Net Unrealized Appreciation (Depreciation) | (22,730) |
F. During the year ended September 30, 2018, the fund purchased $923,296,000 of investment securities and sold $851,966,000 of investment securities, other than U.S. government securities and temporary cash investments. Purchases and sales of U.S. government securities were $1,448,692,000 and $1,556,577,000, respectively.
51
Core Bond Fund
| | | | |
| G. Capital share transactions for each class of shares were: | | | |
| | | | Year Ended September 30, |
| | | 2018 | | 2017 |
| | Amount | Shares | Amount | Shares |
| | ($000) | (000) | ($000) | (000) |
| Investor Shares | | | | |
| Issued | 51,084 | 5,197 | 78,467 | 7,878 |
| Issued in Lieu of Cash Distributions | 2,243 | 230 | 1,647 | 166 |
| Redeemed | (60,352) | (6,161) | (52,731) | (5,298) |
| Net Increase (Decrease)—Investor Shares | (7,025) | (734) | 27,383 | 2,746 |
| Admiral Shares | | | | |
| Issued | 414,173 | 21,169 | 451,536 | 22,676 |
| Issued in Lieu of Cash Distributions | 21,820 | 1,120 | 14,233 | 719 |
| Redeemed | (288,396) | (14,775) | (235,815) | (11,869) |
| Net Increase (Decrease)—Admiral Shares | 147,597 | 7,514 | 229,954 | 11,526 |
At September 30, 2018, one shareholder was the record or beneficial owner of 26% of the fund’s net assets. If the shareholder were to redeem its investment in the fund, the redemption might result in an increase in the fund’s expense ratio, cause the fund to incur higher transaction costs, or lead to the realization of taxable capital gains.
H. Management has determined that no events or transactions occurred subsequent to September 30, 2018, that would require recognition or disclosure in these financial statements.
52
Report of Independent Registered Public Accounting Firm
To the Board of Trustees of Vanguard Malvern Funds and Shareholders of Vanguard Core Bond Fund
Opinion on the Financial Statements
We have audited the accompanying statement of net assets and statement of assets and liabilities of Vanguard Core Bond Fund (one of the funds constituting Vanguard Malvern Funds, referred to hereafter as the “Fund”) as of September 30, 2018, the related statement of operations for the year ended September 30, 2018, the statement of changes in net assets for each of the two years in the period ended September 30, 2018, including the related notes, and the financial highlights for each of the periods indicated therein (collectively referred to as the “financial statements”). In our opinion, the financial statements present fairly, in all material respects, the financial position of the Fund as of September 30, 2018, the results of its operations for the year then ended, the changes in its net assets for each of the two years in the period ended September 30, 2018 and the financial highlights for each of the periods indicated therein in conformity with accounting principles generally accepted in the United States of America.
Basis for Opinion
These financial statements are the responsibility of the Fund’s management. Our responsibility is to express an opinion on the Fund’s financial statements based on our audits. We are a public accounting firm registered with the Public Company Accounting Oversight Board (United States) (“PCAOB”) and are required to be independent with respect to the Fund in accordance with the U.S. federal securities laws and the applicable rules and regulations of the Securities and Exchange Commission and the PCAOB.
We conducted our audits of these financial statements in accordance with the standards of the PCAOB. Those standards require that we plan and perform the audit to obtain reasonable assurance about whether the financial statements are free of material misstatement, whether due to error or fraud.
Our audits included performing procedures to assess the risks of material misstatement of the financial statements, whether due to error or fraud, and performing procedures that respond to those risks. Such procedures included examining, on a test basis, evidence regarding the amounts and disclosures in the financial statements. Our audits also included evaluating the accounting principles used and significant estimates made by management, as well as evaluating the overall presentation of the financial statements. Our procedures included confirmation of securities owned as of September 30, 2018 by correspondence with the custodians and brokers and by agreement to the underlying ownership records of the transfer agent; when replies were not received from brokers, we performed other auditing procedures. We believe that our audits provide a reasonable basis for our opinion.
/s/PricewaterhouseCoopers LLP
Philadelphia, Pennsylvania
November 15, 2018
We have served as the auditor of one or more investment companies in The Vanguard Group of Funds since 1975.
53
Special 2018 tax information (unaudited) for Vanguard Core Bond Fund
This information for the fiscal year ended September 30, 2018, is included pursuant to provisions of the Internal Revenue Code.
For nonresident alien shareholders, 100% of short-term capital gain dividends distributed by the fund are qualified short-term capital gains.
For nonresident alien shareholders, 75.4% of income dividends are interest-related dividends.
54
About Your Fund’s Expenses
As a shareholder of the fund, you incur ongoing costs, which include costs for portfolio management, administrative services, and shareholder reports (like this one), among others. Operating expenses, which are deducted from a fund’s gross income, directly reduce the investment return of the fund.
A fund’s expenses are expressed as a percentage of its average net assets. This figure is known as the expense ratio. The following examples are intended to help you understand the ongoing costs (in dollars) of investing in your fund and to compare these costs with those of other mutual funds. The examples are based on an investment of $1,000 made at the beginning of the period shown and held for the entire period.
The accompanying table illustrates your fund’s costs in two ways:
• Based on actual fund return. This section helps you to estimate the actual expenses that you paid over the period. The ”Ending Account Value“ shown is derived from the fund‘s actual return, and the third column shows the dollar amount that would have been paid by an investor who started with $1,000 in the fund. You may use the information here, together with the amount you invested, to estimate the expenses that you paid over the period.
To do so, simply divide your account value by $1,000 (for example, an $8,600 account value divided by $1,000 = 8.6), then multiply the result by the number given for your fund under the heading ”Expenses Paid During Period.“
• Based on hypothetical 5% yearly return. This section is intended to help you compare your fund‘s costs with those of other mutual funds. It assumes that the fund had a yearly return of 5% before expenses, but that the expense ratio is unchanged. In this case—because the return used is not the fund’s actual return—the results do not apply to your investment. The example is useful in making comparisons because the Securities and Exchange Commission requires all mutual funds to calculate expenses based on a 5% return. You can assess your fund’s costs by comparing this hypothetical example with the hypothetical examples that appear in shareholder reports of other funds.
Note that the expenses shown in the table are meant to highlight and help you compare ongoing costs only and do not reflect transaction costs incurred by the fund for buying and selling securities. Further, the expenses do not include any purchase, redemption, or account service fees described in the fund prospectus. If such fees were applied to your account, your costs would be higher. Your fund does not carry a “sales load.”
The calculations assume no shares were bought or sold during the period. Your actual costs may have been higher or lower, depending on the amount of your investment and the timing of any purchases or redemptions.
You can find more information about the fund’s expenses, including annual expense ratios, in the Financial Statements section of this report. For additional information on operating expenses and other shareholder costs, please refer to your fund’s current prospectus.
55
| | | |
| Six Months Ended September 30, 2018 | | | |
| | Beginning | Ending | Expenses |
| | Account Value | Account Value | Paid During |
| Core Bond Fund | 3/31/2018 | 9/30/2018 | Period |
| Based on Actual Fund Return | | | |
| Investor Shares | $1,000.00 | $999.32 | $1.25 |
| Admiral Shares | 1,000.00 | 1,000.01 | 0.60 |
| Based on Hypothetical 5% Yearly Return | | | |
| Investor Shares | $1,000.00 | $1,023.82 | $1.27 |
| Admiral Shares | 1,000.00 | 1,024.47 | 0.61 |
The calculations are based on expenses incurred in the most recent six-month period. The fund’s annualized six-month expense ratios for that period are 0.25% for Investor Shares and 0.12% for Admiral Shares. The dollar amounts shown as “Expenses Paid” are equal to the annualized expense ratio multiplied by the average account value over the period, multiplied by the number of days in the most recent six-month period, then divided by the number of days in the most recent 12-month period (183/365).
56
Glossary
30-Day SEC Yield. A fund’s 30-day SEC yield is derived using a formula specified by the U.S. Securities and Exchange Commission. Under the formula, data related to the fund’s security holdings in the previous 30 days are used to calculate the fund’s hypothetical net income for that period, which is then annualized and divided by the fund’s estimated average net assets over the calculation period. For the purposes of this calculation, a security’s income is based on its current market yield to maturity (for bonds), its actual income (for asset-backed securities), or its projected dividend yield (for stocks). Because the SEC yield represents hypothetical annualized income, it will differ—at times significantly—from the fund’s actual experience. As a result, the fund’s income distributions may be higher or lower than implied by the SEC yield.
Average Coupon. The average interest rate paid on the fixed income securities held by a fund. It is expressed as a percentage of face value.
Average Duration. An estimate of how much the value of the bonds held by a fund will fluctuate in response to a change in interest rates. To see how the value could change, multiply the average duration by the change in rates. If interest rates rise by 1 percentage point, the value of the bonds in a fund with an average duration of five years would decline by about 5%. If rates decrease by a percentage point, the value would rise by 5%.
Average Effective Maturity. The average length of time until fixed income securities held by a fund reach maturity and are repaid, taking into consideration the possibility that the issuer may call the bond before its maturity date. The figure reflects the proportion of fund assets represented by each security; it also reflects any futures contracts held. In general, the longer the average effective maturity, the more a fund’s share price will fluctuate in response to changes in market interest rates.
Credit Quality. Credit-quality ratings are measured on a scale that generally ranges from AAA (highest) to D (lowest). U.S. Treasury, U.S. Agency, and U.S. Agency mortgage-backed securities appear under “U.S. Government.” Credit-quality ratings are obtained from Moody’s and S&P, and the higher rating for each issue is shown. ”Not Rated” is used to classify securities for which a rating is not available. Not rated securities include a fund’s investment in Vanguard Market Liquidity Fund or Vanguard Municipal Cash Management Fund, each of which invests in high-quality money market instruments and may serve as a cash management vehicle for the Vanguard funds, trusts, and accounts.
Expense Ratio. A fund’s total annual operating expenses expressed as a percentage of the fund’s average net assets. The expense ratio includes management and administrative expenses, but does not include the transaction costs of buying and selling portfolio securities.
Inception Date. The date on which the assets of a fund (or one of its share classes) are first invested in accordance with the fund’s investment objective. For funds with a subscription period, the inception date is the day after that period ends. Investment performance is measured from the inception date.
Short-Term Reserves. The percentage of a fund invested in highly liquid, short-term securities that can be readily converted to cash.
Yield to Maturity. The rate of return an investor would receive if the fixed income securities held by a fund were held to their maturity dates.
57
BLOOMBERG is a trademark and service mark of Bloomberg Finance L.P. BARCLAYS is a trademark and service mark of Barclays Bank Plc, used under license. Bloomberg Finance L.P. and its affiliates, including Bloomberg Index Services Limited (BISL) (collectively, Bloomberg), or Bloomberg’s licensors, own all proprietary rights in the Bloomberg Barclays U.S. Aggregate Float Adjusted Index (Index or Bloomberg Barclays Index).
Neither Barclays Bank Plc, Barclays Capital Inc., or any affiliate (collectively Barclays) or Bloomberg is the issuer or producer of the Core Bond Fund and neither Bloomberg nor Barclays has any responsibilities, obligations or duties to investors in the Core Bond Fund. The Index is licensed for use by The Vanguard Group, Inc. (Vanguard) as the sponsor of the Core Bond Fund. Bloomberg and Barclays’ only relationship with Vanguard in respect of the Index is the licensing of the Index, which is determined, composed and calculated by BISL, or any successor thereto, without regard to the Issuer or the Core Bond Fund or the owners of the Core Bond Fund.
Additionally, Vanguard may for itself execute transaction(s) with Barclays in or relating to the Index in connection with the Core Bond Fund. Investors acquire the Core Bond Fund from Vanguard and investors neither acquire any interest in the Index nor enter into any relationship of any kind whatsoever with Bloomberg or Barclays upon making an investment in the Core Bond Fund. The Core Bond Fund is not sponsored, endorsed, sold or promoted by Bloomberg or Barclays. Neither Bloomberg nor Barclays makes any representation or warranty, express or implied regarding the advisability of investing in the Core Bond Fund or the advisability of investing in securities generally or the ability of the Index to track corresponding or relative market performance. Neither Bloomberg nor Barclays has passed on the legality or suitability of the Core Bond Fund with respect to any person or entity. Neither Bloomberg nor Barclays is responsible for and has not participated in the determination of the timing of, prices at, or quantities of the Core Bond Fund to be issued. Neither Bloomberg nor Barclays has any obligation to take the needs of the Issuer or the owners of the Core Bond Fund or any other third party into consideration in determining, composing or calculating the Index. Neither Bloomberg nor Barclays has any obligation or liability in connection with administration, marketing or trading of the Core Bond Fund.
The licensing agreement between Bloomberg and Barclays is solely for the benefit of Bloomberg and Barclays and not for the benefit of the owners of the Core Bond Fund, investors or other third parties. In addition, the licensing agreement between Vanguard and Bloomberg is solely for the benefit of Vanguard and Bloomberg and not for the benefit of the owners of the Core Bond Fund, investors or other third parties.
NEITHER BLOOMBERG NOR BARCLAYS SHALL HAVE ANY LIABILITY TO THE ISSUER, INVESTORS OR TO OTHER THIRD PARTIES FOR THE QUALITY, ACCURACY AND/OR COMPLETENESS OF THE BLOOMBERG BARCLAYS INDEX OR ANY DATA INCLUDED THEREIN OR FOR INTERRUPTIONS IN THE DELIVERY OF THE BLOOMBERG BARCLAYS INDEX. NEITHER BLOOMBERG NOR BARCLAYS MAKES ANY WARRANTY, EXPRESS OR IMPLIED, AS TO RESULTS TO BE OBTAINED BY THE ISSUER, THE INVESTORS OR ANY OTHER PERSON OR ENTITY FROM THE USE OF THE BLOOMBERG BARCLAYS INDEX OR ANY DATA INCLUDED THEREIN. NEITHER BLOOMBERG NOR BARCLAYS MAKES ANY EXPRESS OR IMPLIED WARRANTIES, AND EACH HEREBY EXPRESSLY DISCLAIMS ALL WARRANTIES OF MERCHANTABILITY OR FITNESS FOR A PARTICULAR PURPOSE OR USE WITH RESPECT TO THE BLOOMBERG BARCLAYS INDEX OR ANY DATA INCLUDED THEREIN. BLOOMBERG RESERVES THE RIGHT TO CHANGE THE METHODS OF CALCULATION OR PUBLICATION, OR TO CEASE THE CALCULATION OR PUBLICATION OF THE BLOOMBERG BARCLAYS INDEX, AND NEITHER BLOOMBERG
NOR BARCLAYS SHALL BE LIABLE FOR ANY MISCALCULATION OF OR ANY INCORRECT, DELAYED OR INTERRUPTED PUBLICATION WITH RESPECT TO THE BLOOMBERG BARCLAYS INDEX. NEITHER BLOOMBERG NOR BARCLAYS SHALL BE LIABLE FOR ANY DAMAGES, INCLUDING, WITHOUT LIMITATION, ANY SPECIAL, INDIRECT OR CONSEQUENTIAL DAMAGES, OR ANY LOST PROFITS AND EVEN IF ADVISED OF THE POSSIBILITY OF SUCH, RESULTING FROM THE USE OF THE BLOOMBERG BARCLAYS INDEX OR ANY DATA INCLUDED THEREIN OR WITH RESPECT TO THE CORE BOND FUND.
None of the information supplied by Bloomberg or Barclays and used in this publication may be reproduced in any manner without the prior written permission of both Bloomberg and Barclays Capital, the investment banking division of Barclays Bank Plc. Barclays Bank Plc is registered in England No. 1026167. Registered office 1 Churchill Place London E14 5HP.
© 2018 Bloomberg. Used with Permission.
Source: Bloomberg Index Services Limited. Copyright 2018, Bloomberg. All rights reserved.
58
The People Who Govern Your Fund
The trustees of your mutual fund are there to see that the fund is operated and managed in your best interests since, as a shareholder, you are a part owner of the fund. Your fund’s trustees also serve on the board of directors of The Vanguard Group, Inc., which is owned by the Vanguard funds and provides services to them on an at-cost basis.
A majority of Vanguard’s board members are independent, meaning that they have no affiliation with Vanguard or the funds they oversee, apart from the sizable personal investments they have made as private individuals. The independent board members have distinguished backgrounds in business, academia, and public service. Each of the trustees and executive officers oversees 211 Vanguard funds.
Information for each trustee and executive officer of the fund appears below. The mailing address of the trustees and officers is P.O. Box 876, Valley Forge, PA 19482. More information about the trustees is in the Statement of Additional Information, which can be obtained, without charge, by contacting Vanguard at 800-662-7447, or online at vanguard.com.
Interested Trustees1
F. William McNabb III
Born in 1957. Trustee since July 2009. Principal occupation(s) during the past five years and other experience: chairman of the board (January 2010–present) of Vanguard and of each of the investment companies served by Vanguard, trustee (2009–present) of each of the investment companies served by Vanguard, and director (2008–present) of Vanguard. Chief executive officer and president (2008–2017) of Vanguard and each of the investment companies served by Vanguard, managing director (1995–2008) of Vanguard, and director (1997–2018) of Vanguard Marketing Corporation. Director (2018–present) of UnitedHealth Group.
Mortimer J. Buckley
Born in 1969. Trustee since January 2018. Principal occupation(s) during the past five years and other experience: chief executive officer (January 2018–present) of Vanguard; chief executive officer, president, and trustee (January 2018–present) of each of the investment companies served by Vanguard; president and director (2017–present) of Vanguard; and president (February 2018–present) of Vanguard Marketing Corporation. Chief investment officer (2013–2017), managing director (2002–2017), head of the Retail Investor Group (2006–2012), and chief information officer (2001–2006) of Vanguard. Chairman of the board (2011–2017) of the Children’s Hospital of Philadelphia.
Independent Trustees
Emerson U. Fullwood
Born in 1948. Trustee since January 2008. Principal occupation(s) during the past five years and other experience: executive chief staff and marketing officer for North America and corporate vice president (retired 2008) of Xerox Corporation (document management products and services). Former president of the Worldwide Channels Group, Latin America, and Worldwide Customer Service and executive chief staff officer of Developing Markets of Xerox. Executive in residence and 2009–2010 Distinguished Minett Professor at the Rochester Institute of Technology. Lead director of SPX FLOW, Inc. (multi-industry manufacturing). Director of the University of Rochester Medical Center, the Monroe Community College Foundation, the United Way of Rochester, North Carolina A&T University, and Roberts Wesleyan College. Trustee of the University of Rochester.
Amy Gutmann
Born in 1949. Trustee since June 2006. Principal occupation(s) during the past five years and other experience: president (2004–present) of the University of Pennsylvania. Christopher H. Browne Distinguished Professor of Political Science, School of Arts and Sciences, and professor of communication, Annenberg School for Communication, with secondary faculty appointments in the Department of Philosophy, School of Arts and Sciences, and at the Graduate School of Education, University of Pennsylvania. Trustee of the National Constitution Center.
1 Mr. McNabb and Mr. Buckley are considered “interested persons,” as defined in the Investment Company Act of 1940, because they are officers of the Vanguard funds.
JoAnn Heffernan Heisen
Born in 1950. Trustee since July 1998. Principal occupation(s) during the past five years and other experience: corporate vice president of Johnson & Johnson (pharmaceuticals/medical devices/consumer products) and member of its executive committee (1997–2008). Chief global diversity officer (retired 2008), vice president and chief information officer (1997–2006), controller (1995–1997), treasurer (1991–1995), and assistant treasurer (1989–1991) of Johnson & Johnson. Director of Skytop Lodge Corporation (hotels) and the Robert Wood Johnson Foundation. Member of the advisory board of the Institute for Women’s Leadership at Rutgers University.
F. Joseph Loughrey
Born in 1949. Trustee since October 2009. Principal occupation(s) during the past five years and other experience: president and chief operating officer (retired 2009) and vice chairman of the board (2008–2009) of Cummins Inc. (industrial machinery). Chairman of the board of Hillenbrand, Inc. (specialized consumer services), Oxfam America, and the Lumina Foundation for Education. Director of the V Foundation for Cancer Research. Member of the advisory council for the College of Arts and Letters and chair of the advisory board to the Kellogg Institute for International Studies, both at the University of Notre Dame.
Mark Loughridge
Born in 1953. Trustee since March 2012. Principal occupation(s) during the past five years and other experience: senior vice president and chief financial officer (retired 2013) of IBM (information technology services). Fiduciary member of IBM’s Retirement Plan Committee (2004–2013), senior vice president and general manager (2002–2004) of IBM Global Financing, vice president and controller (1998–2002) of IBM, and a variety of other prior management roles at IBM. Member of the Council on Chicago Booth.
Scott C. Malpass
Born in 1962. Trustee since March 2012. Principal occupation(s) during the past five years and other experience: chief investment officer (1989–present) and vice president (1996–present) of the University of Notre Dame. Assistant professor of finance at the Mendoza College of Business, University of Notre Dame, and member of the Notre Dame 403(b) Investment Committee. Chairman of the board of TIFF Advisory Services, Inc. Member of the board of Catholic Investment Services, Inc. (investment advisors), the board of advisors for Spruceview Capital Partners, and the board of superintendence of the Institute for the Works of Religion.
Deanna Mulligan
Born in 1963. Trustee since January 2018. Principal occupation(s) during the past five years and other experience: president (2010–present) and chief executive officer (2011–present) of The Guardian Life Insurance Company of America. Chief operating officer (2010–2011) and executive vice president (2008–2010) of Individual Life and Disability of The Guardian Life Insurance Company of America. Member of the board of The Guardian Life Insurance Company of America, the American Council of Life Insurers, the Partnership for New York City (business leadership), and the Committee Encouraging Corporate Philanthropy. Trustee of the Economic Club of New York and the Bruce Museum (arts and science). Member of the Advisory Council for the Stanford Graduate School of Business.
André F. Perold
Born in 1952. Trustee since December 2004. Principal occupation(s) during the past five years and other experience: George Gund Professor of Finance and Banking, Emeritus at the Harvard Business School (retired 2011). Chief investment officer and co-managing partner of HighVista Strategies LLC (private investment firm). Overseer of the Museum of Fine Arts Boston.
Sarah Bloom Raskin
Born in 1961. Trustee since January 2018. Principal occupation(s) during the past five years and other experience: deputy secretary (2014–2017) of the United States Department of the Treasury. Governor (2010–2014) of the Federal Reserve Board. Commissioner (2007–2010) of financial regulation for the State of Maryland. Member of the board of directors (2012–2014) of Neighborhood Reinvestment Corporation. Director of i(x) Investments, LLC.
Peter F. Volanakis
Born in 1955. Trustee since July 2009. Principal occupation(s) during the past five years and other experience: president and chief operating officer (retired 2010) of Corning Incorporated (communications equipment) and director of Corning Incorporated (2000–2010) and Dow Corning (2001–2010). Director (2012) of SPX Corporation (multi-industry manufacturing). Overseer of the Amos Tuck School of Business Administration, Dartmouth College (2001–2013). Chairman of the board of trustees of Colby-Sawyer College. Member of the Board of Hypertherm Inc. (industrial cutting systems, software, and consumables).
Executive Officers
Glenn Booraem
Born in 1967. Principal occupation(s) during the past five years and other experience: principal of Vanguard. Investment stewardship officer (2017–present), treasurer (2015–2017), controller (2010–2015), and assistant controller (2001–2010) of each of the investment companies served by Vanguard.
Christine M. Buchanan
Born in 1970. Principal occupation(s) during the past five years and other experience: principal of Vanguard and global head of Fund Administration at Vanguard. Treasurer (2017–present) of each of the investment companies served by Vanguard. Partner (2005–2017) at KPMG LLP (audit, tax, and advisory services).
Brian Dvorak
Born in 1973. Principal occupation(s) during the past five years and other experience: principal of Vanguard. Chief compliance officer (2017–present) of Vanguard and each of the investment companies served by Vanguard. Assistant vice president (2017–present) of Vanguard Marketing Corporation. Vice president and director of Enterprise Risk Management (2011–2013) at Oppenheimer Funds, Inc.
Thomas J. Higgins
Born in 1957. Principal occupation(s) during the past five years and other experience: principal of Vanguard. Chief financial officer (2008–present) and treasurer (1998–2008) of each of the investment companies served by Vanguard.
Peter Mahoney
Born in 1974. Principal occupation(s) during the past five years and other experience: principal of Vanguard. Controller (2015–present) of each of the investment companies served by Vanguard. Head of International Fund Services (2008–2014) at Vanguard.
Anne E. Robinson
Born in 1970. Principal occupation(s) during the past five years and other experience: general counsel (2016–present) of Vanguard. Secretary (2016–present) of Vanguard and of each of the investment companies served by Vanguard. Managing director (2016–present) of Vanguard. Director and senior vice president (2016–2018) of Vanguard Marketing Corporation. Managing director and general counsel of Global Cards and Consumer Services (2014–2016) at Citigroup. Counsel (2003–2014) at American Express.
Michael Rollings
Born in 1963. Principal occupation(s) during the past five years and other experience: finance director (2017–present) and treasurer (2017) of each of the investment companies served by Vanguard. Managing director (2016–present) of Vanguard. Chief financial officer (2016–present) of Vanguard. Director (2016–present) of Vanguard Marketing Corporation. Executive vice president and chief financial officer (2006–2016) of MassMutual Financial Group.
| |
| Vanguard Senior Management Team |
| |
| Joseph Brennan | Chris D. McIsaac |
| Mortimer J. Buckley | James M. Norris |
| Gregory Davis | Thomas M. Rampulla |
| John James | Karin A. Risi |
| Martha G. King | Anne E. Robinson |
| John T. Marcante | Michael Rollings |
Chairman Emeritus and Senior Advisor
John J. Brennan
Chairman, 1996–2009
Chief Executive Officer and President, 1996–2008
Founder
John C. Bogle
Chairman and Chief Executive Officer, 1974–1996

| |
| | P.O. Box 2600 |
| | Valley Forge, PA 19482-2600 |
| |
| |
| |
| Connect with Vanguard® > | vanguard.com |
| |
| |
| |
| Fund Information > 800-662-7447 | CFA® is a registered trademark owned by CFA Institute. |
| Direct Investor Account Services > 800-662-2739 |
| Institutional Investor Services > 800-523-1036 |
| Text Telephone for People | |
| Who Are Deaf or Hard of Hearing > 800-749-7273 |
| |
| This material may be used in conjunction |
| with the offering of shares of any Vanguard |
| fund only if preceded or accompanied by |
| the fund’s current prospectus. | |
| |
| All comparative mutual fund data are from Lipper, a |
| Thomson Reuters Company, or Morningstar, Inc., unless |
| otherwise noted. | |
| |
| You can obtain a free copy of Vanguard’s proxy voting |
| guidelines by visiting vanguard.com/proxyreporting or by |
| calling Vanguard at 800-662-2739. The guidelines are |
| also available from the SEC’s website, sec.gov. In |
| addition, you may obtain a free report on how your fund |
| voted the proxies for securities it owned during the 12 |
| months ended June 30. To get the report, visit either |
| vanguard.com/proxyreporting or sec.gov. |
| |
| You can review and copy information about your fund at |
| the SEC’s Public Reference Room in Washington, D.C. To |
| find out more about this public service, call the SEC at |
| 202-551-8090. Information about your fund is also |
| available on the SEC’s website, and you can receive |
| copies of this information, for a fee, by sending a |
| request in either of two ways: via email addressed to |
| publicinfo@sec.gov or via regular mail addressed to the |
| Public Reference Section, Securities and Exchange |
| Commission, Washington, DC 20549-1520. |
| | © 2018 The Vanguard Group, Inc. |
| | All rights reserved. |
| | Vanguard Marketing Corporation, Distributor. |
| |
| | Q13200 112018 |

Annual Report | September 30, 2018
Vanguard Emerging Markets Bond Fund
Vanguard’s Principles for Investing Success
We want to give you the best chance of investment success. These principles, grounded in Vanguard’s research and experience, can put you on the right path.
Goals. Create clear, appropriate investment goals.
Balance. Develop a suitable asset allocation using broadly diversified funds. Cost. Minimize cost.
Discipline. Maintain perspective and long-term discipline.
A single theme unites these principles: Focus on the things you can control.
We believe there is no wiser course for any investor.
| |
| Contents | |
| Your Fund’s Performance at a Glance. | 1 |
| CEO’s Perspective. | 2 |
| Advisor’s Report. | 4 |
| Fund Profile. | 7 |
| Performance Summary. | 9 |
| Financial Statements. | 11 |
| About Your Fund’s Expenses. | 37 |
| Glossary. | 39 |
Please note: The opinions expressed in this report are just that—informed opinions. They should not be considered promises or advice. Also, please keep in mind that the information and opinions cover the period through the date on the front of this report. Of course, the risks of investing in your fund are spelled out in the prospectus.
See the Glossary for definitions of investment terms used in this report.
Your Fund’s Performance at a Glance
• For the 12 months ended September 30, 2018, Investor Shares of Vanguard Emerging Markets Bond Fund returned 2.39%. It outpaced its benchmark index by more than 4 percentage points and the average of its peer group by more than 6 percentage points. Admiral Shares returned 0.92% from their inception on December 6, 2017, through September 30, 2018.
• Emerging-market bonds had a strong start to the fiscal year, underpinned by robust synchronized global growth. As the year progressed, the pace of U.S. monetary tightening increased while growth outside the U.S. slowed, putting pressure on emerging markets. Countries most exposed to higher dollar-funding costs led the sell-off.
• The fund’s relative-value-driven strategy served investors well throughout the volatility. In addition to out-of-benchmark allocations to high-quality issuers from the Middle East, local-currency exposures in Brazil and Mexico and corporate exposure in Brazil added value.
| | | | |
| Total Returns: Fiscal Year Ended September 30, 2018 | | | |
| | 30-Day SEC | Income | Capital | Total |
| | Yield | Returns | Returns | Returns |
| Vanguard Emerging Markets Bond Fund | | | | |
| Investor Shares | 5.24% | 4.20% | -1.81% | 2.39% |
| Admiral™ Shares (Inception: 12/6/2017) | 5.39 | 3.70 | -2.78 | 0.92 |
| JP Morgan EMBI Global Diversified | | | | -1.92 |
| Emerging Markets Hard Currency Debt Funds | | | | |
| Average | | | | -4.04 |
Emerging Markets Hard Currency Debt Funds Average: Derived from data provided by Lipper, a Thomson Reuters Company.
| | | |
| Expense Ratios | | | |
| Your Fund Compared With Its Peer Group | | | |
| | Investor | Admiral | Peer Group |
| | Shares | Shares | Average |
| Emerging Markets Bond Fund | 0.60% | 0.45% | 1.13% |
The fund expense ratios shown are from the prospectus dated January 26, 2018, and represent estimated costs for the current fiscal year. For the fiscal year ended September 30, 2018, the fund’s expense ratios were 0.60% for Investor Shares and 0.45% for Admiral Shares. The peer-group expense ratio is derived from data provided by Lipper, a Thomson Reuters Company, and captures information through year-end 2017.
Peer group: Emerging Markets Hard Currency Debt Funds.
1
CEO’s Perspective

Tim Buckley
President and Chief Executive Officer
Dear Shareholder,
Over the years, I’ve found that prudent investors exhibit a common trait: discipline. No matter how the markets move or what new investing fad hits the headlines, those who stay focused on their goals and tune out the noise are set up for long-term success.
The prime gateway to investing is saving, and you don’t usually become a saver without a healthy dose of discipline. Savers make the decision to sock away part of their income, which means spending less and delaying gratification, no matter how difficult that may be.
Of course, disciplined investing extends beyond diligent saving. The financial markets, in the short term especially, are unpredictable; I have yet to meet the investor who can time them perfectly. It takes discipline to resist the urge to go all-in when markets are frothy or to retreat when things look bleak.
Staying put with your investments is one strategy for handling volatility. Another, rebalancing, requires even more discipline because it means steering your money away from strong performers and toward poorer performers.
Patience—a form of discipline—is also the friend of long-term investors. Higher returns are the potential reward for weathering the market’s turbulence and uncertainty.
2
We have been enjoying one of the longest bull markets in history, but it won’t continue forever. Prepare yourself now for how you will react when volatility comes back. Don’t panic. Don’t chase returns or look for answers outside the asset classes you trust. And be sure to rebalance periodically, even when there’s turmoil.
Whether you’re a master of self-control, get a boost from technology, or work with a professional advisor, know that discipline
is necessary to get the most out of your investment portfolio. And know that Vanguard is with you for the entire ride.
Thank you for your continued loyalty.

Mortimer J. Buckley
President and Chief Executive Officer
October 18, 2018
| | | |
| Market Barometer | | | |
| | | Average Annual Total Returns |
| | Periods Ended September 30, 2018 |
| | One Year | Three Years | Five Years |
| Stocks | | | |
| Russell 1000 Index (Large-caps) | 17.76% | 17.07% | 13.67% |
| Russell 2000 Index (Small-caps) | 15.24 | 17.12 | 11.07 |
| Russell 3000 Index (Broad U.S. market) | 17.58 | 17.07 | 13.46 |
| FTSE All-World ex US Index (International) | 2.13 | 10.18 | 4.51 |
| |
| Bonds | | | |
| Bloomberg Barclays U.S. Aggregate Bond Index | | | |
| (Broad taxable market) | -1.22% | 1.31% | 2.16% |
| Bloomberg Barclays Municipal Bond Index | | | |
| (Broad tax-exempt market) | 0.35 | 2.24 | 3.54 |
| FTSE Three-Month U. S. Treasury Bill Index | 1.57 | 0.80 | 0.48 |
| |
| CPI | | | |
| Consumer Price Index | 2.28% | 1.99% | 1.52% |
3
Advisor’s Report
Investor Shares of Vanguard Emerging Markets Bond Fund returned 2.39% for the 12 months ended September 30, 2018. The fund’s benchmark, the JP Morgan EMBI Global Diversified, returned –1.92% for the same period. The average return of its peer group of emerging-market hard currency debt funds was –4.04%. (A “hard currency” is one that is issued by an economically and politically stable country and is widely used around the world as payment for goods and services.)
Admiral Shares of the fund were launched on December 6, 2017. They returned 0.92% from that date through September 30, 2018.
The 30-day SEC yield for Investor Shares climbed to 5.24% by the close of the period compared with 3.98% a year earlier.
The investment environment
After a good start to the fiscal year, some shifts in the macroeconomic landscape put emerging-market assets under pressure.
The pace of U.S. economic expansion accelerated, aided by tax cuts and a pickup in consumer spending and nonresidential fixed investment. That, along with a drop in unemployment to almost a 50-year low and an increase in inflation to near the 2% target, led the Federal Reserve to raise interest rates by a quarter percentage point four times during the period. The increases almost doubled short-term borrowing costs. Longer-term U.S. bond yields rose and, in the second half of the period, the dollar strengthened.
In October 2017, the Fed also began trimming its balance sheet, making it the first developed-market central bank since the 2008 global financial crisis to begin quantitative tightening. Both the European Central Bank and the Bank of Japan are still in quantitative-easing mode.
For emerging markets, developments in the United States effectively tightened their financial conditions, raised the cost of borrowing in dollars, and precipitated capital outflows. The countries most affected were those with large short-term external funding needs, including Argentina, Turkey, and South Africa.
While the U.S. economy accelerated, momentum elsewhere weakened and regional divergences increased. In Europe, Brexit continued to breed uncertainty, as did the possibility of U.S. tariffs on European-made automobiles and concerns about the spending plans of Italy’s newly elected populist government.
More relevant for emerging markets was the slowdown in China, given its role as their most significant growth driver over the past decade. Trade tensions and tariffs added another layer of uncertainty for emerging markets. Those countries have been some of the biggest beneficiaries of the expansion of global trade in recent decades.
Management of the fund
Our investment strategy is driven by relative value selection among securities and countries. This tactical approach, rather than taking directional bets to be
4
long or short the market, enabled the fund to significantly outpace its competitors during a volatile year.
Given the robust macroeconomic backdrop early in the fiscal year, when global growth was more synchronized, we held securities with yields that we believed had the most room to tighten.
Subsequently—as the calm in the bond market persisted even as the Fed continued raising rates while unwinding its balance sheet—we turned more defensive. Rather than moving up in credit quality to achieve that, we increased cash levels and reduced market value at risk by tilting the portfolio to bonds in the parts of the yield curve that had the best carry-to-volatility ratios. The timing worked out well as a bout of turbulence in February led emerging-market bonds to meaningfully reprice.
Although emerging-market valuations have become more attractive overall since that reset, we have remained cautious toward some of the weaker credits. To limit our exposure to those credits, we have bought bonds further out on the yield curve to reduce the market value at risk. That trade proved effective during the second and third quarters of 2018.
Another positive for the fund was our out-of-benchmark allocations. They included some high-quality Middle Eastern issuers, namely Saudi Arabia, the United Arab Emirates, and Kuwait. We felt they offered a better risk/reward profile than some of their Latin American counterparts included in the benchmark.
We added local-currency Mexican rates because its central bank is ahead of the U.S. Fed in tightening, so there is less need for further hikes. With the Mexican national election in the rearview mirror and a new North American free-trade agreement in the works, the level of risk associated with that market has lessened. We selectively added debt issued by Brazilian companies given the backdrop of corporate deleveraging. We also felt that long-dated local-currency Brazilian rates offered a good risk/reward profile ahead of the October general election.
In terms of detractors from relative performance, we probably weren’t wary enough about Turkey. On the other hand, we may have been overly pessimistic about some weaker countries, including Ecuador, Lebanon, and Bahrain.
Outlook
Emerging markets are going through a regime change as the easy monetary cycle experienced since the 2008 global financial crisis has shifted to tightening. The Fed is expected to continue raising interest rates this year and next while the pace of quantitative tightening gradually accelerates.
That said, we remain positive about emerging-market bonds, given the repricing that has taken place, as we are now getting paid more for the investment risk than a year ago. Moreover, the fundamentals of most major emerging markets remain sound and should be able to withstand additional volatility and macroeconomic headwinds. Many have acclimated to the
5
more adverse external environment through currency adjustments, and additional risk premiums have been built into bond prices.
Major risks to the downside for emerging markets remain additional trade frictions and/or a hard landing for the Chinese economy, which would put a brake on global growth and weigh on commodity prices.
We acknowledge that volatility in emerging-market debt is likely to pick up again. For that reason, we are entering the fund’s new fiscal year tactically more defensive. Any upswing in volatility should provide better levels for active relative-value-driven managers like us to add value compared with competitors who count on getting directional outcomes right.
Daniel Shaykevich, Portfolio Manager Vanguard Fixed Income Group October 23, 2018
6
Emerging Markets Bond Fund
Fund Profile
As of September 30, 2018
| | |
| Share-Class Characteristics | |
| | Investor | Admiral |
| | Shares | Shares |
| Ticker Symbol | VEMBX | VEGBX |
| Expense Ratio1 | 0.60% | 0.45% |
| 30-Day SEC Yield | 5.24% | 5.39% |
| | |
| Financial Attributes | | |
| | | JP Morgan |
| | | EMBI Global |
| | | Diversified |
| | Fund | Index |
| Number of Bonds | 94 | 666 |
| Yield to Maturity (before | | |
| expenses) | 5.7% | 6.4% |
| Average Coupon | -0.8% | 6.0% |
| Average Duration | 6.3 years | 6.7 years |
| Average Effective | | |
| Maturity | 10.2 years | 10.9 years |
| Short-Term Reserves | 8.9% | — |
| |
| Sector Diversification (% of portfolio) | |
| Foreign Government | 94.4% |
| Industrial | 2.5 |
| Treasury/Agency | 3.1 |
The agency and mortgage-backed securities sectors may include issues from government-sponsored enterprises; such issues are generally not backed by the full faith and credit of the U.S. government.
| |
| Distribution by Credit Quality (% of portfolio) |
| Aa | 1.3% |
| A | 10.8 |
| Baa | 40.4 |
| Ba | 16.1 |
| B | 22.0 |
| Caa | 0.8 |
| C | 0.3 |
| Not Rated | 8.3 |
Credit-quality ratings are obtained from Moody's and S&P, and the higher rating for each issue is shown. "Not Rated" is used to classify securities for which a rating is not available. Not rated securities include a fund's investment in Vanguard Market Liquidity Fund or Vanguard Municipal Cash Management Fund, each of which invests in high-quality money market instruments and may serve as a cash management vehicle for the Vanguard funds, trusts, and accounts. For more information about these ratings, see the Glossary entry for Credit Quality.
| |
| Distribution by Effective Maturity | |
| (% of portfolio) | |
| Under 1 Year | 11.3% |
| 1 - 3 Years | 9.0 |
| 3 - 5 Years | 18.2 |
| 5 - 7 Years | 17.7 |
| 7 - 10 Years | 17.7 |
| 10 - 20 Years | 5.6 |
| 20 - 30 Years | 15.7 |
| Over 30 Years | 4.8 |
1 The expense ratios shown are from the prospectus dated January 26, 2018, and represent estimated costs for the current fiscal year. For the fiscal year ended September 30, 2018, the expense ratios were 0.60% for Investor Shares and 0.45% for Admiral Shares.
7
Emerging Markets Bond Fund
| |
| Market Diversification (% of portfolio) | |
| | Fund |
| Indonesia | 8.2% |
| Mexico | 7.5 |
| Argentina | 7.3 |
| Chile | 6.3 |
| Ukraine | 5.2 |
| Hungary | 4.6 |
| Brazil | 3.7 |
| Guatemala | 3.7 |
| Saudi Arabia | 3.5 |
| Russia | 3.3 |
| Philippines | 3.2 |
| Egypt | 2.8 |
| Kazakhstan | 2.6 |
| Turkey | 2.5 |
| Colombia | 2.2 |
| India | 2.1 |
| Dominican Republic | 2.0 |
| El Salvador | 2.0 |
| South Africa | 1.6 |
| Uruguay | 1.6 |
| Romania | 1.6 |
| Oman | 1.6 |
| Angola | 1.4 |
| Honduras | 1.3 |
| Sri Lanka | 1.3 |
| Peru | 1.2 |
| Panama | 1.2 |
| Bermuda | 1.1 |
| Venezuela | 1.0 |
| Paraguay | 1.0 |
| Trinidad and Tobago | 1.0 |
| Senegal | 1.0 |
| Other | 9.4 |
8
Emerging Markets Bond Fund
Performance Summary
All of the returns in this report represent past performance, which is not a guarantee of future results that may be achieved by the fund. (Current performance may be lower or higher than the performance data cited. For performance data current to the most recent month-end, visit our website at vanguard.com/performance.) Note, too, that both investment returns and principal value can fluctuate widely, so an investor’s shares, when sold, could be worth more or less than their original cost. The returns shown do not reflect taxes that a shareholder would pay on fund distributions or on the sale of fund shares.
Cumulative Performance: March 10, 2016, Through September 30, 2018
Initial Investment of $10,000
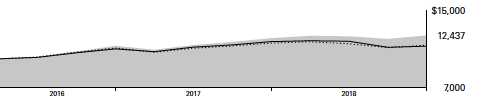
| | | |
| | Average Annual Total Returns | |
| | Periods Ended September 30, 2018 | |
| |
| | | Since | Final Value |
| | One | Inception | of a $10,000 |
| | Year | (3/10/2016) | Investment |
| Emerging Markets Bond FundInvestor | | | |
| Shares | 2.39% | 8.90% | $12,437 |
| |
| JP Morgan EMBI Global Diversified | -1.92 | 5.35 | 11,425 |
| Emerging Markets Hard Currency Debt | | | |
| Funds Average | -4.04 | 4.97 | 11,320 |
"Since Inception" performance is calculated from the Investor Shares’ inception date for both the fund and its comparative standards.
| | |
| | Since | Final Value |
| | Inception | of a $50,000 |
| | (12/6/2017) | Investment |
| Emerging Markets Bond Fund Admiral Shares | 0.92% | $50,458 |
| JP Morgan EMBI Global Diversified | -2.69 | 48,657 |
"Since Inception" performance is calculated from the Admiral Shares’ inception date for both the fund and its comparative standards.
See Financial Highlights for dividend and capital gains information.
9
Emerging Markets Bond Fund
| | | | |
| Fiscal-Year Total Returns (%): March 10, 2016, Through September 30, 2018 | |
| | | | | JP Morgan |
| | | | | EMBI Global |
| | | | Investor Shares | Diversified |
| Fiscal Year | Income Returns | Capital Returns | Total Returns | Total Returns |
| 2016 | 2.81% | 10.70% | 13.51% | 11.36% |
| 2017 | 5.11 | 1.90 | 7.01 | 4.61 |
| 2018 | 4.20 | -1.81 | 2.39 | -1.92 |
10
Emerging Markets Bond Fund
Financial Statements
Statement of Net Assets
As of September 30, 2018
The fund reports a complete list of its holdings in regulatory filings four times in each fiscal year, at the quarter-ends. For the second and fourth fiscal quarters, the lists appear in the fund’s semiannual and annual reports to shareholders. For the first and third fiscal quarters, the fund files the lists with the Securities and Exchange Commission on Form N-Q. Shareholders can look up the fund’s Forms N-Q on the SEC’s website at sec.gov. Forms N-Q may also be reviewed and copied at the SEC’s Public Reference Room (see the back cover of this report for further information).
| | | | |
| | | | Face | Market |
| | | Maturity | Amount | Value • |
| | Coupon | Date | ($000) | ($000) |
| Angola (1.3%) | | | | |
| Sovereign Bond (1.3%) | | | | |
| Republic of Angola | 9.375% | 5/8/48 | 1,250 | 1,322 |
| Total Angola (Cost $1,255) | | | | 1,322 |
| Argentina (6.7%) | | | | |
| Sovereign Bonds (6.7%) | | | | |
| Argentine Republic | 5.625% | 1/26/22 | 600 | 541 |
| Argentine Republic | 4.625% | 1/11/23 | 1,517 | 1,280 |
| Argentine Republic | 6.875% | 1/26/27 | 4,742 | 4,031 |
| 1 Argentine Republic | 2.500% | 12/31/38 | 700 | 416 |
| 1 City of Buenos Aires | 8.950% | 2/19/21 | 500 | 502 |
| Total Argentina (Cost $6,699) | | | | 6,770 |
| Armenia (0.6%) | | | | |
| Sovereign Bonds (0.6%) | | | | |
| Republic of Armenia | 6.000% | 9/30/20 | 400 | 407 |
| Republic of Armenia | 7.150% | 3/26/25 | 200 | 211 |
| Total Armenia (Cost $627) | | | | 618 |
| Bermuda (1.0%) | | | | |
| Sovereign Bond (1.0%) | | | | |
| Bermuda | 4.854% | 2/6/24 | 1,000 | 1,040 |
| Total Bermuda (Cost $1,029) | | | | 1,040 |
| Brazil (3.4%) | | | | |
| Corporate Bonds (1.3%) | | | | |
| Embraer Netherlands Finance BV | 5.050% | 6/15/25 | 500 | 501 |
| 2 Suzano Austria GmbH | 6.000% | 1/15/29 | 850 | 852 |
| | | | | 1,353 |
| Sovereign Bonds (2.1%) | | | | |
| Federative Republic of Brazil | 5.000% | 1/27/45 | 850 | 702 |
| Petrobras Global Finance BV | 7.375% | 1/17/27 | 1,400 | 1,416 |
| | | | | 2,118 |
| Total Brazil (Cost $3,492) | | | | 3,471 |
11
| | | | |
| Emerging Markets Bond Fund | | | | |
| |
| |
| | | | Face | Market |
| | | Maturity | Amount | Value • |
| | Coupon | Date | ($000) | ($000) |
| Chile (5.8%) | | | | |
| Corporate Bond (0.6%) | | | | |
| Celulosa Arauco y Constitucion SA | 5.500% | 11/2/47 | 600 | 586 |
| | | | | 586 |
| Sovereign Bonds (5.2%) | | | | |
| Corp. Nacional del Cobre de Chile | 7.500% | 1/15/19 | 800 | 809 |
| Corp. Nacional del Cobre de Chile | 4.500% | 8/13/23 | 1,000 | 1,022 |
| Corp. Nacional del Cobre de Chile | 4.500% | 9/16/25 | 1,500 | 1,524 |
| Empresa de Transporte de Pasajeros | | | | |
| Metro SA | 5.000% | 1/25/47 | 250 | 251 |
| Empresa Nacional del Petroleo | 3.750% | 8/5/26 | 1,500 | 1,426 |
| 2 Empresa Nacional del Petroleo | 4.500% | 9/14/47 | 250 | 223 |
| | | | | 5,255 |
| Total Chile (Cost $5,867) | | | | 5,841 |
| China (0.9%) | | | | |
| Sovereign Bond (0.9%) | | | | |
| 2 Sinopec Group Overseas Development | | | | |
| 2018 Ltd. | 4.250% | 9/12/28 | 867 | 854 |
| Total China (Cost $860) | | | | 854 |
| Colombia (2.0%) | | | | |
| Sovereign Bonds (2.0%) | | | | |
| Republic of Colombia | 4.375% | 7/12/21 | 1,100 | 1,121 |
| Republic of Colombia | 10.375% | 1/28/33 | 615 | 936 |
| Total Colombia (Cost $2,076) | | | | 2,057 |
| Costa Rica (0.7%) | | | | |
| Sovereign Bond (0.7%) | | | | |
| Republic of Costa Rica | 7.158% | 3/12/45 | 800 | 705 |
| Total Costa Rica (Cost $761) | | | | 705 |
| Cote d’Ivoire (0.4%) | | | | |
| Sovereign Bond (0.4%) | | | | |
| 3 Republic of Cote d’Ivoire | 6.625% | 3/22/48 | 350 | 380 |
| Total Cote d’Ivoire (Cost $431) | | | | 380 |
| Croatia (0.6%) | | | | |
| Sovereign Bond (0.6%) | | | | |
| 3 Republic of Croatia | 3.000% | 3/20/27 | 500 | 614 |
| Total Croatia (Cost $610) | | | | 614 |
| Dominican Republic (1.8%) | | | | |
| Sovereign Bonds (1.8%) | | | | |
| Dominican Republic | 6.875% | 1/29/26 | 500 | 534 |
| Dominican Republic | 6.500% | 2/15/48 | 1,350 | 1,325 |
| Total Dominican Republic (Cost $1,882) | | | | 1,859 |
| Egypt (2.6%) | | | | |
| Sovereign Bonds (2.6%) | | | | |
| Arab Republic of Egypt | 6.125% | 1/31/22 | 800 | 800 |
| Arab Republic of Egypt | 7.500% | 1/31/27 | 1,560 | 1,589 |
| Arab Republic of Egypt | 8.500% | 1/31/47 | 250 | 250 |
| Total Egypt (Cost $2,690) | | | | 2,639 |
12
| | | | |
| Emerging Markets Bond Fund | | | | |
| |
| |
| | | | Face | Market |
| | | Maturity | Amount | Value • |
| | Coupon | Date | ($000) | ($000) |
| El Salvador (1.8%) | | | | |
| Sovereign Bond (1.8%) | | | | |
| Republic of El Salvador | 7.750% | 1/24/23 | 1,750 | 1,830 |
| Total El Salvador (Cost $1,865) | | | | 1,830 |
| Ghana (0.5%) | | | | |
| Sovereign Bond (0.5%) | | | | |
| 1 Ghana Government International Bond | 8.627% | 6/16/49 | 500 | 501 |
| Total Ghana (Cost $481) | | | | 501 |
| Guatemala (3.4%) | | | | |
| Sovereign Bond (3.4%) | | | | |
| Republic of Guatemala | 5.750% | 6/6/22 | 3,300 | 3,424 |
| Total Guatemala (Cost $3,448) | | | | 3,424 |
| Honduras (1.2%) | | | | |
| Sovereign Bond (1.2%) | | | | |
| Republic of Honduras | 6.250% | 1/19/27 | 1,200 | 1,231 |
| Total Honduras (Cost $1,237) | | | | 1,231 |
| Hungary (4.2%) | | | | |
| Sovereign Bonds (4.2%) | | | | |
| Republic of Hungary | 6.250% | 1/29/20 | 1,500 | 1,558 |
| Republic of Hungary | 6.375% | 3/29/21 | 600 | 641 |
| Republic of Hungary | 5.375% | 2/21/23 | 1,000 | 1,060 |
| 3 Republic of Hungary | 1.250% | 10/22/25 | 850 | 979 |
| Total Hungary (Cost $4,279) | | | | 4,238 |
| India (2.0%) | | | | |
| Sovereign Bonds (2.0%) | | | | |
| Export-Import Bank of India | 4.000% | 1/14/23 | 1,500 | 1,483 |
| 2 Export-Import Bank of India | 3.875% | 2/1/28 | 565 | 524 |
| Total India (Cost $2,067) | | | | 2,007 |
| Indonesia (7.5%) | | | | |
| Sovereign Bonds (7.5%) | | | | |
| Republic of Indonesia | 5.375% | 10/17/23 | 4,750 | 5,010 |
| Republic of Indonesia | 5.875% | 1/15/24 | 2,400 | 2,577 |
| Total Indonesia (Cost $7,609) | | | | 7,587 |
| Jordan (0.5%) | | | | |
| Sovereign Bond (0.5%) | | | | |
| Hashemite Kingdom of Jordan | 7.375% | 10/10/47 | 500 | 469 |
| Total Jordan (Cost $464) | | | | 469 |
| Kazakhstan (2.4%) | | | | |
| Sovereign Bonds (2.4%) | | | | |
| Development Bank of Kazakhstan JSC | 4.125% | 12/10/22 | 1,000 | 984 |
| Kazakhstan Temir Zholy Finance BV | 6.950% | 7/10/42 | 600 | 660 |
| KazMunayGas National Co. JSC | 6.375% | 10/24/48 | 750 | 788 |
| Total Kazakhstan (Cost $2,458) | | | | 2,432 |
13
| | | | |
| Emerging Markets Bond Fund | | | | |
| |
| |
| | | | Face | Market |
| | | Maturity | Amount | Value • |
| | Coupon | Date | ($000) | ($000) |
| Kenya (0.7%) | | | | |
| Sovereign Bond (0.7%) | | | | |
| Republic of Kenya | 7.250% | 2/28/28 | 750 | 731 |
| Total Kenya (Cost $703) | | | | 731 |
| Latvia (0.2%) | | | | |
| Sovereign Bond (0.2%) | | | | |
| Republic of Latvia | 2.750% | 1/12/20 | 200 | 198 |
| Total Latvia (Cost $199) | | | | 198 |
| Lebanon (0.6%) | | | | |
| Sovereign Bonds (0.6%) | | | | |
| Republic of Lebanon | 6.650% | 11/3/28 | 400 | 303 |
| Republic of Lebanon | 7.250% | 3/23/37 | 400 | 301 |
| Total Lebanon (Cost $650) | | | | 604 |
| Lithuania (0.7%) | | | | |
| Sovereign Bonds (0.7%) | | | | |
| Republic of Lithuania | 6.125% | 3/9/21 | 170 | 181 |
| Republic of Lithuania | 6.625% | 2/1/22 | 500 | 551 |
| Total Lithuania (Cost $731) | | | | 732 |
| Mexico (6.9%) | | | | |
| Corporate Bond (0.4%) | | | | |
| 1,2 Grupo Bimbo SAB de CV | 5.950% | 7/17/66 | 400 | 402 |
| | | | | 402 |
| Sovereign Bonds (6.5%) | | | | |
| Petroleos Mexicanos | 8.000% | 5/3/19 | 323 | 332 |
| Petroleos Mexicanos | 6.000% | 3/5/20 | 500 | 516 |
| Petroleos Mexicanos | 5.500% | 1/21/21 | 1,250 | 1,290 |
| Petroleos Mexicanos | 6.875% | 8/4/26 | 1,600 | 1,681 |
| Petroleos Mexicanos | 5.625% | 1/23/46 | 1,000 | 848 |
| 4 United Mexican States | 8.000% | 12/7/23 | 34,500 | 1,861 |
| | | | | 6,528 |
| Total Mexico (Cost $6,919) | | | | 6,930 |
| Mongolia (0.8%) | | | | |
| Sovereign Bond (0.8%) | | | | |
| Mongolia | 10.875% | 4/6/21 | 750 | 846 |
| Total Mongolia (Cost $829) | | | | 846 |
| Oman (1.5%) | | | | |
| Sovereign Bond (1.5%) | | | | |
| Sultanate of Oman | 6.750% | 1/17/48 | 1,500 | 1,459 |
| Total Oman (Cost $1,467) | | | | 1,459 |
| Panama (0.8%) | | | | |
| Sovereign Bond (0.8%) | | | | |
| Republic of Panama | 9.375% | 4/1/29 | 535 | 757 |
| Total Panama (Cost $798) | | | | 757 |
| Paraguay (1.0%) | | | | |
| Republic of Paraguay | 5.600% | 3/13/48 | 1,000 | 997 |
| Total Paraguay (Cost $1,021) | | | | 997 |
14
| | | | |
| Emerging Markets Bond Fund | | | | |
| |
| |
| | | | Face | Market |
| | | Maturity | Amount | Value • |
| | Coupon | Date | ($000) | ($000) |
| Peru (1.1%) | | | | |
| Sovereign Bonds (1.1%) | | | | |
| Corp. Financiera de Desarrollo SA | 4.750% | 2/8/22 | 1,000 | 1,020 |
| Republic of Peru | 8.750% | 11/21/33 | 50 | 74 |
| Total Peru (Cost $1,094) | | | | 1,094 |
| Philippines (3.0%) | | | | |
| Sovereign Bonds (3.0%) | | | | |
| Republic of the Philippines | 4.200% | 1/21/24 | 2,000 | 2,055 |
| Republic of the Philippines | 9.500% | 2/2/30 | 650 | 962 |
| Total Philippines (Cost $3,023) | | | | 3,017 |
| Qatar (0.5%) | | | | |
| Sovereign Bond (0.5%) | | | | |
| State of Qatar | 5.103% | 4/23/48 | 500 | 520 |
| Total Qatar (Cost $500) | | | | 520 |
| Romania (1.5%) | | | | |
| Sovereign Bonds (1.5%) | | | | |
| Republic of Romania | 5.125% | 6/15/48 | 1,500 | 1,475 |
| Total Romania (Cost $1,489) | | | | 1,475 |
| Russia (3.0%) | | | | |
| Sovereign Bonds (3.0%) | | | | |
| Gazprom OAO Via Gaz Capital SA | 9.250% | 4/23/19 | 600 | 616 |
| Russian Federation | 5.000% | 4/29/20 | 300 | 305 |
| Russian Federation | 4.250% | 6/23/27 | 200 | 192 |
| Russian Federation | 5.250% | 6/23/47 | 2,000 | 1,920 |
| Total Russia (Cost $3,084) | | | | 3,033 |
| Saudi Arabia (2.4%) | | | | |
| Sovereign Bonds (2.4%) | | | | |
| Kingdom of Saudi Arabia | 5.000% | 4/17/49 | 2,400 | 2,434 |
| Total Saudi Arabia (Cost $2,375) | | | | 2,434 |
| Senegal (0.9%) | | | | |
| Sovereign Bond (0.9%) | | | | |
| 1 Republic of Senegal | 6.750% | 3/13/48 | 1,000 | 893 |
| Total Senegal (Cost $909) | | | | 893 |
| Serbia, Republic of (0.6%) | | | | |
| Sovereign Bond (0.6%) | | | | |
| Republic of Serbia | 4.875% | 2/25/20 | 600 | 607 |
| Total Serbia, Republic of (Cost $607) | | | | 607 |
| South Africa (1.5%) | | | | |
| Sovereign Bond (1.5%) | | | | |
| Republic of South Africa | 5.875% | 9/16/25 | 1,500 | 1,524 |
| Total South Africa (Cost $1,527) | | | | 1,524 |
| Sri Lanka (1.2%) | | | | |
| Sovereign Bond (1.2%) | | | | |
| Democratic Socialist Republic of Sri Lanka | 6.850% | 11/3/25 | 1,200 | 1,195 |
| Total Sri Lanka (Cost $1,205) | | | | 1,195 |
15
| | | | | |
| Emerging Markets Bond Fund | | | | |
| |
| |
| | | | | Face | Market |
| | | | Maturity | Amount | Value • |
| | | Coupon | Date | ($000) | ($000) |
| Supranational (0.8%) | | | | |
| Sovereign Bond (0.8%) | | | | |
| 2 | Arab Petroleum Investments Corp. | 4.125% | 9/18/23 | 800 | 804 |
| Total Supranational (Cost $799) | | | | 804 |
| Trinidad and Tobago (0.9%) | | | | |
| Sovereign Bond (0.9%) | | | | |
| | Petroleum Co. of Trinidad & Tobago Ltd. | 9.750% | 8/14/19 | 1,000 | 930 |
| Total Trinidad and Tobago (Cost $1,037) | | | | 930 |
| Turkey (2.3%) | | | | |
| Sovereign Bonds (2.3%) | | | | |
| 2 | Export Credit Bank of Turkey | 6.125% | 5/3/24 | 421 | 377 |
| | Republic of Turkey | 5.750% | 3/22/24 | 1,079 | 1,014 |
| | Republic of Turkey | 4.250% | 4/14/26 | 850 | 712 |
| | Republic of Turkey | 5.750% | 5/11/47 | 250 | 195 |
| Total Turkey (Cost $2,364) | | | | 2,298 |
| Ukraine (4.0%) | | | | |
| Sovereign Bonds (4.8%) | | | | |
| | Ukraine | 7.750% | 9/1/22 | 3,000 | 2,991 |
| 1 | Ukraine Government International Bond | 7.375% | 9/25/32 | 1,200 | 1,043 |
| 1 | Ukreximbank Via Biz Finance plc | 9.625% | 4/27/22 | 750 | 763 |
| Total Ukraine (Cost $4,967) | | | | 4,797 |
| Uruguay (1.5%) | | | | |
| Sovereign Bond (1.5%) | | | | |
| 1 | Oriental Republic of Uruguay | 4.975% | 4/20/55 | 1,500 | 1,500 |
| Total Uruguay (Cost $1,438) | | | | 1,500 |
| Venezuela (1.0%) | | | | |
| Sovereign Bonds (1.0%) | | | | |
| 5 | Bolivarian Republic of Venezuela | 11.750% | 10/21/26 | 640 | 179 |
| 5 | Bolivarian Republic of Venezuela | 7.000% | 3/31/38 | 500 | 132 |
| 1,5 | Petroleos de Venezuela SA | 6.000% | 11/15/26 | 2,850 | 613 |
| 5 | Petroleos de Venezuela SA | 5.375% | 4/12/27 | 462 | 100 |
| Total Venezuela (Cost $1,039) | | | | 1,024 |
| |
| | | | | Shares | |
| Temporary Cash Investments (8.9%) | | | | |
| Money Market Fund (8.9%) | | | | |
| 6 | Vanguard Market Liquidity Fund (Cost $8,980) | 2.209% | | 89,801 | 8,980 |
| Total Temporary Cash Investments (Cost $8,980) | | | 8,980 |
16
| | | | |
| Emerging Markets Bond Fund | | | | |
| |
| |
| |
| | | | Notional | Market |
| | Expiration | Strike | Amount | Value • |
| | Date | Price | ($000) | ($000) |
| Options Purchased (0.0%) | | | | |
| Foreign Currency Options | | | | |
| Put Options | | | | |
| ZAR | 11/16/18 | $14.3820 | 2,000 | 43 |
| Total Options Purchased (Cost $39) | | | | 43 |
| Total Investments (100.4%) (Cost $101,980) | | | | 101,311 |
| Other Assets and Liabilities (-0.4%) | | | | |
| Other Assets7 | | | | 2,088 |
| Liabilities | | | | (2,541) |
| Net Assets (100%) | | | | 100,858 |
| |
| | | | | Amount |
| | | | | ($000) |
| Statement of Assets and Liabilities | | | | |
| Assets | | | | |
| Investments in Securities, at Value | | | | |
| Unaffiliated Issuers | | | | 92,288 |
| Affiliated Issuers | | | | 8,980 |
| Options Purchased | | | | 43 |
| Total Investments in Securities | | | | 101,311 |
| Investment in Vanguard | | | | 5 |
| Receivables for Accrued Income | | | | 1,277 |
| Receivables for Capital Shares Issued | | | | 290 |
| Variation Margin Receivable—Futures Contracts | | | 1 |
| Unrealized Appreciation—Forward Currency Contracts | | | 75 |
| Unrealized Appreciation—OTC Swap Contracts | | | | 75 |
| Other Assets7 | | | | 365 |
| Total Assets | | | | 103,399 |
| Liabilities | | | | |
| Payables for Investment Securities Purchased | | | | 1,570 |
| Payables for Capital Shares Redeemed | | | | 32 |
| Payables for Distributions | | | | 88 |
| Payables to Vanguard | | | | 22 |
| Variation Margin Payable—CC Swap Contracts | | | | 5 |
| Unrealized Depreciation—Forward Currency Contracts | | | 54 |
| Unrealized Depreciation—OTC Swap Contracts | | | | 76 |
| Other Liabilities | | | | 694 |
| Total Liabilities | | | | 2,541 |
| Net Assets | | | | 100,858 |
17
| |
| Emerging Markets Bond Fund | |
| |
| |
| |
| At September 30, 2018, net assets consisted of: | |
| | Amount |
| | ($000) |
| Paid-in Capital | 102,757 |
| Undistributed Net Investment Income | 107 |
| Accumulated Net Realized Losses | (1,345) |
| Unrealized Appreciation (Depreciation) | |
| Investment Securities | (673) |
| Futures Contracts | (48) |
| Options on Foreign Currency | 4 |
| Swap Contracts | 20 |
| Forward Currency Contracts | 21 |
| Foreign Currencies | 15 |
| Net Assets | 100,858 |
| |
| |
| Investor Shares—Net Assets | |
| Applicable to 2,367,796 outstanding $.001 par value shares of | |
| beneficial interest (unlimited authorization) | 24,534 |
| Net Asset Value Per Share—Investor Shares | $10.36 |
| |
| |
| Admiral Shares—Net Assets | |
| Applicable to 3,166,192 outstanding $.001 par value shares of | |
| beneficial interest (unlimited authorization) | 76,324 |
| Net Asset Value Per Share—Admiral Shares | $24.11 |
• See Note A in Notes to Financial Statements.
1 The average or expected maturity is shorter than the final maturity shown because of the possibility of interim principal payments
and prepayments or the possibility of the issue being called.
2 Security exempt from registration under Rule 144A of the Securities Act of 1933. Such securities may be sold in transactions
exempt from registration, normally to qualified institutional buyers. At September 30, 2018, the aggregate value of these securities
was $4,036,000, representing 4.0% of net assets.
3 Face amount denominated in euro.
4 Face amount denominated in Mexican peso.
5 Non-income-producing security—security in default.
6 Affiliated money market fund available only to Vanguard funds and certain trusts and accounts managed by Vanguard. Rate shown
is the 7-day yield.
7 Cash of $95,000 has been segregated as initial margin for open futures contracts and cash of $147,000 has been segregated as
initial margin for open cleared swap contracts.
ZAR—South African rand.
OTC—Over-the-Counter.
CC—Centrally Cleared.
18
| | | | |
| Emerging Markets Bond Fund | | | | |
| |
| |
| Derivative Financial Instruments Outstanding as of Period End | | |
| |
| Futures Contracts | | | | |
| | | | | ($000) |
| | | | | Value and |
| | | Number of | | Unrealized |
| | | Long (Short) | Notional | Appreciation |
| | Expiration | Contracts | Amount | (Depreciation) |
| Long Futures Contracts | | | | |
| Ultra 10-Year U.S. Treasury Note | December 2018 | 36 | 4,536 | (73) |
| 5-Year U.S. Treasury Note | December 2018 | 6 | 675 | (6) |
| | | | | (79) |
| |
| Short Futures Contracts | | | | |
| Euro-Bund | December 2018 | (16) | (2,950) | 26 |
| Ultra Long U.S. Treasury Bond | December 2018 | (1) | (154) | 5 |
| | | | | 31 |
| | | | | (48) |
| | | | | | |
| Forward Currency Contracts | | | | | | |
| | | | | | | Unrealized |
| | Contract | | | | | Appreciation |
| | Settlement | | Contract Amount (000) | (Depreciation) |
| Counterparty | Date | | Receive | | Deliver | ($000) |
| Toronto-Dominion Bank | 11/20/18 | ZAR | 11,328 | USD | 800 | (4) |
| BNP Paribas Securities, Inc. | 10/17/18 | RUB | 52,050 | USD | 751 | 42 |
| BNP Paribas Securites, Inc. | 10/2/18 | BRL | 2,919 | USD | 700 | 23 |
| Toronto Dominion Bank | 10/2/18 | BRL | 455 | USD | 110 | 3 |
| Goldman Sachs Bank AG | 10/15/18 | USD | 1,817 | MXN | 34,367 | (15) |
| Deutsche Bank AG | 10/17/18 | USD | 1,443 | PEN | 4,822 | (16) |
| Deutsche Bank AG | 10/15/18 | USD | 907 | EUR | 775 | 7 |
| HSBC Bank USA N.A. | 10/2/18 | USD | 821 | BRL | 3,374 | (15) |
| JPMorgan Chase Bank, N.A. | 10/17/18 | USD | 779 | RUB | 51,367 | (4) |
| BNP Paribas Securities, Inc. | 10/15/18 | USD | 7 | EUR | 6 | — |
| | | | | | | 21 |
| BRL—Brazilian real. | | | | | | |
| EUR—Euro. | | | | | | |
| MXN—Mexican peso. | | | | | | |
| PEN—Peruvian sol. | | | | | | |
| RUB—Russian ruble. | | | | | | |
| USD—U.S. dollar. | | | | | | |
| ZAR—South African rand. | | | | | | |
19
Emerging Markets Bond Fund
| | | | | | | |
| Over-the-Counter Credit Default Swaps | | | | | |
| | | | | | | Remaining | |
| | | | | Periodic | | Up-Front | |
| | | | | Premium | | Premium | Unrealized |
| | | | Notional | Received | | Received | Appreciation |
| Termination | | Amount | (Paid)1 | Value | (Paid) | (Depreciation) |
| Reference Entity | Date | Counterparty | ($000) | (%) | ($000) | ($000) | ($000) |
| Credit Protection Sold/ | | | | | | | |
| Moody’s Rating | | | | | | | |
| Ministry of Finance | | | | | | | |
| Malaysia/A3 | 12/20/23 | BARC | 2,750 | 1.000 | 6 | (2) | 4 |
| Petroleos Mexicanos/ | | | | | | | |
| Baa3 | 12/20/23 | DBAG | 1,400 | 1.000 | (87) | 85 | (2) |
| Republic of Indonesia/ | | | | | | | |
| Baa2 | 12/20/23 | BNPSW | 650 | 1.000 | (10) | 14 | 4 |
| Republic of Peru/A3 | 12/20/23 | BOANA | 5,700 | 1.000 | 67 | (47) | 20 |
| Republic of Philippines/ | | | | | | | |
| Baa2 | 12/20/23 | BNPSW | 1,400 | 1.000 | 14 | (9) | 5 |
| Russian Federation/Ba1 12/20/23 | GSI | 1,150 | 1.000 | (24) | 33 | 9 |
| Russian Federation/Ba1 12/20/23 | JPMC | 700 | 1.000 | (15) | 20 | 5 |
| | | | | | (49) | 94 | 45 |
| 1 Periodic premium received/paid quarterly. | | | | | |
| BARC—Barclays Bank plc. | | | | | | | |
| BNPSW—BNP Paribas. | | | | | | | |
| BOANA—Bank of America, N.A. | | | | | | |
| DBAG—Deutsche Bank AG. | | | | | | | |
| GSI—Goldman Sachs International. | | | | | | |
| JPMC—JP Morgan Chase Bank. | | | | | | |
The notional amount represents the maximum potential amount the fund could be required to pay as a seller of credit protection if the reference entity was subject to a credit event.
1 Fixed interest payment received/paid semiannually.
2 Based on 28-day Mexican Interbank Rate (TIIE) as of the most recent reset date and paid every 28 days.
3 Fixed interest payment received/paid annually.
4 Based on the 6-month Budapest Interbank Offered Rate and paid semiannually. HUF—Hungarian forint.
MXN—Mexican peso.
| | | | | | | |
| Centrally Cleared Interest Rate Swaps | | | | | | |
| | | | | Fixed | Floating | | |
| | | | | Interest | Interest | | |
| | | | | Rate | Rate | | Unrealized |
| | Future | | | Received | Received | | Appreciation |
| | Effective | Notional | Amount | (Paid) | (Paid) | Value | (Depreciation) |
| Termination Date | Date | | (000) | (%) | (%) | ($000) | ($000) |
| 6/27/28 | N/A | MXN | 27,750 | 8.0801 | (8.102)2 | (13) | (13) |
| 7/31/28 | N/A | HUF | 300,000 | (2.668)3 | 0.300 4 | 34 | 34 |
| | | | | | | | 21 |
20
| | | | | | |
| Emerging Markets Bond Fund | | | | | |
| |
| |
| Over-the-Counter Interest Rate Swaps | | | | | |
| | | | Fixed | Floating | | |
| | | | Interest | Interest | | |
| | | | Rate | Rate | | Unrealized |
| | | | Received | Received | | Appreciation |
| | | Notional Amount | (Paid)1 | (Paid)1,2 | Value | (Depreciation) |
| Termination Date | Counterparty | (000) | (%) | (%) | ($000) | ($000) |
| 1/2/25 | HSBC | BRL 2,378 | 12.010 | (6.390) | 28 | 28 |
| 1/2/25 | HSBC | BRL 5,184 | 10.455 | (6.390) | (64) | (64) |
| 1/2/25 | HSBC | BRL 2,268 | 10.978 | (6.390) | (10) | (10) |
| | | | | | (46) | (46) |
BRL—Brazilian real.
HSBC—HSBC Holdings plc.
1 Fixed and Floating interest payment received/paid at maturity of contract.
2 Based on 1 Day Overnight Brazil CETIP Interbank Deposit Rate.
See accompanying Notes, which are an integral part of the Financial Statements.
21
Emerging Markets Bond Fund
Statement of Operations
| |
| | Year Ended |
| | September 30, 2018 |
| | ($000) |
| Investment Income | |
| Income | |
| Interest1 | 3,423 |
| Total Income | 3,423 |
| Expenses | |
| The Vanguard Group—Note B | |
| Investment Advisory Services | 2 |
| Management and Administrative—Investor Shares | 177 |
| Management and Administrative—Admiral Shares | 121 |
| Marketing and Distribution—Investor Shares | — |
| Marketing and Distribution—Admiral Shares | — |
| Custodian Fees | 21 |
| Auditing Fees | 46 |
| Shareholders’ Reports and Proxy—Investor Shares | 2 |
| Shareholders’ Reports and Proxy—Admiral Shares | 1 |
| Total Expenses | 370 |
| Expenses Paid Indirectly | (2) |
| Net Expenses | 368 |
| Net Investment Income | 3,055 |
| Realized Net Gain (Loss) | |
| Investment Securities Sold1 | (1,771) |
| Futures Contracts | 78 |
| Purchased Options | (19) |
| Swap Contracts | 411 |
| Forward Currency Contracts | 379 |
| Foreign Currencies | (18) |
| Realized Net Gain (Loss) | (940) |
| Change in Unrealized Appreciation (Depreciation) | |
| Investment Securities1 | (941) |
| Futures Contracts | (46) |
| Purchased Options | 4 |
| Swap Contracts | 12 |
| Forward Currency Contracts | 10 |
| Foreign Currencies | 12 |
| Change in Unrealized Appreciation (Depreciation) | (949) |
| Net Increase (Decrease) in Net Assets Resulting from Operations | 1,166 |
1 Interest income, realized net gain (loss), and change in unrealized appreciation (depreciation) from affiliated companies of the fund were $50,000, ($1,000), and ($1,000) respectively. Purchases and sales are for temporary cash investment purposes.
See accompanying Notes, which are an integral part of the Financial Statements.
22
Emerging Markets Bond Fund
Statement of Changes in Net Assets
| | |
| | Year Ended September 30, |
| | 2018 | 2017 |
| | ($000) | ($000) |
| Increase (Decrease) in Net Assets | | |
| Operations | | |
| Net Investment Income | 3,055 | 549 |
| Realized Net Gain (Loss) | (940) | 569 |
| Change in Unrealized Appreciation (Depreciation) | (949) | (318) |
| Net Increase (Decrease) in Net Assets Resulting from Operations | 1,166 | 800 |
| Distributions | | |
| Net Investment Income | | |
| Investor Shares | (1,458) | (558) |
| Admiral Shares | (1,797) | — |
| Realized Capital Gain | | |
| Investor Shares1 | (630) | (501) |
| Admiral Shares | — | — |
| Total Distributions | (3,885) | (1,059) |
| Capital Share Transactions | | |
| Investor Shares | 14,419 | 1,059 |
| Admiral Shares | 77,011 | — |
| Net Increase (Decrease) from Capital Share Transactions | 91,430 | 1,059 |
| Total Increase (Decrease) | 88,711 | 800 |
| Net Assets | | |
| Beginning of Period | 12,147 | 11,347 |
| End of Period2 | 100,858 | 12,147 |
1 Includes fiscal 2018 and 2017 short-term gain distributions totaling $531,000 and $478,000, respectively. Short-term gain distributions are treated as ordinary income dividends for tax purposes.
2 Net Assets—End of Period includes undistributed (overdistributed) net investment income of $107,000 and ($13,000).
See accompanying Notes, which are an integral part of the Financial Statements.
23
Emerging Markets Bond Fund
Financial Highlights
| | | |
| Investor Shares | | | |
| | | March 10, |
| | Year Ended | 20161 to |
| | September 30, | Sept. 30, |
| For a Share Outstanding Throughout Each Period | 2018 | 2017 | 2016 |
| Net Asset Value, Beginning of Period | $10.76 | $11.07 | $10.00 |
| Investment Operations | | | |
| Net Investment Income | . 443 2 | .5042 | .286 |
| Net Realized and Unrealized Gain (Loss) on Investments | (.193) | .184 | 1.050 |
| Total from Investment Operations | .250 | .688 | 1.336 |
| Distributions | | | |
| Dividends from Net Investment Income | (. 439) | (. 514) | (. 266) |
| Distributions from Realized Capital Gains | (.211) | (.484) | — |
| Total Distributions | (. 650) | (. 998) | (. 266) |
| Net Asset Value, End of Period | $10.36 | $10.76 | $11.07 |
| |
| Total Return3 | 2.39% | 7.01% | 13.51% |
| |
| Ratios/Supplemental Data | | | |
| Net Assets, End of Period (Millions) | $25 | $12 | $11 |
| Ratio of Total Expenses to Average Net Assets | 0.60% | 0.60% | 0.60%4 |
| Ratio of Net Investment Income to Average Net Assets | 4.29% | 4.79% | 4.85%4 |
| Portfolio Turnover Rate | 350% | 261% | 153% |
1 Inception.
2 Calculated based on average shares outstanding.
3 Total returns do not include account service fees that may have applied in the periods shown. Fund prospectuses provide information
about any applicable account service fees.
4 Annualized.
See accompanying Notes, which are an integral part of the Financial Statements.
24
Emerging Markets Bond Fund
Financial Highlights
| |
| Admiral Shares | |
| | December 6, 20171 to |
| For a Share Outstanding Throughout the Period | September 30, 2018 |
| Net Asset Value, Beginning of Period | $24.80 |
| Investment Operations | |
| Net Investment Income2 | .875 |
| Net Realized and Unrealized Gain (Loss) on Investments | (.659) |
| Total from Investment Operations | .216 |
| Distributions | |
| Dividends from Net Investment Income | (.906) |
| Distributions from Realized Capital Gains | — |
| Total Distributions | (. 906) |
| Net Asset Value, End of Period | $24.11 |
| |
| Total Return3 | 0.92% |
| |
| Ratios/Supplemental Data | |
| Net Assets, End of Period (Millions) | $76 |
| Ratio of Total Expenses to Average Net Assets | 0.45%4 |
| Ratio of Net Investment Income to Average Net Assets | 4.44%4 |
| Portfolio Turnover Rate | 350% |
1 Inception.
2 Calculated based on average shares outstanding.
3 Total returns do not include account service fees that may have applied in the periods shown. Fund prospectuses provide information
about any applicable account service fees.
4 Annualized.
See accompanying Notes, which are an integral part of the Financial Statements.
25
Emerging Markets Bond Fund
Notes to Financial Statements
Vanguard Emerging Markets Bond Fund is registered under the Investment Company Act of 1940 as an open-end investment company, or mutual fund. Certain of the fund’s investments are in corporate debt instruments; the issuers’ abilities to meet their obligations may be affected by economic developments in their respective industries. The fund invests in securities of foreign issuers, which may subject it to investment risks not normally associated with investing in securities of U.S. corporations. To minimize the currency risk associated with investment in bonds denominated in currencies other than the U.S. dollar, the fund attempts to hedge its currency exposures. The fund offers two classes of shares: Investor Shares and Admiral Shares. Investor Shares are available to any investor who meets the fund’s minimum purchase requirements. Admiral Shares are designed for investors who meet certain administrative, service, and account-size criteria. Admiral Shares were issued on December 6, 2017.
A. The following significant accounting policies conform to generally accepted accounting principles for U.S. investment companies. The fund consistently follows such policies in preparing its financial statements.
1. Security Valuation: Securities are valued as of the close of trading on the New York Stock Exchange (generally 4 p.m., Eastern time) on the valuation date. Bonds and temporary cash investments are valued using the latest bid prices or using valuations based on a matrix system (which considers such factors as security prices, yields, maturities, and ratings), both as furnished by independent pricing services. Investments in Vanguard Market Liquidity Fund are valued at that fund’s net asset value. Securities for which market quotations are not readily available, or whose values have been affected by events occurring before the fund’s pricing time but after the close of the securities’ primary markets, are valued at their fair values calculated according to procedures adopted by the board of trustees. These procedures include obtaining quotations from an independent pricing service, monitoring news to identify significant market- or security-specific events, and evaluating changes in the values of foreign market proxies (for example, ADRs, futures contracts, or exchange-traded funds), between the time the foreign markets close and the fund’s pricing time. When fair-value pricing is employed, the prices of securities used by a fund to calculate its net asset value may differ from quoted or published prices for the same securities.
2. Foreign Currency: Securities and other assets and liabilities denominated in foreign currencies are translated into U.S. dollars using exchange rates obtained from an independent third party as of the fund’s pricing time on the valuation date. Realized gains (losses) and unrealized appreciation (depreciation) on investment securities include the effects of changes in exchange rates since the securities were purchased, combined with the effects of changes in security prices. Fluctuations in the value of other assets and liabilities resulting from changes in exchange rates are recorded as unrealized foreign currency gains (losses) until the assets or liabilities are settled in cash, at which time they are recorded as realized foreign currency gains (losses).
3. Futures Contracts: The fund uses futures contracts to invest in fixed income asset classes with greater efficiency and lower cost than is possible through direct investment, to add value when these instruments are attractively priced, or to adjust sensitivity to changes in interest rates. The primary risks associated with the use of futures contracts are imperfect correlation between changes in market values of bonds held by the fund and the prices of futures contracts, and the possibility of an illiquid market. Counterparty risk involving futures is mitigated because a regulated clearinghouse is the counterparty instead of the clearing broker. To further mitigate counterparty risk, the fund trades futures contracts on an exchange, monitors the financial strength of its clearing
26
Emerging Markets Bond Fund
brokers and clearinghouse, and has entered into clearing agreements with its clearing brokers. The clearinghouse imposes initial margin requirements to secure the fund’s performance and requires daily settlement of variation margin representing changes in the market value of each contract.
Futures contracts are valued at their quoted daily settlement prices. The notional amounts of the contracts are not recorded in the Statement of Net Assets. Fluctuations in the value of the contracts are recorded in the Statement of Assets and Liabilities as an asset (liability) and in the Statement of Operations as unrealized appreciation (depreciation) until the contracts are closed, when they are recorded as realized futures gains (losses).
During the year ended September 30, 2018, the fund’s average investments in long and short futures contracts each represented 4% of net assets, based on the average of the notional amounts at each quarter-end during the period.
4. Forward Currency Contracts: The fund enters into forward currency contracts to protect the value of securities and related receivables and payables against changes in future foreign exchange rates. The fund’s risks in using these contracts include movement in the values of the foreign currencies relative to the U.S. dollar and the ability of the counterparties to fulfill their obligations under the contracts. The fund mitigates its counterparty risk by entering into forward currency contracts only with a diverse group of prequalified counterparties, monitoring their financial strength, entering into master netting arrangements with its counterparties, and requiring its counterparties to transfer collateral as security for their performance. In the absence of a default, the collateral pledged or received by the fund cannot be repledged, resold, or rehypothecated. The master netting arrangements provide that, in the event of a counterparty’s default (including bankruptcy), the fund may terminate the forward currency contracts, determine the net amount owed by either party in accordance with its master netting arrangements, and sell or retain any collateral held up to the net amount owed to the fund under the master netting arrangements. The forward currency contracts contain provisions whereby a counterparty may terminate open contracts if the fund’s net assets decline below a certain level, triggering a payment by the fund if the fund is in a net liability position at the time of the termination. The payment amount would be reduced by any collateral the fund has pledged. Any assets pledged as collateral for open contracts are noted in the Statement of Net Assets. The value of collateral received or pledged is compared daily to the value of the forward currency contracts exposure with each counterparty, and any difference, if in excess of a specified minimum transfer amount, is adjusted and settled within two business days.
Forward currency contracts are valued at their quoted daily prices obtained from an independent third party, adjusted for currency risk based on the expiration date of each contract. The notional amounts of the contracts are not recorded in the Statement of Net Assets. Fluctuations in the value of the contracts are recorded in the Statement of Assets and Liabilities as an asset (liability) and in the Statement of Operations as unrealized appreciation (depreciation) until the contracts are closed, when they are recorded as realized forward currency contract gains (losses).
During the year ended September 30, 2018, the fund’s average investment in forward currency contracts represented 14% of net assets, based on the average of notional amounts at each quarter-end during the period.
5. Swap Contracts: The fund invests in credit default swaps to adjust the overall credit risk of the fund or to actively overweight or underweight credit risk to a specific issuer or group of issuers. The fund may sell credit protection through credit default swaps to simulate investments in long positions that are either unavailable or considered to be less attractively priced in the bond market.
27
Emerging Markets Bond Fund
The fund may purchase credit protection through credit default swaps to reduce credit exposure to a given issuer or issuers. Under the terms of the swaps, an up-front payment may be exchanged between the seller and buyer. In addition, the seller of the credit protection receives a periodic payment of premium from the buyer that is a fixed percentage applied to a notional amount. If, for example, the reference entity is subject to a credit event (such as bankruptcy, failure to pay, or obligation acceleration) during the term of the swap, the seller agrees to either physically settle or cash settle the swap contract. If the swap is physically settled, the seller agrees to pay the buyer an amount equal to the notional amount and take delivery of a debt instrument of the reference issuer with a par amount equal to such notional amount. If the swap is cash settled, the seller agrees to pay the buyer the difference between the notional amount and the final price for the relevant debt instrument, as determined either in a market auction or pursuant to a pre-agreed-upon valuation procedure.
The fund enters into interest rate swap transactions to adjust the fund’s sensitivity to changes in interest rates and maintain the ability to generate income at prevailing market rates. Under the terms of the swaps, one party pays the other an amount that is a fixed percentage rate applied to a notional amount. In return, the counterparty agrees to pay a floating rate, which is reset periodically based on short-term interest rates, applied to the same notional amount.
The notional amounts of swap contracts are not recorded in the Statement of Net Assets. Swaps are valued daily based on market quotations received from independent pricing services or recognized dealers and the change in value is recorded in the Statement of Assets and Liabilities as an asset (liability) and in the Statement of Operations as unrealized appreciation (depreciation) until the seller of credit protection is required to take delivery (or, in a cash settled swap, pay the settlement amount determined) upon occurrence of a credit event, periodic payments are made, or the swap terminates, at which time realized gain (loss) is recorded. The net premium to be received or paid by the fund under swap contracts is accrued daily and recorded as realized gain (loss) over the life of the contract.
The primary risk associated with selling credit protection is that, upon the occurrence of a defined credit event, the market value of the debt instrument received by the fund (or, in a cash settled swap, the debt instruments used to determine the settlement payment by the fund) will be significantly less than the amount paid by the fund and, in a physically settled swap, the fund may receive an illiquid debt instrument. A risk associated with all types of swaps is the possibility that a counterparty may default on its obligation to pay net amounts due to the fund. The fund’s maximum amount subject to counterparty risk is the unrealized appreciation on the swap contract. The fund mitigates its counterparty risk by entering into swaps only with a diverse group of prequalified counterparties, monitoring their financial strength, entering into master netting arrangements with its counterparties, and requiring its counterparties to transfer collateral as security for their performance. In the absence of a default, the collateral pledged or received by the fund cannot be repledged, resold, or rehypothecated. In the event of a counterparty’s default (including bankruptcy), the fund may terminate any swap contracts with that counterparty, determine the net amount owed by either party in accordance with its master netting arrangements, and sell or retain any collateral held up to the net amount owed to the fund under the master netting arrangements. The swap contracts contain provisions whereby a counterparty may terminate open contracts if the fund’s net assets decline below a certain level, triggering a payment by the fund if the fund is in a net liability position at the time of the termination. The payment amount would be reduced by any collateral the fund has pledged. Any securities pledged as collateral for open contracts are noted in the Statement of Net
28
Emerging Markets Bond Fund
Assets. The value of collateral received or pledged is compared daily to the value of the swap contracts exposure with each counterparty, and any difference, if in excess of a specified minimum transfer amount, is adjusted and settled within two business days.
The fund enters into centrally cleared interest rate swaps to achieve the same objectives specified with respect to the equivalent over-the-counter swaps but with less counterparty risk because a regulated clearinghouse is the counterparty instead of the clearing broker or executing broker. The clearinghouse imposes initial margin requirements to secure the fund’s performance, and requires daily settlement of variation margin representing changes in the market value of each contract. To further mitigate counterparty risk, the fund trades with a diverse group of prequalified executing brokers; monitors the financial strength of its clearing brokers, executing brokers, and clearinghouse; and has entered into agreements with its clearing brokers and executing brokers.
During the year ended September 30, 2018, the fund’s average amounts of investments in credit protection sold and credit protection purchased represented 10% and 3% of net assets, respectively, based on the average of notional amounts at each quarter-end during the period. The average amount of investments in interest rate swaps represented 2% of net assets, based on the average of notional amounts at each quarter-end during the period.
6. Options: The fund invests in options on foreign currency, which are transacted over-the-counter (OTC) and not on an exchange. Unlike exchange-traded options, which are standardized with respect to the underlying instrument, expiration date, contract size, and strike price, the terms of OTC options generally are established through negotiation with the other party to the option contract. Although this type of arrangement allows the purchaser or writer greater flexibility to tailor an option to its needs, OTC options generally involve greater credit risk than exchange-traded options. Credit risk involves the possibility that a counterparty may default on its obligation to pay net amounts due to the fund. The fund mitigates its counterparty risk by entering into options with a diverse group of prequalified counterparties and monitoring their financial strength. The primary risk associated with purchasing options on foreign currency is that the value of the underlying foreign currencies may move in such a way that the option is out-of-the-money (the exercise price of the option exceeds the value of the underlying investment), the position is worthless at expiration, and the fund loses the premium paid. The primary risk associated with selling options on foreign currency is that the value of the underlying foreign currencies may move in such a way that the option is in-the-money (the exercise price of the option exceeds the value of the underlying investment), the counterparty exercises the option, and the fund loses an amount equal to the market value of the option written less the premium received. Options on foreign currency are valued daily based on market quotations received from independent pricing services or recognized dealers. The premium paid for a purchased option is recorded in the Statement of Assets and Liabilities as an asset that is subsequently adjusted daily to the current market value of the option purchased. The premium received for a written option is recorded in the Statement of Assets and Liabilities as an asset with an equal liability that is subsequently adjusted daily to the current market value of the option written. Fluctuations in the value of the options are recorded as unrealized appreciation (depreciation) until expired, closed, or exercised, at which time realized gains (losses) are recognized.
During the year ended September 30, 2018, the fund’s average value of options purchased and options written represented less than 1% and 0% of net assets, respectively, based on the average market values at each quarter-end during the period.
29
Emerging Markets Bond Fund
7. Federal Income Taxes: The fund intends to continue to qualify as a regulated investment company and distribute all of its taxable income. Management has analyzed the fund’s tax positions taken for all open federal income tax years (September 30, 2016–2018), and has concluded that no provision for federal income tax is required in the fund’s financial statements.
8. Distributions: Distributions to shareholders are recorded on the ex-dividend date. Distributions are determined on a tax basis and may differ from net investment income and realized capital gains for financial reporting purposes.
9. Credit Facility: The fund and certain other funds managed by The Vanguard Group (“Vanguard”) participate in a $3.1 billion committed credit facility provided by a syndicate of lenders pursuant to a credit agreement that may be renewed annually; each fund is individually liable for its borrowings, if any, under the credit facility. Borrowings may be utilized for temporary and emergency purposes, and are subject to the fund’s regulatory and contractual borrowing restrictions. The participating funds are charged administrative fees and an annual commitment fee of 0.10% of the undrawn amount of the facility; these fees are allocated to the funds based on a method approved by the fund’s board of trustees and included in Management and Administrative expenses on the fund’s Statement of Operations. Any borrowings under this facility bear interest at a rate based upon the higher of the one-month London Interbank Offered Rate, federal funds effective rate, or overnight bank funding rate plus an agreed-upon spread.
The fund had no borrowings outstanding at September 30, 2018, or at any time during the period then ended.
10. Other: Interest income includes income distributions received from Vanguard Market Liquidity Fund and is accrued daily. Premiums and discounts on debt securities purchased are amortized and accreted, respectively, to interest income over the lives of the respective securities. Security transactions are accounted for on the date securities are bought or sold. Costs used to determine realized gains (losses) on the sale of investment securities are those of the specific securities sold. Fees assessed on capital share transactions are credited to paid-in capital.
B. In accordance with the terms of a Funds’ Service Agreement (the “FSA”) between Vanguard and the fund, Vanguard furnishes to the fund investment advisory, corporate management, administrative, marketing, and distribution services at Vanguard’s cost of operations (as defined by the FSA). These costs of operations are allocated to the fund based on methods and guidelines approved by the board of trustees. Vanguard does not require reimbursement in the current period for certain costs of operations (such as deferred compensation/benefits and risk/insurance costs); the fund’s liability for these costs of operations is included in Payables to Vanguard on the Statement of Assets and Liabilities. All other costs of operations payable to Vanguard are generally settled twice a month.
Upon the request of Vanguard, the fund may invest up to 0.40% of its net assets as capital in Vanguard. At September 30, 2018, the fund had contributed to Vanguard capital in the amount of $5,000, representing 0.00% of the fund’s net assets and 0.00% of Vanguard’s capitalization. The fund’s trustees and officers are also directors and employees, respectively, of Vanguard.
C. The fund’s custodian bank has agreed to reduce its fees when the fund maintains cash on deposit in the non-interest-bearing custody account. For the year ended September 30, 2018, custodian fee offset arrangements reduced the fund’s expenses by $2,000 (an annual rate of 0.00% of average net assets).
30
Emerging Markets Bond Fund
D. Various inputs may be used to determine the value of the fund’s investments. These inputs are summarized in three broad levels for financial statement purposes. The inputs or methodologies used to value securities are not necessarily an indication of the risk associated with investing in those securities.
Level 1—Quoted prices in active markets for identical securities.
Level 2—Other significant observable inputs (including quoted prices for similar securities, interest rates, prepayment speeds, credit risk, etc.).
Level 3—Significant unobservable inputs (including the fund’s own assumptions used to determine the fair value of investments). Any investments valued with significant unobservable inputs are noted on the Statement of Net Assets.
The following table summarizes the market value of the fund’s investments as of September 30, 2018, based on the inputs used to value them:
| | | |
| | Level 1 | Level 2 | Level 3 |
| Investments | ($000) | ($000) | ($000) |
| Corporate Bonds | — | 2,341 | — |
| Sovereign Bonds | — | 89,947 | |
| Temporary Cash Investments | 8,980 | — | — |
| Options Purchased | 43 | — | — |
| Futures Contracts—Assets1 | 1 | — | — |
| Forward Currency Contracts—Assets | — | 75 | — |
| Forward Currency Contracts— Liabilities | — | (54) | |
| Swap Contracts—Assets | — | 75 | — |
| Swap Contracts—Liabilities | (5)1 | (76) | |
| Total | 9,019 | 92,308 | — |
| 1 Represents variation margin on the last day of the reporting period. | | | |
E. At September 30, 2018, the fair values of derivatives were reflected in the Statement of Assets and Liabilities as follows:
| | | | | |
| | Credit | Currency | Interest Rate | |
| | Contracts | Contracts | Contracts | Total |
| Statement of Assets and Liabilities Caption | ($000) | ($000) | ($000) | ($000) |
| Purchased Options | | — | 43 | — | 43 |
| Unrealized Appreciation—Forward Currency Contracts | — | 75 | — | 75 |
| Unrealized Appreciation—Swap Contracts | | 75 | — | — | 75 |
| Variation Margin Receivable—Futures Contracts | | — | — | 1 | 1 |
| Total Assets | | 75 | 118 | 1 | 194 |
| |
| Unrealized Depreciation—Forward Currency Contracts | — | (54) | — | (54) |
| Unrealized Depreciation —Swap Contracts | | (76) | — | — | (76) |
| Variation Margin Payable—Swap Contracts | | — | — | (5) | (5) |
| Total Liabilities | | (76) | (54) | (5) | (135) |
31
Emerging Markets Bond Fund
Realized net gain (loss) and the change in unrealized appreciation (depreciation) on derivatives for the year ended September 30, 2018, were:
| | | | |
| | Credit | Currency | Interest Rate | |
| | Contracts | Contracts | Contracts | Total |
| Realized Net Gain (Loss) on Derivatives | ($000) | ($000) | ($000) | ($000) |
| Options Purchased | — | (19) | — | (19) |
| Futures Contracts | — | — | 78 | 78 |
| Forward Currency Contracts | — | 379 | — | 379 |
| Swap Contracts | 361 | — | 50 | 411 |
| Realized Net Gain (Loss) on Derivatives | 361 | 360 | 128 | 849 |
| | | | |
| Change in Unrealized Appreciation (Depreciation) on Derivatives | | | |
| Options Purchased | — | 4 | — | 4 |
| Futures Contracts | — | — | (46) | (46) |
| Forward Currency Contracts | — | 10 | — | 10 |
| Swap Contracts | 35 | — | (23) | 12 |
| Change in Unrealized Appreciation | | | | |
| (Depreciation) on Derivatives | 35 | 14 | (69) | (20) |
F. Permanent differences between book-basis and tax-basis components of net assets are reclassified among capital accounts in the financial statements to reflect their tax character. These reclassifications have no effect on net assets or net asset value per share. As of period end, the following permanent differences primarily attributable to the accounting for foreign currency transactions and swap agreements were reclassified to the following accounts:
| Amount
($000) |
| Paid-in Capital | — |
| Undistributed (Overdistributed) Net Investment Income | 320 |
| Accumulated Net Realized Gains (Losses) | (320) |
32
Emerging Markets Bond Fund
Temporary differences between book-basis and tax-basis components of accumulated net earnings (losses) arise when certain items of income, gain, or loss are recognized in different periods for financial statement and tax purposes; these differences will reverse at some time in the future. The differences are primarily related to the tax deferral of losses on wash sales and straddles; the realization of unrealized gains or losses on certain futures contracts, forward currency contracts, options, and swap agreements; payables for distributions and the deferral of post-October capital losses to future periods. As of period end, the tax-basis components of accumulated net earnings (losses) are detailed in the table as follows:
| |
| | Amount |
| | ($000) |
| Undistributed Ordinary Income | 261 |
| Undistributed Long-Term Gains | — |
| Capital Loss Carryforwards (Non-expiring)* | (1,382) |
| Net Unrealized Gains (Losses) | (634) |
* Includes losses of $1,382,000 realized subsequent to October 31, 2017, which are deferred and will be treated as realized for tax purposes in the next fiscal year.
As of September 30, 2018, gross unrealized appreciation and depreciation for investments and derivatives based on cost for U.S. federal income tax purposes were as follows:
| |
| | Amount |
| | ($000) |
| Tax Cost | 102,074 |
| Gross Unrealized Appreciation | 692 |
| Gross Unrealized Depreciation | (1,341) |
| Net Unrealized Appreciation (Depreciation) | (649) |
G. During the year ended September 30, 2018, the fund purchased $276,390,000 of investment securities and sold $196,157,000 of investment securities, other than U.S. government securities and temporary cash investments. Purchases and sales of U.S. government securities were $25,643,000 and 25,545,000 respectively.
33
Emerging Markets Bond Fund
H. Capital share transactions for each class of shares were:
| | | | |
| | | | Year Ended September 30, |
| | | 2018 | | 2017 |
| | Amount | Shares | Amount | Shares |
| | ($000) | (000) | ($000) | (000) |
| Investor Shares | | | | |
| Issued | 53,674 | 5,051 | — | — |
| Issued in Lieu of Cash Distributions | 1,989 | 189 | 1,059 | 103 |
| Redeemed | (41,244) | (4,001) | — | — |
| Net Increase (Decrease)—Investor Shares | 14,419 | 1,239 | 1,059 | 103 |
| Admiral Shares1 | | | | |
| Issued | 97,472 | 4,015 | — | — |
| Issued in Lieu of Cash Distributions | 1,453 | 60 | — | — |
| Redeemed | (21,914) | (909) | — | — |
| Net Increase (Decrease)—Admiral Shares | 77,011 | 3,166 | — | — |
| 1 Inception was December 6, 2017, for Admiral Shares. | | | | |
I. Management has determined that no events or transactions occurred subsequent to September 30, 2018, that would require recognition or disclosure in these financial statements.
34
Report of Independent Registered
Public Accounting Firm
To the Board of Trustees of Vanguard Malvern Funds and Shareholders of Vanguard Emerging
Markets Bond Fund
Opinion on the Financial Statements
We have audited the accompanying statement of net assets and statement of assets and liabilities of Vanguard Emerging Markets Bond Fund (one of the funds constituting Vanguard Malvern Funds, referred to hereafter as the “Fund”) as of September 30, 2018, the related statement of operations for the year ended September 30, 2018, the statement of changes in net assets for each of the two years in the period ended September 30, 2018, including the related notes, and the financial highlights for each of the periods indicated therein (collectively referred to as the “financial statements”). In our opinion, the financial statements present fairly, in all material respects, the financial position of the Fund as of September 30, 2018, the results of its operations for the year then ended, the changes in its net assets for each of the two years in the period ended September 30, 2018 and the financial highlights for each of the periods indicated therein in conformity with accounting principles generally accepted in the United States of America.
Basis for Opinion
These financial statements are the responsibility of the Fund’s management. Our responsibility is to express an opinion on the Fund’s financial statements based on our audits. We are a public accounting firm registered with the Public Company Accounting Oversight Board (United States) (“PCAOB”) and are required to be independent with respect to the Fund in accordance with the U.S. federal securities laws and the applicable rules and regulations of the Securities and Exchange Commission and the PCAOB.
We conducted our audits of these financial statements in accordance with the standards of the PCAOB. Those standards require that we plan and perform the audit to obtain reasonable assurance about whether the financial statements are free of material misstatement, whether due to error or fraud.
Our audits included performing procedures to assess the risks of material misstatement of the financial statements, whether due to error or fraud, and performing procedures that respond to those risks. Such procedures included examining, on a test basis, evidence regarding the amounts and disclosures in the financial statements. Our audits also included evaluating the accounting principles used and significant estimates made by management, as well as evaluating the overall presentation of the financial statements. Our procedures included confirmation of securities owned as of September 30, 2018 by correspondence with the custodians and brokers and by agreement to the underlying ownership records of the transfer agent; when replies were not received from brokers, we performed other auditing procedures. We believe that our audits provide a reasonable basis for our opinion.
/s/PricewaterhouseCoopers LLP
Philadelphia, Pennsylvania
November 15, 2018
We have served as the auditor of one or more investment companies in The Vanguard Group of Funds since 1975.
35
Special 2018 tax information (unaudited) for Vanguard Emerging Markets Bond Fund
This information for the fiscal year ended September 30, 2018, is included pursuant to provisions of the Internal Revenue Code.
The fund distributed $98,000 as capital gain dividends (20% rate gain distributions) to shareholders during the fiscal year.
For nonresident alien shareholders, 100% of short-term capital gain dividends distributed by the fund are qualified short-term capital gains.
36
About Your Fund’s Expenses
As a shareholder of the fund, you incur ongoing costs, which include costs for portfolio management, administrative services, and shareholder reports (like this one), among others. Operating expenses, which are deducted from a fund’s gross income, directly reduce the investment return of the fund.
A fund’s expenses are expressed as a percentage of its average net assets. This figure is known as the expense ratio. The following examples are intended to help you understand the ongoing costs (in dollars) of investing in your fund and to compare these costs with those of other mutual funds. The examples are based on an investment of $1,000 made at the beginning of the period shown and held for the entire period.
The accompanying table illustrates your fund’s costs in two ways:
• Based on actual fund return. This section helps you to estimate the actual expenses that you paid over the period. The ”Ending Account Value“ shown is derived from the fund‘s actual return, and the third column shows the dollar amount that would have been paid by an investor who started with $1,000 in the fund. You may use the information here, together with the amount you invested, to estimate the expenses that you paid over the period.
To do so, simply divide your account value by $1,000 (for example, an $8,600 account value divided by $1,000 = 8.6), then multiply the result by the number given for your fund under the heading ”Expenses Paid During Period.“
• Based on hypothetical 5% yearly return. This section is intended to help you compare your fund‘s costs with those of other mutual funds. It assumes that the fund had a yearly return of 5% before expenses, but that the expense ratio is unchanged. In this case—because the return used is not the fund’s actual return—the results do not apply to your investment. The example is useful in making comparisons because the Securities and Exchange Commission requires all mutual funds to calculate expenses based on a 5% return. You can assess your fund’s costs by comparing this hypothetical example with the hypothetical examples that appear in shareholder reports of other funds.
Note that the expenses shown in the table are meant to highlight and help you compare ongoing costs only and do not reflect transaction costs incurred by the fund for buying and selling securities. Further, the expenses do not include any purchase, redemption, or account service fees described in the fund prospectus. If such fees were applied to your account, your costs would be higher. Your fund does not carry a “sales load.”
The calculations assume no shares were bought or sold during the period. Your actual costs may have been higher or lower, depending on the amount of your investment and the timing of any purchases or redemptions.
You can find more information about the fund’s expenses, including annual expense ratios, in the Financial Statements section of this report. For additional information on operating expenses and other shareholder costs, please refer to your fund’s current prospectus.
37
| | | |
| Six Months Ended September 30, 2018 | | | |
| | Beginning | Ending | Expenses |
| | Account Value | Account Value | Paid During |
| Emerging Markets Bond Fund | 3/31/2018 | 9/30/2018 | Period |
| Based on Actual Fund Return | | | |
| Investor Shares | $1,000.00 | $1,007.57 | $3.02 |
| Admiral Shares | 1,000.00 | 1,008.75 | 2.27 |
| Based on Hypothetical 5% Yearly Return | | | |
| Investor Shares | $1,000.00 | $1,022.06 | $3.04 |
| Admiral Shares | 1,000.00 | 1,022.81 | 2.28 |
The calculations are based on expenses incurred in the most recent six-month period. The fund’s annualized six-month expense ratios for that period are 0.60% for Investor Shares and 0.45% for Admiral Shares. The dollar amounts shown as “Expenses Paid” are equal to the annualized expense ratio multiplied by the average account value over the period, multiplied by the number of days in the most recent six-month period, then divided by the number of days in the most recent 12-month period (183/365).
38
Glossary
30-Day SEC Yield. A fund’s 30-day SEC yield is derived using a formula specified by the U.S. Securities and Exchange Commission. Under the formula, data related to the fund’s security holdings in the previous 30 days are used to calculate the fund’s hypothetical net income for that period, which is then annualized and divided by the fund’s estimated average net assets over the calculation period. For the purposes of this calculation, a security’s income is based on its current market yield to maturity (for bonds), its actual income (for asset-backed securities), or its projected dividend yield (for stocks). Because the SEC yield represents hypothetical annualized income, it will differ—at times significantly—from the fund’s actual experience. As a result, the fund’s income distributions may be higher or lower than implied by the SEC yield.
Average Coupon. The average interest rate paid on the fixed income securities held by a fund. It is expressed as a percentage of face value.
Average Duration. An estimate of how much the value of the bonds held by a fund will fluctuate in response to a change in interest rates. To see how the value could change, multiply the average duration by the change in rates. If interest rates rise by 1 percentage point, the value of the bonds in a fund with an average duration of five years would decline by about 5%. If rates decrease by a percentage point, the value would rise by 5%.
Average Effective Maturity. The average length of time until fixed income securities held by a fund reach maturity and are repaid, taking into consideration the possibility that the issuer may call the bond before its maturity date. The figure reflects the proportion of fund assets represented by each security; it also reflects any futures contracts held. In general, the longer the average effective maturity, the more a fund’s share price will fluctuate in response to changes in market interest rates.
Credit Quality. Credit-quality ratings are measured on a scale that generally ranges from AAA (highest) to D (lowest). U.S. Treasury, U.S. Agency, and U.S. Agency mortgage-backed securities appear under “U.S. Government.” Credit-quality ratings are obtained from Moody’s and S&P, and the higher rating for each issue is shown. ”Not Rated” is used to classify securities for which a rating is not available. Not rated securities include a fund’s investment in Vanguard Market Liquidity Fund or Vanguard Municipal Cash Management Fund, each of which invests in high-quality money market instruments and may serve as a cash management vehicle for the Vanguard funds, trusts, and accounts.
Expense Ratio. A fund’s total annual operating expenses expressed as a percentage of the fund’s average net assets. The expense ratio includes management and administrative expenses, but does not include the transaction costs of buying and selling portfolio securities.
Inception Date. The date on which the assets of a fund (or one of its share classes) are first invested in accordance with the fund’s investment objective. For funds with a subscription period, the inception date is the day after that period ends. Investment performance is measured from the inception date.
Short-Term Reserves. The percentage of a fund invested in highly liquid, short-term securities that can be readily converted to cash.
Yield to Maturity. The rate of return an investor would receive if the fixed income securities held by a fund were held to their maturity dates.
39
This page intentionally left blank.
This page intentionally left blank.
This page intentionally left blank.
The People Who Govern Your Fund
The trustees of your mutual fund are there to see that the fund is operated and managed in your best interests since, as a shareholder, you are a part owner of the fund. Your fund’s trustees also serve on the board of directors of The Vanguard Group, Inc., which is owned by the Vanguard funds and provides services to them on an at-cost basis.
A majority of Vanguard’s board members are independent, meaning that they have no affiliation with Vanguard or the funds they oversee, apart from the sizable personal investments they have made as private individuals. The independent board members have distinguished backgrounds in business, academia, and public service. Each of the trustees and executive officers oversees 211 Vanguard funds.
Information for each trustee and executive officer of the fund appears below. The mailing address of the trustees and officers is P.O. Box 876, Valley Forge, PA 19482. More information about the trustees is in the Statement of Additional Information, which can be obtained, without charge, by contacting Vanguard at 800-662-7447, or online at vanguard.com.
Interested Trustees1
F. William McNabb III
Born in 1957. Trustee since July 2009. Principal occupation(s) during the past five years and other experience: chairman of the board (January 2010–present) of Vanguard and of each of the investment companies served by Vanguard, trustee (2009–present) of each of the investment companies served by Vanguard, and director (2008–present) of Vanguard. Chief executive officer and president (2008–2017) of Vanguard and each of the investment companies served by Vanguard, managing director (1995–2008) of Vanguard, and director (1997–2018) of Vanguard Marketing Corporation. Director (2018–present) of UnitedHealth Group.
Mortimer J. Buckley
Born in 1969. Trustee since January 2018. Principal occupation(s) during the past five years and other experience: chief executive officer (January 2018–present) of Vanguard; chief executive officer, president, and trustee (January 2018–present) of each of the investment companies served by Vanguard; president and director (2017–present) of Vanguard; and president (February 2018–present) of Vanguard Marketing Corporation. Chief investment officer (2013–2017), managing director (2002–2017), head of the Retail Investor Group (2006–2012), and chief information officer (2001–2006) of Vanguard. Chairman of the board (2011–2017) of the Children’s Hospital of Philadelphia.
Independent Trustees
Emerson U. Fullwood
Born in 1948. Trustee since January 2008. Principal occupation(s) during the past five years and other experience: executive chief staff and marketing officer for North America and corporate vice president (retired 2008) of Xerox Corporation (document management products and services). Former president of the Worldwide Channels Group, Latin America, and Worldwide Customer Service and executive chief staff officer of Developing Markets of Xerox. Executive in residence and 2009–2010 Distinguished Minett Professor at the Rochester Institute of Technology. Lead director of SPX FLOW, Inc. (multi-industry manufacturing). Director of the University of Rochester Medical Center, the Monroe Community College Foundation, the United Way of Rochester, North Carolina A&T University, and Roberts Wesleyan College. Trustee of the University of Rochester.
Amy Gutmann
Born in 1949. Trustee since June 2006. Principal occupation(s) during the past five years and other experience: president (2004–present) of the University of Pennsylvania. Christopher H. Browne Distinguished Professor of Political Science, School of Arts and Sciences, and professor of communication, Annenberg School for Communication, with secondary faculty appointments in the Department of Philosophy, School of Arts and Sciences, and at the Graduate School of Education, University of Pennsylvania. Trustee of the National Constitution Center.
1 Mr. McNabb and Mr. Buckley are considered “interested persons,” as defined in the Investment Company Act of 1940, because they are officers of the Vanguard funds.
JoAnn Heffernan Heisen
Born in 1950. Trustee since July 1998. Principal occupation(s) during the past five years and other experience: corporate vice president of Johnson & Johnson (pharmaceuticals/medical devices/consumer products) and member of its executive committee (1997–2008). Chief global diversity officer (retired 2008), vice president and chief information officer (1997–2006), controller (1995–1997), treasurer (1991–1995), and assistant treasurer (1989–1991) of Johnson & Johnson. Director of Skytop Lodge Corporation (hotels) and the Robert Wood Johnson Foundation. Member of the advisory board of the Institute for Women’s Leadership at Rutgers University.
F. Joseph Loughrey
Born in 1949. Trustee since October 2009. Principal occupation(s) during the past five years and other experience: president and chief operating officer (retired 2009) and vice chairman of the board (2008–2009) of Cummins Inc. (industrial machinery). Chairman of the board of Hillenbrand, Inc. (specialized consumer services), Oxfam America, and the Lumina Foundation for Education. Director of the V Foundation for Cancer Research. Member of the advisory council for the College of Arts and Letters and chair of the advisory board to the Kellogg Institute for International Studies, both at the University of Notre Dame.
Mark Loughridge
Born in 1953. Trustee since March 2012. Principal occupation(s) during the past five years and other experience: senior vice president and chief financial officer (retired 2013) of IBM (information technology services). Fiduciary member of IBM’s Retirement Plan Committee (2004–2013), senior vice president and general manager (2002–2004) of IBM Global Financing, vice president and controller (1998–2002) of IBM, and a variety of other prior management roles at IBM. Member of the Council on Chicago Booth.
Scott C. Malpass
Born in 1962. Trustee since March 2012. Principal occupation(s) during the past five years and other experience: chief investment officer (1989–present) and vice president (1996–present) of the University of Notre Dame. Assistant professor of finance at the Mendoza College of Business, University of Notre Dame, and member of the Notre Dame 403(b) Investment Committee. Chairman of the board of TIFF Advisory Services, Inc. Member of the board of Catholic Investment Services, Inc. (investment advisors), the board of advisors for Spruceview Capital Partners, and the board of superintendence of the Institute for the Works of Religion.
Deanna Mulligan
Born in 1963. Trustee since January 2018. Principal occupation(s) during the past five years and other experience: president (2010–present) and chief executive officer (2011–present) of The Guardian Life Insurance Company of America. Chief operating officer (2010–2011) and executive vice president (2008–2010) of Individual Life and Disability of The Guardian Life Insurance Company of America. Member of the board of The Guardian Life Insurance Company of America, the American Council of Life Insurers, the Partnership for New York City (business leadership), and the Committee Encouraging Corporate Philanthropy. Trustee of the Economic Club of New York and the Bruce Museum (arts and science). Member of the Advisory Council for the Stanford Graduate School of Business.
André F. Perold
Born in 1952. Trustee since December 2004. Principal occupation(s) during the past five years and other experience: George Gund Professor of Finance and Banking, Emeritus at the Harvard Business School (retired 2011). Chief investment officer and co-managing partner of HighVista Strategies LLC (private investment firm). Overseer of the Museum of Fine Arts Boston.
Sarah Bloom Raskin
Born in 1961. Trustee since January 2018. Principal occupation(s) during the past five years and other experience: deputy secretary (2014–2017) of the United States Department of the Treasury. Governor (2010–2014) of the Federal Reserve Board. Commissioner (2007–2010) of financial regulation for the State of Maryland. Member of the board of directors (2012–2014) of Neighborhood Reinvestment Corporation. Director of i(x) Investments, LLC.
Peter F. Volanakis
Born in 1955. Trustee since July 2009. Principal occupation(s) during the past five years and other experience: president and chief operating officer (retired 2010) of Corning Incorporated (communications equipment) and director of Corning Incorporated (2000–2010) and Dow Corning (2001–2010). Director (2012) of SPX Corporation (multi-industry manufacturing). Overseer of the Amos Tuck School of Business Administration, Dartmouth College (2001–2013). Chairman of the board of trustees of Colby-Sawyer College. Member of the Board of Hypertherm Inc. (industrial cutting systems, software, and consumables).
Executive Officers
Glenn Booraem
Born in 1967. Principal occupation(s) during the past five years and other experience: principal of Vanguard. Investment stewardship officer (2017–present), treasurer (2015–2017), controller (2010–2015), and assistant controller (2001–2010) of each of the investment companies served by Vanguard.
Christine M. Buchanan
Born in 1970. Principal occupation(s) during the past five years and other experience: principal of Vanguard and global head of Fund Administration at Vanguard. Treasurer (2017–present) of each of the investment companies served by Vanguard. Partner (2005–2017) at KPMG LLP (audit, tax, and advisory services).
Brian Dvorak
Born in 1973. Principal occupation(s) during the past five years and other experience: principal of Vanguard. Chief compliance officer (2017–present) of Vanguard and each of the investment companies served by Vanguard. Assistant vice president (2017–present) of Vanguard Marketing Corporation. Vice president and director of Enterprise Risk Management (2011–2013) at Oppenheimer Funds, Inc.
Thomas J. Higgins
Born in 1957. Principal occupation(s) during the past five years and other experience: principal of Vanguard. Chief financial officer (2008–present) and treasurer (1998–2008) of each of the investment companies served by Vanguard.
Peter Mahoney
Born in 1974. Principal occupation(s) during the past five years and other experience: principal of Vanguard. Controller (2015–present) of each of the investment companies served by Vanguard. Head of International Fund Services (2008–2014) at Vanguard.
Anne E. Robinson
Born in 1970. Principal occupation(s) during the past five years and other experience: general counsel (2016–present) of Vanguard. Secretary (2016–present) of Vanguard and of each of the investment companies served by Vanguard. Managing director (2016–present) of Vanguard. Director and senior vice president (2016–2018) of Vanguard Marketing Corporation. Managing director and general counsel of Global Cards and Consumer Services (2014–2016) at Citigroup. Counsel (2003–2014) at American Express.
Michael Rollings
Born in 1963. Principal occupation(s) during the past five years and other experience: finance director (2017–present) and treasurer (2017) of each of the investment companies served by Vanguard. Managing director (2016–present) of Vanguard. Chief financial officer (2016–present) of Vanguard. Director (2016–present) of Vanguard Marketing Corporation. Executive vice president and chief financial officer (2006–2016) of MassMutual Financial Group.
| |
| Vanguard Senior Management Team |
| |
| Joseph Brennan | Chris D. McIsaac |
| Mortimer J. Buckley | James M. Norris |
| Gregory Davis | Thomas M. Rampulla |
| John James | Karin A. Risi |
| Martha G. King | Anne E. Robinson |
| John T. Marcante | Michael Rollings |
Chairman Emeritus and Senior Advisor
John J. Brennan
Chairman, 1996–2009
Chief Executive Officer and President, 1996–2008
Founder
John C. Bogle
Chairman and Chief Executive Officer, 1974–1996

| |
| | P.O. Box 2600 |
| | Valley Forge, PA 19482-2600 |
| |
| |
| |
| Connect with Vanguard® > vanguard.com |
| |
| |
| |
| Fund Information > 800-662-7447 | Source for Bloomberg Barclays indexes: Bloomberg |
| Direct Investor Account Services > 800-662-2739 | Index Services Limited. Copyright 2018, Bloomberg. All |
| | rights reserved. |
| Institutional Investor Services > 800-523-1036 | |
| Text Telephone for People | |
| Who Are Deaf or Hard of Hearing > 800-749-7273 | |
| |
| This material may be used in conjunction | |
| with the offering of shares of any Vanguard | |
| fund only if preceded or accompanied by | |
| the fund’s current prospectus. | |
| |
| All comparative mutual fund data are from Lipper, a | |
| Thomson Reuters Company, or Morningstar, Inc., unless | |
| otherwise noted. | |
| |
| You can obtain a free copy of Vanguard’s proxy voting | |
| guidelines by visiting vanguard.com/proxyreporting or by | |
| calling Vanguard at 800-662-2739. The guidelines are | |
| also available from the SEC’s website, sec.gov. In | |
| addition, you may obtain a free report on how your fund | |
| voted the proxies for securities it owned during the 12 | |
| months ended June 30. To get the report, visit either | |
| vanguard.com/proxyreporting or sec.gov. | |
| |
| You can review and copy information about your fund at | |
| the SEC’s Public Reference Room in Washington, D.C. To | |
| find out more about this public service, call the SEC at | |
| 202-551-8090. Information about your fund is also | |
| available on the SEC’s website, and you can receive | |
| copies of this information, for a fee, by sending a | |
| request in either of two ways: via email addressed to | |
| publicinfo@sec.gov or via regular mail addressed to the | |
| Public Reference Section, Securities and Exchange | |
| Commission, Washington, DC 20549-1520. | |
| | © 2018 The Vanguard Group, Inc. |
| | All rights reserved. |
| | Vanguard Marketing Corporation, Distributor. |
| |
| | Q14310 112018 |

Annual Report | September 30, 2018
Vanguard Institutional Bond Funds
Vanguard Institutional Short-Term Bond Fund
Vanguard Institutional Intermediate-Term Bond Fund
Vanguard’s Principles for Investing Success
We want to give you the best chance of investment success. These principles, grounded in Vanguard’s research and experience, can put you on the right path.
Goals. Create clear, appropriate investment goals.
Balance. Develop a suitable asset allocation using broadly diversified funds. Cost. Minimize cost.
Discipline. Maintain perspective and long-term discipline.
A single theme unites these principles: Focus on the things you can control.
We believe there is no wiser course for any investor.
| |
| Contents | |
| Your Fund’s Performance at a Glance. | 1 |
| CEO’s Perspective. | 3 |
| Institutional Short-Term Bond Fund. | 5 |
| Institutional Intermediate-Term Bond Fund. | 41 |
| About Your Fund’s Expenses. | 88 |
| Glossary. | 90 |
Please note: The opinions expressed in this report are just that—informed opinions. They should not be considered promises or advice. Also, please keep in mind that the information and opinions cover the period through the date on the front of this report. Of course, the risks of investing in your fund are spelled out in the prospectus.
See the Glossary for definitions of investment terms used in this report.
Your Fund’s Performance at a Glance
• For the 12 months ended September 30, 2018, Vanguard Institutional Short-Term Bond Fund returned 0.67% and Vanguard Institutional Intermediate-Term Bond Fund returned –0.75%. Both funds outpaced their benchmark indexes; the Short-Term Fund also did better than the average for its peer group.
• The bond market was marked by rising rates during the period. Short-term maturities moved higher as the Federal Reserve notched four federal funds rate increases, and longer-term rates rose on brighter prospects for growth and inflation.
• The Intermediate-Term Fund and, to a lesser extent, the Short-Term Fund had durations that were shorter than their benchmarks’, a positive given the rising rate environment. Both funds’ holdings in asset-backed securities also added to relative performance.
• Over the ten years ended September 30, the Short-Term Fund’s average annual return was 2.23% and the Intermediate-Term Fund’s return was 3.25%. Both funds surpassed their benchmark indexes.
| | | | |
| Total Returns: Fiscal Year Ended September 30, 2018 | | | |
| | 30-Day SEC | Income | Capital | Total |
| | Yield | Returns | Returns | Returns |
| Vanguard Institutional Short-Term Bond Fund | | | | |
| Institutional Plus Shares | 2.75% | 2.12% | -1.45% | 0.67% |
| Bloomberg Barclays U.S. 1–3 Year Government/Credit | | | | |
| ex Baa Index | | | | 0.12 |
| 1–5 Year Investment-Grade Debt Funds Average | | | | 0.35 |
| 1–5 Year Investment-Grade Debt Funds Average: Derived from data provided by Lipper, a Thomson Reuters Company. | |
| |
| Vanguard Institutional Intermediate-Term Bond Fund | | | | |
| Institutional Plus Shares | 3.06% | 2.41% | -3.16% | -0.75% |
| Bloomberg Barclays U.S. Intermediate Aggregate ex | | | | |
| Baa Index | | | | -0.98 |
Institutional Plus Shares are available to certain institutional investors who meet specific administrative, service, and account-size criteria.
1
| |
| Total Returns: Ten Years Ended September 30, 2018 | |
| | Average |
| | Annual Return |
| Institutional Short-Term Bond Fund Institutional Plus Shares | 2.23% |
| Bloomberg Barclays U.S. 1–3 Year Government/Credit ex Baa Index | 1.51 |
| 1–5 Year Investment-Grade Debt Funds Average | 2.38 |
| 1–5 Year Investment-Grade Debt Funds Average: Derived from data provided by Lipper, a Thomson Reuters Company. | |
| Institutional Intermediate-Term Bond Fund Institutional Plus Shares | 3.25% |
| Bloomberg Barclays U.S. Intermediate Aggregate ex Baa Index | 3.09 |
The figures shown represent past performance, which is not a guarantee of future results. (Current performance may be lower or higher than the performance data cited. For performance data current to the most recent month-end, visit our website at vanguard.com/performance.) Note, too, that both investment returns and principal value can fluctuate widely, so an investor’s shares, when sold, could be worth more or less than their original cost.
2
CEO’s Perspective

Tim Buckley
President and Chief Executive Officer
Dear Shareholder,
Over the years, I’ve found that prudent investors exhibit a common trait: discipline. No matter how the markets move or what new investing fad hits the headlines, those who stay focused on their goals and tune out the noise are set up for long-term success.
The prime gateway to investing is saving, and you don’t usually become a saver without a healthy dose of discipline. Savers make the decision to sock away part of their income, which means spending less and delaying gratification, no matter how difficult that may be.
Of course, disciplined investing extends beyond diligent saving. The financial markets, in the short term especially, are unpredictable; I have yet to meet the investor who can time them perfectly. It takes discipline to resist the urge to go all-in when markets are frothy or to retreat when things look bleak.
Staying put with your investments is one strategy for handling volatility. Another, rebalancing, requires even more discipline because it means steering your money away from strong performers and toward poorer performers.
Patience—a form of discipline—is also the friend of long-term investors. Higher returns are the potential reward for weathering the market’s turbulence and uncertainty.
3
We have been enjoying one of the longest bull markets in history, but it won’t continue forever. Prepare yourself now for how you will react when volatility comes back. Don’t panic. Don’t chase returns or look for answers outside the asset classes you trust. And be sure to rebalance periodically, even when there’s turmoil.
Whether you’re a master of self-control, get a boost from technology, or work with a professional advisor, know that discipline
is necessary to get the most out of your investment portfolio. And know that Vanguard is with you for the entire ride.
Thank you for your continued loyalty.

Mortimer J. Buckley
President and Chief Executive Officer
October 18, 2018
| | | |
| Market Barometer | | | |
| | | Average Annual Total Returns |
| | Periods Ended September 30, 2018 |
| | One Year | Three Years | Five Years |
| Stocks | | | |
| Russell 1000 Index (Large-caps) | 17.76% | 17.07% | 13.67% |
| Russell 2000 Index (Small-caps) | 15.24 | 17.12 | 11.07 |
| Russell 3000 Index (Broad U.S. market) | 17.58 | 17.07 | 13.46 |
| FTSE All-World ex US Index (International) | 2.13 | 10.18 | 4.51 |
| |
| Bonds | | | |
| Bloomberg Barclays U.S. Aggregate Bond Index | | | |
| (Broad taxable market) | -1.22% | 1.31% | 2.16% |
| Bloomberg Barclays Municipal Bond Index | | | |
| (Broad tax-exempt market) | 0.35 | 2.24 | 3.54 |
| FTSE Three-Month U. S. Treasury Bill Index | 1.57 | 0.80 | 0.48 |
| |
| CPI | | | |
| Consumer Price Index | 2.28% | 1.99% | 1.52% |
4
Institutional Short-Term Bond Fund
Fund Profile
As of September 30, 2018
| | | |
| Financial Attributes | | |
| | | Bloomberg | Bloomberg |
| | | Barclays | Barclays |
| | | U.S. 1–3 | U.S. |
| | | Year | Aggregate |
| | | Gov/Credit | Float |
| | | ex Baa | Adjusted |
| | Fund | Index | Index |
| Number of Bonds | 805 | 984 | 10,112 |
| Yield to Maturity | | | |
| (before expenses) | 3.1% | 2.9% | 3.4% |
| Average Coupon | 2.6% | 2.1% | 3.1% |
| Average Duration | 1.9 years | 1.9 years | 6.1 years |
| Average Effective | | | |
| Maturity | 2.1 years | 2.0 years | 8.4 years |
| Ticker Symbol | VISTX | — | — |
| Expense Ratio1 | 0.02% | — | — |
| 30-Day SEC Yield | 2.75% | — | — |
| Short-Term | | | |
| Reserves | 5.9% | — | — |
| |
| Sector Diversification (% of portfolio) | |
| Asset-Backed | 38.4% |
| Commercial Mortgage-Backed | 2.9 |
| Finance | 22.1 |
| Foreign | 14.8 |
| Industrial | 6.0 |
| Treasury/Agency | 15.3 |
| Utilities | 0.4 |
| Other | 0.1 |
The agency and mortgage-backed securities sectors may include issues from government-sponsored enterprises; such issues are generally not backed by the full faith and credit of the U.S. government.
| | |
| Volatility Measures | | |
| | Bloomberg | |
| | Barclays | Bloomberg |
| | U.S. 1–3 Year | Barclays U.S. |
| | Gov/Credit | Aggregate Float |
| | ex Baa Index | Adjusted Index |
| R-Squared | 0.94 | 0.75 |
| Beta | 0.95 | 0.23 |
These measures show the degree and timing of the fund’s fluctuations compared with the indexes over 36 months.
| |
| Distribution by Credit Quality (% of portfolio) |
| U.S. Government | 14.8% |
| Aaa | 44.1 |
| Aa | 16.7 |
| A | 19.2 |
| Not Rated | 5.2 |
Credit-quality ratings are obtained from Moody’s and S&P, and the higher rating for each issue is shown. “Not Rated” is used to classify securities for which a rating is not available. Not rated securities include a fund’s investment in Vanguard Market Liquidity Fund or Vanguard Municipal Cash Management Fund, each of which invests in high-quality money market instruments and may serve as a cash management vehicle for the Vanguard funds, trusts, and accounts. For more information about these ratings, see the Glossary entry for Credit Quality.
| |
| Distribution by Effective Maturity | |
| (% of portfolio) | |
| Under 1 Year | 28.5% |
| 1 - 3 Years | 51.5 |
| 3 - 5 Years | 16.3 |
| 5 - 7 Years | 2.6 |
| 7 - 10 Years | 1.1 |
1 The expense ratio shown is from the prospectus dated January 26, 2018, and represents estimated costs for the current fiscal year. For the fiscal year ended September 30, 2018, the expense ratio was 0.02%.
5
Institutional Short-Term Bond Fund
Performance Summary
All of the returns in this report represent past performance, which is not a guarantee of future results that may be achieved by the fund. (Current performance may be lower or higher than the performance data cited. For performance data current to the most recent month-end, visit our website at vanguard.com/performance.) Note, too, that both investment returns and principal value can fluctuate widely, so an investor’s shares, when sold, could be worth more or less than their original cost. The returns shown do not reflect taxes that a shareholder would pay on fund distributions or on the sale of fund shares.
Cumulative Performance: September 30, 2008, Through September 30, 2018
Initial Investment of $10,000,000

| | | | |
| | Average Annual Total Returns | |
| | Periods Ended September 30, 2018 | |
| |
| | | | | Final Value |
| | One | Five | Ten | of a $10,000,000 |
| | Year | Years | Years | Investment |
| Institutional Short-Term Bond Fund | | | | |
| Institutional Plus Shares | 0.67% | 1.17% | 2.23% | $12,461,815 |
| Bloomberg Barclays U.S. 1–3 Year | | | | |
| | | | | |
| Government/Credit ex Baa Index | 0.12 | 0.72 | 1.51 | 11,616,272 |
| |
| 1–5 Year Investment-Grade Debt Funds | | | | |
| Average | 0.35 | 1.18 | 2.38 | 12,650,554 |
| Spliced Bloomberg Barclays U.S. | | | | |
| Aggregate Float Adjusted Index | -1.23 | 2.16 | 3.79 | 14,510,440 |
For a benchmark description, see the Glossary.
1–5 Year Investment-Grade Debt Funds Average: Derived from data provided by Lipper, a Thomson Reuters Company.
The fund is the successor to VFTC Short-Term Bond Trust (the predecessor trust), a collective trust managed by Vanguard Fiduciary Trust Company, an affiliate of The Vanguard Group, Inc. The predecessor trust transferred its assets to the fund in connection with the fund’s commencement of operations on or about June 19, 2015. The performance of the fund’s Institutional Plus Shares includes the performance of the predecessor trust prior to the commencement of the fund’s operations. The performance of the predecessor trust has not been adjusted to reflect the expenses of the fund’s Institutional Plus Shares. If the performance of the predecessor trust had been adjusted to reflect the expenses of the fund’s Institutional Plus Shares, the predecessor trust’s performance would have been lower. The fund is managed with the same investment objective, strategies, policies, and risks as the predecessor trust. The predecessor trust was not an investment company and, therefore, was not subject to certain investment restrictions imposed on investment companies by the Investment Company Act of 1940. If the predecessor trust had been an investment company, its performance may have been different.
See Financial Highlights for dividend and capital gains information.
6
Institutional Short-Term Bond Fund
Fiscal-Year Total Returns (%): September 30, 2008, Through September 30, 2018
| | | | |
| | | | | Bloomberg |
| | | | | Barclays |
| | | | | U.S. 1–3 Year |
| | | | | Gov/Credit |
| | | | | ex Baa |
| | | Institutional Plus Shares | Index |
| Fiscal Year | Income Returns | Capital Returns | Total Returns | Total Returns |
| 2009 | 0.00% | 8.70% | 8.70% | 5.70% |
| 2010 | 0.00 | 3.76 | 3.76 | 3.03 |
| 2011 | 0.00 | 1.31 | 1.31 | 1.23 |
| 2012 | 0.00 | 2.21 | 2.21 | 1.16 |
| 2013 | 0.00 | 0.67 | 0.67 | 0.50 |
| 2014 | 0.00 | 1.04 | 1.04 | 0.65 |
| 2015 | 0.35 | 0.95 | 1.30 | 1.24 |
| 2016 | 1.37 | 0.38 | 1.75 | 1.11 |
| 2017 | 1.67 | -0.57 | 1.10 | 0.49 |
| 2018 | 2.12 | -1.45 | 0.67 | 0.12 |
The fund is the successor to VFTC Short-Term Bond Trust (the predecessor trust), a collective trust managed by Vanguard Fiduciary Trust Company, an affiliate of The Vanguard Group, Inc. The predecessor trust transferred its assets to the fund in connection with the fund’s commencement of operations on or about June 19, 2015. The performance of the fund’s Institutional Plus Shares includes the performance of the predecessor trust prior to the commencement of the fund’s operations. The performance of the predecessor trust has not been adjusted to reflect the expenses of the fund’s Institutional Plus Shares. If the performance of the predecessor trust had been adjusted to reflect the expenses of the fund’s Institutional Plus Shares, the predecessor trust’s performance would have been lower. The fund is managed with the same investment objective, strategies, policies, and risks as the predecessor trust. The predecessor trust was not an investment company and, therefore, was not subject to certain investment restrictions imposed on investment companies by the Investment Company Act of 1940. If the predecessor trust had been an investment company, its performance may have been different.
7
Institutional Short-Term Bond Fund
Financial Statements
Statement of Net Assets
As of September 30, 2018
The fund reports a complete list of its holdings in regulatory filings four times in each fiscal year, at the quarter-ends. For the second and fourth fiscal quarters, the lists appear in the fund’s semiannual and annual reports to shareholders. For the first and third fiscal quarters, the fund files the lists with the Securities and Exchange Commission on Form N-Q. Shareholders can look up the fund’s Forms N-Q on the SEC’s website at sec.gov. Forms N-Q may also be reviewed and copied at the SEC’s Public Reference Room (see the back cover of this report for further information).
| | | | | |
| | | | | Face | Market |
| | | | Maturity | Amount | Value • |
| | | Coupon | Date | ($000) | ($000) |
| U. S. Government and Agency Obligations (14.5%) | | | |
| U. S. Government Securities (5.3%) | | | | |
| | United States Treasury Note/Bond | 1.500% | 2/28/19 | 8,500 | 8,471 |
| | United States Treasury Note/Bond | 1.625% | 3/31/19 | 46,000 | 45,820 |
| | United States Treasury Note/Bond | 1.000% | 6/30/19 | 15,000 | 14,834 |
| 1,2 | United States Treasury Note/Bond | 1.375% | 9/30/19 | 13,000 | 12,837 |
| | United States Treasury Note/Bond | 1.000% | 10/15/19 | 50,000 | 49,148 |
| | United States Treasury Note/Bond | 1.750% | 11/30/19 | 1,200 | 1,187 |
| | United States Treasury Note/Bond | 1.875% | 12/31/19 | 10,850 | 10,738 |
| | United States Treasury Note/Bond | 2.000% | 1/31/20 | 3,990 | 3,952 |
| | United States Treasury Note/Bond | 2.250% | 2/29/20 | 1,000 | 993 |
| | United States Treasury Note/Bond | 2.375% | 4/30/20 | 30,900 | 30,712 |
| | United States Treasury Note/Bond | 2.500% | 5/31/20 | 15,000 | 14,930 |
| | United States Treasury Note/Bond | 1.625% | 7/31/20 | 5,000 | 4,895 |
| | United States Treasury Note/Bond | 2.625% | 7/31/20 | 126,661 | 126,245 |
| | United States Treasury Note/Bond | 2.000% | 1/15/21 | 11,400 | 11,186 |
| | United States Treasury Note/Bond | 1.375% | 1/31/21 | 14,000 | 13,534 |
| | United States Treasury Note/Bond | 2.625% | 6/15/21 | 1,570 | 1,560 |
| | United States Treasury Note/Bond | 1.625% | 8/31/22 | 1,600 | 1,523 |
| | United States Treasury Note/Bond | 2.500% | 3/31/23 | 195 | 191 |
| | United States Treasury Note/Bond | 2.875% | 7/31/25 | 60,000 | 59,494 |
| | United States Treasury Note/Bond | 1.625% | 5/15/26 | 1,000 | 905 |
| | | | | | 413,155 |
| Agency Bonds and Notes (9.2%) | | | | |
| 3 | AID-Jordan | 2.578% | 6/30/22 | 15,000 | 14,722 |
| 4 | Federal Home Loan Banks | 0.875% | 10/1/18 | 34,500 | 34,499 |
| 4 | Federal Home Loan Banks | 1.750% | 12/14/18 | 28,000 | 27,971 |
| 4 | Federal Home Loan Banks | 1.375% | 3/18/19 | 31,100 | 30,955 |
| 4 | Federal Home Loan Banks | 5.375% | 5/15/19 | 25,250 | 25,692 |
| 4 | Federal Home Loan Banks | 0.875% | 8/5/19 | 110,200 | 108,614 |
| 5 | Federal Home Loan Mortgage Corp. | 0.875% | 10/12/18 | 79,990 | 79,960 |
| 5 | Federal Home Loan Mortgage Corp. | 2.375% | 2/16/21 | 25,700 | 25,390 |
| 5 | Federal National Mortgage Assn. | 1.375% | 1/28/19 | 17,000 | 16,946 |
| 5 | Federal National Mortgage Assn. | 0.875% | 8/2/19 | 8,550 | 8,428 |
| 5 | Federal National Mortgage Assn. | 2.750% | 6/22/21 | 64,700 | 64,424 |
| 5 | Federal National Mortgage Assn. | 2.875% | 9/12/23 | 234,900 | 233,279 |
| 5 | Federal National Mortgage Assn. | 1.875% | 9/24/26 | 15,250 | 13,852 |
8
| | | | | |
| Institutional Short-Term Bond Fund | | | | |
| |
| |
| |
| | | | | Face | Market |
| | | | Maturity | Amount | Value • |
| | | Coupon | Date | ($000) | ($000) |
| 4 | Financing Corp. | 0.000% | 11/2/18 | 3,380 | 3,374 |
| 4 | Tennessee Valley Authority | 2.250% | 3/15/20 | 30,100 | 29,843 |
| | | | | | 717,949 |
| Conventional Mortgage-Backed Securities (0.0%) | | | |
| 5,6 | Freddie Mac Gold Pool | 6.000% | 4/1/28 | 7 | 8 |
| Total U.S. Government and Agency Obligations (Cost $1,136,527) | | | 1,131,112 |
| Asset-Backed/Commercial Mortgage-Backed Securities (39.3%) | | | |
| 6 | Ally Auto Receivables Trust 2017-5 | 2.220% | 10/17/22 | 3,780 | 3,703 |
| 6 | Ally Auto Receivables Trust 2018-1 | 2.350% | 6/15/22 | 5,600 | 5,547 |
| 6 | Ally Auto Receivables Trust 2018-1 | 2.530% | 2/15/23 | 1,490 | 1,467 |
| 6 | Ally Master Owner Trust Series 2017-3 | 2.040% | 6/15/22 | 18,110 | 17,770 |
| 6 | Ally Master Owner Trust Series 2018-2 | 3.290% | 5/15/23 | 44,820 | 44,808 |
| 6 | Ally Master Owner Trust Series 2018-2 | 3.300% | 7/17/23 | 33,960 | 33,924 |
| 7 | American Tower Trust #1 | 3.652% | 3/23/48 | 430 | 421 |
| 6,7 | Americold 2010 LLC Trust Series 2010-ARTA | 4.954% | 1/14/29 | 3,145 | 3,257 |
| 6 | AmeriCredit Automobile Receivables Trust | | | | |
| | 2016-1 | 1.810% | 10/8/20 | 114 | 113 |
| 6,7 | Aventura Mall Trust 2013-AVM | 3.743% | 12/5/32 | 708 | 716 |
| 6,7 | Aventura Mall Trust 2018-AVM | 4.112% | 7/5/40 | 740 | 753 |
| 6,7 | Avis Budget Rental Car Funding AESOP LLC | | | | |
| | 2017-1A | 3.070% | 9/20/23 | 5,215 | 5,090 |
| 6,7 | Avis Budget Rental Car Funding AESOP LLC | | | | |
| | 2017-2A | 2.970% | 3/20/24 | 6,090 | 5,898 |
| 6,7 | Avis Budget Rental Car Funding AESOP LLC | | | | |
| | 2018-1A | 3.700% | 9/20/24 | 10,720 | 10,672 |
| 6 | Banc of America Commercial Mortgage Trust | | | | |
| | 2015-UBS7 | 3.429% | 9/15/48 | 290 | 289 |
| 6 | Banc of America Commercial Mortgage Trust | | | | |
| | 2015-UBS7 | 3.705% | 9/15/48 | 749 | 749 |
| 6 | Banc of America Commercial Mortgage Trust | | | | |
| | 2017-BNK3 | 3.574% | 2/15/50 | 160 | 157 |
| 6 | BANK 2017 - BNK4 | 3.625% | 5/15/50 | 255 | 252 |
| 6 | BANK 2017 - BNK5 | 3.390% | 6/15/60 | 270 | 262 |
| 6 | BANK 2017 - BNK6 | 3.254% | 7/15/60 | 440 | 421 |
| 6 | BANK 2017 - BNK6 | 3.518% | 7/15/60 | 420 | 410 |
| 6 | BANK 2017 - BNK6 | 3.741% | 7/15/60 | 30 | 29 |
| 6 | BANK 2017 - BNK7 | 3.435% | 9/15/60 | 380 | 368 |
| 6 | BANK 2017 - BNK8 | 3.488% | 11/15/50 | 1,120 | 1,089 |
| 6 | BANK 2017 - BNK9 | 3.538% | 11/15/54 | 505 | 492 |
| 6 | BANK 2018 - BN12 | 4.255% | 5/15/61 | 500 | 516 |
| 6 | BANK 2018 - BN13 | 4.217% | 8/15/61 | 750 | 769 |
| 6 | BANK 2018 - BNK10 | 3.641% | 2/15/61 | 380 | 379 |
| 6 | BANK 2018 - BNK10 | 3.688% | 2/15/61 | 990 | 976 |
| 6 | BANK 2018-BN14 | 4.185% | 9/15/60 | 445 | 458 |
| 6 | BANK 2018-BN14 | 4.231% | 9/15/60 | 890 | 919 |
| 6,7,8 Bank of America Student Loan Trust 2010-1A | 3.135% | 2/25/43 | 2,815 | 2,828 |
| | Bank of Nova Scotia | 1.875% | 4/26/21 | 23,910 | 23,093 |
| 6 | Benchmark 2018-B1 Mortgage Trust | 3.602% | 1/15/51 | 110 | 110 |
| 6 | Benchmark 2018-B1 Mortgage Trust | 3.666% | 1/15/51 | 590 | 584 |
| 6 | Benchmark 2018-B1 Mortgage Trust | 3.878% | 1/15/51 | 60 | 60 |
| 6 | Benchmark 2018-B2 Mortgage Trust | 3.882% | 2/15/51 | 1,750 | 1,761 |
| 6 | Benchmark 2018-B3 Mortgage Trust | 4.025% | 4/10/51 | 580 | 587 |
| 6 | Benchmark 2018-B5 Mortgage Trust | 4.208% | 7/15/51 | 590 | 607 |
9
| | | | | |
| Institutional Short-Term Bond Fund | | | | |
| |
| |
| |
| | | | | Face | Market |
| | | | Maturity | Amount | Value • |
| | | Coupon | Date | ($000) | ($000) |
| 6 | Benchmark 2018-B6 Mortgage Trust | 4.170% | 11/10/51 | 788 | 815 |
| 6 | Benchmark 2018-B6 Mortgage Trust | 4.261% | 11/10/51 | 680 | 704 |
| 6 | BMW Vehicle Lease Trust 2017-2 | 2.070% | 10/20/20 | 12,970 | 12,848 |
| 6 | BMW Vehicle Lease Trust 2017-2 | 2.190% | 3/22/21 | 4,040 | 3,984 |
| 6 | BMW Vehicle Owner Trust 2018-A | 2.510% | 6/25/24 | 2,220 | 2,181 |
| 6,8 | Brazos Higher Education Authority Inc. Series | | | | |
| | 2005-3 | 2.573% | 6/25/26 | 1,799 | 1,788 |
| 6,8 | Brazos Higher Education Authority Inc. Series | | | | |
| | 2011-1 | 3.111% | 2/25/30 | 3,019 | 3,037 |
| 6 | Cabela’s Credit Card Master Note Trust | | | | |
| | 2015-1A | 2.260% | 3/15/23 | 5,850 | 5,778 |
| 6,7 | Canadian Pacer Auto Receivables Trust A | | | | |
| | Series 2017 | 2.050% | 3/19/21 | 1,400 | 1,389 |
| 6,7 | Canadian Pacer Auto Receivables Trust A | | | | |
| | Series 2017 | 2.286% | 1/19/22 | 990 | 975 |
| 6,7 | Canadian Pacer Auto Receivables Trust A | | | | |
| | Series 2018 | 3.220% | 9/19/22 | 4,920 | 4,903 |
| 6 | Capital Auto Receivables Asset Trust 2016-2 | 1.630% | 1/20/21 | 630 | 626 |
| 6 | Capital Auto Receivables Asset Trust 2016-3 | 1.690% | 3/20/21 | 130 | 129 |
| 6,7 | Capital Auto Receivables Asset Trust 2017-1 | 2.020% | 8/20/21 | 240 | 238 |
| 6,7 | Capital Auto Receivables Asset Trust 2017-1 | 2.220% | 3/21/22 | 170 | 167 |
| 6,7 | Capital Auto Receivables Asset Trust 2018-1 | 2.790% | 1/20/22 | 7,030 | 7,004 |
| 6 | Capital One Multi-Asset Execution Trust | | | | |
| | 2017-A4 | 1.990% | 7/17/23 | 8,135 | 7,963 |
| 6,7 | CARDS II Trust 2018-2A | 3.047% | 4/17/23 | 23,940 | 23,899 |
| 6 | CarMax Auto Owner Trust 2014-4 | 1.810% | 7/15/20 | 5,272 | 5,261 |
| 6 | CarMax Auto Owner Trust 2015-2 | 1.800% | 3/15/21 | 6,975 | 6,938 |
| 6 | CarMax Auto Owner Trust 2015-3 | 1.980% | 2/16/21 | 5,435 | 5,398 |
| 6 | CarMax Auto Owner Trust 2016-1 | 1.880% | 6/15/21 | 12,720 | 12,551 |
| 6 | CarMax Auto Owner Trust 2016-4 | 1.400% | 8/15/21 | 21,642 | 21,393 |
| 6 | CarMax Auto Owner Trust 2016-4 | 1.600% | 6/15/22 | 11,690 | 11,313 |
| 6 | CarMax Auto Owner Trust 2017-3 | 2.220% | 11/15/22 | 13,510 | 13,169 |
| 6 | CarMax Auto Owner Trust 2017-4 | 2.110% | 10/17/22 | 7,130 | 7,019 |
| 6 | CarMax Auto Owner Trust 2017-4 | 2.330% | 5/15/23 | 4,040 | 3,941 |
| 6 | CarMax Auto Owner Trust 2018-1 | 2.230% | 5/17/21 | 7,425 | 7,396 |
| 6 | CarMax Auto Owner Trust 2018-1 | 2.480% | 11/15/22 | 10,620 | 10,490 |
| 6 | CarMax Auto Owner Trust 2018-1 | 2.640% | 6/15/23 | 1,680 | 1,652 |
| 6 | CarMax Auto Owner Trust 2018-3 | 3.130% | 6/15/23 | 29,670 | 29,661 |
| 6 | CarMax Auto Owner Trust 2018-3 | 3.270% | 3/15/24 | 14,840 | 14,869 |
| 6 | CD 2016-CD1 Commercial Mortgage Trust | 2.724% | 8/10/49 | 520 | 484 |
| 6 | CD 2017-CD3 Commercial Mortgage Trust | 3.631% | 2/10/50 | 815 | 807 |
| 6 | CD 2017-CD4 Commercial Mortgage Trust | 3.514% | 5/10/50 | 380 | 373 |
| 6 | CD 2017-CD5 Commercial Mortgage Trust | 3.431% | 8/15/50 | 555 | 540 |
| 6 | CD 2017-CD6 Commercial Mortgage Trust | 3.456% | 11/13/50 | 225 | 219 |
| 6 | CenterPoint Energy Transition Bond Co. IV LLC | | | | |
| | 2012-1 | 2.161% | 10/15/21 | 7,729 | 7,686 |
| 6,7 | CFCRE Commercial Mortgage Trust 2011-C2 | 5.947% | 12/15/47 | 2,072 | 2,193 |
| 6 | CFCRE Commercial Mortgage Trust 2016-C4 | 3.283% | 5/10/58 | 472 | 456 |
| 6,7 | Chesapeake Funding II LLC 2018-1 | 3.040% | 4/15/30 | 24,730 | 24,639 |
| 6,7 | Chrysler Capital Auto Receivables Trust | | | | |
| | 2015-BA | 2.260% | 10/15/20 | 6,345 | 6,342 |
| 6,7 | Chrysler Capital Auto Receivables Trust | | | | |
| | 2016-AA | 1.960% | 1/18/22 | 22,740 | 22,666 |
| 6,7 | Chrysler Capital Auto Receivables Trust | | | | |
| | 2016-BA | 1.640% | 7/15/21 | 8,232 | 8,185 |
10
| | | | | |
| Institutional Short-Term Bond Fund | | | | |
| |
| |
| |
| | | | | Face | Market |
| | | | Maturity | Amount | Value • |
| | | Coupon | Date | ($000) | ($000) |
| 6,7 | Chrysler Capital Auto Receivables Trust | | | | |
| | 2016-BA | 1.870% | 2/15/22 | 6,210 | 6,110 |
| 6 | Citibank Credit Card Issuance Trust | | | | |
| | 2018-A1 | 2.490% | 1/20/23 | 1,950 | 1,921 |
| 6,7 | Citigroup Commercial Mortgage Trust | | | | |
| | 2012-GC8 | 3.683% | 9/10/45 | 450 | 450 |
| 6 | Citigroup Commercial Mortgage Trust | | | | |
| | 2013-GC11 | 3.093% | 4/10/46 | 952 | 935 |
| 6 | Citigroup Commercial Mortgage Trust | | | | |
| | 2013-GC15 | 3.942% | 9/10/46 | 279 | 282 |
| 6 | Citigroup Commercial Mortgage Trust | | | | |
| | 2014-GC19 | 4.023% | 3/10/47 | 3,415 | 3,492 |
| 6 | Citigroup Commercial Mortgage Trust | | | | |
| | 2014-GC21 | 3.575% | 5/10/47 | 1,207 | 1,214 |
| 6 | Citigroup Commercial Mortgage Trust | | | | |
| | 2014-GC21 | 3.855% | 5/10/47 | 2,026 | 2,049 |
| 6 | Citigroup Commercial Mortgage Trust | | | | |
| | 2014-GC23 | 3.622% | 7/10/47 | 756 | 756 |
| 6 | Citigroup Commercial Mortgage Trust | | | | |
| | 2014-GC23 | 3.863% | 7/10/47 | 255 | 256 |
| 6 | Citigroup Commercial Mortgage Trust | | | | |
| | 2014-GC25 | 3.372% | 10/10/47 | 591 | 582 |
| 6 | Citigroup Commercial Mortgage Trust | | | | |
| | 2014-GC25 | 3.635% | 10/10/47 | 3,132 | 3,127 |
| 6 | Citigroup Commercial Mortgage Trust | | | | |
| | 2015-GC27 | 3.137% | 2/10/48 | 50 | 48 |
| 6 | Citigroup Commercial Mortgage Trust | | | | |
| | 2015-GC31 | 3.762% | 6/10/48 | 950 | 953 |
| 6 | Citigroup Commercial Mortgage Trust | | | | |
| | 2015-GC33 | 3.778% | 9/10/58 | 3,505 | 3,525 |
| 6 | Citigroup Commercial Mortgage Trust | | | | |
| | 2016-C1 | 3.209% | 5/10/49 | 1,456 | 1,403 |
| 6 | Citigroup Commercial Mortgage Trust | | | | |
| | 2016-P4 | 2.902% | 7/10/49 | 240 | 226 |
| 6 | Citigroup Commercial Mortgage Trust | | | | |
| | 2017-C4 | 3.471% | 10/12/50 | 520 | 505 |
| 6 | Citigroup Commercial Mortgage Trust | | | | |
| | 2017-P8 | 3.465% | 9/15/50 | 1,035 | 1,005 |
| 6 | Citigroup Commercial Mortgage Trust | | | | |
| | 2018-C5 | 4.228% | 6/10/51 | 230 | 237 |
| 6 | CNH Equipment Trust 2016-B | 1.970% | 11/15/21 | 9,000 | 8,854 |
| 6 | CNH Equipment Trust 2017-B | 2.170% | 4/17/23 | 5,460 | 5,330 |
| 6 | COMM 2012-CCRE2 Mortgage Trust | 3.147% | 8/15/45 | 363 | 359 |
| 6 | COMM 2012-CCRE2 Mortgage Trust | 3.791% | 8/15/45 | 901 | 895 |
| 6 | COMM 2012-CCRE3 Mortgage Trust | 2.822% | 10/15/45 | 580 | 567 |
| 6,7 | COMM 2012-CCRE3 Mortgage Trust | 3.416% | 10/15/45 | 340 | 335 |
| 6 | COMM 2012-CCRE4 Mortgage Trust | 2.853% | 10/15/45 | 550 | 536 |
| 6 | COMM 2012-CCRE5 Mortgage Trust | 2.771% | 12/10/45 | 291 | 284 |
| 6 | COMM 2013-CCRE11 Mortgage Trust | 3.983% | 8/10/50 | 924 | 938 |
| 6 | COMM 2013-CCRE11 Mortgage Trust | 4.258% | 8/10/50 | 813 | 840 |
| 6 | COMM 2013-CCRE12 Mortgage Trust | 3.623% | 10/10/46 | 530 | 534 |
| 6 | COMM 2013-CCRE12 Mortgage Trust | 4.046% | 10/10/46 | 1,152 | 1,179 |
| 6 | COMM 2013-CCRE13 Mortgage Trust | 4.194% | 11/10/46 | 837 | 864 |
| 6 | COMM 2013-CCRE8 Mortgage Trust | 3.612% | 6/10/46 | 20 | 20 |
| 6 | COMM 2013-CCRE9 Mortgage Trust | 4.375% | 7/10/45 | 1,194 | 1,237 |
11
| | | | | |
| Institutional Short-Term Bond Fund | | | | |
| |
| |
| |
| | | | | Face | Market |
| | | | Maturity | Amount | Value • |
| | | Coupon | Date | ($000) | ($000) |
| 6,7 | COMM 2013-CCRE9 Mortgage Trust | 4.399% | 7/10/45 | 3,169 | 3,253 |
| 6,7 | COMM 2013-LC13 Mortgage Trust | 3.774% | 8/10/46 | 406 | 410 |
| 6 | COMM 2013-LC13 Mortgage Trust | 4.205% | 8/10/46 | 150 | 155 |
| 6 | COMM 2013-LC6 Mortgage Trust | 2.941% | 1/10/46 | 984 | 966 |
| 6,7 | COMM 2013-SFS Mortgage Trust | 3.086% | 4/12/35 | 1,098 | 1,070 |
| 6 | COMM 2014-CCRE14 Mortgage Trust | 3.955% | 2/10/47 | 20 | 20 |
| 6 | COMM 2014-CCRE14 Mortgage Trust | 4.236% | 2/10/47 | 495 | 512 |
| 6 | COMM 2014-CCRE15 Mortgage Trust | 4.074% | 2/10/47 | 30 | 31 |
| 6 | COMM 2014-CCRE17 Mortgage Trust | 3.977% | 5/10/47 | 1,060 | 1,081 |
| 6 | COMM 2014-CCRE17 Mortgage Trust | 4.174% | 5/10/47 | 350 | 356 |
| 6 | COMM 2014-CCRE18 Mortgage Trust | 3.550% | 7/15/47 | 350 | 349 |
| 6 | COMM 2014-CCRE18 Mortgage Trust | 3.828% | 7/15/47 | 3,106 | 3,143 |
| 6 | COMM 2014-CCRE20 Mortgage Trust | 3.326% | 11/10/47 | 80 | 78 |
| 6 | COMM 2014-CCRE20 Mortgage Trust | 3.590% | 11/10/47 | 2,492 | 2,489 |
| 6 | COMM 2014-CCRE21 Mortgage Trust | 3.528% | 12/10/47 | 1,328 | 1,321 |
| 6 | COMM 2014-LC17 Mortgage Trust | 3.917% | 10/10/47 | 1,987 | 2,017 |
| 6 | COMM 2015-CCRE22 Mortgage Trust | 3.309% | 3/10/48 | 855 | 840 |
| 6 | COMM 2015-CCRE24 Mortgage Trust | 3.696% | 8/10/48 | 855 | 855 |
| 6 | COMM 2015-CCRE25 Mortgage Trust | 3.759% | 8/10/48 | 976 | 981 |
| 6 | COMM 2015-CCRE27 Mortgage Trust | 3.612% | 10/10/48 | 487 | 484 |
| 6 | COMM 2015-LC19 Mortgage Trust | 3.183% | 2/10/48 | 44 | 43 |
| 6,7 | Core Industrial Trust 2015-TEXW | 3.077% | 2/10/34 | 496 | 492 |
| 6 | CSAIL 2015-C4 Commercial Mortgage Trust | 3.808% | 11/15/48 | 1,944 | 1,952 |
| 6 | CSAIL 2016-C7 Commercial Mortgage Trust | 3.502% | 11/15/49 | 1,240 | 1,209 |
| 6 | CSAIL 2017-C8 Commercial Mortgage Trust | 3.392% | 6/15/50 | 520 | 501 |
| 6 | CSAIL 2018-CX12 Commercial Mortgage Trust | 4.224% | 8/15/51 | 970 | 997 |
| 6,7 | Daimler Trucks Retail Trust 2018-1 | 2.850% | 7/15/21 | 42,760 | 42,682 |
| 6,7 | Daimler Trucks Retail Trust 2018-1 | 3.030% | 11/15/24 | 11,840 | 11,809 |
| 6 | DBJPM 17-C6 Mortgage Trust | 3.328% | 6/10/50 | 740 | 715 |
| 6,7 | Dell Equipment Finance Trust 2017-2 | 1.970% | 2/24/20 | 6,800 | 6,776 |
| 6,7 | Dell Equipment Finance Trust 2017-2 | 2.190% | 10/24/22 | 5,940 | 5,875 |
| 6,7 | Dell Equipment Finance Trust 2018-1 | 2.970% | 10/22/20 | 12,152 | 12,155 |
| 6,7 | DLL Securitization Trust Series 2018-1 | 3.100% | 4/18/22 | 13,535 | 13,505 |
| 7 | DNB Boligkreditt AS | 2.500% | 3/28/22 | 9,910 | 9,633 |
| 6,7,9 Edsouth Indenture No 9 LLC 2015-1 | 3.016% | 10/25/56 | 674 | 674 |
| 6,7 | Enterprise Fleet Financing LLC Series 2015-1 | 1.740% | 9/20/20 | 212 | 212 |
| 6,7 | Enterprise Fleet Financing LLC Series 2015-2 | 2.090% | 2/22/21 | 11,028 | 11,002 |
| 6,7 | Enterprise Fleet Financing LLC Series 2016-1 | 2.080% | 9/20/21 | 1,480 | 1,473 |
| 5,6 | Fannie Mae Grantor Trust 2017-T1 | 2.898% | 6/25/27 | 13,006 | 12,290 |
| 6 | Fifth Third Auto Trust 2017-1 | 2.030% | 7/15/24 | 13,390 | 13,040 |
| 6,9 | First National Master Note Trust 2017-1 | 2.558% | 4/18/22 | 14,990 | 15,001 |
| 6,9 | First National Master Note Trust 2017-2 | 2.598% | 10/16/23 | 6,030 | 6,035 |
| 6 | Ford Credit Auto Lease Trust 2017-B | 2.030% | 12/15/20 | 6,520 | 6,465 |
| 6 | Ford Credit Auto Lease Trust 2017-B | 2.170% | 2/15/21 | 3,300 | 3,259 |
| 6 | Ford Credit Auto Lease Trust 2018-A | 2.930% | 6/15/21 | 58,340 | 58,191 |
| 6 | Ford Credit Auto Lease Trust 2018-A | 3.050% | 8/15/21 | 5,350 | 5,328 |
| 6 | Ford Credit Auto Lease Trust 2018-B | 3.190% | 12/15/21 | 15,260 | 15,270 |
| 6 | Ford Credit Auto Lease Trust 2018-B | 3.300% | 2/15/22 | 5,390 | 5,392 |
| 6,7 | Ford Credit Auto Owner Trust 2014-REV1 | 2.260% | 11/15/25 | 15,479 | 15,428 |
| 6,7 | Ford Credit Auto Owner Trust 2014-REV2 | 2.310% | 4/15/26 | 2,930 | 2,911 |
| 6,7 | Ford Credit Auto Owner Trust 2015-REV2 | 2.440% | 1/15/27 | 39,000 | 38,520 |
| 6,7 | Ford Credit Auto Owner Trust 2016-REV1 | 2.310% | 8/15/27 | 36,545 | 35,749 |
| 6,7 | Ford Credit Auto Owner Trust 2016-REV2 | 2.030% | 12/15/27 | 33,000 | 31,938 |
| 6,7 | Ford Credit Auto Owner Trust 2017-1 | 2.620% | 8/15/28 | 61,220 | 59,632 |
| 6,7 | Ford Credit Auto Owner Trust 2017-2 | 2.360% | 3/15/29 | 30,610 | 29,373 |
12
| | | | | |
| Institutional Short-Term Bond Fund | | | | |
| |
| |
| |
| | | | | Face | Market |
| | | | Maturity | Amount | Value • |
| | | Coupon | Date | ($000) | ($000) |
| 6,7 | Ford Credit Auto Owner Trust 2018-2 | 3.470% | 1/15/30 | 31,840 | 31,773 |
| 6 | Ford Credit Auto Owner Trust 2018-A | 3.030% | 11/15/22 | 26,200 | 26,171 |
| 6,7 | Ford Credit Auto Owner Trust 2018-REV1 | 3.190% | 7/15/31 | 6,560 | 6,386 |
| 6 | Ford Credit Floorplan Master Owner Trust A | | | | |
| | Series 2015-5 | 2.390% | 8/15/22 | 2,115 | 2,083 |
| 6 | Ford Credit Floorplan Master Owner Trust A | | | | |
| | Series 2017-1 | 2.070% | 5/15/22 | 66,150 | 65,083 |
| 6 | Ford Credit Floorplan Master Owner Trust A | | | | |
| | Series 2017-2 | 2.160% | 9/15/22 | 30,110 | 29,563 |
| 6 | Ford Credit Floorplan Master Owner Trust A | | | | |
| | Series 2018-1 | 2.950% | 5/15/23 | 40,300 | 40,005 |
| 6 | GM Financial Automobile Leasing Trust 2017-1 | 2.260% | 8/20/20 | 9,200 | 9,136 |
| 6 | GM Financial Automobile Leasing Trust 2017-2 | 2.180% | 6/21/21 | 6,180 | 6,109 |
| 6 | GM Financial Automobile Leasing Trust 2017-3 | 1.720% | 1/21/20 | 18,598 | 18,526 |
| 6 | GM Financial Automobile Leasing Trust 2017-3 | 2.010% | 11/20/20 | 12,170 | 12,067 |
| 6 | GM Financial Automobile Leasing Trust 2017-3 | 2.120% | 9/20/21 | 3,710 | 3,658 |
| 6 | GM Financial Automobile Leasing Trust 2018-1 | 2.610% | 1/20/21 | 24,920 | 24,758 |
| 6 | GM Financial Automobile Leasing Trust 2018-2 | 3.060% | 6/21/21 | 29,110 | 29,124 |
| 6 | GM Financial Automobile Leasing Trust 2018-3 | 3.180% | 6/21/21 | 10,950 | 10,945 |
| 6 | GM Financial Automobile Leasing Trust 2018-3 | 3.300% | 7/20/22 | 2,150 | 2,150 |
| 6,7 | GM Financial Consumer Automobile 2017-3 | 2.130% | 3/16/23 | 4,260 | 4,141 |
| 6 | GM Financial Consumer Automobile 2018-2 | 3.020% | 12/18/23 | 5,945 | 5,891 |
| 6 | GM Financial Consumer Automobile 2018-3 | 3.020% | 5/16/23 | 31,600 | 31,523 |
| 6 | GM Financial Consumer Automobile 2018-3 | 3.160% | 1/16/24 | 9,990 | 9,954 |
| 6,7 | GMF Floorplan Owner Revolving Trust 2017-2 | 2.130% | 7/15/22 | 29,660 | 28,981 |
| 6,7 | GMF Floorplan Owner Revolving Trust 2018-2 | 3.130% | 3/15/23 | 27,050 | 26,954 |
| 6,7 | Golden Credit Card Trust 2015-2A | 2.020% | 4/15/22 | 940 | 924 |
| 6,7 | Golden Credit Card Trust 2016-5A | 1.600% | 9/15/21 | 80,100 | 79,093 |
| 6,7,9 Golden Credit Card Trust 2017-4A | 2.678% | 7/15/24 | 20,690 | 20,714 |
| 6,7 | Golden Credit Card Trust 2018-1A | 2.620% | 1/15/23 | 22,260 | 21,930 |
| 6,7 | Golden Credit Card Trust 2018-4A | 3.440% | 10/15/25 | 31,290 | 31,168 |
| 6,7,8 Gosforth Funding 2016-1A plc | 3.014% | 2/15/58 | 13,219 | 13,243 |
| 6,7,8 Gosforth Funding 2018-1A plc | 2.714% | 8/25/60 | 19,820 | 19,824 |
| 6,7 | GreatAmerica Leasing Receivables Funding | | | | |
| | LLC Series 2015-1 | 2.020% | 6/21/21 | 52 | 52 |
| 6,7 | GreatAmerica Leasing Receivables Funding | | | | |
| | LLC Series 2016-1 | 1.990% | 4/20/22 | 1,100 | 1,092 |
| 6,7 | GreatAmerica Leasing Receivables Funding | | | | |
| | LLC Series 2018-1 | 2.600% | 6/15/21 | 3,970 | 3,934 |
| 6,7 | GreatAmerica Leasing Receivables Funding | | | | |
| | LLC Series 2018-1 | 2.830% | 6/17/24 | 2,580 | 2,545 |
| 6 | GS Mortgage Securities Corporation II | | | | |
| | 2015-GC30 | 3.382% | 5/10/50 | 5 | 5 |
| 6,7 | GS Mortgage Securities Trust 2012-GC6 | 4.948% | 1/10/45 | 217 | 224 |
| 6 | GS Mortgage Securities Trust 2013-GC13 | 4.185% | 7/10/46 | 1,338 | 1,373 |
| 6 | GS Mortgage Securities Trust 2013-GCJ12 | 3.135% | 6/10/46 | 1,176 | 1,159 |
| 6 | GS Mortgage Securities Trust 2013-GCJ14 | 3.955% | 8/10/46 | 60 | 61 |
| 6 | GS Mortgage Securities Trust 2014-GC20 | 3.998% | 4/10/47 | 3,596 | 3,668 |
| 6 | GS Mortgage Securities Trust 2014-GC24 | 3.931% | 9/10/47 | 110 | 111 |
| 6 | GS Mortgage Securities Trust 2014-GC24 | 4.162% | 9/10/47 | 60 | 60 |
| 6 | GS Mortgage Securities Trust 2014-GC26 | 3.364% | 11/10/47 | 620 | 608 |
| 6 | GS Mortgage Securities Trust 2014-GC26 | 3.629% | 11/10/47 | 1,380 | 1,379 |
| 6 | GS Mortgage Securities Trust 2015-GC28 | 3.136% | 2/10/48 | 460 | 448 |
| 6 | GS Mortgage Securities Trust 2015-GC28 | 3.396% | 2/10/48 | 80 | 79 |
| 6 | GS Mortgage Securities Trust 2015-GC34 | 3.506% | 10/10/48 | 1,170 | 1,150 |
13
| | | | | |
| Institutional Short-Term Bond Fund | | | | |
| |
| |
| |
| | | | | Face | Market |
| | | | Maturity | Amount | Value • |
| | | Coupon | Date | ($000) | ($000) |
| 6 | GS Mortgage Securities Trust 2016-GS3 | 2.850% | 10/10/49 | 550 | 516 |
| 6 | GS Mortgage Securities Trust 2018-GS10 | 4.155% | 7/10/51 | 1,110 | 1,134 |
| 6,7 | Hertz Vehicle Financing II LP 2015-3A | 2.670% | 9/25/21 | 10,525 | 10,338 |
| 6,7 | Hertz Vehicle Financing II LP 2016-2A | 2.950% | 3/25/22 | 8,760 | 8,619 |
| 6,7 | Hertz Vehicle Financing II LP 2016-3A | 2.270% | 7/25/20 | 2,865 | 2,848 |
| 6,7 | Hertz Vehicle Financing II LP 2018-1A | 3.290% | 2/25/24 | 2,430 | 2,362 |
| 6,7 | Hertz Vehicle Financing LLC 2017-2A | 3.290% | 10/25/23 | 1,503 | 1,464 |
| 6,7,8 Holmes Master Issuer plc 2018-1 | 2.699% | 10/15/54 | 14,680 | 14,660 |
| 6,7,8 Holmes Master Issuer plc 2018-2A | 2.561% | 10/15/54 | 27,420 | 27,309 |
| 6 | Honda Auto Receivables 2017-3 Owner Trust | 1.980% | 11/20/23 | 8,510 | 8,291 |
| 6 | Honda Auto Receivables 2017-4 Owner Trust | 2.050% | 11/22/21 | 1,810 | 1,788 |
| 6 | Honda Auto Receivables 2017-4 Owner Trust | 2.210% | 3/21/24 | 2,900 | 2,840 |
| 6 | Honda Auto Receivables 2018-2 Owner Trust | 3.010% | 5/18/22 | 13,990 | 13,966 |
| 6 | Honda Auto Receivables 2018-3 Owner Trust | 2.950% | 8/22/22 | 22,120 | 22,051 |
| 6 | Honda Auto Receivables 2018-3 Owner Trust | 3.070% | 11/21/24 | 8,110 | 8,068 |
| 6,7 | Houston Galleria Mall Trust 2015-HGLR | 3.087% | 3/5/37 | 960 | 921 |
| 6,7 | Hyundai Auto Lease Securitization Trust 2017-B | 2.130% | 3/15/21 | 15,120 | 14,968 |
| 6,7 | Hyundai Auto Lease Securitization Trust 2017-C | 2.120% | 2/16/21 | 11,080 | 10,994 |
| 6,7 | Hyundai Auto Lease Securitization Trust 2017-C | 2.210% | 9/15/21 | 2,180 | 2,155 |
| 6,7 | Hyundai Auto Lease Securitization Trust 2018-A | 2.810% | 4/15/21 | 26,050 | 25,956 |
| 6,7 | Hyundai Auto Lease Securitization Trust 2018-A | 2.890% | 3/15/22 | 8,250 | 8,193 |
| 6,7 | Hyundai Auto Lease Securitization Trust 2018-B | 3.040% | 10/15/21 | 25,740 | 25,696 |
| 6,7 | Hyundai Auto Lease Securitization Trust 2018-B | 3.200% | 6/15/22 | 3,290 | 3,284 |
| 6 | Hyundai Auto Receivables Trust 2017-B | 1.960% | 2/15/23 | 6,960 | 6,768 |
| 6,7 | Hyundai Floorplan Master Owner Trust | | | | |
| | Series 2016-1A | 1.810% | 3/15/21 | 8,360 | 8,327 |
| 6,8 | Illinois Student Assistance Commission | | | | |
| | Series 2010-1 | 3.385% | 4/25/22 | 238 | 238 |
| 6,7 | Irvine Core Office Trust 2013-IRV | 3.279% | 5/15/48 | 2,036 | 2,009 |
| 6 | John Deere Owner Trust 2015-B | 1.780% | 6/15/22 | 1,965 | 1,961 |
| 6 | John Deere Owner Trust 2016-B | 1.490% | 5/15/23 | 2,135 | 2,103 |
| 6 | John Deere Owner Trust 2017-A | 2.110% | 12/15/23 | 11,350 | 11,208 |
| 6 | John Deere Owner Trust 2017-B | 2.110% | 7/15/24 | 6,770 | 6,556 |
| 6 | John Deere Owner Trust 2018-B | 3.080% | 11/15/22 | 36,300 | 36,223 |
| 6 | John Deere Owner Trust 2018-B | 3.230% | 6/16/25 | 11,550 | 11,501 |
| 6,7 | JP Morgan Chase Commercial Mortgage | | | | |
| | Securities Trust 2010-C1 | 4.608% | 6/15/43 | 83 | 85 |
| 6,7 | JP Morgan Chase Commercial Mortgage | | | | |
| | Securities Trust 2010-C2 | 4.070% | 11/15/43 | 362 | 367 |
| 6,7 | JP Morgan Chase Commercial Mortgage | | | | |
| | Securities Trust 2011-C3 | 4.717% | 2/15/46 | 1,560 | 1,602 |
| 6,7 | JP Morgan Chase Commercial Mortgage | | | | |
| | Securities Trust 2011-C5 | 5.586% | 8/15/46 | 867 | 904 |
| 6,7 | JP Morgan Chase Commercial Mortgage | | | | |
| | Securities Trust 2011-RR1 | 4.717% | 3/16/46 | 4,957 | 5,054 |
| 6 | JP Morgan Chase Commercial Mortgage | | | | |
| | Securities Trust 2012-C8 | 2.829% | 10/15/45 | 381 | 373 |
| 6,7 | JP Morgan Chase Commercial Mortgage | | | | |
| | Securities Trust 2012-C8 | 3.424% | 10/15/45 | 1,627 | 1,610 |
| 6,7 | JP Morgan Chase Commercial Mortgage | | | | |
| | Securities Trust 2012-HSBC | 3.093% | 7/5/32 | 1,124 | 1,115 |
| 6 | JP Morgan Chase Commercial Mortgage | | | | |
| | Securities Trust 2013-C13 | 3.994% | 1/15/46 | 2,283 | 2,333 |
| 6 | JP Morgan Chase Commercial Mortgage | | | | |
| | Securities Trust 2013-C16 | 3.674% | 12/15/46 | 363 | 366 |
14
| | | | |
| Institutional Short-Term Bond Fund | | | | |
| |
| |
| |
| | | | Face | Market |
| | | Maturity | Amount | Value • |
| | Coupon | Date | ($000) | ($000) |
| 6 JP Morgan Chase Commercial Mortgage | | | | |
| Securities Trust 2013-C16 | 3.881% | 12/15/46 | 264 | 268 |
| 6 JP Morgan Chase Commercial Mortgage | | | | |
| Securities Trust 2013-C16 | 4.166% | 12/15/46 | 1,250 | 1,287 |
| 6 JP Morgan Chase Commercial Mortgage | | | | |
| Securities Trust 2013-LC11 | 2.960% | 4/15/46 | 1,315 | 1,288 |
| 6 JP Morgan Chase Commercial Mortgage | | | | |
| Securities Trust 2014-C20 | 3.461% | 7/15/47 | 360 | 361 |
| 6 JP Morgan Chase Commercial Mortgage | | | | |
| Securities Trust 2016-JP3 | 2.870% | 8/15/49 | 1,650 | 1,550 |
| 6 JP Morgan Chase Commercial Mortgage | | | | |
| Securities Trust 2016-JP4 | 3.648% | 12/15/49 | 110 | 109 |
| 6 JP Morgan Chase Commercial Mortgage | | | | |
| Securities Trust 2017-JP6 | 3.490% | 7/15/50 | 310 | 303 |
| 6 JPMBB Commercial Mortgage Securities | | | | |
| Trust 2013-C12 | 3.664% | 7/15/45 | 2,043 | 2,060 |
| 6 JPMBB Commercial Mortgage Securities | | | | |
| Trust 2013-C12 | 4.171% | 7/15/45 | 1,835 | 1,857 |
| 6 JPMBB Commercial Mortgage Securities | | | | |
| Trust 2013-C14 | 3.761% | 8/15/46 | 259 | 262 |
| 6 JPMBB Commercial Mortgage Securities | | | | |
| Trust 2013-C14 | 4.133% | 8/15/46 | 277 | 285 |
| 6 JPMBB Commercial Mortgage Securities | | | | |
| Trust 2013-C15 | 3.659% | 11/15/45 | 246 | 248 |
| 6 JPMBB Commercial Mortgage Securities | | | | |
| Trust 2013-C17 | 4.199% | 1/15/47 | 2,947 | 3,038 |
| 6 JPMBB Commercial Mortgage Securities | | | | |
| Trust 2014-C18 | 4.079% | 2/15/47 | 1,460 | 1,495 |
| 6 JPMBB Commercial Mortgage Securities | | | | |
| Trust 2014-C18 | 4.439% | 2/15/47 | 700 | 719 |
| 6 JPMBB Commercial Mortgage Securities | | | | |
| Trust 2014-C19 | 3.997% | 4/15/47 | 100 | 102 |
| 6 JPMBB Commercial Mortgage Securities | | | | |
| Trust 2014-C21 | 3.493% | 8/15/47 | 240 | 239 |
| 6 JPMBB Commercial Mortgage Securities | | | | |
| Trust 2014-C24 | 3.639% | 11/15/47 | 1,183 | 1,183 |
| 6 JPMBB Commercial Mortgage Securities | | | | |
| Trust 2014-C26 | 3.231% | 1/15/48 | 390 | 382 |
| 6 JPMBB Commercial Mortgage Securities | | | | |
| Trust 2014-C26 | 3.494% | 1/15/48 | 10 | 10 |
| 6 JPMBB Commercial Mortgage Securities | | | | |
| Trust 2015-C27 | 3.179% | 2/15/48 | 330 | 321 |
| 6 JPMBB Commercial Mortgage Securities | | | | |
| Trust 2015-C30 | 3.822% | 7/15/48 | 40 | 40 |
| 6 JPMBB Commercial Mortgage Securities | | | | |
| Trust 2015-C31 | 3.801% | 8/15/48 | 220 | 221 |
| 6 JPMBB Commercial Mortgage Securities | | | | |
| Trust 2015-C32 | 3.598% | 11/15/48 | 490 | 486 |
| 6 JPMCC Commercial Mortgage Securities | | | | |
| Trust 2017-JP5 | 3.723% | 3/15/50 | 860 | 855 |
| 6 JPMCC Commercial Mortgage Securities | | | | |
| Trust 2017-JP7 | 3.454% | 9/15/50 | 340 | 331 |
| 6 JPMDB Commercial Mortgage Securities | | | | |
| Trust 2017-C7 | 3.409% | 10/15/50 | 240 | 233 |
15
| | | | | |
| Institutional Short-Term Bond Fund | | | | |
| |
| |
| |
| | | | | Face | Market |
| | | | Maturity | Amount | Value • |
| | | Coupon | Date | ($000) | ($000) |
| 6 | JPMDB Commercial Mortgage Securities | | | | |
| | Trust 2018-C8 | 4.211% | 6/15/51 | 230 | 237 |
| 6,7,8 Lanark Master Issuer plc 2018-1A | 2.730% | 12/22/69 | 4,409 | 4,405 |
| 6,7,9 Lanark Master Issuer plc 2018-2A | 2.846% | 12/22/69 | 16,090 | 16,079 |
| 6,7,9 Master Credit Card Trust II Series 2018-1A | 2.672% | 7/22/24 | 9,700 | 9,677 |
| 6 | Mercedes-Benz Auto Lease Trust 2018-A | 2.200% | 4/15/20 | 6,620 | 6,607 |
| 6 | Mercedes-Benz Auto Lease Trust 2018-A | 2.410% | 2/16/21 | 10,630 | 10,565 |
| 6 | Mercedes-Benz Auto Lease Trust 2018-A | 2.510% | 10/16/23 | 1,060 | 1,048 |
| 6 | Mercedes-Benz Auto Receivables Trust 2018-1 | 3.150% | 10/15/24 | 12,310 | 12,290 |
| 6,7 | MMAF Equipment Finance LLC 2012-AA | 1.980% | 6/10/32 | 237 | 237 |
| 6,7 | MMAF Equipment Finance LLC 2013-AA | 2.570% | 6/9/33 | 7,239 | 7,218 |
| 6,7 | MMAF Equipment Finance LLC 2015-AA | 2.490% | 2/19/36 | 1,170 | 1,148 |
| 6,7 | MMAF Equipment Finance LLC 2016-AA | 2.210% | 12/15/32 | 8,390 | 8,034 |
| 6,7 | MMAF Equipment Finance LLC 2017-A | 2.410% | 8/16/24 | 10,320 | 10,029 |
| 6,7 | MMAF Equipment Finance LLC 2017-A | 2.680% | 7/16/27 | 5,160 | 4,962 |
| 6,7 | MMAF Equipment Finance LLC 2018-A | 3.390% | 1/10/25 | 6,490 | 6,495 |
| 6,7 | MMAF Equipment Finance LLC 2018-A | 3.610% | 3/10/42 | 3,550 | 3,541 |
| 6 | Morgan Stanley Bank of America Merrill | | | | |
| | Lynch Trust 2012-C5 | 3.176% | 8/15/45 | 879 | 872 |
| 6 | Morgan Stanley Bank of America Merrill | | | | |
| | Lynch Trust 2012-C5 | 3.792% | 8/15/45 | 694 | 689 |
| 6 | Morgan Stanley Bank of America Merrill | | | | |
| | Lynch Trust 2012-C6 | 2.858% | 11/15/45 | 459 | 450 |
| 6 | Morgan Stanley Bank of America Merrill | | | | |
| | Lynch Trust 2013-C10 | 4.219% | 7/15/46 | 3,023 | 3,086 |
| 6 | Morgan Stanley Bank of America Merrill | | | | |
| | Lynch Trust 2013-C11 | 3.960% | 8/15/46 | 1,068 | 1,078 |
| 6 | Morgan Stanley Bank of America Merrill | | | | |
| | Lynch Trust 2013-C11 | 4.303% | 8/15/46 | 70 | 72 |
| 6 | Morgan Stanley Bank of America Merrill | | | | |
| | Lynch Trust 2013-C12 | 3.824% | 10/15/46 | 305 | 309 |
| 6 | Morgan Stanley Bank of America Merrill | | | | |
| | Lynch Trust 2013-C12 | 4.259% | 10/15/46 | 70 | 72 |
| 6 | Morgan Stanley Bank of America Merrill | | | | |
| | Lynch Trust 2013-C13 | 4.039% | 11/15/46 | 150 | 153 |
| 6 | Morgan Stanley Bank of America Merrill | | | | |
| | Lynch Trust 2014-C14 | 4.064% | 2/15/47 | 250 | 255 |
| 6 | Morgan Stanley Bank of America Merrill | | | | |
| | Lynch Trust 2014-C14 | 4.384% | 2/15/47 | 250 | 257 |
| 6 | Morgan Stanley Bank of America Merrill | | | | |
| | Lynch Trust 2014-C15 | 3.773% | 4/15/47 | 1,724 | 1,737 |
| 6 | Morgan Stanley Bank of America Merrill | | | | |
| | Lynch Trust 2014-C15 | 4.051% | 4/15/47 | 2,065 | 2,111 |
| 6 | Morgan Stanley Bank of America Merrill | | | | |
| | Lynch Trust 2014-C16 | 3.892% | 6/15/47 | 2,028 | 2,058 |
| 6 | Morgan Stanley Bank of America Merrill | | | | |
| | Lynch Trust 2014-C16 | 4.094% | 6/15/47 | 465 | 468 |
| 6 | Morgan Stanley Bank of America Merrill | | | | |
| | Lynch Trust 2014-C17 | 3.741% | 8/15/47 | 70 | 70 |
| 6 | Morgan Stanley Bank of America Merrill | | | | |
| | Lynch Trust 2014-C19 | 3.326% | 12/15/47 | 200 | 199 |
| 6 | Morgan Stanley Bank of America Merrill | | | | |
| | Lynch Trust 2014-C19 | 3.526% | 12/15/47 | 20 | 20 |
| 6 | Morgan Stanley Bank of America Merrill | | | | |
| | Lynch Trust 2015-C20 | 3.069% | 2/15/48 | 250 | 247 |
16
| | | | | |
| Institutional Short-Term Bond Fund | | | | |
| |
| |
| |
| | | | | Face | Market |
| | | | Maturity | Amount | Value • |
| | | Coupon | Date | ($000) | ($000) |
| 6 | Morgan Stanley Bank of America Merrill | | | | |
| | Lynch Trust 2015-C20 | 3.249% | 2/15/48 | 90 | 88 |
| 6 | Morgan Stanley Bank of America Merrill | | | | |
| | Lynch Trust 2015-C23 | 3.451% | 7/15/50 | 230 | 225 |
| 6 | Morgan Stanley Bank of America Merrill | | | | |
| | Lynch Trust 2015-C24 | 3.732% | 5/15/48 | 1,190 | 1,190 |
| 6 | Morgan Stanley Bank of America Merrill | | | | |
| | Lynch Trust 2015-C25 | 3.635% | 10/15/48 | 2,112 | 2,097 |
| 6 | Morgan Stanley Bank of America Merrill | | | | |
| | Lynch Trust 2016-C29 | 3.325% | 5/15/49 | 1,450 | 1,406 |
| 6 | Morgan Stanley Bank of America Merrill | | | | |
| | Lynch Trust 2016-C32 | 3.720% | 12/15/49 | 2,590 | 2,568 |
| 6 | Morgan Stanley Bank of America Merrill | | | | |
| | Lynch Trust 2017-C34 | 3.536% | 11/15/52 | 460 | 447 |
| 6,7 | Morgan Stanley Capital I Trust 2012-STAR | 3.201% | 8/5/34 | 1,344 | 1,326 |
| 6 | Morgan Stanley Capital I Trust 2015-UBS8 | 3.809% | 12/15/48 | 6,630 | 6,621 |
| 6 | Morgan Stanley Capital I Trust 2016-UB11 | 2.782% | 8/15/49 | 650 | 604 |
| 6 | Morgan Stanley Capital I Trust 2016-UBS9 | 3.594% | 3/15/49 | 1,690 | 1,673 |
| 6 | Morgan Stanley Capital I Trust 2017-HR2 | 3.509% | 12/15/50 | 180 | 177 |
| 6 | Morgan Stanley Capital I Trust 2017-HR2 | 3.587% | 12/15/50 | 222 | 217 |
| 6,7,9 Motor plc 2017 1A | 2.746% | 9/25/24 | 15,600 | 15,587 |
| 6,9 | Navient Student Loan Trust 2014-8 | 2.656% | 4/25/23 | 9,374 | 9,385 |
| 6,9 | Navient Student Loan Trust 2015-3 | 2.866% | 6/26/56 | 16,175 | 16,244 |
| 6,7,9 Navient Student Loan Trust 2016-2 | 3.266% | 6/25/65 | 6,230 | 6,289 |
| 6,7,9 Navient Student Loan Trust 2016-3 | 3.066% | 6/25/65 | 5,437 | 5,465 |
| 6,7,9 Navient Student Loan Trust 2016-6A | 2.966% | 3/25/66 | 36,920 | 37,254 |
| 6,7,9 Navient Student Loan Trust 2017-1 | 2.966% | 7/26/66 | 17,020 | 17,099 |
| 6,7,9 Navient Student Loan Trust 2017-3A | 2.816% | 7/26/66 | 9,825 | 9,895 |
| 6,7,9 Navient Student Loan Trust 2017-4A | 2.716% | 9/27/66 | 8,650 | 8,688 |
| 6,7,9 Navient Student Loan Trust 2018-1 | 2.406% | 3/25/67 | 1,070 | 1,070 |
| 6,7,9 Navient Student Loan Trust 2018-1 | 2.566% | 3/25/67 | 2,330 | 2,329 |
| 6,7,9 Navient Student Loan Trust 2018-1 | 2.936% | 3/25/67 | 2,880 | 2,893 |
| 6,7,9 Navistar Financial Dealer Note Master | | | | |
| | Trust II 2017-1A | 2.996% | 6/27/22 | 12,390 | 12,437 |
| 6,7 | NextGear Floorplan Master Owner | | | | |
| | Trust 2016-1A | 2.740% | 4/15/21 | 8,880 | 8,872 |
| 6 | Nissan Auto Lease Trust 2017-A | 1.910% | 4/15/20 | 17,500 | 17,400 |
| 6 | Nissan Auto Lease Trust 2017-A | 2.040% | 9/15/22 | 5,610 | 5,556 |
| 6 | Nissan Auto Lease Trust 2017-B | 2.050% | 9/15/20 | 15,110 | 14,983 |
| 6 | Nissan Auto Lease Trust 2017-B | 2.170% | 12/15/21 | 4,210 | 4,156 |
| 6 | Nissan Auto Receivables 2016-A Owner Trust | 1.590% | 7/15/22 | 2,250 | 2,205 |
| 6 | Nissan Auto Receivables 2017-C Owner Trust | 2.120% | 4/18/22 | 15,700 | 15,466 |
| 6 | Nissan Auto Receivables 2017-C Owner Trust | 2.280% | 2/15/24 | 8,850 | 8,638 |
| 6 | Nissan Auto Receivables 2018-B Owner Trust | 3.160% | 12/16/24 | 12,310 | 12,251 |
| 6,9 | Nissan Master Owner Trust Receivables | | | | |
| | Series 2017-C | 2.478% | 10/17/22 | 18,600 | 18,634 |
| 6,7 | OBP Depositor LLC Trust 2010-OBP | 4.646% | 7/15/45 | 654 | 664 |
| 6,7 | Palisades Center Trust 2016-PLSD | 2.713% | 4/13/33 | 510 | 497 |
| 6,7,9 Pepper Residential Securities Trust | | | | |
| | 2017A-A1UA | 3.233% | 3/10/58 | 349 | 349 |
| 6,7,9 Pepper Residential Securities Trust | | | | |
| | 2018A-A1UA | 3.089% | 3/12/47 | 121 | 121 |
| 6,7,9 Pepper Residential Securities Trust | | | | |
| | 2019A-A1U1 | 2.489% | 10/12/18 | 570 | 570 |
| 6,7,9 Pepper Residential Securities Trust | | | | |
| | 2020A-A1U1 | 2.658% | 3/16/19 | 730 | 727 |
17
| | | | | |
| Institutional Short-Term Bond Fund | | | | |
| |
| |
| |
| | | | | Face | Market |
| | | | Maturity | Amount | Value • |
| | | Coupon | Date | ($000) | ($000) |
| 6,7,9 Pepper Residential Securities | | | | |
| | Trust 2021-A1U | 3.038% | 1/16/60 | 3,116 | 3,114 |
| 6,7,8 Permanent Master Issuer plc 2018-1A | 2.747% | 7/15/58 | 13,840 | 13,846 |
| 6,7 | PFS Financing Corp 2017-B | 2.220% | 7/15/22 | 1,020 | 999 |
| 6,7,9 PFS Financing Corp. 2017-C | 2.628% | 10/15/21 | 1,440 | 1,440 |
| 6,7 | PFS Financing Corp. 2017-D | 2.400% | 10/17/22 | 1,500 | 1,472 |
| 6,7 | PFS Financing Corp. 2018-D | 3.190% | 4/17/23 | 640 | 636 |
| 6,7,9 PHEAA Student Loan Trust 2016-2A | 3.166% | 11/25/65 | 12,855 | 13,020 |
| 6 | Public Service New Hampshire Funding | | | | |
| | LLC 2018-1 | 3.094% | 2/1/26 | 9,320 | 9,292 |
| 6 | Public Service New Hampshire Funding | | | | |
| | LLC 2018-1 | 3.506% | 8/1/28 | 3,190 | 3,178 |
| 6 | Public Service New Hampshire Funding | | | | |
| | LLC 2018-1 | 3.814% | 2/1/35 | 3,030 | 3,028 |
| 6,7,9 Resimac Premier Series 2016-1A | 3.523% | 10/10/47 | 2,048 | 2,062 |
| 6,7,9 Resimac Premier Series 2017-1A | 3.081% | 9/11/48 | 5,403 | 5,405 |
| 6,7,9 Resimac Premier Series 2018-1A | 2.933% | 11/10/49 | 2,502 | 2,500 |
| 6,7,9 Resimac Premier Series 2018-1NCA | 2.987% | 12/16/59 | 4,520 | 4,518 |
| 6 | Royal Bank of Canada | 1.875% | 2/5/20 | 5,800 | 5,705 |
| 6 | Santander Drive Auto Receivables | | | | |
| | Trust 2017-1 | 1.770% | 9/15/20 | 684 | 683 |
| 6 | Santander Drive Auto Receivables | | | | |
| | Trust 2017-3 | 1.670% | 6/15/20 | 409 | 409 |
| 6 | Santander Drive Auto Receivables | | | | |
| | Trust 2017-3 | 1.870% | 6/15/21 | 320 | 319 |
| 6 | Santander Drive Auto Receivables | | | | |
| | Trust 2018-1 | 2.100% | 11/16/20 | 734 | 733 |
| 6 | Santander Drive Auto Receivables | | | | |
| | Trust 2018-1 | 2.320% | 8/16/21 | 300 | 299 |
| 6,7 | Santander Retail Auto Lease Trust 2017-A | 2.370% | 1/20/22 | 2,130 | 2,101 |
| 6,7 | Santander Retail Auto Lease Trust 2018-A | 2.930% | 5/20/21 | 16,210 | 16,148 |
| 6,7 | Santander Retail Auto Lease Trust 2018-A | 3.060% | 4/20/22 | 5,680 | 5,646 |
| 6,7 | Securitized Term Auto Receivables Trust | | | | |
| | 2016-1A | 1.524% | 3/25/20 | 6,782 | 6,756 |
| 6,7 | Securitized Term Auto Receivables Trust | | | | |
| | 2016-1A | 1.794% | 2/25/21 | 14,340 | 14,165 |
| 6,7 | Securitized Term Auto Receivables Trust | | | | |
| | 2017-1A | 1.890% | 8/25/20 | 26,585 | 26,466 |
| 6,7 | Securitized Term Auto Receivables Trust | | | | |
| | 2017-1A | 2.209% | 6/25/21 | 12,900 | 12,751 |
| 6,7 | Securitized Term Auto Receivables Trust | | | | |
| | 2017-2A | 2.040% | 4/26/21 | 12,380 | 12,208 |
| 6,7 | Securitized Term Auto Receivables Trust | | | | |
| | 2017-2A | 2.289% | 3/25/22 | 4,160 | 4,051 |
| 6,7 | Securitized Term Auto Receivables Trust | | | | |
| | 2018-1A | 3.068% | 1/25/22 | 11,310 | 11,227 |
| 6,7 | Securitized Term Auto Receivables Trust | | | | |
| | 2018-1A | 3.298% | 11/25/22 | 4,030 | 3,991 |
| 6,8 | SLM Student Loan Trust 2003-14 | 2.565% | 1/25/23 | 608 | 608 |
| 6 | SMART ABS Series 2016-2US Trust | 2.050% | 12/14/22 | 2,330 | 2,264 |
| 6,7 | SMB Private Education Loan Trust 2016-A | 2.700% | 5/15/31 | 489 | 480 |
| 6,7,9 SMB Private Education Loan Trust 2016-B | 3.608% | 2/17/32 | 398 | 407 |
| 6,7,9 SMB Private Education Loan Trust 2016-C | 3.258% | 9/15/34 | 680 | 689 |
| 6,7,9 SMB Private Education Loan Trust 2017-A | 3.058% | 9/15/34 | 3,110 | 3,130 |
18
| | | | | |
| Institutional Short-Term Bond Fund | | | | |
| |
| |
| |
| | | | | Face | Market |
| | | | Maturity | Amount | Value • |
| | | Coupon | Date | ($000) | ($000) |
| 6,7 | SMB Private Education Loan Trust 2017-B | 2.820% | 10/15/35 | 790 | 766 |
| 6,7 | SMB Private Education Loan Trust 2018-A | 3.500% | 2/15/36 | 2,320 | 2,301 |
| 6,7 | SMB Private Education Loan Trust 2018-B | 3.600% | 1/15/37 | 1,370 | 1,366 |
| 6,7 | SMB Private Education Loan Trust 2018-C | 3.630% | 11/15/35 | 2,530 | 2,529 |
| 6,7 | SoFi Professional Loan Program 2017-A LLC | 2.400% | 3/26/40 | 3,500 | 3,386 |
| 6,7,9 SoFi Professional Loan Program 2017-A LLC | 2.916% | 3/26/40 | 2,368 | 2,374 |
| 6,7 | SoFi Professional Loan Program 2017-B LLC | 2.740% | 5/25/40 | 890 | 873 |
| 6,7 | SoFi Professional Loan Program 2017-D LLC | 2.650% | 9/25/40 | 600 | 581 |
| 6,7 | SoFi Professional Loan Program 2017-E LLC | 1.860% | 11/26/40 | 967 | 953 |
| 6,7 | SoFi Professional Loan Program 2017-E LLC | 2.720% | 11/26/40 | 350 | 339 |
| 6,7 | SoFi Professional Loan Program 2017-F LLC | 2.050% | 1/25/41 | 1,149 | 1,138 |
| 6,7 | SoFi Professional Loan Program 2017-F LLC | 2.840% | 1/25/41 | 580 | 562 |
| 6,7 | SoFi Professional Loan Program 2018-A LLC | 2.390% | 2/25/42 | 454 | 450 |
| 6,7 | SoFi Professional Loan Program 2018-A LLC | 2.950% | 2/25/42 | 230 | 224 |
| 6,7 | SoFi Professional Loan Program 2018-B LLC | 3.340% | 8/25/47 | 1,600 | 1,583 |
| 6,7 | SoFi Professional Loan Program 2018-C LLC | 3.590% | 1/25/48 | 3,590 | 3,582 |
| 6,7 | SoFi Professional Loan Program 2018-D LLC | 3.600% | 2/25/48 | 2,000 | 1,993 |
| 6 | Synchrony Card Issuance Trust 2018-A1 | 3.380% | 9/15/24 | 13,520 | 13,528 |
| 6 | Synchrony Credit Card Master Note Trust | | | | |
| | 2015-1 | 2.370% | 3/15/23 | 14,730 | 14,580 |
| 6 | Synchrony Credit Card Master Note Trust | | | | |
| | 2015-4 | 2.380% | 9/15/23 | 24,190 | 23,800 |
| 6 | Synchrony Credit Card Master Note Trust | | | | |
| | 2016-2 | 2.210% | 5/15/24 | 210 | 204 |
| 6 | Synchrony Credit Card Master Note Trust | | | | |
| | 2016-3 | 1.580% | 9/15/22 | 20,540 | 20,277 |
| 6 | Synchrony Credit Card Master Note Trust | | | | |
| | 2017-2 | 2.620% | 10/15/25 | 5,240 | 5,079 |
| 6 | Synchrony Credit Card Master Note Trust | | | | |
| | Series 2012-2 | 2.220% | 1/15/22 | 10,603 | 10,592 |
| 6,7 | TMSQ 2014-1500 Mortgage Trust | 3.680% | 10/10/36 | 100 | 98 |
| 6 | Toyota Auto Receivables 2017-D Owner Trust | 2.120% | 2/15/23 | 840 | 818 |
| 6 | Toyota Auto Receivables 2018-A Owner Trust | 2.350% | 5/16/22 | 7,140 | 7,060 |
| 6 | Toyota Auto Receivables 2018-A Owner Trust | 2.520% | 5/15/23 | 480 | 471 |
| 6 | Toyota Auto Receivables 2018-B Owner Trust | 3.110% | 11/15/23 | 5,060 | 5,044 |
| 6 | Toyota Auto Receivables 2018-C Owner Trust | 3.020% | 12/15/22 | 30,750 | 30,682 |
| 6 | Toyota Auto Receivables 2018-C Owner Trust | 3.130% | 2/15/24 | 14,270 | 14,221 |
| 6,7 | Trafigura Securitisation Finance plc 2017-1A | 2.470% | 12/15/20 | 2,350 | 2,304 |
| 6,7 | Trafigura Securitisation Finance plc 2018-1A | 3.730% | 3/15/22 | 2,050 | 2,050 |
| 6 | UBS Commercial Mortgage Trust 2012-C1 | 4.171% | 5/10/45 | 247 | 250 |
| 6 | UBS Commercial Mortgage Trust 2017-C7 | 3.679% | 12/15/50 | 495 | 488 |
| 6,7 | UBS-BAMLL Trust 2012-WRM | 3.663% | 6/10/30 | 2,364 | 2,332 |
| 6 | UBS-Barclays Commercial Mortgage Trust | | | | |
| | 2012-C4 | 2.850% | 12/10/45 | 521 | 509 |
| 6 | UBS-Barclays Commercial Mortgage Trust | | | | |
| | 2013-C6 | 3.244% | 4/10/46 | 100 | 99 |
| 6 | UBS-Barclays Commercial Mortgage Trust | | | | |
| | 2013-C6 | 3.469% | 4/10/46 | 60 | 59 |
| 6 | USAA Auto Owner Trust 2017-1 | 1.880% | 9/15/22 | 7,560 | 7,426 |
| 6,7 | Verizon Owner Trust 2016-2A | 1.680% | 5/20/21 | 6,620 | 6,573 |
| 6,7 | Verizon Owner Trust 2017-1A | 2.060% | 9/20/21 | 20,500 | 20,301 |
| 6,7 | Verizon Owner Trust 2017-2A | 1.920% | 12/20/21 | 27,610 | 27,245 |
| 6,7 | Verizon Owner Trust 2017-3 | 2.060% | 4/20/22 | 10,800 | 10,632 |
| 6,7 | Verizon Owner Trust 2018-1 | 2.820% | 9/20/22 | 35,740 | 35,498 |
19
| | | | | |
| Institutional Short-Term Bond Fund | | | | |
| |
| |
| |
| | | | | Face | Market |
| | | | Maturity | Amount | Value • |
| | | Coupon | Date | ($000) | ($000) |
| 6,7 | VNDO 2012-6AVE Mortgage Trust | 2.996% | 11/15/30 | 2,236 | 2,191 |
| 6 | Volkswagen Auto Loan Enhanced Trust | | | | |
| | 2018-1 | 3.020% | 11/21/22 | 18,810 | 18,765 |
| 6 | Volkswagen Auto Loan Enhanced Trust | | | | |
| | 2018-1 | 3.150% | 7/22/24 | 8,520 | 8,493 |
| 6,7,9 Volvo Financial Equipment Master Owner | | | | |
| | Trust 2017-A | 2.658% | 11/15/22 | 3,570 | 3,580 |
| 6 | Wells Fargo Commercial Mortgage Trust | | | | |
| | 2012-LC5 | 2.918% | 10/15/45 | 531 | 521 |
| 6 | Wells Fargo Commercial Mortgage Trust | | | | |
| | 2012-LC5 | 3.539% | 10/15/45 | 434 | 429 |
| 6 | Wells Fargo Commercial Mortgage Trust | | | | |
| | 2013-LC12 | 3.928% | 7/15/46 | 312 | 316 |
| 6 | Wells Fargo Commercial Mortgage Trust | | | | |
| | 2013-LC12 | 4.218% | 7/15/46 | 1,306 | 1,345 |
| 6 | Wells Fargo Commercial Mortgage Trust | | | | |
| | 2013-LC12 | 4.423% | 7/15/46 | 350 | 357 |
| 6 | Wells Fargo Commercial Mortgage Trust | | | | |
| | 2014-LC16 | 3.548% | 8/15/50 | 90 | 90 |
| 6 | Wells Fargo Commercial Mortgage Trust | | | | |
| | 2014-LC16 | 3.817% | 8/15/50 | 20 | 20 |
| 6 | Wells Fargo Commercial Mortgage Trust | | | | |
| | 2014-LC18 | 3.405% | 12/15/47 | 10 | 10 |
| 6 | Wells Fargo Commercial Mortgage Trust | | | | |
| | 2015-C26 | 3.166% | 2/15/48 | 960 | 932 |
| 6 | Wells Fargo Commercial Mortgage Trust | | | | |
| | 2015-C27 | 3.190% | 2/15/48 | 80 | 78 |
| 6 | Wells Fargo Commercial Mortgage Trust | | | | |
| | 2015-C27 | 3.451% | 2/15/48 | 460 | 454 |
| 6 | Wells Fargo Commercial Mortgage Trust | | | | |
| | 2015-C29 | 3.637% | 6/15/48 | 2,620 | 2,610 |
| 6 | Wells Fargo Commercial Mortgage Trust | | | | |
| | 2015-C30 | 3.664% | 9/15/58 | 700 | 698 |
| 6 | Wells Fargo Commercial Mortgage Trust | | | | |
| | 2015-LC22 | 3.839% | 9/15/58 | 1,241 | 1,251 |
| 6 | Wells Fargo Commercial Mortgage Trust | | | | |
| | 2015-SG1 | 3.789% | 9/15/48 | 2,594 | 2,603 |
| 6 | Wells Fargo Commercial Mortgage Trust | | | | |
| | 2016-C32 | 3.560% | 1/15/59 | 320 | 317 |
| 6 | Wells Fargo Commercial Mortgage Trust | | | | |
| | 2016-C37 | 3.525% | 12/15/49 | 360 | 352 |
| 6 | Wells Fargo Commercial Mortgage Trust | | | | |
| | 2016-C37 | 3.794% | 12/15/49 | 90 | 90 |
| 6 | Wells Fargo Commercial Mortgage Trust | | | | |
| | 2017-C38 | 3.453% | 7/15/50 | 520 | 506 |
| 6 | Wells Fargo Commercial Mortgage Trust | | | | |
| | 2017-C39 | 3.157% | 9/15/50 | 190 | 179 |
| 6 | Wells Fargo Commercial Mortgage Trust | | | | |
| | 2017-C39 | 3.418% | 9/15/50 | 2,135 | 2,066 |
| 6 | Wells Fargo Commercial Mortgage Trust | | | | |
| | 2017-C40 | 3.581% | 10/15/50 | 1,160 | 1,136 |
| 6 | Wells Fargo Commercial Mortgage Trust | | | | |
| | 2017-C41 | 3.472% | 11/15/50 | 1,430 | 1,387 |
20
| | | | | |
| Institutional Short-Term Bond Fund | | | | |
| |
| |
| |
| | | | | Face | Market |
| | | | Maturity | Amount | Value • |
| | | Coupon | Date | ($000) | ($000) |
| 6 | Wells Fargo Commercial Mortgage Trust | | | | |
| | 2017-C42 | 3.589% | 12/15/50 | 580 | 567 |
| 6 | Wells Fargo Commercial Mortgage Trust | | | | |
| | 2017-RC1 | 3.631% | 1/15/60 | 176 | 174 |
| 6 | Wells Fargo Commercial Mortgage Trust | | | | |
| | 2018-C43 | 4.012% | 3/15/51 | 660 | 666 |
| 6 | Wells Fargo Commercial Mortgage Trust | | | | |
| | 2018-C46 | 4.152% | 8/15/51 | 470 | 480 |
| 7 | Westpac Banking Corp. | 2.100% | 2/25/21 | 1,300 | 1,264 |
| 6,7 | WFRBS Commercial Mortgage Trust | | | | |
| | 2011-C3 | 4.375% | 3/15/44 | 614 | 627 |
| 6 | WFRBS Commercial Mortgage Trust | | | | |
| | 2012-C7 | 3.431% | 6/15/45 | 597 | 597 |
| 6 | WFRBS Commercial Mortgage Trust | | | | |
| | 2012-C7 | 4.090% | 6/15/45 | 752 | 761 |
| 6 | WFRBS Commercial Mortgage Trust | | | | |
| | 2012-C8 | 3.001% | 8/15/45 | 385 | 379 |
| 6 | WFRBS Commercial Mortgage Trust | | | | |
| | 2012-C9 | 2.870% | 11/15/45 | 1,312 | 1,286 |
| 6 | WFRBS Commercial Mortgage Trust | | | | |
| | 2012-C9 | 3.388% | 11/15/45 | 567 | 558 |
| 6 | WFRBS Commercial Mortgage Trust | | | | |
| | 2013-C15 | 3.720% | 8/15/46 | 359 | 362 |
| 6 | WFRBS Commercial Mortgage Trust | | | | |
| | 2013-C15 | 4.153% | 8/15/46 | 526 | 541 |
| 6 | WFRBS Commercial Mortgage Trust | | | | |
| | 2013-C17 | 3.558% | 12/15/46 | 215 | 216 |
| 6 | WFRBS Commercial Mortgage Trust | | | | |
| | 2013-C18 | 3.676% | 12/15/46 | 348 | 351 |
| 6 | WFRBS Commercial Mortgage Trust | | | | |
| | 2013-C18 | 4.162% | 12/15/46 | 1,042 | 1,071 |
| 6 | WFRBS Commercial Mortgage Trust | | | | |
| | 2014-C19 | 3.829% | 3/15/47 | 960 | 965 |
| 6 | WFRBS Commercial Mortgage Trust | | | | |
| | 2014-C19 | 4.101% | 3/15/47 | 110 | 113 |
| 6 | WFRBS Commercial Mortgage Trust | | | | |
| | 2014-C20 | 3.995% | 5/15/47 | 30 | 31 |
| 6 | WFRBS Commercial Mortgage Trust | | | | |
| | 2014-C21 | 3.410% | 8/15/47 | 80 | 79 |
| 6 | WFRBS Commercial Mortgage Trust | | | | |
| | 2014-C21 | 3.678% | 8/15/47 | 230 | 231 |
| 6 | WFRBS Commercial Mortgage Trust | | | | |
| | 2014-C23 | 3.650% | 10/15/57 | 800 | 797 |
| 6 | WFRBS Commercial Mortgage Trust | | | | |
| | 2014-C23 | 3.917% | 10/15/57 | 1,038 | 1,054 |
| 6 | WFRBS Commercial Mortgage Trust | | | | |
| | 2014-C24 | 3.607% | 11/15/47 | 2,251 | 2,242 |
| 6 | WFRBS Commercial Mortgage Trust | | | | |
| | 2014-LC14 | 3.766% | 3/15/47 | 60 | 60 |
| 6 | WFRBS Commercial Mortgage Trust | | | | |
| | 2014-LC14 | 4.045% | 3/15/47 | 1,179 | 1,206 |
| 6,7 | Wheels SPV 2 LLC 2016-1A | 1.870% | 5/20/25 | 2,145 | 2,122 |
| 6 | World Financial Network Credit Card | | | | |
| | Master Note Trust Series 2012-D | 2.150% | 4/17/23 | 22,000 | 21,888 |
21
| | | | |
| Institutional Short-Term Bond Fund | | | | |
| |
| |
| |
| | | | Face | Market |
| | | Maturity | Amount | Value • |
| | Coupon | Date | ($000) | ($000) |
| 6 World Financial Network Credit Card Master | | | | |
| Note Trust Series 2015-B | 2.550% | 6/17/24 | 3,270 | 3,228 |
| 6 World Omni Auto Receivables Trust 2016-A | 1.770% | 9/15/21 | 10,456 | 10,394 |
| 6 World Omni Auto Receivables Trust 2016-B | 1.300% | 2/15/22 | 23,491 | 23,211 |
| 6 World Omni Auto Receivables Trust 2018-A | 2.730% | 2/15/24 | 5,280 | 5,199 |
| 6 World Omni Automobile Lease Securitization | | | | |
| Trust 2017-A | 2.320% | 8/15/22 | 8,800 | 8,706 |
| 6 World Omni Automobile Lease Securitization | | | | |
| Trust 2018-A | 2.830% | 7/15/21 | 23,020 | 22,919 |
| 6 World Omni Automobile Lease Securitization | | | | |
| Trust 2018-A | 2.940% | 5/15/23 | 6,910 | 6,865 |
| 6 World Omni Automobile Lease Securitization | | | | |
| Trust 2018-B | 3.190% | 12/15/21 | 23,160 | 23,151 |
| 6 World Omni Automobile Lease Securitization | | | | |
| Trust 2018-B | 3.300% | 3/15/24 | 4,810 | 4,807 |
| Total Asset-Backed/Commercial Mortgage-Backed Securities (Cost $3,090,568) | | 3,066,689 |
| Corporate Bonds (25.8%) | | | | |
| Finance (19.8%) | | | | |
| Banking (17.4%) | | | | |
| 7 ABN AMRO Bank NV | 3.400% | 8/27/21 | 7,500 | 7,477 |
| American Express Co. | 2.200% | 10/30/20 | 2,605 | 2,543 |
| 7 ANZ New Zealand International Ltd. | 2.250% | 2/1/19 | 15,000 | 14,975 |
| 7 ASB Bank Ltd. | 3.750% | 6/14/23 | 4,955 | 4,913 |
| 7 Australia & New Zealand Banking Group Ltd. | 2.250% | 12/19/19 | 15,855 | 15,700 |
| Australia & New Zealand Banking Group Ltd. | 2.625% | 11/9/22 | 10,048 | 9,653 |
| 6 Bank of America Corp. | 2.369% | 7/21/21 | 1,515 | 1,488 |
| 6 Bank of America Corp. | 2.328% | 10/1/21 | 4,660 | 4,558 |
| 6 Bank of America Corp. | 2.738% | 1/23/22 | 30,000 | 29,483 |
| Bank of Nova Scotia | 2.228% | 12/11/19 | 31,695 | 31,330 |
| Bank of Nova Scotia | 2.150% | 7/14/20 | 1,990 | 1,957 |
| Bank of Nova Scotia | 2.350% | 10/21/20 | 4,245 | 4,170 |
| 7 Banque Federative du Credit Mutuel SA | 2.000% | 4/12/19 | 19,300 | 19,186 |
| 7 Banque Federative du Credit Mutuel SA | 2.200% | 7/20/20 | 26,854 | 26,230 |
| 7 Banque Federative du Credit Mutuel SA | 2.750% | 10/15/20 | 14,000 | 13,767 |
| 7 Banque Federative du Credit Mutuel SA | 2.500% | 4/13/21 | 4,375 | 4,248 |
| 7 Banque Federative du Credit Mutuel SA | 2.700% | 7/20/22 | 22,303 | 21,452 |
| Canadian Imperial Bank of Commerce | 3.500% | 9/13/23 | 8,150 | 8,105 |
| Citibank NA | 2.100% | 6/12/20 | 9,225 | 9,057 |
| Citibank NA | 2.125% | 10/20/20 | 28,095 | 27,435 |
| Citibank NA | 2.850% | 2/12/21 | 31,060 | 30,695 |
| 7 Commonwealth Bank of Australia | 5.000% | 10/15/19 | 12,667 | 12,915 |
| Commonwealth Bank of Australia | 2.300% | 3/12/20 | 1,100 | 1,084 |
| 7 Commonwealth Bank of Australia | 2.050% | 9/18/20 | 27,000 | 26,277 |
| Commonwealth Bank of Australia | 2.400% | 11/2/20 | 2,045 | 2,000 |
| 7 Commonwealth Bank of Australia | 2.000% | 9/6/21 | 25,776 | 24,707 |
| 7 Commonwealth Bank of Australia | 2.750% | 3/10/22 | 5,215 | 5,062 |
| 7 Commonwealth Bank of Australia | 3.450% | 3/16/23 | 3,002 | 2,972 |
| Cooperatieve Rabobank UA | 2.500% | 1/19/21 | 2,045 | 2,001 |
| Cooperatieve Rabobank UA | 3.875% | 2/8/22 | 11,700 | 11,783 |
| 7 Danske Bank A/S | 1.650% | 9/6/19 | 9,062 | 8,928 |
| 7 Danske Bank A/S | 2.750% | 9/17/20 | 8,000 | 7,859 |
| 7 DNB Bank ASA | 2.125% | 10/2/20 | 17,000 | 16,555 |
| 7 Federation des Caisses Desjardins du Quebec | 2.250% | 10/30/20 | 11,220 | 10,925 |
| Fifth Third Bank | 2.200% | 10/30/20 | 825 | 806 |
22
| | | | |
| Institutional Short-Term Bond Fund | | | | |
| |
| |
| |
| | | | Face | Market |
| | | Maturity | Amount | Value • |
| | Coupon | Date | ($000) | ($000) |
| Goldman Sachs Group Inc. | 2.550% | 10/23/19 | 12,800 | 12,746 |
| Goldman Sachs Group Inc. | 2.600% | 12/27/20 | 6,415 | 6,312 |
| Goldman Sachs Group Inc. | 2.875% | 2/25/21 | 8,856 | 8,733 |
| Goldman Sachs Group Inc. | 2.625% | 4/25/21 | 2,250 | 2,202 |
| HSBC Holdings plc | 2.950% | 5/25/21 | 600 | 591 |
| HSBC Holdings plc | 2.650% | 1/5/22 | 36,300 | 35,165 |
| 6 HSBC Holdings plc | 3.033% | 11/22/23 | 7,020 | 6,777 |
| 6 HSBC Holdings plc | 3.950% | 5/18/24 | 19,410 | 19,264 |
| HSBC USA Inc. | 2.750% | 8/7/20 | 3,125 | 3,098 |
| Huntington National Bank | 2.375% | 3/10/20 | 5,300 | 5,234 |
| 7 ING Bank NV | 2.000% | 11/26/18 | 6,400 | 6,394 |
| 7 ING Bank NV | 2.300% | 3/22/19 | 9,520 | 9,497 |
| 7 ING Bank NV | 2.500% | 10/1/19 | 1,070 | 1,063 |
| JPMorgan Chase & Co. | 2.250% | 1/23/20 | 13,950 | 13,808 |
| JPMorgan Chase & Co. | 2.750% | 6/23/20 | 5,500 | 5,458 |
| JPMorgan Chase & Co. | 2.550% | 10/29/20 | 28,960 | 28,539 |
| JPMorgan Chase & Co. | 2.550% | 3/1/21 | 19,218 | 18,867 |
| 6 JPMorgan Chase & Co. | 3.514% | 6/18/22 | 16,310 | 16,319 |
| JPMorgan Chase & Co. | 3.250% | 9/23/22 | 7,585 | 7,519 |
| 6 JPMorgan Chase & Co. | 2.776% | 4/25/23 | 9,070 | 8,809 |
| 6 JPMorgan Chase Bank NA | 3.086% | 4/26/21 | 93,000 | 92,739 |
| Lloyds Bank plc | 3.300% | 5/7/21 | 25,000 | 24,905 |
| 6 Lloyds Banking Group plc | 2.907% | 11/7/23 | 10,010 | 9,547 |
| Manufacturers & Traders Trust Co. | 2.050% | 8/17/20 | 4,815 | 4,714 |
| Manufacturers & Traders Trust Co. | 2.500% | 5/18/22 | 2,440 | 2,352 |
| Mitsubishi UFJ Financial Group Inc. | 2.950% | 3/1/21 | 5,278 | 5,211 |
| Mitsubishi UFJ Financial Group Inc. | 3.535% | 7/26/21 | 2,500 | 2,497 |
| Mitsubishi UFJ Financial Group Inc. | 2.190% | 9/13/21 | 1,930 | 1,857 |
| Mitsubishi UFJ Financial Group Inc. | 2.998% | 2/22/22 | 2,480 | 2,423 |
| Mitsubishi UFJ Financial Group Inc. | 2.665% | 7/25/22 | 12,900 | 12,435 |
| Mitsubishi UFJ Financial Group Inc. | 3.761% | 7/26/23 | 26,465 | 26,285 |
| 7 Mitsubishi UFJ Trust & Banking Corp. | 2.450% | 10/16/19 | 2,710 | 2,691 |
| 7 Mitsubishi UFJ Trust & Banking Corp. | 2.650% | 10/19/20 | 18,515 | 18,223 |
| Morgan Stanley | 2.450% | 2/1/19 | 4,378 | 4,375 |
| Morgan Stanley | 2.800% | 6/16/20 | 808 | 802 |
| Morgan Stanley | 2.500% | 4/21/21 | 14,738 | 14,388 |
| Morgan Stanley | 2.625% | 11/17/21 | 21,292 | 20,701 |
| Morgan Stanley | 2.750% | 5/19/22 | 35,295 | 34,217 |
| 8 Morgan Stanley | 3.563% | 5/8/24 | 4,695 | 4,776 |
| 7 MUFG Bank Ltd. | 2.300% | 3/10/19 | 5,350 | 5,337 |
| 7 MUFG Bank Ltd. | 2.300% | 3/5/20 | 2,030 | 2,000 |
| 7 MUFG Bank Ltd. | 2.750% | 9/14/20 | 10,775 | 10,560 |
| 7 MUFG Bank Ltd. | 2.850% | 9/8/21 | 3,990 | 3,904 |
| National Australia Bank Ltd. | 1.875% | 7/12/21 | 15,000 | 14,339 |
| National Bank of Canada | 2.150% | 6/12/20 | 7,000 | 6,842 |
| National Bank of Canada | 2.200% | 11/2/20 | 2,485 | 2,413 |
| 7 Nordea Bank AB | 3.750% | 8/30/23 | 4,000 | 3,957 |
| PNC Bank NA | 2.550% | 12/9/21 | 320 | 312 |
| Royal Bank of Canada | 2.150% | 10/26/20 | 23,930 | 23,420 |
| Santander UK plc | 3.400% | 6/1/21 | 24,000 | 23,907 |
| 7 Skandinaviska Enskilda Banken AB | 2.375% | 3/25/19 | 2,750 | 2,741 |
| Sumitomo Mitsui Banking Corp. | 2.450% | 1/10/19 | 6,300 | 6,297 |
| Sumitomo Mitsui Banking Corp. | 2.250% | 7/11/19 | 1,500 | 1,493 |
| Sumitomo Mitsui Banking Corp. | 2.092% | 10/18/19 | 7,505 | 7,433 |
| Sumitomo Mitsui Banking Corp. | 2.514% | 1/17/20 | 15,910 | 15,772 |
| Sumitomo Mitsui Financial Group Inc. | 3.748% | 7/19/23 | 4,695 | 4,671 |
23
| | | | | |
| Institutional Short-Term Bond Fund | | | | |
| |
| |
| |
| | | | | Face | Market |
| | | | Maturity | Amount | Value • |
| | | Coupon | Date | ($000) | ($000) |
| | Svenska Handelsbanken AB | 2.250% | 6/17/19 | 6,000 | 5,978 |
| | Svenska Handelsbanken AB | 2.450% | 3/30/21 | 800 | 782 |
| | Svenska Handelsbanken AB | 1.875% | 9/7/21 | 3,320 | 3,175 |
| 7 | Swedbank AB | 2.800% | 3/14/22 | 5,145 | 5,008 |
| | Toronto-Dominion Bank | 1.900% | 10/24/19 | 28,630 | 28,335 |
| | Toronto-Dominion Bank | 3.150% | 9/17/20 | 26,935 | 27,003 |
| | Toronto-Dominion Bank | 3.250% | 6/11/21 | 25,575 | 25,553 |
| | Toronto-Dominion Bank | 3.500% | 7/19/23 | 15,085 | 15,082 |
| 7 | UBS AG | 2.200% | 6/8/20 | 12,310 | 12,087 |
| 7 | UBS AG | 2.450% | 12/1/20 | 21,355 | 20,885 |
| 7 | UBS Group Funding Jersey Ltd. | 3.000% | 4/15/21 | 6,579 | 6,469 |
| 7 | UBS Group Funding Switzerland AG | 3.491% | 5/23/23 | 3,400 | 3,332 |
| 6,7 | UBS Group Funding Switzerland AG | 2.859% | 8/15/23 | 23,972 | 22,913 |
| | Wells Fargo Bank NA | 2.400% | 1/15/20 | 38,900 | 38,592 |
| 6 | Wells Fargo Bank NA | 3.325% | 7/23/21 | 37,575 | 37,525 |
| | Wells Fargo Bank NA | 3.550% | 8/14/23 | 9,525 | 9,468 |
| | Westpac Banking Corp. | 2.600% | 11/23/20 | 150 | 148 |
| | Westpac Banking Corp. | 2.650% | 1/25/21 | 11,115 | 10,930 |
| | Westpac Banking Corp. | 2.000% | 8/19/21 | 5,000 | 4,798 |
| | Westpac Banking Corp. | 2.750% | 1/11/23 | 11,725 | 11,317 |
| | Westpac Banking Corp. | 3.650% | 5/15/23 | 10,820 | 10,799 |
| |
| | Finance Companies (1.4%) | | | | |
| | GE Capital International Funding Co. | | | | |
| | Unlimited Co. | 2.342% | 11/15/20 | 111,436 | 108,636 |
| |
| | Insurance (1.0%) | | | | |
| 7 | AIG Global Funding | 2.700% | 12/15/21 | 2,570 | 2,496 |
| 7 | MassMutual Global Funding II | 1.950% | 9/22/20 | 5,770 | 5,632 |
| 7 | Metropolitan Life Global Funding I | 2.400% | 1/8/21 | 16,660 | 16,323 |
| 7 | Metropolitan Life Global Funding I | 3.000% | 1/10/23 | 1,000 | 975 |
| 7 | Pricoa Global Funding I | 3.450% | 9/1/23 | 3,300 | 3,275 |
| 7 | Principal Life Global Funding II | 2.204% | 12/11/19 | 27,685 | 27,356 |
| 7 | Reliance Standard Life Global Funding II | 2.150% | 10/15/18 | 17,000 | 16,995 |
| 7 | Reliance Standard Life Global Funding II | 3.050% | 1/20/21 | 1,770 | 1,745 |
| | | | | | 1,542,839 |
| Industrial (5.6%) | | | | |
| | Basic Industry (0.5%) | | | | |
| 7 | Air Liquide Finance SA | 1.375% | 9/27/19 | 6,805 | 6,703 |
| | Airgas Inc. | 2.375% | 2/15/20 | 12,470 | 12,349 |
| 7 | Chevron Phillips Chemical Co LLC / | | | | |
| | Chevron Phillips Chemical Co LP | 2.450% | 5/1/20 | 6,685 | 6,609 |
| | EI du Pont de Nemours & Co. | 2.200% | 5/1/20 | 17,475 | 17,241 |
| |
| | Capital Goods (1.0%) | | | | |
| | Caterpillar Financial Services Corp. | 1.900% | 3/22/19 | 20,000 | 19,942 |
| | Caterpillar Financial Services Corp. | 2.250% | 12/1/19 | 15,025 | 14,861 |
| | Caterpillar Financial Services Corp. | 1.850% | 9/4/20 | 20,000 | 19,459 |
| | Caterpillar Financial Services Corp. | 2.500% | 11/13/20 | 4,850 | 4,772 |
| | General Electric Co. | 4.625% | 1/7/21 | 16,000 | 16,482 |
| |
| | Communication (0.2%) | | | | |
| | America Movil SAB de CV | 5.000% | 10/16/19 | 5,200 | 5,278 |
| | America Movil SAB de CV | 5.000% | 3/30/20 | 1,375 | 1,406 |
| 7 | NBCUniversal Enterprise Inc. | 1.974% | 4/15/19 | 9,965 | 9,921 |
24
| | | | |
| Institutional Short-Term Bond Fund | | | | |
| |
| |
| |
| | | | Face | Market |
| | | Maturity | Amount | Value • |
| | Coupon | Date | ($000) | ($000) |
| Consumer Cyclical (1.0%) | | | | |
| American Honda Finance Corp. | 3.000% | 6/16/20 | 8,450 | 8,434 |
| 7 BMW US Capital LLC | 3.250% | 8/14/20 | 6,300 | 6,320 |
| 7 Harley-Davidson Financial Services Inc. | 2.250% | 1/15/19 | 16,092 | 16,068 |
| 7 Harley-Davidson Financial Services Inc. | 2.400% | 9/15/19 | 11,671 | 11,602 |
| 7 Harley-Davidson Financial Services Inc. | 2.150% | 2/26/20 | 6,512 | 6,399 |
| 7 Harley-Davidson Financial Services Inc. | 2.400% | 6/15/20 | 1,650 | 1,618 |
| 7 Nissan Motor Acceptance Corp. | 2.000% | 3/8/19 | 6,700 | 6,679 |
| 7 Nissan Motor Acceptance Corp. | 2.150% | 7/13/20 | 3,500 | 3,425 |
| 7 Nissan Motor Acceptance Corp. | 2.150% | 9/28/20 | 5,000 | 4,873 |
| 7 Nissan Motor Acceptance Corp. | 3.650% | 9/21/21 | 3,500 | 3,508 |
| Toyota Motor Corp. | 3.183% | 7/20/21 | 6,600 | 6,609 |
| |
| Consumer Noncyclical (0.5%) | | | | |
| Altria Group Inc. | 9.250% | 8/6/19 | 18,551 | 19,509 |
| Gilead Sciences Inc. | 1.850% | 9/20/19 | 4,000 | 3,967 |
| Gilead Sciences Inc. | 2.350% | 2/1/20 | 14,075 | 13,954 |
| SSM Health Care Corp. | 3.688% | 6/1/23 | 6,485 | 6,457 |
| |
| Energy (1.7%) | | | | |
| Baker Hughes a GE Co. LLC | 3.200% | 8/15/21 | 12,642 | 12,576 |
| BP Capital Markets plc | 4.750% | 3/10/19 | 37,139 | 37,482 |
| BP Capital Markets plc | 1.676% | 5/3/19 | 19,500 | 19,376 |
| BP Capital Markets plc | 2.521% | 1/15/20 | 480 | 478 |
| BP Capital Markets plc | 2.315% | 2/13/20 | 14,647 | 14,511 |
| BP Capital Markets plc | 4.500% | 10/1/20 | 10,000 | 10,249 |
| TransCanada PipeLines Ltd. | 2.125% | 11/15/19 | 17,190 | 16,995 |
| 8 TransCanada PipeLines Ltd. | 2.589% | 11/15/19 | 16,710 | 16,737 |
| TransCanada PipeLines Ltd. | 2.500% | 8/1/22 | 1,557 | 1,491 |
| |
| Other Industrial (0.4%) | | | | |
| 7 CK Hutchison International 17 Ltd. | 2.250% | 9/29/20 | 12,480 | 12,182 |
| 7 Hutchison Whampoa International 09 Ltd. | 7.625% | 4/9/19 | 16,140 | 16,523 |
| |
| Technology (0.1%) | | | | |
| Baidu Inc. | 2.750% | 6/9/19 | 6,228 | 6,204 |
| |
| Transportation (0.2%) | | | | |
| Burlington Northern Santa Fe LLC | 4.700% | 10/1/19 | 9,257 | 9,408 |
| 6 Delta Air Lines 2012-1 Class A Pass Through | | | | |
| Trust | 4.750% | 11/7/21 | 6,679 | 6,787 |
| 6 Northwest Airlines 2007-1 Class A Pass | | | | |
| Through Trust | 7.027% | 5/1/21 | 4,130 | 4,264 |
| | | | | 439,708 |
| Utilities (0.4%) | | | | |
| Electric (0.3%) | | | | |
| Arizona Public Service Co. | 8.750% | 3/1/19 | 830 | 849 |
| Berkshire Hathaway Energy Co. | 2.375% | 1/15/21 | 3,325 | 3,266 |
| Connecticut Light & Power Co. | 5.500% | 2/1/19 | 3,815 | 3,846 |
| Duke Energy Florida LLC | 4.550% | 4/1/20 | 200 | 204 |
| MidAmerican Energy Co. | 2.400% | 3/15/19 | 3,053 | 3,051 |
| Public Service Electric & Gas Co. | 3.500% | 8/15/20 | 1,297 | 1,302 |
| Southern California Edison Co. | 2.900% | 3/1/21 | 4,665 | 4,612 |
| Western Massachusetts Electric Co. | 3.500% | 9/15/21 | 830 | 831 |
25
| | | | | |
| Institutional Short-Term Bond Fund | | | | |
| |
| |
| |
| | | | | Face | Market |
| | | | Maturity | Amount | Value • |
| | | Coupon | Date | ($000) | ($000) |
| | Natural Gas (0.1%) | | | | |
| | Atmos Energy Corp. | 8.500% | 3/15/19 | 8,990 | 9,215 |
| | | | | | 27,176 |
| Total Corporate Bonds (Cost $2,030,546) | | | | 2,009,723 |
| Sovereign Bonds (14.0%) | | | | |
| | African Development Bank | 1.000% | 11/2/18 | 40,000 | 39,955 |
| 7 | Avi Funding Co. Ltd. | 2.850% | 9/16/20 | 7,700 | 7,581 |
| | Bermuda | 5.603% | 7/20/20 | 3,860 | 3,994 |
| 7 | BNG Bank NV | 1.500% | 2/15/19 | 4,500 | 4,478 |
| 7 | BNG Bank NV | 1.750% | 10/30/19 | 35,000 | 34,608 |
| 7 | CDP Financial Inc. | 4.400% | 11/25/19 | 12,903 | 13,109 |
| 7 | CDP Financial Inc. | 3.150% | 7/24/24 | 1,750 | 1,723 |
| | CNOOC Finance 2015 Australia Pty Ltd. | 2.625% | 5/5/20 | 1,850 | 1,827 |
| | Corp. Andina de Fomento | 2.200% | 7/18/20 | 3,026 | 2,962 |
| 7 | Corp. Nacional del Cobre de Chile | 3.875% | 11/3/21 | 7,950 | 7,980 |
| | Corp. Nacional del Cobre de Chile | 3.875% | 11/3/21 | 2,020 | 2,033 |
| 7 | Corp. Nacional del Cobre de Chile | 4.500% | 8/13/23 | 9,538 | 9,727 |
| | Corp. Nacional del Cobre de Chile | 4.500% | 8/13/23 | 4,600 | 4,699 |
| 7 | CPPIB Capital Inc. | 1.250% | 9/20/19 | 39,785 | 39,170 |
| 7,10 Dexia Credit Local SA | 1.875% | 9/15/21 | 10,000 | 9,620 |
| 7 | Dexia Credit Local SA | 2.375% | 9/20/22 | 10,290 | 9,925 |
| 7 | Dexia Credit Local SA | 3.250% | 9/26/23 | 50,000 | 49,713 |
| 7 | Electricite de France SA | 6.500% | 1/26/19 | 2,000 | 2,022 |
| | Emirate of Abu Dhabi | 2.500% | 10/11/22 | 17,000 | 16,362 |
| | Emirate of Abu Dhabi | 3.125% | 10/11/27 | 6,000 | 5,668 |
| | Equinor ASA | 3.150% | 1/23/22 | 3,000 | 2,981 |
| | Equinor ASA | 2.650% | 1/15/24 | 2,000 | 1,917 |
| | European Investment Bank | 1.875% | 3/15/19 | 20,000 | 19,950 |
| | Export-Import Bank of Korea | 1.500% | 10/21/19 | 19,500 | 19,106 |
| | Export-Import Bank of Korea | 2.250% | 1/21/20 | 4,000 | 3,937 |
| | Export-Import Bank of Korea | 5.125% | 6/29/20 | 1,500 | 1,538 |
| | Export-Import Bank of Korea | 4.000% | 1/29/21 | 5,200 | 5,250 |
| | Export-Import Bank of Korea | 3.000% | 11/1/22 | 2,400 | 2,339 |
| | First Abu Dhabi Bank PJSC | 3.000% | 8/13/19 | 8,000 | 7,994 |
| | FMS Wertmanagement AoeR | 1.625% | 11/20/18 | 10,000 | 9,987 |
| 7 | Harvest Operations Corp. | 4.200% | 6/1/23 | 2,000 | 2,025 |
| 7 | ICBCIL Finance Co. Ltd. | 2.375% | 5/19/19 | 7,000 | 6,939 |
| 8 | Industrial & Commercial Bank of China Ltd. | 3.093% | 11/8/20 | 4,500 | 4,505 |
| | Inter-American Development Bank | 2.125% | 11/9/20 | 150 | 148 |
| | Inter-American Development Bank | 1.250% | 9/14/21 | 1,835 | 1,743 |
| 11 | Japan Bank for International Cooperation | 1.750% | 11/13/18 | 8,250 | 8,243 |
| 11 | Japan Bank for International Cooperation | 2.125% | 11/16/20 | 12,500 | 12,220 |
| 11 | Japan Bank for International Cooperation | 3.125% | 7/20/21 | 24,300 | 24,230 |
| 7 | Japan Finance Organization for Municipalities | 2.125% | 3/6/19 | 15,000 | 14,951 |
| 12 | KFW | 1.875% | 4/1/19 | 5,000 | 4,981 |
| | Kingdom of Saudi Arabia | 2.375% | 10/26/21 | 14,000 | 13,501 |
| | Kingdom of Saudi Arabia | 2.875% | 3/4/23 | 7,600 | 7,330 |
| | Kingdom of Sweden | 1.500% | 7/25/19 | 27,000 | 26,727 |
| 7 | Kommunalbanken AS | 1.375% | 11/23/18 | 100,000 | 99,847 |
| 7 | Kommunalbanken AS | 2.125% | 3/15/19 | 14,000 | 13,969 |
| 7 | Kommunalbanken AS | 1.750% | 5/28/19 | 15,000 | 14,896 |
| 7 | Kommunalbanken AS | 1.500% | 9/9/19 | 33,000 | 32,617 |
| 8 | Korea Development Bank | 3.014% | 9/19/20 | 11,225 | 11,251 |
26
| | | | | |
| Institutional Short-Term Bond Fund | | | | |
| |
| |
| |
| | | | | Face | Market |
| | | | Maturity | Amount | Value • |
| | | Coupon | Date | ($000) | ($000) |
| 8 | Korea Development Bank | 2.884% | 3/12/21 | 10,000 | 10,001 |
| | Korea Development Bank | 4.625% | 11/16/21 | 2,315 | 2,387 |
| 7 | Korea East-West Power Co. Ltd. | 3.875% | 7/19/23 | 10,900 | 10,885 |
| 7 | Korea Hydro & Nuclear Power Co. Ltd. | 2.875% | 10/2/18 | 4,000 | 4,000 |
| 7 | Korea National Oil Corp. | 2.750% | 1/23/19 | 20,000 | 20,000 |
| 7 | Nederlandse Waterschapsbank NV | 1.875% | 3/13/19 | 8,000 | 7,969 |
| 7 | Nederlandse Waterschapsbank NV | 1.250% | 9/9/19 | 11,500 | 11,319 |
| | North American Development Bank | 2.300% | 10/10/18 | 2,625 | 2,625 |
| | Petronas Capital Ltd. | 5.250% | 8/12/19 | 5,840 | 5,940 |
| | Petronas Capital Ltd. | 5.250% | 8/12/19 | 3,628 | 3,690 |
| | Province of Alberta | 1.900% | 12/6/19 | 20,000 | 19,708 |
| 7 | Province of Alberta | 1.750% | 8/26/20 | 9,350 | 9,115 |
| | Province of Manitoba | 9.625% | 12/1/18 | 7,180 | 7,256 |
| | Province of Manitoba | 2.100% | 9/6/22 | 1,400 | 1,335 |
| | Province of Ontario | 1.625% | 1/18/19 | 38,000 | 37,872 |
| | Province of Ontario | 2.000% | 1/30/19 | 29,500 | 29,423 |
| | Province of Ontario | 1.250% | 6/17/19 | 60,000 | 59,255 |
| | Province of Ontario | 4.000% | 10/7/19 | 2,575 | 2,603 |
| | Province of Ontario | 4.400% | 4/14/20 | 19,500 | 19,887 |
| 9 | Province of Quebec | 2.483% | 9/21/20 | 10,000 | 10,030 |
| | Province of Quebec | 2.750% | 8/25/21 | 6,350 | 6,278 |
| | Republic of Chile | 2.250% | 10/30/22 | 2,000 | 1,920 |
| | Republic of Lithuania | 7.375% | 2/11/20 | 34,170 | 36,128 |
| | Republic of Lithuania | 6.125% | 3/9/21 | 17,510 | 18,648 |
| | Republic of Poland | 6.375% | 7/15/19 | 26,796 | 27,531 |
| | Republic of Poland | 5.125% | 4/21/21 | 1,350 | 1,412 |
| | Republic of Poland | 5.000% | 3/23/22 | 20,630 | 21,713 |
| | Sinopec Group Overseas Development | | | | |
| | 2014 Ltd. | 2.750% | 4/10/19 | 9,200 | 9,180 |
| 7 | State Grid Overseas Investment 2014 Ltd. | 2.750% | 5/7/19 | 10,000 | 9,975 |
| | State of Israel | 3.150% | 6/30/23 | 2,000 | 1,973 |
| | State of Qatar | 5.250% | 1/20/20 | 17,200 | 17,645 |
| | State of Qatar | 3.875% | 4/23/23 | 12,500 | 12,584 |
| 7 | Temasek Financial I Ltd. | 4.300% | 10/25/19 | 2,500 | 2,534 |
| 7 | Temasek Financial I Ltd. | 2.375% | 1/23/23 | 5,000 | 4,791 |
| Total Sovereign Bonds (Cost $1,097,099) | | | | 1,089,890 |
| Taxable Municipal Bonds (0.1%) | | | | |
| | Louisiana Local Government Environmental | | | | |
| | Facilities & Community Development | | | | |
| | Authority Revenue 2010-EGSL | 3.220% | 2/1/21 | 367 | 368 |
| | Louisiana Local Government Environmental | | | | |
| | Facilities & Community Development | | | | |
| | Authority Revenue 2010-ELL | 3.450% | 2/1/22 | 4,831 | 4,835 |
| | Princeton University New Jersey GO | 4.950% | 3/1/19 | 3,249 | 3,277 |
| Total Taxable Municipal Bonds (Cost $8,530) | | | | 8,480 |
| |
| | | | | Shares | |
| Temporary Cash Investments (5.9%) | | | | |
| Money Market Fund (5.2%) | | | | |
| 13 | Vanguard Market Liquidity Fund | 2.209% | | 4,012,307 | 401,231 |
27
| | | | | |
| Institutional Short-Term Bond Fund | | | | |
| |
| |
| |
| | | | | Face | Market |
| | | | Maturity | Amount | Value • |
| | | Coupon | Date | ($000) | ($000) |
| Commercial Paper (0.3%) | | | | |
| 14 | Erp Operating LP | 2.339% | 10/1/18 | 1,525 | 1,525 |
| 14 | JP Morgan Securities LLC | 2.344% | 1/28/19 | 21,950 | 21,764 |
| | | | | | 23,289 |
| Certificates of Deposit (0.4%) | | | | |
| | Cooperatieve Rabobank UA | 1.980% | 10/25/19 | 32,235 | 31,838 |
| Total Temporary Cash Investments (Cost $456,764) | | | 456,358 |
| Total Investments (99.6%) (Cost $7,820,034) | | | | 7,762,252 |
| Other Assets and Liabilities (0.4%) | | | | |
| Other Assets | | | | 41,849 |
| Liabilities | | | | (8,011) |
| | | | | | 33,838 |
| Net Assets (100%) | | | | |
| Applicable to 575,147,867 outstanding $.001 par value shares of | | | |
| beneficial interest (unlimited authorization) | | | | 7,796,090 |
| Net Asset Value Per Share | | | | $13.55 |
| |
| | | | | | Amount |
| | | | | | ($000) |
| Statement of Assets and Liabilities | | | | |
| Assets | | | | |
| Investments in Securities, at Value | | | | |
| Unaffiliated Issuers | | | | 7,361,021 |
| Affiliated Issuers | | | | 401,231 |
| Total Investments in Securities | | | | 7,762,252 |
| Investment in Vanguard | | | | 340 |
| Receivables for Investment Securities Sold | | | | 8,192 |
| Receivables for Accrued Income | | | | 31,028 |
| Variation Margin Receivable—Futures Contracts | | | | 378 |
| Variation Margin Receivable—CC Swap Contracts | | | | 16 |
| Unrealized Appreciation—OTC Swap Contracts | | | | 41 |
| Other Assets | | | | 1,854 |
| Total Assets | | | | 7,804,101 |
| Liabilities | | | | |
| Payables for Investment Securities Purchased | | | | 6,110 |
| Payables to Vanguard | | | | 1,221 |
| Variation Margin Payable—Futures Contracts | | | | 244 |
| Variation Margin Payable—CC Swap Contracts | | | | 155 |
| Unrealized Depreciation—OTC Swap Contracts | | | | 281 |
| Total Liabilities | | | | 8,011 |
| Net Assets | | | | 7,796,090 |
28
| |
| Institutional Short-Term Bond Fund | |
| |
| |
| |
| At September 30, 2018, net assets consisted of: | |
| | Amount |
| | ($000) |
| Paid-in Capital | 7,895,152 |
| Overdistributed Net Investment Income | (1) |
| Accumulated Net Realized Losses | (38,811) |
| Unrealized Appreciation (Depreciation) | |
| Investment Securities | (57,782) |
| Futures Contracts | (3,307) |
| Swap Contracts | 839 |
| Net Assets | 7,796,090 |
• See Note A in Notes to Financial Statements.
1 Securities with a value of $4,108,000 have been segregated as initial margin for open futures contracts.
2 Securities with a value of $5,020,000 have been segregated as initial margin for open cleared swap contracts.
3 U.S. government-guaranteed.
4 The issuer operates under a congressional charter; its securities are generally neither guaranteed by the U.S. Treasury nor backed
by the full faith and credit of the U.S. government.
5 The issuer was placed under federal conservatorship in September 2008; since that time, its daily operations have been managed
by the Federal Housing Finance Agency and it receives capital from the U.S. Treasury, as needed to maintain a positive net worth,
in exchange for senior preferred stock.
6 The average or expected maturity is shorter than the final maturity shown because of the possibility of interim principal payments
and prepayments or the possibility of the issue being called.
7 Security exempt from registration under Rule 144A of the Securities Act of 1933. Such securities may be sold in transactions
exempt from registration, normally to qualified institutional buyers. At September 30, 2018, the aggregate value of these
securities was $2,486,446,000, representing 31.9% of net assets.
8 Adjustable-rate security based upon 3-month USD LIBOR plus spread.
9 Adjustable-rate security based upon 1-month USD LIBOR plus spread.
10 Guaranteed by multiple countries.
11 Guaranteed by the Government of Japan.
12 Guaranteed by the Federal Republic of Germany.
13 Affiliated money market fund available only to Vanguard funds and certain trusts and accounts managed by Vanguard. Rate shown
is the 7-day yield.
14 Security exempt from registration under Section 4(2) of the Securities Act of 1933. Such securities may be sold in transactions
exempt from registration only to dealers in that program or other “accredited investors.” At September 30, 2018, the aggregate
value of these securities was $23,289,000, representing 0.3% of net assets.
CC—Centraly Cleared.
GO—General Obligation Bond.
OTC — Over-the-Counter.
29
| | | | |
| Institutional Short-Term Bond Fund | | | | |
| |
| |
| Derivative Financial Instruments Outstanding as of Period End | | |
| Futures Contracts | | | | |
| | | | | ($000) |
| | | | | Value and |
| | | Number of | | Unrealized |
| | | Long (Short) | Notional | Appreciation |
| | Expiration | Contracts | Amount | (Depreciation) |
| Long Futures Contracts | | | | |
| 2-Year U. S. Treasury Note | December 2018 | 7,372 | 1,553,534 | (3,416) |
| 10-Year U. S. Treasury Note | December 2018 | 139 | 16,511 | (41) |
| 30-Year U. S. Treasury Bond | December 2018 | 63 | 8,852 | (218) |
| Ultra 10-Year U. S. Treasury Note | December 2018 | 69 | 8,694 | 31 |
| | | | | (3,644) |
| | | | |
| Short Futures Contracts | | | | |
| 5-Year U. S. Treasury Note | December 2018 | (2,567) | (288,727) | 332 |
| Ultra Long U.S. Treasury Bond | December 2018 | (1) | (154) | 5 |
| | | | | 337 |
| | | | | (3,307) |
| | | | | | | |
| Over-the-Counter Credit Default Swaps | | | | | |
| | | | | | | Remaining | |
| | | | | Periodic | | Up-Front | |
| | | | | Premium | | Premium | Unrealized |
| | | | Notional | Received | | Received | Appreciation |
| Termination | | Amount | (Paid)1 | Value | (Paid) | (Depreciation) |
| Reference Entity | Date | Counterparty | ($000) | (%) | ($000) | ($000) | ($000) |
| Credit Protection Sold/Moody’s Rating | | | | | |
| Republic of Chile/Aa3 | 12/20/23 | BOANA | 5,500 | 1.000 | 143 | (128) | 15 |
| Republic of Chile/Aa3 | 12/20/23 | GSI | 7,750 | 1.000 | 200 | (174) | 26 |
| | | | | | 343 | (302) | 41 |
30
| | | | | | | |
| Institutional Short-Term Bond Fund | | | | | |
| |
| |
| Over-the-Counter Credit Default Swaps (continued) | | | | |
| | | | | | | Remaining | |
| | | | | Periodic | | Up-Front | |
| | | | | Premium | | Premium | Unrealized |
| | | | Notional | Received | | Received | Appreciation |
| | Termination | | Amount | (Paid)1 | Value | (Paid) (Depreciation) |
| Reference Entity | Date | Counterparty | ($000) | (%) | ($000) | ($000) | ($000) |
| Credit Protection Purchased | | | | | | |
| EI du Pont de | | | | | | | |
| Nemours & Co. | 12/20/20 | JPMC | 4,915 | (1.000) | (95) | 53 | (42) |
| State of Qatar | 6/20/22 | BOANA | 2,720 | (1.000) | (57) | (25) | (82) |
| State of Qatar | 6/20/22 | CITNA | 5,280 | (1.000) | (111) | (46) | (157) |
| | | | | | (263) | (18) | (281) |
| | | | | | 80 | (320) | (240) |
The notional amount represents the maximum potential amount the fund could be required to pay as a seller of credit protection if the reference entity was subject to a credit event.
1 Periodic premium received/paid quarterly.
BOANA—Bank of America, N.A.
CITNA—Citibank N.A.
GSI—Goldman Sachs International.
JPMC—JP Morgan Chase Bank.
| | | | | | |
| Centrally Cleared Interest Rate Swaps | | | | | |
| | | | Fixed | Floating | | |
| | | | Interest | Interest | | |
| | | | Rate | Rate | | Unrealized |
| | Future | Notional | Received | Received | | Appreciation |
| | Effective | Amount | (Paid)2 | (Paid) 3 | Value | (Depreciation) |
| Termination Date | Date | ($000) | (%) | (%) | ($000) | ($000) |
| 11/21/19 | N/A | 14,600 | 1.891 | (2.312) | (153) | (153) |
| 12/19/19 | 12/19/181 | 70,582 | 2.500 | (0.000) | (303) | (28) |
| 12/21/20 | 12/19/181 | 11,758 | 2.750 | (0.000) | (74) | (2) |
| 12/20/21 | 12/19/181 | 88,393 | (2.750) | 0.000 | 900 | 140 |
| 12/19/22 | 12/19/181 | 110,503 | (2.750) | 0.000 | 1,488 | 282 |
| 12/19/23 | 12/19/181 | 58,644 | (2.750) | 0.000 | 974 | 196 |
| 12/19/25 | 12/19/181 | 112,711 | (2.750) | 0.000 | 2,661 | 644 |
| | | | | | 5,493 | 1,079 |
1 Forward interest rate swap. In a forward interest rate swap, the fund and the counterparty agree to make periodic net payments beginning on a specified future effective date.
2 Fixed interest payment received/paid semiannually.
3 Based on 3-month London Interbank Offered Rate (LIBOR) as of the most recent payment date. Floating interest payment received/ paid quarterly.
See accompanying Notes, which are an integral part of the Financial Statements.
31
Institutional Short-Term Bond Fund
Statement of Operations
| |
| | Year Ended |
| | September 30, 2018 |
| | ($000) |
| Investment Income | |
| Income | |
| Interest1 | 147,157 |
| Total Income | 147,157 |
| Expenses | |
| The Vanguard Group—Note B | |
| Investment Advisory Services | 210 |
| Management and Administrative | 1,009 |
| Marketing and Distribution | 49 |
| Custodian Fees | 49 |
| Auditing Fees | 37 |
| Trustees’ Fees and Expenses | 4 |
| Total Expenses | 1,358 |
| Net Investment Income | 145,799 |
| Realized Net Gain (Loss) | |
| Investment Securities Sold1 | (32,024) |
| Futures Contracts | (9,045) |
| Swap Contracts | 3,458 |
| Realized Net Gain (Loss) | (37,611) |
| Change in Unrealized Appreciation (Depreciation) | |
| Investment Securities1 | (57,634) |
| Futures Contracts | (2,314) |
| Swap Contracts | 946 |
| Change in Unrealized Appreciation (Depreciation) | (59,002) |
| Net Increase (Decrease) in Net Assets Resulting from Operations | 49,186 |
1 Interest income, realized net gain (loss), and change in unrealized appreciation (depreciation) from an affiliated company of the fund were $2,984,000, ($39,000), and ($18,000), respectively. Purchases and sales are for temporary cash investment purposes.
See accompanying Notes, which are an integral part of the Financial Statements.
32
Institutional Short-Term Bond Fund
Statement of Changes in Net Assets
| | |
| | Year Ended September 30, |
| | 2018 | 2017 |
| | ($000) | ($000) |
| Increase (Decrease) in Net Assets | | |
| Operations | | |
| Net Investment Income | 145,799 | 136,149 |
| Realized Net Gain (Loss) | (37,611) | 4,351 |
| Change in Unrealized Appreciation (Depreciation) | (59,002) | (62,412) |
| Net Increase (Decrease) in Net Assets Resulting from Operations | 49,186 | 78,088 |
| Distributions | | |
| Net Investment Income | (145,766) | (137,196) |
| Realized Capital Gain1 | — | (8,272) |
| Total Distributions | (145,766) | (145,468) |
| Capital Share Transactions | | |
| Issued | 1,370,015 | 592,012 |
| Issued in Lieu of Cash Distributions | 145,766 | 145,468 |
| Redeemed | (855,959) | (3,834,694) |
| Net Increase (Decrease) from Capital Share Transactions | 659,822 | (3,097,214) |
| Total Increase (Decrease) | 563,242 | (3,164,594) |
| Net Assets | | |
| Beginning of Period | 7,232,848 | 10,397,442 |
| End of Period2 | 7,796,090 | 7,232,848 |
1 Includes fiscal 2018 and 2017 short-term gain distributions totaling $0 and $1,244,000, respectively. Short-term gain distributions are treated as ordinary income dividends for tax purposes.
2 Net Assets—End of Period includes undistributed (overdistributed) net investment income of ($1,000) and $113,000.
See accompanying Notes, which are an integral part of the Financial Statements.
33
Institutional Short-Term Bond Fund
Financial Highlights
| | | | |
| | | | | June 19, |
| | | | | 20151 to |
| | Year Ended September 30, | Sept. 30, |
| For a Share Outstanding Throughout Each Period | 2018 | 2017 | 2016 | 2015 |
| Net Asset Value, Beginning of Period | $13.75 | $13.84 | $13.79 | $13.79 |
| Investment Operations | | | | |
| Net Investment Income | . 293 2 | .2212 | .188 | .047 |
| Net Realized and Unrealized Gain (Loss) on Investments | (.202) | (.071) | .052 | .001 |
| Total from Investment Operations | .091 | .150 | . 240 | .048 |
| Distributions | | | | |
| Dividends from Net Investment Income | (. 291) | (. 229) | (.187) | (. 048) |
| Distributions from Realized Capital Gains | — | (.011) | (.003) | — |
| Total Distributions | (. 291) | (. 240) | (.190) | (. 048) |
| Net Asset Value, End of Period | $13.55 | $13.75 | $13.84 | $13.79 |
| |
| Total Return | 0.67% | 1.10% | 1.75% | 0.35% |
| |
| Ratios/Supplemental Data | | | | |
| Net Assets, End of Period (Millions) | $7,796 | $7,233 | $10,397 | $10,270 |
| Ratio of Total Expenses to Average Net Assets | 0.02% | 0.02% | 0.02% | 0.02%3 |
| Ratio of Net Investment Income to Average Net Assets | 2.15% | 1.61% | 1.37% | 1.22%3 |
| Portfolio Turnover Rate | 118% 4 | 66% | 119% | 28% |
1 Commencement of operations as a registered investment company.
2 Calculated based on average shares outstanding.
3 Annualized.
4 Excludes the value of portfolio securities received or delivered as a result of in-kind purchases or redemptions of the fund’s
capital shares.
See accompanying Notes, which are an integral part of the Financial Statements.
34
Institutional Short-Term Bond Fund
Notes to Financial Statements
Vanguard Institutional Short-Term Bond Fund is registered under the Investment Company Act of 1940 as an open-end investment company, or mutual fund. The fund has been established by Vanguard as an investment vehicle for certain collective trusts and other accounts managed by Vanguard or its affiliates, and qualifying education savings plans. The fund is offered to investors who meet certain administrative and service criteria and invest a minimum of $10 million. Certain of the fund’s investments are in corporate debt instruments; the issuers’ abilities to meet their obligations may be affected by economic developments in their respective industries.
A. The following significant accounting policies conform to generally accepted accounting principles for U.S. investment companies. The fund consistently follows such policies in preparing its financial statements.
1. Security Valuation: Securities are valued as of the close of trading on the New York Stock Exchange (generally 4 p.m., Eastern time) on the valuation date. Bonds and temporary cash investments are valued using the latest bid prices or using valuations based on a matrix system (which considers such factors as security prices, yields, maturities, and ratings), both as furnished by independent pricing services. Structured debt securities, including mortgages and asset-backed securities, are valued using the latest bid prices or using valuations based on a matrix system that considers such factors as issuer, tranche, nominal or option-adjusted spreads, weighted average coupon, weighted average maturity, credit enhancements, and collateral. Investments in Vanguard Market Liquidity Fund are valued at that fund’s net asset value. Securities for which market quotations are not readily available, or whose values have been affected by events occurring before the fund’s pricing time but after the close of the securities’ primary markets, are valued by methods deemed by the board of trustees to represent fair value.
2. Futures Contracts: The fund uses futures contracts to invest in fixed income asset classes with greater efficiency and lower cost than is possible through direct investment, to add value when these instruments are attractively priced, or to adjust sensitivity to changes in interest rates. The primary risks associated with the use of futures contracts are imperfect correlation between changes in market values of bonds held by the fund and the prices of futures contracts, and the possibility of an illiquid market. Counterparty risk involving futures is mitigated because a regulated clearinghouse is the counterparty instead of the clearing broker. To further mitigate counterparty risk, the fund trades futures contracts on an exchange, monitors the financial strength of its clearing brokers and clearinghouse, and has entered into clearing agreements with its clearing brokers. The clearinghouse imposes initial margin requirements to secure the fund’s performance and requires daily settlement of variation margin representing changes in the market value of each contract. Any assets pledged as initial margin for open contracts are noted in the Statement of Net Assets.
Futures contracts are valued at their quoted daily settlement prices. The notional amounts of the contracts are not recorded in the Statement of Net Assets. Fluctuations in the value of the contracts are recorded in the Statement of Assets and Liabilities as an asset (liability) and in the Statement of Operations as unrealized appreciation (depreciation) until the contracts are closed, when they are recorded as realized futures gains (losses).
During the year ended September 30, 2018, the fund’s average investments in long and short futures contracts represented 20% and 5% of net assets, respectively, based on the average of the notional amounts at each quarter-end during the period.
35
Institutional Short-Term Bond Fund
3. Swap Contracts: The fund invests in credit default swaps to adjust the overall credit risk of the fund or to actively overweight or underweight credit risk to a specific issuer or group of issuers. The fund may sell credit protection through credit default swaps to simulate investments in long positions that are either unavailable or considered to be less attractively priced in the bond market. The fund may purchase credit protection through credit default swaps to reduce credit exposure to a given issuer or issuers. Under the terms of the swaps, an up-front payment may be exchanged between the seller and buyer. In addition, the seller of the credit protection receives a periodic payment of premium from the buyer that is a fixed percentage applied to a notional amount. If, for example, the reference entity is subject to a credit event (such as bankruptcy, failure to pay, or obligation acceleration) during the term of the swap, the seller agrees to either physically settle or cash settle the swap contract. If the swap is physically settled, the seller agrees to pay the buyer an amount equal to the notional amount and take delivery of a debt instrument of the reference issuer with a par amount equal to such notional amount. If the swap is cash settled, the seller agrees to pay the buyer the difference between the notional amount and the final price for the relevant debt instrument, as determined either in a market auction or pursuant to a pre-agreed-upon valuation procedure.
The fund enters into interest rate swap transactions to adjust the fund’s sensitivity to changes in interest rates and maintain the ability to generate income at prevailing market rates. Under the terms of the swaps, one party pays the other an amount that is a fixed percentage rate applied to a notional amount. In return, the counterparty agrees to pay a floating rate, which is reset periodically based on short-term interest rates, applied to the same notional amount.
The notional amounts of swap contracts are not recorded in the Statement of Net Assets. Swaps are valued daily based on market quotations received from independent pricing services or recognized dealers and the change in value is recorded in the Statement of Assets and Liabilities as an asset (liability) and in the Statement of Operations as unrealized appreciation (depreciation) until the seller of credit protection is required to take delivery (or, in a cash settled swap, pay the settlement amount determined) upon occurrence of a credit event, periodic payments are made, or the swap terminates, at which time realized gain (loss) is recorded. The net premium to be received or paid by the fund under swap contracts is accrued daily and recorded as realized gain (loss) over the life of the contract.
The primary risk associated with selling credit protection is that, upon the occurrence of a defined credit event, the market value of the debt instrument received by the fund (or, in a cash settled swap, the debt instruments used to determine the settlement payment by the fund) will be significantly less than the amount paid by the fund and, in a physically settled swap, the fund may receive an illiquid debt instrument. A risk associated with all types of swaps is the possibility that a counterparty may default on its obligation to pay net amounts due to the fund. The fund’s maximum amount subject o counterparty risk is the unrealized appreciation on the swap contract. The fund mitigates its counterparty risk by entering into swaps only with a diverse group of prequalified counterparties, monitoring their financial strength, entering into master netting arrangements with its counterparties, and requiring its counterparties to transfer collateral as security for their performance. In the absence of a default, the collateral pledged or received by the fund cannot be repledged, resold, or rehypothecated. In the event of a counterparty’s default (including bankruptcy), the fund may terminate any swap contracts with that counterparty, determine the net amount owed by either party in accordance with its master netting arrangements, and sell or retain any collateral held up to the net amount owed to the fund under the master netting arrangements. The swap contracts contain provisions whereby a counterparty may terminate open contracts if the fund’s net assets decline below a certain level, triggering a payment by the fund if the fund is in a net liability position at
36
Institutional Short-Term Bond Fund
the time of the termination. The payment amount would be reduced by any collateral the fund has pledged. Any securities pledged as collateral for open contracts are noted in the Statement of Net Assets. The value of collateral received or pledged is compared daily to the value of the swap contracts exposure with each counterparty, and any difference, if in excess of a specified minimum transfer amount, is adjusted and settled within two business days.
The fund enters into centrally cleared interest rate swaps to achieve the same objectives specified with respect to the equivalent over-the-counter swaps but with less counterparty risk because a regulated clearinghouse is the counterparty instead of the clearing broker or executing broker. The clearinghouse imposes initial margin requirements to secure the fund’s performance, and requires daily settlement of variation margin representing changes in the market value of each contract.
To further mitigate counterparty risk, the fund trades with a diverse group of prequalified executing brokers; monitors the financial strength of its clearing brokers, executing brokers, and clearinghouse; and has entered into agreements with its clearing brokers and executing brokers.
During the year ended September 30, 2018, the fund’s average amounts of investments in credit protection sold and credit protection purchased each represented less than 1% of net assets, respectively, based on the average of notional amounts at each quarter-end during the period. The average amount of investments in interest rate swaps represented 3% of net assets, based on the average of notional amounts at each quarter-end during the period.
4. Federal Income Taxes: The fund intends to continue to qualify as a regulated investment company and distribute all of its taxable income. Management has analyzed the fund’s tax positions taken for all open federal income tax years (September 30, 2015–2018), and has concluded that no provision for federal income tax is required in the fund’s financial statements.
5. Distributions: Distributions to shareholders are recorded on the ex-dividend date. Distributions are determined on a tax basis and may differ from net investment income and realized capital gains for financial reporting purposes.
6. Credit Facility: The fund and certain other funds managed by The Vanguard Group (“Vanguard”) participate in a $3.1 billion committed credit facility provided by a syndicate of lenders pursuant to a credit agreement that may be renewed annually; each fund is individually liable for its borrowings, if any, under the credit facility. Borrowings may be utilized for temporary and emergency purposes, and are subject to the fund’s regulatory and contractual borrowing restrictions. The participating funds are charged administrative fees and an annual commitment fee of 0.10% of the undrawn amount of the facility; these fees are allocated to the funds based on a method approved by the fund’s board of trustees and included in Management and Administrative expenses on the fund’s Statement of Operations. Any borrowings under this facility bear interest at a rate based upon the higher of the one-month London Interbank Offered Rate, federal funds effective rate, or overnight bank funding rate plus an agreed-upon spread.
The fund had no borrowings outstanding at September 30, 2018, or at any time during the period then ended.
7. Other: Interest income includes income distributions received from Vanguard Market Liquidity Fund and is accrued daily. Premiums and discounts on debt securities purchased are amortized and accreted, respectively, to interest income over the lives of the respective securities. Security transactions are accounted for on the date securities are bought or sold. Costs used to determine realized gains (losses) on the sale of investment securities are those of the specific securities sold.
37
Institutional Short-Term Bond Fund
B. In accordance with the terms of a Funds’ Service Agreement (the “FSA”) between Vanguard and the fund, Vanguard furnishes to the fund investment advisory, corporate management, administrative, marketing, and distribution services at Vanguard’s cost of operations (as defined by the FSA). These costs of operations are allocated to the fund based on methods and guidelines approved by the board of trustees. Vanguard does not require reimbursement in the current period for certain costs of operations (such as deferred compensation/benefits and risk/insurance costs); the fund’s liability for these costs of operations is included in Payables to Vanguard on the Statement of Assets and Liabilities. All other costs of operations payable to Vanguard are generally settled twice a month.
Upon the request of Vanguard, the fund may invest up to 0.40% of its net assets as capital in Vanguard. At September 30, 2018, the fund had contributed to Vanguard capital in the amount of $340,000 representing 0.00% of the fund’s net assets and 0.14% of Vanguard’s capitalization. The fund’s trustees and officers are also directors and employees, respectively, of Vanguard.
C. Various inputs may be used to determine the value of the fund’s investments. These inputs are summarized in three broad levels for financial statement purposes. The inputs or methodologies used to value securities are not necessarily an indication of the risk associated with investing in those securities.
Level 1—Quoted prices in active markets for identical securities.
Level 2—Other significant observable inputs (including quoted prices for similar securities, interest rates, prepayment speeds, credit risk, etc.).
Level 3—Significant unobservable inputs (including the fund’s own assumptions used to determine the fair value of investments). Any investments valued with significant unobservable inputs are noted on the Statement of Net Assets.
The following table summarizes the market value of the fund’s investments as of September 30, 2018, based on the inputs used to value them:
| | | |
| | Level 1 | Level 2 | Level 3 |
| Investments | ($000) | ($000) | ($000) |
| U.S. Government and Agency Obligations | — | 1,131,112 | — |
| Asset-Backed/Commercial Mortgage-Backed Securities | — | 3,066,689 | — |
| Corporate Bonds | — | 2,009,723 | — |
| Sovereign Bonds | — | 1,089,890 | — |
| Taxable Municipal Bonds | — | 8,480 | — |
| Temporary Cash Investments | 401,231 | 55,127 | — |
| Futures Contracts—Assets1 | 378 | — | — |
| Futures Contracts—Liabilities1 | (244) | — | — |
| Swap Contracts—Assets | 161 | 41 | — |
| Swap Contracts—Liabilities | (155)1 | (281) | — |
| Total | 401,226 | 7,360,781 | — |
| 1 Represents variation margin on the last day of the reporting period. | | | |
38
Institutional Short-Term Bond Fund
D. At September 30, 2018, the fair values of derivatives were reflected in the Statement of Net Assets and Liabilities as follows:
| | | |
| | Interest Rate | Credit | |
| | Contracts | Contracts | Total |
| Statement of Assets and Liabilities Caption | ($000) | ($000) | ($000) |
| Variation Margin Receivable—Futures Contracts | 378 | — | 378 |
| Variation Margin Receivable—Swap Contracts | 16 | — | 16 |
| Unrealized Appreciation—Swap Contracts | — | 41 | 41 |
| Total Assets | 394 | 41 | 435 |
| |
| Variation Margin Payable—Futures Contracts | (244) | — | (244) |
| Variation Margin Payable—Swap Contracts | (155) | — | (155) |
| Unrealized Depreciation—Swap Contracts | — | (281) | (281) |
| Total Liabilities | (399) | (281) | (680) |
Realized net gain (loss) and the change in unrealized appreciation (depreciation) on derivatives for the year ended September 30, 2018, were:
| | | |
| Interest Rate | Credit | |
| | Contracts | Contracts | Total |
| Realized Net Gain (Loss) on Derivatives | ($000) | ($000) | ($000) |
| Futures Contracts | (9,045) | — | (9,045) |
| Swap Contracts | 3,281 | 177 | 3,458 |
| Realized Net Gain (Loss) on Derivatives | (5,764) | 177 | (5,587) |
| |
| Change in Unrealized Appreciation (Depreciation) on Derivatives | | | |
| Futures Contracts | (2,314) | — | (2,314) |
| Swap Contracts | 989 | (43) | 946 |
| Change in Unrealized Appreciation (Depreciation) on Derivatives | (1,325) | (43) | (1,368) |
E. Permanent differences between book-basis and tax-basis components of net assets are reclassified among capital accounts in the financial statements to reflect their tax character. These reclassifications have no effect on net assets or net asset value per share. As of period end, the following permanent differences primarily attributable to the accounting for swap agreements were reclassified to the following accounts:
| |
| | Amount |
| | ($000) |
| Paid-in Capital | — |
| Undistributed (Overdistributed) Net Investment Income | (147) |
| Accumulated Net Realized Gains (Losses) | 147 |
39
Institutional Short-Term Bond Fund
Temporary differences between book-basis and tax-basis components of accumulated net earnings (losses) arise when certain items of income, gain, or loss are recognized in different periods for financial statement and tax purposes; these differences will reverse at some time in the future. The differences are primarily related to the tax deferral of losses on wash sales and the realization of unrealized gains or losses on certain futures contracts. As of period end, the tax-basis components of accumulated net earnings (losses) are detailed in the table as follows:
| |
| | Amount |
| | ($000) |
| Undistributed Ordinary Income | 1,184 |
| Undistributed Long-Term Gains | — |
| Capital Loss Carryforwards (Non-expiring) | (42,148) |
| Net Unrealized Gains (Losses) | (56,943) |
As of September 30, 2018, gross unrealized appreciation and depreciation for investments and derivatives based on cost for U.S. federal income tax purposes were as follows:
| |
| | Amount |
| | ($000) |
| Tax Cost | 7,820,354 |
| Gross Unrealized Appreciation | 4,079 |
| Gross Unrealized Depreciation | (61,022) |
| Net Unrealized Appreciation (Depreciation) | (56,943) |
F. During the year ended September 30, 2018, the fund purchased $3,633,301,000 of investment securities and sold $3,240,899,000 of investment securities, other than U.S. government securities and temporary cash investments. Purchases and sales of U.S. government securities were $4,830,334,000 and $5,275,887,000, respectively. Total purchases and sales include $774,125,000 and $0, respectively, in connection with in-kind purchases and redemptions of the fund’s capital shares.
| | |
| G. Capital shares issued and redeemed were: | | |
| | Year Ended September 30, |
| | 2018 | 2017 |
| | Shares | Shares |
| | (000) | (000) |
| Issued | 100,885 | 43,012 |
| Issued in Lieu of Cash Distributions | 10,716 | 10,577 |
| Redeemed | (62,628) | (278,926) |
| Net Increase (Decrease) in Shares Outstanding | 48,973 | (225,337) |
H. Management has determined that no events or transactions occurred subsequent to September 30, 2018, that would require recognition or disclosure in these financial statements.
40
Institutional Intermediate-Term Bond Fund
Fund Profile
As of September 30, 2018
| | | |
| Financial Attributes | | |
| | | Bloomberg | Bloomberg |
| | | Barclays | Barclays |
| | | U.S. | U.S. |
| | | Intermediate | Aggregate |
| | | Aggregate | Bond |
| | Fund ex Baa Index | Index |
| Number of Bonds | 1,145 | 5,642 | 10,112 |
| Yield to Maturity | | | |
| (before expenses) | 3.4% | 3.3% | 3.5% |
| Average Coupon | 3.1% | 2.8% | 3.2% |
| Average Duration | 3.8 years | 4.4 years | 6.0 years |
| Average Effective | | | |
| Maturity | 4.9 years | 5.5 years | 8.4 years |
| Ticker Symbol | VIITX | — | — |
| Expense Ratio1 | 0.02% | — | — |
| 30-Day SEC Yield | 3.06% | — | — |
| Short-Term | | | |
| Reserves | 1.9% | — | — |
| |
| Sector Diversification (% of portfolio) | |
| Asset-Backed | 12.7% |
| Commercial Mortgage-Backed | 2.6 |
| Finance | 14.2 |
| Foreign | 9.5 |
| Government Mortgage-Backed | 31.3 |
| Industrial | 8.0 |
| Treasury/Agency | 20.9 |
| Utilities | 0.8 |
The agency and mortgage-backed securities sectors may include issues from government-sponsored enterprises; such issues are generally not backed by the full faith and credit of the U.S. government.
| | |
| Volatility Measures | | |
| | Bloomberg | |
| | Barclays U.S. | Bloomberg |
| | Intermediate | Barclays U.S. |
| | Aggregate ex | Aggregate Bond |
| | Baa Index | Index |
| R-Squared | 0.98 | 0.95 |
| Beta | 0.93 | 0.68 |
These measures show the degree and timing of the fund’s fluctuations compared with the indexes over 36 months.
| |
| Distribution by Credit Quality (% of portfolio) |
| U.S. Government | 50.9% |
| Aaa | 18.1 |
| Aa | 7.5 |
| A | 22.9 |
| Not Rated | 0.6 |
Credit-quality ratings are obtained from Moody’s and S&P, and the higher rating for each issue is shown. “Not Rated” is used to classify securities for which a rating is not available. Not rated securities include a fund’s investment in Vanguard Market Liquidity Fund or Vanguard Municipal Cash Management Fund, each of which invests in high-quality money market instruments and may serve as a cash management vehicle for the Vanguard funds, trusts, and accounts. For more information about these ratings, see the Glossary entry for Credit Quality.
| |
| Distribution by Effective Maturity | |
| (% of portfolio) | |
| Under 1 Year | 3.3% |
| 1 - 3 Years | 28.0 |
| 3 - 5 Years | 24.4 |
| 5 - 7 Years | 15.3 |
| 7 - 10 Years | 27.5 |
| 10 - 20 Years | 1.5 |
1 The expense ratio shown is from the prospectus dated January 26, 2018, and represents estimated costs for the current fiscal year. For the fiscal year ended September 30, 2018, the expense ratio was 0.02%.
41
Institutional Intermediate-Term Bond Fund
Performance Summary
All of the returns in this report represent past performance, which is not a guarantee of future results that may be achieved by the fund. (Current performance may be lower or higher than the performance data cited. For performance data current to the most recent month-end, visit our website at vanguard.com/performance.) Note, too, that both investment returns and principal value can fluctuate widely, so an investor’s shares, when sold, could be worth more or less than their original cost. The returns shown do not reflect taxes that a shareholder would pay on fund distributions or on the sale of fund shares.
Cumulative Performance: September 30, 2008, Through September 30, 2018
Initial Investment of $10,000,000
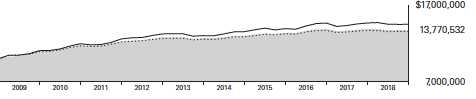
| | | | |
| | Average Annual Total Returns | |
| | Periods Ended September 30, 2018 | |
| |
| | | | | Final Value |
| | One | Five | Ten | of a $10,000,000 |
| | Year | Years | Years | Investment |
| Institutional Intermediate-Term Bond | | | | |
| Fund Institutional Plus Shares | -0.75% | 1.67% | 3.25% | $13,770,532 |
| Bloomberg Barclays U.S. Intermediate | | | | |
| Aggregate ex Baa Index | -0.98 | 1.55 | 3.09 | 13,554,571 |
| Bloomberg Barclays U.S. Aggregate | | | | |
| Bond Index | -1.22 | 2.16 | 3.77 | 14,482,359 |
The fund is the successor to VFTC Intermediate-Term Bond Trust (the predecessor trust), a collective trust managed by Vanguard Fiduciary Trust Company, an affiliate of The Vanguard Group, Inc. The predecessor trust transferred its assets to the fund in connection with the fund’s commencement of operations on or about June 19, 2015. The performance of the fund’s Institutional Plus Shares includes the performance of the predecessor trust prior to the commencement of the fund’s operations. The performance of the predecessor trust has not been adjusted to reflect the expenses of the fund’s Institutional Plus Shares. If the performance of the predecessor trust had been adjusted to reflect the expenses of the fund’s Institutional Plus Shares, the predecessor trust’s performance would have been lower. The fund is managed with the same investment objective, strategies, policies, and risks as the predecessor trust. The predecessor trust was not an investment company and, therefore, was not subject to certain investment restrictions imposed on investment companies by the Investment Company Act of 1940. If the predecessor trust had been an investment company, its performance may have been different.
See Financial Highlights for dividend and capital gains information.
42
Institutional Intermediate-Term Bond Fund
| | | | |
| Fiscal-Year Total Returns (%): September 30, 2008, Through September 30, 2018 | |
| | | | | Bloomberg |
| | | | | Barclays |
| | | | | U.S. |
| | | | | Intermediate |
| | | | | Aggregate |
| | | Institutional Plus Shares | ex Baa Index |
| Fiscal Year | Income Returns | Capital Returns | Total Returns | Total Returns |
| 2009 | 0.00% | 9.36% | 9.36% | 9.18% |
| 2010 | 0.00 | 7.42 | 7.42 | 7.07 |
| 2011 | 0.00 | 3.96 | 3.96 | 4.24 |
| 2012 | 0.00 | 4.58 | 4.58 | 3.83 |
| 2013 | 0.00 | -0.76 | -0.76 | -0.81 |
| 2014 | 0.00 | 2.50 | 2.50 | 2.46 |
| 2015 | 0.56 | 2.43 | 2.99 | 3.16 |
| 2016 | 2.06 | 1.64 | 3.70 | 3.24 |
| 2017 | 1.94 | -1.93 | 0.01 | -0.04 |
| 2018 | 2.41 | -3.16 | -0.75 | -0.98 |
The fund is the successor to VFTC Intermediate-Term Bond Trust (the predecessor trust), a collective trust managed by Vanguard Fiduciary Trust Company, an affiliate of The Vanguard Group, Inc. The predecessor trust transferred its assets to the fund in connection with the fund’s commencement of operations on or about June 19, 2015. The performance of the fund’s Institutional Plus Shares includes the performance of the predecessor trust prior to the commencement of the fund’s operations. The performance of the predecessor trust has not been adjusted to reflect the expenses of the fund’s Institutional Plus Shares. If the performance of the predecessor trust had been adjusted to reflect the expenses of the fund’s Institutional Plus Shares, the predecessor trust’s performance would have been lower. The fund is managed with the same investment objective, strategies, policies, and risks as the predecessor trust. The predecessor trust was not an investment company and, therefore, was not subject to certain investment restrictions imposed on investment companies by the Investment Company Act of 1940. If the predecessor trust had been an investment company, its performance may have been different.
43
Institutional Intermediate-Term Bond Fund
Financial Statements
Statement of Net Assets
As of September 30, 2018
The fund reports a complete list of its holdings in regulatory filings four times in each fiscal year, at the quarter-ends. For the second and fourth fiscal quarters, the lists appear in the fund’s semiannual and annual reports to shareholders. For the first and third fiscal quarters, the fund files the lists with the Securities and Exchange Commission on Form N-Q. Shareholders can look up the fund’s Forms N-Q on the SEC’s website at sec.gov. Forms N-Q may also be reviewed and copied at the SEC’s Public Reference Room (see the back cover of this report for further information).
| | | | | |
| | | | | Face | Market |
| | | | Maturity | Amount | Value • |
| | | Coupon | Date | ($000) | ($000) |
| U. S. Government and Agency Obligations (52.0%) | | | |
| U. S. Government Securities (18.4%) | | | | |
| | United States Treasury Note/Bond | 1.125% | 2/28/19 | 5,000 | 4,975 |
| | United States Treasury Note/Bond | 1.500% | 2/28/19 | 12,000 | 11,959 |
| | United States Treasury Note/Bond | 1.250% | 3/31/19 | 100 | 99 |
| | United States Treasury Note/Bond | 1.250% | 4/30/19 | 900 | 894 |
| | United States Treasury Note/Bond | 1.625% | 4/30/19 | 4,827 | 4,804 |
| | United States Treasury Note/Bond | 0.875% | 5/15/19 | 4,400 | 4,357 |
| | United States Treasury Note/Bond | 0.875% | 6/15/19 | 1,200 | 1,186 |
| | United States Treasury Note/Bond | 1.625% | 7/31/19 | 1,600 | 1,587 |
| | United States Treasury Note/Bond | 0.750% | 8/15/19 | 2,865 | 2,819 |
| | United States Treasury Note/Bond | 3.625% | 8/15/19 | 80 | 81 |
| | United States Treasury Note/Bond | 1.000% | 8/31/19 | 1,266 | 1,247 |
| | United States Treasury Note/Bond | 1.250% | 8/31/19 | 4,100 | 4,049 |
| | United States Treasury Note/Bond | 1.000% | 10/15/19 | 130,000 | 127,786 |
| | United States Treasury Note/Bond | 1.500% | 10/31/19 | 200 | 197 |
| | United States Treasury Note/Bond | 3.375% | 11/15/19 | 15,086 | 15,197 |
| | United States Treasury Note/Bond | 1.750% | 11/30/19 | 3,315 | 3,279 |
| | United States Treasury Note/Bond | 1.375% | 12/15/19 | 400 | 394 |
| | United States Treasury Note/Bond | 1.875% | 12/31/19 | 4,010 | 3,969 |
| | United States Treasury Note/Bond | 2.000% | 1/31/20 | 490 | 485 |
| | United States Treasury Note/Bond | 1.375% | 2/15/20 | 98,015 | 96,223 |
| | United States Treasury Note/Bond | 1.375% | 2/29/20 | 34,000 | 33,357 |
| | United States Treasury Note/Bond | 2.250% | 2/29/20 | 200 | 199 |
| | United States Treasury Note/Bond | 2.375% | 4/30/20 | 16,800 | 16,698 |
| | United States Treasury Note/Bond | 1.375% | 5/31/20 | 344,800 | 336,880 |
| | United States Treasury Note/Bond | 1.500% | 5/31/20 | 200,000 | 195,812 |
| | United States Treasury Note/Bond | 2.500% | 5/31/20 | 700 | 697 |
| 1 | United States Treasury Note/Bond | 1.625% | 6/30/20 | 57,655 | 56,511 |
| | United States Treasury Note/Bond | 2.625% | 7/31/20 | 7,200 | 7,176 |
| | United States Treasury Note/Bond | 2.625% | 8/15/20 | 20,000 | 19,931 |
| | United States Treasury Note/Bond | 2.125% | 8/31/20 | 43,000 | 42,442 |
| | United States Treasury Note/Bond | 1.375% | 9/30/20 | 1,300 | 1,264 |
| | United States Treasury Note/Bond | 2.625% | 11/15/20 | 28,115 | 27,988 |
| | United States Treasury Note/Bond | 2.000% | 11/30/20 | 45,670 | 44,863 |
| | United States Treasury Note/Bond | 2.000% | 1/15/21 | 300 | 294 |
| | United States Treasury Note/Bond | 2.125% | 1/31/21 | 406 | 399 |
| | United States Treasury Note/Bond | 1.125% | 2/28/21 | 176,030 | 168,961 |
| 2 | United States Treasury Note/Bond | 2.250% | 3/31/21 | 188,000 | 185,238 |
| | United States Treasury Note/Bond | 2.375% | 4/15/21 | 10,000 | 9,881 |
44
| | | | | |
| Institutional Intermediate-Term Bond Fund | | | | |
| |
| |
| |
| | | | | Face | Market |
| | | | Maturity | Amount | Value • |
| | | Coupon | Date | ($000) | ($000) |
| | United States Treasury Note/Bond | 1.375% | 4/30/21 | 43,990 | 42,368 |
| | United States Treasury Note/Bond | 1.125% | 7/31/21 | 100 | 95 |
| | United States Treasury Note/Bond | 2.125% | 8/15/21 | 46,699 | 45,729 |
| | United States Treasury Note/Bond | 1.125% | 8/31/21 | 62,000 | 58,968 |
| | United States Treasury Note/Bond | 2.125% | 9/30/21 | 356,285 | 348,546 |
| | United States Treasury Note/Bond | 2.000% | 10/31/21 | 37,000 | 36,035 |
| | United States Treasury Note/Bond | 2.000% | 12/31/21 | 278,000 | 270,269 |
| | United States Treasury Note/Bond | 2.125% | 12/31/21 | 103,000 | 100,537 |
| | United States Treasury Note/Bond | 1.500% | 1/31/22 | 10,000 | 9,556 |
| | United States Treasury Note/Bond | 1.875% | 2/28/22 | 100,000 | 96,672 |
| | United States Treasury Note/Bond | 1.750% | 3/31/22 | 27,115 | 26,073 |
| | United States Treasury Note/Bond | 1.750% | 4/30/22 | 58,000 | 55,716 |
| | United States Treasury Note/Bond | 2.125% | 6/30/22 | 12,175 | 11,834 |
| | United States Treasury Note/Bond | 1.625% | 8/31/22 | 20,000 | 19,044 |
| | United States Treasury Note/Bond | 1.750% | 9/30/22 | 26,500 | 25,328 |
| | United States Treasury Note/Bond | 1.875% | 9/30/22 | 7,341 | 7,051 |
| 3 | United States Treasury Note/Bond | 1.625% | 11/15/22 | 15,050 | 14,288 |
| | United States Treasury Note/Bond | 2.125% | 12/31/22 | 18,215 | 17,626 |
| | United States Treasury Note/Bond | 1.750% | 1/31/23 | 1,700 | 1,618 |
| | United States Treasury Note/Bond | 2.000% | 2/15/23 | 20,000 | 19,234 |
| | United States Treasury Note/Bond | 2.625% | 2/28/23 | 2,000 | 1,975 |
| 2 | United States Treasury Note/Bond | 2.750% | 4/30/23 | 150,300 | 149,080 |
| | United States Treasury Note/Bond | 1.750% | 5/15/23 | 41,300 | 39,177 |
| | United States Treasury Note/Bond | 2.750% | 5/31/23 | 200 | 198 |
| | United States Treasury Note/Bond | 1.375% | 6/30/23 | 14,500 | 13,499 |
| | United States Treasury Note/Bond | 2.500% | 8/15/23 | 19,860 | 19,457 |
| | United States Treasury Note/Bond | 2.750% | 11/15/23 | 20,000 | 19,809 |
| | United States Treasury Note/Bond | 2.125% | 11/30/23 | 10,000 | 9,605 |
| | United States Treasury Note/Bond | 2.750% | 2/15/24 | 28,820 | 28,518 |
| | United States Treasury Note/Bond | 2.375% | 8/15/24 | 2,500 | 2,418 |
| | United States Treasury Note/Bond | 1.875% | 8/31/24 | 12,000 | 11,284 |
| | United States Treasury Note/Bond | 2.250% | 11/15/24 | 1,500 | 1,438 |
| | United States Treasury Note/Bond | 2.000% | 2/15/25 | 49,065 | 46,221 |
| | United States Treasury Note/Bond | 2.125% | 5/15/25 | 3,300 | 3,125 |
| | United States Treasury Note/Bond | 2.250% | 11/15/25 | 40,050 | 38,079 |
| | United States Treasury Note/Bond | 2.250% | 11/15/27 | 7,000 | 6,553 |
| | United States Treasury Note/Bond | 2.750% | 2/15/28 | 71 | 69 |
| | United States Treasury Note/Bond | 2.875% | 5/15/28 | 3,072 | 3,026 |
| | | | | | 3,034,296 |
| Agency Bonds and Notes (0.9%) | | | | |
| 4 | AID-Israel | 5.500% | 12/4/23 | 250 | 278 |
| 4 | AID-Jordan | 2.578% | 6/30/22 | 26,500 | 26,008 |
| 5 | Federal Home Loan Banks | 0.875% | 10/1/18 | 9,750 | 9,750 |
| 5 | Federal Home Loan Banks | 1.250% | 1/16/19 | 15,550 | 15,500 |
| 5 | Federal Home Loan Banks | 0.875% | 8/5/19 | 18,200 | 17,938 |
| 6 | Federal National Mortgage Assn. | 1.125% | 10/19/18 | 205 | 205 |
| 6 | Federal National Mortgage Assn. | 1.875% | 9/24/26 | 73,500 | 66,762 |
| 5 | Tennessee Valley Authority | 2.250% | 3/15/20 | 6,500 | 6,445 |
| 5 | Tennessee Valley Authority | 2.875% | 2/1/27 | 1,280 | 1,230 |
| | | | | | 144,116 |
| Conventional Mortgage-Backed Securities (27.9%) | | | |
| 6,7 | Fannie Mae Pool | 2.000% | 5/1/28–1/1/32 | 39,403 | 36,969 |
| 6,7,8 Fannie Mae Pool | 2.500% | 9/1/27–9/1/46 | 136,271 | 131,418 |
| 6,7 | Fannie Mae Pool | 3.000% | 2/1/27–10/1/48 | 274,661 | 264,850 |
45
| | | | | |
| Institutional Intermediate-Term Bond Fund | | | | |
| |
| |
| |
| | | | | Face | Market |
| | | | Maturity | Amount | Value • |
| | | Coupon | Date | ($000) | ($000) |
| 6,7,8 | Fannie Mae Pool | 3.500% | 8/1/20–11/1/48 | 457,078 | 452,007 |
| 6,7,8 | Fannie Mae Pool | 4.000% | 11/1/18–11/1/48 | 624,909 | 632,215 |
| 6,7,8 | Fannie Mae Pool | 4.500% | 10/1/18–11/1/48 | 336,864 | 348,474 |
| 6,7,8 | Fannie Mae Pool | 5.000% | 10/1/18–11/1/48 | 243,222 | 255,816 |
| 6,7 | Fannie Mae Pool | 5.500% | 11/1/18– 6/1/40 | 29,797 | 32,132 |
| 6,7 | Fannie Mae Pool | 6.000% | 3/1/21–11/1/39 | 16,531 | 17,937 |
| 6,7 | Fannie Mae Pool | 6.500% | 7/1/20–9/1/39 | 8,023 | 8,765 |
| 6,7 | Fannie Mae Pool | 7.000% | 9/1/28–12/1/38 | 3,404 | 3,791 |
| 6,7 | Fannie Mae Pool | 7.500% | 8/1/30– 6/1/32 | 250 | 271 |
| 6,7 | Fannie Mae Pool | 8.000% | 7/1/30–1/1/31 | 13 | 15 |
| 6,7 | Fannie Mae Pool | 8.500% | 12/1/30 | 9 | 10 |
| 6,7 | Freddie Mac Gold Pool | 2.000% | 9/1/28–1/1/32 | 6,374 | 5,978 |
| 6,7 | Freddie Mac Gold Pool | 2.500% | 4/1/27–4/1/43 | 77,152 | 74,367 |
| 6,7,8 | Freddie Mac Gold Pool | 3.000% | 8/1/26–1/1/48 | 409,971 | 397,661 |
| 6,7,8 | Freddie Mac Gold Pool | 3.500% | 8/1/20–10/1/48 | 440,936 | 435,725 |
| 6,7,8 | Freddie Mac Gold Pool | 4.000% | 2/1/19–10/1/48 | 197,178 | 199,546 |
| 6,7 | Freddie Mac Gold Pool | 4.500% | 10/1/18–10/1/47 | 59,845 | 62,063 |
| 6,7 | Freddie Mac Gold Pool | 5.000% | 10/1/18–8/1/41 | 14,262 | 15,043 |
| 6,7 | Freddie Mac Gold Pool | 5.500% | 2/1/19–2/1/40 | 12,906 | 13,943 |
| 6,7 | Freddie Mac Gold Pool | 6.000% | 7/1/20–5/1/40 | 19,802 | 21,645 |
| 6,7 | Freddie Mac Gold Pool | 6.500% | 2/1/29–9/1/38 | 3,537 | 3,865 |
| 6,7 | Freddie Mac Gold Pool | 7.000% | 5/1/28– 6/1/38 | 1,905 | 2,130 |
| 6,7 | Freddie Mac Gold Pool | 7.500% | 3/1/30–5/1/32 | 231 | 257 |
| 6,7 | Freddie Mac Gold Pool | 8.000% | 4/1/30–1/1/31 | 17 | 19 |
| 7 | Ginnie Mae I Pool | 2.500% | 1/15/43– 6/15/43 | 969 | 909 |
| 7 | Ginnie Mae I Pool | 3.000% | 9/15/42–8/15/45 | 38,766 | 37,654 |
| 7 | Ginnie Mae I Pool | 3.500% | 1/15/42– 6/15/47 | 56,552 | 56,471 |
| 7 | Ginnie Mae I Pool | 4.000% | 4/15/39–1/15/45 | 4,543 | 4,636 |
| 7 | Ginnie Mae I Pool | 4.500% | 9/15/33–12/15/46 | 32,074 | 33,498 |
| 7 | Ginnie Mae I Pool | 5.000% | 9/15/33–9/15/41 | 15,643 | 16,678 |
| 7 | Ginnie Mae I Pool | 5.500% | 3/15/31–2/15/41 | 9,358 | 10,055 |
| 7 | Ginnie Mae I Pool | 6.000% | 12/15/28–3/15/41 | 4,194 | 4,523 |
| 7 | Ginnie Mae I Pool | 6.500% | 12/15/27– 6/15/38 | 3,480 | 3,782 |
| 7 | Ginnie Mae I Pool | 7.000% | 8/15/24–11/15/31 | 196 | 207 |
| 7 | Ginnie Mae I Pool | 7.500% | 11/15/30–3/15/32 | 43 | 47 |
| 7 | Ginnie Mae I Pool | 8.000% | 4/15/30–10/15/30 | 48 | 53 |
| 7 | Ginnie Mae I Pool | 8.500% | 7/15/30 | 19 | 20 |
| 7 | Ginnie Mae I Pool | 9.000% | 5/15/21–7/15/21 | 2 | 2 |
| 7 | Ginnie Mae I Pool | 9.500% | 10/15/19 | — | — |
| 7 | Ginnie Mae II Pool | 2.500% | 3/20/43–12/20/46 | 4,860 | 4,554 |
| 7 | Ginnie Mae II Pool | 3.000% | 3/20/27–10/1/48 | 175,646 | 170,777 |
| 7 | Ginnie Mae II Pool | 3.500% | 8/20/42–11/1/48 | 434,539 | 433,262 |
| 7,8 | Ginnie Mae II Pool | 4.000% | 2/20/34–10/1/48 | 235,825 | 240,469 |
| 7,8 | Ginnie Mae II Pool | 4.500% | 3/20/33–10/1/48 | 125,883 | 130,255 |
| 7 | Ginnie Mae II Pool | 5.000% | 5/20/39–10/1/48 | 31,151 | 33,243 |
| 7 | Ginnie Mae II Pool | 5.500% | 4/20/37–3/20/41 | 3,712 | 3,932 |
| 7 | Ginnie Mae II Pool | 6.000% | 5/20/36–10/20/41 | 5,274 | 5,721 |
| 7 | Ginnie Mae II Pool | 6.500% | 3/20/38–7/20/39 | 65 | 72 |
| | | | | | 4,607,732 |
| Nonconventional Mortgage-Backed Securities (4.8%) | | | |
| 6,7,9 | Fannie Mae Pool | 3.293% | 12/1/32 | 6 | 6 |
| 6,7,9 | Fannie Mae Pool | 4.048% | 12/1/40 | 2,694 | 2,837 |
| 6,7,9 | Fannie Mae Pool | 4.129% | 5/1/33 | 50 | 52 |
| 6,7,10 Fannie Mae Pool | 4.463% | 5/1/33 | 11 | 12 |
46
| | | | | |
| Institutional Intermediate-Term Bond Fund | | | | |
| |
| |
| |
| | | | | Face | Market |
| | | | Maturity | Amount | Value • |
| | | Coupon | Date | ($000) | ($000) |
| 6,7,10 Fannie Mae Pool | 4.535% | 8/1/33 | 49 | 51 |
| 6,7,10 Fannie Mae Pool | 4.644% | 7/1/33 | 100 | 103 |
| 6,7 | Fannie Mae REMICS | 3.000% | 5/25/47–9/25/48 | 70,081 | 67,525 |
| 6,7,11 Fannie Mae REMICS 2005-45 | 2.586% | 6/25/35 | 1,724 | 1,723 |
| 6,7,11 Fannie Mae REMICS 2005-95 | 2.626% | 11/25/35 | 1,854 | 1,868 |
| 6,7,11 Fannie Mae REMICS 2006-46 | 2.536% | 6/25/36 | 6,464 | 6,473 |
| 6,7,11 Fannie Mae REMICS 2007-4 | 2.661% | 2/25/37 | 722 | 727 |
| 6,7,11 Fannie Mae REMICS 2012-122 | 2.616% | 11/25/42 | 2,377 | 2,393 |
| 6,7,11 Fannie Mae REMICS 2013-19 | 2.516% | 9/25/41 | 3,158 | 3,158 |
| 6,7,11 Fannie Mae REMICS 2013-39 | 2.566% | 5/25/43 | 3,034 | 3,034 |
| 6,7,11 Fannie Mae REMICS 2015-22 | 2.516% | 4/25/45 | 2,523 | 2,527 |
| 6,7,11 Fannie Mae REMICS 2016-55 | 2.716% | 8/25/46 | 5,135 | 5,202 |
| 6,7,11 Fannie Mae REMICS 2016-60 | 2.466% | 9/25/46 | 10,168 | 10,148 |
| 6,7,11 Fannie Mae REMICS 2016-62 | 2.616% | 9/25/46 | 10,364 | 10,350 |
| 6,7,11 Fannie Mae REMICS 2016-93 | 2.566% | 12/25/46 | 20,633 | 20,593 |
| 6,7 | Fannie Mae REMICS 2017-109 | 3.500% | 11/25/45 | 13,211 | 13,184 |
| 6,7 | Fannie Mae REMICS 2018-13 | 3.000% | 3/25/48 | 52,895 | 51,333 |
| 6,7 | Fannie Mae REMICS 2018-15 | 3.500% | 10/25/44 | 15,392 | 15,331 |
| 6,7 | Fannie Mae REMICS 2018-58 | 3.000% | 8/25/48 | 46,458 | 44,256 |
| 6,7 | Fannie Mae REMICS 2018-65 | 3.000% | 9/25/48 | 43,024 | 41,047 |
| 6,7,10 Freddie Mac Non Gold Pool | 3.711% | 10/1/32 | 14 | 15 |
| 6,7,10 Freddie Mac Non Gold Pool | 3.777% | 1/1/33 | 7 | 7 |
| 6,7,10 Freddie Mac Non Gold Pool | 3.961% | 2/1/33 | 22 | 22 |
| 6,7 | Freddie Mac Non Gold Pool | 4.060% | 7/1/33 | 1,458 | 1,533 |
| 6,7,9 Freddie Mac Non Gold Pool | 4.082% | 9/1/37 | 8,747 | 9,209 |
| 6,7,9 Freddie Mac Non Gold Pool | 4.448% | 7/1/35 | 10,741 | 11,325 |
| 6,7,10 Freddie Mac Non Gold Pool | 4.500% | 8/1/37 | 66 | 68 |
| 6,7,11 Freddie Mac REMICS | 2.508% | 11/15/36–8/15/43 | 4,751 | 4,766 |
| 6,7,11 Freddie Mac REMICS | 2.518% | 11/15/36 | 1,702 | 1,713 |
| 6,7,11 Freddie Mac REMICS | 2.608% | 6/15/42 | 868 | 872 |
| 6,7 | Freddie Mac REMICS | 3.000% | 11/25/47–12/15/47 | 45,147 | 43,869 |
| 6,7 | Freddie Mac REMICS | 6.500% | 12/15/44–11/15/47 | 134,449 | 158,487 |
| 7 | Ginnie Mae REMICS | 3.000% | 12/20/47 | 21,671 | 21,222 |
| 7 | Ginnie Mae REMICS | 6.500% | 6/20/47–9/20/47 | 54,098 | 62,499 |
| 7 | Government National Mortgage Association | | | | |
| | GNR_18-14 | 3.000% | 12/20/47 | 17,019 | 16,583 |
| 7 | Government National Mortgage Association | | | | |
| | GNR_18-92 | 3.500% | 7/20/48 | 46,967 | 46,671 |
| 7 | Government National Mortgage Association | | | | |
| | GNR_18-94 | 3.000% | 7/20/48 | 84,671 | 81,967 |
| 7 | Government National Mortgage Association | | | | |
| | GNR_18-97 | 3.500% | 7/20/48 | 46,970 | 46,689 |
| | | | | | 811,450 |
| Total U.S. Government and Agency Obligations (Cost $8,809,570) | | 8,597,594 |
| Asset-Backed/Commercial Mortgage-Backed Securities (15.8%) | | |
| 7 | Ally Auto Receivables Trust 2017-5 | 2.220% | 10/17/22 | 4,470 | 4,379 |
| 7 | Ally Auto Receivables Trust 2018-1 | 2.350% | 6/15/22 | 6,610 | 6,548 |
| 7 | Ally Auto Receivables Trust 2018-1 | 2.530% | 2/15/23 | 1,770 | 1,742 |
| 7 | Ally Master Owner Trust Series 2017-3 | 2.040% | 6/15/22 | 11,360 | 11,147 |
| 7 | Ally Master Owner Trust Series 2018-2 | 3.290% | 5/15/23 | 32,620 | 32,612 |
| 7 | Ally Master Owner Trust Series 2018-2 | 3.300% | 7/17/23 | 25,780 | 25,753 |
| 12 | American Tower Trust #1 | 3.652% | 3/23/28 | 370 | 363 |
| 7,12 Americold 2010 LLC Trust Series 2010-ARTA | 4.954% | 1/14/29 | 5,406 | 5,598 |
47
| | | | | |
| Institutional Intermediate-Term Bond Fund | | | | |
| |
| |
| |
| | | | | Face | Market |
| | | | Maturity | Amount | Value • |
| | | Coupon | Date | ($000) | ($000) |
| 7 | AmeriCredit Automobile Receivables Trust | | | | |
| | 2016-1 | 1.810% | 10/8/20 | 49 | 49 |
| 7,12 | Aventura Mall Trust 2013-AVM | 3.867% | 12/5/32 | 600 | 607 |
| 7,12 | Aventura Mall Trust 2018-AVM | 4.112% | 7/5/40 | 460 | 468 |
| 7,12 | Avis Budget Rental Car Funding AESOP LLC | | | | |
| | 2017-1A | 3.070% | 9/20/23 | 2,745 | 2,679 |
| 7,12 | Avis Budget Rental Car Funding AESOP LLC | | | | |
| | 2017-2A | 2.970% | 3/20/24 | 7,090 | 6,867 |
| 7,12 | Avis Budget Rental Car Funding AESOP LLC | | | | |
| | 2018-1A | 3.700% | 9/20/24 | 8,180 | 8,143 |
| 7 | Banc of America Commercial Mortgage Trust | | | | |
| | 2015-UBS7 | 3.429% | 9/15/48 | 280 | 279 |
| 7 | Banc of America Commercial Mortgage Trust | | | | |
| | 2015-UBS7 | 3.705% | 9/15/48 | 2,305 | 2,306 |
| 7 | Banc of America Commercial Mortgage Trust | | | | |
| | 2017-BNK3 | 3.574% | 2/15/50 | 320 | 314 |
| 7 | BANK 2017 - BNK4 | 3.625% | 5/15/50 | 580 | 574 |
| 7 | BANK 2017 - BNK5 | 3.390% | 6/15/60 | 660 | 640 |
| 7 | BANK 2017 - BNK6 | 3.254% | 7/15/60 | 1,060 | 1,013 |
| 7 | BANK 2017 - BNK6 | 3.518% | 7/15/60 | 1,110 | 1,083 |
| 7 | BANK 2017 - BNK6 | 3.741% | 7/15/60 | 440 | 429 |
| 7 | BANK 2017 - BNK7 | 3.435% | 9/15/60 | 1,040 | 1,006 |
| 7 | BANK 2017 - BNK8 | 3.488% | 11/15/50 | 2,670 | 2,597 |
| 7 | BANK 2017 - BNK9 | 3.538% | 11/15/54 | 6,665 | 6,497 |
| 7 | BANK 2018 - BN12 | 4.255% | 5/15/61 | 780 | 804 |
| 7 | BANK 2018 - BN13 | 4.217% | 8/15/61 | 770 | 790 |
| 7 | BANK 2018 - BNK10 | 3.641% | 2/15/61 | 1,030 | 1,028 |
| 7 | BANK 2018 - BNK10 | 3.688% | 2/15/61 | 2,730 | 2,692 |
| 7 | BANK 2018 - BN14 | 4.185% | 9/15/60 | 160 | 165 |
| 7 | BANK 2018 - BN14 | 4.231% | 9/15/60 | 2,101 | 2,108 |
| 7,12,13 Bank of America Student Loan Trust 2010-1A | 3.135% | 2/25/43 | 3,191 | 3,206 |
| | Bank of Nova Scotia | 1.875% | 4/26/21 | 19,140 | 18,486 |
| 7 | BENCHMARK 2018-B1 Mortgage Trust | 3.602% | 1/15/51 | 640 | 637 |
| 7 | BENCHMARK 2018-B1 Mortgage Trust | 3.666% | 1/15/51 | 1,530 | 1,516 |
| 7 | BENCHMARK 2018-B1 Mortgage Trust | 3.878% | 1/15/51 | 1,360 | 1,351 |
| 7 | BENCHMARK 2018-B2 Mortgage Trust | 3.882% | 2/15/51 | 8,730 | 8,785 |
| 7 | BENCHMARK 2018-B3 Mortgage Trust | 4.025% | 4/10/51 | 1,590 | 1,609 |
| 7 | BENCHMARK 2018-B5 Mortgage Trust | 4.208% | 7/15/51 | 600 | 618 |
| 7 | BENCHMARK 2018-B6 Mortgage Trust | 4.170% | 11/10/51 | 46 | 48 |
| 7 | BENCHMARK 2018-B6 Mortgage Trust | 4.261% | 11/10/51 | 1,870 | 1,937 |
| 7 | BMW Vehicle Lease Trust 2017-2 | 2.070% | 10/20/20 | 7,640 | 7,568 |
| 7 | BMW Vehicle Lease Trust 2017-2 | 2.190% | 3/22/21 | 2,380 | 2,347 |
| 7 | BMW Vehicle Owner Trust 2018-A | 2.510% | 6/25/24 | 2,530 | 2,486 |
| 7,13 | Brazos Higher Education Authority Inc. Series | | | | |
| | 2005-3 | 2.573% | 6/25/26 | 1,965 | 1,953 |
| 7,13 | Brazos Higher Education Authority Inc. Series | | | | |
| | 2011-1 | 3.111% | 2/25/30 | 1,393 | 1,402 |
| 7 | Cabela’s Credit Card Master Note Trust | | | | |
| | 2015-1A | 2.260% | 3/15/23 | 1,600 | 1,580 |
| 7,12 | Canadian Pacer Auto Receivables Trust A | | | | |
| | Series 2017 | 2.050% | 3/19/21 | 2,290 | 2,272 |
| 7,12 | Canadian Pacer Auto Receivables Trust A | | | | |
| | Series 2017 | 2.286% | 1/19/22 | 1,600 | 1,575 |
48
| | | | | |
| Institutional Intermediate-Term Bond Fund | | | | |
| |
| |
| |
| | | | | Face | Market |
| | | | Maturity | Amount | Value • |
| | | Coupon | Date | ($000) | ($000) |
| 7,12 Canadian Pacer Auto Receivables Trust A | | | | |
| | Series 2018 | 3.220% | 9/19/22 | 4,080 | 4,066 |
| 7 | Capital Auto Receivables Asset Trust 2016-2 | 1.630% | 1/20/21 | 380 | 377 |
| 7 | Capital Auto Receivables Asset Trust 2016-3 | 1.690% | 3/20/21 | 80 | 79 |
| 7,12 Capital Auto Receivables Asset Trust 2017-1 | 2.020% | 8/20/21 | 290 | 288 |
| 7,12 Capital Auto Receivables Asset Trust 2017-1 | 2.220% | 3/21/22 | 200 | 197 |
| 7,12 Capital Auto Receivables Asset Trust 2018-1 | 2.790% | 1/20/22 | 5,720 | 5,699 |
| 7 | Capital One Multi-Asset Execution Trust | | | | |
| | 2015-A2 | 2.080% | 3/15/23 | 6,480 | 6,386 |
| 7 | Capital One Multi-Asset Execution Trust | | | | |
| | 2017-A4 | 1.990% | 7/17/23 | 15,755 | 15,423 |
| 7,12 CARDS II Trust 2018-2A | 3.047% | 4/17/23 | 23,010 | 22,970 |
| 7 | CarMax Auto Owner Trust 2014-4 | 1.810% | 7/15/20 | 1,408 | 1,405 |
| 7 | CarMax Auto Owner Trust 2015-2 | 1.800% | 3/15/21 | 1,900 | 1,890 |
| 7 | CarMax Auto Owner Trust 2015-3 | 1.980% | 2/16/21 | 1,430 | 1,420 |
| 7 | CarMax Auto Owner Trust 2016-1 | 1.880% | 6/15/21 | 3,480 | 3,434 |
| 7 | CarMax Auto Owner Trust 2016-4 | 1.400% | 8/15/21 | 4,111 | 4,064 |
| 7 | CarMax Auto Owner Trust 2016-4 | 1.600% | 6/15/22 | 2,230 | 2,158 |
| 7 | CarMax Auto Owner Trust 2017-3 | 2.220% | 11/15/22 | 9,990 | 9,738 |
| 7 | CarMax Auto Owner Trust 2017-4 | 2.110% | 10/17/22 | 4,190 | 4,125 |
| 7 | CarMax Auto Owner Trust 2017-4 | 2.330% | 5/15/23 | 2,380 | 2,322 |
| 7 | CarMax Auto Owner Trust 2018-1 | 2.230% | 5/17/21 | 8,485 | 8,451 |
| 7 | CarMax Auto Owner Trust 2018-1 | 2.480% | 11/15/22 | 12,130 | 11,981 |
| 7 | CarMax Auto Owner Trust 2018-1 | 2.640% | 6/15/23 | 1,910 | 1,878 |
| 7 | CarMax Auto Owner Trust 2018-3 | 3.130% | 6/15/23 | 19,380 | 19,374 |
| 7 | CarMax Auto Owner Trust 2018-3 | 3.270% | 3/15/24 | 9,680 | 9,699 |
| 7 | CCUBS Commercial Mortgage Trust 2017-C1 | 3.283% | 11/15/50 | 5,000 | 4,776 |
| 7 | CD 2017-CD3 Commercial Mortgage Trust | 3.631% | 2/10/50 | 1,550 | 1,535 |
| 7 | CD 2017-CD4 Commercial Mortgage Trust | 3.514% | 5/10/50 | 880 | 864 |
| 7 | CD 2017-CD5 Commercial Mortgage Trust | 3.431% | 8/15/50 | 1,175 | 1,143 |
| 7 | CD 2017-CD6 Commercial Mortgage Trust | 3.456% | 11/13/50 | 535 | 521 |
| 7 | CenterPoint Energy Transition Bond Co. IV LLC | | | | |
| | 2012-1 | 2.161% | 10/15/21 | 4,378 | 4,353 |
| 7,12 CFCRE Commercial Mortgage Trust 2011-C2 | 5.947% | 12/15/47 | 2,298 | 2,432 |
| 7 | CFCRE Commercial Mortgage Trust 2016-C4 | 3.283% | 5/10/58 | 3,376 | 3,264 |
| 7,12 Chesapeake Funding II LLC 2018-1 | 3.040% | 4/15/30 | 18,420 | 18,352 |
| 7,12 Chrysler Capital Auto Receivables Trust | | | | |
| | 2015-BA | 2.260% | 10/15/20 | 1,666 | 1,665 |
| 7,12 Chrysler Capital Auto Receivables Trust | | | | |
| | 2016-AA | 1.960% | 1/18/22 | 6,150 | 6,130 |
| 7,12 Chrysler Capital Auto Receivables Trust | | | | |
| | 2016-BA | 1.640% | 7/15/21 | 1,789 | 1,779 |
| 7,12 Chrysler Capital Auto Receivables Trust | | | | |
| | 2016-BA | 1.870% | 2/15/22 | 1,700 | 1,673 |
| 7 | Citibank Credit Card Issuance Trust 2014-A1 | 2.880% | 1/23/23 | 8,576 | 8,534 |
| 7 | Citibank Credit Card Issuance Trust 2014-A6 | 2.150% | 7/15/21 | 7,580 | 7,546 |
| 7 | Citibank Credit Card Issuance Trust 2018-A1 | 2.490% | 1/20/23 | 6,710 | 6,612 |
| 7,12 Citigroup Commercial Mortgage Trust | | | | |
| | 2012-GC8 | 3.683% | 9/10/45 | 500 | 500 |
| 7 | Citigroup Commercial Mortgage Trust | | | | |
| | 2013-GC11 | 3.093% | 4/10/46 | 1,527 | 1,501 |
| 7 | Citigroup Commercial Mortgage Trust | | | | |
| | 2013-GC15 | 3.942% | 9/10/46 | 373 | 378 |
49
| | | | | |
| Institutional Intermediate-Term Bond Fund | | | | |
| |
| |
| |
| | | | | Face | Market |
| | | | Maturity | Amount | Value • |
| | | Coupon | Date | ($000) | ($000) |
| 7 | Citigroup Commercial Mortgage Trust | | | | |
| | 2014-GC19 | 3.753% | 3/10/47 | 157 | 159 |
| 7 | Citigroup Commercial Mortgage Trust | | | | |
| | 2014-GC19 | 4.023% | 3/10/47 | 8,659 | 8,853 |
| 7 | Citigroup Commercial Mortgage Trust | | | | |
| | 2014-GC21 | 3.575% | 5/10/47 | 1,304 | 1,311 |
| 7 | Citigroup Commercial Mortgage Trust | | | | |
| | 2014-GC21 | 3.855% | 5/10/47 | 4,082 | 4,129 |
| 7 | Citigroup Commercial Mortgage Trust | | | | |
| | 2014-GC23 | 3.622% | 7/10/47 | 1,575 | 1,576 |
| 7 | Citigroup Commercial Mortgage Trust | | | | |
| | 2014-GC23 | 3.863% | 7/10/47 | 275 | 276 |
| 7 | Citigroup Commercial Mortgage Trust | | | | |
| | 2014-GC25 | 3.372% | 10/10/47 | 1,640 | 1,616 |
| 7 | Citigroup Commercial Mortgage Trust | | | | |
| | 2014-GC25 | 3.635% | 10/10/47 | 4,442 | 4,435 |
| 7 | Citigroup Commercial Mortgage Trust | | | | |
| | 2015-GC27 | 3.137% | 2/10/48 | 20 | 19 |
| 7 | Citigroup Commercial Mortgage Trust | | | | |
| | 2015-GC31 | 3.762% | 6/10/48 | 620 | 622 |
| 7 | Citigroup Commercial Mortgage Trust | | | | |
| | 2015-GC33 | 3.778% | 9/10/58 | 5,062 | 5,091 |
| 7 | Citigroup Commercial Mortgage Trust | | | | |
| | 2015-GC36 | 3.349% | 2/10/49 | 2,600 | 2,529 |
| 7 | Citigroup Commercial Mortgage Trust | | | | |
| | 2016-C1 | 3.209% | 5/10/49 | 1,453 | 1,400 |
| 7 | Citigroup Commercial Mortgage Trust | | | | |
| | 2016-C2 | 2.575% | 8/10/49 | 3,500 | 3,236 |
| 7 | Citigroup Commercial Mortgage Trust | | | | |
| | 2016-GC37 | 3.314% | 4/10/49 | 4,000 | 3,888 |
| 7 | Citigroup Commercial Mortgage Trust | | | | |
| | 2017-C4 | 3.471% | 10/12/50 | 1,070 | 1,039 |
| 7 | Citigroup Commercial Mortgage Trust | | | | |
| | 2017-P8 | 3.203% | 9/15/50 | 4,200 | 3,979 |
| 7 | Citigroup Commercial Mortgage Trust | | | | |
| | 2017-P8 | 3.465% | 9/15/50 | 2,445 | 2,374 |
| 7 | CNH Equipment Trust 2016-B | 1.970% | 11/15/21 | 3,540 | 3,483 |
| 7 | CNH Equipment Trust 2017-B | 2.170% | 4/17/23 | 4,040 | 3,944 |
| 7 | COMM 2012-CCRE2 Mortgage Trust | 3.147% | 8/15/45 | 666 | 660 |
| 7 | COMM 2012-CCRE2 Mortgage Trust | 3.791% | 8/15/45 | 999 | 993 |
| 7 | COMM 2012-CCRE3 Mortgage Trust | 2.822% | 10/15/45 | 1,695 | 1,658 |
| 7,12 COMM 2012-CCRE3 Mortgage Trust | 3.416% | 10/15/45 | 770 | 758 |
| 7 | COMM 2012-CCRE4 Mortgage Trust | 2.853% | 10/15/45 | 1,366 | 1,329 |
| 7 | COMM 2012-CCRE4 Mortgage Trust | 3.251% | 10/15/45 | 50 | 49 |
| 7 | COMM 2012-CCRE5 Mortgage Trust | 2.771% | 12/10/45 | 580 | 565 |
| 7,12 COMM 2013-300P Mortgage Trust | 4.353% | 8/10/30 | 910 | 943 |
| 7 | COMM 2013-CCRE11 Mortgage Trust | 3.983% | 8/10/50 | 2,060 | 2,092 |
| 7 | COMM 2013-CCRE11 Mortgage Trust | 4.258% | 8/10/50 | 922 | 953 |
| 7 | COMM 2013-CCRE12 Mortgage Trust | 3.623% | 10/10/46 | 733 | 737 |
| 7 | COMM 2013-CCRE12 Mortgage Trust | 3.765% | 10/10/46 | 390 | 394 |
| 7 | COMM 2013-CCRE12 Mortgage Trust | 4.046% | 10/10/46 | 2,115 | 2,165 |
| 7 | COMM 2013-CCRE13 Mortgage Trust | 4.194% | 11/10/46 | 7,500 | 7,744 |
| 7 | COMM 2013-CCRE8 Mortgage Trust | 3.612% | 6/10/46 | 10 | 10 |
| 7 | COMM 2013-CCRE9 Mortgage Trust | 4.375% | 7/10/45 | 1,910 | 1,978 |
50
| | | | | |
| Institutional Intermediate-Term Bond Fund | | | | |
| |
| |
| |
| | | | | Face | Market |
| | | | Maturity | Amount | Value • |
| | | Coupon | Date | ($000) | ($000) |
| 7,12 | COMM 2013-CCRE9 Mortgage Trust | 4.399% | 7/10/45 | 2,331 | 2,393 |
| 7,12 | COMM 2013-LC13 Mortgage Trust | 3.774% | 8/10/46 | 546 | 552 |
| 7 | COMM 2013-LC13 Mortgage Trust | 4.205% | 8/10/46 | 160 | 165 |
| 7 | COMM 2013-LC6 Mortgage Trust | 2.941% | 1/10/46 | 933 | 915 |
| 7,12 | COMM 2013-SFS Mortgage Trust | 3.086% | 4/12/35 | 600 | 584 |
| 7,12 | COMM 2014-277P Mortgage Trust | 3.732% | 8/10/49 | 100 | 100 |
| 7 | COMM 2014-CCRE14 Mortgage Trust | 3.955% | 2/10/47 | 4,000 | 4,061 |
| 7 | COMM 2014-CCRE14 Mortgage Trust | 4.236% | 2/10/47 | 943 | 975 |
| 7 | COMM 2014-CCRE15 Mortgage Trust | 4.074% | 2/10/47 | 10 | 10 |
| 7 | COMM 2014-CCRE17 Mortgage Trust | 3.977% | 5/10/47 | 1,315 | 1,341 |
| 7 | COMM 2014-CCRE17 Mortgage Trust | 4.174% | 5/10/47 | 330 | 336 |
| 7 | COMM 2014-CCRE18 Mortgage Trust | 3.550% | 7/15/47 | 6,360 | 6,345 |
| 7 | COMM 2014-CCRE18 Mortgage Trust | 3.828% | 7/15/47 | 3,812 | 3,857 |
| 7 | COMM 2014-CCRE20 Mortgage Trust | 3.326% | 11/10/47 | 1,050 | 1,030 |
| 7 | COMM 2014-CCRE20 Mortgage Trust | 3.590% | 11/10/47 | 3,917 | 3,912 |
| 7 | COMM 2014-CCRE21 Mortgage Trust | 3.528% | 12/10/47 | 5,500 | 5,471 |
| 7 | COMM 2014-LC17 Mortgage Trust | 3.917% | 10/10/47 | 1,540 | 1,563 |
| 7 | COMM 2015-CCRE22 Mortgage Trust | 3.309% | 3/10/48 | 570 | 560 |
| 7 | COMM 2015-CCRE24 Mortgage Trust | 3.432% | 8/10/48 | 2,600 | 2,565 |
| 7 | COMM 2015-CCRE24 Mortgage Trust | 3.696% | 8/10/48 | 2,775 | 2,774 |
| 7 | COMM 2015-CCRE25 Mortgage Trust | 3.759% | 8/10/48 | 1,800 | 1,808 |
| 7 | COMM 2015-CCRE27 Mortgage Trust | 3.612% | 10/10/48 | 3,386 | 3,365 |
| 7 | COMM 2015-LC19 Mortgage Trust | 3.183% | 2/10/48 | 125 | 122 |
| 7,12 | Core Industrial Trust 2015-TEXW | 3.077% | 2/10/34 | 179 | 177 |
| 7 | CSAIL 2015-C4 Commercial Mortgage Trust | 3.808% | 11/15/48 | 685 | 688 |
| 7 | CSAIL 2016-C7 Commercial Mortgage Trust | 3.210% | 11/15/49 | 3,400 | 3,265 |
| 7 | CSAIL 2016-C7 Commercial Mortgage Trust | 3.502% | 11/15/49 | 1,660 | 1,619 |
| 7 | CSAIL 2017-C8 Commercial Mortgage Trust | 3.392% | 6/15/50 | 1,280 | 1,234 |
| 7 | CSAIL 2018-CX12 Commercial Mortgage Trust | 4.224% | 8/15/51 | 1,010 | 1,038 |
| 7,12 | Daimler Trucks Retail Trust 2018-1 | 2.850% | 7/15/21 | 40,570 | 40,496 |
| 7,12 | Daimler Trucks Retail Trust 2018-1 | 3.030% | 11/15/24 | 11,230 | 11,201 |
| 7 | DBJPM 17-C6 Mortgage Trust | 3.328% | 6/10/50 | 1,790 | 1,730 |
| 7,12 | Dell Equipment Finance Trust 2017-2 | 1.970% | 2/24/20 | 4,002 | 3,988 |
| 7,12 | Dell Equipment Finance Trust 2017-2 | 2.190% | 10/24/22 | 3,500 | 3,462 |
| 7,12 | Dell Equipment Finance Trust 2018-1 | 2.970% | 10/22/20 | 12,207 | 12,210 |
| 7 | Discover Card Execution Note Trust 2012-A6 | 1.670% | 1/18/22 | 13,138 | 13,025 |
| 7 | Discover Card Execution Note Trust 2015-A4 | 2.190% | 4/17/23 | 9,500 | 9,335 |
| 7,12 | DLL Securitization Trust Series 2018-1 | 3.100% | 4/18/22 | 12,465 | 12,438 |
| 12 | DNB Boligkreditt AS | 2.500% | 3/28/22 | 20,740 | 20,160 |
| 7,11,12 Edsouth Indenture No 9 LLC 2015-1 | 3.016% | 10/25/56 | 342 | 342 |
| 7,12 | Enterprise Fleet Financing LLC Series 2015-1 | 1.740% | 9/20/20 | 106 | 106 |
| 7,12 | Enterprise Fleet Financing LLC Series 2015-2 | 2.090% | 2/22/21 | 3,437 | 3,429 |
| 7,12 | Enterprise Fleet Financing LLC Series 2016-1 | 2.080% | 9/20/21 | 8,380 | 8,342 |
| 6,7 | Fannie Mae Grantor Trust 2017-T1 | 2.898% | 6/25/27 | 6,932 | 6,551 |
| 7 | Fifth Third Auto Trust 2017-1 | 2.030% | 7/15/24 | 13,110 | 12,767 |
| 7,11 | First National Master Note Trust 2017-1 | 2.558% | 4/18/22 | 8,010 | 8,016 |
| 7,11 | First National Master Note Trust 2017-2 | 2.598% | 10/16/23 | 6,240 | 6,246 |
| 7 | Ford Credit Auto Lease Trust 2017-B | 2.030% | 12/15/20 | 9,280 | 9,201 |
| 7 | Ford Credit Auto Lease Trust 2017-B | 2.170% | 2/15/21 | 4,700 | 4,641 |
| 7 | Ford Credit Auto Lease Trust 2018-A | 2.930% | 6/15/21 | 41,660 | 41,554 |
| 7 | Ford Credit Auto Lease Trust 2018-A | 3.050% | 8/15/21 | 3,820 | 3,804 |
| 7 | Ford Credit Auto Lease Trust 2018-B | 3.190% | 12/15/21 | 12,010 | 12,018 |
| 7 | Ford Credit Auto Lease Trust 2018-B | 3.300% | 2/15/22 | 4,230 | 4,232 |
| 7,12 | Ford Credit Auto Owner Trust 2014-REV1 | 2.260% | 11/15/25 | 4,695 | 4,680 |
51
| | | | | |
| Institutional Intermediate-Term Bond Fund | | | | |
| |
| |
| |
| | | | | Face | Market |
| | | | Maturity | Amount | Value • |
| | | Coupon | Date | ($000) | ($000) |
| 7,12 | Ford Credit Auto Owner Trust 2014-REV2 | 2.310% | 4/15/26 | 920 | 914 |
| 7,12 | Ford Credit Auto Owner Trust 2015-REV2 | 2.440% | 1/15/27 | 10,500 | 10,371 |
| 7,12 | Ford Credit Auto Owner Trust 2016-REV1 | 2.310% | 8/15/27 | 13,230 | 12,942 |
| 7,12 | Ford Credit Auto Owner Trust 2016-REV2 | 2.030% | 12/15/27 | 16,832 | 16,290 |
| 7,12 | Ford Credit Auto Owner Trust 2017-1 | 2.620% | 8/15/28 | 39,440 | 38,417 |
| 7,12 | Ford Credit Auto Owner Trust 2017-2 | 2.360% | 3/15/29 | 16,690 | 16,016 |
| 7 | Ford Credit Auto Owner Trust 2017-B | 1.870% | 9/15/22 | 7,500 | 7,286 |
| 7,12 | Ford Credit Auto Owner Trust 2018-2 | 3.470% | 1/15/30 | 17,320 | 17,284 |
| 7 | Ford Credit Auto Owner Trust 2018-A | 3.030% | 11/15/22 | 26,760 | 26,730 |
| 7,12 | Ford Credit Auto Owner Trust 2018-REV1 | 3.190% | 7/15/31 | 7,750 | 7,545 |
| 7 | Ford Credit Floorplan Master Owner Trust A | | | | |
| | Series 2015-5 | 2.390% | 8/15/22 | 9,260 | 9,122 |
| 7 | Ford Credit Floorplan Master Owner Trust A | | | | |
| | Series 2017-1 | 2.070% | 5/15/22 | 38,780 | 38,154 |
| 7 | Ford Credit Floorplan Master Owner Trust A | | | | |
| | Series 2017-2 | 2.160% | 9/15/22 | 18,630 | 18,291 |
| 7 | Ford Credit Floorplan Master Owner Trust A | | | | |
| | Series 2018-1 | 2.950% | 5/15/23 | 47,010 | 46,666 |
| 7 | GM Financial Automobile Leasing Trust 2016-1 | 1.790% | 3/20/20 | 3,134 | 3,132 |
| 7 | GM Financial Automobile Leasing Trust 2017-1 | 2.260% | 8/20/20 | 5,000 | 4,965 |
| 7 | GM Financial Automobile Leasing Trust 2017-2 | 2.180% | 6/21/21 | 3,720 | 3,678 |
| 7 | GM Financial Automobile Leasing Trust 2017-3 | 1.720% | 1/21/20 | 13,461 | 13,409 |
| 7 | GM Financial Automobile Leasing Trust 2017-3 | 2.010% | 11/20/20 | 7,410 | 7,347 |
| 7 | GM Financial Automobile Leasing Trust 2017-3 | 2.120% | 9/20/21 | 1,970 | 1,942 |
| 7 | GM Financial Automobile Leasing Trust 2018-1 | 2.610% | 1/20/21 | 38,580 | 38,329 |
| 7 | GM Financial Automobile Leasing Trust 2018-2 | 3.060% | 6/21/21 | 19,200 | 19,209 |
| 7 | GM Financial Automobile Leasing Trust 2018-3 | 3.180% | 6/21/21 | 8,620 | 8,616 |
| 7 | GM Financial Automobile Leasing Trust 2018-3 | 3.300% | 7/20/22 | 1,700 | 1,700 |
| 7,12 | GM Financial Consumer Automobile 2017-3 | 2.130% | 3/16/23 | 4,430 | 4,306 |
| 7 | GM Financial Consumer Automobile 2018-2 | 3.020% | 12/18/23 | 4,430 | 4,390 |
| 7 | GM Financial Consumer Automobile 2018-3 | 3.020% | 5/16/23 | 18,400 | 18,355 |
| 7 | GM Financial Consumer Automobile 2018-3 | 3.160% | 1/16/24 | 5,820 | 5,799 |
| 7,11,12 GMF Floorplan Owner Revolving Trust 2017-1 | 2.728% | 1/18/22 | 220 | 221 |
| 7,12 | GMF Floorplan Owner Revolving Trust 2017-2 | 2.130% | 7/15/22 | 21,600 | 21,105 |
| 7,12 | GMF Floorplan Owner Revolving Trust 2018-2 | 3.130% | 3/15/23 | 29,050 | 28,947 |
| 7,12 | Golden Credit Card Trust 2015-2A | 2.020% | 4/15/22 | 695 | 683 |
| 7,12 | Golden Credit Card Trust 2016-5A | 1.600% | 9/15/21 | 25,500 | 25,179 |
| 7,11,12 Golden Credit Card Trust 2017-4A | 2.678% | 7/15/24 | 19,310 | 19,332 |
| 7,12 | Golden Credit Card Trust 2018-1A | 2.620% | 1/15/23 | 20,690 | 20,384 |
| 7,12 | Golden Credit Card Trust 2018-4A | 3.440% | 10/15/25 | 29,270 | 29,156 |
| 7,12,13 Gosforth Funding GFUND_18-1A PLC | 2.714% | 8/25/60 | 14,500 | 14,503 |
| 7,12 | GreatAmerica Leasing Receivables Funding | | | | |
| | LLC Series 2015-1 | 2.020% | 6/21/21 | 25 | 25 |
| 7,12 | GreatAmerica Leasing Receivables Funding | | | | |
| | LLC Series 2016-1 | 1.990% | 4/20/22 | 4,320 | 4,290 |
| 7,12 | GreatAmerica Leasing Receivables Funding | | | | |
| | LLC Series 2018-1 | 2.600% | 6/15/21 | 5,670 | 5,618 |
| 7,12 | GreatAmerica Leasing Receivables Funding | | | | |
| | LLC Series 2018-1 | 2.830% | 6/17/24 | 3,690 | 3,640 |
| 7 | GS Mortgage Securities Corporation II | | | | |
| | 2015-GC30 | 3.382% | 5/10/50 | 5 | 5 |
| 7,12 | GS Mortgage Securities Trust 2012-GC6 | 4.948% | 1/10/45 | 233 | 241 |
| 7 | GS Mortgage Securities Trust 2013-GCJ12 | 3.135% | 6/10/46 | 1,055 | 1,041 |
| 7 | GS Mortgage Securities Trust 2013-GCJ14 | 3.955% | 8/10/46 | 30 | 31 |
52
| | | | | |
| Institutional Intermediate-Term Bond Fund | | | | |
| |
| |
| |
| | | | | Face | Market |
| | | | Maturity | Amount | Value • |
| | | Coupon | Date | ($000) | ($000) |
| 7 | GS Mortgage Securities Trust 2014-GC20 | 3.998% | 4/10/47 | 5,545 | 5,656 |
| 7 | GS Mortgage Securities Trust 2014-GC24 | 3.931% | 9/10/47 | 210 | 213 |
| 7 | GS Mortgage Securities Trust 2014-GC24 | 4.162% | 9/10/47 | 140 | 140 |
| 7 | GS Mortgage Securities Trust 2014-GC26 | 3.364% | 11/10/47 | 1,680 | 1,646 |
| 7 | GS Mortgage Securities Trust 2014-GC26 | 3.629% | 11/10/47 | 3,630 | 3,629 |
| 7 | GS Mortgage Securities Trust 2015-GC28 | 3.136% | 2/10/48 | 90 | 88 |
| 7 | GS Mortgage Securities Trust 2015-GC28 | 3.396% | 2/10/48 | 40 | 39 |
| 7 | GS Mortgage Securities Trust 2015-GC32 | 3.498% | 7/10/48 | 7,000 | 6,913 |
| 7 | GS Mortgage Securities Trust 2015-GC34 | 3.506% | 10/10/48 | 2,520 | 2,478 |
| 7 | GS Mortgage Securities Trust 2016-GS3 | 2.850% | 10/10/49 | 50 | 47 |
| 7 | GS Mortgage Securities Trust 2018-GS10 | 4.155% | 7/10/51 | 1,140 | 1,164 |
| 7,12 | Hertz Vehicle Financing II LP 2015-3A | 2.670% | 9/25/21 | 2,790 | 2,740 |
| 7,12 | Hertz Vehicle Financing II LP 2016-2A | 2.950% | 3/25/22 | 4,141 | 4,074 |
| 7,12 | Hertz Vehicle Financing II LP 2016-3A | 2.270% | 7/25/20 | 1,600 | 1,590 |
| 7,12 | Hertz Vehicle Financing II LP 2018-1A | 3.290% | 2/25/24 | 2,760 | 2,682 |
| 7,12 | Hertz Vehicle Financing LLC 2017-2A | 3.290% | 10/25/23 | 2,111 | 2,056 |
| 7,12 | Hilton USA Trust 2016-HHV | 3.719% | 11/5/38 | 30 | 29 |
| 7,12,13 Holmes Master Issuer PLC 2018-1 | 2.699% | 10/15/54 | 17,850 | 17,825 |
| 7,12,13 Holmes Master Issuer PLC 2018-2A | 2.561% | 10/15/54 | 16,620 | 16,553 |
| 7 | Honda Auto Receivables 2017-2 Owner Trust | 1.870% | 9/15/23 | 10,000 | 9,746 |
| 7 | Honda Auto Receivables 2017-3 Owner Trust | 1.980% | 11/20/23 | 6,490 | 6,323 |
| 7 | Honda Auto Receivables 2017-4 Owner Trust | 2.050% | 11/22/21 | 15,530 | 15,340 |
| 7 | Honda Auto Receivables 2017-4 Owner Trust | 2.210% | 3/21/24 | 2,330 | 2,282 |
| 7 | Honda Auto Receivables 2018-2 Owner Trust | 3.010% | 5/18/22 | 10,180 | 10,162 |
| 7 | Honda Auto Receivables 2018-3 Owner Trust | 2.950% | 8/22/22 | 13,680 | 13,637 |
| 7 | Honda Auto Receivables 2018-3 Owner Trust | 3.070% | 11/21/24 | 5,020 | 4,994 |
| 7,12 | Houston Galleria Mall Trust 2015-HGLR | 3.087% | 3/5/37 | 13,080 | 12,551 |
| 7,12 | Hyundai Auto Lease Securitization Trust 2017-B | 2.130% | 3/15/21 | 8,250 | 8,167 |
| 7,12 | Hyundai Auto Lease Securitization Trust 2017-C | 2.120% | 2/16/21 | 12,600 | 12,502 |
| 7,12 | Hyundai Auto Lease Securitization Trust 2017-C | 2.210% | 9/15/21 | 2,480 | 2,451 |
| 7,12 | Hyundai Auto Lease Securitization Trust 2018-A | 2.810% | 4/15/21 | 25,590 | 25,498 |
| 7,12 | Hyundai Auto Lease Securitization Trust 2018-A | 2.890% | 3/15/22 | 8,100 | 8,044 |
| 7,12 | Hyundai Auto Lease Securitization Trust 2018-B | 3.040% | 10/15/21 | 22,090 | 22,052 |
| 7,12 | Hyundai Auto Lease Securitization Trust 2018-B | 3.200% | 6/15/22 | 2,830 | 2,825 |
| 7 | Hyundai Auto Receivables Trust 2017-B | 1.960% | 2/15/23 | 11,040 | 10,735 |
| 7,12 | Hyundai Floorplan Master Owner Trust | | | | |
| | Series 2016-1A | 1.810% | 3/15/21 | 2,090 | 2,082 |
| 7,13 | Illinois Student Assistance Commission | | | | |
| | Series 2010-1 | 3.385% | 4/25/22 | 162 | 162 |
| 7,12 | Irvine Core Office Trust 2013-IRV | 3.279% | 5/15/48 | 2,184 | 2,154 |
| 7 | John Deere Owner Trust 2015-B | 1.780% | 6/15/22 | 540 | 539 |
| 7 | John Deere Owner Trust 2016-B | 1.490% | 5/15/23 | 1,000 | 985 |
| 7 | John Deere Owner Trust 2017-A | 2.110% | 12/15/23 | 7,650 | 7,554 |
| 7 | John Deere Owner Trust 2017-B | 2.110% | 7/15/24 | 7,960 | 7,709 |
| 7 | John Deere Owner Trust 2018-B | 3.080% | 11/15/22 | 23,700 | 23,650 |
| 7 | John Deere Owner Trust 2018-B | 3.230% | 6/16/25 | 7,540 | 7,508 |
| 7,12 | JP Morgan Chase Commercial Mortgage | | | | |
| | Securities Trust 2011-C3 | 4.717% | 2/15/46 | 3,133 | 3,216 |
| 7,12 | JP Morgan Chase Commercial Mortgage | | | | |
| | Securities Trust 2011-C5 | 5.586% | 8/15/46 | 1,383 | 1,441 |
| 7,12 | JP Morgan Chase Commercial Mortgage | | | | |
| | Securities Trust 2011-RR1 | 4.717% | 3/16/46 | 9,826 | 10,018 |
| 7 | JP Morgan Chase Commercial Mortgage | | | | |
| | Securities Trust 2012-C6 | 3.507% | 5/15/45 | 401 | 402 |
53
| | | | | |
| Institutional Intermediate-Term Bond Fund | | | | |
| |
| |
| |
| | | | | Face | Market |
| | | | Maturity | Amount | Value • |
| | | Coupon | Date | ($000) | ($000) |
| 7 | JP Morgan Chase Commercial Mortgage | | | | |
| | Securities Trust 2012-C8 | 2.829% | 10/15/45 | 975 | 954 |
| 7,12 JP Morgan Chase Commercial Mortgage | | | | |
| | Securities Trust 2012-C8 | 3.424% | 10/15/45 | 1,523 | 1,506 |
| 7,12 JP Morgan Chase Commercial Mortgage | | | | |
| | Securities Trust 2012-HSBC | 3.093% | 7/5/32 | 1,686 | 1,672 |
| 7 | JP Morgan Chase Commercial Mortgage | | | | |
| | Securities Trust 2013-C10 | 2.875% | 12/15/47 | 431 | 422 |
| 7 | JP Morgan Chase Commercial Mortgage | | | | |
| | Securities Trust 2013-C13 | 3.994% | 1/15/46 | 2,948 | 3,012 |
| 7 | JP Morgan Chase Commercial Mortgage | | | | |
| | Securities Trust 2013-C16 | 3.674% | 12/15/46 | 499 | 503 |
| 7 | JP Morgan Chase Commercial Mortgage | | | | |
| | Securities Trust 2013-C16 | 3.881% | 12/15/46 | 185 | 188 |
| 7 | JP Morgan Chase Commercial Mortgage | | | | |
| | Securities Trust 2013-C16 | 4.166% | 12/15/46 | 1,250 | 1,287 |
| 7 | JP Morgan Chase Commercial Mortgage | | | | |
| | Securities Trust 2013-LC11 | 2.960% | 4/15/46 | 2,807 | 2,750 |
| 7 | JP Morgan Chase Commercial Mortgage | | | | |
| | Securities Trust 2014-C20 | 3.461% | 7/15/47 | 210 | 211 |
| 7 | JP Morgan Chase Commercial Mortgage | | | | |
| | Securities Trust 2016-JP3 | 2.870% | 8/15/49 | 1,480 | 1,390 |
| 7 | JP Morgan Chase Commercial Mortgage | | | | |
| | Securities Trust 2016-JP4 | 3.648% | 12/15/49 | 470 | 465 |
| 7 | JP Morgan Chase Commercial Mortgage | | | | |
| | Securities Trust 2017-JP6 | 3.490% | 7/15/50 | 750 | 733 |
| 7 | JPMBB Commercial Mortgage Securities | | | | |
| | Trust 2013-C12 | 3.363% | 7/15/45 | 1,598 | 1,587 |
| 7 | JPMBB Commercial Mortgage Securities | | | | |
| | Trust 2013-C12 | 3.664% | 7/15/45 | 3,137 | 3,162 |
| 7 | JPMBB Commercial Mortgage Securities | | | | |
| | Trust 2013-C12 | 4.171% | 7/15/45 | 1,465 | 1,484 |
| 7 | JPMBB Commercial Mortgage Securities | | | | |
| | Trust 2013-C14 | 3.761% | 8/15/46 | 386 | 390 |
| 7 | JPMBB Commercial Mortgage Securities | | | | |
| | Trust 2013-C14 | 4.133% | 8/15/46 | 490 | 504 |
| 7 | JPMBB Commercial Mortgage Securities | | | | |
| | Trust 2013-C15 | 3.659% | 11/15/45 | 196 | 198 |
| 7 | JPMBB Commercial Mortgage Securities | | | | |
| | Trust 2013-C17 | 4.199% | 1/15/47 | 4,238 | 4,369 |
| 7 | JPMBB Commercial Mortgage Securities | | | | |
| | Trust 2014-C18 | 4.079% | 2/15/47 | 5,130 | 5,252 |
| 7 | JPMBB Commercial Mortgage Securities | | | | |
| | Trust 2014-C18 | 4.439% | 2/15/47 | 450 | 462 |
| 7 | JPMBB Commercial Mortgage Securities | | | | |
| | Trust 2014-C19 | 3.997% | 4/15/47 | 10 | 10 |
| 7 | JPMBB Commercial Mortgage Securities | | | | |
| | Trust 2014-C21 | 3.493% | 8/15/47 | 190 | 189 |
| 7 | JPMBB Commercial Mortgage Securities | | | | |
| | Trust 2014-C24 | 3.639% | 11/15/47 | 1,090 | 1,090 |
| 7 | JPMBB Commercial Mortgage Securities | | | | |
| | Trust 2014-C26 | 3.231% | 1/15/48 | 90 | 88 |
| 7 | JPMBB Commercial Mortgage Securities | | | | |
| | Trust 2014-C26 | 3.494% | 1/15/48 | 10 | 10 |
54
| | | | | |
| Institutional Intermediate-Term Bond Fund | | | | |
| |
| |
| |
| | | | | Face | Market |
| | | | Maturity | Amount | Value • |
| | | Coupon | Date | ($000) | ($000) |
| 7 | JPMBB Commercial Mortgage Securities | | | | |
| | Trust 2015-C27 | 3.179% | 2/15/48 | 110 | 107 |
| 7 | JPMBB Commercial Mortgage Securities | | | | |
| | Trust 2015-C30 | 3.822% | 7/15/48 | 20 | 20 |
| 7 | JPMBB Commercial Mortgage Securities | | | | |
| | Trust 2015-C31 | 3.801% | 8/15/48 | 150 | 151 |
| 7 | JPMBB Commercial Mortgage Securities | | | | |
| | Trust 2015-C32 | 3.598% | 11/15/48 | 3,403 | 3,374 |
| 7 | JPMCC Commercial Mortgage Securities | | | | |
| | Trust 2017-JP5 | 3.723% | 3/15/50 | 6,180 | 6,146 |
| 7 | JPMCC Commercial Mortgage Securities | | | | |
| | Trust 2017-JP7 | 3.454% | 9/15/50 | 895 | 871 |
| 7 | JPMDB Commercial Mortgage Securities | | | | |
| | Trust 2017-C7 | 3.409% | 10/15/50 | 660 | 641 |
| 7 | JPMDB Commercial Mortgage Securities | | | | |
| | Trust 2018-C8 | 4.211% | 6/15/51 | 60 | 62 |
| 7,12,13 Lanark Master Issuer plc 2018-1A | 2.730% | 12/22/69 | 4,708 | 4,703 |
| 7,11,12 Lanark Master Issuer plc 2018-2A | 2.846% | 12/22/69 | 10,560 | 10,553 |
| 7,12 | Master Credit Card Trust II Series 2017-1A | 2.260% | 7/21/21 | 20,000 | 19,789 |
| 7,11,12 Master Credit Card Trust II Series 2018-1A | 2.672% | 7/22/24 | 8,120 | 8,101 |
| 7 | Mercedes-Benz Auto Lease Trust 2018-A | 2.200% | 4/15/20 | 7,565 | 7,549 |
| 7 | Mercedes-Benz Auto Lease Trust 2018-A | 2.410% | 2/16/21 | 12,140 | 12,066 |
| 7 | Mercedes-Benz Auto Lease Trust 2018-A | 2.510% | 10/16/23 | 1,210 | 1,197 |
| 7 | Mercedes-Benz Auto Receivables Trust 2018-1 | 3.150% | 10/15/24 | 6,700 | 6,689 |
| 7,12 | MMAF Equipment Finance LLC 2012-AA | 1.980% | 6/10/32 | 39 | 39 |
| 7,12 | MMAF Equipment Finance LLC 2013-AA | 2.570% | 6/9/33 | 963 | 961 |
| 7,12 | MMAF Equipment Finance LLC 2015-AA | 2.490% | 2/19/36 | 570 | 559 |
| 7,12 | MMAF Equipment Finance LLC 2016-AA | 2.210% | 12/15/32 | 6,130 | 5,870 |
| 7,12 | MMAF Equipment Finance LLC 2017-A | 2.410% | 8/16/24 | 6,180 | 6,006 |
| 7,12 | MMAF Equipment Finance LLC 2017-A | 2.680% | 7/16/27 | 3,090 | 2,972 |
| 7,12 | MMAF Equipment Finance LLC 2018-A | 3.390% | 1/10/25 | 4,730 | 4,734 |
| 7,12 | MMAF Equipment Finance LLC 2018-A | 3.610% | 3/10/42 | 2,580 | 2,573 |
| 7 | Morgan Stanley Bank of America Merrill | | | | |
| | Lynch Trust 2012-C5 | 3.176% | 8/15/45 | 2,605 | 2,584 |
| 7 | Morgan Stanley Bank of America Merrill | | | | |
| | Lynch Trust 2012-C5 | 3.792% | 8/15/45 | 1,116 | 1,108 |
| 7 | Morgan Stanley Bank of America Merrill | | | | |
| | Lynch Trust 2012-C6 | 2.858% | 11/15/45 | 1,266 | 1,241 |
| 7 | Morgan Stanley Bank of America Merrill | | | | |
| | Lynch Trust 2013-C10 | 4.219% | 7/15/46 | 5,387 | 5,499 |
| 7 | Morgan Stanley Bank of America Merrill | | | | |
| | Lynch Trust 2013-C11 | 3.960% | 8/15/46 | 1,290 | 1,302 |
| 7 | Morgan Stanley Bank of America Merrill | | | | |
| | Lynch Trust 2013-C11 | 4.303% | 8/15/46 | 190 | 195 |
| 7 | Morgan Stanley Bank of America Merrill | | | | |
| | Lynch Trust 2013-C12 | 3.824% | 10/15/46 | 420 | 425 |
| 7 | Morgan Stanley Bank of America Merrill | | | | |
| | Lynch Trust 2013-C12 | 4.259% | 10/15/46 | 150 | 154 |
| 7 | Morgan Stanley Bank of America Merrill | | | | |
| | Lynch Trust 2013-C13 | 4.039% | 11/15/46 | 85 | 87 |
| 7 | Morgan Stanley Bank of America Merrill | | | | |
| | Lynch Trust 2014-C14 | 4.064% | 2/15/47 | 400 | 408 |
| 7 | Morgan Stanley Bank of America Merrill | | | | |
| | Lynch Trust 2014-C14 | 4.384% | 2/15/47 | 200 | 205 |
55
| | | | | |
| Institutional Intermediate-Term Bond Fund | | | | |
| |
| |
| |
| | | | | Face | Market |
| | | | Maturity | Amount | Value • |
| | | Coupon | Date | ($000) | ($000) |
| 7 | Morgan Stanley Bank of America Merrill | | | | |
| | Lynch Trust 2014-C15 | 3.773% | 4/15/47 | 2,240 | 2,256 |
| 7 | Morgan Stanley Bank of America Merrill | | | | |
| | Lynch Trust 2014-C15 | 4.051% | 4/15/47 | 5,400 | 5,521 |
| 7 | Morgan Stanley Bank of America Merrill | | | | |
| | LynchTrust 2014-C16 | 3.892% | 6/15/47 | 3,243 | 3,291 |
| 7 | Morgan Stanley Bank of America Merrill | | | | |
| | Lynch Trust 2014-C16 | 4.094% | 6/15/47 | 330 | 332 |
| 7 | Morgan Stanley Bank of America Merrill | | | | |
| | Lynch Trust 2014-C17 | 3.741% | 8/15/47 | 570 | 573 |
| 7 | Morgan Stanley Bank of America Merrill | | | | |
| | Lynch Trust 2014-C18 | 3.923% | 10/15/47 | 60 | 61 |
| 7 | Morgan Stanley Bank of America Merrill | | | | |
| | Lynch Trust 2014-C19 | 3.326% | 12/15/47 | 120 | 119 |
| 7 | Morgan Stanley Bank of America Merrill | | | | |
| | LynchTrust 2014-C19 | 3.526% | 12/15/47 | 10 | 10 |
| 7 | Morgan Stanley Bank of America Merrill | | | | |
| | Lynch Trust 2015-C20 | 3.069% | 2/15/48 | 150 | 148 |
| 7 | Morgan Stanley Bank of America Merrill | | | | |
| | Lynch Trust 2015-C20 | 3.249% | 2/15/48 | 60 | 58 |
| 7 | Morgan Stanley Bank of America Merrill | | | | |
| | Lynch Trust 2015-C23 | 3.451% | 7/15/50 | 11,030 | 10,791 |
| 7 | Morgan Stanley Bank of America Merrill | | | | |
| | Lynch Trust 2015-C23 | 3.719% | 7/15/50 | 5,200 | 5,206 |
| 7 | Morgan Stanley Bank of America Merrill | | | | |
| | Lynch Trust 2015-C24 | 3.732% | 5/15/48 | 780 | 780 |
| 7 | Morgan Stanley Bank of America Merrill | | | | |
| | Lynch Trust 2015-C25 | 3.372% | 10/15/48 | 2,500 | 2,426 |
| 7 | Morgan Stanley Bank of America Merrill | | | | |
| | Lynch Trust 2015-C25 | 3.635% | 10/15/48 | 4,458 | 4,427 |
| 7 | Morgan Stanley Bank of America Merrill | | | | |
| | Lynch Trust 2016-C29 | 3.325% | 5/15/49 | 450 | 436 |
| 7 | Morgan Stanley Bank of America Merrill | | | | |
| | Lynch Trust 2016-C32 | 3.459% | 12/15/49 | 5,600 | 5,438 |
| 7 | Morgan Stanley Bank of America Merrill | | | | |
| | Lynch Trust 2016-C32 | 3.720% | 12/15/49 | 3,042 | 3,017 |
| 7 | Morgan Stanley Bank of America Merrill | | | | |
| | Lynch Trust 2017-C34 | 3.536% | 11/15/52 | 1,250 | 1,214 |
| 7,12 | Morgan Stanley Capital I Trust 2012-STAR | 3.201% | 8/5/34 | 2,251 | 2,221 |
| 7 | Morgan Stanley Capital I Trust 2015-UBS8 | 3.809% | 12/15/48 | 7,050 | 7,040 |
| 7 | Morgan Stanley Capital I Trust 2016-UBS9 | 3.594% | 3/15/49 | 5,000 | 4,950 |
| 7 | Morgan Stanley Capital I Trust 2017-HR2 | 3.509% | 12/15/50 | 1,260 | 1,242 |
| 7 | Morgan Stanley Capital I Trust 2017-HR2 | 3.587% | 12/15/50 | 4,257 | 4,155 |
| 7,11,12 Motor plc 2017 1A | 2.746% | 9/25/24 | 17,400 | 17,385 |
| 7,12 | MSBAM Commercial Mortgage Securities | | | | |
| | Trust 2012-CKSV | 3.277% | 10/15/30 | 110 | 106 |
| 7,11 | Navient Student Loan Trust 2014-8 | 2.656% | 4/25/23 | 2,733 | 2,736 |
| 7,11 | Navient Student Loan Trust 2015-3 | 2.866% | 6/26/56 | 5,164 | 5,186 |
| 7,11,12 Navient Student Loan Trust 2016-2 | 3.266% | 6/25/65 | 1,650 | 1,666 |
| 7,11,12 Navient Student Loan Trust 2016-3 | 3.066% | 6/25/65 | 2,093 | 2,103 |
| 7,11,12 Navient Student Loan Trust 2016-6A | 2.966% | 3/25/66 | 7,450 | 7,517 |
| 7,11,12 Navient Student Loan Trust 2017-1 | 2.966% | 7/26/66 | 28,980 | 29,115 |
| 7,11,12 Navient Student Loan Trust 2017-3A | 2.816% | 7/26/66 | 5,175 | 5,212 |
| 7,11,12 Navient Student Loan Trust 2017-4A | 2.716% | 9/27/66 | 6,410 | 6,438 |
56
| | | | | |
| Institutional Intermediate-Term Bond Fund | | | | |
| |
| |
| |
| | | | | Face | Market |
| | | | Maturity | Amount | Value • |
| | | Coupon | Date | ($000) | ($000) |
| 7,11,12 Navient Student Loan Trust 2018-1 | 2.406% | 3/25/67 | 1,260 | 1,260 |
| 7,11,12 Navient Student Loan Trust 2018-1 | 2.566% | 3/25/67 | 2,760 | 2,759 |
| 7,11,12 Navient Student Loan Trust 2018-1 | 2.936% | 3/25/67 | 3,410 | 3,426 |
| 7,11,12 Navistar Financial Dealer Note Master | | | | |
| | Trust II 2017-1A | 2.996% | 6/27/22 | 7,510 | 7,538 |
| 7,12 | NextGear Floorplan Master Owner Trust | | | | |
| | 2016-1A | 2.740% | 4/15/21 | 3,380 | 3,377 |
| 7 | Nissan Auto Lease Trust 2017-A | 1.910% | 4/15/20 | 18,650 | 18,544 |
| 7 | Nissan Auto Lease Trust 2017-A | 2.040% | 9/15/22 | 5,240 | 5,189 |
| 7 | Nissan Auto Lease Trust 2017-B | 2.050% | 9/15/20 | 9,350 | 9,271 |
| 7 | Nissan Auto Lease Trust 2017-B | 2.170% | 12/15/21 | 2,610 | 2,576 |
| 7 | Nissan Auto Receivables 2016-A Owner Trust | 1.590% | 7/15/22 | 10,250 | 10,046 |
| 7 | Nissan Auto Receivables 2017-C Owner Trust | 2.120% | 4/18/22 | 21,970 | 21,642 |
| 7 | Nissan Auto Receivables 2017-C Owner Trust | 2.280% | 2/15/24 | 12,380 | 12,084 |
| 7 | Nissan Auto Receivables 2018-B Owner Trust | 3.160% | 12/16/24 | 6,700 | 6,668 |
| 7,11 | Nissan Master Owner Trust Receivables Series | | | | |
| | 2017-C | 2.478% | 10/17/22 | 19,325 | 19,361 |
| 7,12 | Palisades Center Trust 2016-PLSD | 2.713% | 4/13/33 | 1,250 | 1,219 |
| 7,11,12 Pepper Residential Securities Trust | | | | |
| | 2017A-A1UA | 3.233% | 3/10/58 | 208 | 208 |
| 7,11,12 Pepper Residential Securities Trust | | | | |
| | 2018A-A1UA | 3.089% | 3/12/47 | 59 | 59 |
| 7,11,12 Pepper Residential Securities Trust | | | | |
| | 2019A-A1U1 | 2.489% | 10/12/18 | 690 | 690 |
| 7,11,12 Pepper Residential Securities Trust | | | | |
| | 2020A-A1U1 | 2.658% | 3/16/19 | 670 | 667 |
| 7,11,12 Pepper Residential Securities Trust | | | | |
| | 2021-A1U | 3.038% | 1/16/60 | 1,653 | 1,653 |
| 7,12,13 Permanent Master Issuer PLC 2018-1A | 2.747% | 7/15/58 | 9,060 | 9,064 |
| 7,12 | PFS Financing Corp. 2017-B | 2.220% | 7/15/22 | 630 | 617 |
| 7,11,12 PFS Financing Corp. 2017-C | 2.628% | 10/15/21 | 840 | 840 |
| 7,12 | PFS Financing Corp. 2017-D | 2.400% | 10/17/22 | 880 | 864 |
| 7,12 | PFS Financing Corp. 2018-D | 3.190% | 4/17/23 | 440 | 437 |
| 7,11,12 PHEAA Student Loan Trust 2016-2A | 3.166% | 11/25/65 | 5,378 | 5,448 |
| 7 | Public Service New Hampshire Funding LLC | | | | |
| | 2018-1 | 3.094% | 2/1/26 | 7,220 | 7,198 |
| 7 | Public Service New Hampshire Funding LLC | | | | |
| | 2018-1 | 3.506% | 8/1/28 | 2,470 | 2,461 |
| 7 | Public Service New Hampshire Funding LLC | | | | |
| | 2018-1 | 3.814% | 2/1/35 | 2,350 | 2,348 |
| 7,11,12 Resimac Premier Series 2016-1A | 3.523% | 10/10/47 | 1,264 | 1,272 |
| 7,11,12 Resimac Premier Series 2017-1A | 3.081% | 9/11/48 | 2,701 | 2,702 |
| 7,11,12 Resimac Premier Series 2018-1A | 2.933% | 11/10/49 | 1,300 | 1,298 |
| 7,11,12 Resimac Premier Series 2018-1NCA | 2.987% | 12/16/59 | 2,500 | 2,499 |
| 7 | Royal Bank of Canada | 1.875% | 2/5/21 | 5,400 | 5,311 |
| 7 | Santander Drive Auto Receivables Trust 2017-1 | 1.770% | 9/15/20 | 346 | 346 |
| 7 | Santander Drive Auto Receivables Trust 2017-3 | 1.670% | 6/15/20 | 428 | 427 |
| 7 | Santander Drive Auto Receivables Trust 2017-3 | 1.870% | 6/15/21 | 330 | 329 |
| 7 | Santander Drive Auto Receivables Trust 2018-1 | 2.100% | 11/16/20 | 411 | 410 |
| 7 | Santander Drive Auto Receivables Trust 2018-1 | 2.320% | 8/16/21 | 170 | 169 |
| 7,12 | Santander Retail Auto Lease Trust 2017-A | 2.370% | 1/20/22 | 2,520 | 2,485 |
| 7,12 | Santander Retail Auto Lease Trust 2018-A | 2.930% | 5/20/21 | 17,750 | 17,682 |
| 7,12 | Santander Retail Auto Lease Trust 2018-A | 3.060% | 4/20/22 | 6,220 | 6,182 |
57
| | | | | |
| Institutional Intermediate-Term Bond Fund | | | | |
| |
| |
| |
| | | | | Face | Market |
| | | | Maturity | Amount | Value • |
| | | Coupon | Date | ($000) | ($000) |
| 7,12 | Securitized Term Auto Receivables Trust | | | | |
| | 2016-1A | 1.524% | 3/25/20 | 2,018 | 2,010 |
| 7,12 | Securitized Term Auto Receivables Trust | | | | |
| | 2016-1A | 1.794% | 2/25/21 | 3,980 | 3,931 |
| 7,12 | Securitized Term Auto Receivables Trust | | | | |
| | 2017-1A | 1.890% | 8/25/20 | 12,035 | 11,981 |
| 7,12 | Securitized Term Auto Receivables Trust | | | | |
| | 2017-1A | 2.209% | 6/25/21 | 4,600 | 4,547 |
| 7,12 | Securitized Term Auto Receivables Trust | | | | |
| | 2017-2A | 2.040% | 4/26/21 | 11,190 | 11,034 |
| 7,12 | Securitized Term Auto Receivables Trust | | | | |
| | 2017-2A | 2.289% | 3/25/22 | 3,750 | 3,652 |
| 7,12 | Securitized Term Auto Receivables Trust | | | | |
| | 2018-1A | 3.068% | 1/25/22 | 8,690 | 8,626 |
| 7,12 | Securitized Term Auto Receivables Trust | | | | |
| | 2018-1A | 3.298% | 11/25/22 | 3,100 | 3,070 |
| 7 | SMART ABS Series 2016-2US Trust | 2.050% | 12/14/22 | 910 | 884 |
| 7,12 | SMB Private Education Loan Trust 2016-A | 2.700% | 5/15/31 | 325 | 318 |
| 7,11,12 SMB Private Education Loan Trust 2016-B | 3.608% | 2/17/32 | 242 | 248 |
| 7,11,12 SMB Private Education Loan Trust 2016-C | 3.258% | 9/15/34 | 400 | 405 |
| 7,11,12 SMB Private Education Loan Trust 2017-A | 3.058% | 9/15/34 | 450 | 453 |
| 7,12 | SMB Private Education Loan Trust 2017-B | 2.820% | 10/15/35 | 520 | 504 |
| 7,12 | SMB Private Education Loan Trust 2018-A | 3.500% | 2/15/36 | 1,890 | 1,874 |
| 7,12 | SMB Private Education Loan Trust 2018-B | 3.600% | 1/15/37 | 840 | 838 |
| 7,12 | SMB Private Education Loan Trust 2018-C | 3.630% | 11/15/35 | 1,390 | 1,389 |
| 7,12 | SoFi Professional Loan Program 2017-A LLC | 2.400% | 3/26/40 | 90 | 87 |
| 7,12 | SoFi Professional Loan Program 2017-B LLC | 2.740% | 5/25/40 | 440 | 432 |
| 7,12 | SoFi Professional Loan Program 2017-D LLC | 2.650% | 9/25/40 | 340 | 329 |
| 7,12 | SoFi Professional Loan Program 2017-E LLC | 1.860% | 11/26/40 | 684 | 674 |
| 7,12 | SoFi Professional Loan Program 2017-E LLC | 2.720% | 11/26/40 | 250 | 242 |
| 7,12 | SoFi Professional Loan Program 2017-F LLC | 2.050% | 1/25/41 | 780 | 772 |
| 7,12 | SoFi Professional Loan Program 2017-F LLC | 2.840% | 1/25/41 | 390 | 378 |
| 7,12 | SoFi Professional Loan Program 2018-A LLC | 2.390% | 2/25/42 | 258 | 256 |
| 7,12 | SoFi Professional Loan Program 2018-A LLC | 2.950% | 2/25/42 | 130 | 126 |
| 7,12 | SoFi Professional Loan Program 2018-B LLC | 3.340% | 8/25/47 | 1,070 | 1,059 |
| 7,12 | SoFi Professional Loan Program 2018-C LLC | 3.590% | 1/25/48 | 1,850 | 1,846 |
| 7,12 | SoFi Professional Loan Program 2018-D LLC | 3.600% | 2/25/48 | 1,100 | 1,096 |
| 7 | Synchrony Card Issuance Trust 2018-A1 | 3.380% | 9/15/24 | 10,630 | 10,636 |
| 7 | Synchrony Credit Card Master Note Trust | | | | |
| | 2015-1 | 2.370% | 3/15/23 | 3,355 | 3,321 |
| 7 | Synchrony Credit Card Master Note Trust | | | | |
| | 2015-4 | 2.380% | 9/15/23 | 7,153 | 7,038 |
| 7 | Synchrony Credit Card Master Note Trust | | | | |
| | 2016-2 | 2.210% | 5/15/24 | 6,820 | 6,635 |
| 7 | Synchrony Credit Card Master Note Trust | | | | |
| | 2016-3 | 1.580% | 9/15/22 | 16,820 | 16,604 |
| 7 | Synchrony Credit Card Master Note Trust | | | | |
| | 2017-2 | 2.620% | 10/15/25 | 10,670 | 10,342 |
| 7 | Synchrony Credit Card Master Note Trust | | | | |
| | Series 2012-2 | 2.220% | 1/15/22 | 1,997 | 1,995 |
| 7,12 | TMSQ 2014-1500 Mortgage Trust | 3.680% | 10/10/36 | 100 | 98 |
| 7 | Toyota Auto Receivables 2016-B Owner Trust | 1.520% | 8/16/21 | 2,470 | 2,437 |
| 7 | Toyota Auto Receivables 2017-D Owner Trust | 2.120% | 2/15/23 | 955 | 930 |
| 7 | Toyota Auto Receivables 2018-A Owner Trust | 2.350% | 5/16/22 | 8,430 | 8,336 |
58
| | | | | |
| Institutional Intermediate-Term Bond Fund | | | | |
| |
| |
| |
| | | | | Face | Market |
| | | | Maturity | Amount | Value • |
| | | Coupon | Date | ($000) | ($000) |
| 7 | Toyota Auto Receivables 2018-A Owner Trust | 2.520% | 5/15/23 | 540 | 530 |
| 7 | Toyota Auto Receivables 2018-B Owner Trust | 3.110% | 11/15/23 | 4,160 | 4,147 |
| 7 | Toyota Auto Receivables 2018-C Owner Trust | 3.020% | 12/15/22 | 23,180 | 23,129 |
| 7 | Toyota Auto Receivables 2018-C Owner Trust | 3.130% | 2/15/24 | 10,070 | 10,035 |
| 7,12 | Trafigura Securitisation Finance plc 2017-1A | 2.470% | 12/15/20 | 1,590 | 1,559 |
| 7,12 | Trafigura Securitisation Finance plc 2018-1A | 3.730% | 3/15/22 | 1,130 | 1,130 |
| 7 | UBS Commercial Mortgage Trust 2012-C1 | 4.171% | 5/10/45 | 273 | 276 |
| 7 | UBS Commercial Mortgage Trust 2017-C7 | 3.679% | 12/15/50 | 1,235 | 1,217 |
| 7,12 | UBS-BAMLL Trust 2012-WRM | 3.663% | 6/10/30 | 4,409 | 4,349 |
| 7 | UBS-Barclays Commercial Mortgage Trust | | | | |
| | 2012-C4 | 2.850% | 12/10/45 | 1,499 | 1,464 |
| 7 | UBS-Barclays Commercial Mortgage Trust | | | | |
| | 2013-C6 | 3.244% | 4/10/46 | 220 | 218 |
| 7 | UBS-Barclays Commercial Mortgage Trust | | | | |
| | 2013-C6 | 3.469% | 4/10/46 | 150 | 148 |
| 7 | USAA Auto Owner Trust 2017-1 | 1.880% | 9/15/22 | 8,440 | 8,290 |
| 7,12 | Verizon Owner Trust 2016-2A | 1.680% | 5/20/21 | 7,160 | 7,109 |
| 7,12 | Verizon Owner Trust 2017-1A | 2.060% | 9/20/21 | 11,000 | 10,893 |
| 7,12 | Verizon Owner Trust 2017-2A | 1.920% | 12/20/21 | 30,260 | 29,860 |
| 7,12 | Verizon Owner Trust 2017-3 | 2.060% | 4/20/22 | 10,080 | 9,923 |
| 7,12 | Verizon Owner Trust 2018-1 | 2.820% | 9/20/22 | 34,730 | 34,495 |
| 7,12 | VNDO 2012-6AVE Mortgage Trust | 2.996% | 11/15/30 | 2,836 | 2,780 |
| 7 | Volkswagen Auto Loan Enhanced Trust 2018-1 | 3.020% | 11/21/22 | 12,330 | 12,301 |
| 7 | Volkswagen Auto Loan Enhanced Trust 2018-1 | 3.150% | 7/22/24 | 5,610 | 5,592 |
| 7,11,12 Volvo Financial Equipment Master Owner | | | | |
| | Trust 2017-A | 2.658% | 11/15/22 | 3,320 | 3,329 |
| 7 | Wells Fargo Commercial Mortgage Trust | | | | |
| | 2012-LC5 | 2.918% | 10/15/45 | 959 | 941 |
| 7 | Wells Fargo Commercial Mortgage Trust | | | | |
| | 2012-LC5 | 3.539% | 10/15/45 | 626 | 620 |
| 7 | Wells Fargo Commercial Mortgage Trust | | | | |
| | 2013-LC12 | 3.928% | 7/15/46 | 455 | 461 |
| 7 | Wells Fargo Commercial Mortgage Trust | | | | |
| | 2013-LC12 | 4.218% | 7/15/46 | 311 | 320 |
| 7 | Wells Fargo Commercial Mortgage Trust | | | | |
| | 2014-LC16 | 3.548% | 8/15/50 | 30 | 30 |
| 7 | Wells Fargo Commercial Mortgage Trust | | | | |
| | 2014-LC16 | 3.817% | 8/15/50 | 10 | 10 |
| 7 | Wells Fargo Commercial Mortgage Trust | | | | |
| | 2014-LC18 | 3.405% | 12/15/47 | 10 | 10 |
| 7 | Wells Fargo Commercial Mortgage Trust | | | | |
| | 2015-C26 | 3.166% | 2/15/48 | 1,565 | 1,520 |
| 7 | Wells Fargo Commercial Mortgage Trust | | | | |
| | 2015-C27 | 3.190% | 2/15/48 | 120 | 118 |
| 7 | Wells Fargo Commercial Mortgage Trust | | | | |
| | 2015-C27 | 3.451% | 2/15/48 | 440 | 434 |
| 7 | Wells Fargo Commercial Mortgage Trust | | | | |
| | 2015-C29 | 3.637% | 6/15/48 | 3,130 | 3,119 |
| 7 | Wells Fargo Commercial Mortgage Trust | | | | |
| | 2015-C30 | 3.664% | 9/15/58 | 2,120 | 2,114 |
| 7 | Wells Fargo Commercial Mortgage Trust | | | | |
| | 2015-LC22 | 3.839% | 9/15/58 | 4,415 | 4,452 |
| 7 | Wells Fargo Commercial Mortgage Trust | | | | |
| | 2015-SG1 | 3.789% | 9/15/48 | 3,480 | 3,492 |
59
| | | | | |
| Institutional Intermediate-Term Bond Fund | | | | |
| |
| |
| |
| | | | | Face | Market |
| | | | Maturity | Amount | Value • |
| | | Coupon | Date | ($000) | ($000) |
| 7 | Wells Fargo Commercial Mortgage Trust | | | | |
| | 2016-C32 | 3.560% | 1/15/59 | 510 | 504 |
| 7 | Wells Fargo Commercial Mortgage Trust | | | | |
| | 2016-C37 | 3.525% | 12/15/49 | 470 | 460 |
| 7 | Wells Fargo Commercial Mortgage Trust | | | | |
| | 2016-C37 | 3.794% | 12/15/49 | 380 | 379 |
| 7 | Wells Fargo Commercial Mortgage Trust | | | | |
| | 2017-C38 | 3.453% | 7/15/50 | 1,285 | 1,251 |
| 7 | Wells Fargo Commercial Mortgage Trust | | | | |
| | 2017-C39 | 3.157% | 9/15/50 | 30 | 28 |
| 7 | Wells Fargo Commercial Mortgage Trust | | | | |
| | 2017-C39 | 3.418% | 9/15/50 | 2,505 | 2,424 |
| 7 | Wells Fargo Commercial Mortgage Trust | | | | |
| | 2017-C40 | 3.581% | 10/15/50 | 3,040 | 2,977 |
| 7 | Wells Fargo Commercial Mortgage Trust | | | | |
| | 2017-C41 | 3.472% | 11/15/50 | 1,790 | 1,736 |
| 7 | Wells Fargo Commercial Mortgage Trust | | | | |
| | 2017-C42 | 3.589% | 12/15/50 | 6,685 | 6,537 |
| 7 | Wells Fargo Commercial Mortgage Trust | | | | |
| | 2017-RC1 | 3.631% | 1/15/60 | 396 | 391 |
| 7 | Wells Fargo Commercial Mortgage Trust | | | | |
| | 2018-C43 | 4.012% | 3/15/51 | 1,800 | 1,816 |
| 7 | Wells Fargo Commercial Mortgage Trust | | | | |
| | 2018-C46 | 4.152% | 8/15/51 | 2,030 | 2,074 |
| 12 | Westpac Banking Corp. | 2.100% | 2/25/21 | 950 | 924 |
| 7,12 WFRBS Commercial Mortgage Trust 2011-C3 | 4.375% | 3/15/44 | 1,366 | 1,394 |
| 7 | WFRBS Commercial Mortgage Trust 2012-C7 | 3.431% | 6/15/45 | 1,199 | 1,199 |
| 7 | WFRBS Commercial Mortgage Trust 2012-C7 | 4.090% | 6/15/45 | 683 | 691 |
| 7 | WFRBS Commercial Mortgage Trust 2012-C8 | 3.001% | 8/15/45 | 233 | 230 |
| 7 | WFRBS Commercial Mortgage Trust 2012-C9 | 2.870% | 11/15/45 | 2,705 | 2,651 |
| 7 | WFRBS Commercial Mortgage Trust 2012-C9 | 3.388% | 11/15/45 | 633 | 623 |
| 7 | WFRBS Commercial Mortgage Trust 2013-C15 | 3.720% | 8/15/46 | 526 | 531 |
| 7 | WFRBS Commercial Mortgage Trust 2013-C15 | 4.153% | 8/15/46 | 255 | 262 |
| 7 | WFRBS Commercial Mortgage Trust 2013-C17 | 3.558% | 12/15/46 | 180 | 181 |
| 7 | WFRBS Commercial Mortgage Trust 2013-C18 | 3.676% | 12/15/46 | 666 | 672 |
| 7 | WFRBS Commercial Mortgage Trust 2013-C18 | 4.162% | 12/15/46 | 1,665 | 1,712 |
| 7 | WFRBS Commercial Mortgage Trust 2014-C19 | 3.829% | 3/15/47 | 2,540 | 2,554 |
| 7 | WFRBS Commercial Mortgage Trust 2014-C19 | 4.101% | 3/15/47 | 1,215 | 1,247 |
| 7 | WFRBS Commercial Mortgage Trust 2014-C20 | 3.995% | 5/15/47 | 30 | 31 |
| 7 | WFRBS Commercial Mortgage Trust 2014-C21 | 3.410% | 8/15/47 | 20 | 20 |
| 7 | WFRBS Commercial Mortgage Trust 2014-C21 | 3.678% | 8/15/47 | 80 | 80 |
| 7 | WFRBS Commercial Mortgage Trust 2014-C23 | 3.650% | 10/15/57 | 5,500 | 5,482 |
| 7 | WFRBS Commercial Mortgage Trust 2014-C23 | 3.917% | 10/15/57 | 925 | 939 |
| 7 | WFRBS Commercial Mortgage Trust 2014-C24 | 3.607% | 11/15/47 | 3,030 | 3,017 |
| 7 | WFRBS Commercial Mortgage Trust 2014-LC14 | 3.766% | 3/15/47 | 2,570 | 2,580 |
| 7 | WFRBS Commercial Mortgage Trust 2014-LC14 | 4.045% | 3/15/47 | 2,570 | 2,629 |
| 7,12 Wheels SPV 2 LLC 2016-1A | 1.870% | 5/20/25 | 865 | 856 |
| 7 | World Financial Network Credit Card Master | | | | |
| | Note Trust Series 2015-B | 2.550% | 6/17/24 | 1,520 | 1,500 |
| 7 | World Omni Auto Receivables Trust 2014-B | 1.680% | 12/15/20 | 2,853 | 2,848 |
| 7 | World Omni Auto Receivables Trust 2015-B | 1.840% | 1/17/22 | 15,000 | 14,881 |
| 7 | World Omni Auto Receivables Trust 2016-A | 1.770% | 9/15/21 | 1,337 | 1,330 |
| 7 | World Omni Auto Receivables Trust 2016-B | 1.300% | 2/15/22 | 6,479 | 6,402 |
| 7 | World Omni Auto Receivables Trust 2018-A | 2.730% | 2/15/24 | 3,590 | 3,535 |
60
| | | | | |
| Institutional Intermediate-Term Bond Fund | | | | |
| |
| |
| |
| | | | | Face | Market |
| | | | Maturity | Amount | Value • |
| | | Coupon | Date | ($000) | ($000) |
| 7 | World Omni Automobile Lease Securitization | | | | |
| | Trust 2017-A | 2.320% | 8/15/22 | 4,670 | 4,620 |
| 7 | World Omni Automobile Lease Securitization | | | | |
| | Trust 2018-A | 2.830% | 7/15/21 | 22,380 | 22,282 |
| 7 | World Omni Automobile Lease Securitization | | | | |
| | Trust 2018-A | 2.940% | 5/15/23 | 6,720 | 6,676 |
| 7 | World Omni Automobile Lease Securitization | | | | |
| | Trust 2018-B | 3.190% | 12/15/21 | 16,800 | 16,794 |
| 7 | World Omni Automobile Lease Securitization | | | | |
| | Trust 2018-B | 3.300% | 3/15/24 | 3,490 | 3,487 |
| Total Asset-Backed/Commercial Mortgage-Backed Securities (Cost $2,646,771) | | 2,617,237 |
| Corporate Bonds (22.6%) | | | | |
| Finance (14.0%) | | | | |
| | Banking (11.7%) | | | | |
| | American Express Co. | 3.700% | 8/3/23 | 37,405 | 37,246 |
| | American Express Co. | 3.000% | 10/30/24 | 18,265 | 17,445 |
| 12 | ASB Bank Ltd. | 3.750% | 6/14/23 | 10,575 | 10,486 |
| | Australia & New Zealand Banking Group Ltd. | 2.000% | 11/16/18 | 3,880 | 3,878 |
| | Banco Santander SA | 4.379% | 4/12/28 | 2,585 | 2,452 |
| 7 | Bank of America Corp. | 2.369% | 7/21/21 | 3,005 | 2,952 |
| 7 | Bank of America Corp. | 2.328% | 10/1/21 | 9,260 | 9,058 |
| | Bank of America Corp. | 3.004% | 12/20/23 | 25,315 | 24,491 |
| 7 | Bank of America Corp. | 3.550% | 3/5/24 | 142,215 | 140,520 |
| 7 | Bank of America Corp. | 3.366% | 1/23/26 | 35,445 | 34,082 |
| 7 | Bank of America Corp. | 3.824% | 1/20/28 | 28,026 | 27,286 |
| | Bank of New York Mellon Corp. | 4.150% | 2/1/21 | 2,000 | 2,040 |
| | Bank of New York Mellon Corp. | 2.050% | 5/3/21 | 3,685 | 3,572 |
| | Bank of New York Mellon Corp. | 3.450% | 8/11/23 | 17,780 | 17,642 |
| | Bank of New York Mellon Corp. | 3.400% | 5/15/24 | 2,100 | 2,070 |
| | Bank of New York Mellon Corp. | 3.000% | 2/24/25 | 700 | 671 |
| | Bank of Nova Scotia | 2.150% | 7/14/20 | 945 | 929 |
| 12 | Banque Federative du Credit Mutuel SA | 2.750% | 10/15/20 | 8,345 | 8,206 |
| 12 | Banque Federative du Credit Mutuel SA | 2.500% | 4/13/21 | 13,875 | 13,472 |
| 12 | Banque Federative du Credit Mutuel SA | 2.700% | 7/20/22 | 37,330 | 35,906 |
| 12 | Banque Federative du Credit Mutuel SA | 3.750% | 7/20/23 | 48,800 | 48,489 |
| 12 | BNP Paribas SA | 3.375% | 1/9/25 | 18,980 | 17,958 |
| 12 | BNP Paribas SA | 4.400% | 8/14/28 | 16,125 | 15,791 |
| | BPCE SA | 2.500% | 12/10/18 | 8,325 | 8,325 |
| | Canadian Imperial Bank of Commerce | 3.500% | 9/13/23 | 17,320 | 17,225 |
| | Comerica Inc. | 3.700% | 7/31/23 | 26,370 | 26,268 |
| | Commonwealth Bank of Australia | 2.300% | 3/12/20 | 1,500 | 1,478 |
| 12 | Commonwealth Bank of Australia | 5.000% | 3/19/20 | 3,300 | 3,373 |
| | Commonwealth Bank of Australia | 2.400% | 11/2/20 | 3,090 | 3,022 |
| 12 | Commonwealth Bank of Australia | 2.000% | 9/6/21 | 11,329 | 10,859 |
| 12 | Commonwealth Bank of Australia | 2.750% | 3/10/22 | 10,060 | 9,765 |
| 12 | Commonwealth Bank of Australia | 3.450% | 3/16/23 | 1,930 | 1,911 |
| 12 | Commonwealth Bank of Australia | 3.150% | 9/19/27 | 12,000 | 11,166 |
| | Cooperatieve Rabobank UA | 2.250% | 1/14/19 | 2,540 | 2,538 |
| | Cooperatieve Rabobank UA | 2.750% | 1/10/23 | 16,410 | 15,763 |
| 12 | Cooperatieve Rabobank UA | 3.875% | 9/26/23 | 19,200 | 19,147 |
| | Credit Suisse AG | 3.000% | 10/29/21 | 3,000 | 2,956 |
| 12 | Danske Bank A/S | 2.750% | 9/17/20 | 1,155 | 1,135 |
| | Fifth Third Bank | 2.250% | 6/14/21 | 6,133 | 5,951 |
61
| | | | | |
| Institutional Intermediate-Term Bond Fund | | | | |
| |
| |
| |
| | | | | Face | Market |
| | | | Maturity | Amount | Value • |
| | | Coupon | Date | ($000) | ($000) |
| | First Republic Bank | 2.500% | 6/6/22 | 20,500 | 19,684 |
| | Goldman Sachs Group Inc. | 2.550% | 10/23/19 | 13,317 | 13,260 |
| | Goldman Sachs Group Inc. | 2.300% | 12/13/19 | 24,740 | 24,523 |
| | Goldman Sachs Group Inc. | 2.600% | 12/27/20 | 9,715 | 9,559 |
| | Goldman Sachs Group Inc. | 5.750% | 1/24/22 | 11,320 | 12,042 |
| | Goldman Sachs Group Inc. | 3.000% | 4/26/22 | 16,015 | 15,677 |
| 7 | Goldman Sachs Group Inc. | 2.876% | 10/31/22 | 14,170 | 13,818 |
| | Goldman Sachs Group Inc. | 3.625% | 1/22/23 | 295 | 293 |
| 7 | Goldman Sachs Group Inc. | 2.908% | 6/5/23 | 25,190 | 24,359 |
| | Goldman Sachs Group Inc. | 3.850% | 7/8/24 | 2,100 | 2,089 |
| | Goldman Sachs Group Inc. | 3.750% | 5/22/25 | 2,860 | 2,802 |
| 7 | Goldman Sachs Group Inc. | 3.272% | 9/29/25 | 29,755 | 28,435 |
| 7 | Goldman Sachs Group Inc. | 3.691% | 6/5/28 | 14,140 | 13,439 |
| 7 | Goldman Sachs Group Inc. | 3.814% | 4/23/29 | 16,535 | 15,730 |
| | HSBC Bank USA NA | 4.875% | 8/24/20 | 4,336 | 4,435 |
| | HSBC Holdings plc | 5.100% | 4/5/21 | 780 | 810 |
| | HSBC Holdings plc | 2.650% | 1/5/22 | 7,210 | 6,985 |
| | HSBC Holdings plc | 4.875% | 1/14/22 | 2,030 | 2,103 |
| 7 | HSBC Holdings plc | 3.262% | 3/13/23 | 22,350 | 21,878 |
| | HSBC Holdings plc | 3.600% | 5/25/23 | 4,085 | 4,042 |
| 7 | HSBC Holdings plc | 3.033% | 11/22/23 | 17,615 | 17,006 |
| 7 | HSBC Holdings plc | 3.950% | 5/18/24 | 13,115 | 13,017 |
| | HSBC Holdings plc | 4.300% | 3/8/26 | 550 | 546 |
| | HSBC Holdings plc | 4.375% | 11/23/26 | 985 | 967 |
| 7 | HSBC Holdings plc | 4.041% | 3/13/28 | 52,681 | 50,755 |
| 7 | HSBC Holdings plc | 4.583% | 6/19/29 | 50,850 | 50,844 |
| | HSBC USA Inc. | 2.750% | 8/7/20 | 3,623 | 3,591 |
| | Huntington National Bank | 2.375% | 3/10/20 | 8,455 | 8,349 |
| | Huntington National Bank | 2.500% | 8/7/22 | 4,685 | 4,486 |
| | Huntington National Bank | 3.550% | 10/6/23 | 11,465 | 11,322 |
| 12 | ING Bank NV | 2.500% | 10/1/19 | 3,040 | 3,020 |
| | JPMorgan Chase & Co. | 2.250% | 1/23/20 | 18,479 | 18,291 |
| | JPMorgan Chase & Co. | 4.950% | 3/25/20 | 4,385 | 4,494 |
| | JPMorgan Chase & Co. | 2.750% | 6/23/20 | 5,255 | 5,215 |
| | JPMorgan Chase & Co. | 2.550% | 10/29/20 | 21,890 | 21,572 |
| | JPMorgan Chase & Co. | 2.550% | 3/1/21 | 11,356 | 11,149 |
| | JPMorgan Chase & Co. | 4.500% | 1/24/22 | 5,296 | 5,459 |
| | JPMorgan Chase & Co. | 2.972% | 1/15/23 | 27,933 | 27,192 |
| | JPMorgan Chase & Co. | 3.200% | 1/25/23 | 1,955 | 1,923 |
| 7 | JPMorgan Chase & Co. | 2.776% | 4/25/23 | 8,975 | 8,716 |
| | JPMorgan Chase & Co. | 2.700% | 5/18/23 | 6,106 | 5,865 |
| | JPMorgan Chase & Co. | 3.875% | 2/1/24 | 4,000 | 4,027 |
| 7 | JPMorgan Chase & Co. | 3.559% | 4/23/24 | 20,590 | 20,390 |
| | JPMorgan Chase & Co. | 3.625% | 5/13/24 | 6,500 | 6,441 |
| | JPMorgan Chase & Co. | 3.125% | 1/23/25 | 8,856 | 8,459 |
| 7 | JPMorgan Chase & Co. | 3.220% | 3/1/25 | 32,655 | 31,561 |
| | JPMorgan Chase & Co. | 3.900% | 7/15/25 | 14,605 | 14,575 |
| | JPMorgan Chase & Co. | 3.300% | 4/1/26 | 4,090 | 3,918 |
| | JPMorgan Chase & Co. | 3.200% | 6/15/26 | 7,340 | 6,985 |
| 7 | JPMorgan Chase & Co. | 3.782% | 2/1/28 | 18,655 | 18,132 |
| 7 | JPMorgan Chase & Co. | 3.540% | 5/1/28 | 12,890 | 12,279 |
| 7 | JPMorgan Chase & Co. | 3.509% | 1/23/29 | 11,075 | 10,454 |
| 7 | JPMorgan Chase & Co. | 4.005% | 4/23/29 | 12,680 | 12,415 |
| | KeyBank NA | 2.500% | 11/22/21 | 1,860 | 1,807 |
62
| | | | | |
| Institutional Intermediate-Term Bond Fund | | | | |
| |
| |
| |
| | | | | Face | Market |
| | | | Maturity | Amount | Value • |
| | | Coupon | Date | ($000) | ($000) |
| | Lloyds Banking Group plc | 4.450% | 5/8/25 | 15,000 | 14,962 |
| | Manufacturers & Traders Trust Co. | 2.500% | 5/18/22 | 3,890 | 3,750 |
| | Mitsubishi UFJ Financial Group Inc. | 2.950% | 3/1/21 | 24,101 | 23,795 |
| | Mitsubishi UFJ Financial Group Inc. | 2.190% | 9/13/21 | 1,470 | 1,414 |
| | Mitsubishi UFJ Financial Group Inc. | 2.998% | 2/22/22 | 3,115 | 3,043 |
| | Mitsubishi UFJ Financial Group Inc. | 2.665% | 7/25/22 | 17,200 | 16,580 |
| | Mitsubishi UFJ Financial Group Inc. | 3.761% | 7/26/23 | 32,435 | 32,215 |
| | Mitsubishi UFJ Financial Group Inc. | 2.527% | 9/13/23 | 1,025 | 961 |
| | Mitsubishi UFJ Financial Group Inc. | 3.777% | 3/2/25 | 8,860 | 8,756 |
| | Mitsubishi UFJ Financial Group Inc. | 3.677% | 2/22/27 | 5,990 | 5,793 |
| | Mitsubishi UFJ Financial Group Inc. | 4.050% | 9/11/28 | 36,100 | 35,739 |
| 12 | Mitsubishi UFJ Trust & Banking Corp. | 2.650% | 10/19/20 | 12,470 | 12,274 |
| | Morgan Stanley | 5.750% | 1/25/21 | 7,650 | 8,038 |
| | Morgan Stanley | 2.625% | 11/17/21 | 40,688 | 39,559 |
| | Morgan Stanley | 2.750% | 5/19/22 | 8,140 | 7,891 |
| | Morgan Stanley | 3.125% | 1/23/23 | 16,800 | 16,369 |
| | Morgan Stanley | 3.875% | 4/29/24 | 4,030 | 4,012 |
| 13 | Morgan Stanley | 3.563% | 5/8/24 | 7,555 | 7,685 |
| | Morgan Stanley | 3.700% | 10/23/24 | 6,138 | 6,048 |
| | Morgan Stanley | 4.000% | 7/23/25 | 1,355 | 1,344 |
| | Morgan Stanley | 3.875% | 1/27/26 | 2,020 | 1,983 |
| | Morgan Stanley | 3.625% | 1/20/27 | 8,470 | 8,106 |
| 7 | Morgan Stanley | 3.591% | 7/22/28 | 19,180 | 18,159 |
| | MUFG Americas Holdings Corp. | 3.500% | 6/18/22 | 7,000 | 6,962 |
| | MUFG Americas Holdings Corp. | 3.000% | 2/10/25 | 2,000 | 1,899 |
| 12 | MUFG Bank Ltd. | 2.300% | 3/5/20 | 715 | 704 |
| 12 | MUFG Bank Ltd. | 2.750% | 9/14/20 | 8,500 | 8,330 |
| 12 | MUFG Bank Ltd. | 2.850% | 9/8/21 | 3,010 | 2,945 |
| 12 | Nordea Bank AB | 3.750% | 8/30/23 | 8,700 | 8,607 |
| | PNC Bank NA | 2.600% | 7/21/20 | 5,735 | 5,672 |
| | PNC Bank NA | 2.150% | 4/29/21 | 2,294 | 2,228 |
| | PNC Bank NA | 2.550% | 12/9/21 | 5,135 | 5,003 |
| | PNC Bank NA | 2.625% | 2/17/22 | 3,980 | 3,874 |
| | PNC Bank NA | 2.950% | 2/23/25 | 5,360 | 5,114 |
| | PNC Bank NA | 3.250% | 6/1/25 | 27 | 26 |
| | PNC Financial Services Group Inc. | 2.854% | 11/9/22 | 1,335 | 1,292 |
| | PNC Funding Corp. | 5.125% | 2/8/20 | 3,840 | 3,939 |
| | Santander UK plc | 3.400% | 6/1/21 | 51,000 | 50,802 |
| | Sumitomo Mitsui Financial Group Inc. | 2.784% | 7/12/22 | 8,570 | 8,288 |
| | Sumitomo Mitsui Financial Group Inc. | 2.778% | 10/18/22 | 6,840 | 6,571 |
| | Sumitomo Mitsui Financial Group Inc. | 3.748% | 7/19/23 | 9,975 | 9,925 |
| 12 | Swedbank AB | 2.375% | 2/27/19 | 4,200 | 4,200 |
| 12 | Swedbank AB | 2.800% | 3/14/22 | 8,215 | 7,997 |
| | Toronto-Dominion Bank | 3.500% | 7/19/23 | 32,065 | 32,058 |
| | UBS AG | 2.350% | 3/26/20 | 700 | 690 |
| 12 | UBS Group Funding Jersey Ltd. | 3.000% | 4/15/21 | 5,470 | 5,379 |
| 12 | UBS Group Funding Jersey Ltd. | 2.650% | 2/1/22 | 24,139 | 23,280 |
| 12 | UBS Group Funding Switzerland AG | 3.491% | 5/23/23 | 2,060 | 2,019 |
| 7,12 UBS Group Funding Switzerland AG | 2.859% | 8/15/23 | 26,640 | 25,463 |
| | US Bancorp | 2.350% | 1/29/21 | 750 | 736 |
| | US Bancorp | 3.700% | 1/30/24 | 1,735 | 1,745 |
| | Wells Fargo & Co. | 3.000% | 1/22/21 | 2,240 | 2,222 |
| | Wells Fargo & Co. | 2.625% | 7/22/22 | 19,530 | 18,848 |
| | Wells Fargo & Co. | 3.450% | 2/13/23 | 8,300 | 8,127 |
63
| | | | | |
| Institutional Intermediate-Term Bond Fund | | | | |
| |
| |
| |
| | | | | Face | Market |
| | | | Maturity | Amount | Value • |
| | | Coupon | Date | ($000) | ($000) |
| | Wells Fargo & Co. | 3.300% | 9/9/24 | 8,943 | 8,649 |
| | Wells Fargo & Co. | 3.000% | 2/19/25 | 8,170 | 7,739 |
| | Wells Fargo Bank NA | 3.550% | 8/14/23 | 40,290 | 40,048 |
| | Westpac Banking Corp. | 2.300% | 5/26/20 | 265 | 261 |
| | Westpac Banking Corp. | 2.100% | 5/13/21 | 4,820 | 4,664 |
| | Westpac Banking Corp. | 2.000% | 8/19/21 | 7,665 | 7,356 |
| | Westpac Banking Corp. | 2.750% | 1/11/23 | 21,690 | 20,935 |
| | Westpac Banking Corp. | 3.350% | 3/8/27 | 18,935 | 18,004 |
| |
| | Brokerage (0.1%) | | | | |
| | Charles Schwab Corp. | 3.850% | 5/21/25 | 10,810 | 10,889 |
| | Invesco Finance plc | 3.125% | 11/30/22 | 5,203 | 5,099 |
| | Invesco Finance plc | 4.000% | 1/30/24 | 4,000 | 4,008 |
| | Invesco Finance plc | 3.750% | 1/15/26 | 3,427 | 3,355 |
| | TD Ameritrade Holding Corp. | 3.625% | 4/1/25 | 3,670 | 3,608 |
| |
| | Finance Companies (0.5%) | | | | |
| | GE Capital International Funding Co. | | | | |
| | Unlimited Co. | 2.342% | 11/15/20 | 27,211 | 26,527 |
| | GE Capital International Funding Co. | | | | |
| | Unlimited Co. | 3.373% | 11/15/25 | 55,037 | 52,378 |
| |
| | Insurance (1.3%) | | | | |
| | Aetna Inc. | 2.750% | 11/15/22 | 1,700 | 1,637 |
| | Aetna Inc. | 2.800% | 6/15/23 | 2,345 | 2,247 |
| 12 | AIA Group Ltd. | 3.200% | 3/11/25 | 17,405 | 16,551 |
| 12 | AIG Global Funding | 2.700% | 12/15/21 | 2,625 | 2,549 |
| | Berkshire Hathaway Inc. | 2.750% | 3/15/23 | 17,376 | 16,916 |
| | Berkshire Hathaway Inc. | 3.125% | 3/15/26 | 5,117 | 4,922 |
| | Chubb INA Holdings Inc. | 2.700% | 3/13/23 | 2,940 | 2,836 |
| | Chubb INA Holdings Inc. | 3.350% | 5/15/24 | 4,390 | 4,310 |
| | Chubb INA Holdings Inc. | 3.150% | 3/15/25 | 1,264 | 1,222 |
| | Chubb INA Holdings Inc. | 3.350% | 5/3/26 | 6,530 | 6,345 |
| | Manulife Financial Corp. | 4.900% | 9/17/20 | 7,455 | 7,677 |
| | Marsh & McLennan Cos. Inc. | 4.800% | 7/15/21 | 5,500 | 5,663 |
| | Marsh & McLennan Cos. Inc. | 2.750% | 1/30/22 | 11,000 | 10,693 |
| | Marsh & McLennan Cos. Inc. | 3.500% | 6/3/24 | 2,370 | 2,322 |
| | Marsh & McLennan Cos. Inc. | 3.500% | 3/10/25 | 13,865 | 13,479 |
| 12 | MassMutual Global Funding II | 2.750% | 6/22/24 | 14,920 | 14,147 |
| 12 | Metropolitan Life Global Funding I | 3.000% | 1/10/23 | 9,594 | 9,351 |
| 12 | Metropolitan Life Global Funding I | 3.450% | 12/18/26 | 8,725 | 8,467 |
| 12 | Metropolitan Life Global Funding I | 3.000% | 9/19/27 | 17,995 | 16,723 |
| 12 | New York Life Global Funding | 2.900% | 1/17/24 | 4,620 | 4,456 |
| 12 | New York Life Global Funding | 3.000% | 1/10/28 | 25,140 | 23,610 |
| | PartnerRe Finance B LLC | 5.500% | 6/1/20 | 1,940 | 1,995 |
| 12 | Pricoa Global Funding I | 2.550% | 11/24/20 | 2,435 | 2,392 |
| 12 | Pricoa Global Funding I | 2.450% | 9/21/22 | 4,300 | 4,121 |
| 12 | Reliance Standard Life Global Funding II | 3.050% | 1/20/21 | 1,430 | 1,410 |
| 12 | Swiss Re Treasury US Corp. | 2.875% | 12/6/22 | 7,330 | 7,052 |
| | UnitedHealth Group Inc. | 2.875% | 3/15/23 | 3,000 | 2,921 |
| | UnitedHealth Group Inc. | 3.750% | 7/15/25 | 5,915 | 5,924 |
| | UnitedHealth Group Inc. | 3.450% | 1/15/27 | 7,500 | 7,345 |
| |
| | Real Estate Investment Trusts (0.4%) | | | | |
| | AvalonBay Communities Inc. | 3.350% | 5/15/27 | 2,960 | 2,839 |
| | AvalonBay Communities Inc. | 3.200% | 1/15/28 | 2,250 | 2,143 |
64
| | | | | |
| Institutional Intermediate-Term Bond Fund | | | | |
| |
| |
| |
| | | | | Face | Market |
| | | | Maturity | Amount | Value • |
| | | Coupon | Date | ($000) | ($000) |
| | Camden Property Trust | 4.875% | 6/15/23 | 435 | 453 |
| | Camden Property Trust | 4.250% | 1/15/24 | 1,738 | 1,757 |
| | Camden Property Trust | 3.500% | 9/15/24 | 435 | 421 |
| | Federal Realty Investment Trust | 3.000% | 8/1/22 | 2,575 | 2,513 |
| | Federal Realty Investment Trust | 2.750% | 6/1/23 | 5,330 | 5,089 |
| | Federal Realty Investment Trust | 3.250% | 7/15/27 | 6,335 | 5,926 |
| 12 | Scentre Group Trust 1 / Scentre Group Trust 2 | 3.750% | 3/23/27 | 6,810 | 6,512 |
| | Simon Property Group LP | 4.375% | 3/1/21 | 4,750 | 4,863 |
| | Simon Property Group LP | 3.500% | 9/1/25 | 1,003 | 976 |
| | Simon Property Group LP | 3.375% | 12/1/27 | 11,855 | 11,296 |
| 12 | WEA Finance LLC | 4.125% | 9/20/28 | 20,070 | 19,894 |
| | | | | | 2,309,615 |
| Industrial (7.9%) | | | | |
| | Basic Industry (0.6%) | | | | |
| 12 | Air Liquide Finance SA | 1.750% | 9/27/21 | 18,481 | 17,624 |
| 12 | Air Liquide Finance SA | 2.250% | 9/27/23 | 14,180 | 13,324 |
| | Airgas Inc. | 2.900% | 11/15/22 | 2,575 | 2,507 |
| 12 | Chevron Phillips Chemical Co. LLC / Chevron | | | | |
| | Phillips Chemical Co. LP | 3.400% | 12/1/26 | 9,820 | 9,503 |
| 12 | Chevron Phillips Chemical Co. LLC / Chevron | | | | |
| | Phillips Chemical Co. LP | 3.700% | 6/1/28 | 21,765 | 21,514 |
| | EI du Pont de Nemours & Co. | 2.200% | 5/1/20 | 37,385 | 36,885 |
| |
| | Capital Goods (1.0%) | | | | |
| | Caterpillar Financial Services Corp. | 2.850% | 6/1/22 | 7,100 | 6,979 |
| | Caterpillar Financial Services Corp. | 2.400% | 6/6/22 | 13,610 | 13,195 |
| | Caterpillar Financial Services Corp. | 3.750% | 11/24/23 | 6,005 | 6,079 |
| | Caterpillar Inc. | 3.900% | 5/27/21 | 1,613 | 1,641 |
| | Caterpillar Inc. | 2.600% | 6/26/22 | 1,755 | 1,709 |
| | Deere & Co. | 2.600% | 6/8/22 | 5,825 | 5,681 |
| | General Dynamics Corp. | 2.625% | 11/15/27 | 13,665 | 12,523 |
| | General Dynamics Corp. | 3.750% | 5/15/28 | 14,340 | 14,393 |
| | General Electric Co. | 5.500% | 1/8/20 | 5,000 | 5,131 |
| | General Electric Co. | 4.625% | 1/7/21 | 29,656 | 30,549 |
| | General Electric Co. | 3.150% | 9/7/22 | 26,095 | 25,747 |
| | Illinois Tool Works Inc. | 2.650% | 11/15/26 | 12,675 | 11,712 |
| | John Deere Capital Corp. | 2.750% | 3/15/22 | 5,830 | 5,719 |
| | John Deere Capital Corp. | 2.650% | 6/24/24 | 10,000 | 9,510 |
| | Parker-Hannifin Corp. | 3.500% | 9/15/22 | 1,885 | 1,885 |
| 12 | Siemens Financieringsmaatschappij NV | 2.700% | 3/16/22 | 12,300 | 11,972 |
| |
| | Communication (0.8%) | | | | |
| | America Movil SAB de CV | 5.000% | 10/16/19 | 13,000 | 13,197 |
| | America Movil SAB de CV | 5.000% | 3/30/20 | 7,725 | 7,897 |
| | America Movil SAB de CV | 3.125% | 7/16/22 | 1,160 | 1,136 |
| | Comcast Cable Communications Holdings Inc. | 9.455% | 11/15/22 | 1,700 | 2,069 |
| | Comcast Corp. | 5.150% | 3/1/20 | 4,425 | 4,550 |
| | Comcast Corp. | 1.625% | 1/15/22 | 3,830 | 3,614 |
| | Comcast Corp. | 3.600% | 3/1/24 | 9,390 | 9,278 |
| | Comcast Corp. | 3.375% | 2/15/25 | 29,805 | 28,743 |
| | Comcast Corp. | 3.375% | 8/15/25 | 23,444 | 22,634 |
| | NBCUniversal Media LLC | 5.150% | 4/30/20 | 9,000 | 9,276 |
| | NBCUniversal Media LLC | 2.875% | 1/15/23 | 27,000 | 26,180 |
65
| | | | | |
| Institutional Intermediate-Term Bond Fund | | | | |
| |
| |
| |
| | | | | Face | Market |
| | | | Maturity | Amount | Value • |
| | | Coupon | Date | ($000) | ($000) |
| | Consumer Cyclical (1.3%) | | | | |
| | American Honda Finance Corp. | 2.250% | 8/15/19 | 7,340 | 7,306 |
| | American Honda Finance Corp. | 2.450% | 9/24/20 | 2,375 | 2,348 |
| 12 | BMW US Capital LLC | 3.400% | 8/13/21 | 14,100 | 14,072 |
| 12 | BMW US Capital LLC | 3.450% | 4/12/23 | 22,000 | 21,776 |
| 12 | BMW US Capital LLC | 3.750% | 4/12/28 | 19,000 | 18,680 |
| | Costco Wholesale Corp. | 2.750% | 5/18/24 | 3,380 | 3,269 |
| | Costco Wholesale Corp. | 3.000% | 5/18/27 | 4,225 | 4,010 |
| 12 | Harley-Davidson Financial Services Inc. | 2.250% | 1/15/19 | 7,945 | 7,933 |
| 12 | Harley-Davidson Financial Services Inc. | 2.400% | 9/15/19 | 1,655 | 1,645 |
| 12 | Harley-Davidson Financial Services Inc. | 2.150% | 2/26/20 | 1,219 | 1,198 |
| 12 | Harley-Davidson Financial Services Inc. | 2.400% | 6/15/20 | 5,000 | 4,902 |
| 12 | Harley-Davidson Financial Services Inc. | 3.350% | 2/15/23 | 10,000 | 9,716 |
| | Harley-Davidson Inc. | 3.500% | 7/28/25 | 8,000 | 7,655 |
| | Lowe’s Cos. Inc. | 4.625% | 4/15/20 | 2,380 | 2,417 |
| | Lowe’s Cos. Inc. | 3.120% | 4/15/22 | 5,005 | 4,973 |
| | Lowe’s Cos. Inc. | 3.375% | 9/15/25 | 1,370 | 1,348 |
| | Lowe’s Cos. Inc. | 2.500% | 4/15/26 | 23,025 | 21,145 |
| | Lowe’s Cos. Inc. | 3.100% | 5/3/27 | 4,420 | 4,206 |
| 12 | Nissan Motor Acceptance Corp. | 2.550% | 3/8/21 | 6,215 | 6,075 |
| 12 | Nissan Motor Acceptance Corp. | 2.600% | 9/28/22 | 2,825 | 2,703 |
| 12 | Nissan Motor Acceptance Corp. | 3.875% | 9/21/23 | 15,000 | 15,006 |
| | TJX Cos. Inc. | 2.500% | 5/15/23 | 1,100 | 1,054 |
| | TJX Cos. Inc. | 2.250% | 9/15/26 | 23,870 | 21,560 |
| | Visa Inc. | 3.150% | 12/14/25 | 24,040 | 23,280 |
| | Walmart Inc. | 2.350% | 12/15/22 | 4,165 | 4,023 |
| | Walmart Inc. | 2.650% | 12/15/24 | 5,250 | 5,013 |
| |
| | Consumer Noncyclical (1.1%) | | | | |
| | Anheuser-Busch InBev Finance Inc. | 2.625% | 1/17/23 | 5,660 | 5,439 |
| | Anheuser-Busch InBev Finance Inc. | 3.300% | 2/1/23 | 5,165 | 5,100 |
| | Anheuser-Busch InBev Finance Inc. | 3.650% | 2/1/26 | 30,160 | 29,300 |
| | Coca-Cola Femsa SAB de CV | 2.375% | 11/26/18 | 1,455 | 1,451 |
| | Coca-Cola Femsa SAB de CV | 3.875% | 11/26/23 | 1,500 | 1,496 |
| | Covidien International Finance SA | 4.200% | 6/15/20 | 4,126 | 4,197 |
| | Gilead Sciences Inc. | 4.500% | 4/1/21 | 3,000 | 3,082 |
| | Gilead Sciences Inc. | 3.700% | 4/1/24 | 30,110 | 30,190 |
| | Gilead Sciences Inc. | 3.500% | 2/1/25 | 27,725 | 27,223 |
| | Gilead Sciences Inc. | 3.650% | 3/1/26 | 7,300 | 7,168 |
| | Kaiser Foundation Hospitals | 3.500% | 4/1/22 | 1,235 | 1,236 |
| | Kaiser Foundation Hospitals | 3.150% | 5/1/27 | 965 | 922 |
| | Kimberly-Clark Corp. | 3.625% | 8/1/20 | 700 | 707 |
| | Medtronic Inc. | 3.150% | 3/15/22 | 3,355 | 3,334 |
| | Medtronic Inc. | 3.625% | 3/15/24 | 2,075 | 2,085 |
| | Medtronic Inc. | 3.500% | 3/15/25 | 33,905 | 33,626 |
| | Providence St. Joseph Health Obligated Group | 2.746% | 10/1/26 | 300 | 276 |
| 12 | Roche Holdings Inc. | 3.350% | 9/30/24 | 8,200 | 8,114 |
| | SSM Health Care Corp. | 3.688% | 6/1/23 | 13,650 | 13,593 |
| |
| | Energy (1.7%) | | | | |
| | Baker Hughes a GE Co. LLC / Baker Hughes | | | | |
| | Co-Obligor Inc. | 3.337% | 12/15/27 | 36,860 | 34,549 |
| | BP Capital Markets America Inc. | 3.796% | 9/21/25 | 8,000 | 8,015 |
| | BP Capital Markets plc | 4.750% | 3/10/19 | 8,500 | 8,579 |
| | BP Capital Markets plc | 4.500% | 10/1/20 | 4,500 | 4,612 |
66
| | | | |
| Institutional Intermediate-Term Bond Fund | | | | |
| |
| |
| |
| | | | Face | Market |
| | | Maturity | Amount | Value • |
| | Coupon | Date | ($000) | ($000) |
| BP Capital Markets plc | 3.561% | 11/1/21 | 2,387 | 2,400 |
| BP Capital Markets plc | 3.245% | 5/6/22 | 10,875 | 10,790 |
| BP Capital Markets plc | 2.500% | 11/6/22 | 3,500 | 3,381 |
| BP Capital Markets plc | 2.750% | 5/10/23 | 11,575 | 11,182 |
| BP Capital Markets plc | 3.994% | 9/26/23 | 1,000 | 1,018 |
| BP Capital Markets plc | 3.814% | 2/10/24 | 35,250 | 35,590 |
| BP Capital Markets plc | 3.224% | 4/14/24 | 8,400 | 8,228 |
| BP Capital Markets plc | 3.535% | 11/4/24 | 8,740 | 8,660 |
| BP Capital Markets plc | 3.506% | 3/17/25 | 8,000 | 7,887 |
| BP Capital Markets plc | 3.119% | 5/4/26 | 19,465 | 18,533 |
| ConocoPhillips Co. | 4.950% | 3/15/26 | 24,750 | 26,709 |
| Shell International Finance BV | 4.300% | 9/22/19 | 1,575 | 1,597 |
| Shell International Finance BV | 4.375% | 3/25/20 | 2,050 | 2,089 |
| Shell International Finance BV | 3.250% | 5/11/25 | 23,255 | 22,788 |
| Shell International Finance BV | 2.875% | 5/10/26 | 7,445 | 7,068 |
| Total Capital International SA | 2.875% | 2/17/22 | 4,500 | 4,430 |
| Total Capital SA | 4.450% | 6/24/20 | 9,160 | 9,365 |
| Total Capital SA | 4.125% | 1/28/21 | 895 | 913 |
| TransCanada PipeLines Ltd. | 2.500% | 8/1/22 | 1,375 | 1,317 |
| TransCanada PipeLines Ltd. | 3.750% | 10/16/23 | 700 | 699 |
| TransCanada PipeLines Ltd. | 4.875% | 1/15/26 | 21,348 | 22,197 |
| TransCanada PipeLines Ltd. | 4.250% | 5/15/28 | 18,599 | 18,621 |
| |
| Technology (1.1%) | | | | |
| Apple Inc. | 3.000% | 2/9/24 | 11,675 | 11,439 |
| Apple Inc. | 3.450% | 5/6/24 | 6,000 | 5,998 |
| Apple Inc. | 2.850% | 5/11/24 | 12,195 | 11,809 |
| Apple Inc. | 2.750% | 1/13/25 | 10,240 | 9,814 |
| Apple Inc. | 2.500% | 2/9/25 | 5,930 | 5,590 |
| Apple Inc. | 3.200% | 5/13/25 | 1,430 | 1,400 |
| Apple Inc. | 3.250% | 2/23/26 | 13,092 | 12,785 |
| Apple Inc. | 2.450% | 8/4/26 | 3,245 | 2,987 |
| Apple Inc. | 3.350% | 2/9/27 | 8,158 | 7,964 |
| Microsoft Corp. | 2.875% | 2/6/24 | 19,090 | 18,662 |
| Microsoft Corp. | 2.700% | 2/12/25 | 1,175 | 1,125 |
| Microsoft Corp. | 3.125% | 11/3/25 | 3,365 | 3,286 |
| Microsoft Corp. | 2.400% | 8/8/26 | 15,595 | 14,351 |
| Oracle Corp. | 2.500% | 5/15/22 | 9,010 | 8,764 |
| Oracle Corp. | 3.400% | 7/8/24 | 10,000 | 9,934 |
| Oracle Corp. | 2.950% | 11/15/24 | 21,704 | 20,916 |
| Oracle Corp. | 2.950% | 5/15/25 | 5,140 | 4,929 |
| QUALCOMM Inc. | 2.600% | 1/30/23 | 4,815 | 4,624 |
| QUALCOMM Inc. | 2.900% | 5/20/24 | 27,920 | 26,661 |
| |
| Transportation (0.3%) | | | | |
| 7 Continental Airlines 2012-2 Class A Pass | | | | |
| Through Trust | 4.000% | 4/29/26 | 433 | 433 |
| 7 CSX Transportation Inc. | 6.251% | 1/15/23 | 1,188 | 1,282 |
| 7 Delta Air Lines 2007-1 Class A Pass Through | | | | |
| Trust | 6.821% | 2/10/24 | 4,699 | 5,108 |
| 7 Northwest Airlines 2007-1 Class A Pass | | | | |
| Through Trust | 7.027% | 5/1/21 | 3,314 | 3,421 |
| 7 Southwest Airlines Co. 2007-1 Pass Through | | | | |
| Trust | 6.150% | 2/1/24 | 3,316 | 3,485 |
67
| | | | | |
| Institutional Intermediate-Term Bond Fund | | | | |
| |
| |
| |
| | | | | Face | Market |
| | | | Maturity | Amount | Value • |
| | | Coupon | Date | ($000) | ($000) |
| 7 | Spirit Airlines Class A Pass Through | | | | |
| | Certificates Series 2015-1 | 4.100% | 10/1/29 | 18,091 | 17,873 |
| 7 | Spirit Airlines Pass Through Trust 2017-1A | 3.650% | 2/15/30 | 15,042 | 14,320 |
| 7 | United Airlines 2013-1 Class A Pass Through | | | | |
| | Trust | 4.300% | 2/15/27 | 1,232 | 1,247 |
| | | | | | 1,301,632 |
| Utilities (0.7%) | | | | |
| | Electric (0.7%) | | | | |
| | AEP Transmission Co. LLC | 3.100% | 12/1/26 | 1,735 | 1,649 |
| | Ameren Illinois Co. | 2.700% | 9/1/22 | 2,047 | 1,990 |
| | Baltimore Gas & Electric Co. | 2.800% | 8/15/22 | 950 | 924 |
| | Berkshire Hathaway Energy Co. | 2.800% | 1/15/23 | 4,455 | 4,325 |
| | Berkshire Hathaway Energy Co. | 3.750% | 11/15/23 | 16,200 | 16,277 |
| | Berkshire Hathaway Energy Co. | 3.250% | 4/15/28 | 8,975 | 8,484 |
| | Commonwealth Edison Co. | 3.400% | 9/1/21 | 9,800 | 9,821 |
| | Commonwealth Edison Co. | 2.550% | 6/15/26 | 880 | 806 |
| | Connecticut Light & Power Co. | 5.500% | 2/1/19 | 2,125 | 2,142 |
| | Duke Energy Florida LLC | 4.550% | 4/1/20 | 1,375 | 1,401 |
| | Duke Energy Florida LLC | 3.800% | 7/15/28 | 725 | 723 |
| | Entergy Arkansas Inc. | 3.700% | 6/1/24 | 1,603 | 1,606 |
| | Entergy Arkansas Inc. | 3.500% | 4/1/26 | 10,288 | 10,112 |
| | Entergy Louisiana LLC | 3.300% | 12/1/22 | 1,450 | 1,429 |
| | Entergy Louisiana LLC | 2.400% | 10/1/26 | 5,560 | 5,015 |
| | Entergy Louisiana LLC | 3.120% | 9/1/27 | 9,585 | 9,031 |
| | Georgia Power Co. | 2.400% | 4/1/21 | 9,510 | 9,250 |
| | Georgia Power Co. | 2.850% | 5/15/22 | 2,820 | 2,746 |
| | PacifiCorp | 5.500% | 1/15/19 | 3,000 | 3,023 |
| | Southern California Edison Co. | 3.650% | 3/1/28 | 10,620 | 10,344 |
| | Southwestern Public Service Co. | 3.300% | 6/15/24 | 14,881 | 14,595 |
| | Virginia Electric & Power Co. | 2.950% | 1/15/22 | 8,540 | 8,420 |
| | Virginia Electric & Power Co. | 2.750% | 3/15/23 | 2,515 | 2,436 |
| | | | | | 126,549 |
| Total Corporate Bonds (Cost $3,817,124) | | | | 3,737,796 |
| Sovereign Bonds (10.1%) | | | | |
| | Asian Development Bank | 1.750% | 1/10/20 | 10,000 | 9,862 |
| 12 | Avi Funding Co. Ltd. | 2.850% | 9/16/20 | 10,950 | 10,781 |
| 12 | BNG Bank NV | 1.500% | 2/15/19 | 20,500 | 20,400 |
| 12 | BNG Bank NV | 2.500% | 2/28/20 | 30,000 | 29,810 |
| 12 | BNG Bank NV | 2.125% | 12/14/20 | 13,001 | 12,757 |
| | Bermuda | 4.854% | 2/6/24 | 12,685 | 13,189 |
| 12 | Bermuda | 4.854% | 2/6/24 | 3,000 | 3,131 |
| | CDP Financial Inc. | 4.400% | 11/25/19 | 12,455 | 12,658 |
| 12 | CDP Financial Inc. | 4.400% | 11/25/19 | 30,475 | 30,961 |
| 12 | CDP Financial Inc. | 3.150% | 7/24/24 | 1,519 | 1,496 |
| | CNOOC Finance 2015 Australia Pty Ltd. | 2.625% | 5/5/20 | 2,294 | 2,265 |
| | CNOOC Finance 2015 USA LLC | 4.375% | 5/2/28 | 8,000 | 8,032 |
| | CNOOC Nexen Finance 2014 ULC | 4.250% | 4/30/24 | 9,000 | 9,078 |
| 12 | CNPC General Capital Ltd. | 3.400% | 4/16/23 | 1,000 | 976 |
| 12 | Corp Nacional del Cobre de Chile | 4.500% | 9/16/25 | 5,900 | 5,990 |
| | Corp. Andina de Fomento | 2.000% | 5/10/19 | 1,080 | 1,073 |
| | Corp. Andina de Fomento | 2.200% | 7/18/20 | 5,734 | 5,612 |
| | Corp. Andina de Fomento | 2.125% | 9/27/21 | 2,000 | 1,925 |
| | Corp. Andina de Fomento | 4.375% | 6/15/22 | 7,611 | 7,798 |
68
| | | | | |
| Institutional Intermediate-Term Bond Fund | | | | |
| |
| |
| |
| | | | | Face | Market |
| | | | Maturity | Amount | Value • |
| | | Coupon | Date | ($000) | ($000) |
| | Corp. Nacional del Cobre de Chile | 3.875% | 11/3/21 | 10,062 | 10,127 |
| 12 | Corp. Nacional del Cobre de Chile | 3.875% | 11/3/21 | 3,150 | 3,162 |
| | Corp. Nacional del Cobre de Chile | 3.000% | 7/17/22 | 5,000 | 4,866 |
| | Corp. Nacional del Cobre de Chile | 4.500% | 8/13/23 | 23,349 | 23,850 |
| | Corp. Nacional del Cobre de Chile | 4.500% | 9/16/25 | 37,400 | 38,006 |
| | CPPIB Capital Inc. | 1.250% | 9/20/19 | 10,000 | 9,849 |
| 12 | CPPIB Capital Inc. | 1.250% | 9/20/19 | 20,000 | 19,691 |
| 12 | CPPIB Capital Inc. | 2.250% | 1/25/22 | 58,500 | 56,825 |
| 12,14Development Bank of Japan Inc. | 3.125% | 9/6/23 | 12,000 | 11,843 |
| 14 | Development Bank of Japan Inc. | 2.750% | 9/16/25 | 8,500 | 8,129 |
| 12,15Dexia Credit Local SA | 1.875% | 9/15/21 | 15,000 | 14,431 |
| 12 | Dexia Credit Local SA | 2.375% | 9/20/22 | 16,910 | 16,311 |
| 12 | Dexia Credit Local SA | 3.250% | 9/26/23 | 70,000 | 69,598 |
| 12 | Electricite de France SA | 4.500% | 9/21/28 | 10,250 | 10,096 |
| | Emirate of Abu Dhabi | 3.125% | 10/11/27 | 14,000 | 13,225 |
| | Equinor ASA | 3.150% | 1/23/22 | 8,000 | 7,949 |
| | Equinor ASA | 2.450% | 1/17/23 | 2,000 | 1,926 |
| | Equinor ASA | 3.700% | 3/1/24 | 7,000 | 7,052 |
| | European Investment Bank | 1.625% | 12/15/20 | 15,000 | 14,584 |
| | Export-Import Bank of China | 3.625% | 7/31/24 | 10,000 | 9,821 |
| | Export-Import Bank of Korea | 2.250% | 1/21/20 | 6,000 | 5,905 |
| | Export-Import Bank of Korea | 5.125% | 6/29/20 | 14,875 | 15,251 |
| | Export-Import Bank of Korea | 4.000% | 1/29/21 | 2,800 | 2,827 |
| | Export-Import Bank of Korea | 2.500% | 5/10/21 | 5,000 | 4,868 |
| | Export-Import Bank of Korea | 1.875% | 10/21/21 | 10,000 | 9,507 |
| 13 | Export-Import Bank of Korea | 3.210% | 1/25/22 | 10,000 | 10,062 |
| | Export-Import Bank of Korea | 5.000% | 4/11/22 | 7,200 | 7,503 |
| | Export-Import Bank of Korea | 3.000% | 11/1/22 | 2,000 | 1,949 |
| 12 | Harvest Operations Corp. | 4.200% | 6/1/23 | 8,000 | 8,100 |
| | Hydro-Quebec | 8.050% | 7/7/24 | 470 | 571 |
| 12 | ICBCIL Finance Co. Ltd. | 2.375% | 5/19/19 | 9,600 | 9,516 |
| | Industrial & Commercial Bank of China Ltd. | 3.231% | 11/13/19 | 1,250 | 1,243 |
| 14 | Japan Bank for International Cooperation | 1.750% | 11/13/18 | 3,000 | 2,998 |
| 14 | Japan Bank for International Cooperation | 1.750% | 11/13/18 | 10,000 | 9,993 |
| 14 | Japan Bank for International Cooperation | 2.125% | 2/7/19 | 3,000 | 2,996 |
| 14 | Japan Bank for International Cooperation | 2.250% | 2/24/20 | 29,500 | 29,202 |
| 14 | Japan Bank for International Cooperation | 2.125% | 7/21/20 | 11,000 | 10,807 |
| 14 | Japan Bank for International Cooperation | 2.125% | 11/16/20 | 27,100 | 26,494 |
| 14 | Japan Bank for International Cooperation | 3.125% | 7/20/21 | 29,700 | 29,614 |
| | Kingdom of Saudi Arabia | 2.375% | 10/26/21 | 6,500 | 6,268 |
| | Kingdom of Saudi Arabia | 2.875% | 3/4/23 | 5,060 | 4,880 |
| 13 | Korea Development Bank | 3.014% | 9/19/20 | 8,850 | 8,870 |
| | Korea Development Bank | 2.500% | 1/13/21 | 6,000 | 5,878 |
| | Korea Development Bank | 4.625% | 11/16/21 | 605 | 624 |
| | Korea Development Bank | 3.375% | 3/12/23 | 30,000 | 29,499 |
| | Korea East-West Power Co. Ltd. | 2.625% | 11/27/18 | 5,350 | 5,345 |
| 12 | Korea East-West Power Co. Ltd. | 3.875% | 7/19/23 | 23,900 | 23,867 |
| | KSA Sukuk Ltd. | 2.894% | 4/20/22 | 30,480 | 29,685 |
| 12 | Nederlandse Waterschapsbank NV | 1.875% | 3/13/19 | 2,000 | 1,992 |
| 12 | Nederlandse Waterschapsbank NV | 1.250% | 9/9/19 | 36,300 | 35,730 |
| | North American Development Bank | 2.300% | 10/10/18 | 4,125 | 4,124 |
| 12 | Ontario Teachers’ Cadillac Fairview Properties | | | | |
| | Trust | 3.125% | 3/20/22 | 17,690 | 17,347 |
69
| | | | | |
| Institutional Intermediate-Term Bond Fund | | | | |
| |
| |
| |
| | | | | Face | Market |
| | | | Maturity | Amount | Value • |
| | | Coupon | Date | ($000) | ($000) |
| 12 | Ontario Teachers’ Cadillac Fairview Properties | | | | |
| | Trust | 3.875% | 3/20/27 | 6,600 | 6,558 |
| 12 | Ontario Teachers’ Finance Trust | 2.750% | 4/16/21 | 45,000 | 44,500 |
| 12 | Petronas Capital Ltd. | 5.250% | 8/12/19 | 25,750 | 26,200 |
| | Petronas Capital Ltd. | 5.250% | 8/12/19 | 3,991 | 4,059 |
| | Petronas Capital Ltd. | 5.250% | 8/12/19 | 389 | 396 |
| | Petronas Global Sukuk Ltd. | 2.707% | 3/18/20 | 60,870 | 60,208 |
| | Province of Alberta | 1.900% | 12/6/19 | 15,000 | 14,781 |
| 12 | Province of Alberta | 1.750% | 8/26/20 | 1,650 | 1,608 |
| | Province of Manitoba | 2.100% | 9/6/22 | 2,100 | 2,003 |
| | Province of Ontario | 1.625% | 1/18/19 | 48,000 | 47,838 |
| | Province of Ontario | 4.000% | 10/7/19 | 6,025 | 6,091 |
| | Province of Ontario | 4.400% | 4/14/20 | 24,595 | 25,084 |
| | Province of Ontario | 2.550% | 2/12/21 | 23,500 | 23,178 |
| 11 | Province of Quebec | 2.483% | 9/21/20 | 20,000 | 20,060 |
| | Province of Quebec | 2.750% | 8/25/21 | 10,150 | 10,035 |
| | Province of Quebec | 2.375% | 1/31/22 | 15,700 | 15,309 |
| | Province of Quebec | 7.500% | 7/15/23 | 2,065 | 2,421 |
| | Province of Quebec | 7.125% | 2/9/24 | 2,674 | 3,131 |
| | Province of Quebec | 2.750% | 4/12/27 | 5,730 | 5,455 |
| 7,12 Ras Laffan Liquefied Natural Gas Co. Ltd. II | 5.298% | 9/30/20 | 263 | 267 |
| 7 | Republic of Chile | 3.240% | 2/6/28 | 8,605 | 8,246 |
| | Republic of Korea | 7.125% | 4/16/19 | 23,910 | 24,448 |
| | Republic of Latvia | 2.750% | 1/12/20 | 5,260 | 5,214 |
| | Republic of Lithuania | 7.375% | 2/11/20 | 117,326 | 124,049 |
| | Republic of Lithuania | 6.125% | 3/9/21 | 27,055 | 28,814 |
| | Republic of Lithuania | 6.625% | 2/1/22 | 16,300 | 17,951 |
| | Republic of Poland | 6.375% | 7/15/19 | 9,000 | 9,247 |
| | Republic of Poland | 5.125% | 4/21/21 | 10,910 | 11,415 |
| | Republic of Poland | 5.000% | 3/23/22 | 30,437 | 32,034 |
| | Republic of Poland | 4.000% | 1/22/24 | 10,000 | 10,200 |
| | Republic of Slovenia | 5.500% | 10/26/22 | 3,385 | 3,621 |
| | Republic of Slovenia | 5.250% | 2/18/24 | 18,841 | 20,333 |
| | Sinopec Group Overseas Development 2013 | | | | |
| | Ltd. | 4.375% | 10/17/23 | 4,600 | 4,668 |
| | Sinopec Group Overseas Development 2014 | | | | |
| | Ltd. | 4.375% | 4/10/24 | 7,100 | 7,199 |
| | Sinopec Group Overseas Development 2015 | | | | |
| | Ltd. | 2.500% | 4/28/20 | 6,000 | 5,908 |
| 12 | Sinopec Group Overseas Development 2017 | | | | |
| | Ltd. | 2.375% | 4/12/20 | 9,000 | 8,840 |
| 12 | Sinopec Group Overseas Development 2018 | | | | |
| | Ltd. | 4.250% | 9/12/28 | 17,767 | 17,498 |
| 12 | Slovak Republic | 4.375% | 5/21/22 | 2,500 | 2,590 |
| | State of Israel | 4.000% | 6/30/22 | 1,170 | 1,191 |
| | State of Israel | 2.875% | 3/16/26 | 17,255 | 16,320 |
| | State of Israel | 3.250% | 1/17/28 | 2,918 | 2,803 |
| | State of Kuwait | 2.750% | 3/20/22 | 6,563 | 6,403 |
| | State of Qatar | 6.550% | 4/9/19 | 22,000 | 22,404 |
| | State of Qatar | 5.250% | 1/20/20 | 25,100 | 25,749 |
| | State of Qatar | 4.500% | 4/23/28 | 9,000 | 9,264 |
| 12 | Temasek Financial I Ltd. | 2.375% | 1/23/23 | 2,000 | 1,916 |
| 12 | Temasek Financial I Ltd. | 3.625% | 8/1/28 | 20,000 | 19,900 |
| Total Sovereign Bonds (Cost $1,685,330) | | | | 1,670,057 |
70
| | | | |
| Institutional Intermediate-Term Bond Fund | | | | |
| |
| |
| |
| | | | Face | Market |
| | | Maturity | Amount | Value • |
| | Coupon | Date | ($000) | ($000) |
| Taxable Municipal Bonds (0.1%) | | | | |
| California GO | 6.200% | 3/1/19 | 3,025 | 3,068 |
| California GO | 6.200% | 10/1/19 | 170 | 176 |
| Florida Hurricane Catastrophe Fund Finance | | | | |
| Corp. Revenue | 2.995% | 7/1/20 | 2,250 | 2,249 |
| Louisiana Local Government Environmental | | | | |
| Facilities & Community Development | | | | |
| Authority Revenue 2010-EGSL | 3.220% | 2/1/21 | 217 | 218 |
| Louisiana Local Government Environmental | | | | |
| Facilities & Community Development | | | | |
| Authority Revenue 2010-ELL | 3.450% | 2/1/22 | 668 | 668 |
| Regents of the University of California Revenue | 3.063% | 7/1/25 | 3,430 | 3,329 |
| Total Taxable Municipal Bonds (Cost $9,870) | | | | 9,708 |
| | | | |
| | | | Shares | |
| Temporary Cash Investments (1.9%) | | | | |
| Money Market Fund (1.6%) | | | | |
| 16 Vanguard Market Liquidity Fund, 2.209% | | | 2,681,822 | 268,182 |
| |
| | | | Face | |
| | | | Amount | |
| | | | ($000) | |
| Commercial Paper (0.3%) | | | | |
| 17 JP Morgan Securities LLC | 2.344% | 1/28/19 | 50,390 | 49,964 |
| Total Temporary Cash Investments (Cost $318,183) | | | 318,146 |
| Total Investments (102.5%) (Cost $17,286,848) | | | 16,950,538 |
| Other Assets and Liabilities (-2.5%) | | | | |
| Other Assets | | | | 1,876,145 |
| Liabilities | | | | (2,300,166) |
| | | | | (424,021) |
| Net Assets (100%) | | | | |
| Applicable to 738,050,770 outstanding $.001 par value shares of | | | |
| beneficial interest (unlimited authorization) | | | | 16,526,517 |
| Net Asset Value Per Share | | | | $22.39 |
71
Institutional Intermediate-Term Bond Fund
| |
| | Amount |
| | ($000) |
| Statement of Assets and Liabilities | |
| Assets | |
| Investments in Securities, at Value | |
| Unaffiliated Issuers | 16,682,356 |
| Affiliated Issuers | 268,182 |
| Total Investments in Securities | 16,950,538 |
| Investment in Vanguard | 772 |
| Receivables for Investment Securities Sold | 1,789,189 |
| Receivables for Accrued Income | 82,033 |
| Variation Margin Receivable—Futures Contracts | 246 |
| Variation Margin Receivable—CC Swap Contracts | 5 |
| Unrealized Appreciation—OTC Swap Contracts | 92 |
| Other Assets | 3,808 |
| Total Assets | 18,826,683 |
| Liabilities | |
| Payables for Investment Securities Purchased | 2,298,326 |
| Payables to Vanguard | 1,282 |
| Variation Margin Payable—Futures Contracts | 16 |
| Variation Margin Payable—CC Swap Contracts | 120 |
| Unrealized Depreciation—OTC Swap Contracts | 422 |
| Total Liabilities | 2,300,166 |
| Net Assets | 16,526,517 |
72
| |
| Institutional Intermediate-Term Bond Fund | |
| |
| |
| |
| At September 30, 2018, net assets consisted of: | |
| | Amount |
| | ($000) |
| Paid-in Capital | 17,051,795 |
| Undistributed Net Investment Income | 99 |
| Accumulated Net Realized Losses | (189,482) |
| Unrealized Appreciation (Depreciation) | |
| Investment Securities | (336,310) |
| Futures Contracts | (236) |
| Swap Contracts | 651 |
| Net Assets | 16,526,517 |
• See Note A in Notes to Financial Statements.
1 Securities with a value of $3,051,000 have been segregated as initial margin for open futures contracts.
2 Securities with a value of $3,973,000 have been segregated as collateral for certain open To Be Announced (TBA) transactions.
3 Securities with a value of $4,097,000 have been segregated as initial margin for open cleared swap contracts.
4 U.S. government-guaranteed.
5 The issuer operates under a congressional charter; its securities are generally neither guaranteed by the U.S. Treasury nor backed
by the full faith and credit of the U.S. government.
6 The issuer was placed under federal conservatorship in September 2008; since that time, its daily operations have been managed
by the Federal Housing Finance Agency and it receives capital from the U.S. Treasury, as needed to maintain a positive net worth,
in exchange for senior preferred stock.
7 The average or expected maturity is shorter than the final maturity shown because of the possibility of interim principal payments
and prepayments or the possibility of the issue being called.
8 Includes securities purchased on a when-issued or delayed-delivery basis for which the fund has not taken delivery as of
September 30, 2018.
9 Adjustable-rate security based upon one-year Constant Maturity Treasury yield plus spread.
10 Adjustable-rate security based upon 12-month USD LIBOR plus spread.
11 Adjustable-rate security based upon 1-month USD LIBOR plus spread.
12 Security exempt from registration under Rule 144A of the Securities Act of 1933. Such securities may be sold in transactions
exempt from registration, normally to qualified institutional buyers. At September 30, 2018, the aggregate value of these
securities was $2,248,334,000, representing 13.6% of net assets.
13 Adjustable-rate security based upon 3-month USD LIBOR plus spread.
14 Guaranteed by the Government of Japan.
15 Guaranteed by multiple countries.
16 Affiliated money market fund available only to Vanguard funds and certain trusts and accounts managed by Vanguard. Rate shown
is the 7-day yield.
17 Security exempt from registration under Section 4(2) of the Securities Act of 1933. Such securities may be sold in transactions
exempt from registration only to dealers in that program or other “accredited investors.” At September 30, 2018, the value of this
security was $49,964,000, representing 0.3% of net assets.
GO—General Obligation Bond.
CC—Centrally Cleared
OTC—Over-the-Counter
73
| | | | |
| Institutional Intermediate-Term Bond Fund | | | |
| |
| |
| Derivative Financial Instruments Outstanding as of Period End | | |
| Futures Contracts | | | | |
| | | | | ($000) |
| | | | | Value and |
| | | Number of | | Unrealized |
| | | Long (Short) | Notional | Appreciation |
| | Expiration | Contracts | Amount | (Depreciation) |
| Long Futures Contracts | | | | |
| 2-Year U. S. Treasury Note | December 2018 | 3,576 | 753,586 | (1,124) |
| 5-Year U. S. Treasury Note | December 2018 | 1,862 | 209,431 | 26 |
| 10-Year U.S. Treasury Note | December 2018 | 713 | 84,691 | (73) |
| 30-Year U.S. Treasury Bond | December 2018 | 33 | 4,637 | (1) |
| | | | | (1,172) |
| | | | |
| Short Futures Contracts | | | | |
| Ultra 10-Year U.S. Treasury Note | December 2018 | (1,105) | (139,230) | 826 |
| Ultra Long U.S. Treasury Bond | December 2018 | (29) | (4,474) | 110 |
| | | | | 936 |
| | | | | (236) |
| | | | | | | |
| Over-the-Counter Credit Default Swaps | | | | | |
| | | | | | | Remaining | |
| | | | | Periodic | | Up-Front | |
| | | | | Premium | | Premium | Unrealized |
| | | | Notional | Received | | Received | Appreciation |
| Termination | | Amount | (Paid)1 | Value | (Paid) | (Depreciation) |
| Reference Entity | Date | Counterparty | ($000) | (%) | ($000) | ($000) | ($000) |
| Credit Protection Sold/ | | | | | | | |
| Moody’s Rating | | | | | | | |
| America Movil /A3 | 6/20/23 | BARC | 6,200 | 1.000 | (64) | 106 | 42 |
| People’s Republic of | | | | | | | |
| China/A3 | 12/20/23 | GSI | 4,200 | 1.000 | 85 | (77) | 8 |
| Republic of Chile/Aa3 | 12/20/23 | CITNA | 1,700 | 1.000 | 44 | (38) | 6 |
| Republic of Chile/Aa3 | 12/20/23 | BOANA | 13,700 | 1.000 | 354 | (318) | 36 |
| | | | | | 419 | (327) | 92 |
74
| | | | | | | |
| Institutional Intermediate-Term Bond Fund | | | | | |
| |
| |
| Over-the-Counter Credit Default Swaps (continued) | | | | |
| | | | | | | Remaining | |
| | | | | Periodic | | Up-Front | |
| | | | | Premium | | Premium | Unrealized |
| | | | Notional | Received | | Received | Appreciation |
| | Termination | | Amount | (Paid)1 | Value | (Paid) | (Depreciation) |
| Reference Entity | Date | Counterparty | ($000) | (%) | ($000) | ($000) | ($000) |
| Credit Protection Purchased | | | | | | |
| EI du Pont de | | | | | | | |
| Nemours & Co. | 12/20/20 | JPMC | 4,015 | (1.000) | (78) | 43 | (35) |
| State of Qatar | 6/20/22 | BOANA | 4,080 | (1.000) | (85) | (37) | (122) |
| State of Qatar | 6/20/22 | CITNA | 7,920 | (1.000) | (165) | (70) | (235) |
| Wells Fargo & Co. | 9/20/20 | BOANA | 3,740 | (1.000) | (61) | 31 | (30) |
| | | | | | (389) | (33) | (422) |
| | | | | | 30 | (360) | (330) |
The notional amount represents the maximum potential amount the fund could be required to pay as a seller of credit protection if the reference entity was subject to a credit event.
1 Periodic premium received/paid quarterly.
BARC—Barclays Bank plc.
BOANA—Bank of America, N.A.
CITNA—Citibank N.A.
GSI—Goldman Sachs International.
JPMC—JP Morgan Chase Bank.
At September 30, 2018, the counterparties had deposited in a segregated account cash of $410,000 in connection with open open over-the-counter swap contracts.
| | | | | | |
| Centrally Cleared Interest Rate Swaps | | | | | | |
| | | | Fixed | Floating | | |
| | | | Interest | Interest | | |
| | | | Rate | Rate | | Unrealized |
| | Future | Notional | Received | Received | | Appreciation |
| | Effective | Amount | (Paid)2 | (Paid) 3 | Value | (Depreciation) |
| Termination Date | Date1 | ($000) | (%) | (%) | ($000) | ($000) |
| 12/19/19 | 12/19/18 | 35,195 | 2.500 | (0.000) | (151) | (12) |
| 12/21/20 | 12/19/18 | 1,802 | (2.750) | 0.000 | 11 | 2 |
| 12/20/21 | 12/19/18 | 59,380 | (2.750) | 0.000 | 605 | 96 |
| 12/19/22 | 12/19/18 | 84,428 | (2.750) | 0.000 | 1,137 | 222 |
| 12/19/23 | 12/19/18 | 52,728 | (2.750) | 0.000 | 876 | 179 |
| 12/19/25 | 12/19/18 | 83,890 | (2.750) | 0.000 | 1,981 | 494 |
| | | | | | 4,459 | 981 |
1 Forward interest rate swap. In a forward interest rate swap, the fund and the counterparty agree to make periodic net payments beginning on a specified future effective date.
2 Fixed interest payment received/paid semiannually.
3 Based on 3-month London Interbank Offered Rate (LIBOR) as of the most recent payment date. Floating interest payment received/ paid quarterly.
See accompanying Notes, which are an integral part of the Financial Statements.
75
Institutional Intermediate-Term Bond Fund
Statement of Operations
| |
| | Year Ended |
| | September 30, 2018 |
| | ($000) |
| Investment Income | |
| Income | |
| Interest1 | 370,485 |
| Total Income | 370,485 |
| Expenses | |
| The Vanguard Group—Note B | |
| Investment Advisory Services | 462 |
| Management and Administrative | 2,221 |
| Marketing and Distribution | 127 |
| Custodian Fees | 103 |
| Auditing Fees | 49 |
| Trustees’ Fees and Expenses | 8 |
| Total Expenses | 2,970 |
| Net Investment Income | 367,515 |
| Realized Net Gain (Loss) | |
| Investment Securities Sold1 | (99,893) |
| Futures Contracts | (54,035) |
| Swap Contracts | 910 |
| Realized Net Gain (Loss) | (153,018) |
| Change in Unrealized Appreciation (Depreciation) | |
| Investment Securities1 | (330,384) |
| Futures Contracts | 4,940 |
| Swap Contracts | 991 |
| Change in Unrealized Appreciation (Depreciation) | (324,453) |
| Net Increase (Decrease) in Net Assets Resulting from Operations | (109,956) |
1 Interest income, realized net gain (loss), and change in unrealized appreciation (depreciation) from an affiliated company of the fund were $7,414,000, ($19,000), and ($106,000). Purchases and sales are for temporary cash investment purposes.
See accompanying Notes, which are an integral part of the Financial Statements.
76
Institutional Intermediate-Term Bond Fund
Statement of Changes in Net Assets
| | |
| | Year Ended September 30, |
| | 2018 | 2017 |
| | ($000) | ($000) |
| Increase (Decrease) in Net Assets | | |
| Operations | | |
| Net Investment Income | 367,515 | 245,206 |
| Realized Net Gain (Loss) | (153,018) | (34,873) |
| Change in Unrealized Appreciation (Depreciation) | (324,453) | (150,985) |
| Net Increase (Decrease) in Net Assets Resulting from Operations | (109,956) | 59,348 |
| Distributions | | |
| Net Investment Income | (367,615) | (245,776) |
| Realized Capital Gain1 | — | (94,306) |
| Total Distributions | (367,615) | (340,082) |
| Capital Share Transactions | | |
| Issued | 3,428,096 | 4,450,553 |
| Issued in Lieu of Cash Distributions | 367,615 | 340,082 |
| Redeemed | (897,177) | (225,161) |
| Net Increase (Decrease) from Capital Share Transactions | 2,898,534 | 4,565,474 |
| Total Increase (Decrease) | 2,420,963 | 4,284,740 |
| Net Assets | | |
| Beginning of Period | 14,105,554 | 9,820,814 |
| End of Period2 | 16,526,517 | 14,105,554 |
1 Includes fiscal 2018 and 2017 short-term gain distributions totaling $0 and $47,560,000, respectively. Short-term gain distributions are treated as ordinary income dividends for tax purposes.
2 Net Assets—End of Period includes undistributed (overdistributed) net investment income of $99,000 and $251,000.
See accompanying Notes, which are an integral part of the Financial Statements.
77
Institutional Intermediate-Term Bond Fund
Financial Highlights
| | | | |
| | | | | June 19, |
| | | | | 20151 to |
| | Year Ended September 30, | |
| For a Share Outstanding | | | | Sept. 30, |
| Throughout Each Period | 2018 | 2017 | 2016 | 2015 |
| Net Asset Value, Beginning of Period1 | $23.12 | $23.79 | $23.46 | $23.36 |
| Investment Operations | | | | |
| Net Investment Income | . 5612 | .462 2 | .473 | .126 |
| Net Realized and Unrealized Gain (Loss) on Investments | (.736) | (.470) | .383 | .101 |
| Total from Investment Operations | (.175) | (. 008) | . 856 | . 227 |
| Distributions | | | | |
| Dividends from Net Investment Income | (. 555) | (. 454) | (. 473) | (.127) |
| Distributions from Realized Capital Gains | — | (.208) | (.053) | — |
| Total Distributions | (. 555) | (. 662) | (. 526) | (.127) |
| Net Asset Value, End of Period | $22.39 | $23.12 | $23.79 | $23.46 |
| |
| Total Return | -0.75% | 0.01% | 3.70% | 0.97% |
| |
| Ratios/Supplemental Data | | | | |
| Net Assets, End of Period (Millions) | $16,527 | $14,106 | $9,821 | $8,035 |
| Ratio of Total Expenses to Average Net Assets | 0.02% | 0.02% | 0.02% | 0.02%3 |
| Ratio of Net Investment Income to Average Net Assets | 2.48% | 1.99% | 2.02% | 1.92%3 |
| Portfolio Turnover Rate 4 | 182% | 253% | 251% | 45% |
1 Commencement of operations as a registered investment company.
2 Calculated based on average shares outstanding.
3 Annualized.
4 Includes 67%, 111%, 67%, and 12% attributable to mortgage-dollar-roll activity.
See accompanying Notes, which are an integral part of the Financial Statements.
78
Institutional Intermediate-Term Bond Fund
Notes to Financial Statements
Vanguard Institutional Intermediate-Term Bond Fund is registered under the Investment Company Act of 1940 as an open-end investment company, or mutual fund. The fund has been established by Vanguard as an investment vehicle for certain collective trusts and other accounts managed by Vanguard or its affiliates and qualifying education savings plans. The fund is offered to investors who meet certain administrative and service criteria and invest a minimum of $10 million. Certain of the fund’s investments are in corporate debt instruments; the issuers’ abilities to meet their obligations may be affected by economic developments in their respective industries.
A. The following significant accounting policies conform to generally accepted accounting principles for U.S. investment companies. The fund consistently follows such policies in preparing its financial statements.
1. Security Valuation: Securities are valued as of the close of trading on the New York Stock Exchange (generally 4 p.m., Eastern time) on the valuation date. Bonds and temporary cash investments are valued using the latest bid prices or using valuations based on a matrix system (which considers such factors as security prices, yields, maturities, and ratings), both as furnished by independent pricing services. Structured debt securities, including mortgages and asset-backed securities, are valued using the latest bid prices or using valuations based on a matrix system that considers such factors as issuer, tranche, nominal or option-adjusted spreads, weighted average coupon, weighted average maturity, credit enhancements, and collateral. Investments in Vanguard Market Liquidity Fund are valued at that fund’s net asset value. Securities for which market quotations are not readily available, or whose values have been affected by events occurring before the fund’s pricing time but after the close of the securities’ primary markets, are valued by methods deemed by the board of trustees to represent fair value.
2. Futures Contracts: The fund uses futures contracts to invest in fixed income asset classes with greater efficiency and lower cost than is possible through direct investment, to add value when these instruments are attractively priced, or to adjust sensitivity to changes in interest rates. The primary risks associated with the use of futures contracts are imperfect correlation between changes in market values of bonds held by the fund and the prices of futures contracts, and the possibility of an illiquid market. Counterparty risk involving futures is mitigated because a regulated clearinghouse is the counterparty instead of the clearing broker. To further mitigate counterparty risk, the fund trades futures contracts on an exchange, monitors the financial strength of its clearing brokers and clearinghouse, and has entered into clearing agreements with its clearing brokers. The clearinghouse imposes initial margin requirements to secure the fund’s performance and requires daily settlement of variation margin representing changes in the market value of each contract. Any assets pledged as initial margin for open contracts are noted in the Statement of Net Assets.
Futures contracts are valued at their quoted daily settlement prices. The notional amounts of the contracts are not recorded in the Statement of Net Assets. Fluctuations in the value of the contracts are recorded in the Statement of Assets and Liabilities as an asset (liability) and in the Statement of Operations as unrealized appreciation (depreciation) until the contracts are closed, when they are recorded as realized futures gains (losses).
During the year ended September 30, 2018, the fund’s average investments in long and short futures contracts represented 9% and 2% of net assets, respectively, based on the average of the notional amounts at each quarter-end during the period.
79
Institutional Intermediate-Term Bond Fund
3. Swap Contracts: The fund invests in credit default swaps to adjust the overall credit risk of the fund or to actively overweight or underweight credit risk to a specific issuer or group of issuers. The fund may sell credit protection through credit default swaps to simulate investments in long positions that are either unavailable or considered to be less attractively priced in the bond market. The fund may purchase credit protection through credit default swaps to reduce credit exposure to a given issuer or issuers. Under the terms of the swaps, an up-front payment may be exchanged between the seller and buyer. In addition, the seller of the credit protection receives a periodic payment of premium from the buyer that is a fixed percentage applied to a notional amount. If, for example, the reference entity is subject to a credit event (such as bankruptcy, failure to pay, or obligation acceleration) during the term of the swap, the seller agrees to either physically settle or cash settle the swap contract. If the swap is physically settled, the seller agrees to pay the buyer an amount equal to the notional amount and take delivery of a debt instrument of the reference issuer with a par amount equal to such notional amount. If the swap is cash settled, the seller agrees to pay the buyer the difference between the notional amount and the final price for the relevant debt instrument, as determined either in a market auction or pursuant to a pre-agreed-upon valuation procedure.
The fund enters into interest rate swap transactions to adjust the fund’s sensitivity to changes in interest rates and maintain the ability to generate income at prevailing market rates. Under the terms of the swaps, one party pays the other an amount that is a fixed percentage rate applied to a notional amount. In return, the counterparty agrees to pay a floating rate, which is reset periodically based on short-term interest rates, applied to the same notional amount.
The notional amounts of swap contracts are not recorded in the Statement of Net Assets. Swaps are valued daily based on market quotations received from independent pricing services or recognized dealers and the change in value is recorded in the Statement of Assets and Liabilities as an asset (liability) and in the Statement of Operations as unrealized appreciation (depreciation) until the seller of credit protection is required to take delivery (or, in a cash settled swap, pay the settlement amount determined) upon occurrence of a credit event, periodic payments are made, or the swap terminates, at which time realized gain (loss) is recorded. The net premium to be received or paid by the fund under swap contracts is accrued daily and recorded as realized gain (loss) over the life of the contract.
The primary risk associated with selling credit protection is that, upon the occurrence of a defined credit event, the market value of the debt instrument received by the fund (or, in a cash settled swap, the debt instruments used to determine the settlement payment by the fund) will be significantly less than the amount paid by the fund and, in a physically settled swap, the fund may receive an illiquid debt instrument. A risk associated with all types of swaps is the possibility that a counterparty may default on its obligation to pay net amounts due to the fund. The fund’s maximum amount subject to counterparty risk is the unrealized appreciation on the swap contract. The fund mitigates its counterparty risk by entering into swaps only with a diverse group of prequalified counterparties, monitoring their financial strength, entering into master netting arrangements with its counterparties, and requiring its counterparties to transfer collateral as security for their performance. In the absence of a default, the collateral pledged or received by the fund cannot be repledged, resold, or rehypoth-ecated. In the event of a counterparty’s default (including bankruptcy), the fund may terminate any swap contracts with that counterparty, determine the net amount owed by either party in accordance with its master netting arrangements, and sell or retain any collateral held up to the net amount owed to the fund under the master netting arrangements. The swap contracts contain provisions whereby a counterparty may terminate open contracts if the fund’s net assets decline below a certain level, triggering a payment by the fund if the fund is in a net liability position at the time of the termination.
80
Institutional Intermediate-Term Bond Fund
The payment amount would be reduced by any collateral the fund has pledged. Any securities pledged as collateral for open contracts are noted in the Statement of Net Assets. The value of collateral received or pledged is compared daily to the value of the swap contracts exposure with each counterparty, and any difference, if in excess of a specified minimum transfer amount, is adjusted and settled within two business days.
The fund enters into centrally cleared interest rate and credit default swaps to achieve the same objectives specified with respect to the equivalent over-the-counter swaps but with less counterparty risk because a regulated clearinghouse is the counterparty instead of the clearing broker or executing broker. The clearinghouse imposes initial margin requirements to secure the fund’s performance, and requires daily settlement of variation margin representing changes in the market value of each contract. To further mitigate counterparty risk, the fund trades with a diverse group of prequalified executing brokers; monitors the financial strength of its clearing brokers, executing brokers, and clearinghouse; and has entered into agreements with its clearing brokers and executing brokers.
During the year ended September 30, 2018, the fund’s average amounts of investments in credit protection sold and credit protection purchased each represented less than 1% of net assets, respectively, based on the average of notional amounts at each quarter-end during the period. The average amount of investments in interest rate swaps represented 3% of net assets, based on the average of notional amounts at each quarter-end during the period.
4. To Be Announced (TBA) Transactions: A TBA transaction is an agreement to buy or sell mortgage-backed securities with agreed-upon characteristics (face amount, coupon, maturity) for settlement at a future date. The fund may be a seller of TBA transactions to reduce its exposure to the mortgage-backed securities market or in order to sell mortgage-backed securities it owns under delayed-delivery arrangements. When the fund is a buyer of TBA transactions, it maintains cash or short-term investments in an amount sufficient to meet the purchase price at the settlement date of the TBA transaction. The primary risk associated with TBA transactions is that a counterparty may default on its obligations. The fund mitigates its counterparty risk by, among other things, performing a credit analysis of counterparties, allocating transactions among numerous counterparties, and monitoring its exposure to each counterparty. The fund may also enter into a Master Securities Forward Transaction Agreement (MSFTA) with certain counterparties and require them to transfer collateral as security for their performance. In the absence of a default, the collateral pledged or received by the fund cannot be repledged, resold, or rehypothecated. Under an MSFTA, upon a counterparty default (including bankruptcy), the fund may terminate any TBA transactions with that counterparty, determine the net amount owed by either party in accordance with its master netting arrangements, and sell or retain any collateral held up to the net amount owed to the fund under the master netting arrangements. At September 30, 2018, counterparties had deposited in segregated accounts securities with a value of $1,445,000 and cash of $1,420,000 in connection with TBA transactions.
5. Mortgage Dollar Rolls: The fund enters into mortgage-dollar-roll transactions, in which the fund sells mortgage-backed securities to a dealer and simultaneously agrees to purchase similar securities in the future at a predetermined price. The proceeds of the securities sold in mortgage-dollar-roll transactions are typically invested in high-quality short-term fixed income securities. The fund forgoes principal and interest paid on the securities sold, and is compensated by interest earned on the proceeds of the sale and by a lower price on the securities to be repurchased. The fund has also entered into mortgage-dollar-roll transactions in which the fund buys mortgage-backed securities from a dealer pursuant to a TBA transaction and simultaneously agrees to sell similar securities in the future at a predetermined price. The securities bought in mortgage-dollar-
81
Institutional Intermediate-Term Bond Fund
roll transactions are used to cover an open TBA sell position. The fund continues to earn interest on mortgage-backed security pools already held and receives a lower price on the securities to be sold in the future. The fund accounts for mortgage-dollar-roll transactions as purchases and sales; as such, these transactions may increase the fund’s portfolio turnover rate. Amounts to be received or paid in connection with open mortgage dollar rolls are included in Receivables for Investment Securities Sold or Payables for Investment Securities Purchased in the Statement of Assets and Liabilities.
6. Federal Income Taxes: The fund intends to continue to qualify as a regulated investment company and distribute all of its taxable income. Management has analyzed the fund’s tax positions taken for all open federal income tax years (September 30, 2015–2018), and has concluded that no provision for federal income tax is required in the fund’s financial statements.
7. Distributions: Distributions to shareholders are recorded on the ex-dividend date. Distributions are determined on a tax basis and may differ from net investment income and realized capital gains for financial reporting purposes.
8. Credit Facility: The fund and certain other funds managed by The Vanguard Group (“Vanguard”) participate in a $3.1 billion committed credit facility provided by a syndicate of lenders pursuant to a credit agreement that may be renewed annually; each fund is individually liable for its borrowings, if any, under the credit facility. Borrowings may be utilized for temporary and emergency purposes, and are subject to the fund’s regulatory and contractual borrowing restrictions. The participating funds are charged administrative fees and an annual commitment fee of 0.10% of the undrawn amount of the facility; these fees are allocated to the funds based on a method approved by the fund’s board of trustees and included in Management and Administrative expenses on the fund’s Statement of Operations. Any borrowings under this facility bear interest at a rate based upon the higher of the one-month London Interbank Offered Rate, federal funds effective rate, or overnight bank funding rate plus an agreed-upon spread.
The fund had no borrowings outstanding at September 30, 2018, or at any time during the period then ended.
9. Other: Interest income includes income distributions received from Vanguard Market Liquidity Fund and is accrued daily. Premiums and discounts on debt securities purchased are amortized and accreted, respectively, to interest income over the lives of the respective securities. Security transactions are accounted for on the date securities are bought or sold. Costs used to determine realized gains (losses) on the sale of investment securities are those of the specific securities sold.
B. In accordance with the terms of a Funds’ Service Agreement (the “FSA”) between Vanguard and the fund, Vanguard furnishes to the fund investment advisory, corporate management, administrative, marketing, and distribution services at Vanguard’s cost of operations (as defined by the FSA). These costs of operations are allocated to the fund based on methods and guidelines approved by the board of trustees. Vanguard does not require reimbursement in the current period for certain costs of operations (such as deferred compensation/benefits and risk/insurance costs); the fund’s liability for these costs of operations is included in Payables to Vanguard on the Statement of Assets and Liabilities. All other costs of operations payable to Vanguard are generally settled twice a month.
Upon the request of Vanguard, the fund may invest up to 0.40% of its net assets as capital in Vanguard. At September 30, 2018, the fund had contributed to Vanguard capital in the amount of $772,000, representing 0.00% of the fund’s net assets and 0.31% of Vanguard’s capitalization. The fund’s trustees and officers are also directors and employees, respectively, of Vanguard.
82
Institutional Intermediate-Term Bond Fund
C. Various inputs may be used to determine the value of the fund’s investments. These inputs are summarized in three broad levels for financial statement purposes. The inputs or methodologies used to value securities are not necessarily an indication of the risk associated with investing in those securities.
Level 1—Quoted prices in active markets for identical securities.
Level 2—Other significant observable inputs (including quoted prices for similar securities, interest rates, prepayment speeds, credit risk, etc.).
Level 3—Significant unobservable inputs (including the fund’s own assumptions used to determine the fair value of investments). Any investments valued with significant unobservable inputs are noted on the Statement of Net Assets.
The following table summarizes the market value of the fund’s investments as of September 30, 2018, based on the inputs used to value them:
| | | |
| | Level 1 | Level 2 | Level 3 |
| Investments | ($000) | ($000) | ($000) |
| U.S. Government and Agency Obligations | — | 8,597,594 | — |
| Asset-Backed/Commercial Mortgage-Backed Securities | — | 2,617,237 | — |
| Corporate Bonds | — | 3,737,796 | — |
| Sovereign Bonds | — | 1,670,057 | — |
| Taxable Municipal Bonds | — | 9,708 | — |
| Temporary Cash Investments | 268,182 | 49,964 | — |
| Futures Contracts—Assets1 | 246 | — | — |
| Futures Contracts—Liabilities1 | (16) | — | — |
| Swap Contracts—Assets | 51 | 92 | — |
| Swap Contracts—Liabilities | (120)1 | (422) | — |
| Total | 268,297 | 16,682,026 | — |
| 1 Represents variation margin on the last day of the reporting period. | | | |
D. At September 30, 2018, the fair values of derivatives were reflected in the Statement of Assets and Liabilities as follows:
| | | |
| | Interest Rate | Credit | |
| | Contracts | Contracts | Total |
| Statement of Assets and Liabilities Caption | ($000) | ($000) | ($000) |
| Variation Margin Receivable—Futures Contracts | 246 | — | 246 |
| Variation Margin Receivable—CC Swap Contracts | 5 | — | 5 |
| Unrealized Appreciation—OTC Swap Contracts | — | 92 | 92 |
| Total Assets | 251 | 92 | 343 |
| |
| Variation Margin Payable—Futures Contracts | (16) | — | (16) |
| Variation Margin Payable—CC Swap Contracts | (120) | — | (120) |
| Unrealized Depreciation—OTC Swap Contracts | — | (422) | (422) |
| Total Liabilities | (136) | (422) | (558) |
83
Institutional Intermediate-Term Bond Fund
Realized net gain (loss) and the change in unrealized appreciation (depreciation) on derivatives for the year ended September 30, 2018, were:
| | | |
| Interest Rate | Credit | |
| | Contracts | Contracts | Total |
| Realized Net Gain (Loss) on Derivatives | ($000) | ($000) | ($000) |
| Futures Contracts | (54,035) | — | (54,035) |
| Swap Contracts | 681 | 229 | 910 |
| Realized Net Gain (Loss) on Derivatives | (53,354) | 229 | (53,125) |
| |
| Change in Unrealized Appreciation (Depreciation) on Derivatives | | | |
| Futures Contracts | 4,940 | — | 4,940 |
| Swap Contracts | 1,002 | (11) | 991 |
| Change in Unrealized Appreciation (Depreciation) on Derivatives | 5,942 | (11) | 5,931 |
E. Permanent differences between book-basis and tax-basis components of net assets are reclassified among capital accounts in the financial statements to reflect their tax character. These reclassifications have no effect on net assets or net asset value per share. As of period end, the following permanent differences primarily attributable to the accounting for swap agreements were reclassified to the following accounts:
| |
| | Amount |
| | ($000) |
| Paid-in Capital | — |
| Undistributed (Overdistributed) Net Investment Income | (52) |
| Accumulated Net Realized Gains (Losses) | 52 |
Temporary differences between book-basis and tax-basis components of accumulated net earnings (losses) arise when certain items of income, gain, or loss are recognized in different periods for financial statement and tax purposes; these differences will reverse at some time in the future. The differences are primarily related to the tax deferral of losses on wash sales, the realization of unrealized gains or losses on certain futures contracts, and swap agreements. As of period end, the tax-basis components of accumulated net earnings (losses) are detailed in the table as follows:
| |
| | Amount |
| | ($000) |
| Undistributed Ordinary Income | 1,236 |
| Undistributed Long-Term Gains | — |
| Capital Loss Carryforwards (Non-expiring)* | (189,718) |
| Net Unrealized Gains (Losses) | (335,659) |
* The fund used capital loss carryforwards of $41,023,000 to offset taxable capital gains realized during the year ended September 30, 2018, reducing the amount of capital gains that would otherwise be available to distribute to shareholders.
84
Institutional Intermediate-Term Bond Fund
As of September 30, 2018, gross unrealized appreciation and depreciation for investments and derivatives based on cost for U.S. federal income tax purposes were as follows:
| |
| | Amount |
| | ($000) |
| Tax Cost | 17,286,487 |
| Gross Unrealized Appreciation | 21,277 |
| Gross Unrealized Depreciation | (356,936) |
| Net Unrealized Appreciation (Depreciation) | (335,659) |
F. During the year ended September 30, 2018, the fund purchased $5,466,038,000 of investment securities and sold $2,827,354,000 of investment securities, other than U.S. government securities and temporary cash investments. Purchases and sales of U.S. government securities were $24,525,400,000 and $23,448,839,000, respectively. Total purchases and sales include $2,701,937,000 and $0, respectively, in connection with in-kind purchases and redemptions of the fund’s capital shares.
| | |
| G. Capital shares issued and redeemed were: | | |
| | Year Ended September 30, |
| | 2018 | 2017 |
| | Shares | Shares |
| | (000) | (000) |
| Issued | 150,754 | 192,265 |
| Issued in Lieu of Cash Distributions | 16,255 | 14,746 |
| Redeemed | (39,041) | (9,687) |
| Net Increase (Decrease) in Shares Outstanding | 127,968 | 197,324 |
H. Management has determined that no events or transactions occurred subsequent to September 30, 2018, that would require recognition or disclosure in these financial statements.
85
Report of Independent Registered
Public Accounting Firm
To the Board of Trustees of Vanguard Malvern Funds and Shareholders of Vanguard Institutional
Short-Term Bond Fund and Vanguard Institutional Intermediate-Term Bond Fund
Opinions on the Financial Statements
We have audited the accompanying statements of assets and liabilities and statements of net assets of Vanguard Institutional Short-Term Bond Fund and Vanguard Institutional Intermediate-Term Bond Fund (two of the funds constituting Vanguard Malvern Funds, hereafter collectively referred to as the “Funds”) as of September 30, 2018, the related statements of operations for the year ended September 30, 2018, the statements of changes in net assets for each of the two years in the period ended September 30, 2018, including the related notes, and the financial highlights for each of the periods indicated therein (collectively referred to as the “financial statements”). In our opinion, the financial statements present fairly, in all material respects, the financial position of each of the Funds as of September 30, 2018, the results of each of their operations for the year then ended, the changes in each of their net assets for each of the two years in the period ended September 30, 2018, and each of the financial highlights for each of the periods indicated therein in conformity with accounting principles generally accepted in the United States of America.
Basis for Opinions
These financial statements are the responsibility of the Funds’ management. Our responsibility is to express an opinion on the Funds’ financial statements based on our audits. We are a public accounting firm registered with the Public Company Accounting Oversight Board (United States) (“PCAOB”) and are required to be independent with respect to the Funds in accordance with the U.S. federal securities laws and the applicable rules and regulations of the Securities and Exchange Commission and the PCAOB.
We conducted our audits of these financial statements in accordance with the standards of the PCAOB. Those standards require that we plan and perform the audit to obtain reasonable assurance about whether the financial statements are free of material misstatement, whether due to error or fraud.
Our audits included performing procedures to assess the risks of material misstatement of the financial statements, whether due to error or fraud, and performing procedures that respond to those risks. Such procedures included examining, on a test basis, evidence regarding the amounts and disclosures in the financial statements. Our audits also included evaluating the accounting principles used and significant estimates made by management, as well as evaluating the overall presentation of the financial statements. Our procedures included confirmation of securities owned as of September 30, 2018, by correspondence with the custodians and brokers and by agreement to the underlying ownership records of the transfer agent; when replies were not received from brokers, we performed other auditing procedures. We believe that our audits provide a reasonable basis for our opinions.
/s/PricewaterhouseCoopers LLP
Philadelphia, Pennsylvania
November 15, 2018
We have served as the auditor of one or more investment companies in The Vanguard Group of Funds since 1975.
86
Special 2018 tax information (unaudited) for Vanguard Institutional Short-Term Bond Fund
This information for the fiscal year ended September 30, 2018, is included pursuant to provisions of the Internal Revenue Code.
For nonresident alien shareholders, 60.6% of income dividends are interest-related dividends.
Special 2018 tax information (unaudited) for Vanguard Institutional Intermediate-Term Bond Fund
This information for the fiscal year ended September 30, 2018, is included pursuant to provisions of the Internal Revenue Code.
For nonresident alien shareholders, 77.9% of income dividends are interest-related dividends.
87
About Your Fund’s Expenses
As a shareholder of the fund, you incur ongoing costs, which include costs for portfolio management, administrative services, and shareholder reports (like this one), among others. Operating expenses, which are deducted from a fund’s gross income, directly reduce the investment return of the fund.
A fund’s expenses are expressed as a percentage of its average net assets. This figure is known as the expense ratio. The following examples are intended to help you understand the ongoing costs (in dollars) of investing in your fund and to compare these costs with those of other mutual funds. The examples are based on an investment of $1,000 made at the beginning of the period shown and held for the entire period.
The accompanying table illustrates your fund’s costs in two ways:
• Based on actual fund return. This section helps you to estimate the actual expenses that you paid over the period. The ”Ending Account Value“ shown is derived from the fund‘s actual return, and the third column shows the dollar amount that would have been paid by an investor who started with $1,000 in the fund. You may use the information here, together with the amount you invested, to estimate the expenses that you paid over the period.
To do so, simply divide your account value by $1,000 (for example, an $8,600 account value divided by $1,000 = 8.6), then multiply the result by the number given for your fund under the heading ”Expenses Paid During Period.“
• Based on hypothetical 5% yearly return. This section is intended to help you compare your fund‘s costs with those of other mutual funds. It assumes that the fund had a yearly return of 5% before expenses, but that the expense ratio is unchanged. In this case—because the return used is not the fund’s actual return—the results do not apply to your investment. The example is useful in making comparisons because the Securities and Exchange Commission requires all mutual funds to calculate expenses based on a 5% return. You can assess your fund’s costs by comparing this hypothetical example with the hypothetical examples that appear in shareholder reports of other funds.
Note that the expenses shown in the table are meant to highlight and help you compare ongoing costs only and do not reflect transaction costs incurred by the fund for buying and selling securities. Further, the expenses do not include any purchase, redemption, or account service fees described in the fund prospectus. If such fees were applied to your account, your costs would be higher. Your fund does not carry a “sales load.”
The calculations assume no shares were bought or sold during the period. Your actual costs may have been higher or lower, depending on the amount of your investment and the timing of any purchases or redemptions.
You can find more information about the fund’s expenses, including annual expense ratios, in the Financial Statements section of this report. For additional information on operating expenses and other shareholder costs, please refer to your fund’s current prospectus.
88
| | | |
| Six Months Ended September 30, 2018 | | | |
| | Beginning | Ending | Expenses |
| | Account Value | Account Value | Paid During |
| | 3/31/2018 | 9/30/2018 | Period |
| Based on Actual Fund Return | | | |
| Institutional Short-Term Bond Fund | $1,000.00 | $1,009.20 | $0.10 |
| Institutional Intermediate-Term Bond Fund | $1,000.00 | $1,004.10 | $0.10 |
| Based on Hypothetical 5% Yearly Return | | | |
| Institutional Short-Term Bond Fund | $1,000.00 | $1,024.97 | $0.10 |
| Institutional Intermediate-Term Bond Fund | $1,000.00 | $1,024.97 | $0.10 |
The calculations are based on expenses incurred in the most recent six-month period. The funds’ annualized six-month expense ratios for that period are: for the Institutional Short-Term Bond Fund Institutional Plus Shares, 0.02%, and for the Institutional Intermediate-Term Bond Fund Institutional Plus Shares, 0.02%. The dollar amounts shown as “Expenses Paid” are equal to the annualized expense ratio multiplied by the average account value over the period, multiplied by the number of days in the most recent six-month period, then divided by the number of days in the most recent 12-month period (183/365).
89
Glossary
30-Day SEC Yield. A fund’s 30-day SEC yield is derived using a formula specified by the U.S. Securities and Exchange Commission. Under the formula, data related to the fund’s security holdings in the previous 30 days are used to calculate the fund’s hypothetical net income for that period, which is then annualized and divided by the fund’s estimated average net assets over the calculation period. For the purposes of this calculation, a security’s income is based on its current market yield to maturity (for bonds), its actual income (for asset-backed securities), or its projected dividend yield (for stocks). Because the SEC yield represents hypothetical annualized income, it will differ—at times significantly—from the fund’s actual experience. As a result, the fund’s income distributions may be higher or lower than implied by the SEC yield.
Average Coupon. The average interest rate paid on the fixed income securities held by a fund. It is expressed as a percentage of face value.
Average Duration. An estimate of how much the value of the bonds held by a fund will fluctuate in response to a change in interest rates. To see how the value could change, multiply the average duration by the change in rates. If interest rates rise by 1 percentage point, the value of the bonds in a fund with an average duration of five years would decline by about 5%. If rates decrease by a percentage point, the value would rise by 5%.
Average Effective Maturity. The average length of time until fixed income securities held by a fund reach maturity and are repaid, taking into consideration the possibility that the issuer may call the bond before its maturity date. The figure reflects the proportion of fund assets represented by each security; it also reflects any futures contracts held. In general, the longer the average effective maturity, the more a fund’s share price will fluctuate in response to changes in market interest rates.
Beta. A measure of the magnitude of a fund’s past share-price fluctuations in relation to the ups and downs of a given market index. The index is assigned a beta of 1.00. Compared with a given index, a fund with a beta of 1.20 typically would have seen its share price rise or fall by 12% when the index rose or fell by 10%. For this report, beta is based on returns over the past 36 months for both the fund and the index. Note that a fund’s beta should be reviewed in conjunction with its R-squared (see definition). The lower the R-squared, the less correlation there is between the fund and the index, and the less reliable beta is as an indicator of volatility.
Credit Quality. Credit-quality ratings are measured on a scale that generally ranges from AAA (highest) to D (lowest). U.S. Treasury, U.S. Agency, and U.S. Agency mortgage-backed securities appear under “U.S. Government.” Credit-quality ratings are obtained from Moody’s and S&P, and the higher rating for each issue is shown. ”Not Rated” is used to classify securities for which a rating is not available. Not rated securities include a fund’s investment in Vanguard Market Liquidity Fund or Vanguard Municipal Cash Management Fund, each of which invests in high-quality money market instruments and may serve as a cash management vehicle for the Vanguard funds, trusts, and accounts.
Expense Ratio. A fund’s total annual operating expenses expressed as a percentage of the fund’s average net assets. The expense ratio includes management and administrative expenses, but does not include the transaction costs of buying and selling portfolio securities.
90
Inception Date. The date on which the assets of a fund (or one of its share classes) are first invested in accordance with the fund’s investment objective. For funds with a subscription period, the inception date is the day after that period ends. Investment performance is measured from the inception date.
R-Squared. A measure of how much of a fund’s past returns can be explained by the returns from the market in general, as measured by a given index. If a fund’s total returns were precisely synchronized with an index’s returns, its R-squared would be 1.00. If the fund’s returns bore no relationship to the index’s returns, its R-squared would be 0. For this report, R-squared is based on returns over the past 36 months for both the fund and the index.
Short-Term Reserves. The percentage of a fund invested in highly liquid, short-term securities that can be readily converted to cash.
Yield to Maturity. The rate of return an investor would receive if the fixed income securities held by a fund were held to their maturity dates.
Benchmark Information
Spliced Bloomberg Barclays U.S. Aggregate Float Adjusted Index: Bloomberg Barclays U.S. Aggregate Bond Index through December 31, 2009; Bloomberg Barclays U.S. Aggregate Float Adjusted Index thereafter.
91
BLOOMBERG is a trademark and service mark of Bloomberg Finance L.P. BARCLAYS is a trademark and service mark of Barclays Bank Plc, used under license. Bloomberg Finance L.P. and its affiliates, including Bloomberg Index Services Limited (BISL) (collectively, Bloomberg), or Bloomberg’s licensors, own all proprietary rights in the Bloomberg Barclays U.S. 1–3 Year Government/Credit ex Baa Index and Bloomberg Barclays U.S. Intermediate Aggregate ex Baa Index (Indices or Bloomberg Barclays Indices).
Neither Barclays Bank Plc, Barclays Capital Inc., or any affiliate (collectively Barclays) or Bloomberg is the issuer or producer of the Institutional Bond Funds and neither Bloomberg nor Barclays has any responsibilities, obligations or duties to investors in the Institutional Bond Funds. The Indices are licensed for use by The Vanguard Group, Inc. (Vanguard) as the sponsor of the Institutional Bond Funds. Bloomberg and Barclays’ only relationship with Vanguard in respect of the Indices is the licensing of the Indices, which are determined, composed and calculated by BISL, or any successor thereto, without regard to the Issuer or the Institutional Bond Funds or the owners of the Institutional Bond Funds.
Additionally, Vanguard may for itself execute transaction(s) with Barclays in or relating to the Indices in connection with the Institutional Bond Funds. Investors acquire the Institutional Bond Funds from Vanguard and investors neither acquire any interest in the Indices nor enter into any relationship of any kind whatsoever with Bloomberg or Barclays upon making an investment in the Institutional Bond Funds. The Institutional Bond Funds are not sponsored, endorsed, sold or promoted by Bloomberg or Barclays. Neither Bloomberg nor Barclays makes any representation or warranty, express or implied regarding the advisability of investing in the Institutional Bond Funds or the advisability of investing in securities generally or the ability of the Indices to track corresponding or relative market performance. Neither Bloomberg nor Barclays has passed on the legality or suitability of the Institutional Bond Funds with respect to any person or entity. Neither Bloomberg nor Barclays is responsible for and has not participated in the determination of the timing of, prices at, or quantities of the Institutional Bond Funds to be issued. Neither Bloomberg nor Barclays has any obligation to take the needs of the Issuer or the owners of the Institutional Bond Funds or any other third party into consideration in determining, composing or calculating the Indices. Neither Bloomberg nor Barclays has any obligation or liability in connection with administration, marketing or trading of the Institutional Bond Funds The licensing agreement between Bloomberg and Barclays is solely for the benefit of Bloomberg and Barclays and not for the benefit of the owners of the Institutional Bond Funds, investors or other third parties. In addition, the licensing agreement between Vanguard and Bloomberg is solely for the benefit of Vanguard and Bloomberg and not for the benefit of the owners of the Institutional Bond Funds, investors or other third parties.
NEITHER BLOOMBERG NOR BARCLAYS SHALL HAVE ANY LIABILITY TO THE ISSUER, INVESTORS OR TO OTHER THIRD PARTIES FOR THE QUALITY, ACCURACY AND/OR COMPLETENESS OF THE BLOOMBERG BARCLAYS INDICES OR ANY DATA INCLUDED THEREIN OR FOR INTERRUPTIONS IN THE DELIVERY OF THE BLOOMBERG BARCLAYS INDICES. NEITHER BLOOMBERG NOR BARCLAYS MAKES ANY WARRANTY, EXPRESS OR IMPLIED, AS TO RESULTS TO BE OBTAINED BY THE ISSUER, THE INVESTORS OR ANY OTHER PERSON OR ENTITY FROM THE USE OF THE BLOOMBERG BARCLAYS INDICES OR ANY DATA INCLUDED THEREIN. NEITHER BLOOMBERG NOR BARCLAYS MAKES ANY EXPRESS OR IMPLIED WARRANTIES, AND EACH HEREBY EXPRESSLY DISCLAIMS ALL WARRANTIES OF MERCHANTABILITY
OR FITNESS FOR A PARTICULAR PURPOSE OR USE WITH RESPECT TO THE BLOOMBERG BARCLAYS INDICES OR ANY DATA INCLUDED THEREIN. BLOOMBERG RESERVES THE RIGHT TO CHANGE THE METHODS OF CALCULATION OR PUBLICATION, OR TO CEASE THE CALCULATION OR PUBLICATION OF THE BLOOMBERG BARCLAYS INDICES, AND NEITHER BLOOMBERG NOR BARCLAYS SHALL BE LIABLE FOR ANY MISCALCULATION OF OR ANY INCORRECT, DELAYED OR INTERRUPTED PUBLICATION WITH RESPECT TO ANY OF THE BLOOMBERG BARCLAYS INDICES. NEITHER BLOOMBERG NOR BARCLAYS SHALL BE LIABLE FOR ANY DAMAGES, INCLUDING, WITHOUT LIMITATION, ANY SPECIAL, INDIRECT OR CONSEQUENTIAL DAMAGES, OR ANY LOST PROFITS AND EVEN IF ADVISED OF THE POSSIBILITY OF SUCH, RESULTING FROM THE USE OF THE BLOOMBERG BARCLAYS INDICES OR ANY DATA INCLUDED THEREIN OR WITH RESPECT TO THE INSTITUTIONAL BOND FUNDS.
None of the information supplied by Bloomberg or Barclays and used in this publication may be reproduced in any manner without the prior written permission of both Bloomberg and Barclays Capital, the investment banking division of Barclays Bank Plc. Barclays Bank Plc is registered in England No. 1026167. Registered office 1 Churchill Place London E14 5HP.
© 2018 Bloomberg. Used with Permission.
Source: Bloomberg Index Services Limited. Copyright 2018, Bloomberg. All rights reserved.
92
The People Who Govern Your Fund
The trustees of your mutual fund are there to see that the fund is operated and managed in your best interests since, as a shareholder, you are a part owner of the fund. Your fund’s trustees also serve on the board of directors of The Vanguard Group, Inc., which is owned by the Vanguard funds and provides services to them on an at-cost basis.
A majority of Vanguard’s board members are independent, meaning that they have no affiliation with Vanguard or the funds they oversee, apart from the sizable personal investments they have made as private individuals. The independent board members have distinguished backgrounds in business, academia, and public service. Each of the trustees and executive officers oversees 211 Vanguard funds.
Information for each trustee and executive officer of the fund appears below. The mailing address of the trustees and officers is P.O. Box 876, Valley Forge, PA 19482. More information about the trustees is in the Statement of Additional Information, which can be obtained, without charge, by contacting Vanguard at 800-662-7447, or online at vanguard.com.
Interested Trustees1
F. William McNabb III
Born in 1957. Trustee since July 2009. Principal occupation(s) during the past five years and other experience: chairman of the board (January 2010–present) of Vanguard and of each of the investment companies served by Vanguard, trustee (2009–present) of each of the investment companies served by Vanguard, and director (2008–present) of Vanguard. Chief executive officer and president (2008–2017) of Vanguard and each of the investment companies served by Vanguard, managing director (1995–2008) of Vanguard, and director (1997–2018) of Vanguard Marketing Corporation. Director (2018–present) of UnitedHealth Group.
Mortimer J. Buckley
Born in 1969. Trustee since January 2018. Principal occupation(s) during the past five years and other experience: chief executive officer (January 2018–present) of Vanguard; chief executive officer, president, and trustee (January 2018–present) of each of the investment companies served by Vanguard; president and director (2017–present) of Vanguard; and president (February 2018–present) of Vanguard Marketing Corporation. Chief investment officer (2013–2017), managing director (2002–2017), head of the Retail Investor Group (2006–2012), and chief information officer (2001–2006) of Vanguard. Chairman of the board (2011–2017) of the Children’s Hospital of Philadelphia.
Independent Trustees
Emerson U. Fullwood
Born in 1948. Trustee since January 2008. Principal occupation(s) during the past five years and other experience: executive chief staff and marketing officer for North America and corporate vice president (retired 2008) of Xerox Corporation (document management products and services). Former president of the Worldwide Channels Group, Latin America, and Worldwide Customer Service and executive chief staff officer of Developing Markets of Xerox. Executive in residence and 2009–2010 Distinguished Minett Professor at the Rochester Institute of Technology. Lead director of SPX FLOW, Inc. (multi-industry manufacturing). Director of the University of Rochester Medical Center, the Monroe Community College Foundation, the United Way of Rochester, North Carolina A&T University, and Roberts Wesleyan College. Trustee of the University of Rochester.
Amy Gutmann
Born in 1949. Trustee since June 2006. Principal occupation(s) during the past five years and other experience: president (2004–present) of the University of Pennsylvania. Christopher H. Browne Distinguished Professor of Political Science, School of Arts and Sciences, and professor of communication, Annenberg School for Communication, with secondary faculty appointments in the Department of Philosophy, School of Arts and Sciences, and at the Graduate School of Education, University of Pennsylvania. Trustee of the National Constitution Center.
1 Mr. McNabb and Mr. Buckley are considered “interested persons,” as defined in the Investment Company Act of 1940, because they are officers of the Vanguard funds.
JoAnn Heffernan Heisen
Born in 1950. Trustee since July 1998. Principal occupation(s) during the past five years and other experience: corporate vice president of Johnson & Johnson (pharmaceuticals/medical devices/consumer products) and member of its executive committee (1997–2008). Chief global diversity officer (retired 2008), vice president and chief information officer (1997–2006), controller (1995–1997), treasurer (1991–1995), and assistant treasurer (1989–1991) of Johnson & Johnson. Director of Skytop Lodge Corporation (hotels) and the Robert Wood Johnson Foundation. Member of the advisory board of the Institute for Women’s Leadership at Rutgers University.
F. Joseph Loughrey
Born in 1949. Trustee since October 2009. Principal occupation(s) during the past five years and other experience: president and chief operating officer (retired 2009) and vice chairman of the board (2008–2009) of Cummins Inc. (industrial machinery). Chairman of the board of Hillenbrand, Inc. (specialized consumer services), Oxfam America, and the Lumina Foundation for Education. Director of the V Foundation for Cancer Research. Member of the advisory council for the College of Arts and Letters and chair of the advisory board to the Kellogg Institute for International Studies, both at the University of Notre Dame.
Mark Loughridge
Born in 1953. Trustee since March 2012. Principal occupation(s) during the past five years and other experience: senior vice president and chief financial officer (retired 2013) of IBM (information technology services). Fiduciary member of IBM’s Retirement Plan Committee (2004–2013), senior vice president and general manager (2002–2004) of IBM Global Financing, vice president and controller (1998–2002) of IBM, and a variety of other prior management roles at IBM. Member of the Council on Chicago Booth.
Scott C. Malpass
Born in 1962. Trustee since March 2012. Principal occupation(s) during the past five years and other experience: chief investment officer (1989–present) and vice president (1996–present) of the University of Notre Dame. Assistant professor of finance at the Mendoza College of Business, University of Notre Dame, and member of the Notre Dame 403(b) Investment Committee. Chairman of the board of TIFF Advisory Services, Inc. Member of the board of Catholic Investment Services, Inc. (investment advisors), the board of advisors for Spruceview Capital Partners, and the board of superintendence of the Institute for the Works of Religion.
Deanna Mulligan
Born in 1963. Trustee since January 2018. Principal occupation(s) during the past five years and other experience: president (2010–present) and chief executive officer (2011–present) of The Guardian Life Insurance Company of America. Chief operating officer (2010–2011) and executive vice president (2008–2010) of Individual Life and Disability of The Guardian Life Insurance Company of America. Member of the board of The Guardian Life Insurance Company of America, the American Council of Life Insurers, the Partnership for New York City (business leadership), and the Committee Encouraging Corporate Philanthropy. Trustee of the Economic Club of New York and the Bruce Museum (arts and science). Member of the Advisory Council for the Stanford Graduate School of Business.
André F. Perold
Born in 1952. Trustee since December 2004. Principal occupation(s) during the past five years and other experience: George Gund Professor of Finance and Banking, Emeritus at the Harvard Business School (retired 2011). Chief investment officer and co-managing partner of HighVista Strategies LLC (private investment firm). Overseer of the Museum of Fine Arts Boston.
Sarah Bloom Raskin
Born in 1961. Trustee since January 2018. Principal occupation(s) during the past five years and other experience: deputy secretary (2014–2017) of the United States Department of the Treasury. Governor (2010–2014) of the Federal Reserve Board. Commissioner (2007–2010) of financial regulation for the State of Maryland. Member of the board of directors (2012–2014) of Neighborhood Reinvestment Corporation. Director of i(x) Investments, LLC.
Peter F. Volanakis
Born in 1955. Trustee since July 2009. Principal occupation(s) during the past five years and other experience: president and chief operating officer (retired 2010) of Corning Incorporated (communications equipment) and director of Corning Incorporated (2000–2010) and Dow Corning (2001–2010). Director (2012) of SPX Corporation (multi-industry manufacturing). Overseer of the Amos Tuck School of Business Administration, Dartmouth College (2001–2013). Chairman of the board of trustees of Colby-Sawyer College. Member of the Board of Hypertherm Inc. (industrial cutting systems, software, and consumables).
Executive Officers
Glenn Booraem
Born in 1967. Principal occupation(s) during the past five years and other experience: principal of Vanguard. Investment stewardship officer (2017–present), treasurer (2015–2017), controller (2010–2015), and assistant controller (2001–2010) of each of the investment companies served by Vanguard.
Christine M. Buchanan
Born in 1970. Principal occupation(s) during the past five years and other experience: principal of Vanguard and global head of Fund Administration at Vanguard. Treasurer (2017–present) of each of the investment companies served by Vanguard. Partner (2005–2017) at KPMG LLP (audit, tax, and advisory services).
Brian Dvorak
Born in 1973. Principal occupation(s) during the past five years and other experience: principal of Vanguard. Chief compliance officer (2017–present) of Vanguard and each of the investment companies served by Vanguard. Assistant vice president (2017–present) of Vanguard Marketing Corporation. Vice president and director of Enterprise Risk Management (2011–2013) at Oppenheimer Funds, Inc.
Thomas J. Higgins
Born in 1957. Principal occupation(s) during the past five years and other experience: principal of Vanguard. Chief financial officer (2008–present) and treasurer (1998–2008) of each of the investment companies served by Vanguard.
Peter Mahoney
Born in 1974. Principal occupation(s) during the past five years and other experience: principal of Vanguard. Controller (2015–present) of each of the investment companies served by Vanguard. Head of International Fund Services (2008–2014) at Vanguard.
Anne E. Robinson
Born in 1970. Principal occupation(s) during the past five years and other experience: general counsel (2016–present) of Vanguard. Secretary (2016–present) of Vanguard and of each of the investment companies served by Vanguard. Managing director (2016–present) of Vanguard. Director and senior vice president (2016–2018) of Vanguard Marketing Corporation. Managing director and general counsel of Global Cards and Consumer Services (2014–2016) at Citigroup. Counsel (2003–2014) at American Express.
Michael Rollings
Born in 1963. Principal occupation(s) during the past five years and other experience: finance director (2017–present) and treasurer (2017) of each of the investment companies served by Vanguard. Managing director (2016–present) of Vanguard. Chief financial officer (2016–present) of Vanguard. Director (2016–present) of Vanguard Marketing Corporation. Executive vice president and chief financial officer (2006–2016) of MassMutual Financial Group.
| |
| Vanguard Senior Management Team |
| |
| Joseph Brennan | Chris D. McIsaac |
| Mortimer J. Buckley | James M. Norris |
| Gregory Davis | Thomas M. Rampulla |
| John James | Karin A. Risi |
| Martha G. King | Anne E. Robinson |
| John T. Marcante | Michael Rollings |
Chairman Emeritus and Senior Advisor
John J. Brennan
Chairman, 1996–2009
Chief Executive Officer and President, 1996–2008
Founder
John C. Bogle
Chairman and Chief Executive Officer, 1974–1996

|
| P.O. Box 2600 |
| Valley Forge, PA 19482-2600 |
| |
| |
| |
| Connect with Vanguard® > vanguard.com |
| |
| |
| |
| Fund Information > 800-662-7447 |
| Direct Investor Account Services > 800-662-2739 |
| Institutional Investor Services > 800-523-1036 |
| Text Telephone for People |
| Who Are Deaf or Hard of Hearing > 800-749-7273 |
| |
| This material may be used in conjunction |
| with the offering of shares of any Vanguard |
| fund only if preceded or accompanied by |
| the fund’s current prospectus. |
| |
| All comparative mutual fund data are from Lipper, a |
| Thomson Reuters Company, or Morningstar, Inc., unless |
| otherwise noted. |
| |
| You can obtain a free copy of Vanguard’s proxy voting |
| guidelines by visiting vanguard.com/proxyreporting or by |
| calling Vanguard at 800-662-2739. The guidelines are |
| also available from the SEC’s website, sec.gov. In |
| addition, you may obtain a free report on how your fund |
| voted the proxies for securities it owned during the 12 |
| months ended June 30. To get the report, visit either |
| vanguard.com/proxyreporting or sec.gov. |
| |
| You can review and copy information about your fund at |
| the SEC’s Public Reference Room in Washington, D.C. To |
| find out more about this public service, call the SEC at |
| 202-551-8090. Information about your fund is also |
| available on the SEC’s website, and you can receive |
| copies of this information, for a fee, by sending a |
| request in either of two ways: via email addressed to |
| publicinfo@sec.gov or via regular mail addressed to the |
| Public Reference Section, Securities and Exchange |
| Commission, Washington, DC 20549-1520. |
| © 2018 The Vanguard Group, Inc. |
| All rights reserved. |
| Vanguard Marketing Corporation, Distributor. |
| |
| Q4720 112018 |
Item 2: Code of Ethics. The Registrant has adopted a code of ethics that applies to the Registrant’s principal executive officer, principal financial officer, principal accounting officer or controller or persons performing similar functions. The Code of Ethics was amended during the reporting period covered by this report to make certain technical, non-material changes.
Item 3: Audit Committee Financial Expert. All members of the Audit Committee have been determined by the Registrant’s Board of Trustees to be Audit Committee Financial Experts and to be independent: JoAnn Heffernan Heisen, F. Joseph Loughrey, Mark Loughridge, Sarah Bloom Raskin, and Peter F. Volanakis.
Item 4: Principal Accountant Fees and Services.
(a) Audit Fees.
Audit Fees of the Registrant
Fiscal Year Ended September 30, 2018: $306,000
Fiscal Year Ended September 30, 2017: $322,000
Aggregate Audit Fees of Registered Investment Companies in the Vanguard Group.
Fiscal Year Ended September 30, 2018: $9,734,277
Fiscal Year Ended September 30, 2017: $8,424,459
Includes fees billed in connection with audits of the Registrant, other registered investment
companies in the Vanguard complex, The Vanguard Group, Inc. and Vanguard Marketing
Corporation.
(b) Audit-Related Fees.
Fiscal Year Ended September 30, 2018: $5,581,336
Fiscal Year Ended September 30, 2017: $3,194,093
Includes fees billed in connection with assurance and related services provided to the Registrant,
other registered investment companies in the Vanguard complex, The Vanguard Group, Inc., and
Vanguard Marketing Corporation.
(c) Tax Fees.
Fiscal Year Ended September 30, 2018: $347,985
Fiscal Year Ended September 30, 2017: $274,313
Includes fees billed in connection with tax compliance, planning, and advice services provided to
the Registrant, other registered investment companies in the Vanguard complex, The Vanguard
Group, Inc., and Vanguard Marketing Corporation.
(d) All Other Fees.
Fiscal Year Ended September 30, 2018: $0
Fiscal Year Ended September 30, 2017: $0
Includes fees billed for services related to tax reported information provided to the Registrant, other registered investment companies in the Vanguard complex, The Vanguard Group, Inc., and Vanguard Marketing Corporation.
(e) (1) Pre-Approval Policies. The policy of the Registrant’s Audit Committee is to consider and, if appropriate, approve before the principal accountant is engaged for such services, all specific audit and non-audit services provided to: the Registrant, other registered investment companies in the Vanguard complex, The Vanguard Group, Inc., and entities controlled by The Vanguard Group, Inc. that provide ongoing services to the Registrant. In making a determination, the Audit Committee considers whether the services are consistent with maintaining the principal accountant’s independence.
In the event of a contingency situation in which the principal accountant is needed to provide services in between scheduled Audit Committee meetings, the Chairman of the Audit Committee would be called on to consider and, if appropriate, pre-approve audit or permitted non-audit services in an amount sufficient to complete services through the next Audit Committee meeting, and to determine if such services would be consistent with maintaining the accountant’s independence. At the next scheduled Audit Committee meeting, services and fees would be presented to the Audit Committee for formal consideration, and, if appropriate, approval by the entire Audit Committee. The Audit Committee would again consider whether such services and fees are consistent with maintaining the principal accountant’s independence.
The Registrant’s Audit Committee is informed at least annually of all audit and non-audit services provided by the principal accountant to the Vanguard complex, whether such services are provided to: the Registrant, other registered investment companies in the Vanguard complex, The Vanguard Group, Inc., or other entities controlled by The Vanguard Group, Inc. that provide ongoing services to the Registrant.
(2) No percentage of the principal accountant’s fees or services were approved pursuant to the waiver provision of paragraph (c)(7)(i)(C) of Rule 2-01 of Regulation S-X.
(f) For the most recent fiscal year, over 50% of the hours worked under the principal accountant’s engagement were not performed by persons other than full-time, permanent employees of the principal accountant.
(g) Aggregate Non-Audit Fees.
Fiscal Year Ended September 30, 2018: $347,985
Fiscal Year Ended September 30, 2017: $274,313
Includes fees billed for non-audit services provided to the Registrant, other registered investment companies in the Vanguard complex, The Vanguard Group, Inc., and Vanguard Marketing Corporation.
(h) For the most recent fiscal year, the Audit Committee has determined that the provision of all non-audit services was consistent with maintaining the principal accountant’s independence.
Item 5: Audit Committee of Listed Registrants.
The Registrant is a listed issuer as defined in rule 10A-3 under the Securities Exchange Act of 1934 (“Exchange Act”). The Registrant has a separately-designated standing audit committee established in accordance with Section 3(a)(58)(A) of the Exchange Act. The Registrant’s audit committee members are: JoAnn Heffernan Heisen, F. Joseph Loughrey, Mark Loughridge, Sarah Bloom Raskin, and Peter F. Volanakis.
Item 6: Investments.
Not Applicable.
Item 7: Disclosure of Proxy Voting Policies and Procedures for Closed-End Management Investment Companies.
Not Applicable.
Item 8: Portfolio Managers of Closed-End Management Investment Companies.
Not Applicable.
Item 9: Purchase of Equity Securities by Closed-End Management Investment Company and Affiliated Purchasers.
Not Applicable.
Item 10: Submission of Matters to a Vote of Security Holders.
Not Applicable.
Item 11: Controls and Procedures.
(a) Disclosure Controls and Procedures. The Principal Executive and Financial Officers concluded that the Registrant’s Disclosure Controls and Procedures are effective based on their evaluation of the Disclosure Controls and Procedures as of a date within 90 days of the filing date of this report.
(b) Internal Control Over Financial Reporting. There were no significant changes in Registrant’s Internal Control Over Financial Reporting or in other factors that could significantly affect this control subsequent to the date of the evaluation, including any corrective actions with regard to significant deficiencies and material weaknesses.
Item 12: Disclosure of Securities Lending Activities for Closed-End Management Investment Companies.
Not Applicable.
Item 13: Exhibits.
| (a) | Code of Ethics. |
| (b) | Certifications. |
Pursuant to the requirements of the Securities Exchange Act of 1934 and the Investment Company Act of 1940, the registrant has duly caused this report to be signed on its behalf by the undersigned, thereunto duly authorized.
| |
| | VANGUARD MALVERN FUNDS |
| |
| |
| /s/ MORTIMER J. BUCKLEY* |
BY: | MORTIMER J. BUCKLEY
CHIEF EXECUTIVE OFFICER |
Date: November 16, 2018
Pursuant to the requirements of the Securities Exchange Act of 1934 and the Investment Company Act of 1940, this report has been signed below by the following persons on behalf of the registrant and in the capacities and on the dates indicated.
| VANGUARD MALVERN FUNDS |
| /s/ MORTIMER J. BUCKLEY * |
BY: | MORTIMER J. BUCKLEY
CHIEF EXECUTIVE OFFICER |
| VANGUARD MALVERN FUNDS |
| /s/ THOMAS J. HIGGINS* |
BY: | THOMAS J. HIGGINS
CHIEF FINANCIAL OFFICER |
Date: November 16, 2018
* By: /s/ Anne E. Robinson
Anne E. Robinson, pursuant to a Power of Attorney filed on January 18, 2018 see file Number 33-32216, Incorporated by Reference.