UNITED STATES
SECURITIES AND EXCHANGE COMMISSION
Washington, D.C. 20549
FORM N-CSR
CERTIFIED SHAREHOLDER REPORT
OF
REGISTERED MANAGEMENT INVESTMENT COMPANIES
| | |
| Investment Company Act file number: | 811-05628 | |
Name of Registrant: | Vanguard Malvern Funds |
Address of Registrant: | P.O. Box 2600 |
| | Valley Forge, PA 19482 |
Name and address of agent for service: | Anne E. Robinson, Esquire |
| | P.O. Box 876 |
| | Valley Forge, PA 19482 |
Registrant’s telephone number, including area code: (610) 669-1000 |
Date of fiscal year end: September 30 | |
Date of reporting period: October 1, 2016 – September 30, 2017 |
Item 1: Reports to Shareholders | |

Annual Report | September 30, 2017
Vanguard U.S. Value Fund
Vanguard’s Principles for Investing Success
We want to give you the best chance of investment success. These principles, grounded in Vanguard’s research and experience, can put you on the right path.
Goals. Create clear, appropriate investment goals.
Balance. Develop a suitable asset allocation using broadly diversified funds. Cost. Minimize cost.
Discipline. Maintain perspective and long-term discipline.
A single theme unites these principles: Focus on the things you can control.
We believe there is no wiser course for any investor.
| |
| Contents | |
| Your Fund’s Performance at a Glance. | 1 |
| Chairman’s Perspective. | 3 |
| Advisor’s Report. | 7 |
| Fund Profile. | 9 |
| Performance Summary. | 10 |
| Financial Statements. | 12 |
| Your Fund’s After-Tax Returns. | 25 |
| About Your Fund’s Expenses. | 26 |
| Glossary. | 28 |
Please note: The opinions expressed in this report are just that—informed opinions. They should not be considered promises
or advice. Also, please keep in mind that the information and opinions cover the period through the date on the front of this
report. Of course, the risks of investing in your fund are spelled out in the prospectus.
See the Glossary for definitions of investment terms used in this report.
About the cover: Nautical images have been part of Vanguard’s rich heritage since its start in 1975. For an
incoming ship, a lighthouse offers a beacon and safe path to shore. You can similarly depend on Vanguard to put
you first––and light the way––as you strive to meet your financial goals. Our client focus and low costs,
stemming from our unique ownership structure, assure that your interests are paramount.
Your Fund’s Performance at a Glance
• For the 12 months ended September 30, 2017, Vanguard U.S. Value Fund
returned nearly 18%, outpacing both its benchmark index and the average return
of its peer group.
• Your fund’s stock selection model generated broad-based performance. The model
focuses on five signals that rank a universe of stocks. Four of those signals—valuation,
growth, sentiment, and management decisions—contributed to performance. In
particular, the valuation and growth signals were significant drivers of the fund’s return.
• Seven of the fund’s 11 industry sectors generated positive results, led by information
technology, materials, and health care.
• Stocks in the energy and consumer discretionary sectors were among those that
detracted most from performance. In addition, growth stocks outperformed their value
counterparts during the period.
| |
| Total Returns: Fiscal Year Ended September 30, 2017 | |
| | Total |
| | Returns |
| Vanguard U.S. Value Fund | 17.87% |
| Russell 3000 Value Index | 15.53 |
| Multi-Cap Value Funds Average | 16.69 |
Multi-Cap Value Funds Average: Derived from data provided by Lipper, a Thomson Reuters Company.
| |
| Total Returns: Ten Years Ended September 30, 2017 | |
| | Average |
| | Annual Return |
| U.S. Value Fund | 6.53% |
| Russell 3000 Value Index | 6.01 |
| Multi-Cap Value Funds Average | 5.39 |
Multi-Cap Value Funds Average: Derived from data provided by Lipper, a Thomson Reuters Company.
The figures shown represent past performance, which is not a guarantee of future results. (Current performance may be lower or higher than the performance data cited. For performance data current to the most recent month-end, visit our website at vanguard.com/performance.) Note, too, that both investment returns and principal value can fluctuate widely, so an investor’s shares, when sold, could be worth more or less than their original cost.
1
| | |
| Expense Ratios | | |
| Your Fund Compared With Its Peer Group | | |
| | | Peer Group |
| | Fund | Average |
| U.S. Value Fund | 0.23% | 1.10% |
The fund expense ratio shown is from the prospectus dated January 26, 2017, and represents estimated costs for the current fiscal year. For the fiscal year ended September 30, 2017, the fund’s expense ratio was 0.23%. The peer-group expense ratio is derived from data provided by Lipper, a Thomson Reuters Company, and captures information through year-end 2016.
Peer group: Multi-Cap Value Funds.
2
Chairman’s Perspective

Bill McNabb
Chairman and Chief Executive Officer
Dear Shareholder,
Our investors depend on Vanguard to be a responsible steward of their assets. This includes our obvious responsibilities—managing the funds, offering investment perspectives and advice, and assisting with questions and transactions.
But because a long-term perspective informs every aspect of our investment approach, we also work on your behalf in less obvious ways, such as by advocating for responsible governance among the companies in which Vanguard funds invest. Vanguard’s index funds are essentially permanent owners of thousands of publicly traded companies, and we have a special obligation to be engaged stewards actively focused on the long term.
Simply put, we believe that well-governed companies are more likely to perform well over the long run.
Although Vanguard has always been an advocate for strong corporate governance, we have expanded our efforts recently as our investor base continues to grow. Our Investment Stewardship team has doubled in size since 2015, and we continue to add analysts, researchers, and operations team members. The team guides our engagement activities and our funds’ proxy voting by analyzing corporate governance practices in companies around the world.
3
Our four Investment Stewardship pillars
As we evaluate company responsiveness to governance matters, including environmental and social concerns, we focus on four key areas—what we call our Investment Stewardship pillars:
• The board: A high-functioning, well-composed, independent, diverse, and experienced board with effective ongoing evaluation practices.
• Governance structures: Provisions and structures that empower shareholders and protect their rights.
• Appropriate compensation: Pay that incentivizes relative outperformance over the long term.
• Risk oversight: Effective, integrated, and ongoing oversight of relevant industry-and company-specific risks.
Guided by these pillars, our Investment Stewardship team conducted more than 950 engagements, or discussions, with company directors and leaders worldwide during the 12 months ended June 30, 2017.
| | | |
| Market Barometer | | | |
| | | Average Annual Total Returns |
| | Periods Ended September 30, 2017 |
| | One Year | Three Years | Five Years |
| Stocks | | | |
| Russell 1000 Index (Large-caps) | 18.54% | 10.63% | 14.27% |
| Russell 2000 Index (Small-caps) | 20.74 | 12.18 | 13.79 |
| Russell 3000 Index (Broad U.S. market) | 18.71 | 10.74 | 14.23 |
| FTSE All-World ex US Index (International) | 19.49 | 5.11 | 7.35 |
| |
| Bonds | | | |
| Bloomberg Barclays U.S. Aggregate Bond Index | | | |
| (Broad taxable market) | 0.07% | 2.71% | 2.06% |
| Bloomberg Barclays Municipal Bond Index | | | |
| (Broad tax-exempt market) | 0.87 | 3.19 | 3.01 |
| Citigroup Three-Month U.S. Treasury Bill Index | 0.64 | 0.28 | 0.18 |
| |
| CPI | | | |
| Consumer Price Index | 2.23% | 1.22% | 1.30% |
4
We also cast more than 171,000 votes on behalf of Vanguard funds at more than 18,000 shareholder meetings.
Gender diversity on boards and climate risk
As we engage with companies, we are devoting increased attention to two specific topics. The first is gender diversity on boards. It’s no secret that the right combination of talent, skills, and experience leads to better results, so we pay close attention to how company boards are structured and managed, and how they evolve.
In recent years, a growing body of research has demonstrated that greater diversity on boards can lead to improved governance and company performance. We are advocating for boards to incorporate diverse perspectives and experience into their strategic planning and decision-making. One example of our commitment to more diverse boards is our participation in the 30% Club, a global coalition working to increase the representation of women in boardrooms and leadership roles.
The second issue is climate risk. We will continue to engage with companies to understand their responses to this risk. Regardless of one’s perspective on the issue, the potential is real for changing regulations, demographics, and consumption behavior to affect business results for companies in many sectors.
We want to ensure that such business and regulatory risks are sufficiently disclosed so investors can value companies appropriately. In the past year, we have voted for shareholder proposals at several energy companies that called for management to improve its climate risk assessment and planning, and we will consider supporting similar proposals if we believe they are beneficial to long-term shareholder value. When a proposal from a shareholder presents a strong case for change, we’re more than willing to fully consider it. And even if the case falls short, these proposals often catalyze a discussion that generates meaningful change over time.
In addition to considering activists’ proposals, we consult research providers and our own network of experts. When we detect material risks to a company’s long-term value (such as bad leadership, poor disclosure, misaligned compensation structures, or threats to shareholder rights), we act with our voice and our vote.
Our stewardship reflects our mission
But we don’t act as independent agents with our own agenda. Every time we speak with a company chairman, CEO, or director, we’re acutely aware of the role we play in representing the economic interests of more than 20 million Vanguard investors. So you can expect us to speak out when we detect threats to the economic interests of our shareholders.
5
We take positions on these matters not because they are inherently good or noble but because they are tied to the long-term economic value of your funds’ investments.
You trust us to represent your interests across the globe. You can be confident we act on that responsibility with the seriousness and dedication it deserves.
To learn more about our Investment Stewardship program, including how our funds have voted, visit https://about. vanguard.com/investment-stewardship/.
As always, thank you for investing with Vanguard.

F. William McNabb III
Chairman and Chief Executive Officer
October 13, 2017
6
Advisor’s Report
For the 12 months ended September 30, 2017, Vanguard U.S. Value Fund returned nearly 18%. The fund bested its benchmark index, the Russell 3000 Value Index, which returned well over 15%. It also outperformed the average return of its peer group.
Investment environment
As the period began, investors cheered stronger-than-expected third-quarter economic growth that stood in contrast to disappointing results earlier in 2016. That exuberance gained steam after the U.S. presidential election as investors anticipated the benefits of the new administration’s policy initiatives focused on tax reform, infrastructure spending, and greater deregulation. That optimism fueled a move toward riskier assets, propelling many bellwether stock indexes to record highs in 2017.
The Federal Reserve also acknowledged the strength of the U.S. economy. In December, as inflation inched closer to the Fed’s 2% target level, it raised the federal funds rate by a quarter percentage point—only the second increase in a decade. Optimism waned a bit in early 2017 as investors realized policy initiatives would take longer to materialize than had been anticipated. But consumers continued to open their wallets and unemployment continued to decline.
Those developments played a large part in the Fed’s decision to raise rates in March and June, pushing its target range to 1%–1.25%. Those moves, along with the
establishment of a framework for trimming its $4.5 trillion balance sheet, took the Fed closer to normalizing monetary policy after its emergency intervention in response to the Great Recession.
Despite those positive developments, disappointing inflation measures confounded some market outlooks. Annualized core inflation softened a little during the spring. In response, the Fed scaled back its 2017 inflation forecast but still expected inflation to move closer to its 2% target over the medium term. Further tightening in the labor market should help, although wage gains have been modest.
Over the period, the broad U.S. equity market (as measured by the Russell 3000 Index) returned nearly 19%. U.S. stock market performance was broad-based; nine of 11 market sectors advanced, led by financials, materials, and industrials. Growth stocks outperformed their value counterparts, small-capitalization stocks topped large-caps, and international and emerging-market equities outperformed their U.S. peers.
Many other countries posted decent growth, but major central banks such as the Bank of Japan, the Bank of England, and the European Central Bank remained in accommodative policy mode as they struggled to balance growth and inflation concerns. Even with a weaker U.S. dollar, comparatively low yields across many developed markets kept U.S. bonds attractive to international investors.
7
Investment objective and strategy
Although it’s important to understand how overall performance is affected by the macroeconomic factors we’ve described, our strategy focuses on company-specific fundamentals—not technical analysis. Our stock selection model evaluates companies within our investment universe to identify those with attractive characteristics that we believe will outperform over the long run.
To do this, we use a strict quantitative process that focuses on a combination of five key themes: high quality—healthy balance sheets and consistent cash-flow generation; effective use of capital—sound investment policies that favor internal over external funding; consistent earnings growth—a demonstrated ability to grow earnings year after year; strong market sentiment—market confirmation of our view; and reasonable valuation—avoidance of overpriced stocks.
The interaction of these themes generates an opinion on all the stocks in our universe each day. We monitor our portfolio based on those rankings and adjust when appropriate. Our approach also includes a dynamic weighting process that shifts the relative importance of the themes over time. Using the results of our model, we then construct our portfolio with the goal of maximizing expected return, while minimizing exposure to risks that our research indicates do not improve returns, such as industry selection and other risks relative to our benchmark.
Our successes and failures
The fund’s outperformance was driven by our valuation signal, especially in the beginning of the period, and our growth signal. The sentiment and management decisions signals contributed to a lesser degree.
Stock selection results were positive in seven sectors, with information technology, materials, and health care leading the way. Energy and consumer discretionary were among the sectors that detracted the most.
Our overweighting of semiconductor manufacturer NVIDIA contributed significantly to our strength in information technology. AK Steel, Chemours, Advanced Micro Devices, and Bank of America were also top contributors.
Energy sector companies such as Denbury Resources, Newfield Exploration, Sanchez Energy, and Chesapeake Energy hurt most.
Portfolio Managers:
James P. Stetler
Binbin Guo, Principal,
Head of Alpha Equity Investments
Vanguard Quantitative Equity Group
October 12, 2017
8
U.S. Value Fund
Fund Profile
As of September 30, 2017
| | | |
| Portfolio Characteristics | | |
| | | | DJ |
| | | | U.S. |
| | | Russell | Total |
| | | 3000 | Market |
| | | Value | FA |
| | Fund | Index | Index |
| Number of Stocks | 230 | 2,110 | 3,808 |
| Median Market Cap | $36.6B | $55.2B | $61.4B |
| Price/Earnings Ratio | 18.0x | 18.8x | 21.9x |
| Price/Book Ratio | 2.1x | 1.9x | 2.9x |
| Return on Equity | 11.5% | 10.9% | 15.1% |
| Earnings Growth | | | |
| Rate | 7.4% | 6.3% | 9.6% |
| Dividend Yield | 2.2% | 2.3% | 1.8% |
| Foreign Holdings | 0.2% | 0.0% | 0.0% |
| Turnover Rate | 95% | — | — |
| Ticker Symbol | VUVLX | — | — |
| Expense Ratio1 | 0.23% | — | — |
| 30-Day SEC Yield | 2.07% | — | — |
| Short-Term Reserves | 0.2% | — | — |
| | | |
| Sector Diversification (% of equity exposure) |
| | | Russell | DJ |
| | | 3000 | U.S. Total |
| | | Value | Market |
| | Fund | Index | FA Index |
| Consumer Discretionary | 7.0% | 7.0% | 12.3% |
| Consumer Staples | 8.3 | 8.2 | 7.3 |
| Energy | 10.4 | 10.5 | 5.8 |
| Financials | 26.2 | 26.4 | 15.0 |
| Health Care | 13.3 | 13.3 | 14.0 |
| Industrials | 8.9 | 8.8 | 10.8 |
| Information Technology | 8.4 | 8.3 | 22.3 |
| Materials | 2.9 | 3.0 | 3.4 |
| Real Estate | 5.4 | 5.3 | 4.0 |
| Telecommunication | | | |
| Services | 3.0 | 3.0 | 2.0 |
| Utilities | 6.2 | 6.2 | 3.1 |
| | |
| Volatility Measures | | |
| | Russell | DJ |
| | 3000 | U.S. Total |
| | Value | Market |
| | Index | FA Index |
| R-Squared | 0.94 | 0.86 |
| Beta | 1.01 | 0.98 |
These measures show the degree and timing of the fund’s
fluctuations compared with the indexes over 36 months.
| | |
| Ten Largest Holdings (% of total net assets) |
| Exxon Mobil Corp. | Integrated Oil & Gas | 3.1% |
| JPMorgan Chase & Co. | Diversified Banks | 3.1 |
| Chevron Corp. | Integrated Oil & Gas | 2.2 |
| Procter & Gamble Co. | Household Products | 2.2 |
| Berkshire Hathaway Inc. Multi-Sector | |
| | Holdings | 2.1 |
| Pfizer Inc. | Pharmaceuticals | 2.1 |
| Bank of America Corp. | Diversified Banks | 2.1 |
| Citigroup Inc. | Diversified Banks | 2.1 |
| AT&T Inc. | Integrated | |
| | Telecommunication | |
| | Services | 2.0 |
| Johnson & Johnson | Pharmaceuticals | 1.9 |
| Top Ten | | 22.9% |
The holdings listed exclude any temporary cash investments and
equity index products.
Investment Focus
Sector categories are based on the Global Industry Classification
Standard (“GICS”), except for the “Other” category (if applicable),
which includes securities that have not been provided a GICS
classification as of the effective reporting period.
1 The expense ratio shown is from the prospectus dated January 26, 2017, and represents estimated costs for the current fiscal year. For the fiscal year ended September 30, 2017, the expense ratio was 0.23%.
9
U.S. Value Fund
Performance Summary
All of the returns in this report represent past performance, which is not a guarantee of future results that may be achieved by the fund. (Current performance may be lower or higher than the performance data cited. For performance data current to the most recent month-end, visit our website at vanguard.com/performance.) Note, too, that both investment returns and principal value can fluctuate widely, so an investor’s shares, when sold, could be worth more or less than their original cost. The returns shown do not reflect taxes that a shareholder would pay on fund distributions or on the sale of fund shares.
Cumulative Performance: September 30, 2007, Through September 30, 2017
Initial Investment of $10,000

| | | | | |
| | | Average Annual Total Returns | |
| | | Periods Ended September 30, 2017 | |
| | | | | | Final Value |
| | | One | Five | Ten | of a $10,000 |
| | | Year | Years | Years | Investment |
| | U.S. Value Fund* | 17.87% | 14.01% | 6.53% | $18,830 |
| • • • • • • • • | Russell 3000 Value Index | 15.53 | 13.20 | 6.01 | 17,926 |
| – – – – | Multi-Cap Value Funds Average | 16.69 | 12.32 | 5.39 | 16,908 |
| | Dow Jones U.S. Total Stock Market | | | | |
| | Float Adjusted Index | 18.67 | 14.15 | 7.64 | 20,887 |
| Multi-Cap Value Funds Average: Derived from data provided by Lipper, a Thomson Reuters Company. | | |
See Financial Highlights for dividend and capital gains information.
10
U.S. Value Fund
Fiscal-Year Total Returns (%): September 30, 2007, Through September 30, 2017

11
U.S. Value Fund
Financial Statements
Statement of Net Assets
As of September 30, 2017
The fund reports a complete list of its holdings in regulatory filings four times in each fiscal year, at the quarter-ends. For the second and fourth fiscal quarters, the lists appear in the fund’s semiannual and annual reports to shareholders. For the first and third fiscal quarters, the fund files the lists with the Securities and Exchange Commission on Form N-Q. Shareholders can look up the fund’s Forms N-Q on the SEC’s website at sec.gov. Forms N-Q may also be reviewed and copied at the SEC’s Public Reference Room (see the back cover of this report for further information).
| | | |
| | | | Market |
| | | | Value• |
| | | Shares | ($000) |
| Common Stocks (99.5%)1 | | |
| Consumer Discretionary (7.0%) | |
| | Best Buy Co. Inc. | 184,448 | 10,506 |
| | Comcast Corp. Class A | 263,023 | 10,121 |
| | Coach Inc. | 232,498 | 9,365 |
| | Lear Corp. | 54,053 | 9,356 |
| | Carnival Corp. | 141,480 | 9,135 |
| * | Liberty Media Corp- | | |
| | Liberty SiriusXM Class | | |
| | A Shares | 210,839 | 8,834 |
| * | Burlington Stores Inc. | 87,400 | 8,343 |
| * | Discovery | | |
| | Communications Inc. | | |
| | Class A | 299,521 | 6,377 |
| | New York Times Co. | | |
| | Class A | 316,333 | 6,200 |
| | General Motors Co. | 143,549 | 5,797 |
| | Royal Caribbean | | |
| | Cruises Ltd. | 47,745 | 5,660 |
| | Hasbro Inc. | 41,730 | 4,076 |
| * | Cooper-Standard | | |
| | Holdings Inc. | 26,268 | 3,046 |
| | Twenty-First Century | | |
| | Fox Inc. Class A | 108,834 | 2,871 |
| | MDC Holdings Inc. | 84,154 | 2,795 |
| | Office Depot Inc. | 601,483 | 2,731 |
| | Ralph Lauren Corp. | | |
| | Class A | 25,591 | 2,259 |
| | Twenty-First Century | | |
| | Fox Inc. | 52,971 | 1,366 |
| | Target Corp. | 19,185 | 1,132 |
| ^ | Big 5 Sporting Goods | | |
| | Corp. | 145,850 | 1,116 |
| | Time Warner Inc. | 10,030 | 1,028 |
| * | Iconix Brand Group Inc. | 175,125 | 996 |
| | Aaron’s Inc. | 20,592 | 898 |
| | Tailored Brands Inc. | 59,475 | 859 |
| * | Gray Television Inc. | 36,005 | 565 |
| | | |
| | KB Home | 23,075 | 557 |
| | Toll Brothers Inc. | 11,389 | 472 |
| | | | 116,461 |
| Consumer Staples (8.2%) | | |
| | Procter & Gamble Co. | 397,545 | 36,169 |
| | Philip Morris | | |
| | International Inc. | 213,172 | 23,664 |
| | Wal-Mart Stores Inc. | 274,463 | 21,447 |
| | Walgreens Boots | | |
| | Alliance Inc. | 148,670 | 11,480 |
| | Conagra Brands Inc. | 289,686 | 9,774 |
| | Sanderson Farms Inc. | 57,160 | 9,232 |
| | Hershey Co. | 64,543 | 7,046 |
| | PepsiCo Inc. | 44,280 | 4,934 |
| | Bunge Ltd. | 55,176 | 3,832 |
| * | Pilgrim’s Pride Corp. | 112,317 | 3,191 |
| | CVS Health Corp. | 39,202 | 3,188 |
| | Universal Corp. | 19,523 | 1,119 |
| * | HRG Group Inc. | 57,067 | 891 |
| | Campbell Soup Co. | 17,676 | 828 |
| | Kimberly-Clark Corp. | 7,010 | 825 |
| | | | 137,620 |
| Energy (10.4%) | | |
| | Exxon Mobil Corp. | 640,325 | 52,494 |
| | Chevron Corp. | 316,482 | 37,187 |
| | Valero Energy Corp. | 174,527 | 13,426 |
| | Halliburton Co. | 220,379 | 10,144 |
| | Williams Cos. Inc. | 333,707 | 10,015 |
| *,^ | Chesapeake Energy | | |
| | Corp. | 1,809,458 | 7,781 |
| | Devon Energy Corp. | 168,409 | 6,182 |
| | Baker Hughes a GE Co. | 134,641 | 4,931 |
| ^ | RPC Inc. | 197,635 | 4,899 |
| * | Newfield Exploration Co. | 157,753 | 4,680 |
| * | Peabody Energy Corp. | 155,297 | 4,505 |
| | Phillips 66 | 43,157 | 3,954 |
| | Schlumberger Ltd. | 49,084 | 3,424 |
| * | Exterran Corp. | 99,487 | 3,145 |
12
U.S. Value Fund
| | | |
| | | | Market |
| | | | Value• |
| | | Shares | ($000) |
| * | Laredo Petroleum Inc. | 149,318 | 1,931 |
| * | Abraxas Petroleum Corp. | 516,877 | 972 |
| | Delek US Holdings Inc. | 31,474 | 841 |
| * | Denbury Resources Inc. | 602,127 | 807 |
| * | W&T Offshore Inc. | 257,786 | 786 |
| * | SandRidge Energy Inc. | 32,793 | 659 |
| * | McDermott International | | |
| | Inc. | 76,382 | 555 |
| * | REX American Resources | | |
| | Corp. | 5,003 | 469 |
| | CVR Energy Inc. | 17,177 | 445 |
| | | | 174,232 |
| Financials (26.1%) | | |
| | JPMorgan Chase & Co. | 540,838 | 51,655 |
| * | Berkshire Hathaway Inc. | | |
| | Class B | 193,497 | 35,472 |
| | Bank of America Corp. | 1,388,345 | 35,181 |
| | Citigroup Inc. | 475,238 | 34,569 |
| | Wells Fargo & Co. | 464,484 | 25,616 |
| | Goldman Sachs Group Inc. | 85,230 | 20,216 |
| | PNC Financial Services | | |
| | Group Inc. | 128,872 | 17,368 |
| | Morgan Stanley | 356,198 | 17,158 |
| | Bank of New York | | |
| | Mellon Corp. | 293,952 | 15,585 |
| | State Street Corp. | 137,477 | 13,135 |
| | Aflac Inc. | 148,012 | 12,047 |
| | Regions Financial Corp. | 764,727 | 11,647 |
| | Citizens Financial | | |
| | Group Inc. | 307,046 | 11,628 |
| | Allstate Corp. | 123,602 | 11,360 |
| | Lincoln National Corp. | 151,072 | 11,101 |
| | T. Rowe Price Group Inc. | 120,522 | 10,925 |
| | Unum Group | 206,536 | 10,560 |
| | Comerica Inc. | 127,670 | 9,736 |
| | Everest Re Group Ltd. | 42,594 | 9,728 |
| | Ameriprise Financial Inc. | 61,656 | 9,157 |
| | Assured Guaranty Ltd. | 224,235 | 8,465 |
| * | Walker & Dunlop Inc. | 130,529 | 6,831 |
| | Discover Financial | | |
| | Services | 105,159 | 6,781 |
| | Zions Bancorporation | 143,376 | 6,764 |
| | Leucadia National Corp. | 211,444 | 5,339 |
| | Universal Insurance | | |
| | Holdings Inc. | 217,019 | 4,991 |
| | American Express Co. | 51,238 | 4,635 |
| | SunTrust Banks Inc. | 57,003 | 3,407 |
| | CNO Financial Group Inc. | 138,788 | 3,239 |
| | Torchmark Corp. | 28,164 | 2,256 |
| | US Bancorp | 40,502 | 2,170 |
| | East West Bancorp Inc. | 32,318 | 1,932 |
| | Primerica Inc. | 19,997 | 1,631 |
| | Raymond James | | |
| | Financial Inc. | 10,558 | 890 |
| | Ally Financial Inc. | 35,344 | 857 |
| | | |
| * | Credit Acceptance Corp. | 3,036 | 851 |
| | Principal Financial Group | | |
| | Inc. | 12,925 | 832 |
| | American Financial Group | | |
| | Inc. | 7,995 | 827 |
| | Federal Agricultural | | |
| | Mortgage Corp. | 10,908 | 793 |
| | Capital One Financial Corp. | 6,843 | 579 |
| | | | 437,914 |
| Health Care (13.3%) | | |
| | Pfizer Inc. | 991,878 | 35,410 |
| | Johnson & Johnson | 250,973 | 32,629 |
| | Merck & Co. Inc. | 457,173 | 29,273 |
| | Bristol-Myers Squibb Co. | 251,719 | 16,044 |
| | Anthem Inc. | 75,730 | 14,380 |
| * | Centene Corp. | 108,191 | 10,470 |
| | Agilent Technologies Inc. | 158,181 | 10,155 |
| | Cigna Corp. | 50,260 | 9,396 |
| | Humana Inc. | 35,454 | 8,638 |
| * | WellCare Health Plans Inc. | 49,772 | 8,548 |
| * | Quintiles IMS Holdings Inc. | 89,051 | 8,466 |
| | Baxter International Inc. | 134,006 | 8,409 |
| | Aetna Inc. | 49,648 | 7,894 |
| * | Express Scripts Holding Co. 124,595 | 7,889 |
| | Medtronic plc | 56,027 | 4,357 |
| | Amgen Inc. | 22,337 | 4,165 |
| | Abbott Laboratories | 39,877 | 2,128 |
| * | Exelixis Inc. | 60,640 | 1,469 |
| * | INC Research Holdings | | |
| | Inc. Class A | 17,240 | 902 |
| | Allergan plc | 3,939 | 807 |
| * | OraSure Technologies Inc. | 26,786 | 603 |
| | | | 222,032 |
| Industrials (8.8%) | | |
| | Honeywell International | | |
| | Inc. | 99,030 | 14,037 |
| | General Electric Co. | 570,370 | 13,792 |
| | Oshkosh Corp. | 121,671 | 10,043 |
| | Spirit AeroSystems | | |
| | Holdings Inc. Class A | 128,241 | 9,967 |
| | Caterpillar Inc. | 79,655 | 9,934 |
| | Owens Corning | 122,641 | 9,486 |
| * | United Rentals Inc. | 67,229 | 9,327 |
| | Lockheed Martin Corp. | 29,826 | 9,255 |
| | SkyWest Inc. | 179,152 | 7,865 |
| | Quad/Graphics Inc. | 301,013 | 6,806 |
| * | United Continental | | |
| | Holdings Inc. | 101,363 | 6,171 |
| | Global Brass & Copper | | |
| | Holdings Inc. | 177,763 | 6,008 |
| | Copa Holdings SA Class A | 42,473 | 5,289 |
| | Waste Management Inc. | 56,484 | 4,421 |
| | Wabash National Corp. | 183,039 | 4,177 |
| * | Meritor Inc. | 147,959 | 3,848 |
| | Timken Co. | 67,507 | 3,277 |
13
U.S. Value Fund
| | | |
| | | | Market |
| | | | Value• |
| | | Shares | ($000) |
| * | Rush Enterprises Inc. | | |
| | Class A | 60,929 | 2,820 |
| | United Technologies Corp. | 20,219 | 2,347 |
| | GATX Corp. | 32,163 | 1,980 |
| * | Hawaiian Holdings Inc. | 44,826 | 1,683 |
| | American Airlines | | |
| | Group Inc. | 34,805 | 1,653 |
| | Allison Transmission | | |
| | Holdings Inc. | 32,313 | 1,213 |
| * | Harsco Corp. | 54,845 | 1,146 |
| | Rockwell Automation Inc. | 4,662 | 831 |
| | CECO Environmental Corp. | 46,275 | 392 |
| | | | 147,768 |
| Information Technology (8.3%) | |
| | Intel Corp. | 362,945 | 13,821 |
| | HP Inc. | 670,001 | 13,373 |
| | Cisco Systems Inc. | 376,386 | 12,658 |
| | Applied Materials Inc. | 188,617 | 9,825 |
| | Booz Allen Hamilton | | |
| | Holding Corp. Class A | 247,213 | 9,243 |
| *,^ | VMware Inc. Class A | 84,151 | 9,188 |
| *,^ | Advanced Micro Devices | | |
| | Inc. | 626,522 | 7,988 |
| | Oracle Corp. | 160,329 | 7,752 |
| | CDW Corp. | 115,793 | 7,642 |
| * | TTM Technologies Inc. | 463,242 | 7,120 |
| * | Extreme Networks Inc. | 443,102 | 5,268 |
| | DXC Technology Co. | 59,226 | 5,086 |
| | Travelport Worldwide Ltd. | 273,100 | 4,288 |
| * | CACI International Inc. | | |
| | Class A | 27,637 | 3,851 |
| | SYNNEX Corp. | 27,238 | 3,446 |
| * | ON Semiconductor Corp. | 140,265 | 2,591 |
| * | Anixter International Inc. | 29,302 | 2,491 |
| * | Amkor Technology Inc. | 234,081 | 2,470 |
| * | Dell Technologies Inc. | | |
| | Class V | 31,693 | 2,447 |
| | Western Digital Corp. | 21,144 | 1,827 |
| * | Micron Technology Inc. | 34,667 | 1,363 |
| | QUALCOMM Inc. | 26,000 | 1,348 |
| * | Ultra Clean Holdings Inc. | 40,914 | 1,253 |
| * | Sigma Designs Inc. | 165,961 | 1,046 |
| | Convergys Corp. | 23,908 | 619 |
| * | Unisys Corp. | 58,504 | 497 |
| * | Alpha & Omega | | |
| | Semiconductor Ltd. | 19,824 | 327 |
| * | Sykes Enterprises Inc. | 9,568 | 279 |
| | | | 139,107 |
| Materials (2.9%) | | |
| * | Freeport-McMoRan Inc. | 697,621 | 9,794 |
| | Huntsman Corp. | 342,172 | 9,382 |
| | Chemours Co. | 182,453 | 9,234 |
| * | Owens-Illinois Inc. | 345,192 | 8,685 |
| * | Louisiana-Pacific Corp. | 312,512 | 8,463 |
| | | |
| * | AdvanSix Inc. | 43,990 | 1,749 |
| | DowDuPont Inc. | 19,627 | 1,359 |
| * | Alcoa Corp. | 9,095 | 424 |
| | | | 49,090 |
| Real Estate (5.4%) | | |
| ^ | Omega Healthcare | | |
| | Investors Inc. | 284,946 | 9,093 |
| | Hospitality Properties | | |
| | Trust | 308,949 | 8,802 |
| | Lexington Realty Trust | 705,509 | 7,210 |
| | Senior Housing | | |
| | Properties Trust | 348,210 | 6,808 |
| | CoreCivic Inc. | 229,070 | 6,132 |
| | Sabra Health Care | | |
| | REIT Inc. | 270,866 | 5,943 |
| | GEO Group Inc. | 219,073 | 5,893 |
| *,2 | Forestar Group Inc. | 274,347 | 4,719 |
| | Xenia Hotels & Resorts | | |
| | Inc. | 216,625 | 4,560 |
| | Sunstone Hotel Investors | | |
| | Inc. | 283,139 | 4,550 |
| | CorEnergy Infrastructure | | |
| | Trust Inc. | 117,483 | 4,153 |
| | Government Properties | | |
| | Income Trust | 211,584 | 3,971 |
| | LaSalle Hotel Properties | 134,889 | 3,914 |
| | Select Income REIT | 119,680 | 2,803 |
| | Prologis Inc. | 35,223 | 2,235 |
| | NorthStar Realty Europe | | |
| | Corp. | 153,722 | 1,969 |
| ^ | Uniti Group Inc. | 116,709 | 1,711 |
| | National Health | | |
| | Investors Inc. | 20,588 | 1,591 |
| | Getty Realty Corp. | 35,690 | 1,021 |
| | Essex Property Trust Inc. | 3,629 | 922 |
| | Ashford Hospitality | | |
| | Trust Inc. | 128,054 | 854 |
| | Park Hotels & Resorts Inc. | 15,667 | 432 |
| | Chesapeake Lodging Trust | 12,749 | 344 |
| | Tier REIT Inc. | 17,398 | 336 |
| | | | 89,966 |
| Telecommunication Services (3.0%) | |
| | AT&T Inc. | 841,647 | 32,967 |
| * | T-Mobile US Inc. | 144,633 | 8,918 |
| * | Sprint Corp. | 496,059 | 3,859 |
| | Verizon Communications | | |
| | Inc. | 72,669 | 3,597 |
| | | | 49,341 |
| Utilities (6.1%) | | |
| | NextEra Energy Inc. | 114,889 | 16,837 |
| | PG&E Corp. | 187,919 | 12,795 |
| | CenterPoint Energy Inc. | 349,101 | 10,197 |
| | FirstEnergy Corp. | 320,282 | 9,874 |
| | Entergy Corp. | 129,275 | 9,872 |
14
U.S. Value Fund
| | | |
| | | | Market |
| | | | Value• |
| | | Shares | ($000) |
| | Ameren Corp. | 170,225 | 9,846 |
| | National Fuel Gas Co. | 154,473 | 8,745 |
| | NRG Energy Inc. | 239,855 | 6,138 |
| | DTE Energy Co. | 51,184 | 5,495 |
| | MDU Resources Group Inc. | 179,041 | 4,646 |
| | Xcel Energy Inc. | 76,688 | 3,629 |
| | PNM Resources Inc. | 56,434 | 2,274 |
| | AES Corp. | 146,749 | 1,617 |
| | Avangrid Inc. | 19,456 | 923 |
| | | | 102,888 |
| Total Common Stocks | | |
| (Cost $1,407,471) | | 1,666,419 |
| Temporary Cash Investments (1.4%)1 | |
| Money Market Fund (1.3%) | | |
| 3,4 | Vanguard Market Liquidity | | |
| | Fund, 1.223% | 222,053 | 22,210 |
| |
| | | Face | |
| | | Amount | |
| | | ($000) | |
| U. S. Government and Agency Obligations (0.1%) |
| 5 | United States Cash | | |
| | Management Bill, | | |
| | 1.048%, 1/2/18 | 1,000 | 997 |
| 5 | United States Treasury Bill, | | |
| | 1.107%, 12/28/17 | 400 | 399 |
| | | | 1,396 |
| Total Temporary Cash Investments | |
| (Cost $23,604) | | 23,606 |
| Total Investments (100.9%) | | |
| (Cost $1,431,075) | | 1,690,025 |
| |
| | Amount |
| | ($000) |
| Other Assets and Liabilities (-0.9%) | |
| Other Assets | |
| Receivables for Investment Securities Sold | 265 |
| Investment in Vanguard | 102 |
| Receivables for Accrued Income | 1,947 |
| Receivables for Capital Shares Issued | 597 |
| Variation Margin Receivable-Futures | |
| Contracts | 32 |
| Other Assets | 3,202 |
| Total Other Assets | 6,145 |
| Liabilities | |
| Payables for Investment Securities | |
| Purchased | (6,724) |
| Collateral for Securities on Loan | (11,837) |
| Payables for Capital Shares Redeemed | (914) |
| Payables to Vanguard | (1,380) |
| Other Liabilities | (4) |
| Total Liabilities | (20,859) |
| Net Assets (100%) | |
| Applicable to 85,358,971 outstanding | |
| $.001 par value shares of beneficial | |
| interest (unlimited authorization) | 1,675,311 |
| Net Asset Value Per Share | $19.63 |
15
U.S. Value Fund
| |
| At September 30, 2017, net assets consisted of: |
| | Amount |
| | ($000) |
| Paid-in Capital | 1,301,912 |
| Undistributed Net Investment Income | 23,033 |
| Accumulated Net Realized Gains | 91,362 |
| Unrealized Appreciation (Depreciation) | |
| Investment Securities | 258,950 |
| Futures Contracts | 54 |
| Net Assets | 1,675,311 |
• See Note A in Notes to Financial Statements.
* Non-income-producing security.
^ Includes partial security positions on loan to broker-dealers.
The total value of securities on loan is $11,344,000.
1 The fund invests a portion of its cash reserves in equity
markets through the use of index futures contracts. After
giving effect to futures investments, the fund’s effective
common stock and temporary cash investment positions
represent 100.0% and 0.9%, respectively, of net assets.
2 Security value determined using significant unobservable
inputs.
3 Affiliated money market fund available only to Vanguard funds
and certain trusts and accounts managed by Vanguard. Rate
shown is the 7-day yield.
4 Includes $11,837,000 of collateral received for securities
on loan.
5 Securities with a value of $509,000 have been segregated as
initial margin for open futures contracts.
REIT—Real Estate Investment Trust.
| | | | |
| Derivative Financial Instruments Outstanding as of Period End | | |
| |
| Futures Contracts | | | | |
| | | | | ($000) |
| | | | | Value and |
| | | Number of | | Unrealized |
| | | Long (Short) | Notional | Appreciation |
| | Expiration | Contracts | Amount | (Depreciation) |
| Long Futures Contracts | | | | |
| E-mini S&P 500 Index | December 2017 | 69 | 8,681 | 54 |
Unrealized appreciation (depreciation) on open futures contracts is required to be treated as realized gain (loss) for tax purposes.
See accompanying Notes, which are an integral part of the Financial Statements.
16
U.S. Value Fund
| |
| Statement of Operations | |
| |
| | Year Ended |
| | September 30, 2017 |
| | ($000) |
| Investment Income | |
| Income | |
| Dividends | 39,716 |
| Interest1 | 79 |
| Securities Lending—Net | 725 |
| Total Income | 40,520 |
| Expenses | |
| The Vanguard Group—Note B | |
| Investment Advisory Services | 1,034 |
| Management and Administrative | 2,146 |
| Marketing and Distribution | 270 |
| Custodian Fees | 24 |
| Auditing Fees | 35 |
| Shareholders’ Reports and Proxy | 87 |
| Trustees’ Fees and Expenses | 2 |
| Total Expenses | 3,598 |
| Net Investment Income | 36,922 |
| Realized Net Gain (Loss) | |
| Investment Securities Sold1 | 99,442 |
| Futures Contracts | 1,349 |
| Realized Net Gain (Loss) | 100,791 |
| Change in Unrealized Appreciation (Depreciation) | |
| Investment Securities1 | 109,838 |
| Futures Contracts | 38 |
| Change in Unrealized Appreciation (Depreciation) | 109,876 |
| Net Increase (Decrease) in Net Assets Resulting from Operations | 247,589 |
1 Interest income, realized net gain (loss), and change in unrealized appreciation (depreciation) from an affiliated company of the fund were $74,000, $3,000, and $0, respectively.
See accompanying Notes, which are an integral part of the Financial Statements.
17
U.S. Value Fund
| | |
| Statement of Changes in Net Assets | | |
| |
| | Year Ended September 30, |
| | 2017 | 2016 |
| | ($000) | ($000) |
| Increase (Decrease) in Net Assets | | |
| Operations | | |
| Net Investment Income | 36,922 | 34,546 |
| Realized Net Gain (Loss) | 100,791 | 23,090 |
| Change in Unrealized Appreciation (Depreciation) | 109,876 | 81,526 |
| Net Increase (Decrease) in Net Assets Resulting from Operations | 247,589 | 139,162 |
| Distributions | | |
| Net Investment Income | (30,933) | (26,754) |
| Realized Capital Gain1 | (22,230) | (48,800) |
| Total Distributions | (53,163) | (75,554) |
| Capital Share Transactions | | |
| Issued | 422,683 | 306,212 |
| Issued in Lieu of Cash Distributions | 50,256 | 71,550 |
| Redeemed | (365,711) | (282,648) |
| Net Increase (Decrease) from Capital Share Transactions | 107,228 | 95,114 |
| Total Increase (Decrease) | 301,654 | 158,722 |
| Net Assets | | |
| Beginning of Period | 1,373,657 | 1,214,935 |
| End of Period2 | 1,675,311 | 1,373,657 |
1 Includes fiscal 2017 and 2016 short-term gain distributions totaling $0 and $0, respectively. Short-term gain distributions are treated as ordinary income dividends for tax purposes.
2 Net Assets—End of Period includes undistributed (overdistributed) net investment income of $23,033,000 and $20,151,000.
See accompanying Notes, which are an integral part of the Financial Statements.
18
| | | | | |
| U.S. Value Fund | | | | | |
| |
| |
| Financial Highlights | | | | | |
| |
| |
| For a Share Outstanding | | | Year Ended September 30, |
| Throughout Each Period | 2017 | 2016 | 2015 | 2014 | 2013 |
| Net Asset Value, Beginning of Period | $17.25 | $16.48 | $16.95 | $14.41 | $11.89 |
| Investment Operations | | | | | |
| Net Investment Income | . 4371 | .440 | .355 | .299 | .304 |
| Net Realized and Unrealized Gain (Loss) | | | | | |
| on Investments | 2.606 | 1.341 | (.543) | 2.531 | 2.506 |
| Total from Investment Operations | 3.043 | 1.781 | (.188) | 2.830 | 2.810 |
| Distributions | | | | | |
| Dividends from Net Investment Income | (. 386) | (. 358) | (. 282) | (. 290) | (. 290) |
| Distributions from Realized Capital Gains | (.277) | (.653) | — | — | — |
| Total Distributions | (. 663) | (1.011) | (. 282) | (. 290) | (. 290) |
| Net Asset Value, End of Period | $19.63 | $17.25 | $16.48 | $16.95 | $14.41 |
| |
| Total Return2 | 17.87% | 11.09% | -1.18% | 19.89% | 24.16% |
| |
| Ratios/Supplemental Data | | | | | |
| Net Assets, End of Period (Millions) | $1,675 | $1,374 | $1,215 | $1,117 | $829 |
| Ratio of Total Expenses to Average Net Assets | 0.23% | 0.23% | 0.26% | 0.29% | 0.29% |
| Ratio of Net Investment Income to | | | | | |
| Average Net Assets | 2.36% | 2.63% | 2.10% | 1.92% | 2.26% |
| Portfolio Turnover Rate | 95% | 76% | 66% | 57% | 75% |
1 Calculated based on average shares outstanding.
2 Total returns do not include account service fees that may have applied in the periods shown. Fund prospectuses provide information about any applicable account service fees.
See accompanying Notes, which are an integral part of the Financial Statements.
19
U.S. Value Fund
Notes to Financial Statements
Vanguard U.S. Value Fund is registered under the Investment Company Act of 1940 as an open-end investment company, or mutual fund.
A. The following significant accounting policies conform to generally accepted accounting principles for U.S. investment companies. The fund consistently follows such policies in preparing its financial statements.
1. Security Valuation: Securities are valued as of the close of trading on the New York Stock Exchange (generally 4 p.m., Eastern time) on the valuation date. Equity securities are valued at the latest quoted sales prices or official closing prices taken from the primary market in which each security trades; such securities not traded on the valuation date are valued at the mean of the latest quoted bid and asked prices. Securities for which market quotations are not readily available, or whose values have been materially affected by events occurring before the fund’s pricing time but after the close of the securities’ primary markets, are valued by methods deemed by the board of trustees to represent fair value. Investments in Vanguard Market Liquidity Fund are valued at that fund’s net asset value. Temporary cash investments are valued using the latest bid prices or using valuations based on a matrix system (which considers such factors as security prices, yields, maturities, and ratings), both as furnished by independent pricing services.
2. Futures Contracts: The fund uses index futures contracts to a limited extent, with the objective of maintaining full exposure to the stock market while maintaining liquidity. The fund may purchase or sell futures contracts to achieve a desired level of investment, whether to accommodate portfolio turnover or cash flows from capital share transactions. The primary risks associated with the use of futures contracts are imperfect correlation between changes in market values of stocks held by the fund and the prices of futures contracts, and the possibility of an illiquid market. Counterparty risk involving futures is mitigated because a regulated clearinghouse is the counterparty instead of the clearing broker. To further mitigate counterparty risk, the fund trades futures contracts on an exchange, monitors the financial strength of its clearing brokers and clearinghouse, and has entered into clearing agreements with its clearing brokers. The clearinghouse imposes initial margin requirements to secure the fund’s performance and requires daily settlement of variation margin representing changes in the market value of each contract.
Futures contracts are valued at their quoted daily settlement prices. The notional amounts of the contracts are not recorded in the Statement of Net Assets. Fluctuations in the value of the contracts are recorded in the Statement of Net Assets as an asset (liability) and in the Statement of Operations as unrealized appreciation (depreciation) until the contracts are closed, when they are recorded as realized futures gains (losses).
During the year ended September 30, 2017, the fund’s average investments in long and short futures contracts represented less than 1% and 0% of net assets, respectively, based on the average of the notional amounts at each quarter-end during the period.
3. Federal Income Taxes: The fund intends to continue to qualify as a regulated investment company and distribute all of its taxable income. Management has analyzed the fund’s tax positions taken for all open federal income tax years (September 30, 2014–2017), and has concluded that no provision for federal income tax is required in the fund’s financial statements.
20
U.S. Value Fund
4. Distributions: Distributions to shareholders are recorded on the ex-dividend date.
5. Securities Lending: To earn additional income, the fund lends its securities to qualified institutional borrowers. Security loans are subject to termination by the fund at any time, and are required to be secured at all times by collateral in an amount at least equal to the market value of securities loaned. Daily market fluctuations could cause the value of loaned securities to be more or less than the value of the collateral received. When this occurs, the collateral is adjusted and settled on the next business day. The fund further mitigates its counterparty risk by entering into securities lending transactions only with a diverse group of prequalified counterparties, monitoring their financial strength, and entering into master securities lending agreements with its counterparties. The master securities lending agreements provide that, in the event of a counterparty’s default (including bankruptcy), the fund may terminate any loans with that borrower, determine the net amount owed, and sell or retain the collateral up to the net amount owed to the fund; however, such actions may be subject to legal proceedings. While collateral mitigates counterparty risk, in the event of a default, the fund may experience delays and costs in recovering the securities loaned. The fund invests cash collateral received in Vanguard Market Liquidity Fund, and records a liability in the Statement of Net Assets for the return of the collateral, during the period the securities are on loan. Securities lending income represents fees charged to borrowers plus income earned on invested cash collateral, less expenses associated with the loan. During the term of the loan, the fund is entitled to all distributions made on or in respect of the loaned securities.
6. Credit Facility: The fund and certain other funds managed by The Vanguard Group (“Vanguard”) participate in a $3.1 billion committed credit facility provided by a syndicate of lenders pursuant to a credit agreement that may be renewed annually; each fund is individually liable for its borrowings, if any, under the credit facility. Borrowings may be utilized for temporary and emergency purposes, and are subject to the fund’s regulatory and contractual borrowing restrictions. The participating funds are charged administrative fees and an annual commitment fee of 0.10% of the undrawn amount of the facility; these fees are allocated to the funds based on a method approved by the fund’s board of trustees and included in Management and Administrative expenses on the fund’s Statement of Operations. Any borrowings under this facility bear interest at a rate based upon the higher of the one-month London Interbank Offered Rate, federal funds effective rate, or overnight bank funding rate plus an agreed-upon spread.
The fund had no borrowings outstanding at September 30, 2017, or at any time during the period then ended.
7. Other: Dividend income is recorded on the ex-dividend date. Interest income includes income distributions received from Vanguard Market Liquidity Fund and is accrued daily. Premiums and discounts on debt securities purchased are amortized and accreted, respectively, to interest income over the lives of the respective securities. Security transactions are accounted for on the date securities are bought or sold. Costs used to determine realized gains (losses) on the sale of investment securities are those of the specific securities sold.
B. In accordance with the terms of a Funds’ Service Agreement (the “FSA”) between Vanguard and the fund, Vanguard furnishes to the fund investment advisory, corporate management, administrative, marketing, and distribution services at Vanguard’s cost of operations (as defined by the FSA). These costs of operations are allocated to the fund based on methods and guidelines approved by the board of trustees. Vanguard does not require reimbursement in the current period
21
U.S. Value Fund
for certain costs of operations (such as deferred compensation/benefits and risk/insurance costs); the fund’s liability for these costs of operations is included in Payables to Vanguard on the Statement of Net Assets.
Upon the request of Vanguard, the fund may invest up to 0.40% of its net assets as capital in Vanguard. At September 30, 2017, the fund had contributed to Vanguard capital in the amount of $102,000, representing 0.01% of the fund’s net assets and 0.04% of Vanguard’s capitalization. The fund’s trustees and officers are also directors and employees, respectively, of Vanguard.
C. Various inputs may be used to determine the value of the fund’s investments. These inputs are summarized in three broad levels for financial statement purposes. The inputs or methodologies used to value securities are not necessarily an indication of the risk associated with investing in those securities.
Level 1—Quoted prices in active markets for identical securities.
Level 2—Other significant observable inputs (including quoted prices for similar securities, interest rates, prepayment speeds, credit risk, etc.).
Level 3—Significant unobservable inputs (including the fund’s own assumptions used to determine the fair value of investments). Any investments valued with significant unobservable inputs are noted on the Statement of Net Assets.
The following table summarizes the market value of the fund’s investments as of September 30, 2017, based on the inputs used to value them:
| | | |
| | Level 1 | Level 2 | Level 3 |
| Investments | ($000) | ($000) | ($000) |
| Common Stocks | 1,661,700 | — | 4,719 |
| Temporary Cash Investments | 22,210 | 1,396 | — |
| Futures Contracts—Assets1 | 32 | — | — |
| Total | 1,683,942 | 1,396 | 4,719 |
| 1 Represents variation margin on the last day of the reporting period. | | | |
D. Distributions are determined on a tax basis and may differ from net investment income and realized capital gains for financial reporting purposes. Differences may be permanent or temporary. Permanent differences are reclassified among capital accounts in the financial statements to reflect their tax character. Temporary differences arise when certain items of income, expense, gain, or loss are recognized in different periods for financial statement and tax purposes. These differences will reverse at some time in the future. Differences in classification may also result from the treatment of short-term gains as ordinary income for tax purposes.
The fund used a tax accounting practice to treat a portion of the price of capital shares redeemed during the year as distributions from net investment income and realized capital gains. Accordingly, the fund has reclassified $3,107,000 from undistributed net investment income, and $8,471,000 from accumulated net realized gains, to paid-in capital.
For tax purposes, at September 30, 2017, the fund had $46,927,000 of ordinary income and $68,731,000 of long-term capital gains available for distribution.
22
U.S. Value Fund
At September 30, 2017, the cost of investment securities for tax purposes was $1,431,075,000. Net unrealized appreciation of investment securities for tax purposes was $258,950,000, consisting of unrealized gains of $285,019,000 on securities that had risen in value since their purchase and $26,069,000 in unrealized losses on securities that had fallen in value since their purchase.
E. During the year ended September 30, 2017, the fund purchased $1,564,356,000 of investment securities and sold $1,473,193,000 of investment securities, other than temporary cash investments.
F. Capital shares issued and redeemed were:
| | |
| | Year Ended September 30, |
| | 2017 | 2016 |
| | Shares | Shares |
| | (000) | (000) |
| Issued | 22,746 | 18,669 |
| Issued in Lieu of Cash Distributions | 2,714 | 4,339 |
| Redeemed | (19,713) | (17,113) |
| Net Increase (Decrease) in Shares Outstanding | 5,747 | 5,895 |
G. Management has determined that no material events or transactions occurred subsequent to September 30, 2017, that would require recognition or disclosure in these financial statements.
23
Report of Independent Registered
Public Accounting Firm
To the Board of Trustees of Vanguard Malvern Funds and the Shareholders of Vanguard U.S.
Value Fund
In our opinion, the accompanying statement of net assets and the related statements of operations and of changes in net assets and the financial highlights present fairly, in all material respects, the financial position of Vanguard U.S. Value Fund (constituting a separate portfolio of Vanguard Malvern Funds, hereafter referred to as the “Fund”) as of September 30, 2017, the results of its operations for the year then ended, the changes in its net assets for each of the two years in the period then ended and the financial highlights for each of the five years in the period then ended, in conformity with accounting principles generally accepted in the United States of America. These financial statements and financial highlights (hereafter referred to as “financial statements”) are the responsibility of the Fund’s management. Our responsibility is to express an opinion on these financial statements based on our audits. We conducted our audits of these financial statements in accordance with the standards of the Public Company Accounting Oversight Board (United States). Those standards require that we plan and perform the audit to obtain reasonable assurance about whether the financial statements are free of material misstatement. An audit includes examining, on a test basis, evidence supporting the amounts and disclosures in the financial statements, assessing the accounting principles used and significant estimates made by management, and evaluating the overall financial statement presentation. We believe that our audits, which included confirmation of securities as of September 30, 2017 by correspondence with the custodian and brokers and by agreement to the underlying ownership records of the transfer agent, provide a reasonable basis for our opinion.
/s/PricewaterhouseCoopers LLP
Philadelphia, Pennsylvania
November 13, 2017
Special 2017 tax information (unaudited) for Vanguard U.S. Value Fund
This information for the fiscal year ended September 30, 2017, is included pursuant to provisions
of the Internal Revenue Code.
The fund distributed $28,657,000 as capital gain dividends (20% rate gain distributions)
to shareholders during the fiscal year.
The fund distributed $27,329,000 of qualified dividend income to shareholders during the
fiscal year.
For corporate shareholders, 54.7% of investment income (dividend income plus short-term gains,
if any) qualifies for the dividends-received deduction.
24
Your Fund’s After-Tax Returns
This table presents returns for your fund both before and after taxes. The after-tax returns are shown in two ways: (1) assuming that an investor owned the fund during the entire period and paid taxes on the fund’s distributions, and (2) assuming that an investor paid taxes on the fund’s distributions and sold all shares at the end of each period.
Calculations are based on the highest individual federal income tax and capital gains tax rates in effect at the times of the distributions and the hypothetical sales. State and local taxes were not considered. After-tax returns reflect any qualified dividend income, using actual prior-year figures and estimates for 2017. (In the example, returns after the sale of fund shares may be higher than those assuming no sale. This occurs when the sale would have produced a capital loss. The calculation assumes that the investor received a tax deduction for the loss.)
Please note that your actual after-tax returns will depend on your tax situation and may differ from those shown. Also note that if you own the fund in a tax-deferred account, such as an individual retirement account or a 401(k) plan, this information does not apply to you. Such accounts are not subject to current taxes.
Finally, keep in mind that a fund’s performance—whether before or after taxes—does not guarantee future results.
| | | |
| Average Annual Total Returns: U.S. Value Fund | | | |
| Periods Ended September 30, 2017 | | | |
| | One | Five | Ten |
| | Year | Years | Years |
| Returns Before Taxes | 17.87% | 14.01% | 6.53% |
| Returns After Taxes on Distributions | 16.85 | 13.23 | 5.71 |
| Returns After Taxes on Distributions and Sale of Fund Shares | 10.79 | 11.15 | 5.07 |
25
About Your Fund’s Expenses
As a shareholder of the fund, you incur ongoing costs, which include costs for portfolio management, administrative services, and shareholder reports (like this one), among others. Operating expenses, which are deducted from a fund’s gross income, directly reduce the investment return of the fund.
A fund’s expenses are expressed as a percentage of its average net assets. This figure is known as the expense ratio. The following examples are intended to help you understand the ongoing costs (in dollars) of investing in your fund and to compare these costs with those of other mutual funds. The examples are based on an investment of $1,000 made at the beginning of the period shown and held for the entire period.
The accompanying table illustrates your fund’s costs in two ways:
• Based on actual fund return. This section helps you to estimate the actual expenses that you paid over the period. The ”Ending Account Value“ shown is derived from the fund‘s actual return, and the third column shows the dollar amount that would have been paid by an investor who started with $1,000 in the fund. You may use the information here, together with the amount you invested, to estimate the expenses that you paid over the period.
To do so, simply divide your account value by $1,000 (for example, an $8,600 account value divided by $1,000 = 8.6), then multiply the result by the number given for your fund under the heading ”Expenses Paid During Period.“
• Based on hypothetical 5% yearly return. This section is intended to help you compare your fund‘s costs with those of other mutual funds. It assumes that the fund had a yearly return of 5% before expenses, but that the expense ratio is unchanged. In this case—because the return used is not the fund’s actual return—the results do not apply to your investment. The example is useful in making comparisons because the Securities and Exchange Commission requires all mutual funds to calculate expenses based on a 5% return. You can assess your fund’s costs by comparing this hypothetical example with the hypothetical examples that appear in shareholder reports of other funds.
Note that the expenses shown in the table are meant to highlight and help you compare ongoing costs only and do not reflect transaction costs incurred by the fund for buying and selling securities. Further, the expenses do not include any purchase, redemption, or account service fees described in the fund prospectus. If such fees were applied to your account, your costs would be higher. Your fund does not carry a “sales load.”
The calculations assume no shares were bought or sold during the period. Your actual costs may have been higher or lower, depending on the amount of your investment and the timing of any purchases or redemptions.
You can find more information about the fund’s expenses, including annual expense ratios, in the Financial Statements section of this report. For additional information on operating expenses and other shareholder costs, please refer to your fund’s current prospectus.
26
| | | |
| Six Months Ended September 30, 2017 | | | |
| | Beginning | Ending | Expenses |
| | Account Value | Account Value | Paid During |
| U.S. Value Fund | 3/31/2017 | 9/30/2017 | Period |
| Based on Actual Fund Return | $1,000.00 | $1,046.93 | $1.13 |
| Based on Hypothetical 5% Yearly Return | 1,000.00 | 1,023.97 | 1.12 |
The calculations are based on expenses incurred in the most recent six-month period. The fund’s annualized six-month expense ratio for that period is 0.22%. The dollar amounts shown as “Expenses Paid” are equal to the annualized expense ratio multiplied by the average account value over the period, multiplied by the number of days in the most recent six-month period, then divided by the number of days in the most recent 12-month period (183/365).
27
Glossary
30-Day SEC Yield. A fund’s 30-day SEC yield is derived using a formula specified by the U.S. Securities and Exchange Commission. Under the formula, data related to the fund’s security holdings in the previous 30 days are used to calculate the fund’s hypothetical net income for that period, which is then annualized and divided by the fund’s estimated average net assets over the calculation period. For the purposes of this calculation, a security’s income is based on its current market yield to maturity (for bonds), its actual income (for asset-backed securities), or its projected dividend yield (for stocks). Because the SEC yield represents hypothetical annualized income, it will differ—at times significantly—from the fund’s actual experience. As a result, the fund’s income distributions may be higher or lower than implied by the SEC yield.
Beta. A measure of the magnitude of a fund’s past share-price fluctuations in relation to the ups and downs of a given market index. The index is assigned a beta of 1.00. Compared with a given index, a fund with a beta of 1.20 typically would have seen its share price rise or fall by 12% when the index rose or fell by 10%. For this report, beta is based on returns over the past 36 months for both the fund and the index. Note that a fund’s beta should be reviewed in conjunction with its R-squared (see definition). The lower the R-squared, the less correlation there is between the fund and the index, and the less reliable beta is as an indicator of volatility.
Dividend Yield. Dividend income earned by stocks, expressed as a percentage of the aggregate market value (or of net asset value, for a fund). The yield is determined by dividing the amount of the annual dividends by the aggregate value (or net asset value) at the end of the period. For a fund, the dividend yield is based solely on stock holdings and does not include any income produced by other investments.
Earnings Growth Rate. The average annual rate of growth in earnings over the past five years for the stocks now in a fund.
Equity Exposure. A measure that reflects a fund’s investments in stocks and stock futures. Any holdings in short-term reserves are excluded.
Expense Ratio. A fund’s total annual operating expenses expressed as a percentage of the fund’s average net assets. The expense ratio includes management and administrative expenses, but does not include the transaction costs of buying and selling portfolio securities.
Foreign Holdings. The percentage of a fund represented by securities or depositary receipts of companies based outside the United States.
Inception Date. The date on which the assets of a fund (or one of its share classes) are first invested in accordance with the fund’s investment objective. For funds with a subscription period, the inception date is the day after that period ends. Investment performance is measured from the inception date.
Median Market Cap. An indicator of the size of companies in which a fund invests; the midpoint of market capitalization (market price x shares outstanding) of a fund’s stocks, weighted by the proportion of the fund’s assets invested in each stock. Stocks representing half of the fund’s assets have market capitalizations above the median, and the rest are below it.
Price/Book Ratio. The share price of a stock divided by its net worth, or book value, per share.
For a fund, the weighted average price/book ratio of the stocks it holds.
28
Price/Earnings Ratio. The ratio of a stock’s current price to its per-share earnings over the past year. For a fund, the weighted average P/E of the stocks it holds. P/E is an indicator of market expectations about corporate prospects; the higher the P/E, the greater the expectations for a company’s future growth.
R-Squared. A measure of how much of a fund’s past returns can be explained by the returns from the market in general, as measured by a given index. If a fund’s total returns were precisely synchronized with an index’s returns, its R-squared would be 1.00. If the fund’s returns bore no relationship to the index’s returns, its R-squared would be 0. For this report, R-squared is based on returns over the past 36 months for both the fund and the index.
Return on Equity. The annual average rate of return generated by a company during the past five years for each dollar of shareholder’s equity (net income divided by shareholder’s equity). For a fund, the weighted average return on equity for the companies whose stocks it holds.
Short-Term Reserves. The percentage of a fund invested in highly liquid, short-term securities that can be readily converted to cash.
Turnover Rate. An indication of the fund’s trading activity. Funds with high turnover rates incur higher transaction costs and may be more likely to distribute capital gains (which may be taxable to investors). The turnover rate excludes in-kind transactions, which have minimal impact on costs.
29
The Global Industry Classification Standard (“GICS”) was developed by and is the exclusive property and a service mark of MSCI Inc. (“MSCI”) and Standard and Poor’s, a division of McGraw-Hill Companies, Inc. (“S&P”), and is licensed for use by Vanguard. Neither MSCI, S&P nor any third party involved in making or compiling the GICS or any GICS classification makes any express or implied warranties or representations with respect to such standard or classification (or the results to be obtained by the use thereof), and all such parties hereby expressly disclaim all warranties of originality, accuracy, completeness, merchantability or fitness for a particular purpose with respect to any such standard or classification. Without limiting any of the foregoing, in no event shall MSCI, S&P, any of its affiliates or any third party involved in making or compiling the GICS or any GICS classification have any liability for any direct, indirect, special, punitive, consequential or any other damages (including lost profits) even if notified of the possibility of such damages.
30
The People Who Govern Your Fund
The trustees of your mutual fund are there to see that the fund is operated and managed in your best interests since, as a shareholder, you are a part owner of the fund. Your fund’s trustees also serve on the board of directors of The Vanguard Group, Inc., which is owned by the Vanguard funds and provides services to them on an at-cost basis.
A majority of Vanguard’s board members are independent, meaning that they have no affiliation with Vanguard or the funds they oversee, apart from the sizable personal investments they have made as private individuals. The independent board members have distinguished backgrounds in business, academia, and public service. Each of the trustees and executive officers oversees 198 Vanguard funds.
Information for each trustee and executive officer of the fund appears below. The mailing address of the trustees and officers is P.O. Box 876, Valley Forge, PA 19482. More information about the trustees is in the Statement of Additional Information, which can be obtained, without charge, by contacting Vanguard at 800-662-7447, or online at vanguard.com.
Interested Trustee1
F. William McNabb III
Born 1957. Trustee Since July 2009. Chairman of the Board. Principal Occupation(s) During the Past Five Years and Other Experience: Chairman of the Board of The Vanguard Group, Inc., and of each of the investment companies served by The Vanguard Group, since January 2010; Chief Executive Officer and Director of The Vanguard Group and President and Chief Executive Officer of each of the investment companies served by The Vanguard Group, since 2008; Director of Vanguard Marketing Corporation; President of The Vanguard Group (2008–2017); Managing Director of The Vanguard Group (1995–2008).
Independent Trustees
Emerson U. Fullwood
Born 1948. Trustee Since January 2008. Principal Occupation(s) During the Past Five Years and Other Experience: Executive Chief Staff and Marketing Officer for North America and Corporate Vice President (retired 2008) of Xerox Corporation (document management products and services);
Executive in Residence and 2009–2010 Distinguished Minett Professor at the Rochester Institute of Technology; Lead Director of SPX FLOW, Inc. (multi-industry manufacturing); Director of the United Way of Rochester, the University of Rochester Medical Center, Monroe Community College Foundation, North Carolina A&T University, and Roberts Wesleyan College; Trustee of the University of Rochester.
Rajiv L. Gupta
Born 1945. Trustee Since December 2001.2 Principal Occupation(s) During the Past Five Years and Other Experience: Chairman and Chief Executive Officer (retired 2009) and President (2006–2008) of Rohm and Haas Co. (chemicals); Director of Arconic Inc. (diversified manufacturer), HP Inc. (printer and personal computer manufacturing), and Delphi Automotive plc (automotive components); Senior Advisor at New Mountain Capital.
Amy Gutmann
Born 1949. Trustee Since June 2006. Principal Occupation(s) During the Past Five Years and Other Experience: President of the University of Pennsylvania; Christopher H. Browne
1 Mr. McNabb is considered an “interested person,” as defined in the Investment Company Act of 1940, because he is an officer of the Vanguard funds.
2 December 2002 for Vanguard Equity Income Fund, the Vanguard Municipal Bond Funds, and the Vanguard State Tax-Exempt Funds.
Distinguished Professor of Political Science, School of Arts and Sciences, and Professor of Communication, Annenberg School for Communication, with secondary faculty appointments in the Department of Philosophy, School of Arts and Sciences, and at the Graduate School of Education, University of Pennsylvania; Trustee of the National Constitution Center.
JoAnn Heffernan Heisen
Born 1950. Trustee Since July 1998. Principal Occupation(s) During the Past Five Years and Other Experience: Corporate Vice President and Member of the Executive Committee (1997–2008), Chief Global Diversity Officer (retired 2008), Vice President and Chief Information Officer (1997–2006), Controller (1995–1997), Treasurer (1991–1995), and Assistant Treasurer (1989–1991) of Johnson & Johnson (pharmaceuticals/medical devices/ consumer products); Director of Skytop Lodge Corporation (hotels) and the Robert Wood Johnson Foundation; Member of the Advisory Board of the Institute for Women’s Leadership at Rutgers University.
F. Joseph Loughrey
Born 1949. Trustee Since October 2009. Principal Occupation(s) During the Past Five Years and Other Experience: President and Chief Operating Officer (retired 2009) of Cummins Inc. (industrial machinery); Chairman of the Board of Hillenbrand, Inc. (specialized consumer services), Oxfam America, and the Lumina Foundation for Education; Director of the V Foundation for Cancer Research; Member of the Advisory Council for the College of Arts and Letters and Chair of the Advisory Board to the Kellogg Institute for International Studies, both at the University of Notre Dame.
Mark Loughridge
Born 1953. Trustee Since March 2012. Principal Occupation(s) During the Past Five Years and Other Experience: Senior Vice President and Chief Financial Officer (retired 2013) at IBM (information technology services); Fiduciary Member of IBM’s Retirement Plan Committee (2004–2013); Member of the Council on Chicago Booth.
Scott C. Malpass
Born 1962. Trustee Since March 2012. Principal Occupation(s) During the Past Five Years and Other Experience: Chief Investment Officer and Vice President at the University of Notre Dame; Assistant Professor of Finance at the Mendoza College of Business at Notre Dame; Member of the Notre Dame 403(b) Investment Committee, the Board of Advisors for Spruceview Capital Partners, the Board of Catholic Investment Services, Inc. (investment advisor), and the Board of Superintendence of the Institute for the Works of Religion; Chairman of the Board of TIFF Advisory Services, Inc. (investment advisor).
André F. Perold
Born 1952. Trustee Since December 2004. Principal Occupation(s) During the Past Five Years and Other Experience: George Gund Professor of Finance and Banking, Emeritus at the Harvard Business School (retired 2011); Chief Investment Officer and Co-Managing Partner of HighVista Strategies LLC (private investment firm); Overseer of the Museum of Fine Arts Boston.
Peter F. Volanakis
Born 1955. Trustee Since July 2009. Principal Occupation(s) During the Past Five Years and Other Experience: President and Chief Operating Officer (retired 2010) of Corning Incorporated (communications equipment); Chairman of the Board of Trustees of Colby-Sawyer College; Member of the Board of Hypertherm, Inc. (industrial cutting systems, software, and consumables).
Executive Officers
Glenn Booraem
Born 1967. Investment Stewardship Officer Since February 2017. Principal Occupation(s) During the Past Five Years and Other Experience: Principal of The Vanguard Group, Inc.; Treasurer (2015–2017), Controller (2010–2015), and Assistant Controller (2001–2010) of each of the investment companies served by The Vanguard Group.
Thomas J. Higgins
Born 1957. Chief Financial Officer Since September 2008. Principal Occupation(s) During the Past Five Years and Other Experience: Principal of The Vanguard Group, Inc.; Chief Financial Officer of each of the investment companies served by The Vanguard Group; Treasurer of each of the investment companies served by The Vanguard Group (1998–2008).
Peter Mahoney
Born 1974. Controller Since May 2015. Principal Occupation(s) During the Past Five Years and Other Experience: Principal of The Vanguard Group, Inc.; Controller of each of the investment companies served by The Vanguard Group; Head of International Fund Services at The Vanguard Group (2008–2014).
Anne E. Robinson
Born 1970. Secretary Since September 2016. Principal Occupation(s) During the Past Five Years and Other Experience: Managing Director of The Vanguard Group, Inc.; General Counsel of The Vanguard Group; Secretary of The Vanguard Group and of each of the investment companies served by The Vanguard Group; Director and Senior Vice President of Vanguard Marketing Corporation; Managing Director and General Counsel of Global Cards and Consumer Services at Citigroup (2014–2016); Counsel at American Express (2003–2014).
Michael Rollings
Born 1963. Treasurer Since February 2017. Principal Occupation(s) During the Past Five Years and Other Experience: Managing Director of The Vanguard Group, Inc.; Treasurer of each of the investment companies served by The Vanguard Group; Director of Vanguard Marketing Corporation; Executive Vice President and Chief Financial Officer of MassMutual Financial Group (2006–2016).
| |
| Vanguard Senior Management Team |
| |
| Mortimer J. Buckley | Chris D. McIsaac |
| Gregory Davis | James M. Norris |
| John James | Thomas M. Rampulla |
| Martha G. King | Karin A. Risi |
| John T. Marcante | |
Chairman Emeritus and Senior Advisor
John J. Brennan
Chairman, 1996–2009
Chief Executive Officer and President, 1996–2008
Founder
John C. Bogle
Chairman and Chief Executive Officer, 1974–1996
| |  |
| | P.O. Box 2600 |
| | Valley Forge, PA 19482-2600 |
| |
| |
| |
| Connect with Vanguard® > | vanguard.com |
| |
| |
| |
| Fund Information > 800-662-7447 | CFA® is a registered trademark owned by CFA Institute. |
| Direct Investor Account Services > 800-662-2739 |
| Institutional Investor Services > 800-523-1036 |
| Text Telephone for People | |
| Who Are Deaf or Hard of Hearing> 800-749-7273 |
| |
| This material may be used in conjunction |
| with the offering of shares of any Vanguard |
| fund only if preceded or accompanied by |
| the fund’s current prospectus. | |
| |
| All comparative mutual fund data are from Lipper, a |
| Thomson Reuters Company, or Morningstar, Inc., unless |
| otherwise noted. | |
| |
| You can obtain a free copy of Vanguard’s proxy voting |
| guidelines by visiting vanguard.com/proxyreporting or by |
| calling Vanguard at 800-662-2739. The guidelines are |
| also available from the SEC’s website, sec.gov. In |
| addition, you may obtain a free report on how your fund |
| voted the proxies for securities it owned during the 12 |
| months ended June 30. To get the report, visit either |
| vanguard.com/proxyreporting or sec.gov. |
| |
| You can review and copy information about your fund at |
| the SEC’s Public Reference Room in Washington, D.C. To |
| find out more about this public service, call the SEC at |
| 202-551-8090. Information about your fund is also |
| available on the SEC’s website, and you can receive |
| copies of this information, for a fee, by sending a |
| request in either of two ways: via email addressed to |
| publicinfo@sec.gov or via regular mail addressed to the |
| Public Reference Section, Securities and Exchange |
| Commission, Washington, DC 20549-1520. |
| | © 2017 The Vanguard Group, Inc. |
| | All rights reserved. |
| | Vanguard Marketing Corporation, Distributor. |
| |
| | Q1240 112017 |

Annual Report | September 30, 2017
Vanguard Capital Value Fund
Vanguard’s Principles for Investing Success
We want to give you the best chance of investment success. These
principles, grounded in Vanguard’s research and experience, can put you on
the right path.
Goals. Create clear, appropriate investment goals.
Balance. Develop a suitable asset allocation using broadly diversified funds.
Cost. Minimize cost.
Discipline. Maintain perspective and long-term discipline.
A single theme unites these principles: Focus on the things you can control.
We believe there is no wiser course for any investor.
| |
| Contents | |
| Your Fund’s Performance at a Glance. | 1 |
| Chairman’s Perspective. | 3 |
| Advisor’s Report. | 7 |
| Fund Profile. | 11 |
| Performance Summary. | 12 |
| Financial Statements. | 14 |
| Your Fund’s After-Tax Returns. | 26 |
| About Your Fund’s Expenses. | 27 |
| Glossary. | 29 |
Please note: The opinions expressed in this report are just that—informed opinions. They should not be considered promises or advice. Also, please keep in mind that the information and opinions cover the period through the date on the front of this report. Of course, the risks of investing in your fund are spelled out in the prospectus.
See the Glossary for definitions of investment terms used in this report.
About the cover: Nautical images have been part of Vanguard’s rich heritage since its start in 1975. For an incoming ship, a lighthouse offers a beacon and safe path to shore. You can similarly depend on Vanguard to put you first––and light the way––as you strive to meet your financial goals. Our client focus and low costs, stemming from our unique ownership structure, assure that your interests are paramount.
Your Fund’s Performance at a Glance
• Vanguard Capital Value Fund returned 14.56% for the 12 months ended
September 30, 2017, trailing its benchmark and the average return of its peers.
• Eight of 11 industry sectors represented in the fund recorded positive results.
The highest total returns came from financials (+37%), the fund’s largest sector,
and materials (+32%); both sectors outperformed their benchmark counterparts.
Industrials (+26%) and utilities (+17%) also provided a relative boost.
• The fund’s health care stocks (–3%) were notable underperformers compared
with their benchmark counterparts. This result was driven mainly by holdings
among health care providers and services, as well as pharmaceutical companies,
which declined on concerns over potential regulatory changes. Energy (–6%) and
consumer staples (–3%) also lost ground and underperformed.
• Among other sectors, information technology (+16%) slightly underperformed,
while real estate (+6%) outperformed.
| |
| Total Returns: Fiscal Year Ended September 30, 2017 | |
| | Total |
| | Returns |
| Vanguard Capital Value Fund | 14.56% |
| Russell 3000 Value Index | 15.53 |
| Multi-Cap Value Funds Average | 16.69 |
| Multi-Cap Value Funds Average: Derived from data provided by Lipper, a Thomson Reuters Company. | |
| |
| |
| Total Returns: Ten Years Ended September 30, 2017 | |
| | Average |
| | Annual Return |
| Capital Value Fund | 5.29% |
| Russell 3000 Value Index | 6.01 |
| Multi-Cap Value Funds Average | 5.39 |
| Multi-Cap Value Funds Average: Derived from data provided by Lipper, a Thomson Reuters Company. | |
The figures shown represent past performance, which is not a guarantee of future results. (Current performance may be lower or higher than the performance data cited. For performance data current to the most recent month-end, visit our website at vanguard.com/performance.) Note, too, that both investment returns and principal value can fluctuate widely, so an investor’s shares, when sold, could be worth more or less than their original cost.
1
| | |
| Expense Ratios | | |
| Your Fund Compared With Its Peer Group | | |
| | | Peer Group |
| | Fund | Average |
| Capital Value Fund | 0.25% | 1.10% |
The fund expense ratio shown is from the prospectus dated January 26, 2017, and represents estimated costs for the current fiscal year. For the fiscal year ended September 30, 2017, the fund’s expense ratio was 0.27%. The peer-group expense ratio is derived from data provided by Lipper, a Thomson Reuters Company, and captures information through year-end 2016.
Peer group: Multi-Cap Value Funds.
2
Chairman’s Perspective

Bill McNabb
Chairman and Chief Executive Officer
Dear Shareholder,
Our investors depend on Vanguard to be a responsible steward of their assets. This includes our obvious responsibilities—managing the funds, offering investment perspectives and advice, and assisting with questions and transactions.
But because a long-term perspective informs every aspect of our investment approach, we also work on your behalf in less obvious ways, such as by advocating for responsible governance among the companies in which Vanguard funds invest. Vanguard’s index funds are essentially permanent owners of thousands of publicly traded companies, and we have a special obligation to be engaged stewards actively focused on the long term.
Simply put, we believe that well-governed companies are more likely to perform well over the long run.
Although Vanguard has always been an advocate for strong corporate governance, we have expanded our efforts recently as our investor base continues to grow. Our Investment Stewardship team has doubled in size since 2015, and we continue to add analysts, researchers, and operations team members. The team guides our engagement activities and our funds’ proxy voting by analyzing corporate governance practices in companies around the world.
3
Our four Investment Stewardship pillars
As we evaluate company responsiveness to governance matters, including environmental and social concerns, we focus on four key areas—what we call our Investment Stewardship pillars:
• The board: A high-functioning, well-composed, independent, diverse, and experienced board with effective ongoing evaluation practices.
• Governance structures: Provisions and structures that empower shareholders and protect their rights.
• Appropriate compensation: Pay that incentivizes relative outperformance over the long term.
• Risk oversight: Effective, integrated, and ongoing oversight of relevant industry-and company-specific risks.
Guided by these pillars, our Investment Stewardship team conducted more than 950 engagements, or discussions, with company directors and leaders worldwide during the 12 months ended June 30, 2017.
| | | |
| Market Barometer | | | |
| | | Average Annual Total Returns |
| | Periods Ended September 30, 2017 |
| | One Year | Three Years | Five Years |
| Stocks | | | |
| Russell 1000 Index (Large-caps) | 18.54% | 10.63% | 14.27% |
| Russell 2000 Index (Small-caps) | 20.74 | 12.18 | 13.79 |
| Russell 3000 Index (Broad U.S. market) | 18.71 | 10.74 | 14.23 |
| FTSE All-World ex US Index (International) | 19.49 | 5.11 | 7.35 |
| |
| Bonds | | | |
| Bloomberg Barclays U.S. Aggregate Bond Index | | | |
| (Broad taxable market) | 0.07% | 2.71% | 2.06% |
| Bloomberg Barclays Municipal Bond Index | | | |
| (Broad tax-exempt market) | 0.87 | 3.19 | 3.01 |
| Citigroup Three-Month U.S. Treasury Bill Index | 0.64 | 0.28 | 0.18 |
| |
| CPI | | | |
| Consumer Price Index | 2.23% | 1.22% | 1.30% |
4
We also cast more than 171,000 votes on behalf of Vanguard funds at more than 18,000 shareholder meetings.
Gender diversity on boards and climate risk
As we engage with companies, we are devoting increased attention to two specific topics. The first is gender diversity on boards. It’s no secret that the right combination of talent, skills, and experience leads to better results, so we pay close attention to how company boards are structured and managed, and how they evolve.
In recent years, a growing body of research has demonstrated that greater diversity on boards can lead to improved governance and company performance. We are advocating for boards to incorporate diverse perspectives and experience into their strategic planning and decision-making. One example of our commitment to more diverse boards is our participation in the 30% Club, a global coalition working to increase the representation of women in boardrooms and leadership roles.
The second issue is climate risk. We will continue to engage with companies to understand their responses to this risk. Regardless of one’s perspective on the issue, the potential is real for changing regulations, demographics, and consumption behavior to affect business results for companies in many sectors.
We want to ensure that such business and regulatory risks are sufficiently disclosed so investors can value companies appropriately. In the past year, we have voted for shareholder proposals at several energy companies that called for management to improve its climate risk assessment and planning, and we will consider supporting similar proposals if we believe they are beneficial to long-term shareholder value. When a proposal from a shareholder presents a strong case for change, we’re more than willing to fully consider it. And even if the case falls short, these proposals often catalyze a discussion that generates meaningful change over time.
In addition to considering activists’ proposals, we consult research providers and our own network of experts. When we detect material risks to a company’s long-term value (such as bad leadership, poor disclosure, misaligned compensation structures, or threats to shareholder rights), we act with our voice and our vote.
Our stewardship reflects our mission
But we don’t act as independent agents with our own agenda. Every time we speak with a company chairman, CEO, or director, we’re acutely aware of the role we play in representing the economic interests of more than 20 million Vanguard investors. So you can expect us to speak out when we detect threats to the economic interests of our shareholders.
5
We take positions on these matters not because they are inherently good or noble but because they are tied to the long-term economic value of your funds’ investments.
You trust us to represent your interests across the globe. You can be confident we act on that responsibility with the seriousness and dedication it deserves.
To learn more about our Investment Stewardship program, including how our funds have voted, visit https://about. vanguard.com/investment-stewardship/.
As always, thank you for investing with Vanguard.

F. William McNabb III
Chairman and Chief Executive Officer
October 13, 2017
6
Advisor’s Report
For the 12 months ended September 30, 2017, Vanguard Capital Value Fund returned 14.56%. The fund’s performance reflects the management of the fund by Wellington Management Company llp. The fund’s manager, David W. Palmer, has prepared the following discussion of the investment environment that existed during the 12-month period and of how the portfolio positioning reflects his assessment. These comments were prepared on October 23, 2017.
Portfolio Manager:
David W. Palmer, CFA
Senior Managing Director
The fund focuses on stocks that trade at a discounted multiple to the broad market, based either on current earnings or on those we expect within a reasonable investment horizon. We search for companies with pronounced negative sentiment, controversy, or perceived event risk that, through fundamental research and analysis, we find to be temporary or overstated. Because individual holdings can be out of phase with the market for extended periods, we seek to build a portfolio of stocks with unique drivers, diversified across capitalization sizes and industries.
Equities performed very well over the fiscal year, with the Russell 3000 Value Index returning more than 15%. Valuation measures expanded somewhat during the year as the index’s return outpaced the
consensus growth forecast in the reported earnings of quoted companies in calendar 2017 compared with 2016.
Despite a slowdown in some economic indicators during the spring and early summer, investors generally favored economically sensitive sectors. The sectors included those expected to benefit from a boost in infrastructure spending, corporate tax rate cuts, and trade policies favoring domestically produced goods. The three highest-returning sectors, each of which far exceeded the total return of the Russell 3000 Value Index, included the cyclical industry groups financials, materials, and industrials.
The environment for corporate earnings growth has remained favorable as consumers have seen growth in disposable incomes, yet without wage and benefit costs spiking sufficiently to become a severe headwind to company profit margins. Our expectations are for both GDP growth and inflation to be in the range of 2.3% annually for 2017 and 2018. These are very comfortable levels for the U.S. economy and for company managements to model when making investment decisions, but there is always the risk that events deviate from these encouraging forecasts.
Where we have seen investors extrapolating good news well into the future we have reduced the portfolio’s weighting in these outperforming stocks
7
or sectors, recycling the assets into areas of the market where controversy and skepticism have produced what we believe to be a more attractive combination of value and appreciation potential. Those movements were made first in the financial sector in the months after the 2016 U.S. election, when we reduced the exposure as markets started to price in both higher interest rates and more lenient regulation. More recently, we have also reduced some of the holdings in information technology, as many of those stocks have seen improved sentiment and positive price momentum.
We feel very optimistic today looking at the coiled-spring nature of many of Capital Value’s holdings; we believe there is potential for the expansion of valuation measures among many of the beaten-down but well-managed companies we have added to the portfolio this year.
Our security selection decisions were strongest in industrials, real estate, materials, and financials, and were most challenging in health care, energy, and consumer staples. Sector allocation decisions added to total return, most notably by emphasizing the outperforming materials group while underweighting the lagging energy, consumer staples, and telecommunication services sectors.
Holdings in regional bank PNC Financial Services, money center bank Citigroup, insurer MetLife, and financial advisor Raymond James were all large contributors
to performance, although, admittedly, most financials did well during the year. Celanese, an intermediate-products and specialty-chemicals maker, provided a total return of nearly 60% amid strong earnings, shareholder-friendly capital returns, and earnings-accretive acquisitions of complementary assets. In information technology, Western Digital, a disk and flash-storage provider, performed well. Its newly acquired SanDisk business proved highly additive to earnings during a period of tight supply and demand for NAND storage chips.
The greatest detractor from relative performance during the fiscal year came from the health care sector. Holdings in Teva Pharmaceutical, a generics and branded-drugs producer, suffered on the loss of patent protection for Copaxone, a widely used drug for the treatment of multiple sclerosis. However, Teva and the portfolio’s position in rival generics maker Mylan also were challenged by rising competition in the market for more commodity-oriented generic drugs. The Food and Drug Administration’s focus on approving a fourth or fifth generic competitor crushed the profitability of those products in many instances, taking their margins to breakeven or below. While we believe that the coming approval cycle for more complex-to-manufacture generics and biosimilars will reinvigorate profit growth for the sector, we also acknowledge that the near term will continue to bring pricing pressure on commoditized products.
8
Shares of natural gas producer Southwestern Energy were hit hard by a warm winter, with gas inventories ending the season at high levels. That left investors pessimistic about future realization prices for the company’s output.
In consumer staples, Coty, a fragrance, cosmetics, and hair care manufacturer, struggled through the early stages of its acquisition of several brands from Procter & Gamble that will require reinvestment in innovation and marketing.
At the end of September, the Capital Value portfolio was most overweight relative to the Russell 3000 Value Index in the materials, information technology, and real estate sectors. Again, compared with the benchmark, over the past year we added the most relative exposure to consumer staples and telecommunication services, while the largest reductions to relative exposure were in health care and financials.
Within consumer staples, we initiated new positions in food retailer Kroger and drugstore operator Walgreens Boots Alliance, as well as in Campbell Soup. Both Kroger and Walgreens had meaningfully trailed the market’s advance because of competitive concerns. Most notably, the imminent arrival or expansion of Amazon into that retail category compounded what was already a difficult business. Kroger and Walgreens are seasoned operators, trading at considerable valuation discounts to the broad market on current earnings,
as the investment community believes those earnings levels will be challenged to show future growth. We believe the Capital Value shareholder is being well compensated to take on these risks at today’s prices.
In information technology, we purchased a holding in communications chip-maker Qualcomm amid controversy about the future level of royalties the company would receive for its intellectual property from the dominant mobile device developers. In our view, Qualcomm is well-positioned to earn royalty income from its patents on both 4G and the coming 5G wireless technology, and we expect the company will settle its disputes with these customers at rates that will allow for growth in the earnings power of the business.
In the year ahead, we see economic growth continuing to boost earnings, helped by an improvement in capital investment spending and the potential for a tailwind from restocking somewhat lean inventories. While value stocks have so far meaningfully lagged their growth counterparts in 2017, we see a wide range of intriguing risk–reward opportunities for the portfolio, some of which have been discussed above.
We are constantly analyzing the subset of the market where concerns are roiling and other investors are jumping ship in order to find underpriced values that will be evident once the seas settle. Our team greatly appreciates the trust of Vanguard
9
and the Capital Value shareholders, and we believe that confidence will be rewarded through the future performance of the portfolio over the market cycle.
10
Capital Value Fund
Fund Profile
As of September 30, 2017
| | | |
| Portfolio Characteristics | | |
| | | | DJ |
| | | | U.S. |
| | | Russell | Total |
| | | 3000 | Market |
| | | Value | FA |
| | Fund | Index | Index |
| Number of Stocks | 90 | 2,110 | 3,808 |
| Median Market Cap | $25.4B | $55.2B | $61.4B |
| Price/Earnings Ratio | 18.6x | 18.8x | 21.9x |
| Price/Book Ratio | 1.8x | 1.9x | 2.9x |
| Return on Equity | 11.2% | 10.9% | 15.1% |
| Earnings Growth | | | |
| Rate | 6.3% | 6.3% | 9.6% |
| Dividend Yield | 2.3% | 2.3% | 1.8% |
| Foreign Holdings | 9.4% | 0.0% | 0.0% |
| Turnover Rate | 41% | — | — |
| Ticker Symbol | VCVLX | — | — |
| Expense Ratio1 | 0.25% | — | — |
| 30-Day SEC Yield | 2.06% | — | — |
| Short-Term Reserves | 0.8% | — | — |
| | | |
| Sector Diversification (% of equity exposure) |
| | | Russell | DJ |
| | | 3000 | U.S. Total |
| | | Value | Market |
| | Fund | Index | FA Index |
| Consumer Discretionary | 8.1% | 7.0% | 12.3% |
| Consumer Staples | 7.5 | 8.2 | 7.3 |
| Energy | 10.5 | 10.5 | 5.8 |
| Financials | 22.5 | 26.4 | 15.0 |
| Health Care | 11.0 | 13.3 | 14.0 |
| Industrials | 7.0 | 8.8 | 10.8 |
| Information Technology | 10.9 | 8.3 | 22.3 |
| Materials | 6.4 | 3.0 | 3.4 |
| Real Estate | 6.6 | 5.3 | 4.0 |
| Telecommunication | | | |
| Services | 2.9 | 3.0 | 2.0 |
| Utilities | 6.6 | 6.2 | 3.1 |
| | |
| Volatility Measures | | |
| | Russell | DJ |
| | 3000 | U.S. Total |
| | Value | Market |
| | Index | FA Index |
| R-Squared | 0.84 | 0.80 |
| Beta | 1.28 | 1.28 |
These measures show the degree and timing of the fund’s
fluctuations compared with the indexes over 36 months.
| | |
| Ten Largest Holdings (% of total net assets) |
| Citigroup Inc. | Diversified Banks | 3.9% |
| MetLife Inc. | Life & Health | |
| | Insurance | 3.6 |
| Wells Fargo & Co. | Diversified Banks | 3.4 |
| PNC Financial Services | | |
| Group Inc. | Regional Banks | 2.9 |
| QUALCOMM Inc. | Semiconductors | 2.7 |
| Arthur J Gallagher & Co. Insurance Brokers | 2.1 |
| Verizon Communications Integrated | |
| Inc. | Telecommunication | |
| | Services | 1.9 |
| Reliance Steel & | | |
| Aluminum Co. | Steel | 1.9 |
| Celanese Corp. | Specialty Chemicals | 1.9 |
| STORE Capital Corp. | Diversified REITs | 1.8 |
| Top Ten | | 26.1% |
The holdings listed exclude any temporary cash investments and
equity index products.
Investment Focus

Sector categories are based on the Global Industry Classification Standard (“GICS”), except for the “Other” category (if applicable), which includes securities that have not been provided a GICS classification as of the effective reporting period.
1 The expense ratio shown is from the prospectus dated January 26, 2017, and represents estimated costs for the current fiscal year. For the fiscal year ended September 30, 2017, the expense ratio was 0.27%.
11
Capital Value Fund
Performance Summary
All of the returns in this report represent past performance, which is not a guarantee of future results that may be achieved by the fund. (Current performance may be lower or higher than the performance data cited. For performance data current to the most recent month-end, visit our website at vanguard.com/performance.) Note, too, that both investment returns and principal value can fluctuate widely, so an investor’s shares, when sold, could be worth more or less than their original cost. The returns shown do not reflect taxes that a shareholder would pay on fund distributions or on the sale of fund shares.
Cumulative Performance: September 30, 2007, Through September 30, 2017
Initial Investment of $10,000

| | | | | |
| | | Average Annual Total Returns | |
| | | Periods Ended September 30, 2017 | |
| | | | | | Final Value |
| | | One | Five | Ten | of a $10,000 |
| | | Year | Years | Years | Investment |
| | Capital Value Fund* | 14.56% | 11.94% | 5.29% | $16,750 |
| • • • • • • • • | Russell 3000 Value Index | 15.53 | 13.20 | 6.01 | 17,926 |
| – – – – | Multi-Cap Value Funds Average | 16.69 | 12.32 | 5.39 | 16,908 |
| | Dow Jones U.S. Total Stock Market | | | | |
| | Float Adjusted Index | 18.67 | 14.15 | 7.64 | 20,887 |
Multi-Cap Value Funds Average: Derived from data provided by Lipper, a Thomson Reuters Company.
See Financial Highlights for dividend and capital gains information.
12
Capital Value Fund
Fiscal-Year Total Returns (%): September 30, 2007, Through September 30, 2017

13
Capital Value Fund
Financial Statements
Statement of Net Assets
As of September 30, 2017
The fund reports a complete list of its holdings in regulatory filings four times in each fiscal year, at
the quarter-ends. For the second and fourth fiscal quarters, the lists appear in the fund’s semiannual
and annual reports to shareholders. For the first and third fiscal quarters, the fund files the lists with
the Securities and Exchange Commission on Form N-Q. Shareholders can look up the fund’s Forms
N-Q on the SEC’s website at sec.gov. Forms N-Q may also be reviewed and copied at the SEC’s
Public Reference Room (see the back cover of this report for further information).
| | | |
| | | | Market |
| | | | Value• |
| | | Shares | ($000) |
| Common Stocks (99.3%) | | |
| Consumer Discretionary (8.0%) | |
| | Las Vegas Sands Corp. | 198,334 | 12,725 |
| | General Motors Co. | 314,577 | 12,703 |
| | SES SA Class A | 550,083 | 12,043 |
| | Coach Inc. | 194,200 | 7,822 |
| | VF Corp. | 117,742 | 7,485 |
| | L Brands Inc. | 168,400 | 7,007 |
| | John Wiley & Sons Inc. | | |
| | Class A | 85,941 | 4,598 |
| | Expedia Inc. | 29,435 | 4,237 |
| * | Global Brands Group | | |
| | Holding Ltd. | 38,380,000 | 3,704 |
| | | | 72,324 |
| Consumer Staples (7.4%) | | |
| | British American | | |
| | Tobacco plc | 254,308 | 15,921 |
| | Kroger Co. | 658,059 | 13,201 |
| | Walgreens Boots | | |
| | Alliance Inc. | 170,800 | 13,189 |
| | Coty Inc. Class A | 547,989 | 9,058 |
| | Campbell Soup Co. | 133,600 | 6,255 |
| * | Simply Good Foods Co. | 480,100 | 5,622 |
| * | Hostess Brands Inc. | | |
| | Class A | 292,300 | 3,993 |
| | | | 67,239 |
| Energy (10.4%) | | |
| | Halliburton Co. | 276,817 | 12,742 |
| | Anadarko Petroleum | | |
| | Corp. | 236,212 | 11,539 |
| | HollyFrontier Corp. | 304,797 | 10,964 |
| | Cimarex Energy Co. | 88,300 | 10,037 |
| | Canadian Natural | | |
| | Resources Ltd. | | |
| | (New York Shares) | 257,347 | 8,619 |
| * | Diamondback Energy Inc. | 72,871 | 7,138 |
| | | |
| | Pioneer Natural | | |
| | Resources Co. | 41,041 | 6,055 |
| | Hess Corp. | 119,498 | 5,603 |
| * | Laredo Petroleum Inc. | 427,900 | 5,533 |
| | Marathon Oil Corp. | 401,543 | 5,445 |
| | Helmerich & Payne Inc. | 94,565 | 4,928 |
| * | Southwestern Energy Co. | 458,475 | 2,801 |
| * | Trican Well Service Ltd. | 764,396 | 2,793 |
| | | | 94,197 |
| Financials (22.4%) | | |
| | Citigroup Inc. | 483,809 | 35,192 |
| | MetLife Inc. | 629,922 | 32,724 |
| | Wells Fargo & Co. | 553,502 | 30,526 |
| | PNC Financial Services | | |
| | Group Inc. | 196,222 | 26,445 |
| | Arthur J Gallagher & Co. | 303,768 | 18,697 |
| | American International | | |
| | Group Inc. | 268,645 | 16,492 |
| | XL Group Ltd. | 305,873 | 12,067 |
| | M&T Bank Corp. | 52,632 | 8,476 |
| | Principal Financial Group | | |
| | Inc. | 109,160 | 7,023 |
| | Unum Group | 126,785 | 6,483 |
| | Raymond James | | |
| | Financial Inc. | 55,400 | 4,672 |
| * | Brighthouse Financial Inc. | 57,492 | 3,495 |
| | | | 202,292 |
| Health Care (10.9%) | | |
| | Bristol-Myers Squibb Co. | 246,211 | 15,694 |
| | McKesson Corp. | 99,133 | 15,228 |
| * | Mylan NV | 407,149 | 12,772 |
| | Allergan plc | 54,985 | 11,269 |
| * | Biogen Inc. | 27,851 | 8,721 |
| * | Envision Healthcare Corp. | 175,251 | 7,878 |
| | STERIS plc | 84,734 | 7,490 |
| * | AMN Healthcare | | |
| | Services Inc. | 139,000 | 6,352 |
14
| | | |
| Capital Value Fund | | |
| |
| |
| |
| | | | Market |
| | | | Value• |
| | | Shares | ($000) |
| | Eli Lilly & Co. | 66,600 | 5,697 |
| * | Regeneron | | |
| | Pharmaceuticals Inc. | 11,701 | 5,232 |
| * | Alder Biopharmaceuticals | | |
| | Inc. | 175,058 | 2,144 |
| | | | 98,477 |
| Industrials (7.0%) | | |
| * | Genesee & Wyoming Inc. | | |
| | Class A | 173,509 | 12,841 |
| | Steelcase Inc. Class A | 649,154 | 9,997 |
| | Herman Miller Inc. | 258,896 | 9,294 |
| | Sanwa Holdings Corp. | 754,000 | 8,659 |
| | JB Hunt Transport | | |
| | Services Inc. | 72,598 | 8,064 |
| | Eaton Corp. plc | 100,468 | 7,715 |
| * | Clean Harbors Inc. | 85,900 | 4,871 |
| | Dun & Bradstreet Corp. | 14,200 | 1,653 |
| | | | 63,094 |
| Information Technology (10.9%) | |
| | QUALCOMM Inc. | 463,503 | 24,028 |
| | Western Digital Corp. | 131,477 | 11,360 |
| | Genpact Ltd. | 355,971 | 10,234 |
| * | Keysight Technologies | | |
| | Inc. | 233,800 | 9,740 |
| | Cisco Systems Inc. | 261,215 | 8,785 |
| | Silicon Motion | | |
| | Technology Corp. ADR | 172,512 | 8,286 |
| *,^ | Acacia Communications | | |
| | Inc. | 172,000 | 8,101 |
| * | GoDaddy Inc. Class A | 178,352 | 7,760 |
| | Amdocs Ltd. | 104,200 | 6,702 |
| | Skyworks Solutions Inc. | 31,384 | 3,198 |
| | | | 98,194 |
| Materials (6.4%) | | |
| | Reliance Steel & | | |
| | Aluminum Co. | 228,162 | 17,379 |
| | Celanese Corp. Class A | 163,223 | 17,019 |
| | PPG Industries Inc. | 84,158 | 9,145 |
| | CRH plc | 230,555 | 8,756 |
| ^ | Southern Copper Corp. | 128,900 | 5,125 |
| | | | 57,424 |
| Other (0.0%) | | |
| *,1,2 Allstar Co-Invest LLC | | |
| | Private Placement | NA | — |
| |
| Real Estate (6.6%) | | |
| | STORE Capital Corp. | 666,607 | 16,579 |
| | Host Hotels & Resorts | | |
| | Inc. | 705,128 | 13,038 |
| | |
| Columbia Property Trust | | |
| Inc. | 433,583 | 9,439 |
| American Tower Corp. | 65,707 | 8,981 |
| Simon Property Group Inc. | 45,938 | 7,396 |
| Taubman Centers Inc. | 76,000 | 3,777 |
| | | 59,210 |
| Telecommunication Services (2.8%) | |
| Verizon Communications | | |
| Inc. | 352,191 | 17,430 |
| Nippon Telegraph & | | |
| Telephone Corp. | 177,700 | 8,142 |
| | | 25,572 |
| Utilities (6.5%) | | |
| PG&E Corp. | 240,409 | 16,369 |
| Exelon Corp. | 411,338 | 15,495 |
| OGE Energy Corp. | 294,896 | 10,625 |
| Sempra Energy | 77,107 | 8,800 |
| Iberdrola SA | 988,017 | 7,683 |
| | | 58,972 |
| Total Common Stocks | | |
| (Cost $782,466) | | 896,995 |
| Temporary Cash Investments (1.7%) | |
| Money Market Fund (0.9%) | | |
| 3,4 Vanguard Market Liquidity | | |
| Fund, 1.223% | 83,813 | 8,383 |
| |
| | Face | |
| | Amount | |
| | ($000) | |
| Repurchase Agreement (0.8%) | |
| RBS Securities, Inc. | | |
| 1.040%, 10/2/17 | | |
| (Dated 9/29/17, | | |
| Repurchase Value | | |
| $7,001,000, collateralized | | |
| by U.S. Treasury | | |
| Note/Bond 1.000%, | | |
| 2/15/18, with a value of | | |
| $7,143,000) | 7,000 | 7,000 |
| Total Temporary Cash Investments | |
| (Cost $15,383) | | 15,383 |
| Total Investments (101.0%) | | |
| (Cost $797,849) | | 912,378 |
15
Capital Value Fund
| |
| | Amount |
| | ($000) |
| Other Assets and Liabilities (-1.0%) | |
| Other Assets | |
| Investment in Vanguard | 55 |
| Receivables for Investment Securities Sold | 2,805 |
| Receivables for Accrued Income | 1,468 |
| Receivables for Capital Shares Issued | 194 |
| Unrealized Appreciation—Forward Currency |
| Contracts | 252 |
| Other Assets | 230 |
| Total Other Assets | 5,004 |
| Liabilities | |
| Payables for Investment Securities | |
| Purchased | (3,194) |
| Collateral for Securities on Loan | (8,382) |
| Payables to Investment Advisor | (97) |
| Payables for Capital Shares Redeemed | (307) |
| Payables to Vanguard | (2,053) |
| Total Liabilities | (14,033) |
| Net Assets (100%) | |
| Applicable to 69,708,924 outstanding | |
| $.001 par value shares of beneficial | |
| interest (unlimited authorization) | 903,349 |
| Net Asset Value Per Share | $12.96 |
| |
| At September 30, 2017, net assets consisted of: |
| | Amount |
| | ($000) |
| Paid-in Capital | 874,803 |
| Undistributed Net Investment Income | 11,533 |
| Accumulated Net Realized Losses | (97,758) |
| Unrealized Appreciation (Depreciation) | |
| Investment Securities | 114,529 |
| Forward Currency Contracts | 252 |
| Foreign Currencies | (10) |
| Net Assets | 903,349 |
• See Note A in Notes to Financial Statements.
* Non-income-producing security.
^ Includes partial security positions on loan to broker-dealers.
The total value of securities on loan is $8,080,000.
1 Security value determined using significant unobservable
inputs.
2 Restricted security represents 0.0% of net assets. Shares not
applicable for this private placement.
3 Affiliated money market fund available only to Vanguard funds
and certain trusts and accounts managed by Vanguard. Rate
shown is the 7-day yield.
4 Includes $8,382,000 of collateral received for securities
on loan.
ADR—American Depositary Receipt.
Derivative Financial Instruments Outstanding as of Period End
Forward Currency Contracts
Unrealized
Contract Appreciation
Settlement Contract Amount (000) (Depreciation)
Counterparty Date Receive Deliver ($000)
Citibank, N.A. 12/20/17 USD 10,088 EUR 8,413 98
Barclays Bank 12/20/17 USD 7,305 JPY 801,276 154
252
EUR—Euro.
JPY—Japanese yen.
USD—U.S. dollar.
Unrealized appreciation (depreciation) on open forward currency contracts is treated as realized gain (loss) for tax purposes.
16
| |
| Capital Value Fund | |
| |
| |
| Statement of Operations | |
| |
| | Year Ended |
| | September 30, 2017 |
| | ($000) |
| Investment Income | |
| Income | |
| Dividends1 | 20,171 |
| Interest 2 | 38 |
| Securities Lending—Net | 507 |
| Total Income | 20,716 |
| Expenses | |
| Investment Advisory Fees—Note B | |
| Basic Fee | 2,091 |
| Performance Adjustment | (1,764) |
| The Vanguard Group—Note C | |
| Management and Administrative | 1,852 |
| Marketing and Distribution | 130 |
| Custodian Fees | 37 |
| Auditing Fees | 37 |
| Shareholders’ Reports and Proxy | 69 |
| Trustees’ Fees and Expenses | 3 |
| Total Expenses | 2,455 |
| Net Investment Income | 18,261 |
| Realized Net Gain (Loss) | |
| Investment Securities Sold 2 | 69,838 |
| Foreign Currencies and Forward Currency Contracts | (380) |
| Realized Net Gain (Loss) | 69,458 |
| Change in Unrealized Appreciation (Depreciation) | |
| Investment Securities 2 | 38,771 |
| Foreign Currencies and Forward Currency Contracts | 110 |
| Change in Unrealized Appreciation (Depreciation) | 38,881 |
| Net Increase (Decrease) in Net Assets Resulting from Operations | 126,600 |
1 Dividends are net of foreign withholding taxes of $271,000.
2 Interest income, realized net gain (loss), and change in unrealized appreciation (depreciation) from an affiliated company of the fund were $0, $1,000, and $0, respectively.
See accompanying Notes, which are an integral part of the Financial Statements.
17
| | |
| Capital Value Fund | | |
| |
| |
| Statement of Changes in Net Assets | | |
| |
| | Year Ended September 30, |
| | 2017 | 2016 |
| | ($000) | ($000) |
| Increase (Decrease) in Net Assets | | |
| Operations | | |
| Net Investment Income | 18,261 | 14,932 |
| Realized Net Gain (Loss) | 69,458 | (164,848) |
| Change in Unrealized Appreciation (Depreciation) | 38,881 | 254,302 |
| Net Increase (Decrease) in Net Assets Resulting from Operations | 126,600 | 104,386 |
| Distributions | | |
| Net Investment Income | (15,817) | (12,846) |
| Realized Capital Gain1 | — | (93,310) |
| Total Distributions | (15,817) | (106,156) |
| Capital Share Transactions | | |
| Issued | 80,436 | 100,481 |
| Issued in Lieu of Cash Distributions | 14,657 | 99,619 |
| Redeemed | (235,684) | (323,723) |
| Net Increase (Decrease) from Capital Share Transactions | (140,591) | (123,623) |
| Total Increase (Decrease) | (29,808) | (125,393) |
| Net Assets | | |
| Beginning of Period | 933,157 | 1,058,550 |
| End of Period2 | 903,349 | 933,157 |
1 Includes fiscal 2017 and 2016 short-term gain distributions totaling $0 and $27,386,000, respectively. Short-term gain distributions are treated as ordinary income dividends for tax purposes.
2 Net Assets—End of Period includes undistributed (overdistributed) net investment income of $11,533,000 and $9,068,000.
See accompanying Notes, which are an integral part of the Financial Statements.
18
| | | | | |
| Capital Value Fund | | | | | |
| |
| |
| Financial Highlights | | | | | |
| |
| |
| For a Share Outstanding | | | Year Ended September 30, |
| Throughout Each Period | 2017 | 2016 | 2015 | 2014 | 2013 |
| Net Asset Value, Beginning of Period | $11.50 | $11.45 | $15.32 | $14.57 | $10.58 |
| Investment Operations | | | | | |
| Net Investment Income | . 2411 | .180 | .1291 | .1782 | .138 |
| Net Realized and Unrealized Gain (Loss) | | | | | |
| on Investments | 1.420 | 1.060 | (2.330) | 2.055 | 4.051 |
| Total from Investment Operations | 1.661 | 1.240 | (2.201) | 2.233 | 4.189 |
| Distributions | | | | | |
| Dividends from Net Investment Income | (.201) | (.144) | (.175) | (.111) | (.199) |
| Distributions from Realized Capital Gains | — | (1.046) | (1.494) | (1.372) | — |
| Total Distributions | (.201) | (1.190) | (1.669) | (1.483) | (.199) |
| Net Asset Value, End of Period | $12.96 | $11.50 | $11.45 | $15.32 | $14.57 |
| |
| Total Return 3 | 14.56% | 11.36% | -15.67% | 16.50% | 40.21% |
| |
| Ratios/Supplemental Data | | | | | |
| Net Assets, End of Period (Millions) | $903 | $933 | $1,059 | $1,784 | $1,249 |
| Ratio of Total Expenses to Average Net Assets4 | 0.27% | 0.25% | 0.50% | 0.47% | 0.41% |
| Ratio of Net Investment Income to | | | | | |
| Average Net Assets | 1.97% | 1.51% | 0.93% | 1.19%2 | 1.03% |
| Portfolio Turnover Rate | 41% | 134% | 90% | 90% | 132% |
1 Calculated based on average shares outstanding.
2 Net investment income per share and the ratio of net investment income to average net assets include $0.18 and 0.12%, respectively, resulting from a special dividend from Vodafone Group plc in the form of cash and shares in Verizon Communications Inc. in February 2014.
3 Total returns do not include account service fees that may have applied in the periods shown. Fund prospectuses provide information about any applicable account service fees.
4 Includes performance-based investment advisory fee increases (decreases) of (0.19%), (0.20%), 0.06%, 0.02%, and (0.05%).
See accompanying Notes, which are an integral part of the Financial Statements.
19
Capital Value Fund
Notes to Financial Statements
Vanguard Capital Value Fund is registered under the Investment Company Act of 1940 as an open-end investment company, or mutual fund.
A. The following significant accounting policies conform to generally accepted accounting principles for U.S. investment companies. The fund consistently follows such policies in preparing its financial statements.
1. Security Valuation: Securities are valued as of the close of trading on the New York Stock Exchange (generally 4 p.m., Eastern time) on the valuation date. Equity securities are valued at the latest quoted sales prices or official closing prices taken from the primary market in which each security trades; such securities not traded on the valuation date are valued at the mean of the latest quoted bid and asked prices. Securities for which market quotations are not readily available, or whose values have been affected by events occurring before the fund’s pricing time but after the close of the securities’ primary markets, are valued at their fair values calculated according to procedures adopted by the board of trustees. These procedures include obtaining quotations from an independent pricing service, monitoring news to identify significant market- or security-specific events, and evaluating changes in the values of foreign market proxies (for example, ADRs, futures contracts, or exchange-traded funds), between the time the foreign markets close and the fund’s pricing time. When fair-value pricing is employed, the prices of securities used by a fund to calculate its net asset value may differ from quoted or published prices for the same securities. Investments in Vanguard Market Liquidity Fund are valued at that fund’s net asset value. Temporary cash investments are valued using the latest bid prices or using valuations based on a matrix system (which considers such factors as security prices, yields, maturities, and ratings), both as furnished by independent pricing services.
2. Foreign Currency: Securities and other assets and liabilities denominated in foreign currencies are translated into U.S. dollars using exchange rates obtained from an independent third party as of the fund’s pricing time on the valuation date. Realized gains (losses) and unrealized appreciation (depreciation) on investment securities include the effects of changes in exchange rates since the securities were purchased, combined with the effects of changes in security prices. Fluctuations in the value of other assets and liabilities resulting from changes in exchange rates are recorded as unrealized foreign currency gains (losses) until the assets or liabilities are settled in cash, at which time they are recorded as realized foreign currency gains (losses).
3. Forward Currency Contracts: The fund enters into forward currency contracts to protect the value of securities and related receivables and payables against changes in future foreign exchange rates. The fund’s risks in using these contracts include movement in the values of the foreign currencies relative to the U.S. dollar and the ability of the counterparties to fulfill their obligations under the contracts. The fund mitigates its counterparty risk by entering into forward currency contracts only with a diverse group of prequalified counterparties, monitoring their financial strength, entering into master netting arrangements with its counterparties, and requiring its counterparties to transfer collateral as security for their performance. In the absence of a default, the collateral pledged or received by the fund cannot be repledged, resold, or rehypothecated.
The master netting arrangements provide that, in the event of a counterparty’s default (including bankruptcy), the fund may terminate the forward currency contracts, determine the net amount owed by either party in accordance with its master netting arrangements, and sell or retain any collateral held up to the net amount owed to the fund under the master netting arrangements. The forward currency contracts contain provisions whereby a counterparty may terminate open contracts if the fund’s net assets decline below a certain level, triggering a payment by the fund
20
Capital Value Fund
if the fund is in a net liability position at the time of the termination. The payment amount would be reduced by any collateral the fund has pledged. Any assets pledged as collateral for open contracts are noted in the Statement of Net Assets. The value of collateral received or pledged is compared daily to the value of the forward currency contracts exposure with each counterparty, and any difference, if in excess of a specified minimum transfer amount, is adjusted and settled within two business days.
Forward currency contracts are valued at their quoted daily prices obtained from an independent third party, adjusted for currency risk based on the expiration date of each contract. The notional amounts of the contracts are not recorded in the Statement of Net Assets. Fluctuations in the value of the contracts are recorded in the Statement of Net Assets as an asset (liability) and in the Statement of Operations as unrealized appreciation (depreciation) until the contracts are closed, when they are recorded as realized forward currency contract gains (losses).
During the year ended September 30, 2017, the fund’s average investment in forward currency contracts represented 2% of net assets, based on the average of notional amounts at each quarter-end during the period.
4. Repurchase Agreements: The fund enters into repurchase agreements with institutional counterparties. Securities pledged as collateral to the fund under repurchase agreements are held by a custodian bank until the agreements mature, and in the absence of a default, such collateral cannot be repledged, resold, or rehypothecated. Each agreement requires that the market value of the collateral be sufficient to cover payments of interest and principal. The fund further mitigates its counterparty risk by entering into repurchase agreements only with a diverse group of prequalified counterparties, monitoring their financial strength, and entering into master repurchase agreements with its counterparties. The master repurchase agreements provide that, in the event of a counterparty’s default (including bankruptcy), the fund may terminate any repurchase agreements with that counterparty, determine the net amount owed, and sell or retain the collateral up to the net amount owed to the fund. Such action may be subject to legal proceedings, which may delay or limit the disposition of collateral.
5. Federal Income Taxes: The fund intends to continue to qualify as a regulated investment company and distribute all of its taxable income. Management has analyzed the fund’s tax positions taken for all open federal income tax years (September 30, 2014–2017), and has concluded that no provision for federal income tax is required in the fund’s financial statements.
6. Distributions: Distributions to shareholders are recorded on the ex-dividend date.
7. Securities Lending: To earn additional income, the fund lends its securities to qualified institutional borrowers. Security loans are subject to termination by the fund at any time, and are required to be secured at all times by collateral in an amount at least equal to the market value of securities loaned. Daily market fluctuations could cause the value of loaned securities to be more or less than the value of the collateral received. When this occurs, the collateral is adjusted and settled on the next business day. The fund further mitigates its counterparty risk by entering into securities lending transactions only with a diverse group of prequalified counterparties, monitoring their financial strength, and entering into master securities lending agreements with its counterparties. The master securities lending agreements provide that, in the event of a counterparty’s default (including bankruptcy), the fund may terminate any loans with that borrower, determine the net amount owed, and sell or retain the collateral up to the net amount owed to the fund; however, such actions may be subject to legal proceedings. While
21
Capital Value Fund
collateral mitigates counterparty risk, in the event of a default, the fund may experience delays and costs in recovering the securities loaned. The fund invests cash collateral received in Vanguard Market Liquidity Fund, and records a liability in the Statement of Net Assets for the return of the collateral, during the period the securities are on loan. Securities lending income represents fees charged to borrowers plus income earned on invested cash collateral, less expenses associated with the loan. During the term of the loan, the fund is entitled to all distributions made on or in respect of the loaned securities.
8. Credit Facility: The fund and certain other funds managed by The Vanguard Group (“Vanguard”) participate in a $3.1 billion committed credit facility provided by a syndicate of lenders pursuant to a credit agreement that may be renewed annually; each fund is individually liable for its borrowings, if any, under the credit facility. Borrowings may be utilized for temporary and emergency purposes, and are subject to the fund’s regulatory and contractual borrowing restrictions. The participating funds are charged administrative fees and an annual commitment fee of 0.10% of the undrawn amount of the facility; these fees are allocated to the funds based on a method approved by the fund’s board of trustees and included in Management and Administrative expenses on the fund’s Statement of Operations. Any borrowings under this facility bear interest at a rate based upon the higher of the one-month London Interbank Offered Rate, federal funds effective rate, or overnight bank funding rate plus an agreed-upon spread.
The fund had no borrowings outstanding at September 30, 2017, or at any time during the period then ended.
9. Other: Dividend income is recorded on the ex-dividend date. Interest income is accrued daily. Premiums and discounts on debt securities purchased are amortized and accreted, respectively, to interest income over the lives of the respective securities. Security transactions are accounted for on the date securities are bought or sold. Costs used to determine realized gains (losses) on the sale of investment securities are those of the specific securities sold.
B. Wellington Management Company llp provides investment advisory services to the fund for a fee calculated at an annual percentage rate of average net assets. The basic fee is subject to quarterly adjustments based on the fund’s performance relative to the Dow Jones U.S. Total Stock Market Float Adjusted Index for the preceding three years. For the year ended September 30, 2017, the investment advisory fee represented an effective annual basic rate of 0.23% of the fund’s average net assets before a decrease of $1,764,000 (0.19%) based on performance.
C. In accordance with the terms of a Funds’ Service Agreement (the “FSA”) between Vanguard and the fund, Vanguard furnishes to the fund corporate management, administrative, marketing, and distribution services at Vanguard’s cost of operations (as defined by the FSA). These costs of operations are allocated to the fund based on methods and guidelines approved by the board of trustees. Vanguard does not require reimbursement in the current period for certain costs of operations (such as deferred compensation/benefits and risk/insurance costs); the fund’s liability for these costs of operations is included in Payables to Vanguard on the Statement of Net Assets.
Upon the request of Vanguard, the fund may invest up to 0.40% of its net assets as capital in Vanguard. At September 30, 2017, the fund had contributed to Vanguard capital in the amount of $55,000, representing 0.01% of the fund’s net assets and 0.02% of Vanguard’s capitalization. The fund’s trustees and officers are also directors and employees, respectively, of Vanguard.
22
Capital Value Fund
D. Various inputs may be used to determine the value of the fund’s investments. These inputs are summarized in three broad levels for financial statement purposes. The inputs or methodologies used to value securities are not necessarily an indication of the risk associated with investing in those securities.
Level 1—Quoted prices in active markets for identical securities.
Level 2—Other significant observable inputs (including quoted prices for similar securities, interest rates, prepayment speeds, credit risk, etc.).
Level 3—Significant unobservable inputs (including the fund’s own assumptions used to determine the fair value of investments). Any investments valued with significant unobservable inputs are noted on the Statement of Net Assets.
The following table summarizes the market value of the fund’s investments as of September 30, 2017, based on the inputs used to value them:
| | | |
| | Level 1 | Level 2 | Level 3 |
| Investments | ($000) | ($000) | ($000) |
| Common Stocks | 832,087 | 64,908 | — |
| Preferred Stocks | — | — | — |
| Temporary Cash Investments | 8,383 | 7,000 | — |
| Forward Currency Contracts—Assets | — | 252 | — |
| Total | 840,470 | 72,160 | — |
E. Distributions are determined on a tax basis and may differ from net investment income and realized capital gains for financial reporting purposes. Differences may be permanent or temporary. Permanent differences are reclassified among capital accounts in the financial statements to reflect their tax character. Temporary differences arise when certain items of income, expense, gain, or loss are recognized in different periods for financial statement and tax purposes. These differences will reverse at some time in the future. Differences in classification may also result from the treatment of short-term gains as ordinary income for tax purposes.
For tax purposes, at September 30, 2017, the fund had $13,698,000 of ordinary income available for distribution. The fund used capital loss carryforwards of $69,547,000 to offset taxable capital gains realized during the year ended September 30, 2017. At September 30, 2017, the fund had available capital losses totaling $97,717,000 that may be carried forward indefinitely to offset future net capital gains.
At September 30, 2017, the cost of investment securities for tax purposes was $797,849,000.
Net unrealized appreciation of investment securities for tax purposes was $114,529,000, consisting of unrealized gains of $149,101,000 on securities that had risen in value since their purchase and $34,572,000 in unrealized losses on securities that had fallen in value since their purchase.
F. During the year ended September 30, 2017, the fund purchased $382,086,000 of investment securities and sold $516,955,000 of investment securities, other than temporary cash investments.
23
Capital Value Fund
| | |
| G. Capital shares issued and redeemed were: | | |
| | Year Ended September 30, |
| | 2017 | 2016 |
| | Shares | Shares |
| | (000) | (000) |
| Issued | 6,622 | 9,076 |
| Issued in Lieu of Cash Distributions | 1,209 | 9,106 |
| Redeemed | (19,274) | (29,458) |
| Net Increase (Decrease) in Shares Outstanding | (11,443) | (11,276) |
H. Management has determined that no material events or transactions occurred subsequent to September 30, 2017, that would require recognition or disclosure in these financial statements.
24
Report of Independent Registered Public Accounting Firm
To the Board of Trustees of Vanguard Malvern Funds and the Shareholders of Vanguard Capital Value Fund
In our opinion, the accompanying statement of net assets and the related statements of operations and of changes in net assets and the financial highlights present fairly, in all material respects, the financial position of Vanguard Capital Value Fund (constituting a separate portfolio of Vanguard Malvern Funds, hereafter referred to as the “Fund”) as of September 30, 2017, the results of its operations for the year then ended, the changes in its net assets for each of the two years in the period then ended and the financial highlights for each of the five years in the period then ended, in conformity with accounting principles generally accepted in the United States of America. These financial statements and financial highlights (hereafter referred to as “financial statements”) are the responsibility of the Fund’s management. Our responsibility is to express an opinion on these financial statements based on our audits. We conducted our audits of these financial statements in accordance with the standards of the Public Company Accounting Oversight Board (United States). Those standards require that we plan and perform the audit to obtain reasonable assurance about whether the financial statements are free of material misstatement. An audit includes examining, on a test basis, evidence supporting the amounts and disclosures in the financial statements, assessing the accounting principles used and significant estimates made by management, and evaluating the overall financial statement presentation. We believe that our audits, which included confirmation of securities as of September 30, 2017 by correspondence with the custodians and brokers and by agreement to the underlying ownership records of the transfer agent, provide a reasonable basis for our opinion.
/s/PricewaterhouseCoopers LLP
Philadelphia, Pennsylvania
November 13, 2017
Special 2017 tax information (unaudited) for Vanguard Capital Value Fund
This information for the fiscal year ended September 30, 2017, is included pursuant to provisions
of the Internal Revenue Code.
The fund distributed $15,817,000 of qualified dividend income to shareholders during the
fiscal year.
For corporate shareholders, 77.7% of investment income (dividend income plus short-term gains,
if any) qualifies for the dividends-received deduction.
25
Your Fund’s After-Tax Returns
This table presents returns for your fund both before and after taxes. The after-tax returns are shown in two ways: (1) assuming that an investor owned the fund during the entire period and paid taxes on the fund’s distributions, and (2) assuming that an investor paid taxes on the fund’s distributions and sold all shares at the end of each period.
Calculations are based on the highest individual federal income tax and capital gains tax rates in effect at the times of the distributions and the hypothetical sales. State and local taxes were not considered. After-tax returns reflect any qualified dividend income, using actual prior-year figures and estimates for 2017. (In the example, returns after the sale of fund shares may be higher than those assuming no sale. This occurs when the sale would have produced a capital loss. The calculation assumes that the investor received a tax deduction for the loss.)
Please note that your actual after-tax returns will depend on your tax situation and may differ from those shown. Also note that if you own the fund in a tax-deferred account, such as an individual retirement account or a 401(k) plan, this information does not apply to you. Such accounts are not subject to current taxes.
Finally, keep in mind that a fund’s performance—whether before or after taxes—does not guarantee future results.
| | | |
| Average Annual Total Returns: Capital Value Fund | | | |
| Periods Ended September 30, 2017 | | | |
| | One | Five | Ten |
| | Year | Years | Years |
| Returns Before Taxes | 14.56% | 11.94% | 5.29% |
| Returns After Taxes on Distributions | 14.12 | 9.46 | 3.76 |
| Returns After Taxes on Distributions and Sale of Fund Shares | 8.57 | 8.64 | 3.72 |
26
About Your Fund’s Expenses
As a shareholder of the fund, you incur ongoing costs, which include costs for portfolio management, administrative services, and shareholder reports (like this one), among others. Operating expenses, which are deducted from a fund’s gross income, directly reduce the investment return of the fund.
A fund’s expenses are expressed as a percentage of its average net assets. This figure is known as the expense ratio. The following examples are intended to help you understand the ongoing costs (in dollars) of investing in your fund and to compare these costs with those of other mutual funds. The examples are based on an investment of $1,000 made at the beginning of the period shown and held for the entire period.
The accompanying table illustrates your fund’s costs in two ways:
• Based on actual fund return. This section helps you to estimate the actual expenses that you paid over the period. The ”Ending Account Value“ shown is derived from the fund‘s actual return, and the third column shows the dollar amount that would have been paid by an investor who started with $1,000 in the fund. You may use the information here, together with the amount you invested, to estimate the expenses that you paid over the period.
To do so, simply divide your account value by $1,000 (for example, an $8,600 account value divided by $1,000 = 8.6), then multiply the result by the number given for your fund under the heading ”Expenses Paid During Period.“
• Based on hypothetical 5% yearly return. This section is intended to help you compare your fund‘s costs with those of other mutual funds. It assumes that the fund had a yearly return of 5% before expenses, but that the expense ratio is unchanged. In this case—because the return used is not the fund’s actual return—the results do not apply to your investment. The example is useful in making comparisons because the Securities and Exchange Commission requires all mutual funds to calculate expenses based on a 5% return. You can assess your fund’s costs by comparing this hypothetical example with the hypothetical examples that appear in shareholder reports of other funds.
Note that the expenses shown in the table are meant to highlight and help you compare ongoing costs only and do not reflect transaction costs incurred by the fund for buying and selling securities. Further, the expenses do not include any purchase, redemption, or account service fees described in the fund prospectus. If such fees were applied to your account, your costs would be higher. Your fund does not carry a “sales load.”
The calculations assume no shares were bought or sold during the period. Your actual costs may have been higher or lower, depending on the amount of your investment and the timing of any purchases or redemptions.
You can find more information about the fund’s expenses, including annual expense ratios, in the Financial Statements section of this report. For additional information on operating expenses and other shareholder costs, please refer to your fund’s current prospectus.
27
| | | |
| Six Months Ended September 30, 2017 | | | |
| | Beginning | Ending | Expenses |
| | Account Value | Account Value | Paid During |
| Capital Value Fund | 3/31/2017 | 9/30/2017 | Period |
| Based on Actual Fund Return | $1,000.00 | $1,043.48 | $1.38 |
| Based on Hypothetical 5% Yearly Return | 1,000.00 | 1,023.71 | 1.37 |
The calculations are based on expenses incurred in the most recent six-month period. The fund’s annualized six-month expense ratio for that period is 0.27%. The dollar amounts shown as “Expenses Paid” are equal to the annualized expense ratio multiplied by the average account value over the period, multiplied by the number of days in the most recent six-month period, then divided by the number of days in the most recent 12-month period (183/365).
28
Glossary
30-Day SEC Yield. A fund’s 30-day SEC yield is derived using a formula specified by the U.S. Securities and Exchange Commission. Under the formula, data related to the fund’s security holdings in the previous 30 days are used to calculate the fund’s hypothetical net income for that period, which is then annualized and divided by the fund’s estimated average net assets over the calculation period. For the purposes of this calculation, a security’s income is based on its current market yield to maturity (for bonds), its actual income (for asset-backed securities), or its projected dividend yield (for stocks). Because the SEC yield represents hypothetical annualized income, it will differ—at times significantly—from the fund’s actual experience. As a result, the fund’s income distributions may be higher or lower than implied by the SEC yield.
Beta. A measure of the magnitude of a fund’s past share-price fluctuations in relation to the ups and downs of a given market index. The index is assigned a beta of 1.00. Compared with a given index, a fund with a beta of 1.20 typically would have seen its share price rise or fall by 12% when the index rose or fell by 10%. For this report, beta is based on returns over the past 36 months for both the fund and the index. Note that a fund’s beta should be reviewed in conjunction with its R-squared (see definition). The lower the R-squared, the less correlation there is between the fund and the index, and the less reliable beta is as an indicator of volatility.
Dividend Yield. Dividend income earned by stocks, expressed as a percentage of the aggregate market value (or of net asset value, for a fund). The yield is determined by dividing the amount of the annual dividends by the aggregate value (or net asset value) at the end of the period. For a fund, the dividend yield is based solely on stock holdings and does not include any income produced by other investments.
Earnings Growth Rate. The average annual rate of growth in earnings over the past five years for the stocks now in a fund.
Equity Exposure. A measure that reflects a fund’s investments in stocks and stock futures. Any holdings in short-term reserves are excluded.
Expense Ratio. A fund’s total annual operating expenses expressed as a percentage of the fund’s average net assets. The expense ratio includes management and administrative expenses, but does not include the transaction costs of buying and selling portfolio securities.
Foreign Holdings. The percentage of a fund represented by securities or depositary receipts of companies based outside the United States.
Inception Date. The date on which the assets of a fund (or one of its share classes) are first invested in accordance with the fund’s investment objective. For funds with a subscription period, the inception date is the day after that period ends. Investment performance is measured from the inception date.
Median Market Cap. An indicator of the size of companies in which a fund invests; the midpoint of market capitalization (market price x shares outstanding) of a fund’s stocks, weighted by the proportion of the fund’s assets invested in each stock. Stocks representing half of the fund’s assets have market capitalizations above the median, and the rest are below it.
Price/Book Ratio. The share price of a stock divided by its net worth, or book value, per share.
For a fund, the weighted average price/book ratio of the stocks it holds.
29
Price/Earnings Ratio. The ratio of a stock’s current price to its per-share earnings over the past year. For a fund, the weighted average P/E of the stocks it holds. P/E is an indicator of market expectations about corporate prospects; the higher the P/E, the greater the expectations for a company’s future growth.
R-Squared. A measure of how much of a fund’s past returns can be explained by the returns from the market in general, as measured by a given index. If a fund’s total returns were precisely synchronized with an index’s returns, its R-squared would be 1.00. If the fund’s returns bore no relationship to the index’s returns, its R-squared would be 0. For this report, R-squared is based on returns over the past 36 months for both the fund and the index.
Return on Equity. The annual average rate of return generated by a company during the past five years for each dollar of shareholder’s equity (net income divided by shareholder’s equity). For a fund, the weighted average return on equity for the companies whose stocks it holds.
Short-Term Reserves. The percentage of a fund invested in highly liquid, short-term securities that can be readily converted to cash.
Turnover Rate. An indication of the fund’s trading activity. Funds with high turnover rates incur higher transaction costs and may be more likely to distribute capital gains (which may be taxable to investors). The turnover rate excludes in-kind transactions, which have minimal impact on costs.
30
The Global Industry Classification Standard (“GICS”) was developed by and is the exclusive property and a service mark of MSCI Inc. (“MSCI”) and Standard and Poor’s, a division of McGraw-Hill Companies, Inc. (“S&P”), and is licensed for use by Vanguard. Neither MSCI, S&P nor any third party involved in making or compiling the GICS or any GICS classification makes any express or implied warranties or representations with respect to such standard or classification (or the results to be obtained by the use thereof), and all such parties hereby expressly disclaim all warranties of originality, accuracy, completeness, merchantability or fitness for a particular purpose with respect to any such standard or classification. Without limiting any of the foregoing, in no event shall MSCI, S&P, any of its affiliates or any third party involved in making or compiling the GICS or any GICS classification have any liability for any direct, indirect, special, punitive, consequential or any other damages (including lost profits) even if notified of the possibility of such damages.
31
This page intentionally left blank.
This page intentionally left blank.
This page intentionally left blank.
The People Who Govern Your Fund
The trustees of your mutual fund are there to see that the fund is operated and managed in your best interests since, as a shareholder, you are a part owner of the fund. Your fund’s trustees also serve on the board of directors of The Vanguard Group, Inc., which is owned by the Vanguard funds and provides services to them on an at-cost basis.
A majority of Vanguard’s board members are independent, meaning that they have no affiliation with Vanguard or the funds they oversee, apart from the sizable personal investments they have made as private individuals. The independent board members have distinguished backgrounds in business, academia, and public service. Each of the trustees and executive officers oversees 198 Vanguard funds.
Information for each trustee and executive officer of the fund appears below. The mailing address of the trustees and officers is P.O. Box 876, Valley Forge, PA 19482. More information about the trustees is in the Statement of Additional Information, which can be obtained, without charge, by contacting Vanguard at 800-662-7447, or online at vanguard.com.
Interested Trustee1
F. William McNabb III
Born 1957. Trustee Since July 2009. Chairman of the Board. Principal Occupation(s) During the Past Five Years and Other Experience: Chairman of the Board of The Vanguard Group, Inc., and of each of the investment companies served by The Vanguard Group, since January 2010; Chief Executive Officer and Director of The Vanguard Group and President and Chief Executive Officer of each of the investment companies served by The Vanguard Group, since 2008; Director of Vanguard Marketing Corporation; President of The Vanguard Group (2008–2017); Managing Director of The Vanguard Group (1995–2008).
Independent Trustees
Emerson U. Fullwood
Born 1948. Trustee Since January 2008. Principal Occupation(s) During the Past Five Years and Other Experience: Executive Chief Staff and Marketing Officer for North America and Corporate Vice President (retired 2008) of Xerox Corporation (document management products and services);
Executive in Residence and 2009–2010 Distinguished Minett Professor at the Rochester Institute of Technology; Lead Director of SPX FLOW, Inc. (multi-industry manufacturing); Director of the United Way of Rochester, the University of Rochester Medical Center, Monroe Community College Foundation, North Carolina A&T University, and Roberts Wesleyan College; Trustee of the University of Rochester.
Rajiv L. Gupta
Born 1945. Trustee Since December 2001.2 Principal Occupation(s) During the Past Five Years and Other Experience: Chairman and Chief Executive Officer (retired 2009) and President (2006–2008) of Rohm and Haas Co. (chemicals); Director of Arconic Inc. (diversified manufacturer), HP Inc. (printer and personal computer manufacturing), and Delphi Automotive plc (automotive components); Senior Advisor at New Mountain Capital.
Amy Gutmann
Born 1949. Trustee Since June 2006. Principal Occupation(s) During the Past Five Years and Other Experience: President of the University of Pennsylvania; Christopher H. Browne
1 Mr. McNabb is considered an “interested person,” as defined in the Investment Company Act of 1940, because he is an officer of the Vanguard funds.
2 December 2002 for Vanguard Equity Income Fund, the Vanguard Municipal Bond Funds, and the Vanguard State Tax-Exempt Funds.
Distinguished Professor of Political Science, School of Arts and Sciences, and Professor of Communication, Annenberg School for Communication, with secondary faculty appointments in the Department of Philosophy, School of Arts and Sciences, and at the Graduate School of Education, University of Pennsylvania; Trustee of the National Constitution Center.
JoAnn Heffernan Heisen
Born 1950. Trustee Since July 1998. Principal Occupation(s) During the Past Five Years and Other Experience: Corporate Vice President and Member of the Executive Committee (1997–2008), Chief Global Diversity Officer (retired 2008), Vice President and Chief Information Officer (1997–2006), Controller (1995–1997), Treasurer (1991–1995), and Assistant Treasurer (1989–1991) of Johnson & Johnson (pharmaceuticals/medical devices/ consumer products); Director of Skytop Lodge Corporation (hotels) and the Robert Wood Johnson Foundation; Member of the Advisory Board of the Institute for Women’s Leadership at Rutgers University.
F. Joseph Loughrey
Born 1949. Trustee Since October 2009. Principal Occupation(s) During the Past Five Years and Other Experience: President and Chief Operating Officer (retired 2009) of Cummins Inc. (industrial machinery); Chairman of the Board of Hillenbrand, Inc. (specialized consumer services), Oxfam America, and the Lumina Foundation for Education; Director of the V Foundation for Cancer Research; Member of the Advisory Council for the College of Arts and Letters and Chair of the Advisory Board to the Kellogg Institute for International Studies, both at the University of Notre Dame.
Mark Loughridge
Born 1953. Trustee Since March 2012. Principal Occupation(s) During the Past Five Years and Other Experience: Senior Vice President and Chief Financial Officer (retired 2013) at IBM (information technology services); Fiduciary Member of IBM’s Retirement Plan Committee (2004–2013); Member of the Council on Chicago Booth.
Scott C. Malpass
Born 1962. Trustee Since March 2012. Principal Occupation(s) During the Past Five Years and Other Experience: Chief Investment Officer and Vice President at the University of Notre Dame; Assistant Professor of Finance at the Mendoza College of Business at Notre Dame; Member of the Notre Dame 403(b) Investment Committee, the Board of Advisors for Spruceview Capital Partners, the Board of Catholic Investment Services, Inc. (investment advisor), and the Board of Superintendence of the Institute for the Works of Religion; Chairman of the Board of TIFF Advisory Services, Inc. (investment advisor).
André F. Perold
Born 1952. Trustee Since December 2004. Principal Occupation(s) During the Past Five Years and Other Experience: George Gund Professor of Finance and Banking, Emeritus at the Harvard Business School (retired 2011); Chief Investment Officer and Co-Managing Partner of HighVista Strategies LLC (private investment firm); Overseer of the Museum of Fine Arts Boston.
Peter F. Volanakis
Born 1955. Trustee Since July 2009. Principal Occupation(s) During the Past Five Years and Other Experience: President and Chief Operating Officer (retired 2010) of Corning Incorporated (communications equipment); Chairman of the Board of Trustees of Colby-Sawyer College; Member of the Board of Hypertherm, Inc. (industrial cutting systems, software, and consumables).
Executive Officers
Glenn Booraem
Born 1967. Investment Stewardship Officer Since February 2017. Principal Occupation(s) During the Past Five Years and Other Experience: Principal of The Vanguard Group, Inc.; Treasurer (2015–2017), Controller (2010–2015), and Assistant Controller (2001–2010) of each of the investment companies served by The Vanguard Group.
Thomas J. Higgins
Born 1957. Chief Financial Officer Since September 2008. Principal Occupation(s) During the Past Five Years and Other Experience: Principal of The Vanguard Group, Inc.; Chief Financial Officer of each of the investment companies served by The Vanguard Group; Treasurer of each of the investment companies served by The Vanguard Group (1998–2008).
Peter Mahoney
Born 1974. Controller Since May 2015. Principal Occupation(s) During the Past Five Years and Other Experience: Principal of The Vanguard Group, Inc.; Controller of each of the investment companies served by The Vanguard Group; Head of International Fund Services at The Vanguard Group (2008–2014).
Anne E. Robinson
Born 1970. Secretary Since September 2016. Principal Occupation(s) During the Past Five Years and Other Experience: Managing Director of The Vanguard Group, Inc.; General Counsel of The Vanguard Group; Secretary of The Vanguard Group and of each of the investment companies served by The Vanguard Group; Director and Senior Vice President of Vanguard Marketing Corporation; Managing Director and General Counsel of Global Cards and Consumer Services at Citigroup (2014–2016); Counsel at American Express (2003–2014).
Michael Rollings
Born 1963. Treasurer Since February 2017. Principal Occupation(s) During the Past Five Years and Other Experience: Managing Director of The Vanguard Group, Inc.; Treasurer of each of the investment companies served by The Vanguard Group; Director of Vanguard Marketing Corporation; Executive Vice President and Chief Financial Officer of MassMutual Financial Group (2006–2016).
| |
| Vanguard Senior Management Team |
| |
| Mortimer J. Buckley | Chris D. McIsaac |
| Gregory Davis | James M. Norris |
| John James | Thomas M. Rampulla |
| Martha G. King | Karin A. Risi |
| John T. Marcante | |
Chairman Emeritus and Senior Advisor
John J. Brennan
Chairman, 1996–2009
Chief Executive Officer and President, 1996–2008
Founder
John C. Bogle
Chairman and Chief Executive Officer, 1974–1996
| |  |
| | P.O. Box 2600 |
| | Valley Forge, PA 19482-2600 |
| |
| |
| |
| Connect with Vanguard® > | vanguard.com |
| |
| |
| |
| Fund Information > 800-662-7447 | CFA® is a registered trademark owned by CFA Institute. |
| Direct Investor Account Services > 800-662-2739 |
| Institutional Investor Services > 800-523-1036 |
| Text Telephone for People | |
| Who Are Deaf or Hard of Hearing> 800-749-7273 |
| |
| This material may be used in conjunction |
| with the offering of shares of any Vanguard |
| fund only if preceded or accompanied by |
| the fund’s current prospectus. | |
| |
| All comparative mutual fund data are from Lipper, a |
| Thomson Reuters Company, or Morningstar, Inc., unless |
| otherwise noted. | |
| |
| You can obtain a free copy of Vanguard’s proxy voting |
| guidelines by visiting vanguard.com/proxyreporting or by |
| calling Vanguard at 800-662-2739. The guidelines are |
| also available from the SEC’s website, sec.gov. In |
| addition, you may obtain a free report on how your fund |
| voted the proxies for securities it owned during the 12 |
| months ended June 30. To get the report, visit either |
| vanguard.com/proxyreporting or sec.gov. |
| |
| You can review and copy information about your fund at |
| the SEC’s Public Reference Room in Washington, D.C. To |
| find out more about this public service, call the SEC at |
| 202-551-8090. Information about your fund is also |
| available on the SEC’s website, and you can receive |
| copies of this information, for a fee, by sending a |
| request in either of two ways: via email addressed to |
| publicinfo@sec.gov or via regular mail addressed to the |
| Public Reference Section, Securities and Exchange |
| Commission, Washington, DC 20549-1520. |
| | © 2017 The Vanguard Group, Inc. |
| | All rights reserved. |
| | Vanguard Marketing Corporation, Distributor. |
| |
| | Q3280 112017 |

Annual Report | September 30, 2017
Vanguard Short-Term Inflation-Protected
Securities Index Fund
Vanguard’s Principles for Investing Success
We want to give you the best chance of investment success. These principles, grounded in Vanguard’s research and experience, can put you on the right path.
Goals. Create clear, appropriate investment goals.
Balance. Develop a suitable asset allocation using broadly diversified funds. Cost. Minimize cost.
Discipline. Maintain perspective and long-term discipline.
A single theme unites these principles: Focus on the things you can control.
We believe there is no wiser course for any investor.
| |
| Contents | |
| Your Fund’s Performance at a Glance. | 1 |
| Chairman’s Perspective. | 3 |
| Fund Profile. | 7 |
| Performance Summary. | 9 |
| Financial Statements. | 12 |
| About Your Fund’s Expenses. | 26 |
| Glossary. | 28 |
Please note: The opinions expressed in this report are just that—informed opinions. They should not be considered promises or advice. Also, please keep in mind that the information and opinions cover the period through the date on the front of this report. Of course, the risks of investing in your fund are spelled out in the prospectus.
See the Glossary for definitions of investment terms used in this report.
About the cover: Nautical images have been part of Vanguard’s rich heritage since its start in 1975. For an incoming ship, a lighthouse offers a beacon and safe path to shore. You can similarly depend on Vanguard to put you first––and light the way––as you strive to meet your financial goals. Our client focus and low costs, stemming from our unique ownership structure, assure that your interests are paramount.
Your Fund’s Performance at a Glance
• For the 12 months ended September 30, 2017, Vanguard Short-Term Inflation-Protected Securities Index Fund returned 0.31% for Investor Shares, tracking its benchmark index (+0.51%) and exceeding the average return of its peer funds (–0.14%). The 30-day SEC yield for Investor Shares began the period at –0.40% and ended at –0.20%.
• Prices of regular U.S. Treasury securities fell during the period as economic prospects brightened and interest rates rose. However, Treasury Inflation-Protected Securities (TIPS) outperformed regular Treasuries as inflation expectations increased, a development that typically favors TIPS over nominal Treasuries.
• A measure of expected inflation over the next five years (the gap between nominal and TIPS yields) widened from 1.42% to 1.82%.
• To minimize the risk of overdistributing income, the fund withheld income distribution in March, June, and September in light of the low-interest-rate environment. Distributions will be made when sufficient income is available.
| | | | |
| Total Returns: Fiscal Year Ended September 30, 2017 | | | |
| | 30-Day SEC | Income | Capital | Total |
| | Yield | Returns | Returns | Returns |
| Vanguard Short-Term Inflation-Protected Securities Index Fund | | | |
| Investor Shares | -0.20% | 0.55% | -0.24% | 0.31% |
| ETF Shares | -0.12 | | | |
| Market Price | | | | 0.38 |
| Net Asset Value | | | | 0.40 |
| Admiral™ Shares | -0.12 | 0.76 | -0.36 | 0.40 |
| Institutional Shares | -0.12 | 0.80 | -0.36 | 0.44 |
| Bloomberg Barclays U.S. Treasury Inflation-Protected | | | | |
| Securities (TIPS) 0–5 Year Index | | | | 0.51 |
| Inflation-Protected Bond Funds Average | | | | -0.14 |
Inflation-Protected Bond Funds Average: Derived from data provided by Lipper, a Thomson Reuters Company.
Admiral Shares carry lower expenses and are available to investors who meet certain account-balance requirements. Institutional Shares are available to certain institutional investors who meet specific administrative, service, and account-size criteria. The Vanguard ETF® Shares shown are traded on the Nasdaq exchange and are available only through brokers. The table provides ETF returns based on both the Nasdaq market price and the net asset value for a share. U.S. Pat. Nos. 6,879,964; 7,337,138; 7,720,749; 7,925,573; 8,090,646; and 8,417,623.
For the ETF Shares, the market price is determined by the midpoint of the bid-offer spread as of the closing time of the New York Stock Exchange (generally 4 p.m., Eastern time). The net asset value is also determined as of the NYSE closing time. For more information about how the ETF Shares' market prices have compared with their net asset value, visit vanguard.com, select your ETF, and then select the Price and Performance tab. The ETF premium/discount analysis there shows the percentages of days on which the ETF Shares' market price was above or below the NAV.
1
| |
| Total Returns: Inception Through September 30, 2017 | |
| | Average |
| | Annual Return |
| Short-Term Inflation-Protected Securities Index Fund Investor Shares (Returns since inception: | |
| 10/16/2012) | 0.09% |
| Bloomberg Barclays U.S. Treasury Inflation-Protected Securities (TIPS) 0–5 Year Index | 0.18 |
| Inflation-Protected Bond Funds Average | -0.54 |
| Inflation-Protected Bond Funds Average: Derived from data provided by Lipper, a Thomson Reuters Company. | |
The figures shown represent past performance, which is not a guarantee of future results. (Current performance may be lower or higher than the performance data cited. For performance data current to the most recent month-end, visit our website at vanguard.com/performance.) Note, too, that both investment returns and principal value can fluctuate widely, so an investor’s shares, when sold, could be worth more or less than their original cost.
| | | | | |
| Expense Ratios | | | | | |
| Your Fund Compared With Its Peer Group | | | | | |
| | Investor | ETF | Admiral | Institutional | Peer Group |
| | Shares | Shares | Shares | Shares | Average |
| Short-Term Inflation-Protected Securities Index | | | | | |
| Fund | 0.16% | 0.07% | 0.07% | 0.04% | 0.74% |
The fund expense ratios shown are from the prospectus dated January 26, 2017, and represent estimated costs for the current fiscal year. For the fiscal year ended September 30, 2017, the expense ratios were 0.15% for Investor Shares, 0.06% for ETF Shares, 0.06% for Admiral Shares, and 0.04% for Institutional Shares. The peer-group expense ratio is derived from data provided by Lipper, a Thomson Reuters Company, and captures information through year-end 2016.
Peer group: Inflation-Protected Bond Funds.
2
Chairman’s Perspective

Bill McNabb
Chairman and Chief Executive Officer
Dear Shareholder,
Our investors depend on Vanguard to be a responsible steward of their assets. This includes our obvious responsibilities—managing the funds, offering investment perspectives and advice, and assisting with questions and transactions.
But because a long-term perspective informs every aspect of our investment approach, we also work on your behalf in less obvious ways, such as by advocating for responsible governance among the companies in which Vanguard funds invest. Vanguard’s index funds are essentially permanent owners of thousands of publicly traded companies, and we have a special obligation to be engaged stewards actively focused on the long term.
Simply put, we believe that well-governed companies are more likely to perform well over the long run.
Although Vanguard has always been an advocate for strong corporate governance, we have expanded our efforts recently as our investor base continues to grow. Our Investment Stewardship team has doubled in size since 2015, and we continue to add analysts, researchers, and operations team members. The team guides our engagement activities and our funds’ proxy voting by analyzing corporate governance practices in companies around the world.
3
Our four Investment Stewardship pillars
As we evaluate company responsiveness to governance matters, including environmental and social concerns, we focus on four key areas—what we call our Investment Stewardship pillars:
• The board: A high-functioning, well-composed, independent, diverse, and experienced board with effective ongoing evaluation practices.
• Governance structures: Provisions and structures that empower shareholders and protect their rights.
• Appropriate compensation: Pay that incentivizes relative outperformance over the long term.
• Risk oversight: Effective, integrated, and ongoing oversight of relevant industry-and company-specific risks.
Guided by these pillars, our Investment Stewardship team conducted more than 950 engagements, or discussions, with company directors and leaders worldwide during the 12 months ended June 30, 2017.
| | | |
| Market Barometer | | | |
| | | Average Annual Total Returns |
| | Periods Ended September 30, 2017 |
| | One Year | Three Years | Five Years |
| Stocks | | | |
| Russell 1000 Index (Large-caps) | 18.54% | 10.63% | 14.27% |
| Russell 2000 Index (Small-caps) | 20.74 | 12.18 | 13.79 |
| Russell 3000 Index (Broad U.S. market) | 18.71 | 10.74 | 14.23 |
| FTSE All-World ex US Index (International) | 19.49 | 5.11 | 7.35 |
| |
| Bonds | | | |
| Bloomberg Barclays U.S. Aggregate Bond Index | | | |
| (Broad taxable market) | 0.07% | 2.71% | 2.06% |
| Bloomberg Barclays Municipal Bond Index | | | |
| (Broad tax-exempt market) | 0.87 | 3.19 | 3.01 |
| Citigroup Three-Month U.S. Treasury Bill Index | 0.64 | 0.28 | 0.18 |
| |
| CPI | | | |
| Consumer Price Index | 2.23% | 1.22% | 1.30% |
4
We also cast more than 171,000 votes on behalf of Vanguard funds at more than 18,000 shareholder meetings.
Gender diversity on boards and climate risk
As we engage with companies, we are devoting increased attention to two specific topics. The first is gender diversity on boards. It’s no secret that the right combination of talent, skills, and experience leads to better results, so we pay close attention to how company boards are structured and managed, and how they evolve.
In recent years, a growing body of research has demonstrated that greater diversity on boards can lead to improved governance and company performance. We are advocating for boards to incorporate diverse perspectives and experience into their strategic planning and decision-making. One example of our commitment to more diverse boards is our participation in the 30% Club, a global coalition working to increase the representation of women in boardrooms and leadership roles.
The second issue is climate risk. We will continue to engage with companies to understand their responses to this risk. Regardless of one’s perspective on the issue, the potential is real for changing regulations, demographics, and consumption behavior to affect business results for companies in many sectors.
We want to ensure that such business and regulatory risks are sufficiently disclosed so investors can value companies appropriately. In the past year, we have voted for shareholder proposals at several energy companies that called for management to improve its climate risk assessment and planning, and we will consider supporting similar proposals if we believe they are beneficial to long-term shareholder value. When a proposal from a shareholder presents a strong case for change, we’re more than willing to fully consider it. And even if the case falls short, these proposals often catalyze a discussion that generates meaningful change over time.
In addition to considering activists’ proposals, we consult research providers and our own network of experts. When we detect material risks to a company’s long-term value (such as bad leadership, poor disclosure, misaligned compensation structures, or threats to shareholder rights), we act with our voice and our vote.
Our stewardship reflects our mission
But we don’t act as independent agents with our own agenda. Every time we speak with a company chairman, CEO, or director, we’re acutely aware of the role we play in representing the economic interests of more than 20 million Vanguard investors. So you can expect us to speak out when we detect threats to the economic interests of our shareholders.
5
We take positions on these matters not because they are inherently good or noble but because they are tied to the long-term economic value of your funds’ investments.
You trust us to represent your interests across the globe. You can be confident we act on that responsibility with the seriousness and dedication it deserves.
To learn more about our Investment Stewardship program, including how our funds have voted, visit https://about. vanguard.com/investment-stewardship/.
As always, thank you for investing with Vanguard.

F. William McNabb III
Chairman and Chief Executive Officer
October 13, 2017
6
Short-Term Inflation-Protected Securities Index Fund
Fund Profile
As of September 30, 2017
| | | | |
| Share-Class Characteristics | | | | |
| | Investor | | Admiral | Institutional |
| | Shares | ETF Shares | Shares | Shares |
| Ticker Symbol | VTIPX | VTIP | VTAPX | VTSPX |
| Expense Ratio1 | 0.16% | 0.07% | 0.07% | 0.04% |
| 30-Day SEC Yield2 | -0.20% | -0.12% | -0.12% | -0.12% |
| | | |
| Financial Attributes | | |
| |
| | | Bloomberg | |
| | | Barclays | Bloomberg |
| | | TIPS | Barclays |
| | | 0-5 Year | Aggregate |
| | Fund | Index | Bond Index |
| |
| Number of Bonds | 15 | 15 | 9,460 |
| |
| Yield to Maturity | | | |
| (before expenses) | 2.0% | 2.0% | 2.6% |
| |
| Average Coupon | 0.6% | 0.6% | 3.1% |
| |
| Average Duration | 2.7 years | 2.7 years | 6.0 years |
| |
| Average Effective | | | |
| Maturity | 2.7 years | 2.7 years | 8.2 years |
| |
| Short-Term | | | |
| Reserves | 0.1% | — | — |
| |
| Sector Diversification (% of portfolio) | |
| Treasury/Agency | 100.0% |
| | |
| Volatility Measures | | |
| | Bloomberg | |
| | Barclays | Bloomberg |
| | TIPS | Barclays |
| | 0-5 Year | Aggregate Bond |
| | Index | Index |
| R-Squared | 0.99 | 0.24 |
| Beta | 1.02 | 0.28 |
These measures show the degree and timing of the fund’s fluctuations compared with the indexes over 36 months.
| |
| Distribution by Credit Quality (% of portfolio) |
| U.S. Government | 100.0% |
Credit-quality ratings are obtained from Barclays and are from Moody's, Fitch, and S&P. When ratings from all three agencies are used, the median rating is shown. When ratings from two of the agencies are used, the lower rating for each issue is shown. "Not Rated" is used to classify securities for which a rating is not available. For more information about these ratings, see the Glossary entry for Credit Quality.
The agency and mortgage-backed securities sectors may include issues from government-sponsored enterprises; such issues are generally not backed by the full faith and credit of the U.S. government.
| |
| Distribution by Effective Maturity | |
| (% of portfolio) | |
| Under 1 Year | 16.8% |
| 1 - 3 Years | 37.4 |
| 3 - 5 Years | 45.8 |
1 The expense ratios shown are from the prospectus dated January 26, 2017, and represent estimated costs for the current fiscal year. For the fiscal year ended September 30, 2017, the expense ratios were 0.15% for Investor Shares, 0.06% for ETF Shares, 0.06% for Admiral Shares, and 0.04% for Institutional Shares.
2 Yields of inflation-protected securities tend to be lower than those of nominal bonds, because the former do not incorporate market expectations about inflation. The principal amounts—and thus the interest payments—of inflation-protected securities are adjusted over time to reflect inflation.
7
Short-Term Inflation-Protected Securities Index Fund
Investment Focus

8
Short-Term Inflation-Protected Securities Index Fund
Performance Summary
All of the returns in this report represent past performance, which is not a guarantee of future results that may be achieved by the fund. (Current performance may be lower or higher than the performance data cited. For performance data current to the most recent month-end, visit our website at vanguard.com/performance.) Note, too, that both investment returns and principal value can fluctuate widely, so an investor’s shares, when sold, could be worth more or less than their original cost. The returns shown do not reflect taxes that a shareholder would pay on fund distributions or on the sale of fund shares.
Cumulative Performance: October 16, 2012, Through September 30, 2017
Initial Investment of $10,000
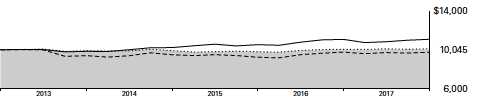
| | | | |
| | | Average Annual Total Returns | |
| | | Periods Ended September 30, 2017 | |
| |
| | | | Since | Final Value |
| | | One | Inception | of a $10,000 |
| | | Year | (10/16/2012) | Investment |
| | Short-Term Inflation-Protected | | | |
| | Securities Index Fund Investor Shares | 0.31% | 0.09% | $10,045 |
| | Bloomberg Barclays U.S. Treasury | | | |
| • • • • • • • • | | | | |
| | Inflation-Protected Securities (TIPS) 0–5 | | | |
| | Year Index | 0.51 | 0.18 | 10,090 |
| |
| – – – – | Inflation-Protected Bond Funds Average | -0.14 | -0.54 | 9,735 |
| |
| | Bloomberg Barclays U.S. Aggregate | | | |
| | Bond Index | 0.07 | 2.08 | 11,074 |
Inflation-Protected Bond Funds Average: Derived from data provided by Lipper, a Thomson Reuters Company.
"Since Inception" performance is calculated from the Investor Shares’ inception date for both the fund and its comparative standards.
| | | |
| | | Since | Final Value |
| | One | Inception | of a $10,000 |
| | Year | (10/12/2012) | Investment |
| Short-Term Inflation-Protected Securities | | | |
| Index Fund ETF Shares Net Asset Value | 0.40% | 0.18% | $10,089 |
| Bloomberg Barclays U.S. Treasury | | | |
| Inflation-Protected Securities (TIPS) 0–5 Year | | | |
| Index | 0.51 | 0.18 | 10,088 |
| Bloomberg Barclays U.S. Aggregate Bond | | | |
| Index | 0.07 | 2.05 | 11,058 |
"Since Inception" performance is calculated from the ETF Shares’ inception date for both the fund and its comparative standards.
See Financial Highlights for dividend and capital gains information.
9
| | | |
| Short-Term Inflation-Protected Securities Index Fund | | | |
| |
| |
| |
| |
| | Average Annual Total Returns | |
| | Periods Ended September 30, 2017 | |
| | | Since | Final Value |
| | One | Inception | of a $10,000 |
| | Year | (10/16/2012) | Investment |
| Short-Term Inflation-Protected Securities | | | |
| Index Fund Admiral Shares | 0.40% | 0.18% | $10,089 |
| Bloomberg Barclays U.S. Treasury | | | |
| Inflation-Protected Securities (TIPS) 0–5 Year | | | |
| Index | 0.51 | 0.18 | 10,090 |
| Bloomberg Barclays U.S. Aggregate Bond | | | |
| Index | 0.07 | 2.08 | 11,074 |
"Since Inception" performance is calculated from the Admiral Shares’ inception date for both the fund and its comparative standards.
| | | |
| | | Since | Final Value |
| | One | Inception | of a $5,000,000 |
| | Year | (10/17/2012) | Investment |
| Short-Term Inflation-Protected Securities | | | |
| Index Fund Institutional Shares | 0.44% | 0.22% | $5,054,760 |
| Bloomberg Barclays U.S. Treasury | | | |
| Inflation-Protected Securities (TIPS) 0–5 Year | | | |
| Index | 0.51 | 0.19 | 5,048,466 |
| Bloomberg Barclays U.S. Aggregate Bond | | | |
| Index | 0.07 | 2.13 | 5,549,614 |
"Since Inception" performance is calculated from the Institutional Shares’ inception date for both the fund and its comparative standards.
| | |
| Cumulative Returns of ETF Shares: October 12, 2012, Through September 30, 2017 | |
| |
| | | Since |
| | One | Inception |
| | Year | (10/12/2012) |
| Short-Term Inflation-Protected Securities Index Fund | | |
| ETF Shares Market Price | 0.38% | 0.98% |
| Short-Term Inflation-Protected Securities Index Fund | | |
| ETF Shares Net Asset Value | 0.40 | 0.89 |
| Bloomberg Barclays U.S. Treasury | | |
| Inflation-Protected Securities (TIPS) 0–5 Year Index | 0.51 | 0.88 |
"Since Inception" performance is calculated from the ETF Shares’ inception date for both the fund and its comparative standards.
10
Short-Term Inflation-Protected Securities Index Fund
| | | | |
| Fiscal-Year Total Returns (%): October 16, 2012, Through September 30, 2017 | |
| | | | | Bloomberg |
| | | | | Barclays |
| | | | | TIPS |
| | | | | 0-5 Year |
| | | | Investor Shares | Index |
| Fiscal Year | Income Returns | Capital Returns | Total Returns | Total Returns |
| 2013 | 0.09% | -1.00% | -0.91% | -1.20% |
| 2014 | 0.02 | -0.04 | -0.02 | 0.21 |
| 2015 | 0.70 | -2.06 | -1.36 | -1.19 |
| 2016 | 0.43 | 2.05 | 2.48 | 2.62 |
| 2017 | 0.55 | -0.24 | 0.31 | 0.51 |
11
Short-Term Inflation-Protected Securities Index Fund
Financial Statements
Statement of Net Assets
As of September 30, 2017
The fund reports a complete list of its holdings in regulatory filings four times in each fiscal year, at the quarter-ends. For the second and fourth fiscal quarters, the lists appear in the fund’s semiannual and annual reports to shareholders. For the first and third fiscal quarters, the fund files the lists with the Securities and Exchange Commission on Form N-Q. Shareholders can look up the fund’s Forms N-Q on the SEC’s website at sec.gov. Forms N-Q may also be reviewed and copied at the SEC’s Public Reference Room (see the back cover of this report for further information).
| | | | |
| | | | Face | Market |
| | | Maturity | Amount | Value • |
| | Coupon | Date | ($000) | ($000) |
| U.S. Government and Agency Obligations (99.8%) | | | |
| U.S. Government Securities (99.8%) | | | | |
| United States Treasury Inflation Indexed Bonds | 1.625% | 1/15/18 | 584,994 | 688,020 |
| United States Treasury Inflation Indexed Bonds | 0.125% | 4/15/18 | 2,111,735 | 2,236,915 |
| United States Treasury Inflation Indexed Bonds | 1.375% | 7/15/18 | 594,452 | 685,764 |
| United States Treasury Inflation Indexed Bonds | 2.125% | 1/15/19 | 545,639 | 641,440 |
| United States Treasury Inflation Indexed Bonds | 0.125% | 4/15/19 | 2,121,308 | 2,223,690 |
| United States Treasury Inflation Indexed Bonds | 1.875% | 7/15/19 | 617,233 | 736,810 |
| United States Treasury Inflation Indexed Bonds | 1.375% | 1/15/20 | 757,914 | 888,238 |
| United States Treasury Inflation Indexed Bonds | 0.125% | 4/15/20 | 2,120,880 | 2,227,332 |
| United States Treasury Inflation Indexed Bonds | 1.250% | 7/15/20 | 1,174,715 | 1,373,136 |
| United States Treasury Inflation Indexed Bonds | 1.125% | 1/15/21 | 1,357,484 | 1,578,615 |
| United States Treasury Inflation Indexed Bonds | 0.125% | 4/15/21 | 1,867,856 | 1,934,290 |
| United States Treasury Inflation Indexed Bonds | 0.625% | 7/15/21 | 1,484,643 | 1,656,041 |
| United States Treasury Inflation Indexed Bonds | 0.125% | 1/15/22 | 1,655,371 | 1,795,079 |
| United States Treasury Inflation Indexed Bonds | 0.125% | 4/15/22 | 1,274,686 | 1,282,419 |
| United States Treasury Inflation Indexed Bonds | 0.125% | 7/15/22 | 1,733,995 | 1,853,557 |
| Total U.S. Government and Agency Obligations (Cost $21,846,498) | | 21,801,346 |
| |
| | | | Shares | |
| Temporary Cash Investment (0.1%) | | | | |
| Money Market Fund (0.1%) | | | | |
| 1 Vanguard Market Liquidity Fund (Cost $20,744) | 1.223% | | 207,393 | 20,744 |
| Total Investments (99.9%) (Cost $21,867,242) | | | | 21,822,090 |
12
| |
| Short-Term Inflation-Protected Securities Index Fund | |
| |
| |
| |
| | Amount |
| | ($000) |
| Other Assets and Liabilities (0.1%) | |
| Other Assets | |
| Investment in VGI | 1,367 |
| Receivables for Accrued Income | 28,383 |
| Receivables for Capital Shares Issued | 117,541 |
| Total Other Assets | 147,291 |
| Liabilities | |
| Payables for Investment Securities Purchased | (95,992) |
| Payables for Capital Shares Redeemed | (14,510) |
| Payables to Vanguard | (4,384) |
| Other Liabilities | (5,096) |
| Total Liabilities | (119,982) |
| Net Assets (100%) | 21,849,399 |
| |
| |
| At September 30, 2017, net assets consisted of: | |
| | Amount |
| | ($000) |
| Paid-in Capital | 21,804,613 |
| Undistributed Net Investment Income | 194,124 |
| Accumulated Net Realized Losses | (104,186) |
| Unrealized Appreciation (Depreciation) | (45,152) |
| Net Assets | 21,849,399 |
| |
| Investor Shares—Net Assets | |
| Applicable to 238,404,410 outstanding $.001 par value shares of | |
| beneficial interest (unlimited authorization) | 5,904,271 |
| Net Asset Value Per Share—Investor Shares | $24.77 |
| |
| ETF Shares—Net Assets | |
| Applicable to 78,542,013 outstanding $.001 par value shares of | |
| beneficial interest (unlimited authorization) | 3,880,796 |
| Net Asset Value Per Share—ETF Shares | $49.41 |
| |
| Admiral Shares—Net Assets | |
| Applicable to 204,848,370 outstanding $.001 par value shares of | |
| beneficial interest (unlimited authorization) | 5,078,425 |
| Net Asset Value Per Share—Admiral Shares | $24.79 |
13
| |
| Short-Term Inflation-Protected Securities Index Fund | |
| |
| |
| |
| | Amount |
| | ($000) |
| Institutional Shares—Net Assets | |
| Applicable to 281,627,267 outstanding $.001 par value shares of | |
| beneficial interest (unlimited authorization) | 6,985,907 |
| Net Asset Value Per Share—Institutional Shares | $24.81 |
• See Note A in Notes to Financial Statements.
1 Affiliated money market fund available only to Vanguard funds and certain trusts and accounts managed by Vanguard.
Rate shown is the 7-day yield.
See accompanying Notes, which are an integral part of the Financial Statements.
14
| |
| Short-Term Inflation-Protected Securities Index Fund | |
| |
| |
| Statement of Operations | |
| |
| | Year Ended |
| | September 30, 2017 |
| | ($000) |
| Investment Income | |
| Income | |
| Interest1 | 269,907 |
| Total Income | 269,907 |
| Expenses | |
| The Vanguard Group—Note B | |
| Investment Advisory Services | 633 |
| Management and Administrative—Investor Shares | 6,982 |
| Management and Administrative—ETF Shares | 1,425 |
| Management and Administrative—Admiral Shares | 1,861 |
| Management and Administrative—Institutional Shares | 1,875 |
| Marketing and Distribution—Investor Shares | 847 |
| Marketing and Distribution—ETF Shares | 199 |
| Marketing and Distribution—Admiral Shares | 424 |
| Marketing and Distribution—Institutional Shares | 314 |
| Custodian Fees | 112 |
| Auditing Fees | 68 |
| Shareholders’ Reports and Proxy—Investor Shares | 119 |
| Shareholders’ Reports and Proxy—ETF Shares | 214 |
| Shareholders’ Reports and Proxy—Admiral Shares | 119 |
| Shareholders’ Reports and Proxy—Institutional Shares | 15 |
| Trustees’ Fees and Expenses | 15 |
| Total Expenses | 15,222 |
| Net Investment Income | 254,685 |
| Realized Net Gain (Loss) | |
| Investment Securities Sold1 | (5,193) |
| Futures Contracts | (1,848) |
| Realized Net Gain (Loss) | (7,041) |
| Change in Unrealized Appreciation (Depreciation) of Investment Securities1 | (168,286) |
| Net Increase (Decrease) in Net Assets Resulting from Operations | 79,358 |
1 Interest income, realized net gain (loss), and change in unrealzied appreciation (depreciation) from an affiliated company of the fund were $1,569,000, ($88,000), and $0, respectively.
See accompanying Notes, which are an integral part of the Financial Statements.
15
| | |
| Short-Term Inflation-Protected Securities Index Fund | | |
| |
| |
| Statement of Changes in Net Assets | | |
| |
| | Year Ended September 30, |
| | 2017 | 2016 |
| | ($000) | ($000) |
| Increase (Decrease) in Net Assets | | |
| Operations | | |
| Net Investment Income | 254,685 | 70,180 |
| Realized Net Gain (Loss) | (7,041) | (12,164) |
| Change in Unrealized Appreciation (Depreciation) | (168,286) | 307,524 |
| Net Increase (Decrease) in Net Assets Resulting from Operations | 79,358 | 365,540 |
| Distributions | | |
| Net Investment Income | | |
| Investor Shares | (27,992) | — |
| ETF Shares | (21,465) | — |
| Admiral Shares | (26,937) | — |
| Institutional Shares | (44,908) | — |
| Realized Capital Gain | | |
| Investor Shares | — | — |
| ETF Shares | — | — |
| Admiral Shares | — | — |
| Institutional Shares | — | — |
| Total Distributions | (121,302) | — |
| Capital Share Transactions | | |
| Investor Shares | 826,514 | 443,641 |
| ETF Shares | 1,409,404 | 583,428 |
| Admiral Shares | 1,712,740 | 1,173,766 |
| Institutional Shares | 1,503,409 | 1,539,781 |
| Net Increase (Decrease) from Capital Share Transactions | 5,452,067 | 3,740,616 |
| Total Increase (Decrease) | 5,410,123 | 4,106,156 |
| Net Assets | | |
| Beginning of Period | 16,439,276 | 12,333,120 |
| End of Period1 | 21,849,399 | 16,439,276 |
1 Net Assets—End of Period includes undistributed (overdistributed) net investment income of $194,124,000 and $60,698,000.
See accompanying Notes, which are an integral part of the Financial Statements.
16
| | | | | |
| Short-Term Inflation-Protected Securities Index Fund | | | | |
| |
| |
| Financial Highlights | | | | | |
| |
| |
| Investor Shares | | | | | |
| | | | | | Oct. 16, |
| | | | | | 20121 to |
| | | Year Ended September 30, | |
| For a Share Outstanding | | | | | Sept. 30, |
| Throughout Each Period | 2017 | 2016 | 2015 | 2014 | 2013 |
| Net Asset Value, Beginning of Period | $24.83 | $24.23 | $24.74 | $24.75 | $25.00 |
| Investment Operations | | | | | |
| Net Investment Income | . 312 2 | .0802 | (.131) | .183 | . 015 |
| Net Realized and Unrealized Gain (Loss) | | | | | |
| on Investments | (. 237) | . 520 | (. 206) | (.189) | (. 241) |
| Total from Investment Operations | . 075 | . 600 | (. 337) | (. 006) | (. 226) |
| Distributions | | | | | |
| Dividends from Net Investment Income | (.135) | — | (.173) | (. 004) | (. 024) |
| Distributions from Realized Capital Gains | — | — | — | — | — |
| Total Distributions | (.135) | — | (.173) | (. 004) | (. 024) |
| Net Asset Value, End of Period | $24.77 | $24.83 | $24.23 | $24.74 | $24.75 |
| |
| Total Return3 | 0.31% | 2.48% | -1.36% | -0.02% | -0.91% |
| |
| Ratios/Supplemental Data | | | | | |
| Net Assets, End of Period (Millions) | $5,904 | $5,088 | $4,532 | $4,517 | $3,702 |
| Ratio of Total Expenses to Average Net Assets | 0.15% | 0.16% | 0.17% | 0.20% | 0.20%4 |
| Ratio of Net Investment Income to | | | | | |
| Average Net Assets | 1.26% | 0.42% | (0.53%) | 0.88% | 0.01%4 |
| Portfolio Turnover Rate 5 | 27% | 28% | 26% | 18% | 13% |
1 Inception.
2 Calculated based on average shares outstanding.
3 Total returns do not include transaction or account service fees that may have applied in the periods shown. Fund prospectuses provide information about any applicable transaction and account service fees.
4 Annualized.
5 Excludes the value of portfolio securities received or delivered as a result of in-kind purchases or redemptions of the fund’s capital shares, including ETF Creation Units.
See accompanying Notes, which are an integral part of the Financial Statements.
17
| | | | | |
| Short-Term Inflation-Protected Securities Index Fund | | | | | |
| |
| |
| Financial Highlights | | | | | |
| |
| |
| ETF Shares | | | | | |
| | | | | | Oct. 12, |
| | | | | | 20121 to |
| | | Year Ended September 30, | |
| For a Share Outstanding | | | | | Sept. 30, |
| Throughout Each Period | 2017 | 2016 | 2015 | 2014 | 2013 |
| Net Asset Value, Beginning of Period | $49.59 | $48.36 | $49.38 | $49.36 | $49.83 |
| Investment Operations | | | | | |
| Net Investment Income | . 6712 | .2512 | (. 210) | . 414 | . 065 |
| Net Realized and Unrealized Gain (Loss) | | | | | |
| on Investments | (. 477) | . 979 | (. 415) | (. 371) | (. 483) |
| Total from Investment Operations | .194 | 1.230 | (.625) | .043 | (.418) |
| Distributions | | | | | |
| Dividends from Net Investment Income | (. 374) | — | (. 395) | (. 023) | (. 052) |
| Distributions from Realized Capital Gains | — | — | — | — | — |
| Total Distributions | (. 374) | — | (. 395) | (. 023) | (. 052) |
| Net Asset Value, End of Period | $49.41 | $49.59 | $48.36 | $49.38 | $49.36 |
| |
| Total Return | 0.40% | 2.54% | -1.26% | 0.09% | -0.84% |
| |
| Ratios/Supplemental Data | | | | | |
| Net Assets, End of Period (Millions) | $3,881 | $2,478 | $1,838 | $1,336 | $967 |
| Ratio of Total Expenses to Average Net Assets | 0.06% | 0.07% | 0.08% | 0.10% | 0.10%3 |
| Ratio of Net Investment Income to | | | | | |
| Average Net Assets | 1.35% | 0.51% | (0.44%) | 0.98% | 0.11%3 |
| Portfolio Turnover Rate 4 | 27% | 28% | 26% | 18% | 13% |
1 Inception.
2 Calculated based on average shares outstanding.
3 Annualized.
4 Excludes the value of portfolio securities received or delivered as a result of in-kind purchases or redemptions of the fund’s capital
shares, including ETF Creation Units.
See accompanying Notes, which are an integral part of the Financial Statements.
18
| | | | | |
| Short-Term Inflation-Protected Securities Index Fund | | | | | |
| |
| |
| Financial Highlights | | | | | |
| |
| |
| Admiral Shares | | | | | |
| | | | | | Oct. 16, |
| | | | | | 20121 to |
| | | Year Ended September 30, | |
| For a Share Outstanding | | | | | Sept. 30, |
| Throughout Each Period | 2017 | 2016 | 2015 | 2014 | 2013 |
| Net Asset Value, Beginning of Period | $24.88 | $24.27 | $24.77 | $24.77 | $25.00 |
| Investment Operations | | | | | |
| Net Investment Income | . 338 2 | .1492 | (.105) | . 209 | . 025 |
| Net Realized and Unrealized Gain (Loss) | | | | | |
| on Investments | (. 241) | . 461 | (.197) | (.195) | (. 229) |
| Total from Investment Operations | .097 | .610 | (. 302) | .014 | (. 204) |
| Distributions | | | | | |
| Dividends from Net Investment Income | (.187) | — | (.198) | (. 014) | (. 026) |
| Distributions from Realized Capital Gains | — | — | — | — | — |
| Total Distributions | (.187) | — | (.198) | (. 014) | (. 026) |
| Net Asset Value, End of Period | $24.79 | $24.88 | $24.27 | $24.77 | $24.77 |
| |
| Total Return3 | 0.40% | 2.51% | -1.22% | 0.06% | -0.82% |
| |
| Ratios/Supplemental Data | | | | | |
| Net Assets, End of Period (Millions) | $5,078 | $3,373 | $2,126 | $1,518 | $776 |
| Ratio of Total Expenses to Average Net Assets | 0.06% | 0.07% | 0.08% | 0.10% | 0.10%4 |
| Ratio of Net Investment Income to | | | | | |
| Average Net Assets | 1.35% | 0.51% | (0.44%) | 0.98% | 0.11%4 |
| Portfolio Turnover Rate 5 | 27% | 28% | 26% | 18% | 13% |
1 Inception.
2 Calculated based on average shares outstanding.
3 Total returns do not include transaction or account service fees that may have applied in the periods shown. Fund prospectuses provide
information about any applicable transaction and account service fees.
4 Annualized.
5 Excludes the value of portfolio securities received or delivered as a result of in-kind purchases or redemptions of the fund’s capital
shares, including ETF Creation Units.
See accompanying Notes, which are an integral part of the Financial Statements.
19
| | | | | |
| Short-Term Inflation-Protected Securities Index Fund | | | | |
| |
| |
| Financial Highlights | | | | | |
| |
| |
| Institutional Shares | | | | | |
| | | | | | Oct. 17, |
| | | | | | 20121 to |
| | | Year Ended September 30, | |
| For a Share Outstanding | | | | | Sept. 30, |
| Throughout Each Period | 2017 | 2016 | 2015 | 2014 | 2013 |
| Net Asset Value, Beginning of Period | $24.90 | $24.28 | $24.78 | $24.77 | $24.99 |
| Investment Operations | | | | | |
| Net Investment Income | . 333 2 | .1392 | (. 099) | . 215 | . 026 |
| Net Realized and Unrealized Gain (Loss) | | | | | |
| on Investments | (. 225) | . 481 | (.196) | (.189) | (. 220) |
| Total from Investment Operations | .108 | .620 | (. 295) | .026 | (.194) |
| Distributions | | | | | |
| Dividends from Net Investment Income | (.198) | — | (. 205) | (. 016) | (. 026) |
| Distributions from Realized Capital Gains | — | — | — | — | — |
| Total Distributions | (.198) | — | (. 205) | (. 016) | (. 026) |
| Net Asset Value, End of Period | $24.81 | $24.90 | $24.28 | $24.78 | $24.77 |
| |
| Total Return3 | 0.44% | 2.55% | -1.19% | 0.11% | -0.78% |
| |
| Ratios/Supplemental Data | | | | | |
| Net Assets, End of Period (Millions) | $6,986 | $5,500 | $3,837 | $2,706 | $1,262 |
| Ratio of Total Expenses to Average Net Assets | 0.04% | 0.04% | 0.05% | 0.07% | 0.07%4 |
| Ratio of Net Investment Income to | | | | | |
| Average Net Assets | 1.37% | 0.54% | (0.41%) | 1.01% | 0.14%4 |
| Portfolio Turnover Rate 5 | 27% | 28% | 26% | 18% | 13% |
1 Inception.
2 Calculated based on average shares outstanding.
3 Total returns do not include transaction fees that may have applied in the periods shown. Fund prospectuses provide information about
any applicable transaction fees.
4 Annualized.
5 Excludes the value of portfolio securities received or delivered as a result of in-kind purchases or redemptions of the fund’s capital
shares, including ETF Creation Units.
See accompanying Notes, which are an integral part of the Financial Statements.
20
Short-Term Inflation-Protected Securities Index Fund
Notes to Financial Statements
Vanguard Short-Term Inflation-Protected Securities Index Fund is registered under the Investment Company Act of 1940 as an open-end investment company, or mutual fund. The fund offers four classes of shares: Investor Shares, ETF Shares, Admiral Shares, and Institutional Shares. Investor Shares are available to any investor who meets the fund’s minimum purchase requirements. ETF Shares are listed for trading on Nasdaq; they can be purchased and sold through a broker. Admiral Shares and Institutional Shares are designed for investors who meet certain administrative, service, and account-size criteria.
A. The following significant accounting policies conform to generally accepted accounting principles for U.S. investment companies. The fund consistently follows such policies in preparing its financial statements.
1. Security Valuation: Securities are valued as of the close of trading on the New York Stock Exchange (generally 4 p.m., Eastern time) on the valuation date. Bonds and temporary cash investments are valued using the latest bid prices or using valuations based on a matrix system (which considers such factors as security prices, yields, maturities, and ratings), both as furnished by independent pricing services. Investments in Vanguard Market Liquidity Fund are valued at that fund’s net asset value. Securities for which market quotations are not readily available, or whose values have been affected by events occurring before the fund’s pricing time but after the close of the securities’ primary markets, are valued by methods deemed by the board of trustees to represent fair value.
2. Futures Contracts: The fund uses futures contracts to invest in fixed income asset classes with greater efficiency and lower cost than is possible through direct investment, to add value when these instruments are attractively priced, or to adjust sensitivity to changes in interest rates. The primary risks associated with the use of futures contracts are imperfect correlation between changes in market values of bonds held by the fund and the prices of futures contracts, and the possibility of an illiquid market. Counterparty risk involving futures is mitigated because a regulated clearinghouse is the counterparty instead of the clearing broker. To further mitigate counterparty risk, the fund trades futures contracts on an exchange, monitors the financial strength of its clearing brokers and clearinghouse, and has entered into clearing agreements with its clearing brokers. The clearinghouse imposes initial margin requirements to secure the fund’s performance and requires daily settlement of variation margin representing changes in the market value of each contract.
Futures contracts are valued at their quoted daily settlement prices. The notional amounts of the contracts are not recorded in the Statement of Net Assets. Fluctuations in the value of the contracts are recorded in the Statement of Net Assets as an asset (liability) and in the Statement of Operations as unrealized appreciation (depreciation) until the contracts are closed, when they are recorded as realized futures gains (losses).
During the year ended September 30, 2017, the fund’s average investments in long and short futures contracts each represented 0% of net assets, based on the average of aggregate settlement values at each quarter-end during the period. The fund had no open futures contracts at September 30, 2017.
3. Federal Income Taxes: The fund intends to continue to qualify as a regulated investment company and distribute all of its taxable income. Management has analyzed the fund’s tax positions taken for all open federal income tax years (September 30, 2014–2017), and has concluded that no provision for federal income tax is required in the fund’s financial statements.
21
Short-Term Inflation-Protected Securities Index Fund
4. Distributions: Distributions to shareholders are recorded on the ex-dividend date.
5. Credit Facility: The fund and certain other funds managed by The Vanguard Group (“Vanguard”) participate in a $3.1 billion committed credit facility provided by a syndicate of lenders pursuant to a credit agreement that may be renewed annually; each fund is individually liable for its borrowings, if any, under the credit facility. Borrowings may be utilized for temporary and emergency purposes, and are subject to the fund’s regulatory and contractual borrowing restrictions. The participating funds are charged administrative fees and an annual commitment fee of 0.10% of the undrawn amount of the facility; these fees are allocated to the funds based on a method approved by the fund’s board of trustees and included in Management and Administrative expenses on the fund’s Statement of Operations. Any borrowings under this facility bear interest at a rate based upon the higher of the one-month London Interbank Offered Rate, federal funds effective rate, or overnight bank funding rate plus an agreed-upon spread.
The fund had no borrowings outstanding at September 30, 2017, or at any time during the period then ended.
6. Other: Interest income includes income distributions received from Vanguard Market Liquidity Fund and is accrued daily. Premiums and discounts on debt securities purchased are amortized and accreted, respectively, to interest income over the lives of the respective securities. Inflation adjustments to the face amount of inflation-indexed securities are included in interest income. Security transactions are accounted for on the date securities are bought or sold. Costs used to determine realized gains (losses) on the sale of investment securities are those of the specific securities sold.
Each class of shares has equal rights as to assets and earnings, except that each class separately bears certain class-specific expenses related to maintenance of shareholder accounts (included in Management and Administrative expenses), shareholder reporting, and the proxy. Marketing and distribution expenses are allocated to each class of shares based on a method approved by the board of trustees. Income, other non-class-specific expenses, and gains and losses on investments are allocated to each class of shares based on its relative net assets.
B. In accordance with the terms of a Funds’ Service Agreement (the “FSA”) between Vanguard and the fund, Vanguard furnishes to the fund investment advisory, corporate management, administrative, marketing, and distribution services at Vanguard’s cost of operations (as defined by the FSA). These costs of operations are allocated to the fund based on methods and guidelines approved by the board of trustees. Vanguard does not require reimbursement in the current period for certain costs of operations (such as deferred compensation/benefits and risk/insurance costs); the fund’s liability for these costs of operations is included in Payables to Vanguard on the Statement of Net Assets.
Upon the request of Vanguard, the fund may invest up to 0.40% of its net assets as capital in Vanguard. At September 30, 2017, the fund had contributed to Vanguard capital in the amount of $1,367,000, representing 0.01% of the fund’s net assets and 0.55% of Vanguard’s capitalization. The fund’s trustees and officers are also directors and employees, respectively, of Vanguard.
C. Various inputs may be used to determine the value of the fund’s investments. These inputs are summarized in three broad levels for financial statement purposes. The inputs or methodologies used to value securities are not necessarily an indication of the risk associated with investing in those securities.
22
Short-Term Inflation-Protected Securities Index Fund
Level 1—Quoted prices in active markets for identical securities.
Level 2—Other significant observable inputs (including quoted prices for similar securities, interest
rates, prepayment speeds, credit risk, etc.).
Level 3—Significant unobservable inputs (including the fund’s own assumptions used to determine
the fair value of investments). Any investments valued with significant unobservable inputs are
noted on the Statement of Net Assets.
The following table summarizes the market value of the fund’s investments as of September 30,
2017, based on the inputs used to value them:
| | | |
| | Level 1 | Level 2 | Level 3 |
| Investments | ($000) | ($000) | ($000) |
| U.S. Government and Agency Obligations | — | 21,801,346 | — |
| Temporary Cash Investments | 20,744 | — | — |
| Total | 20,744 | 21,801,346 | — |
D. Distributions are determined on a tax basis and may differ from net investment income and realized capital gains for financial reporting purposes. Differences may be permanent or temporary. Permanent differences are reclassified among capital accounts in the financial statements to reflect their tax character. Temporary differences arise when certain items of income, expense, gain, or loss are recognized in different periods for financial statement and tax purposes. These differences will reverse at some time in the future. Differences in classification may also result from the treatment of short-term gains as ordinary income for tax purposes.
Certain of the fund’s U.S. Treasury inflation-indexed securities experienced deflation and amortization adjustments that reduced interest income and the cost of investments for financial statement purposes by an amount greater than the reduction of taxable income; the additional income reduction will be deferred for tax purposes until it is used to offset future inflation adjustments that increase taxable income. The difference becomes permanent if the securities are sold. During the year ended September 30, 2017, the fund realized gains of $43,000 related to previously tax-deferred deflation adjustments, which have been reclassified from accumulated net realized losses to undistributed net investment income. Deferred inflation and amortization adjustments to securities held at September 30, 2017, totaling $402,000 are reflected as a reduction of the amount of tax-basis unrealized appreciation of investment securities.
During the year ended September 30, 2017, the fund realized $9,202,000 of net capital gains resulting from in-kind redemptions—in which shareholders exchanged fund shares for securities held by the fund rather than for cash. Because such gains are not taxable to the fund, and are not distributed to shareholders, they have been reclassified from accumulated net realized losses to paid-in capital.
For tax purposes, at September 30, 2017, the fund had $198,269,000 of ordinary income available for distribution. The fund had available capital losses totaling $104,154,000 that may be carried forward indefinitely to offset future net capital gains.
23
Short-Term Inflation-Protected Securities Index Fund
At September 30, 2017, the cost of investment securities for tax purposes was $21,867,644,000. Net unrealized depreciation of investment securities for tax purposes was $45,554,000, consisting of unrealized gains of $15,483,000 on securities that had risen in value since their purchase and $61,037,000 in unrealized losses on securities that had fallen in value since their purchase.
E. During the year ended September 30, 2017, the fund purchased $10,213,900,000 of investment securities and sold $5,080,787,000 of investment securities, other than temporary cash investments. Purchases and sales include $1,244,402,000 and $105,731,000, respectively, in connection with in-kind purchases and redemptions of the fund’s capital shares.
| | | | |
| F. Capital share transactions for each class of shares were: | | | |
| | | | Year Ended September 30, |
| | | 2017 | | 2016 |
| | Amount | Shares | Amount | Shares |
| | ($000) | (000) | ($000) | (000) |
| Investor Shares | | | | |
| Issued | 1,069,872 | 43,271 | 873,920 | 35,645 |
| Issued in Lieu of Cash Distributions | 27,936 | 1,136 | — | — |
| Redeemed | (271,294) | (10,974) | (430,279) | (17,713) |
| Net Increase (Decrease)—Investor Shares | 826,514 | 33,433 | 443,641 | 17,932 |
| ETF Shares | | | | |
| Issued | 1,524,321 | 30,900 | 955,615 | 19,579 |
| Issued in Lieu of Cash Distributions | — | — | — | — |
| Redeemed | (114,917) | (2,325) | (372,187) | (7,625) |
| Net Increase (Decrease)—ETF Shares | 1,409,404 | 28,575 | 583,428 | 11,954 |
| Admiral Shares | | | | |
| Issued | 2,400,906 | 97,067 | 1,743,525 | 71,273 |
| Issued in Lieu of Cash Distributions | 25,001 | 1,016 | — | — |
| Redeemed | (713,167) | (28,817) | (569,759) | (23,298) |
| Net Increase (Decrease)—Admiral Shares | 1,712,740 | 69,266 | 1,173,766 | 47,975 |
| Institutional Shares | | | | |
| Issued | 2,636,078 | 106,487 | 2,316,657 | 94,659 |
| Issued in Lieu of Cash Distributions | 44,322 | 1,801 | — | — |
| Redeemed | (1,176,991) | (47,524) | (776,876) | (31,833) |
| Net Increase (Decrease)—Institutional Shares | 1,503,409 | 60,764 | 1,539,781 | 62,826 |
At September 30, 2017, one shareholder was the record or beneficial owner of 38% of the fund’s net assets. If the shareholder were to redeem its investment in the fund, the redemption might result in an increase in the fund’s expense ratio, cause the fund to incur higher transaction costs, or lead to the realization of taxable capital gains.
G. Management has determined that no material events or transactions occurred subsequent to September 30, 2017, that would require recognition or disclosure in these financial statements.
24
Report of Independent Registered
Public Accounting Firm
To the Board of Trustees of Vanguard Malvern Funds and the Shareholders of Vanguard Short-Term
Inflation-Protected Securities Index Fund
In our opinion, the accompanying statement of net assets and the related statements of operations and of changes in net assets and the financial highlights present fairly, in all material respects, the financial position of Vanguard Short-Term Inflation-Protected Securities Index Fund (constituting a separate portfolio of Vanguard Malvern Funds, hereafter referred to as the “Fund”) as of September 30, 2017, the results of its operations for the year then ended, the changes in its net assets for each of the two years in the period then ended and the financial highlights for each of the periods indicated, in conformity with accounting principles generally accepted in the United States of America. These financial statements and financial highlights (hereafter referred to as “financial statements”) are the responsibility of the Fund’s management. Our responsibility is to express an opinion on these financial statements based on our audits. We conducted our audits of these financial statements in accordance with the standards of the Public Company Accounting Oversight Board (United States). Those standards require that we plan and perform the audit to obtain reasonable assurance about whether the financial statements are free of material misstatement. An audit includes examining, on a test basis, evidence supporting the amounts and disclosures in the financial statements, assessing the accounting principles used and significant estimates made by management, and evaluating the overall financial statement presentation. We believe that our audits, which included confirmation of securities as of September 30, 2017 by correspondence with the custodian and brokers and by agreement to the underlying ownership records of the transfer agent, provide a reasonable basis for our opinion.
/s/PricewaterhouseCoopers LLP
Philadelphia, Pennsylvania
November 16, 2017
Special 2017 tax information (unaudited) for Vanguard Short-Term Inflation-Protected Securities Index Fund
This information for the fiscal year ended September 30, 2017, is included pursuant to provisions of the Internal Revenue Code.
For nonresident alien shareholders, 99.5% of income dividends are interest-related dividends.
25
About Your Fund’s Expenses
As a shareholder of the fund, you incur ongoing costs, which include costs for portfolio management, administrative services, and shareholder reports (like this one), among others. Operating expenses, which are deducted from a fund’s gross income, directly reduce the investment return of the fund.
A fund’s expenses are expressed as a percentage of its average net assets. This figure is known as the expense ratio. The following examples are intended to help you understand the ongoing costs (in dollars) of investing in your fund and to compare these costs with those of other mutual funds. The examples are based on an investment of $1,000 made at the beginning of the period shown and held for the entire period.
The accompanying table illustrates your fund’s costs in two ways:
• Based on actual fund return. This section helps you to estimate the actual expenses that you paid over the period. The ”Ending Account Value“ shown is derived from the fund‘s actual return, and the third column shows the dollar amount that would have been paid by an investor who started with $1,000 in the fund. You may use the information here, together with the amount you invested, to estimate the expenses that you paid over the period.
To do so, simply divide your account value by $1,000 (for example, an $8,600 account value divided by $1,000 = 8.6), then multiply the result by the number given for your fund under the heading ”Expenses Paid During Period.“
• Based on hypothetical 5% yearly return. This section is intended to help you compare your fund‘s costs with those of other mutual funds. It assumes that the fund had a yearly return of 5% before expenses, but that the expense ratio is unchanged. In this case—because the return used is not the fund’s actual return—the results do not apply to your investment. The example is useful in making comparisons because the Securities and Exchange Commission requires all mutual funds to calculate expenses based on a 5% return. You can assess your fund’s costs by comparing this hypothetical example with the hypothetical examples that appear in shareholder reports of other funds.
Note that the expenses shown in the table are meant to highlight and help you compare ongoing costs only and do not reflect transaction costs incurred by the fund for buying and selling securities. Further, the expenses do not include any purchase, redemption, or account service fees described in the fund prospectus. If such fees were applied to your account, your costs would be higher. Your fund does not carry a “sales load.”
The calculations assume no shares were bought or sold during the period. Your actual costs may have been higher or lower, depending on the amount of your investment and the timing of any purchases or redemptions.
You can find more information about the fund’s expenses, including annual expense ratios, in the Financial Statements section of this report. For additional information on operating expenses and other shareholder costs, please refer to your fund’s current prospectus.
26
| | | |
| Six Months Ended September 30, 2017 | | | |
| | Beginning | Ending | Expenses |
| Short-Term Inflation-Protected Securities Index | Account Value | Account Value | Paid During |
| Fund | 3/31/2017 | 9/30/2017 | Period |
| Based on Actual Fund Return | | | |
| Investor Shares | $1,000.00 | $999.19 | $0.70 |
| ETF Shares | 1,000.00 | 999.19 | 0.25 |
| Admiral Shares | 1,000.00 | 999.19 | 0.25 |
| Institutional Shares | 1,000.00 | 999.60 | 0.20 |
| Based on Hypothetical 5% Yearly Return | | | |
| Investor Shares | $1,000.00 | $1,024.37 | $0.71 |
| ETF Shares | 1,000.00 | 1,024.82 | 0.25 |
| Admiral Shares | 1,000.00 | 1,024.82 | 0.25 |
| Institutional Shares | 1,000.00 | 1,024.87 | 0.20 |
The calculations are based on expenses incurred in the most recent six-month period. The fund’s annualized six-month expense ratios for that period are 0.14% for Investor Shares, 0.05% for ETF Shares, 0.05% for Admiral Shares, and 0.04% for Institutional Shares. The dollar amounts shown as “Expenses Paid” are equal to the annualized expense ratio multiplied by the average account value over the period, multiplied by the number of days in the most recent six-month period, then divided by the number of days in the most recent 12-month period (183/365).
27
Glossary
30-Day SEC Yield. A fund’s 30-day SEC yield is derived using a formula specified by the U.S. Securities and Exchange Commission. Under the formula, data related to the fund’s security holdings in the previous 30 days are used to calculate the fund’s hypothetical net income for that period, which is then annualized and divided by the fund’s estimated average net assets over the calculation period. For the purposes of this calculation, a security’s income is based on its current market yield to maturity (for bonds), its actual income (for asset-backed securities), or its projected dividend yield (for stocks). Because the SEC yield represents hypothetical annualized income, it will differ—at times significantly—from the fund’s actual experience. As a result, the fund’s income distributions may be higher or lower than implied by the SEC yield.
Average Coupon. The average interest rate paid on the fixed income securities held by a fund. It is expressed as a percentage of face value.
Average Duration. An estimate of how much the value of the fund’s bonds will fluctuate in response to a change in “real” interest rates—meaning rates without inflation expectations built in. Real interest rates are reflected in market yields for inflation-adjusted securities. To see how the fund’s bond values could change, multiply the average duration by the change in real rates. For example, if the average duration were five years, then the value of the fund’s bonds would decline by about 5% if real interest rates rose by 1 percentage point. Conversely, if real rates fell by a percentage point, the value of the bonds would rise about 5%.
Average Effective Maturity. The average length of time until fixed income securities held by a fund reach maturity and are repaid, taking into consideration the possibility that the issuer may call the bond before its maturity date. The figure reflects the proportion of fund assets represented by each security; it also reflects any futures contracts held. In general, the longer the average effective maturity, the more a fund’s share price will fluctuate in response to changes in market interest rates.
Credit Quality. Credit-quality ratings are measured on a scale that generally ranges from AAA (highest) to D (lowest). U.S. Treasury, U.S. Agency, and U.S. Agency mortgage-backed securities appear under “U.S. Government.” Credit-quality ratings are obtained from Barclays and are from Moody’s, Fitch, and S&P. When ratings from all three agencies are used, the median rating is shown. When ratings from two of the agencies are used, the lower rating for each issue is shown. “Not Rated” is used to classify securities for which a rating is not available.
Expense Ratio. A fund’s total annual operating expenses expressed as a percentage of the fund’s average net assets. The expense ratio includes management and administrative expenses, but does not include the transaction costs of buying and selling portfolio securities.
Inception Date. The date on which the assets of a fund (or one of its share classes) are first invested in accordance with the fund’s investment objective. For funds with a subscription period, the inception date is the day after that period ends. Investment performance is measured from the inception date.
Short-Term Reserves. The percentage of a fund invested in highly liquid, short-term securities that can be readily converted to cash.
28
Yield to Maturity. This term generally refers to the rate of return an investor would receive if the fixed income securities held by a fund were held to their maturity dates. For the Short-Term Inflation-Protected Securities Index Fund, the calculation is modified by adding in the inflation adjustment made over the past 12 months. This change results in a figure more directly comparable to the yield-to-maturity figures for other types of bond funds. (An unmodified yield to maturity is used in calculating the fund’s 30-Day SEC Yield.)
29
BLOOMBERG is a trademark and service mark of Bloomberg Finance L.P. BARCLAYS is a trademark and service mark of Barclays Bank Plc, used under license. Bloomberg Finance L.P. and its affiliates, including Bloomberg Index Services Limited (BISL) (collectively, Bloomberg), or Bloomberg’s licensors, own all proprietary rights in the Bloomberg Barclays U.S. Treasury Inflation-Protected Securities (Tips) 0–5 Year Index (Index or Bloomberg Barclays Index).
Neither Barclays Bank Plc, Barclays Capital Inc., or any affiliate (collectively Barclays) or Bloomberg is the issuer or producer of the Short-Term Inflation-Protected Securities Index Fund and neither Bloomberg nor Barclays has any responsibilities, obligations or duties to investors in the Short-Term Inflation-Protected Securities Index Fund. The Index is licensed for use by The Vanguard Group, Inc. (Vanguard) as the sponsor of the Short-Term Inflation-Protected Securities Index Fund. Bloomberg and Barclays’ only relationship with Vanguard in respect of the Index is the licensing of the Index, which is determined, composed and calculated by BISL, or any successor thereto, without regard to the Issuer or the Short-Term Inflation-Protected Securities Index Fund or the owners of the Short-Term Inflation-Protected Securities Index Fund.
Additionally, Vanguard may for itself execute transaction(s) with Barclays in or relating to the Index in connection with the Short-Term Inflation-Protected Securities Index Fund. Investors acquire the Short-Term Inflation-Protected Securities Index Fund from Vanguard and investors neither acquire any interest in the Index nor enter into any relationship of any kind whatsoever with Bloomberg or Barclays upon making an investment in the Short-Term Inflation-Protected Securities Index Fund. The Short-Term Inflation-Protected Securities Index Fund is not sponsored, endorsed, sold or promoted by Bloomberg or Barclays. Neither Bloomberg nor Barclays makes any representation or warranty, express or implied regarding the advisability of investing in the Short-Term Inflation-Protected Securities Index Fund or the advisability of investing in securities generally or the ability of the Index to track corresponding or relative market performance. Neither Bloomberg nor Barclays has passed on the legality or suitability of the Short-Term Inflation-Protected Securities Index Fund with respect to any person or entity. Neither Bloomberg nor Barclays is responsible for and has not participated in the determination of the timing of, prices at, or quantities of the Short-Term Inflation-Protected Securities Index Fund to be issued. Neither Bloomberg nor Barclays has any obligation to take the needs of the Issuer or the owners of the Short-Term Inflation-Protected Securities Index Fund or any other third party into consideration in determining, composing or calculating the Index. Neither Bloomberg nor Barclays has any obligation or liability in connection with administration, marketing or trading of the Short-Term Inflation-Protected Securities Index Fund.
30
The licensing agreement between Bloomberg and Barclays is solely for the benefit of Bloomberg and Barclays and not for the benefit of the owners of the Short-Term Inflation-Protected Securities Index Fund, investors or other third parties. In addition, the licensing agreement between Vanguard and Bloomberg is solely for the benefit of Vanguard and Bloomberg and not for the benefit of the owners of the Short-Term Inflation-Protected Securities Index Fund, investors or other third parties.
NEITHER BLOOMBERG NOR BARCLAYS SHALL HAVE ANY LIABILITY TO THE ISSUER, INVESTORS OR TO OTHER THIRD PARTIES FOR THE QUALITY, ACCURACY AND/OR COMPLETENESS OF THE BLOOMBERG BARCLAYS INDEX OR ANY DATA INCLUDED THEREIN OR FOR INTERRUPTIONS IN THE DELIVERY OF THE BLOOMBERG BARCLAYS INDEX. NEITHER BLOOMBERG NOR BARCLAYS MAKES ANY WARRANTY, EXPRESS OR IMPLIED, AS TO RESULTS TO BE OBTAINED BY THE ISSUER, THE INVESTORS OR ANY OTHER PERSON OR ENTITY FROM THE USE OF THE BLOOMBERG BARCLAYS INDEX OR ANY DATA INCLUDED THEREIN. NEITHER BLOOMBERG NOR BARCLAYS MAKES ANY EXPRESS OR IMPLIED WARRANTIES, AND EACH HEREBY EXPRESSLY DISCLAIMS ALL WARRANTIES OF MERCHANTABILITY OR FITNESS FOR A PARTICULAR PURPOSE OR USE WITH RESPECT TO THE BLOOMBERG BARCLAYS INDEX OR ANY DATA INCLUDED THEREIN. BLOOMBERG RESERVES THE RIGHT TO CHANGE THE METHODS OF CALCULATION OR PUBLICATION, OR
TO CEASE THE CALCULATION OR PUBLICATION OF THE BLOOMBERG BARCLAYS INDEX, AND NEITHER BLOOMBERG NOR BARCLAYS SHALL BE LIABLE FOR ANY MISCALCULATION OF OR ANY INCORRECT, DELAYED OR INTERRUPTED PUBLICATION WITH RESPECT TO ANY OF THE BLOOMBERG BARCLAYS INDEX. NEITHER BLOOMBERG NOR BARCLAYS SHALL BE LIABLE FOR ANY DAMAGES, INCLUDING, WITHOUT LIMITATION, ANY SPECIAL, INDIRECT
OR CONSEQUENTIAL DAMAGES, OR ANY LOST PROFITS AND EVEN IF ADVISED OF THE POSSIBLITY OF SUCH, RESULTING FROM THE USE OF THE BLOOMBERG BARCLAYS INDEX OR ANY DATA INCLUDED THEREIN OR WITH RESPECT TO THE SHORT-TERM INFLATION-PROTECTED SECURITIES INDEX FUND.
None of the information supplied by Bloomberg or Barclays and used in this publication may be reproduced in any manner without the prior written permission of both Bloomberg and Barclays Capital, the investment banking division of Barclays Bank Plc. Barclays Bank Plc is registered in England No. 1026167. Registered office 1 Churchill Place London E14 5HP.
© 2017 Bloomberg. Used with Permission.
Source: Bloomberg Index Services Limited. Copyright 2017, Bloomberg. All rights reserved.
31
This page intentionally left blank.
This page intentionally left blank.
This page intentionally left blank.
The People Who Govern Your Fund
The trustees of your mutual fund are there to see that the fund is operated and managed in your best interests since, as a shareholder, you are a part owner of the fund. Your fund’s trustees also serve on the board of directors of The Vanguard Group, Inc., which is owned by the Vanguard funds and provides services to them on an at-cost basis.
A majority of Vanguard’s board members are independent, meaning that they have no affiliation with Vanguard or the funds they oversee, apart from the sizable personal investments they have made as private individuals. The independent board members have distinguished backgrounds in business, academia, and public service. Each of the trustees and executive officers oversees 198 Vanguard funds.
Information for each trustee and executive officer of the fund appears below. The mailing address of the trustees and officers is P.O. Box 876, Valley Forge, PA 19482. More information about the trustees is in the Statement of Additional Information, which can be obtained, without charge, by contacting Vanguard at 800-662-7447, or online at vanguard.com.
Interested Trustee1
F. William McNabb III
Born 1957. Trustee Since July 2009. Chairman of the Board. Principal Occupation(s) During the Past Five Years and Other Experience: Chairman of the Board of The Vanguard Group, Inc., and of each of the investment companies served by The Vanguard Group, since January 2010; Chief Executive Officer and Director of The Vanguard Group and President and Chief Executive Officer of each of the investment companies served by The Vanguard Group, since 2008; Director of Vanguard Marketing Corporation; President of The Vanguard Group (2008–2017); Managing Director of The Vanguard Group (1995–2008).
Independent Trustees
Emerson U. Fullwood
Born 1948. Trustee Since January 2008. Principal Occupation(s) During the Past Five Years and Other Experience: Executive Chief Staff and Marketing Officer for North America and Corporate Vice President (retired 2008) of Xerox Corporation (document management products and services);
Executive in Residence and 2009–2010 Distinguished Minett Professor at the Rochester Institute of Technology; Lead Director of SPX FLOW, Inc. (multi-industry manufacturing); Director of the United Way of Rochester, the University of Rochester Medical Center, Monroe Community College Foundation, North Carolina A&T University, and Roberts Wesleyan College; Trustee of the University of Rochester.
Rajiv L. Gupta
Born 1945. Trustee Since December 2001.2 Principal Occupation(s) During the Past Five Years and Other Experience: Chairman and Chief Executive Officer (retired 2009) and President (2006–2008) of Rohm and Haas Co. (chemicals); Director of Arconic Inc. (diversified manufacturer), HP Inc. (printer and personal computer manufacturing), and Delphi Automotive plc (automotive components); Senior Advisor at New Mountain Capital.
Amy Gutmann
Born 1949. Trustee Since June 2006. Principal Occupation(s) During the Past Five Years and Other Experience: President of the University of Pennsylvania; Christopher H. Browne
1 Mr. McNabb is considered an “interested person,” as defined in the Investment Company Act of 1940, because he is an officer of the Vanguard funds.
2 December 2002 for Vanguard Equity Income Fund, the Vanguard Municipal Bond Funds, and the Vanguard State Tax-Exempt Funds.
Distinguished Professor of Political Science, School of Arts and Sciences, and Professor of Communication, Annenberg School for Communication, with secondary faculty appointments in the Department of Philosophy, School of Arts and Sciences, and at the Graduate School of Education, University of Pennsylvania; Trustee of the National Constitution Center.
JoAnn Heffernan Heisen
Born 1950. Trustee Since July 1998. Principal Occupation(s) During the Past Five Years and Other Experience: Corporate Vice President and Member of the Executive Committee (1997–2008), Chief Global Diversity Officer (retired 2008), Vice President and Chief Information Officer (1997–2006), Controller (1995–1997), Treasurer (1991–1995), and Assistant Treasurer (1989–1991) of Johnson & Johnson (pharmaceuticals/medical devices/ consumer products); Director of Skytop Lodge Corporation (hotels) and the Robert Wood Johnson Foundation; Member of the Advisory Board of the Institute for Women’s Leadership at Rutgers University.
F. Joseph Loughrey
Born 1949. Trustee Since October 2009. Principal Occupation(s) During the Past Five Years and Other Experience: President and Chief Operating Officer (retired 2009) of Cummins Inc. (industrial machinery); Chairman of the Board of Hillenbrand, Inc. (specialized consumer services), Oxfam America, and the Lumina Foundation for Education; Director of the V Foundation for Cancer Research; Member of the Advisory Council for the College of Arts and Letters and Chair of the Advisory Board to the Kellogg Institute for International Studies, both at the University of Notre Dame.
Mark Loughridge
Born 1953. Trustee Since March 2012. Principal Occupation(s) During the Past Five Years and Other Experience: Senior Vice President and Chief Financial Officer (retired 2013) at IBM (information technology services); Fiduciary Member of IBM’s Retirement Plan Committee (2004–2013); Member of the Council on Chicago Booth.
Scott C. Malpass
Born 1962. Trustee Since March 2012. Principal Occupation(s) During the Past Five Years and Other Experience: Chief Investment Officer and Vice President at the University of Notre Dame; Assistant Professor of Finance at the Mendoza College of Business at Notre Dame; Member of the Notre Dame 403(b) Investment Committee, the Board of Advisors for Spruceview Capital Partners, the Board of Catholic Investment Services, Inc. (investment advisor), and the Board of Superintendence of the Institute for the Works of Religion; Chairman of the Board of TIFF Advisory Services, Inc. (investment advisor).
André F. Perold
Born 1952. Trustee Since December 2004. Principal Occupation(s) During the Past Five Years and Other Experience: George Gund Professor of Finance and Banking, Emeritus at the Harvard Business School (retired 2011); Chief Investment Officer and Co-Managing Partner of HighVista Strategies LLC (private investment firm); Overseer of the Museum of Fine Arts Boston.
Peter F. Volanakis
Born 1955. Trustee Since July 2009. Principal Occupation(s) During the Past Five Years and Other Experience: President and Chief Operating Officer (retired 2010) of Corning Incorporated (communications equipment); Chairman of the Board of Trustees of Colby-Sawyer College; Member of the Board of Hypertherm, Inc. (industrial cutting systems, software, and consumables).
Executive Officers
Glenn Booraem
Born 1967. Investment Stewardship Officer Since February 2017. Principal Occupation(s) During the Past Five Years and Other Experience: Principal of The Vanguard Group, Inc.; Treasurer (2015–2017), Controller (2010–2015), and Assistant Controller (2001–2010) of each of the investment companies served by The Vanguard Group.
Thomas J. Higgins
Born 1957. Chief Financial Officer Since September 2008. Principal Occupation(s) During the Past Five Years and Other Experience: Principal of The Vanguard Group, Inc.; Chief Financial Officer of each of the investment companies served by The Vanguard Group; Treasurer of each of the investment companies served by The Vanguard Group (1998–2008).
Peter Mahoney
Born 1974. Controller Since May 2015. Principal Occupation(s) During the Past Five Years and Other Experience: Principal of The Vanguard Group, Inc.; Controller of each of the investment companies served by The Vanguard Group; Head of International Fund Services at The Vanguard Group (2008–2014).
Anne E. Robinson
Born 1970. Secretary Since September 2016. Principal Occupation(s) During the Past Five Years and Other Experience: Managing Director of The Vanguard Group, Inc.; General Counsel of The Vanguard Group; Secretary of The Vanguard Group and of each of the investment companies served by The Vanguard Group; Director and Senior Vice President of Vanguard Marketing Corporation; Managing Director and General Counsel of Global Cards and Consumer Services at Citigroup (2014–2016); Counsel at American Express (2003–2014).
Michael Rollings
Born 1963. Treasurer Since February 2017. Principal Occupation(s) During the Past Five Years and Other Experience: Managing Director of The Vanguard Group, Inc.; Treasurer of each of the investment companies served by The Vanguard Group; Director of Vanguard Marketing Corporation; Executive Vice President and Chief Financial Officer of MassMutual Financial Group (2006–2016).
| |
| Vanguard Senior Management Team |
| |
| Mortimer J. Buckley | Chris D. McIsaac |
| Gregory Davis | James M. Norris |
| John James | Thomas M. Rampulla |
| Martha G. King | Karin A. Risi |
| John T. Marcante | |
Chairman Emeritus and Senior Advisor
John J. Brennan
Chairman, 1996–2009
Chief Executive Officer and President, 1996–2008
Founder
John C. Bogle
Chairman and Chief Executive Officer, 1974–1996
|  |
| P.O. Box 2600 |
| Valley Forge, PA 19482-2600 |
| | |
| | |
| | |
| Connect with Vanguard® > vanguard.com | |
| | |
| | |
| | |
| Fund Information > 800-662-7447 | |
| Direct Investor Account Services > 800-662-2739 | |
| Institutional Investor Services > 800-523-1036 | |
| Text Telephone for People | |
| Who Are Deaf or Hard of Hearing> 800-749-7273 | |
| | |
| This material may be used in conjunction | |
| with the offering of shares of any Vanguard | |
| fund only if preceded or accompanied by | |
| the fund’s current prospectus. | |
| | |
| All comparative mutual fund data are from Lipper, a | |
| Thomson Reuters Company, or Morningstar, Inc., unless | |
| otherwise noted. | |
| | |
| You can obtain a free copy of Vanguard’s proxy voting | |
| guidelines by visiting vanguard.com/proxyreporting or by | |
| calling Vanguard at 800-662-2739. The guidelines are | |
| also available from the SEC’s website, sec.gov. In | |
| addition, you may obtain a free report on how your fund | |
| voted the proxies for securities it owned during the 12 | |
| months ended June 30. To get the report, visit either | |
| vanguard.com/proxyreporting or sec.gov. | |
| | |
| You can review and copy information about your fund at | |
| the SEC’s Public Reference Room in Washington, D.C. To | |
| find out more about this public service, call the SEC at | |
| 202-551-8090. Information about your fund is also | |
| available on the SEC’s website, and you can receive | |
| copies of this information, for a fee, by sending a | |
| request in either of two ways: via email addressed to | |
| publicinfo@sec.gov or via regular mail addressed to the | |
| Public Reference Section, Securities and Exchange | |
| Commission, Washington, DC 20549-1520. | |
| © 2017 The Vanguard Group, Inc. |
| All rights reserved. |
| Vanguard Marketing Corporation, Distributor. |
| | Q19670 112017 |
| |

Annual Report | September 30, 2017
Vanguard Core Bond Fund
Vanguard’s Principles for Investing Success
We want to give you the best chance of investment success. These principles, grounded in Vanguard’s research and experience, can put you on the right path.
Goals. Create clear, appropriate investment goals.
Balance. Develop a suitable asset allocation using broadly diversified funds. Cost. Minimize cost.
Discipline. Maintain perspective and long-term discipline.
A single theme unites these principles: Focus on the things you can control.
We believe there is no wiser course for any investor.
| |
| Contents | |
| Your Fund’s Performance at a Glance. | 1 |
| Chairman’s Perspective. | 2 |
| Advisor’s Report. | 6 |
| Fund Profile. | 9 |
| Performance Summary. | 10 |
| Financial Statements. | 12 |
| About Your Fund’s Expenses. | 57 |
| Glossary. | 59 |
Please note: The opinions expressed in this report are just that—informed opinions. They should not be considered promises or advice. Also, please keep in mind that the information and opinions cover the period through the date on the front of this report. Of course, the risks of investing in your fund are spelled out in the prospectus.
See the Glossary for definitions of investment terms used in this report.
About the cover: Nautical images have been part of Vanguard’s rich heritage since its start in 1975. For an incoming ship, a lighthouse offers a beacon and safe path to shore. You can similarly depend on Vanguard to put you first––and light the way––as you strive to meet your financial goals. Our client focus and low costs, stemming from our unique ownership structure, assure that your interests are paramount.
Your Fund’s Performance at a Glance
• For the 12 months ended September 30, 2017, Vanguard Core Bond Fund returned 0.03% for Investor Shares and 0.10% for Admiral Shares. Those performances were in line with the 0.06% return of the benchmark (Bloomberg Barclays U.S. Aggregate Float Adjusted Index) but trailed the 0.44% average return for peer funds.
• The fund’s tilt toward BBB-rated bonds was positive. Overweighted allocations to U.S. financial institutions and select property and casualty bonds worked particularly well, as did an underweighting of European financials.
• In anticipation of higher inflation, the fund slightly increased its exposure to Treasury
Inflation-Protected Securities at the beginning of the period. However, as the fiscal year
closed, it trimmed those holdings as valuations rebounded and approached their target.
• The fund was also underweighted in industrials and made tactical trades in energy
as volatility in that sector generated buying opportunities. These moves resulted in
small gains.
| | | | |
| Total Returns: Fiscal Year Ended September 30, 2017 | | | |
| | 30-Day SEC | Income | Capital | Total |
| | Yield | Returns | Returns | Returns |
| Vanguard Core Bond Fund | | | | |
| Investor Shares | 2.18% | 1.96% | -1.93% | 0.03% |
| Admiral™ Shares | 2.28 | 2.07 | -1.97 | 0.10 |
| Bloomberg Barclays U.S. Aggregate Float Adjusted | | | | |
| Index | | | | 0.06 |
| Core Bond Funds Average | | | | 0.44 |
Core Bond Funds Average: Derived from data provided by Lipper, a Thomson Reuters Company.
Admiral Shares carry lower expenses and are available to investors who meet certain account-balance requirements.
| | | |
| Expense Ratios | | | |
| Your Fund Compared With Its Peer Group | | | |
| | Investor | Admiral | Peer Group |
| | Shares | Shares | Average |
| Core Bond Fund | 0.25% | 0.15% | 0.78% |
The fund expense ratios shown are from the prospectus dated January 26, 2017, and represent estimated costs for the current fiscal year. For the fiscal year ended September 30, 2017, the fund’s expense ratios were 0.25% for Investor Shares and 0.15% for Admiral Shares. The peer-group expense ratio is derived from data provided by Lipper, a Thomson Reuters Company, and captures information through year-end 2016.
Peer group: Core Bond Funds.
1
Chairman’s Perspective

Bill McNabb
Chairman and Chief Executive Officer
Dear Shareholder,
Our investors depend on Vanguard to be a responsible steward of their assets. This includes our obvious responsibilities—managing the funds, offering investment perspectives and advice, and assisting with questions and transactions.
But because a long-term perspective informs every aspect of our investment approach, we also work on your behalf in less obvious ways, such as by advocating for responsible governance among the companies in which Vanguard funds invest. Vanguard’s index funds are essentially permanent owners of thousands of publicly traded companies, and we have a special obligation to be engaged stewards actively focused on the long term.
Simply put, we believe that well-governed companies are more likely to perform well over the long run.
Although Vanguard has always been an advocate for strong corporate governance, we have expanded our efforts recently as our investor base continues to grow. Our Investment Stewardship team has doubled in size since 2015, and we continue to add analysts, researchers, and operations team members. The team guides our engagement activities and our funds’ proxy voting by analyzing corporate governance practices in companies around the world.
2
Our four Investment Stewardship pillars
As we evaluate company responsiveness to governance matters, including environmental and social concerns, we focus on four key areas—what we call our Investment Stewardship pillars:
• The board: A high-functioning, well-composed, independent, diverse, and experienced board with effective ongoing evaluation practices.
• Governance structures: Provisions
and structures that empower shareholders
and protect their rights.
• Appropriate compensation: Pay that incentivizes relative outperformance over the long term.
• Risk oversight: Effective, integrated, and ongoing oversight of relevant industry-and company-specific risks.
Guided by these pillars, our Investment Stewardship team conducted more than 950 engagements, or discussions, with company directors and leaders worldwide during the 12 months ended June 30, 2017.
| | | |
| Market Barometer | | | |
| | | Average Annual Total Returns |
| | Periods Ended September 30, 2017 |
| | One Year | Three Years | Five Years |
| Stocks | | | |
| Russell 1000 Index (Large-caps) | 18.54% | 10.63% | 14.27% |
| Russell 2000 Index (Small-caps) | 20.74 | 12.18 | 13.79 |
| Russell 3000 Index (Broad U.S. market) | 18.71 | 10.74 | 14.23 |
| FTSE All-World ex US Index (International) | 19.49 | 5.11 | 7.35 |
| |
| Bonds | | | |
| Bloomberg Barclays U.S. Aggregate Bond Index | | | |
| (Broad taxable market) | 0.07% | 2.71% | 2.06% |
| Bloomberg Barclays Municipal Bond Index | | | |
| (Broad tax-exempt market) | 0.87 | 3.19 | 3.01 |
| Citigroup Three-Month U.S. Treasury Bill Index | 0.64 | 0.28 | 0.18 |
| |
| CPI | | | |
| Consumer Price Index | 2.23% | 1.22% | 1.30% |
3
We also cast more than 171,000 votes on behalf of Vanguard funds at more than 18,000 shareholder meetings.
Gender diversity on boards and climate risk
As we engage with companies, we are devoting increased attention to two specific topics. The first is gender diversity on boards. It’s no secret that the right combination of talent, skills, and experience leads to better results, so we pay close attention to how company boards are structured and managed, and how they evolve.
In recent years, a growing body of research has demonstrated that greater diversity on boards can lead to improved governance and company performance. We are advocating for boards to incorporate diverse perspectives and experience into their strategic planning and decision-making. One example of our commitment to more diverse boards is our participation in the 30% Club, a global coalition working to increase the representation of women in boardrooms and leadership roles.
The second issue is climate risk. We will continue to engage with companies to understand their responses to this risk. Regardless of one’s perspective on the issue, the potential is real for changing regulations, demographics, and consumption behavior to affect business results for companies in many sectors.
We want to ensure that such business and regulatory risks are sufficiently disclosed so investors can value companies appropriately. In the past year, we have voted for shareholder proposals at several energy companies that called for management to improve its climate risk assessment and planning, and we will consider supporting similar proposals if we believe they are beneficial to long-term shareholder value. When a proposal from a shareholder presents a strong case for change, we’re more than willing to fully consider it. And even if the case falls short, these proposals often catalyze a discussion that generates meaningful change over time.
In addition to considering activists’ proposals, we consult research providers and our own network of experts. When we detect material risks to a company’s long-term value (such as bad leadership, poor disclosure, misaligned compensation structures, or threats to shareholder rights), we act with our voice and our vote.
Our stewardship reflects our mission
But we don’t act as independent agents with our own agenda. Every time we speak with a company chairman, CEO, or director, we’re acutely aware of the role we play in representing the economic interests of more than 20 million Vanguard investors. So you can expect us to speak out when we detect threats to the economic interests of our shareholders.
4
We take positions on these matters not because they are inherently good or noble but because they are tied to the long-term economic value of your funds’ investments.
You trust us to represent your interests across the globe. You can be confident we act on that responsibility with the seriousness and dedication it deserves.
To learn more about our Investment Stewardship program, including how our funds have voted, visit https://about. vanguard.com/investment-stewardship/.
As always, thank you for investing with Vanguard.

F. William McNabb III
Chairman and Chief Executive Officer
October 13, 2017
5
Advisor’s Report
For the 12 months ended September 30, 2017, Vanguard Core Bond Fund returned 0.03% for Investor Shares and 0.10% for Admiral Shares. Those performances were in line with the 0.06% return of the benchmark (Bloomberg Barclays U.S. Aggregate Float Adjusted Index) but trailed the 0.44% average return for peer funds.
Investment environment
The period began on an unexpected note, with investors cheering stronger-than-expected third-quarter 2016 economic growth that stood in contrast to disappointing results from earlier in the year. The exuberance gained steam in the wake of U.S. elections in anticipation of the new administration’s policy initiatives focused on tax reform, infrastructure spending, and greater deregulation. This fueled a move toward riskier assets, propelling many bellwether stock indexes to record highs in early 2017.
The Federal Reserve also acknowledged the economy’s strength. In December, as inflation inched closer to the 2% target level, the Fed raised the funds rate by a quarter percentage point—only the second increase in a decade. Optimism waned a bit in early 2017 as policy initiatives remained unrealized. But consumers continued to open their wallets and unemployment dropped.
Those developments most likely played a large part in the Fed’s decision to again raise rates in March and June, pushing its target range up to 1%–1.25%. Along with
the establishment of a framework for trimming its $4.5 trillion balance sheet, those moves took the Fed closer to normalizing monetary policy after its emergency intervention in the wake of the Great Recession.
Despite those positive developments, disappointing inflation measures confounded some market outlooks. Annualized core inflation softened a little during the spring. In response, the Fed scaled back its 2017 forecast but still expected inflation to move closer to its 2% target over the medium term. Further tightening in the labor market should help, although wage gains have been small.
Abroad, many countries posted decent growth, but major central banks such as the Bank of Japan, the Bank of England, and the European Central Bank remained in accommodative policy mode as they struggled to balance growth and inflation concerns. Even with a weaker U.S. dollar, comparatively low yields in many developed markets kept U.S. bonds attractive to international investors.
The period concluded on an uncertain note, as investor optimism waned but the economy was stable. Complicating things was an escalated discussion of a possible U.S. government shutdown over the debt ceiling. Because the Fed’s rate moves were telegraphed in advance, the market responded with a measured increase in short-term rates. But the unexpected debt ceiling debate led to a sell-off in short-term
6
bonds, which caused their yields to spike at the end of the fund’s fiscal year. As the period closed, legislative action on this front was pushed off till later in the year.
The 2-year yield jumped 72 basis points to 1.29%. On the longer end of the curve, the yield on the 10-year Treasury note increased 74 basis points to 2.33%, and the 30-year yield rose 54 basis points to 2.86%.
Management of the fund
Entering the period, we believed consumer prices would rise at a faster rate than the market expected and we increased the fund’s exposure to Treasury Inflation-Protected Securities (TIPS). These securities, which are not part of the benchmark index, are designed to appreciate in value as inflation rises. Factors that supported our inflation outlook included a tightening labor market causing an uptick in wages, an increase in the price of oil and other commodities, and the prospect of fiscal stimulus.
That position worked in the fund’s favor until spring, when unexpectedly weak inflation caused TIPS to give back some of their gains. Recent readings were more in line with our expectations as the period closed, providing an upward lift in TIPs and allowing us to trim positions as we became more neutral on valuations in the short term.
The spreads in yields between corporate bonds and Treasuries continued to narrow, providing a favorable environment for
generating excess yield without greater risk. Our tilt toward BBB-rated bonds, which are still considered investment-grade, was positive. In particular, overweighted allocations to U.S. financial institutions and select property and casualty bonds worked well, as did an underweighting of European financials. Our competitors were more aggressive with this trade, which explains some of our relative underperformance.
We were also underweighted in industrials, and we made tactical trades in energy as volatility in that sector allowed us to be opportunistic. These moves provided small gains.
Our asset-backed securities positions posted decent results. Mortgage-backed securities (MBS) contributed, as did bonds focused on automobile dealer financing.
Outlook
Absent any external shocks, the U.S. economy is set to continue on its trajectory of modest but steady growth, with real GDP expanding by about 2% for 2017. The pace could pick up a little next year depending on the timing and size of any fiscal stimulus the government may enact.
We agree with the Fed’s assessment that the recent disinflation is transitory and that consumer prices will gradually rise through 2019. The Fed is likely to remain patient and cautious, however, in carrying out monetary tightening. Some officials have indicated they would favor waiting for inflation to reach or modestly exceed 2%
7
for some time before moving to raise rates more quickly. That could mean we won’t see another rate hike until the second half of 2018, especially if the Fed begins reducing its balance sheet later this year.
We continue to monitor developments concerning the debt ceiling debate and fiscal stimulus. In particular, we will watch how the Fed tapers its balance sheet, including its MBS holdings, which have benefited from stability in interest rates.
Portfolio Managers:
Brian W. Quigley
Gemma Wright-Casparius, Principal
Gregory S. Nassour, CFA, Principal
Vanguard Fixed Income Group
October 19, 2017
8
Core Bond Fund
Fund Profile
As of September 30, 2017
| | |
| Share-Class Characteristics | | |
| | Investor | Admiral |
| | Shares | Shares |
| Ticker Symbol | VCORX | VCOBX |
| Expense Ratio1 | 0.25% | 0.15% |
| 30-Day SEC Yield | 2.18% | 2.28% |
| | |
| Financial Attributes | | |
| |
| | | Bloomberg |
| | | Barclays U.S. |
| | | Aggregate |
| | | Float Adjusted |
| | Fund | Index |
| |
| Number of Bonds | 885 | 9,460 |
| |
| Yield to Maturity | | |
| (before expenses) | 2.7% | 2.5% |
| |
| Average Coupon | 2.7% | 3.0% |
| |
| Average Duration | 6.1 years | 6.1 years |
| |
| Average Effective | | |
| Maturity | 7.1 years | 8.3 years |
| |
| Short-Term | | |
| Reserves | 5.3% | — |
| |
| Sector Diversification (% of portfolio) | |
| Asset-Backed | 3.7% |
| Commercial Mortgage-Backed | 3.7 |
| Finance | 11.7 |
| Foreign | 3.5 |
| Government Mortgage-Backed | 22.7 |
| Industrial | 13.7 |
| Treasury/Agency | 38.7 |
| Utilities | 2.2 |
| Other | 0.1 |
The agency and mortgage-backed securities sectors may include
issues from government-sponsored enterprises; such issues are
generally not backed by the full faith and credit of the U.S.
government.
| |
| Distribution by Effective Maturity | |
| (% of portfolio) | |
| Under 1 Year | 2.5% |
| 1 - 3 Years | 22.9 |
| 3 - 5 Years | 19.9 |
| 5 - 7 Years | 20.1 |
| 7 - 10 Years | 23.2 |
| 10 - 20 Years | 3.9 |
| 20 - 30 Years | 7.3 |
| Over 30 Years | 0.2 |
| |
| Distribution by Credit Quality (% of portfolio) |
| U.S. Government | 55.8% |
| Aaa | 5.7 |
| Aa | 3.1 |
| A | 10.2 |
| Baa | 18.4 |
| Ba | 0.8 |
| B | 0.1 |
| Not Rated | 5.9 |
Credit-quality ratings are obtained from Moody's and S&P, and the higher rating for each issue is shown. "Not Rated" is used to classify securities for which a rating is not available. Not rated securities include a fund's investment in Vanguard Market Liquidity Fund or Vanguard Municipal Cash Management Fund, each of which invests in high-quality money market instruments and may serve as a cash management vehicle for the Vanguard funds, trusts, and accounts. For more information about these ratings, see the Glossary entry for Credit Quality.
Investment Focus

1 The expense ratios shown are from the prospectus dated January 26, 2017, and represent estimated costs for the current fiscal year. For the fiscal year ended September 30, 2017, the expense ratios were 0.25% for Investor Shares and 0.15% for Admiral Shares.
9
Core Bond Fund
Performance Summary
All of the returns in this report represent past performance, which is not a guarantee of future results that may be achieved by the fund. (Current performance may be lower or higher than the performance data cited. For performance data current to the most recent month-end, visit our website at vanguard.com/performance.) Note, too, that both investment returns and principal value can fluctuate widely, so an investor’s shares, when sold, could be worth more or less than their original cost. The returns shown do not reflect taxes that a shareholder would pay on fund distributions or on the sale of fund shares.
Cumulative Performance: March 28, 2016, Through September 30, 2017
Initial Investment of $10,000
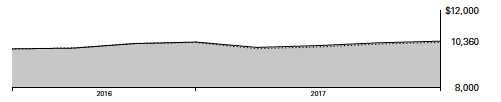
| | | | |
| | | Average Annual Total Returns | |
| | | Periods Ended September 30, 2017 | |
| | | | Since | Final Value |
| | | One | Inception | of a $10,000 |
| | | Year | (3/28/2016) | Investment |
| | Core Bond Fund Investor Shares | 0.03% | 2.38% | $10,360 |
| | Bloomberg Barclays U.S. | | | |
| • • • • • • • • | | | | |
| |
| | Aggregate Float Adjusted Index | 0.06 | 2.22 | 10,336 |
| | Core Bond Funds Average | 0.44 | 2.63 | 10,400 |
Core Bond Funds Average: Derived from data provided by Lipper, a Thomson Reuters Company.
"Since Inception" performance is calculated from the Investor Shares’ inception date for both the fund and its comparative standards.
| | | |
| | | Since | Final Value |
| | One | Inception | of a $50,000 |
| | Year | (3/28/2016) | Investment |
| |
| Core Bond Fund Admiral Shares | 0.10% | 2.49% | $51,890 |
| Bloomberg Barclays U.S. Aggregate Float | | | |
| Adjusted Index | 0.06 | 2.22 | 51,682 |
"Since Inception" performance is calculated from the Admiral Shares’ inception date for both the fund and its comparative standards.
See Financial Highlights for dividend and capital gains information.
10
Core Bond Fund
| | | | |
| Fiscal-Year Total Returns (%): March 28, 2016, Through September 30, 2017 | |
| |
| | | | | Bloomberg |
| | | | | Barclays U.S. |
| | | | | Aggregate |
| | | | | Float Adjusted |
| | | | Investor Shares | Index |
| Fiscal Year | Income Returns | Capital Returns | Total Returns | Total Returns |
| 2016 | 0.97% | 2.60% | 3.57% | 3.31% |
| 2017 | 1.96 | -1.93 | 0.03 | 0.06 |
11
Core Bond Fund
Financial Statements
Statement of Net Assets
As of September 30, 2017
The fund reports a complete list of its holdings in regulatory filings four times in each fiscal year, at the quarter-ends. For the second and fourth fiscal quarters, the lists appear in the fund’s semiannual and annual reports to shareholders. For the first and third fiscal quarters, the fund files the lists with the Securities and Exchange Commission on Form N-Q. Shareholders can look up the fund’s Forms N-Q on the SEC’s website at sec.gov. Forms N-Q may also be reviewed and copied at the SEC’s Public Reference Room (see the back cover of this report for further information).
| | | | |
| | | | Face | Market |
| | | Maturity | Amount | Value • |
| | Coupon | Date | ($000) | ($000) |
| U. S. Government and Agency Obligations (61.1%) | | | |
| U. S. Government Securities (30.1%) | | | | |
| United States Treasury Inflation Indexed Bonds | 0.125% | 4/15/18 | 9,120 | 9,661 |
| United States Treasury Inflation Indexed Bonds | 0.375% | 1/15/27 | 9,796 | 9,800 |
| United States Treasury Inflation Indexed Bonds | 1.000% | 2/15/46 | 460 | 481 |
| United States Treasury Inflation Indexed Bonds | 0.875% | 2/15/47 | 800 | 798 |
| United States Treasury Note/Bond | 0.875% | 5/31/18 | 50 | 50 |
| United States Treasury Note/Bond | 2.250% | 7/31/18 | 44 | 44 |
| United States Treasury Note/Bond | 1.375% | 9/30/18 | 33,000 | 33,000 |
| United States Treasury Note/Bond | 1.000% | 11/30/18 | 3,800 | 3,783 |
| United States Treasury Note/Bond | 1.125% | 2/28/19 | 3,800 | 3,785 |
| United States Treasury Note/Bond | 1.500% | 2/28/19 | 1,200 | 1,201 |
| United States Treasury Note/Bond | 1.250% | 3/31/19 | 11,100 | 11,071 |
| United States Treasury Note/Bond | 1.625% | 3/31/19 | 1,700 | 1,705 |
| United States Treasury Note/Bond | 0.875% | 4/15/19 | 150 | 149 |
| United States Treasury Note/Bond | 1.250% | 4/30/19 | 600 | 598 |
| United States Treasury Note/Bond | 1.625% | 6/30/19 | 2,250 | 2,256 |
| United States Treasury Note/Bond | 1.000% | 10/15/19 | 5,000 | 4,950 |
| United States Treasury Note/Bond | 1.000% | 11/30/19 | 1,700 | 1,682 |
| United States Treasury Note/Bond | 1.500% | 11/30/19 | 2,500 | 2,499 |
| United States Treasury Note/Bond | 1.375% | 12/15/19 | 600 | 598 |
| United States Treasury Note/Bond | 1.375% | 1/15/20 | 2,500 | 2,491 |
| United States Treasury Note/Bond | 1.625% | 3/15/20 | 5,200 | 5,207 |
| United States Treasury Note/Bond | 1.125% | 3/31/20 | 2,500 | 2,473 |
| United States Treasury Note/Bond | 1.375% | 3/31/20 | 2,200 | 2,189 |
| United States Treasury Note/Bond | 1.500% | 4/15/20 | 13,250 | 13,225 |
| United States Treasury Note/Bond | 1.500% | 6/15/20 | 9,000 | 8,978 |
| United States Treasury Note/Bond | 1.625% | 6/30/20 | 2,000 | 2,001 |
| United States Treasury Note/Bond | 1.500% | 7/15/20 | 5,650 | 5,634 |
| United States Treasury Note/Bond | 1.625% | 7/31/20 | 5,000 | 5,002 |
| United States Treasury Note/Bond | 1.375% | 8/31/20 | 1,025 | 1,018 |
| United States Treasury Note/Bond | 1.375% | 10/31/20 | 650 | 645 |
| United States Treasury Note/Bond | 1.750% | 10/31/20 | 3,900 | 3,911 |
| United States Treasury Note/Bond | 1.625% | 11/30/20 | 650 | 649 |
| United States Treasury Note/Bond | 2.000% | 11/30/20 | 1,000 | 1,010 |
| United States Treasury Note/Bond | 1.750% | 12/31/20 | 1,586 | 1,589 |
| United States Treasury Note/Bond | 1.375% | 1/31/21 | 2,400 | 2,374 |
| United States Treasury Note/Bond | 2.125% | 1/31/21 | 700 | 710 |
12
| | | | |
| Core Bond Fund | | | | |
| |
| |
| |
| | | | Face | Market |
| | | Maturity | Amount | Value • |
| | Coupon | Date | ($000) | ($000) |
| United States Treasury Note/Bond | 1.125% | 2/28/21 | 1,985 | 1,946 |
| United States Treasury Note/Bond | 1.250% | 3/31/21 | 1,000 | 984 |
| United States Treasury Note/Bond | 1.375% | 4/30/21 | 9,756 | 9,631 |
| United States Treasury Note/Bond | 2.250% | 4/30/21 | 2,300 | 2,340 |
| United States Treasury Note/Bond | 1.375% | 5/31/21 | 5,000 | 4,930 |
| United States Treasury Note/Bond | 2.125% | 6/30/21 | 420 | 425 |
| United States Treasury Note/Bond | 1.125% | 7/31/21 | 800 | 780 |
| United States Treasury Note/Bond | 2.125% | 8/15/21 | 6,600 | 6,683 |
| United States Treasury Note/Bond | 2.000% | 8/31/21 | 900 | 907 |
| United States Treasury Note/Bond | 1.250% | 10/31/21 | 4,000 | 3,909 |
| United States Treasury Note/Bond | 2.000% | 12/31/21 | 5,000 | 5,030 |
| United States Treasury Note/Bond | 1.625% | 8/31/22 | 200 | 197 |
| United States Treasury Note/Bond | 1.750% | 9/30/22 | 1,000 | 991 |
| United States Treasury Note/Bond | 2.000% | 11/30/22 | 706 | 707 |
| United States Treasury Note/Bond | 1.750% | 1/31/23 | 500 | 494 |
| United States Treasury Note/Bond | 2.000% | 2/15/23 | 2,400 | 2,400 |
| United States Treasury Note/Bond | 1.500% | 2/28/23 | 1,000 | 974 |
| United States Treasury Note/Bond | 1.500% | 3/31/23 | 980 | 954 |
| United States Treasury Note/Bond | 1.625% | 5/31/23 | 1,000 | 978 |
| United States Treasury Note/Bond | 2.750% | 11/15/23 | 244 | 254 |
| United States Treasury Note/Bond | 2.250% | 12/31/23 | 2,300 | 2,321 |
| 1 United States Treasury Note/Bond | 2.750% | 2/15/24 | 1,900 | 1,972 |
| United States Treasury Note/Bond | 1.625% | 2/15/26 | 3,268 | 3,106 |
| United States Treasury Note/Bond | 1.625% | 5/15/26 | 5,035 | 4,773 |
| United States Treasury Note/Bond | 2.375% | 5/15/27 | 20,000 | 20,075 |
| United States Treasury Note/Bond | 2.250% | 8/15/27 | 750 | 745 |
| United States Treasury Note/Bond | 6.125% | 8/15/29 | 1,500 | 2,079 |
| United States Treasury Note/Bond | 5.375% | 2/15/31 | 3,000 | 4,014 |
| United States Treasury Note/Bond | 5.000% | 5/15/37 | 1,642 | 2,243 |
| United States Treasury Note/Bond | 3.500% | 2/15/39 | 350 | 395 |
| United States Treasury Note/Bond | 4.250% | 5/15/39 | 600 | 750 |
| United States Treasury Note/Bond | 4.375% | 11/15/39 | 630 | 801 |
| United States Treasury Note/Bond | 4.625% | 2/15/40 | 425 | 559 |
| United States Treasury Note/Bond | 3.750% | 8/15/41 | 650 | 759 |
| United States Treasury Note/Bond | 3.125% | 11/15/41 | 600 | 634 |
| United States Treasury Note/Bond | 3.125% | 2/15/42 | 650 | 687 |
| United States Treasury Note/Bond | 2.750% | 8/15/42 | 130 | 128 |
| United States Treasury Note/Bond | 3.625% | 8/15/43 | 2,200 | 2,523 |
| United States Treasury Note/Bond | 2.875% | 8/15/45 | 1,550 | 1,556 |
| United States Treasury Note/Bond | 3.000% | 11/15/45 | 11,742 | 12,076 |
| 2 United States Treasury Note/Bond | 2.500% | 2/15/46 | 4,746 | 4,412 |
| United States Treasury Note/Bond | 2.500% | 5/15/46 | 2,800 | 2,601 |
| United States Treasury Note/Bond | 3.000% | 2/15/47 | 3,300 | 3,392 |
| United States Treasury Note/Bond | 3.000% | 5/15/47 | 900 | 925 |
| | | | | 266,257 |
| Agency Bonds and Notes (8.4%) | | | | |
| 3 AID-Iraq | 2.149% | 1/18/22 | 4,300 | 4,311 |
| 3 AID-Ukraine | 1.844% | 5/16/19 | 1,700 | 1,709 |
| 3 AID-Ukraine | 1.471% | 9/29/21 | 2,100 | 2,061 |
| 4 Fannie Mae Principal Strip | 0.000% | 2/1/19 | 800 | 783 |
| 5 Federal Home Loan Banks | 0.625% | 8/7/18 | 100 | 99 |
| 5 Federal Home Loan Banks | 0.875% | 10/1/18 | 2,500 | 2,487 |
| 5 Federal Home Loan Banks | 1.250% | 1/16/19 | 100 | 100 |
| 5 Federal Home Loan Banks | 1.375% | 3/18/19 | 3,350 | 3,345 |
13
| | | | | |
| Core Bond Fund | | | | |
| |
| |
| |
| | | | | Face | Market |
| | | | Maturity | Amount | Value • |
| | | Coupon | Date | ($000) | ($000) |
| 5 | Federal Home Loan Banks | 1.375% | 5/28/19 | 1,500 | 1,497 |
| 5 | Federal Home Loan Banks | 0.875% | 8/5/19 | 2,100 | 2,074 |
| 5 | Federal Home Loan Banks | 1.375% | 9/28/20 | 1,500 | 1,486 |
| 4 | Federal Home Loan Mortgage Corp. | 0.875% | 10/12/18 | 720 | 716 |
| 4 | Federal Home Loan Mortgage Corp. | 1.375% | 8/15/19 | 4,000 | 3,987 |
| 4 | Federal Home Loan Mortgage Corp. | 1.500% | 1/17/20 | 2,000 | 1,995 |
| 4 | Federal Home Loan Mortgage Corp. | 1.625% | 9/29/20 | 3,000 | 2,993 |
| 4 | Federal National Mortgage Assn. | 1.000% | 2/26/19 | 1,550 | 1,540 |
| 4 | Federal National Mortgage Assn. | 0.875% | 8/2/19 | 450 | 445 |
| 4 | Federal National Mortgage Assn. | 1.000% | 8/28/19 | 800 | 792 |
| 4 | Federal National Mortgage Assn. | 0.000% | 10/9/19 | 9,600 | 9,263 |
| 4 | Federal National Mortgage Assn. | 1.500% | 7/30/20 | 1,250 | 1,244 |
| 4 | Federal National Mortgage Assn. | 1.875% | 4/5/22 | 800 | 797 |
| 4 | Federal National Mortgage Assn. | 1.875% | 9/24/26 | 5,600 | 5,323 |
| 5 | Financing Corp. | 0.000% | 5/11/18 | 1,500 | 1,488 |
| | Private Export Funding Corp. | 1.875% | 7/15/18 | 250 | 251 |
| | Private Export Funding Corp. | 4.375% | 3/15/19 | 128 | 133 |
| | Private Export Funding Corp. | 1.450% | 8/15/19 | 2,715 | 2,703 |
| | Private Export Funding Corp. | 2.250% | 3/15/20 | 567 | 573 |
| | Private Export Funding Corp. | 2.300% | 9/15/20 | 150 | 152 |
| | Private Export Funding Corp. | 2.800% | 5/15/22 | 1,900 | 1,960 |
| | Private Export Funding Corp. | 3.550% | 1/15/24 | 1,300 | 1,391 |
| | Resolution Funding Corp. Interest Strip | 0.000% | 1/15/27 | 600 | 463 |
| | Resolution Funding Corp. Interest Strip | 0.000% | 4/15/27 | 1,800 | 1,378 |
| | Resolution Funding Corp. Interest Strip | 0.000% | 7/15/27 | 794 | 603 |
| | Resolution Funding Corp. Interest Strip | 0.000% | 10/15/27 | 794 | 597 |
| | Resolution Funding Corp. Interest Strip | 0.000% | 4/15/28 | 3,000 | 2,205 |
| | Resolution Funding Corp. Principal Strip | 0.000% | 10/15/19 | 2,000 | 1,934 |
| | Resolution Funding Corp. Principal Strip | 0.000% | 7/15/20 | 5,500 | 5,232 |
| | Resolution Funding Corp. Principal Strip | 0.000% | 10/15/20 | 2,000 | 1,894 |
| 5 | Tennessee Valley Authority Principal Strip | 0.000% | 11/1/25 | 3,000 | 2,417 |
| | | | | | 74,421 |
| Conventional Mortgage-Backed Securities (21.1%) | | | |
| 4,6 | Fannie Mae Pool | 2.000% | 1/1/32 | 2,349 | 2,313 |
| 4,6 | Fannie Mae Pool | 2.500% | 2/1/28–10/1/31 | 11,597 | 11,684 |
| 4,6,7 Fannie Mae Pool | 3.000% | 2/1/27–11/1/47 | 29,896 | 30,176 |
| 4,6 | Fannie Mae Pool | 3.500% | 3/1/27–10/1/47 | 3,553 | 3,735 |
| 4,6,7 Fannie Mae Pool | 4.000% | 8/1/39–10/1/47 | 23,716 | 25,039 |
| 4,6 | Fannie Mae Pool | 4.500% | 1/1/41–7/1/47 | 6,819 | 7,399 |
| 4,6,7 Fannie Mae Pool | 5.000% | 3/1/38–10/1/47 | 7,176 | 7,940 |
| 4,6 | Fannie Mae Pool | 6.000% | 5/1/37 | 860 | 978 |
| 4,6 | Freddie Mac Gold Pool | 2.500% | 8/1/31–11/1/31 | 1,845 | 1,862 |
| 4,6,7 Freddie Mac Gold Pool | 3.000% | 10/1/32–11/1/47 | 8,031 | 8,104 |
| 4,6 | Freddie Mac Gold Pool | 3.500% | 3/1/45–10/1/47 | 19,498 | 20,141 |
| 4,6 | Freddie Mac Gold Pool | 4.000% | 1/1/46–10/1/47 | 4,700 | 4,956 |
| 4,6 | Freddie Mac Gold Pool | 4.500% | 6/1/47–8/1/47 | 5,140 | 5,548 |
| 6 | Ginnie Mae I Pool | 4.000% | 7/15/45–8/15/45 | 270 | 286 |
| 6 | Ginnie Mae I Pool | 4.500% | 2/15/39–9/15/46 | 1,477 | 1,613 |
| 6 | Ginnie Mae I Pool | 5.000% | 3/15/38–2/15/40 | 3,185 | 3,512 |
| 6,7 | Ginnie Mae II Pool | 3.000% | 12/20/44–10/1/47 | 14,505 | 14,739 |
| 6,7 | Ginnie Mae II Pool | 3.500% | 10/20/43–10/1/47 | 20,509 | 21,378 |
| 6 | Ginnie Mae II Pool | 4.000% | 11/20/42–10/1/47 | 9,759 | 10,301 |
| 6 | Ginnie Mae II Pool | 4.500% | 11/20/44–10/1/47 | 4,058 | 4,364 |
| | | | | | 186,068 |
14
| | | | | |
| Core Bond Fund | | | | |
| |
| |
| |
| | | | | Face | Market |
| | | | Maturity | Amount | Value • |
| | | Coupon | Date | ($000) | ($000) |
| Nonconventional Mortgage-Backed Securities (1.5%) | | | |
| 4,6,8 | Fannie Mae Pool | 3.083% | 12/1/40 | 192 | 203 |
| 4,6,9 | Fannie Mae REMICS 2005-45 | 1.607% | 6/25/35 | 116 | 117 |
| 4,6,9 | Fannie Mae REMICS 2005-95 | 1.647% | 11/25/35 | 156 | 157 |
| 4,6,9 | Fannie Mae REMICS 2006-46 | 1.557% | 6/25/36 | 432 | 432 |
| 4,6,9 | Fannie Mae REMICS 2007-4 | 1.682% | 2/25/37 | 59 | 60 |
| 4,6,9 | Fannie Mae REMICS 2012-122 | 1.637% | 11/25/42 | 159 | 160 |
| 4,6,9 | Fannie Mae REMICS 2013-19 | 1.537% | 9/25/41 | 220 | 219 |
| 4,6,9 | Fannie Mae REMICS 2013-39 | 1.587% | 5/25/43 | 207 | 206 |
| 4,6,9 | Fannie Mae REMICS 2015-22 | 1.537% | 4/25/45 | 173 | 172 |
| *,^,4,6 Fannie Mae REMICS 2015-8 | 4.863% | 3/25/45 | 21,669 | 4,812 |
| 4,6,9 | Fannie Mae REMICS 2016-55 | 1.737% | 8/25/46 | 342 | 345 |
| 4,6,9 | Fannie Mae REMICS 2016-60 | 1.487% | 9/25/46 | 705 | 703 |
| 4,6,9 | Fannie Mae REMICS 2016-62 | 1.637% | 9/25/46 | 708 | 710 |
| 4,6,9 | Fannie Mae REMICS 2016-93 | 1.587% | 12/25/46 | 1,423 | 1,424 |
| 4,6,8 | Freddie Mac Non Gold Pool | 3.111% | 9/1/37 | 640 | 676 |
| 4,6 | Freddie Mac Non Gold Pool | 3.222% | 7/1/33 | 101 | 106 |
| 4,6,8 | Freddie Mac Non Gold Pool | 3.329% | 7/1/35 | 749 | 789 |
| 4,6,9 | Freddie Mac REMICS | 1.577% | 11/15/36 | 144 | 144 |
| 4,6,9 | Freddie Mac REMICS | 1.584% | 8/15/43 | 179 | 180 |
| 4,6,9 | Freddie Mac REMICS | 1.594% | 11/15/36 | 110 | 110 |
| 4,6,9 | Freddie Mac REMICS | 1.684% | 6/15/42 | 62 | 62 |
| *,6 | Government National Mortgage Association | | | | |
| | GNR_15-106D | 4.000% | 1/20/45 | 1,909 | 368 |
| *,^,6 | Government National Mortgage Association | | | | |
| | GNR_17-85A | 4.914% | 6/20/47 | 5,447 | 1,109 |
| | | | | | 13,264 |
| Total U.S. Government and Agency Obligations (Cost $544,592) | | | 540,010 |
| Asset-Backed/Commercial Mortgage-Backed Securities (7.6%) | | | |
| 6 | Ally Master Owner Trust Series 2017-3 | 2.040% | 6/15/22 | 350 | 350 |
| 6,10 American Homes 4 Rent 2014-SFR3 | 3.678% | 12/17/36 | 95 | 99 |
| 6 | AmeriCredit Automobile Receivables | | | | |
| | Trust 2014-1 | 2.150% | 3/9/20 | 90 | 90 |
| 6 | AmeriCredit Automobile Receivables | | | | |
| | Trust 2014-2 | 2.180% | 6/8/20 | 60 | 60 |
| 6 | AmeriCredit Automobile Receivables | | | | |
| | Trust 2015-3 | 3.340% | 8/8/21 | 285 | 288 |
| 6 | AmeriCredit Automobile Receivables | | | | |
| | Trust 2016-2 | 2.210% | 5/10/21 | 30 | 30 |
| 6 | AmeriCredit Automobile Receivables | | | | |
| | Trust 2016-2 | 2.870% | 11/8/21 | 20 | 20 |
| 6 | AmeriCredit Automobile Receivables | | | | |
| | Trust 2016-2 | 3.650% | 5/9/22 | 125 | 128 |
| 6 | AmeriCredit Automobile Receivables | | | | |
| | Trust 2016-3 | 2.710% | 9/8/22 | 200 | 200 |
| 6 | AmeriCredit Automobile Receivables | | | | |
| | Trust 2016-4 | 2.410% | 7/8/22 | 225 | 224 |
| 6,10 Applebee’s Funding LLC/IHOP Funding LLC | 4.277% | 9/5/44 | 35 | 34 |
| 6,10 ARL Second LLC 2014-1A | 2.920% | 6/15/44 | 66 | 65 |
| 6,10 Aventura Mall Trust 2013-AVM | 3.867% | 12/5/32 | 800 | 834 |
| 6,10 Avis Budget Rental Car Funding AESOP LLC | | | | |
| | 2013-2A | 2.970% | 2/20/20 | 575 | 580 |
15
| | | | | |
| Core Bond Fund | | | | |
| |
| |
| |
| | | | | Face | Market |
| | | | Maturity | Amount | Value • |
| | | Coupon | Date | ($000) | ($000) |
| 6,10 Avis Budget Rental Car Funding AESOP LLC | | | | |
| | 2015-2A | 2.630% | 12/20/21 | 380 | 380 |
| 6 | BANK 2017 - BNK4 | 3.625% | 5/15/50 | 140 | 146 |
| 6 | BANK 2017 - BNK5 | 3.390% | 6/15/60 | 180 | 184 |
| 6 | BANK 2017 - BNK6 | 3.518% | 7/15/60 | 100 | 103 |
| | Bank of Nova Scotia | 1.875% | 4/26/21 | 830 | 817 |
| 10 | Bank of Nova Scotia | 1.875% | 9/20/21 | 110 | 108 |
| 6 | California Republic Auto Receivables | | | | |
| | Trust 2016-2 | 2.520% | 5/16/22 | 210 | 210 |
| 6 | California Republic Auto Receivables | | | | |
| | Trust 2016-2 | 3.510% | 3/15/23 | 210 | 210 |
| 6 | Capital Auto Receivables Asset Trust 2013-4 | 2.670% | 2/20/19 | 102 | 102 |
| 6 | Capital Auto Receivables Asset Trust 2016-2 | 3.160% | 11/20/23 | 220 | 222 |
| 6 | Capital Auto Receivables Asset Trust 2016-3 | 2.350% | 9/20/21 | 50 | 50 |
| 6 | Capital Auto Receivables Asset Trust 2016-3 | 2.650% | 1/20/24 | 40 | 40 |
| 6 | CarMax Auto Owner Trust 2013-3 | 2.850% | 2/18/20 | 750 | 750 |
| 6 | CarMax Auto Owner Trust 2016-2 | 2.160% | 12/15/21 | 100 | 100 |
| 6 | CarMax Auto Owner Trust 2016-2 | 3.250% | 11/15/22 | 100 | 101 |
| 6 | CarMax Auto Owner Trust 2016-3 | 1.900% | 4/15/22 | 200 | 198 |
| 6 | CarMax Auto Owner Trust 2016-3 | 2.200% | 6/15/22 | 190 | 188 |
| 6 | CarMax Auto Owner Trust 2016-3 | 2.940% | 1/17/23 | 190 | 189 |
| 6 | CD 2017-CD3 Commercial Mortgage Trust | 3.631% | 2/10/50 | 160 | 167 |
| 6 | CD 2017-CD4 Commercial Mortgage Trust | 3.514% | 5/10/50 | 80 | 83 |
| 6 | CD 2017-CD5 Commercial Mortgage Trust | 3.431% | 8/15/50 | 90 | 92 |
| 6 | CFCRE Commercial Mortgage Trust 2016-C4 | 3.283% | 5/10/58 | 61 | 61 |
| 6,10 Chesapeake Funding II LLC 2016-2A | 1.880% | 6/15/28 | 516 | 517 |
| 6,10 Chrysler Capital Auto Receivables | | | | |
| | Trust 2014-BA | 3.440% | 8/16/21 | 200 | 203 |
| 6,10 Chrysler Capital Auto Receivables | | | | |
| | Trust 2016-AA | 2.880% | 2/15/22 | 90 | 91 |
| 6,10 Chrysler Capital Auto Receivables | | | | |
| | Trust 2016-AA | 4.220% | 2/15/23 | 90 | 92 |
| 6,10 Chrysler Capital Auto Receivables | | | | |
| | Trust 2016-BA | 1.870% | 2/15/22 | 20 | 20 |
| 6 | Citigroup Commercial Mortgage | | | | |
| | Trust 2013-GC15 | 4.371% | 9/10/46 | 30 | 33 |
| 6 | Citigroup Commercial Mortgage | | | | |
| | Trust 2014-GC19 | 4.023% | 3/10/47 | 370 | 393 |
| 6 | Citigroup Commercial Mortgage | | | | |
| | Trust 2014-GC21 | 3.575% | 5/10/47 | 350 | 365 |
| 6 | Citigroup Commercial Mortgage | | | | |
| | Trust 2014-GC23 | 3.622% | 7/10/47 | 350 | 365 |
| 6 | Citigroup Commercial Mortgage | | | | |
| | Trust 2014-GC23 | 4.175% | 7/10/47 | 230 | 239 |
| 6 | Citigroup Commercial Mortgage | | | | |
| | Trust 2014-GC25 | 3.372% | 10/10/47 | 10 | 10 |
| 6 | Citigroup Commercial Mortgage | | | | |
| | Trust 2014-GC25 | 3.635% | 10/10/47 | 360 | 375 |
| 6 | Citigroup Commercial Mortgage | | | | |
| | Trust 2014-GC25 | 4.345% | 10/10/47 | 140 | 143 |
| 6 | Citigroup Commercial Mortgage | | | | |
| | Trust 2014-GC25 | 4.682% | 10/10/47 | 175 | 174 |
| 6 | Citigroup Commercial Mortgage | | | | |
| | Trust 2015-GC27 | 3.137% | 2/10/48 | 228 | 229 |
16
| | | | | |
| Core Bond Fund | | | | |
| |
| |
| |
| | | | | Face | Market |
| | | | Maturity | Amount | Value • |
| | | Coupon | Date | ($000) | ($000) |
| 6 | Citigroup Commercial Mortgage | | | | |
| | Trust 2015-GC31 | 3.762% | 6/10/48 | 30 | 31 |
| 6 | Citigroup Commercial Mortgage | | | | |
| | Trust 2016-C1 | 3.209% | 5/10/49 | 61 | 61 |
| 6,11 | Citigroup Commercial Mortgage | | | | |
| | Trust 2017-P8 | 3.465% | 9/15/50 | 220 | 227 |
| 6,11 | Citigroup Commercial Mortgage | | | | |
| | Trust 2017-P8 | 4.192% | 9/15/50 | 60 | 62 |
| 6,11 | Citigroup Commercial Mortgage | | | | |
| | Trust 2017-P8 | 4.272% | 9/15/50 | 60 | 60 |
| 6,10 | CKE Restaurant Holdings Inc. 2013-1A | 4.474% | 3/20/43 | 77 | 78 |
| 6,9,10 | Colony American Homes 2015-1 | 2.734% | 7/17/32 | 70 | 70 |
| 6,9,10 | Colony American Homes 2015-1A | 2.434% | 7/17/32 | 177 | 178 |
| 6,9,10 | Colony Starwood Homes 2016-1A Trust | 2.737% | 7/17/33 | 493 | 495 |
| 6,9,10 | Colony Starwood Homes 2016-1A Trust | 3.387% | 7/17/33 | 185 | 186 |
| 6,10 | COMM 2012-CCRE3 Mortgage Trust | 3.416% | 10/15/45 | 40 | 41 |
| 6 | COMM 2012-CCRE4 Mortgage Trust | 3.251% | 10/15/45 | 500 | 507 |
| 6 | COMM 2013-CCRE12 Mortgage Trust | 3.765% | 10/10/46 | 60 | 63 |
| 6 | COMM 2013-CCRE12 Mortgage Trust | 4.046% | 10/10/46 | 500 | 535 |
| 6,10 | COMM 2013-CCRE6 Mortgage Trust | 3.147% | 3/10/46 | 150 | 151 |
| 6,10 | COMM 2013-CCRE6 Mortgage Trust | 3.397% | 3/10/46 | 210 | 209 |
| 6,10 | COMM 2013-CCRE9 Mortgage Trust | 4.396% | 7/10/45 | 230 | 238 |
| 6,10 | COMM 2014-277P Mortgage Trust | 3.732% | 8/10/49 | 100 | 104 |
| 6 | COMM 2014-CCRE14 Mortgage Trust | 4.236% | 2/10/47 | 20 | 22 |
| 6 | COMM 2014-CCRE15 Mortgage Trust | 4.074% | 2/10/47 | 350 | 374 |
| 6 | COMM 2014-CCRE17 Mortgage Trust | 3.700% | 5/10/47 | 20 | 21 |
| 6 | COMM 2014-CCRE17 Mortgage Trust | 3.977% | 5/10/47 | 350 | 372 |
| 6 | COMM 2014-CCRE17 Mortgage Trust | 4.895% | 5/10/47 | 190 | 195 |
| 6 | COMM 2014-CCRE20 Mortgage Trust | 3.326% | 11/10/47 | 20 | 20 |
| 6 | COMM 2014-CCRE20 Mortgage Trust | 3.590% | 11/10/47 | 350 | 363 |
| 6 | COMM 2014-CCRE21 Mortgage Trust | 3.528% | 12/10/47 | 50 | 52 |
| 6 | COMM 2015-CCRE22 Mortgage Trust | 3.309% | 3/10/48 | 228 | 232 |
| 6 | COMM 2015-LC19 Mortgage Trust | 3.183% | 2/10/48 | 228 | 230 |
| 6 | CSAIL 2015-C1 Commercial Mortgage Trust | 3.505% | 4/15/50 | 228 | 234 |
| 6 | CSAIL 2015-C4 Commercial Mortgage Trust | 3.808% | 11/15/48 | 228 | 238 |
| 6 | CSAIL 2016-C7 Commercial Mortgage Trust | 3.502% | 11/15/49 | 60 | 61 |
| 6 | CSAIL 2017-C8 Commercial Mortgage Trust | 3.392% | 6/15/50 | 230 | 234 |
| 6,10 | DB Master Finance LLC 2015-1A | 3.980% | 2/20/45 | 59 | 60 |
| 6,10 | DB Master Finance LLC 2017-1A | 3.629% | 11/20/47 | 220 | 221 |
| 6,10 | DB Master Finance LLC 2017-1A | 4.030% | 11/20/47 | 170 | 171 |
| 6 | DBJPM 16-C1 Mortgage Trust | 3.505% | 5/10/49 | 140 | 133 |
| 6 | DBJPM 17-C6 Mortgage Trust | 3.328% | 6/10/50 | 160 | 163 |
| 6,9 | Discover Card Execution Note Trust 2017-A5 | 1.834% | 12/15/26 | 650 | 656 |
| 6,10 | Drive Auto Receivables Trust 2015-AA | 3.060% | 5/17/21 | 334 | 335 |
| 6,10 | Drive Auto Receivables Trust 2015-DA | 4.590% | 1/17/23 | 132 | 136 |
| 6,10 | Drive Auto Receivables Trust 2016-BA | 2.560% | 6/15/20 | 358 | 359 |
| 6,10 | Drive Auto Receivables Trust 2016-BA | 3.190% | 7/15/22 | 270 | 273 |
| 6,10 | Drive Auto Receivables Trust 2016-BA | 4.530% | 8/15/23 | 200 | 204 |
| 6,10 | Drive Auto Receivables Trust 2016-C | 1.670% | 11/15/19 | 111 | 111 |
| 6,10 | Drive Auto Receivables Trust 2016-C | 2.370% | 11/16/20 | 80 | 80 |
| 6,10 | Drive Auto Receivables Trust 2016-C | 4.180% | 3/15/24 | 90 | 93 |
| 6 | Drive Auto Receivables Trust 2017-1 | 1.860% | 3/16/20 | 210 | 210 |
| 6 | Drive Auto Receivables Trust 2017-1 | 3.840% | 3/15/23 | 50 | 51 |
| 6,10 | Enterprise Fleet Financing LLC Series 2016-2 | 2.040% | 2/22/22 | 450 | 449 |
17
| | | | | |
| Core Bond Fund | | | | |
| |
| |
| |
| | | | | Face | Market |
| | | | Maturity | Amount | Value • |
| | | Coupon | Date | ($000) | ($000) |
| 6,9,10 | Evergreen Credit Card Trust Series 2016-1 | 1.954% | 4/15/20 | 1,175 | 1,178 |
| 6,9,10 | Evergreen Credit Card Trust Series 2016-3 | 1.734% | 11/16/20 | 110 | 110 |
| 4,6,9 | Fannie Mae Connecticut Avenue Securities | | | | |
| | 2016-C04 | 2.687% | 1/25/29 | 167 | 168 |
| 4,6,9 | Fannie Mae Connecticut Avenue Securities | | | | |
| | 2016-C05 | 2.587% | 1/25/29 | 397 | 399 |
| 4,6 | Fannie Mae Grantor Trust 2017-T1 | 2.898% | 6/25/27 | 20 | 20 |
| 4,6 | FHLMC Multifamily Structured Pass | | | | |
| | Through Certificates K054 | 2.745% | 1/25/26 | 1,000 | 999 |
| 4,6 | FHLMC Multifamily Structured Pass | | | | |
| | Through Certificates K056 | 2.525% | 5/25/26 | 1,000 | 981 |
| 4,6 | FHLMC Multifamily Structured Pass | | | | |
| | Through Certificates K057 | 2.570% | 7/25/26 | 1,000 | 983 |
| 4,6 | FHLMC Multifamily Structured Pass | | | | |
| | Through Certificates K061 | 3.347% | 11/25/26 | 1,000 | 1,039 |
| 4,6 | FHLMC Multifamily Structured Pass | | | | |
| | Through Certificates K062 | 3.413% | 12/25/26 | 1,000 | 1,045 |
| 4,6 | FHLMC Multifamily Structured Pass | | | | |
| | Through Certificates K066 | 3.117% | 6/25/27 | 540 | 551 |
| 6,10 | Flagship Credit Auto Trust 2016-4 | 1.960% | 2/16/21 | 120 | 120 |
| 6,10 | Ford Credit Auto Owner Trust 2014-REV1 | 2.410% | 11/15/25 | 250 | 251 |
| 6,10 | Ford Credit Auto Owner Trust 2014-REV2 | 2.510% | 4/15/26 | 200 | 202 |
| 6 | Ford Credit Auto Owner Trust 2016-B | 1.850% | 9/15/21 | 200 | 198 |
| 6,10 | Ford Credit Auto Owner Trust 2017-1 | 2.620% | 8/15/28 | 450 | 455 |
| 6,10 | Ford Credit Auto Owner Trust 2017-2 | 2.360% | 3/15/29 | 650 | 648 |
| 6,10 | Ford Credit Auto Owner Trust 2017-2 | 2.600% | 3/15/29 | 120 | 120 |
| 6,10 | Ford Credit Auto Owner Trust 2017-2 | 2.750% | 3/15/29 | 250 | 249 |
| 6 | Ford Credit Floorplan Master Owner Trust A | | | | |
| | Series 2014-2 | 2.310% | 2/15/21 | 200 | 201 |
| 6 | Ford Credit Floorplan Master Owner Trust A | | | | |
| | Series 2017-1 | 2.070% | 5/15/22 | 1,050 | 1,053 |
| 4,6,9 | Freddie Mac Structured Agency Credit Risk | | | | |
| | Debt Notes 2016-DNA2 | 2.487% | 10/25/28 | 58 | 59 |
| 4,6,9 | Freddie Mac Structured Agency Credit Risk | | | | |
| | Debt Notes 2016-DNA3 | 2.337% | 12/25/28 | 118 | 118 |
| 4,6,9 | Freddie Mac Structured Agency Credit Risk | | | | |
| | Debt Notes 2016-DNA3 | 3.237% | 12/25/28 | 250 | 255 |
| 6,10 | FRS I LLC 2013-1A | 3.080% | 4/15/43 | 182 | 181 |
| 6 | GM Financial Automobile Leasing | | | | |
| | Trust 2015-2 | 2.420% | 7/22/19 | 420 | 421 |
| 6 | GM Financial Automobile Leasing | | | | |
| | Trust 2015-2 | 2.990% | 7/22/19 | 50 | 50 |
| 6 | GM Financial Automobile Leasing | | | | |
| | Trust 2016-2 | 2.580% | 3/20/20 | 190 | 189 |
| 6 | GM Financial Automobile Leasing | | | | |
| | Trust 2017-2 | 2.180% | 6/21/21 | 90 | 90 |
| 6 | GM Financial Automobile Leasing | | | | |
| | Trust 2017-3 | 2.010% | 11/20/20 | 200 | 200 |
| 6 | GM Financial Automobile Leasing | | | | |
| | Trust 2017-3 | 2.120% | 9/20/21 | 80 | 80 |
| 6 | GM Financial Automobile Leasing | | | | |
| | Trust 2017-3 | 2.400% | 9/20/21 | 80 | 80 |
| 6 | GM Financial Automobile Leasing | | | | |
| | Trust 2017-3 | 2.730% | 9/20/21 | 40 | 40 |
18
| | | | | |
| Core Bond Fund | | | | |
| |
| |
| |
| | | | | Face | Market |
| | | | Maturity | Amount | Value • |
| | | Coupon | Date | ($000) | ($000) |
| 6,10 | GMF Floorplan Owner Revolving | | | | |
| | Trust 2015-1 | 1.970% | 5/15/20 | 450 | 450 |
| 6,10 | GMF Floorplan Owner Revolving | | | | |
| | Trust 2016-1 | 2.410% | 5/17/21 | 330 | 330 |
| 6,10 | GMF Floorplan Owner Revolving | | | | |
| | Trust 2016-1 | 2.850% | 5/17/21 | 330 | 328 |
| 6,10 | GMF Floorplan Owner Revolving | | | | |
| | Trust 2017-2 | 2.440% | 7/15/22 | 260 | 259 |
| 6,10 | GMF Floorplan Owner Revolving | | | | |
| | Trust 2017-2 | 2.630% | 7/15/22 | 140 | 140 |
| 6,10 | Golden Credit Card Trust 2016-5A | 1.600% | 9/15/21 | 150 | 149 |
| 6 | GS Mortgage Securities Corporation II | | | | |
| | 2015-GC30 | 3.382% | 5/10/50 | 228 | 233 |
| 6 | GS Mortgage Securities Trust 2013-GCJ12 | 3.135% | 6/10/46 | 350 | 357 |
| 6 | GS Mortgage Securities Trust 2014-GC20 | 3.998% | 4/10/47 | 350 | 370 |
| 6 | GS Mortgage Securities Trust 2014-GC24 | 3.931% | 9/10/47 | 390 | 413 |
| 6 | GS Mortgage Securities Trust 2014-GC24 | 4.641% | 9/10/47 | 170 | 178 |
| 6 | GS Mortgage Securities Trust 2014-GC24 | 4.662% | 9/10/47 | 150 | 151 |
| 6 | GS Mortgage Securities Trust 2015-GC28 | 3.136% | 2/10/48 | 30 | 30 |
| 6 | GS Mortgage Securities Trust 2015-GC28 | 3.396% | 2/10/48 | 228 | 233 |
| 6,10 | Hertz Vehicle Financing II LP 2015-1A | 2.730% | 3/25/21 | 850 | 850 |
| 6,10 | Hertz Vehicle Financing LLC 2013-1A | 1.830% | 8/25/19 | 680 | 678 |
| 6,10 | Hertz Vehicle Financing LLC 2016-3A | 2.270% | 7/25/20 | 25 | 25 |
| 6,10 | Hertz Vehicle Financing LLC 2017-2A | 3.290% | 10/25/23 | 180 | 181 |
| 6,10 | Hertz Vehicle Financing LLC 2017-2A | 4.200% | 10/25/23 | 350 | 351 |
| 6,10 | Hilton USA Trust 2016-HHV | 3.719% | 11/5/38 | 20 | 21 |
| 6,10 | Hyundai Auto Lease Securitization | | | | |
| | Trust 2017-B | 2.130% | 3/15/21 | 200 | 200 |
| 6,9,10 | Invitation Homes 2015-SFR2 Trust | 2.884% | 6/17/32 | 70 | 70 |
| 6,9,10 | Invitation Homes 2015-SFR3 Trust | 2.984% | 8/17/32 | 70 | 70 |
| 6,10 | JP Morgan Chase Commercial Mortgage | | | | |
| | Securities Trust 2011-C3 | 4.717% | 2/15/46 | 1,700 | 1,808 |
| 6,10 | JP Morgan Chase Commercial Mortgage | | | | |
| | Securities Trust 2011-C5 | 5.588% | 8/15/46 | 550 | 601 |
| 6,10 | JP Morgan Chase Commercial Mortgage | | | | |
| | Securities Trust 2011-RR1 | 4.717% | 3/16/46 | 20 | 21 |
| 6,10 | JP Morgan Chase Commercial Mortgage | | | | |
| | Securities Trust 2012-C8 | 3.424% | 10/15/45 | 90 | 92 |
| 6 | JP Morgan Chase Commercial Mortgage | | | | |
| | Securities Trust 2013-C13 | 4.188% | 1/15/46 | 230 | 232 |
| 6 | JP Morgan Chase Commercial Mortgage | | | | |
| | Securities Trust 2016-JP4 | 3.648% | 12/15/49 | 90 | 94 |
| 6 | JP Morgan Chase Commercial Mortgage | | | | |
| | Securities Trust 2017-JP6 | 3.490% | 7/15/50 | 70 | 72 |
| 6 | JPMBB Commercial Mortgage Securities | | | | |
| | Trust 2013-C12 | 3.363% | 7/15/45 | 1,600 | 1,656 |
| 6 | JPMBB Commercial Mortgage Securities | | | | |
| | Trust 2013-C14 | 4.133% | 8/15/46 | 30 | 32 |
| 6 | JPMBB Commercial Mortgage Securities | | | | |
| | Trust 2013-C15 | 5.250% | 11/15/45 | 30 | 31 |
| 6 | JPMBB Commercial Mortgage Securities | | | | |
| | Trust 2014-C18 | 4.079% | 2/15/47 | 380 | 405 |
| 6 | JPMBB Commercial Mortgage Securities | | | | |
| | Trust 2014-C26 | 3.231% | 1/15/48 | 350 | 354 |
19
| | | | | |
| Core Bond Fund | | | | |
| |
| |
| |
| | | | | Face | Market |
| | | | Maturity | Amount | Value • |
| | | Coupon | Date | ($000) | ($000) |
| 6 | JPMBB Commercial Mortgage Securities | | | | |
| | Trust 2014-C26 | 3.494% | 1/15/48 | 350 | 361 |
| 6 | JPMBB Commercial Mortgage Securities | | | | |
| | Trust 2015-C27 | 3.179% | 2/15/48 | 258 | 260 |
| 6 | JPMCC Commercial Mortgage Securities | | | | |
| | Trust 2017-JP5 | 3.723% | 3/15/50 | 160 | 168 |
| 6 | JPMCC Commercial Mortgage Securities | | | | |
| | Trust 2017-JP7 | 3.454% | 9/15/50 | 150 | 153 |
| 6,9,10 | Mercedes-Benz Master Owner Trust 2017-B | 1.654% | 5/16/22 | 460 | 461 |
| 6 | Morgan Stanley Bank of America Merrill | | | | |
| | Lynch Trust 2012-C5 | 3.792% | 8/15/45 | 100 | 104 |
| 6 | Morgan Stanley Bank of America Merrill | | | | |
| | Lynch Trust 2013-C10 | 4.219% | 7/15/46 | 200 | 199 |
| 6 | Morgan Stanley Bank of America Merrill | | | | |
| | Lynch Trust 2013-C12 | 4.259% | 10/15/46 | 400 | 432 |
| 6 | Morgan Stanley Bank of America Merrill | | | | |
| | Lynch Trust 2014-C15 | 3.773% | 4/15/47 | 350 | 368 |
| 6 | Morgan Stanley Bank of America Merrill | | | | |
| | Lynch Trust 2014-C15 | 5.056% | 4/15/47 | 150 | 156 |
| 6 | Morgan Stanley Bank of America Merrill | | | | |
| | Lynch Trust 2014-C16 | 3.892% | 6/15/47 | 20 | 21 |
| 6 | Morgan Stanley Bank of America Merrill | | | | |
| | Lynch Trust 2014-C16 | 4.481% | 6/15/47 | 80 | 83 |
| 6 | Morgan Stanley Bank of America Merrill | | | | |
| | Lynch Trust 2014-C17 | 3.741% | 8/15/47 | 350 | 366 |
| 6 | Morgan Stanley Bank of America Merrill | | | | |
| | Lynch Trust 2014-C18 | 3.923% | 10/15/47 | 350 | 370 |
| 6 | Morgan Stanley Bank of America Merrill | | | | |
| | Lynch Trust 2014-C19 | 3.526% | 12/15/47 | 450 | 465 |
| 6 | Morgan Stanley Bank of America Merrill | | | | |
| | Lynch Trust 2015-C20 | 3.249% | 2/15/48 | 228 | 230 |
| 6 | Morgan Stanley Bank of America Merrill | | | | |
| | Lynch Trust 2016-C29 | 4.911% | 5/15/49 | 160 | 166 |
| 6 | Morgan Stanley Bank of America Merrill | | | | |
| | Lynch Trust 2016-C32 | 3.720% | 12/15/49 | 60 | 63 |
| 6 | Morgan Stanley Capital I Trust 2015-UBS8 | 3.809% | 12/15/48 | 189 | 197 |
| 6,9,10,11Motor plc 2017 1A | 1.773% | 9/25/24 | 850 | 850 |
| 6,10 | MSBAM Commercial Mortgage Securities | | | | |
| | Trust 2012-CKSV | 3.277% | 10/15/30 | 1,700 | 1,696 |
| 10 | National Australia Bank Ltd. | 2.250% | 3/16/21 | 40 | 40 |
| 6,9,10 | Navient Student Loan Trust 2016-2 | 2.287% | 6/25/65 | 200 | 203 |
| 6,9,10 | Navient Student Loan Trust 2016-3 | 2.087% | 6/25/65 | 60 | 61 |
| 6,9,10 | Navient Student Loan Trust 2016-6A | 1.987% | 3/25/66 | 100 | 100 |
| 6,9,10 | Navient Student Loan Trust 2017-4A | 1.737% | 9/27/66 | 180 | 181 |
| 6,9,10 | Navistar Financial Dealer Note Master | | | | |
| | Trust II 2016-1A | 2.587% | 9/27/21 | 220 | 222 |
| 6,10 | NextGear Floorplan Master Owner | | | | |
| | Trust 2016-1A | 2.740% | 4/15/21 | 580 | 584 |
| 6 | Nissan Auto Lease Trust 2017-A | 1.910% | 4/15/20 | 510 | 511 |
| 6 | Nissan Auto Lease Trust 2017-A | 2.040% | 9/15/22 | 190 | 190 |
| 6,10 | Palisades Center Trust 2016-PLSD | 2.713% | 4/13/33 | 700 | 702 |
| 6,9,10 | Pepper Residential Securities | | | | |
| | Trust 2017A-A1UA | 2.335% | 3/10/58 | 200 | 200 |
| 6,10 | PFS Financing Corp 2017-B | 2.220% | 7/15/22 | 340 | 339 |
20
| | | | | |
| Core Bond Fund | | | | |
| |
| |
| |
| | | | | Face | Market |
| | | | Maturity | Amount | Value • |
| | | Coupon | Date | ($000) | ($000) |
| 6,9,10 | PHEAA Student Loan Trust 2016-2A | 2.187% | 11/25/65 | 219 | 220 |
| 6,10 | Progress Residential 2015-SFR3 Trust | 3.067% | 11/12/32 | 412 | 414 |
| 6,9,10 | Resimac Premier Series 2016-1A | 2.625% | 10/10/47 | 601 | 603 |
| | Royal Bank of Canada | 2.300% | 3/22/21 | 150 | 150 |
| 6 | Santander Drive Auto Receivables | | | | |
| | Trust 2016-2 | 2.080% | 2/16/21 | 215 | 216 |
| 6 | Santander Drive Auto Receivables | | | | |
| | Trust 2016-2 | 2.660% | 11/15/21 | 170 | 171 |
| 6 | Santander Drive Auto Receivables | | | | |
| | Trust 2016-2 | 3.390% | 4/15/22 | 140 | 142 |
| 6 | Santander Drive Auto Receivables | | | | |
| | Trust 2016-3 | 1.890% | 6/15/21 | 200 | 200 |
| 6 | Santander Drive Auto Receivables | | | | |
| | Trust 2016-3 | 2.460% | 3/15/22 | 260 | 261 |
| 6 | Santander Drive Auto Receivables | | | | |
| | Trust 2017-3 | 1.870% | 6/15/21 | 220 | 220 |
| 6 | Santander Drive Auto Receivables | | | | |
| | Trust 2017-3 | 2.760% | 12/15/22 | 110 | 110 |
| 6,10 | Securitized Term Auto Receivables | | | | |
| | Trust 2016-1A | 1.524% | 3/25/20 | 50 | 50 |
| 6,10 | Securitized Term Auto Receivables | | | | |
| | Trust 2016-1A | 1.794% | 2/25/21 | 40 | 40 |
| 6,10,11 Securitized Term Auto Receivables | | | | |
| | Trust 2017-2A | 2.289% | 3/25/22 | 180 | 180 |
| 6 | SMART ABS Series 2016-2US Trust | 2.050% | 12/14/22 | 40 | 40 |
| 6,10 | SMB Private Education Loan Trust 2016-A | 2.700% | 5/15/31 | 440 | 442 |
| 6,9,10 | SMB Private Education Loan Trust 2016-B | 2.684% | 2/17/32 | 280 | 287 |
| 6,9,10 | SMB Private Education Loan Trust 2016-C | 2.334% | 9/15/34 | 100 | 102 |
| 6,9,10 | SMB Private Education Loan Trust 2017-A | 2.134% | 9/15/34 | 120 | 121 |
| 6,10 | SoFi Professional Loan Program 2016-B LLC | 2.740% | 10/25/32 | 470 | 473 |
| 6,10 | SoFi Professional Loan Program 2016-C LLC | 2.360% | 12/27/32 | 500 | 498 |
| 6,10 | SoFi Professional Loan Program 2016-D LLC | 2.340% | 4/25/33 | 100 | 99 |
| 6,9,10 | SoFi Professional Loan Program 2016-D LLC | 2.187% | 1/25/39 | 72 | 73 |
| 6,10 | SoFi Professional Loan Program 2017-B LLC | 2.740% | 5/25/40 | 10 | 10 |
| 6,10 | SoFi Professional Loan Program 2017-D LLC | 2.650% | 9/25/40 | 120 | 119 |
| 6,10 | SpareBank 1 Boligkreditt AS | 1.750% | 11/15/20 | 250 | 248 |
| 6 | Synchrony Credit Card Master Note | | | | |
| | Trust 2016-1 | 2.390% | 3/15/22 | 345 | 346 |
| 6 | Synchrony Credit Card Master Note | | | | |
| | Trust 2016-3 | 1.910% | 9/15/22 | 100 | 99 |
| 6,10 | Taco Bell Funding LLC 2016-1A | 4.377% | 5/25/46 | 36 | 37 |
| 6,10 | Taco Bell Funding LLC 2016-1A | 4.970% | 5/25/46 | 31 | 33 |
| 6,10 | TMSQ 2014-1500 Mortgage Trust | 3.680% | 10/10/36 | 100 | 104 |
| 10 | Toronto-Dominion Bank | 2.250% | 3/15/21 | 30 | 30 |
| 6,10 | Trafigura Securitisation Finance plc 2017-1A | 2.470% | 12/15/20 | 890 | 888 |
| 6,9,10 | Trillium Credit Card Trust II 2016-1A | 1.958% | 5/26/21 | 760 | 762 |
| 6,10 | Trip Rail Master Funding LLC 2017-1A | 2.709% | 8/15/47 | 98 | 98 |
| 6 | UBS-Barclays Commercial Mortgage | | | | |
| | Trust 2013-C6 | 3.469% | 4/10/46 | 10 | 10 |
| 6 | Wells Fargo Commercial Mortgage | | | | |
| | Trust 2012-LC5 | 3.539% | 10/15/45 | 40 | 41 |
| 6 | Wells Fargo Commercial Mortgage | | | | |
| | Trust 2013-LC12 | 4.218% | 7/15/46 | 350 | 377 |
| 6 | Wells Fargo Commercial Mortgage | | | | |
| | Trust 2013-LC12 | 4.430% | 7/15/46 | 450 | 479 |
21
| | | | | |
| Core Bond Fund | | | | |
| |
| |
| |
| | | | | Face | Market |
| | | | Maturity | Amount | Value • |
| | | Coupon | Date | ($000) | ($000) |
| 6 | Wells Fargo Commercial Mortgage | | | | |
| | Trust 2015-C26 | 3.166% | 2/15/48 | 110 | 111 |
| 6 | Wells Fargo Commercial Mortgage | | | | |
| | Trust 2015-C27 | 3.190% | 2/15/48 | 388 | 391 |
| 6 | Wells Fargo Commercial Mortgage | | | | |
| | Trust 2015-C27 | 3.451% | 2/15/48 | 30 | 31 |
| 6 | Wells Fargo Commercial Mortgage | | | | |
| | Trust 2015-C29 | 3.637% | 6/15/48 | 30 | 31 |
| 6 | Wells Fargo Commercial Mortgage | | | | |
| | Trust 2015-C30 | 4.645% | 9/15/58 | 200 | 204 |
| 6 | Wells Fargo Commercial Mortgage | | | | |
| | Trust 2015-LC22 | 4.693% | 9/15/58 | 160 | 160 |
| 6 | Wells Fargo Commercial Mortgage | | | | |
| | Trust 2016-C37 | 3.794% | 12/15/49 | 70 | 74 |
| 6 | Wells Fargo Commercial Mortgage | | | | |
| | Trust 2017-C38 | 3.453% | 7/15/50 | 240 | 246 |
| 6 | Wells Fargo Commercial Mortgage | | | | |
| | Trust 2017-C39 | 3.418% | 9/15/50 | 240 | 245 |
| 6 | Wells Fargo Commercial Mortgage | | | | |
| | Trust 2017-RC1 | 3.631% | 1/15/60 | 80 | 83 |
| 6,10 Wendys Funding LLC 2015-1A | 3.371% | 6/15/45 | 20 | 20 |
| 6,10 Wendys Funding LLC 2015-1A | 4.080% | 6/15/45 | 56 | 57 |
| 6,10 Wendys Funding LLC 2015-1A | 4.497% | 6/15/45 | 49 | 50 |
| 10 | Westpac Banking Corp. | 2.250% | 11/9/20 | 365 | 365 |
| 10 | Westpac Banking Corp. | 2.100% | 2/25/21 | 40 | 40 |
| 6 | WFRBS Commercial Mortgage Trust 2013-C15 | 4.153% | 8/15/46 | 100 | 107 |
| 6 | WFRBS Commercial Mortgage Trust 2013-C18 | 4.162% | 12/15/46 | 20 | 22 |
| 6 | WFRBS Commercial Mortgage Trust 2014-C20 | 3.995% | 5/15/47 | 20 | 21 |
| 6 | WFRBS Commercial Mortgage Trust 2014-C21 | 3.410% | 8/15/47 | 10 | 10 |
| 6 | WFRBS Commercial Mortgage Trust 2014-C21 | 3.678% | 8/15/47 | 360 | 376 |
| 6 | WFRBS Commercial Mortgage Trust 2014-C24 | 3.607% | 11/15/47 | 380 | 393 |
| 6 | WFRBS Commercial Mortgage Trust 2014-LC14 | 4.045% | 3/15/47 | 410 | 437 |
| 6 | World Omni Auto Receivables Trust 2015-B | 2.150% | 8/15/22 | 175 | 175 |
| Total Asset-Backed/Commercial Mortgage-Backed Securities (Cost $67,733) | | 67,543 |
| Corporate Bonds (27.2%) | | | | |
| Finance (11.4%) | | | | |
| | Banking (6.1%) | | | | |
| | Bank of America Corp. | 3.300% | 1/11/23 | 306 | 313 |
| 6 | Bank of America Corp. | 3.124% | 1/20/23 | 565 | 574 |
| | Bank of America Corp. | 4.000% | 4/1/24 | 500 | 528 |
| | Bank of America Corp. | 3.875% | 8/1/25 | 400 | 420 |
| 6 | Bank of America Corp. | 3.093% | 10/1/25 | 2,105 | 2,093 |
| 6 | Bank of America Corp. | 3.824% | 1/20/28 | 540 | 553 |
| 10 | Bank of Tokyo-Mitsubishi UFJ Ltd. | 2.300% | 3/5/20 | 650 | 652 |
| 10 | Banque Federative du Credit Mutuel SA | 2.700% | 7/20/22 | 1,460 | 1,464 |
| 12,13BPCE SA | 2.990% | 4/24/20 | 1,500 | 1,189 |
| 12 | BPCE SA | 3.500% | 4/24/20 | 1,400 | 1,111 |
| | Citigroup Inc. | 1.800% | 2/5/18 | 300 | 300 |
| | Citigroup Inc. | 2.900% | 12/8/21 | 1,795 | 1,817 |
| | Citigroup Inc. | 3.200% | 10/21/26 | 800 | 783 |
| | Commonwealth Bank of Australia | 2.400% | 11/2/20 | 500 | 502 |
| 10 | Commonwealth Bank of Australia | 2.500% | 9/18/22 | 980 | 974 |
| 12,13Commonwealth Bank of Australia | 3.640% | 11/5/24 | 1,500 | 1,196 |
22
| | | | | |
| Core Bond Fund | | | | |
| |
| |
| |
| | | | | Face | Market |
| | | | Maturity | Amount | Value • |
| | | Coupon | Date | ($000) | ($000) |
| 10 | Commonwealth Bank of Australia | 4.500% | 12/9/25 | 700 | 730 |
| 10 | Commonwealth Bank of Australia | 3.150% | 9/19/27 | 1,065 | 1,053 |
| 12,13Cooperatieve Rabobank UA | 4.210% | 7/2/25 | 1,500 | 1,205 |
| | Cooperatieve Rabobank UA | 4.375% | 8/4/25 | 450 | 473 |
| 10 | Credit Suisse Group AG | 4.282% | 1/9/28 | 320 | 334 |
| | First Republic Bank | 2.375% | 6/17/19 | 510 | 509 |
| | First Republic Bank | 2.500% | 6/6/22 | 1,095 | 1,086 |
| | Goldman Sachs Group Inc. | 3.000% | 4/26/22 | 350 | 354 |
| 6 | Goldman Sachs Group Inc. | 2.908% | 6/5/23 | 965 | 963 |
| 14 | Goldman Sachs Group Inc. | 1.250% | 5/1/25 | 108 | 127 |
| | Goldman Sachs Group Inc. | 3.750% | 5/22/25 | 1,050 | 1,078 |
| 6 | Goldman Sachs Group Inc. | 3.272% | 9/29/25 | 2,065 | 2,062 |
| 6 | Goldman Sachs Group Inc. | 3.691% | 6/5/28 | 865 | 871 |
| | Goldman Sachs Group Inc. | 5.150% | 5/22/45 | 550 | 629 |
| | HSBC Holdings plc | 2.950% | 5/25/21 | 185 | 188 |
| 6 | HSBC Holdings plc | 3.262% | 3/13/23 | 2,135 | 2,178 |
| | HSBC Holdings plc | 3.900% | 5/25/26 | 700 | 732 |
| 6 | HSBC Holdings plc | 4.041% | 3/13/28 | 735 | 767 |
| 6 | HSBC Holdings plc | 6.000% | 11/22/65 | 360 | 376 |
| | ICICI Bank Ltd. | 4.000% | 3/18/26 | 250 | 254 |
| 10 | Intesa Sanpaolo SPA | 3.875% | 7/14/27 | 825 | 828 |
| | JPMorgan Chase & Co. | 2.295% | 8/15/21 | 1,495 | 1,490 |
| | JPMorgan Chase & Co. | 2.972% | 1/15/23 | 945 | 957 |
| 6 | JPMorgan Chase & Co. | 2.776% | 4/25/23 | 690 | 693 |
| | JPMorgan Chase & Co. | 2.700% | 5/18/23 | 182 | 181 |
| 6 | JPMorgan Chase & Co. | 3.220% | 3/1/25 | 550 | 557 |
| 6 | JPMorgan Chase & Co. | 3.782% | 2/1/28 | 480 | 491 |
| 6 | JPMorgan Chase & Co. | 3.882% | 7/24/38 | 535 | 537 |
| | JPMorgan Chase & Co. | 5.500% | 10/15/40 | 216 | 262 |
| | Lloyds Banking Group plc | 3.000% | 1/11/22 | 275 | 277 |
| | Lloyds Banking Group plc | 3.750% | 1/11/27 | 250 | 252 |
| 10 | Macquarie Bank Ltd. | 2.600% | 6/24/19 | 78 | 79 |
| | Manufacturers & Traders Trust Co. | 2.500% | 5/18/22 | 335 | 335 |
| | Manufacturers & Traders Trust Co. | 3.400% | 8/17/27 | 265 | 265 |
| 10 | Mitsubishi UFJ Trust & Banking Corp. | 2.450% | 10/16/19 | 285 | 287 |
| | Morgan Stanley | 2.625% | 11/17/21 | 2,365 | 2,365 |
| | Morgan Stanley | 2.750% | 5/19/22 | 570 | 572 |
| 15 | Morgan Stanley | 2.532% | 5/8/24 | 385 | 390 |
| 6 | Morgan Stanley | 3.971% | 7/22/38 | 500 | 503 |
| | PNC Bank NA | 2.550% | 12/9/21 | 340 | 341 |
| | Regions Financial Corp. | 2.750% | 8/14/22 | 570 | 569 |
| 10 | Santander Holdings USA Inc. | 3.700% | 3/28/22 | 1,555 | 1,582 |
| 10 | Santander Holdings USA Inc. | 4.400% | 7/13/27 | 280 | 285 |
| 6 | Skandinaviska Enskilda Banken AB | 5.750% | 12/31/49 | 200 | 206 |
| | Synchrony Bank | 3.000% | 6/15/22 | 770 | 766 |
| | Synchrony Financial | 4.500% | 7/23/25 | 1,650 | 1,715 |
| 10 | UBS Group Funding Jersey Ltd. | 3.000% | 4/15/21 | 1,095 | 1,107 |
| 10 | UBS Group Funding Jersey Ltd. | 2.650% | 2/1/22 | 300 | 299 |
| 6,10 UBS Group Funding Switzerland AG | 2.859% | 8/15/23 | 1,840 | 1,831 |
| | Wells Fargo & Co. | 2.625% | 7/22/22 | 1,010 | 1,010 |
| 6 | Wells Fargo & Co. | 3.584% | 5/22/28 | 435 | 440 |
| 12,13Westpac Banking Corp. | 3.770% | 3/14/24 | 1,500 | 1,192 |
| | Westpac Banking Corp. | 3.350% | 3/8/27 | 565 | 572 |
23
| | | | | |
| Core Bond Fund | | | | |
| |
| |
| |
| | | | | Face | Market |
| | | | Maturity | Amount | Value • |
| | | Coupon | Date | ($000) | ($000) |
| | Brokerage (0.2%) | | | | |
| 10 | Apollo Management Holdings LP | 4.000% | 5/30/24 | 500 | 510 |
| | Invesco Finance plc | 4.000% | 1/30/24 | 180 | 191 |
| | Jefferies Group LLC | 4.850% | 1/15/27 | 285 | 300 |
| | Stifel Financial Corp. | 4.250% | 7/18/24 | 215 | 219 |
| |
| | Finance Companies (0.4%) | | | | |
| | AerCap Ireland Capital DAC / AerCap Global | | | | |
| | Aviation Trust | 3.750% | 5/15/19 | 150 | 153 |
| | Air Lease Corp. | 2.125% | 1/15/18 | 2,110 | 2,114 |
| | Air Lease Corp. | 4.250% | 9/15/24 | 495 | 522 |
| | International Lease Finance Corp. | 4.625% | 4/15/21 | 1,000 | 1,062 |
| |
| | Insurance (2.6%) | | | | |
| 10 | AIA Group Ltd. | 3.200% | 3/11/25 | 1,650 | 1,651 |
| 6,14 Allianz SE | 2.241% | 7/7/45 | 100 | 121 |
| 6,14 Allianz SE | 3.375% | 9/29/49 | 300 | 384 |
| | American Financial Group Inc. | 3.500% | 8/15/26 | 275 | 275 |
| | American International Group Inc. | 3.750% | 7/10/25 | 350 | 362 |
| | Aon plc | 3.500% | 6/14/24 | 1,900 | 1,957 |
| | Aon plc | 4.750% | 5/15/45 | 300 | 328 |
| | Arch Capital Finance LLC | 4.011% | 12/15/26 | 265 | 272 |
| 10 | Brighthouse Financial Inc. | 3.700% | 6/22/27 | 765 | 748 |
| 10 | Brighthouse Financial Inc. | 4.700% | 6/22/47 | 50 | 49 |
| | Chubb INA Holdings Inc. | 2.700% | 3/13/23 | 225 | 225 |
| | CNA Financial Corp. | 3.450% | 8/15/27 | 65 | 64 |
| 6,14 Delta Lloyd NV | 4.375% | 6/29/49 | 125 | 159 |
| 6,14 Demeter Investments BV for Zurich Insurance | | | | |
| | Co. Ltd. | 3.500% | 10/1/46 | 697 | 911 |
| | Enstar Group Ltd. | 4.500% | 3/10/22 | 500 | 517 |
| | First American Financial Corp. | 4.600% | 11/15/24 | 290 | 298 |
| 10 | Five Corners Funding Trust | 4.419% | 11/15/23 | 828 | 891 |
| | Infinity Property & Casualty Corp. | 5.000% | 9/19/22 | 520 | 554 |
| | Marsh & McLennan Cos. Inc. | 2.350% | 9/10/19 | 180 | 181 |
| | Marsh & McLennan Cos. Inc. | 2.750% | 1/30/22 | 125 | 126 |
| | Marsh & McLennan Cos. Inc. | 3.500% | 6/3/24 | 1,000 | 1,030 |
| | Marsh & McLennan Cos. Inc. | 3.500% | 3/10/25 | 1,650 | 1,703 |
| 10 | MassMutual Global Funding II | 2.750% | 6/22/24 | 2,000 | 1,985 |
| | Prudential Financial Inc. | 4.500% | 11/15/20 | 20 | 21 |
| | Reinsurance Group of America Inc. | 3.950% | 9/15/26 | 2,095 | 2,126 |
| 10 | Reliance Standard Life Global Funding II | 2.375% | 5/4/20 | 240 | 240 |
| 10 | Sammons Financial Group Inc. | 4.450% | 5/12/27 | 1,675 | 1,713 |
| 10 | Swiss Re Treasury US Corp. | 2.875% | 12/6/22 | 130 | 130 |
| 10 | TIAA Asset Management Finance Co. LLC | 4.125% | 11/1/24 | 1,346 | 1,411 |
| | Trinity Acquisition plc | 4.625% | 8/15/23 | 350 | 371 |
| | Trinity Acquisition plc | 6.125% | 8/15/43 | 102 | 121 |
| | Willis North America Inc. | 3.600% | 5/15/24 | 550 | 563 |
| | XLIT Ltd. | 6.375% | 11/15/24 | 998 | 1,164 |
| 6,14 XLIT Ltd. | 3.250% | 6/29/47 | 566 | 656 |
| |
| | Other Finance (0.1%) | | | | |
| | ORIX Corp. | 3.700% | 7/18/27 | 730 | 732 |
24
| | | | | |
| Core Bond Fund | | | | |
| |
| |
| |
| | | | | Face | Market |
| | | | Maturity | Amount | Value • |
| | | Coupon | Date | ($000) | ($000) |
| | Real Estate Investment Trusts (2.0%) | | | | |
| | Brandywine Operating Partnership LP | 3.950% | 2/15/23 | 182 | 184 |
| | Brandywine Operating Partnership LP | 4.100% | 10/1/24 | 374 | 375 |
| | Brandywine Operating Partnership LP | 4.550% | 10/1/29 | 1,488 | 1,507 |
| | Brixmor Operating Partnership LP | 3.650% | 6/15/24 | 340 | 339 |
| | Brixmor Operating Partnership LP | 3.850% | 2/1/25 | 60 | 60 |
| | Brixmor Operating Partnership LP | 4.125% | 6/15/26 | 810 | 817 |
| | Brixmor Operating Partnership LP | 3.900% | 3/15/27 | 220 | 218 |
| | Camden Property Trust | 4.875% | 6/15/23 | 25 | 27 |
| | Camden Property Trust | 4.250% | 1/15/24 | 65 | 69 |
| | Camden Property Trust | 3.500% | 9/15/24 | 20 | 20 |
| | Columbia Property Trust Operating | | | | |
| | Partnership LP | 3.650% | 8/15/26 | 213 | 207 |
| | DDR Corp. | 3.900% | 8/15/24 | 420 | 422 |
| | DDR Corp. | 4.250% | 2/1/26 | 40 | 40 |
| | DDR Corp. | 4.700% | 6/1/27 | 145 | 149 |
| | Digital Realty Trust LP | 3.700% | 8/15/27 | 1,300 | 1,312 |
| 10 | Goodman Australia Industrial Fund | 3.400% | 9/30/26 | 500 | 491 |
| 10 | Goodman US Finance Three LLC | 3.700% | 3/15/28 | 420 | 418 |
| 10 | Goodman US Finance Three LLC | 4.500% | 10/15/37 | 455 | 456 |
| | HCP Inc. | 3.400% | 2/1/25 | 145 | 144 |
| | HCP Inc. | 4.000% | 6/1/25 | 200 | 206 |
| | Healthcare Trust of America Holdings LP | 3.700% | 4/15/23 | 759 | 778 |
| | Healthcare Trust of America Holdings LP | 3.500% | 8/1/26 | 200 | 196 |
| | Healthcare Trust of America Holdings LP | 3.750% | 7/1/27 | 545 | 543 |
| | Highwoods Realty LP | 3.875% | 3/1/27 | 500 | 502 |
| | Kilroy Realty LP | 4.375% | 10/1/25 | 1,925 | 2,014 |
| | Kilroy Realty LP | 4.250% | 8/15/29 | 105 | 107 |
| | Kimco Realty Corp. | 3.300% | 2/1/25 | 60 | 60 |
| | Kimco Realty Corp. | 4.450% | 9/1/47 | 70 | 70 |
| | Liberty Property LP | 4.400% | 2/15/24 | 1,250 | 1,330 |
| | Mid-America Apartments LP | 4.000% | 11/15/25 | 380 | 393 |
| | Omega Healthcare Investors Inc. | 4.750% | 1/15/28 | 935 | 942 |
| | Public Storage | 3.094% | 9/15/27 | 680 | 678 |
| 10 | Scentre Group Trust 1 / Scentre Group Trust 2 | 3.750% | 3/23/27 | 315 | 319 |
| | Tanger Properties LP | 3.125% | 9/1/26 | 915 | 859 |
| | Ventas Realty LP | 3.850% | 4/1/27 | 175 | 178 |
| | VEREIT Operating Partnership LP | 3.950% | 8/15/27 | 1,400 | 1,394 |
| | | | | | 100,608 |
| Industrial (13.6%) | | | | |
| | Basic Industry (0.6%) | | | | |
| | Agrium Inc. | 3.375% | 3/15/25 | 1,215 | 1,222 |
| | Agrium Inc. | 5.250% | 1/15/45 | 400 | 454 |
| 10 | Air Liquide Finance SA | 1.750% | 9/27/21 | 200 | 195 |
| 10 | CF Industries Inc. | 3.400% | 12/1/21 | 110 | 112 |
| 10 | CF Industries Inc. | 4.500% | 12/1/26 | 230 | 240 |
| 12 | Glencore Australia Holdings Pty Ltd. | 4.500% | 9/19/19 | 1,550 | 1,244 |
| | Potash Corp. of Saskatchewan Inc. | 3.250% | 12/1/17 | 100 | 100 |
| | Potash Corp. of Saskatchewan Inc. | 6.500% | 5/15/19 | 100 | 107 |
| | Potash Corp. of Saskatchewan Inc. | 3.625% | 3/15/24 | 230 | 234 |
| | Potash Corp. of Saskatchewan Inc. | 3.000% | 4/1/25 | 10 | 10 |
| | Potash Corp. of Saskatchewan Inc. | 4.000% | 12/15/26 | 300 | 312 |
| | Vale Overseas Ltd. | 5.875% | 6/10/21 | 95 | 105 |
| | Vale Overseas Ltd. | 6.875% | 11/21/36 | 400 | 460 |
25
| | | | | |
| Core Bond Fund | | | | |
| |
| |
| |
| | | | | Face | Market |
| | | | Maturity | Amount | Value • |
| | | Coupon | Date | ($000) | ($000) |
| | WestRock RKT Co. | 4.900% | 3/1/22 | 35 | 38 |
| | WestRock RKT Co. | 4.000% | 3/1/23 | 405 | 426 |
| |
| | Capital Goods (0.6%) | | | | |
| 14 | General Electric Co. | 2.125% | 5/17/37 | 500 | 586 |
| | Hubbell Inc. | 3.150% | 8/15/27 | 355 | 355 |
| 10 | LafargeHolcim Finance US LLC | 3.500% | 9/22/26 | 2,500 | 2,463 |
| 16 | Leonardo SPA | 8.000% | 12/16/19 | 150 | 229 |
| 14 | Leonardo SPA | 4.500% | 1/19/21 | 159 | 212 |
| 14 | Leonardo SPA | 5.250% | 1/21/22 | 50 | 70 |
| 14 | Parker-Hannifin Corp. | 1.125% | 3/1/25 | 100 | 119 |
| | Spirit AeroSystems Inc. | 3.850% | 6/15/26 | 235 | 235 |
| | Textron Inc. | 3.650% | 3/15/27 | 233 | 234 |
| | United Rentals North America Inc. | 4.625% | 7/15/23 | 285 | 297 |
| | United Rentals North America Inc. | 5.500% | 5/15/27 | 105 | 112 |
| |
| | Communication (3.3%) | | | | |
| | AMC Networks Inc. | 5.000% | 4/1/24 | 300 | 310 |
| | AMC Networks Inc. | 4.750% | 8/1/25 | 335 | 337 |
| | AT&T Inc. | 4.450% | 4/1/24 | 500 | 531 |
| | AT&T Inc. | 4.125% | 2/17/26 | 2,625 | 2,694 |
| | AT&T Inc. | 4.250% | 3/1/27 | 450 | 463 |
| | AT&T Inc. | 3.900% | 8/14/27 | 1,535 | 1,537 |
| 14 | AT&T Inc. | 3.150% | 9/4/36 | 200 | 238 |
| | AT&T Inc. | 5.250% | 3/1/37 | 300 | 315 |
| 16 | AT&T Inc. | 3.550% | 9/14/37 | 205 | 262 |
| | AT&T Inc. | 5.350% | 9/1/40 | 200 | 209 |
| | AT&T Inc. | 4.800% | 6/15/44 | 600 | 583 |
| | AT&T Inc. | 5.150% | 2/14/50 | 285 | 287 |
| | CBS Corp. | 3.700% | 8/15/24 | 1,600 | 1,641 |
| | CBS Corp. | 3.500% | 1/15/25 | 400 | 406 |
| | Charter Communications Operating LLC / | | | | |
| | Charter Communications Operating Capital | 4.464% | 7/23/22 | 2,240 | 2,362 |
| | Charter Communications Operating LLC / | | | | |
| | Charter Communications Operating Capital | 4.908% | 7/23/25 | 950 | 1,014 |
| | Charter Communications Operating LLC / | | | | |
| | Charter Communications Operating Capital | 6.384% | 10/23/35 | 200 | 233 |
| 10 | Charter Communications Operating LLC / | | | | |
| | Charter Communications Operating Capital | 5.375% | 5/1/47 | 500 | 517 |
| | Comcast Corp. | 3.000% | 2/1/24 | 925 | 936 |
| | Comcast Corp. | 3.375% | 8/15/25 | 200 | 205 |
| | Comcast Corp. | 2.350% | 1/15/27 | 600 | 559 |
| | Comcast Corp. | 3.150% | 2/15/28 | 400 | 397 |
| | Comcast Corp. | 5.650% | 6/15/35 | 700 | 853 |
| | Comcast Corp. | 4.750% | 3/1/44 | 500 | 559 |
| | Crown Castle International Corp. | 2.250% | 9/1/21 | 1,000 | 988 |
| | Crown Castle International Corp. | 5.250% | 1/15/23 | 600 | 663 |
| | Crown Castle International Corp. | 4.000% | 3/1/27 | 270 | 277 |
| | Crown Castle International Corp. | 3.650% | 9/1/27 | 220 | 220 |
| | Discovery Communications LLC | 3.800% | 3/13/24 | 600 | 618 |
| | Discovery Communications LLC | 4.900% | 3/11/26 | 700 | 747 |
| | NBCUniversal Media LLC | 2.875% | 1/15/23 | 1,760 | 1,784 |
| | Qwest Corp. | 7.250% | 9/15/25 | 200 | 220 |
| | Scripps Networks Interactive Inc. | 3.900% | 11/15/24 | 250 | 255 |
26
| | | | | |
| Core Bond Fund | | | | |
| |
| |
| |
| | | | | Face | Market |
| | | | Maturity | Amount | Value • |
| | | Coupon | Date | ($000) | ($000) |
| 10 | Telstra Corp. Ltd. | 3.125% | 4/7/25 | 75 | 75 |
| | Time Warner Cable LLC | 5.500% | 9/1/41 | 120 | 125 |
| | Verizon Communications Inc. | 5.150% | 9/15/23 | 420 | 471 |
| | Verizon Communications Inc. | 4.150% | 3/15/24 | 90 | 95 |
| | Verizon Communications Inc. | 4.125% | 3/16/27 | 2,574 | 2,685 |
| | Verizon Communications Inc. | 4.400% | 11/1/34 | 450 | 452 |
| | Verizon Communications Inc. | 3.850% | 11/1/42 | 950 | 836 |
| | Verizon Communications Inc. | 4.522% | 9/15/48 | 425 | 411 |
| | Verizon Communications Inc. | 5.012% | 8/21/54 | 525 | 525 |
| | Viacom Inc. | 4.375% | 3/15/43 | 500 | 431 |
| |
| | Consumer Cyclical (1.2%) | | | | |
| 10 | Alimentation Couche-Tard Inc. | 3.550% | 7/26/27 | 550 | 555 |
| 10 | Alimentation Couche-Tard Inc. | 4.500% | 7/26/47 | 500 | 517 |
| | Ford Motor Co. | 4.750% | 1/15/43 | 420 | 409 |
| | Ford Motor Co. | 5.291% | 12/8/46 | 850 | 884 |
| | Ford Motor Credit Co. LLC | 3.336% | 3/18/21 | 1,520 | 1,549 |
| | General Motors Co. | 4.000% | 4/1/25 | 240 | 243 |
| | General Motors Co. | 4.200% | 10/1/27 | 280 | 284 |
| | General Motors Co. | 6.600% | 4/1/36 | 300 | 356 |
| | General Motors Co. | 5.150% | 4/1/38 | 700 | 713 |
| | General Motors Co. | 5.200% | 4/1/45 | 850 | 853 |
| | General Motors Financial Co. Inc. | 4.200% | 3/1/21 | 300 | 314 |
| | General Motors Financial Co. Inc. | 4.375% | 9/25/21 | 510 | 541 |
| | General Motors Financial Co. Inc. | 5.250% | 3/1/26 | 650 | 705 |
| 10 | Harley-Davidson Financial Services Inc. | 2.150% | 2/26/20 | 300 | 299 |
| 10 | Hyundai Capital America | 3.100% | 4/5/22 | 220 | 218 |
| 16 | Jaguar Land Rover Automotive plc | 5.000% | 2/15/22 | 200 | 294 |
| 16 | Jaguar Land Rover Automotive plc | 3.875% | 3/1/23 | 100 | 141 |
| 14 | Jaguar Land Rover Automotive plc | 2.200% | 1/15/24 | 100 | 119 |
| | Kohl’s Corp. | 5.550% | 7/17/45 | 100 | 96 |
| | Lowe’s Cos. Inc. | 3.100% | 5/3/27 | 245 | 244 |
| | Lowe’s Cos. Inc. | 4.375% | 9/15/45 | 150 | 159 |
| | Lowe’s Cos. Inc. | 3.700% | 4/15/46 | 300 | 291 |
| | Lowe’s Cos. Inc. | 4.050% | 5/3/47 | 200 | 205 |
| | Walgreens Boots Alliance Inc. | 3.800% | 11/18/24 | 440 | 455 |
| | Walgreens Boots Alliance Inc. | 4.650% | 6/1/46 | 500 | 520 |
| |
| | Consumer Noncyclical (2.3%) | | | | |
| | Abbott Laboratories | 4.750% | 11/30/36 | 500 | 549 |
| | Abbott Laboratories | 4.900% | 11/30/46 | 600 | 669 |
| | Anheuser-Busch InBev Finance Inc. | 3.650% | 2/1/26 | 300 | 310 |
| | Anheuser-Busch InBev Finance Inc. | 4.700% | 2/1/36 | 1,650 | 1,817 |
| | Anheuser-Busch InBev Finance Inc. | 4.900% | 2/1/46 | 650 | 740 |
| | Becton Dickinson & Co. | 3.734% | 12/15/24 | 200 | 205 |
| | Becton Dickinson & Co. | 3.700% | 6/6/27 | 750 | 758 |
| | Biogen Inc. | 4.050% | 9/15/25 | 990 | 1,056 |
| | Constellation Brands Inc. | 3.750% | 5/1/21 | 800 | 834 |
| | Express Scripts Holding Co. | 3.900% | 2/15/22 | 200 | 210 |
| | Express Scripts Holding Co. | 4.500% | 2/25/26 | 910 | 973 |
| | Express Scripts Holding Co. | 4.800% | 7/15/46 | 300 | 317 |
| 14 | Fresenius SE & Co. KGaA | 4.000% | 2/1/24 | 300 | 414 |
| 14 | Fresenius SE & Co. KGaA | 3.000% | 1/30/32 | 500 | 625 |
| | Gilead Sciences Inc. | 5.650% | 12/1/41 | 610 | 757 |
27
| | | | | |
| Core Bond Fund | | | | |
| |
| |
| |
| | | | | Face | Market |
| | | | Maturity | Amount | Value • |
| | | Coupon | Date | ($000) | ($000) |
| 16 | McKesson Corp. | 3.125% | 2/17/29 | 350 | 472 |
| | Mead Johnson Nutrition Co. | 3.000% | 11/15/20 | 450 | 462 |
| | Medtronic Inc. | 4.375% | 3/15/35 | 150 | 165 |
| | Medtronic Inc. | 5.550% | 3/15/40 | 240 | 297 |
| | Newell Brands Inc. | 5.500% | 4/1/46 | 180 | 213 |
| | Perrigo Finance Unlimited Co. | 4.900% | 12/15/44 | 881 | 891 |
| | Quest Diagnostics Inc. | 3.450% | 6/1/26 | 100 | 101 |
| 10 | Reckitt Benckiser Treasury Services plc | 2.750% | 6/26/24 | 650 | 644 |
| | Reynolds American Inc. | 5.700% | 8/15/35 | 400 | 467 |
| | Reynolds American Inc. | 7.250% | 6/15/37 | 625 | 845 |
| | Reynolds American Inc. | 5.850% | 8/15/45 | 150 | 181 |
| | Teva Pharmaceutical Finance Co. LLC | 6.150% | 2/1/36 | 442 | 477 |
| 14 | Teva Pharmaceutical Finance Netherlands II BV | 1.250% | 3/31/23 | 100 | 115 |
| 14 | Teva Pharmaceutical Finance Netherlands II BV | 1.625% | 10/15/28 | 100 | 105 |
| | Teva Pharmaceutical Finance Netherlands III BV | 2.800% | 7/21/23 | 3,360 | 3,203 |
| | The Kroger Co. | 2.800% | 8/1/22 | 700 | 700 |
| | The Kroger Co. | 3.700% | 8/1/27 | 175 | 172 |
| | Thermo Fisher Scientific Inc. | 3.650% | 12/15/25 | 500 | 518 |
| | Tyson Foods Inc. | 4.875% | 8/15/34 | 150 | 166 |
| |
| | Energy (3.1%) | | | | |
| | Anadarko Petroleum Corp. | 3.450% | 7/15/24 | 550 | 544 |
| | Anadarko Petroleum Corp. | 5.550% | 3/15/26 | 750 | 836 |
| | Anadarko Petroleum Corp. | 6.600% | 3/15/46 | 300 | 368 |
| 10 | Andeavor | 4.750% | 12/15/23 | 1,000 | 1,077 |
| | Apache Corp. | 5.100% | 9/1/40 | 100 | 105 |
| 10 | APT Pipelines Ltd. | 4.250% | 7/15/27 | 160 | 165 |
| | Boardwalk Pipelines LP | 4.450% | 7/15/27 | 225 | 229 |
| | BP Capital Markets plc | 2.315% | 2/13/20 | 110 | 111 |
| | BP Capital Markets plc | 2.112% | 9/16/21 | 100 | 99 |
| | BP Capital Markets plc | 3.245% | 5/6/22 | 600 | 621 |
| | BP Capital Markets plc | 2.750% | 5/10/23 | 450 | 449 |
| | BP Capital Markets plc | 3.535% | 11/4/24 | 1,125 | 1,164 |
| | BP Capital Markets plc | 3.506% | 3/17/25 | 175 | 180 |
| | BP Capital Markets plc | 3.279% | 9/19/27 | 615 | 613 |
| 10 | Cenovus Energy Inc. | 4.250% | 4/15/27 | 1,000 | 992 |
| | Cenovus Energy Inc. | 4.450% | 9/15/42 | 500 | 432 |
| | Cimarex Energy Co. | 3.900% | 5/15/27 | 900 | 915 |
| | Columbia Pipeline Group Inc. | 4.500% | 6/1/25 | 240 | 257 |
| | ConocoPhillips Co. | 4.200% | 3/15/21 | 300 | 319 |
| | ConocoPhillips Co. | 4.950% | 3/15/26 | 975 | 1,098 |
| | ConocoPhillips Co. | 5.950% | 3/15/46 | 180 | 233 |
| | Devon Energy Corp. | 4.000% | 7/15/21 | 200 | 207 |
| | Devon Energy Corp. | 3.250% | 5/15/22 | 300 | 304 |
| | Devon Energy Corp. | 5.600% | 7/15/41 | 500 | 547 |
| | Energy Transfer LP | 6.700% | 7/1/18 | 230 | 238 |
| | Energy Transfer LP | 9.700% | 3/15/19 | 260 | 287 |
| | Energy Transfer LP | 5.200% | 2/1/22 | 642 | 694 |
| | Energy Transfer LP | 4.750% | 1/15/26 | 500 | 525 |
| | EnLink Midstream Partners LP | 4.850% | 7/15/26 | 200 | 210 |
| | Enterprise Products Operating LLC | 6.650% | 10/15/34 | 180 | 224 |
| | Hess Corp. | 4.300% | 4/1/27 | 200 | 198 |
| | Hess Corp. | 5.800% | 4/1/47 | 150 | 154 |
| | Kinder Morgan Inc. | 7.800% | 8/1/31 | 70 | 89 |
28
| | | | | |
| Core Bond Fund | | | | |
| |
| |
| |
| | | | | Face | Market |
| | | | Maturity | Amount | Value • |
| | | Coupon | Date | ($000) | ($000) |
| | Kinder Morgan Inc. | 7.750% | 1/15/32 | 95 | 122 |
| | Marathon Oil Corp. | 2.800% | 11/1/22 | 150 | 146 |
| | Marathon Oil Corp. | 3.850% | 6/1/25 | 900 | 897 |
| | Marathon Oil Corp. | 4.400% | 7/15/27 | 280 | 284 |
| | Marathon Oil Corp. | 5.200% | 6/1/45 | 200 | 201 |
| | MPLX LP | 4.500% | 7/15/23 | 360 | 382 |
| | MPLX LP | 4.875% | 12/1/24 | 600 | 647 |
| | National Oilwell Varco Inc. | 3.950% | 12/1/42 | 1,200 | 1,004 |
| | Plains All American Pipeline LP / | | | | |
| | PAA Finance Corp. | 6.500% | 5/1/18 | 150 | 154 |
| | Regency Energy Partners LP / | | | | |
| | Regency Energy Finance Corp. | 5.000% | 10/1/22 | 1,600 | 1,730 |
| | Sabine Pass Liquefaction LLC | 5.625% | 4/15/23 | 535 | 594 |
| | Sabine Pass Liquefaction LLC | 5.750% | 5/15/24 | 315 | 351 |
| | Sabine Pass Liquefaction LLC | 5.625% | 3/1/25 | 400 | 441 |
| | Sabine Pass Liquefaction LLC | 5.875% | 6/30/26 | 330 | 369 |
| | Shell International Finance BV | 2.250% | 1/6/23 | 210 | 208 |
| | Shell International Finance BV | 3.250% | 5/11/25 | 350 | 358 |
| | Shell International Finance BV | 2.875% | 5/10/26 | 500 | 497 |
| | Shell International Finance BV | 4.125% | 5/11/35 | 500 | 528 |
| | Shell International Finance BV | 3.625% | 8/21/42 | 150 | 144 |
| | Shell International Finance BV | 4.000% | 5/10/46 | 300 | 304 |
| | Spectra Energy Partners LP | 4.750% | 3/15/24 | 150 | 163 |
| | Spectra Energy Partners LP | 3.500% | 3/15/25 | 180 | 181 |
| | Sunoco Logistics Partners Operations LP | 3.450% | 1/15/23 | 350 | 349 |
| | Tennessee Gas Pipeline Co. LLC | 7.000% | 10/15/28 | 700 | 840 |
| | Tennessee Gas Pipeline Co. LLC | 7.625% | 4/1/37 | 90 | 115 |
| | Valero Energy Partners LP | 4.375% | 12/15/26 | 165 | 170 |
| | Williams Partners LP | 4.125% | 11/15/20 | 180 | 189 |
| | Williams Partners LP | 3.900% | 1/15/25 | 817 | 832 |
| | Williams Partners LP | 4.000% | 9/15/25 | 270 | 276 |
| |
| | Technology (1.5%) | | | | |
| | Apple Inc. | 3.850% | 5/4/43 | 860 | 867 |
| | Apple Inc. | 3.450% | 2/9/45 | 170 | 161 |
| 10 | Broadcom Corp. / Broadcom Cayman | | | | |
| | Finance Ltd. | 3.000% | 1/15/22 | 1,000 | 1,017 |
| 10 | Broadcom Corp. / Broadcom Cayman | | | | |
| | Finance Ltd. | 3.625% | 1/15/24 | 250 | 257 |
| 10 | Broadcom Corp. / Broadcom Cayman | | | | |
| | Finance Ltd. | 3.875% | 1/15/27 | 250 | 257 |
| | CA Inc. | 3.600% | 8/1/20 | 20 | 21 |
| | CA Inc. | 3.600% | 8/15/22 | 60 | 61 |
| | CA Inc. | 4.700% | 3/15/27 | 45 | 46 |
| 10 | Diamond 1 Finance Corp. / Diamond 2 | | | | |
| | Finance Corp. | 4.420% | 6/15/21 | 590 | 619 |
| 10 | Diamond 1 Finance Corp. / Diamond 2 | | | | |
| | Finance Corp. | 5.450% | 6/15/23 | 570 | 622 |
| 10 | Diamond 1 Finance Corp. / Diamond 2 | | | | |
| | Finance Corp. | 6.020% | 6/15/26 | 910 | 1,008 |
| 10 | Diamond 1 Finance Corp. / Diamond 2 | | | | |
| | Finance Corp. | 8.100% | 7/15/36 | 1,000 | 1,253 |
| | DXC Technology Co. | 4.250% | 4/15/24 | 240 | 253 |
| | DXC Technology Co. | 4.750% | 4/15/27 | 225 | 241 |
29
| | | | | |
| Core Bond Fund | | | | |
| |
| |
| |
| | | | | Face | Market |
| | | | Maturity | Amount | Value • |
| | | Coupon | Date | ($000) | ($000) |
| | Equifax Inc. | 2.300% | 6/1/21 | 10 | 10 |
| | Equifax Inc. | 3.300% | 12/15/22 | 45 | 45 |
| 16 | Fidelity National Information Services Inc. | 1.700% | 6/30/22 | 100 | 133 |
| | Hewlett Packard Enterprise Co. | 4.900% | 10/15/25 | 500 | 529 |
| | Hewlett Packard Enterprise Co. | 6.350% | 10/15/45 | 1,300 | 1,378 |
| | QUALCOMM Inc. | 2.600% | 1/30/23 | 330 | 331 |
| | QUALCOMM Inc. | 2.900% | 5/20/24 | 540 | 542 |
| | QUALCOMM Inc. | 3.250% | 5/20/27 | 540 | 544 |
| 10 | Seagate HDD Cayman | 4.875% | 3/1/24 | 335 | 330 |
| | Tyco Electronics Group SA | 4.875% | 1/15/21 | 65 | 70 |
| | Tyco Electronics Group SA | 3.500% | 2/3/22 | 90 | 93 |
| | Tyco Electronics Group SA | 3.450% | 8/1/24 | 15 | 15 |
| | Tyco Electronics Group SA | 3.125% | 8/15/27 | 335 | 331 |
| | Tyco Electronics Group SA | 7.125% | 10/1/37 | 120 | 168 |
| | Verisk Analytics Inc. | 5.800% | 5/1/21 | 84 | 93 |
| | Verisk Analytics Inc. | 4.000% | 6/15/25 | 300 | 312 |
| | Verisk Analytics Inc. | 5.500% | 6/15/45 | 750 | 845 |
| | VMware Inc. | 2.950% | 8/21/22 | 280 | 281 |
| | VMware Inc. | 3.900% | 8/21/27 | 840 | 849 |
| |
| | Transportation (1.0%) | | | | |
| 10 | Adani Ports & Special Economic Zone Ltd. | 4.000% | 7/30/27 | 200 | 199 |
| 10 | Air Canada | 7.750% | 4/15/21 | 653 | 745 |
| 6 | American Airlines 2016-3 Class B Pass | | | | |
| | Through Trust | 3.750% | 10/15/25 | 840 | 844 |
| 6 | American Airlines 2017-2B Class B Pass | | | | |
| | Through Trust | 3.700% | 10/15/25 | 885 | 883 |
| 12 | Asciano Finance Ltd. | 5.250% | 5/19/25 | 110 | 89 |
| 6 | Continental Airlines 2005-ERJ1 Pass | | | | |
| | Through Trust | 9.798% | 10/1/22 | 225 | 247 |
| | Continental Airlines 2012-3 Class C Pass | | | | |
| | Thru Certificates | 6.125% | 4/29/18 | 110 | 112 |
| 6,17 Delta Air Lines 2002-1 Class G-1 Pass | | | | |
| | Through Trust | 6.718% | 7/2/24 | 55 | 62 |
| 6 | Delta Air Lines 2007-1 Class A Pass | | | | |
| | Through Trust | 6.821% | 2/10/24 | 889 | 1,024 |
| 6 | Delta Air Lines 2007-1 Class B Pass | | | | |
| | Through Trust | 8.021% | 8/10/22 | 57 | 65 |
| | Delta Air Lines Inc. | 3.625% | 3/15/22 | 990 | 1,014 |
| | Kansas City Southern | 3.125% | 6/1/26 | 230 | 223 |
| | Kansas City Southern | 4.300% | 5/15/43 | 650 | 651 |
| 12 | Qantas Airways Ltd. | 7.500% | 6/11/21 | 1,000 | 886 |
| | Southwest Airlines Co. | 7.375% | 3/1/27 | 135 | 175 |
| 6 | UAL 2007-1 Pass Through Trust | 6.636% | 7/2/22 | 1,536 | 1,666 |
| 6 | US Airways 2001-1C Pass Through Trust | 7.346% | 9/20/23 | 46 | 50 |
| | | | | | 120,366 |
| Utilities (2.2%) | | | | |
| | Electric (1.8%) | | | | |
| | AEP Transmission Co. LLC | 3.100% | 12/1/26 | 165 | 165 |
| 10 | Cerro del Aguila SA | 4.125% | 8/16/27 | 300 | 299 |
| | Cleco Corporate Holdings LLC | 4.973% | 5/1/46 | 250 | 269 |
| | Commonwealth Edison Co. | 6.450% | 1/15/38 | 223 | 301 |
| | Duke Energy Corp. | 2.650% | 9/1/26 | 35 | 33 |
| | Duke Energy Corp. | 3.150% | 8/15/27 | 1,075 | 1,064 |
30
| | | | | |
| Core Bond Fund | | | | |
| |
| |
| |
| | | | | Face | Market |
| | | | Maturity | Amount | Value • |
| | | Coupon | Date | ($000) | ($000) |
| 10 | EDP Finance BV | 4.125% | 1/15/20 | 1,400 | 1,452 |
| 10 | EDP Finance BV | 5.250% | 1/14/21 | 1,600 | 1,727 |
| 16 | EDP Finance BV | 8.625% | 1/4/24 | 50 | 90 |
| 10 | EDP Finance BV | 3.625% | 7/15/24 | 600 | 607 |
| | Emera US Finance LP | 4.750% | 6/15/46 | 700 | 753 |
| 10 | Enel Finance International NV | 2.875% | 5/25/22 | 600 | 602 |
| 10 | Enel Finance International NV | 3.625% | 5/25/27 | 60 | 60 |
| 10 | Enel Finance International NV | 4.750% | 5/25/47 | 555 | 590 |
| | Entergy Arkansas Inc. | 3.500% | 4/1/26 | 1,000 | 1,027 |
| | Entergy Louisiana LLC | 3.120% | 9/1/27 | 175 | 176 |
| | Entergy Louisiana LLC | 4.950% | 1/15/45 | 300 | 310 |
| | Exelon Corp. | 3.950% | 6/15/25 | 550 | 573 |
| | FirstEnergy Corp. | 3.900% | 7/15/27 | 660 | 670 |
| 10 | FirstEnergy Transmission LLC | 4.350% | 1/15/25 | 550 | 582 |
| | Fortis Inc. | 3.055% | 10/4/26 | 725 | 704 |
| | Georgia Power Co. | 3.250% | 3/30/27 | 505 | 504 |
| | Georgia Power Co. | 5.950% | 2/1/39 | 400 | 497 |
| | MidAmerican Energy Co. | 5.800% | 10/15/36 | 230 | 291 |
| | PacifiCorp | 5.250% | 6/15/35 | 275 | 326 |
| | PacifiCorp | 6.100% | 8/1/36 | 200 | 261 |
| | PacifiCorp | 6.000% | 1/15/39 | 325 | 425 |
| | PPL Capital Funding Inc. | 3.100% | 5/15/26 | 850 | 835 |
| | Puget Energy Inc. | 3.650% | 5/15/25 | 350 | 354 |
| | Puget Sound Energy Inc. | 6.274% | 3/15/37 | 100 | 131 |
| | South Carolina Electric & Gas Co. | 6.050% | 1/15/38 | 100 | 127 |
| | South Carolina Electric & Gas Co. | 4.350% | 2/1/42 | 150 | 155 |
| 6 | Southern Co. | 5.500% | 3/15/57 | 140 | 148 |
| | Southwestern Public Service Co. | 4.500% | 8/15/41 | 210 | 231 |
| |
| | Natural Gas (0.3%) | | | | |
| | CenterPoint Energy Resources Corp. | 5.850% | 1/15/41 | 435 | 535 |
| 10 | Centrica plc | 4.000% | 10/16/23 | 490 | 507 |
| | Sempra Energy | 3.250% | 6/15/27 | 500 | 493 |
| | Southwest Gas Corp. | 3.800% | 9/29/46 | 885 | 842 |
| |
| | Other Utility (0.1%) | | | | |
| | American Water Capital Corp. | 6.593% | 10/15/37 | 118 | 162 |
| | American Water Capital Corp. | 3.750% | 9/1/47 | 710 | 711 |
| | | | | | 19,589 |
| Total Corporate Bonds (Cost $237,589) | | | | 240,563 |
| Sovereign Bonds (3.5%) | | | | |
| | Arab Republic of Egypt | 8.500% | 1/31/47 | 200 | 223 |
| 14 | Banque Centrale de Tunisie SA | 5.625% | 2/17/24 | 220 | 268 |
| 10 | Banque Ouest Africaine de Developpement | 5.000% | 7/27/27 | 200 | 206 |
| | Bermuda | 4.854% | 2/6/24 | 320 | 350 |
| | BOC Aviation Ltd. | 3.875% | 5/9/19 | 200 | 204 |
| 10 | CDP Financial Inc. | 4.400% | 11/25/19 | 600 | 631 |
| | Corp. Andina de Fomento | 2.125% | 9/27/21 | 750 | 744 |
| 10 | CPPIB Capital Inc. | 1.250% | 9/20/19 | 200 | 198 |
| | Electricite de France SA | 3.625% | 10/13/25 | 600 | 617 |
| 10 | Empresa Nacional del Petroleo | 4.500% | 9/14/47 | 200 | 192 |
| | Export-Import Bank of Korea | 2.250% | 1/21/20 | 1,200 | 1,194 |
| | Export-Import Bank of Korea | 5.125% | 6/29/20 | 500 | 533 |
31
| | | | | |
| Core Bond Fund | | | | |
| |
| |
| |
| | | | | Face | Market |
| | | | Maturity | Amount | Value • |
| | | Coupon | Date | ($000) | ($000) |
| 10 | ICBCIL Finance Co. Ltd. | 2.375% | 5/19/19 | 300 | 298 |
| | Kingdom of Saudi Arabia | 4.625% | 10/4/47 | 600 | 602 |
| | KSA Sukuk Ltd. | 2.894% | 4/20/22 | 1,000 | 1,005 |
| | Nexen Energy ULC | 6.400% | 5/15/37 | 300 | 385 |
| 10 | NongHyup Bank | 1.875% | 9/12/21 | 500 | 481 |
| 10 | Ontario Teachers’ Cadillac Fairview | | | | |
| | Properties Trust | 3.125% | 3/20/22 | 200 | 204 |
| 10 | Ontario Teachers’ Cadillac Fairview | | | | |
| | Properties Trust | 3.875% | 3/20/27 | 200 | 206 |
| | Petrobras Global Finance BV | 7.375% | 1/17/27 | 245 | 270 |
| | Petrobras Global Finance BV | 5.999% | 1/27/28 | 642 | 642 |
| | Petroleos Mexicanos | 5.500% | 2/4/19 | 470 | 489 |
| | Petroleos Mexicanos | 5.500% | 1/21/21 | 4,250 | 4,538 |
| | Petroleos Mexicanos | 4.875% | 1/24/22 | 370 | 386 |
| 10 | Petroleos Mexicanos | 6.750% | 9/21/47 | 260 | 275 |
| 10 | Province of Alberta | 2.050% | 8/17/26 | 500 | 470 |
| | Province of Ontario | 1.625% | 1/18/19 | 1,000 | 995 |
| | Province of Ontario | 2.000% | 1/30/19 | 500 | 500 |
| | Province of Ontario | 2.500% | 4/27/26 | 50 | 49 |
| | Province of Quebec | 7.125% | 2/9/24 | 200 | 247 |
| | Province of Quebec | 7.500% | 9/15/29 | 75 | 107 |
| | Republic of Colombia | 4.000% | 2/26/24 | 235 | 245 |
| 6 | Republic of Colombia | 3.875% | 4/25/27 | 275 | 279 |
| | Republic of Colombia | 10.375% | 1/28/33 | 250 | 388 |
| 6 | Republic of Colombia | 5.000% | 6/15/45 | 420 | 433 |
| | Republic of Hungary | 6.250% | 1/29/20 | 1,200 | 1,308 |
| 14 | Republic of Indonesia | 3.750% | 6/14/28 | 200 | 264 |
| | Republic of Lithuania | 7.375% | 2/11/20 | 600 | 672 |
| | Republic of Lithuania | 6.125% | 3/9/21 | 365 | 409 |
| 6 | Republic of Panama | 4.000% | 9/22/24 | 600 | 639 |
| | Republic of Panama | 8.125% | 4/28/34 | 150 | 204 |
| | Republic of Poland | 5.125% | 4/21/21 | 615 | 674 |
| | Republic of Poland | 5.000% | 3/23/22 | 70 | 78 |
| | Republic of Turkey | 5.750% | 3/22/24 | 400 | 425 |
| | Republic of Turkey | 5.750% | 5/11/47 | 691 | 680 |
| | State of Israel | 4.500% | 1/30/43 | 200 | 217 |
| | State of Qatar | 5.250% | 1/20/20 | 2,000 | 2,121 |
| | Statoil ASA | 2.450% | 1/17/23 | 600 | 598 |
| | Sultanate of Oman | 5.375% | 3/8/27 | 200 | 205 |
| | Ukraine | 7.375% | 9/25/32 | 225 | 219 |
| | United Mexican States | 4.000% | 10/2/23 | 2,398 | 2,534 |
| | United Mexican States | 6.050% | 1/11/40 | 500 | 600 |
| | YPF SA | 8.875% | 12/19/18 | 600 | 641 |
| Total Sovereign Bonds (Cost $30,872) | | | | 31,342 |
| Taxable Municipal Bonds (0.2%) | | | | |
| | California GO | 7.550% | 4/1/39 | 500 | 769 |
| | Wisconsin Annual Appropriation Revenue | 3.954% | 5/1/36 | 500 | 514 |
| Total Taxable Municipal Bonds (Cost $1,246) | | | | 1,283 |
32
| | | | | |
| Core Bond Fund | | | | | |
| |
| |
| |
| | | | | | Market |
| | | | | | Value• |
| | | | Coupon | Shares | ($000) |
| Temporary Cash Investment (5.6%) | | | | |
| Money Market Fund (5.6%) | | | | | |
| 18 Vanguard Market Liquidity Fund (Cost $49,628) | 1.223% | 496,218 | 49,632 |
| |
| | | | | Notional | |
| | Expiration | | Exercise | Amount | Value |
| | Date | Contracts | Price | ($000) | ($000) |
| Options Purchased (0.0%) | | | | | |
| Options on Futures Purchased (0.0%) | | | | |
| Call Options on 5-Year U.S. | | | | | |
| Treasury Note Futures | | | | | |
| Contracts (Cost $8) | 10/27/17 | 46 | USD 118.00 | 5,428 | 5 |
| |
| | | | | Notional | |
| | | | | Amount on | |
| | | | | Underlying | |
| | | Expiration | Exercise | Swap | |
| Counterparty | Date | Rate | ($000) | |
| Credit Default Swaptions Purchased (0.0%) | | | | |
| Put Swaptions on | | | | | |
| CDX-NA-HY-S29-V1 | | | | | |
| 5-Year Index (Cost $4) | JPMC | 10/18/17 | 60.0% | 2,755 | 1 |
| Total Options Purchased (Cost $12) | | | | 6 |
| Total Investments (105.2%) (Cost $931,672) | | | | 930,379 |
| |
| | | | | Notional | |
| | Expiration | | Exercise | Amount | |
| | Date | Contracts | Price | ($000) | |
| Liability for Options Written (0.0%) | | | | |
| Written Options on Futures (0.0%) | | | | |
| Call Options on 5-Year | | | | | |
| U.S. Treasury Note | | | | | |
| Futures Contracts | 10/27/17 | 90 | USD 118.50 | 10,665 | (4) |
| Call Options on 10-Year | | | | | |
| U.S. Treasury Note | | | | | |
| Futures Contracts | 11/24/17 | 12 | USD 127.50 | 1,530 | (2) |
| Put Options on 10-Year | | | | | |
| U.S. Treasury Note | | | | | |
| Futures Contracts | 10/27/17 | 27 | USD 125.50 | 3,389 | (17) |
| Put Options on 10-Year | | | | | |
| U.S. Treasury Note | | | | | |
| Futures Contracts | 10/27/17 | 27 | USD 125.00 | 3,375 | (11) |
| Put Options on 10-Year | | | | | |
| U.S. Treasury Note | | | | | |
| Futures Contracts | 11/24/17 | 27 | USD 124.50 | 3,362 | (12) |
| Put Options on 10-Year | | | | | |
| U.S. Treasury Note | | | | | |
| Futures Contracts | 11/24/17 | 12 | USD 125.50 | 1,506 | (10) |
| Put Options on 10-Year | | | | | |
| U.S. Treasury Note | | | | | |
| Futures Contracts | 11/24/17 | 18 | USD 124.00 | 2,232 | (5) |
| Total Options on Futures Written (Premiums Received $46) | | | (61) |
33
| | | | | |
| Core Bond Fund | | | | | |
| |
| | | | | Notional | |
| | | | | Amount on | |
| | | | | Underlying | |
| | | Expiration | Exercise | Swap | Value |
| | Counterparty | Date | Rate | ($000) | ($000) |
| Written Swaptions on Credit Default Index (0.0%) | | | |
| Call Swaptions on | | | | | |
| CDX-NA-IG-S28-V1 | | | | | |
| 5-Year Index | GSI | 11/15/17 | 55.0% | 1,725 | (2) |
| Put Swaptions on | | | | | |
| CDX-NA-HY-S29-V1 | | | | | |
| 5-Year Index | JPMC | 12/20/17 | 75.0% | 5,505 | (3) |
| Total Credit Default Swaptions Written (Premiums Received $7) | | | (5) |
| Total Liability on Options Written (Premiums Received $53) | | | (66) |
| |
| | | | | | Market |
| | | | | | Value• |
| | | | | | ($000) |
| Other Assets and Liabilities (-5.2%) | | | | |
| Other Assets | | | | | 65,307 |
| Other Liabilities | | | | | (111,213) |
| | | | | | (45,906) |
| Net Assets (100%) | | | | | 884,407 |
34
| |
| Core Bond Fund | |
| |
| |
| |
| |
| | Amount |
| | ($000) |
| Statement of Assets and Liabilities | |
| Assets | |
| Investments in Securities, at Value | |
| Unaffiliated Issuers (excluding Segregated Securities) | 878,538 |
| Collateral for Futures Contracts | 1,892 |
| Collateral for Swap Contracts | 311 |
| Total Unaffiliated Issuers | 880,741 |
| Affiliated Vanguard Funds | 49,632 |
| Options Purchased | 6 |
| Total Investments in Securities | 930,379 |
| Investment in Vanguard | 55 |
| Receivables for Investment Securities Sold | 57,749 |
| Receivables for Accrued Income | 4,641 |
| Receivables for Capital Shares Issued | 1,603 |
| Variation Margin Receivable—Futures Contracts | 173 |
| Variation Margin Receivable—Swap Contracts | 4 |
| Unrealized Appreciation—Forward Currency Contracts | 365 |
| Unrealized Appreciation—Swap Contracts | 15 |
| Other Assets | 702 |
| Total Assets | 995,686 |
| Liabilities | |
| Payables for Investment Securities Purchased | 109,220 |
| Payables for Capital Shares Redeemed | 902 |
| Payables for Distributions | 219 |
| Payables to Vanguard | 153 |
| Liabilities for Options Written | 66 |
| Variation Margin Payable—Futures Contracts | 149 |
| Variation Margin Payable—Swap Contracts | 9 |
| Unrealized Depreciation—Forward Currency Contracts | 79 |
| Unrealized Depreciation—Swap Contracts | 249 |
| Other Liabilities | 233 |
| Total Liabilities | 111,279 |
| Net Assets | 884,407 |
| |
| |
| At September 30, 2017, net assets consisted of: | |
| | Amount |
| | ($000) |
| Paid-in Capital | 888,524 |
| Undistributed Net Investment Income | 404 |
| Accumulated Net Realized Losses | (2,662) |
| Unrealized Appreciation (Depreciation) | |
| Investment Securities | (1,287) |
| Futures Contracts | (510) |
| Options | (19) |
| Swap Contracts | (332) |
| Forward Currency Contracts | 286 |
| Foreign Currencies | 3 |
| Net Assets | 884,407 |
35
| |
| Core Bond Fund | |
| |
| |
| |
| | Amount |
| | ($000) |
| Investor Shares—Net Assets | |
| Applicable to 9,062,029 outstanding $.001 par value shares of | |
| beneficial interest (unlimited authorization) | 90,647 |
| Net Asset Value Per Share—Investor Shares | $10.00 |
| |
| Admiral Shares—Net Assets | |
| Applicable to 39,684,433 outstanding $.001 par value shares of | |
| beneficial interest (unlimited authorization) | 793,760 |
| Net Asset Value Per Share—Admiral Shares | $20.00 |
• See Note A in Notes to Financial Statements.
* Interest only security.
^ Inverse floating security whose interest rate is derived by subtracting 1-month USD LIBOR from a given cap.
1 Securities with a value of $311,000 have been segregated as initial margin for open cleared swap contracts.
2 Securities with a value of $1,892,000 have been segregated as initial margin for open futures contracts.
3 U.S. government-guaranteed.
4 The issuer was placed under federal conservatorship in September 2008; since that time, its daily operations have been managed
by the Federal Housing Finance Agency and it receives capital from the U.S. Treasury, as needed to maintain a positive net worth,
in exchange for senior preferred stock.
5 The issuer operates under a congressional charter; its securities are generally neither guaranteed by the U.S. Treasury nor backed
by the full faith and credit of the U.S. government.
6 The average or expected maturity is shorter than the final maturity shown because of the possibility of interim principal payments
and prepayments or the possibility of the issue being called.
7 Includes securities purchased on a when-issued or delayed-delivery basis for which the fund has not taken delivery as of
September 30, 2017.
8 Adjustable-rate security based upon one-year Constant Maturity Treasury yield plus spread.
9 Adjustable-rate security based upon 1-month USD LIBOR plus spread.
10 Security exempt from registration under Rule 144A of the Securities Act of 1933. Such securities may be sold in transactions
exempt from registration, normally to qualified institutional buyers. At September 30, 2017, the aggregate value of these
securities was $75,985,000, representing 8.6% of net assets.
11 Security value determined using significant unobservable inputs.
12 Face amount denominated in Australian dollars.
13 Adjustable-rate security based upon 3-month AUD Australian Bank Bill Rate plus spread.
14 Face amount denominated in euro.
15 Adjustable-rate security based upon 3-month USD LIBOR plus spread.
16 Face amount denominated in British pounds.
17 Scheduled principal and interest payments are guaranteed by Municipal Bond Insurance Association.
18 Affiliated money market fund available only to Vanguard funds and certain trusts and accounts managed by Vanguard. Rate shown
is the 7-day yield.
GO—General Obligation Bond.
GSI—Goldman Sachs International.
JPMC—JP Morgan Chase Bank.
36
| | | | |
| Core Bond Fund | | | | |
| |
| |
| Derivative Financial Instruments Outstanding as of Period End | | |
| Futures Contracts | | | | |
| | | | | ($000) |
| | | | | Value and |
| | | Number of | | Unrealized |
| | | Long (Short) | Notional | Appreciation |
| | Expiration | Contracts | Amount | (Depreciation) |
| Long Futures Contracts | | | | |
| 5-Year U.S. Treasury Note | December 2017 | 885 | 103,988 | (427) |
| Ultra Long U.S. Treasury Bond | December 2017 | 186 | 30,713 | (440) |
| 30-Year U.S. Treasury Bond | December 2017 | 118 | 18,032 | (290) |
| 10-Year U.S. Treasury Note | December 2017 | 109 | 13,659 | (35) |
| | | | | (1,192) |
| |
| Short Futures Contracts | | | | |
| Ultra 10-Year U.S. Treasury Note | December 2017 | (486) | (65,283) | 602 |
| AUD 3-Year Treasury Bond | December 2017 | (32) | (2,787) | 9 |
| Euro-Bund | December 2017 | (14) | (2,664) | 27 |
| 2-Year U. S. Treasury Note | December 2017 | (10) | (2,157) | — |
| Euro-Bobl | December 2017 | (8) | (1,240) | 6 |
| Euro-Buxl | December 2017 | (6) | (1,158) | 17 |
| Long Gilt | December 2017 | (4) | (664) | 17 |
| AUD 10-Year Treasury Bond | December 2017 | (3) | (299) | 4 |
| | | | | 682 |
| | | | | (510) |
Unrealized appreciation (depreciation) on open futures contracts, except for AUD 3-Year Treasury Bond and AUD 10-Year Treasury Bond futures contracts, is required to be treated as realized gain (loss) for tax purposes.
| | | | | | |
| Forward Currency Contracts | | | | | | |
| | | | | | | Unrealized |
| | Contract | | | | | Appreciation |
| | | | Contract Amount (000) | |
| | Settlement | | | | | (Depreciation) |
| Counterparty | Date | | Receive | | Deliver | ($000) |
| BNP Paribas | 10/16/17 | AUD | 2,770 | USD | 2,202 | (30) |
| Goldman Sachs Bank AG | 10/16/17 | AUD | 1,500 | USD | 1,200 | (24) |
| JPMorgan Chase Bank, N.A. | 10/16/17 | GBP | 260 | USD | 349 | — |
| JPMorgan Chase Bank, N.A. | 10/16/17 | GBP | 110 | USD | 148 | — |
| JPMorgan Chase Bank, N.A. | 10/16/17 | AUD | 140 | USD | 112 | (2) |
| Citibank, N.A. | 10/16/17 | USD | 10,910 | AUD | 13,580 | 260 |
| Citibank, N.A. | 10/16/17 | USD | 5,471 | EUR | 4,560 | 77 |
37
| | | | | | |
| Core Bond Fund | | | | | | |
| |
| |
| Forward Currency Contracts (continued) | | | | | |
| | | | | | | Unrealized |
| | Contract | | | | | Appreciation |
| | | | Contract Amount (000) | |
| | Settlement | | | | | (Depreciation) |
| Counterparty | Date | | Receive | | Deliver | ($000) |
| JPMorgan Chase Bank, N.A. | 10/16/17 | USD | 2,123 | GBP | 1,600 | (22) |
| BNP Paribas | 10/16/17 | USD | 807 | AUD | 1,000 | 22 |
| Morgan Stanley Capital Services LLC | 10/16/17 | USD | 300 | AUD | 377 | 5 |
| JPMorgan Chase Bank, N.A. | 10/16/17 | USD | 212 | EUR | 180 | (1) |
| Goldman Sachs Bank AG | 10/16/17 | USD | 84 | EUR | 70 | 1 |
| | | | | | | 286 |
| AUD—Australian dollar. | | | | | | |
| EUR—euro. | | | | | | |
| GBP—British pound. | | | | | | |
| USD—U.S. dollar. | | | | | | |
Unrealized appreciation (depreciation) on open forward currency contracts is treated as ordinary income for tax purposes.
| | | | | | |
| Centrally Cleared Credit Default Swaps | | | | | |
| | | | | Periodic | | |
| | | | | Premium | | Unrealized |
| | | | | Received | | Appreciation |
| | Termination | Notional Amount | (Paid)1 | Value | (Depreciation) |
| Reference Entity | Date | | (000) | (%) | ($000) | ($000) |
| Credit Protection Sold | | | | | | |
| CDX-NA-HY-S29-V1 | 12/20/22 | USD | 1,096 | 5.000 | 86 | 6 |
| CDX-NA-IG-S28-V1 | 6/20/24 | USD | 1,304 | 1.000 | 16 | 3 |
| | | | | | 102 | 9 |
| |
| Credit Protection Purchased | | | | | | |
| CDX-NA-IG-S28-V1 | 6/20/22 | USD | 346 | (1.000) | (7) | (1) |
| iTraxx Europe Crossover | | | | | | |
| Index-S28-V1 | 12/20/22 | EUR | 600 | (5.000) | (83) | (2) |
| iTraxx Europe Subordinated | | | | | | |
| Financials-S27-V1 | 6/20/22 | EUR | 2,505 | (1.000) | 8 | (53) |
| iTraxx Europe-S27-V1 | 6/20/22 | EUR | 2,875 | (1.000) | (83) | (40) |
| | | | | | (165) | (96) |
| | | | | | (63) | (87) |
| 1 Periodic premium received/paid quarterly. | | | | | |
| EUR—euro. | | | | | | |
| USD—U.S. dollar. | | | | | | |
38
| | | | | | | |
| Core Bond Fund | | | | | | | |
| |
| |
| Over-the-Counter Credit Default Swaps | | | | | |
| | | | | | | Remaining | |
| | | | | Periodic | | Up-Front | |
| | | | | Premium | | Premium | Unrealized |
| | | | Notional | Received | | Received | Appreciation |
| Termination | | Amount | (Paid) | Value | (Paid) | (Depreciation) |
| Reference Entity | Date | Counterparty | ($000) | (%) | ($000) | ($000) | ($000) |
| Credit Protection Sold/Moody’s Rating | | | | | | | |
| Berkshire Hathaway | | | | | | | |
| Inc./Aa2 | 6/20/21 | JPMC | 70 | 1.0002 | 1 | — | 1 |
| Berkshire Hathaway | | | | | | | |
| Inc./Aa2 | 6/20/21 | GSI | 55 | 1.0002 | 1 | — | 1 |
| Berkshire Hathaway | | | | | | | |
| Inc. /Aa2 | 6/20/22 | BARC | 450 | 1.000 2 | 8 | (7) | 1 |
| Berkshire Hathaway | | | | | | | |
| Inc./Aa2 | 12/20/22 | BARC | 400 | 1.0002 | 7 | (7) | — |
| Berkshire Hathaway | | | | | | | |
| Inc./Aa2 | 6/20/24 | JPMC | 600 | 1.0002 | 3 | (6) | (3) |
| Berkshire Hathaway | | | | | | | |
| Inc. /Aa2 | 6/20/24 | BARC | 600 | 1.000 2 | 3 | (7) | (4) |
| Metlife Inc./A3 | 12/20/21 | BARC | 100 | 1.0002 | 2 | — | 2 |
| Metlife Inc./A3 | 6/20/24 | BARC | 700 | 1.0002 | 5 | (1) | 4 |
| People’s Republic of | | | | | | | |
| China/A1 | 6/20/22 | BNPSW | 200 | 1.0002 | 4 | (2) | 2 |
| Republic of Peru/A3 | 12/20/22 | GSI | 1,400 | 1.0002 | 11 | (12) | (1) |
| Simon Property Group | | | | | | | |
| LP/A2 | 6/20/22 | JPMC | 125 | 1.0002 | 2 | — | 2 |
| Simon Property Group | | | | | | | |
| LP/A2 | 6/20/22 | JPMC | 85 | 1.0002 | 1 | — | 1 |
| The Southern | | | | | | | |
| Company/Baa2 | 6/20/22 | JPMC | 1,725 | 1.000 2 | 25 | (27) | (2) |
| | | | | | 73 | (69) | 4 |
| |
| Credit Protection Purchased | | | | | | |
| Banco Bilbao Vizcaya | | | | | | | |
| Argentaria SA | 6/20/21 | BOANA | 505 | (1.000)2 | (11) | (11) | (22) |
| Bank of China Ltd. | 12/20/21 | BNPSW | 100 | (1.000)2 | (2) | — | (2) |
| Bank of China Ltd. | 6/20/22 | BNPSW | 200 | (1.000)2 | (3) | — | (3) |
| Barclays Bank plc | 6/20/22 | BOANA | 4251 | (1.000)2 | (14) | 9 | (5) |
| Barclays Bank plc | 6/20/22 | CSFBI | 4251 | (1.000)2 | (14) | 9 | (5) |
| Barclays Bank plc | 12/20/22 | CITNA | 1861 | (1.000)2 | 5 | (8) | (3) |
| CECONOMY AG | 6/20/22 | BARC | 2901 | (1.000)2 | (2) | (1) | (3) |
| CECONOMY AG | 6/20/22 | BARC | 2101 | (1.000)2 | (2) | — | (2) |
| CECONOMY AG | 6/20/22 | BARC | 2101 | (1.000)2 | (2) | — | (2) |
| CECONOMY AG | 6/20/22 | BARC | 1251 | (1.000)2 | (1) | — | (1) |
| CECONOMY AG | 6/20/22 | BARC | 851 | (1.000)2 | (1) | — | (1) |
39
| | | | | | | |
| Core Bond Fund | | | | | | | |
| |
| |
| Over-the-Counter Credit Default Swaps (continued) | | | | |
| | | | | | | Remaining | |
| | | | | Periodic | | Up-Front | |
| | | | | Premium | | Premium | Unrealized |
| | | | Notional | Received | | Received | Appreciation |
| Termination | | Amount | (Paid) | Value | (Paid) | (Depreciation) |
| Reference Entity | Date | Counterparty | ($000) | (%) | ($000) | ($000) | ($000) |
| CECONOMY AG | 6/20/22 | BARC | 851 | (1.000)2 | (1) | — | (1) |
| CECONOMY AG | 6/20/22 | BARC | 851 | (1.000)2 | (1) | — | (1) |
| CMBX-NA-AAA-9 | 9/17/58 | CSFBI | 2,000 | (0.500)3 | 4 | (45) | (41) |
| CMBX-NA-AAA-9 | 9/17/58 | GSI | 170 | (0.500)3 | — | (6) | (6) |
| CMBX-NA-AAA-9 | 9/17/58 | MSCS | 100 | (0.500)3 | — | (4) | (4) |
| CMBX-NA-AAA-9 | 9/17/58 | JPM | 90 | (0.500)3 | — | (3) | (3) |
| CMBX-NA-AAA-9 | 9/17/58 | JPM | 90 | (0.500)3 | — | (4) | (4) |
| CMBX-NA-AAA-9 | 9/17/58 | MSCS | 90 | (0.500)3 | — | (5) | (5) |
| CMBX-NA-AAA-9 | 9/17/58 | GSI | 80 | (0.500)3 | — | (4) | (4) |
| CMBX-NA-AAA-9 | 9/17/58 | GSI | 20 | (0.500)3 | — | (1) | (1) |
| Commerzbank AG | 6/20/21 | BOANA | 505 | (1.000)2 | (8) | (7) | (15) |
| Deutsche Bank AG | 12/20/21 | BARC | 600 | (1.000)2 | (6) | (7) | (13) |
| Deutsche Bank AG | 12/20/22 | JPMC | 440 | (1.000)2 | (2) | 2 | — |
| Deutsche Bank AG | 12/20/22 | JPMC | 265 | (1.000)2 | (1) | 1 | — |
| Deutsche Bank AG | 12/20/22 | JPMC | 175 | (1.000)2 | (1) | 1 | — |
| Dominion Energy Inc. | 6/20/22 | JPMC | 215 | (1.000)2 | (7) | 7 | — |
| Enel Investment | | | | | | | |
| Holding BV | 6/20/22 | BNPSW | 4401 | (1.000)2 | (11) | 8 | (3) |
| Engie SA | 12/20/21 | BNPSW | 1801 | (1.000)2 | (6) | 2 | (4) |
| Engie SA | 6/20/22 | JPMC | 1801 | (1.000)2 | (7) | 4 | (3) |
| Exelon Corp. | 6/20/22 | JPMC | 345 | (1.000)2 | (11) | 10 | (1) |
| Exelon Corp. | 6/20/22 | JPMC | 215 | (1.000)2 | (7) | 7 | — |
| Federative Republic | | | | | | | |
| of Brazil | 12/20/22 | GSI | 374 | (1.000)2 | 16 | (18) | (2) |
| Federative Republic | | | | | | | |
| of Brazil | 12/20/22 | BNPSW | 150 | (1.000)2 | 6 | (7) | (1) |
| Lincoln National Corp. | 6/20/21 | BARC | 35 | (1.000)2 | (1) | — | (1) |
| Lincoln National Corp. | 6/20/21 | BARC | 25 | (1.000)2 | (1) | — | (1) |
| Lincoln National Corp. | 12/20/21 | BARC | 100 | (1.000)2 | (2) | — | (2) |
| McDonald’s Corp. | 6/20/22 | GSI | 325 | (1.000)2 | (11) | 9 | (2) |
| People’s Republic | | | | | | | |
| of China | 12/20/22 | GSI | 1,200 | (1.000)2 | (23) | 23 | — |
| Republic of Indonesia | 6/20/22 | JPMC | 200 | (1.000)2 | (1) | (2) | (3) |
| Republic of Philippines 12/20/22 | BNPSW | 310 | (1.000)2 | (5) | 5 | — |
| Republic of Turkey | 12/20/19 | GSCM | 1,250 | (1.000)2 | (5) | (15) | (20) |
| Republic of Turkey | 12/20/19 | GSCM | 735 | (1.000)2 | (3) | (9) | (12) |
| Republic of Turkey | 12/20/22 | GSI | 540 | (1.000)2 | 22 | (21) | 1 |
40
| | | | | | | |
| Core Bond Fund | | | | | | | |
| |
| |
| Over-the-Counter Credit Default Swaps (continued) | | | | |
| | | | | | | Remaining | |
| | | | | Periodic | | Up-Front | |
| | | | | Premium | | Premium | Unrealized |
| | | | Notional | Received | | Received | Appreciation |
| | Termination | | Amount | (Paid) | Value | (Paid) | (Depreciation) |
| Reference Entity | Date | Counterparty | ($000) | (%) | ($000) | ($000) | ($000) |
| Sempra Energy | 6/20/22 | JPMC | 345 | (1.000)2 | (11) | 10 | (1) |
| Sempra Energy | 6/20/22 | JPMC | 215 | (1.000)2 | (7) | 7 | — |
| Societe General SA | 12/20/21 | JPMC | 325 | (1.000)2 | (9) | 1 | (8) |
| Standard Chartered | | | | | | | |
| Bank | 12/20/21 | JPMC | 185 | (1.000)2 | (5) | (1) | (6) |
| State of Qatar | 6/20/22 | CITNA | 660 | (1.000)2 | (4) | (7) | (11) |
| State of Qatar | 6/20/22 | BOANA | 340 | (1.000)2 | (2) | (4) | (6) |
| UniCredit SpA | 6/20/22 | JPMC | 175 | (1.000)2 | 7 | (12) | (5) |
| | | | | | (151) | (87) | (238) |
| | | | | | (78) | (156) | (234) |
The notional amount represents the maximum potential amount the fund could be required to pay as a seller of credit protection if the reference entity was subject to a credit event.
1 Notional amount denominated in euro.
2 Periodic premium received/paid quarterly.
3 Periodic premium received/paid monthly.
BARC—Barclays Bank plc.
BNPSW—BNP Paribas.
BOANA—Bank of America, N.A.
CITNA—Citibank N.A.
CSFBI—Credit Suisse First Boston International.
GSCM—Goldman Sachs Bank USA.
GSI—Goldman Sachs International.
JPM—JP Morgan Securities.
JPMC—JP Morgan Chase Bank.
MSCS—Morgan Stanley Capital Services LLC.
At September 30, 2017, the counterparties had deposited in segregated accounts securities with a value of $298,000 in connection with forward currency contracts and over-the-counter swap contracts.
41
| | | | | | |
| Core Bond Fund | | | | | | |
| |
| |
| Centrally Cleared Interest Rate Swaps | | | | | |
| | | | Fixed | Floating | | |
| | | | Interest | Interest | | |
| | | | Rate | Rate | | Unrealized |
| | Future | Notional | Received | Received | | Appreciation |
| | Effective | Amount | (Paid)2 | (Paid) | Value | (Depreciation) |
| Termination Date | Date | ($000) | (%) | (%) | ($000) | ($000) |
| 12/20/18 | 12/20/171 | 3,475 | 1.750 | (0.000)3 | 3 | (2) |
| 12/20/19 | 12/20/171 | 1,351 | 2.000 | (0.000)3 | 5 | (2) |
| 12/20/20 | 12/20/171 | 1,394 | 2.250 | (0.000)3 | 14 | (4) |
| 12/20/21 | 12/20/171 | 1,186 | 2.250 | (0.000)3 | 12 | (4) |
| 12/20/22 | 12/20/171 | 396 | 2.250 | (0.000)3 | 4 | 5 |
| 12/20/24 | 12/20/171 | 645 | 2.500 | (0.000)3 | 13 | (4) |
| | | | | | 51 | (11) |
1 Forward interest rate swap. In a forward interest rate swap, the fund and the counterparty agree to make periodic net payments beginning on a specified future effective date.
2 Fixed interest payment received/paid semi-annually.
3 Based on 3-month London Interbank Offered Rate (LIBOR) as of the most recent payment date. Floating interest payment received/ paid quarterly.
See accompanying Notes, which are an integral part of the Financial Statements.
42
| |
| Core Bond Fund | |
| |
| |
| Statement of Operations | |
| |
| | Year Ended |
| | September 30, 2017 |
| | ($000) |
| Investment Income | |
| Income | |
| Interest1 | 17,433 |
| Total Income | 17,433 |
| Expenses | |
| The Vanguard Group—Note B | |
| Investment Advisory Services | 95 |
| Management and Administrative—Investor Shares | 141 |
| Management and Administrative—Admiral Shares | 740 |
| Marketing and Distribution—Investor Shares | 14 |
| Marketing and Distribution—Admiral Shares | 62 |
| Custodian Fees | 27 |
| Auditing Fees | 45 |
| Shareholders’ Reports and Proxy—Investor Shares | 12 |
| Shareholders’ Reports and Proxy—Admiral Shares | 14 |
| Trustees’ Fees and Expenses | 1 |
| Total Expenses | 1,151 |
| Net Investment Income | 16,282 |
| Realized Net Gain (Loss) | |
| Investment Securities Sold1 | (1,594) |
| Futures Contracts | 140 |
| Purchased Options | (48) |
| Written Options | 245 |
| Swap Contracts | (843) |
| Foreign Currencies and Forward Currency Contracts | (1,432) |
| Realized Net Gain (Loss) | (3,532) |
| Change in Unrealized Appreciation (Depreciation) | |
| Investment Securities1 | (9,333) |
| Futures Contracts | (343) |
| Purchased Options | (6) |
| Written Options | (14) |
| Swap Contracts | (322) |
| Foreign Currencies and Forward Currency Contracts | 196 |
| Change in Unrealized Appreciation (Depreciation) | (9,822) |
| Net Increase (Decrease) in Net Assets Resulting from Operations | 2,928 |
1 Interest income, realized net gain (loss), and change in unrealized appreciation (depreciation) from an affiliated company of the fund were $401,000, $4,000, and $2,000, respectively.
See accompanying Notes, which are an integral part of the Financial Statements.
43
| | |
| Core Bond Fund | | |
| |
| |
| Statement of Changes in Net Assets | | |
| |
| | | March 10, |
| | Year Ended | 20161 to |
| | September 30, | September 30, |
| | 2017 | 2016 |
| | ($000) | ($000) |
| Increase (Decrease) in Net Assets | | |
| Operations | | |
| Net Investment Income | 16,282 | 5,500 |
| Realized Net Gain (Loss) | (3,532) | 3,923 |
| Change in Unrealized Appreciation (Depreciation) | (9,822) | 7,963 |
| Net Increase (Decrease) in Net Assets Resulting from Operations | 2,928 | 17,386 |
| Distributions | | |
| Net Investment Income | | |
| Investor Shares | (1,458) | (546) |
| Admiral Shares | (13,502) | (4,920) |
| Realized Capital Gain 2 | | |
| Investor Shares | (378) | — |
| Admiral Shares | (3,414) | — |
| Total Distributions | (18,752) | (5,466) |
| Capital Share Transactions | | |
| Investor Shares | 27,383 | 63,514 |
| Admiral Shares | 229,954 | 567,460 |
| Net Increase (Decrease) from Capital Share Transactions | 257,337 | 630,974 |
| Total Increase (Decrease) | 241,513 | 642,894 |
| Net Assets | | |
| Beginning of Period | 642,894 | — |
| End of Period3 | 884,407 | 642,894 |
1 Commencement of subscription period for the fund.
2 Includes fiscal 2017 short-term gain distributions totaling $3,792,000. Short-term gain distributions are treated as ordinary income dividends for tax purposes.
3 Net Assets—End of Period includes undistributed (overdistributed) net investment income of $404,000 and $66,000.
See accompanying Notes, which are an integral part of the Financial Statements.
44
| | |
| Core Bond Fund | | |
| |
| |
| Financial Highlights | | |
| |
| |
| Investor Shares | | |
| | Year March 10, |
| | Ended | 20161 to |
| | Sept. 30, | Sept. 30, |
| For a Share Outstanding Throughout Each Period | 2017 | 2016 |
| Net Asset Value, Beginning of Period | $10.26 | $10.00 |
| Investment Operations | | |
| Net Investment Income | . 217 2 | .097 |
| Net Realized and Unrealized Gain (Loss) on Investments | (.219) | .259 |
| Total from Investment Operations | (.002) | .356 |
| Distributions | | |
| Dividends from Net Investment Income | (.197) | (.096) |
| Distributions from Realized Capital Gains | (.061) | — |
| Total Distributions | (.258) | (.096) |
| Net Asset Value, End of Period | $10.00 | $10.26 |
| |
| Total Return3 | 0.03% | 3.57% |
| |
| Ratios/Supplemental Data | | |
| Net Assets, End of Period (Millions) | $91 | $65 |
| Ratio of Total Expenses to Average Net Assets | 0.25% | 0.25% |
| Ratio of Net Investment Income to Average Net Assets | 2.18% | 2.00% |
| Portfolio Turnover Rate 4 | 232% | 229% |
1 Subscription period for the fund was March 10, 2016, to March 24, 2016, during which time all assets were held in money market instruments. Performance measurement began March 28, 2016, the first business day after the subscription period, at a net asset value of $10.00.
2 Calculated based on average shares outstanding.
3 Total returns do not include account service fees that may have applied in the periods shown. Fund prospectuses provide information about any applicable account service fees.
4 Includes 81% and 58% attributable to mortgage-dollar-roll activity.
See accompanying Notes, which are an integral part of the Financial Statements.
45
| | |
| Core Bond Fund | | |
| |
| |
| Financial Highlights | | |
| |
| |
| Admiral Shares | | |
| | Year | March 10, |
| | Ended | 20161 to |
| | Sept. 30, | Sept. 30, |
| For a Share Outstanding Throughout Each Period | 2017 | 2016 |
| Net Asset Value, Beginning of Period | $20.53 | $20.00 |
| Investment Operations | | |
| Net Investment Income | . 4542 | .205 |
| Net Realized and Unrealized Gain (Loss) on Investments | (.445) | .528 |
| Total from Investment Operations | .009 | .733 |
| Distributions | | |
| Dividends from Net Investment Income | (.417) | (.203) |
| Distributions from Realized Capital Gains | (.122) | — |
| Total Distributions | (.539) | (.203) |
| Net Asset Value, End of Period | $20.00 | $20.53 |
| |
| Total Return3 | 0.10% | 3.67% |
| |
| Ratios/Supplemental Data | | |
| Net Assets, End of Period (Millions) | $794 | $578 |
| Ratio of Total Expenses to Average Net Assets | 0.15% | 0.15% |
| Ratio of Net Investment Income to Average Net Assets | 2.28% | 2.10% |
| Portfolio Turnover Rate 4 | 232% | 229% |
1 Subscription period for the fund was March 10, 2016, to March 24, 2016, during which time all assets were held in money market instruments. Performance measurement began March 28, 2016, the first business day after the subscription period, at a net asset value of $20.00.
2 Calculated based on average shares outstanding.
3 Total returns do not include account service fees that may have applied in the periods shown. Fund prospectuses provide information about any applicable account service fees.
4 Includes 81% and 58% attributable to mortgage-dollar-roll activity.
See accompanying Notes, which are an integral part of the Financial Statements.
46
Core Bond Fund
Notes to Financial Statements
Vanguard Core Bond Fund is registered under the Investment Company Act of 1940 as an open-end investment company, or mutual fund. Certain of the fund’s investments are in corporate debt instruments; the issuers’ abilities to meet their obligations may be affected by economic developments in their respective industries. The fund invests in securities of foreign issuers, which may subject it to investment risks not normally associated with investing in securities of U.S. corporations. To minimize the currency risk associated with investment in bonds denominated in currencies other than the U.S. dollar, the fund attempts to hedge its currency exposures. The fund offers two classes of shares: Investor Shares and Admiral Shares. Investor Shares are available to any investor who meets the fund’s minimum purchase requirements. Admiral Shares are designed for investors who meet certain administrative, service, and account-size criteria.
A. The following significant accounting policies conform to generally accepted accounting principles for U.S. investment companies. The fund consistently follows such policies in preparing its financial statements.
1. Security Valuation: Securities are valued as of the close of trading on the New York Stock Exchange (generally 4 p.m., Eastern time) on the valuation date. Bonds and temporary cash investments are valued using the latest bid prices or using valuations based on a matrix system (which considers such factors as security prices, yields, maturities, and ratings), both as furnished by independent pricing services. Structured debt securities, including mortgages and asset-backed securities, are valued using the latest bid prices or using valuations based on a matrix system that considers such factors as issuer, tranche, nominal or option-adjusted spreads, weighted average coupon, weighted average maturity, credit enhancements, and collateral. Investments in Vanguard Market Liquidity Fund are valued at that fund’s net asset value. Securities for which market quotations are not readily available, or whose values have been affected by events occurring before the fund’s pricing time but after the close of the securities’ primary markets, are valued at their fair values calculated according to procedures adopted by the board of trustees. These procedures include obtaining quotations from an independent pricing service, monitoring news to identify significant market- or security-specific events, and evaluating changes in the values of foreign market proxies (for example, ADRs, futures contracts, or exchange-traded funds), between the time the foreign markets close and the fund’s pricing time. When fair-value pricing is employed, the prices of securities used by a fund to calculate its net asset value may differ from quoted or published prices for the same securities.
2. Foreign Currency: Securities and other assets and liabilities denominated in foreign currencies are translated into U.S. dollars using exchange rates obtained from an independent third party as of the fund’s pricing time on the valuation date. Realized gains (losses) and unrealized appreciation (depreciation) on investment securities include the effects of changes in exchange rates since the securities were purchased, combined with the effects of changes in security prices. Fluctuations in the value of other assets and liabilities resulting from changes in exchange rates are recorded as unrealized foreign currency gains (losses) until the assets or liabilities are settled in cash, at which time they are recorded as realized foreign currency gains (losses).
3. Futures Contracts: The fund uses futures contracts to invest in fixed income asset classes with greater efficiency and lower cost than is possible through direct investment, to add value when these instruments are attractively priced, or to adjust sensitivity to changes in interest rates. The primary risks associated with the use of futures contracts are imperfect correlation between changes in market values of bonds held by the fund and the prices of futures contracts, and the
47
Core Bond Fund
possibility of an illiquid market. Counterparty risk involving futures is mitigated because a regulated clearinghouse is the counterparty instead of the clearing broker. To further mitigate counterparty risk, the fund trades futures contracts on an exchange, monitors the financial strength of its clearing brokers and clearinghouse, and has entered into clearing agreements with its clearing brokers. The clearinghouse imposes initial margin requirements to secure the fund’s performance and requires daily settlement of variation margin representing changes in the market value of each contract.
Futures contracts are valued at their quoted daily settlement prices. The notional amounts of the contracts are not recorded in the Statement of Net Assets. Fluctuations in the value of the contracts are recorded in the Statement of Assets and Liabilities as an asset (liability) and in the Statement of Operations as unrealized appreciation (depreciation) until the contracts are closed, when they are recorded as realized futures gains (losses).
During the year ended September 30, 2017, the fund’s average investments in long and short futures contracts represented 13% and 8% of net assets, respectively, based on the average of aggregate settlement values at each quarter-end during the period.
4. Forward Currency Contracts: The fund enters into forward currency contracts to protect the value of securities and related receivables and payables against changes in future foreign exchange rates. The fund’s risks in using these contracts include movement in the values of the foreign currencies relative to the U.S. dollar and the ability of the counterparties to fulfill their obligations under the contracts. The fund mitigates its counterparty risk by entering into forward currency contracts only with a diverse group of prequalified counterparties, monitoring their financial strength, entering into master netting arrangements with its counterparties, and requiring its counterparties to transfer collateral as security for their performance. In the absence of a default, the collateral pledged or received by the fund cannot be repledged, resold, or rehypothecated. The master netting arrangements provide that, in the event of a counterparty’s default (including bankruptcy), the fund may terminate the forward currency contracts, determine the net amount owed by either party in accordance with its master netting arrangements, and sell or retain any collateral held up to the net amount owed to the fund under the master netting arrangements. The forward currency contracts contain provisions whereby a counterparty may terminate open contracts if the fund’s net assets decline below a certain level, triggering a payment by the fund if the fund is in a net liability position at the time of the termination. The payment amount would be reduced by any collateral the fund has pledged. Any assets pledged as collateral for open contracts are noted in the Statement of Net Assets. The value of collateral received or pledged is compared daily to the value of the forward currency contracts exposure with each counterparty, and any difference, if in excess of a specified minimum transfer amount, is adjusted and settled within two business days.
Forward currency contracts are valued at their quoted daily prices obtained from an independent third party, adjusted for currency risk based on the expiration date of each contract. The notional amounts of the contracts are not recorded in the Statement of Net Assets. Fluctuations in the value of the contracts are recorded in the Statement of Assets and Liabilities as an asset (liability) and in the Statement of Operations as unrealized appreciation (depreciation) until the contracts are closed, when they are recorded as realized forward currency contract gains (losses).
During the year ended September 30, 2017, the fund’s average investment in forward currency contracts represented 3% of net assets, based on the average of notional amounts at each quarter-end during the period.
48
Core Bond Fund
5. Swap Contracts: The fund invests in credit default swaps to adjust the overall credit risk of the fund or to actively overweight or underweight credit risk to a specific issuer or group of issuers. The fund may sell credit protection through credit default swaps to simulate investments in long positions that are either unavailable or considered to be less attractively priced in the bond market. The fund may purchase credit protection through credit default swaps to reduce credit exposure to a given issuer or issuers. Under the terms of the swaps, an up-front payment may be exchanged between the seller and buyer. In addition, the seller of the credit protection receives a periodic payment of premium from the buyer that is a fixed percentage applied to a notional amount. If, for example, the reference entity is subject to a credit event (such as bankruptcy, failure to pay, or obligation acceleration) during the term of the swap, the seller agrees to either physically settle or cash settle the swap contract. If the swap is physically settled, the seller agrees to pay the buyer an amount equal to the notional amount and take delivery of a debt instrument of the reference issuer with a par amount equal to such notional amount. If the swap is cash settled, the seller agrees to pay the buyer the difference between the notional amount and the final price for the relevant debt instrument, as determined either in a market auction or pursuant to a pre-agreed-upon valuation procedure.
The fund enters into interest rate swap transactions to adjust the fund’s sensitivity to changes in interest rates and maintain the ability to generate income at prevailing market rates. Under the terms of the swaps, one party pays the other an amount that is a fixed percentage rate applied to a notional amount. In return, the counterparty agrees to pay a floating rate, which is reset periodically based on short-term interest rates, applied to the same notional amount.
The notional amounts of swap contracts are not recorded in the Statement of Net Assets. Swaps are valued daily based on market quotations received from independent pricing services or recognized dealers and the change in value is recorded in the Statement of Assets and Liabilities as an asset (liability) and in the Statement of Operations as unrealized appreciation (depreciation) until the seller of credit protection is required to take delivery (or, in a cash settled swap, pay the settlement amount determined) upon occurrence of a credit event, periodic payments are made, or the swap terminates, at which time realized gain (loss) is recorded. The net premium to be received or paid by the fund under swap contracts is accrued daily and recorded as realized gain (loss) over the life of the contract.
The primary risk associated with selling credit protection is that, upon the occurrence of a defined credit event, the market value of the debt instrument received by the fund (or, in a cash settled swap, the debt instruments used to determine the settlement payment by the fund) will be significantly less than the amount paid by the fund and, in a physically settled swap, the fund may receive an illiquid debt instrument. A risk associated with all types of swaps is the possibility that a counterparty may default on its obligation to pay net amounts due to the fund. The fund’s maximum amount subject to counterparty risk is the unrealized appreciation on the swap contract. The fund mitigates its counterparty risk by entering into swaps only with a diverse group of prequalified counterparties, monitoring their financial strength, entering into master netting arrangements with its counterparties, and requiring its counterparties to transfer collateral as security for their performance. In the absence of a default, the collateral pledged or received by the fund cannot be repledged, resold, or rehypothecated. In the event of a counterparty’s default (including bankruptcy), the fund may terminate any swap contracts with that counterparty, determine the net amount owed by either party in accordance with its master netting arrangements, and sell or retain any collateral held up
49
Core Bond Fund
to the net amount owed to the fund under the master netting arrangements. The swap contracts contain provisions whereby a counterparty may terminate open contracts if the fund’s net assets decline below a certain level, triggering a payment by the fund if the fund is in a net liability position at the time of the termination. The payment amount would be reduced by any collateral the fund has pledged. Any securities pledged as collateral for open contracts are noted in the Statement of Net Assets. The value of collateral received or pledged is compared daily to the value of the swap contracts exposure with each counterparty, and any difference, if in excess of a specified minimum transfer amount, is adjusted and settled within two business days.
The fund enters into centrally cleared interest rate and credit default swaps to achieve the same objectives specified with respect to the equivalent over-the-counter swaps but with less counterparty risk because a regulated clearinghouse is the counterparty instead of the clearing broker or executing broker. The clearinghouse imposes initial margin requirements to secure the fund’s performance, and requires daily settlement of variation margin representing changes in the market value of each contract. To further mitigate counterparty risk, the fund trades with a diverse group of prequalified executing brokers; monitors the financial strength of its clearing brokers, executing brokers, and clearinghouse; and has entered into agreements with its clearing brokers and executing brokers.
During the year ended September 30, 2017, the fund’s average amounts of investments in credit protection sold and credit protection purchased represented 1% and 4% of net assets, respectively, based on the average of notional amounts at each quarter-end during the period. The average amount of investments in interest rate swaps represented 2% of net assets, based on the average of notional amounts at each quarter-end during the period.
6. Options: The fund invests in options contracts on futures and swaps to adjust its exposure to the underlying investments. The primary risk associated with purchasing options is that the value of the underlying investments may move in such a way that the option is out-of-the-money (the exercise price of the option exceeds the value of the underlying investment), the position is worthless at expiration, and the fund loses the premium paid. The primary risk associated with selling options is that the value of the underlying investments may move in such a way that the option is in-the-money (the exercise price of the option exceeds the value of the underlying investment), the counterparty exercises the option, and the fund loses an amount equal to the market value of the option written less the premium received.
The fund invests in options on futures, which are exchange-traded. Counterparty risk involving exchange-traded options on futures is mitigated because a regulated clearinghouse is the counterparty instead of the clearing broker. To further mitigate counterparty risk, the fund trades options on futures on an exchange, monitors the financial strength of its clearing brokers and clearinghouses, and has entered into clearing agreements with its clearing brokers.
The fund invests in options on swaps (swaptions), which are transacted over-the-counter (OTC) and not on an exchange. A receiver swaption gives the owner the right to receive the total return of a specified asset, reference rate, or index. A payer swaption gives the owner the right to pay the total return of a specified asset, reference rate, or index. Swaptions also include options that allow an existing swap to be terminated or extended by one of the counterparties. Unlike exchange-traded options, which are standardized with respect to the underlying instrument, expiration date, contract size, and strike price, the terms of OTC options generally are established through negotiation with
50
Core Bond Fund
the other party to the option contract. Although this type of arrangement allows the purchaser or writer greater flexibility to tailor an option to its needs, OTC options generally involve greater credit risk than exchange-traded options. Credit risk involves the possibility that a counterparty may default on its obligation to pay net amounts due to the fund. The fund mitigates its counterparty risk by entering into swaptions with a diverse group of prequalified counterparties and monitoring their financial strength.
Options on futures contracts are valued at their quoted daily settlement prices. Swaptions are valued daily based on market quotations received from independent pricing services or recognized dealers. The premium paid for a purchased option is recorded in the Statement of Assets and Liabilities as an asset that is subsequently adjusted daily to the current market value of the option purchased. The premium received for a written option is recorded in the Statement of Assets and Liabilities as an asset with an equal liability that is subsequently adjusted daily to the current market value of the option written. Fluctuations in the value of the options are recorded in the Statement of Operations as unrealized appreciation (depreciation) until expired, closed, or exercised, at which time realized gains (losses) are recognized.
During the year ended September 30, 2017, the fund’s average value of investments in options purchased and options written each represented less than 1% of net assets, based on the average market values at each quarter-end during the period.
7. To Be Announced (TBA) Transactions: A TBA transaction is an agreement to buy or sell mortgage-backed securities with agreed-upon characteristics (face amount, coupon, maturity) for settlement at a future date. The fund may be a seller of TBA transactions to reduce its exposure to the mortgage-backed securities market or in order to sell mortgage-backed securities it owns under delayed-delivery arrangements. When the fund is a buyer of TBA transactions, it maintains cash or short-term investments in an amount sufficient to meet the purchase price at the settlement date of the TBA transaction. The primary risk associated with TBA transactions is that a counterparty may default on its obligations. The fund mitigates its counterparty risk by, among other things, performing a credit analysis of counterparties, allocating transactions among numerous counterparties, and monitoring its exposure to each counterparty. The fund may also enter into a Master Securities Forward Transaction Agreement (MSFTA) with certain counterparties and require them to transfer collateral as security for their performance. In the absence of a default, the collateral pledged or received by the fund cannot be repledged, resold, or rehypothecated. Under an MSFTA, upon a counterparty default (including bankruptcy), the fund may terminate any TBA transactions with that counterparty, determine the net amount owed by either party in accordance with its master netting arrangements, and sell or retain any collateral held up to the net amount owed to the fund under the master netting arrangements.
8. Mortgage Dollar Rolls: The fund enters into mortgage-dollar-roll transactions, in which the fund sells mortgage-backed securities to a dealer and simultaneously agrees to purchase similar securities in the future at a predetermined price. The proceeds of the securities sold in mortgage-dollar-roll transactions are typically invested in high-quality short-term fixed income securities. The fund forgoes principal and interest paid on the securities sold, and is compensated by interest earned on the proceeds of the sale and by a lower price on the securities to be repurchased. The fund has also entered into mortgage-dollar-roll transactions in which the fund buys mortgage-backed securities from a dealer pursuant to a TBA transaction and simultaneously agrees to sell
51
Core Bond Fund
similar securities in the future at a predetermined price. The securities bought in mortgage-dollar-roll transactions are used to cover an open TBA sell position. The fund continues to earn interest on mortgage-backed security pools already held and receives a lower price on the securities to be sold in the future. The fund accounts for mortgage-dollar-roll transactions as purchases and sales; as such, these transactions may increase the fund’s portfolio turnover rate. Amounts to be received or paid in connection with open mortgage dollar rolls are included in Receivables for Investment Securities Sold or Payables for Investment Securities Purchased in the Statement of Assets and Liabilities.
9. Federal Income Taxes: The fund intends to continue to qualify as a regulated investment company and distribute all of its taxable income. Management has analyzed the fund’s tax positions taken for all open federal income tax years (September 30, 2016–2017), and has concluded that no provision for federal income tax is required in the fund’s financial statements.
10. Distributions: Distributions to shareholders are recorded on the ex-dividend date.
11. Credit Facility: The fund and certain other funds managed by The Vanguard Group (“Vanguard”) participate in a $3.1 billion committed credit facility provided by a syndicate of lenders pursuant to a credit agreement that may be renewed annually; each fund is individually liable for its borrowings, if any, under the credit facility. Borrowings may be utilized for temporary and emergency purposes, and are subject to the fund’s regulatory and contractual borrowing restrictions. The participating funds are charged administrative fees and an annual commitment fee of 0.10% of the undrawn amount of the facility; these fees are allocated to the funds based on a method approved by the fund’s board of trustees and included in Management and Administrative expenses on the fund’s Statement of Operations. Any borrowings under this facility bear interest at a rate based upon the higher of the one-month London Interbank Offered Rate, federal funds effective rate, or overnight bank funding rate plus an agreed-upon spread.
The fund had no borrowings outstanding at September 30, 2017, or at any time during the period then ended.
12. Other: Interest income includes income distributions received from Vanguard Market Liquidity Fund and is accrued daily. Premiums and discounts on debt securities purchased are amortized and accreted, respectively, to interest income over the lives of the respective securities. Security transactions are accounted for on the date securities are bought or sold. Costs used to determine realized gains (losses) on the sale of investment securities are those of the specific securities sold.
Each class of shares has equal rights as to assets and earnings, except that each class separately bears certain class-specific expenses related to maintenance of shareholder accounts (included in Management and Administrative expenses), shareholder reporting, and the proxy. Marketing and distribution expenses are allocated to each class of shares based on a method approved by the board of trustees. Income, other non-class-specific expenses, and gains and losses on investments are allocated to each class of shares based on its relative net assets.
B. In accordance with the terms of a Funds’ Service Agreement (the “FSA”) between Vanguard and the fund, Vanguard furnishes to the fund investment advisory, corporate management, administrative, marketing, and distribution services at Vanguard’s cost of operations (as defined by the FSA). These costs of operations are allocated to the fund based on methods and guidelines approved by the board of trustees. Vanguard does not require reimbursement in the current period
52
Core Bond Fund
for certain costs of operations (such as deferred compensation/benefits and risk/insurance costs); the fund’s liability for these costs of operations is included in Payables to Vanguard on the Statement of Assets and Liabilities.
Upon the request of Vanguard, the fund may invest up to 0.40% of its net assets as capital in Vanguard. At September 30, 2017, the fund had contributed to Vanguard capital in the amount of $55,000, representing 0.01% of the fund’s net assets and 0.02% of Vanguard’s capitalization. The fund’s trustees and officers are also directors and employees, respectively, of Vanguard.
C. Various inputs may be used to determine the value of the fund’s investments. These inputs are summarized in three broad levels for financial statement purposes. The inputs or methodologies used to value securities are not necessarily an indication of the risk associated with investing in those securities.
Level 1—Quoted prices in active markets for identical securities.
Level 2—Other significant observable inputs (including quoted prices for similar securities, interest rates, prepayment speeds, credit risk, etc.).
Level 3—Significant unobservable inputs (including the fund’s own assumptions used to determine the fair value of investments). Any investments valued with significant unobservable inputs are noted on the Statement of Net Assets.
The following table summarizes the market value of the fund’s investments as of September 30, 2017, based on the inputs used to value them:
| | | |
| | Level 1 | Level 2 | Level 3 |
| Investments | ($000) | ($000) | ($000) |
| U.S. Government and Agency Obligations | — | 540,010 | — |
| Asset-Backed/Commercial Mortgage-Backed Securities | — | 66,164 | 1,379 |
| Corporate Bonds | — | 240,563 | — |
| Sovereign Bonds | — | 31,342 | — |
| Taxable Municipal Bonds | — | 1,283 | — |
| Temporary Cash Investments | 49,632 | — | — |
| Options Purchased | 5 | 1 | — |
| Liability for Option Written | (61) | (5) | — |
| Futures Contracts—Assets1 | 173 | — | — |
| Futures Contracts—Liabilities1 | (149) | — | — |
| Forward Currency Contracts—Assets | — | 365 | — |
| Forward Currency Contracts—Liabilities | — | (79) | — |
| Swap Contracts—Assets | 41 | 15 | — |
| Swap Contracts—Liabilities | (9)1 | (249) | — |
| Total | 49,595 | 879,410 | 1,379 |
| 1 Represents variation margin on the last day of the reporting period. | | | |
53
Core Bond Fund
D. At September 30, 2017, the fair values of derivatives were reflected in the Statement of Assets and Liabilities as follows:
| | | | |
| Interest Rate | Currency | Credit | |
| | Contracts | Contracts | Contracts | Total |
| Statement of Assets and Liabilities Caption | ($000) | ($000) | ($000) | ($000) |
| Options Purchased | 5 | — | 1 | 6 |
| Variation Margin Receivable—Futures Contracts | 173 | — | — | 173 |
| Variation Margin Receivable—Swap Contracts | — | — | 4 | 4 |
| Unrealized Appreciation—Forwards Contracts | — | 365 | — | 365 |
| Unrealized Appreciation—Swap Contracts | — | — | 15 | 15 |
| Liability for Options Written | (61) | — | (5) | (66) |
| Variation Margin Payable—Futures Contracts | (149) | — | — | (149) |
| Variation Margin Payable—Swap Contracts | (5) | — | (4) | (9) |
| Unrealized Depreciation—Forwards Contracts | — | (79) | — | (79) |
| Unrealized Depreciation—Swap Contracts | — | — | (249) | (249) |
Realized net gain (loss) and the change in unrealized appreciation (depreciation) on derivatives for the year ended September 30, 2017, were:
| | | | |
| | Interest Rate | Currency | Credit | |
| | Contracts | Contracts | Contracts | Total |
| Realized Net Gain (Loss) on Derivatives | ($000) | ($000) | ($000) | ($000) |
| Futures Contracts | 140 | — | — | 140 |
| Options | 189 | — | 8 | 197 |
| Swap Contracts | (189) | — | (654) | (843) |
| Forward Currency Contracts | — | (1,713) | — | (1,713) |
| Realized Net Gain (Loss) on Derivatives | 140 | (1,713) | (646) | (2,219) |
| |
| Change in Unrealized Appreciation (Depreciation) on Derivatives | | | |
| Futures Contracts | (343) | — | — | (343) |
| Options | (19) | — | (1) | (20) |
| Swap Contracts | (39) | — | (283) | (322) |
| Forward Currency Contracts | — | 192 | — | 192 |
| Change in Unrealized Appreciation | | | | |
| (Depreciation) on Derivatives | (401) | 192 | (284) | (493) |
E. Capital gain distributions are determined on a tax basis and may differ from realized capital gains for financial reporting purposes. Differences may be permanent or temporary. Permanent differences are reclassified among capital accounts in the financial statements to reflect their tax character. Temporary differences arise when gains or losses are recognized in different periods for financial statement and tax purposes. These differences will reverse at some time in the future.
54
Core Bond Fund
During the year ended September 30, 2017, the fund realized net foreign currency losses of $554,000 (including gains and losses on foreign currency contracts and the foreign currency component on sales of foreign currency denominated bonds), which decreased distributable net income for tax purposes; accordingly, such losses have been reclassified from accumulated net realized losses to undistributed net investment income.
Realized and unrealized gains (losses) on certain of the fund’s swap contracts are treated as ordinary income (loss) for tax purposes; the effect on the fund’s income dividends to shareholders is offset by a change in principal return. Realized losses of $430,000 on swap contracts have been reclassified from accumulated net realized losses to undistributed net investment income.
For tax purposes, at September 30, 2017, the fund had $989,000 of ordinary income available for distribution. The fund had available capital losses totaling $3,197,000 that may be carried forward indefinitely to offset future net capital gains.
At September 30, 2017, the cost of investment securities for tax purposes was $931,660,000. Net unrealized depreciation of investment securities for tax purposes was $1,287,000, consisting of unrealized gains of $5,267,000 on securities that had risen in value since their purchase and $6,554,000 in unrealized losses on securities that had fallen in value since their purchase.
F. During the year ended September 30, 2017, the fund purchased $361,300,000 of investment securities and sold $294,342,000 of investment securities, other than U.S. government securities and temporary cash investments. Purchases and sales of U.S. government securities were $1,496,675,000 and $1,313,549,000, respectively.
| | | | |
| G. Capital share transactions for each class of shares were: | | | |
| | | Year Ended | March 10, 20161 to |
| | September 30, 2017 | September 30, 2016 |
| | Amount | Shares | Amount | Shares |
| | ($000) | (000) | ($000) | (000) |
| Investor Shares | | | | |
| Issued | 78,467 | 7,878 | 89,670 | 8,892 |
| Issued in Lieu of Cash Distributions | 1,647 | 166 | 482 | 47 |
| Redeemed | (52,731) | (5,298) | (26,638) | (2,623) |
| Net Increase (Decrease)—Investor Shares | 27,383 | 2,746 | 63,514 | 6,316 |
| Admiral Shares | | | | |
| Issued | 451,536 | 22,676 | 614,186 | 30,451 |
| Issued in Lieu of Cash Distributions | 14,233 | 719 | 4,207 | 206 |
| Redeemed | (235,815) | (11,869) | (50,933) | (2,498) |
| Net Increase (Decrease)—Admiral Shares | 229,954 | 11,526 | 567,460 | 28,159 |
| 1 Commencement of subscription period for the fund. | | | | |
At September 30, 2017, one shareholder was the record or beneficial owner of 25% of the fund’s net assets. If the shareholder were to redeem its investment in the fund, the redemption might result in an increase in the fund’s expense ratio, cause the fund to incur higher transaction costs, or lead to the realization of taxable capital gains.
H. Management has determined that no material events or transactions occurred subsequent to September 30, 2017, that would require recognition or disclosure in these financial statements.
55
Report of Independent Registered Public Accounting Firm
To the Board of Trustees of Vanguard Malvern Funds and the Shareholders of Vanguard Core Bond Fund
In our opinion, the accompanying statement of net assets, statement of assets and liabilities and the related statements of operations and of changes in net assets and the financial highlights present fairly, in all material respects, the financial position of Vanguard Core Bond Fund (constituting a separate portfolio of Vanguard Malvern Funds, hereafter referred to as the “Fund”) as of September 30, 2017, the results of its operations for the year then ended, and the changes in its net assets and the financial highlights for the year then ended and for the period March 10, 2016 (commencement of operations) through September 30, 2016, in conformity with accounting principles generally accepted in the United States of America. These financial statements and financial highlights (hereafter referred to as “financial statements”) are the responsibility of the Fund’s management. Our responsibility is to express an opinion on these financial statements based on our audits. We conducted our audits of these financial statements in accordance with the standards of the Public Company Accounting Oversight Board (United States). Those standards require that we plan and perform the audit to obtain reasonable assurance about whether the financial statements are free of material misstatement. An audit includes examining, on a test basis, evidence supporting the amounts and disclosures in the financial statements, assessing the accounting principles used and significant estimates made by management, and evaluating the overall financial statement presentation. We believe that our audits, which included confirmation of securities as of September 30, 2017 by correspondence with the custodian and brokers and by agreement to the underlying ownership records of the transfer agent, provide a reasonable basis for our opinion.
/s/PricewaterhouseCoopers LLP
Philadelphia, Pennsylvania
November 16, 2017
Special 2017 tax information (unaudited) for Vanguard Core Bond Fund
This information for the fiscal year ended September 30, 2017, is included pursuant to provisions
of the Internal Revenue Code.
For nonresident alien shareholders, 100% of short-term capital gain dividends distributed by the
fund are qualified short-term capital gains.
For nonresident alien shareholders, 80.8% of income dividends are interest-related dividends.
56
About Your Fund’s Expenses
As a shareholder of the fund, you incur ongoing costs, which include costs for portfolio management, administrative services, and shareholder reports (like this one), among others. Operating expenses, which are deducted from a fund’s gross income, directly reduce the investment return of the fund.
A fund’s expenses are expressed as a percentage of its average net assets. This figure is known as the expense ratio. The following examples are intended to help you understand the ongoing costs (in dollars) of investing in your fund and to compare these costs with those of other mutual funds. The examples are based on an investment of $1,000 made at the beginning of the period shown and held for the entire period.
The accompanying table illustrates your fund’s costs in two ways:
• Based on actual fund return. This section helps you to estimate the actual expenses that you paid over the period. The ”Ending Account Value“ shown is derived from the fund‘s actual return, and the third column shows the dollar amount that would have been paid by an investor who started with $1,000 in the fund. You may use the information here, together with the amount you invested, to estimate the expenses that you paid over the period.
To do so, simply divide your account value by $1,000 (for example, an $8,600 account value divided by $1,000 = 8.6), then multiply the result by the number given for your fund under the heading ”Expenses Paid During Period.“
• Based on hypothetical 5% yearly return. This section is intended to help you compare your fund‘s costs with those of other mutual funds. It assumes that the fund had a yearly return of 5% before expenses, but that the expense ratio is unchanged. In this case—because the return used is not the fund’s actual return—the results do not apply to your investment. The example is useful in making comparisons because the Securities and Exchange Commission requires all mutual funds to calculate expenses based on a 5% return. You can assess your fund’s costs by comparing this hypothetical example with the hypothetical examples that appear in shareholder reports of other funds.
Note that the expenses shown in the table are meant to highlight and help you compare ongoing costs only and do not reflect transaction costs incurred by the fund for buying and selling securities. Further, the expenses do not include any purchase, redemption, or account service fees described in the fund prospectus. If such fees were applied to your account, your costs would be higher. Your fund does not carry a “sales load.”
The calculations assume no shares were bought or sold during the period. Your actual costs may have been higher or lower, depending on the amount of your investment and the timing of any purchases or redemptions.
You can find more information about the fund’s expenses, including annual expense ratios, in the Financial Statements section of this report. For additional information on operating expenses and other shareholder costs, please refer to your fund’s current prospectus.
57
| | | |
| Six Months Ended September 30, 2017 | | | |
| | Beginning | Ending | Expenses |
| | Account Value | Account Value | Paid During |
| Core Bond Fund | 3/31/2017 | 9/30/2017 | Period |
| Based on Actual Fund Return | | | |
| Investor Shares | $1,000.00 | $1,022.64 | $1.27 |
| Admiral Shares | 1,000.00 | 1,023.21 | 0.76 |
| Based on Hypothetical 5% Yearly Return | | | |
| Investor Shares | $1,000.00 | $1,023.82 | $1.27 |
| Admiral Shares | 1,000.00 | 1,024.32 | 0.76 |
The calculations are based on expenses incurred in the current period. The fund’s annualized expense ratios for that period are 0.25% for Investor Shares and 0.15% for Admiral Shares. The dollar amounts shown as “Expenses Paid” are equal to the annualized expense ratio multiplied by the average account value over the period, multiplied by the number of days in the current period, then divided by the number of days in the most recent 12-month period (183/365).
58
Glossary
30-Day SEC Yield. A fund’s 30-day SEC yield is derived using a formula specified by the U.S. Securities and Exchange Commission. Under the formula, data related to the fund’s security holdings in the previous 30 days are used to calculate the fund’s hypothetical net income for that period, which is then annualized and divided by the fund’s estimated average net assets over the calculation period. For the purposes of this calculation, a security’s income is based on its current market yield to maturity (for bonds), its actual income (for asset-backed securities), or its projected dividend yield (for stocks). Because the SEC yield represents hypothetical annualized income, it will differ—at times significantly—from the fund’s actual experience. As a result, the fund’s income distributions may be higher or lower than implied by the SEC yield.
Average Coupon. The average interest rate paid on the fixed income securities held by a fund. It is expressed as a percentage of face value.
Average Duration. An estimate of how much the value of the bonds held by a fund will fluctuate in response to a change in interest rates. To see how the value could change, multiply the average duration by the change in rates. If interest rates rise by 1 percentage point, the value of the bonds in a fund with an average duration of five years would decline by about 5%. If rates decrease by a percentage point, the value would rise by 5%.
Average Effective Maturity. The average length of time until fixed income securities held by a fund reach maturity and are repaid, taking into consideration the possibility that the issuer may call the bond before its maturity date. The figure reflects the proportion of fund assets represented by each security; it also reflects any futures contracts held. In general, the longer the average effective maturity, the more a fund’s share price will fluctuate in response to changes in market interest rates.
Credit Quality. Credit-quality ratings are measured on a scale that generally ranges from AAA (highest) to D (lowest). U.S. Treasury, U.S. Agency, and U.S. Agency mortgage-backed securities appear under “U.S. Government.” Credit-quality ratings are obtained from Moody’s and S&P, and the higher rating for each issue is shown. ”Not Rated” is used to classify securities for which a rating is not available. Not rated securities include a fund’s investment in Vanguard Market Liquidity Fund or Vanguard Municipal Cash Management Fund, each of which invests in high-quality money market instruments and may serve as a cash management vehicle for the Vanguard funds, trusts, and accounts.
Expense Ratio. A fund’s total annual operating expenses expressed as a percentage of the fund’s average net assets. The expense ratio includes management and administrative expenses, but does not include the transaction costs of buying and selling portfolio securities.
Inception Date. The date on which the assets of a fund (or one of its share classes) are first invested in accordance with the fund’s investment objective. For funds with a subscription period, the inception date is the day after that period ends. Investment performance is measured from the inception date.
Short-Term Reserves. The percentage of a fund invested in highly liquid, short-term securities that can be readily converted to cash.
Yield to Maturity. The rate of return an investor would receive if the fixed income securities held by a fund were held to their maturity dates.
59
BLOOMBERG is a trademark and service mark of Bloomberg Finance L.P. BARCLAYS is a trademark and service mark of Barclays Bank Plc, used under license. Bloomberg Finance L.P. and its affiliates, including Bloomberg Index Services Limited (BISL) (collectively, Bloomberg), or Bloomberg’s licensors, own all proprietary rights in the Bloomberg Barclays U.S. Aggregate Float Adjusted Index (Index or Bloomberg Barclays Index).
Neither Barclays Bank Plc, Barclays Capital Inc., or any affiliate (collectively Barclays) or Bloomberg is the issuer or producer of the Core Bond Fund and neither Bloomberg nor Barclays has any responsibilities, obligations or duties to investors in the Core Bond Fund. The Index is licensed for use by The Vanguard Group, Inc. (Vanguard) as the sponsor of the Core Bond Fund. Bloomberg and Barclays’ only relationship with Vanguard in respect of the Index is the licensing of the Index, which is determined, composed and calculated by BISL, or any successor thereto, without regard to the Issuer or the Core Bond Fund or the owners of the Core Bond Fund.
Additionally, Vanguard may for itself execute transaction(s) with Barclays in or relating to the Index in connection with the Core Bond Fund. Investors acquire the Core Bond Fund from Vanguard and investors neither acquire any interest in the Index nor enter into any relationship of any kind whatsoever with Bloomberg or Barclays upon making an investment in the Core Bond Fund. The Core Bond Fund is not sponsored, endorsed, sold or promoted by Bloomberg or Barclays. Neither Bloomberg nor Barclays makes any representation or warranty, express or implied regarding the advisability of investing in the Core Bond Fund or the advisability of investing in securities generally or the ability of the Index to track corresponding or relative market performance. Neither Bloomberg nor Barclays has passed on the legality or suitability of the Core Bond Fund with respect to any person or entity. Neither Bloomberg nor Barclays is responsible for and has not participated in the determination of the timing of, prices at, or quantities of the Core Bond Fund to be issued. Neither Bloomberg nor Barclays has any obligation to take the needs of the Issuer or the owners of the Core Bond Fund or any other third party into consideration in determining, composing or calculating the Index. Neither Bloomberg nor Barclays has any obligation or liability in connection with administration, marketing or trading of the Core Bond Fund.
The licensing agreement between Bloomberg and Barclays is solely for the benefit of Bloomberg and Barclays and not for the benefit of the owners of the Core Bond Fund, investors or other third parties. In addition, the licensing agreement between Vanguard and Bloomberg is solely for the benefit of Vanguard and Bloomberg and not for the benefit of the owners of the Core Bond Fund, investors or other third parties.
NEITHER BLOOMBERG NOR BARCLAYS SHALL HAVE ANY LIABILITY TO THE ISSUER, INVESTORS OR TO OTHER THIRD PARTIES FOR THE QUALITY, ACCURACY AND/OR COMPLETENESS OF THE BLOOMBERG BARCLAYS INDEX OR ANY DATA INCLUDED THEREIN OR FOR INTERRUPTIONS IN THE DELIVERY OF THE BLOOMBERG BARCLAYS INDEX. NEITHER BLOOMBERG NOR BARCLAYS MAKES ANY WARRANTY, EXPRESS OR IMPLIED, AS TO RESULTS TO BE OBTAINED BY THE ISSUER, THE INVESTORS OR ANY OTHER PERSON OR ENTITY FROM THE USE OF THE BLOOMBERG BARCLAYS INDEX OR ANY DATA INCLUDED THEREIN. NEITHER BLOOMBERG NOR BARCLAYS MAKES ANY EXPRESS OR IMPLIED WARRANTIES, AND EACH HEREBY EXPRESSLY DISCLAIMS ALL WARRANTIES OF MERCHANTABILITY OR FITNESS FOR A PARTICULAR PURPOSE OR USE WITH RESPECT TO THE BLOOMBERG BARCLAYS INDEX OR ANY DATA INCLUDED THEREIN. BLOOMBERG RESERVES THE RIGHT TO CHANGE THE METHODS OF CALCULATION OR PUBLICATION, OR TO CEASE THE CALCULATION OR PUBLICATION OF THE BLOOMBERG BARCLAYS INDEX, AND NEITHER BLOOMBERG
NOR BARCLAYS SHALL BE LIABLE FOR ANY MISCALCULATION OF OR ANY INCORRECT, DELAYED OR INTERRUPTED PUBLICATION WITH RESPECT TO THE BLOOMBERG BARCLAYS INDEX. NEITHER BLOOMBERG NOR BARCLAYS SHALL BE LIABLE FOR ANY DAMAGES, INCLUDING, WITHOUT LIMITATION, ANY SPECIAL, INDIRECT OR CONSEQUENTIAL DAMAGES, OR ANY LOST PROFITS AND EVEN IF ADVISED OF THE POSSIBLITY OF SUCH, RESULTING FROM THE USE OF THE BLOOMBERG BARCLAYS INDEX OR ANY DATA INCLUDED THEREIN OR WITH RESPECT TO THE CORE BOND FUND.
None of the information supplied by Bloomberg or Barclays and used in this publication may be reproduced in any manner without the prior written permission of both Bloomberg and Barclays Capital, the investment banking division of Barclays Bank Plc. Barclays Bank Plc is registered in England No. 1026167. Registered office 1 Churchill Place London E14 5HP.
© 2017 Bloomberg. Used with Permission.
Source: Bloomberg Index Services Limited. Copyright 2017, Bloomberg. All rights reserved.
60
This page intentionally left blank.
This page intentionally left blank.
The People Who Govern Your Fund
The trustees of your mutual fund are there to see that the fund is operated and managed in your best interests since, as a shareholder, you are a part owner of the fund. Your fund’s trustees also serve on the board of directors of The Vanguard Group, Inc., which is owned by the Vanguard funds and provides services to them on an at-cost basis.
A majority of Vanguard’s board members are independent, meaning that they have no affiliation with Vanguard or the funds they oversee, apart from the sizable personal investments they have made as private individuals. The independent board members have distinguished backgrounds in business, academia, and public service. Each of the trustees and executive officers oversees 198 Vanguard funds.
Information for each trustee and executive officer of the fund appears below. The mailing address of the trustees and officers is P.O. Box 876, Valley Forge, PA 19482. More information about the trustees is in the Statement of Additional Information, which can be obtained, without charge, by contacting Vanguard at 800-662-7447, or online at vanguard.com.
Interested Trustee1
F. William McNabb III
Born 1957. Trustee Since July 2009. Chairman of the Board. Principal Occupation(s) During the Past Five Years and Other Experience: Chairman of the Board of The Vanguard Group, Inc., and of each of the investment companies served by The Vanguard Group, since January 2010; Chief Executive Officer and Director of The Vanguard Group and President and Chief Executive Officer of each of the investment companies served by The Vanguard Group, since 2008; Director of Vanguard Marketing Corporation; President of The Vanguard Group (2008–2017); Managing Director of The Vanguard Group (1995–2008).
Independent Trustees
Emerson U. Fullwood
Born 1948. Trustee Since January 2008. Principal Occupation(s) During the Past Five Years and Other Experience: Executive Chief Staff and Marketing Officer for North America and Corporate Vice President (retired 2008) of Xerox Corporation (document management products and services);
Executive in Residence and 2009–2010 Distinguished Minett Professor at the Rochester Institute of Technology; Lead Director of SPX FLOW, Inc. (multi-industry manufacturing); Director of the United Way of Rochester, the University of Rochester Medical Center, Monroe Community College Foundation, North Carolina A&T University, and Roberts Wesleyan College; Trustee of the University of Rochester.
Rajiv L. Gupta
Born 1945. Trustee Since December 2001.2 Principal Occupation(s) During the Past Five Years and Other Experience: Chairman and Chief Executive Officer (retired 2009) and President (2006–2008) of Rohm and Haas Co. (chemicals); Director of Arconic Inc. (diversified manufacturer), HP Inc. (printer and personal computer manufacturing), and Delphi Automotive plc (automotive components); Senior Advisor at New Mountain Capital.
Amy Gutmann
Born 1949. Trustee Since June 2006. Principal Occupation(s) During the Past Five Years and Other Experience: President of the University of Pennsylvania; Christopher H. Browne
1 Mr. McNabb is considered an “interested person,” as defined in the Investment Company Act of 1940, because he is an officer of the Vanguard funds.
2 December 2002 for Vanguard Equity Income Fund, the Vanguard Municipal Bond Funds, and the Vanguard State Tax-Exempt Funds.
Distinguished Professor of Political Science, School of Arts and Sciences, and Professor of Communication, Annenberg School for Communication, with secondary faculty appointments in the Department of Philosophy, School of Arts and Sciences, and at the Graduate School of Education, University of Pennsylvania; Trustee of the National Constitution Center.
JoAnn Heffernan Heisen
Born 1950. Trustee Since July 1998. Principal Occupation(s) During the Past Five Years and Other Experience: Corporate Vice President and Member of the Executive Committee (1997–2008), Chief Global Diversity Officer (retired 2008), Vice President and Chief Information Officer (1997–2006), Controller (1995–1997), Treasurer (1991–1995), and Assistant Treasurer (1989–1991) of Johnson & Johnson (pharmaceuticals/medical devices/ consumer products); Director of Skytop Lodge Corporation (hotels) and the Robert Wood Johnson Foundation; Member of the Advisory Board of the Institute for Women’s Leadership at Rutgers University.
F. Joseph Loughrey
Born 1949. Trustee Since October 2009. Principal Occupation(s) During the Past Five Years and Other Experience: President and Chief Operating Officer (retired 2009) of Cummins Inc. (industrial machinery); Chairman of the Board of Hillenbrand, Inc. (specialized consumer services), Oxfam America, and the Lumina Foundation for Education; Director of the V Foundation for Cancer Research; Member of the Advisory Council for the College of Arts and Letters and Chair of the Advisory Board to the Kellogg Institute for International Studies, both at the University of Notre Dame.
Mark Loughridge
Born 1953. Trustee Since March 2012. Principal Occupation(s) During the Past Five Years and Other Experience: Senior Vice President and Chief Financial Officer (retired 2013) at IBM (information technology services); Fiduciary Member of IBM’s Retirement Plan Committee (2004–2013); Member of the Council on Chicago Booth.
Scott C. Malpass
Born 1962. Trustee Since March 2012. Principal Occupation(s) During the Past Five Years and Other Experience: Chief Investment Officer and Vice President at the University of Notre Dame; Assistant Professor of Finance at the Mendoza College of Business at Notre Dame; Member of the Notre Dame 403(b) Investment Committee, the Board of Advisors for Spruceview Capital Partners, the Board of Catholic Investment Services, Inc. (investment advisor), and the Board of Superintendence of the Institute for the Works of Religion; Chairman of the Board of TIFF Advisory Services, Inc. (investment advisor).
André F. Perold
Born 1952. Trustee Since December 2004. Principal Occupation(s) During the Past Five Years and Other Experience: George Gund Professor of Finance and Banking, Emeritus at the Harvard Business School (retired 2011); Chief Investment Officer and Co-Managing Partner of HighVista Strategies LLC (private investment firm); Overseer of the Museum of Fine Arts Boston.
Peter F. Volanakis
Born 1955. Trustee Since July 2009. Principal Occupation(s) During the Past Five Years and Other Experience: President and Chief Operating Officer (retired 2010) of Corning Incorporated (communications equipment); Chairman of the Board of Trustees of Colby-Sawyer College; Member of the Board of Hypertherm, Inc. (industrial cutting systems, software, and consumables).
Executive Officers
Glenn Booraem
Born 1967. Investment Stewardship Officer Since February 2017. Principal Occupation(s) During the Past Five Years and Other Experience: Principal of The Vanguard Group, Inc.; Treasurer (2015–2017), Controller (2010–2015), and Assistant Controller (2001–2010) of each of the investment companies served by The Vanguard Group.
Thomas J. Higgins
Born 1957. Chief Financial Officer Since September 2008. Principal Occupation(s) During the Past Five Years and Other Experience: Principal of The Vanguard Group, Inc.; Chief Financial Officer of each of the investment companies served by The Vanguard Group; Treasurer of each of the investment companies served by The Vanguard Group (1998–2008).
Peter Mahoney
Born 1974. Controller Since May 2015. Principal Occupation(s) During the Past Five Years and Other Experience: Principal of The Vanguard Group, Inc.; Controller of each of the investment companies served by The Vanguard Group; Head of International Fund Services at The Vanguard Group (2008–2014).
Anne E. Robinson
Born 1970. Secretary Since September 2016. Principal Occupation(s) During the Past Five Years and Other Experience: Managing Director of The Vanguard Group, Inc.; General Counsel of The Vanguard Group; Secretary of The Vanguard Group and of each of the investment companies served by The Vanguard Group; Director and Senior Vice President of Vanguard Marketing Corporation; Managing Director and General Counsel of Global Cards and Consumer Services at Citigroup (2014–2016); Counsel at American Express (2003–2014).
Michael Rollings
Born 1963. Treasurer Since February 2017. Principal Occupation(s) During the Past Five Years and Other Experience: Managing Director of The Vanguard Group, Inc.; Treasurer of each of the investment companies served by The Vanguard Group; Director of Vanguard Marketing Corporation; Executive Vice President and Chief Financial Officer of MassMutual Financial Group (2006–2016).
| |
| Vanguard Senior Management Team |
| |
| Mortimer J. Buckley | Chris D. McIsaac |
| Gregory Davis | James M. Norris |
| John James | Thomas M. Rampulla |
| Martha G. King | Karin A. Risi |
| John T. Marcante | |
Chairman Emeritus and Senior Advisor
John J. Brennan
Chairman, 1996–2009
Chief Executive Officer and President, 1996–2008
Founder
John C. Bogle
Chairman and Chief Executive Officer, 1974–1996
| |
| | 
|
| | P.O. Box 2600 |
| | Valley Forge, PA 19482-2600 |
| |
| |
| |
| Connect with Vanguard® > | vanguard.com |
| |
| |
| |
| Fund Information > 800-662-7447 | CFA® is a registered trademark owned by CFA Institute. |
| Direct Investor Account Services > 800-662-2739 |
| Institutional Investor Services > 800-523-1036 |
| Text Telephone for People | |
| Who Are Deaf or Hard of Hearing> 800-749-7273 |
| |
| This material may be used in conjunction |
| with the offering of shares of any Vanguard |
| fund only if preceded or accompanied by |
| the fund’s current prospectus. | |
| |
| All comparative mutual fund data are from Lipper, a |
| Thomson Reuters Company, or Morningstar, Inc., unless |
| otherwise noted. | |
| |
| You can obtain a free copy of Vanguard’s proxy voting |
| guidelines by visiting vanguard.com/proxyreporting or by |
| calling Vanguard at 800-662-2739. The guidelines are |
| also available from the SEC’s website, sec.gov. In |
| addition, you may obtain a free report on how your fund |
| voted the proxies for securities it owned during the 12 |
| months ended June 30. To get the report, visit either |
| vanguard.com/proxyreporting or sec.gov. |
| |
| You can review and copy information about your fund at |
| the SEC’s Public Reference Room in Washington, D.C. To |
| find out more about this public service, call the SEC at |
| 202-551-8090. Information about your fund is also |
| available on the SEC’s website, and you can receive |
| copies of this information, for a fee, by sending a |
| request in either of two ways: via email addressed to |
| publicinfo@sec.gov or via regular mail addressed to the |
| Public Reference Section, Securities and Exchange |
| Commission, Washington, DC 20549-1520. |
| | © 2017 The Vanguard Group, Inc. |
| | All rights reserved. |
| | Vanguard Marketing Corporation, Distributor. |
| |
| | Q13200 112017 |

Annual Report | September 30, 2017
Vanguard Emerging Markets Bond Fund
Vanguard’s Principles for Investing Success
We want to give you the best chance of investment success. These principles, grounded in Vanguard’s research and experience, can put you on the right path.
Goals. Create clear, appropriate investment goals.
Balance. Develop a suitable asset allocation using broadly diversified funds. Cost. Minimize cost.
Discipline. Maintain perspective and long-term discipline.
A single theme unites these principles: Focus on the things you can control.
We believe there is no wiser course for any investor.
| |
| Contents | |
| |
| Your Fund’s Performance at a Glance | 1 |
| Chairman’s Perspective | 2 |
| Advisor’s Report | 6 |
| Fund Profile | 9 |
| Performance Summary | 11 |
| Financial Statements | 12 |
| About Your Fund’s Expenses | 31 |
| Glossary | 33 |
Please note: The opinions expressed in this report are just that—informed opinions. They should not be considered promises or advice. Also, please keep in mind that the information and opinions cover the period through the date on the front of this report. Of course, the risks of investing in your fund are spelled out in the prospectus.
See the Glossary for definitions of investment terms used in this report.
About the cover: Nautical images have been part of Vanguard’s rich heritage since its start in 1975. For an incoming ship, a lighthouse offers a beacon and safe path to shore. You can similarly depend on Vanguard to put you first––and light the way––as you strive to meet your financial goals. Our client focus and low costs, stemming from our unique ownership structure, assure that your interests are paramount.
Your Fund’s Performance at a Glance
• Vanguard Emerging Markets Bond Fund returned 7.01% for the 12 months ended
September 30, 2017. It outpaced its benchmark index by well over two percentage
points and finished a little ahead of its peer group.
• Emerging-market bonds initially slumped after the U.S. election amid fears of rising
interest rates and more protectionist trade policies but then made solid gains as the
outlook for global growth improved, the U.S. dollar weakened, and investors continued
to reach for yield.
• The fund benefited from its exposure to Brazil, where despite political turmoil,
reforms continued to grind forward and the economy pulled out of recession.
Argentina was another bright spot, with the government’s reform agenda helping
to boost confidence and foster economic growth.
• Selective out-of-benchmark positions in corporate bonds were another positive,
as their spreads tightened over the period.
| | | | |
| Total Returns: Fiscal Year Ended September 30, 2017 | | | | |
| 30-Day | Income | Capital | Total |
| SEC Yield | Returns | Returns | Returns |
| Vanguard Emerging Markets Bond Fund | 3.98% | 5.11% | 1.90% | 7.01% |
| J.P. Morgan EMBI Global Diversified Index | 4.61 |
| Emerging Markets Hard Currency Debt Funds Average | | | | 6.85 |
Emerging Markets Hard Currency Debt Funds Average: Derived from data provided by Lipper, a Thomson Reuters Company.
| | |
| Expense Ratios | | |
| Your Fund Compared With Its Peer Group | | |
| | Peer Group |
| Fund | Average |
| Emerging Markets Bond Fund | 0.60% | 1.16% |
The fund expense ratio shown is from the prospectus dated January 26, 2017, and represents estimated costs for the current fiscal year. For the fiscal year ended September 30, 2017, the fund’s expense ratio was 0.60%. The peer-group expense ratio is derived from data provided by Lipper Inc., a Thomson Reuters Company, and captures information through year-end 2016.
Peer group: Emerging Markets Hard Currency Debt Funds.
1
Chairman’s Perspective

Bill McNabb
Chairman and Chief Executive Officer
Dear Shareholder,
Our investors depend on Vanguard to be a responsible steward of their assets. This includes our obvious responsibilities—managing the funds, offering investment perspectives and advice, and assisting with questions and transactions.
But because a long-term perspective informs every aspect of our investment approach, we also work on your behalf in less obvious ways, such as by advocating for responsible governance among the companies in which Vanguard funds invest. Vanguard’s index funds are essentially permanent owners of thousands of publicly traded companies, and we have a special obligation to be engaged stewards actively focused on the long term.
Simply put, we believe that well-governed companies are more likely to perform well over the long run.
Although Vanguard has always been an advocate for strong corporate governance, we have expanded our efforts recently as our investor base continues to grow. Our Investment Stewardship team has doubled in size since 2015, and we continue to add analysts, researchers, and operations team members. The team guides our engagement activities and our funds’ proxy voting by analyzing corporate governance practices in companies around the world.
2
Our four Investment Stewardship pillars
As we evaluate company responsiveness to governance matters, including environmental and social concerns, we focus on four key areas—what we call our Investment Stewardship pillars:
• The board: A high-functioning, well-composed, independent, diverse, and experienced board with effective ongoing evaluation practices.
• Governance structures: Provisions and structures that empower shareholders and protect their rights.
• Appropriate compensation: Pay that incentivizes relative outperformance over the long term.
• Risk oversight: Effective, integrated, and ongoing oversight of relevant industry-and company-specific risks.
Guided by these pillars, our Investment Stewardship team conducted more than 950 engagements, or discussions, with company directors and leaders worldwide during the 12 months ended June 30, 2017.
| | | |
| Market Barometer | | | |
| | Average Annual Total Returns |
| Periods Ended September 30, 2017 |
| One Year | Three Years | Five Years |
| Stocks | | | |
| Russell 1000 Index (Large-caps) | 18.54% | 10.63% | 14.27% |
| Russell 2000 Index (Small-caps) | 20.74 | 12.18 | 13.79 |
| Russell 3000 Index (Broad U.S. market) | 18.71 | 10.74 | 14.23 |
| FTSE All-World ex US Index (International) | 19.49 | 5.11 | 7.35 |
| |
| Bonds | | | |
| Bloomberg Barclays U.S. Aggregate Bond Index | | | |
| (Broad taxable market) | 0.07% | 2.71% | 2.06% |
| Bloomberg Barclays Municipal Bond Index | | | |
| (Broad tax-exempt market) | 0.87 | 3.19 | 3.01 |
| Citigroup Three-Month U.S. Treasury Bill Index | 0.64 | 0.28 | 0.18 |
| |
| CPI | | | |
| Consumer Price Index | 2.23% | 1.22% | 1.30% |
3
We also cast more than 171,000 votes on behalf of Vanguard funds at more than 18,000 shareholder meetings.
Gender diversity on boards and climate risk
As we engage with companies, we are devoting increased attention to two specific topics. The first is gender diversity on boards. It’s no secret that the right combination of talent, skills, and experience leads to better results, so we pay close attention to how company boards are structured and managed, and how they evolve.
In recent years, a growing body of research has demonstrated that greater diversity on boards can lead to improved governance and company performance. We are advocating for boards to incorporate diverse perspectives and experience into their strategic planning and decision-making. One example of our commitment to more diverse boards is our participation in the 30% Club, a global coalition working to increase the representation of women in boardrooms and leadership roles.
The second issue is climate risk. We will continue to engage with companies to understand their responses to this risk. Regardless of one’s perspective on the issue, the potential is real for changing regulations, demographics, and consumption behavior to affect business results for companies in many sectors.
We want to ensure that such business and regulatory risks are sufficiently disclosed so investors can value companies appropriately. In the past year, we have voted for shareholder proposals at several energy companies that called for management to improve its climate risk assessment and planning, and we will consider supporting similar proposals if we believe they are beneficial to long-term shareholder value. When a proposal from a shareholder presents a strong case for change, we’re more than willing to fully consider it. And even if the case falls short, these proposals often catalyze a discussion that generates meaningful change over time.
In addition to considering activists’ proposals, we consult research providers and our own network of experts. When we detect material risks to a company’s long-term value (such as bad leadership, poor disclosure, misaligned compensation structures, or threats to shareholder rights), we act with our voice and our vote.
Our stewardship reflects our mission
But we don’t act as independent agents with our own agenda. Every time we speak with a company chairman, CEO, or director, we’re acutely aware of the role we play in representing the economic interests of more than 20 million Vanguard investors. So you can expect us to speak out when we detect threats to the economic interests of our shareholders.
4
We take positions on these matters not because they are inherently good or noble but because they are tied to the long-term economic value of your funds’ investments.
You trust us to represent your interests across the globe. You can be confident we act on that responsibility with the seriousness and dedication it deserves.
To learn more about our Investment Stewardship program, including how our funds have voted, visit https://about. vanguard.com/investment-stewardship/.
As always, thank you for investing with Vanguard.

F. William McNabb III
Chairman and Chief Executive Officer
October 13, 2017
5
Advisor’s Report
For the 12 months ended September 30, 2017, Vanguard Emerging Markets Bond Fund returned 7.01%. Its benchmark, the J.P. Morgan EMBI Global Diversified Index, returned 4.61%. The average return of its peer group of emerging-market hard currency debt funds was 6.85%. (A “hard currency” is one that is issued by an economically and politically stable country and is widely used around the world as payment for goods and services.)
The investment environment
After a rocky start, emerging-market bonds produced solid returns for the fiscal year. The United States election results initially stoked market fears that the Republican policy agenda would lead to higher inflation, a stronger U.S. dollar, and the implementation of protectionist trade policies. The last point was particularly important for emerging markets, as they have been some of the biggest beneficiaries of the expansion of global trade in recent decades. Those concerns faded, however, and emerging-market bonds benefited from strong investor inflows amid a backdrop of more synchronized global growth, continuing low interest rates, a weaker U.S. dollar, and some recovery in commodity prices.
A couple of major credit stories contributed significantly to returns. Brazil emerged from a prolonged recession, and its government, despite political turbulence, managed to move forward with some of the business-friendly reforms on its policy agenda. That action was complemented
by the Brazilian central bank’s success in significantly lowering inflation, allowing for an aggressive monetary easing cycle. Even though some of the country’s longer-term fiscal concerns have not been resolved, Brazilian bonds as a whole produced strong outperformance.
Another notable credit story was Argentina, which also recovered from a recession in part because of the Argentine government’s efforts to normalize monetary policy, roll back regulations, and gradually consolidate fiscal policy. Progress on those fronts helped revive demand for Argentine debt, enabling the government to issue $2.75 billion of 100-year U.S. dollar-denominated bonds in June—a significant achievement for a country that was in default a little more than a year ago.
Ukrainian debt also performed well. The country has been adhering to the International Monetary Fund’s restructuring plan. This reform momentum, along with investors’ appetite for yield, supported demand, while supply across Central Europe was light.
Asia was a stability story. China managed to protect its capital account from outflows while maintaining a steady pace of growth. Given that backdrop, the markets largely shrugged off ratings agency downgrades to China’s sovereign debt based on concerns about continuing credit growth. India and Indonesia continued to deliver on reforms that supported performance.
6
Management of the fund
Alpha generation came largely from security selection, but also from country selection and rates.
In Brazil, our position in the state-owned oil and gas company, Petrobras, was a significant contributor to the fund’s active returns. By holding Petrobras’ short-maturity debt, the fund benefited as the company executed multiple liability management exercises to meaningfully improve its maturity profile.
An overweight in Argentina’s sovereign bonds contributed to relative performance as President Mauricio Macri’s Cambiemos coalition received strong public support for its market-friendly agenda.
Relative-value-driven strategies also boosted performance. One example was our exposure to some local-currency bonds, notably in Mexico, South Africa, and Indonesia. (The exposure was hedged to mitigate currency risk.)
Another example was our investments in countries not included in the fund’s benchmark. We took a position in Saudi Arabian bonds. The country is in the process of restructuring its economy, which has necessitated some debt spending. However, it has a solid credit profile, including strong asset coverage and a significant amount of foreign assets on its balance sheet. We were able to add value in emerging-market corporate bonds,
which also fall outside of the benchmark, by holding select issuers with the help of our strong corporate research resources.
Our fund is more defensively positioned than a number of its competitors, in part because it is not as reliant on macroeconomic and risk-beta positioning to generate value. Even though this defensive positioning generally detracts from the fund’s relative performance during risk-on periods, the fund outpaced its peer-group average this fiscal year.
Outlook
Although emerging markets are not immune to global risks, their strong fundamentals should support performance. Likewise, emerging-market bond spreads being wide relative to other income sectors will give them a certain degree of protection from interest rate volatility.
We will continue to monitor a number of idiosyncratic stories. There is a heightened probability of default in Venezuela, but with the market already pricing in that scenario, we don’t expect to see much of a spillover effect. In Mexico, ongoing NAFTA negotiations and a presidential election in July 2018 will likely cause some volatility. Although China is enjoying positive short-term economic momentum, we are always looking for factors that would cause concern, given that country’s importance. We do have some concerns about refinancing risk in frontier markets over the medium term, but that likely will not be an issue in the near term.
7
Overall, our fundamental outlook remains positive. We will continue to focus most of our risk on relative value opportunities. There will likely be opportunities to be overweighted in local markets throughout the next year as inflation decreases across emerging markets, and the liquidity withdrawal and rate increases from G3 central banks should be relatively modest. Additionally, we intend to maintain a higher-than-average level of liquidity to ensure that we’re in a position to take advantage of both expected and unexpected opportunities.
Daniel Shaykevich, Portfolio Manager
Vanguard Fixed Income Group
October 24, 2017
8
Emerging Markets Bond Fund
Fund Profile
As of September 30, 2017
| | |
| Financial Attributes | | |
|
| J. P. Morgan |
| EMBI Global |
| Diversified |
| Fund | Index |
| Number of Bonds | 48 | 627 |
| Yield to Maturity | | |
| (before expenses) | 4.9% | 5.2% |
| Average Coupon | 8.4% | 6.0% |
| Average Duration | 6.0 years | 6.8 years |
| Average Effective | | |
| Maturity | 10.2 years | 10.3 years |
| Ticker Symbol | VEMBX | — |
| Expense Ratio1 | 0.60% | — |
| 30-Day SEC Yield | 3.98% | — |
| Short-Term Reserves | 9.4% | — |
| |
| Sector Diversification (% of portfolio) |
| |
| Foreign Government | 100.00% |
| |
| Distribution by Credit Quality (% of portfolio) |
| |
| A | 9.2% |
| Baa | 32.2 |
| Ba | 26.3 |
| Less than Ba | 23.0 |
| Not Rated | 9.3 |
Credit-quality ratings are obtained from Moody’s and S&P, and the higher rating for each issue is shown. “Not Rated” is used to classify securities for which a rating is not available. Not rated securities include a fund’s investment in Vanguard Market Liquidity Fund or Vanguard Municipal Cash Management Fund, each of which invests in high-quality money market instruments and may serve as a cash management vehicle for the Vanguard funds, trusts, and accounts. For more information about these ratings, see the Glossary entry for Credit Quality.
| |
| Distribution by Effective Maturity | |
| (% of portfolio) | |
| |
| Under 1 Year | 6.2% |
| 1–3 Years | 11.7 |
| 3–5 Years | 23.2 |
| 5–7 Years | 9.9 |
| 7–10 Years | 18.5 |
| 10–20 Years | 12.1 |
| 20–30 Years | 14.6 |
| Over 30 Years | 3.8 |
1 The expense ratio shown is from the prospectus dated January 26, 2017, and represents estimated costs for the current fiscal year.
For the fiscal year ended September 30, 2017, the expense ratio was 0.60%.
9
Emerging Markets Bond Fund
| | |
| Market Diversification (% of portfolio) | |
| Fund |
| Emerging Markets | |
| Mexico | 8.0% |
| Argentina | 6.4 |
| Brazil | 6.3 |
| Indonesia | 6.2 |
| Turkey | 5.4 |
| Russia | 4.8 |
| Supranational | 4.7 |
| Ukraine | 3.7 |
| Saudi Arabia | 3.6 |
| Hungary | 3.5 |
| Costa Rica | 3.4 |
| Columbia | 3.3 |
| Lithuania | 2.7 |
| Peru | 2.6 |
| Egypt | 2.5 |
| Panama | 2.5 |
| Iraq | 2.2 |
| Kazakhstan | 2.1 |
| Armenia | 2.0 |
| Cote d’Ivoire | 2.0 |
| Vietnam | 1.9 |
| Ghana | 1.9 |
| Serbia, Republic of | 1.9 |
| Venezuela | 1.9 |
| Kenya | 1.9 |
| Oman | 1.9 |
| Trinidad and Tobago | 1.8 |
| Guatemala | 1.8 |
| Tunisia | 1.8 |
| Chile | 1.7 |
| Honduras | 1.5 |
| China | 1.2 |
| Lebanon | 0.9 |
| | |
10
Emerging Markets Bond Fund
Performance Summary
All of the returns in this report represent past performance, which is not a guarantee of future results that may be achieved by the fund. (Current performance may be lower or higher than the performance data cited. For performance data current to the most recent month-end, visit our website at vanguard.com/performance.) Note, too, that both investment returns and principal value can fluctuate widely, so an investor’s shares, when sold, could be worth more or less than their original cost. The returns shown do not reflect taxes that a shareholder would pay on fund distributions or on the sale of fund shares.
Cumulative Performance: March 10, 2016, Through September 30, 2017
Initial Investment of $10,000

| | | | |
| | Average Annual Total Returns | Final Value |
| Periods Ended September 30, 2017 | of a $10,000 |
| One Year Since Inception | Investment |
| Emerging Markets Bond Fund | 7.01% | 13.31% | $12,147 |
| J.P. Morgan EMBI Global Diversified Index | 4.61 | 10.30 | 11,649 |
| Emerging Markets Hard Currency Debt Funds Average | 6.85 | 11.20 | 11,797 |
| | | | |
| Fiscal-Period Total Returns (%): March 10, 2016, Through September 30, 2017 | |
| J.P. Morgan |
| EMBI Global |
| Diversified |
| Investor Shares | Index |
| Income | Capital | Total | Total |
| Fiscal Year | Returns | Returns | Returns | Returns |
| 2016 | 2.81% | 10.70% | 13.51% | 11.36% |
| 2017 | 5.11 | 1.90 | 7.01 | 4.61 |
See Financial Highlights for dividend and capital gains information.
11
Emerging Markets Bond Fund
Financial Statements
Statement of Net Assets
As of September 30, 2017
The fund reports a complete list of its holdings in regulatory filings four times in each fiscal year, at the quarter-ends. For the second and fourth fiscal quarters, the lists appear in the fund’s semiannual and annual reports to shareholders. For the first and third fiscal quarters, the fund files the lists with the Securities and Exchange Commission on Form N-Q. Shareholders can look up the fund’s Forms N-Q on the SEC’s website at sec.gov. Forms N-Q may also be reviewed and copied at the SEC’s Public Reference Room (see the back cover of this report for further information).
| | | | | |
| Face | Market |
| Maturity | Amount | Value • |
| | Coupon | Date | ($000) | ($000) |
| Argentina (5.8%) | | | | |
| Sovereign Bonds (5.8%) | | | | |
| Argentine Republic | 6.875% | 4/22/21 | 600 | 653 |
| Argentine Republic | 7.125% | 6/28/17 | 50 | 50 |
| Total Argentina (Cost $700) | 703 |
| Armenia (1.8%) | | | | |
| Sovereign Bond (1.8%) | | | | |
| Republic of Armenia | 7.150% | 3/26/25 | 200 | 224 |
| Total Armenia (Cost $216) | 224 |
| Brazil (5.7%) | | | | |
| Sovereign Bonds (5.7%) | | | | |
| Federative Republic of Brazil | 5.625% | 1/7/41 | 100 | 101 |
| 1 | Petrobras Global Finance BV | 5.999% | 1/27/28 | 595 | 595 |
| Total Brazil (Cost $684) | 696 |
| Chile (1.6%) | | | | |
| Sovereign Bond (1.6%) | | | | |
| 1 | Empresa Nacional del Petroleo | 4.500% | 9/14/47 | 200 | 192 |
| Total Chile (Cost $194) | 192 |
| China (1.1%) | | | | |
| Sovereign Bond (1.1%) | | | | |
| Nexen Energy ULC | 6.400% | 5/15/37 | 100 | 128 |
| Total China (Cost $115) | 128 |
| Colombia (3.0%) | | | | |
| Sovereign Bonds (3.0%) | | | | |
| Republic of Colombia | 10.375% | 1/28/33 | 100 | 155 |
| 2 | Republic of Colombia | 5.000% | 6/15/45 | 200 | 206 |
| Total Colombia (Cost $351) | 361 |
| Costa Rica (3.1%) | | | | |
| Sovereign Bonds (3.1%) | | | | |
| Republic of Costa Rica | 4.250% | 1/26/23 | 200 | 198 |
| Republic of Costa Rica | 5.625% | 4/30/43 | 200 | 183 |
| Total Costa Rica (Cost $351) | 381 |
12
| | | | | |
| Emerging Markets Bond Fund | | | | |
| |
| |
| Face | Market |
| Maturity | Amount | Value • |
| | Coupon | Date | ($000) | ($000) |
| Cote d’Ivoire (1.8%) | | | | |
| Sovereign Bond (1.8%) | | | | |
| 3 | Republic of Cote d’Ivoire | 5.125% | 6/15/25 | 180 | 220 |
| Total Cote d’Ivoire (Cost $202) | 220 |
| Egypt (2.3%) | | | | |
| Sovereign Bond (2.3%) | | | | |
| Arab Republic of Egypt | 8.500% | 1/31/47 | 250 | 279 |
| Total Egypt (Cost $253) | 279 |
| Ghana (1.8%) | | | | |
| Sovereign Bond (1.8%) | | | | |
| Republic of Ghana | 7.875% | 8/7/23 | 200 | 212 |
| Total Ghana (Cost $201) | 212 |
| Guatemala (1.6%) | | | | |
| Sovereign Bond (1.6%) | | | | |
| Republic of Guatemala | 4.375% | 6/5/27 | 200 | 197 |
| Total Guatemala (Cost $198) | 197 |
| Honduras (1.3%) | | | | |
| Sovereign Bond (1.3%) | | | | |
| Republic of Honduras | 6.250% | 1/19/27 | 150 | 162 |
| Total Honduras (Cost $150) | 162 |
| Hungary (3.2%) | | | | |
| Sovereign Bond (3.2%) | | | | |
| Republic of Hungary | 6.250% | 1/29/20 | 355 | 387 |
| Total Hungary (Cost $386) | 387 |
| Indonesia (5.6%) | | | | |
| Sovereign Bonds (5.6%) | | | | |
| Republic of Indonesia | 3.750% | 4/25/22 | 260 | 270 |
| 4 | Republic of Indonesia | 8.375% | 9/15/26 | 930,000 | 77 |
| Republic of Indonesia | 5.250% | 1/17/42 | 300 | 335 |
| Total Indonesia (Cost $648) | 682 |
| Iraq (2.0%) | | | | |
| Sovereign Bond (2.0%) | | | | |
| Republic of Iraq | 6.752% | 3/9/23 | 250 | 248 |
| Total Iraq (Cost $250) | 248 |
| Kazakhstan (1.9%) | | | | |
| Sovereign Bond (1.9%) | | | | |
| Republic of Kazakhstan | 3.875% | 10/14/24 | 225 | 231 |
| Total Kazakhstan (Cost $219) | 231 |
| Kenya (1.7%) | | | | |
| Sovereign Bond (1.7%) | | | | |
| Republic of Kenya | 6.875% | 6/24/24 | 200 | 205 |
| Total Kenya (Cost $207) | 205 |
13
| | | | | |
| Emerging Markets Bond Fund | | | | |
| |
| |
| Face | Market |
| Maturity | Amount | Value • |
| | Coupon | Date | ($000) | ($000) |
| Lebanon (0.8%) | | | | |
| Sovereign Bond (0.8%) | | | | |
| Republic of Lebanon | 6.100% | 10/4/22 | 100 | 100 |
| Total Lebanon (Cost $98) | 100 |
| Lithuania (2.5%) | | | | |
| Sovereign Bonds (2.5%) | | | | |
| Republic of Lithuania | 7.375% | 2/11/20 | 100 | 112 |
| Republic of Lithuania | 6.125% | 3/9/21 | 170 | 191 |
| Total Lithuania (Cost $300) | 303 |
| Mexico (7.3%) | | | | |
| Sovereign Bonds (7.3%) | | | | |
| Petroleos Mexicanos | 5.500% | 1/21/21 | 630 | 673 |
| United Mexican States | 4.000% | 10/2/23 | 200 | 211 |
| Total Mexico (Cost $866) | 884 |
| Oman (1.7%) | | | | |
| Sovereign Bond (1.7%) | | | | |
| Sultanate of Oman | 5.375% | 3/8/27 | 200 | 205 |
| Total Oman (Cost $199) | 205 |
| Panama (2.3%) | | | | |
| Sovereign Bond (2.3%) | | | | |
| Republic of Panama | 9.375% | 4/1/29 | 185 | 279 |
| Total Panama (Cost $280) | 279 |
| Peru (2.4%) | | | | |
| Sovereign Bonds (2.4%) | | | | |
| Corp. Financiera de Desarrollo SA | 4.750% | 2/8/22 | 200 | 214 |
| Republic of Peru | 8.750% | 11/21/33 | 50 | 79 |
| Total Peru (Cost $280) | 293 |
| Russia (4.4%) | | | | |
| Sovereign Bonds (4.4%) | | | | |
| Gazprom OAO Via Gaz Capital SA | 9.250% | 4/23/19 | 200 | 218 |
| Russian Federation | 5.000% | 4/29/20 | 300 | 318 |
| Total Russia (Cost $531) | 536 |
| Saudi Arabia (3.3%) | | | | |
| Sovereign Bond (3.3%) | | | | |
| Kingdom of Saudi Arabia | 4.625% | 10/4/47 | 400 | 402 |
| Total Saudi Arabia (Cost $398) | 402 |
| Serbia, Republic of (1.7%) | | | | |
| Sovereign Bond (1.7%) | | | | |
| Republic of Serbia | 4.875% | 2/25/20 | 200 | 209 |
| Total Serbia, Republic of (Cost $204) | 209 |
| Supranational (4.3%) | | | | |
| Sovereign Bonds (4.3%) | | | | |
| 1 | Banque Ouest Africaine de Developpement | 5.500% | 5/6/21 | 300 | 319 |
| 1 | Banque Ouest Africaine de Developpement | 5.000% | 7/27/27 | 200 | 205 |
| Total Supranational (Cost $494) | 524 |
14
| | | | | |
| Emerging Markets Bond Fund | | | | |
| |
| |
| Face | Market |
| Maturity | Amount | Value • |
| | Coupon | Date | ($000) | ($000) |
| Trinidad and Tobago (1.7%) | | | | |
| Sovereign Bond (1.7%) | | | | |
| Republic of Trinidad & Tobago | 4.500% | 8/4/26 | 200 | 202 |
| Total Trinidad and Tobago (Cost $202) | 202 |
| Tunisia (1.6%) | | | | |
| Sovereign Bond (1.6%) | | | | |
| Banque Centrale de Tunisie SA | 5.750% | 1/30/25 | 200 | 195 |
| Total Tunisia (Cost $180) | 195 |
| Turkey (4.9%) | | | | |
| Sovereign Bonds (4.9%) | | | | |
| Republic of Turkey | 5.750% | 5/11/47 | 400 | 393 |
| 1 | TC Ziraat Bankasi AS | 5.125% | 5/3/22 | 200 | 204 |
| Total Turkey (Cost $602) | 597 |
| Ukraine (3.4%) | | | | |
| Sovereign Bonds (3.4%) | | | | |
| 2 | Oschadbank Via SSB #1 plc | 9.625% | 3/20/25 | 200 | 214 |
| Ukraine | 7.375% | 9/25/32 | 200 | 195 |
| Total Ukraine (Cost $398) | 409 |
| Venezuela (1.7%) | | | | |
| Sovereign Bonds (1.7%) | | | | |
| Bolivarian Republic of Venezuela | 7.750% | 10/13/19 | 280 | 125 |
| Bolivarian Republic of Venezuela | 7.000% | 3/31/38 | 100 | 33 |
| Petroleos de Venezuela SA | 5.375% | 4/12/27 | 162 | 49 |
| Total Venezuela (Cost $238) | 207 |
| Vietnam (1.8%) | | | | |
| Sovereign Bond (1.8%) | | | | |
| Socialist Republic of Vietnam | 4.800% | 11/19/24 | 200 | 213 |
| Total Vietnam (Cost $203) | 213 |
| | | | |
| Shares | |
| Temporary Cash Investments (9.5%) | | | | |
| Money Market Fund (9.5%) | | | | |
| 5 | Vanguard Market Liquidity Fund (Cost $1,158) | 1.223% | 11,577 | 1,158 |
| Total Temporary Cash Investments (Cost $1,158) | 1,158 |
| Total Investments (100.6%) (Cost $11,956) | 12,224 |
| Other Assets and Liabilities (-0.6%) | | | | |
| Other Assets 6 | | | | 556 |
| Liabilities | | | | (633) |
| Net Assets (100%) | 12,147 |
| | | | |
15
Emerging Markets Bond Fund
| |
| Amount |
| ($000) |
| Statement of Assets and Liabilities | |
| Assets | |
| Investments in Securities, at Value |
| Unaffiliated Issuers (excluding Segregated Securities) | 11,066 |
| Affiliated Vanguard Funds | 1,158 |
| Total Investments in Securities | 12,224 |
| Investment in Vanguard | 1 |
| Receivables for Investment Securities Sold | 363 |
| Receivables for Accrued Income | 167 |
| Unrealized Appreciation—Forward Currency Contracts | 11 |
| Unrealized Appreciation—Swap Contracts | 8 |
| Other Assets 6 | 6 |
| Total Assets | 12,780 |
| Liabilities | |
| Payables for Investment Securities Purchased | 395 |
| Payables to Vanguard | 3 |
| Variation Margin Payable—Futures Contracts | 1 |
| Other Liabilities | 234 |
| Total Liabilities | 633 |
| Net Assets | 12,147 |
| |
| At September 30, 2017, net assets consisted of: | |
| Amount |
| ($000) |
| Paid-in Capital | 11,327 |
| Overdistributed Net Investment Income | (13) |
| Accumulated Net Realized Gains | 545 |
| Unrealized Appreciation (Depreciation) | |
| Investment Securities | 268 |
| Futures Contracts | (2) |
| Swap Contracts | 8 |
| Forward Currency Contracts | 11 |
| Foreign Currencies | 3 |
| Net Assets | 12,147 |
| |
| Net Assets | |
| Applicable to 1,128,871 outstanding $.001 par value shares of | |
| beneficial interest (unlimited authorization) | 12,147 |
| Net Asset Value Per Share | $10.76 |
• See Note A in Notes to Financial Statements.
1 Security exempt from registration under Rule 144A of the Securities Act of 1933. Such securities may be sold in transactions exempt from registration, normally to qualified institutional buyers. At September 30, 2017, the aggregate value of these securities was $1,515,000, representing 12.5% of net assets.
2 The average or expected maturity is shorter than the final maturity shown because of the possibility of interim principal payments and prepayments or the possibility of the issue being called.
3 Face amount denominated in euro.
4 Face amount denominated in Indonesian rupiah.
5 Affiliated money market fund available only to Vanguard funds and certain trusts and accounts managed by Vanguard. Rate shown is the 7-day yield.
6 Cash of $9,000 has been segregated as initial margin for open futures contracts.
16
Emerging Markets Bond Fund
| | | | |
| Derivative Financial Instruments Outstanding as of Period End | | |
| |
| Futures Contracts | | | | |
| | | | ($000) |
| Value and |
| Number of | Unrealized |
| Long (Short) | Notional | Appreciation |
| Expiration | Contracts | Amount | (Depreciation) |
| Long Futures Contracts | |
| 10-Year U.S. Treasury Note | December 2017 | 4 | 501 | (6) |
| Short Futures Contracts | |
| Euro-Bund | December 2017 | (2) | (381) | 4 |
| 30-Year U.S. Treasury Bond | December 2017 | (2) | (306) | — |
| (2) |
Unrealized appreciation (depreciation) on open futures contracts is required to be treated as realized gain (loss) for tax purposes.
| | | | | | |
| Forward Currency Contracts | | | | | | |
| Unrealized |
| Contract | Appreciation |
| Settlement | | Contract Amount (000) | (Depreciation) |
| Counterparty | Date | | Receive | | Deliver | ($000) |
| BNP Paribas | 10/16/2017 | HUF | 41,384 | USD | 157 | — |
| BNP Paribas | 10/16/2017 | IDR | 38,944 | USD | 3 | — |
| Citibank, N.A. | 10/16/2017 | USD | 215 | EUR | 179 | 3 |
| BNP Paribas | 10/16/2017 | USD | 156 | HUF | 40,325 | 3 |
| Goldman Sachs Bank AG | 10/16/2017 | USD | 120 | TRY | 429 | — |
| BNP Paribas | 10/16/2017 | USD | 110 | KRW | 124,125 | 2 |
| BNP Paribas | 10/16/2017 | USD | 70 | IDR | 925,050 | 1 |
| BNP Paribas | 10/16/2017 | USD | 60 | BRL | 188 | 1 |
| BNP Paribas | 10/16/2017 | USD | 56 | MXN | 1,006 | 1 |
| BNP Paribas | 10/16/2017 | USD | 9 | HUF | 2,359 | — |
| | | | | | 11 |
| BRL—Brazilian real. | | | | | | |
| EUR—euro. | | | | | | |
| HUF—Hungarian forint. | | | | | | |
| IDR—Indonesian rupiah. | | | | | | |
| KRW—Korean won. | | | | | | |
| MXN—Mexican peso. | | | | | | |
| TRY—Turkish new lira. | | | | | | |
| USD—U.S. dollar. | | | | | | |
Unrealized appreciation on open forward currency contracts, except for Indonesian rupiah, is treated as ordinary income for tax purposes.
17
Emerging Markets Bond Fund
| | | | | | | |
| Over-the-Counter Credit Default Swaps | | | | | | |
| Remaining | |
| Periodic | Up-Front | |
| Premium | Premium | Unrealized |
| | | Notional | Received | Received | Appreciation |
| Termination | | Amount | (Paid)1 | Value | (Paid) | (Depreciation) |
| Reference Entity | Date | Counterparty | ($000) | (%) | ($000) | ($000) | ($000) |
| Credit Protection Sold/ | | | | | | |
| Moody’s Rating | | | | | | | |
| Republic of | | | | | | | |
| Colombia/Baa2 | 6/20/22 | GSI | 110 | 1.000 | (1) | 2 | 1 |
| Russian Federation/ | | | | | | | |
| Ba1 | 6/20/22 | JPMC | 350 | 1.000 | (5) | 11 | 6 |
| | | 460 | (6) | 13 | 7 |
| |
| |
| Credit Protection Purchased | | | | | | |
| Federative Republic | | | | | | | |
| of Brazil | 12/20/22 | GSI | 93 | (1.000) | 4 | (4) | — |
| Republic of Philippines | 12/20/22 | BNPSW | 600 | (1.000) | (10) | 11 | 1 |
| (6) | 7 | 1 |
The notional amount represents the maximum potential amount the fund could be required to pay as a seller of credit protection if the
reference entity was subject to a credit event.
1 Periodic premium received/paid quarterly.
BNPSW—BNP Paribas.
GSI—Goldman Sachs International.
JPMC—JP Morgan Chase Bank NA.
See accompanying Notes, which are an integral part of the Financial Statements.
18
| | |
| Emerging Markets Bond Fund | | |
| |
| |
| Statement of Operations | | |
| |
| | Year Ended |
| September 30, 2017 |
| | ($000) |
| Investment Income | | |
| Income | | |
| Interest1 | | 618 |
| Total Income | | 618 |
| Expenses | | |
| The Vanguard Group—Note B | | |
| Management and Administrative | | 19 |
| Marketing and Distribution | | — |
| Custodian Fees | | 3 |
| Auditing Fees | | 47 |
| Total Expenses | | 69 |
| Net Investment Income | | 549 |
| Realized Net Gain (Loss) | | |
| Investment Securities Sold1 | | 645 |
| Futures Contracts | | (16) |
| Options | | (18) |
| Swap Contracts | | 52 |
| Foreign Currencies and Forward Currency Contracts | | (94) |
| Realized Net Gain (Loss) | | 569 |
| Change in Unrealized Appreciation (Depreciation) | | |
| Investment Securities1 | | (325) |
| Futures Contracts | | (5) |
| Options | | (3) |
| Swap Contracts | | (19) |
| Foreign Currencies and Forward Currency Contracts | | 34 |
| Change in Unrealized Appreciation (Depreciation) | | (318) |
| Net Increase (Decrease) in Net Assets Resulting from Operations | 800 |
1 Interest income, realized net gain (loss), and change in unrealized appreciation (depreciation) from an affiliated company of the fund were $5,000, $0, and $0, respectively.
See accompanying Notes, which are an integral part of the Financial Statements.
19
Emerging Markets Bond Fund
| | | |
| Statement of Changes in Net Assets | | |
| |
| | March 10, |
| Year Ended | 20161 to |
| September 30, | September 30, |
| 2017 | 2016 |
| ($000) | ($000) |
| Increase (Decrease) in Net Assets | | |
| Operations | | |
| Net Investment Income | 549 | 290 |
| Realized Net Gain (Loss) | 569 | 452 |
| Change in Unrealized Appreciation (Depreciation) | (318) | 606 |
| Net Increase (Decrease) in Net Assets Resulting from Operations | 800 | 1,348 |
| Distributions | | |
| Net Investment Income | (558) | (269) |
| Realized Capital Gain 2 | (501) | — |
| Total Distributions | (1,059) | (269) |
| Capital Share Transactions | | |
| Issued | — | 10,000 |
| Issued in Lieu of Cash Distributions | 1,059 | 268 |
| Redeemed | — | — |
| Net Increase (Decrease) from Capital Share Transactions | 1,059 | 10,268 |
| Total Increase (Decrease) | 800 | 11,347 |
| Net Assets |
| Beginning of Period | 11,347 | — |
| End of Period3 | 12,147 | 11,347 |
1 Inception.
2 Includes fiscal 2017 and 2016 short-term gain distributions totaling $478,000 and $0, respectively. Short-term gain distributions are
treated as ordinary income dividends for tax purposes.
3 Net Assets—End of Period includes undistributed (overdistributed) net investment income of ($13,000) and $25,000.
See accompanying Notes, which are an integral part of the Financial Statements.
20
| | |
| Emerging Markets Bond Fund | | |
| |
| |
| Financial Highlights | | |
| |
| Year | March 10, |
| Ended | 20161 to |
| Sept. 30, | Sept. 30, |
| For a Share Outstanding Throughout Each Period | 2017 | 2016 |
| Net Asset Value, Beginning of Period | $11.07 | $10.00 |
| Investment Operations | | |
| Net Investment Income | . 504 2 | .286 |
| Net Realized and Unrealized Gain (Loss) on Investments | .184 | 1.050 |
| Total from Investment Operations | .688 | 1.336 |
| Distributions | | |
| Dividends from Net Investment Income | (.514) | (.266) |
| Distributions from Realized Capital Gains | (.484) | — |
| Total Distributions | (.998) | (.266) |
| Net Asset Value, End of Period | $10.76 | $11.07 |
| |
| Total Return 3 | 7.01% | 13.51% |
| |
| Ratios/Supplemental Data | | |
| Net Assets, End of Period (Millions) | $12 | $11 |
| Ratio of Total Expenses to Average Net Assets | 0.60% | 0.60%4 |
| Ratio of Net Investment Income to Average Net Assets | 4.79% | 4.85%4 |
| Portfolio Turnover Rate | 261% | 153% |
1 Inception.
2 Calculated based on average shares outstanding.
3 Total returns do not include account service fees that may have applied in the periods shown. Fund prospectuses provide information
about any applicable account service fees.
4 Annualized.
See accompanying Notes, which are an integral part of the Financial Statements.
21
Emerging Markets Bond Fund
Notes to Financial Statements
Vanguard Emerging Markets Bond Fund is registered under the Investment Company Act of 1940 as an open-end investment company, or mutual fund. Certain of the fund’s investments are in corporate debt instruments; the issuers’ abilities to meet their obligations may be affected by economic developments in their respective industries. The fund invests in securities of foreign issuers, which may subject it to investment risks not normally associated with investing in securities of U.S. corporations. To minimize the currency risk associated with investment in bonds denominated in currencies other than the U.S. dollar, the fund attempts to hedge its currency exposures. The fund offers two classes of shares: Investor Shares and Admiral Shares. Investor Shares are available to any investor who meets the fund’s minimum purchase requirements. Admiral Shares are designed for investors who meet certain administrative, service, and account-size criteria. The fund has not issued any Admiral Shares through September 30, 2017.
A. The following significant accounting policies conform to generally accepted accounting principles for U.S. investment companies. The fund consistently follows such policies in preparing its financial statements.
1. Security Valuation: Securities are valued as of the close of trading on the New York Stock Exchange (generally 4 p.m., Eastern time) on the valuation date. Bonds and temporary cash investments are valued using the latest bid prices or using valuations based on a matrix system (which considers such factors as security prices, yields, maturities, and ratings), both as furnished by independent pricing services. Investments in Vanguard Market Liquidity Fund are valued at that fund’s net asset value. Securities for which market quotations are not readily available, or whose values have been affected by events occurring before the fund’s pricing time but after the close of the securities’ primary markets, are valued at their fair values calculated according to procedures adopted by the board of trustees. These procedures include obtaining quotations from an independent pricing service, monitoring news to identify significant market- or security-specific events, and evaluating changes in the values of foreign market proxies (for example, ADRs, futures contracts, or exchange-traded funds), between the time the foreign markets close and the fund’s pricing time. When fair-value pricing is employed, the prices of securities used by a fund to calculate its net asset value may differ from quoted or published prices for the same securities.
2. Foreign Currency: Securities and other assets and liabilities denominated in foreign currencies are translated into U.S. dollars using exchange rates obtained from an independent third party as of the fund’s pricing time on the valuation date. Realized gains (losses) and unrealized appreciation (depreciation) on investment securities include the effects of changes in exchange rates since the securities were purchased, combined with the effects of changes in security prices. Fluctuations in the value of other assets and liabilities resulting from changes in exchange rates are recorded as unrealized foreign currency gains (losses) until the assets or liabilities are settled in cash, at which time they are recorded as realized foreign currency gains (losses).
3. Futures Contracts: The fund uses futures contracts to invest in fixed income asset classes with greater efficiency and lower cost than is possible through direct investment, to add value when these instruments are attractively priced, or to adjust sensitivity to changes in interest rates. The primary risks associated with the use of futures contracts are imperfect correlation between changes in market values of bonds held by the fund and the prices of futures contracts, and the possibility of an illiquid market. Counterparty risk involving futures is mitigated because a regulated clearinghouse is the counterparty instead of the clearing broker. To further mitigate counterparty risk, the fund trades futures contracts on an exchange, monitors the financial strength of its clearing
22
Emerging Markets Bond Fund
brokers and clearinghouse, and has entered into clearing agreements with its clearing brokers. The clearinghouse imposes initial margin requirements to secure the fund’s performance and requires daily settlement of variation margin representing changes in the market value of each contract.
Futures contracts are valued at their quoted daily settlement prices. The notional amounts of the contracts are not recorded in the Statement of Net Assets. Fluctuations in the value of the contracts are recorded in the Statement of Assets and Liabilities as an asset (liability) and in the Statement of Operations as unrealized appreciation (depreciation) until the contracts are closed, when they are recorded as realized futures gains (losses).
During the year ended September 30, 2017, the fund’s average investments in long and short futures contracts represented 6% and 3% of net assets, respectively, based on the average of the notional amounts at each quarter-end during the period.
4. Forward Currency Contracts: The fund enters into forward currency contracts to protect the value of securities and related receivables and payables against changes in future foreign exchange rates. The fund’s risks in using these contracts include movement in the values of the foreign currencies relative to the U.S. dollar and the ability of the counterparties to fulfill their obligations under the contracts. The fund mitigates its counterparty risk by entering into forward currency contracts only with a diverse group of prequalified counterparties, monitoring their financial strength, entering into master netting arrangements with its counterparties, and requiring its counterparties to transfer collateral as security for their performance. In the absence of a default, the collateral pledged or received by the fund cannot be repledged, resold, or rehypothecated.
The master netting arrangements provide that, in the event of a counterparty’s default (including bankruptcy), the fund may terminate the forward currency contracts, determine the net amount owed by either party in accordance with its master netting arrangements, and sell or retain any collateral held up to the net amount owed to the fund under the master netting arrangements. The forward currency contracts contain provisions whereby a counterparty may terminate open contracts if the fund’s net assets decline below a certain level, triggering a payment by the fund if the fund is in a net liability position at the time of the termination. The payment amount would be reduced by any collateral the fund has pledged. Any assets pledged as collateral for open contracts are noted in the Statement of Net Assets. The value of collateral received or pledged is compared daily to the value of the forward currency contracts exposure with each counterparty, and any difference, if in excess of a specified minimum transfer amount, is adjusted and settled within two business days.
Forward currency contracts are valued at their quoted daily prices obtained from an independent third party, adjusted for currency risk based on the expiration date of each contract. The notional amounts of the contracts are not recorded in the Statement of Net Assets. Fluctuations in the value of the contracts are recorded in the Statement of Assets and Liabilities as an asset (liability) and in the Statement of Operations as unrealized appreciation (depreciation) until the contracts are closed, when they are recorded as realized forward currency contract gains (losses).
During the year ended September 30, 2017, the fund’s average investment in forward currency contracts represented 13% of net assets, based on the average of notional amounts at each quarter-end during the period.
23
Emerging Markets Bond Fund
5. Swap Contracts: The fund invests in credit default swaps to adjust the overall credit risk of the fund or to actively overweight or underweight credit risk to a specific issuer or group of issuers. The fund may sell credit protection through credit default swaps to simulate investments in long positions that are either unavailable or considered to be less attractively priced in the bond market. The fund may purchase credit protection through credit default swaps to reduce credit exposure to a given issuer or issuers. Under the terms of the swaps, an up-front payment may be exchanged between the seller and buyer. In addition, the seller of the credit protection receives a periodic payment of premium from the buyer that is a fixed percentage applied to a notional amount. If, for example, the reference entity is subject to a credit event (such as bankruptcy, failure to pay, or obligation acceleration) during the term of the swap, the seller agrees to either physically settle or cash settle the swap contract. If the swap is physically settled, the seller agrees to pay the buyer an amount equal to the notional amount and take delivery of a debt instrument of the reference issuer with a par amount equal to such notional amount. If the swap is cash settled, the seller agrees to pay the buyer the difference between the notional amount and the final price for the relevant debt instrument, as determined either in a market auction or pursuant to a pre-agreed-upon valuation procedure.
The fund enters into interest rate swap transactions to adjust the fund’s sensitivity to changes in interest rates and maintain the ability to generate income at prevailing market rates. Under the terms of the swaps, one party pays the other an amount that is a fixed percentage rate applied to a notional amount. In return, the counterparty agrees to pay a floating rate, which is reset periodically based on short-term interest rates, applied to the same notional amount.
The notional amounts of swap contracts are not recorded in the Statement of Net Assets. Swaps are valued daily based on market quotations received from independent pricing services or recognized dealers and the change in value is recorded in the Statement of Assets and Liabilities as an asset (liability) and in the Statement of Operations as unrealized appreciation (depreciation) until the seller of credit protection is required to take delivery (or, in a cash settled swap, pay the settlement amount determined) upon occurrence of a credit event, periodic payments are made, or the swap terminates, at which time realized gain (loss) is recorded. The net premium to be received or paid by the fund under swap contracts is accrued daily and recorded as realized gain (loss) over the life of the contract.
The primary risk associated with selling credit protection is that, upon the occurrence of a defined credit event, the market value of the debt instrument received by the fund (or, in a cash settled swap, the debt instruments used to determine the settlement payment by the fund) will be significantly less than the amount paid by the fund and, in a physically settled swap, the fund may receive an illiquid debt instrument. A risk associated with all types of swaps is the possibility that a counterparty may default on its obligation to pay net amounts due to the fund. The fund’s maximum amount subject to counterparty risk is the unrealized appreciation on the swap contract. The fund mitigates its counterparty risk by entering into swaps only with a diverse group of prequalified counterparties, monitoring their financial strength, entering into master netting arrangements with its counterparties, and requiring its counterparties to transfer collateral as security for their performance. In the absence of a default, the collateral pledged or received by the fund cannot be repledged, resold, or rehypothecated. In the event of a counterparty’s default (including bankruptcy), the fund may terminate any swap contracts with that counterparty,
24
Emerging Markets Bond Fund
determine the net amount owed by either party in accordance with its master netting arrangements, and sell or retain any collateral held up to the net amount owed to the fund under the master netting arrangements. The swap contracts contain provisions whereby a counterparty may terminate open contracts if the fund’s net assets decline below a certain level, triggering a payment by the fund if the fund is in a net liability position at the time of the termination. The payment amount would be reduced by any collateral the fund has pledged. Any securities pledged as collateral for open contracts are noted in the Statement of Net Assets. The value of collateral received or pledged is compared daily to the value of the swap contracts exposure with each counterparty, and any difference, if in excess of a specified minimum transfer amount, is adjusted and settled within two business days.
During the year ended September 30, 2017, the fund’s average amounts of investments in credit protection sold and credit protection purchased represented 9% and 4% of net assets, respectively, based on the average of notional amounts at each quarter-end during the period. The average amount of investments in interest rate swaps represented 1% of net assets, based on the average of notional amounts at each quarter-end during the period.
6. Options: The fund invests in options on foreign currency, which are transacted over-the-counter (OTC) and not on an exchange. Unlike exchange-traded options, which are standardized with respect to the underlying instrument, expiration date, contract size, and strike price, the terms of OTC options generally are established through negotiation with the other party to the option contract. Although this type of arrangement allows the purchaser or writer greater flexibility to tailor an option to its needs, OTC options generally involve greater credit risk than exchange-traded options. Credit risk involves the possibility that a counterparty may default on its obligation to pay net amounts due to the fund. The fund mitigates its counterparty risk by entering into options with a diverse group of prequalified counterparties and monitoring their financial strength. The primary risk associated with purchasing options on foreign currency is that the value of the underlying foreign currencies may move in such a way that the option is out-of-the-money (the exercise price of the option exceeds the value of the underlying investment), the position is worthless at expiration, and the fund loses the premium paid. The primary risk associated with selling options on foreign currency is that the value of the underlying foreign currencies may move in such a way that the option is in-the-money (the exercise price of the option exceeds the value of the underlying investment), the counterparty exercises the option, and the fund loses an amount equal to the market value of the option written less the premium received. Options on foreign currency are valued daily based on market quotations received from independent pricing services or recognized dealers. The premium paid for a purchased option is recorded in the Statement of Assets and Liabilities as an asset that is subsequently adjusted daily to the current market value of the option purchased. The premium received for a written option is recorded in the Statement of Assets and Liabilities as an asset with an equal liability that is subsequently adjusted daily to the current market value of the option written. Fluctuations in the value of the options are recorded as unrealized appreciation (depreciation) until expired, closed, or exercised, at which time realized gains (losses) are recognized.
During the year ended September 30, 2017, the fund’s average value of options purchased and options written represented less than 1% and 0% of net assets, respectively, based on the average market values at each quarter-end during the period.
25
Emerging Markets Bond Fund
7. Federal Income Taxes: The fund intends to continue to qualify as a regulated investment company and distribute all of its taxable income. Management has analyzed the fund’s tax positions taken for all open federal income tax years (September 30, 2016–2017), and has concluded that no provision for federal income tax is required in the fund’s financial statements.
8. Distributions: Distributions to shareholders are recorded on the ex-dividend date.
9. Credit Facility: The fund and certain other funds managed by The Vanguard Group (“Vanguard”) participate in a $3.1 billion committed credit facility provided by a syndicate of lenders pursuant to a credit agreement that may be renewed annually; each fund is individually liable for its borrowings, if any, under the credit facility. Borrowings may be utilized for temporary and emergency purposes, and are subject to the fund’s regulatory and contractual borrowing restrictions. The participating funds are charged administrative fees and an annual commitment fee of 0.10% of the undrawn amount of the facility; these fees are allocated to the funds based on a method approved by the fund’s board of trustees and included in Management and Administrative expenses on the fund’s Statement of Operations. Any borrowings under this facility bear interest at a rate based upon the higher of the one-month London Interbank Offered Rate, federal funds effective rate, or overnight bank funding rate plus an agreed-upon spread.
The fund had no borrowings outstanding at September 30, 2017, or at any time during the period then ended.
10. Other: Interest income includes income distributions received from Vanguard Market Liquidity Fund and is accrued daily. Premiums and discounts on debt securities purchased are amortized and accreted, respectively, to interest income over the lives of the respective securities. Security transactions are accounted for on the date securities are bought or sold. Costs used to determine realized gains (losses) on the sale of investment securities are those of the specific securities sold. Fees assessed on capital share transactions are credited to paid-in capital.
B. In accordance with the terms of a Funds’ Service Agreement (the “FSA”) between Vanguard and the fund, Vanguard furnishes to the fund investment advisory, corporate management, administrative, marketing, and distribution services at Vanguard’s cost of operations (as defined by the FSA). These costs of operations are allocated to the fund based on methods and guidelines approved by the board of trustees. Vanguard does not require reimbursement in the current period for certain costs of operations (such as deferred compensation/benefits and risk/insurance costs); the fund’s liability for these costs of operations is included in Payables to Vanguard on the Statement of Assets and Liabilities.
Upon the request of Vanguard, the fund may invest up to 0.40% of its net assets as capital in Vanguard. At September 30, 2017, the fund had contributed to Vanguard capital in the amount of $1,000, representing 0.01% of the fund’s net assets and 0.00% of Vanguard’s capitalization. The fund’s trustees and officers are also directors and employees, respectively, of Vanguard.
C. Various inputs may be used to determine the value of the fund’s investments. These inputs are summarized in three broad levels for financial statement purposes. The inputs or methodologies used to value securities are not necessarily an indication of the risk associated with investing in those securities.
26
Emerging Markets Bond Fund
Level 1—Quoted prices in active markets for identical securities.
Level 2—Other significant observable inputs (including quoted prices for similar securities, interest rates, prepayment speeds, credit risk, etc.).
Level 3—Significant unobservable inputs (including the fund’s own assumptions used to determine the fair value of investments). Any investments valued with significant unobservable inputs are noted on the Statement of Net Assets.
The following table summarizes the market value of the fund’s investments as of September 30, 2017, based on the inputs used to value them:
| | | |
| Level 1 | Level 2 | Level 3 |
| Investments | ($000) | ($000) | ($000) |
| Sovereign Bonds | — | 11,066 | — |
| Temporary Cash Investments | 1,158 | — | — |
| Futures Contracts—Liabilities1 | (1) | — | — |
| Forward Currency Contracts—Assets | — | 11 | — |
| Swap Contracts—Assets | — | 8 | — |
| Total | 1,157 | 11,085 | — |
| 1 Represents variation margin on the last day of the reporting period. | | | |
D. At September 30, 2017, the fair values of derivatives were reflected in the Statement of Assets and Liabilities as follows:
| | | | |
| Credit | Currency | Interest Rate | |
| Statement of Assets and | Contracts | Contracts | Contracts | Total |
| Liabilities Caption | ($000) | ($000) | ($000) | ($000) |
| Unrealized Appreciation—Forward | | | | |
| Currency Contracts | — | 11 | — | 11 |
| Unrealized Appreciation—Swap Contracts | 8 | — | — | 8 |
| Variation Margin Payable—Futures Contracts | — | — | (1) | (1) |
27
Emerging Markets Bond Fund
Realized net gain (loss) and the change in unrealized appreciation (depreciation) on derivatives for the year ended September 30, 2017, were:
| | | | |
| Credit | Currency | Interest Rate | |
| Contracts | Contracts | Contracts | Total |
| Realized Net Gain (Loss) on Derivatives | ($000) | ($000) | ($000) | ($000) |
| Futures Contracts | — | — | (16) | (16) |
| Forward Currency Contracts | — | (149) | — | (149) |
| Swap Contracts | 52 | — | — | 52 |
| Options | — | (18) | — | (18) |
| Realized Net Gain (Loss) on Derivatives | 52 | (167) | (16) | (131) |
Change in Unrealized Appreciation (Depreciation) on Derivatives
| | | | |
| Futures Contracts | — | — | (5) | (5) |
| Forward Currency Contracts | — | 31 | — | 31 |
| Swap Contracts | (19) | — | — | (19) |
| Options | — | (3) | — | (3) |
| Change in Unrealized Appreciation | | | | |
| (Depreciation) on Derivatives | (19) | 28 | (5) | 4 |
E. Distributions are determined on a tax basis and may differ from net investment income and realized capital gains for financial reporting purposes. Differences may be permanent or temporary. Permanent differences are reclassified among capital accounts in the financial statements to reflect their tax character. Temporary differences arise when certain items of income, expense, gain, or loss are recognized in different periods for financial statement and tax purposes. These differences will reverse at some time in the future. Differences in classification may also result from the treatment of short-term gains as ordinary income for tax purposes.
During the year ended September 30, 2017, the fund realized net foreign currency losses of $31,000, which increased distributable net income for tax purposes; accordingly, such losses have been reclassified from accumulated net realized gains to overdistributed net investment income.
For tax purposes, at September 30, 2017, the fund had $494,000 of ordinary income and $46,000 of long-term capital gains available for distribution.
At September 30, 2017, the cost of investment securities for tax purposes was $11,957,000. Net unrealized appreciation of investment securities for tax purposes was $267,000, consisting of unrealized gains of $322,000 on securities that had risen in value since their purchase and $55,000 in unrealized losses on securities that had fallen in value since their purchase.
F. During the year ended September 30, 2017, the fund purchased $28,242,000 of investment securities and sold $28,248,000 of investment securities, other than temporary cash investments.
28
| | |
| Emerging Markets Bond Fund | | |
| |
| |
| |
| |
| G. Capital shares issued and redeemed were: | | |
| Year Ended | March 10, 20161 to |
| September 30, 2017 | September 30, 2016 |
| Shares | Shares |
| (000) | (000) |
| Issued | — | 1,000 |
| Issued in Lieu of Cash Distributions | 103 | 25 |
| Redeemed | — | — |
| Net Increase (Decrease) | 103 | 1,025 |
| 1 Inception. | | |
At September 30, 2017, a subsidiary of Vanguard was the record or beneficial owner of 100% of the fund’s net assets. If the shareholder were to redeem its investment in the fund, the redemption might result in an increase in the fund’s expense ratio, cause the fund to incur higher transaction costs, or lead to the realization of taxable capital gains.
H. Management has determined that no material events or transactions occurred subsequent to September 30, 2017, that would require recognition or disclosure in these financial statements.
29
Report of Independent Registered
Public Accounting Firm
To the Board of Trustees of Vanguard Malvern Funds and the Shareholders of Vanguard Emerging
Markets Bond Fund
In our opinion, the accompanying statement of net assets, statement of assets and liabilities and the related statements of operations and of changes in net assets and the financial highlights present fairly, in all material respects, the financial position of Vanguard Emerging Markets Bond Fund (constituting a separate portfolio of Vanguard Malvern Funds, hereafter referred to as the “Fund”) as of September 30, 2017, the results of its operations for the year then ended, and the changes in its net assets and the financial highlights for the year then ended and for the period March 10, 2016 (commencement of operations) through September 30, 2016, in conformity with accounting principles generally accepted in the United States of America. These financial statements and financial highlights (hereafter referred to as “financial statements”) are the responsibility of the Fund’s management. Our responsibility is to express an opinion on these financial statements based on our audits. We conducted our audits of these financial statements in accordance with the standards of the Public Company Accounting Oversight Board (United States). Those standards require that we plan and perform the audit to obtain reasonable assurance about whether the financial statements are free of material misstatement. An audit includes examining, on a test basis, evidence supporting the amounts and disclosures in the financial statements, assessing the accounting principles used and significant estimates made by management, and evaluating the overall financial statement presentation. We believe that our audits, which included confirmation of securities as of September 30, 2017 by correspondence with the custodian and brokers and by agreement to the underlying ownership records of the transfer agent, provide a reasonable basis for our opinion.
/s/PricewaterhouseCoopers LLP
Philadelphia, Pennsylvania
November 16, 2017
Special 2017 tax information (unaudited) for Vanguard Emerging Markets Bond Fund
This information for the fiscal year ended September 30, 2017, is included pursuant to provisions
of the Internal Revenue Code.
The fund distributed $24,000 as capital gain dividends (20% rate gain distributions) to shareholders
during the fiscal year.
For nonresident alien shareholders, 100% of short-term capital gain dividends distributed by the
fund are qualified short-term capital gains.
30
About Your Fund’s Expenses
As a shareholder of the fund, you incur ongoing costs, which include costs for portfolio management, administrative services, and shareholder reports (like this one), among others. Operating expenses, which are deducted from a fund’s gross income, directly reduce the investment return of the fund.
A fund’s expenses are expressed as a percentage of its average net assets. This figure is known as the expense ratio. The following examples are intended to help you understand the ongoing costs (in dollars) of investing in your fund and to compare these costs with those of other mutual funds. The examples are based on an investment of $1,000 made at the beginning of the period shown and held for the entire period.
The accompanying table illustrates your fund’s costs in two ways:
• Based on actual fund return. This section helps you to estimate the actual expenses that you paid over the period. The ”Ending Account Value“ shown is derived from the fund‘s actual return, and the third column shows the dollar amount that would have been paid by an investor who started with $1,000 in the fund. You may use the information here, together with the amount you invested, to estimate the expenses that you paid over the period.
To do so, simply divide your account value by $1,000 (for example, an $8,600 account value divided by $1,000 = 8.6), then multiply the result by the number given for your fund under the heading ”Expenses Paid During Period.“
• Based on hypothetical 5% yearly return. This section is intended to help you compare your fund‘s costs with those of other mutual funds. It assumes that the fund had a yearly return of 5% before expenses, but that the expense ratio is unchanged. In this case—because the return used is not the fund’s actual return—the results do not apply to your investment. The example is useful in making comparisons because the Securities and Exchange Commission requires all mutual funds to calculate expenses based on a 5% return. You can assess your fund’s costs by comparing this hypothetical example with the hypothetical examples that appear in shareholder reports of other funds.
Note that the expenses shown in the table are meant to highlight and help you compare ongoing costs only and do not reflect transaction costs incurred by the fund for buying and selling securities. Further, the expenses do not include any purchase, redemption, or account service fees described in the fund prospectus. If such fees were applied to your account, your costs would be higher. Your fund does not carry a “sales load.” The calculations assume no shares were bought or sold during the period. Your actual costs may have been higher or lower, depending on the amount of your investment and the timing of any purchases or redemptions.
You can find more information about the fund’s expenses, including annual expense ratios, in the Financial Statements section of this report. For additional information on operating expenses and other shareholder costs, please refer to your fund’s current prospectus.
31
| | | |
| Six Months Ended September 30, 2017 | | | |
| Beginning | Ending | Expenses |
| Account Value | Account Value | Paid During |
| Emerging Markets Government Bond Fund | 3/31/2017 | 9/30/2017 | Period |
| Based on Actual Fund Return | $1,000.00 | $1,062.99 | $3.10 |
| Based on Hypothetical 5% Yearly Return | 1,000.00 | 1,022.06 | 3.04 |
The calculations are based on expenses incurred in the most recent six-month period. The fund’s annualized six-month expense ratio for that period is 0.60%. The dollar amounts shown as “Expenses Paid” are equal to the annualized expense ratio multiplied by the average account value over the period, multiplied by the number of days in the most recent six-month period, then divided by the number of days in the most recent 12-month period (183/365).
32
Glossary
30-Day SEC Yield. A fund’s 30-day SEC yield is derived using a formula specified by the U.S. Securities and Exchange Commission. Under the formula, data related to the fund’s security holdings in the previous 30 days are used to calculate the fund’s hypothetical net income for that period, which is then annualized and divided by the fund’s estimated average net assets over the calculation period. For the purposes of this calculation, a security’s income is based on its current market yield to maturity (for bonds), its actual income (for asset-backed securities), or its projected dividend yield (for stocks). Because the SEC yield represents hypothetical annualized income, it will differ—at times significantly—from the fund’s actual experience. As a result, the fund’s income distributions may be higher or lower than implied by the SEC yield.
Average Coupon. The average interest rate paid on the fixed income securities held by a fund. It is expressed as a percentage of face value.
Average Duration. An estimate of how much the value of the bonds held by a fund will fluctuate in response to a change in interest rates. To see how the value could change, multiply the average duration by the change in rates. If interest rates rise by 1 percentage point, the value of the bonds in a fund with an average duration of five years would decline by about 5%. If rates decrease by a percentage point, the value would rise by 5%.
Average Effective Maturity. The average length of time until fixed income securities held by a fund reach maturity and are repaid, taking into consideration the possibility that the issuer may call the bond before its maturity date. The figure reflects the proportion of fund assets represented by each security; it also reflects any futures contracts held. In general, the longer the average effective maturity, the more a fund’s share price will fluctuate in response to changes in market interest rates.
Credit Quality. Credit-quality ratings are measured on a scale that generally ranges from AAA (highest) to D (lowest). U.S. Treasury, U.S. Agency, and U.S. Agency mortgage-backed securities appear under “U.S. Government.” Credit-quality ratings are obtained from Moody’s and S&P, and the higher rating for each issue is shown. “Not Rated” is used to classify securities for which a rating is not available. Not rated securities include a fund’s investment in Vanguard Market Liquidity Fund or Vanguard Municipal Cash Management Fund, each of which invests in high-quality money market instruments and may serve as a cash management vehicle for the Vanguard funds, trusts, and accounts.
Expense Ratio. A fund’s total annual operating expenses expressed as a percentage of the fund’s average net assets. The expense ratio includes management and administrative expenses, but does not include the transaction costs of buying and selling portfolio securities.
Inception Date. The date on which the assets of a fund (or one of its share classes) are first invested in accordance with the fund’s investment objective. For funds with a subscription period, the inception date is the day after that period ends. Investment performance is measured from the inception date.
Short-Term Reserves. The percentage of a fund invested in highly liquid, short-term securities that can be readily converted to cash.
Yield to Maturity. The rate of return an investor would receive if the fixed income securities held by a fund were held to their maturity dates.
33
This page intentionally left blank.
The People Who Govern Your Fund
The trustees of your mutual fund are there to see that the fund is operated and managed in your best interests since, as a shareholder, you are a part owner of the fund. Your fund’s trustees also serve on the board of directors of The Vanguard Group, Inc., which is owned by the Vanguard funds and provides services to them on an at-cost basis.
A majority of Vanguard’s board members are independent, meaning that they have no affiliation with Vanguard or the funds they oversee, apart from the sizable personal investments they have made as private individuals. The independent board members have distinguished backgrounds in business, academia, and public service. Each of the trustees and executive officers oversees 198 Vanguard funds.
Information for each trustee and executive officer of the fund appears below. The mailing address of the trustees and officers is P.O. Box 876, Valley Forge, PA 19482. More information about the trustees is in the Statement of Additional Information, which can be obtained, without charge, by contacting Vanguard at 800-662-7447, or online at vanguard.com.
Interested Trustee1
F. William McNabb III
Born 1957. Trustee Since July 2009. Chairman of the Board. Principal Occupation(s) During the Past Five Years and Other Experience: Chairman of the Board of The Vanguard Group, Inc., and of each of the investment companies served by The Vanguard Group, since January 2010; Chief Executive Officer and Director of The Vanguard Group and President and Chief Executive Officer of each of the investment companies served by The Vanguard Group, since 2008; Director of Vanguard Marketing Corporation; President of The Vanguard Group (2008–2017); Managing Director of The Vanguard Group (1995–2008).
Independent Trustees
Emerson U. Fullwood
Born 1948. Trustee Since January 2008. Principal Occupation(s) During the Past Five Years and Other Experience: Executive Chief Staff and Marketing Officer for North America and Corporate Vice President (retired 2008) of Xerox Corporation (document management products and services);
Executive in Residence and 2009–2010 Distinguished Minett Professor at the Rochester Institute of Technology; Lead Director of SPX FLOW, Inc. (multi-industry manufacturing); Director of the United Way of Rochester, the University of Rochester Medical Center, Monroe Community College Foundation, North Carolina A&T University, and Roberts Wesleyan College; Trustee of the University of Rochester.
Rajiv L. Gupta
Born 1945. Trustee Since December 2001.2 Principal Occupation(s) During the Past Five Years and Other Experience: Chairman and Chief Executive Officer (retired 2009) and President (2006–2008) of Rohm and Haas Co. (chemicals); Director of Arconic Inc. (diversified manufacturer), HP Inc. (printer and personal computer manufacturing), and Delphi Automotive plc (automotive components); Senior Advisor at New Mountain Capital.
Amy Gutmann
Born 1949. Trustee Since June 2006. Principal Occupation(s) During the Past Five Years and Other Experience: President of the University of Pennsylvania; Christopher H. Browne
1 Mr. McNabb is considered an “interested person,” as defined in the Investment Company Act of 1940, because he is an officer of the Vanguard funds.
2 December 2002 for Vanguard Equity Income Fund, the Vanguard Municipal Bond Funds, and the Vanguard State Tax-Exempt Funds.
Distinguished Professor of Political Science, School of Arts and Sciences, and Professor of Communication, Annenberg School for Communication, with secondary faculty appointments in the Department of Philosophy, School of Arts and Sciences, and at the Graduate School of Education, University of Pennsylvania; Trustee of the National Constitution Center.
JoAnn Heffernan Heisen
Born 1950. Trustee Since July 1998. Principal Occupation(s) During the Past Five Years and Other Experience: Corporate Vice President and Member of the Executive Committee (1997–2008), Chief Global Diversity Officer (retired 2008), Vice President and Chief Information Officer (1997–2006), Controller (1995–1997), Treasurer (1991–1995), and Assistant Treasurer (1989–1991) of Johnson & Johnson (pharmaceuticals/medical devices/ consumer products); Director of Skytop Lodge Corporation (hotels) and the Robert Wood Johnson Foundation; Member of the Advisory Board of the Institute for Women’s Leadership at Rutgers University.
F. Joseph Loughrey
Born 1949. Trustee Since October 2009. Principal Occupation(s) During the Past Five Years and Other Experience: President and Chief Operating Officer (retired 2009) of Cummins Inc. (industrial machinery); Chairman of the Board of Hillenbrand, Inc. (specialized consumer services), Oxfam America, and the Lumina Foundation for Education; Director of the V Foundation for Cancer Research; Member of the Advisory Council for the College of Arts and Letters and Chair of the Advisory Board to the Kellogg Institute for International Studies, both at the University of Notre Dame.
Mark Loughridge
Born 1953. Trustee Since March 2012. Principal Occupation(s) During the Past Five Years and Other Experience: Senior Vice President and Chief Financial Officer (retired 2013) at IBM (information technology services); Fiduciary Member of IBM’s Retirement Plan Committee (2004–2013); Member of the Council on Chicago Booth.
Scott C. Malpass
Born 1962. Trustee Since March 2012. Principal Occupation(s) During the Past Five Years and Other Experience: Chief Investment Officer and Vice President at the University of Notre Dame; Assistant Professor of Finance at the Mendoza College of Business at Notre Dame; Member of the Notre Dame 403(b) Investment Committee, the Board of Advisors for Spruceview Capital Partners, the Board of Catholic Investment Services, Inc. (investment advisor), and the Board of Superintendence of the Institute for the Works of Religion; Chairman of the Board of TIFF Advisory Services, Inc. (investment advisor).
André F. Perold
Born 1952. Trustee Since December 2004. Principal Occupation(s) During the Past Five Years and Other Experience: George Gund Professor of Finance and Banking, Emeritus at the Harvard Business School (retired 2011); Chief Investment Officer and Co-Managing Partner of HighVista Strategies LLC (private investment firm); Overseer of the Museum of Fine Arts Boston.
Peter F. Volanakis
Born 1955. Trustee Since July 2009. Principal Occupation(s) During the Past Five Years and Other Experience: President and Chief Operating Officer (retired 2010) of Corning Incorporated (communications equipment); Chairman of the Board of Trustees of Colby-Sawyer College; Member of the Board of Hypertherm, Inc. (industrial cutting systems, software, and consumables).
Executive Officers
Glenn Booraem
Born 1967. Investment Stewardship Officer Since February 2017. Principal Occupation(s) During the Past Five Years and Other Experience: Principal of The Vanguard Group, Inc.; Treasurer (2015–2017), Controller (2010–2015), and Assistant Controller (2001–2010) of each of the investment companies served by The Vanguard Group.
Thomas J. Higgins
Born 1957. Chief Financial Officer Since September 2008. Principal Occupation(s) During the Past Five Years and Other Experience: Principal of The Vanguard Group, Inc.; Chief Financial Officer of each of the investment companies served by The Vanguard Group; Treasurer of each of the investment companies served by The Vanguard Group (1998–2008).
Peter Mahoney
Born 1974. Controller Since May 2015. Principal Occupation(s) During the Past Five Years and Other Experience: Principal of The Vanguard Group, Inc.; Controller of each of the investment companies served by The Vanguard Group; Head of International Fund Services at The Vanguard Group (2008–2014).
Anne E. Robinson
Born 1970. Secretary Since September 2016. Principal Occupation(s) During the Past Five Years and Other Experience: Managing Director of The Vanguard Group, Inc.; General Counsel of The Vanguard Group; Secretary of The Vanguard Group and of each of the investment companies served by The Vanguard Group; Director and Senior Vice President of Vanguard Marketing Corporation; Managing Director and General Counsel of Global Cards and Consumer Services at Citigroup (2014–2016); Counsel at American Express (2003–2014).
Michael Rollings
Born 1963. Treasurer Since February 2017. Principal Occupation(s) During the Past Five Years and Other Experience: Managing Director of The Vanguard Group, Inc.; Treasurer of each of the investment companies served by The Vanguard Group; Director of Vanguard Marketing Corporation; Executive Vice President and Chief Financial Officer of MassMutual Financial Group (2006–2016).
| |
| Vanguard Senior Management Team |
| |
| Mortimer J. Buckley | Chris D. McIsaac |
| Gregory Davis | James M. Norris |
| John James | Thomas M. Rampulla |
| Martha G. King | Karin A. Risi |
| John T. Marcante | |
Chairman Emeritus and Senior Advisor
John J. Brennan
Chairman, 1996–2009
Chief Executive Officer and President, 1996–2008
Founder
John C. Bogle
Chairman and Chief Executive Officer, 1974–1996
|  |
| P.O. Box 2600 |
| Valley Forge, PA 19482-2600 |
| | |
| | |
| | |
| Connect with Vanguard® > vanguard.com | |
| | |
| | |
| Fund Information > 800-662-7447 | |
| | |
| Direct Investor Account Services > 800-662-2739 | |
| | |
| Institutional Investor Services > 800-523-1036 | |
| | |
| Text Telephone for People | |
| Who Are Deaf or Hard of Hearing > 800-749-7273 | |
| | |
| This material may be used in conjunction | |
| with the offering of shares of any Vanguard | |
| fund only if preceded or accompanied by | |
| the fund’s current prospectus. | |
| | |
| All comparative mutual fund data are from Lipper, a | |
| Thomson Reuters Company, or Morningstar, Inc., unless | |
| otherwise noted. | |
| | |
| You can obtain a free copy of Vanguard’s proxy voting | |
| guidelines by visiting vanguard.com/proxyreporting or by | |
| calling Vanguard at 800-662-2739. The guidelines are | |
| also available from the SEC’s website, sec.gov. In | |
| addition, you may obtain a free report on how your fund | |
| voted the proxies for securities it owned during the 12 | |
| months ended June 30. To get the report, visit either | |
| vanguard.com/proxyreporting or sec.gov. | |
| | |
| You can review and copy information about your fund at | |
| the SEC’s Public Reference Room in Washington, D.C. To | |
| find out more about this public service, call the SEC at | |
| 202-551-8090. Information about your fund is also | |
| available on the SEC’s website, and you can receive | |
| copies of this information, for a fee, by sending a | |
| request in either of two ways: via email addressed to | |
| publicinfo@sec.gov or via regular mail addressed to the | |
| Public Reference Section, Securities and Exchange | |
| Commission, Washington, DC 20549-1520. | |
| © 2017 The Vanguard Group, Inc. |
| All rights reserved. |
| Vanguard Marketing Corporation, Distributor. |
| Q14310 112017 |

Annual Report | September 30, 2017
Vanguard Institutional Bond Funds
Vanguard Institutional Short-Term Bond Fund
Vanguard Institutional Intermediate-Term Bond Fund
Vanguard’s Principles for Investing Success
We want to give you the best chance of investment success. These principles, grounded in Vanguard’s research and experience, can put you on the right path.
Goals. Create clear, appropriate investment goals.
Balance. Develop a suitable asset allocation using broadly diversified funds. Cost. Minimize cost.
Discipline. Maintain perspective and long-term discipline.
A single theme unites these principles: Focus on the things you can control.
We believe there is no wiser course for any investor.
| |
| Contents | |
| Your Fund’s Performance at a Glance. | 1 |
| Chairman’s Perspective. | 3 |
| Institutional Short-Term Bond Fund. | 7 |
| Institutional Intermediate-Term Bond Fund. | 39 |
| About Your Fund’s Expenses. | 84 |
| Glossary. | 86 |
Please note: The opinions expressed in this report are just that—informed opinions. They should not be considered promises or advice. Also, please keep in mind that the information and opinions cover the period through the date on the front of this report. Of course, the risks of investing in your fund are spelled out in the prospectus.
See the Glossary for definitions of investment terms used in this report.
About the cover: Nautical images have been part of Vanguard’s rich heritage since its start in 1975. For an incoming ship, a lighthouse offers a beacon and safe path to shore. You can similarly depend on Vanguard to put you first––and light the way––as you strive to meet your financial goals. Our client focus and low costs, stemming from our unique ownership structure, assure that your interests are paramount.
Your Fund’s Performance at a Glance
• Vanguard Institutional Short-Term Bond Fund returned 1.10% and Vanguard Institutional Intermediate-Term Bond Fund returned 0.01% for the 12 months ended September 30, 2017. Both funds outpaced their benchmarks; the Short-Term Fund fell short of the average return of its peers.
• The prospect of tax reform and infrastructure spending contributed to a sharp increase in interest rates late last year. While short-term rates kept rising as the Federal Reserve continued to tighten monetary policy, longer-term rates eased back a little as growth and inflation expectations moderated.
• Relative to their benchmarks, the funds benefited from underweight allocations to U.S.
Treasuries and overweight positions in lower-rated bonds and asset-backed securities.
• Over the ten years ended September 30, 2017, the Short-Term Fund’s average annual return was 2.45% and the Intermediate-Term Fund’s return was 3.68%. Both funds outperformed their comparative standards.
| | | | |
| Total Returns: Fiscal Year Ended September 30, 2017 | | | |
| | 30-Day SEC | Income | Capital | Total |
| | Yield | Returns | Returns | Returns |
| Vanguard Institutional Short-Term Bond Fund | | | | |
| Institutional Plus Shares | 1.76% | 1.67% | -0.57% | 1.10% |
| Bloomberg Barclays U.S. 1-3 Year Government/Credit | | | | |
| ex Baa Index | | | | 0.49 |
| 1–5 Year Investment-Grade Debt Funds Average | | | | 1.26 |
1–5 Year Investment-Grade Debt Funds Average: Derived from data provided by Lipper, a Thomson Reuters Company. | |
| |
| Vanguard Institutional Intermediate-Term Bond Fund | | | | |
| Institutional Plus Shares | 1.98% | 1.94% | -1.93% | 0.01% |
| Bloomberg Barclays U.S. Intermediate Aggregate ex | | | | |
| Baa Index | | | | -0.04 |
Institutional Plus Shares are available to certain institutional investors who meet specific administrative, service, and account-size criteria.
1
| |
| Total Returns: Ten Years Ended September 30, 2017 | |
| | Average |
| | Annual Return |
| Institutional Short-Term Bond Fund Institutional Plus Shares | 2.45% |
| Bloomberg Barclays U.S. 1-3 Year Government/Credit ex Baa Index | 1.95 |
| 1–5 Year Investment-Grade Debt Funds Average | 2.12 |
| 1–5 Year Investment-Grade Debt Funds Average: Derived from data provided by Lipper, a Thomson Reuters Company. | |
| Institutional Intermediate-Term Bond Fund Institutional Plus Shares | 3.68% |
| Bloomberg Barclays U.S. Intermediate Aggregate ex Baa Index | 3.65 |
The figures shown represent past performance, which is not a guarantee of future results. (Current performance may be lower or higher than the performance data cited. For performance data current to the most recent month-end, visit our website at vanguard.com/performance.) Note, too, that both investment returns and principal value can fluctuate widely, so an investor’s shares, when sold, could be worth more or less than their original cost.
2
Chairman’s Perspective

Bill McNabb
Chairman and Chief Executive Officer
Dear Shareholder,
Our investors depend on Vanguard to be a responsible steward of their assets. This includes our obvious responsibilities—managing the funds, offering investment perspectives and advice, and assisting with questions and transactions.
But because a long-term perspective informs every aspect of our investment approach, we also work on your behalf in less obvious ways, such as by advocating for responsible governance among the companies in which Vanguard funds invest. Vanguard’s index funds are essentially permanent owners of thousands of publicly traded companies, and we have a special obligation to be engaged stewards actively focused on the long term.
Simply put, we believe that well-governed companies are more likely to perform well over the long run.
Although Vanguard has always been an advocate for strong corporate governance, we have expanded our efforts recently as our investor base continues to grow. Our Investment Stewardship team has doubled in size since 2015, and we continue to add analysts, researchers, and operations team members. The team guides our engagement activities and our funds’ proxy voting by analyzing corporate governance practices in companies around the world.
3
Our four Investment Stewardship pillars
As we evaluate company responsiveness to governance matters, including environmental and social concerns, we focus on four key areas—what we call our Investment Stewardship pillars:
• The board: A high-functioning, well-composed, independent, diverse, and experienced board with effective ongoing evaluation practices.
• Governance structures: Provisions
and structures that empower shareholders
and protect their rights.
• Appropriate compensation: Pay that incentivizes relative outperformance over the long term.
• Risk oversight: Effective, integrated, and ongoing oversight of relevant industry-and company-specific risks.
Guided by these pillars, our Investment Stewardship team conducted more than 950 engagements, or discussions, with company directors and leaders worldwide during the 12 months ended June 30, 2017.
| | | |
| Market Barometer | | | |
| | | Average Annual Total Returns |
| | Periods Ended September 30, 2017 |
| | One Year | Three Years | Five Years |
| Stocks | | | |
| Russell 1000 Index (Large-caps) | 18.54% | 10.63% | 14.27% |
| Russell 2000 Index (Small-caps) | 20.74 | 12.18 | 13.79 |
| Russell 3000 Index (Broad U.S. market) | 18.71 | 10.74 | 14.23 |
| FTSE All-World ex US Index (International) | 19.49 | 5.11 | 7.35 |
| |
| Bonds | | | |
| Bloomberg Barclays U.S. Aggregate Bond Index | | | |
| (Broad taxable market) | 0.07% | 2.71% | 2.06% |
| Bloomberg Barclays Municipal Bond Index | | | |
| (Broad tax-exempt market) | 0.87 | 3.19 | 3.01 |
| Citigroup Three-Month U.S. Treasury Bill Index | 0.64 | 0.28 | 0.18 |
| |
| CPI | | | |
| Consumer Price Index | 2.23% | 1.22% | 1.30% |
4
We also cast more than 171,000 votes on behalf of Vanguard funds at more than 18,000 shareholder meetings.
Gender diversity on boards and climate risk
As we engage with companies, we are devoting increased attention to two specific topics. The first is gender diversity on boards. It’s no secret that the right combination of talent, skills, and experience leads to better results, so we pay close attention to how company boards are structured and managed, and how they evolve.
In recent years, a growing body of research has demonstrated that greater diversity on boards can lead to improved governance and company performance. We are advocating for boards to incorporate diverse perspectives and experience into their strategic planning and decision-making. One example of our commitment to more diverse boards is our participation in the 30% Club, a global coalition working to increase the representation of women in boardrooms and leadership roles.
The second issue is climate risk. We will continue to engage with companies to understand their responses to this risk. Regardless of one’s perspective on the issue, the potential is real for changing regulations, demographics, and consumption behavior to affect business results for companies in many sectors.
We want to ensure that such business and regulatory risks are sufficiently disclosed so investors can value companies appropriately. In the past year, we have voted for shareholder proposals at several energy companies that called for management to improve its climate risk assessment and planning, and we will consider supporting similar proposals if we believe they are beneficial to long-term shareholder value. When a proposal from a shareholder presents a strong case for change, we’re more than willing to fully consider it. And even if the case falls short, these proposals often catalyze a discussion that generates meaningful change over time.
In addition to considering activists’ proposals, we consult research providers and our own network of experts. When we detect material risks to a company’s long-term value (such as bad leadership, poor disclosure, misaligned compensation structures, or threats to shareholder rights), we act with our voice and our vote.
Our stewardship reflects our mission
But we don’t act as independent agents with our own agenda. Every time we speak with a company chairman, CEO, or director, we’re acutely aware of the role we play in representing the economic interests of more than 20 million Vanguard investors. So you can expect us to speak out when we detect threats to the economic interests of our shareholders.
5
We take positions on these matters not because they are inherently good or noble but because they are tied to the long-term economic value of your funds’ investments.
You trust us to represent your interests across the globe. You can be confident we act on that responsibility with the seriousness and dedication it deserves.
To learn more about our Investment Stewardship program, including how our funds have voted, visit https://about. vanguard.com/investment-stewardship/.
As always, thank you for investing with Vanguard.

F. William McNabb III
Chairman and Chief Executive Officer
October 13, 2017
6
Institutional Short-Term Bond Fund
Fund Profile
As of September 30, 2017
| | | |
| Financial Attributes | | |
| | | Bloomberg | Bloomberg |
| | | Barclays | Barclays |
| | | U.S. 1-3 | U.S. |
| | | Year | Aggregate |
| | | Gov/Credit | Float |
| | | ex Baa | Adjusted |
| | Fund | Index | Index |
| Number of Bonds | 645 | 961 | 9,460 |
| Yield to Maturity | | | |
| (before expenses) | 1.9% | 1.6% | 2.5% |
| Average Coupon | 2.1% | 1.9% | 3% |
| Average Duration | 1.9 years | 1.9 years | 6.1 years |
| Average Effective | | | |
| Maturity | 2.1 years | 2 years | 8.3 years |
| Ticker Symbol | VISTX | — | — |
| Expense Ratio1 | 0.02% | — | — |
| 30-Day SEC Yield | 1.76% | — | — |
| Short-Term | | | |
| Reserves | 2.3% | — | — |
| |
| Sector Diversification (% of portfolio) | |
| Asset-Backed | 32.5% |
| Commercial Mortgage-Backed | 1.6 |
| Finance | 21.8 |
| Foreign | 14.8 |
| Industrial | 7.0 |
| Treasury/Agency | 20.7 |
| Utilities | 1.5 |
| Other | 0.1 |
The agency and mortgage-backed securities sectors may include issues from government-sponsored enterprises; such issues are generally not backed by the full faith and credit of the U.S. government.
| | |
| Volatility Measures | | |
| |
| | Bloomberg | |
| | Barclays | |
| | U.S. 1-3 Year | Bloomberg |
| | Gov/Credit | Barclays U.S. |
| | ex Baa | Aggregate Float |
| | Index | Adjusted Index |
| R-Squared | 0.93 | 0.74 |
| |
| Beta | 0.94 | 0.22 |
| |
| Distribution by Credit Quality (% of portfolio) |
| U.S. Government | 19.6% |
| Aaa | 41.7 |
| Aa | 15.6 |
| A | 21.9 |
| Not Rated | 1.2 |
Credit-quality ratings are obtained from Moody’s and S&P, and the higher rating for each issue is shown. “Not Rated” is used to classify securities for which a rating is not available. Not rated securities include a fund’s investment in Vanguard Market Liquidity Fund or Vanguard Municipal Cash Management Fund, each of which invests in high-quality money market instruments and may serve as a cash management vehicle for the Vanguard funds, trusts, and accounts. For more information about these ratings, see the Glossary entry for Credit Quality.
These measures show the degree and timing of the fund’s fluctuations compared with the indexes over 36 months.
| |
| Distribution by Effective Maturity | |
| (% of portfolio) | |
| Under 1 Year | 19.2% |
| 1 - 3 Years | 61.7 |
| 3 - 5 Years | 15.1 |
| 5 - 7 Years | 2.5 |
| 7 - 10 Years | 1.5 |
1 The expense ratio shown is from the prospectus dated January 26, 2017, and represents estimated costs for the current fiscal year. For the fiscal year ended September 30, 2017, the expense ratio was 0.02%.
7
Institutional Short-Term Bond Fund
Performance Summary
All of the returns in this report represent past performance, which is not a guarantee of future results that may be achieved by the fund. (Current performance may be lower or higher than the performance data cited. For performance data current to the most recent month-end, visit our website at vanguard.com/performance.) Note, too, that both investment returns and principal value can fluctuate widely, so an investor’s shares, when sold, could be worth more or less than their original cost. The returns shown do not reflect taxes that a shareholder would pay on fund distributions or on the sale of fund shares.
Cumulative Performance: September 30, 2007, Through September 30, 2017
Initial Investment of $10,000,000

| | | | | |
| | | Average Annual Total Returns | |
| | | Periods Ended September 30, 2017 | |
| |
| | | | | | Final Value |
| | | One | Five | Ten | of a $10,000,000 |
| | | Year | Years | Years | Investment |
| | Institutional Short-Term Bond Fund | | | | |
| | Institutional Plus Shares | 1.10% | 1.17% | 2.45% | $12,732,724 |
| | Bloomberg Barclays U.S. 1-3 Year | | | | |
| • • • • • • • • | | | | | |
| | Government/Credit ex Baa Index | 0.49 | 0.80 | 1.95 | 12,132,761 |
| |
| – – – – | 1–5 Year Investment-Grade Debt Funds | | | | |
| | Average | 1.26 | 1.17 | 2.12 | 12,336,171 |
| |
| | Spliced Bloomberg Barclays U.S. | | | | |
| | Aggregate Float Adjusted Index | 0.06 | 2.07 | 4.30 | 15,228,364 |
For a benchmark description, see the Glossary.
1–5 Year Investment-Grade Debt Funds Average: Derived from data provided by Lipper, a Thomson Reuters Company.
The fund is the successor to VFTC Short-Term Bond Trust (the predecessor trust), a collective trust managed by Vanguard Fiduciary Trust Company, an affiliate of The Vanguard Group, Inc. The predecessor trust transferred its assets to the fund in connection with the fund’s commencement of operations on or about June 19, 2015. The performance of the fund’s Institutional Plus Shares includes the performance of the predecessor trust prior to the commencement of the fund’s operations. The performance of the predecessor trust has not been adjusted to reflect the expenses of the fund’s Institutional Plus Shares. If the performance of the predecessor trust had been adjusted to reflect the expenses of the fund’s Institutional Plus Shares, the predecessor trust’s performance would have been lower. The fund is managed with the same investment objective, strategies, policies, and risks as the predecessor trust. The predecessor trust was not an investment company and, therefore, was not subject to certain investment restrictions imposed on investment companies by the Investment Company Act of 1940. If the predecessor trust had been an investment company, its performance may have been different.
See Financial Highlights for dividend and capital gains information.
8
Institutional Short-Term Bond Fund
| | | | |
| Fiscal-Year Total Returns (%): September 30, 2007, Through September 30, 2017 | |
| | | | | Bloomberg |
| | | | | Barclays |
| | | | | U.S. 1-3 Year |
| | | | | Gov/Credit |
| | | | | ex Baa |
| | | Institutional Plus Shares | Index |
| Fiscal Year | Income Returns | Capital Returns | Total Returns | Total Returns |
| 2008 | 0.00% | 2.86% | 2.86% | 4.57% |
| 2009 | 0.00 | 8.70 | 8.70 | 5.70 |
| 2010 | 0.00 | 3.76 | 3.76 | 3.03 |
| 2011 | 0.00 | 1.31 | 1.31 | 1.23 |
| 2012 | 0.00 | 2.21 | 2.21 | 1.16 |
| 2013 | 0.00 | 0.67 | 0.67 | 0.50 |
| 2014 | 0.00 | 1.04 | 1.04 | 0.65 |
| 2015 | 0.35 | 0.95 | 1.30 | 1.24 |
| 2016 | 1.37 | 0.38 | 1.75 | 1.11 |
| 2017 | 1.67 | -0.57 | 1.10 | 0.49 |
The fund is the successor to VFTC Short-Term Bond Trust (the predecessor trust), a collective trust managed by Vanguard Fiduciary Trust Company, an affiliate of The Vanguard Group, Inc. The predecessor trust transferred its assets to the fund in connection with the fund’s commencement of operations on or about June 19, 2015. The performance of the fund’s Institutional Plus Shares includes the performance of the predecessor trust prior to the commencement of the fund’s operations. The performance of the predecessor trust has not been adjusted to reflect the expenses of the fund’s Institutional Plus Shares. If the performance of the predecessor trust had been adjusted to reflect the expenses of the fund’s Institutional Plus Shares, the predecessor trust’s performance would have been lower. The fund is managed with the same investment objective, strategies, policies, and risks as the predecessor trust. The predecessor trust was not an investment company and, therefore, was not subject to certain investment restrictions imposed on investment companies by the Investment Company Act of 1940. If the predecessor trust had been an investment company, its performance may have been different.
9
Institutional Short-Term Bond Fund
Financial Statements
Statement of Net Assets
As of September 30, 2017
The fund reports a complete list of its holdings in regulatory filings four times in each fiscal year, at the quarter-ends. For the second and fourth fiscal quarters, the lists appear in the fund’s semiannual and annual reports to shareholders. For the first and third fiscal quarters, the fund files the lists with the Securities and Exchange Commission on Form N-Q. Shareholders can look up the fund’s Forms N-Q on the SEC’s website at sec.gov. Forms N-Q may also be reviewed and copied at the SEC’s Public Reference Room (see the back cover of this report for further information).
| | | | | |
| | | | | Face | Market |
| | | | Maturity | Amount | Value • |
| | | Coupon | Date | ($000) | ($000) |
| U. S. Government and Agency Obligations (20.4%) | | | |
| U.S. Government Securities (2.5%) | | | | |
| | United States Treasury Inflation Indexed Bonds | 0.125% | 4/15/18 | 40,000 | 42,371 |
| | United States Treasury Inflation Indexed Bonds | 0.375% | 1/15/27 | 74,270 | 74,298 |
| | United States Treasury Note/Bond | 1.125% | 2/28/19 | 50 | 50 |
| | United States Treasury Note/Bond | 1.250% | 8/31/19 | 15,200 | 15,133 |
| | United States Treasury Note/Bond | 1.375% | 4/30/20 | 30 | 30 |
| 1,2 | United States Treasury Note/Bond | 1.375% | 10/31/20 | 17,000 | 16,857 |
| | United States Treasury Note/Bond | 1.125% | 8/31/21 | 25,000 | 24,360 |
| | United States Treasury Note/Bond | 1.625% | 8/31/22 | 8,600 | 8,479 |
| | | | | | 181,578 |
| Agency Bonds and Notes (17.9%) | | | | |
| 3 | AID-Jordan | 2.578% | 6/30/22 | 13,750 | 13,992 |
| 4 | Federal Home Loan Banks | 0.625% | 8/7/18 | 5,720 | 5,688 |
| 4 | Federal Home Loan Banks | 0.875% | 10/1/18 | 34,500 | 34,327 |
| 4 | Federal Home Loan Banks | 1.750% | 12/14/18 | 3,000 | 3,010 |
| 4 | Federal Home Loan Banks | 1.250% | 1/16/19 | 103,300 | 103,015 |
| 4 | Federal Home Loan Banks | 1.375% | 3/18/19 | 78,150 | 78,024 |
| 4 | Federal Home Loan Banks | 5.375% | 5/15/19 | 23,000 | 24,418 |
| 4 | Federal Home Loan Banks | 1.375% | 5/28/19 | 43,250 | 43,157 |
| 4 | Federal Home Loan Banks | 0.875% | 8/5/19 | 110,200 | 108,861 |
| 4 | Federal Home Loan Banks | 1.375% | 9/28/20 | 36,250 | 35,909 |
| 5 | Federal Home Loan Mortgage Corp. | 0.875% | 10/12/18 | 200,130 | 199,097 |
| 5 | Federal Home Loan Mortgage Corp. | 1.125% | 4/15/19 | 66,050 | 65,679 |
| 5 | Federal Home Loan Mortgage Corp. | 1.375% | 8/15/19 | 131,250 | 130,835 |
| 5 | Federal Home Loan Mortgage Corp. | 1.250% | 10/2/19 | 49,300 | 48,994 |
| 5 | Federal Home Loan Mortgage Corp. | 1.500% | 1/17/20 | 6,300 | 6,285 |
| 5 | Federal Home Loan Mortgage Corp. | 1.625% | 9/29/20 | 42,750 | 42,657 |
| 5 | Federal National Mortgage Assn. | 1.375% | 1/28/19 | 17,000 | 16,980 |
| 5 | Federal National Mortgage Assn. | 1.000% | 2/26/19 | 35,225 | 34,993 |
| 5 | Federal National Mortgage Assn. | 0.875% | 8/2/19 | 8,100 | 8,002 |
| 5 | Federal National Mortgage Assn. | 1.000% | 8/28/19 | 6,750 | 6,681 |
| 5 | Federal National Mortgage Assn. | 1.000% | 10/24/19 | 130,950 | 129,451 |
| 5 | Federal National Mortgage Assn. | 1.500% | 7/30/20 | 100,500 | 100,003 |
| 5 | Federal National Mortgage Assn. | 1.875% | 4/5/22 | 41,950 | 41,771 |
| 5 | Federal National Mortgage Assn. | 1.875% | 9/24/26 | 13,750 | 13,069 |
| 4 | Financing Corp. | 0.000% | 11/2/18 | 3,090 | 3,039 |
| | | | | | 1,297,937 |
10
| | | | | |
| Institutional Short-Term Bond Fund | | | | |
| |
| |
| |
| | | | | Face | Market |
| | | | Maturity | Amount | Value • |
| | | Coupon | Date | ($000) | ($000) |
| Conventional Mortgage-Backed Securities (0.0%) | | | |
| 5,6 | Freddie Mac Gold Pool | 6.000% | 4/1/28 | 10 | 11 |
| Total U.S. Government and Agency Obligations (Cost $1,486,539) | | | 1,479,526 |
| Asset-Backed/Commercial Mortgage-Backed Securities (35.6%) | | | |
| 6 | Ally Auto Receivables Trust 2015-1 | 1.750% | 5/15/20 | 6,230 | 6,228 |
| 6 | Ally Auto Receivables Trust 2015-2 | 1.840% | 6/15/20 | 10,990 | 11,007 |
| 6 | Ally Auto Receivables Trust 2016-1 | 1.730% | 11/16/20 | 19,500 | 19,500 |
| 6 | Ally Master Owner Trust Series 2015-3 | 1.630% | 5/15/20 | 16,385 | 16,388 |
| 6 | Ally Master Owner Trust Series 2017-3 | 2.040% | 6/15/22 | 16,710 | 16,705 |
| 6,7 | American Express Credit Account Master | | | | |
| | Trust 2014-1 | 1.604% | 12/15/21 | 38,834 | 38,990 |
| 6,7 | American Express Credit Account Master | | | | |
| | Trust 2017-5 | 1.614% | 2/18/25 | 6,390 | 6,417 |
| 6,8 | Americold 2010 LLC Trust Series 2010-ARTA | 4.954% | 1/14/29 | 2,055 | 2,203 |
| 6,8 | Aventura Mall Trust 2013-AVM | 3.867% | 12/5/32 | 447 | 466 |
| 6,8 | Avis Budget Rental Car Funding AESOP LLC | | | | |
| | 2017-1A | 3.070% | 9/20/23 | 4,735 | 4,781 |
| 6 | BA Credit Card Trust 2017-A2 | 1.840% | 1/17/23 | 2,070 | 2,063 |
| 6 | Banc of America Commercial Mortgage Trust | | | | |
| | 2015-UBS7 | 3.705% | 9/15/48 | 344 | 359 |
| 6 | BANK 2017 - BNK4 | 3.625% | 5/15/50 | 410 | 426 |
| 6 | BANK 2017 - BNK5 | 3.390% | 6/15/60 | 430 | 439 |
| 6 | BANK 2017 - BNK6 | 3.518% | 7/15/60 | 220 | 227 |
| 6,8,9 Bank of America Student Loan Trust 2010-1A | 2.114% | 2/25/43 | 3,630 | 3,639 |
| 8 | Bank of Montreal | 1.750% | 6/15/21 | 15,060 | 14,781 |
| | Bank of Nova Scotia | 1.875% | 4/26/21 | 35,090 | 34,530 |
| 8 | Bank of Nova Scotia | 1.875% | 9/20/21 | 27,900 | 27,407 |
| 6,7 | Barclays Dryrock Issuance Trust 2017-2 | 1.534% | 5/15/23 | 6,390 | 6,399 |
| 6,7,8 BMW Floorplan Master Owner Trust 2015-1A | 1.734% | 7/15/20 | 28,865 | 28,940 |
| 6,9 | Brazos Higher Education Authority Inc. | | | | |
| | Series 2005-3 | 1.528% | 6/25/26 | 2,640 | 2,624 |
| 6,9 | Brazos Higher Education Authority Inc. | | | | |
| | Series 2011-1 | 2.117% | 2/25/30 | 3,649 | 3,672 |
| 6 | Cabela’s Credit Card Master Note Trust | | | | |
| | 2015-1A | 2.260% | 3/15/23 | 5,500 | 5,527 |
| 6,7 | Cabela’s Credit Card Master Note Trust | | | | |
| | 2015-2 | 1.904% | 7/17/23 | 12,475 | 12,565 |
| 6,7 | Cabela’s Credit Card Master Note Trust | | | | |
| | 2016-1 | 2.084% | 6/15/22 | 55,030 | 55,597 |
| 6 | Capital One Multi-Asset Execution Trust | | | | |
| | 2015-A4 | 2.750% | 5/15/25 | 17,420 | 17,904 |
| 6,7 | Capital One Multi-Asset Execution Trust | | | | |
| | 2016-A2 | 1.864% | 2/15/24 | 10,720 | 10,861 |
| 6,7,8 CARDS II Trust 2016-1A | 1.934% | 7/15/21 | 19,670 | 19,739 |
| 6,7,8 CARDS II Trust 2017-1A | 1.604% | 4/18/22 | 23,060 | 23,101 |
| 6 | CarMax Auto Owner Trust 2014-4 | 1.810% | 7/15/20 | 8,300 | 8,310 |
| 6 | CarMax Auto Owner Trust 2015-2 | 1.800% | 3/15/21 | 6,530 | 6,532 |
| 6 | CarMax Auto Owner Trust 2015-3 | 1.980% | 2/16/21 | 5,075 | 5,081 |
| 6 | CarMax Auto Owner Trust 2016-1 | 1.880% | 6/15/21 | 11,970 | 11,966 |
| 6 | CarMax Auto Owner Trust 2016-4 | 1.400% | 8/15/21 | 23,320 | 23,163 |
| 6 | CarMax Auto Owner Trust 2016-4 | 1.600% | 6/15/22 | 11,090 | 10,969 |
| 6 | CarMax Auto Owner Trust 2017-3 | 2.220% | 11/15/22 | 12,120 | 12,109 |
| 6 | CD 2017-CD3 Commercial Mortgage Trust | 3.631% | 2/10/50 | 580 | 604 |
11
| | | | | |
| Institutional Short-Term Bond Fund | | | | |
| |
| |
| |
| | | | | Face | Market |
| | | | Maturity | Amount | Value • |
| | | Coupon | Date | ($000) | ($000) |
| 6 | CD 2017-CD4 Commercial Mortgage Trust | 3.514% | 5/10/50 | 210 | 217 |
| 6 | CD 2017-CD5 Commercial Mortgage Trust | 3.431% | 8/15/50 | 190 | 194 |
| 6 | CenterPoint Energy Transition Bond Co. IV | | | | |
| | LLC 2012-1 | 2.161% | 10/15/21 | 11,387 | 11,427 |
| 6,8 | CFCRE Commercial Mortgage Trust 2011-C2 | 5.945% | 12/15/47 | 1,609 | 1,796 |
| 6 | Chase Issuance Trust 2014-A2 | 2.770% | 3/15/23 | 2,012 | 2,063 |
| 6,8 | Chrysler Capital Auto Receivables Trust | | | | |
| | 2015-BA | 2.260% | 10/15/20 | 11,170 | 11,221 |
| 6,8 | Chrysler Capital Auto Receivables Trust | | | | |
| | 2016-AA | 1.960% | 1/18/22 | 21,280 | 21,274 |
| 6,8 | Chrysler Capital Auto Receivables Trust | | | | |
| | 2016-BA | 1.640% | 7/15/21 | 10,570 | 10,537 |
| 6,8 | Chrysler Capital Auto Receivables Trust | | | | |
| | 2016-BA | 1.870% | 2/15/22 | 5,870 | 5,802 |
| 6,7 | Citibank Credit Card Issuance Trust 2017-A5 | 1.856% | 4/22/26 | 9,390 | 9,487 |
| 6 | Citigroup Commercial Mortgage Trust | | | | |
| | 2012-GC8 | 3.024% | 9/10/45 | 291 | 297 |
| 6,8 | Citigroup Commercial Mortgage Trust | | | | |
| | 2012-GC8 | 3.683% | 9/10/45 | 349 | 363 |
| 6 | Citigroup Commercial Mortgage Trust | | | | |
| | 2013-GC11 | 1.987% | 4/10/46 | 3,882 | 3,885 |
| 6 | Citigroup Commercial Mortgage Trust | | | | |
| | 2013-GC11 | 3.093% | 4/10/46 | 571 | 581 |
| 6 | Citigroup Commercial Mortgage Trust | | | | |
| | 2013-GC15 | 3.942% | 9/10/46 | 177 | 186 |
| 6 | Citigroup Commercial Mortgage Trust | | | | |
| | 2014-GC19 | 4.023% | 3/10/47 | 2,186 | 2,324 |
| 6 | Citigroup Commercial Mortgage Trust | | | | |
| | 2014-GC21 | 3.575% | 5/10/47 | 1,047 | 1,091 |
| 6 | Citigroup Commercial Mortgage Trust | | | | |
| | 2014-GC21 | 3.855% | 5/10/47 | 1,617 | 1,704 |
| 6 | Citigroup Commercial Mortgage Trust | | | | |
| | 2014-GC23 | 3.622% | 7/10/47 | 576 | 600 |
| 6 | Citigroup Commercial Mortgage Trust | | | | |
| | 2014-GC23 | 3.863% | 7/10/47 | 205 | 210 |
| 6 | Citigroup Commercial Mortgage Trust | | | | |
| | 2014-GC25 | 3.372% | 10/10/47 | 471 | 484 |
| 6 | Citigroup Commercial Mortgage Trust | | | | |
| | 2014-GC25 | 3.635% | 10/10/47 | 2,091 | 2,176 |
| 6 | Citigroup Commercial Mortgage Trust | | | | |
| | 2016-C1 | 3.209% | 5/10/49 | 1,076 | 1,085 |
| 6,10 Citigroup Commercial Mortgage Trust | | | | |
| | 2017-P8 | 3.465% | 9/15/50 | 450 | 463 |
| 6 | CNH Equipment Trust 2016-B | 1.970% | 11/15/21 | 8,340 | 8,319 |
| 6 | CNH Equipment Trust 2017-B | 2.170% | 4/17/23 | 4,900 | 4,916 |
| 6 | COMM 2012-CCRE2 Mortgage Trust | 3.147% | 8/15/45 | 221 | 227 |
| 6 | COMM 2012-CCRE2 Mortgage Trust | 3.791% | 8/15/45 | 700 | 731 |
| 6 | COMM 2012-CCRE3 Mortgage Trust | 2.822% | 10/15/45 | 288 | 291 |
| 6 | COMM 2012-CCRE4 Mortgage Trust | 2.853% | 10/15/45 | 241 | 244 |
| 6 | COMM 2012-CCRE5 Mortgage Trust | 2.771% | 12/10/45 | 177 | 179 |
| 6 | COMM 2013-CCRE11 Mortgage Trust | 3.983% | 8/10/50 | 684 | 726 |
| 6 | COMM 2013-CCRE11 Mortgage Trust | 4.258% | 8/10/50 | 598 | 647 |
| 6 | COMM 2013-CCRE12 Mortgage Trust | 3.623% | 10/10/46 | 336 | 351 |
| 6 | COMM 2013-CCRE12 Mortgage Trust | 4.046% | 10/10/46 | 877 | 938 |
12
| | | | | |
| Institutional Short-Term Bond Fund | | | | |
| |
| |
| |
| | | | | Face | Market |
| | | | Maturity | Amount | Value • |
| | | Coupon | Date | ($000) | ($000) |
| 6 | COMM 2013-CCRE13 Mortgage Trust | 4.194% | 11/12/46 | 461 | 498 |
| 6 | COMM 2013-CCRE9 Mortgage Trust | 4.373% | 7/10/45 | 1,572 | 1,704 |
| 6,8 | COMM 2013-CCRE9 Mortgage Trust | 4.396% | 7/10/45 | 2,461 | 2,629 |
| 6,8 | COMM 2013-LC13 Mortgage Trust | 3.774% | 8/10/46 | 258 | 270 |
| 6 | COMM 2013-LC13 Mortgage Trust | 4.205% | 8/10/46 | 130 | 140 |
| 6 | COMM 2013-LC6 Mortgage Trust | 2.941% | 1/10/46 | 745 | 755 |
| 6,8 | COMM 2013-SFS Mortgage Trust | 3.086% | 4/12/35 | 807 | 816 |
| 6 | COMM 2014-CCRE14 Mortgage Trust | 4.236% | 2/10/47 | 305 | 329 |
| 6 | COMM 2014-CCRE17 Mortgage Trust | 3.977% | 5/10/47 | 766 | 814 |
| 6 | COMM 2014-CCRE17 Mortgage Trust | 4.174% | 5/10/47 | 272 | 287 |
| 6 | COMM 2014-CCRE18 Mortgage Trust | 3.550% | 7/15/47 | 20 | 21 |
| 6 | COMM 2014-CCRE18 Mortgage Trust | 3.828% | 7/15/47 | 1,964 | 2,063 |
| 6 | COMM 2014-CCRE20 Mortgage Trust | 3.590% | 11/10/47 | 1,596 | 1,656 |
| 6 | COMM 2014-CCRE21 Mortgage Trust | 3.528% | 12/10/47 | 1,098 | 1,135 |
| 6 | COMM 2014-LC17 Mortgage Trust | 3.917% | 10/10/47 | 1,232 | 1,304 |
| 6 | COMM 2015-CCRE22 Mortgage Trust | 3.309% | 3/10/48 | 440 | 449 |
| 6 | COMM 2015-CCRE25 Mortgage Trust | 3.759% | 8/10/48 | 341 | 358 |
| 6 | COMM 2015-LC19 Mortgage Trust | 3.183% | 2/10/48 | 30 | 30 |
| 8 | Commonwealth Bank of Australia | 2.000% | 6/18/19 | 21,387 | 21,377 |
| 6 | CSAIL 2015-C1 Commercial Mortgage Trust | 3.505% | 4/15/50 | 20 | 21 |
| 6 | CSAIL 2015-C4 Commercial Mortgage Trust | 3.808% | 11/15/48 | 422 | 442 |
| 6 | CSAIL 2016-C7 Commercial Mortgage Trust | 3.502% | 11/15/49 | 970 | 993 |
| 6 | CSAIL 2017-C8 Commercial Mortgage Trust | 3.392% | 6/15/50 | 560 | 570 |
| 6 | DBJPM 17-C6 Mortgage Trust | 3.328% | 6/10/50 | 400 | 406 |
| 6,7 | Discover Card Execution Note Trust 2016-A2 | 1.774% | 9/15/21 | 14,310 | 14,400 |
| 6 | Discover Card Execution Note Trust 2017-A4 | 2.530% | 10/15/26 | 31,510 | 31,594 |
| 6,7 | Discover Card Execution Note Trust 2017-A5 | 1.834% | 12/15/26 | 16,020 | 16,178 |
| 8 | DNB Boligkreditt AS | 1.450% | 3/21/18 | 4,035 | 4,030 |
| 6,8 | Enterprise Fleet Financing LLC Series 2015-2 | 2.090% | 2/22/21 | 12,450 | 12,407 |
| 6,8 | Enterprise Fleet Financing LLC Series 2016-2 | 2.040% | 2/22/22 | 4,580 | 4,569 |
| 6,7,8 Evergreen Credit Card Trust Series 2016-1 | 1.954% | 4/15/20 | 17,410 | 17,459 |
| 6,7,8 Evergreen Credit Card Trust Series 2016-3 | 1.734% | 11/16/20 | 10,640 | 10,683 |
| 5,6 | Fannie Mae Grantor Trust 2017-T1 | 2.898% | 6/25/27 | 11,797 | 11,738 |
| 6 | Fifth Third Auto Trust 2017-1 | 2.030% | 7/15/24 | 12,650 | 12,622 |
| 6,7 | First National Master Note Trust 2017-1 | 1.634% | 4/18/22 | 21,920 | 21,936 |
| 6,8 | Ford Credit Auto Owner Trust 2014-REV1 | 2.260% | 11/15/25 | 14,450 | 14,555 |
| 6,8 | Ford Credit Auto Owner Trust 2014-REV2 | 2.310% | 4/15/26 | 1,120 | 1,130 |
| 6 | Ford Credit Auto Owner Trust 2015-C | 1.740% | 2/15/21 | 16,855 | 16,844 |
| 6,8 | Ford Credit Auto Owner Trust 2015-REV2 | 2.440% | 1/15/27 | 37,000 | 37,432 |
| 6 | Ford Credit Auto Owner Trust 2016-A | 1.600% | 6/15/21 | 12,130 | 12,085 |
| 6,8 | Ford Credit Auto Owner Trust 2016-REV1 | 2.310% | 8/15/27 | 35,255 | 35,445 |
| 6,8 | Ford Credit Auto Owner Trust 2016-REV2 | 2.030% | 12/15/27 | 25,450 | 25,308 |
| 6,8 | Ford Credit Auto Owner Trust 2017-1 | 2.620% | 8/15/28 | 54,570 | 55,202 |
| 6,8 | Ford Credit Auto Owner Trust 2017-2 | 2.360% | 3/15/29 | 28,070 | 27,983 |
| 6,7 | Ford Credit Floorplan Master Owner Trust A | | | | |
| | Series 2014-2 | 1.734% | 2/15/21 | 42,840 | 42,992 |
| 6,7 | Ford Credit Floorplan Master Owner Trust A | | | | |
| | Series 2016-3 | 1.854% | 7/15/21 | 24,830 | 24,984 |
| 6,7 | Ford Credit Floorplan Master Owner Trust A | | | | |
| | Series 2016-4 | 1.764% | 7/15/20 | 19,200 | 19,251 |
| 6 | Ford Credit Floorplan Master Owner Trust A | | | | |
| | Series 2017-1 | 2.070% | 5/15/22 | 59,120 | 59,283 |
| 6 | GM Financial Automobile Leasing Trust | | | | |
| | 2015-1 | 1.730% | 6/20/19 | 3,120 | 3,121 |
13
| | | | | |
| Institutional Short-Term Bond Fund | | | | |
| |
| |
| |
| | | | | Face | Market |
| | | | Maturity | Amount | Value • |
| | | Coupon | Date | ($000) | ($000) |
| 6 | GM Financial Automobile Leasing Trust | | | | |
| | 2015-3 | 1.690% | 3/20/19 | 11,950 | 11,952 |
| 6 | GM Financial Automobile Leasing Trust | | | | |
| | 2017-1 | 2.260% | 8/20/20 | 9,200 | 9,259 |
| 6 | GM Financial Automobile Leasing Trust | | | | |
| | 2017-2 | 2.180% | 6/21/21 | 5,520 | 5,505 |
| 6 | GM Financial Automobile Leasing Trust | | | | |
| | 2017-3 | 1.720% | 1/21/20 | 25,630 | 25,593 |
| 6 | GM Financial Automobile Leasing Trust | | | | |
| | 2017-3 | 2.010% | 11/20/20 | 10,880 | 10,881 |
| 6 | GM Financial Automobile Leasing Trust | | | | |
| | 2017-3 | 2.120% | 9/20/21 | 3,500 | 3,504 |
| 6,7,8 GMF Floorplan Owner Revolving Trust | | | | |
| | 2016-1 | 2.084% | 5/17/21 | 28,850 | 29,116 |
| 6,8 | GMF Floorplan Owner Revolving Trust | | | | |
| | 2017-2 | 2.130% | 7/15/22 | 26,530 | 26,446 |
| 6,7,8 Golden Credit Card Trust 2014-2A | 1.684% | 3/15/21 | 25,433 | 25,494 |
| 6,7,8 Golden Credit Card Trust 2016-1A | 1.834% | 1/15/20 | 93,590 | 93,719 |
| 6,8 | Golden Credit Card Trust 2016-5A | 1.600% | 9/15/21 | 76,660 | 76,069 |
| 6,7,8 Golden Credit Card Trust 2017-4A | 1.754% | 7/15/24 | 18,210 | 18,236 |
| 6,8,9 Gosforth Funding 2016-1A plc | 2.015% | 2/15/58 | 25,248 | 25,306 |
| 6,8 | GS Mortgage Securities Trust 2012-GC6 | 4.948% | 1/10/45 | 117 | 127 |
| 6 | GS Mortgage Securities Trust 2013-GC13 | 4.169% | 7/10/46 | 805 | 866 |
| 6 | GS Mortgage Securities Trust 2013-GCJ12 | 3.135% | 6/10/46 | 701 | 715 |
| 6 | GS Mortgage Securities Trust 2014-GC20 | 3.998% | 4/10/47 | 2,460 | 2,602 |
| 6 | GS Mortgage Securities Trust 2014-GC26 | 3.629% | 11/10/47 | 150 | 156 |
| 6,8 | Hertz Vehicle Financing II LP 2015-3A | 2.670% | 9/25/21 | 10,525 | 10,464 |
| 6,8 | Hertz Vehicle Financing LLC 2016-2A | 2.950% | 3/25/22 | 7,255 | 7,235 |
| 6,8 | Hertz Vehicle Financing LLC 2016-3A | 2.270% | 7/25/20 | 2,605 | 2,593 |
| 6,8 | Hertz Vehicle Financing LLC 2017-2A | 3.290% | 10/25/23 | 1,710 | 1,716 |
| 6 | Honda Auto Receivables 2017-3 Owner Trust | 1.980% | 11/20/23 | 7,720 | 7,722 |
| 6,8 | Hyundai Auto Lease Securitization Trust | | | | |
| | 2017-B | 2.130% | 3/15/21 | 13,650 | 13,623 |
| 6 | Hyundai Auto Receivables Trust 2015-C | 1.780% | 11/15/21 | 11,030 | 11,031 |
| 6 | Hyundai Auto Receivables Trust 2017-B | 1.960% | 2/15/23 | 5,940 | 5,928 |
| 6,8 | Hyundai Floorplan Master Owner Trust | | | | |
| | Series 2016-1A | 1.810% | 3/15/21 | 8,360 | 8,337 |
| 9 | Illinois Student Assistance Commission | | | | |
| | Series 2010-1 | 2.364% | 4/25/22 | 1,145 | 1,150 |
| 6,8 | Irvine Core Office Trust 2013-IRV | 3.279% | 5/15/48 | 1,333 | 1,366 |
| 6 | John Deere Owner Trust 2015-B | 1.780% | 6/15/22 | 1,845 | 1,847 |
| 6 | John Deere Owner Trust 2016-B | 1.490% | 5/15/23 | 1,935 | 1,925 |
| 6 | John Deere Owner Trust 2017-A | 2.110% | 12/15/23 | 10,750 | 10,797 |
| 6 | John Deere Owner Trust 2017-B | 2.110% | 7/15/24 | 5,940 | 5,946 |
| 6,8 | JP Morgan Chase Commercial Mortgage | | | | |
| | Securities Trust 2010-C1 | 4.608% | 6/15/43 | 88 | 91 |
| 6,8 | JP Morgan Chase Commercial Mortgage | | | | |
| | Securities Trust 2010-C2 | 3.616% | 11/15/43 | 32 | 32 |
| 6,8 | JP Morgan Chase Commercial Mortgage | | | | |
| | Securities Trust 2010-C2 | 4.070% | 11/15/43 | 239 | 250 |
| 6,8 | JP Morgan Chase Commercial Mortgage | | | | |
| | Securities Trust 2011-C3 | 4.388% | 2/15/46 | 1,768 | 1,781 |
| 6,8 | JP Morgan Chase Commercial Mortgage | | | | |
| | Securities Trust 2011-C3 | 4.717% | 2/15/46 | 400 | 425 |
14
| | | | | |
| Institutional Short-Term Bond Fund | | | | |
| |
| |
| |
| | | | | Face | Market |
| | | | Maturity | Amount | Value • |
| | | Coupon | Date | ($000) | ($000) |
| 6,8 | JP Morgan Chase Commercial Mortgage | | | | |
| | Securities Trust 2011-C5 | 5.588% | 8/15/46 | 673 | 736 |
| 6,8 | JP Morgan Chase Commercial Mortgage | | | | |
| | Securities Trust 2011-RR1 | 4.717% | 3/16/46 | 3,003 | 3,182 |
| 6 | JP Morgan Chase Commercial Mortgage | | | | |
| | Securities Trust 2012-C8 | 2.829% | 10/15/45 | 251 | 254 |
| 6,8 | JP Morgan Chase Commercial Mortgage | | | | |
| | Securities Trust 2012-C8 | 3.424% | 10/15/45 | 1,283 | 1,309 |
| 6,8 | JP Morgan Chase Commercial Mortgage | | | | |
| | Securities Trust 2012-HSBC | 3.093% | 7/5/32 | 846 | 870 |
| 6 | JP Morgan Chase Commercial Mortgage | | | | |
| | Securities Trust 2013-C13 | 3.994% | 1/15/46 | 1,353 | 1,440 |
| 6 | JP Morgan Chase Commercial Mortgage | | | | |
| | Securities Trust 2013-C16 | 3.674% | 12/15/46 | 234 | 244 |
| 6 | JP Morgan Chase Commercial Mortgage | | | | |
| | Securities Trust 2013-C16 | 3.881% | 12/15/46 | 184 | 194 |
| 6 | JP Morgan Chase Commercial Mortgage | | | | |
| | Securities Trust 2013-C16 | 4.166% | 12/15/46 | 900 | 967 |
| 6 | JP Morgan Chase Commercial Mortgage | | | | |
| | Securities Trust 2013-LC11 | 2.960% | 4/15/46 | 607 | 614 |
| 6 | JP Morgan Chase Commercial Mortgage | | | | |
| | Securities Trust 2016-JP4 | 3.648% | 12/15/49 | 60 | 62 |
| 6 | JP Morgan Chase Commercial Mortgage | | | | |
| | Securities Trust 2017-JP6 | 3.490% | 7/15/50 | 170 | 175 |
| 6 | JPMBB Commercial Mortgage Securities | | | | |
| | Trust 2013-C12 | 3.664% | 7/15/45 | 1,223 | 1,282 |
| 6 | JPMBB Commercial Mortgage Securities | | | | |
| | Trust 2013-C12 | 4.161% | 7/15/45 | 1,425 | 1,498 |
| 6 | JPMBB Commercial Mortgage Securities | | | | |
| | Trust 2013-C14 | 3.761% | 8/15/46 | 170 | 178 |
| 6 | JPMBB Commercial Mortgage Securities | | | | |
| | Trust 2013-C14 | 4.133% | 8/15/46 | 252 | 269 |
| 6 | JPMBB Commercial Mortgage Securities | | | | |
| | Trust 2013-C15 | 3.659% | 11/15/45 | 194 | 202 |
| 6 | JPMBB Commercial Mortgage Securities | | | | |
| | Trust 2013-C17 | 4.199% | 1/15/47 | 834 | 897 |
| 6 | JPMBB Commercial Mortgage Securities | | | | |
| | Trust 2014-C18 | 4.079% | 2/15/47 | 1,085 | 1,157 |
| 6 | JPMBB Commercial Mortgage Securities | | | | |
| | Trust 2014-C18 | 4.439% | 2/15/47 | 544 | 580 |
| 6 | JPMBB Commercial Mortgage Securities | | | | |
| | Trust 2014-C19 | 3.997% | 4/15/47 | 100 | 106 |
| 6 | JPMBB Commercial Mortgage Securities | | | | |
| | Trust 2014-C21 | 3.493% | 8/15/47 | 190 | 196 |
| 6 | JPMBB Commercial Mortgage Securities | | | | |
| | Trust 2014-C24 | 3.639% | 11/15/47 | 853 | 890 |
| 6 | JPMCC Commercial Mortgage Securities | | | | |
| | Trust 2017-JP5 | 3.723% | 3/15/50 | 470 | 492 |
| 6 | JPMCC Commercial Mortgage Securities | | | | |
| | Trust 2017-JP7 | 3.454% | 9/15/50 | 340 | 348 |
| 6,8 | Kubota Credit Owner Trust 2017-1A | 2.160% | 3/15/24 | 3,870 | 3,860 |
| 6 | LB-UBS Commercial Mortgage Trust 2008-C1 | 6.319% | 4/15/41 | 2,435 | 2,477 |
| 6,7,8 Master Credit Card Trust II Series 2016-1A | 1.987% | 9/23/19 | 43,020 | 43,146 |
| 6,7,8 Mercedes-Benz Master Owner Trust 2016-B | 1.934% | 5/17/21 | 9,730 | 9,800 |
| 6,7,8 Mercedes-Benz Master Owner Trust 2017-B | 1.654% | 5/16/22 | 25,700 | 25,773 |
15
| | | | | |
| Institutional Short-Term Bond Fund | | | | |
| |
| |
| |
| | | | | Face | Market |
| | | | Maturity | Amount | Value • |
| | | Coupon | Date | ($000) | ($000) |
| 6,8 | MMAF Equipment Finance LLC 2011-AA | 3.040% | 8/15/28 | 1,403 | 1,405 |
| 6,8 | MMAF Equipment Finance LLC 2012-AA | 1.980% | 6/10/32 | 2,958 | 2,964 |
| 6,8 | MMAF Equipment Finance LLC 2013-AA | 1.680% | 5/11/20 | 3,828 | 3,829 |
| 6,8 | MMAF Equipment Finance LLC 2013-AA | 2.570% | 6/9/33 | 7,037 | 7,114 |
| 6,8 | MMAF Equipment Finance LLC 2016-AA | 2.210% | 12/15/32 | 7,480 | 7,424 |
| 6,8 | MMAF Equipment Finance LLC 2017-A | 2.410% | 8/16/24 | 10,320 | 10,346 |
| 6,8 | MMAF Equipment Finance LLC 2017-A | 2.680% | 7/16/27 | 5,160 | 5,189 |
| 6 | Morgan Stanley Bank of America Merrill | | | | |
| | Lynch Trust 2012-C5 | 3.176% | 8/15/45 | 399 | 410 |
| 6 | Morgan Stanley Bank of America Merrill | | | | |
| | Lynch Trust 2012-C5 | 3.792% | 8/15/45 | 387 | 401 |
| 6 | Morgan Stanley Bank of America Merrill | | | | |
| | Lynch Trust 2012-C6 | 2.858% | 11/15/45 | 201 | 204 |
| 6 | Morgan Stanley Bank of America Merrill | | | | |
| | Lynch Trust 2013-C10 | 4.219% | 7/15/46 | 1,810 | 1,944 |
| 6 | Morgan Stanley Bank of America Merrill | | | | |
| | Lynch Trust 2013-C11 | 3.960% | 8/15/46 | 873 | 925 |
| 6 | Morgan Stanley Bank of America Merrill | | | | |
| | Lynch Trust 2013-C11 | 4.315% | 8/15/46 | 130 | 139 |
| 6 | Morgan Stanley Bank of America Merrill | | | | |
| | Lynch Trust 2013-C12 | 3.824% | 10/15/46 | 193 | 202 |
| 6 | Morgan Stanley Bank of America Merrill | | | | |
| | Lynch Trust 2013-C12 | 4.259% | 10/15/46 | 50 | 54 |
| 6 | Morgan Stanley Bank of America Merrill | | | | |
| | Lynch Trust 2013-C13 | 4.039% | 11/15/46 | 75 | 80 |
| 6 | Morgan Stanley Bank of America Merrill | | | | |
| | Lynch Trust 2014-C14 | 4.064% | 2/15/47 | 194 | 207 |
| 6 | Morgan Stanley Bank of America Merrill | | | | |
| | Lynch Trust 2014-C14 | 4.384% | 2/15/47 | 194 | 206 |
| 6 | Morgan Stanley Bank of America Merrill | | | | |
| | Lynch Trust 2014-C15 | 3.773% | 4/15/47 | 1,214 | 1,278 |
| 6 | Morgan Stanley Bank of America Merrill | | | | |
| | Lynch Trust 2014-C15 | 4.051% | 4/15/47 | 1,645 | 1,753 |
| 6 | Morgan Stanley Bank of America Merrill | | | | |
| | Lynch Trust 2014-C16 | 3.892% | 6/15/47 | 1,385 | 1,462 |
| 6 | Morgan Stanley Bank of America Merrill | | | | |
| | Lynch Trust 2014-C16 | 4.094% | 6/15/47 | 361 | 380 |
| 6 | Morgan Stanley Bank of America Merrill | | | | |
| | Lynch Trust 2015-C22 | 3.306% | 4/15/48 | 659 | 668 |
| 6 | Morgan Stanley Bank of America Merrill | | | | |
| | Lynch Trust 2015-C23 | 3.451% | 7/15/50 | 20 | 21 |
| 6 | Morgan Stanley Bank of America Merrill | | | | |
| | Lynch Trust 2016-C32 | 3.720% | 12/15/49 | 130 | 136 |
| 6,8 | Morgan Stanley Capital I Trust 2012-STAR | 3.201% | 8/5/34 | 883 | 888 |
| 6,7,8,10 Motor plc 2017 1A | 1.773% | 9/25/24 | 14,360 | 14,360 |
| 8 | National Australia Bank Ltd. | 2.250% | 3/16/21 | 22,840 | 22,814 |
| 6,7 | Navient Student Loan Trust 2014-8 | 1.677% | 4/25/23 | 20,486 | 20,542 |
| 6,7 | Navient Student Loan Trust 2015-3 | 1.887% | 6/26/56 | 16,600 | 16,645 |
| 6,7,8 | Navient Student Loan Trust 2016-2 | 2.287% | 6/25/65 | 5,810 | 5,891 |
| 6,7,8 | Navient Student Loan Trust 2016-3 | 2.087% | 6/25/65 | 5,140 | 5,200 |
| 6,7,8 | Navient Student Loan Trust 2016-6A | 1.987% | 3/25/66 | 35,210 | 35,322 |
| 6,7,8 | Navient Student Loan Trust 2017-1 | 1.987% | 7/26/66 | 12,020 | 12,162 |
| 6,7,8 | Navient Student Loan Trust 2017-3A | 1.837% | 7/26/66 | 8,910 | 8,971 |
| 6,7,8 | Navient Student Loan Trust 2017-4A | 1.737% | 9/27/66 | 7,760 | 7,789 |
16
| | | | | |
| Institutional Short-Term Bond Fund | | | | |
| |
| |
| |
| | | | | Face | Market |
| | | | Maturity | Amount | Value • |
| | | Coupon | Date | ($000) | ($000) |
| 6,7,8 | Navistar Financial Dealer Note Master Trust | | | | |
| | II 2017-1A | 2.017% | 6/27/22 | 11,440 | 11,446 |
| 6,8 | NextGear Floorplan Master Owner Trust | | | | |
| | 2016-1A | 2.740% | 4/15/21 | 8,250 | 8,314 |
| 6 | Nissan Auto Lease Trust 2017-A | 1.910% | 4/15/20 | 14,210 | 14,225 |
| 6 | Nissan Auto Lease Trust 2017-A | 2.040% | 9/15/22 | 5,130 | 5,119 |
| 6 | Nissan Auto Receivables 2015-A Owner | | | | |
| | Trust | 1.500% | 9/15/21 | 27,560 | 27,493 |
| 6,7 | Nissan Master Owner Trust Receivables | | | | |
| | Series 2016-A | 1.874% | 6/15/21 | 41,710 | 42,042 |
| 9 | North Carolina State Education Assistance | | | | |
| | Authority 2011-1 | 2.214% | 1/26/26 | 696 | 696 |
| 6,8 | OBP Depositor LLC Trust 2010-OBP | 4.646% | 7/15/45 | 481 | 513 |
| 6,8 | Palisades Center Trust 2016-PLSD | 2.713% | 4/13/33 | 250 | 251 |
| 6,7,8 | PHEAA Student Loan Trust 2016-2A | 2.187% | 11/25/65 | 14,933 | 14,970 |
| | Royal Bank of Canada | 2.200% | 9/23/19 | 14,165 | 14,212 |
| | Royal Bank of Canada | 2.100% | 10/14/20 | 23,750 | 23,708 |
| 6 | Royal Bank of Canada | 1.875% | 2/5/21 | 4,900 | 4,878 |
| | Royal Bank of Canada | 2.300% | 3/22/21 | 13,995 | 13,979 |
| 6,8 | Securitized Term Auto Receivables | | | | |
| | Trust 2016-1A | 1.524% | 3/25/20 | 14,660 | 14,584 |
| 6,8 | Securitized Term Auto Receivables | | | | |
| | Trust 2016-1A | 1.794% | 2/25/21 | 13,660 | 13,561 |
| 6,8 | Securitized Term Auto Receivables | | | | |
| | Trust 2017-1A | 1.890% | 8/25/20 | 26,230 | 26,195 |
| 6,8 | Securitized Term Auto Receivables | | | | |
| | Trust 2017-1A | 2.209% | 6/25/21 | 7,900 | 7,907 |
| 6,8,10 | Securitized Term Auto Receivables | | | | |
| | Trust 2017-2A | 2.040% | 4/26/21 | 10,990 | 10,990 |
| 6,8,10 | Securitized Term Auto Receivables | | | | |
| | Trust 2017-2A | 2.289% | 3/25/22 | 3,690 | 3,690 |
| 6,9 | SLM Student Loan Trust 2003-14 | 1.544% | 1/25/23 | 3,880 | 3,879 |
| 6,9 | SLM Student Loan Trust 2005-5 | 1.414% | 4/25/25 | 3,464 | 3,462 |
| 6,9 | SLM Student Loan Trust 2005-6 | 1.424% | 7/27/26 | 907 | 907 |
| 6,7 | SLM Student Loan Trust 2013-6 | 1.737% | 2/25/21 | 22 | 22 |
| 6,7 | SLM Student Loan Trust 2014-1 | 1.617% | 7/26/21 | 2,047 | 2,047 |
| 6 | SMART ABS Series 2014-1US Trust | 1.680% | 12/14/19 | 2,622 | 2,620 |
| 6 | SMART ABS Series 2016-2US Trust | 2.050% | 12/14/22 | 2,160 | 2,138 |
| 8 | SpareBank 1 Boligkreditt AS | 1.250% | 5/2/18 | 3,097 | 3,089 |
| 6,8 | SpareBank 1 Boligkreditt AS | 1.750% | 11/15/20 | 8,341 | 8,284 |
| 8 | Swedbank Hypotek AB | 1.375% | 3/28/18 | 3,868 | 3,863 |
| 6 | Synchrony Credit Card Master Note | | | | |
| | Trust 2015-1 | 2.370% | 3/15/23 | 13,760 | 13,886 |
| 6 | Synchrony Credit Card Master Note | | | | |
| | Trust 2015-2 | 1.600% | 4/15/21 | 14,360 | 14,363 |
| 6 | Synchrony Credit Card Master Note | | | | |
| | Trust 2015-4 | 2.380% | 9/15/23 | 22,600 | 22,830 |
| 6 | Synchrony Credit Card Master Note | | | | |
| | Trust 2016-3 | 1.580% | 9/15/22 | 19,410 | 19,276 |
| 6 | Synchrony Credit Card Master Note Trust | | | | |
| | Series 2012-2 | 2.220% | 1/15/22 | 16,577 | 16,677 |
| 6,7,8 | Trillium Credit Card Trust II 2016-1A | 1.958% | 5/26/21 | 66,330 | 66,542 |
| 6 | UBS Commercial Mortgage Trust 2012-C1 | 4.171% | 5/10/45 | 192 | 202 |
| 6,8 | UBS-BAMLL Trust 2012-WRM | 3.663% | 6/10/30 | 1,551 | 1,574 |
17
| | | | | |
| Institutional Short-Term Bond Fund | | | | |
| |
| |
| |
| | | | | Face | Market |
| | | | Maturity | Amount | Value • |
| | | Coupon | Date | ($000) | ($000) |
| 6 | UBS-Barclays Commercial Mortgage Trust | | | | |
| | 2012-C4 | 2.850% | 12/10/45 | 228 | 230 |
| 6 | UBS-Barclays Commercial Mortgage Trust | | | | |
| | 2013-C6 | 3.244% | 4/10/46 | 30 | 31 |
| 6 | USAA Auto Owner Trust 2017-1 | 1.880% | 9/15/22 | 6,960 | 6,945 |
| 6,8 | Verizon Owner Trust 2017-1A | 2.060% | 9/20/21 | 20,500 | 20,566 |
| 6,8 | Verizon Owner Trust 2017-2A | 1.920% | 12/20/21 | 25,370 | 25,346 |
| 6,8 | VNDO 2012-6AVE Mortgage Trust | 2.996% | 11/15/30 | 1,428 | 1,451 |
| 6,8 | Volvo Financial Equipment LLC Series | | | | |
| | 2016-1A | 1.890% | 9/15/20 | 5,160 | 5,153 |
| 6,8 | Volvo Financial Equipment LLC Series | | | | |
| | 2017-1A | 2.210% | 11/15/21 | 4,970 | 4,973 |
| 6 | Wells Fargo Commercial Mortgage Trust | | | | |
| | 2012-LC5 | 2.918% | 10/15/45 | 326 | 331 |
| 6 | Wells Fargo Commercial Mortgage Trust | | | | |
| | 2012-LC5 | 3.539% | 10/15/45 | 279 | 285 |
| 6 | Wells Fargo Commercial Mortgage Trust | | | | |
| | 2013-LC12 | 3.928% | 7/15/46 | 203 | 213 |
| 6 | Wells Fargo Commercial Mortgage Trust | | | | |
| | 2013-LC12 | 4.218% | 7/15/46 | 784 | 845 |
| 6 | Wells Fargo Commercial Mortgage Trust | | | | |
| | 2013-LC12 | 4.430% | 7/15/46 | 272 | 290 |
| 6 | Wells Fargo Commercial Mortgage Trust | | | | |
| | 2015-C26 | 3.166% | 2/15/48 | 290 | 293 |
| 6 | Wells Fargo Commercial Mortgage Trust | | | | |
| | 2015-C29 | 3.637% | 6/15/48 | 70 | 73 |
| 6 | Wells Fargo Commercial Mortgage Trust | | | | |
| | 2015-SG1 | 3.789% | 9/15/48 | 484 | 507 |
| 6 | Wells Fargo Commercial Mortgage Trust | | | | |
| | 2016-C37 | 3.794% | 12/15/49 | 50 | 53 |
| 6 | Wells Fargo Commercial Mortgage Trust | | | | |
| | 2017-C38 | 3.453% | 7/15/50 | 560 | 573 |
| 6 | Wells Fargo Commercial Mortgage Trust | | | | |
| | 2017-C39 | 3.418% | 9/15/50 | 520 | 531 |
| 6 | Wells Fargo Commercial Mortgage Trust | | | | |
| | 2017-RC1 | 3.631% | 1/15/60 | 240 | 249 |
| 6,7 | Wells Fargo Dealer Floorplan Master Note | | | | |
| | Trust Series 2015-2 | 1.886% | 1/20/22 | 18,460 | 18,575 |
| 8 | Westpac Banking Corp. | 1.850% | 11/26/18 | 13,270 | 13,266 |
| 8 | Westpac Banking Corp. | 2.250% | 11/9/20 | 13,440 | 13,440 |
| 8 | Westpac Banking Corp. | 2.100% | 2/25/21 | 1,160 | 1,155 |
| 6,8 | WFRBS Commercial Mortgage Trust | | | | |
| | 2011-C3 | 4.375% | 3/15/44 | 269 | 285 |
| 6 | WFRBS Commercial Mortgage Trust | | | | |
| | 2012-C7 | 3.431% | 6/15/45 | 262 | 272 |
| 6 | WFRBS Commercial Mortgage Trust | | | | |
| | 2012-C7 | 4.090% | 6/15/45 | 584 | 610 |
| 6 | WFRBS Commercial Mortgage Trust | | | | |
| | 2012-C8 | 3.001% | 8/15/45 | 169 | 173 |
| 6 | WFRBS Commercial Mortgage Trust | | | | |
| | 2012-C9 | 2.870% | 11/15/45 | 400 | 406 |
| 6 | WFRBS Commercial Mortgage Trust | | | | |
| | 2012-C9 | 3.388% | 11/15/45 | 440 | 448 |
| 6 | WFRBS Commercial Mortgage Trust | | | | |
| | 2013-C15 | 3.720% | 8/15/46 | 231 | 241 |
18
| | | | | |
| Institutional Short-Term Bond Fund | | | | |
| |
| |
| |
| | | | | Face | Market |
| | | | Maturity | Amount | Value • |
| | | Coupon | Date | ($000) | ($000) |
| 6 | WFRBS Commercial Mortgage Trust | | | | |
| | 2013-C15 | 4.153% | 8/15/46 | 396 | 425 |
| 6 | WFRBS Commercial Mortgage Trust | | | | |
| | 2013-C17 | 3.558% | 12/15/46 | 167 | 174 |
| 6 | WFRBS Commercial Mortgage Trust | | | | |
| | 2013-C18 | 3.676% | 12/15/46 | 221 | 231 |
| 6 | WFRBS Commercial Mortgage Trust | | | | |
| | 2013-C18 | 4.162% | 12/15/46 | 790 | 851 |
| 6 | WFRBS Commercial Mortgage Trust | | | | |
| | 2014-C19 | 3.829% | 3/15/47 | 10 | 10 |
| 6 | WFRBS Commercial Mortgage Trust | | | | |
| | 2014-C19 | 4.101% | 3/15/47 | 80 | 85 |
| 6 | WFRBS Commercial Mortgage Trust | | | | |
| | 2014-C23 | 3.917% | 10/15/57 | 643 | 682 |
| 6 | WFRBS Commercial Mortgage Trust | | | | |
| | 2014-C24 | 3.607% | 11/15/47 | 1,521 | 1,575 |
| 6 | WFRBS Commercial Mortgage Trust | | | | |
| | 2014-LC14 | 3.766% | 3/15/47 | 40 | 42 |
| 6 | WFRBS Commercial Mortgage Trust | | | | |
| | 2014-LC14 | 4.045% | 3/15/47 | 827 | 882 |
| 6,8 | Wheels SPV 2 LLC 2016-1A | 1.870% | 5/20/25 | 1,945 | 1,938 |
| 6 | World Financial Network Credit Card Master | | | | |
| | Note Trust Series 2012-D | 2.150% | 4/17/23 | 20,637 | 20,718 |
| 6 | World Financial Network Credit Card Master | | | | |
| | Note Trust Series 2013-A | 1.610% | 12/15/21 | 6,191 | 6,192 |
| 6,7 | World Financial Network Credit Card Master | | | | |
| | Note Trust Series 2015-A | 1.714% | 2/15/22 | 11,160 | 11,179 |
| 6 | World Financial Network Credit Card Master | | | | |
| | Note Trust Series 2015-B | 2.550% | 6/17/24 | 3,030 | 3,061 |
| 6 | World Omni Auto Receivables Trust 2016-A | 1.770% | 9/15/21 | 13,950 | 13,953 |
| 6 | World Omni Auto Receivables Trust 2016-B | 1.300% | 2/15/22 | 26,830 | 26,624 |
| 6 | World Omni Automobile Lease Securitization | | | | |
| | Trust 2017-A | 2.320% | 8/15/22 | 8,800 | 8,821 |
| Total Asset-Backed/Commercial Mortgage-Backed Securities (Cost $2,567,785) | | 2,573,567 |
| Corporate Bonds (27.4%) | | | | |
| Finance (19.5%) | | | | |
| | Banking (18.7%) | | | | |
| 8 | ABN AMRO Bank NV | 2.500% | 10/30/18 | 2,750 | 2,772 |
| | American Express Credit Corp. | 1.875% | 5/3/19 | 6,670 | 6,651 |
| 8 | ANZ New Zealand International Ltd. | 2.250% | 2/1/19 | 13,630 | 13,693 |
| | Australia & New Zealand Banking Group Ltd. | 2.550% | 11/23/21 | 8,115 | 8,110 |
| | Bank of America NA | 1.750% | 6/5/18 | 1,221 | 1,221 |
| | Bank of America NA | 2.050% | 12/7/18 | 16,080 | 16,132 |
| | Bank of Nova Scotia | 1.650% | 6/14/19 | 8,170 | 8,148 |
| | Bank of Nova Scotia | 2.350% | 10/21/20 | 3,890 | 3,921 |
| | Bank of Nova Scotia | 2.700% | 3/7/22 | 2,765 | 2,795 |
| 8 | Bank of Tokyo-Mitsubishi UFJ Ltd. | 1.700% | 3/5/18 | 2,270 | 2,268 |
| 8 | Bank of Tokyo-Mitsubishi UFJ Ltd. | 2.700% | 9/9/18 | 300 | 302 |
| 8 | Bank of Tokyo-Mitsubishi UFJ Ltd. | 2.150% | 9/14/18 | 6,240 | 6,246 |
| 8 | Bank of Tokyo-Mitsubishi UFJ Ltd. | 2.300% | 3/10/19 | 4,860 | 4,876 |
| 8 | Bank of Tokyo-Mitsubishi UFJ Ltd. | 2.300% | 3/5/20 | 3,355 | 3,364 |
| 8 | Bank of Tokyo-Mitsubishi UFJ Ltd. | 2.750% | 9/14/20 | 7,487 | 7,572 |
| 8 | Banque Federative du Credit Mutuel SA | 2.000% | 4/12/19 | 17,540 | 17,572 |
| 8 | Banque Federative du Credit Mutuel SA | 2.200% | 7/20/20 | 22,904 | 22,891 |
19
| | | | |
| Institutional Short-Term Bond Fund | | | | |
| |
| |
| |
| | | | Face | Market |
| | | Maturity | Amount | Value • |
| | Coupon | Date | ($000) | ($000) |
| 8 Banque Federative du Credit Mutuel SA | 2.750% | 10/15/20 | 12,215 | 12,354 |
| 8 Banque Federative du Credit Mutuel SA | 2.500% | 4/13/21 | 3,995 | 3,998 |
| Canadian Imperial Bank of Commerce | 1.550% | 1/23/18 | 1,255 | 1,255 |
| Canadian Imperial Bank of Commerce | 2.100% | 10/5/20 | 21,825 | 21,777 |
| Citibank NA | 2.100% | 6/12/20 | 8,110 | 8,114 |
| Commonwealth Bank of Australia | 1.625% | 3/12/18 | 5,310 | 5,311 |
| Commonwealth Bank of Australia | 2.500% | 9/20/18 | 7,220 | 7,276 |
| Commonwealth Bank of Australia | 1.750% | 11/2/18 | 6,137 | 6,127 |
| Commonwealth Bank of Australia | 2.300% | 9/6/19 | 19,150 | 19,299 |
| 8 Commonwealth Bank of Australia | 5.000% | 10/15/19 | 10,177 | 10,768 |
| 8 Commonwealth Bank of Australia | 2.050% | 9/18/20 | 23,555 | 23,441 |
| Commonwealth Bank of Australia | 2.400% | 11/2/20 | 2,790 | 2,801 |
| Commonwealth Bank of Australia | 2.550% | 3/15/21 | 4,780 | 4,797 |
| 8 Commonwealth Bank of Australia | 2.000% | 9/6/21 | 5,010 | 4,920 |
| 8 Commonwealth Bank of Australia | 2.750% | 3/10/22 | 4,395 | 4,425 |
| Cooperatieve Rabobank UA | 2.250% | 1/14/19 | 11,020 | 11,101 |
| Cooperatieve Rabobank UA | 2.500% | 1/19/21 | 1,795 | 1,813 |
| Credit Suisse AG | 1.700% | 4/27/18 | 13,685 | 13,695 |
| 8 Danske Bank A/S | 1.650% | 9/6/19 | 8,227 | 8,170 |
| 8 Danske Bank A/S | 2.750% | 9/17/20 | 7,260 | 7,360 |
| 8 Danske Bank A/S | 2.700% | 3/2/22 | 4,705 | 4,726 |
| 8 DNB Bank ASA | 2.125% | 10/2/20 | 14,850 | 14,839 |
| Fifth Third Bank | 2.150% | 8/20/18 | 6,448 | 6,475 |
| Fifth Third Bank | 1.625% | 9/27/19 | 8,940 | 8,883 |
| Goldman Sachs Group Inc. | 5.950% | 1/18/18 | 21,905 | 22,176 |
| Goldman Sachs Group Inc. | 2.375% | 1/22/18 | 39,705 | 39,790 |
| Goldman Sachs Group Inc. | 6.150% | 4/1/18 | 15,680 | 16,017 |
| Goldman Sachs Group Inc. | 2.900% | 7/19/18 | 34,109 | 34,389 |
| Goldman Sachs Group Inc. | 2.625% | 1/31/19 | 11,570 | 11,666 |
| Goldman Sachs Group Inc. | 2.600% | 12/27/20 | 6,605 | 6,642 |
| Goldman Sachs Group Inc. | 2.625% | 4/25/21 | 1,965 | 1,973 |
| HSBC Holdings plc | 2.650% | 1/5/22 | 11,630 | 11,642 |
| HSBC USA Inc. | 1.500% | 11/13/17 | 9,630 | 9,629 |
| HSBC USA Inc. | 1.625% | 1/16/18 | 25,090 | 25,097 |
| HSBC USA Inc. | 1.700% | 3/5/18 | 4,343 | 4,346 |
| Huntington National Bank | 2.200% | 11/6/18 | 5,527 | 5,546 |
| Huntington National Bank | 2.375% | 3/10/20 | 4,670 | 4,695 |
| 8 ING Bank NV | 2.000% | 11/26/18 | 5,810 | 5,810 |
| 8 ING Bank NV | 2.300% | 3/22/19 | 8,511 | 8,549 |
| JPMorgan Chase & Co. | 6.000% | 1/15/18 | 46,352 | 46,928 |
| JPMorgan Chase & Co. | 1.800% | 1/25/18 | 12,966 | 12,972 |
| JPMorgan Chase & Co. | 1.700% | 3/1/18 | 38,317 | 38,327 |
| JPMorgan Chase & Co. | 2.200% | 10/22/19 | 11,741 | 11,808 |
| JPMorgan Chase & Co. | 2.250% | 1/23/20 | 5,730 | 5,758 |
| JPMorgan Chase & Co. | 2.750% | 6/23/20 | 4,950 | 5,044 |
| JPMorgan Chase & Co. | 2.550% | 10/29/20 | 28,372 | 28,691 |
| JPMorgan Chase & Co. | 2.550% | 3/1/21 | 10,241 | 10,317 |
| 6 JPMorgan Chase & Co. | 2.776% | 4/25/23 | 7,985 | 8,015 |
| JPMorgan Chase Bank NA | 6.000% | 10/1/17 | 11,790 | 11,791 |
| Manufacturers & Traders Trust Co. | 2.050% | 8/17/20 | 4,200 | 4,186 |
| Manufacturers & Traders Trust Co. | 2.500% | 5/18/22 | 2,490 | 2,492 |
| Mitsubishi UFJ Financial Group Inc. | 2.950% | 3/1/21 | 8,395 | 8,527 |
| Mitsubishi UFJ Financial Group Inc. | 2.190% | 9/13/21 | 5,430 | 5,360 |
| Mitsubishi UFJ Financial Group Inc. | 2.665% | 7/25/22 | 11,255 | 11,235 |
| 8 Mitsubishi UFJ Trust & Banking Corp. | 2.450% | 10/16/19 | 2,625 | 2,640 |
20
| | | | | |
| Institutional Short-Term Bond Fund | | | | |
| |
| |
| |
| | | | | Face | Market |
| | | | Maturity | Amount | Value • |
| | | Coupon | Date | ($000) | ($000) |
| 8 | Mitsubishi UFJ Trust & Banking Corp. | 2.650% | 10/19/20 | 16,860 | 16,988 |
| | Morgan Stanley | 1.875% | 1/5/18 | 6,400 | 6,404 |
| | Morgan Stanley | 2.125% | 4/25/18 | 41,310 | 41,405 |
| | Morgan Stanley | 2.200% | 12/7/18 | 1,088 | 1,092 |
| | Morgan Stanley | 2.500% | 1/24/19 | 10,235 | 10,307 |
| | Morgan Stanley | 2.450% | 2/1/19 | 3,976 | 4,003 |
| | Morgan Stanley | 2.500% | 4/21/21 | 13,005 | 13,024 |
| | Morgan Stanley | 2.625% | 11/17/21 | 11,125 | 11,124 |
| | Morgan Stanley | 2.750% | 5/19/22 | 5,890 | 5,909 |
| 9 | Morgan Stanley | 2.532% | 5/8/24 | 4,140 | 4,191 |
| | MUFG Americas Holdings Corp. | 1.625% | 2/9/18 | 4,800 | 4,799 |
| | MUFG Union Bank NA | 2.625% | 9/26/18 | 5,970 | 6,020 |
| | MUFG Union Bank NA | 2.250% | 5/6/19 | 4,580 | 4,594 |
| | National Australia Bank Ltd. | 2.300% | 7/25/18 | 3,860 | 3,880 |
| | National Australia Bank Ltd. | 2.000% | 1/14/19 | 6,293 | 6,306 |
| | National Australia Bank Ltd. | 1.375% | 7/12/19 | 13,000 | 12,880 |
| | National Australia Bank Ltd. | 2.250% | 1/10/20 | 6,000 | 6,017 |
| | National Bank of Canada | 2.100% | 12/14/18 | 6,815 | 6,832 |
| | National Bank of Canada | 2.150% | 6/12/20 | 11,205 | 11,195 |
| 8 | Nordea Bank AB | 1.625% | 9/30/19 | 3,750 | 3,724 |
| | PNC Bank NA | 1.450% | 7/29/19 | 8,535 | 8,466 |
| | Royal Bank of Canada | 1.800% | 7/30/18 | 2,411 | 2,415 |
| | Royal Bank of Canada | 2.000% | 12/10/18 | 5,235 | 5,252 |
| | Royal Bank of Canada | 2.150% | 3/15/19 | 17,304 | 17,408 |
| | Royal Bank of Canada | 1.500% | 7/29/19 | 13,015 | 12,943 |
| | Royal Bank of Canada | 2.125% | 3/2/20 | 19,235 | 19,317 |
| | Royal Bank of Canada | 2.350% | 10/30/20 | 8,389 | 8,453 |
| | Santander UK plc | 3.050% | 8/23/18 | 11,250 | 11,370 |
| | Santander UK plc | 2.000% | 8/24/18 | 7,787 | 7,798 |
| | Santander UK plc | 2.500% | 3/14/19 | 10,220 | 10,305 |
| 8 | Skandinaviska Enskilda Banken AB | 1.750% | 3/19/18 | 9,085 | 9,091 |
| 8 | Skandinaviska Enskilda Banken AB | 2.375% | 3/25/19 | 7,040 | 7,090 |
| | Skandinaviska Enskilda Banken AB | 1.875% | 9/13/21 | 4,895 | 4,789 |
| | Sumitomo Mitsui Banking Corp. | 1.950% | 7/23/18 | 2,153 | 2,157 |
| | Sumitomo Mitsui Banking Corp. | 2.450% | 1/10/19 | 5,765 | 5,806 |
| | Sumitomo Mitsui Banking Corp. | 2.250% | 7/11/19 | 1,250 | 1,254 |
| | Svenska Handelsbanken AB | 2.500% | 1/25/19 | 7,835 | 7,900 |
| | Svenska Handelsbanken AB | 2.250% | 6/17/19 | 5,500 | 5,525 |
| | Svenska Handelsbanken AB | 1.500% | 9/6/19 | 13,625 | 13,528 |
| | Svenska Handelsbanken AB | 1.950% | 9/8/20 | 13,085 | 13,037 |
| | Svenska Handelsbanken AB | 1.875% | 9/7/21 | 3,015 | 2,957 |
| 8 | Swedbank AB | 1.750% | 3/12/18 | 17,350 | 17,365 |
| 8 | Swedbank AB | 2.800% | 3/14/22 | 4,535 | 4,583 |
| | Toronto-Dominion Bank | 1.450% | 8/13/19 | 22,525 | 22,386 |
| | Toronto-Dominion Bank | 1.850% | 9/11/20 | 15,895 | 15,827 |
| 8 | UBS AG | 2.200% | 6/8/20 | 10,820 | 10,809 |
| 8 | UBS Group Funding Jersey Ltd. | 3.000% | 4/15/21 | 5,304 | 5,362 |
| 6,8 | UBS Group Funding Switzerland AG | 2.859% | 8/15/23 | 6,125 | 6,096 |
| | Wachovia Corp. | 5.750% | 2/1/18 | 12,660 | 12,830 |
| | Wells Fargo & Co. | 2.100% | 7/26/21 | 6,450 | 6,374 |
| | Wells Fargo Bank NA | 1.650% | 1/22/18 | 21,087 | 21,098 |
| | Wells Fargo Bank NA | 1.800% | 11/28/18 | 8,845 | 8,855 |
| | Wells Fargo Bank NA | 2.150% | 12/6/19 | 11,830 | 11,884 |
| | Westpac Banking Corp. | 1.600% | 1/12/18 | 3,390 | 3,392 |
| | Westpac Banking Corp. | 2.250% | 7/30/18 | 9,010 | 9,045 |
21
| | | | |
| Institutional Short-Term Bond Fund | | | | |
| |
| |
| |
| | | | Face | Market |
| | | Maturity | Amount | Value • |
| | Coupon | Date | ($000) | ($000) |
| Westpac Banking Corp. | 2.250% | 1/17/19 | 13,390 | 13,451 |
| Westpac Banking Corp. | 1.600% | 8/19/19 | 28,105 | 27,988 |
| Westpac Banking Corp. | 4.875% | 11/19/19 | 25,460 | 26,940 |
| Westpac Banking Corp. | 2.000% | 8/19/21 | 4,540 | 4,471 |
| |
| Finance Companies (0.1%) | | | | |
| GE Capital International Funding Co. | 2.342% | 11/15/20 | 9,940 | 9,982 |
| |
| Insurance (0.7%) | | | | |
| 8 AIG Global Funding | 2.700% | 12/15/21 | 2,335 | 2,351 |
| 8 MassMutual Global Funding II | 1.950% | 9/22/20 | 5,035 | 5,006 |
| MetLife Inc. | 1.903% | 12/15/17 | 18,000 | 18,008 |
| 8 Metropolitan Life Global Funding I | 3.000% | 1/10/23 | 1,000 | 1,016 |
| 8 New York Life Global Funding | 1.950% | 9/28/20 | 5,950 | 5,856 |
| 8 Reliance Standard Life Global Funding II | 2.150% | 10/15/18 | 15,550 | 15,560 |
| 8 Reliance Standard Life Global Funding II | 3.050% | 1/20/21 | 1,610 | 1,624 |
| | | | | 1,410,031 |
| Industrial (6.8%) | | | | |
| Basic Industry (0.2%) | | | | |
| 8 Air Liquide Finance SA | 1.375% | 9/27/19 | 3,835 | 3,795 |
| Airgas Inc. | 2.375% | 2/15/20 | 7,185 | 7,219 |
| Airgas Inc. | 3.050% | 8/1/20 | 1,290 | 1,299 |
| |
| Capital Goods (2.0%) | | | | |
| Caterpillar Financial Services Corp. | 7.150% | 2/15/19 | 10,575 | 11,325 |
| Caterpillar Financial Services Corp. | 1.900% | 3/22/19 | 17,625 | 17,664 |
| Caterpillar Financial Services Corp. | 2.250% | 12/1/19 | 13,660 | 13,773 |
| Caterpillar Financial Services Corp. | 2.100% | 1/10/20 | 6,015 | 6,011 |
| Caterpillar Financial Services Corp. | 1.850% | 9/4/20 | 17,405 | 17,258 |
| Caterpillar Financial Services Corp. | 2.500% | 11/13/20 | 4,410 | 4,450 |
| Caterpillar Financial Services Corp. | 1.931% | 10/1/21 | 5,785 | 5,705 |
| Caterpillar Financial Services Corp. | 2.400% | 6/6/22 | 3,115 | 3,113 |
| Caterpillar Inc. | 7.900% | 12/15/18 | 9,000 | 9,658 |
| John Deere Capital Corp. | 5.750% | 9/10/18 | 12,315 | 12,776 |
| John Deere Capital Corp. | 1.950% | 1/8/19 | 15,070 | 15,065 |
| John Deere Capital Corp. | 2.200% | 3/13/20 | 8,815 | 8,876 |
| John Deere Capital Corp. | 2.375% | 7/14/20 | 6,140 | 6,197 |
| Komatsu Mining Corp. | 5.125% | 10/15/21 | 11,942 | 13,104 |
| |
| Communication (0.6%) | | | | |
| America Movil SAB de CV | 5.625% | 11/15/17 | 32,700 | 32,781 |
| America Movil SAB de CV | 5.000% | 3/30/20 | 1,265 | 1,350 |
| 8 NBCUniversal Enterprise Inc. | 1.974% | 4/15/19 | 8,785 | 8,815 |
| |
| Consumer Cyclical (0.9%) | | | | |
| Alibaba Group Holding Ltd. | 1.625% | 11/28/17 | 2,500 | 2,500 |
| American Honda Finance Corp. | 2.125% | 10/10/18 | 11,670 | 11,727 |
| American Honda Finance Corp. | 1.950% | 7/20/20 | 8,725 | 8,708 |
| 8 Harley-Davidson Financial Services Inc. | 2.250% | 1/15/19 | 10,867 | 10,883 |
| 8 Harley-Davidson Financial Services Inc. | 2.400% | 9/15/19 | 6,360 | 6,380 |
| 8 Harley-Davidson Financial Services Inc. | 2.150% | 2/26/20 | 5,467 | 5,442 |
| 8 Harley-Davidson Financial Services Inc. | 2.400% | 6/15/20 | 1,440 | 1,441 |
| 8 Harley-Davidson Funding Corp. | 6.800% | 6/15/18 | 4,760 | 4,923 |
| Lowe’s Cos. Inc. | 1.150% | 4/15/19 | 2,320 | 2,302 |
| 8 Nissan Motor Acceptance Corp. | 2.000% | 3/8/19 | 6,090 | 6,093 |
22
| | | | |
| Institutional Short-Term Bond Fund | | | | |
| |
| |
| |
| | | | Face | Market |
| | | Maturity | Amount | Value • |
| | Coupon | Date | ($000) | ($000) |
| 8 Nissan Motor Acceptance Corp. | 2.150% | 7/13/20 | 3,050 | 3,052 |
| 8 Nissan Motor Acceptance Corp. | 2.150% | 9/28/20 | 4,365 | 4,362 |
| PACCAR Financial Corp. | 1.750% | 8/14/18 | 910 | 911 |
| |
| Consumer Noncyclical (1.0%) | | | | |
| Altria Group Inc. | 9.250% | 8/6/19 | 16,350 | 18,505 |
| Anheuser-Busch InBev Finance Inc. | 1.250% | 1/17/18 | 240 | 240 |
| Anheuser-Busch InBev Finance Inc. | 1.900% | 2/1/19 | 12,238 | 12,266 |
| Anheuser-Busch InBev Worldwide Inc. | 7.750% | 1/15/19 | 4,475 | 4,805 |
| Gilead Sciences Inc. | 1.850% | 9/4/18 | 4,115 | 4,119 |
| Gilead Sciences Inc. | 1.850% | 9/20/19 | 3,500 | 3,502 |
| Gilead Sciences Inc. | 2.350% | 2/1/20 | 12,985 | 13,123 |
| Gilead Sciences Inc. | 2.550% | 9/1/20 | 11,180 | 11,382 |
| Medtronic Inc. | 1.375% | 4/1/18 | 6,700 | 6,698 |
| |
| Energy (1.2%) | | | | |
| BP Capital Markets plc | 2.241% | 9/26/18 | 13,800 | 13,885 |
| BP Capital Markets plc | 4.750% | 3/10/19 | 8,700 | 9,066 |
| BP Capital Markets plc | 1.676% | 5/3/19 | 17,700 | 17,672 |
| BP Capital Markets plc | 4.500% | 10/1/20 | 2,750 | 2,933 |
| Shell International Finance BV | 2.000% | 11/15/18 | 9,200 | 9,227 |
| Shell International Finance BV | 1.375% | 5/10/19 | 35,000 | 34,823 |
| |
| Other Industrial (0.4%) | | | | |
| 8 CK Hutchison International 17 Ltd. | 2.250% | 9/29/20 | 10,900 | 10,865 |
| 8 Hutchison Whampoa International 09 Ltd. | 7.625% | 4/9/19 | 14,665 | 15,840 |
| |
| Technology (0.2%) | | | | |
| Baidu Inc. | 3.250% | 8/6/18 | 10,100 | 10,212 |
| QUALCOMM Inc. | 1.850% | 5/20/19 | 4,415 | 4,426 |
| QUALCOMM Inc. | 2.100% | 5/20/20 | 3,865 | 3,886 |
| |
| Transportation (0.3%) | | | | |
| Burlington Northern Santa Fe LLC | 4.700% | 10/1/19 | 7,727 | 8,147 |
| 6 Delta Air Lines 2012-1 Class A Pass | | | | |
| Through Trust | 4.750% | 11/7/21 | 7,707 | 8,052 |
| 6 Northwest Airlines 2007-1 Class A Pass | | | | |
| Through Trust | 7.027% | 5/1/21 | 4,018 | 4,375 |
| | | | | 497,007 |
| Utilities (1.1%) | | | | |
| Electric (1.0%) | | | | |
| Arizona Public Service Co. | 8.750% | 3/1/19 | 760 | 831 |
| Connecticut Light & Power Co. | 5.500% | 2/1/19 | 3,610 | 3,771 |
| Duke Energy Florida LLC | 4.550% | 4/1/20 | 200 | 212 |
| Georgia Power Co. | 2.000% | 9/8/20 | 7,500 | 7,468 |
| MidAmerican Energy Co. | 2.400% | 3/15/19 | 2,785 | 2,808 |
| National Rural Utilities Cooperative | | | | |
| Finance Corp. | 10.375% | 11/1/18 | 23,852 | 25,963 |
| Oklahoma Gas & Electric Co. | 6.350% | 9/1/18 | 13,400 | 13,932 |
| Oncor Electric Delivery Co. LLC | 6.800% | 9/1/18 | 1,000 | 1,045 |
| Pacific Gas & Electric Co. | 8.250% | 10/15/18 | 2,280 | 2,424 |
| Pacific Gas & Electric Co. | 3.500% | 10/1/20 | 7,305 | 7,591 |
| Public Service Electric & Gas Co. | 3.500% | 8/15/20 | 1,182 | 1,226 |
| South Carolina Electric & Gas Co. | 6.500% | 11/1/18 | 1,240 | 1,299 |
23
| | | | | |
| Institutional Short-Term Bond Fund | | | | |
| |
| |
| |
| | | | | Face | Market |
| | | | Maturity | Amount | Value • |
| | | Coupon | Date | ($000) | ($000) |
| | Natural Gas (0.1%) | | | | |
| | Atmos Energy Corp. | 8.500% | 3/15/19 | 8,720 | 9,536 |
| | | | | | 78,106 |
| Total Corporate Bonds (Cost $1,985,051) | | | | 1,985,144 |
| Sovereign Bonds (14.4%) | | | | |
| | African Development Bank | 1.000% | 11/2/18 | 36,330 | 36,099 |
| 8 | Avi Funding Co. Ltd. | 2.850% | 9/16/20 | 6,700 | 6,697 |
| 8 | Banco del Estado de Chile | 2.000% | 11/9/17 | 7,095 | 7,077 |
| 8 | Bank Nederlandse Gemeenten NV | 1.125% | 5/25/18 | 36,700 | 36,624 |
| 8 | Bank Nederlandse Gemeenten NV | 1.000% | 9/20/18 | 10,000 | 9,937 |
| 8 | Caisse d’Amortissement de la Dette Sociale | 1.375% | 1/29/18 | 1,825 | 1,825 |
| 8 | CDP Financial Inc. | 4.400% | 11/25/19 | 11,228 | 11,813 |
| | CNOOC Finance 2013 Ltd. | 1.750% | 5/9/18 | 16,820 | 16,802 |
| | CNOOC Finance 2015 Australia Pty Ltd. | 2.625% | 5/5/20 | 1,050 | 1,055 |
| | Corp. Andina de Fomento | 2.200% | 7/18/20 | 2,641 | 2,644 |
| 8 | Corp. Nacional del Cobre de Chile | 3.875% | 11/3/21 | 7,275 | 7,608 |
| | Corp. Nacional del Cobre de Chile | 3.875% | 11/3/21 | 1,800 | 1,883 |
| 8 | Corp. Nacional del Cobre de Chile | 4.500% | 8/13/23 | 6,875 | 7,389 |
| 8 | CPPIB Capital Inc. | 1.250% | 9/20/19 | 37,285 | 36,922 |
| 8,11 Dexia Credit Local SA | 1.875% | 9/15/21 | 9,080 | 8,893 |
| 8 | Dexia Credit Local SA | 2.375% | 9/20/22 | 9,300 | 9,257 |
| 8 | Electricite de France SA | 6.500% | 1/26/19 | 1,825 | 1,933 |
| | European Investment Bank | 1.000% | 3/15/18 | 13,775 | 13,758 |
| | European Investment Bank | 1.875% | 3/15/19 | 18,375 | 18,443 |
| | European Investment Bank | 2.500% | 4/15/21 | 11,025 | 11,241 |
| | Export-Import Bank of Korea | 1.500% | 10/21/19 | 17,250 | 16,959 |
| | Export-Import Bank of Korea | 5.125% | 6/29/20 | 1,375 | 1,466 |
| | Export-Import Bank of Korea | 4.000% | 1/29/21 | 4,775 | 4,959 |
| | First Abu Dhabi Bank PJSC | 3.000% | 8/13/19 | 7,000 | 7,091 |
| | FMS Wertmanagement AoeR | 1.625% | 11/20/18 | 9,175 | 9,175 |
| 8 | ICBCIL Finance Co. Ltd. | 2.375% | 5/19/19 | 6,360 | 6,316 |
| | Industrial & Commercial Bank of China Ltd. | 2.351% | 11/13/17 | 4,500 | 4,502 |
| | International Finance Corp. | 1.750% | 9/4/18 | 9,000 | 9,016 |
| 12 | Japan Bank for International Cooperation | 1.750% | 7/31/18 | 4,600 | 4,600 |
| 12 | Japan Bank for International Cooperation | 1.750% | 11/13/18 | 7,575 | 7,565 |
| | Japan Finance Organization for Municipalities | 1.375% | 4/18/18 | 4,000 | 3,988 |
| 8 | Japan Finance Organization for Municipalities | 2.125% | 3/6/19 | 13,775 | 13,757 |
| 13 | KFW | 1.000% | 6/11/18 | 11,475 | 11,438 |
| 13 | KFW | 1.000% | 9/7/18 | 10,000 | 9,951 |
| 13 | KFW | 1.875% | 4/1/19 | 4,600 | 4,617 |
| 13 | KFW | 4.000% | 1/27/20 | 4,125 | 4,342 |
| | Kingdom of Saudi Arabia | 2.375% | 10/26/21 | 12,700 | 12,529 |
| | Kingdom of Saudi Arabia | 2.875% | 3/4/23 | 6,650 | 6,632 |
| | Kingdom of Sweden | 1.500% | 7/25/19 | 23,555 | 23,501 |
| 8 | Kommunalbanken AS | 1.000% | 3/15/18 | 2,750 | 2,744 |
| 8 | Kommunalbanken AS | 1.125% | 5/23/18 | 7,350 | 7,333 |
| 8 | Kommunalbanken AS | 1.375% | 11/23/18 | 87,031 | 86,809 |
| 8 | Kommunalbanken AS | 2.125% | 3/15/19 | 12,850 | 12,925 |
| 8 | Kommunalbanken AS | 1.750% | 5/28/19 | 13,775 | 13,785 |
| 8 | Kommunalbanken AS | 1.500% | 9/9/19 | 28,721 | 28,598 |
| 8 | Kommuninvest I Sverige AB | 1.000% | 10/24/17 | 2,750 | 2,749 |
| 9 | Korea Development Bank | 1.999% | 9/19/20 | 14,400 | 14,381 |
| | Korea Development Bank | 4.625% | 11/16/21 | 1,800 | 1,922 |
| 8 | Korea Expressway Corp. | 1.875% | 10/22/17 | 1,800 | 1,800 |
24
| | | | | |
| Institutional Short-Term Bond Fund | | | | |
| |
| |
| |
| | | | | Face | Market |
| | | | Maturity | Amount | Value • |
| | | Coupon | Date | ($000) | ($000) |
| 8 | Korea Gas Corp. | 2.875% | 7/29/18 | 7,350 | 7,396 |
| 8 | Korea National Oil Corp. | 2.750% | 1/23/19 | 18,375 | 18,399 |
| 8 | Korea Resources Corp. | 2.125% | 5/2/18 | 2,750 | 2,747 |
| 8 | Municipality Finance plc | 1.125% | 4/17/18 | 2,300 | 2,294 |
| 8 | Nederlandse Waterschapsbank NV | 1.875% | 3/13/19 | 7,350 | 7,365 |
| 8 | Nederlandse Waterschapsbank NV | 1.250% | 9/9/19 | 11,000 | 10,884 |
| | North American Development Bank | 2.300% | 10/10/18 | 2,400 | 2,409 |
| 14 | Oesterreichische Kontrollbank AG | 1.750% | 1/24/20 | 25,364 | 25,341 |
| | Province of Alberta | 1.900% | 12/6/19 | 20,000 | 19,931 |
| 8 | Province of Alberta | 1.750% | 8/26/20 | 8,600 | 8,475 |
| | Province of Manitoba | 9.625% | 12/1/18 | 6,325 | 6,856 |
| | Province of Manitoba | 2.100% | 9/6/22 | 1,275 | 1,259 |
| | Province of Ontario | 1.100% | 10/25/17 | 21,125 | 21,130 |
| | Province of Ontario | 1.625% | 1/18/19 | 34,665 | 34,501 |
| | Province of Ontario | 2.000% | 1/30/19 | 27,130 | 27,124 |
| | Province of Ontario | 1.250% | 6/17/19 | 54,190 | 53,488 |
| | Province of Ontario | 4.000% | 10/7/19 | 2,375 | 2,464 |
| | Province of Ontario | 4.400% | 4/14/20 | 17,075 | 17,995 |
| 7 | Province of Quebec | 1.456% | 9/21/20 | 10,000 | 10,000 |
| | Province of Quebec | 2.750% | 8/25/21 | 5,825 | 5,902 |
| | Republic of Lithuania | 7.375% | 2/11/20 | 8,990 | 10,077 |
| | Republic of Lithuania | 6.125% | 3/9/21 | 16,000 | 17,948 |
| | Republic of Poland | 6.375% | 7/15/19 | 17,261 | 18,641 |
| | Republic of Poland | 5.125% | 4/21/21 | 1,240 | 1,359 |
| | Republic of Poland | 5.000% | 3/23/22 | 18,925 | 20,936 |
| 8 | State Grid Overseas Investment 2014 Ltd. | 2.750% | 5/7/19 | 9,175 | 9,255 |
| | State of Israel | 3.150% | 6/30/23 | 1,800 | 1,860 |
| | State of Qatar | 2.099% | 1/18/18 | 13,190 | 13,178 |
| | State of Qatar | 5.250% | 1/20/20 | 16,000 | 16,970 |
| | Statoil ASA | 1.250% | 11/9/17 | 25,000 | 24,994 |
| | Statoil ASA | 1.200% | 1/17/18 | 2,630 | 2,627 |
| | Statoil ASA | 1.950% | 11/8/18 | 16,420 | 16,445 |
| | Statoil ASA | 3.150% | 1/23/22 | 2,700 | 2,780 |
| | Statoil ASA | 2.650% | 1/15/24 | 1,825 | 1,811 |
| | Svensk Exportkredit AB | 1.125% | 4/5/18 | 5,475 | 5,461 |
| 8 | Temasek Financial I Ltd. | 4.300% | 10/25/19 | 2,250 | 2,359 |
| 8 | Temasek Financial I Ltd. | 2.375% | 1/23/23 | 4,600 | 4,601 |
| Total Sovereign Bonds (Cost $1,039,693) | | | | 1,040,612 |
| Taxable Municipal Bonds (0.3%) | | | | |
| | Florida Hurricane Catastrophe Fund Finance | | | | |
| | Corp. Revenue | 2.107% | 7/1/18 | 1,825 | 1,828 |
| | Louisiana Local Government Environmental | | | | |
| | Facilities & Community Development | | | | |
| | Authority Revenue 2010-EGSL | 3.220% | 2/1/21 | 2,174 | 2,187 |
| | Louisiana Local Government Environmental | | | | |
| | Facilities & Community Development | | | | |
| | Authority Revenue 2010-ELL | 3.450% | 2/1/22 | 8,130 | 8,260 |
| | Princeton University New Jersey GO | 4.950% | 3/1/19 | 5,975 | 6,226 |
| Total Taxable Municipal Bonds (Cost $18,458) | | | | 18,501 |
25
| | | | |
| Institutional Short-Term Bond Fund | | | | |
| |
| |
| |
| | | | | Market |
| | | | | Value• |
| | Coupon | | Shares | ($000) |
| Temporary Cash Investments (2.3%) | | | | |
| Money Market Fund (1.3%) | | | | |
| 15 Vanguard Market Liquidity Fund | 1.223% | | 916,201 | 91,639 |
| |
| | | | Face | |
| | | Maturity | Amount | |
| | | Date | ($000) | |
| Commercial Paper (0.7%) | | | | |
| 16 Electricite de France | 1.995% | 1/5/18 | 23,500 | 23,398 |
| 8,16 Engie SA | 1.543% | 10/10/17 | 3,815 | 3,814 |
| 8,16 Engie SA | 1.520% | 10/12/17 | 5,075 | 5,073 |
| 8,16 Engie SA | 1.520% | 10/13/17 | 2,200 | 2,199 |
| 8,16 Engie SA | 1.520% | 10/18/17 | 5,860 | 5,857 |
| 8,16 Engie SA | 1.565% | 10/20/17 | 1,000 | 1,000 |
| 8,16 Engie SA | 1.544% | 11/9/17 | 3,645 | 3,640 |
| 8,16 Engie SA | 1.565% | 11/10/17 | 3,610 | 3,605 |
| 8,16 Engie SA | 1.565% | 11/15/17 | 3,395 | 3,390 |
| | | | | 51,976 |
| Certificates of Deposit (0.3%) | | | | |
| Royal Bank of Canada (New York Branch) | 1.360% | 10/5/2017 | 21,580 | 21,580 |
| Total Temporary Cash Investments (Cost $165,167) | | | 165,195 |
| Total Investments (100.4%) (Cost $7,262,693) | | | | 7,262,545 |
| |
| | | | | Amount |
| | | | | ($000) |
| Other Assets and Liabilities (-0.4%) | | | | |
| Other Assets | | | | |
| Investment in Vanguard | | | | 450 |
| Receivables for Investment Securities Sold | | | | 26,186 |
| Receivables for Accrued Income | | | | 27,415 |
| Variation Margin Receivable—Futures Contracts | | | | 664 |
| Variation Margin Receivable—Swap Contracts | | | | 129 |
| Unrealized Appreciation—Swap Contracts | | | | 2 |
| Other Assets | | | | 815 |
| Total Other Assets | | | | 55,661 |
| Liabilities | | | | |
| Payables for Investment Securities Purchased | | | | (82,446) |
| Payables to Vanguard | | | | (1,564) |
| Variation Margin Payable—Futures Contracts | | | | (1,013) |
| Variation Margin Payable—Swap Contracts | | | | (110) |
| Unrealized Depreciation—Swap Contracts | | | | (199) |
| Other Liabilities | | | | (26) |
| Total Liabilities | | | | (85,358) |
| Net Assets (100%) | | | | |
| Applicable to 526,174,489 outstanding $.001 par value shares of | | | |
| beneficial interest (unlimited authorization) | | | | 7,232,848 |
| Net Asset Value Per Share | | | | $13.75 |
26
| |
| Institutional Short-Term Bond Fund | |
| |
| |
| |
| At September 30, 2017, net assets consisted of: | |
| | Amount |
| | ($000) |
| Paid-in Capital | 7,235,330 |
| Undistributed Net Investment Income | 113 |
| Accumulated Net Realized Losses | (1,347) |
| Unrealized Appreciation (Depreciation) | |
| Investment Securities | (148) |
| Futures Contracts | (993) |
| Swap Contracts | (107) |
| Net Assets | 7,232,848 |
• See Note A in Notes to Financial Statements.
1 Securities with a value of $2,454,000 have been segregated as initial margin for open futures contracts.
2 Securities with a value of $1,785,000 have been segregated as initial margin for open cleared swap contracts.
3 U.S. government-guaranteed.
4 The issuer operates under a congressional charter; its securities are generally neither guaranteed by the U.S. Treasury nor backed
by the full faith and credit of the U.S. government.
5 The issuer was placed under federal conservatorship in September 2008; since that time, its daily operations have been managed
by the Federal Housing Finance Agency and it receives capital from the U.S. Treasury, as needed to maintain a positive net worth,
in exchange for senior preferred stock.
6 The average or expected maturity is shorter than the final maturity shown because of the possibility of interim principal payments
and prepayments or the possibility of the issue being called.
7 Adjustable-rate security based upon 1-month USD LIBOR plus spread.
8 Security exempt from registration under Rule 144A of the Securities Act of 1933. Such securities may be sold in transactions
exempt from registration, normally to qualified institutional buyers. At September 30, 2017, the aggregate value of these
securities was $2,126,573,000, representing 29.4% of net assets.
9 Adjustable-rate security based upon 3-month USD LIBOR plus spread.
10 Security value determined using significant unobservable inputs.
11 Guaranteed by multiple countries.
12 Guaranteed by the Government of Japan.
13 Guaranteed by the Federal Republic of Germany.
14 Guaranteed by the Republic of Austria.
15 Affiliated money market fund available only to Vanguard funds and certain trusts and accounts managed by Vanguard. Rate shown
is the 7-day yield.
16 Security exempt from registration under Section 4(2) of the Securities Act of 1933. Such securities may be sold in transactions
exempt from registration only to dealers in that program or other “accredited investors.” At September 30, 2017, the aggregate
value of these securities was $51,976,000, representing 0.7% of net assets.
GO—General Obligation Bond.
27
| | | | |
| Institutional Short-Term Bond Fund | | | | |
| |
| |
| Derivative Financial Instruments Outstanding as of Period End | | |
| |
| Futures Contracts | | | | |
| | | | | ($000) |
| | | | | Value and |
| | | Number of | | Unrealized |
| | | Long (Short) | Notional | Appreciation |
| | Expiration | Contracts | Amount | (Depreciation) |
| Long Futures Contracts | | | | |
| 2-Year U.S. Treasury Note | December 2017 | 6,265 | 1,351,380 | (3,664) |
| 10-Year U.S. Treasury Note | December 2017 | 404 | 50,626 | (90) |
| 30-Year U.S. Treasury Bond | December 2017 | 63 | 9,627 | (170) |
| | | | | (3,924) |
| |
| Short Futures Contracts | | | | |
| Ultra 10-Year U.S. Treasury Note | December 2017 | (1,764) | (236,955) | 2,610 |
| 5-Year U.S. Treasury Note | December 2017 | (982) | (115,385) | 321 |
| | | | | 2,931 |
| | | | | (993) |
Unrealized appreciation (depreciation) on open futures contracts is required to be treated as realized gain (loss) for tax purposes.
28
| | | | | | | |
| Institutional Short-Term Bond Fund | | | | | |
| |
| |
| Over-the-Counter Credit Default Swaps | | | | | |
| | | | | | | Remaining | |
| | | | | Periodic | | Up-Front | |
| | | | | Premium | | Premium | Unrealized |
| | | | Notional | Received | | Received | Appreciation |
| | Termination | | Amount | (Paid)1 | Value | (Paid)1 (Depreciation) |
| Reference Entity | Date | Counterparty | ($000) | (%) | ($000) | ($000) | ($000) |
| Credit Protection Sold/Moody’s Rating | | | | | |
| Republic of | | | | | | | |
| Chile/Aa3 | 12/20/22 | CITNA | 30,530 | 1.000 | 597 | (595) | 2 |
| |
| Credit Protection Purchased | | | | | | |
| EI du Pont de | | | | | | | |
| Nemours & Co. | 12/20/20 | JPMC | 4,915 | (1.000) | (138) | 76 | (62) |
| State of Qatar | 6/20/22 | CITNA | 5,280 | (1.000) | (32) | (58) | (90) |
| State of Qatar | 6/20/22 | BOANA | 2,720 | (1.000) | (16) | (31) | (47) |
| | | | | | (186) | (13) | (199) |
| | | | | | 411 | (608) | (197) |
The notional amount represents the maximum potential amount the fund could be required to pay as a seller of credit protection if the reference entity was subject to a credit event.
1 Periodic premium received/paid quarterly.
BOANA—Bank of America, N.A.
CITNA—Citi Bank N.A.
JPMC—JP Morgan Chase Bank.
At September 30, 2017, a counterparty had deposited in a segregated account cash of $550,000 in connection with open over-the-counter swap contracts.
| | | | | | |
| Centrally Cleared Interest Rate Swaps | | | | | | |
| | | | Fixed | Floating | | |
| | | | Interest | Interest | | |
| | | | Rate | Rate | | Unrealized |
| | Future | Notional Received | Received | | Appreciation |
| | Effective | Amount | (Paid)2 | (Paid) | Value | (Depreciation) |
| Termination Date | Date | ($000) | (%) | (%) | ($000) | ($000) |
| 12/20/18 | 12/20/171 | 267,372 | 1.750 | (0.000)3 | 235 | (141) |
| 12/20/19 | 12/20/171 | 87,258 | 2.000 | (0.000)3 | 330 | (162) |
| 12/20/20 | 12/20/171 | 40,797 | 2.250 | (0.000)3 | 406 | (105) |
| 12/20/21 | 12/20/171 | 11,648 | (2.250) | 0.0003 | (116) | 41 |
| 12/20/22 | 12/20/171 | 31,507 | (2.250) | 0.0003 | (280) | 139 |
| 12/20/24 | 12/20/171 | 49,952 | (2.500) | 0.0003 | (1,008) | 318 |
| | | | | | (433) | 90 |
1 Forward interest rate swap. In a forward interest rate swap, the fund and the counterparty agree to make periodic net payments beginning on a specified future effective date.
2 Fixed interest payment received/paid semiannually.
3 Based on 3-month London Interbank Offered Rate (LIBOR) as of the most recent payment date. Floating interest payment received/ paid quarterly.
See accompanying Notes, which are an integral part of the Financial Statements.
29
| |
| Institutional Short-Term Bond Fund | |
| |
| |
| Statement of Operations | |
| |
| | Year Ended |
| | September 30, 2017 |
| | ($000) |
| Investment Income | |
| Income | |
| Interest1 | 137,859 |
| Total Income | 137,859 |
| Expenses | |
| The Vanguard Group—Note B | |
| Investment Advisory Services | 272 |
| Management and Administrative | 1,049 |
| Marketing and Distribution | 210 |
| Custodian Fees | 134 |
| Auditing Fees | 39 |
| Trustees’ Fees and Expenses | 6 |
| Total Expenses | 1,710 |
| Net Investment Income | 136,149 |
| Realized Net Gain (Loss) | |
| Investment Securities Sold1 | (7,431) |
| Futures Contracts | 10,097 |
| Swap Contracts | 1,685 |
| Realized Net Gain (Loss) | 4,351 |
| Change in Unrealized Appreciation (Depreciation) | |
| Investment Securities1 | (61,622) |
| Futures Contracts | (74) |
| Swap Contracts | (716) |
| Change in Unrealized Appreciation (Depreciation) | (62,412) |
| Net Increase (Decrease) in Net Assets Resulting from Operations | 78,088 |
1 Interest income, realized net gain (loss), and change in unrealized appreciation (depreciation) from an affiliated company of the fund were $1,140,000, ($25,000), and $2,000, respectively.
See accompanying Notes, which are an integral part of the Financial Statements.
30
| | |
| Institutional Short-Term Bond Fund | | |
| |
| |
| Statement of Changes in Net Assets | | |
| |
| | Year Ended September 30, |
| | 2017 | 2016 |
| | ($000) | ($000) |
| Increase (Decrease) in Net Assets | | |
| Operations | | |
| Net Investment Income | 136,149 | 140,919 |
| Realized Net Gain (Loss) | 4,351 | 2,311 |
| Change in Unrealized Appreciation (Depreciation) | (62,412) | 31,501 |
| Net Increase (Decrease) in Net Assets Resulting from Operations | 78,088 | 174,731 |
| Distributions | | |
| Net Investment Income | (137,196) | (139,853) |
| Realized Capital Gain1 | (8,272) | (2,233) |
| Total Distributions | (145,468) | (142,086) |
| Capital Share Transactions | | |
| Issued | 592,012 | 100,988 |
| Issued in Lieu of Cash Distributions | 145,468 | 142,087 |
| Redeemed | (3,834,694) | (148,693) |
| Net Increase (Decrease) from Capital Share Transactions | (3,097,214) | 94,382 |
| Total Increase (Decrease) | (3,164,594) | 127,027 |
| Net Assets | | |
| Beginning of Period | 10,397,442 | 10,270,415 |
| End of Period2 | 7,232,848 | 10,397,442 |
1 Includes fiscal 2017 and 2016 short-term gain distributions totaling $1,244,000 and $2,233,000, respectively. Short-term gain
distributions are treated as ordinary income dividends for tax purposes.
2 Net Assets—End of Period includes undistributed (overdistributed) net investment income of $113,000 and $640,000.
See accompanying Notes, which are an integral part of the Financial Statements.
31
| | | |
| Institutional Short-Term Bond Fund | | | |
| |
| |
| Financial Highlights | | | |
| |
| |
| | | | June 19, |
| | Year Ended | 20151 to |
| | September 30, | Sept. 30, |
| For a Share Outstanding Throughout Each Period | 2017 | 2016 | 2015 |
| Net Asset Value, Beginning of Period | $13.84 | $13.79 | $13.79 |
| Investment Operations | | | |
| Net Investment Income | . 2212 | .188 | .047 |
| Net Realized and Unrealized Gain (Loss) on Investments | (.071) | .052 | .001 |
| Total from Investment Operations | .150 | .240 | .048 |
| Distributions | | | |
| Dividends from Net Investment Income | (. 229) | (.187) | (. 048) |
| Distributions from Realized Capital Gains | (.011) | (.003) | — |
| Total Distributions | (. 240) | (.190) | (. 048) |
| Net Asset Value, End of Period | $13.75 | $13.84 | $13.79 |
| |
| Total Return | 1.10% | 1.75% | 0.35% |
| |
| Ratios/Supplemental Data | | | |
| Net Assets, End of Period (Millions) | $7,233 | $10,397 | $10,270 |
| Ratio of Total Expenses to Average Net Assets | 0.02% | 0.02% | 0.02%3 |
| Ratio of Net Investment Income to Average Net Assets | 1.61% | 1.37% | 1.22%3 |
| Portfolio Turnover Rate | 66% | 119% | 28% |
| 1 Commencement of operations as a registered investment company. | | | |
| 2 Calculated based on average shares outstanding. | | | |
| 3 Annualized. | | | |
See accompanying Notes, which are an integral part of the Financial Statements.
32
Institutional Short-Term Bond Fund
Notes to Financial Statements
Vanguard Institutional Short-Term Bond Fund is registered under the Investment Company Act of 1940 as an open-end investment company, or mutual fund. The fund has been established by Vanguard as an investment vehicle for certain collective trusts and other accounts managed by Vanguard or its affiliates, and qualifying education savings plans. The fund is offered to investors who meet certain administrative and service criteria and invest a minimum of $10 million. Certain of the fund’s investments are in corporate debt instruments; the issuers’ abilities to meet their obligations may be affected by economic developments in their respective industries.
A. The following significant accounting policies conform to generally accepted accounting principles for U.S. investment companies. The fund consistently follows such policies in preparing its financial statements.
1. Security Valuation: Securities are valued as of the close of trading on the New York Stock Exchange (generally 4 p.m., Eastern time) on the valuation date. Bonds and temporary cash investments are valued using the latest bid prices or using valuations based on a matrix system (which considers such factors as security prices, yields, maturities, and ratings), both as furnished by independent pricing services. Structured debt securities, including mortgages and asset-backed securities, are valued using the latest bid prices or using valuations based on a matrix system that considers such factors as issuer, tranche, nominal or option-adjusted spreads, weighted average coupon, weighted average maturity, credit enhancements, and collateral. Investments in Vanguard Market Liquidity Fund are valued at that fund’s net asset value. Securities for which market quotations are not readily available, or whose values have been affected by events occurring before the fund’s pricing time but after the close of the securities’ primary markets, are valued by methods deemed by the board of trustees to represent fair value.
2. Futures Contracts: The fund uses futures contracts to invest in fixed income asset classes with greater efficiency and lower cost than is possible through direct investment, to add value when these instruments are attractively priced, or to adjust sensitivity to changes in interest rates. The primary risks associated with the use of futures contracts are imperfect correlation between changes in market values of bonds held by the fund and the prices of futures contracts, and the possibility of an illiquid market. Counterparty risk involving futures is mitigated because a regulated clearinghouse is the counterparty instead of the clearing broker. To further mitigate counterparty risk, the fund trades futures contracts on an exchange, monitors the financial strength of its clearing brokers and clearinghouse, and has entered into clearing agreements with its clearing brokers. The clearinghouse imposes initial margin requirements to secure the fund’s performance and requires daily settlement of variation margin representing changes in the market value of each contract.
Futures contracts are valued at their quoted daily settlement prices. The notional amounts of the contracts are not recorded in the Statement of Net Assets. Fluctuations in the value of the contracts are recorded in the Statement of Net Assets as an asset (liability) and in the Statement of Operations as unrealized appreciation (depreciation) until the contracts are closed, when they are recorded as realized futures gains (losses).
During the year ended September 30, 2017, the fund’s average investments in long and short futures contracts represented 17% and 7% of net assets, respectively, based on the average of the notional amounts at each quarter-end during the period.
33
Institutional Short-Term Bond Fund
3. Swap Contracts: The fund invests in credit default swaps to adjust the overall credit risk of the fund or to actively overweight or underweight credit risk to a specific issuer or group of issuers. The fund may sell credit protection through credit default swaps to simulate investments in long positions that are either unavailable or considered to be less attractively priced in the bond market. The fund may purchase credit protection through credit default swaps to reduce credit exposure to a given issuer or issuers. Under the terms of the swaps, an up-front payment may be exchanged between the seller and buyer. In addition, the seller of the credit protection receives a periodic payment of premium from the buyer that is a fixed percentage applied to a notional amount. If, for example, the reference entity is subject to a credit event (such as bankruptcy, failure to pay, or obligation acceleration) during the term of the swap, the seller agrees to either physically settle or cash settle the swap contract. If the swap is physically settled, the seller agrees to pay the buyer an amount equal to the notional amount and take delivery of a debt instrument of the reference issuer with a par amount equal to such notional amount. If the swap is cash settled, the seller agrees to pay the buyer the difference between the notional amount and the final price for the relevant debt instrument, as determined either in a market auction or pursuant to a pre-agreed-upon valuation procedure.
The fund enters into interest rate swap transactions to adjust the fund’s sensitivity to changes in interest rates and maintain the ability to generate income at prevailing market rates. Under the terms of the swaps, one party pays the other an amount that is a fixed percentage rate applied to a notional amount. In return, the counterparty agrees to pay a floating rate, which is reset periodically based on short-term interest rates, applied to the same notional amount.
The notional amounts of swap contracts are not recorded in the Statement of Net Assets. Swaps are valued daily based on market quotations received from independent pricing services or recognized dealers and the change in value is recorded in the Statement of Net Assets as an asset (liability) and in the Statement of Operations as unrealized appreciation (depreciation) until the seller of credit protection is required to take delivery (or, in a cash settled swap, pay the settlement amount determined) upon occurrence of a credit event, periodic payments are made, or the swap terminates, at which time realized gain (loss) is recorded. The net premium to be received or paid by the fund under swap contracts is accrued daily and recorded as realized gain (loss) over the life of the contract.
The primary risk associated with selling credit protection is that, upon the occurrence of a defined credit event, the market value of the debt instrument received by the fund (or, in a cash settled swap, the debt instruments used to determine the settlement payment by the fund) will be significantly less than the amount paid by the fund and, in a physically settled swap, the fund may receive an illiquid debt instrument. A risk associated with all types of swaps is the possibility that a counterparty may default on its obligation to pay net amounts due to the fund. The fund’s maximum amount subject to counterparty risk is the unrealized appreciation on the swap contract. The fund mitigates its counterparty risk by entering into swaps only with a diverse group of prequalified counterparties, monitoring their financial strength, entering into master netting arrangements with its counterparties, and requiring its counterparties to transfer collateral as security for their performance. In the absence of a default, the collateral pledged or received by the fund cannot be repledged, resold, or rehypothecated. In the event of a counterparty’s default (including bankruptcy), the fund may terminate any swap contracts with that counterparty, determine the net amount owed by either party in accordance with its master netting arrangements, and sell or retain any collateral held up to the net amount owed to the fund under the master netting arrangements. The swap contracts contain provisions whereby a counterparty may terminate open contracts if the fund’s
34
Institutional Short-Term Bond Fund
net assets decline below a certain level, triggering a payment by the fund if the fund is in a net liability position at the time of the termination. The payment amount would be reduced by any collateral the fund has pledged. Any securities pledged as collateral for open contracts are noted in the Statement of Net Assets. The value of collateral received or pledged is compared daily to the value of the swap contracts exposure with each counterparty, and any difference, if in excess of a specified minimum transfer amount, is adjusted and settled within two business days.
The fund enters into centrally cleared interest rate swaps to achieve the same objectives specified with respect to the equivalent over-the-counter swaps but with less counterparty risk because a regulated clearinghouse is the counterparty instead of the clearing broker or executing broker. The clearinghouse imposes initial margin requirements to secure the fund’s performance, and requires daily settlement of variation margin representing changes in the market value of each contract. To further mitigate counterparty risk, the fund trades with a diverse group of prequalified executing brokers; monitors the financial strength of its clearing brokers, executing brokers, and clearinghouse; and has entered into agreements with its clearing brokers and executing brokers.
During the year ended September 30, 2017, the fund’s average amounts of investments in credit protection sold and credit protection purchased each represented less than 1% of net assets, respectively, based on the average of notional amounts at each quarter-end during the period. The average amount of investments in interest rate swaps represented 8% of net assets, based on the average of notional amounts at each quarter-end during the period.
4. Federal Income Taxes: The fund intends to continue to qualify as a regulated investment company and distribute all of its taxable income. Management has analyzed the fund’s tax positions taken for all open federal income tax years (September 30, 2015–2017), and has concluded that no provision for federal income tax is required in the fund’s financial statements.
5. Distributions: Distributions to shareholders are recorded on the ex-dividend date.
6. Credit Facility: The fund and certain other funds managed by The Vanguard Group (“Vanguard”) participate in a $3.1 billion committed credit facility provided by a syndicate of lenders pursuant to a credit agreement that may be renewed annually; each fund is individually liable for its borrowings, if any, under the credit facility. Borrowings may be utilized for temporary and emergency purposes, and are subject to the fund’s regulatory and contractual borrowing restrictions. The participating funds are charged administrative fees and an annual commitment fee of 0.10% of the undrawn amount of the facility; these fees are allocated to the funds based on a method approved by the fund’s board of trustees and included in Management and Administrative expenses on the fund’s Statement of Operations. Any borrowings under this facility bear interest at a rate based upon the higher of the one-month London Interbank Offered Rate, federal funds effective rate, or overnight bank funding rate plus an agreed-upon spread.
The fund had no borrowings outstanding at September 30, 2017, or at any time during the period then ended.
7. Other: Interest income includes income distributions received from Vanguard Market Liquidity Fund and is accrued daily. Premiums and discounts on debt securities purchased are amortized and accreted, respectively, to interest income over the lives of the respective securities. Security transactions are accounted for on the date securities are bought or sold. Costs used to determine realized gains (losses) on the sale of investment securities are those of the specific securities sold.
35
Institutional Short-Term Bond Fund
B. In accordance with the terms of a Funds’ Service Agreement (the “FSA”) between Vanguard and the fund, Vanguard furnishes to the fund investment advisory, corporate management, administrative, marketing, and distribution services at Vanguard’s cost of operations (as defined by the FSA). These costs of operations are allocated to the fund based on methods and guidelines approved by the board of trustees. Vanguard does not require reimbursement in the current period for certain costs of operations (such as deferred compensation/benefits and risk/insurance costs); the fund’s liability for these costs of operations is included in Payables to Vanguard on the Statement of Net Assets.
Upon the request of Vanguard, the fund may invest up to 0.40% of its net assets as capital in Vanguard. At September 30, 2017, the fund had contributed to Vanguard capital in the amount of $450,000, representing 0.01% of the fund’s net assets and 0.18% of Vanguard’s capitalization. The fund’s trustees and officers are also directors and employees, respectively, of Vanguard.
C. Various inputs may be used to determine the value of the fund’s investments. These inputs are summarized in three broad levels for financial statement purposes. The inputs or methodologies used to value securities are not necessarily an indication of the risk associated with investing in those securities.
Level 1—Quoted prices in active markets for identical securities.
Level 2—Other significant observable inputs (including quoted prices for similar securities, interest
rates, prepayment speeds, credit risk, etc.).
Level 3—Significant unobservable inputs (including the fund’s own assumptions used to determine
the fair value of investments). Any investments valued with significant unobservable inputs are
noted on the Statement of Net Assets.
The following table summarizes the market value of the fund’s investments as of September 30, 2017, based on the inputs used to value them:
| | | |
| | Level 1 | Level 2 | Level 3 |
| Investments | ($000) | ($000) | ($000) |
| U.S. Government and Agency Obligations | — | 1,479,526 | — |
| Asset-Backed/Commercial Mortgage-Backed Securities | — | 2,544,064 | 29,503 |
| Corporate Bonds | — | 1,985,144 | — |
| Sovereign Bonds | — | 1,040,612 | — |
| Taxable Municipal Bonds | — | 18,501 | — |
| Temporary Cash Investments | 91,639 | 73,556 | — |
| Futures Contracts—Assets1 | 664 | — | — |
| Futures Contracts—Liabilities1 | (1,013) | — | — |
| Swap Contracts—Assets | 1291 | 2 | — |
| Swap Contracts—Liabilities | (110)1 | (199) | — |
| Total | 91,309 | 7,141,206 | 29,503 |
| 1 Represents variation margin on the last day of the reporting period. | | | |
36
Institutional Short-Term Bond Fund
D. At September 30, 2017, the fair values of derivatives were reflected in the Statement of Net Assets as follows:
| | | |
| | Interest Rate | Credit | |
| | Contracts | Contracts | Total |
| Statement of Net Assets Caption | ($000) | ($000) | ($000) |
| Variation Margin Receivable—Futures Contracts | 664 | — | 664 |
| Variation Margin Receivable—Swap Contracts | 129 | — | 129 |
| Unrealized Appreciation—Swap Contracts | — | 2 | 2 |
| Variation Margin Payable—Futures Contracts | (1,013) | — | (1,013) |
| Variation Margin Payable—Swap Contracts | (110) | — | (110) |
| Unrealized Depreciation—Swap Contracts | — | (199) | (199) |
Realized net gain (loss) and the change in unrealized appreciation (depreciation) on derivatives for the year ended September 30, 2017, were:
| | | |
| Interest Rate | Credit | |
| | Contracts | Contracts | Total |
| Realized Net Gain (Loss) on Derivatives | ($000) | ($000) | ($000) |
| Futures Contracts | 10,097 | — | 10,097 |
| Swap Contracts | 335 | 1,350 | 1,685 |
| Realized Net Gain (Loss) on Derivatives | 10,432 | 1,350 | 11,782 |
| |
| Change in Unrealized Appreciation (Depreciation) on Derivatives | | | |
| Futures Contracts | (74) | — | (74) |
| Swap Contracts | (424) | (292) | (716) |
| Change in Unrealized Appreciation (Depreciation) on Derivatives | (498) | (292) | (790) |
E. Distributions are determined on a tax basis and may differ from net investment income and realized capital gains for financial reporting purposes. Differences may be permanent or temporary. Permanent differences are reclassified among capital accounts in the financial statements to reflect their tax character. Temporary differences arise when certain items of income, expense, gain, or loss are recognized in different periods for financial statement and tax purposes. These differences will reverse at some time in the future. Differences in classification may also result from the treatment of short-term gains as ordinary income for tax purposes.
For tax purposes at September 30, 2017, the fund had $1,640,000 of ordinary income available for distribution. The fund had available capital losses totaling $2,330,000 that may be carried forward indefinitely to offset future net capital gains.
37
Institutional Short-Term Bond Fund
At September 30, 2017, the cost of investment securities for tax purposes was $7,262,734,000. Net unrealized depreciation of investment securities for tax purposes was $189,000, consisting of unrealized gains of $17,470,000 on securities that had risen in value since their purchase and $17,659,000 in unrealized losses on securities that had fallen in value since their purchase.
F. During the year ended September 30, 2017, the fund purchased $1,921,266,000 of investment securities and sold $3,711,628,000 of investment securities, other than U.S. government securities and temporary cash investments. Purchases and sales of U.S. government securities were $3,483,402,000 and $4,639,376,000, respectively.
| | |
| G. Capital shares issued and redeemed were: | | |
| | Year Ended September 30, |
| | 2017 | 2016 |
| | Shares | Shares |
| | (000) | (000) |
| Issued | 43,012 | 7,323 |
| Issued in Lieu of Cash Distributions | 10,577 | 10,301 |
| Redeemed | (278,926) | (10,767) |
| Net Increase (Decrease) in Shares Outstanding | (225,337) | 6,857 |
H. Management has determined that no material events or transactions occurred subsequent to September 30, 2017, that would require recognition or disclosure in these financial statements.
38
Institutional Intermediate-Term Bond Fund
Fund Profile
As of September 30, 2017
| | | |
| Financial Attributes | | |
| | | Bloomberg Bloomberg |
| | | Barclays | Barclays |
| | | U.S. | U.S. |
| | | Intermediate | Aggregate |
| | | Aggregate | Bond |
| | Fund ex Baa Index | Index |
| Number of Bonds | 1,056 | 5,264 | 9,460 |
| Yield to Maturity | | | |
| (before expenses) | 2.2% | 2.3% | 2.6% |
| Average Coupon | 2.7% | 2.7% | 3.1% |
| Average Duration | 3.9% | 4.2% | 6.0% |
| Average Effective | | | |
| Maturity | 4.4 years | 5.2 years | 8.2 years |
| Ticker Symbol | VIITX | — | — |
| Expense Ratio1 | 0.02% | — | — |
| 30-Day SEC Yield | 1.98% | — | — |
| Short-Term | | | |
| Reserves | 7.6% | — | — |
| | |
| Volatility Measures | | |
| | Bloomberg | |
| | Barclays U.S. | Bloomberg |
| | Intermediate | Barclays U.S. |
| | Aggregate ex | Aggregate Bond |
| | Baa Index | Index |
| R-Squared | 0.98 | 0.95 |
| Beta | 0.97 | 0.67 |
| |
| Distribution by Credit Quality (% of portfolio) |
| U.S. Government | 52.5% |
| Aaa | 14.1 |
| Aa | 7.4 |
| A | 17.9 |
| Not Rated | 8.1 |
Credit-quality ratings are obtained from Moody’s and S&P, and the
higher rating for each issue is shown. “Not Rated” is used to
classify securities for which a rating is not available. Not rated
securities include a fund’s investment in Vanguard Market Liquidity
Fund or Vanguard Municipal Cash Management Fund, each of
which invests in high-quality money market instruments and may
serve as a cash management vehicle for the Vanguard funds, trusts,
and accounts. For more information about these ratings, see the
Glossary entry for Credit Quality.
| |
| Distribution by Effective Maturity | |
| (% of portfolio) | |
| Under 1 Year | 11.1% |
| 1 - 3 Years | 25.5 |
| 3 - 5 Years | 23.4 |
| 5 - 7 Years | 23.0 |
| 7 - 10 Years | 16.0 |
| 10 - 20 Years | 1.0 |
These measures show the degree and timing of the fund’s
fluctuations compared with the indexes over 36 months.
| |
| Sector Diversification (% of portfolio) | |
| |
| Asset-Backed | 9.7% |
| Commercial Mortgaged-Backed | 2.0 |
| Finance | 12.8 |
| Foreign | 6.5 |
| Government Mortgage-Backed | 28.2 |
| Industrial | 7.6 |
| Treasury/Agency | 32.0 |
| Utilities | 1.2 |
The agency and mortgage-backed securities sectors may include
issues from government-sponsored enterprises; such issues are
generally not backed by the full faith and credit of the U.S.
government.
1 The expense ratio shown is from the prospectus dated January 26, 2017, and represents estimated costs for the current fiscal year. For the fiscal year ended September 30, 2017, the expense ratio was 0.02%.
39
Institutional Intermediate-Term Bond Fund
Performance Summary
All of the returns in this report represent past performance, which is not a guarantee of future results that may be achieved by the fund. (Current performance may be lower or higher than the performance data cited. For performance data current to the most recent month-end, visit our website at vanguard.com/performance.) Note, too, that both investment returns and principal value can fluctuate widely, so an investor’s shares, when sold, could be worth more or less than their original cost. The returns shown do not reflect taxes that a shareholder would pay on fund distributions or on the sale of fund shares.
Cumulative Performance: September 30, 2007, Through September 30, 2017
Initial Investment of $10,000,000

| | | | | |
| | | Average Annual Total Returns | |
| | | Periods Ended September 30, 2017 | |
| |
| | | | | | Final Value |
| | | One | Five | Ten | of a $10,000,000 |
| | | Year | Years | Years | Investment |
| | Institutional Intermediate-Term Bond | | | | |
| | Fund Institutional Plus Shares | 0.01% | 1.67% | 3.68% | $14,355,512 |
| | Bloomberg Barclays U.S. Intermediate | | | | |
| • • • • • • • • | | | | | |
| | Aggregate ex Baa Index | -0.04 | 1.59 | 3.65 | 14,309,942 |
| |
| | Bloomberg Barclays U.S. Aggregate | | | | |
| | Bond Index | 0.07 | 2.06 | 4.27 | 15,196,077 |
The fund is the successor to VFTC Intermediate-Term Bond Trust (the predecessor trust), a collective trust managed by Vanguard Fiduciary Trust Company, an affiliate of The Vanguard Group, Inc. The predecessor trust transferred its assets to the fund in connection with the fund’s commencement of operations on or about June 19, 2015. The performance of the fund’s Institutional Plus Shares includes the performance of the predecessor trust prior to the commencement of the fund’s operations. The performance of the predecessor trust has not been adjusted to reflect the expenses of the fund’s Institutional Plus Shares. If the performance of the predecessor trust had been adjusted to reflect the expenses of the fund’s Institutional Plus Shares, the predecessor trust’s performance would have been lower. The fund is managed with the same investment objective, strategies, policies, and risks as the predecessor trust. The predecessor trust was not an investment company and, therefore, was not subject to certain investment restrictions imposed on investment companies by the Investment Company Act of 1940. If the predecessor trust had been an investment company, its performance may have been different.
See Financial Highlights for dividend and capital gains information.
40
Institutional Intermediate-Term Bond Fund
| | | | |
| Fiscal-Year Total Returns (%): September 30, 2007, Through September 30, 2017 | |
| | | | | Bloomberg |
| | | | | Barclays |
| | | | | U.S. |
| | | | | Intermediate |
| | | | | Aggregate |
| | | Institutional Plus Shares | ex Baa Index |
| Fiscal Year | Income Returns | Capital Returns | Total Returns | Total Returns |
| 2008 | 0.00% | 3.46% | 3.46% | 4.54% |
| 2009 | 0.00 | 9.36 | 9.36 | 9.18 |
| 2010 | 0.00 | 7.42 | 7.42 | 7.07 |
| 2011 | 0.00 | 3.96 | 3.96 | 4.24 |
| 2012 | 0.00 | 4.58 | 4.58 | 3.83 |
| 2013 | 0.00 | -0.76 | -0.76 | -0.81 |
| 2014 | 0.00 | 2.50 | 2.50 | 2.46 |
| 2015 | 0.56 | 2.43 | 2.99 | 3.16 |
| 2016 | 2.06 | 1.64 | 3.70 | 3.24 |
| 2017 | 1.94 | -1.93 | 0.01 | -0.04 |
The fund is the successor to VFTC Intermediate-Term Bond Trust (the predecessor trust), a collective trust managed by Vanguard Fiduciary
Trust Company, an affiliate of The Vanguard Group, Inc. The predecessor trust transferred its assets to the fund in connection with the
fund’s commencement of operations on or about June 19, 2015. The performance of the fund’s Institutional Plus Shares includes the
performance of the predecessor trust prior to the commencement of the fund’s operations. The performance of the predecessor trust has
not been adjusted to reflect the expenses of the fund’s Institutional Plus Shares. If the performance of the predecessor trust had been
adjusted to reflect the expenses of the fund’s Institutional Plus Shares, the predecessor trust’s performance would have been lower. The
fund is managed with the same investment objective, strategies, policies, and risks as the predecessor trust. The predecessor trust was
not an investment company and, therefore, was not subject to certain investment restrictions imposed on investment companies by the
Investment Company Act of 1940. If the predecessor trust had been an investment company, its performance may have been different.
41
Institutional Intermediate-Term Bond Fund
Financial Statements
Statement of Net Assets
As of September 30, 2017
The fund reports a complete list of its holdings in regulatory filings four times in each fiscal year, at the quarter-ends. For the second and fourth fiscal quarters, the lists appear in the fund’s semiannual and annual reports to shareholders. For the first and third fiscal quarters, the fund files the lists with the Securities and Exchange Commission on Form N-Q. Shareholders can look up the fund’s Forms N-Q on the SEC’s website at sec.gov. Forms N-Q may also be reviewed and copied at the SEC’s Public Reference Room (see the back cover of this report for further information).
| | | | | |
| | | | | Face | Market |
| | | | Maturity | Amount | Value • |
| | | Coupon | Date | ($000) | ($000) |
| U. S. Government and Agency Obligations (60.1%) | | | |
| U. S. Government Securities (30.6%) | | | | |
| | United States Treasury Inflation Indexed Bonds | 0.125% | 4/15/18 | 176,940 | 187,429 |
| | United States Treasury Inflation Indexed Bonds | 0.375% | 1/15/27 | 160,062 | 160,123 |
| | United States Treasury Note/Bond | 1.000% | 2/15/18 | 750 | 750 |
| | United States Treasury Note/Bond | 1.000% | 5/15/18 | 430,000 | 429,329 |
| 1 | United States Treasury Note/Bond | 2.375% | 5/31/18 | 406,000 | 408,854 |
| | United States Treasury Note/Bond | 1.125% | 6/15/18 | 97,500 | 97,394 |
| | United States Treasury Note/Bond | 1.000% | 8/15/18 | 1,500 | 1,496 |
| | United States Treasury Note/Bond | 1.375% | 9/30/18 | 164,000 | 164,000 |
| | United States Treasury Note/Bond | 1.125% | 1/15/19 | 11,900 | 11,855 |
| | United States Treasury Note/Bond | 0.750% | 2/15/19 | 330 | 327 |
| | United States Treasury Note/Bond | 1.125% | 2/28/19 | 3,200 | 3,187 |
| | United States Treasury Note/Bond | 1.375% | 2/28/19 | 9,131 | 9,125 |
| | United States Treasury Note/Bond | 1.250% | 3/31/19 | 1,000 | 997 |
| | United States Treasury Note/Bond | 0.875% | 4/15/19 | 5,300 | 5,254 |
| | United States Treasury Note/Bond | 1.250% | 4/30/19 | 7,400 | 7,378 |
| | United States Treasury Note/Bond | 1.625% | 4/30/19 | 16,173 | 16,218 |
| | United States Treasury Note/Bond | 1.250% | 5/31/19 | 17,400 | 17,346 |
| 1 | United States Treasury Note/Bond | 1.500% | 5/31/19 | 118,700 | 118,812 |
| | United States Treasury Note/Bond | 0.875% | 6/15/19 | 86,000 | 85,167 |
| | United States Treasury Note/Bond | 1.250% | 6/30/19 | 450 | 448 |
| | United States Treasury Note/Bond | 0.875% | 7/31/19 | 100 | 99 |
| | United States Treasury Note/Bond | 1.625% | 7/31/19 | 1,600 | 1,604 |
| 2 | United States Treasury Note/Bond | 0.750% | 8/15/19 | 2,865 | 2,827 |
| | United States Treasury Note/Bond | 3.625% | 8/15/19 | 706 | 734 |
| | United States Treasury Note/Bond | 1.000% | 8/31/19 | 39,984 | 39,628 |
| | United States Treasury Note/Bond | 1.250% | 8/31/19 | 3,500 | 3,485 |
| 2 | United States Treasury Note/Bond | 0.875% | 9/15/19 | 28,700 | 28,364 |
| | United States Treasury Note/Bond | 1.750% | 9/30/19 | 16,600 | 16,683 |
| 3 | United States Treasury Note/Bond | 1.000% | 11/15/19 | 65,075 | 64,384 |
| | United States Treasury Note/Bond | 3.375% | 11/15/19 | 15,086 | 15,675 |
| | United States Treasury Note/Bond | 1.375% | 12/15/19 | 57,069 | 56,891 |
| | United States Treasury Note/Bond | 1.625% | 12/31/19 | 21,600 | 21,647 |
| | United States Treasury Note/Bond | 1.375% | 2/15/20 | 98,015 | 97,617 |
| | United States Treasury Note/Bond | 1.375% | 4/30/20 | 100,050 | 99,534 |
| | United States Treasury Note/Bond | 1.375% | 5/31/20 | 344,800 | 342,914 |
| | United States Treasury Note/Bond | 1.500% | 5/31/20 | 328,000 | 327,232 |
42
| | | | |
| Institutional Intermediate-Term Bond Fund | | | | |
| |
| |
| |
| | | | Face | Market |
| | | Maturity | Amount | Value • |
| | Coupon | Date | ($000) | ($000) |
| United States Treasury Note/Bond | 1.625% | 6/30/20 | 21,300 | 21,313 |
| United States Treasury Note/Bond | 2.625% | 8/15/20 | 20,000 | 20,562 |
| United States Treasury Note/Bond | 2.125% | 8/31/20 | 110,000 | 111,547 |
| United States Treasury Note/Bond | 1.375% | 9/30/20 | 51,400 | 51,014 |
| United States Treasury Note/Bond | 1.375% | 10/31/20 | 19,350 | 19,187 |
| United States Treasury Note/Bond | 1.750% | 10/31/20 | 300 | 301 |
| United States Treasury Note/Bond | 1.625% | 11/30/20 | 17,218 | 17,192 |
| United States Treasury Note/Bond | 2.000% | 11/30/20 | 4,300 | 4,343 |
| United States Treasury Note/Bond | 1.375% | 1/31/21 | 46,510 | 46,009 |
| United States Treasury Note/Bond | 2.125% | 1/31/21 | 3,594 | 3,643 |
| United States Treasury Note/Bond | 1.125% | 2/28/21 | 20,570 | 20,162 |
| United States Treasury Note/Bond | 1.375% | 4/30/21 | 18,100 | 17,868 |
| United States Treasury Note/Bond | 1.375% | 5/31/21 | 79,000 | 77,901 |
| United States Treasury Note/Bond | 1.125% | 6/30/21 | 142,827 | 139,479 |
| United States Treasury Note/Bond | 1.125% | 7/31/21 | 21,000 | 20,482 |
| United States Treasury Note/Bond | 2.125% | 8/15/21 | 37,400 | 37,867 |
| United States Treasury Note/Bond | 1.125% | 8/31/21 | 57,000 | 55,540 |
| United States Treasury Note/Bond | 1.250% | 10/31/21 | 60,200 | 58,836 |
| United States Treasury Note/Bond | 1.750% | 11/30/21 | 321 | 319 |
| United States Treasury Note/Bond | 2.125% | 12/31/21 | 103,000 | 104,127 |
| United States Treasury Note/Bond | 1.500% | 1/31/22 | 10,000 | 9,847 |
| United States Treasury Note/Bond | 1.875% | 2/28/22 | 100,000 | 100,000 |
| United States Treasury Note/Bond | 1.750% | 4/30/22 | 58,000 | 57,620 |
| United States Treasury Note/Bond | 1.750% | 9/30/22 | 26,500 | 26,247 |
| United States Treasury Note/Bond | 1.625% | 11/15/22 | 15,050 | 14,810 |
| United States Treasury Note/Bond | 2.000% | 2/15/23 | 20,000 | 20,003 |
| United States Treasury Note/Bond | 1.750% | 5/15/23 | 41,300 | 40,680 |
| United States Treasury Note/Bond | 1.375% | 6/30/23 | 12,800 | 12,336 |
| United States Treasury Note/Bond | 2.500% | 8/15/23 | 19,860 | 20,360 |
| United States Treasury Note/Bond | 2.750% | 11/15/23 | 20,000 | 20,781 |
| United States Treasury Note/Bond | 2.125% | 11/30/23 | 10,000 | 10,028 |
| United States Treasury Note/Bond | 2.750% | 2/15/24 | 28,820 | 29,919 |
| United States Treasury Note/Bond | 2.000% | 5/31/24 | 21,000 | 20,816 |
| United States Treasury Note/Bond | 2.375% | 8/15/24 | 18,550 | 18,802 |
| 1 United States Treasury Note/Bond | 1.875% | 8/31/24 | 140,000 | 137,441 |
| United States Treasury Note/Bond | 2.250% | 11/15/25 | 21,000 | 20,990 |
| United States Treasury Note/Bond | 1.625% | 2/15/26 | 43,950 | 41,766 |
| United States Treasury Note/Bond | 1.625% | 5/15/26 | 20,941 | 19,851 |
| United States Treasury Note/Bond | 2.000% | 11/15/26 | 10,000 | 9,741 |
| United States Treasury Note/Bond | 5.375% | 2/15/31 | 3,300 | 4,416 |
| | | | | 4,308,953 |
| Agency Bonds and Notes (1.3%) | | | | |
| 4 AID-Jordan | 2.578% | 6/30/22 | 24,000 | 24,423 |
| 5 Federal Home Loan Banks | 0.875% | 10/1/18 | 8,500 | 8,457 |
| 5 Federal Home Loan Banks | 1.250% | 1/16/19 | 13,600 | 13,562 |
| 5 Federal Home Loan Banks | 0.875% | 8/5/19 | 16,000 | 15,806 |
| 6 Federal Home Loan Mortgage Corp. | 0.875% | 7/19/19 | 39,400 | 38,947 |
| 6 Federal Home Loan Mortgage Corp. | 1.375% | 8/15/19 | 4,750 | 4,735 |
| 6 Federal Home Loan Mortgage Corp. | 1.500% | 1/17/20 | 7,000 | 6,983 |
| 6 Federal National Mortgage Assn. | 1.000% | 10/24/19 | 11,250 | 11,121 |
| 6 Federal National Mortgage Assn. | 1.875% | 9/24/26 | 65,000 | 61,783 |
| | | | | 185,817 |
43
| | | | | |
| Institutional Intermediate-Term Bond Fund | | | | |
| |
| |
| |
| | | | | Face | Market |
| | | | Maturity | Amount | Value • |
| | | Coupon | Date | ($000) | ($000) |
| Conventional Mortgage-Backed Securities (26.4%) | | | |
| 6,7 | Fannie Mae Pool | 2.000% | 5/1/28–1/1/32 | 38,622 | 38,074 |
| 6,7,8 Fannie Mae Pool | 2.500% | 2/1/28–2/1/43 | 111,927 | 112,751 |
| 6,7,8 Fannie Mae Pool | 3.000% | 5/1/27–11/1/47 | 562,840 | 568,813 |
| 6,7 | Fannie Mae Pool | 3.500% | 8/1/20–10/1/47 | 104,633 | 108,798 |
| 6,7,8 Fannie Mae Pool | 4.000% | 7/1/18–10/1/47 | 454,793 | 479,922 |
| 6,7,8 Fannie Mae Pool | 4.500% | 1/1/18–10/1/47 | 144,511 | 155,846 |
| 6,7,8 Fannie Mae Pool | 5.000% | 10/1/17–10/1/47 | 99,174 | 108,385 |
| 6,7 | Fannie Mae Pool | 5.500% | 10/1/17– 6/1/40 | 24,436 | 27,047 |
| 6,7 | Fannie Mae Pool | 6.000% | 3/1/21–11/1/39 | 13,760 | 15,453 |
| 6,7 | Fannie Mae Pool | 6.500% | 7/1/20–8/1/39 | 7,855 | 8,711 |
| 6,7 | Fannie Mae Pool | 7.000% | 9/1/28–9/1/38 | 3,892 | 4,514 |
| 6,7 | Fannie Mae Pool | 7.500% | 8/1/30–6/1/32 | 349 | 383 |
| 6,7 | Fannie Mae Pool | 8.000% | 7/1/30–1/1/31 | 15 | 17 |
| 6,7 | Fannie Mae Pool | 8.500% | 12/1/30 | 10 | 11 |
| 6,7 | Freddie Mac Gold Pool | 2.000% | 9/1/28–6/1/30 | 5,705 | 5,638 |
| 6,7,8 Freddie Mac Gold Pool | 2.500% | 9/1/27–4/1/43 | 80,293 | 80,928 |
| 6,7,8 Freddie Mac Gold Pool | 3.000% | 8/1/26–11/1/47 | 232,582 | 234,707 |
| 6,7,8 Freddie Mac Gold Pool | 3.500% | 8/1/20–10/1/47 | 415,877 | 430,440 |
| 6,7 | Freddie Mac Gold Pool | 4.000% | 5/1/18–10/1/47 | 136,173 | 143,541 |
| 6,7,8 Freddie Mac Gold Pool | 4.500% | 10/1/18–11/1/47 | 48,549 | 52,075 |
| 6,7 | Freddie Mac Gold Pool | 5.000% | 12/1/17–4/1/41 | 11,641 | 12,553 |
| 6,7 | Freddie Mac Gold Pool | 5.500% | 1/1/18–2/1/40 | 13,355 | 14,811 |
| 6,7 | Freddie Mac Gold Pool | 6.000% | 7/1/20–5/1/40 | 20,707 | 23,419 |
| 6,7 | Freddie Mac Gold Pool | 6.500% | 2/1/29–9/1/38 | 4,532 | 4,994 |
| 6,7 | Freddie Mac Gold Pool | 7.000% | 5/1/28–6/1/38 | 2,413 | 2,765 |
| 6,7 | Freddie Mac Gold Pool | 7.500% | 3/1/30–5/1/32 | 272 | 310 |
| 6,7 | Freddie Mac Gold Pool | 8.000% | 4/1/30–1/1/31 | 27 | 30 |
| 7 | Ginnie Mae I Pool | 2.500% | 1/15/43–6/15/43 | 1,060 | 1,043 |
| 7 | Ginnie Mae I Pool | 3.000% | 9/15/42–8/15/45 | 16,700 | 16,990 |
| 7 | Ginnie Mae I Pool | 3.500% | 1/15/42–7/15/45 | 12,470 | 13,005 |
| 7 | Ginnie Mae I Pool | 4.000% | 4/15/39–1/15/45 | 2,365 | 2,497 |
| 7 | Ginnie Mae I Pool | 4.500% | 9/15/33–12/15/46 | 32,553 | 35,203 |
| 7 | Ginnie Mae I Pool | 5.000% | 9/15/33–9/15/41 | 15,953 | 17,637 |
| 7 | Ginnie Mae I Pool | 5.500% | 3/15/31–7/15/40 | 7,976 | 8,960 |
| 7 | Ginnie Mae I Pool | 6.000% | 12/15/28–3/15/40 | 3,697 | 4,158 |
| 7 | Ginnie Mae I Pool | 6.500% | 12/15/27–6/15/38 | 3,829 | 4,180 |
| 7 | Ginnie Mae I Pool | 7.000% | 8/15/24–11/15/31 | 238 | 263 |
| 7 | Ginnie Mae I Pool | 7.500% | 11/15/30–3/15/32 | 47 | 52 |
| 7 | Ginnie Mae I Pool | 8.000% | 4/15/30–10/15/30 | 53 | 59 |
| 7 | Ginnie Mae I Pool | 8.500% | 7/15/30 | 20 | 22 |
| 7 | Ginnie Mae I Pool | 9.000% | 1/15/20–7/15/21 | 3 | 3 |
| 7 | Ginnie Mae I Pool | 9.500% | 10/15/19 | — | — |
| 7 | Ginnie Mae II Pool | 2.500% | 3/20/43–4/20/43 | 3,309 | 3,259 |
| 7,8 | Ginnie Mae II Pool | 3.000% | 6/20/43–10/1/47 | 286,803 | 291,220 |
| 7,8 | Ginnie Mae II Pool | 3.500% | 8/20/42–10/1/47 | 392,869 | 409,588 |
| 7 | Ginnie Mae II Pool | 4.000% | 2/20/34–10/1/47 | 197,705 | 209,404 |
| 7 | Ginnie Mae II Pool | 4.500% | 3/20/33–10/1/47 | 30,544 | 32,608 |
| 7 | Ginnie Mae II Pool | 5.000% | 5/20/39–2/20/42 | 25,930 | 28,172 |
| 7 | Ginnie Mae II Pool | 5.500% | 4/20/37–3/20/41 | 4,049 | 4,438 |
| 7 | Ginnie Mae II Pool | 6.000% | 5/20/36–10/20/41 | 5,981 | 6,712 |
| 7 | Ginnie Mae II Pool | 6.500% | 3/20/38–7/20/39 | 76 | 87 |
| | | | | | 3,724,496 |
44
| | | | | |
| Institutional Intermediate-Term Bond Fund | | | | |
| |
| |
| |
| | | | | Face | Market |
| | | | Maturity | Amount | Value • |
| | | Coupon | Date | ($000) | ($000) |
| Nonconventional Mortgage-Backed Securities (1.8%) | | | |
| 6,7,9 | Fannie Mae Pool | 2.625% | 12/1/32 | 6 | 6 |
| 6,7,9 | Fannie Mae Pool | 3.083% | 12/1/40 | 3,144 | 3,313 |
| 6,7,9 | Fannie Mae Pool | 3.085% | 5/1/33 | 58 | 61 |
| 6,7,10 | Fannie Mae Pool | 3.535% | 8/1/33 | 77 | 81 |
| 6,7,10 | Fannie Mae Pool | 3.586% | 7/1/33 | 128 | 131 |
| 6,7,10 | Fannie Mae Pool | 3.721% | 5/1/33 | 12 | 12 |
| 6,7,11 | Fannie Mae REMICS 2005-45 | 1.607% | 6/25/35 | 1,817 | 1,820 |
| 6,7,11 | Fannie Mae REMICS 2005-95 | 1.647% | 11/25/35 | 2,411 | 2,424 |
| 6,7,11 | Fannie Mae REMICS 2006-46 | 1.557% | 6/25/36 | 6,729 | 6,723 |
| 6,7,11 | Fannie Mae REMICS 2007-4 | 1.682% | 2/25/37 | 906 | 910 |
| 6,7,11 | Fannie Mae REMICS 2012-122 | 1.637% | 11/25/42 | 2,484 | 2,487 |
| 6,7,11 | Fannie Mae REMICS 2013-19 | 1.537% | 9/25/41 | 3,418 | 3,407 |
| 6,7,11 | Fannie Mae REMICS 2013-39 | 1.587% | 5/25/43 | 3,214 | 3,207 |
| 6,7,11 | Fannie Mae REMICS 2015-22 | 1.537% | 4/25/45 | 2,679 | 2,664 |
| 6,7,11 | Fannie Mae REMICS 2016-55 | 1.737% | 8/25/46 | 5,280 | 5,320 |
| 6,7,11 | Fannie Mae REMICS 2016-60 | 1.487% | 9/25/46 | 10,864 | 10,829 |
| 6,7,11 | Fannie Mae REMICS 2016-62 | 1.637% | 9/25/46 | 10,838 | 10,875 |
| 6,7,11 | Fannie Mae REMICS 2016-93 | 1.587% | 12/25/46 | 22,299 | 22,317 |
| 6,7,9 | Freddie Mac Non Gold Pool | 3.111% | 9/1/37 | 10,212 | 10,796 |
| 6,7 | Freddie Mac Non Gold Pool | 3.222% | 7/1/33 | 1,687 | 1,775 |
| 6,7,9 | Freddie Mac Non Gold Pool | 3.329% | 7/1/35 | 12,503 | 13,167 |
| 6,7,10 | Freddie Mac Non Gold Pool | 3.435% | 10/1/32 | 23 | 25 |
| 6,7,10 | Freddie Mac Non Gold Pool | 3.500% | 8/1/37 | 91 | 96 |
| 6,7,10 | Freddie Mac Non Gold Pool | 3.586% | 1/1/33 | 7 | 8 |
| 6,7,10 | Freddie Mac Non Gold Pool | 3.711% | 2/1/33 | 38 | 39 |
| 6,7,11 | Freddie Mac REMICS | 1.584% | 11/15/36–8/15/43 | 5,113 | 5,118 |
| 6,7,11 | Freddie Mac REMICS | 1.594% | 11/15/36 | 1,738 | 1,741 |
| 6,7,11 | Freddie Mac REMICS | 1.684% | 6/15/42 | 977 | 980 |
| 6,7 | Freddie Mac REMICS | 6.500% | 12/15/44–11/15/46 | 89,414 | 108,544 |
| 7 | Government National Mortgage Association | | | | |
| | GNR_17-93C | 6.500% | 6/20/47 | 27,204 | 33,509 |
| | | | | | 252,385 |
| Total U.S. Government and Agency Obligations (Cost $8,507,730) | | 8,471,651 |
| Asset-Backed/Commercial Mortgage-Backed Securities (12.0%) | | |
| 7 | Ally Auto Receivables Trust 2015-1 | 1.750% | 5/15/20 | 1,600 | 1,599 |
| 7 | Ally Auto Receivables Trust 2015-2 | 1.840% | 6/15/20 | 2,920 | 2,924 |
| 7 | Ally Master Owner Trust Series 2014-5 | 1.600% | 10/15/19 | 8,920 | 8,920 |
| 7 | Ally Master Owner Trust Series 2015-3 | 1.630% | 5/15/20 | 14,525 | 14,528 |
| 7 | Ally Master Owner Trust Series 2017-3 | 2.040% | 6/15/22 | 10,700 | 10,697 |
| 7,11 | American Express Credit Account Master | | | | |
| | Trust 2014-1 | 1.604% | 12/15/21 | 12,202 | 12,251 |
| 7,11 | American Express Credit Account Master | | | | |
| | Trust 2017-5 | 1.614% | 2/18/25 | 7,290 | 7,321 |
| 7,11 | American Express Issuance Trust II 2013-2 | 1.664% | 8/15/19 | 3,317 | 3,329 |
| 7,12 | Americold 2010 LLC Trust Series 2010-ARTA 4.954% | 1/14/29 | 4,828 | 5,177 |
| 7,12 | Aventura Mall Trust 2013-AVM | 3.867% | 12/5/32 | 400 | 417 |
| 7,12 | Avis Budget Rental Car Funding AESOP | | | | |
| | LLC 2017-1A | 3.070% | 9/20/23 | 2,500 | 2,524 |
| 7,11 | BA Credit Card Trust 2014-A1 | 1.614% | 6/15/21 | 15,428 | 15,478 |
| 7 | BA Credit Card Trust 2017-A2 | 1.840% | 1/17/23 | 3,330 | 3,319 |
| 7 | Banc of America Commercial Mortgage | | | | |
| | Trust 2015-UBS7 | 3.705% | 9/15/48 | 715 | 746 |
45
| | | | | |
| Institutional Intermediate-Term Bond Fund | | | | |
| |
| |
| |
| | | | | Face | Market |
| | | | Maturity | Amount | Value • |
| | | Coupon | Date | ($000) | ($000) |
| 7 | BANK 2017 - BNK4 | 3.625% | 5/15/50 | 1,540 | 1,601 |
| 7 | BANK 2017 - BNK5 | 3.390% | 6/15/60 | 1,760 | 1,796 |
| 7 | BANK 2017 - BNK6 | 3.518% | 7/15/60 | 1,020 | 1,052 |
| 7,12,13 | Bank of America Student Loan Trust 2010-1A | 2.114% | 2/25/43 | 3,936 | 3,945 |
| 12 | Bank of Montreal | 1.750% | 6/15/21 | 5,835 | 5,727 |
| | Bank of Nova Scotia | 1.850% | 4/14/20 | 3,696 | 3,681 |
| | Bank of Nova Scotia | 1.875% | 4/26/21 | 26,230 | 25,811 |
| 12 | Bank of Nova Scotia | 1.875% | 9/20/21 | 7,770 | 7,633 |
| 7 | Barclays Dryrock Issuance Trust 2014-3 | 2.410% | 7/15/22 | 9,200 | 9,298 |
| 7,11 | Barclays Dryrock Issuance Trust 2017-2 | 1.534% | 5/15/23 | 7,290 | 7,300 |
| 7,11,12 | BMW Floorplan Master Owner Trust 2015-1A | 1.734% | 7/15/20 | 8,115 | 8,136 |
| 7,13 | Brazos Higher Education Authority Inc. | | | | |
| | Series 2005-3 | 1.528% | 6/25/26 | 2,588 | 2,572 |
| 7,13 | Brazos Higher Education Authority Inc. | | | | |
| | Series 2011-1 | 2.117% | 2/25/30 | 1,610 | 1,621 |
| 7 | Cabela’s Credit Card Master Note Trust | | | | |
| | 2015-1A | 2.260% | 3/15/23 | 1,430 | 1,437 |
| 7,11 | Cabela’s Credit Card Master Note Trust | | | | |
| | 2015-2 | 1.904% | 7/17/23 | 3,225 | 3,248 |
| 7,11 | Cabela’s Credit Card Master Note Trust | | | | |
| | 2016-1 | 2.084% | 6/15/22 | 3,440 | 3,475 |
| 12 | Canadian Imperial Bank of Commerce | 2.250% | 7/21/20 | 2,235 | 2,242 |
| 7 | Capital One Multi-Asset Execution Trust | | | | |
| | 2015-A2 | 2.080% | 3/15/23 | 6,480 | 6,512 |
| 7 | Capital One Multi-Asset Execution Trust | | | | |
| | 2015-A4 | 2.750% | 5/15/25 | 7,765 | 7,981 |
| 7 | Capital One Multi-Asset Execution Trust | | | | |
| | 2015-A8 | 2.050% | 8/15/23 | 11,390 | 11,440 |
| 7,11 | Capital One Multi-Asset Execution Trust | | | | |
| | 2016-A1 | 1.684% | 2/15/22 | 30,620 | 30,780 |
| 7,11 | Capital One Multi-Asset Execution Trust | | | | |
| | 2016-A2 | 1.864% | 2/15/24 | 2,900 | 2,938 |
| 7,11,12 | CARDS II Trust 2016-1A | 1.934% | 7/15/21 | 9,200 | 9,232 |
| 7,11,12 | CARDS II Trust 2017-1A | 1.604% | 4/18/22 | 12,290 | 12,312 |
| 7 | CarMax Auto Owner Trust 2014-4 | 1.810% | 7/15/20 | 2,100 | 2,102 |
| 7 | CarMax Auto Owner Trust 2015-2 | 1.800% | 3/15/21 | 1,690 | 1,691 |
| 7 | CarMax Auto Owner Trust 2015-3 | 1.980% | 2/16/21 | 1,265 | 1,266 |
| 7 | CarMax Auto Owner Trust 2016-1 | 1.880% | 6/15/21 | 3,080 | 3,079 |
| 7 | CarMax Auto Owner Trust 2016-4 | 1.400% | 8/15/21 | 4,430 | 4,400 |
| 7 | CarMax Auto Owner Trust 2016-4 | 1.600% | 6/15/22 | 2,110 | 2,087 |
| 7 | CarMax Auto Owner Trust 2017-3 | 2.220% | 11/15/22 | 9,220 | 9,211 |
| 7 | CD 2017-CD3 Commercial Mortgage Trust | 3.631% | 2/10/50 | 1,580 | 1,646 |
| 7 | CD 2017-CD4 Commercial Mortgage Trust | 3.514% | 5/10/50 | 800 | 826 |
| 7 | CD 2017-CD5 Commercial Mortgage Trust | 3.431% | 8/15/50 | 880 | 900 |
| 7 | CenterPoint Energy Transition Bond Co. IV | | | | |
| | LLC 2012-1 | 2.161% | 10/15/21 | 5,787 | 5,808 |
| 7,12 | CFCRE Commercial Mortgage Trust 2011-C2 | 5.945% | 12/15/47 | 2,054 | 2,293 |
| 7 | CFCRE Commercial Mortgage Trust 2016-C4 | 3.283% | 5/10/58 | 3,235 | 3,255 |
| 7 | Chase Issuance Trust 2014-A2 | 2.770% | 3/15/23 | 2,333 | 2,392 |
| 7,11 | Chase Issuance Trust 2016-A1 | 1.664% | 5/17/21 | 30,978 | 31,133 |
| 7,12 | Chrysler Capital Auto Receivables Trust | | | | |
| | 2015-BA | 2.260% | 10/15/20 | 2,790 | 2,803 |
| 7,12 | Chrysler Capital Auto Receivables Trust | | | | |
| | 2016-AA | 1.960% | 1/18/22 | 5,360 | 5,359 |
46
| | | | | |
| Institutional Intermediate-Term Bond Fund | | | | |
| |
| |
| |
| | | | | Face | Market |
| | | | Maturity | Amount | Value • |
| | | Coupon | Date | ($000) | ($000) |
| 7,12 Chrysler Capital Auto Receivables Trust | | | | |
| | 2016-BA | 1.640% | 7/15/21 | 2,300 | 2,293 |
| 7,12 Chrysler Capital Auto Receivables Trust | | | | |
| | 2016-BA | 1.870% | 2/15/22 | 1,630 | 1,611 |
| 7,11 Citibank Credit Card Issuance Trust 2008-A7 | 2.611% | 5/20/20 | 3,898 | 3,930 |
| 7,11 Citibank Credit Card Issuance Trust 2013-A2 | 1.517% | 5/26/20 | 14,014 | 14,033 |
| 7,11 Citibank Credit Card Issuance Trust 2013-A7 | 1.665% | 9/10/20 | 6,379 | 6,402 |
| 7 | Citibank Credit Card Issuance Trust 2014-A1 | 2.880% | 1/23/23 | 4,486 | 4,618 |
| 7 | Citibank Credit Card Issuance Trust 2014-A6 | 2.150% | 7/15/21 | 7,080 | 7,129 |
| 7,11 Citibank Credit Card Issuance Trust 2017-A5 | 1.856% | 4/22/26 | 5,610 | 5,668 |
| 7 | Citigroup Commercial Mortgage Trust | | | | |
| | 2012-GC8 | 3.024% | 9/10/45 | 1,280 | 1,307 |
| 7,12 Citigroup Commercial Mortgage Trust | | | | |
| | 2012-GC8 | 3.683% | 9/10/45 | 400 | 416 |
| 7 | Citigroup Commercial Mortgage Trust | | | | |
| | 2013-GC11 | 3.093% | 4/10/46 | 1,364 | 1,390 |
| 7 | Citigroup Commercial Mortgage Trust | | | | |
| | 2013-GC15 | 3.942% | 9/10/46 | 333 | 349 |
| 7 | Citigroup Commercial Mortgage Trust | | | | |
| | 2014-GC19 | 3.753% | 3/10/47 | 160 | 168 |
| 7 | Citigroup Commercial Mortgage Trust | | | | |
| | 2014-GC19 | 4.023% | 3/10/47 | 7,828 | 8,324 |
| 7 | Citigroup Commercial Mortgage Trust | | | | |
| | 2014-GC21 | 3.575% | 5/10/47 | 1,290 | 1,344 |
| 7 | Citigroup Commercial Mortgage Trust | | | | |
| | 2014-GC21 | 3.855% | 5/10/47 | 3,705 | 3,906 |
| 7 | Citigroup Commercial Mortgage Trust | | | | |
| | 2014-GC23 | 3.622% | 7/10/47 | 1,380 | 1,437 |
| 7 | Citigroup Commercial Mortgage Trust | | | | |
| | 2014-GC23 | 3.863% | 7/10/47 | 240 | 246 |
| 7 | Citigroup Commercial Mortgage Trust | | | | |
| | 2014-GC25 | 3.372% | 10/10/47 | 1,530 | 1,572 |
| 7 | Citigroup Commercial Mortgage Trust | | | | |
| | 2014-GC25 | 3.635% | 10/10/47 | 3,929 | 4,088 |
| 7 | Citigroup Commercial Mortgage Trust | | | | |
| | 2015-GC33 | 3.778% | 9/10/58 | 1,983 | 2,077 |
| 7 | Citigroup Commercial Mortgage Trust | | | | |
| | 2016-C1 | 3.209% | 5/10/49 | 533 | 537 |
| 7,14 Citigroup Commercial Mortgage Trust | | | | |
| | 2017-P8 | 3.465% | 9/15/50 | 2,110 | 2,173 |
| 7 | CNH Equipment Trust 2016-B | 1.970% | 11/15/21 | 3,090 | 3,082 |
| 7 | CNH Equipment Trust 2017-B | 2.170% | 4/17/23 | 3,730 | 3,742 |
| 7 | COMM 2012-CCRE2 Mortgage Trust | 3.147% | 8/15/45 | 595 | 612 |
| 7 | COMM 2012-CCRE2 Mortgage Trust | 3.791% | 8/15/45 | 893 | 933 |
| 7 | COMM 2012-CCRE3 Mortgage Trust | 2.822% | 10/15/45 | 1,531 | 1,544 |
| 7,12 COMM 2012-CCRE3 Mortgage Trust | 3.416% | 10/15/45 | 610 | 625 |
| 7 | COMM 2012-CCRE4 Mortgage Trust | 2.853% | 10/15/45 | 1,221 | 1,232 |
| 7 | COMM 2012-CCRE4 Mortgage Trust | 3.251% | 10/15/45 | 30 | 30 |
| 7 | COMM 2012-CCRE5 Mortgage Trust | 2.771% | 12/10/45 | 518 | 521 |
| 7 | COMM 2013-CCRE11 Mortgage Trust | 3.983% | 8/10/50 | 1,835 | 1,948 |
| 7 | COMM 2013-CCRE11 Mortgage Trust | 4.258% | 8/10/50 | 842 | 911 |
| 7 | COMM 2013-CCRE12 Mortgage Trust | 3.623% | 10/10/46 | 655 | 683 |
| 7 | COMM 2013-CCRE12 Mortgage Trust | 3.765% | 10/10/46 | 310 | 327 |
| 7 | COMM 2013-CCRE12 Mortgage Trust | 4.046% | 10/10/46 | 1,895 | 2,027 |
47
| | | | | |
| Institutional Intermediate-Term Bond Fund | | | | |
| |
| |
| |
| | | | | Face | Market |
| | | | Maturity | Amount | Value • |
| | | Coupon | Date | ($000) | ($000) |
| 7 | COMM 2013-CCRE13 Mortgage Trust | 4.194% | 11/12/46 | 3,226 | 3,484 |
| 7 | COMM 2013-CCRE9 Mortgage Trust | 4.373% | 7/10/45 | 3,734 | 4,048 |
| 7,12 | COMM 2013-CCRE9 Mortgage Trust | 4.396% | 7/10/45 | 2,083 | 2,225 |
| 7,12 | COMM 2013-LC13 Mortgage Trust | 3.774% | 8/10/46 | 546 | 571 |
| 7 | COMM 2013-LC13 Mortgage Trust | 4.205% | 8/10/46 | 150 | 162 |
| 7 | COMM 2013-LC6 Mortgage Trust | 2.941% | 1/10/46 | 834 | 845 |
| 7,12 | COMM 2013-SFS Mortgage Trust | 3.086% | 4/12/35 | 500 | 505 |
| 7 | COMM 2014-CCRE14 Mortgage Trust | 3.955% | 2/10/47 | 4,000 | 4,233 |
| 7 | COMM 2014-CCRE14 Mortgage Trust | 4.236% | 2/10/47 | 853 | 919 |
| 7 | COMM 2014-CCRE17 Mortgage Trust | 3.977% | 5/10/47 | 1,182 | 1,256 |
| 7 | COMM 2014-CCRE17 Mortgage Trust | 4.174% | 5/10/47 | 295 | 311 |
| 7 | COMM 2014-CCRE18 Mortgage Trust | 3.550% | 7/15/47 | 6,000 | 6,202 |
| 7 | COMM 2014-CCRE18 Mortgage Trust | 3.828% | 7/15/47 | 3,389 | 3,561 |
| 7 | COMM 2014-CCRE20 Mortgage Trust | 3.326% | 11/10/47 | 870 | 890 |
| 7 | COMM 2014-CCRE20 Mortgage Trust | 3.590% | 11/10/47 | 3,532 | 3,665 |
| 7 | COMM 2014-CCRE21 Mortgage Trust | 3.528% | 12/10/47 | 4,950 | 5,118 |
| 7 | COMM 2014-LC17 Mortgage Trust | 3.917% | 10/10/47 | 1,375 | 1,456 |
| 7 | COMM 2015-CCRE22 Mortgage Trust | 3.309% | 3/10/48 | 460 | 469 |
| 7 | COMM 2015-CCRE24 Mortgage Trust | 3.696% | 8/10/48 | 2,450 | 2,551 |
| 7 | COMM 2015-CCRE25 Mortgage Trust | 3.759% | 8/10/48 | 850 | 892 |
| 7 | COMM 2015-CCRE27 Mortgage Trust | 3.612% | 10/10/48 | 3,024 | 3,137 |
| 7 | COMM 2015-LC19 Mortgage Trust | 3.183% | 2/10/48 | 170 | 172 |
| 12 | Commonwealth Bank of Australia | 2.000% | 6/18/19 | 2,602 | 2,601 |
| 12 | Commonwealth Bank of Australia | 2.125% | 7/22/20 | 2,280 | 2,275 |
| 7 | CSAIL 2015-C1 Commercial Mortgage Trust | 3.505% | 4/15/50 | 140 | 144 |
| 7 | CSAIL 2015-C4 Commercial Mortgage Trust | 3.808% | 11/15/48 | 145 | 152 |
| 7 | CSAIL 2016-C7 Commercial Mortgage Trust | 3.502% | 11/15/49 | 1,520 | 1,556 |
| 7 | CSAIL 2017-C8 Commercial Mortgage Trust | 3.392% | 6/15/50 | 2,340 | 2,380 |
| 7 | DBJPM 17-C6 Mortgage Trust | 3.328% | 6/10/50 | 1,630 | 1,656 |
| 7 | Discover Card Execution Note Trust 2012-A6 | 1.670% | 1/18/22 | 13,138 | 13,117 |
| 7,11 | Discover Card Execution Note Trust 2013-A1 | 1.534% | 8/17/20 | 3,294 | 3,297 |
| 7 | Discover Card Execution Note Trust 2015-A4 | 2.190% | 4/17/23 | 9,500 | 9,553 |
| 7,11 | Discover Card Execution Note Trust 2016-A2 | 1.774% | 9/15/21 | 3,670 | 3,693 |
| 7 | Discover Card Execution Note Trust 2017-A4 | 2.530% | 10/15/26 | 16,840 | 16,885 |
| 7,11 | Discover Card Execution Note Trust 2017-A5 | 1.834% | 12/15/26 | 17,460 | 17,632 |
| 12 | DNB Boligkreditt AS | 1.450% | 3/21/18 | 1,198 | 1,197 |
| 7,12 | Enterprise Fleet Financing LLC Series 2015-2 | 2.090% | 2/22/21 | 3,300 | 3,289 |
| 7,12 | Enterprise Fleet Financing LLC Series 2016-1 | 2.080% | 9/20/21 | 7,640 | 7,649 |
| 7,12 | Enterprise Fleet Financing LLC Series 2016-2 | 2.040% | 2/22/22 | 1,390 | 1,387 |
| 7,11,12 | Evergreen Credit Card Trust Series 2016-1 | 1.954% | 4/15/20 | 36,000 | 36,100 |
| 7,11,12 | Evergreen Credit Card Trust Series 2016-3 | 1.734% | 11/16/20 | 2,550 | 2,560 |
| 6,7 | Fannie Mae Grantor Trust 2017-T1 | 2.898% | 6/25/27 | 6,319 | 6,287 |
| 6,7 | FHLMC Multifamily Structured Pass | | | | |
| | Through Certificates K066 | 3.117% | 6/25/27 | 5,460 | 5,571 |
| 7 | Fifth Third Auto Trust 2017-1 | 2.030% | 7/15/24 | 12,140 | 12,114 |
| 7,11 | First National Master Note Trust 2017-1 | 1.634% | 4/18/22 | 11,720 | 11,728 |
| 7,12 | Ford Credit Auto Owner Trust 2014-REV1 | 2.260% | 11/15/25 | 4,089 | 4,119 |
| 7 | Ford Credit Auto Owner Trust 2015-C | 1.740% | 2/15/21 | 4,455 | 4,452 |
| 7,12 | Ford Credit Auto Owner Trust 2015-REV2 | 2.440% | 1/15/27 | 9,700 | 9,813 |
| 7,12 | Ford Credit Auto Owner Trust 2016-REV1 | 2.310% | 8/15/27 | 11,910 | 11,974 |
| 7,12 | Ford Credit Auto Owner Trust 2016-REV2 | 2.030% | 12/15/27 | 15,232 | 15,147 |
| 7,12 | Ford Credit Auto Owner Trust 2017-1 | 2.620% | 8/15/28 | 36,790 | 37,216 |
| 7,12 | Ford Credit Auto Owner Trust 2017-2 | 2.360% | 3/15/29 | 14,950 | 14,904 |
| 7 | Ford Credit Auto Owner Trust 2017-B | 1.870% | 9/15/22 | 7,500 | 7,481 |
48
| | | | | |
| Institutional Intermediate-Term Bond Fund | | | | |
| |
| |
| |
| | | | | Face | Market |
| | | | Maturity | Amount | Value • |
| | | Coupon | Date | ($000) | ($000) |
| 7,11 | Ford Credit Floorplan Master Owner Trust | | | | |
| | A Series 2014-2 | 1.734% | 2/15/21 | 6,191 | 6,213 |
| 7,11 | Ford Credit Floorplan Master Owner Trust A | | | | |
| | Series 2015-2 | 1.804% | 1/15/22 | 7,310 | 7,366 |
| 7 | Ford Credit Floorplan Master Owner Trust A | | | | |
| | Series 2015-5 | 2.390% | 8/15/22 | 8,230 | 8,318 |
| 7,11 | Ford Credit Floorplan Master Owner Trust A | | | | |
| | Series 2016-1 | 2.134% | 2/15/21 | 11,720 | 11,808 |
| 7,11 | Ford Credit Floorplan Master Owner Trust A | | | | |
| | Series 2016-3 | 1.854% | 7/15/21 | 4,500 | 4,528 |
| 7,11 | Ford Credit Floorplan Master Owner Trust A | | | | |
| | Series 2016-4 | 1.764% | 7/15/20 | 3,480 | 3,489 |
| 7 | Ford Credit Floorplan Master Owner Trust A | | | | |
| | Series 2017-1 | 2.070% | 5/15/22 | 36,140 | 36,240 |
| 7 | GM Financial Automobile Leasing Trust | | | | |
| | 2015-1 | 1.730% | 6/20/19 | 950 | 950 |
| 7 | GM Financial Automobile Leasing Trust | | | | |
| | 2015-3 | 1.690% | 3/20/19 | 3,213 | 3,214 |
| 7 | GM Financial Automobile Leasing Trust | | | | |
| | 2016-1 | 1.790% | 3/20/20 | 7,100 | 7,072 |
| 7 | GM Financial Automobile Leasing Trust | | | | |
| | 2017-1 | 2.260% | 8/20/20 | 5,000 | 5,032 |
| 7 | GM Financial Automobile Leasing Trust | | | | |
| | 2017-2 | 2.180% | 6/21/21 | 3,500 | 3,491 |
| 7 | GM Financial Automobile Leasing Trust | | | | |
| | 2017-3 | 1.720% | 1/21/20 | 20,020 | 19,991 |
| 7 | GM Financial Automobile Leasing Trust | | | | |
| | 2017-3 | 2.010% | 11/20/20 | 6,780 | 6,781 |
| 7 | GM Financial Automobile Leasing Trust | | | | |
| | 2017-3 | 2.120% | 9/20/21 | 1,830 | 1,832 |
| 7,11,12 | GMF Floorplan Owner Revolving Trust | | | | |
| | 2016-1 | 2.084% | 5/17/21 | 10,260 | 10,354 |
| 7,11,12 | GMF Floorplan Owner Revolving Trust | | | | |
| | 2017-1 | 1.804% | 1/18/22 | 220 | 221 |
| 7,12 | GMF Floorplan Owner Revolving Trust | | | | |
| | 2017-2 | 2.130% | 7/15/22 | 20,010 | 19,947 |
| 7,11,12 | Golden Credit Card Trust 2014-2A | 1.684% | 3/15/21 | 2,921 | 2,928 |
| 7,12 | Golden Credit Card Trust 2016-5A | 1.600% | 9/15/21 | 24,420 | 24,232 |
| 7,11,12 | Golden Credit Card Trust 2017-4A | 1.754% | 7/15/24 | 17,930 | 17,956 |
| 7,12 | GreatAmerica Leasing Receivables Funding | | | | |
| | LLC Series 2014-1 | 1.470% | 8/15/20 | 302 | 302 |
| 7,12 | GreatAmerica Leasing Receivables Funding | | | | |
| | LLC Series 2016-1 | 1.990% | 4/20/22 | 3,770 | 3,755 |
| 7,12 | GreatAmerica Leasing Receivables Funding | | | | |
| | LLC Series 2017-1 | 2.360% | 1/20/23 | 5,700 | 5,700 |
| 7,12 | GS Mortgage Securities Trust 2012-GC6 | 4.948% | 1/10/45 | 233 | 253 |
| 7 | GS Mortgage Securities Trust 2013-GCJ12 | 3.135% | 6/10/46 | 934 | 954 |
| 7 | GS Mortgage Securities Trust 2014-GC20 | 3.998% | 4/10/47 | 4,923 | 5,206 |
| 7 | GS Mortgage Securities Trust 2014-GC26 | 3.629% | 11/10/47 | 1,900 | 1,979 |
| 7 | Harley-Davidson Motorcycle Trust 2014-1 | 1.550% | 10/15/21 | 2,692 | 2,692 |
| 7,12 | Hertz Vehicle Financing II LP 2015-3A | 2.670% | 9/25/21 | 2,790 | 2,774 |
| 7,12 | Hertz Vehicle Financing LLC 2016-2A | 2.950% | 3/25/22 | 1,830 | 1,825 |
| 7,12 | Hertz Vehicle Financing LLC 2016-3A | 2.270% | 7/25/20 | 1,380 | 1,374 |
| 7,12 | Hertz Vehicle Financing LLC 2017-2A | 3.290% | 10/25/23 | 3,170 | 3,181 |
49
| | | | | |
| Institutional Intermediate-Term Bond Fund | | | | |
| |
| |
| |
| | | | | Face | Market |
| | | | Maturity | Amount | Value • |
| | | Coupon | Date | ($000) | ($000) |
| 7 | Honda Auto Receivables 2017-2 Owner Trust | 1.870% | 9/15/23 | 10,000 | 9,982 |
| 7 | Honda Auto Receivables 2017-3 Owner Trust | 1.980% | 11/20/23 | 6,020 | 6,022 |
| 7,12 Hyundai Auto Lease Securitization Trust | | | | |
| | 2017-B | 2.130% | 3/15/21 | 7,540 | 7,525 |
| 7 | Hyundai Auto Receivables Trust 2015-C | 1.780% | 11/15/21 | 2,910 | 2,910 |
| 7 | Hyundai Auto Receivables Trust 2017-B | 1.960% | 2/15/23 | 10,250 | 10,230 |
| 7,12 Hyundai Floorplan Master Owner Trust | | | | |
| | Series 2016-1A | 1.810% | 3/15/21 | 2,090 | 2,084 |
| 13 | Illinois Student Assistance Commission | | | | |
| | Series 2010-1 | 2.364% | 4/25/22 | 745 | 747 |
| 7,12 Irvine Core Office Trust 2013-IRV | 3.279% | 5/15/48 | 1,952 | 1,999 |
| 7 | John Deere Owner Trust 2015-B | 1.780% | 6/15/22 | 480 | 481 |
| 7 | John Deere Owner Trust 2016-B | 1.490% | 5/15/23 | 880 | 875 |
| 7 | John Deere Owner Trust 2017-A | 2.110% | 12/15/23 | 7,390 | 7,422 |
| 7 | John Deere Owner Trust 2017-B | 2.110% | 7/15/24 | 7,410 | 7,418 |
| 7,12 JP Morgan Chase Commercial Mortgage | | | | |
| | Securities Trust 2011-C3 | 4.717% | 2/15/46 | 2,819 | 2,999 |
| 7,12 JP Morgan Chase Commercial Mortgage | | | | |
| | Securities Trust 2011-C5 | 5.588% | 8/15/46 | 833 | 910 |
| 7,12 JP Morgan Chase Commercial Mortgage | | | | |
| | Securities Trust 2011-RR1 | 4.717% | 3/16/46 | 8,782 | 9,306 |
| 7 | JP Morgan Chase Commercial Mortgage | | | | |
| | Securities Trust 2012-C6 | 3.507% | 5/15/45 | 371 | 386 |
| 7 | JP Morgan Chase Commercial Mortgage | | | | |
| | Securities Trust 2012-C8 | 2.829% | 10/15/45 | 944 | 953 |
| 7,12 JP Morgan Chase Commercial Mortgage | | | | |
| | Securities Trust 2012-C8 | 3.424% | 10/15/45 | 1,373 | 1,399 |
| 7,12 JP Morgan Chase Commercial Mortgage | | | | |
| | Securities Trust 2012-HSBC | 3.093% | 7/5/32 | 1,543 | 1,586 |
| 7 | JP Morgan Chase Commercial Mortgage | | | | |
| | Securities Trust 2013-C13 | 3.994% | 1/15/46 | 2,635 | 2,803 |
| 7 | JP Morgan Chase Commercial Mortgage | | | | |
| | Securities Trust 2013-C16 | 3.674% | 12/15/46 | 452 | 471 |
| 7 | JP Morgan Chase Commercial Mortgage | | | | |
| | Securities Trust 2013-C16 | 3.881% | 12/15/46 | 100 | 106 |
| 7 | JP Morgan Chase Commercial Mortgage | | | | |
| | Securities Trust 2013-C16 | 4.166% | 12/15/46 | 1,120 | 1,204 |
| 7 | JP Morgan Chase Commercial Mortgage | | | | |
| | Securities Trust 2013-LC11 | 2.960% | 4/15/46 | 1,721 | 1,742 |
| 7 | JP Morgan Chase Commercial Mortgage | | | | |
| | Securities Trust 2016-JP4 | 3.648% | 12/15/49 | 400 | 416 |
| 7 | JP Morgan Chase Commercial Mortgage | | | | |
| | Securities Trust 2017-JP6 | 3.490% | 7/15/50 | 680 | 701 |
| 7 | JPMBB Commercial Mortgage Securities | | | | |
| | Trust 2013-C12 | 3.363% | 7/15/45 | 1,310 | 1,356 |
| 7 | JPMBB Commercial Mortgage Securities | | | | |
| | Trust 2013-C12 | 3.664% | 7/15/45 | 2,804 | 2,938 |
| 7 | JPMBB Commercial Mortgage Securities | | | | |
| | Trust 2013-C12 | 4.161% | 7/15/45 | 1,309 | 1,377 |
| 7 | JPMBB Commercial Mortgage Securities | | | | |
| | Trust 2013-C14 | 3.761% | 8/15/46 | 358 | 373 |
| 7 | JPMBB Commercial Mortgage Securities | | | | |
| | Trust 2013-C14 | 4.133% | 8/15/46 | 450 | 481 |
| 7 | JPMBB Commercial Mortgage Securities | | | | |
| | Trust 2013-C15 | 3.659% | 11/15/45 | 179 | 186 |
50
| | | | | |
| Institutional Intermediate-Term Bond Fund | | | | |
| |
| |
| |
| | | | | Face | Market |
| | | | Maturity | Amount | Value • |
| | | Coupon | Date | ($000) | ($000) |
| 7 | JPMBB Commercial Mortgage Securities | | | | |
| | Trust 2013-C17 | 4.199% | 1/15/47 | 3,697 | 3,975 |
| 7 | JPMBB Commercial Mortgage Securities | | | | |
| | Trust 2014-C18 | 4.079% | 2/15/47 | 4,862 | 5,187 |
| 7 | JPMBB Commercial Mortgage Securities | | | | |
| | Trust 2014-C18 | 4.439% | 2/15/47 | 402 | 429 |
| 7 | JPMBB Commercial Mortgage Securities | | | | |
| | Trust 2014-C21 | 3.493% | 8/15/47 | 170 | 175 |
| 7 | JPMBB Commercial Mortgage Securities | | | | |
| | Trust 2014-C24 | 3.639% | 11/15/47 | 970 | 1,012 |
| 7 | JPMBB Commercial Mortgage Securities | | | | |
| | Trust 2015-C32 | 3.598% | 11/15/48 | 3,040 | 3,158 |
| 7 | JPMCC Commercial Mortgage Securities | | | | |
| | Trust 2017-JP5 | 3.723% | 3/15/50 | 6,000 | 6,281 |
| 7 | JPMCC Commercial Mortgage Securities | | | | |
| | Trust 2017-JP7 | 3.454% | 9/15/50 | 1,550 | 1,586 |
| 7,12 | Kubota Credit Owner Trust 2017-1A | 2.160% | 3/15/24 | 2,940 | 2,932 |
| 7 | LB-UBS Commercial Mortgage Trust | | | | |
| | 2008-C1 | 6.319% | 4/15/41 | 5,592 | 5,687 |
| 7,11,12 | Master Credit Card Trust II Series 2016-1A | 1.987% | 9/23/19 | 10,790 | 10,822 |
| 7,12 | Master Credit Card Trust II Series 2017-1A | 2.260% | 7/21/21 | 20,000 | 20,110 |
| 7,11 | MBNA Credit Card Master Note Trust | | | | |
| | 2004-A3 | 1.494% | 8/16/21 | 15,215 | 15,239 |
| 7,11,12 | Mercedes-Benz Master Owner Trust 2016-B | 1.934% | 5/17/21 | 12,000 | 12,086 |
| 7,11,12 | Mercedes-Benz Master Owner Trust 2017-B | 1.654% | 5/16/22 | 15,690 | 15,735 |
| 7,12 | MMAF Equipment Finance LLC 2011-AA | 3.040% | 8/15/28 | 986 | 987 |
| 7,12 | MMAF Equipment Finance LLC 2012-AA | 1.980% | 6/10/32 | 444 | 445 |
| 7,12 | MMAF Equipment Finance LLC 2013-AA | 1.680% | 5/11/20 | 779 | 780 |
| 7,12 | MMAF Equipment Finance LLC 2013-AA | 2.570% | 6/9/33 | 895 | 905 |
| 7,12 | MMAF Equipment Finance LLC 2016-AA | 2.210% | 12/15/32 | 5,240 | 5,200 |
| 7,12 | MMAF Equipment Finance LLC 2017-A | 2.410% | 8/16/24 | 6,180 | 6,195 |
| 7,12 | MMAF Equipment Finance LLC 2017-A | 2.680% | 7/16/27 | 3,090 | 3,107 |
| 7 | Morgan Stanley Bank of America Merrill | | | | |
| | Lynch Trust 2012-C5 | 3.176% | 8/15/45 | 2,328 | 2,389 |
| 7 | Morgan Stanley Bank of America Merrill | | | | |
| | Lynch Trust 2012-C5 | 3.792% | 8/15/45 | 896 | 930 |
| 7 | Morgan Stanley Bank of America Merrill | | | | |
| | Lynch Trust 2012-C6 | 2.858% | 11/15/45 | 1,132 | 1,144 |
| 7 | Morgan Stanley Bank of America Merrill | | | | |
| | Lynch Trust 2013-C10 | 4.219% | 7/15/46 | 4,817 | 5,174 |
| 7 | Morgan Stanley Bank of America Merrill | | | | |
| | Lynch Trust 2013-C11 | 3.960% | 8/15/46 | 1,160 | 1,229 |
| 7 | Morgan Stanley Bank of America Merrill | | | | |
| | Lynch Trust 2013-C11 | 4.315% | 8/15/46 | 350 | 373 |
| 7 | Morgan Stanley Bank of America Merrill | | | | |
| | Lynch Trust 2013-C12 | 3.824% | 10/15/46 | 375 | 391 |
| 7 | Morgan Stanley Bank of America Merrill | | | | |
| | Lynch Trust 2013-C12 | 4.259% | 10/15/46 | 130 | 140 |
| 7 | Morgan Stanley Bank of America Merrill | | | | |
| | Lynch Trust 2013-C13 | 4.039% | 11/15/46 | 75 | 80 |
| 7 | Morgan Stanley Bank of America Merrill | | | | |
| | Lynch Trust 2014-C14 | 4.064% | 2/15/47 | 358 | 381 |
| 7 | Morgan Stanley Bank of America Merrill | | | | |
| | Lynch Trust 2014-C14 | 4.384% | 2/15/47 | 179 | 190 |
51
| | | | | |
| Institutional Intermediate-Term Bond Fund | | | | |
| |
| |
| |
| | | | | Face | Market |
| | | | Maturity | Amount | Value • |
| | | Coupon | Date | ($000) | ($000) |
| 7 | Morgan Stanley Bank of America Merrill | | | | |
| | Lynch Trust 2014-C15 | 3.773% | 4/15/47 | 1,960 | 2,063 |
| 7 | Morgan Stanley Bank of America Merrill | | | | |
| | Lynch Trust 2014-C15 | 4.051% | 4/15/47 | 4,350 | 4,637 |
| 7 | Morgan Stanley Bank of America Merrill | | | | |
| | Lynch Trust 2014-C16 | 3.892% | 6/15/47 | 2,913 | 3,075 |
| 7 | Morgan Stanley Bank of America Merrill | | | | |
| | Lynch Trust 2014-C16 | 4.094% | 6/15/47 | 295 | 310 |
| 7 | Morgan Stanley Bank of America Merrill | | | | |
| | Lynch Trust 2015-C22 | 3.306% | 4/15/48 | 1,090 | 1,106 |
| 7 | Morgan Stanley Bank of America Merrill | | | | |
| | Lynch Trust 2015-C23 | 3.451% | 7/15/50 | 6,000 | 6,160 |
| 7 | Morgan Stanley Bank of America Merrill | | | | |
| | Lynch Trust 2015-C25 | 3.635% | 10/15/48 | 2,903 | 3,015 |
| 7 | Morgan Stanley Bank of America Merrill | | | | |
| | Lynch Trust 2016-C32 | 3.720% | 12/15/49 | 792 | 829 |
| 7,12 | Morgan Stanley Capital I Trust 2012-STAR | 3.201% | 8/5/34 | 2,011 | 2,022 |
| 7 | Morgan Stanley Capital I Trust 2016-UBS9 | 3.594% | 3/15/49 | 1,760 | 1,823 |
| 7,11,12,14 Motor plc 2017 1A | 1.773% | 9/25/24 | 16,100 | 16,100 |
| 12 | National Australia Bank Ltd. | 2.250% | 3/16/21 | 14,730 | 14,713 |
| 7,11 | Navient Student Loan Trust 2014-8 | 1.677% | 4/25/23 | 5,358 | 5,373 |
| 7,11 | Navient Student Loan Trust 2015-3 | 1.887% | 6/26/56 | 4,800 | 4,813 |
| 7,11,12 | Navient Student Loan Trust 2016-2 | 2.287% | 6/25/65 | 1,450 | 1,470 |
| 7,11,12 | Navient Student Loan Trust 2016-3 | 2.087% | 6/25/65 | 1,880 | 1,902 |
| 7,11,12 | Navient Student Loan Trust 2016-6A | 1.987% | 3/25/66 | 7,040 | 7,062 |
| 7,11,12 | Navient Student Loan Trust 2017-1 | 1.987% | 7/26/66 | 26,000 | 26,307 |
| 7,11,12 | Navient Student Loan Trust 2017-3A | 1.837% | 7/26/66 | 4,715 | 4,747 |
| 7,11,12 | Navient Student Loan Trust 2017-4A | 1.737% | 9/27/66 | 5,910 | 5,932 |
| 7,11,12 | Navistar Financial Dealer Note Master | | | | |
| | Trust II 2017-1A | 2.017% | 6/27/22 | 7,070 | 7,074 |
| 7,12 | NextGear Floorplan Master Owner | | | | |
| | Trust 2016-1A | 2.740% | 4/15/21 | 2,950 | 2,973 |
| 7 | Nissan Auto Lease Trust 2017-A | 1.910% | 4/15/20 | 17,740 | 17,759 |
| 7 | Nissan Auto Lease Trust 2017-A | 2.040% | 9/15/22 | 4,910 | 4,899 |
| 7 | Nissan Auto Receivables 2015-A Owner | | | | |
| | Trust | 1.500% | 9/15/21 | 6,990 | 6,973 |
| 7 | Nissan Auto Receivables 2015-B Owner | | | | |
| | Trust | 1.790% | 1/17/22 | 775 | 775 |
| 7 | Nissan Auto Receivables 2015-C Owner | | | | |
| | Trust | 1.670% | 2/15/22 | 15,000 | 14,954 |
| 7 | Nissan Auto Receivables 2016-A Owner | | | | |
| | Trust | 1.590% | 7/15/22 | 9,120 | 9,063 |
| 7 | Nissan Master Owner Trust Receivables | | | | |
| | Series 2015-A | 1.440% | 1/15/20 | 7,500 | 7,499 |
| 7,11 | Nissan Master Owner Trust Receivables | | | | |
| | Series 2016-A | 1.874% | 6/15/21 | 13,480 | 13,587 |
| 13 | North Carolina State Education Assistance | | | | |
| | Authority 2011-1 | 2.214% | 1/26/26 | 283 | 283 |
| 7,12 | Palisades Center Trust 2016-PLSD | 2.713% | 4/13/33 | 840 | 843 |
| 7,11,12 | PHEAA Student Loan Trust 2016-2A | 2.187% | 11/25/65 | 6,108 | 6,123 |
| | Royal Bank of Canada | 2.200% | 9/23/19 | 3,072 | 3,082 |
| | Royal Bank of Canada | 2.100% | 10/14/20 | 4,360 | 4,352 |
52
| | | | | |
| Institutional Intermediate-Term Bond Fund | | | | |
| |
| |
| |
| | | | | Face | Market |
| | | | Maturity | Amount | Value • |
| | | Coupon | Date | ($000) | ($000) |
| 7 | Royal Bank of Canada | 1.875% | 2/5/21 | 4,800 | 4,779 |
| | Royal Bank of Canada | 2.300% | 3/22/21 | 5,583 | 5,577 |
| 7,12 | Securitized Term Auto Receivables Trust | | | | |
| | 2016-1A | 1.524% | 3/25/20 | 4,390 | 4,367 |
| 7,12 | Securitized Term Auto Receivables | | | | |
| | Trust 2016-1A | 1.794% | 2/25/21 | 3,800 | 3,773 |
| 7,12 | Securitized Term Auto Receivables | | | | |
| | Trust 2017-1A | 1.890% | 8/25/20 | 13,680 | 13,662 |
| 7,12 | Securitized Term Auto Receivables | | | | |
| | Trust 2017-1A | 2.209% | 6/25/21 | 4,120 | 4,124 |
| 7,12,14 Securitized Term Auto Receivables | | | | |
| | Trust 2017-2A | 2.040% | 4/26/21 | 10,370 | 10,370 |
| 7,12,14 Securitized Term Auto Receivables | | | | |
| | Trust 2017-2A | 2.289% | 3/25/22 | 3,480 | 3,480 |
| 7,13 | SLM Student Loan Trust 2005-5 | 1.414% | 4/25/25 | 3,370 | 3,368 |
| 7,11 | SLM Student Loan Trust 2014-1 | 1.617% | 7/26/21 | 623 | 623 |
| 7 | SMART ABS Series 2014-1US Trust | 1.680% | 12/14/19 | 160 | 160 |
| 7 | SMART ABS Series 2016-2US Trust | 2.050% | 12/14/22 | 810 | 802 |
| 12 | SpareBank 1 Boligkreditt AS | 1.250% | 5/2/18 | 998 | 996 |
| 7,12 | SpareBank 1 Boligkreditt AS | 1.750% | 11/15/20 | 5,077 | 5,042 |
| 12 | Swedbank Hypotek AB | 1.375% | 3/28/18 | 1,131 | 1,130 |
| 7 | Synchrony Credit Card Master Note | | | | |
| | Trust 2015-1 | 2.370% | 3/15/23 | 2,955 | 2,982 |
| 7 | Synchrony Credit Card Master Note | | | | |
| | Trust 2015-2 | 1.600% | 4/15/21 | 3,500 | 3,501 |
| 7 | Synchrony Credit Card Master Note | | | | |
| | Trust 2015-4 | 2.380% | 9/15/23 | 6,363 | 6,428 |
| 7 | Synchrony Credit Card Master Note | | | | |
| | Trust 2016-2 | 2.210% | 5/15/24 | 5,840 | 5,842 |
| 7 | Synchrony Credit Card Master Note | | | | |
| | Trust 2016-3 | 1.580% | 9/15/22 | 16,370 | 16,257 |
| 7 | Synchrony Credit Card Master Note | | | | |
| | Trust Series 2012-2 | 2.220% | 1/15/22 | 2,986 | 3,004 |
| 7 | Toyota Auto Receivables 2016-B Owner | | | | |
| | Trust | 1.520% | 8/16/21 | 2,470 | 2,457 |
| 7,11,12 | Trillium Credit Card Trust II 2016-1A | 1.958% | 5/26/21 | 23,940 | 24,017 |
| 7 | UBS Commercial Mortgage Trust 2012-C1 | 4.171% | 5/10/45 | 244 | 257 |
| 7,12 | UBS-BAMLL Trust 2012-WRM | 3.663% | 6/10/30 | 3,940 | 3,998 |
| 7 | UBS-Barclays Commercial Mortgage | | | | |
| | Trust 2012-C4 | 2.850% | 12/10/45 | 1,340 | 1,351 |
| 7 | UBS-Barclays Commercial Mortgage | | | | |
| | Trust 2013-C6 | 3.244% | 4/10/46 | 200 | 205 |
| 7 | UBS-Barclays Commercial Mortgage | | | | |
| | Trust 2013-C6 | 3.469% | 4/10/46 | 120 | 123 |
| 7 | USAA Auto Owner Trust 2017-1 | 1.880% | 9/15/22 | 7,810 | 7,794 |
| 7,12 | Verizon Owner Trust 2017-1A | 2.060% | 9/20/21 | 11,000 | 11,036 |
| 7,12 | Verizon Owner Trust 2017-2A | 1.920% | 12/20/21 | 28,510 | 28,483 |
| 7,12 | VNDO 2012-6AVE Mortgage Trust | 2.996% | 11/15/30 | 2,529 | 2,571 |
| 7,12 | Volvo Financial Equipment LLC Series | | | | |
| | 2016-1A | 1.890% | 9/15/20 | 1,280 | 1,278 |
| 7,12 | Volvo Financial Equipment LLC Series | | | | |
| | 2017-1A | 2.210% | 11/15/21 | 2,310 | 2,311 |
| 7 | Wells Fargo Commercial Mortgage Trust | | | | |
| | 2012-LC5 | 2.918% | 10/15/45 | 862 | 876 |
53
| | | | | |
| Institutional Intermediate-Term Bond Fund | | | | |
| |
| |
| |
| | | | | Face | Market |
| | | | Maturity | Amount | Value • |
| | | Coupon | Date | ($000) | ($000) |
| 7 | Wells Fargo Commercial Mortgage Trust | | | | |
| | 2012-LC5 | 3.539% | 10/15/45 | 517 | 529 |
| 7 | Wells Fargo Commercial Mortgage Trust | | | | |
| | 2013-LC12 | 3.928% | 7/15/46 | 416 | 438 |
| 7 | Wells Fargo Commercial Mortgage Trust | | | | |
| | 2013-LC12 | 4.218% | 7/15/46 | 296 | 319 |
| 7 | Wells Fargo Commercial Mortgage Trust | | | | |
| | 2015-C26 | 3.166% | 2/15/48 | 1,405 | 1,419 |
| 7 | Wells Fargo Commercial Mortgage Trust | | | | |
| | 2015-C29 | 3.637% | 6/15/48 | 330 | 343 |
| 7 | Wells Fargo Commercial Mortgage Trust | | | | |
| | 2015-C30 | 3.664% | 9/15/58 | 1,870 | 1,950 |
| 7 | Wells Fargo Commercial Mortgage Trust | | | | |
| | 2015-LC22 | 3.839% | 9/15/58 | 2,572 | 2,715 |
| 7 | Wells Fargo Commercial Mortgage Trust | | | | |
| | 2015-SG1 | 3.789% | 9/15/48 | 720 | 754 |
| 7 | Wells Fargo Commercial Mortgage Trust | | | | |
| | 2016-C37 | 3.794% | 12/15/49 | 320 | 336 |
| 7 | Wells Fargo Commercial Mortgage Trust | | | | |
| | 2017-C38 | 3.453% | 7/15/50 | 2,350 | 2,404 |
| 7 | Wells Fargo Commercial Mortgage Trust | | | | |
| | 2017-C39 | 3.418% | 9/15/50 | 2,440 | 2,493 |
| 7 | Wells Fargo Commercial Mortgage Trust | | | | |
| | 2017-RC1 | 3.631% | 1/15/60 | 900 | 933 |
| 7,11 Wells Fargo Dealer Floorplan Master Note | | | | |
| | Trust Series 2015-2 | 1.886% | 1/20/22 | 12,080 | 12,155 |
| 12 | Westpac Banking Corp. | 1.850% | 11/26/18 | 1,028 | 1,028 |
| 12 | Westpac Banking Corp. | 2.000% | 3/3/20 | 2,550 | 2,545 |
| 12 | Westpac Banking Corp. | 2.250% | 11/9/20 | 3,460 | 3,460 |
| 12 | Westpac Banking Corp. | 2.100% | 2/25/21 | 880 | 876 |
| 7,12 WFRBS Commercial Mortgage Trust 2011-C3 | 4.375% | 3/15/44 | 1,221 | 1,290 |
| 7 | WFRBS Commercial Mortgage Trust 2012-C7 | 3.431% | 6/15/45 | 1,072 | 1,113 |
| 7 | WFRBS Commercial Mortgage Trust 2012-C7 | 4.090% | 6/15/45 | 610 | 637 |
| 7 | WFRBS Commercial Mortgage Trust 2012-C8 | 3.001% | 8/15/45 | 208 | 213 |
| 7 | WFRBS Commercial Mortgage Trust 2012-C9 | 2.870% | 11/15/45 | 2,428 | 2,463 |
| 7 | WFRBS Commercial Mortgage Trust 2012-C9 | 3.388% | 11/15/45 | 566 | 577 |
| 7 | WFRBS Commercial Mortgage Trust | | | | |
| | 2013-C15 | 3.720% | 8/15/46 | 476 | 496 |
| 7 | WFRBS Commercial Mortgage Trust | | | | |
| | 2013-C15 | 4.153% | 8/15/46 | 225 | 242 |
| 7 | WFRBS Commercial Mortgage Trust | | | | |
| | 2013-C17 | 3.558% | 12/15/46 | 161 | 167 |
| 7 | WFRBS Commercial Mortgage Trust | | | | |
| | 2013-C18 | 3.676% | 12/15/46 | 595 | 623 |
| 7 | WFRBS Commercial Mortgage Trust | | | | |
| | 2013-C18 | 4.162% | 12/15/46 | 1,488 | 1,603 |
| 7 | WFRBS Commercial Mortgage Trust | | | | |
| | 2014-C19 | 3.829% | 3/15/47 | 100 | 105 |
| 7 | WFRBS Commercial Mortgage Trust | | | | |
| | 2014-C19 | 4.101% | 3/15/47 | 1,031 | 1,102 |
| 7 | WFRBS Commercial Mortgage Trust | | | | |
| | 2014-C23 | 3.917% | 10/15/57 | 815 | 864 |
| 7 | WFRBS Commercial Mortgage Trust | | | | |
| | 2014-C24 | 3.607% | 11/15/47 | 2,810 | 2,909 |
54
| | | | | |
| Institutional Intermediate-Term Bond Fund | | | | |
| |
| |
| |
| | | | | Face | Market |
| | | | Maturity | Amount | Value • |
| | | Coupon | Date | ($000) | ($000) |
| 7 | WFRBS Commercial Mortgage Trust | | | | |
| | 2014-LC14 | 3.766% | 3/15/47 | 2,560 | 2,690 |
| 7 | WFRBS Commercial Mortgage Trust | | | | |
| | 2014-LC14 | 4.045% | 3/15/47 | 2,302 | 2,454 |
| 7,12 Wheels SPV 2 LLC 2016-1A | 1.870% | 5/20/25 | 665 | 663 |
| 7 | World Financial Network Credit Card Master | | | | |
| | Note Trust Series 2013-A | 1.610% | 12/15/21 | 1,732 | 1,732 |
| 7,11 World Financial Network Credit Card Master | | | | |
| | Note Trust Series 2015-A | 1.714% | 2/15/22 | 2,585 | 2,589 |
| 7 | World Financial Network Credit Card Master | | | | |
| | Note Trust Series 2015-B | 2.550% | 6/17/24 | 1,330 | 1,343 |
| 7 | World Omni Auto Receivables Trust 2014-B | 1.680% | 12/15/20 | 3,360 | 3,360 |
| 7 | World Omni Auto Receivables Trust 2015-B | 1.840% | 1/17/22 | 15,000 | 14,997 |
| 7 | World Omni Auto Receivables Trust 2016-A | 1.770% | 9/15/21 | 1,390 | 1,390 |
| 7 | World Omni Auto Receivables Trust 2016-B | 1.300% | 2/15/22 | 7,410 | 7,353 |
| 7 | World Omni Automobile Lease Securitization | | | | |
| | Trust 2017-A | 2.320% | 8/15/22 | 4,670 | 4,681 |
| Total Asset-Backed/Commercial Mortgage-Backed Securities (Cost $1,691,975) | | 1,697,962 |
| Corporate Bonds (20.6%) | | | | |
| Finance (12.3%) | | | | |
| | Banking (10.0%) | | | | |
| 12 | ABN AMRO Bank NV | 2.500% | 10/30/18 | 5,390 | 5,432 |
| | American Express Credit Corp. | 1.875% | 11/5/18 | 4,107 | 4,109 |
| | American Express Credit Corp. | 2.250% | 8/15/19 | 1,800 | 1,806 |
| | American Express Credit Corp. | 2.375% | 5/26/20 | 4,900 | 4,933 |
| | Australia & New Zealand Banking Group Ltd. | 2.000% | 11/16/18 | 3,640 | 3,649 |
| | Australia & New Zealand Banking Group Ltd. | 2.550% | 11/23/21 | 5,598 | 5,595 |
| | Bank of New York Mellon Corp. | 2.150% | 2/24/20 | 590 | 593 |
| | Bank of New York Mellon Corp. | 2.600% | 8/17/20 | 1,246 | 1,263 |
| | Bank of New York Mellon Corp. | 4.150% | 2/1/21 | 2,000 | 2,113 |
| | Bank of New York Mellon Corp. | 2.050% | 5/3/21 | 3,685 | 3,667 |
| | Bank of New York Mellon Corp. | 3.400% | 5/15/24 | 1,890 | 1,950 |
| | Bank of New York Mellon Corp. | 3.000% | 2/24/25 | 600 | 601 |
| | Bank of New York Mellon Corp. | 2.800% | 5/4/26 | 2,470 | 2,412 |
| 7 | Bank of New York Mellon Corp. | 3.442% | 2/7/28 | 3,875 | 3,933 |
| | Bank of Nova Scotia | 1.650% | 6/14/19 | 4,090 | 4,079 |
| | Bank of Nova Scotia | 4.375% | 1/13/21 | 4,490 | 4,788 |
| | Bank of Nova Scotia | 2.700% | 3/7/22 | 1,360 | 1,375 |
| 12 | Bank of Tokyo-Mitsubishi UFJ Ltd. | 2.300% | 3/5/20 | 3,600 | 3,609 |
| 12 | Bank of Tokyo-Mitsubishi UFJ Ltd. | 2.750% | 9/14/20 | 7,652 | 7,739 |
| 12 | Banque Federative du Credit Mutuel SA | 2.750% | 10/15/20 | 7,440 | 7,524 |
| 12 | Banque Federative du Credit Mutuel SA | 2.500% | 4/13/21 | 13,020 | 13,031 |
| 12 | Banque Federative du Credit Mutuel SA | 2.700% | 7/20/22 | 11,130 | 11,157 |
| | Bear Stearns Cos. LLC | 6.400% | 10/2/17 | 7,190 | 7,191 |
| | Bear Stearns Cos. LLC | 7.250% | 2/1/18 | 5,050 | 5,142 |
| | BNP Paribas SA | 2.700% | 8/20/18 | 3,590 | 3,621 |
| | BNP Paribas SA | 2.400% | 12/12/18 | 5,350 | 5,382 |
| | BPCE SA | 2.500% | 12/10/18 | 7,485 | 7,534 |
| | BPCE SA | 2.500% | 7/15/19 | 2,225 | 2,243 |
| | BPCE SA | 2.650% | 2/3/21 | 2,550 | 2,565 |
| | BPCE SA | 4.000% | 4/15/24 | 2,750 | 2,913 |
| | Branch Banking & Trust Co. | 2.625% | 1/15/22 | 12,200 | 12,369 |
| | Canadian Imperial Bank of Commerce | 2.550% | 6/16/22 | 6,185 | 6,193 |
55
| | | | | |
| Institutional Intermediate-Term Bond Fund | | | | |
| |
| |
| |
| | | | | Face | Market |
| | | | Maturity | Amount | Value • |
| | | Coupon | Date | ($000) | ($000) |
| | Commonwealth Bank of Australia | 1.625% | 3/12/18 | 990 | 990 |
| | Commonwealth Bank of Australia | 2.500% | 9/20/18 | 9,260 | 9,332 |
| | Commonwealth Bank of Australia | 1.750% | 11/2/18 | 710 | 709 |
| | Commonwealth Bank of Australia | 2.250% | 3/13/19 | 2,000 | 2,012 |
| | Commonwealth Bank of Australia | 2.300% | 9/6/19 | 6,329 | 6,378 |
| 12 | Commonwealth Bank of Australia | 5.000% | 3/19/20 | 2,970 | 3,167 |
| | Commonwealth Bank of Australia | 2.400% | 11/2/20 | 4,420 | 4,437 |
| 12 | Commonwealth Bank of Australia | 2.000% | 9/6/21 | 3,920 | 3,849 |
| 12 | Commonwealth Bank of Australia | 2.750% | 3/10/22 | 10,060 | 10,129 |
| 12 | Commonwealth Bank of Australia | 2.500% | 9/18/22 | 16,950 | 16,853 |
| 12 | Commonwealth Bank of Australia | 3.150% | 9/19/27 | 11,000 | 10,876 |
| | Cooperatieve Rabobank UA | 2.250% | 1/14/19 | 2,380 | 2,397 |
| | Cooperatieve Rabobank UA | 2.250% | 1/14/20 | 3,610 | 3,635 |
| | Credit Suisse AG | 2.300% | 5/28/19 | 5,990 | 6,023 |
| | Credit Suisse AG | 3.000% | 10/29/21 | 3,000 | 3,053 |
| | Credit Suisse AG | 3.625% | 9/9/24 | 2,800 | 2,896 |
| 12 | Danske Bank A/S | 2.750% | 9/17/20 | 1,105 | 1,120 |
| 12 | Danske Bank A/S | 2.700% | 3/2/22 | 11,080 | 11,128 |
| | Fifth Third Bank | 2.300% | 3/15/19 | 1,360 | 1,369 |
| | Fifth Third Bank | 1.625% | 9/27/19 | 5,820 | 5,783 |
| | Fifth Third Bank | 2.250% | 6/14/21 | 5,364 | 5,359 |
| | First Republic Bank | 2.500% | 6/6/22 | 18,680 | 18,520 |
| | Goldman Sachs Group Inc. | 2.625% | 1/31/19 | 8,910 | 8,984 |
| | Goldman Sachs Group Inc. | 2.550% | 10/23/19 | 11,885 | 11,986 |
| | Goldman Sachs Group Inc. | 2.300% | 12/13/19 | 21,690 | 21,773 |
| | Goldman Sachs Group Inc. | 2.600% | 12/27/20 | 10,920 | 10,981 |
| | Goldman Sachs Group Inc. | 5.750% | 1/24/22 | 8,970 | 10,042 |
| | Goldman Sachs Group Inc. | 3.000% | 4/26/22 | 14,575 | 14,729 |
| 7 | Goldman Sachs Group Inc. | 2.908% | 6/5/23 | 16,520 | 16,492 |
| 7 | Goldman Sachs Group Inc. | 2.905% | 7/24/23 | 9,710 | 9,701 |
| | Goldman Sachs Group Inc. | 3.850% | 7/8/24 | 1,880 | 1,953 |
| | Goldman Sachs Group Inc. | 3.750% | 5/22/25 | 2,160 | 2,218 |
| 7 | Goldman Sachs Group Inc. | 3.272% | 9/29/25 | 16,520 | 16,495 |
| 7 | Goldman Sachs Group Inc. | 3.691% | 6/5/28 | 14,985 | 15,091 |
| 12 | HSBC Bank plc | 1.500% | 5/15/18 | 2,250 | 2,248 |
| | HSBC Bank USA NA | 4.875% | 8/24/20 | 3,896 | 4,186 |
| | HSBC Holdings plc | 2.950% | 5/25/21 | 5,305 | 5,400 |
| | HSBC Holdings plc | 2.650% | 1/5/22 | 3,955 | 3,959 |
| 7 | HSBC Holdings plc | 3.262% | 3/13/23 | 28,265 | 28,831 |
| | HSBC Holdings plc | 3.600% | 5/25/23 | 7,765 | 8,077 |
| | HSBC Holdings plc | 4.375% | 11/23/26 | 985 | 1,026 |
| 7 | HSBC Holdings plc | 4.041% | 3/13/28 | 41,901 | 43,704 |
| | HSBC USA Inc. | 2.350% | 3/5/20 | 1,580 | 1,588 |
| | HSBC USA Inc. | 2.750% | 8/7/20 | 3,325 | 3,381 |
| | Huntington National Bank | 2.200% | 11/6/18 | 1,812 | 1,818 |
| | Huntington National Bank | 2.375% | 3/10/20 | 7,705 | 7,746 |
| | Huntington National Bank | 2.500% | 8/7/22 | 2,780 | 2,762 |
| 12 | ING Bank NV | 2.500% | 10/1/19 | 2,670 | 2,688 |
| | JPMorgan Chase & Co. | 1.700% | 3/1/18 | 2,400 | 2,401 |
| | JPMorgan Chase & Co. | 1.625% | 5/15/18 | 545 | 545 |
| | JPMorgan Chase & Co. | 2.250% | 1/23/20 | 28,352 | 28,491 |
| | JPMorgan Chase & Co. | 4.950% | 3/25/20 | 3,995 | 4,267 |
| | JPMorgan Chase & Co. | 2.750% | 6/23/20 | 4,475 | 4,560 |
| | JPMorgan Chase & Co. | 2.550% | 10/29/20 | 25,165 | 25,448 |
56
| | | | | |
| Institutional Intermediate-Term Bond Fund | | | | |
| |
| |
| |
| | | | | Face | Market |
| | | | Maturity | Amount | Value • |
| | | Coupon | Date | ($000) | ($000) |
| | JPMorgan Chase & Co. | 2.550% | 3/1/21 | 10,159 | 10,235 |
| | JPMorgan Chase & Co. | 2.295% | 8/15/21 | 6,720 | 6,700 |
| | JPMorgan Chase & Co. | 4.500% | 1/24/22 | 5,296 | 5,718 |
| | JPMorgan Chase & Co. | 3.250% | 9/23/22 | 3,140 | 3,240 |
| | JPMorgan Chase & Co. | 2.972% | 1/15/23 | 34,053 | 34,471 |
| 7 | JPMorgan Chase & Co. | 2.776% | 4/25/23 | 14,030 | 14,084 |
| | JPMorgan Chase & Co. | 2.700% | 5/18/23 | 5,337 | 5,319 |
| | JPMorgan Chase & Co. | 3.875% | 2/1/24 | 1,500 | 1,580 |
| | JPMorgan Chase & Co. | 3.625% | 5/13/24 | 3,350 | 3,478 |
| | JPMorgan Chase & Co. | 3.125% | 1/23/25 | 7,986 | 8,023 |
| 7 | JPMorgan Chase & Co. | 3.220% | 3/1/25 | 9,345 | 9,458 |
| | JPMorgan Chase & Co. | 3.900% | 7/15/25 | 8,000 | 8,381 |
| | JPMorgan Chase & Co. | 3.300% | 4/1/26 | 7,479 | 7,477 |
| 7 | JPMorgan Chase & Co. | 3.782% | 2/1/28 | 18,750 | 19,192 |
| 7 | JPMorgan Chase & Co. | 3.540% | 5/1/28 | 11,745 | 11,827 |
| | JPMorgan Chase Bank NA | 6.000% | 10/1/17 | 7,190 | 7,191 |
| | KeyBank NA | 1.650% | 2/1/18 | 2,400 | 2,400 |
| | KeyBank NA | 2.350% | 3/8/19 | 881 | 888 |
| | KeyBank NA | 2.500% | 11/22/21 | 1,860 | 1,869 |
| | Lloyds Bank plc | 2.700% | 8/17/20 | 1,545 | 1,568 |
| | Manufacturers & Traders Trust Co. | 2.300% | 1/30/19 | 6,062 | 6,093 |
| | Manufacturers & Traders Trust Co. | 2.500% | 5/18/22 | 4,195 | 4,199 |
| | Manufacturers & Traders Trust Co. | 3.400% | 8/17/27 | 5,365 | 5,372 |
| | Mitsubishi UFJ Financial Group Inc. | 2.950% | 3/1/21 | 38,650 | 39,260 |
| | Mitsubishi UFJ Financial Group Inc. | 2.190% | 9/13/21 | 3,880 | 3,830 |
| | Mitsubishi UFJ Financial Group Inc. | 2.998% | 2/22/22 | 2,975 | 3,013 |
| | Mitsubishi UFJ Financial Group Inc. | 2.665% | 7/25/22 | 15,770 | 15,742 |
| | Mitsubishi UFJ Financial Group Inc. | 2.527% | 9/13/23 | 825 | 812 |
| | Mitsubishi UFJ Financial Group Inc. | 3.677% | 2/22/27 | 10,000 | 10,283 |
| | Mitsubishi UFJ Financial Group Inc. | 3.287% | 7/25/27 | 3,665 | 3,651 |
| 12 | Mitsubishi UFJ Trust & Banking Corp. | 2.650% | 10/19/20 | 11,120 | 11,204 |
| | Mizuho Financial Group Inc. | 2.953% | 2/28/22 | 2,730 | 2,755 |
| | Morgan Stanley | 2.500% | 1/24/19 | 6,752 | 6,799 |
| | Morgan Stanley | 2.375% | 7/23/19 | 25,904 | 26,060 |
| | Morgan Stanley | 5.625% | 9/23/19 | 2,868 | 3,063 |
| | Morgan Stanley | 5.750% | 1/25/21 | 6,800 | 7,496 |
| | Morgan Stanley | 2.625% | 11/17/21 | 24,079 | 24,077 |
| | Morgan Stanley | 2.750% | 5/19/22 | 9,785 | 9,816 |
| 13 | Morgan Stanley | 2.532% | 5/8/24 | 6,885 | 6,970 |
| | Morgan Stanley | 3.700% | 10/23/24 | 6,138 | 6,349 |
| | Morgan Stanley | 3.875% | 1/27/26 | 1,110 | 1,146 |
| | Morgan Stanley | 3.625% | 1/20/27 | 8,090 | 8,167 |
| 7 | Morgan Stanley | 3.591% | 7/22/28 | 9,710 | 9,708 |
| | MUFG Americas Holdings Corp. | 3.500% | 6/18/22 | 6,290 | 6,498 |
| | MUFG Americas Holdings Corp. | 3.000% | 2/10/25 | 1,800 | 1,774 |
| | MUFG Union Bank NA | 2.625% | 9/26/18 | 1,460 | 1,472 |
| | National Australia Bank Ltd. | 2.300% | 7/25/18 | 3,140 | 3,156 |
| | National Australia Bank Ltd. | 2.000% | 1/14/19 | 728 | 729 |
| | National Australia Bank Ltd. | 2.500% | 5/22/22 | 6,775 | 6,735 |
| | National Bank of Canada | 2.100% | 12/14/18 | 2,525 | 2,531 |
| 12 | Nordea Bank AB | 1.625% | 9/30/19 | 3,535 | 3,511 |
| 12 | Nordea Bank AB | 2.500% | 9/17/20 | 1,865 | 1,877 |
| | PNC Bank NA | 2.200% | 1/28/19 | 3,300 | 3,318 |
| | PNC Bank NA | 2.600% | 7/21/20 | 5,115 | 5,186 |
57
| | | | | |
| Institutional Intermediate-Term Bond Fund | | | | |
| |
| |
| |
| | | | | Face | Market |
| | | | Maturity | Amount | Value • |
| | | Coupon | Date | ($000) | ($000) |
| | PNC Bank NA | 2.450% | 11/5/20 | 1,707 | 1,721 |
| | PNC Bank NA | 2.150% | 4/29/21 | 2,078 | 2,071 |
| | PNC Bank NA | 2.550% | 12/9/21 | 7,785 | 7,819 |
| | PNC Bank NA | 2.625% | 2/17/22 | 14,655 | 14,779 |
| | PNC Bank NA | 2.700% | 11/1/22 | 4,900 | 4,922 |
| | PNC Bank NA | 3.300% | 10/30/24 | 1,450 | 1,486 |
| | PNC Bank NA | 2.950% | 2/23/25 | 4,610 | 4,606 |
| | PNC Bank NA | 3.250% | 6/1/25 | 4,527 | 4,599 |
| | PNC Financial Services Group Inc. | 2.854% | 11/9/22 | 1,200 | 1,213 |
| | PNC Funding Corp. | 5.125% | 2/8/20 | 2,550 | 2,724 |
| | Royal Bank of Canada | 1.500% | 7/29/19 | 6,250 | 6,215 |
| | Santander UK plc | 3.050% | 8/23/18 | 3,410 | 3,446 |
| | Santander UK plc | 2.500% | 3/14/19 | 3,118 | 3,144 |
| | Santander UK plc | 2.350% | 9/10/19 | 3,950 | 3,973 |
| | Skandinaviska Enskilda Banken AB | 2.625% | 3/15/21 | 980 | 987 |
| | Skandinaviska Enskilda Banken AB | 1.875% | 9/13/21 | 7,465 | 7,303 |
| | State Street Corp. | 1.350% | 5/15/18 | 1,800 | 1,794 |
| | State Street Corp. | 3.300% | 12/16/24 | 1,790 | 1,844 |
| | State Street Corp. | 3.550% | 8/18/25 | 2,611 | 2,718 |
| | Sumitomo Mitsui Financial Group Inc. | 2.934% | 3/9/21 | 2,900 | 2,935 |
| | Sumitomo Mitsui Financial Group Inc. | 2.784% | 7/12/22 | 7,855 | 7,886 |
| | Sumitomo Mitsui Financial Group Inc. | 2.632% | 7/14/26 | 3,585 | 3,408 |
| | SunTrust Bank | 2.450% | 8/1/22 | 12,480 | 12,425 |
| | Svenska Handelsbanken AB | 2.450% | 3/30/21 | 11,675 | 11,743 |
| 12 | Swedbank AB | 2.375% | 2/27/19 | 3,770 | 3,792 |
| 12 | Swedbank AB | 2.800% | 3/14/22 | 7,485 | 7,565 |
| | Toronto-Dominion Bank | 1.450% | 8/13/19 | 700 | 696 |
| | Toronto-Dominion Bank | 2.500% | 12/14/20 | 6,580 | 6,658 |
| | Toronto-Dominion Bank | 2.125% | 4/7/21 | 9,125 | 9,098 |
| 12 | UBS Group Funding Jersey Ltd. | 3.000% | 4/15/21 | 5,270 | 5,327 |
| 12 | UBS Group Funding Jersey Ltd. | 2.650% | 2/1/22 | 22,609 | 22,513 |
| 12 | UBS Group Funding Switzerland AG | 3.491% | 5/23/23 | 2,060 | 2,104 |
| 7,12 UBS Group Funding Switzerland AG | 2.859% | 8/15/23 | 23,230 | 23,121 |
| | US Bancorp | 2.350% | 1/29/21 | 1,350 | 1,359 |
| | US Bancorp | 3.100% | 4/27/26 | 1,212 | 1,204 |
| | Wachovia Corp. | 5.750% | 2/1/18 | 6,740 | 6,830 |
| | Wells Fargo & Co. | 2.600% | 7/22/20 | 6,635 | 6,727 |
| | Wells Fargo & Co. | 3.000% | 1/22/21 | 2,240 | 2,289 |
| | Wells Fargo & Co. | 2.625% | 7/22/22 | 22,650 | 22,648 |
| | Wells Fargo & Co. | 3.450% | 2/13/23 | 7,460 | 7,637 |
| | Wells Fargo & Co. | 3.300% | 9/9/24 | 8,943 | 9,057 |
| | Wells Fargo & Co. | 3.000% | 2/19/25 | 6,300 | 6,241 |
| | Wells Fargo & Co. | 3.550% | 9/29/25 | 9,029 | 9,261 |
| | Wells Fargo & Co. | 3.000% | 4/22/26 | 13,750 | 13,491 |
| | Wells Fargo & Co. | 3.000% | 10/23/26 | 5,000 | 4,870 |
| 7 | Wells Fargo & Co. | 3.584% | 5/22/28 | 18,950 | 19,150 |
| | Wells Fargo Bank NA | 6.000% | 11/15/17 | 7,190 | 7,227 |
| | Wells Fargo Bank NA | 1.800% | 11/28/18 | 3,385 | 3,389 |
| | Wells Fargo Bank NA | 2.150% | 12/6/19 | 14,500 | 14,567 |
| | Westpac Banking Corp. | 2.250% | 7/30/18 | 5,575 | 5,597 |
| | Westpac Banking Corp. | 1.950% | 11/23/18 | 2,376 | 2,377 |
| | Westpac Banking Corp. | 4.875% | 11/19/19 | 7,190 | 7,608 |
| | Westpac Banking Corp. | 2.600% | 11/23/20 | 6,430 | 6,510 |
| | Westpac Banking Corp. | 2.100% | 5/13/21 | 7,555 | 7,476 |
58
| | | | | |
| Institutional Intermediate-Term Bond Fund | | | | |
| |
| |
| |
| | | | | Face | Market |
| | | | Maturity | Amount | Value • |
| | | Coupon | Date | ($000) | ($000) |
| | Westpac Banking Corp. | 2.000% | 8/19/21 | 7,665 | 7,548 |
| | Westpac Banking Corp. | 3.350% | 3/8/27 | 18,765 | 19,002 |
| |
| | Brokerage (0.2%) | | | | |
| | BlackRock Inc. | 3.200% | 3/15/27 | 8,310 | 8,409 |
| | Charles Schwab Corp. | 2.200% | 7/25/18 | 450 | 452 |
| | Charles Schwab Corp. | 4.450% | 7/22/20 | 1,350 | 1,438 |
| | Charles Schwab Corp. | 3.200% | 3/2/27 | 805 | 807 |
| | Invesco Finance plc | 3.125% | 11/30/22 | 4,490 | 4,581 |
| | Invesco Finance plc | 4.000% | 1/30/24 | 4,000 | 4,243 |
| | Invesco Finance plc | 3.750% | 1/15/26 | 3,060 | 3,165 |
| | TD Ameritrade Holding Corp. | 2.950% | 4/1/22 | 60 | 61 |
| | TD Ameritrade Holding Corp. | 3.625% | 4/1/25 | 3,220 | 3,328 |
| |
| | Finance Companies (0.2%) | | | | |
| | GE Capital International Funding Co. | 2.342% | 11/15/20 | 25,739 | 25,848 |
| | GE Capital International Funding Co. | 3.373% | 11/15/25 | 4,516 | 4,665 |
| |
| | Insurance (1.5%) | | | | |
| | Aetna Inc. | 2.750% | 11/15/22 | 1,700 | 1,704 |
| | Aetna Inc. | 2.800% | 6/15/23 | 2,050 | 2,054 |
| 12 | AIA Group Ltd. | 3.200% | 3/11/25 | 15,935 | 15,942 |
| 12 | AIG Global Funding | 2.700% | 12/15/21 | 2,340 | 2,356 |
| | Berkshire Hathaway Inc. | 2.750% | 3/15/23 | 15,430 | 15,583 |
| | Berkshire Hathaway Inc. | 3.125% | 3/15/26 | 13,295 | 13,405 |
| | Chubb INA Holdings Inc. | 2.875% | 11/3/22 | 6,693 | 6,801 |
| | Chubb INA Holdings Inc. | 2.700% | 3/13/23 | 1,000 | 1,001 |
| | Chubb INA Holdings Inc. | 3.350% | 5/15/24 | 3,860 | 3,991 |
| | Chubb INA Holdings Inc. | 3.150% | 3/15/25 | 984 | 1,001 |
| 12 | Jackson National Life Global Funding | 4.700% | 6/1/18 | 2,250 | 2,293 |
| | Manulife Financial Corp. | 4.900% | 9/17/20 | 6,695 | 7,193 |
| | Manulife Financial Corp. | 4.150% | 3/4/26 | 2,529 | 2,689 |
| | Marsh & McLennan Cos. Inc. | 4.800% | 7/15/21 | 4,820 | 5,206 |
| | Marsh & McLennan Cos. Inc. | 2.750% | 1/30/22 | 10,400 | 10,491 |
| | Marsh & McLennan Cos. Inc. | 3.500% | 6/3/24 | 1,995 | 2,055 |
| | Marsh & McLennan Cos. Inc. | 3.500% | 3/10/25 | 8,620 | 8,897 |
| | Marsh & McLennan Cos. Inc. | 3.750% | 3/14/26 | 3,982 | 4,154 |
| 12 | MassMutual Global Funding II | 2.750% | 6/22/24 | 21,965 | 21,800 |
| 12 | Metropolitan Life Global Funding I | 3.000% | 1/10/23 | 9,594 | 9,742 |
| 12 | Metropolitan Life Global Funding I | 3.450% | 12/18/26 | 8,725 | 8,951 |
| 12 | Metropolitan Life Global Funding I | 3.000% | 9/19/27 | 17,995 | 17,669 |
| 12 | New York Life Global Funding | 2.900% | 1/17/24 | 4,120 | 4,160 |
| | PartnerRe Finance B LLC | 5.500% | 6/1/20 | 1,740 | 1,867 |
| 12 | Pricoa Global Funding I | 2.550% | 11/24/20 | 2,130 | 2,149 |
| 12 | Pricoa Global Funding I | 2.450% | 9/21/22 | 3,940 | 3,934 |
| 12 | Reliance Standard Life Global Funding II | 3.050% | 1/20/21 | 1,270 | 1,281 |
| 12 | Swiss Re Treasury US Corp. | 2.875% | 12/6/22 | 6,555 | 6,561 |
| | UnitedHealth Group Inc. | 1.900% | 7/16/18 | 1,020 | 1,022 |
| | UnitedHealth Group Inc. | 2.700% | 7/15/20 | 1,010 | 1,029 |
| | UnitedHealth Group Inc. | 3.350% | 7/15/22 | 2,080 | 2,161 |
| | UnitedHealth Group Inc. | 2.875% | 3/15/23 | 2,700 | 2,742 |
| | UnitedHealth Group Inc. | 3.750% | 7/15/25 | 5,275 | 5,592 |
| | UnitedHealth Group Inc. | 3.450% | 1/15/27 | 7,500 | 7,722 |
| | UnitedHealth Group Inc. | 3.375% | 4/15/27 | 2,825 | 2,895 |
59
| | | | | |
| Institutional Intermediate-Term Bond Fund | | | | |
| |
| |
| |
| | | | | Face | Market |
| | | | Maturity | Amount | Value • |
| | | Coupon | Date | ($000) | ($000) |
| | Other Finance (0.1%) | | | | |
| | ORIX Corp. | 3.700% | 7/18/27 | 12,765 | 12,792 |
| |
| | Real Estate Investment Trusts (0.3%) | | | | |
| | AvalonBay Communities Inc. | 3.350% | 5/15/27 | 5,975 | 6,032 |
| | Camden Property Trust | 4.875% | 6/15/23 | 435 | 474 |
| | Camden Property Trust | 4.250% | 1/15/24 | 1,488 | 1,572 |
| | Camden Property Trust | 3.500% | 9/15/24 | 435 | 440 |
| | Federal Realty Investment Trust | 3.000% | 8/1/22 | 2,300 | 2,336 |
| | Federal Realty Investment Trust | 2.750% | 6/1/23 | 4,490 | 4,440 |
| | Federal Realty Investment Trust | 3.250% | 7/15/27 | 6,000 | 5,914 |
| | Public Storage | 3.094% | 9/15/27 | 11,755 | 11,715 |
| 12 | Scentre Group Trust 1 / Scentre Group Trust 2 | 3.750% | 3/23/27 | 6,205 | 6,283 |
| | Simon Property Group LP | 2.500% | 9/1/20 | 727 | 736 |
| | Simon Property Group LP | 4.375% | 3/1/21 | 4,400 | 4,673 |
| | Simon Property Group LP | 3.500% | 9/1/25 | 891 | 909 |
| | Simon Property Group LP | 3.300% | 1/15/26 | 894 | 896 |
| | | | | | 1,732,850 |
| Industrial (7.5%) | | | | |
| | Basic Industry (0.2%) | | | | |
| 12 | Air Liquide Finance SA | 1.750% | 9/27/21 | 16,586 | 16,184 |
| 12 | Air Liquide Finance SA | 2.250% | 9/27/23 | 5,020 | 4,848 |
| | Air Products & Chemicals Inc. | 2.750% | 2/3/23 | 1,040 | 1,038 |
| | Airgas Inc. | 2.900% | 11/15/22 | 2,575 | 2,607 |
| | Praxair Inc. | 4.050% | 3/15/21 | 2,800 | 2,967 |
| | Praxair Inc. | 2.450% | 2/15/22 | 1,840 | 1,848 |
| | Praxair Inc. | 2.200% | 8/15/22 | 1,120 | 1,108 |
| |
| | Capital Goods (1.4%) | | | | |
| | Caterpillar Financial Services Corp. | 2.100% | 1/10/20 | 6,290 | 6,286 |
| | Caterpillar Financial Services Corp. | 1.700% | 8/9/21 | 22,027 | 21,563 |
| | Caterpillar Financial Services Corp. | 2.850% | 6/1/22 | 6,000 | 6,128 |
| | Caterpillar Financial Services Corp. | 2.400% | 6/6/22 | 17,465 | 17,454 |
| | Caterpillar Financial Services Corp. | 3.750% | 11/24/23 | 5,365 | 5,677 |
| | Caterpillar Financial Services Corp. | 3.250% | 12/1/24 | 1,705 | 1,749 |
| | Caterpillar Inc. | 2.600% | 6/26/22 | 1,250 | 1,262 |
| | Deere & Co. | 2.600% | 6/8/22 | 5,220 | 5,274 |
| | Dover Corp. | 3.150% | 11/15/25 | 1,825 | 1,857 |
| | General Dynamics Corp. | 2.375% | 11/15/24 | 13,140 | 12,912 |
| | Hubbell Inc. | 3.150% | 8/15/27 | 5,695 | 5,688 |
| | Illinois Tool Works Inc. | 3.500% | 3/1/24 | 2,650 | 2,770 |
| | Illinois Tool Works Inc. | 2.650% | 11/15/26 | 14,415 | 14,056 |
| | John Deere Capital Corp. | 2.450% | 9/11/20 | 5,175 | 5,229 |
| | John Deere Capital Corp. | 2.800% | 3/4/21 | 3,475 | 3,537 |
| | John Deere Capital Corp. | 2.750% | 3/15/22 | 4,645 | 4,720 |
| | John Deere Capital Corp. | 2.800% | 1/27/23 | 1,925 | 1,960 |
| | John Deere Capital Corp. | 2.800% | 3/6/23 | 2,820 | 2,862 |
| | John Deere Capital Corp. | 2.650% | 6/24/24 | 10,000 | 9,937 |
| | John Deere Capital Corp. | 2.800% | 9/8/27 | 6,435 | 6,318 |
| | Parker-Hannifin Corp. | 3.500% | 9/15/22 | 1,885 | 1,970 |
| | Parker-Hannifin Corp. | 3.300% | 11/21/24 | 3,935 | 4,040 |
| 12 | Parker-Hannifin Corp. | 3.250% | 3/1/27 | 6,040 | 6,067 |
| | Precision Castparts Corp. | 2.500% | 1/15/23 | 8,650 | 8,661 |
| | Precision Castparts Corp. | 3.250% | 6/15/25 | 13,895 | 14,141 |
| 12 | Siemens Financieringsmaatschappij NV | 2.700% | 3/16/22 | 11,205 | 11,301 |
60
| | | | | |
| Institutional Intermediate-Term Bond Fund | | | | |
| |
| |
| |
| | | | | Face | Market |
| | | | Maturity | Amount | Value • |
| | | Coupon | Date | ($000) | ($000) |
| 12 | Siemens Financieringsmaatschappij NV | 3.125% | 3/16/24 | 3,445 | 3,501 |
| 12 | Siemens Financieringsmaatschappij NV | 2.350% | 10/15/26 | 8,770 | 8,233 |
| |
| | Communication (0.6%) | | | | |
| | America Movil SAB de CV | 5.000% | 10/16/19 | 1,800 | 1,908 |
| | America Movil SAB de CV | 5.000% | 3/30/20 | 4,800 | 5,121 |
| | America Movil SAB de CV | 3.125% | 7/16/22 | 7,364 | 7,535 |
| | Comcast Cable Communications Holdings | | | | |
| | Inc. | 9.455% | 11/15/22 | 1,530 | 2,029 |
| | Comcast Corp. | 5.875% | 2/15/18 | 2,100 | 2,133 |
| | Comcast Corp. | 5.700% | 5/15/18 | 2,220 | 2,276 |
| | Comcast Corp. | 2.850% | 1/15/23 | 2,700 | 2,738 |
| | Comcast Corp. | 3.600% | 3/1/24 | 3,600 | 3,772 |
| | Comcast Corp. | 3.375% | 2/15/25 | 7,885 | 8,082 |
| | Comcast Corp. | 3.375% | 8/15/25 | 12,018 | 12,345 |
| | NBCUniversal Media LLC | 5.150% | 4/30/20 | 8,090 | 8,737 |
| | NBCUniversal Media LLC | 2.875% | 1/15/23 | 25,090 | 25,435 |
| | Walt Disney Co. | 3.150% | 9/17/25 | 2,500 | 2,549 |
| |
| | Consumer Cyclical (1.1%) | | | | |
| | Alibaba Group Holding Ltd. | 3.125% | 11/28/21 | 1,030 | 1,050 |
| | American Honda Finance Corp. | 2.250% | 8/15/19 | 6,590 | 6,638 |
| | American Honda Finance Corp. | 2.450% | 9/24/20 | 2,225 | 2,255 |
| | American Honda Finance Corp. | 1.700% | 9/9/21 | 2,790 | 2,737 |
| | Automatic Data Processing Inc. | 3.375% | 9/15/25 | 475 | 491 |
| | Costco Wholesale Corp. | 2.750% | 5/18/24 | 3,180 | 3,183 |
| | Costco Wholesale Corp. | 3.000% | 5/18/27 | 3,945 | 3,950 |
| | Cummins Inc. | 3.650% | 10/1/23 | 1,350 | 1,419 |
| 12 | Harley-Davidson Financial Services Inc. | 2.250% | 1/15/19 | 7,090 | 7,100 |
| 12 | Harley-Davidson Financial Services Inc. | 2.400% | 9/15/19 | 1,475 | 1,480 |
| 12 | Harley-Davidson Financial Services Inc. | 2.150% | 2/26/20 | 1,089 | 1,084 |
| | Harley-Davidson Inc. | 3.500% | 7/28/25 | 7,465 | 7,632 |
| | Lowe’s Cos. Inc. | 4.625% | 4/15/20 | 2,070 | 2,176 |
| | Lowe’s Cos. Inc. | 3.120% | 4/15/22 | 4,440 | 4,587 |
| | Lowe’s Cos. Inc. | 3.375% | 9/15/25 | 775 | 797 |
| | Lowe’s Cos. Inc. | 2.500% | 4/15/26 | 18,500 | 17,709 |
| | Lowe’s Cos. Inc. | 3.100% | 5/3/27 | 7,265 | 7,227 |
| | Mastercard Inc. | 3.375% | 4/1/24 | 7,714 | 8,035 |
| 12 | Nissan Motor Acceptance Corp. | 2.550% | 3/8/21 | 5,415 | 5,442 |
| 12 | Nissan Motor Acceptance Corp. | 2.600% | 9/28/22 | 2,595 | 2,598 |
| | PACCAR Financial Corp. | 1.750% | 8/14/18 | 740 | 741 |
| | PACCAR Financial Corp. | 2.200% | 9/15/19 | 450 | 453 |
| | Starbucks Corp. | 2.100% | 2/4/21 | 1,980 | 1,982 |
| | Starbucks Corp. | 2.450% | 6/15/26 | 3,645 | 3,500 |
| | TJX Cos. Inc. | 2.750% | 6/15/21 | 1,650 | 1,678 |
| | TJX Cos. Inc. | 2.500% | 5/15/23 | 900 | 896 |
| | TJX Cos. Inc. | 2.250% | 9/15/26 | 2,650 | 2,461 |
| | Visa Inc. | 2.200% | 12/14/20 | 4,465 | 4,505 |
| | Visa Inc. | 2.150% | 9/15/22 | 6,680 | 6,654 |
| | Visa Inc. | 2.800% | 12/14/22 | 7,090 | 7,247 |
| | Visa Inc. | 3.150% | 12/14/25 | 17,825 | 18,198 |
| | Wal-Mart Stores Inc. | 3.625% | 7/8/20 | 1,365 | 1,430 |
| | Wal-Mart Stores Inc. | 3.250% | 10/25/20 | 1,485 | 1,543 |
| | Wal-Mart Stores Inc. | 4.250% | 4/15/21 | 2,852 | 3,061 |
| | Wal-Mart Stores Inc. | 2.550% | 4/11/23 | 6,290 | 6,353 |
61
| | | | | |
| Institutional Intermediate-Term Bond Fund | | | | |
| |
| |
| |
| | | | | Face | Market |
| | | | Maturity | Amount | Value • |
| | | Coupon | Date | ($000) | ($000) |
| | Consumer Noncyclical (1.1%) | | | | |
| | Anheuser-Busch Cos. LLC | 5.500% | 1/15/18 | 5,840 | 5,906 |
| | Anheuser-Busch InBev Finance Inc. | 1.250% | 1/17/18 | 970 | 969 |
| | Anheuser-Busch InBev Finance Inc. | 2.150% | 2/1/19 | 2,050 | 2,062 |
| | Anheuser-Busch InBev Finance Inc. | 2.650% | 2/1/21 | 6,300 | 6,402 |
| | Anheuser-Busch InBev Finance Inc. | 2.625% | 1/17/23 | 2,355 | 2,368 |
| | Anheuser-Busch InBev Finance Inc. | 3.300% | 2/1/23 | 3,700 | 3,835 |
| | Anheuser-Busch InBev Finance Inc. | 3.650% | 2/1/26 | 17,300 | 17,898 |
| | Anheuser-Busch InBev Worldwide Inc. | 5.375% | 1/15/20 | 1,990 | 2,139 |
| | Anheuser-Busch InBev Worldwide Inc. | 2.500% | 7/15/22 | 2,725 | 2,746 |
| | Coca-Cola Femsa SAB de CV | 2.375% | 11/26/18 | 1,155 | 1,157 |
| | Coca-Cola Femsa SAB de CV | 3.875% | 11/26/23 | 1,350 | 1,422 |
| | Covidien International Finance SA | 4.200% | 6/15/20 | 4,126 | 4,362 |
| | Gilead Sciences Inc. | 3.700% | 4/1/24 | 27,530 | 28,986 |
| | Gilead Sciences Inc. | 3.500% | 2/1/25 | 16,095 | 16,724 |
| | Kaiser Foundation Hospitals | 3.500% | 4/1/22 | 1,105 | 1,150 |
| | Kimberly-Clark Corp. | 3.625% | 8/1/20 | 630 | 655 |
| | Medtronic Global Holdings SCA | 3.350% | 4/1/27 | 10,450 | 10,686 |
| | Medtronic Inc. | 5.600% | 3/15/19 | 1,800 | 1,893 |
| | Medtronic Inc. | 3.150% | 3/15/22 | 12,000 | 12,411 |
| | Medtronic Inc. | 3.625% | 3/15/24 | 2,030 | 2,135 |
| | Medtronic Inc. | 3.500% | 3/15/25 | 15,370 | 16,001 |
| | PepsiCo Inc. | 4.500% | 1/15/20 | 2,250 | 2,383 |
| | PepsiCo Inc. | 2.850% | 2/24/26 | 2,615 | 2,599 |
| 12 | Reckitt Benckiser Treasury Services plc | 2.750% | 6/26/24 | 11,000 | 10,906 |
| 12 | Roche Holdings Inc. | 2.875% | 9/29/21 | 1,590 | 1,629 |
| |
| | Energy (1.4%) | | | | |
| | BP Capital Markets plc | 1.375% | 5/10/18 | 1,800 | 1,799 |
| | BP Capital Markets plc | 2.241% | 9/26/18 | 3,780 | 3,803 |
| | BP Capital Markets plc | 4.750% | 3/10/19 | 7,640 | 7,962 |
| | BP Capital Markets plc | 4.500% | 10/1/20 | 4,040 | 4,309 |
| | BP Capital Markets plc | 3.561% | 11/1/21 | 2,047 | 2,139 |
| | BP Capital Markets plc | 3.062% | 3/17/22 | 915 | 937 |
| | BP Capital Markets plc | 3.245% | 5/6/22 | 2,600 | 2,691 |
| | BP Capital Markets plc | 2.500% | 11/6/22 | 3,140 | 3,135 |
| | BP Capital Markets plc | 2.750% | 5/10/23 | 11,500 | 11,480 |
| | BP Capital Markets plc | 3.994% | 9/26/23 | 900 | 963 |
| | BP Capital Markets plc | 3.814% | 2/10/24 | 10,790 | 11,343 |
| | BP Capital Markets plc | 3.224% | 4/14/24 | 7,250 | 7,385 |
| | BP Capital Markets plc | 3.535% | 11/4/24 | 5,915 | 6,122 |
| | BP Capital Markets plc | 3.506% | 3/17/25 | 8,000 | 8,250 |
| | BP Capital Markets plc | 3.119% | 5/4/26 | 6,600 | 6,594 |
| | BP Capital Markets plc | 3.279% | 9/19/27 | 11,000 | 10,968 |
| | Chevron Corp. | 2.193% | 11/15/19 | 450 | 454 |
| | Dominion Energy Gas Holdings LLC | 2.500% | 12/15/19 | 2,690 | 2,713 |
| | Dominion Energy Gas Holdings LLC | 2.800% | 11/15/20 | 2,685 | 2,722 |
| | Exxon Mobil Corp. | 2.397% | 3/6/22 | 1,100 | 1,105 |
| | Occidental Petroleum Corp. | 1.500% | 2/15/18 | 2,250 | 2,251 |
| | Occidental Petroleum Corp. | 4.100% | 2/1/21 | 5,815 | 6,142 |
| | Occidental Petroleum Corp. | 3.125% | 2/15/22 | 2,695 | 2,760 |
| | Occidental Petroleum Corp. | 2.700% | 2/15/23 | 1,800 | 1,807 |
| | Shell International Finance BV | 4.375% | 3/25/20 | 1,840 | 1,953 |
| | Shell International Finance BV | 3.400% | 8/12/23 | 5,000 | 5,222 |
| | Shell International Finance BV | 3.250% | 5/11/25 | 23,950 | 24,479 |
62
| | | | |
| Institutional Intermediate-Term Bond Fund | | | | |
| |
| |
| |
| | | | Face | Market |
| | | Maturity | Amount | Value • |
| | Coupon | Date | ($000) | ($000) |
| Shell International Finance BV | 2.875% | 5/10/26 | 15,500 | 15,411 |
| Total Capital Canada Ltd. | 2.750% | 7/15/23 | 2,700 | 2,730 |
| Total Capital International SA | 2.875% | 2/17/22 | 4,040 | 4,118 |
| Total Capital International SA | 2.700% | 1/25/23 | 1,350 | 1,362 |
| Total Capital International SA | 3.700% | 1/15/24 | 6,000 | 6,325 |
| Total Capital SA | 4.450% | 6/24/20 | 4,670 | 4,985 |
| Total Capital SA | 4.125% | 1/28/21 | 805 | 856 |
| TransCanada PipeLines Ltd. | 2.500% | 8/1/22 | 1,200 | 1,199 |
| TransCanada PipeLines Ltd. | 3.750% | 10/16/23 | 640 | 675 |
| TransCanada PipeLines Ltd. | 4.875% | 1/15/26 | 10,651 | 11,937 |
| |
| Technology (1.4%) | | | | |
| Apple Inc. | 2.000% | 5/6/20 | 3,705 | 3,722 |
| Apple Inc. | 2.250% | 2/23/21 | 1,500 | 1,510 |
| Apple Inc. | 2.850% | 5/6/21 | 5,840 | 6,002 |
| Apple Inc. | 2.150% | 2/9/22 | 895 | 893 |
| Apple Inc. | 2.850% | 2/23/23 | 4,780 | 4,877 |
| Apple Inc. | 2.400% | 5/3/23 | 3,590 | 3,582 |
| Apple Inc. | 3.000% | 2/9/24 | 3,210 | 3,282 |
| Apple Inc. | 3.450% | 5/6/24 | 5,385 | 5,643 |
| Apple Inc. | 2.850% | 5/11/24 | 11,855 | 12,002 |
| Apple Inc. | 2.500% | 2/9/25 | 5,060 | 4,985 |
| Apple Inc. | 3.200% | 5/13/25 | 1,360 | 1,393 |
| Apple Inc. | 3.250% | 2/23/26 | 7,145 | 7,323 |
| Apple Inc. | 3.350% | 2/9/27 | 9,795 | 10,078 |
| Apple Inc. | 3.000% | 6/20/27 | 1,710 | 1,709 |
| Applied Materials Inc. | 2.625% | 10/1/20 | 4,735 | 4,818 |
| Applied Materials Inc. | 3.900% | 10/1/25 | 427 | 455 |
| Baidu Inc. | 3.250% | 8/6/18 | 7,075 | 7,154 |
| Cisco Systems Inc. | 4.450% | 1/15/20 | 590 | 624 |
| Cisco Systems Inc. | 2.200% | 9/20/23 | 2,210 | 2,176 |
| Cisco Systems Inc. | 2.950% | 2/28/26 | 4,290 | 4,321 |
| Cisco Systems Inc. | 2.500% | 9/20/26 | 2,210 | 2,138 |
| Intel Corp. | 2.350% | 5/11/22 | 2,670 | 2,678 |
| Intel Corp. | 2.875% | 5/11/24 | 9,255 | 9,339 |
| Microsoft Corp. | 2.375% | 2/12/22 | 445 | 449 |
| Microsoft Corp. | 2.650% | 11/3/22 | 700 | 712 |
| Microsoft Corp. | 2.875% | 2/6/24 | 18,220 | 18,582 |
| Microsoft Corp. | 2.700% | 2/12/25 | 2,685 | 2,695 |
| Microsoft Corp. | 3.300% | 2/6/27 | 11,090 | 11,456 |
| Oracle Corp. | 2.375% | 1/15/19 | 2,920 | 2,948 |
| Oracle Corp. | 2.500% | 5/15/22 | 8,180 | 8,293 |
| Oracle Corp. | 3.400% | 7/8/24 | 4,000 | 4,173 |
| Oracle Corp. | 2.950% | 5/15/25 | 4,295 | 4,329 |
| Oracle Corp. | 2.650% | 7/15/26 | 1,915 | 1,870 |
| QUALCOMM Inc. | 2.600% | 1/30/23 | 15,210 | 15,251 |
| QUALCOMM Inc. | 2.900% | 5/20/24 | 17,100 | 17,178 |
| QUALCOMM Inc. | 3.250% | 5/20/27 | 14,725 | 14,842 |
| |
| Transportation (0.3%) | | | | |
| Burlington Northern Santa Fe LLC | 3.450% | 9/15/21 | 1,185 | 1,231 |
| Burlington Northern Santa Fe LLC | 3.000% | 3/15/23 | 5,093 | 5,208 |
| Burlington Northern Santa Fe LLC | 3.850% | 9/1/23 | 11,041 | 11,796 |
| Burlington Northern Santa Fe LLC | 3.400% | 9/1/24 | 9,470 | 9,835 |
63
| | | | | |
| Institutional Intermediate-Term Bond Fund | | | | |
| |
| |
| |
| | | | | Face | Market |
| | | | Maturity | Amount | Value • |
| | | Coupon | Date | ($000) | ($000) |
| 7 | CSX Transportation Inc. | 6.251% | 1/15/23 | 1,164 | 1,332 |
| 7 | Delta Air Lines 2007-1 Class A Pass | | | | |
| | Through Trust | 6.821% | 2/10/24 | 4,593 | 5,293 |
| 7 | Northwest Airlines 2007-1 Class A | | | | |
| | Pass Through Trust | 7.027% | 5/1/21 | 3,146 | 3,426 |
| 7 | Southwest Airlines Co. 2007-1 Pass | | | | |
| | Through Trust | 6.150% | 2/1/24 | 3,402 | 3,730 |
| 7 | United Airlines 2013-1 Class A Pass | | | | |
| | Through Trust | 4.300% | 2/15/27 | 1,168 | 1,236 |
| | | | | | 1,055,784 |
| Utilities (0.8%) | | | | |
| | Electric (0.8%) | | | | |
| 12 | AEP Transmission Co. LLC | 3.100% | 12/1/26 | 1,590 | 1,593 |
| | Ameren Illinois Co. | 2.700% | 9/1/22 | 1,827 | 1,846 |
| | Baltimore Gas & Electric Co. | 2.800% | 8/15/22 | 950 | 955 |
| | Commonwealth Edison Co. | 3.400% | 9/1/21 | 8,700 | 9,021 |
| | Commonwealth Edison Co. | 2.550% | 6/15/26 | 880 | 851 |
| | Connecticut Light & Power Co. | 5.500% | 2/1/19 | 2,125 | 2,220 |
| | Connecticut Light & Power Co. | 2.500% | 1/15/23 | 5,550 | 5,538 |
| | Duke Energy Florida LLC | 4.550% | 4/1/20 | 1,375 | 1,458 |
| | Entergy Arkansas Inc. | 3.700% | 6/1/24 | 1,603 | 1,676 |
| | Entergy Arkansas Inc. | 3.500% | 4/1/26 | 9,180 | 9,429 |
| | Entergy Louisiana LLC | 3.300% | 12/1/22 | 1,300 | 1,337 |
| | Entergy Louisiana LLC | 2.400% | 10/1/26 | 4,920 | 4,676 |
| | Entergy Louisiana LLC | 3.120% | 9/1/27 | 3,060 | 3,072 |
| | Georgia Power Co. | 2.400% | 4/1/21 | 8,665 | 8,675 |
| | Georgia Power Co. | 2.850% | 5/15/22 | 2,735 | 2,774 |
| | Georgia Power Co. | 3.250% | 3/30/27 | 4,950 | 4,937 |
| | MidAmerican Energy Co. | 5.300% | 3/15/18 | 3,326 | 3,384 |
| | National Rural Utilities Cooperative | | | | |
| | Finance Corp. | 10.375% | 11/1/18 | 3,477 | 3,785 |
| | National Rural Utilities Cooperative | | | | |
| | Finance Corp. | 2.950% | 2/7/24 | 1,115 | 1,120 |
| | Oncor Electric Delivery Co. LLC | 7.000% | 9/1/22 | 4,180 | 4,998 |
| | PacifiCorp | 5.500% | 1/15/19 | 2,665 | 2,787 |
| | Sierra Pacific Power Co. | 3.375% | 8/15/23 | 5,740 | 5,934 |
| | Southwestern Public Service Co. | 3.300% | 6/15/24 | 13,616 | 14,009 |
| | Virginia Electric & Power Co. | 2.950% | 1/15/22 | 7,700 | 7,847 |
| | Virginia Electric & Power Co. | 2.950% | 11/15/26 | 975 | 967 |
| | Westar Energy Inc. | 2.550% | 7/1/26 | 5,745 | 5,546 |
| | Westar Energy Inc. | 3.100% | 4/1/27 | 5,930 | 5,952 |
| |
| | Natural Gas (0.0%) | | | | |
| 12 | Engie SA | 2.875% | 10/10/22 | 1,305 | 1,319 |
| | | | | | 117,706 |
| Total Corporate Bonds (Cost $2,886,153) | | | | 2,906,340 |
| Sovereign Bonds (6.4%) | | | | |
| | Asian Development Bank | 1.750% | 1/10/20 | 17,875 | 17,895 |
| 12 | Avi Funding Co. Ltd. | 2.850% | 9/16/20 | 9,400 | 9,396 |
| 12 | Banco del Estado de Chile | 2.000% | 11/9/17 | 1,450 | 1,446 |
| 12 | Bank Nederlandse Gemeenten NV | 1.500% | 2/15/19 | 20,500 | 20,440 |
| 12 | Bermuda | 4.854% | 2/6/24 | 2,725 | 2,975 |
| | Bermuda | 4.854% | 2/6/24 | 7,700 | 8,408 |
| | CDP Financial Inc. | 4.400% | 11/25/19 | 12,055 | 12,681 |
64
| | | | | |
| Institutional Intermediate-Term Bond Fund | | | | |
| |
| |
| |
| | | | | Face | Market |
| | | | Maturity | Amount | Value • |
| | | Coupon | Date | ($000) | ($000) |
| 12 | CDP Financial Inc. | 4.400% | 11/25/19 | 18,235 | 19,185 |
| 12 | CDP Financial Inc. | 3.150% | 7/24/24 | 1,269 | 1,303 |
| | CNOOC Finance 2013 Ltd. | 1.750% | 5/9/18 | 5,860 | 5,854 |
| 12 | CNPC General Capital Ltd. | 3.400% | 4/16/23 | 800 | 817 |
| | Corp. Andina de Fomento | 2.200% | 7/18/20 | 5,229 | 5,235 |
| | Corp. Andina de Fomento | 4.375% | 6/15/22 | 7,161 | 7,722 |
| 12 | Corp. Nacional del Cobre de Chile | 3.875% | 11/3/21 | 2,950 | 3,085 |
| | Corp. Nacional del Cobre de Chile | 3.875% | 11/3/21 | 1,300 | 1,360 |
| | CPPIB Capital Inc. | 1.250% | 9/20/19 | 10,000 | 9,898 |
| 12 | CPPIB Capital Inc. | 1.250% | 9/20/19 | 17,700 | 17,528 |
| 12 | CPPIB Capital Inc. | 2.250% | 1/25/22 | 56,520 | 56,764 |
| 15 | Development Bank of Japan Inc. | 2.750% | 9/16/25 | 7,580 | 7,610 |
| 12,16 | Dexia Credit Local SA | 1.875% | 9/15/21 | 13,260 | 12,987 |
| 12 | Dexia Credit Local SA | 2.375% | 9/20/22 | 15,310 | 15,239 |
| 12 | Electricite de France SA | 3.625% | 10/13/25 | 9,110 | 9,356 |
| | European Investment Bank | 1.625% | 12/15/20 | 35,715 | 35,439 |
| | European Investment Bank | 4.000% | 2/16/21 | 9,100 | 9,722 |
| | European Investment Bank | 2.500% | 4/15/21 | 7,275 | 7,417 |
| | Export-Import Bank of Korea | 1.750% | 2/27/18 | 3,935 | 3,932 |
| | Export-Import Bank of Korea | 2.250% | 1/21/20 | 5,390 | 5,365 |
| | Export-Import Bank of Korea | 5.125% | 6/29/20 | 5,000 | 5,332 |
| | Export-Import Bank of Korea | 4.000% | 1/29/21 | 2,550 | 2,648 |
| | Export-Import Bank of Korea | 4.375% | 9/15/21 | 9,364 | 9,896 |
| | Export-Import Bank of Korea | 1.875% | 10/21/21 | 8,870 | 8,543 |
| | Export-Import Bank of Korea | 4.000% | 1/14/24 | 2,000 | 2,104 |
| 12 | ICBCIL Finance Co. Ltd. | 2.375% | 5/19/19 | 8,000 | 7,945 |
| | Industrial & Commercial Bank of China Ltd. | 3.231% | 11/13/19 | 1,000 | 1,013 |
| | Inter-American Development Bank | 3.875% | 2/14/20 | 4,550 | 4,776 |
| | Inter-American Development Bank | 3.000% | 2/21/24 | 3,250 | 3,390 |
| 15 | Japan Bank for International Cooperation | 1.750% | 11/13/18 | 2,725 | 2,722 |
| 15 | Japan Bank for International Cooperation | 1.750% | 11/13/18 | 9,170 | 9,165 |
| 15 | Japan Bank for International Cooperation | 2.125% | 2/7/19 | 2,725 | 2,735 |
| 15 | Japan Bank for International Cooperation | 2.250% | 2/24/20 | 27,500 | 27,602 |
| 15 | Japan Bank for International Cooperation | 2.125% | 7/21/20 | 10,085 | 10,097 |
| 17 | KFW | 1.000% | 6/11/18 | 5,225 | 5,208 |
| | Kingdom of Saudi Arabia | 2.375% | 10/26/21 | 5,800 | 5,722 |
| | Kingdom of Saudi Arabia | 2.875% | 3/4/23 | 4,620 | 4,607 |
| 13 | Korea Development Bank | 1.999% | 9/19/20 | 8,000 | 7,989 |
| | Korea Development Bank | 2.500% | 1/13/21 | 4,750 | 4,708 |
| | Korea East-West Power Co. Ltd. | 2.625% | 11/27/18 | 4,755 | 4,778 |
| 12 | Korea Gas Corp. | 2.875% | 7/29/18 | 3,650 | 3,673 |
| | KSA Sukuk Ltd. | 2.894% | 4/20/22 | 13,760 | 13,825 |
| 12 | Municipality Finance plc | 1.125% | 4/17/18 | 2,275 | 2,269 |
| 12 | Nederlandse Waterschapsbank NV | 1.875% | 3/13/19 | 1,800 | 1,804 |
| 12 | Nederlandse Waterschapsbank NV | 1.250% | 9/9/19 | 32,000 | 31,663 |
| | North American Development Bank | 2.300% | 10/10/18 | 3,750 | 3,764 |
| 12 | Ontario Teachers’ Cadillac Fairview | | | | |
| | Properties Trust | 3.125% | 3/20/22 | 7,000 | 7,138 |
| 12 | Ontario Teachers’ Cadillac Fairview | | | | |
| | Properties Trust | 3.875% | 3/20/27 | 6,600 | 6,812 |
| | Province of Alberta | 1.900% | 12/6/19 | 15,000 | 14,949 |
| 12 | Province of Alberta | 1.750% | 8/26/20 | 1,500 | 1,478 |
| 12 | Province of Alberta | 2.050% | 8/17/26 | 5,000 | 4,694 |
| | Province of Manitoba | 2.100% | 9/6/22 | 1,900 | 1,877 |
| | Province of New Brunswick | 2.750% | 6/15/18 | 1,145 | 1,155 |
65
| | | | | |
| Institutional Intermediate-Term Bond Fund | | | | |
| |
| |
| |
| | | | | Face | Market |
| | | | Maturity | Amount | Value • |
| | | Coupon | Date | ($000) | ($000) |
| | Province of Ontario | 1.100% | 10/25/17 | 11,625 | 11,628 |
| | Province of Ontario | 1.200% | 2/14/18 | 2,275 | 2,273 |
| | Province of Ontario | 3.000% | 7/16/18 | 11,926 | 12,025 |
| | Province of Ontario | 1.625% | 1/18/19 | 42,130 | 41,931 |
| | Province of Ontario | 4.000% | 10/7/19 | 5,475 | 5,679 |
| | Province of Ontario | 4.400% | 4/14/20 | 18,760 | 19,771 |
| | Province of Ontario | 2.500% | 4/27/26 | 1,135 | 1,116 |
| | Province of Quebec | 3.500% | 7/29/20 | 10,575 | 10,920 |
| 11 | Province of Quebec | 1.456% | 9/21/20 | 18,400 | 18,400 |
| | Province of Quebec | 2.750% | 8/25/21 | 9,225 | 9,346 |
| | Province of Quebec | 7.500% | 7/15/23 | 1,335 | 1,653 |
| | Province of Quebec | 7.125% | 2/9/24 | 670 | 827 |
| | Province of Quebec | 2.750% | 4/12/27 | 8,020 | 7,951 |
| | Province of Quebec | 7.500% | 9/15/29 | 13,835 | 19,647 |
| 7,12 Ras Laffan Liquefied Natural Gas Co. Ltd. II | 5.298% | 9/30/20 | 388 | 401 |
| | Republic of Chile | 2.250% | 10/30/22 | 30,000 | 29,879 |
| | Republic of Korea | 7.125% | 4/16/19 | 3,175 | 3,413 |
| | Republic of Lithuania | 7.375% | 2/11/20 | 39,635 | 44,431 |
| | Republic of Lithuania | 6.125% | 3/9/21 | 1,815 | 2,036 |
| | Republic of Poland | 5.125% | 4/21/21 | 10,205 | 11,187 |
| | Republic of Poland | 5.000% | 3/23/22 | 26,142 | 28,920 |
| 12 | Republic of Slovakia | 4.375% | 5/21/22 | 2,275 | 2,483 |
| | Republic of Slovenia | 5.500% | 10/26/22 | 2,025 | 2,308 |
| 12 | Sinopec Group Overseas Development | | | | |
| | 2017 Ltd. | 2.375% | 4/12/20 | 9,110 | 9,107 |
| | State of Israel | 2.875% | 3/16/26 | 15,265 | 15,358 |
| | State of Kuwait | 2.750% | 3/20/22 | 6,563 | 6,634 |
| | State of Qatar | 5.250% | 1/20/20 | 24,000 | 25,454 |
| | Statoil ASA | 5.250% | 4/15/19 | 4,550 | 4,777 |
| | Statoil ASA | 3.150% | 1/23/22 | 7,065 | 7,273 |
| | Statoil ASA | 2.450% | 1/17/23 | 1,825 | 1,819 |
| | Statoil ASA | 3.700% | 3/1/24 | 6,300 | 6,629 |
| 12 | Temasek Financial I Ltd. | 2.375% | 1/23/23 | 1,750 | 1,751 |
| Total Sovereign Bonds (Cost $898,375) | | | | 902,167 |
| Taxable Municipal Bonds (0.0%) | | | | |
| | Florida Hurricane Catastrophe Fund Finance | | | | |
| | Corp. Revenue | 2.995% | 7/1/20 | 2,050 | 2,090 |
| | Louisiana Local Government Environmental | | | | |
| | Facilities & Community Development | | | | |
| | Authority Revenue 2010-EGSL | 3.220% | 2/1/21 | 1,231 | 1,238 |
| | Louisiana Local Government Environmental | | | | |
| | Facilities & Community Development | | | | |
| | Authority Revenue 2010-ELL | 3.450% | 2/1/22 | 1,075 | 1,092 |
| | University of California Revenue | 2.054% | 5/15/18 | 900 | 903 |
| Total Taxable Municipal Bonds (Cost $5,256) | | | | 5,323 |
66
| | | | |
| Institutional Intermediate-Term Bond Fund | | | | |
| |
| |
| |
| | | | | Market |
| | | | | Value• |
| | Coupon | | Shares | ($000) |
| Temporary Cash Investments (8.2%) | | | | |
| Money Market Fund (8.1%) | | | | |
| 18 Vanguard Market Liquidity Fund | 1.223% | | 11,445,760 | 1,144,805 |
| |
| | | | Face | |
| | | Maturity | Amount | |
| | | Date | ($000) | |
| Commercial Paper (0.1%) | | | | |
| 19 Electricite de France | 1.995% | 1/5/18 | 10,000 | 9,957 |
| Total Temporary Cash Investments (Cost $1,154,642) | | | 1,154,762 |
| Total Investments (107.3%) (Cost $15,144,131) | | | | 15,138,205 |
| Other Assets and Liabilities (-7.3%) | | | | |
| Other Assets | | | | 1,171,988 |
| Liabilities | | | | (2,204,639) |
| | | | | (1,032,651) |
| Net Assets (100%) | | | | |
| Applicable to 610,082,606 outstanding $.001 par value shares of | | | |
| beneficial interest (unlimited authorization) | | | | 14,105,554 |
| Net Asset Value Per Share | | | | $23.12 |
| |
| | | | | Amount |
| | | | | ($000) |
| Statement of Assets and Liabilities | | | | |
| Assets | | | | |
| Investments in Securities, at Value | | | | |
| Unaffiliated Issuers (excluding Segregated Securities) | | | 13,982,189 |
| Collateral for To Be Announced (TBA) Transactions | | | 2,105 |
| Collateral for Futures Contracts | | | | 8,413 |
| Collateral for Swap Contracts | | | | 693 |
| Total Unaffiliated Issuers | | | | 13,993,400 |
| Affiliated Vanguard Funds | | | | 1,144,805 |
| Total Investments in Securities | | | | 15,138,205 |
| Investment in Vanguard | | | | 900 |
| Receivables for Investment Securities Sold | | | | 1,108,645 |
| Receivables for Accrued Income | | | | 58,863 |
| Variation Margin Receivable—Futures Contracts | | | | 879 |
| Variation Margin Receivable—Swap Contracts | | | | 63 |
| Other Assets | | | | 2,638 |
| Total Assets | | | | 16,310,193 |
| Liabilities | | | | |
| Payables for Investment Securities Purchased | | | | 2,195,478 |
| Payables to Vanguard | | | | 1,604 |
| Variation Margin Payable—Futures Contracts | | | | 3,271 |
| Variation Margin Payable—Swap Contracts | | | | 79 |
| Unrealized Depreciation—Swap Contracts | | | | 319 |
| Other Liabilities | | | | 3,888 |
| Total Liabilities | | | | 2,204,639 |
| Net Assets | | | | 14,105,554 |
67
| |
| Institutional Intermediate-Term Bond Fund | |
| |
| |
| |
| At September 30, 2017, net assets consisted of: | |
| | Amount |
| | ($000) |
| Paid-in Capital | 14,153,261 |
| Undistributed Net Investment Income | 251 |
| Accumulated Net Realized Losses | (36,516) |
| Unrealized Appreciation (Depreciation) | |
| Investment Securities | (5,926) |
| Futures Contracts | (5,176) |
| Swap Contracts | (340) |
| Net Assets | 14,105,554 |
• See Note A in Notes to Financial Statements.
1 Securities with a value of $2,105,000 have been segregated as collateral for certain open To Be Announced (TBA) transactions.
2 Securities with a value of $8,413,000 have been segregated as initial margin for open futures contracts.
3 Securities with a value of $693,000 have been segregated as initial margin for open cleared swap contracts.
4 U.S. government-guaranteed.
5 The issuer operates under a congressional charter; its securities are generally neither guaranteed by the U.S. Treasury nor backed
by the full faith and credit of the U.S. government.
6 The issuer was placed under federal conservatorship in September 2008; since that time, its daily operations have been managed
by the Federal Housing Finance Agency and it receives capital from the U.S. Treasury, as needed to maintain a positive net worth,
in exchange for senior preferred stock.
7 The average or expected maturity is shorter than the final maturity shown because of the possibility of interim principal payments
and prepayments or the possibility of the issue being called.
8 Includes securities purchased on a when-issued or delayed-delivery basis for which the fund has not taken delivery as of
September 30, 2017.
9 Adjustable-rate security based upon one-year Constant Maturity Treasury yield plus spread.
10 Adjustable-rate security based upon 12-month USD LIBOR plus spread.
11 Adjustable-rate security based upon 1-month USD LIBOR plus spread.
12 Security exempt from registration under Rule 144A of the Securities Act of 1933. Such securities may be sold in transactions
exempt from registration, normally to qualified institutional buyers. At September 30, 2017, the aggregate value of these
securities was $1,285,668,000, representing 9.1% of net assets.
13 Adjustable-rate security based upon 3-month USD LIBOR plus spread.
14 Security value determined using significant unobservable inputs.
15 Guaranteed by the Government of Japan.
16 Guaranteed by multiple countries.
17 Guaranteed by the Federal Republic of Germany.
18 Affiliated money market fund available only to Vanguard funds and certain trusts and accounts managed by Vanguard. Rate shown
is the 7-day yield.
19 Security exempt from registration under Section 4(2) of the Securities Act of 1933. Such securities may be sold in transactions
exempt from registration only to dealers in that program or other “accredited investors.” At September 30, 2017, the value of
these securities was $9,957,000, representing 0.1% of net assets.
See accompanying Notes, which are an integral part of the Financial Statements.
68
| | | | |
| Institutional Intermediate-Term Bond Fund | | | |
| |
| |
| Derivative Financial Instruments Outstanding as of Period End | | |
| Futures Contracts | | | | |
| | | | | ($000) |
| | | | | Value and |
| | | Number of | | Unrealized |
| | | Long (Short) | Notional | Appreciation |
| | Expiration | Contracts | Amount | (Depreciation) |
| Long Futures Contracts | | | | |
| 5-Year U.S. Treasury Note | December 2017 | 12,948 | 1,521,390 | (8,514) |
| 2-Year U.S. Treasury Note | December 2017 | 1,680 | 362,381 | (933) |
| 10-Year U.S. Treasury Note | December 2017 | 2,763 | 346,238 | (1,473) |
| | | | | (10,920) |
| |
| Short Futures Contracts | | | | |
| Ultra 10-Year U.S. Treasury Note | December 2017 | (3,673) | (493,387) | 5,594 |
| Ultra Long U.S. Treasury Bond | December 2017 | (38) | (6,275) | 108 |
| 30-Year U.S. Treasury Bond | December 2017 | (14) | (2,139) | 42 |
| | | | | 5,744 |
| | | | | (5,176) |
Unrealized appreciation (depreciation) on open futures contracts is required to be treated as realized gain (loss) for tax purposes.
69
Institutional Intermediate-Term Bond Fund
At September 30, 2017, the fund had the following open total return swap contracts:
| | | | | | | |
| Over-the-Counter Credit Default Swaps | | | | | |
| | | | | | | Remaining | |
| | | | | Periodic | | Up-Front | |
| | | | | Premium | | Premium | Unrealized |
| | | | Notional | Received | | Received | Appreciation |
| Termination | | Amount | (Paid)1 | Value | (Paid) | (Depreciation) |
| Reference Entity | Date | Counterparty | ($000) | (%) | ($000) | ($000) | ($000) |
| Credit Protection Sold/Moody’s Rating | | | | | |
| People’s Republic of | | | | | | | |
| China/A1 | 12/20/22 | GS | 4,600 | 1.000 | 83 | (94) | (11) |
| Republic of Chile/Aa3 | 12/20/22 | CITNA | 7,420 | 1.000 | 145 | (144) | 1 |
| Republic of Chile/Aa3 | 12/20/22 | GSI | 13,500 | 1.000 | 264 | (277) | (13) |
| | | | 25,520 | | 492 | (515) | (23) |
| |
| Credit Protection Purchased | | | | | | |
| EI du Pont de | | | | | | | |
| Nemours & Co. | 12/20/20 | JPMC | 4,015 | (1.000) | (113) | 62 | (51) |
| State of Qatar | 6/20/22 | BOANA | 4,080 | (1.000) | (24) | (47) | (71) |
| State of Qatar | 6/20/22 | CITNA | 7,920 | (1.000) | (48) | (87) | (135) |
| Wells Fargo & Co. | 9/20/20 | BOANA | 3,740 | (1.000) | (84) | 45 | (39) |
| | | | | | (269) | (27) | (296) |
| | | | | | | | (319) |
The notional amount represents the maximum potential amount the fund could be required to pay as a seller of credit protection if the
reference entity was subject to a credit event.
1 Periodic premium received/paid quarterly.
BOANA—Bank of America, N.A.
CITNA—Citi Bank N.A.
GSI—Goldman Sachs International.
70
| | | | | | |
| Institutional Intermediate-Term Bond Fund | | | | | |
| |
| |
| JPMC—JP Morgan Chase Bank. | | | | | | |
| Centrally Cleared Interest Rate Swaps | | | | | | |
| | | | Fixed | Floating | | |
| | | | Interest | Interest | | |
| | | | Rate | Rate | | Unrealized |
| | Future | Notional | Received | Received | | Appreciation |
| | Effective | Amount | (Paid)2 | (Paid) 3 | Value | (Depreciation) |
| Termination Date | Date1 | ($000) | (%) | (%) | ($000) | ($000) |
| 12/20/18 | 12/20/17 | 96,602 | 1.750 | 0.000 | 85 | (51) |
| 12/20/19 | 12/20/17 | 53,797 | 2.000 | 0.000 | 203 | (95) |
| 12/20/20 | 12/20/17 | 38,558 | 2.250 | 0.000 | 383 | (100) |
| 12/20/21 | 12/20/17 | 12,169 | (2.250) | 0.000 | (121) | 45 |
| 12/20/22 | 12/20/17 | 5,995 | (2.250) | 0.000 | (53) | 28 |
| 12/20/24 | 12/20/17 | 23,181 | (2.500) | 0.000 | (468) | 152 |
| | | | | | 29 | (21) |
1 Forward interest rate swap. In a forward interest rate swap, the fund and the counterparty agree to make periodic net payments beginning on a specified future effective date.
2 Fixed interest payment received/paid semiannually.
3 Based on 3-month London Interbank Offered Rate (LIBOR) as of the most recent payment date. Floating interest payment received/ paid quarterly.
See accompanying Notes, which are an integral part of the Financial Statements.
71
| |
| Institutional Intermediate-Term Bond Fund | |
| |
| |
| Statement of Operations | |
| |
| | Year Ended |
| | September 30, 2017 |
| | ($000) |
| Investment Income | |
| Income | |
| Interest1 | 247,675 |
| Total Income | 247,675 |
| Expenses | |
| The Vanguard Group—Note B | |
| Investment Advisory Services | 408 |
| Management and Administrative | 1,582 |
| Marketing and Distribution | 251 |
| Custodian Fees | 168 |
| Auditing Fees | 51 |
| Trustees’ Fees and Expenses | 9 |
| Total Expenses | 2,469 |
| Net Investment Income | 245,206 |
| Realized Net Gain (Loss) | |
| Investment Securities Sold1 | (11,600) |
| Futures Contracts | (23,122) |
| Swap Contracts | (151) |
| Realized Net Gain (Loss) | (34,873) |
| Change in Unrealized Appreciation (Depreciation) | |
| Investment Securities1 | (145,472) |
| Futures Contracts | (4,877) |
| Swap Contracts | (636) |
| Change in Unrealized Appreciation (Depreciation) | (150,985) |
| Net Increase (Decrease) in Net Assets Resulting from Operations | 59,348 |
1 Interest income, realized net gain (loss), and change in unrealized appreciation (depreciation) from an affiliated company of the fund were $10,634,000, $60,000, and $108,000.
See accompanying Notes, which are an integral part of the Financial Statements.
72
| | |
| Institutional Intermediate-Term Bond Fund | | |
| |
| |
| Statement of Changes in Net Assets | | |
| |
| | Year Ended September 30, |
| | 2017 | 2016 |
| | ($000) | ($000) |
| Increase (Decrease) in Net Assets | | |
| Operations | | |
| Net Investment Income | 245,206 | 174,145 |
| Realized Net Gain (Loss) | (34,873) | 99,425 |
| Change in Unrealized Appreciation (Depreciation) | (150,985) | 43,828 |
| Net Increase (Decrease) in Net Assets Resulting from Operations | 59,348 | 317,398 |
| Distributions | | |
| Net Investment Income | (245,776) | (174,092) |
| Realized Capital Gain1 | (94,306) | (18,223) |
| Total Distributions | (340,082) | (192,315) |
| Capital Share Transactions | | |
| Issued | 4,450,553 | 1,479,396 |
| Issued in Lieu of Cash Distributions | 340,082 | 192,315 |
| Redeemed | (225,161) | (11,057) |
| Net Increase (Decrease) from Capital Share Transactions | 4,565,474 | 1,660,654 |
| Total Increase (Decrease) | 4,284,740 | 1,785,737 |
| Net Assets | | |
| Beginning of Period | 9,820,814 | 8,035,077 |
| End of Period2 | 14,105,554 | 9,820,814 |
1 Includes fiscal 2017 and 2016 short-term gain distributions totaling $47,560,000 and $4,126,000, respectively. Short-term gain distributions are treated as ordinary income dividends for tax purposes.
2 Net Assets—End of Period includes undistributed (overdistributed) net investment income of $251,000 and $524,000.
See accompanying Notes, which are an integral part of the Financial Statements.
73
| | | |
| Institutional Intermediate-Term Bond Fund | | | |
| |
| |
| Financial Highlights | | | |
| |
| |
| | | | June 19, |
| | Year Ended | 20151 to |
| | September 30, | Sept. 30, |
| For a Share Outstanding Throughout Each Period | 2017 | 2016 | 2015 |
| Net Asset Value, Beginning of Period | $23.79 | $23.46 | $23.36 |
| Investment Operations | | | |
| Net Investment Income | . 462 2 | .473 | .126 |
| Net Realized and Unrealized Gain (Loss) on Investments | (.470) | .383 | .101 |
| Total from Investment Operations | (.008) | .856 | .227 |
| Distributions | | | |
| Dividends from Net Investment Income | (.454) | (.473) | (.127) |
| Distributions from Realized Capital Gains | (.208) | (.053) | — |
| Total Distributions | (.662) | (.526) | (.127) |
| Net Asset Value, End of Period | $23.12 | $23.79 | $23.46 |
| |
| Total Return | 0.01% | 3.70% | 0.97% |
| |
| Ratios/Supplemental Data | | | |
| Net Assets, End of Period (Millions) | $14,106 | $9,821 | $8,035 |
| Ratio of Total Expenses to Average Net Assets | 0.02% | 0.02% | 0.02%3 |
| Ratio of Net Investment Income to Average Net Assets | 1.99% | 2.02% | 1.92%3 |
| Portfolio Turnover Rate4 | 253% | 251% | 45% |
1 Commencement of operations as a registered investment company.
2 Calculated based on average shares outstanding.
3 Annualized.
4 Includes 111%, 67%, and 12% attributable to mortgage-dollar-roll activity.
See accompanying Notes, which are an integral part of the Financial Statements.
74
Institutional Intermediate-Term Bond Fund
Notes to Financial Statements
Vanguard Institutional Intermediate-Term Bond Fund is registered under the Investment Company Act of 1940 as an open-end investment company, or mutual fund. The fund has been established by Vanguard as an investment vehicle for certain collective trusts and other accounts managed by Vanguard or its affiliates, and qualifying education savings plans. The fund is offered to investors who meet certain administrative and service criteria and invest a minimum of $10 million. Certain of the fund’s investments are in corporate debt instruments; the issuers’ abilities to meet their obligations may be affected by economic developments in their respective industries.
A. The following significant accounting policies conform to generally accepted accounting principles for U.S. investment companies. The fund consistently follows such policies in preparing its financial statements.
1. Security Valuation: Securities are valued as of the close of trading on the New York Stock Exchange (generally 4 p.m., Eastern time) on the valuation date. Bonds and temporary cash investments are valued using the latest bid prices or using valuations based on a matrix system (which considers such factors as security prices, yields, maturities, and ratings), both as furnished by independent pricing services. Structured debt securities, including mortgages and asset-backed securities, are valued using the latest bid prices or using valuations based on a matrix system that considers such factors as issuer, tranche, nominal or option-adjusted spreads, weighted average coupon, weighted average maturity, credit enhancements, and collateral. Investments in Vanguard Market Liquidity Fund are valued at that fund’s net asset value. Securities for which market quotations are not readily available, or whose values have been affected by events occurring before the fund’s pricing time but after the close of the securities’ primary markets, are valued by methods deemed by the board of trustees to represent fair value.
2. Futures Contracts: The fund uses futures contracts to invest in fixed income asset classes with greater efficiency and lower cost than is possible through direct investment, to add value when these instruments are attractively priced, or to adjust sensitivity to changes in interest rates. The primary risks associated with the use of futures contracts are imperfect correlation between changes in market values of bonds held by the fund and the prices of futures contracts, and the possibility of an illiquid market. Counterparty risk involving futures is mitigated because a regulated clearinghouse is the counterparty instead of the clearing broker. To further mitigate counterparty risk, the fund trades futures contracts on an exchange, monitors the financial strength of its clearing brokers and clearinghouse, and has entered into clearing agreements with its clearing brokers. The clearinghouse imposes initial margin requirements to secure the fund’s performance and requires daily settlement of variation margin representing changes in the market value of each contract.
Futures contracts are valued at their quoted daily settlement prices. The notional amounts of the contracts are not recorded in the Statement of Net Assets. Fluctuations in the value of the contracts are recorded in the Statement of Assets and Liabilities as an asset (liability) and in the Statement of Operations as unrealized appreciation (depreciation) until the contracts are closed, when they are recorded as realized futures gains (losses).
During the year ended September 30, 2017, the fund’s average investments in long and short futures contracts represented 11% and 3% of net assets, respectively, based on the average of the notional amounts at each quarter-end during the period.
3. Swap Contracts: The fund invests in credit default swaps to adjust the overall credit risk of the fund or to actively overweight or underweight credit risk to a specific issuer or group of issuers. The fund may sell credit protection through credit default swaps to simulate investments in long
75
Institutional Intermediate-Term Bond Fund
positions that are either unavailable or considered to be less attractively priced in the bond market. The fund may purchase credit protection through credit default swaps to reduce credit exposure to a given issuer or issuers. Under the terms of the swaps, an up-front payment may be exchanged between the seller and buyer. In addition, the seller of the credit protection receives a periodic payment of premium from the buyer that is a fixed percentage applied to a notional amount. If, for example, the reference entity is subject to a credit event (such as bankruptcy, failure to pay, or obligation acceleration) during the term of the swap, the seller agrees to either physically settle or cash settle the swap contract. If the swap is physically settled, the seller agrees to pay the buyer an amount equal to the notional amount and take delivery of a debt instrument of the reference issuer with a par amount equal to such notional amount. If the swap is cash settled, the seller agrees to pay the buyer the difference between the notional amount and the final price for the relevant debt instrument, as determined either in a market auction or pursuant to a pre-agreed-upon valuation procedure.
The fund enters into interest rate swap transactions to adjust the fund’s sensitivity to changes in interest rates and maintain the ability to generate income at prevailing market rates. Under the terms of the swaps, one party pays the other an amount that is a fixed percentage rate applied to a notional amount. In return, the counterparty agrees to pay a floating rate, which is reset periodically based on short-term interest rates, applied to the same notional amount.
The notional amounts of swap contracts are not recorded in the Statement of Net Assets. Swaps are valued daily based on market quotations received from independent pricing services or recognized dealers and the change in value is recorded in the Statement of Assets and Liabilities as an asset (liability) and in the Statement of Operations as unrealized appreciation (depreciation) until the seller of credit protection is required to take delivery (or, in a cash settled swap, pay the settlement amount determined) upon occurrence of a credit event, periodic payments are made, or the swap terminates, at which time realized gain (loss) is recorded. The net premium to be received or paid by the fund under swap contracts is accrued daily and recorded as realized gain (loss) over the life of the contract.
The primary risk associated with selling credit protection is that, upon the occurrence of a defined credit event, the market value of the debt instrument received by the fund (or, in a cash settled swap, the debt instruments used to determine the settlement payment by the fund) will be significantly less than the amount paid by the fund and, in a physically settled swap, the fund may receive an illiquid debt instrument. A risk associated with all types of swaps is the possibility that a counterparty may default on its obligation to pay net amounts due to the fund. The fund’s maximum amount subject to counterparty risk is the unrealized appreciation on the swap contract. The fund mitigates its counterparty risk by entering into swaps only with a diverse group of prequalified counterparties, monitoring their financial strength, entering into master netting arrangements with its counterparties, and requiring its counterparties to transfer collateral as security for their performance. In the absence of a default, the collateral pledged or received by the fund cannot be repledged, resold, or rehypothecated. In the event of a counterparty’s default (including bankruptcy), the fund may terminate any swap contracts with that counterparty, determine the net amount owed by either party in accordance with its master netting arrangements, and sell or retain any collateral held up to the net amount owed to the fund under the master netting arrangements. The swap contracts contain provisions whereby a counterparty may terminate open contracts if the fund’s net assets decline below a certain level, triggering a payment by the fund if the fund is in a net liability position at the time of the termination. The payment amount would be reduced by any collateral the fund has pledged. Any securities pledged as collateral for open contracts are noted in the Statement
76
Institutional Intermediate-Term Bond Fund
of Net Assets. The value of collateral received or pledged is compared daily to the value of the swap contracts exposure with each counterparty, and any difference, if in excess of a specified minimum transfer amount, is adjusted and settled within two business days.
The fund enters into centrally cleared interest rate and credit default swaps to achieve the same objectives specified with respect to the equivalent over-the-counter swaps but with less counterparty risk because a regulated clearinghouse is the counterparty instead of the clearing broker or executing broker. The clearinghouse imposes initial margin requirements to secure the fund’s performance, and requires daily settlement of variation margin representing changes in the market value of each contract. To further mitigate counterparty risk, the fund trades with a diverse group of prequalified executing brokers; monitors the financial strength of its clearing brokers, executing brokers, and clearinghouse; and has entered into agreements with its clearing brokers and executing brokers.
During the year ended September 30, 2017, the fund’s average amounts of investments in credit protection sold and credit protection purchased each represented less than 1% of net assets, respectively, based on the average of notional amounts at each quarter-end during the period. The average amount of investments in interest rate swaps represented 2% of net assets, based on the average of notional amounts at each quarter-end during the period.
4. To Be Announced (TBA) Transactions: A TBA transaction is an agreement to buy or sell mortgage-backed securities with agreed-upon characteristics (face amount, coupon, maturity) for settlement at a future date. The fund may be a seller of TBA transactions to reduce its exposure to the mortgage-backed securities market or in order to sell mortgage-backed securities it owns under delayed-delivery arrangements. When the fund is a buyer of TBA transactions, it maintains cash or short-term investments in an amount sufficient to meet the purchase price at the settlement date of the TBA transaction. The primary risk associated with TBA transactions is that a counterparty may default on its obligations. The fund mitigates its counterparty risk by, among other things, performing a credit analysis of counterparties, allocating transactions among numerous counterparties, and monitoring its exposure to each counterparty. The fund may also enter into a Master Securities Forward Transaction Agreement (MSFTA) with certain counterparties and require them to transfer collateral as security for their performance. In the absence of a default, the collateral pledged or received by the fund cannot be repledged, resold, or rehypothecated. Under an MSFTA, upon a counterparty default (including bankruptcy), the fund may terminate any TBA transactions with that counterparty, determine the net amount owed by either party in accordance with its master netting arrangements, and sell or retain any collateral held up to the net amount owed to the fund under the master netting arrangements.
5. Mortgage Dollar Rolls: The fund enters into mortgage-dollar-roll transactions, in which the fund sells mortgage-backed securities to a dealer and simultaneously agrees to purchase similar securities in the future at a predetermined price. The proceeds of the securities sold in mortgage-dollar-roll transactions are typically invested in high-quality short-term fixed income securities. The fund forgoes principal and interest paid on the securities sold, and is compensated by interest earned on the proceeds of the sale and by a lower price on the securities to be repurchased. The fund has also entered into mortgage-dollar-roll transactions in which the fund buys mortgage-backed securities from a dealer pursuant to a TBA transaction and simultaneously agrees to sell similar securities in the future at a predetermined price. The securities bought in mortgage-dollar-roll transactions are used to cover an open TBA sell position. The fund continues to earn interest on mortgage-backed security pools already held and receives a lower price on the securities to be
77
Institutional Intermediate-Term Bond Fund
sold in the future. The fund accounts for mortgage-dollar-roll transactions as purchases and sales; as such, these transactions may increase the fund’s portfolio turnover rate. Amounts to be received or paid in connection with open mortgage dollar rolls are included in Receivables for Investment Securities Sold or Payables for Investment Securities Purchased in the Statement of Assets and Liabilities.
6. Federal Income Taxes: The fund intends to continue to qualify as a regulated investment company and distribute all of its taxable income. Management has analyzed the fund’s tax positions taken for all open federal income tax years (September 30, 2015–2017), and has concluded that no provision for federal income tax is required in the fund’s financial statements.
7. Distributions: Distributions to shareholders are recorded on the ex-dividend date.
8. Credit Facility: The fund and certain other funds managed by The Vanguard Group (“Vanguard”) participate in a $3.1 billion committed credit facility provided by a syndicate of lenders pursuant to a credit agreement that may be renewed annually; each fund is individually liable for its borrowings, if any, under the credit facility. Borrowings may be utilized for temporary and emergency purposes, and are subject to the fund’s regulatory and contractual borrowing restrictions. The participating funds are charged administrative fees and an annual commitment fee of 0.10% of the undrawn amount of the facility; these fees are allocated to the funds based on a method approved by the fund’s board of trustees and included in Management and Administrative expenses on the fund’s Statement of Operations. Any borrowings under this facility bear interest at a rate based upon the higher of the one-month London Interbank Offered Rate, federal funds effective rate, or overnight bank funding rate plus an agreed-upon spread.
The fund had no borrowings outstanding at September 30, 2017, or at any time during the period then ended.
9. Other: Interest income includes income distributions received from Vanguard Market Liquidity Fund and is accrued daily. Premiums and discounts on debt securities purchased are amortized and accreted, respectively, to interest income over the lives of the respective securities. Security transactions are accounted for on the date securities are bought or sold. Costs used to determine realized gains (losses) on the sale of investment securities are those of the specific securities sold.
B. In accordance with the terms of a Funds’ Service Agreement (the “FSA”) between Vanguard and the fund, Vanguard furnishes to the fund investment advisory, corporate management, administrative, marketing, and distribution services at Vanguard’s cost of operations (as defined by the FSA). These costs of operations are allocated to the fund based on methods and guidelines approved by the board of trustees. Vanguard does not require reimbursement in the current period for certain costs of operations (such as deferred compensation/benefits and risk/insurance costs); the fund’s liability for these costs of operations is included in Payables to Vanguard on the Statement of Assets and Liabilities.
Upon the request of Vanguard, the fund may invest up to 0.40% of its net assets as capital in Vanguard. At September 30, 2017, the fund had contributed to Vanguard capital in the amount of $900,000, representing 0.01% of the fund’s net assets and 0.36% of Vanguard’s capitalization. The fund’s trustees and officers are also directors and employees, respectively, of Vanguard.
78
Institutional Intermediate-Term Bond Fund
C. Various inputs may be used to determine the value of the fund’s investments. These inputs are summarized in three broad levels for financial statement purposes. The inputs or methodologies used to value securities are not necessarily an indication of the risk associated with investing in those securities.
Level 1—Quoted prices in active markets for identical securities.
Level 2—Other significant observable inputs (including quoted prices for similar securities, interest
rates, prepayment speeds, credit risk, etc.).
Level 3—Significant unobservable inputs (including the fund’s own assumptions used to determine
the fair value of investments). Any investments valued with significant unobservable inputs are
noted on the Statement of Net Assets.
The following table summarizes the market value of the fund’s investments as of September 30, 2017, based on the inputs used to value them:
| | | |
| | Level 1 | Level 2 | Level 3 |
| Investments | ($000) | ($000) | ($000) |
| U.S. Government and Agency Obligations | — | 8,471,651 | — |
| Asset-Backed/Commercial Mortgage-Backed Securities | — | 1,665,839 | 32,123 |
| Corporate Bonds | — | 2,906,340 | — |
| Sovereign Bonds | — | 902,167 | — |
| Taxable Municipal Bonds | — | 5,323 | — |
| Temporary Cash Investments | 1,144,805 | 9,957 | — |
| Futures Contracts—Assets1 | 879 | — | — |
| Futures Contracts—Liabilities1 | (3,271) | — | — |
| Swap Contracts—Assets | 631 | — | — |
| Swap Contracts—Liabilities | (79)1 | (319) | — |
| Total | 1,142,397 | 13,960,958 | 32,123 |
| 1 Represents variation margin on the last day of the reporting period. | | | |
D. At September 30, 2017, the fair values of derivatives were reflected in the Statement of Assets and Liabilities as follows:
| | | |
| | Interest Rate | Credit | |
| | Contracts | Contracts | Total |
| Statement of Assets and Liabilities Caption | ($000) | ($000) | ($000) |
| Variation Margin Receivable—Futures Contracts | 879 | — | 879 |
| Variation Margin Receivable—Swap Contracts | 63 | — | 63 |
| Variation Margin Payable—Futures Contracts | (3,271) | — | (3,271) |
| Variation Margin Payable—Swap Contracts | (79) | — | (79) |
| Unrealized Depreciation—Swap Contracts | — | (319) | (319) |
79
Institutional Intermediate-Term Bond Fund
Realized net gain (loss) and the change in unrealized appreciation (depreciation) on derivatives for the year ended September 30, 2017, were:
| | | |
| Interest Rate | Credit | |
| | Contracts | Contracts | Total |
| Realized Net Gain (Loss) on Derivatives | ($000) | ($000) | ($000) |
| Futures Contracts | (23,122) | — | (23,122) |
| Swap Contracts | (988) | 837 | (151) |
| Realized Net Gain (Loss) on Derivatives | (24,110) | 837 | (23,273) |
| |
| Change in Unrealized Appreciation (Depreciation) on Derivatives | | | |
| Futures Contracts | (4,877) | — | (4,877) |
| Swap Contracts | (273) | (363) | (636) |
| Change in Unrealized Appreciation (Depreciation) on Derivatives | (5,150) | (363) | (5,513) |
E. Distributions are determined on a tax basis and may differ from net investment income and realized capital gains for financial reporting purposes. Differences may be permanent or temporary. Permanent differences are reclassified among capital accounts in the financial statements to reflect their tax character. Temporary differences arise when certain items of income, expense, gain, or loss are recognized in different periods for financial statement and tax purposes. These differences will reverse at some time in the future. Differences in classification may also result from the treatment of short-term gains as ordinary income for tax purposes.
For tax purposes, at September 30, 2017, the fund had $1,723,000 of ordinary income available for distribution. The fund had available capital losses totaling $41,023,000 that may be carried forward indefinitely to offset future net capital gains.
At September 30, 2017, the cost of investment securities for tax purposes was $15,144,800,000. Net unrealized depreciation of investment securities for tax purposes was $6,595,000, consisting of unrealized gains of $67,350,000 on securities that had risen in value since their purchase and $73,945,000 in unrealized losses on securities that had fallen in value since their purchase.
F. During the year ended September 30, 2017, the fund purchased $3,267,503,000 of investment securities and sold $1,893,108,000 of investment securities, other than U.S. government securities and temporary cash investments. Purchases and sales of U.S. government securities were $30,315,101,000 and $27,965,284,000, respectively.
80
Institutional Intermediate-Term Bond Fund
| | |
| G. Capital shares issued and redeemed were: | | |
| | Six Months Ended September 30, |
| | 2017 | 2016 |
| | Shares | Shares |
| | (000) | (000) |
| Issued | 192,265 | 62,521 |
| Issued in Lieu of Cash Distributions | 14,746 | 8,169 |
| Redeemed | (9,687) | (474) |
| Net Increase (Decrease) in Shares Outstanding | 197,324 | 70,216 |
H. Management has determined that no material events or transactions occurred subsequent to September 30, 2017, that would require recognition or disclosure in these financial statements.
81
Report of Independent Registered
Public Accounting Firm
To the Board of Trustees of Vanguard Malvern Funds and the Shareholders of Vanguard Institutional
Short-Term Bond Fund and Vanguard Institutional Intermediate-Term Bond Fund
In our opinion, the accompanying statement of assets and liabilities of Vanguard Institutional Intermediate-Term Bond Fund and statements of net assets of Vanguard Institutional Short-Term Bond Fund and Vanguard Institutional Intermediate-Term Bond Fund (constituting separate portfolios of Vanguard Malvern Funds, hereafter referred to as the “Funds”) and the related statements of operations and of changes in net assets and the financial highlights present fairly, in all material respects, the financial position of the Funds as of September 30, 2017, the results of each of their operations for the year then ended, the changes in each of their net assets for each of the two years in the period then ended and the financial highlights for each of the periods indicated, in conformity with accounting principles generally accepted in the United States of America. These financial statements and financial highlights (hereafter referred to as “financial statements”) are the responsibility of the Funds’ management. Our responsibility is to express an opinion on these financial statements based on our audits. We conducted our audits of these financial statements in accordance with the standards of the Public Company Accounting Oversight Board (United States). Those standards require that we plan and perform the audit to obtain reasonable assurance about whether the financial statements are free of material misstatement. An audit includes examining, on a test basis, evidence supporting the amounts and disclosures in the financial statements, assessing the accounting principles used and significant estimates made by management, and evaluating the overall financial statement presentation. We believe that our audits, which included confirmation of securities as of September 30, 2017 by correspondence with the custodian and brokers and by agreement to the underlying ownership records of the transfer agent, provide a reasonable basis for our opinion.
/s/PricewaterhouseCoopers LLP
Philadelphia, Pennsylvania
November 16, 2017
Special 2017 tax information (unaudited) for Vanguard Institutional Short-Term Bond Fund
This information for the fiscal year ended September 30, 2017, is included pursuant to provisions
of the Internal Revenue Code.
The fund distributed $7,036,000 as capital gain dividends (20% rate gain distributions) to
shareholders during the fiscal year.
For nonresident alien shareholders, 100% of short-term capital gain dividends distributed by the
fund are qualified short-term capital gains.
For nonresident alien shareholders, 58.2% of income dividends are interest-related dividends.
82
Special 2017 tax information (unaudited) for Vanguard Institutional Intermediate-Term
Bond Fund
This information for the fiscal year ended September 30, 2017, is included pursuant to provisions
of the Internal Revenue Code.
The fund distributed $46,746,000 as capital gain dividends (20% rate gain distributions) to
shareholders during the fiscal year.
For nonresident alien shareholders, 100% of short-term capital gain dividends distributed by
the fund are qualified short-term capital gains.
For nonresident alien shareholders, 76.4% of income dividends are interest-related dividends.
83
About Your Fund’s Expenses
As a shareholder of the fund, you incur ongoing costs, which include costs for portfolio management, administrative services, and shareholder reports (like this one), among others. Operating expenses, which are deducted from a fund’s gross income, directly reduce the investment return of the fund.
A fund’s expenses are expressed as a percentage of its average net assets. This figure is known as the expense ratio. The following examples are intended to help you understand the ongoing costs (in dollars) of investing in your fund and to compare these costs with those of other mutual funds. The examples are based on an investment of $1,000 made at the beginning of the period shown and held for the entire period.
The accompanying table illustrates your fund’s costs in two ways:
• Based on actual fund return. This section helps you to estimate the actual expenses that you paid over the period. The ”Ending Account Value“ shown is derived from the fund‘s actual return, and the third column shows the dollar amount that would have been paid by an investor who started with $1,000 in the fund. You may use the information here, together with the amount you invested, to estimate the expenses that you paid over the period.
To do so, simply divide your account value by $1,000 (for example, an $8,600 account value divided by $1,000 = 8.6), then multiply the result by the number given for your fund under the heading ”Expenses Paid During Period.“
• Based on hypothetical 5% yearly return. This section is intended to help you compare your fund‘s costs with those of other mutual funds. It assumes that the fund had a yearly return of 5% before expenses, but that the expense ratio is unchanged. In this case—because the return used is not the fund’s actual return—the results do not apply to your investment. The example is useful in making comparisons because the Securities and Exchange Commission requires all mutual funds to calculate expenses based on a 5% return. You can assess your fund’s costs by comparing this hypothetical example with the hypothetical examples that appear in shareholder reports of other funds.
Note that the expenses shown in the table are meant to highlight and help you compare ongoing costs only and do not reflect transaction costs incurred by the fund for buying and selling securities. Further, the expenses do not include any purchase, redemption, or account service fees described in the fund prospectus. If such fees were applied to your account, your costs would be higher. Your fund does not carry a “sales load.”
The calculations assume no shares were bought or sold during the period. Your actual costs may have been higher or lower, depending on the amount of your investment and the timing of any purchases or redemptions.
You can find more information about the fund’s expenses, including annual expense ratios, in the Financial Statements section of this report. For additional information on operating expenses and other shareholder costs, please refer to your fund’s current prospectus.
84
| | | |
| Six Months Ended September 30, 2017 | | | |
| | Beginning | Ending | Expenses |
| | Account Value | Account Value | Paid During |
| | 3/31/2017 | 9/30/2017 | Period |
| Based on Actual Fund Return | | | |
| Institutional Short-Term Bond Fund | $1,000.00 | $1,008.80 | $0.10 |
| Institutional Intermediate-Term Bond Fund | $1,000.00 | $1,014.01 | $0.10 |
| Based on Hypothetical 5% Yearly Return | | | |
| Institutional Short-Term Bond Fund | $1,000.00 | $1,024.97 | $0.10 |
| Institutional Intermediate-Term Bond Fund | $1,000.00 | $1,024.97 | $0.10 |
The calculations are based on expenses incurred in the most recent six-month period. The funds’ annualized six-month expense ratios for that period are: for the Institutional Short-Term Bond Fund Institutional Plus Shares, 0.02%; and for the Institutional Intermediate-Term Bond Fund Institutional Plus Shares, 0.02%. The dollar amounts shown as “Expenses Paid” are equal to the annualized expense ratio multiplied by the average account value over the period, multiplied by the number of days in the most recent six-month period, then divided by the number of days in the most recent 12-month period (183/365).
85
Glossary
30-Day SEC Yield. A fund’s 30-day SEC yield is derived using a formula specified by the U.S. Securities and Exchange Commission. Under the formula, data related to the fund’s security holdings in the previous 30 days are used to calculate the fund’s hypothetical net income for that period, which is then annualized and divided by the fund’s estimated average net assets over the calculation period. For the purposes of this calculation, a security’s income is based on its current market yield to maturity (for bonds), its actual income (for asset-backed securities), or its projected dividend yield (for stocks). Because the SEC yield represents hypothetical annualized income, it will differ—at times significantly—from the fund’s actual experience. As a result, the fund’s income distributions may be higher or lower than implied by the SEC yield.
Average Coupon. The average interest rate paid on the fixed income securities held by a fund. It is expressed as a percentage of face value.
Average Duration. An estimate of how much the value of the bonds held by a fund will fluctuate in response to a change in interest rates. To see how the value could change, multiply the average duration by the change in rates. If interest rates rise by 1 percentage point, the value of the bonds in a fund with an average duration of five years would decline by about 5%. If rates decrease by a percentage point, the value would rise by 5%.
Average Effective Maturity. The average length of time until fixed income securities held by a fund reach maturity and are repaid, taking into consideration the possibility that the issuer may call the bond before its maturity date. The figure reflects the proportion of fund assets represented by each security; it also reflects any futures contracts held. In general, the longer the average effective maturity, the more a fund’s share price will fluctuate in response to changes in market interest rates.
Beta. A measure of the magnitude of a fund’s past share-price fluctuations in relation to the ups and downs of a given market index. The index is assigned a beta of 1.00. Compared with a given index, a fund with a beta of 1.20 typically would have seen its share price rise or fall by 12% when the index rose or fell by 10%. For this report, beta is based on returns over the past 36 months for both the fund and the index. Note that a fund’s beta should be reviewed in conjunction with its R-squared (see definition). The lower the R-squared, the less correlation there is between the fund and the index, and the less reliable beta is as an indicator of volatility.
Credit Quality. Credit-quality ratings are measured on a scale that generally ranges from AAA (highest) to D (lowest). U.S. Treasury, U.S. Agency, and U.S. Agency mortgage-backed securities appear under “U.S. Government.” Credit-quality ratings are obtained from Moody’s and S&P, and the higher rating for each issue is shown. ”Not Rated” is used to classify securities for which a rating is not available. Not rated securities include a fund’s investment in Vanguard Market Liquidity Fund or Vanguard Municipal Cash Management Fund, each of which invests in high-quality money market instruments and may serve as a cash management vehicle for the Vanguard funds, trusts, and accounts.
Expense Ratio. A fund’s total annual operating expenses expressed as a percentage of the fund’s average net assets. The expense ratio includes management and administrative expenses, but does not include the transaction costs of buying and selling portfolio securities.
86
Inception Date. The date on which the assets of a fund (or one of its share classes) are first invested in accordance with the fund’s investment objective. For funds with a subscription period, the inception date is the day after that period ends. Investment performance is measured from the inception date.
R-Squared. A measure of how much of a fund’s past returns can be explained by the returns from the market in general, as measured by a given index. If a fund’s total returns were precisely synchronized with an index’s returns, its R-squared would be 1.00. If the fund’s returns bore no relationship to the index’s returns, its R-squared would be 0. For this report, R-squared is based on returns over the past 36 months for both the fund and the index.
Short-Term Reserves. The percentage of a fund invested in highly liquid, short-term securities that can be readily converted to cash.
Yield to Maturity. The rate of return an investor would receive if the fixed income securities held by a fund were held to their maturity dates.
Benchmark Information
Spliced Bloomberg Barclays U.S. Aggregate Float Adjusted Index: Bloomberg Barclays U.S.
Aggregate Bond Index through December 31, 2009; Bloomberg Barclays U.S. Aggregate Float
Adjusted Index thereafter.
87
BLOOMBERG is a trademark and service mark of Bloomberg Finance L.P. BARCLAYS is a trademark and service mark of Barclays Bank Plc, used under license. Bloomberg Finance L.P. and its affiliates, including Bloomberg Index Services Limited (BISL) (collectively, Bloomberg), or Bloomberg’s licensors, own all proprietary rights in the Bloomberg Barclays U.S. 1–3 Year Government/Credit ex Baa Index and Bloomberg Barclays U.S. Intermediate Aggregate ex Baa Index (Indices or Bloomberg Barclays Indices).
Neither Barclays Bank Plc, Barclays Capital Inc., or any affiliate (collectively Barclays) or Bloomberg is the issuer or producer of the Institutional Bond Funds and neither Bloomberg nor Barclays has any responsibilities, obligations or duties to investors in the Institutional Bond Funds. The Indices are licensed for use by The Vanguard Group, Inc. (Vanguard) as the sponsor of the Institutional Bond Funds. Bloomberg and Barclays’ only relationship with Vanguard in respect of the Indices is the licensing of the Indices, which are determined, composed and calculated by BISL, or any successor thereto, without regard to the Issuer or the Institutional Bond Funds or the owners of the Institutional Bond Funds.
Additionally, Vanguard may for itself execute transaction(s) with Barclays in or relating to the Indices in connection with the Institutional Bond Funds. Investors acquire the Institutional Bond Funds from Vanguard and investors neither acquire any interest in the Indices nor enter into any relationship of any kind whatsoever with Bloomberg or Barclays upon making an investment in the Institutional Bond Funds. The Institutional Bond Funds are not sponsored, endorsed, sold or promoted by Bloomberg or Barclays. Neither Bloomberg nor Barclays makes any representation or warranty, express or implied regarding the advisability of investing in the Institutional Bond Funds or the advisability of investing in securities generally or the ability of the Indices to track corresponding or relative market performance. Neither Bloomberg nor Barclays has passed on the legality or suitability of the Institutional Bond Funds with respect to any person or entity. Neither Bloomberg nor Barclays is responsible for and has not participated in the determination of the timing of, prices at, or quantities of the Institutional Bond Funds to be issued. Neither Bloomberg nor Barclays has any obligation to take the needs of the Issuer or the owners of the Institutional Bond Funds or any other third party into consideration in determining, composing or calculating the Indices. Neither Bloomberg nor Barclays has any obligation or liability in connection with administration, marketing or trading of the Institutional Bond Funds The licensing agreement between Bloomberg and Barclays is solely for the benefit of Bloomberg and Barclays and not for the benefit of the owners of the Institutional Bond Funds, investors or other third parties. In addition, the licensing agreement between Vanguard and Bloomberg is solely for the benefit of Vanguard and Bloomberg and not for the benefit of the owners of the Institutional Bond Funds, investors or other third parties.
NEITHER BLOOMBERG NOR BARCLAYS SHALL HAVE ANY LIABILITY TO THE ISSUER, INVESTORS OR TO OTHER THIRD PARTIES FOR THE QUALITY, ACCURACY AND/OR COMPLETENESS OF THE BLOOMBERG BARCLAYS INDICES OR ANY DATA INCLUDED THEREIN OR FOR INTERRUPTIONS IN THE DELIVERY OF THE BLOOMBERG BARCLAYS INDICES. NEITHER BLOOMBERG NOR BARCLAYS MAKES ANY WARRANTY, EXPRESS OR IMPLIED, AS TO RESULTS TO BE OBTAINED BY THE ISSUER, THE INVESTORS OR ANY OTHER PERSON OR ENTITY FROM THE USE OF THE BLOOMBERG BARCLAYS INDICES OR ANY DATA INCLUDED THEREIN. NEITHER BLOOMBERG NOR BARCLAYS MAKES ANY EXPRESS OR IMPLIED WARRANTIES, AND EACH HEREBY EXPRESSLY DISCLAIMS ALL WARRANTIES OF MERCHANTABILITY
OR FITNESS FOR A PARTICULAR PURPOSE OR USE WITH RESPECT TO THE BLOOMBERG BARCLAYS INDICES OR ANY DATA INCLUDED THEREIN. BLOOMBERG RESERVES THE RIGHT TO CHANGE THE METHODS OF CALCULATION OR PUBLICATION, OR TO CEASE THE CALCULATION OR PUBLICATION OF THE BLOOMBERG BARCLAYS INDICES, AND NEITHER BLOOMBERG NOR BARCLAYS SHALL BE LIABLE FOR ANY MISCALCULATION OF OR ANY INCORRECT, DELAYED OR INTERRUPTED PUBLICATION WITH RESPECT TO ANY OF THE BLOOMBERG BARCLAYS INDICES. NEITHER BLOOMBERG NOR BARCLAYS SHALL BE LIABLE FOR ANY DAMAGES, INCLUDING, WITHOUT LIMITATION, ANY SPECIAL, INDIRECT OR CONSEQUENTIAL DAMAGES, OR ANY LOST PROFITS AND EVEN IF ADVISED OF THE POSSIBLITY OF SUCH, RESULTING FROM THE USE OF THE BLOOMBERG BARCLAYS INDICES OR ANY DATA INCLUDED THEREIN OR WITH RESPECT TO THE INSTITUTIONAL BOND FUNDS.
None of the information supplied by Bloomberg or Barclays and used in this publication may be reproduced in any manner without the prior written permission of both Bloomberg and Barclays Capital, the investment banking division of Barclays Bank Plc. Barclays Bank Plc is registered in England No. 1026167. Registered office 1 Churchill Place London E14 5HP.
© 2017 Bloomberg. Used with Permission.
Source: Bloomberg Index Services Limited. Copyright 2017, Bloomberg. All rights reserved.
88
The People Who Govern Your Fund
The trustees of your mutual fund are there to see that the fund is operated and managed in your best interests since, as a shareholder, you are a part owner of the fund. Your fund’s trustees also serve on the board of directors of The Vanguard Group, Inc., which is owned by the Vanguard funds and provides services to them on an at-cost basis.
A majority of Vanguard’s board members are independent, meaning that they have no affiliation with Vanguard or the funds they oversee, apart from the sizable personal investments they have made as private individuals. The independent board members have distinguished backgrounds in business, academia, and public service. Each of the trustees and executive officers oversees 198 Vanguard funds.
Information for each trustee and executive officer of the fund appears below. The mailing address of the trustees and officers is P.O. Box 876, Valley Forge, PA 19482. More information about the trustees is in the Statement of Additional Information, which can be obtained, without charge, by contacting Vanguard at 800-662-7447, or online at vanguard.com.
Interested Trustee1
F. William McNabb III
Born 1957. Trustee Since July 2009. Chairman of the Board. Principal Occupation(s) During the Past Five Years and Other Experience: Chairman of the Board of The Vanguard Group, Inc., and of each of the investment companies served by The Vanguard Group, since January 2010; Chief Executive Officer and Director of The Vanguard Group and President and Chief Executive Officer of each of the investment companies served by The Vanguard Group, since 2008; Director of Vanguard Marketing Corporation; President of The Vanguard Group (2008–2017); Managing Director of The Vanguard Group (1995–2008).
Independent Trustees
Emerson U. Fullwood
Born 1948. Trustee Since January 2008. Principal Occupation(s) During the Past Five Years and Other Experience: Executive Chief Staff and Marketing Officer for North America and Corporate Vice President (retired 2008) of Xerox Corporation (document management products and services);
Executive in Residence and 2009–2010 Distinguished Minett Professor at the Rochester Institute of Technology; Lead Director of SPX FLOW, Inc. (multi-industry manufacturing); Director of the United Way of Rochester, the University of Rochester Medical Center, Monroe Community College Foundation, North Carolina A&T University, and Roberts Wesleyan College; Trustee of the University of Rochester.
Rajiv L. Gupta
Born 1945. Trustee Since December 2001.2 Principal Occupation(s) During the Past Five Years and Other Experience: Chairman and Chief Executive Officer (retired 2009) and President (2006–2008) of Rohm and Haas Co. (chemicals); Director of Arconic Inc. (diversified manufacturer), HP Inc. (printer and personal computer manufacturing), and Delphi Automotive plc (automotive components); Senior Advisor at New Mountain Capital.
Amy Gutmann
Born 1949. Trustee Since June 2006. Principal Occupation(s) During the Past Five Years and Other Experience: President of the University of Pennsylvania; Christopher H. Browne
1 Mr. McNabb is considered an “interested person,” as defined in the Investment Company Act of 1940, because he is an officer of the Vanguard funds.
2 December 2002 for Vanguard Equity Income Fund, the Vanguard Municipal Bond Funds, and the Vanguard State Tax-Exempt Funds.
Distinguished Professor of Political Science, School of Arts and Sciences, and Professor of Communication, Annenberg School for Communication, with secondary faculty appointments in the Department of Philosophy, School of Arts and Sciences, and at the Graduate School of Education, University of Pennsylvania; Trustee of the National Constitution Center.
JoAnn Heffernan Heisen
Born 1950. Trustee Since July 1998. Principal Occupation(s) During the Past Five Years and Other Experience: Corporate Vice President and Member of the Executive Committee (1997–2008), Chief Global Diversity Officer (retired 2008), Vice President and Chief Information Officer (1997–2006), Controller (1995–1997), Treasurer (1991–1995), and Assistant Treasurer (1989–1991) of Johnson & Johnson (pharmaceuticals/medical devices/ consumer products); Director of Skytop Lodge Corporation (hotels) and the Robert Wood Johnson Foundation; Member of the Advisory Board of the Institute for Women’s Leadership at Rutgers University.
F. Joseph Loughrey
Born 1949. Trustee Since October 2009. Principal Occupation(s) During the Past Five Years and Other Experience: President and Chief Operating Officer (retired 2009) of Cummins Inc. (industrial machinery); Chairman of the Board of Hillenbrand, Inc. (specialized consumer services), Oxfam America, and the Lumina Foundation for Education; Director of the V Foundation for Cancer Research; Member of the Advisory Council for the College of Arts and Letters and Chair of the Advisory Board to the Kellogg Institute for International Studies, both at the University of Notre Dame.
Mark Loughridge
Born 1953. Trustee Since March 2012. Principal Occupation(s) During the Past Five Years and Other Experience: Senior Vice President and Chief Financial Officer (retired 2013) at IBM (information technology services); Fiduciary Member of IBM’s Retirement Plan Committee (2004–2013); Member of the Council on Chicago Booth.
Scott C. Malpass
Born 1962. Trustee Since March 2012. Principal Occupation(s) During the Past Five Years and Other Experience: Chief Investment Officer and Vice President at the University of Notre Dame; Assistant Professor of Finance at the Mendoza College of Business at Notre Dame; Member of the Notre Dame 403(b) Investment Committee, the Board of Advisors for Spruceview Capital Partners, the Board of Catholic Investment Services, Inc. (investment advisor), and the Board of Superintendence of the Institute for the Works of Religion; Chairman of the Board of TIFF Advisory Services, Inc. (investment advisor).
André F. Perold
Born 1952. Trustee Since December 2004. Principal Occupation(s) During the Past Five Years and Other Experience: George Gund Professor of Finance and Banking, Emeritus at the Harvard Business School (retired 2011); Chief Investment Officer and Co-Managing Partner of HighVista Strategies LLC (private investment firm); Overseer of the Museum of Fine Arts Boston.
Peter F. Volanakis
Born 1955. Trustee Since July 2009. Principal Occupation(s) During the Past Five Years and Other Experience: President and Chief Operating Officer (retired 2010) of Corning Incorporated (communications equipment); Chairman of the Board of Trustees of Colby-Sawyer College; Member of the Board of Hypertherm, Inc. (industrial cutting systems, software, and consumables).
Executive Officers
Glenn Booraem
Born 1967. Investment Stewardship Officer Since February 2017. Principal Occupation(s) During the Past Five Years and Other Experience: Principal of The Vanguard Group, Inc.; Treasurer (2015–2017), Controller (2010–2015), and Assistant Controller (2001–2010) of each of the investment companies served by The Vanguard Group.
Thomas J. Higgins
Born 1957. Chief Financial Officer Since September 2008. Principal Occupation(s) During the Past Five Years and Other Experience: Principal of The Vanguard Group, Inc.; Chief Financial Officer of each of the investment companies served by The Vanguard Group; Treasurer of each of the investment companies served by The Vanguard Group (1998–2008).
Peter Mahoney
Born 1974. Controller Since May 2015. Principal Occupation(s) During the Past Five Years and Other Experience: Principal of The Vanguard Group, Inc.; Controller of each of the investment companies served by The Vanguard Group; Head of International Fund Services at The Vanguard Group (2008–2014).
Anne E. Robinson
Born 1970. Secretary Since September 2016. Principal Occupation(s) During the Past Five Years and Other Experience: Managing Director of The Vanguard Group, Inc.; General Counsel of The Vanguard Group; Secretary of The Vanguard Group and of each of the investment companies served by The Vanguard Group; Director and Senior Vice President of Vanguard Marketing Corporation; Managing Director and General Counsel of Global Cards and Consumer Services at Citigroup (2014–2016); Counsel at American Express (2003–2014).
Michael Rollings
Born 1963. Treasurer Since February 2017. Principal Occupation(s) During the Past Five Years and Other Experience: Managing Director of The Vanguard Group, Inc.; Treasurer of each of the investment companies served by The Vanguard Group; Director of Vanguard Marketing Corporation; Executive Vice President and Chief Financial Officer of MassMutual Financial Group (2006–2016).
| |
| Vanguard Senior Management Team |
| |
| Mortimer J. Buckley | Chris D. McIsaac |
| Gregory Davis | James M. Norris |
| John James | Thomas M. Rampulla |
| Martha G. King | Karin A. Risi |
| John T. Marcante | |
Chairman Emeritus and Senior Advisor
John J. Brennan
Chairman, 1996–2009
Chief Executive Officer and President, 1996–2008
Founder
John C. Bogle
Chairman and Chief Executive Officer, 1974–1996
|  |
| P.O. Box 2600 |
| Valley Forge, PA 19482-2600 |
| | |
| | |
| | |
| Connect with Vanguard® > vanguard.com | |
| | |
| | |
| | |
| Fund Information > 800-662-7447 | |
| Direct Investor Account Services > 800-662-2739 | |
| Institutional Investor Services > 800-523-1036 | |
| Text Telephone for People | |
| Who Are Deaf or Hard of Hearing> 800-749-7273 | |
| | |
| This material may be used in conjunction | |
| with the offering of shares of any Vanguard | |
| fund only if preceded or accompanied by | |
| the fund’s current prospectus. | |
| | |
| All comparative mutual fund data are from Lipper, a | |
| Thomson Reuters Company, or Morningstar, Inc., unless | |
| otherwise noted. | |
| | |
| You can obtain a free copy of Vanguard’s proxy voting | |
| guidelines by visiting vanguard.com/proxyreporting or by | |
| calling Vanguard at 800-662-2739. The guidelines are | |
| also available from the SEC’s website, sec.gov. In | |
| addition, you may obtain a free report on how your fund | |
| voted the proxies for securities it owned during the 12 | |
| months ended June 30. To get the report, visit either | |
| vanguard.com/proxyreporting or sec.gov. | |
| | |
| You can review and copy information about your fund at | |
| the SEC’s Public Reference Room in Washington, D.C. To | |
| find out more about this public service, call the SEC at | |
| 202-551-8090. Information about your fund is also | |
| available on the SEC’s website, and you can receive | |
| copies of this information, for a fee, by sending a | |
| request in either of two ways: via email addressed to | |
| publicinfo@sec.gov or via regular mail addressed to the | |
| Public Reference Section, Securities and Exchange | |
| Commission, Washington, DC 20549-1520. | |
| © 2017 The Vanguard Group, Inc. |
| All rights reserved. |
| Vanguard Marketing Corporation, Distributor. |
| | Q4720 112017 |
| |
Item 2: Code of Ethics. The Registrant has adopted a code of ethics that applies to the Registrant’s principal executive officer, principal financial officer, principal accounting officer or controller or persons performing similar functions. The Code of Ethics was amended during the reporting period covered by this report to make certain technical, non-material changes.
Item 3: Audit Committee Financial Expert. All members of the Audit Committee have been determined by the Registrant’s Board of Trustees to be Audit Committee Financial Experts and to be independent: Rajiv L. Gupta, JoAnn Heffernan Heisen, F. Joseph Loughrey, Mark Loughridge, and Peter F. Volanakis.
Item 4: Principal Accountant Fees and Services.
(a) Audit Fees.
Audit Fees of the Registrant
Fiscal Year Ended September 30, 2017: $322,000
Fiscal Year Ended September 30, 2016: $295,000
Aggregate Audit Fees of Registered Investment Companies in the Vanguard Group.
Fiscal Year Ended September 30, 2017: $8,424,459
Fiscal Year Ended September 30, 2016: $9,629,849
Includes fees billed in connection with audits of the Registrant, other registered investment companies in the Vanguard complex, The Vanguard Group, Inc. and Vanguard Marketing Corporation.
(b) Audit-Related Fees.
Fiscal Year Ended September 30, 2017: $3,194,093
Fiscal Year Ended September 30, 2016: $2,717,627
Includes fees billed in connection with assurance and related services provided to the Registrant, other registered investment companies in the Vanguard complex, The Vanguard Group, Inc., and Vanguard Marketing Corporation.
(c) Tax Fees.
Fiscal Year Ended September 30, 2017: $274,313
Fiscal Year Ended September 30, 2016: $254,050
Includes fees billed in connection with tax compliance, planning, and advice services provided to the Registrant, other registered investment companies in the Vanguard complex, The Vanguard Group, Inc., and Vanguard Marketing Corporation.
(d) All Other Fees.
Fiscal Year Ended September 30, 2017: $0
Fiscal Year Ended September 30, 2016: $214,225
Includes fees billed for services related to tax reported information provided to the Registrant, other registered investment companies in the Vanguard complex, The Vanguard Group, Inc., and Vanguard Marketing Corporation.
(e) (1) Pre-Approval Policies. The policy of the Registrant’s Audit Committee is to consider and, if appropriate, approve before the principal accountant is engaged for such services, all specific audit and non-audit services provided to: the Registrant, other registered investment companies in the Vanguard complex, The Vanguard Group, Inc., and entities controlled by The Vanguard Group, Inc. that provide ongoing services to the Registrant. In making a determination, the Audit Committee considers whether the services are consistent with maintaining the principal accountant’s independence.
In the event of a contingency situation in which the principal accountant is needed to provide services in between scheduled Audit Committee meetings, the Chairman of the Audit Committee would be called on to consider and, if appropriate, pre-approve audit or permitted non-audit services in an amount sufficient to complete services through the next Audit Committee meeting, and to determine if such services would be consistent with maintaining the accountant’s independence. At the next scheduled Audit Committee meeting, services and fees would be presented to the Audit Committee for formal consideration, and, if appropriate, approval by the entire Audit Committee. The Audit Committee would again consider whether such services and fees are consistent with maintaining the principal accountant’s independence.
The Registrant’s Audit Committee is informed at least annually of all audit and non-audit services provided by the principal accountant to the Vanguard complex, whether such services are provided to: the Registrant, other registered investment companies in the Vanguard complex, The Vanguard Group, Inc., or other entities controlled by The Vanguard Group, Inc. that provide ongoing services to the Registrant.
(2) No percentage of the principal accountant’s fees or services were approved pursuant to the waiver provision of paragraph (c)(7)(i)(C) of Rule 2-01 of Regulation S-X.
(f) For the most recent fiscal year, over 50% of the hours worked under the principal accountant’s engagement were not performed by persons other than full-time, permanent employees of the principal accountant.
(g) Aggregate Non-Audit Fees.
Fiscal Year Ended September 30, 2017: $274,313
Fiscal Year Ended September 30, 2016: $468,275
Includes fees billed for non-audit services provided to the Registrant, other registered investment companies in the Vanguard complex, The Vanguard Group, Inc., and Vanguard Marketing Corporation.
(h) For the most recent fiscal year, the Audit Committee has determined that the provision of all non-audit services was consistent with maintaining the principal accountant’s independence.
Item 5: Audit Committee of Listed Registrants.
The Registrant is a listed issuer as defined in rule 10A-3 under the Securities Exchange Act of 1934 (“Exchange Act”). The Registrant has a separately-designated standing audit committee established in accordance with Section 3(a)(58)(A) of the Exchange Act. The Registrant’s audit committee members are: Rajiv L. Gupta, JoAnn Heffernan Heisen, F. Joseph Loughrey, Mark Loughridge, and Peter F. Volanakis.
Item 6: Investments.
Not Applicable.
Item 7: Disclosure of Proxy Voting Policies and Procedures for Closed-End Management
Investment Companies.
Not Applicable.
Item 8: Portfolio Managers of Closed-End Management Investment Companies.
Not Applicable.
Item 9: Purchase of Equity Securities by Closed-End Management Investment Company and
Affiliated Purchasers.
Not Applicable.
Item 10: Submission of Matters to a Vote of Security Holders.
Not Applicable.
Item 11: Controls and Procedures.
(a) Disclosure Controls and Procedures. The Principal Executive and Financial Officers concluded that the Registrant’s Disclosure Controls and Procedures are effective based on their evaluation of the Disclosure Controls and Procedures as of a date within 90 days of the filing date of this report.
(b) Internal Control Over Financial Reporting. There were no significant changes in Registrant’s Internal Control Over Financial Reporting or in other factors that could significantly affect this control subsequent to the date of the evaluation, including any corrective actions with regard to significant deficiencies and material weaknesses.
Item 12: Disclosure of Securities Lending Activities for Closed-End Management
Investment Companies.
Not Applicable.
Item 13: Exhibits.
(a) Code of Ethics.
(b) Certifications.
Pursuant to the requirements of the Securities Exchange Act of 1934 and the Investment Company Act of 1940, the registrant has duly caused this report to be signed on its behalf by the undersigned, thereunto duly authorized.
| |
| | VANGUARD MALVERN FUNDS |
| |
| |
| BY: | /s/ F. WILLIAM MCNABB III* |
| | F. WILLIAM MCNABB III |
| | CHIEF EXECUTIVE OFFICER |
| |
| Date: November 21, 2017 |
Pursuant to the requirements of the Securities Exchange Act of 1934 and the Investment Company Act of 1940, this report has been signed below by the following persons on behalf of the registrant and in the capacities and on the dates indicated.
| |
| | VANGUARD MALVERN FUNDS |
| |
BY: | /s/ F. WILLIAM MCNABB III* |
| | F. WILLIAM MCNABB III |
| | CHIEF EXECUTIVE OFFICER |
| Date: November 21, 2017 |
| VANGUARD MALVERN FUNDS |
| |
BY: | /s/ THOMAS J. HIGGINS* |
| | THOMAS J. HIGGINS |
| | CHIEF FINANCIAL OFFICER |
| Date: November 21, 2017 |
* By: /s/ Anne E. Robinson
Anne E. Robinson, pursuant to a Power of Attorney filed on October 4, 2016 see file Number
33-32548, Incorporated by Reference.