UNITED STATES
SECURITIES AND EXCHANGE COMMISSION
Washington, D.C. 20549
FORM N-CSR
CERTIFIED SHAREHOLDER REPORT
OF
REGISTERED MANAGEMENT INVESTMENT COMPANIES
Investment Company Act file number: 811-05628
Name of Registrant: | Vanguard Malvern Funds |
Address of Registrant: | P.O. Box 2600 |
| Valley Forge, PA 19482 |
| |
Name and address of agent for service: | Anne E. Robinson, Esquire |
| P.O. Box 876 |
| Valley Forge, PA 19482 |
Registrant’s telephone number, including area code: (610) 669-1000
Date of fiscal year end: September 30
Date of reporting period: October 1, 2018—September 30, 2019
Item 1: Reports to Shareholders

Annual Report | September 30, 2019 Vanguard U.S. Value Fund |
See the inside front cover for important information about access to your fund’s annual and semiannual shareholder reports. |
Important information about access to shareholder reports
Beginning on January 1, 2021, as permitted by regulations adopted by the Securities and Exchange Commission, paper copies of your fund’s annual and semiannual shareholder reports will no longer be sent to you by mail, unless you specifically request them. Instead, you will be notified by mail each time a report is posted on the website and will be provided with a link to access the report.
If you have already elected to receive shareholder reports electronically, you will not be affected by this change and do not need to take any action. You may elect to receive shareholder reports and other communications from the fund electronically by contacting your financial intermediary (such as a broker-dealer or bank) or, if you invest directly with the fund, by calling Vanguard at one of the phone numbers on the back cover of this report or by logging on to vanguard.com.
You may elect to receive paper copies of all future shareholder reports free of charge. If you invest through a financial intermediary, you can contact the intermediary to request that you continue to receive paper copies. If you invest directly with the fund, you can call Vanguard at one of the phone numbers on the back cover of this report or log on to vanguard.com. Your election to receive paper copies will apply to all the funds you hold through an intermediary or directly with Vanguard.
Contents | |
| |
| |
A Note From Our Chairman | 1 |
| |
Your Fund’s Performance at a Glance | 2 |
| |
Advisor’s Report | 3 |
| |
About Your Fund’s Expenses | 5 |
| |
Performance Summary | 7 |
| |
Financial Statements | 9 |
Please note: The opinions expressed in this report are just that—informed opinions. They should not be considered promises or advice. Also, please keep in mind that the information and opinions cover the period through the date on the front of this report. Of course, the risks of investing in your fund are spelled out in the prospectus.
A Note From Our Chairman

Tim Buckley
Chairman and Chief Executive Officer
Dear Shareholder,
Recent volatility in financial markets—affecting stocks, bonds, and commodities—has been a good reminder of the wise old adage, “Never keep all your eggs in one basket.” Maintaining balance and diversification in your investment portfolio can help to both limit risk and set you up for long-term success.
It’s understandable why some investors might become complacent after a long market run-up like the one that lifted stock prices, especially U.S. stock prices, in the years following the global financial crisis. But failing to rebalance regularly can leave a portfolio with a much different mix of assets than intended and, often, more risk than intended.
Balance across and diversification within asset classes are powerful tools for managing risk and achieving your investment goals. A portfolio’s allocation will determine a large portion of its long-term return and also the majority of its volatility risk. A well-diversified portfolio is less vulnerable to significant swings in the performance of any one segment of the asset classes in which it invests.
Balance and diversification will never eliminate the risk of loss, nor will they guarantee positive returns in a declining market. But they should reduce the chance that you’ll suffer disproportionate losses in one particular high-flying asset class or sector when it comes back to earth. And exposure to all key market components should give you at least some participation in the sectors that are performing best at any given time.
Vanguard is committed to helping you achieve balance and diversification in your portfolios to help meet your investment goals. We thank you for your continued loyalty.
Sincerely,

Mortimer J. Buckley
Chairman and Chief Executive Officer
October 14, 2019
1
Your Fund’s Performance at a Glance
· Vanguard U.S. Value Fund posted a return of about —3% for the 12 months ended September 30, 2019, well below the performance of its benchmark, the Russell 3000 Value Index, which had a positive return of more than 3% for the period
· The broad U.S. stock market as measured by the Russell 3000 Index returned nearly 3% during the period. While stocks endured stretches of volatility at the end of 2018 and during the spring of 2019, performance was boosted by the accommodative stance of the Federal Reserve. The Fed cut interest rates in August and September in response to a softening economy.
· Information technology was the only sector that contributed positively to performance on a relative basis. Energy, industrial, and health care stocks detracted most.
· Over the ten years ended September 30, 2019, the fund’s average annual return of 11.39% was slightly above that of its benchmark.
Market Barometer | | | |
| Average Annual Total Returns |
| Periods Ended September 30, 2019 |
| One Year | Three Years | Five Years |
Stocks | | | |
Russell 1000 Index (Large-caps) | 3.87% | 13.19% | 10.62% |
Russell 2000 Index (Small-caps) | -8.89 | 8.23 | 8.19 |
Russell 3000 Index (Broad U.S. market) | 2.92 | 12.83 | 10.44 |
FTSE All-World ex US Index (International) | -1.12 | 6.46 | 3.24 |
| | | |
Bonds | | | |
Bloomberg Barclays U.S. Aggregate Bond Index | | | |
(Broad taxable market) | 10.30% | 2.92% | 3.38% |
Bloomberg Barclays Municipal Bond Index | | | |
(Broad tax-exempt market) | 8.55 | 3.19 | 3.66 |
FTSE Three-Month U.S. Treasury Bill Index | 2.36 | 1.52 | 0.95 |
| | | |
CPI | | | |
Consumer Price Index | 1.71% | 2.07% | 1.53% |
2
Advisor’s Report
For the 12 months ended September 30, 2019, Vanguard U.S. Value Fund posted a return of about —3%, well below the return of its benchmark index, the Russell 3000 Value Index.
Investment objective and strategy
Although it’s important to understand how overall performance is affected by macroeconomic factors, our strategy focuses on company-specific fundamentals—not technical analysis. Our stock selection model evaluates companies within our investment universe to identify those with attractive characteristics that we believe will outperform over the long run.
To do this, we use a strict quantitative process that focuses on a combination of five key themes or decision models: high quality—healthy balance sheets and consistent cash-flow generation; effective use of capital by management—sound investment policies that favor internal over external funding; consistent earnings growth—a demonstrated ability to grow earnings year after year; strong market sentiment—market confirmation of our view; and reasonable valuation—avoidance of overpriced stocks.
The interaction of these themes generates an opinion on all the stocks in our universe each day. Using the results of our model, we then construct our portfolio with the goal of maximizing expected return while minimizing exposure to risks that our research indicates do not improve returns, such as industry selection and other risks relative to our benchmark.
Investment environment
The recent macroeconomic environment—characterized by high economic and policy uncertainty, low GDP growth, and low interest rates—has contributed to some extraordinary trends in the equity markets. These trends are not unusual at the late stage of a business cycle and include:
· Value underperformance. We’ve seen the longest stretch of value underperformance since the dot-com bubble burst in 2000. Investors have been flocking to high-growth-potential companies with the hope of higher returns without necessarily looking at the underlying earnings. As a result, these companies are trading at inflated valuations that increasingly diverge from those of value companies.
· Sentiment rules. The equity market has mostly been trading on sentiment, with investors reacting to macroeconomic shocks such as tariffs and Federal Reserve interest rate announcements while largely ignoring fundamentals (quality, growth, etc.) since spring 2018.
· “Junk” rally. A big junk rally in which stocks with high valuations and low-quality earnings outperform began in January. It has been a risk-on and fundamental-off market, in which investors give up safety for returns.
3
While market environments such as the one we’ve experienced can be challenging for investors, it is crucial to maintain a long-term focus. These market conditions are not unusual at the late stage of a business cycle, and investors should expect to experience them at least once during their investment life.
As with any other form of active equity management, our strategies are designed to deliver long-term outperformance. Often, quantitatively driven funds are among the first to bounce back after a drop in the markets and can weather unpredictable markets by staying focused on the historical trends and in-depth data analysis performed regularly by expert portfolio managers, analysts, and traders.
Our successes and failures
Against this backdrop, the fund underperformed across the board as all five of our decision models did not perform as expected, and ten of the fund’s 11 industry sectors detracted from performance on a relative basis. Only information technology added to performance while energy, industrials, and health care were the biggest detractors.
The portfolio benefited from its holdings in information technology stocks Enphase Energy, Booz Allen Hamilton, and Electro Scientific Industries. The greatest shortfalls came from Mallinckrodt in health care, Tailored Brands in consumer discretionary, and Universal Insurance Holdings in financials.
We continue to believe that constructing a portfolio focused on the fundamentals we’ve described will benefit investors over the long term, although we recognize that markets can reward or punish us in the near term. We believe the fund offers a strong mix of stocks with attractive valuation and growth characteristics.
Portfolio Managers:
James P. Stetler
Binbin Guo, Principal, Head of
Alpha Equity Investments
Vanguard Quantitative Equity Group
October 18, 2019
4
About Your Fund’s Expenses
As a shareholder of the fund, you incur ongoing costs, which include costs for portfolio management, administrative services, and shareholder reports (like this one), among others. Operating expenses, which are deducted from a fund’s gross income, directly reduce the investment return of the fund.
A fund’s expenses are expressed as a percentage of its average net assets. This figure is known as the expense ratio. The following examples are intended to help you understand the ongoing costs (in dollars) of investing in your fund and to compare these costs with those of other mutual funds. The examples are based on an investment of $1,000 made at the beginning of the period shown and held for the entire period.
The accompanying table illustrates your fund’s costs in two ways:
· Based on actual fund return. This section helps you to estimate the actual expenses that you paid over the period. The “Ending Account Value” shown is derived from the fund’s actual return, and the third column shows the dollar amount that would have been paid by an investor who started with $1,000 in the fund. You may use the information here, together with the amount you invested, to estimate the expenses that you paid over the period.
To do so, simply divide your account value by $1,000 (for example, an $8,600 account value divided by $1,000 = 8.6), then multiply the result by the number given for your fund under the heading “Expenses Paid During Period.”
· Based on hypothetical 5% yearly return. This section is intended to help you compare your fund’s costs with those of other mutual funds. It assumes that the fund had a yearly return of 5% before expenses, but that the expense ratio is unchanged. In this case—because the return used is not the fund’s actual return—the results do not apply to your investment. The example is useful in making comparisons because the Securities and Exchange Commission requires all mutual funds to calculate expenses based on a 5% return. You can assess your fund’s costs by comparing this hypothetical example with the hypothetical examples that appear in shareholder reports of other funds.
Note that the expenses shown in the table are meant to highlight and help you compare ongoing costs only and do not reflect transaction costs incurred by the fund for buying and selling securities. Further, the expenses do not include any purchase, redemption, or account service fees described in the fund prospectus. If such fees were applied to your account, your costs would be higher. Your fund does not carry a “sales load.”
The calculations assume no shares were bought or sold during the period. Your actual costs may have been higher or lower, depending on the amount of your investment and the timing of any purchases or redemptions.
You can find more information about the fund’s expenses, including annual expense ratios, in the Financial Statements section of this report. For additional information on operating expenses and other shareholder costs, please refer to your fund’s current prospectus.
5
Six Months Ended September 30, 2019 | | | |
| Beginning | Ending | Expenses |
| Account Value | Account Value | Paid During |
U.S. Value Fund | 3/31/2019 | 9/30/2019 | Period |
Based on Actual Fund Return | $1,000.00 | $1,027.92 | $1.12 |
Based on Hypothetical 5% Yearly Return | 1,000.00 | 1,023.97 | 1.12 |
The calculations are based on expenses incurred in the most recent six-month period. The fund’s annualized six-month expense ratio for that period is 0.22%. The dollar amounts shown as “Expenses Paid” are equal to the annualized expense ratio multiplied by the average account value over the period, multiplied by the number of days in the most recent six-month period, then divided by the number of days in the most recent 12-month period (183/365).
6
U.S. Value Fund
Performance Summary
All of the returns in this report represent past performance, which is not a guarantee of future results that may be achieved by the fund. (Current performance may be lower or higher than the performance data cited. For performance data current to the most recent month-end, visit our website at vanguard.com/performance.) Note, too, that both investment returns and principal value can fluctuate widely, so an investor’s shares, when sold, could be worth more or less than their original cost. The returns shown do not reflect taxes that a shareholder would pay on fund distributions or on the sale of fund shares.
Cumulative Performance: September 30, 2009, Through September 30, 2019
Initial Investment of $10,000

| | Average Annual Total Returns | |
| | Periods Ended September 30, 2019 | |
| | | | | Final Value |
| | One | Five | Ten | of a $10,000 |
| | Year | Years | Years | Investment |

| U.S. Value Fund | -2.98% | 6.71% | 11.39% | $29,397 |

| Russell 3000 Value Index | 3.10 | 7.76 | 11.36 | 29,336 |

| Dow Jones U.S. Total Stock Market Float Adjusted Index | 2.81 | 10.40 | 13.09 | 34,207 |
See Financial Highlights for dividend and capital gains information.
7
U.S. Value Fund
Sector Diversification
As of September 30, 2019
Communication Services | | 7.7 | % |
Consumer Discretionary | | 6.6 | |
Consumer Staples | | 8.6 | |
Energy | | 8.3 | |
Financials | | 24.0 | |
Health Care | | 12.1 | |
Industrials | | 9.9 | |
Information Technology | | 6.1 | |
Materials | | 4.2 | |
Real Estate | | 5.7 | |
Utilities | | 6.8 | |
The table reflects the fund’s equity exposure, based on its investments in stocks and stock index futures. Any holdings in short-term reserves are excluded. Sector categories are based on the Global Industry Classification Standard (“GICS”), except for the “Other” category (if applicable), which includes securities that have not been provided a GICS classification as of the effective reporting period.
The Global Industry Classification Standard (“GICS”) was developed by and is the exclusive property and a service mark of MSCI Inc. (“MSCI”) and Standard and Poor’s, a division of McGraw-Hill Companies, Inc. (“S&P”), and is licensed for use by Vanguard. Neither MSCI, S&P nor any third party involved in making or compiling the GICS or any GICS classification makes any express or implied warranties or representations with respect to such standard or classification (or the results to be obtained by the use thereof), and all such parties hereby expressly disclaim all warranties of originality, accuracy, completeness, merchantability or fitness for a particular purpose with respect to any such standard or classification. Without limiting any of the foregoing, in no event shall MSCI, S&P, any of its affiliates or any third party involved in making or compiling the GICS or any classification have any liability for any direct, indirect, special, punitive, consequential or any other damages (including lost profits) even if notified of the possibility of such damages.
8
U.S. Value Fund
Financial Statements
Statement of Net Assets
As of September 30, 2019
The fund files its complete schedule of portfolio holdings with the Securities and Exchange Commission (SEC) for the first and third quarters of each fiscal year as an exhibit to its reports on Form N-PORT. The fund’s Form N-PORT reports are available on the SEC’s website at www.sec.gov.
| | | Market |
| | | Value· |
| | Shares | ($000) |
Common Stocks (99.5%)1 | | |
Communication Services (7.6%) | | |
| Verizon Communications Inc. | 390,178 | 23,551 |
| AT&T Inc. | 523,836 | 19,822 |
| Walt Disney Co. | 116,813 | 15,223 |
| Comcast Corp. Class A | 304,245 | 13,715 |
* | Discovery Communications Inc. Class A | 287,571 | 7,658 |
| New York Times Co. Class A | 229,783 | 6,544 |
* | T-Mobile US Inc. | 67,771 | 5,338 |
| CenturyLink Inc. | 321,929 | 4,018 |
| News Corp. Class B | 182,235 | 2,605 |
| Sinclair Broadcast Group Inc. Class A | 41,621 | 1,779 |
| Fox Corp. Class A | 55,012 | 1,735 |
* | Glu Mobile Inc. | 312,253 | 1,558 |
| Telephone & Data Systems Inc. | 53,439 | 1,379 |
* | Bandwidth Inc. Class A 20 | 20,773 | 1,353 |
| TEGNA Inc. | 79,331 | 1,232 |
* | United States Cellular Corp. | 29,991 | 1,127 |
* | Discovery Communications Inc. | 35,934 | 885 |
| News Corp. Class A | 50,656 | 705 |
| Fox Corp. Class B | 22,271 | 702 |
| | | 110,929 |
Consumer Discretionary (6.5%) | | |
| Home Depot Inc. | 46,169 | 10,712 |
| Whirlpool Corp. | 54,037 | 8,557 |
| Gentex Corp. | 290,292 | 7,993 |
| Brinker International Inc. | 175,159 | 7,474 |
| Rent-A-Center Inc. | 266,840 | 6,882 |
*,^ | YETI Holdings Inc. | 218,522 | 6,119 |
| Best Buy Co. Inc. | 87,831 | 6,060 |
| McDonald’s Corp. | 26,141 | 5,613 |
| Carnival Corp. | 117,386 | 5,131 |
* | frontdoor Inc. | 105,261 | 5,113 |
* | Genesco Inc. | 103,922 | 4,159 |
| Yum! Brands Inc. | 27,639 | 3,135 |
| Expedia Group Inc. | 20,261 | 2,723 |
* | Stoneridge Inc. | 80,727 | 2,500 |
| Lear Corp. | 20,934 | 2,468 |
| Standard Motor Products Inc. | 31,812 | 1,545 |
* | American Axle & Manufacturing Holdings Inc. | 145,783 | 1,198 |
* | AutoZone Inc. | 772 | 837 |
* | Deckers Outdoor Corp. | 5,425 | 799 |
* | K12 Inc. | 30,137 | 796 |
* | Under Armour Inc. Class C | 42,469 | 770 |
| Las Vegas Sands Corp. | 12,474 | 721 |
| Signet Jewelers Ltd. | 42,624 | 714 |
| Dine Brands Global Inc. | 9,390 | 712 |
* | Modine Manufacturing Co. | 62,644 | 712 |
* | 1-800-Flowers.com Inc. Class A | 40,399 | 598 |
| | | 94,041 |
Consumer Staples (8.6%) | | |
| Procter & Gamble Co. | 216,996 | 26,990 |
| Philip Morris International Inc. | 253,984 | 19,285 |
| Walmart Inc. | 132,912 | 15,774 |
| PepsiCo Inc. | 77,170 | 10,580 |
| Bunge Ltd. | 143,599 | 8,131 |
| Molson Coors Brewing Co. Class B | 126,312 | 7,263 |
| Campbell Soup Co. | 141,283 | 6,629 |
| Coty Inc. Class A | 597,585 | 6,281 |
* | TreeHouse Foods Inc. | 111,529 | 6,184 |
| Casey’s General Stores Inc. | 31,867 | 5,136 |
* | Edgewell Personal Care Co. | 151,831 | 4,933 |
* | US Foods Holding Corp. | 78,406 | 3,222 |
| Kimberly-Clark Corp. | 16,132 | 2,291 |
^ | B&G Foods Inc. | 67,753 | 1,281 |
| | | 123,980 |
9
U.S. Value Fund
| | | Market |
| | | Value· |
| | Shares | ($000) |
Energy (8.3%) | | |
| Chevron Corp. | 263,716 | 31,277 |
| Exxon Mobil Corp. | 388,922 | 27,462 |
| ConocoPhillips | 257,893 | 14,695 |
| Devon Energy Corp. | 332,036 | 7,989 |
| Occidental Petroleum Corp. | 169,454 | 7,536 |
* | Southwestern Energy Co. | 3,719,332 | 7,178 |
| HollyFrontier Corp. | 130,111 | 6,979 |
* | W&T Offshore Inc. | 1,134,668 | 4,958 |
| Range Resources Corp. | 949,275 | 3,626 |
| Phillips 66 | 27,425 | 2,808 |
| Valero Energy Corp. | 30,714 | 2,618 |
| Cabot Oil & Gas Corp. | 51,486 | 905 |
* | Continental Resources Inc. | 25,935 | 798 |
* | CONSOL Energy Inc. | 42,615 | 666 |
| Delek US Holdings Inc. | 12,227 | 444 |
| | | 119,939 |
Financials (23.9%) | | |
| JPMorgan Chase & Co. | 390,091 | 45,910 |
* | Berkshire Hathaway Inc. Class B | 167,775 | 34,900 |
| Bank of America Corp. | 1,154,489 | 33,676 |
| Citigroup Inc. | 217,792 | 15,045 |
| Wells Fargo & Co. | 282,515 | 14,250 |
| Allstate Corp. | 117,135 | 12,730 |
| Capital One Financial Corp. | 138,994 | 12,646 |
| MetLife Inc. | 232,985 | 10,988 |
| American Express Co. | 90,841 | 10,745 |
| Ally Financial Inc. | 307,578 | 10,199 |
| Fifth Third Bancorp | 363,719 | 9,959 |
| Regions Financial Corp. | 614,456 | 9,721 |
| Discover Financial Services | 116,698 | 9,463 |
| Synchrony Financial | 276,354 | 9,421 |
| Ameriprise Financial Inc. | 62,878 | 9,249 |
| Aflac Inc. | 168,343 | 8,808 |
| AXA Equitable Holdings Inc. | 388,784 | 8,615 |
| OFG Bancorp | 380,221 | 8,327 |
| Zions Bancorp NA | 183,761 | 8,181 |
| Hanover Insurance Group Inc. | 59,764 | 8,100 |
| Progressive Corp. | 83,293 | 6,434 |
| Comerica Inc. | 89,763 | 5,923 |
| Unum Group | 182,016 | 5,409 |
| Navient Corp. | 416,359 | 5,329 |
| Popular Inc. | 92,006 | 4,976 |
* | Brighthouse Financial Inc. | 113,410 | 4,590 |
| Erie Indemnity Co. Class A | 21,971 | 4,079 |
| FNB Corp. | 284,976 | 3,286 |
| Universal Insurance Holdings Inc. | 104,809 | 3,143 |
| Radian Group Inc. | 132,231 | 3,020 |
* | Athene Holding Ltd. Class A | 54,524 | 2,293 |
| Walker & Dunlop Inc. | 29,961 | 1,676 |
| Primerica Inc. | 10,922 | 1,390 |
| First Horizon National Corp. | 70,037 | 1,135 |
| OneMain Holdings Inc. | 25,615 | 940 |
| US Bancorp | 13,462 | 745 |
| Morgan Stanley | 16,775 | 716 |
| | | 346,017 |
Health Care (12.1%) | | |
| Johnson & Johnson | 231,223 | 29,916 |
| Abbott Laboratories | 204,950 | 17,148 |
| Pfizer Inc. | 383,094 | 13,765 |
| Anthem Inc. | 50,374 | 12,095 |
* | IQVIA Holdings Inc. | 71,153 | 10,629 |
| Bristol-Myers Squibb Co. | 195,841 | 9,931 |
| Merck & Co. Inc. | 116,773 | 9,830 |
| McKesson Corp. | 67,825 | 9,269 |
| Cooper Cos. Inc. | 30,759 | 9,135 |
| HCA Healthcare Inc. | 67,342 | 8,109 |
| Cardinal Health Inc. | 158,846 | 7,496 |
* | Integer Holdings Corp. | 94,435 | 7,136 |
| Medtronic plc | 56,807 | 6,170 |
| Danaher Corp. | 27,864 | 4,024 |
| Amgen Inc. | 16,037 | 3,103 |
* | Medpace Holdings Inc. | 35,233 | 2,961 |
* | Syneos Health Inc. | 49,504 | 2,634 |
| Eli Lilly & Co. | 18,858 | 2,109 |
| Thermo Fisher Scientific Inc. | 7,055 | 2,055 |
* | Enanta Pharmaceuticals Inc. | 30,245 | 1,817 |
*,^ | Mallinckrodt plc | 651,539 | 1,570 |
* | AMAG Pharmaceuticals Inc. | 122,911 | 1,420 |
*,^ | Intrexon Corp. | 229,669 | 1,314 |
| Owens & Minor Inc. | 185,151 | 1,076 |
| | | 174,712 |
Industrials (9.9%) | | |
| Honeywell International Inc. | 80,563 | 13,631 |
| L3Harris Technologies Inc. | 51,911 | 10,831 |
* | United Airlines Holdings Inc. | 116,786 | 10,325 |
| General Electric Co. | 1,125,501 | 10,062 |
* | FTI Consulting Inc. | 87,268 | 9,249 |
10
U.S. Value Fund
| | | Market |
| | | Value· |
| | Shares | ($000) |
| WW Grainger Inc. | 28,276 | 8,402 |
| Caterpillar Inc. | 65,272 | 8,244 |
| Spirit AeroSystems Holdings Inc. Class A | 100,085 | 8,231 |
| Lockheed Martin Corp. | 19,777 | 7,714 |
* | Aerojet Rocketdyne Holdings Inc. | 141,967 | 7,171 |
| Pentair plc | 148,117 | 5,599 |
* | Builders FirstSource Inc. | 261,585 | 5,382 |
| Landstar System Inc. | 38,366 | 4,319 |
| AGCO Corp. | 52,338 | 3,962 |
| Macquarie Infrastructure Corp. | 92,497 | 3,651 |
| Triumph Group Inc. | 132,811 | 3,039 |
* | WESCO International Inc. | 60,136 | 2,873 |
| United Technologies Corp. | 20,867 | 2,849 |
| ArcBest Corp. | 86,175 | 2,624 |
| Expeditors International of Washington Inc. | 30,014 | 2,230 |
* | GMS Inc. | 71,327 | 2,048 |
* | BMC Stock Holdings Inc. | 67,221 | 1,760 |
* | JetBlue Airways Corp. | 91,085 | 1,526 |
| Allison Transmission Holdings Inc. | 32,313 | 1,520 |
| Nielsen Holdings plc | 45,923 | 976 |
| PACCAR Inc. | 13,678 | 958 |
* | Hub Group Inc. Class A | 19,751 | 918 |
* | Echo Global Logistics Inc. | 37,389 | 847 |
| Delta Air Lines Inc. | 13,136 | 757 |
| Heidrick & Struggles International Inc. | 27,371 | 747 |
* | Foundation Building Materials Inc. | 48,218 | 747 |
| | | 143,192 |
Information Technology (6.0%) | | |
| Intel Corp. | 383,654 | 19,770 |
| Booz Allen Hamilton Holding Corp. Class A | 119,493 | 8,486 |
| HP Inc. | 386,126 | 7,306 |
* | CACI International Inc. Class A | 30,175 | 6,978 |
* | Dell Technologies Inc. | 126,010 | 6,535 |
| QUALCOMM Inc. | 82,982 | 6,330 |
* | Enphase Energy Inc. | 263,285 | 5,853 |
* | Tech Data Corp. | 43,184 | 4,502 |
* | Synaptics Inc. | 82,165 | 3,283 |
* | SunPower Corp. Class A | 263,324 | 2,889 |
* | Diebold Nixdorf Inc. | 257,001 | 2,878 |
* | Cardtronics plc Class A | 86,554 | 2,617 |
* | ON Semiconductor Corp. | 129,696 | 2,491 |
| Avnet Inc. | 51,281 | 2,281 |
* | SMART Global Holdings Inc. | 53,288 | 1,358 |
| International Business Machines Corp. | 8,059 | 1,172 |
* | Teradata Corp. | 31,306 | 970 |
* | eGain Corp. | 107,212 | 858 |
* | Unisys Corp. | 97,678 | 726 |
| | | 87,283 |
Materials (4.2%) | | |
| CF Industries Holdings Inc. | 206,205 | 10,145 |
| Ecolab Inc. | 43,500 | 8,615 |
| Ball Corp. | 112,265 | 8,174 |
* | Element Solutions Inc. | 719,200 | 7,322 |
| Reliance Steel & Aluminum Co. | 62,462 | 6,225 |
| International Paper Co. | 115,361 | 4,824 |
| Domtar Corp. | 99,425 | 3,560 |
| Linde plc | 12,212 | 2,366 |
| FMC Corp. | 25,100 | 2,201 |
| Valvoline Inc. | 98,321 | 2,166 |
* | Allegheny Technologies Inc. | 95,305 | 1,930 |
| Dow Inc. | 38,534 | 1,836 |
| Owens-Illinois Inc. | 118,402 | 1,216 |
| | | 60,580 |
Real Estate (5.7%) | | |
| Spirit Realty Capital Inc. | 200,026 | 9,573 |
| Essex Property Trust Inc. | 28,710 | 9,378 |
| Medical Properties Trust Inc. | 475,548 | 9,302 |
| EPR Properties | 108,875 | 8,368 |
| Brixmor Property Group Inc. | 393,410 | 7,982 |
| Park Hotels & Resorts Inc. | 266,018 | 6,643 |
| HCP Inc. | 177,498 | 6,324 |
| Ventas Inc. | 55,949 | 4,086 |
| Omega Healthcare Investors Inc. | 86,154 | 3,600 |
| Hannon Armstrong Sustainable Infrastructure Capital Inc. | 123,045 | 3,587 |
| Lexington Realty Trust Class B | 294,082 | 3,014 |
| SITE Centers Corp. | 164,527 | 2,486 |
| Macerich Co. | 63,231 | 1,998 |
| Equity Commonwealth | 43,148 | 1,478 |
| Regency Centers Corp. | 20,257 | 1,408 |
| CoreCivic Inc. | 66,922 | 1,157 |
| Equity Residential | 12,674 | 1,093 |
| Kennedy-Wilson Holdings Inc. | 37,564 | 823 |
| | | 82,300 |
11
U.S. Value Fund
| | | Market |
| | | Value· |
| | Shares | ($000) |
Utilities (6.7%) | | |
| Southern Co. | 245,343 | 15,155 |
| Exelon Corp. | 283,033 | 13,673 |
| FirstEnergy Corp. | 240,593 | 11,604 |
| NRG Energy Inc. | 241,775 | 9,574 |
| AES Corp. | 578,792 | 9,457 |
| Vistra Energy Corp. | 327,595 | 8,757 |
| Ameren Corp. | 64,491 | 5,163 |
| Eversource Energy | 53,531 | 4,575 |
| Evergy Inc. | 59,952 | 3,990 |
| Entergy Corp. | 24,642 | 2,892 |
| Duke Energy Corp. | 29,624 | 2,840 |
| IDACORP Inc. | 22,155 | 2,496 |
| NextEra Energy Inc. | 10,610 | 2,472 |
| ALLETE Inc. | 22,165 | 1,937 |
| Hawaiian Electric Industries Inc. | 31,520 | 1,438 |
| PNM Resources Inc. | 15,267 | 795 |
| Clearway Energy Inc. Class A | 45,607 | 791 |
| | | 97,609 |
Total Common Stocks (Cost $1,236,797) | | 1,440,582 |
Temporary Cash Investments (2.2%)1 | | |
Money Market Fund (2.1%) | | |
2,3 | Vanguard Market Liquidity Fund, 2.098% | 306,381 | 30,641 |
| | Face | |
| | Amount | |
| | ($000) | |
U.S. Government and Agency Obligations (0.1%) | | |
4 | United States Treasury Bill, 1.931%, 11/29/19 | 400 | 399 |
Total Temporary Cash Investments (Cost $31,039) | 31,040 | |
Total Investments (101.7%) (Cost $1,267,836) | 1,471,622 | |
| Amount |
| ($000) |
Other Assets and Liabilities (-1.7%) | |
Other Assets | |
Investment in Vanguard | 67 |
Receivables for Investment Securities Sold | 3,232 |
Receivables for Accrued Income | 2,020 |
Receivables for Capital Shares Issued | 381 |
Variation Margin Receivable— Futures Contracts | 37 |
Other Assets4 | 675 |
Total Other Assets | 6,412 |
Liabilities | |
Payables for Investment Securities Purchased | (4,434) |
Collateral for Securities on Loan | (8,324) |
Payables for Capital Shares Redeemed | (1,238) |
Payables to Vanguard | (806) |
Other Liabilities | (15,853) |
Total Liabilities | (30,655) |
Net Assets (100%) | |
Applicable to 80,237,132 outstanding $.001 par value shares of beneficial interest (unlimited authorization) | 1,447,379 |
Net Asset Value Per Share | $18.04 |
| |
At September 30, 2019, net assets consisted of: | |
| Amount |
| ($000) |
Paid-in Capital | 1,207,852 |
Total Distributable Earnings (Loss) | 239,527 |
Net Assets | 1,447,379 |
· See Note A in Notes to Financial Statements.
* Non-income-producing security.
^ Includes partial security positions on loan to broker-dealers. The total value of securities on loan is $7,957,000.
1 The fund invests a portion of its cash reserves in equity markets through the use of index futures contracts. After giving effect to futures investments, the fund’s effective common stock and temporary cash investment positions represent 100.0% and 1.7%, respectively, of net assets.
2 Affiliated money market fund available only to Vanguard funds and certain trusts and accounts managed by Vanguard. Rate shown is the 7-day yield.
3 Includes $8,324,000 of collateral received for securities on loan.
4 Securities with a value of $399,000 and cash of $15,000 have been segregated as initial margin for open futures contracts.
12
U.S. Value Fund
Derivative Financial Instruments Outstanding as of Period End | | |
| | |
Futures Contracts | | | | |
| | | | ($000) |
| | | | Value and |
| | Number of | | Unrealized |
| | Long (Short) | Notional | Appreciation |
| Expiration | Contracts | Amount | (Depreciation) |
Long Futures Contracts | | | | |
E-mini S&P 500 Index | December 2019 | 49 | 7,297 | (64) |
See accompanying Notes, which are an integral part of the Financial Statements.
13
U.S. Value Fund
Statement of Operations
| Year Ended |
| September 30, 2019 |
| ($000) |
Investment Income | |
Income | |
Dividends | 37,745 |
Interest1 | 134 |
Securities Lending—Net | 1,795 |
Total Income | 39,674 |
Expenses | |
The Vanguard Group—Note B | |
Investment Advisory Services | 1,213 |
Management and Administrative | 1,848 |
Marketing and Distribution | 162 |
Custodian Fees | 11 |
Auditing Fees | 32 |
Shareholders’ Reports | 27 |
Trustees’ Fees and Expenses | 1 |
Total Expenses | 3,294 |
Net Investment Income | 36,380 |
Realized Net Gain (Loss) | |
Investment Securities Sold1 | 11,837 |
Futures Contracts | 5 |
Realized Net Gain (Loss) | 11,842 |
Change in Unrealized Appreciation (Depreciation) | |
Investment Securities1 | (106,092) |
Futures Contracts | (56) |
Change in Unrealized Appreciation (Depreciation) | (106,148) |
Net Increase (Decrease) in Net Assets Resulting from Operations | (57,926) |
1 Interest income, realized net gain (loss), and change in unrealized appreciation (depreciation) from an affiliated company of the fund were $122,000, $3,000, and $1,000, respectively. Purchases and sales are for temporary cash investment purposes.
See accompanying Notes, which are an integral part of the Financial Statements.
14
U.S. Value Fund
Statement of Changes in Net Assets
| Year Ended September 30, |
| 2019 | 2018 |
| ($000) | ($000) |
Increase (Decrease) in Net Assets | | |
Operations | | |
Net Investment Income | 36,380 | 32,402 |
Realized Net Gain (Loss) | 11,842 | 81,508 |
Change in Unrealized Appreciation (Depreciation) | (106,148) | 50,866 |
Net Increase (Decrease) in Net Assets Resulting from Operations | (57,926) | 164,776 |
Distributions | | |
Net Investment Income | (32,254) | (32,253) |
Realized Capital Gain1 | (71,059) | (97,416) |
Total Distributions | (103,313) | (129,669) |
Capital Share Transactions | | |
Issued | 184,404 | 214,440 |
Issued in Lieu of Cash Distributions | 96,928 | 121,791 |
Redeemed | (364,718) | (354,645) |
Net Increase (Decrease) from Capital Share Transactions | (83,386) | (18,414) |
Total Increase (Decrease) | (244,625) | 16,693 |
Net Assets | | |
Beginning of Period | 1,692,004 | 1,675,311 |
End of Period | 1,447,379 | 1,692,004 |
1 Includes fiscal 2019 and 2018 short-term gain distributions totaling $0 and $22,953,000, respectively. Short-term gain distributions are treated as ordinary income dividends for tax purposes.
See accompanying Notes, which are an integral part of the Financial Statements.
15
U.S. Value Fund
Financial Highlights
For a Share Outstanding | | | Year Ended September 30, |
Throughout Each Period | 2019 | 2018 | 2017 | 2016 | 2015 |
Net Asset Value, Beginning of Period | $20.03 | $19.63 | $17.25 | $16.48 | $16.95 |
Investment Operations | | | | | |
Net Investment Income | .4321 | .3731 | .4371 | .440 | .355 |
Net Realized and Unrealized Gain (Loss) on Investments | (1.176) | 1.563 | 2.606 | 1.341 | (.543) |
Total from Investment Operations | (.744) | 1.936 | 3.043 | 1.781 | (.188) |
Distributions | | | | | |
Dividends from Net Investment Income | (.389) | (.382) | (.386) | (.358) | (.282) |
Distributions from Realized Capital Gains | (.857) | (1.154) | (.277) | (.653) | — |
Total Distributions | (1.246) | (1.536) | (.663) | (1.011) | (.282) |
Net Asset Value, End of Period | $18.04 | $20.03 | $19.63 | $17.25 | $16.48 |
| | | | | |
Total Return2 | -2.98% | 10.22% | 17.87% | 11.09% | -1.18% |
| | | | | |
Ratios/Supplemental Data | | | | | |
Net Assets, End of Period (Millions) | $1,447 | $1,692 | $1,675 | $1,374 | $1,215 |
Ratio of Total Expenses to Average Net Assets | 0.22% | 0.22% | 0.23% | 0.23% | 0.26% |
Ratio of Net Investment Income to Average Net Assets | 2.43% | 1.92% | 2.36% | 2.63% | 2.10% |
Portfolio Turnover Rate | 61% | 75% | 95% | 76% | 66% |
1 Calculated based on average shares outstanding.
2 Total returns do not include account service fees that may have applied in the periods shown. Fund prospectuses provide information about any applicable account service fees.
See accompanying Notes, which are an integral part of the Financial Statements.
16
U.S. Value Fund
Notes to Financial Statements
Vanguard U.S. Value Fund is registered under the Investment Company Act of 1940 as an open-end investment company, or mutual fund.
A. The following significant accounting policies conform to generally accepted accounting principles for U.S. investment companies. The fund consistently follows such policies in preparing its financial statements.
1. Security Valuation: Securities are valued as of the close of trading on the New York Stock Exchange (generally 4 p.m., Eastern time) on the valuation date. Equity securities are valued at the latest quoted sales prices or official closing prices taken from the primary market in which each security trades; such securities not traded on the valuation date are valued at the mean of the latest quoted bid and asked prices. Securities for which market quotations are not readily available, or whose values have been materially affected by events occurring before the fund’s pricing time but after the close of the securities’ primary markets, are valued by methods deemed by the board of trustees to represent fair value. Investments in Vanguard Market Liquidity Fund are valued at that fund’s net asset value. Temporary cash investments are valued using the latest bid prices or using valuations based on a matrix system (which considers such factors as security prices, yields, maturities, and ratings), both as furnished by independent pricing services.
2. Futures Contracts: The fund uses index futures contracts to a limited extent, with the objective of maintaining full exposure to the stock market while maintaining liquidity. The fund may purchase or sell futures contracts to achieve a desired level of investment, whether to accommodate portfolio turnover or cash flows from capital share transactions. The primary risks associated with the use of futures contracts are imperfect correlation between changes in market values of stocks held by the fund and the prices of futures contracts, and the possibility of an illiquid market. Counterparty risk involving futures is mitigated because a regulated clearinghouse is the counterparty instead of the clearing broker. To further mitigate counterparty risk, the fund trades futures contracts on an exchange, monitors the financial strength of its clearing brokers and clearinghouse, and has entered into clearing agreements with its clearing brokers. The clearing-house imposes initial margin requirements to secure the fund’s performance and requires daily settlement of variation margin representing changes in the market value of each contract. Any assets pledged as initial margin for open contracts are noted in the Statement of Net Assets.
Futures contracts are valued at their quoted daily settlement prices. The notional amounts of the contracts are not recorded in the Statement of Net Assets. Fluctuations in the value of the contracts are recorded in the Statement of Net Assets as an asset (liability) and in the Statement of Operations as unrealized appreciation (depreciation) until the contracts are closed, when they are recorded as realized futures gains (losses).
During the year ended September 30, 2019, the fund’s average investments in long and short futures contracts represented 1% and 0% of net assets, respectively, based on the average of the notional amounts at each quarter-end during the period.
3. Federal Income Taxes: The fund intends to continue to qualify as a regulated investment company and distribute all of its taxable income. Management has analyzed the fund’s tax positions taken for all open federal income tax years (September 30, 2016–2019), and has concluded that no provision for federal income tax is required in the fund’s financial statements.
17
U.S. Value Fund
4. Distributions: Distributions to shareholders are recorded on the ex-dividend date. Distributions are determined on a tax basis and may differ from net investment income and realized capital gains for financial reporting purposes.
5. Securities Lending: To earn additional income, the fund lends its securities to qualified institutional borrowers. Security loans are subject to termination by the fund at any time, and are required to be secured at all times by collateral in an amount at least equal to the market value of securities loaned. Daily market fluctuations could cause the value of loaned securities to be more or less than the value of the collateral received. When this occurs, the collateral is adjusted and settled before the opening of the market on the next business day. The fund further mitigates its counterparty risk by entering into securities lending transactions only with a diverse group of prequalified counterparties, monitoring their financial strength, and entering into master securities lending agreements with its counterparties. The master securities lending agreements provide that, in the event of a counterparty’s default (including bankruptcy), the fund may terminate any loans with that borrower, determine the net amount owed, and sell or retain the collateral up to the net amount owed to the fund; however, such actions may be subject to legal proceedings. While collateral mitigates counterparty risk, in the event of a default, the fund may experience delays and costs in recovering the securities loaned. The fund invests cash collateral received in Vanguard Market Liquidity Fund, and records a liability in the Statement of Net Assets for the return of the collateral, during the period the securities are on loan. Securities lending income represents fees charged to borrowers plus income earned on invested cash collateral, less expenses associated with the loan. During the term of the loan, the fund is entitled to all distributions made on or in respect of the loaned securities.
6. Credit Facility: The fund and certain other funds managed by The Vanguard Group (“Vanguard”) participate in a $4.3 billion committed credit facility provided by a syndicate of lenders pursuant to a credit agreement that may be renewed annually; each fund is individually liable for its borrowings, if any, under the credit facility. Borrowings may be utilized for temporary and emergency purposes, and are subject to the fund’s regulatory and contractual borrowing restrictions. The participating funds are charged administrative fees and an annual commitment fee of 0.10% of the undrawn amount of the facility; these fees are allocated to the funds based on a method approved by the fund’s board of trustees and included in Management and Administrative expenses on the fund’s Statement of Operations. Any borrowings under this facility bear interest at a rate based upon the higher of the one-month London Interbank Offered Rate, federal funds effective rate, or overnight bank funding rate plus an agreed-upon spread.
The fund had no borrowings outstanding at September 30, 2019, or at any time during the period then ended.
7. Other: Dividend income is recorded on the ex-dividend date. Interest income includes income distributions received from Vanguard Market Liquidity Fund and is accrued daily. Premiums and discounts on debt securities purchased are amortized and accreted, respectively, to interest income over the lives of the respective securities. Security transactions are accounted for on the date securities are bought or sold. Costs used to determine realized gains (losses) on the sale of investment securities are those of the specific securities sold.
18
U.S. Value Fund
B. In accordance with the terms of a Funds’ Service Agreement (the “FSA”) between Vanguard and the fund, Vanguard furnishes to the fund investment advisory, corporate management, administrative, marketing, distribution, and cash management services at Vanguard’s cost of operations (as defined by the FSA). These costs of operations are allocated to the fund based on methods and guidelines approved by the board of trustees. Vanguard does not require reimbursement in the current period for certain costs of operations (such as deferred compensation/ benefits and risk/insurance costs); the fund’s liability for these costs of operations is included in Payables to Vanguard on the Statement of Net Assets. All other costs of operations payable to Vanguard are generally settled twice a month.
Upon the request of Vanguard, the fund may invest up to 0.40% of its net assets as capital in Vanguard. At September 30, 2019, the fund had contributed to Vanguard capital in the amount of $67,000, representing less than 0.01% of the fund’s net assets and 0.03% of Vanguard’s capital received pursuant to the FSA. The fund’s trustees and officers are also directors and employees, respectively, of Vanguard.
C. Various inputs may be used to determine the value of the fund’s investments. These inputs are summarized in three broad levels for financial statement purposes. The inputs or methodologies used to value securities are not necessarily an indication of the risk associated with investing in those securities.
Level 1—Quoted prices in active markets for identical securities.
Level 2—Other significant observable inputs (including quoted prices for similar securities, interest rates, prepayment speeds, credit risk, etc.).
Level 3—Significant unobservable inputs (including the fund’s own assumptions used to determine the fair value of investments). Any investments valued with significant unobservable inputs are noted on the Statement of Net Assets.
The following table summarizes the market value of the fund’s investments and derivatives as of September 30, 2019, based on the inputs used to value them:
| Level 1 | Level 2 | Level 3 |
Investments | ($000) | ($000) | ($000) |
Common Stocks | 1,440,582 | — | — |
Temporary Cash Investments | 30,641 | 399 | — |
Futures Contracts—Assets1 | 37 | — | — |
Total | 1,471,260 | 399 | — |
1 Represents variation margin on the last day of the reporting period.
D. Permanent differences between book-basis and tax-basis components of net assets are reclassified among capital accounts in the financial statements to reflect their tax character. These reclassifications have no effect on net assets or net asset value per share. As of period end, permanent differences primarily attributable to the accounting for distributions in connection with fund share redemptions were reclassified between the following accounts:
| Amount |
| ($000) |
Paid-in Capital | 1,731 |
Total Distributable Earnings (Loss) | (1,731) |
19
U.S. Value Fund
Temporary differences between book-basis and tax-basis components of total distributable earnings (loss) arise when certain items of income, gain, or loss are recognized in different periods for financial statement and tax purposes; these differences will reverse at some time in the future. The differences are primarily related to the tax deferral of losses on wash sales and the realization of unrealized gains or losses on certain futures contracts. As of period end, the tax-basis components of total distributable earnings (loss) are detailed in the table as follows:
| Amount |
| ($000) |
Undistributed Ordinary Income | 24,945 |
Undistributed Long-Term Gains | 11,450 |
Capital Loss Carryforwards (Non-expiring) | — |
Net Unrealized Gains (Losses) | 203,779 |
As of September 30, 2019, gross unrealized appreciation and depreciation for investments and derivatives based on cost for U.S. federal income tax purposes were as follows:
| Amount |
| ($000) |
Tax Cost | 1,267,843 |
Gross Unrealized Appreciation | 264,556 |
Gross Unrealized Depreciation | (60,777) |
Net Unrealized Appreciation (Depreciation) | 203,779 |
E. During the year ended September 30, 2019, the fund purchased $918,939,000 of investment securities and sold $1,065,427,000 of investment securities, other than temporary cash investments.
F. Capital shares issued and redeemed were:
| Year Ended September 30, |
| 2019 | 2018 |
| Shares | Shares |
| (000) | (000) |
Issued | 10,484 | 11,008 |
Issued in Lieu of Cash Distributions | 6,009 | 6,353 |
Redeemed | (20,731) | (18,245) |
Net Increase (Decrease) in Shares Outstanding | (4,238) | (884) |
G. Management has determined that no events or transactions occurred subsequent to September 30, 2019, that would require recognition or disclosure in these financial statements.
20
Report of Independent Registered
Public Accounting Firm
To the Board of Trustees of Vanguard Malvern Funds and Shareholders of Vanguard U.S. Value Fund
Opinion on the Financial Statements
We have audited the accompanying statement of net assets of Vanguard U.S. Value Fund (one of the funds constituting Vanguard Malvern Funds, referred to hereafter as the “Fund”) as of September 30, 2019, the related statement of operations for the year ended September 30, 2019, the statement of changes in net assets for each of the two years in the period ended September 30, 2019, including the related notes, and the financial highlights for each of the five years in the period ended September 30, 2019 (collectively referred to as the “financial statements”). In our opinion, the financial statements present fairly, in all material respects, the financial position of the Fund as of September 30, 2019, the results of its operations for the year then ended, the changes in its net assets for each of the two years in the period ended September 30, 2019 and the financial highlights for each of the five years in the period ended September 30, 2019 in conformity with accounting principles generally accepted in the United States of America.
Basis for Opinion
These financial statements are the responsibility of the Fund’s management. Our responsibility is to express an opinion on the Fund’s financial statements based on our audits. We are a public accounting firm registered with the Public Company Accounting Oversight Board (United States) (“PCAOB”) and are required to be independent with respect to the Fund in accordance with the U.S. federal securities laws and the applicable rules and regulations of the Securities and Exchange Commission and the PCAOB.
We conducted our audits of these financial statements in accordance with the standards of the PCAOB. Those standards require that we plan and perform the audit to obtain reasonable assurance about whether the financial statements are free of material misstatement, whether due to error or fraud.
Our audits included performing procedures to assess the risks of material misstatement of the financial statements, whether due to error or fraud, and performing procedures that respond to those risks. Such procedures included examining, on a test basis, evidence regarding the amounts and disclosures in the financial statements. Our audits also included evaluating the accounting principles used and significant estimates made by management, as well as evaluating the overall presentation of the financial statements. Our procedures included confirmation of securities owned as of September 30, 2019 by correspondence with the custodian and brokers and by agreement to the underlying ownership records of the transfer agent; when replies were not received from brokers, we performed other auditing procedures. We believe that our audits provide a reasonable basis for our opinion.
/s/PricewaterhouseCoopers LLP
Philadelphia, Pennsylvania
November 13, 2019
We have served as the auditor of one or more investment companies in The Vanguard Group of Funds since 1975.
21
Special 2019 tax information (unaudited) for Vanguard U.S. Value Fund
This information for the fiscal year ended September 30, 2019, is included pursuant to provisions of the Internal Revenue Code.
The fund distributed $71,485,000 as capital gain dividends (20% rate gain distributions) to shareholders during the fiscal year.
The fund distributed $29,943,000 of qualified dividend income to shareholders during the fiscal year.
For corporate shareholders, 96.7% of investment income (dividend income plus short-term gains, if any) qualifies for the dividends-received deduction.
22
The People Who Govern Your Fund
The trustees of your mutual fund are there to see that the fund is operated and managed in your best interests since, as a shareholder, you are a part owner of the fund. Your fund’s trustees also serve on the board of directors of The Vanguard Group, Inc., which is owned by the Vanguard funds and provides services to them.
A majority of Vanguard’s board members are independent, meaning that they have no affiliation with Vanguard or the funds they oversee, apart from the sizable personal investments they have made as private individuals. The independent board members have distinguished backgrounds in business, academia, and public service. Each of the trustees and executive officers oversees 212 Vanguard funds.
Information for each trustee and executive officer of the fund appears below. That information, as well as the Vanguard fund count, is as of the date on the cover of this fund report. The mailing address of the trustees and officers is P.O. Box 876, Valley Forge, PA 19482. More information about the trustees is in the Statement of Additional Information, which can be obtained, without charge, by contacting Vanguard at 800-662-7447, or online at vanguard.com.
Interested Trustee1
Mortimer J. Buckley
Born in 1969. Trustee since January 2018. Principal occupation(s) during the past five years and other experience: chairman of the board (January 2019–present) of Vanguard and of each of the investment companies served by Vanguard; chief executive officer (January 2018–present) of Vanguard; chief executive officer, president, and trustee (January 2018–present) of each of the investment companies served by Vanguard; president and director (2017–present) of Vanguard; and president (February 2018–present) of Vanguard Marketing Corporation. Chief investment officer (2013–2017), managing director (2002–2017), head of the Retail Investor Group (2006–2012), and chief information officer (2001–2006) of Vanguard. Chairman of the board (2011–2017) and trustee (2009–2017) of the Children’s Hospital of Philadelphia; trustee (2018–present) of The Shipley School.
Independent Trustees
Emerson U. Fullwood
Born in 1948. Trustee since January 2008. Principal occupation(s) during the past five years and other experience: executive chief staff and marketing officer for North America and corporate vice president (retired 2008) of Xerox Corporation (document management products and services). Former president of the Worldwide Channels Group, Latin America, and Worldwide Customer Service and executive chief staff officer of Developing Markets of Xerox. Executive in residence and 2009–2010 Distinguished Minett Professor at the Rochester Institute of Technology. Director of SPX FLOW, Inc. (multi-industry manufacturing). Director of the University of Rochester Medical Center, the Monroe Community College Foundation, the United Way of Rochester, North Carolina A&T University, and Roberts Wesleyan College. Trustee of the University of Rochester.
Amy Gutmann
Born in 1949. Trustee since June 2006. Principal occupation(s) during the past five years and other experience: president (2004–present) of the University of Pennsylvania. Christopher H. Browne Distinguished Professor of Political Science, School of Arts and Sciences, and professor of communication, Annenberg School for Communication, with secondary faculty appointments in the Department of Philosophy, School of Arts and Sciences, and at the Graduate School of Education, University of Pennsylvania. Trustee of the National Constitution Center.
F. Joseph Loughrey
Born in 1949. Trustee since October 2009. Principal occupation(s) during the past five years and other experience: president and chief operating officer (retired 2009) and vice chairman of the board (2008–2009) of Cummins Inc. (industrial machinery). Chairman of the board of Hillenbrand, Inc. (specialized consumer services), and the Lumina Foundation.
1 Mr. Buckley is considered an “interested person,” as defined in the Investment Company Act of 1940, because he is an officer of the Vanguard funds.
Director of the V Foundation and Oxfam America. Member of the advisory council for the College of Arts and Letters and chair of the advisory board to the Kellogg Institute for International Studies, both at the University of Notre Dame.
Mark Loughridge
Born in 1953. Trustee since March 2012. Principal occupation(s) during the past five years and other experience: senior vice president and chief financial officer (retired 2013) of IBM (information technology services). Fiduciary member of IBM’s Retirement Plan Committee (2004–2013), senior vice president and general manager (2002–2004) of IBM Global Financing, vice president and controller (1998–2002) of IBM, and a variety of other prior management roles at IBM. Member of the Council on Chicago Booth.
Scott C. Malpass
Born in 1962. Trustee since March 2012. Principal occupation(s) during the past five years and other experience: chief investment officer (1989–present) and vice president (1996–present) of the University of Notre Dame. Assistant professor of finance at the Mendoza College of Business, University of Notre Dame, and member of the Notre Dame 403(b) Investment Committee. Chairman of the board of TIFF Advisory Services, Inc. Member of the board of Catholic Investment Services, Inc. (investment advisors) and the board of superintendence of the Institute for the Works of Religion.
Deanna Mulligan
Born in 1963. Trustee since January 2018. Principal occupation(s) during the past five years and other experience: president (2010–present) and chief executive officer (2011–present) of The Guardian Life Insurance Company of America. Chief operating officer (2010–2011) and executive vice president (2008–2010) of Individual Life and Disability of The Guardian Life Insurance Company of America. Member of the board of The Guardian Life Insurance Company of America, the American Council of Life Insurers, the Partnership for New York City (business leadership), and the Committee Encouraging Corporate Philanthropy. Trustee of the Economic Club of New York and the Bruce Museum (arts and science). Member of the Advisory Council for the Stanford Graduate School of Business.
André F. Perold
Born in 1952. Trustee since December 2004. Principal occupation(s) during the past five years and other experience: George Gund Professor of Finance and Banking, Emeritus at the Harvard Business School (retired 2011). Chief investment officer and co-managing partner of HighVista Strategies LLC (private investment firm). Board of advisors and investment committee member of the Museum of Fine Arts Boston. Board member (2018–present) of RIT Capital Partners (investment firm); investment committee member of Partners Health Care System.
Sarah Bloom Raskin
Born in 1961. Trustee since January 2018. Principal occupation(s) during the past five years and other experience: deputy secretary (2014–2017) of the United States Department of the Treasury. Governor (2010–2014) of the Federal Reserve Board. Commissioner (2007–2010) of financial regulation for the State of Maryland. Member of the board of directors (2012–2014) of Neighborhood Reinvestment Corporation. Director (2017–present) of i(x) Investments, LLC; director (2017–present) of Reserve Trust. Rubinstein Fellow (2017–present) of Duke University; trustee (2017–present) of Amherst College.
Peter F. Volanakis
Born in 1955. Trustee since July 2009. Principal occupation(s) during the past five years and other experience: president and chief operating officer (retired 2010) of Corning Incorporated (communications equipment) and director of Corning Incorporated (2000–2010) and Dow Corning (2001–2010). Director (2012) of SPX Corporation (multi-industry manufacturing). Overseer of the Amos Tuck School of Business Administration, Dartmouth College (2001–2013). Chairman of the board of trustees of Colby-Sawyer College. Member of the board of Hypertherm Inc. (industrial cutting systems, software, and consumables).
Executive Officers
Glenn Booraem
Born in 1967. Principal occupation(s) during the past five years and other experience: principal of Vanguard. Investment stewardship officer (2017–present), treasurer (2015–2017), controller (2010–2015), and assistant controller (2001–2010) of each of the investment companies served by Vanguard.
Christine M. Buchanan
Born in 1970. Principal occupation(s) during the past five years and other experience: principal of Vanguard and global head of Fund Administration at Vanguard. Treasurer (2017–present) of each of the investment companies served by Vanguard. Partner (2005–2017) at KPMG LLP (audit, tax, and advisory services).
Thomas J. Higgins
Born in 1957. Principal occupation(s) during the past five years and other experience: principal of Vanguard. Chief financial officer (2008–present) and treasurer (1998–2008) of each of the investment companies served by Vanguard.
Peter Mahoney
Born in 1974. Principal occupation(s) during the past five years and other experience: principal of Vanguard. Controller (2015–present) of each of the investment companies served by Vanguard. Head of International Fund Services (2008–2014) at Vanguard.
Anne E. Robinson
Born in 1970. Principal occupation(s) during the past five years and other experience: general counsel (2016–present) of Vanguard. Secretary (2016–present) of Vanguard and of each of the investment companies served by Vanguard. Managing director (2016–present) of Vanguard. Director and senior vice president (2016–2018) of Vanguard Marketing Corporation. Managing director and general counsel of Global Cards and Consumer Services (2014–2016) at Citigroup. Counsel (2003–2014) at American Express.
Michael Rollings
Born in 1963. Principal occupation(s) during the past five years and other experience: finance director (2017–present) and treasurer (2017) of each of the investment companies served by Vanguard. Managing director (2016–present) of Vanguard. Chief financial officer (2016–present) of Vanguard. Director (2016–present) of Vanguard Marketing Corporation. Executive vice president and chief financial officer (2006–2016) of MassMutual Financial Group.
John E. Schadl
Born in 1972. Principal occupation(s) during the past five years and other experience: principal of Vanguard. Chief compliance officer (2019–present) of Vanguard and of each of the investment companies served by Vanguard. Assistant vice president (May 2019–present) of Vanguard Marketing Corporation.
Vanguard Senior Management Team
Joseph Brennan | Chris D. McIsaac |
Mortimer J. Buckley | James M. Norris |
Gregory Davis | Thomas M. Rampulla |
John James | Karin A. Risi |
Martha G. King | Anne E. Robinson |
John T. Marcante | Michael Rollings |
| | 
|
| | |
| | P.O. Box 2600 |
| | Valley Forge, PA 19482-2600 |
Connect with Vanguard® > vanguard.com
Fund Information > 800-662-7447
Direct Investor Account Services > 800-662-2739
Institutional Investor Services > 800-523-1036
Text Telephone for People
Who Are Deaf or Hard of Hearing > 800-749-7273
This material may be used in conjunction with the offering of shares of any Vanguard fund only if preceded or accompanied by the fund’s current prospectus.
All comparative mutual fund data are from Morningstar, Inc., unless otherwise noted.
You can obtain a free copy of Vanguard’s proxy voting guidelines by visiting vanguard.com/proxyreporting or by calling Vanguard at 800-662-2739. The guidelines are also available from the SEC’s website, www.sec.gov. In addition, you may obtain a free report on how your fund voted the proxies for securities it owned during the 12 months ended June 30. To get the report, visit either vanguard.com/proxyreporting or www.sec.gov.
You can review information about your fund on the SEC’s website, and you can receive copies of this information, for a fee, by sending a request via email addressed to publicinfo@sec.gov.
Source for Bloomberg Barclays indexes: Bloomberg Index Services Limited. Copyright 2019, Bloomberg. All rights reserved.
| © 2019 The Vanguard Group, Inc. |
| All rights reserved. |
| Vanguard Marketing Corporation, Distributor. |
| |
| Q1240 112019 |

Annual Report | September 30, 2019 Vanguard Capital Value Fund |
See the inside front cover for important information about access to your fund’s annual and semiannual shareholder reports. |
Important information about access to shareholder reports
Beginning on January 1, 2021, as permitted by regulations adopted by the Securities and Exchange Commission, paper copies of your fund’s annual and semiannual shareholder reports will no longer be sent to you by mail, unless you specifically request them. Instead, you will be notified by mail each time a report is posted on the website and will be provided with a link to access the report.
If you have already elected to receive shareholder reports electronically, you will not be affected by this change and do not need to take any action. You may elect to receive shareholder reports and other communications from the fund electronically by contacting your financial intermediary (such as a broker-dealer or bank) or, if you invest directly with the fund, by calling Vanguard at one of the phone numbers on the back cover of this report or by logging on to vanguard.com.
You may elect to receive paper copies of all future shareholder reports free of charge. If you invest through a financial intermediary, you can contact the intermediary to request that you continue to receive paper copies. If you invest directly with the fund, you can call Vanguard at one of the phone numbers on the back cover of this report or log on to vanguard.com. Your election to receive paper copies will apply to all the funds you hold through an intermediary or directly with Vanguard.
Contents | |
| |
| |
A Note From Our Chairman | 1 |
| |
Your Fund’s Performance at a Glance | 2 |
| |
Advisor’s Report | 3 |
| |
About Your Fund’s Expenses | 6 |
| |
Performance Summary | 8 |
| |
Financial Statements | 10 |
Please note: The opinions expressed in this report are just that—informed opinions. They should not be considered promises or advice. Also, please keep in mind that the information and opinions cover the period through the date on the front of this report. Of course, the risks of investing in your fund are spelled out in the prospectus.
A Note From Our Chairman

Tim Buckley
Chairman and Chief Executive Officer
Dear Shareholder,
Recent volatility in financial markets—affecting stocks, bonds, and commodities—has been a good reminder of the wise old adage, “Never keep all your eggs in one basket.” Maintaining balance and diversification in your investment portfolio can help to both limit risk and set you up for long-term success.
It’s understandable why some investors might become complacent after a long market run-up like the one that lifted stock prices, especially U.S. stock prices, in the years following the global financial crisis. But failing to rebalance regularly can leave a portfolio with a much different mix of assets than intended and, often, more risk than intended.
Balance across and diversification within asset classes are powerful tools for managing risk and achieving your investment goals. A portfolio’s allocation will determine a large portion of its long-term return and also the majority of its volatility risk. A well-diversified portfolio is less vulnerable to significant swings in the performance of any one segment of the asset classes in which it invests.
Balance and diversification will never eliminate the risk of loss, nor will they guarantee positive returns in a declining market. But they should reduce the chance that you’ll suffer disproportionate losses in one particular high-flying asset class or sector when it comes back to earth. And exposure to all key market components should give you at least some participation in the sectors that are performing best at any given time.
Vanguard is committed to helping you achieve balance and diversification in your portfolios to help meet your investment goals. We thank you for your continued loyalty.
Sincerely,

Mortimer J. Buckley
Chairman and Chief Executive Officer
October 14, 2019
1
Your Fund’s Performance at a Glance
· Vanguard Capital Value Fund returned –0.18% for the 12 months ended September 30, 2019, lagging its benchmark, the Russell 3000 Value Index, which returned 3.10%.
· The broad U.S. stock market advanced nearly 3% for the year, which was marked by sharp intervals of volatility and uncertainty. Investors fretted over U.S.-China trade, heightened tensions with Iran, the imbroglio over Britain’s exit from the European Union, and whether an inverted yield curve signaled a recession ahead. With an eye toward the deteriorating global economic outlook, the Federal Reserve lowered short-term interest rates twice during the period to sustain the U.S. economic recovery.
· Large- and mid-capitalization stocks generally outdistanced their small-cap counterparts.
· The advisor’s strong selections in communication services made that sector the largest contributor to returns. The fund’s holdings in consumer staples, energy, health care, and financials lagged their benchmark counterparts and detracted most from relative results.
Market Barometer | | | |
| Average Annual Total Returns |
| Periods Ended September 30, 2019 |
| One Year | Three Years | Five Years |
Stocks | | | |
Russell 1000 Index (Large-caps) | 3.87% | 13.19% | 10.62% |
Russell 2000 Index (Small-caps) | -8.89 | 8.23 | 8.19 |
Russell 3000 Index (Broad U.S. market) | 2.92 | 12.83 | 10.44 |
FTSE All-World ex US Index (International) | -1.12 | 6.46 | 3.24 |
| | | |
Bonds | | | |
Bloomberg Barclays U.S. Aggregate Bond Index | | | |
(Broad taxable market) | 10.30% | 2.92% | 3.38% |
Bloomberg Barclays Municipal Bond Index | | | |
(Broad tax-exempt market) | 8.55 | 3.19 | 3.66 |
FTSE Three-Month U.S. Treasury Bill Index | 2.36 | 1.52 | 0.95 |
| | | |
CPI | | | |
Consumer Price Index | 1.71% | 2.07% | 1.53% |
2
Advisor’s Report
For the 12 months ended September 30, 2019, Vanguard Capital Value Fund returned –0.18%, underperforming its benchmark, the Russell 3000 Value Index, which returned 3.10%.
The investment environment
Seven of the 11 sectors in the index posted positive returns and six sectors in the fund beat the return of the index as a whole. For the fund, the utilities, real estate, consumer discretionary, communication services, and information technology sectors exceeded the benchmark return by a wide margin, while industrials narrowly led the benchmark return. All other sectors for the fund trailed the benchmark’s result. Energy, consumer staples, health care, and financials posted negative returns.
Our shortfalls
Security selection drove relative underperformance. Weak selection in consumer staples, energy, and financials was partially offset by strong selection in communication services and industrials. Sector allocation also weighed on relative performance. The fund’s underweight allocation to utilities and overweight to energy detracted from results.
Within consumer staples, our holding of Walgreens Boots Alliance and British American Tobacco (BAT) hurt relative performance, as did our not holding Procter & Gamble. Walgreens traded down amid challenges for the drug retail industry as well as concerns about the Walgreens and Boots Alliance merger.
BAT has faced headwinds from faster-than-expected volume declines, competition from e-cigarettes and next-generation products, increased Food and Drug Administration regulation—specifically of menthol cigarettes—and increased balance sheet leverage on the back of an acquisition of Reynolds. We ultimately eliminated the name as our thesis about pricing and next-generation efforts offsetting volume declines was disproven.
We did not hold Procter & Gamble based on valuation discipline, because the company had been trading at a premium to industry peers.
In energy, our holdings of exploration and production companies Concho Resources and Cimarex Energy drove underperformance, along with our position in Halliburton.
Concho Resources, the fund’s largest detractor, reported disappointing second-quarter results and guidance for the balance of the year. Several poor operating decisions and cost inflation led to a production shortfall and increased expenses. Shares of Cimarex Energy declined as the company reported weak second-quarter results. In addition to lower-than-expected oil production guidance, the company contended with lower oil and natural gas prices because of pipeline constraints in the Permian Basin.
Shares of Halliburton and other oilfield services companies dropped during the period. Halliburton, a diversified provider
3
with a large market share in U.S. onshore shale drilling and completion areas, has seen a sharp stock pullback as customers scaled back capital spending plans. While customers’ oilfield spending can fluctuate widely, we anticipate an eventual tightening of Halliburton’s services markets as providers reduce capacity to better align with customer demand. In the meantime, we believe the company’s diversification and capital structure will allow it to maintain its equipment fleet while smaller competitors are forced to raid the cupboards for cash.
Our successes
Communication services marked an area of strength, with Comcast and Verizon contributing the most to relative results. Comcast shares rose during the period as the cable giant continued to exceed estimates on its high-speed internet business. Comcast also has gained traction with its message that the decline of traditional TV subscribers will hurt profits less than expected. Verizon demonstrated an encouraging trend of improving organic growth in its wireless services revenues. Investors also started to factor in benefits from the transition to 5G wireless, including new product offerings and uses, and the potential for different industry dynamics if T-Mobile and Sprint execute their merger plans.
Industrials also contributed to results, driven notably by Herman Miller and Johnson Controls. Herman Miller experienced strong sales and accelerating earnings growth in office furniture, equipment, and home furnishings. We continue to believe the company is moving from a period of apathy and compressed margins to one of operating leverage and pricing power. Johnson Controls, a manufacturer of HVAC and fire and security equipment, won investor favor by selling its Power Solutions battery business and redeploying capital into a large share buyback. Management also began focusing on improving operational execution to drive profitability.
Fund positioning and outlook
At the end of September, the fund’s most significant overweightings relative to the Russell 3000 Value Index were in the information technology, real estate, and materials sectors. The most notable shifts in active positioning over the period—a function of bottom-up stock selection—included increases to our information technology, communication services, and health care weights, and reductions in our consumer staples, utilities, and financials weights.
Notable new purchases during the period included CVS Health, Intel, Raymond James, Humana, and Carter’s. CVS Health is an integrated pharmacy health care provider that should benefit from the recent combination with Aetna. The stock was sold down as the market questioned CVS’s ability to successfully integrate Aetna, but after a rocky start, we have been encouraged by management’s execution. With Intel, we took advantage of near-term weakness to accumulate a position. We believe its data center business will reaccelerate once its cloud
4
customers digest excess inventory and return to an order pattern that better matches their processing needs.
With Raymond James, we had an opportunity to add a best-in-class company at a depressed multiple because of broader industry headwinds. The company has meaningfully improved its competitive positioning and offers some of the highest organic growth among peers. Shares of Humana, which is primarily focused on the Medicare Advantage program for older adults, have been pressured by “Medicare-for-all” proposals in the platforms of several Democratic presidential candidates. We believe this is a harsh overreaction to a very unlikely outcome, and we felt positive underlying fundamentals had created a good opportunity to initiate a position.
Carter’s, the owner of its eponymous brand as well as OshKosh B’gosh, Skip Hop, and other labels, came under selling pressure as investors worried about the potential imposition of 25% tariffs on the company’s China-sourced infant, toddler, and children’s apparel. The stock was trading at a discounted valuation relative to its long-term history, which we believe ignored the potential to adjust sourcing and supply chains prospectively.
Notable eliminations included Wells Fargo, PNC Financial, RenaissanceRe, AIG, and Walgreens Boots Alliance. We shed PNC Financial, AIG, and RenaissanceRe because they achieved our valuation targets and we found more compelling opportunities elsewhere. We abandoned Wells Fargo and Walgreens Boots Alliance because our thesis for each was disproven.
There is discussion in the financial press, and even within Wellington, about the multiyear underperformance of value stocks relative to their growth counterparts. Our team is working continuously to position the portfolio with stocks that are priced at a clear discount to their peers and to their fundamental value. At the same time, we are turning over every rock to find companies that are not only “cheap” on static metrics but that have a favorable future trajectory of sales, earnings, and distributable cash flows. We believe we have found an attractive balance of risk and reward in the fund as it is constructed today, and we have conviction that Vanguard investors will be well rewarded for their patience with value investing.
David W. Palmer, CFA
Senior Managing Director
and Equity Portfolio Manager
Wellington Management Company LLP
October 21, 2019
5
About Your Fund’s Expenses
As a shareholder of the fund, you incur ongoing costs, which include costs for portfolio management, administrative services, and shareholder reports (like this one), among others. Operating expenses, which are deducted from a fund’s gross income, directly reduce the investment return of the fund.
A fund’s expenses are expressed as a percentage of its average net assets. This figure is known as the expense ratio. The following examples are intended to help you understand the ongoing costs (in dollars) of investing in your fund and to compare these costs with those of other mutual funds. The examples are based on an investment of $1,000 made at the beginning of the period shown and held for the entire period.
The accompanying table illustrates your fund’s costs in two ways:
· Based on actual fund return. This section helps you to estimate the actual expenses that you paid over the period. The “Ending Account Value” shown is derived from the fund’s actual return, and the third column shows the dollar amount that would have been paid by an investor who started with $1,000 in the fund. You may use the information here, together with the amount you invested, to estimate the expenses that you paid over the period.
To do so, simply divide your account value by $1,000 (for example, an $8,600 account value divided by $1,000 = 8.6), then multiply the result by the number given for your fund under the heading “Expenses Paid During Period.”
· Based on hypothetical 5% yearly return. This section is intended to help you compare your fund’s costs with those of other mutual funds. It assumes that the fund had a yearly return of 5% before expenses, but that the expense ratio is unchanged. In this case—because the return used is not the fund’s actual return—the results do not apply to your investment. The example is useful in making comparisons because the Securities and Exchange Commission requires all mutual funds to calculate expenses based on a 5% return. You can assess your fund’s costs by comparing this hypothetical example with the hypothetical examples that appear in shareholder reports of other funds.
Note that the expenses shown in the table are meant to highlight and help you compare ongoing costs only and do not reflect transaction costs incurred by the fund for buying and selling securities. Further, the expenses do not include any purchase, redemption, or account service fees described in the fund prospectus. If such fees were applied to your account, your costs would be higher. Your fund does not carry a “sales load.”
The calculations assume no shares were bought or sold during the period. Your actual costs may have been higher or lower, depending on the amount of your investment and the timing of any purchases or redemptions.
You can find more information about the fund’s expenses, including annual expense ratios, in the Financial Statements section of this report. For additional information on operating expenses and other shareholder costs, please refer to your fund’s current prospectus.
6
Six Months Ended September 30, 2019 | | | |
| Beginning | Ending | Expenses |
| Account Value | Account Value | Paid During |
Capital Value Fund | 3/31/2019 | 9/30/2019 | Period |
Based on Actual Fund Return | $1,000.00 | $1,056.74 | $1.50 |
Based on Hypothetical 5% Yearly Return | 1,000.00 | 1,023.61 | 1.47 |
The calculations are based on expenses incurred in the most recent six-month period. The fund’s annualized six-month expense ratio for that period is 0.29%. The dollar amounts shown as “Expenses Paid” are equal to the annualized expense ratio multiplied by the average account value over the period, multiplied by the number of days in the most recent six-month period, then divided by the number of days in the most recent 12-month period (183/365).
7
Capital Value Fund
Performance Summary
All of the returns in this report represent past performance, which is not a guarantee of future results that may be achieved by the fund. (Current performance may be lower or higher than the performance data cited. For performance data current to the most recent month-end, visit our website at vanguard.com/performance.) Note, too, that both investment returns and principal value can fluctuate widely, so an investor’s shares, when sold, could be worth more or less than their original cost. The returns shown do not reflect taxes that a shareholder would pay on fund distributions or on the sale of fund shares.
Cumulative Performance: September 30, 2009, Through September 30, 2019
Initial Investment of $10,000

| | Average Annual Total Returns | |
| | Periods Ended September 30, 2019 | |
| | | | | Final Value |
| | One | Five | Ten | of a $10,000 |
| | Year | Years | Years | Investment |

| Capital Value Fund | -0.18% | 3.10% | 9.29% | $24,322 |

| Russell 3000 Value Index | 3.10 | 7.76 | 11.36 | 29,336 |

| Dow Jones U.S. Total Stock Market Float Adjusted Index | 2.81 | 10.40 | 13.09 | 34,207 |
See Financial Highlights for dividend and capital gains information.
8
Capital Value Fund
Sector Diversification
As of September 30, 2019
Communication Services | | 9.4 | % |
Consumer Discretionary | | 6.2 | |
Consumer Staples | | 5.4 | |
Energy | | 8.6 | |
Financials | | 17.6 | |
Health Care | | 12.0 | |
Industrials | | 11.0 | |
Information Technology | | 12.4 | |
Materials | | 6.3 | |
Other | | 0.0 | |
Real Estate | | 9.0 | |
Utilities | | 2.1 | |
The table reflects the fund’s equity exposure, based on its investments in stocks. Any holdings in short-term reserves are excluded. Sector categories are based on the Global Industry Classification Standard (“GICS”), except for the “Other” category (if applicable), which includes securities that have not been provided a GICS classification as of the effective reporting period.
The Global Industry Classification Standard (“GICS”) was developed by and is the exclusive property and a service mark of MSCI Inc. (“MSCI���) and Standard and Poor’s, a division of McGraw-Hill Companies, Inc. (“S&P”), and is licensed for use by Vanguard. Neither MSCI, S&P nor any third party involved in making or compiling the GICS or any GICS classification makes any express or implied warranties or representations with respect to such standard or classification (or the results to be obtained by the use thereof), and all such parties hereby expressly disclaim all warranties of originality, accuracy, completeness, merchantability or fitness for a particular purpose with respect to any such standard or classification. Without limiting any of the foregoing, in no event shall MSCI, S&P, any of its affiliates or any third party involved in making or compiling the GICS or any GICS classification have any liability for any direct, indirect, special, punitive, consequential or any other damages (including lost profits) even if notified of the possibility of such damages.
9
Capital Value Fund
Financial Statements
Statement of Net Assets
As of September 30, 2019
The fund files its complete schedule of portfolio holdings with the Securities and Exchange Commission (SEC) for the first and third quarters of each fiscal year as an exhibit to its reports on Form N-PORT. The fund’s Form N-PORT reports are available on the SEC’s website at www.sec.gov.
| | | Market |
| | | Value· |
| | Shares | ($000) |
Common Stocks (98.8%) | | |
Communication Services (9.3%) | | |
| Comcast Corp. Class A | 570,836 | 25,733 |
| Verizon Communications Inc. | 293,590 | 17,721 |
* | Electronic Arts Inc. | 90,088 | 8,813 |
* | Alphabet Inc. Class A | 7,050 | 8,609 |
* | Charter Communications Inc. Class A | 19,800 | 8,160 |
* | T-Mobile US Inc. | 67,500 | 5,317 |
| | | 74,353 |
Consumer Discretionary (6.1%) | | |
| Expedia Group Inc. | 133,681 | 17,968 |
| Carter’s Inc. | 160,000 | 14,594 |
| General Motors Co. | 232,857 | 8,727 |
| Steven Madden Ltd. | 204,100 | 7,305 |
| | | 48,594 |
Consumer Staples (5.3%) | | |
| Philip Morris International Inc. | 279,442 | 21,218 |
| Kroger Co. | 546,859 | 14,098 |
| Archer-Daniels-Midland Co. | 172,400 | 7,080 |
| | | 42,396 |
Energy (8.5%) | | |
| Chevron Corp. | 141,561 | 16,789 |
| Canadian Natural Resources Ltd. | 509,661 | 13,572 |
| Concho Resources Inc. | 140,965 | 9,572 |
| Diamondback Energy Inc. | 71,877 | 6,463 |
| Enbridge Inc. | 163,800 | 5,746 |
| Cimarex Energy Co. | 114,307 | 5,480 |
| Tenaris SA ADR | 255,389 | 5,409 |
| Halliburton Co. | 253,847 | 4,785 |
| | | 67,816 |
Financials (17.4%) | | |
| MetLife Inc. | 497,754 | 23,474 |
| Raymond James Financial Inc. | 200,600 | 16,541 |
| Citigroup Inc. | 237,898 | 16,434 |
| Bank of America Corp. | 529,000 | 15,431 |
| Unum Group | 350,128 | 10,406 |
| TD Ameritrade Holding Corp. | 202,900 | 9,475 |
* | Athene Holding Ltd. Class A | 220,000 | 9,253 |
| Voya Financial Inc. | 142,428 | 7,754 |
| Bank OZK | 261,980 | 7,144 |
| London Stock Exchange Group plc | 68,817 | 6,180 |
| CNO Financial Group Inc. | 369,381 | 5,847 |
| Atlantic Union Bankshares Corp. | 148,100 | 5,516 |
| Lancashire Holdings Ltd. | 564,555 | 5,139 |
| | | 138,594 |
Health Care (11.9%) | | |
| CVS Health Corp. | 362,873 | 22,886 |
| Humana Inc. | 62,700 | 16,031 |
| McKesson Corp. | 80,973 | 11,066 |
| Koninklijke Philips NV | 233,563 | 10,774 |
| Bristol-Myers Squibb Co. | 197,816 | 10,031 |
* | Centene Corp. | 168,000 | 7,268 |
* | Biogen Inc. | 27,283 | 6,352 |
| AstraZeneca plc ADR | 137,400 | 6,124 |
* | Seattle Genetics Inc. | 49,321 | 4,212 |
| | | 94,744 |
Industrials (10.9%) | | |
| Wabtec Corp. | 199,500 | 14,336 |
| Steelcase Inc. Class A | 652,155 | 12,000 |
| Southwest Airlines Co. | 212,757 | 11,491 |
| Herman Miller Inc. | 224,655 | 10,354 |
| Fortune Brands Home & Security Inc. | 180,130 | 9,853 |
| Delta Air Lines Inc. | 163,919 | 9,442 |
| Sanwa Holdings Corp. | 730,100 | 8,204 |
| AO Smith Corp. | 137,400 | 6,555 |
| Pentair plc | 120,800 | 4,566 |
| Scorpio Bulkers Inc. | 1 | — |
| | | 86,801 |
10
Capital Value Fund
| | | Market |
| | | Value· |
| | Shares | ($000) |
Information Technology (12.3%) | | |
| Intel Corp. | 352,600 | 18,170 |
| Western Digital Corp. | 237,957 | 14,192 |
| KLA Corp. | 88,016 | 14,034 |
| Samsung Electronics Co. Ltd. | 261,016 | 10,687 |
| Amdocs Ltd. | 141,935 | 9,383 |
| Genpact Ltd. | 236,747 | 9,174 |
| Broadcom Inc. | 30,582 | 8,443 |
* | Coherent Inc. | 48,258 | 7,418 |
* | Micron Technology Inc. | 143,500 | 6,149 |
* | Qorvo Inc. | 1 | — |
| | | 97,650 |
Materials (6.2%) | | |
| Reliance Steel & Aluminum Co. | 142,730 | 14,224 |
| Celanese Corp. Class A | 106,155 | 12,982 |
| CRH plc | 223,412 | 7,661 |
| Cabot Corp. | 133,500 | 6,050 |
^ | Nutrien Ltd. | 102,300 | 5,096 |
* | Alcoa Corp. | 167,800 | 3,368 |
| | | 49,381 |
Other (0.0%) | | |
*,§,1 | Allstar Co-Invest LLC Private Placement | NA | 214 |
| | | |
Real Estate (8.8%) | | |
| Equinix Inc. | 21,317 | 12,296 |
| Americold Realty Trust | 330,300 | 12,244 |
| Host Hotels & Resorts Inc. | 637,677 | 11,025 |
| Simon Property Group Inc. | 50,450 | 7,853 |
| Columbia Property Trust Inc. | 361,539 | 7,647 |
| Brixmor Property Group Inc. | 362,312 | 7,351 |
| Acadia Realty Trust | 245,857 | 7,027 |
| American Tower Corp. | 23,016 | 5,089 |
| | | 70,532 |
Utilities (2.1%) | | |
* | Iberdrola SA | 853,556 | 8,872 |
| Sempra Energy | 53,977 | 7,967 |
| | | 16,839 |
Total Common Stocks
(Cost $737,618) | | 787,914 |
Temporary Cash Investments (1.8%) | | |
Money Market Fund (0.6%) | | |
2,3 | Vanguard Market Liquidity Fund, 2.098% | 50,512 | 5,052 |
| | Face | Market |
| | Amount | Value· |
| | ($000) | ($000) |
Repurchase Agreement (1.2%) | | |
| RBS Securities, Inc. 2.350%, 10/1/19 (Dated 9/30/19, Repurchase Value $9,301,000, collateralized by U.S. Treasury Note/Bond 0.750%, 7/15/28, with a value of $9,486,000) | 9,300 | 9,300 |
Total Temporary Cash Investments (Cost $14,352) | | 14,352 |
Total Investments (100.6%) (Cost $751,970) | | 802,266 |
| | |
| | Amount |
| | ($000) |
Other Assets and Liabilities (-0.6%) | | |
Other Assets | | |
Investment in Vanguard | | 37 |
Receivables for Investment Securities Sold | | 8 |
Receivables for Accrued Income | | 1,564 |
Receivables for Capital Shares Issued | | 168 |
Unrealized Appreciation—Forward Currency Contracts | | 27 |
Other Assets | | 65 |
Total Other Assets | | 1,869 |
Liabilities | | |
Collateral for Securities on Loan | | (5,049) |
Payables to Investment Advisor | | (118) |
Payables for Capital Shares Redeemed | | (648) |
Payables to Vanguard | | (1,136) |
Total Liabilities | | (6,951) |
Net Assets (100%) | | |
Applicable to 59,464,555 outstanding $.001 par value shares of beneficial interest (unlimited authorization) | | 797,184 |
Net Asset Value Per Share | | $13.41 |
11
Capital Value Fund
At September 30, 2019, net assets consisted of:
| | Amount |
| | ($000) |
Paid-in Capital | | 739,406 |
Total Distributable Earnings (Loss) | | 57,778 |
Net Assets | | 797,184 |
· See Note A in Notes to Financial Statements.
* Non-income-producing security.
^ Includes partial security positions on loan to broker-dealers.
The total value of securities on loan is $4,837,000.
§ Security value determined using significant unobservable inputs.
1 Restricted security represents 0.0% of net assets. Shares not applicable for this Private Placement. See Restricted Security table for additional information.
2 Affiliated money market fund available only to Vanguard funds and certain trusts and accounts managed by Vanguard. Rate shown is the 7-day yield.
3 Collateral of $5,049,000 was received for securities on loan.
ADR—American Depositary Receipt.
Restricted Securities as of Period End |
| | Acquisition |
| Acquisition | Cost |
Security Name | Date | ($000) |
Allstar Co-Invest LLC Private Placement | August 2011 | 459 |
Derivative Financial Instruments Outstanding as of Period End |
Forward Currency Contracts | | | | |
Counterparty | Contract Settlement Date | Contract Amount (000) | Unrealized Appreciation ($000) | Unrealized (Depreciation) ($000) |
| Receive | | Deliver |
Goldman Sachs International | 12/18/19 | USD | 7,482 | JPY | 801,276 | 27 | — |
JPY—Japanese yen.
USD—U.S. dollar.
See accompanying Notes, which are an integral part of the Financial Statements.
12
Capital Value Fund
Statement of Operations
| Year Ended |
| September 30, 2019 |
| ($000) |
Investment Income | |
Income | |
Dividends1 | 20,612 |
Interest2 | 183 |
Securities Lending—Net | 31 |
Total Income | 20,826 |
Expenses | |
Investment Advisory Fees—Note B | |
Basic Fee | 1,775 |
Performance Adjustment | (1,334) |
The Vanguard Group—Note C | |
Management and Administrative | 1,689 |
Marketing and Distribution | 69 |
Custodian Fees | 8 |
Auditing Fees | 32 |
Shareholders’ Reports | 15 |
Trustees’ Fees and Expenses | 1 |
Total Expenses | 2,255 |
Net Investment Income | 18,571 |
Realized Net Gain (Loss) | |
Investment Securities Sold2 | 11,271 |
Forward Currency Contracts | 345 |
Foreign Currencies | (3) |
Realized Net Gain (Loss) | 11,613 |
Change in Unrealized Appreciation (Depreciation) | |
Investment Securities2 | (37,282) |
Forward Currency Contracts | (110) |
Foreign Currencies | 2 |
Change in Unrealized Appreciation (Depreciation) | (37,390) |
Net Increase (Decrease) in Net Assets Resulting from Operations | (7,206) |
1 Dividends are net of foreign withholding taxes of $316,000.
2 Interest income, realized net gain (loss), and change in unrealized appreciation (depreciation) from an affiliated company of the fund were $0, ($1,000), and $1,000, respectively. Purchases and sales are for temporary cash investment purposes.
See accompanying Notes, which are an integral part of the Financial Statements.
13
Capital Value Fund
Statement of Changes in Net Assets
| Year Ended September 30, |
| 2019 | 2018 |
| ($000) | ($000) |
Increase (Decrease) in Net Assets | | |
Operations | | |
Net Investment Income | 18,571 | 18,141 |
Realized Net Gain (Loss) | 11,613 | 81,935 |
Change in Unrealized Appreciation (Depreciation) | (37,390) | (27,061) |
Net Increase (Decrease) in Net Assets Resulting from Operations | (7,206) | 73,015 |
Distributions | | |
Net Investment Income | (18,899) | (17,678) |
Realized Capital Gain | — | — |
Total Distributions | (18,899) | (17,678) |
Capital Share Transactions | | |
Issued | 72,817 | 57,634 |
Issued in Lieu of Cash Distributions | 17,308 | 16,300 |
Redeemed | (140,330) | (159,126) |
Net Increase (Decrease) from Capital Share Transactions | (50,205) | (85,192) |
Total Increase (Decrease) | (76,310) | (29,855) |
Net Assets | | |
Beginning of Period | 873,494 | 903,349 |
End of Period | 797,184 | 873,494 |
See accompanying Notes, which are an integral part of the Financial Statements.
14
Capital Value Fund
Financial Highlights
For a Share Outstanding | | | Year Ended September 30, |
Throughout Each Period | 2019 | 2018 | 2017 | 2016 | 2015 |
Net Asset Value, Beginning of Period | $13.79 | $12.96 | $11.50 | $11.45 | $15.32 |
Investment Operations | | | | | |
Net Investment Income | .2991 | .2731 | .2411 | .180 | .1291 |
Net Realized and Unrealized Gain (Loss) on Investments | (.377) | .817 | 1.420 | 1.060 | (2.330) |
Total from Investment Operations | (.078) | 1.090 | 1.661 | 1.240 | (2.201) |
Distributions | | | | | |
Dividends from Net Investment Income | (.302) | (.260) | (.201) | (.144) | (.175) |
Distributions from Realized Capital Gains | — | — | — | (1.046) | (1.494) |
Total Distributions | (.302) | (.260) | (.201) | (1.190) | (1.669) |
Net Asset Value, End of Period | $13.41 | $13.79 | $12.96 | $11.50 | $11.45 |
| | | | | |
Total Return2 | -0.18% | 8.48% | 14.56% | 11.36% | -15.67% |
| | | | | |
Ratios/Supplemental Data | | | | | |
Net Assets, End of Period (Millions) | $797 | $873 | $903 | $933 | $1,059 |
Ratio of Total Expenses to Average Net Assets3 | 0.29% | 0.29% | 0.27% | 0.25% | 0.50% |
Ratio of Net Investment Income to Average Net Assets | 2.35% | 2.04% | 1.97% | 1.51% | 0.93% |
Portfolio Turnover Rate | 46% | 47% | 41% | 134% | 90% |
1 Calculated based on average shares outstanding.
2 Total returns do not include account service fees that may have applied in the periods shown. Fund prospectuses provide information about any applicable account service fees.
3 Includes performance-based investment advisory fee increases (decreases) of (0.17%), (0.17%), (0.19%), (0.20%), and 0.06%.
See accompanying Notes, which are an integral part of the Financial Statements.
15
Capital Value Fund
Notes to Financial Statements
Vanguard Capital Value Fund is registered under the Investment Company Act of 1940 as an open-end investment company, or mutual fund.
A. The following significant accounting policies conform to generally accepted accounting principles for U.S. investment companies. The fund consistently follows such policies in preparing its financial statements.
1. Security Valuation: Securities are valued as of the close of trading on the New York Stock Exchange (generally 4 p.m., Eastern time) on the valuation date. Equity securities are valued at the latest quoted sales prices or official closing prices taken from the primary market in which each security trades; such securities not traded on the valuation date are valued at the mean of the latest quoted bid and asked prices. Securities for which market quotations are not readily available, or whose values have been affected by events occurring before the fund’s pricing time but after the close of the securities’ primary markets, are valued at their fair values calculated according to procedures adopted by the board of trustees. These procedures include obtaining quotations from an independent pricing service, monitoring news to identify significant market- or security-specific events, and evaluating changes in the values of foreign market proxies (for example, ADRs, futures contracts, or exchange-traded funds), between the time the foreign markets close and the fund’s pricing time. When fair-value pricing is employed, the prices of securities used by a fund to calculate its net asset value may differ from quoted or published prices for the same securities. Investments in Vanguard Market Liquidity Fund are valued at that fund’s net asset value. Temporary cash investments are valued using the latest bid prices or using valuations based on a matrix system (which considers such factors as security prices, yields, maturities, and ratings), both as furnished by independent pricing services.
2. Foreign Currency: Securities and other assets and liabilities denominated in foreign currencies are translated into U.S. dollars using exchange rates obtained from an independent third party as of the fund’s pricing time on the valuation date. Realized gains (losses) and unrealized appreciation (depreciation) on investment securities include the effects of changes in exchange rates since the securities were purchased, combined with the effects of changes in security prices. Fluctuations in the value of other assets and liabilities resulting from changes in exchange rates are recorded as unrealized foreign currency gains (losses) until the assets or liabilities are settled in cash, at which time they are recorded as realized foreign currency gains (losses).
3. Forward Currency Contracts: The fund enters into forward currency contracts to protect the value of securities and related receivables and payables against changes in future foreign exchange rates. The fund’s risks in using these contracts include movement in the values of the foreign currencies relative to the U.S. dollar and the ability of the counterparties to fulfill their obligations under the contracts. The fund mitigates its counterparty risk by entering into forward currency contracts only with a diverse group of prequalified counterparties, monitoring their financial strength, entering into master netting arrangements with its counterparties, and requiring its counterparties to transfer collateral as security for their performance. In the absence of a default, the collateral pledged or received by the fund cannot be repledged, resold, or rehypothecated. The master netting arrangements provide that, in the event of a counterparty’s default (including bankruptcy), the fund may terminate the forward currency contracts, determine the net amount owed by either party in accordance with its master netting arrangements, and sell or retain any collateral held up to the net amount owed to the fund under the master netting arrangements. The forward currency contracts contain provisions whereby a counterparty may terminate open contracts if the fund’s net
16
Capital Value Fund
assets decline below a certain level, triggering a payment by the fund if the fund is in a net liability position at the time of the termination. The payment amount would be reduced by any collateral the fund has pledged. Any assets pledged as collateral for open contracts are noted in the Statement of Net Assets. The value of collateral received or pledged is compared daily to the value of the forward currency contracts exposure with each counterparty, and any difference, if in excess of a specified minimum transfer amount, is adjusted and settled within two business days.
Forward currency contracts are valued at their quoted daily prices obtained from an independent third party, adjusted for currency risk based on the expiration date of each contract. The notional amounts of the contracts are not recorded in the Statement of Net Assets. Fluctuations in the value of the contracts are recorded in the Statement of Net Assets as an asset (liability) and in the Statement of Operations as unrealized appreciation (depreciation) until the contracts are closed, when they are recorded as realized forward currency contract gains (losses).
During the year ended September 30, 2019, the fund’s average investment in forward currency contracts represented 1% of net assets, based on the average of notional amounts at each quarter-end during the period.
4. Repurchase Agreements: The fund enters into repurchase agreements with institutional counterparties. Securities pledged as collateral to the fund under repurchase agreements are held by a custodian bank until the agreements mature, and in the absence of a default, such collateral cannot be repledged, resold, or rehypothecated. Each agreement requires that the market value of the collateral be sufficient to cover payments of interest and principal. The fund further mitigates its counterparty risk by entering into repurchase agreements only with a diverse group of prequalified counterparties, monitoring their financial strength, and entering into master repurchase agreements with its counterparties. The master repurchase agreements provide that, in the event of a counterparty’s default (including bankruptcy), the fund may terminate any repurchase agreements with that counterparty, determine the net amount owed, and sell or retain the collateral up to the net amount owed to the fund. Such action may be subject to legal proceedings, which may delay or limit the disposition of collateral.
5. Federal Income Taxes: The fund intends to continue to qualify as a regulated investment company and distribute all of its taxable income. Management has analyzed the fund’s tax positions taken for all open federal income tax years (September 30, 2016–2019), and has concluded that no provision for federal income tax is required in the fund’s financial statements.
6. Distributions: Distributions to shareholders are recorded on the ex-dividend date. Distributions are determined on a tax basis and may differ from net investment income and realized capital gains for financial reporting purposes.
7. Securities Lending: To earn additional income, the fund lends its securities to qualified institutional borrowers. Security loans are subject to termination by the fund at any time, and are required to be secured at all times by collateral in an amount at least equal to the market value of securities loaned. Daily market fluctuations could cause the value of loaned securities to be more or less than the value of the collateral received. When this occurs, the collateral is adjusted and settled before the opening of the market on the next business day. The fund further mitigates its counterparty risk by entering into securities lending transactions only with a diverse group of prequalified counterparties, monitoring their financial strength, and entering into master securities lending agreements with its counterparties. The master securities lending agreements provide that, in the event of a
17
Capital Value Fund
counterparty’s default (including bankruptcy), the fund may terminate any loans with that borrower, determine the net amount owed, and sell or retain the collateral up to the net amount owed to the fund; however, such actions may be subject to legal proceedings. While collateral mitigates counterparty risk, in the event of a default, the fund may experience delays and costs in recovering the securities loaned. The fund invests cash collateral received in Vanguard Market Liquidity Fund, and records a liability in the Statement of Net Assets for the return of the collateral, during the period the securities are on loan. Securities lending income represents fees charged to borrowers plus income earned on invested cash collateral, less expenses associated with the loan. During the term of the loan, the fund is entitled to all distributions made on or in respect of the loaned securities.
8. Credit Facility: The fund and certain other funds managed by The Vanguard Group (“Vanguard”) participate in a $4.3 billion committed credit facility provided by a syndicate of lenders pursuant to a credit agreement that may be renewed annually; each fund is individually liable for its borrowings, if any, under the credit facility. Borrowings may be utilized for temporary and emergency purposes, and are subject to the fund’s regulatory and contractual borrowing restrictions. The participating funds are charged administrative fees and an annual commitment fee of 0.10% of the undrawn amount of the facility; these fees are allocated to the funds based on a method approved by the fund’s board of trustees and included in Management and Administrative expenses on the fund’s Statement of Operations. Any borrowings under this facility bear interest at a rate based upon the higher of the one-month London Interbank Offered Rate, federal funds effective rate, or overnight bank funding rate plus an agreed-upon spread.
The fund had no borrowings outstanding at September 30, 2019, or at any time during the period then ended.
9. Other: Dividend income is recorded on the ex-dividend date. Interest income includes income distributions received from Vanguard Market Liquidity Fund and is accrued daily. Premiums and discounts on debt securities purchased are amortized and accreted, respectively, to interest income over the lives of the respective securities. Security transactions are accounted for on the date securities are bought or sold. Costs used to determine realized gains (losses) on the sale of investment securities are those of the specific securities sold.
B. Wellington Management Company LLP provides investment advisory services to the fund for a fee calculated at an annual percentage rate of average net assets. The basic fee is subject to quarterly adjustments based on the fund’s performance relative to the Dow Jones U.S. Total Stock Market Float Adjusted Index for the preceding three years. For the year ended September 30, 2019, the investment advisory fee represented an effective annual basic rate of 0.22% of the fund’s average net assets before a decrease of $1,334,000 (0.17%) based on performance.
C. In accordance with the terms of a Funds’ Service Agreement (the “FSA”) between Vanguard and the fund, Vanguard furnishes to the fund corporate management, administrative, marketing, and distribution services at Vanguard’s cost of operations (as defined by the FSA). These costs of operations are allocated to the fund based on methods and guidelines approved by the board of trustees. Vanguard does not require reimbursement in the current period for certain costs of operations (such as deferred compensation/benefits and risk/insurance costs); the fund’s liability for these costs of operations is included in Payables to Vanguard on the Statement of Net Assets. All other costs of operations payable to Vanguard are generally settled twice a month.
18
Capital Value Fund
Upon the request of Vanguard, the fund may invest up to 0.40% of its net assets as capital in Vanguard. At September 30, 2019, the fund had contributed to Vanguard capital in the amount of $37,000, representing less than 0.01% of the fund’s net assets and 0.01% of Vanguard’s capital received pursuant to the FSA. The fund’s trustees and officers are also directors and employees, respectively, of Vanguard.
D. Various inputs may be used to determine the value of the fund’s investments. These inputs are summarized in three broad levels for financial statement purposes. The inputs or methodologies used to value securities are not necessarily an indication of the risk associated with investing in those securities.
Level 1—Quoted prices in active markets for identical securities.
Level 2—Other significant observable inputs (including quoted prices for similar securities, interest rates, prepayment speeds, credit risk, etc.).
Level 3—Significant unobservable inputs (including the fund’s own assumptions used to determine the fair value of investments). Any investments valued with significant unobservable inputs are noted on the Statement of Net Assets.
The following table summarizes the market value of the fund’s investments and derivatives as of September 30, 2019, based on the inputs used to value them:
| Level 1 | Level 2 | Level 3 |
Investments | ($000) | ($000) | ($000) |
Common Stocks | 740,957 | 46,743 | 214 |
Temporary Cash Investments | 5,052 | 9,300 | — |
Forward Currency Contracts—Assets | — | 27 | — |
Total | 746,009 | 56,070 | 214 |
E. Permanent differences between book-basis and tax-basis components of net assets are reclassified among capital accounts in the financial statements to reflect their tax character. These reclassifications have no effect on net assets or net asset value per share. As of period end, permanent differences primarily attributable to the accounting for foreign currency transactions were reclassified between the individual components of total distributable earnings (loss).
| Amount |
| ($000) |
Paid-in Capital | — |
Total Distributable Earnings (Loss) | — |
Temporary differences between book-basis and tax-basis components of total distributable earnings (loss) arise when certain items of income, gain, or loss are recognized in different periods for financial statement and tax purposes; these differences will reverse at some time in the future.
19
Capital Value Fund
The differences are primarily related to the tax deferral of losses on wash sales and the realization of unrealized gains or losses on certain forward currency contracts. As of period end, the tax-basis components of total distributable earnings (loss) are detailed in the table as follows:
| Amount |
| ($000) |
Undistributed Ordinary Income | 12,869 |
Undistributed Long-Term Gains | — |
Capital Loss Carryforwards (Non-expiring)* | (4,325) |
Net Unrealized Gains (Losses) | 50,277 |
* The fund used capital loss carryforwards of $11,506,000 to offset taxable capital gains realized during the year ended September 30, 2019.
As of September 30, 2019, gross unrealized appreciation and depreciation for investments and derivatives based on cost for U.S. federal income tax purposes were as follows:
| Amount |
| ($000) |
Tax Cost | 751,986 |
Gross Unrealized Appreciation | 102,049 |
Gross Unrealized Depreciation | (51,769) |
Net Unrealized Appreciation (Depreciation) | 50,280 |
F. During the year ended September 30, 2019, the fund purchased $359,505,000 of investment securities and sold $412,819,000 of investment securities, other than temporary cash investments.
G. Capital shares issued and redeemed were:
| Year Ended September 30, |
| 2019 | 2018 |
| Shares | Shares |
| (000) | (000) |
Issued | 5,738 | 4,316 |
Issued in Lieu of Cash Distributions | 1,520 | 1,227 |
Redeemed | (11,130) | (11,915) |
Net Increase (Decrease) in Shares Outstanding | (3,872) | (6,372) |
H. Management has determined that no events or transactions occurred subsequent to September 30, 2019, that would require recognition or disclosure in these financial statements.
20
Report of Independent Registered Public Accounting Firm
To the Board of Trustees of Vanguard Malvern Funds and Shareholders of Vanguard Capital Value Fund
Opinion on the Financial Statements
We have audited the accompanying statement of net assets of Vanguard Capital Value Fund (one of the funds constituting Vanguard Malvern Funds, referred to hereafter as the “Fund”) as of September 30, 2019, the related statement of operations for the year ended September 30, 2019, the statement of changes in net assets for each of the two years in the period ended September 30, 2019, including the related notes, and the financial highlights for each of the five years in the period ended September 30, 2019 (collectively referred to as the “financial statements”). In our opinion, the financial statements present fairly, in all material respects, the financial position of the Fund as of September 30, 2019, the results of its operations for the year then ended, the changes in its net assets for each of the two years in the period ended September 30, 2019 and the financial highlights for each of the five years in the period ended September 30, 2019 in conformity with accounting principles generally accepted in the United States of America.
Basis for Opinion
These financial statements are the responsibility of the Fund’s management. Our responsibility is to express an opinion on the Fund’s financial statements based on our audits. We are a public accounting firm registered with the Public Company Accounting Oversight Board (United States) (“PCAOB”) and are required to be independent with respect to the Fund in accordance with the U.S. federal securities laws and the applicable rules and regulations of the Securities and Exchange Commission and the PCAOB.
We conducted our audits of these financial statements in accordance with the standards of the PCAOB. Those standards require that we plan and perform the audit to obtain reasonable assurance about whether the financial statements are free of material misstatement, whether due to error or fraud.
Our audits included performing procedures to assess the risks of material misstatement of the financial statements, whether due to error or fraud, and performing procedures that respond to those risks. Such procedures included examining, on a test basis, evidence regarding the amounts and disclosures in the financial statements. Our audits also included evaluating the accounting principles used and significant estimates made by management, as well as evaluating the overall presentation of the financial statements. Our procedures included confirmation of securities owned as of September 30, 2019 by correspondence with the custodians and brokers and by agreement to the underlying ownership records of the transfer agent; when replies were not received from brokers, we performed other auditing procedures. We believe that our audits provide a reasonable basis for our opinion.
/s/PricewaterhouseCoopers LLP
Philadelphia, Pennsylvania
November 19, 2019
We have served as the auditor of one or more investment companies in The Vanguard Group of Funds since 1975.
21
Special 2019 tax information (unaudited) for Vanguard Capital Value Fund
This information for the fiscal year ended September 30, 2019, is included pursuant to provisions of the Internal Revenue Code.
The fund distributed $18,899,000 of qualified dividend income to shareholders during the fiscal year.
For corporate shareholders, 77.9% of investment income (dividend income plus short-term gains, if any) qualifies for the dividends-received deduction.
22
The People Who Govern Your Fund
The trustees of your mutual fund are there to see that the fund is operated and managed in your best interests since, as a shareholder, you are a part owner of the fund. Your fund’s trustees also serve on the board of directors of The Vanguard Group, Inc., which is owned by the Vanguard funds and provides services to them.
A majority of Vanguard’s board members are independent, meaning that they have no affiliation with Vanguard or the funds they oversee, apart from the sizable personal investments they have made as private individuals. The independent board members have distinguished backgrounds in business, academia, and public service. Each of the trustees and executive officers oversees 212 Vanguard funds.
Information for each trustee and executive officer of the fund appears below. That information, as well as the Vanguard fund count, is as of the date on the cover of this fund report. The mailing address of the trustees and officers is P.O. Box 876, Valley Forge, PA 19482. More information about the trustees is in the Statement of Additional Information, which can be obtained, without charge, by contacting Vanguard at 800-662-7447, or online at vanguard.com.
Interested Trustee1
Mortimer J. Buckley
Born in 1969. Trustee since January 2018. Principal occupation(s) during the past five years and other experience: chairman of the board (January 2019–present) of Vanguard and of each of the investment companies served by Vanguard; chief executive officer (January 2018–present) of Vanguard; chief executive officer, president, and trustee (January 2018–present) of each of the investment companies served by Vanguard; president and director (2017–present) of Vanguard; and president (February 2018–present) of Vanguard Marketing Corporation. Chief investment officer (2013–2017), managing director (2002–2017), head of the Retail Investor Group (2006–2012), and chief information officer (2001–2006) of Vanguard. Chairman of the board (2011–2017) and trustee (2009–2017) of the Children’s Hospital of Philadelphia; trustee (2018–present) of The Shipley School.
Independent Trustees
Emerson U. Fullwood
Born in 1948. Trustee since January 2008. Principal occupation(s) during the past five years and other experience: executive chief staff and marketing officer for North America and corporate vice president (retired 2008) of Xerox Corporation (document management products and services). Former president of the Worldwide Channels Group, Latin America, and Worldwide Customer Service and executive chief staff officer of Developing Markets of Xerox. Executive in residence and 2009–2010 Distinguished Minett Professor at the Rochester Institute of Technology. Director of SPX FLOW, Inc. (multi-industry manufacturing). Director of the University of Rochester Medical Center, the Monroe Community College Foundation, the United Way of Rochester, North Carolina A&T University, and Roberts Wesleyan College. Trustee of the University of Rochester.
Amy Gutmann
Born in 1949. Trustee since June 2006. Principal occupation(s) during the past five years and other experience: president (2004–present) of the University of Pennsylvania. Christopher H. Browne Distinguished Professor of Political Science, School of Arts and Sciences, and professor of communication, Annenberg School for Communication, with secondary faculty appointments in the Department of Philosophy, School of Arts and Sciences, and at the Graduate School of Education, University of Pennsylvania. Trustee of the National Constitution Center.
F.Joseph Loughrey
Born in 1949. Trustee since October 2009. Principal occupation(s) during the past five years and other experience: president and chief operating officer (retired 2009) and vice chairman of the board (2008–2009) of Cummins Inc. (industrial machinery). Chairman of the board of Hillenbrand, Inc. (specialized consumer services), and the Lumina Foundation.
1 Mr. Buckley is considered an “interested person,” as defined in the Investment Company Act of 1940, because he is an officer of the Vanguard funds.
Director of the V Foundation and Oxfam America. Member of the advisory council for the College of Arts and Letters and chair of the advisory board to the Kellogg Institute for International Studies, both at the University of Notre Dame.
Mark Loughridge
Born in 1953. Trustee since March 2012. Principal occupation(s) during the past five years and other experience: senior vice president and chief financial officer (retired 2013) of IBM (information technology services). Fiduciary member of IBM’s Retirement Plan Committee (2004–2013), senior vice president and general manager (2002–2004) of IBM Global Financing, vice president and controller (1998–2002) of IBM, and a variety of other prior management roles at IBM. Member of the Council on Chicago Booth.
Scott C. Malpass
Born in 1962. Trustee since March 2012. Principal occupation(s) during the past five years and other experience: chief investment officer (1989–present) and vice president (1996–present) of the University of Notre Dame. Assistant professor of finance at the Mendoza College of Business, University of Notre Dame, and member of the Notre Dame 403(b) Investment Committee. Chairman of the board of TIFF Advisory Services, Inc. Member of the board of Catholic Investment Services, Inc. (investment advisors) and the board of superintendence of the Institute for the Works of Religion.
Deanna Mulligan
Born in 1963. Trustee since January 2018. Principal occupation(s) during the past five years and other experience: president (2010–present) and chief executive officer (2011–present) of The Guardian Life Insurance Company of America. Chief operating officer (2010–2011) and executive vice president (2008–2010) of Individual Life and Disability of The Guardian Life Insurance Company of America. Member of the board of The Guardian Life Insurance Company of America, the American Council of Life Insurers, the Partnership for New York City (business leadership), and the Committee Encouraging Corporate Philanthropy. Trustee of the Economic Club of New York and the Bruce Museum (arts and science). Member of the Advisory Council for the Stanford Graduate School of Business.
André F. Perold
Born in 1952. Trustee since December 2004. Principal occupation(s) during the past five years and other experience: George Gund Professor of Finance and Banking, Emeritus at the Harvard Business School (retired 2011). Chief investment officer and co-managing partner of HighVista Strategies LLC (private investment firm). Board of advisors and investment committee member of the Museum of Fine Arts Boston. Board member (2018–present) of RIT Capital Partners (investment firm); investment committee member of Partners Health Care System.
Sarah Bloom Raskin
Born in 1961. Trustee since January 2018. Principal occupation(s) during the past five years and other experience: deputy secretary (2014–2017) of the United States Department of the Treasury. Governor (2010–2014) of the Federal Reserve Board. Commissioner (2007–2010) of financial regulation for the State of Maryland. Member of the board of directors (2012–2014) of Neighborhood Reinvestment Corporation. Director (2017–present) of i(x) Investments, LLC; director (2017–present) of Reserve Trust. Rubinstein Fellow (2017–present) of Duke University; trustee (2017–present) of Amherst College.
Peter F. Volanakis
Born in 1955. Trustee since July 2009. Principal occupation(s) during the past five years and other experience: president and chief operating officer (retired 2010) of Corning Incorporated (communications equipment) and director of Corning Incorporated (2000–2010) and Dow Corning (2001–2010). Director (2012) of SPX Corporation (multi-industry manufacturing). Overseer of the Amos Tuck School of Business Administration, Dartmouth College (2001–2013). Chairman of the board of trustees of Colby-Sawyer College. Member of the board of Hypertherm Inc. (industrial cutting systems, software, and consumables).
Executive Officers
Glenn Booraem
Born in 1967. Principal occupation(s) during the past five years and other experience: principal of Vanguard. Investment stewardship officer (2017–present), treasurer (2015–2017), controller (2010–2015), and assistant controller (2001–2010) of each of the investment companies served by Vanguard.
Christine M. Buchanan
Born in 1970. Principal occupation(s) during the past five years and other experience: principal of Vanguard and global head of Fund Administration at Vanguard. Treasurer (2017–present) of each of the investment companies served by Vanguard. Partner (2005–2017) at KPMG LLP (audit, tax, and advisory services).
Thomas J. Higgins
Born in 1957. Principal occupation(s) during the past five years and other experience: principal of Vanguard. Chief financial officer (2008–present) and treasurer (1998–2008) of each of the investment companies served by Vanguard.
Peter Mahoney
Born in 1974. Principal occupation(s) during the past five years and other experience: principal of Vanguard. Controller (2015–present) of each of the investment companies served by Vanguard. Head of International Fund Services (2008–2014) at Vanguard.
Anne E. Robinson
Born in 1970. Principal occupation(s) during the past five years and other experience: general counsel (2016–present) of Vanguard. Secretary (2016–present) of Vanguard and of each of the investment companies served by Vanguard. Managing director (2016–present) of Vanguard. Director and senior vice president (2016–2018) of Vanguard Marketing Corporation. Managing director and general counsel of Global Cards and Consumer Services (2014–2016) at Citigroup. Counsel (2003–2014) at American Express.
Michael Rollings
Born in 1963. Principal occupation(s) during the past five years and other experience: finance director (2017–present) and treasurer (2017) of each of the investment companies served by Vanguard. Managing director (2016–present) of Vanguard. Chief financial officer (2016–present) of Vanguard. Director (2016–present) of Vanguard Marketing Corporation. Executive vice president and chief financial officer (2006–2016) of MassMutual Financial Group.
John E. Schadl
Born in 1972. Principal occupation(s) during the past five years and other experience: principal of Vanguard. Chief compliance officer (2019–present) of Vanguard and of each of the investment companies served by Vanguard. Assistant vice president (May 2019–present) of Vanguard Marketing Corporation.
Vanguard Senior Management Team |
| |
Joseph Brennan | Chris D. McIsaac |
Mortimer J. Buckley | James M. Norris |
Gregory Davis | Thomas M. Rampulla |
John James | Karin A. Risi |
Martha G. King | Anne E. Robinson |
John T. Marcante | Michael Rollings |
| | 
|
| | |
| | P.O. Box 2600 |
| | Valley Forge, PA 19482-2600 |
Connect with Vanguard® > vanguard.com
Fund Information > 800-662-7447
Direct Investor Account Services > 800-662-2739
Institutional Investor Services > 800-523-1036
Text Telephone for People
Who Are Deaf or Hard of Hearing > 800-749-7273
This material may be used in conjunction with the offering of shares of any Vanguard fund only if preceded or accompanied by the fund’s current prospectus.
All comparative mutual fund data are from Morningstar, Inc., unless otherwise noted.
You can obtain a free copy of Vanguard’s proxy voting guidelines by visiting vanguard.com/proxyreporting or by calling Vanguard at 800-662-2739. The guidelines are also available from the SEC’s website, www.sec.gov. In addition, you may obtain a free report on how your fund voted the proxies for securities it owned during the 12 months ended June 30. To get the report, visit either vanguard.com/proxyreporting or www.sec.gov.
You can review information about your fund on the SEC’s website, and you can receive copies of this information, for a fee, by sending a request via email addressed to publicinfo@sec.gov.
Source for Bloomberg Barclays indexes: Bloomberg Index Services Limited. Copyright 2019, Bloomberg. All rights reserved.
CFA® is a registered trademark owned by CFA Institute.
| © 2019 The Vanguard Group, Inc. |
| All rights reserved. |
| Vanguard Marketing Corporation, Distributor. |
| |
| Q3280 112019 |

Annual Report | September 30, 2019 Vanguard Short-Term Inflation-Protected Securities Index Fund |
See the inside front cover for important information about access to your fund’s annual and semiannual shareholder reports. |
Important information about access to shareholder reports
Beginning on January 1, 2021, as permitted by regulations adopted by the Securities and Exchange Commission, paper copies of your fund’s annual and semiannual shareholder reports will no longer be sent to you by mail, unless you specifically request them. Instead, you will be notified by mail each time a report is posted on the website and will be provided with a link to access the report.
If you have already elected to receive shareholder reports electronically, you will not be affected by this change and do not need to take any action. You may elect to receive shareholder reports and other communications from the fund electronically by contacting your financial intermediary (such as a broker-dealer or bank) or, if you invest directly with the fund, by calling Vanguard at one of the phone numbers on the back cover of this report or by logging on to vanguard.com.
You may elect to receive paper copies of all future shareholder reports free of charge. If you invest through a financial intermediary, you can contact the intermediary to request that you continue to receive paper copies. If you invest directly with the fund, you can call Vanguard at one of the phone numbers on the back cover of this report or log on to vanguard.com. Your election to receive paper copies will apply to all the funds you hold through an intermediary or directly with Vanguard.
Contents | |
| |
A Note From Our Chairman | 1 |
Your Fund’s Performance at a Glance | 2 |
About Your Fund’s Expenses | 3 |
Performance Summary | 5 |
Financial Statements | 8 |
Please note: The opinions expressed in this report are just that—informed opinions. They should not be considered promises or advice. Also, please keep in mind that the information and opinions cover the period through the date on the front of this report. Of course, the risks of investing in your fund are spelled out in the prospectus.
A Note From Our Chairman

Tim Buckley
Chairman and Chief Executive Officer
Dear Shareholder,
Recent volatility in financial markets—affecting stocks, bonds, and commodities—has been a good reminder of the wise old adage, “Never keep all your eggs in one basket.” Maintaining balance and diversification in your investment portfolio can help to both limit risk and set you up for long-term success.
It’s understandable why some investors might become complacent after a long market run-up like the one that lifted stock prices, especially U.S. stock prices, in the years following the global financial crisis. But failing to rebalance regularly can leave a portfolio with a much different mix of assets than intended and, often, more risk than intended.
Balance across and diversification within asset classes are powerful tools for managing risk and achieving your investment goals. A portfolio’s allocation will determine a large portion of its long-term return and also the majority of its volatility risk. A well-diversified portfolio is less vulnerable to significant swings in the performance of any one segment of the asset classes in which it invests.
Balance and diversification will never eliminate the risk of loss, nor will they guarantee positive returns in a declining market. But they should reduce the chance that you’ll suffer disproportionate losses in one particular high-flying asset class or sector when it comes back to earth. And exposure to all key market components should give you at least some participation in the sectors that are performing best at any given time.
Vanguard is committed to helping you achieve balance and diversification in your portfolios to help meet your investment goals. We thank you for your continued loyalty.
Sincerely,

|
|
Mortimer J. Buckley |
Chairman and Chief Executive Officer |
October 14, 2019 |
1
Your Fund’s Performance at a Glance
· For the 12 months ended September��30, 2019, Vanguard Short-Term Inflation-Protected Securities Index Fund returned 3.36% for Investor Shares, tracking its benchmark (+3.44%). The 30-day SEC yield for Investor Shares, a proxy for a fund’s potential annualized rate of income, declined 38 basis points over the period, to 0.41%. (A basis point is one one-hundredth of a percentage point.)
· Prices of regular U.S. Treasury securities rose amid signs of slowing global growth, an escalation in trade disputes, flare-ups in geopolitical tensions, and continued uncertainty about the United Kingdom’s exit from the European Union. Against this background, several major central banks, including the Federal Reserve, turned more accommodative in the latter part of the period.
· The gap between nominal yields and yields of Treasury inflation-protected securities (TIPS)—considered a measure of the expected annualized rate of inflation over the next five years—fell 70 basis points, to 1.34%. TIPS underperformed regular Treasuries, as they typically do when inflation expectations fall.
Market Barometer | | | |
| Average Annual Total Returns |
| Periods Ended September 30, 2019 |
| One Year | Three Years | Five Years |
Stocks | | | |
Russell 1000 Index (Large-caps) | 3.87% | 13.19% | 10.62% |
Russell 2000 Index (Small-caps) | -8.89 | 8.23 | 8.19 |
Russell 3000 Index (Broad U.S. market) | 2.92 | 12.83 | 10.44 |
FTSE All-World ex US Index (International) | -1.12 | 6.46 | 3.24 |
| | | |
Bonds | | | |
Bloomberg Barclays U.S. Aggregate Bond Index | | | |
(Broad taxable market) | 10.30% | 2.92% | 3.38% |
Bloomberg Barclays Municipal Bond Index | | | |
(Broad tax-exempt market) | 8.55 | 3.19 | 3.66 |
FTSE Three-Month U.S. Treasury Bill Index | 2.36 | 1.52 | 0.95 |
| | | |
CPI | | | |
Consumer Price Index | 1.71% | 2.07% | 1.53% |
2
About Your Fund’s Expenses
As a shareholder of the fund, you incur ongoing costs, which include costs for portfolio management, administrative services, and shareholder reports (like this one), among others. Operating expenses, which are deducted from a fund’s gross income, directly reduce the investment return of the fund.
A fund’s expenses are expressed as a percentage of its average net assets. This figure is known as the expense ratio. The following examples are intended to help you understand the ongoing costs (in dollars) of investing in your fund and to compare these costs with those of other mutual funds. The examples are based on an investment of $1,000 made at the beginning of the period shown and held for the entire period.
The accompanying table illustrates your fund’s costs in two ways:
· Based on actual fund return. This section helps you to estimate the actual expenses that you paid over the period. The “Ending Account Value” shown is derived from the fund’s actual return, and the third column shows the dollar amount that would have been paid by an investor who started with $1,000 in the fund. You may use the information here, together with the amount you invested, to estimate the expenses that you paid over the period.
To do so, simply divide your account value by $1,000 (for example, an $8,600 account value divided by $1,000 = 8.6), then multiply the result by the number given for your fund under the heading “Expenses Paid During Period.”
· Based on hypothetical 5% yearly return. This section is intended to help you compare your fund’s costs with those of other mutual funds. It assumes that the fund had a yearly return of 5% before expenses, but that the expense ratio is unchanged. In this case—because the return used is not the fund’s actual return—the results do not apply to your investment. The example is useful in making comparisons because the Securities and Exchange Commission requires all mutual funds to calculate expenses based on a 5% return. You can assess your fund’s costs by comparing this hypothetical example with the hypothetical examples that appear in shareholder reports of other funds.
Note that the expenses shown in the table are meant to highlight and help you compare ongoing costs only and do not reflect transaction costs incurred by the fund for buying and selling securities. Further, the expenses do not include any purchase, redemption, or account service fees described in the fund prospectus. If such fees were applied to your account, your costs would be higher. Your fund does not carry a “sales load.”
The calculations assume no shares were bought or sold during the period. Your actual costs may have been higher or lower, depending on the amount of your investment and the timing of any purchases or redemptions.
You can find more information about the fund’s expenses, including annual expense ratios, in the Financial Statements section of this report. For additional information on operating expenses and other shareholder costs, please refer to your fund’s current prospectus.
3
Six Months Ended September 30, 2019 | | | |
| Beginning | Ending | Expenses |
| Account Value | Account Value | Paid During |
Short-Term Inflation-Protected Securities Index Fund | 3/31/2019 | 9/30/2019 | Period |
Based on Actual Fund Return | | | |
Investor Shares | $1,000.00 | $1,019.42 | $0.71 |
ETF Shares | 1,000.00 | 1,019.95 | 0.20 |
Admiral™ Shares | 1,000.00 | 1,019.82 | 0.30 |
Institutional Shares | 1,000.00 | 1,019.93 | 0.20 |
Based on Hypothetical 5% Yearly Return | | | |
Investor Shares | $1,000.00 | $1,024.37 | $0.71 |
ETF Shares | 1,000.00 | 1,024.87 | 0.20 |
Admiral Shares | 1,000.00 | 1,024.77 | 0.30 |
Institutional Shares | 1,000.00 | 1,024.87 | 0.20 |
The calculations are based on expenses incurred in the most recent six-month period. The fund’s annualized six-month expense ratios for that period are 0.14% for Investor Shares, 0.04% for ETF Shares, 0.06% for Admiral Shares, and 0.04% for Institutional Shares. The dollar amounts shown as “Expenses Paid” are equal to the annualized expense ratio multiplied by the average account value over the period, multiplied by the number of days in the most recent six-month period, then divided by the number of days in the most recent 12-month period (183/365).
4
Short-Term Inflation-Protected Securities Index Fund
Performance Summary
All of the returns in this report represent past performance, which is not a guarantee of future results that may be achieved by the fund. (Current performance may be lower or higher than the performance data cited. For performance data current to the most recent month-end, visit our website at vanguard.com/performance.) Note, too, that both investment returns and principal value can fluctuate widely, so an investor’s shares, when sold, could be worth more or less than their original cost. The returns shown do not reflect taxes that a shareholder would pay on fund distributions or on the sale of fund shares.
Cumulative Performance: October 16, 2012, Through September 30, 2019
Initial Investment of $10,000

| | Average Annual Total Returns | |
| | Periods Ended September 30, 2019 | |
| | | | Since | Final Value |
| | One | Five | Inception | of a $10,000 |
| | Year | Years | (10/16/2012) | Investment |

| Short-Term Inflation-Protected Securities Index Fund Investor Shares | 3.36% | 1.13% | 0.67% | $10,477 |

| Bloomberg Barclays U.S. Treasury Inflation-Protected Securities (TIPS) 0–5 Year Index | 3.44 | 1.27 | 0.76 | 10,543 |

| Bloomberg Barclays U.S. Aggregate Bond Index | 10.30 | 3.38 | 2.74 | 12,065 |
“Since Inception” performance is calculated from the Investor Shares’ inception date for both the fund and its comparative standards.
| | | | Since | Final Value |
| | One | Five | Inception | of a $10,000 |
| | Year | Years | (10/12/2012) | Investment |
Short-Term Inflation-Protected Securities Index Fund ETF Shares Net Asset Value | 3.46% | 1.22% | 0.76% | $10,542 |
Bloomberg Barclays U.S. Treasury Inflation-Protected Securities (TIPS) 0–5 Year Index | 3.44 | 1.27 | 0.76 | 10,542 |
Bloomberg Barclays U.S. Aggregate Bond Index | 10.30 | 3.38 | 2.71 | 12,048 |
“Since Inception” performance is calculated from the ETF Shares’ inception date for both the fund and its comparative standards.
See Financial Highlights for dividend and capital gains information.
5
Short-Term Inflation-Protected Securities Index Fund
| | Average Annual Total Returns | |
| | Periods Ended September 30, 2019 | |
| | | | Since | Final Value |
| | One | Five | Inception | of a $10,000 |
| | Year | Years | (10/16/2012) | Investment |
Short-Term Inflation-Protected Securities Index Fund Admiral Shares | 3.46% | 1.22% | 0.76% | $10,542 |
Bloomberg Barclays U.S. Treasury Inflation-Protected Securities (TIPS) 0–5 Year Index | 3.44 | 1.27 | 0.76 | 10,543 |
Bloomberg Barclays U.S. Aggregate Bond Index | 10.30 | 3.38 | 2.74 | 12,065 |
“Since Inception” performance is calculated from the Admiral Shares’ inception date for both the fund and its comparative standards.
| | | | Since | Final Value |
| | One | Five | Inception | of a $5,000,000 |
| | Year | Years | (10/17/2012) | Investment |
Short-Term Inflation-Protected Securities Index Fund Institutional Shares | 3.48% | 1.25% | 0.80% | $5,283,640 |
Bloomberg Barclays U.S. Treasury Inflation-Protected Securities (TIPS) 0–5 Year Index | 3.44 | 1.27 | 0.77 | 5,275,289 |
Bloomberg Barclays U.S. Aggregate Bond Index | 10.30 | 3.38 | 2.77 | 6,046,563 |
“Since Inception” performance is calculated from the Institutional Shares’ inception date for both the fund and its comparative standards.
Cumulative Returns of ETF Shares: October 12, 2012, Through September 30, 2019
| | | Since |
| One | Five | Inception |
| Year | Years | (10/12/2012) |
Short-Term Inflation-Protected Securities Index Fund ETF Shares Market Price | 3.46% | 6.25% | 5.48% |
Short-Term Inflation-Protected Securities Index Fund ETF Shares Net Asset Value | 3.46 | 6.23 | 5.42 |
Bloomberg Barclays U.S. Treasury Inflation-Protected Securities (TIPS) 0–5 Year Index | 3.44 | 6.50 | 5.42 |
“Since Inception” performance is calculated from the ETF Shares’ inception date for both the fund and its comparative standards.
For the ETF Shares, the market price is determined by the midpoint of the bid-offer spread as of the closing time of the New York Stock Exchange (generally 4 p.m., Eastern time). The net asset value is also determined as of the NYSE closing time. For more information about how the ETF Shares’ market prices have compared with their net asset value, visit vanguard.com, select your ETF, and then select the Price and Performance tab. The ETF premium/discount analysis there shows the percentages of days on which the ETF Shares’ market price was above or below the NAV.
6
Short-Term Inflation-Protected Securities Index Fund
Sector Diversification
As of September 30, 2019
The table reflects the fund’s market exposure. Any holdings in short-term reserves are excluded. The agency and mortgage-backed securities sectors may include issues from government-sponsored enterprises; such issues are generally not backed by the full faith and credit of the U.S. government.
7
Short-Term Inflation-Protected Securities Index Fund
Financial Statements
Statement of Net Assets
As of September 30, 2019
The fund files its complete schedule of portfolio holdings with the Securities and Exchange Commission (SEC) for the first and third quarters of each fiscal year as an exhibit to its reports on Form N-PORT. The fund’s Form N-PORT reports are available on the SEC’s website at www.sec.gov.
| | | | | | | Face | | Market | |
| | | | | Maturity | | Amount | | Value· | |
| | | Coupon | | Date | | ($000 | ) | ($000 | ) |
U.S. Government and Agency Obligations (99.9%) | | | | | | | | | |
U.S. Government Securities (99.9%) | | | | | | | | | |
| United States Treasury Inflation Indexed Bonds | | 1.375% | | 1/15/20 | | 886,360 | | 1,048,367 | |
| United States Treasury Inflation Indexed Bonds | | 0.125% | | 4/15/20 | | 2,482,786 | | 2,697,207 | |
| United States Treasury Inflation Indexed Bonds | | 1.250% | | 7/15/20 | | 1,384,709 | | 1,635,943 | |
| United States Treasury Inflation Indexed Bonds | | 1.125% | | 1/15/21 | | 1,588,712 | | 1,869,182 | |
| United States Treasury Inflation Indexed Bonds | | 0.125% | | 4/15/21 | | 2,184,837 | | 2,339,698 | |
| United States Treasury Inflation Indexed Bonds | | 0.625% | | 7/15/21 | | 1,737,519 | | 1,985,970 | |
| United States Treasury Inflation Indexed Bonds | | 0.125% | | 1/15/22 | | 1,925,909 | | 2,163,062 | |
| United States Treasury Inflation Indexed Bonds | | 0.125% | | 4/15/22 | | 2,184,453 | | 2,281,921 | |
| United States Treasury Inflation Indexed Bonds | | 0.125% | | 7/15/22 | | 2,018,205 | | 2,243,288 | |
| United States Treasury Inflation Indexed Bonds | | 0.125% | | 1/15/23 | | 2,035,165 | | 2,244,520 | |
| United States Treasury Inflation Indexed Bonds | | 0.625% | | 4/15/23 | | 2,184,862 | | 2,276,557 | |
| United States Treasury Inflation Indexed Bonds | | 0.375% | | 7/15/23 | | 2,035,375 | | 2,258,722 | |
| United States Treasury Inflation Indexed Bonds | | 0.625% | | 1/15/24 | | 2,034,930 | | 2,274,328 | |
| United States Treasury Inflation Indexed Bonds | | 0.500% | | 4/15/24 | | 1,588,516 | | 1,637,199 | |
| United States Treasury Inflation Indexed Bonds | | 0.125% | | 7/15/24 | | 2,035,937 | | 2,200,263 | |
Total U.S. Government and Agency Obligations (Cost $31,167,467) | | | | 31,156,227 | |
| | | | | | | | | | |
| | | | | | | Shares | | | |
Temporary Cash Investment (0.0%) | | | | | | | | | |
Money Market Fund (0.0%) | | | | | | | | | |
1 | Vanguard Market Liquidity Fund (Cost $3,098) | | 2.098% | | | | 30,975 | | 3,098 | |
Total Investments (99.9%) (Cost $31,170,565) | | | | | | | | 31,159,325 | |
8
Short-Term Inflation-Protected Securities Index Fund
| | Amount | |
| | ($000 | ) |
Other Assets and Liabilities (0.1%) | | | |
Other Assets | | | |
Investment in Vanguard | | 1,460 | |
Receivables for Accrued Income | | 36,091 | |
Receivables for Capital Shares Issued | | 227,206 | |
Total Other Assets | | 264,757 | |
Liabilities | | | |
Payables for Investment Securities Purchased | | (207,735 | ) |
Payables for Capital Shares Redeemed | | (14,170 | ) |
Payables to Vanguard | | (3,036 | ) |
Other Liabilities | | (20 | ) |
Total Liabilities | | (224,961 | ) |
Net Assets (100%) | | 31,199,121 | |
| | | |
At September 30, 2019, net assets consisted of: | | | |
| | Amount | |
| | ($000 | ) |
Paid-in Capital | | 31,247,643 | |
Total Distributable Earnings (Loss) | | (48,522 | ) |
Net Assets | | 31,199,121 | |
| | | |
Investor Shares—Net Assets | | | |
Applicable to 285,449,840 outstanding $.001 par value shares of beneficial interest (unlimited authorization) | | 7,013,951 | |
Net Asset Value Per Share—Investor Shares | | $24.57 | |
| | | |
ETF Shares—Net Assets | | | |
Applicable to 140,402,576 outstanding $.001 par value shares of beneficial interest (unlimited authorization) | | 6,884,429 | |
Net Asset Value Per Share—ETF Shares | | $49.03 | |
| | | |
Admiral Shares—Net Assets | | | |
Applicable to 298,083,813 outstanding $.001 par value shares of beneficial interest (unlimited authorization) | | 7,333,407 | |
Net Asset Value Per Share—Admiral Shares | | $24.60 | |
| | | |
Institutional Shares—Net Assets | | | |
Applicable to 404,867,320 outstanding $.001 par value shares of beneficial interest (unlimited authorization) | | 9,967,334 | |
Net Asset Value Per Share—Institutional Shares | | $24.62 | |
· See Note A in Notes to Financial Statements.
1 Affiliated money market fund available only to Vanguard funds and certain trusts and accounts managed by Vanguard. Rate shown is the 7-day yield.
See accompanying Notes, which are an integral part of the Financial Statements.
9
Short-Term Inflation-Protected Securities Index Fund
Statement of Operations
| | Year Ended | |
| | September 30, 2019 | |
| | ($000 | ) |
Investment Income | | | |
Income | | | |
Interest1 | | 606,336 | |
Total Income | | 606,336 | |
Expenses | | | |
The Vanguard Group—Note B | | | |
Investment Advisory Services | | 1,022 | |
Management and Administrative—Investor Shares | | 8,442 | |
Management and Administrative—ETF Shares | | 2,217 | |
Management and Administrative—Admiral Shares | | 3,324 | |
Management and Administrative—Institutional Shares | | 2,816 | |
Marketing and Distribution—Investor Shares | | 671 | |
Marketing and Distribution—ETF Shares | | 352 | |
Marketing and Distribution—Admiral Shares | | 434 | |
Marketing and Distribution—Institutional Shares | | 325 | |
Custodian Fees | | 131 | |
Auditing Fees | | 64 | |
Shareholders’ Reports—Investor Shares | | 47 | |
Shareholders’ Reports—ETF Shares | | 183 | |
Shareholders’ Reports—Admiral Shares | | 86 | |
Shareholders’ Reports—Institutional Shares | | 7 | |
Trustees’ Fees and Expenses | | 13 | |
Total Expenses | | 20,134 | |
Net Investment Income | | 586,202 | |
Realized Net Gain (Loss) | | | |
Investment Securities Sold1,2 | | (41,300 | ) |
Futures Contracts | | (6,002 | ) |
Realized Net Gain (Loss) | | (47,302 | ) |
Change in Unrealized Appreciation (Depreciation) of Investment Securities1 | | 432,416 | |
Net Increase (Decrease) in Net Assets Resulting from Operations | | 971,316 | |
1 Interest income, realized net gain (loss), and change in unrealized appreciation (depreciation) from an affiliated company of the fund were $5,061,000, $76,000, and ($1,000) , respectively. Purchases and sales are for temporary cash investment purposes.
2 Includes $3,896,000 of net gain (loss) resulting from in-kind redemptions; such gain (loss) is not taxable to the fund.
See accompanying Notes, which are an integral part of the Financial Statements.
10
Short-Term Inflation-Protected Securities Index Fund
Statement of Changes in Net Assets
| | Year Ended September 30, | |
| | 2019 | | 2018 | |
| | ($000 | ) | ($000 | ) |
Increase (Decrease) in Net Assets | | | | | |
Operations | | | | | |
Net Investment Income | | 586,202 | | 684,104 | |
Realized Net Gain (Loss) | | (47,302 | ) | (39,997 | ) |
Change in Unrealized Appreciation (Depreciation) | | 432,416 | | (398,504 | ) |
Net Increase (Decrease) in Net Assets Resulting from Operations | | 971,316 | | 245,603 | |
Distributions | | | | | |
Net Investment Income | | | | | |
Investor Shares | | (129,427 | ) | (196,531 | ) |
ETF Shares | | (125,996 | ) | (158,959 | ) |
Admiral Shares | | (137,254 | ) | (186,081 | ) |
Institutional Shares | | (178,041 | ) | (242,955 | ) |
Realized Capital Gain | | | | | |
Investor Shares | | — | | — | |
ETF Shares | | — | | — | |
Admiral Shares | | — | | — | |
Institutional Shares | | — | | — | |
Total Distributions | | (570,718 | ) | (784,526 | ) |
Capital Share Transactions | | | | | |
Investor Shares | | 240,591 | | 912,377 | |
ETF Shares | | 1,350,372 | | 1,681,666 | |
Admiral Shares | | 709,238 | | 1,573,157 | |
Institutional Shares | | 1,775,121 | | 1,245,525 | |
Net Increase (Decrease) from Capital Share Transactions | | 4,075,322 | | 5,412,725 | |
Total Increase (Decrease) | | 4,475,920 | | 4,873,802 | |
Net Assets | | | | | |
Beginning of Period | | 26,723,201 | | 21,849,399 | |
End of Period | | 31,199,121 | | 26,723,201 | |
See accompanying Notes, which are an integral part of the Financial Statements.
11
Short-Term Inflation-Protected Securities Index Fund
Financial Highlights
Investor Shares | | | | | |
| | | | | |
For a Share Outstanding | Year Ended September 30, |
Throughout Each Period | 2019 | 2018 | 2017 | 2016 | 2015 |
Net Asset Value, Beginning of Period | $24.23 | $24.77 | $24.83 | $24.23 | $24.74 |
Investment Operations | | | | | |
Net Investment Income | .4831 | .6691 | .3121 | .0801 | (.131) |
Net Realized and Unrealized Gain (Loss) on Investments | .324 | (.448) | (.237) | .520 | (.206) |
Total from Investment Operations | .807 | .221 | .075 | .600 | (.337) |
Distributions | | | | | |
Dividends from Net Investment Income | (.467) | (.761) | (.135) | — | (.173) |
Distributions from Realized Capital Gains | — | — | — | — | — |
Total Distributions | (.467) | (.761) | (.135) | — | (.173) |
Net Asset Value, End of Period | $24.57 | $24.23 | $24.77 | $24.83 | $24.23 |
| | | | | |
Total Return2 | 3.36% | 0.91% | 0.31% | 2.48% | -1.36% |
| | | | | |
Ratios/Supplemental Data | | | | | |
Net Assets, End of Period (Millions) | $7,014 | $6,679 | $5,904 | $5,088 | $4,532 |
Ratio of Total Expenses to Average Net Assets | 0.14% | 0.14% | 0.15% | 0.16% | 0.17% |
Ratio of Net Investment Income to Average Net Assets | 1.98% | 2.73% | 1.26% | 0.42% | (0.53%) |
Portfolio Turnover Rate3 | 26% | 25% | 27% | 28% | 26% |
1 Calculated based on average shares outstanding.
2 Total returns do not include account service fees that may have applied in the periods shown. Fund prospectuses provide information about any applicable account service fees.
3 Excludes the value of portfolio securities received or delivered as a result of in-kind purchases or redemptions of the fund’s capital shares, including ETF Creation Units.
See accompanying Notes, which are an integral part of the Financial Statements.
12
Short-Term Inflation-Protected Securities Index Fund
Financial Highlights
ETF Shares | | | | | |
| | | | | |
For a Share Outstanding | Year Ended September 30, |
Throughout Each Period | 2019 | 2018 | 2017 | 2016 | 2015 |
Net Asset Value, Beginning of Period | $48.34 | $49.41 | $49.59 | $48.36 | $49.38 |
Investment Operations | | | | | |
Net Investment Income | 1.0031 | 1.3581 | .6711 | .2511 | (.210) |
Net Realized and Unrealized Gain (Loss) on Investments | .652 | (.869) | (.477) | .979 | (.415) |
Total from Investment Operations | 1.655 | .489 | .194 | 1.230 | (.625) |
Distributions | | | | | |
Dividends from Net Investment Income | (.965) | (1.559) | (.374) | — | (.395) |
Distributions from Realized Capital Gains | — | — | — | — | — |
Total Distributions | (.965) | (1.559) | (.374) | — | (.395) |
Net Asset Value, End of Period | $49.03 | $48.34 | $49.41 | $49.59 | $48.36 |
| | | | | |
Total Return | 3.46% | 1.01% | 0.40% | 2.54% | -1.26% |
| | | | | |
Ratios/Supplemental Data | | | | | |
Net Assets, End of Period (Millions) | $6,884 | $5,453 | $3,881 | $2,478 | $1,838 |
Ratio of Total Expenses to Average Net Assets | 0.05% | 0.06% | 0.06% | 0.07% | 0.08% |
Ratio of Net Investment Income to Average Net Assets | 2.07% | 2.81% | 1.35% | 0.51% | (0.44%) |
Portfolio Turnover Rate2 | 26% | 25% | 27% | 28% | 26% |
1 Calculated based on average shares outstanding.
2 Excludes the value of portfolio securities received or delivered as a result of in-kind purchases or redemptions of the fund’s capital shares, including ETF Creation Units.
See accompanying Notes, which are an integral part of the Financial Statements.
13
Short-Term Inflation-Protected Securities Index Fund
Financial Highlights
Admiral Shares | | | | | |
| | | | | |
For a Share Outstanding | Year Ended September 30, |
Throughout Each Period | 2019 | 2018 | 2017 | 2016 | 2015 |
Net Asset Value, Beginning of Period | $24.25 | $24.79 | $24.88 | $24.27 | $24.77 |
Investment Operations | | | | | |
Net Investment Income | .5001 | .6921 | .3381 | .1491 | (.105) |
Net Realized and Unrealized Gain (Loss) on Investments | .332 | (.450) | (.241) | .461 | (.197) |
Total from Investment Operations | .832 | .242 | .097 | .610 | (.302) |
Distributions | | | | | |
Dividends from Net Investment Income | (.482) | (.782) | (.187) | — | (.198) |
Distributions from Realized Capital Gains | — | — | — | — | — |
Total Distributions | (.482) | (.782) | (.187) | — | (.198) |
Net Asset Value, End of Period | $24.60 | $24.25 | $24.79 | $24.88 | $24.27 |
| | | | | |
Total Return2 | 3.46% | 1.00% | 0.40% | 2.51% | -1.22% |
| | | | | |
Ratios/Supplemental Data | | | | | |
Net Assets, End of Period (Millions) | $7,333 | $6,525 | $5,078 | $3,373 | $2,126 |
Ratio of Total Expenses to Average Net Assets | 0.06% | 0.06% | 0.06% | 0.07% | 0.08% |
Ratio of Net Investment Income to Average Net Assets | 2.06% | 2.81% | 1.35% | 0.51% | (0.44%) |
Portfolio Turnover Rate3 | 26% | 25% | 27% | 28% | 26% |
1 Calculated based on average shares outstanding.
2 Total returns do not include account service fees that may have applied in the periods shown. Fund prospectuses provide information about any applicable account service fees.
3 Excludes the value of portfolio securities received or delivered as a result of in-kind purchases or redemptions of the fund’s capital shares, including ETF Creation Units.
See accompanying Notes, which are an integral part of the Financial Statements.
14
Short-Term Inflation-Protected Securities Index Fund
Financial Highlights
Institutional Shares | | | | | |
| | | | | |
For a Share Outstanding | Year Ended September 30, |
Throughout Each Period | 2019 | 2018 | 2017 | 2016 | 2015 |
Net Asset Value, Beginning of Period | $24.27 | $24.81 | $24.90 | $24.28 | $24.78 |
Investment Operations | | | | | |
Net Investment Income | .5171 | .6961 | .3331 | .1391 | (.099) |
Net Realized and Unrealized Gain (Loss) on Investments | .319 | (.449) | (.225) | .481 | (.196) |
Total from Investment Operations | .836 | .247 | .108 | .620 | (.295) |
Distributions | | | | | |
Dividends from Net Investment Income | (.486) | (.787) | (.198) | — | (.205) |
Distributions from Realized Capital Gains | — | — | — | — | — |
Total Distributions | (.486) | (.787) | (.198) | — | (.205) |
Net Asset Value, End of Period | $24.62 | $24.27 | $24.81 | $24.90 | $24.28 |
| | | | | |
Total Return | 3.48% | 1.02% | 0.44% | 2.55% | -1.19% |
| | | | | |
Ratios/Supplemental Data | | | | | |
Net Assets, End of Period (Millions) | $9,967 | $8,067 | $6,986 | $5,500 | $3,837 |
Ratio of Total Expenses to Average Net Assets | 0.04% | 0.04% | 0.04% | 0.04% | 0.05% |
Ratio of Net Investment Income to Average Net Assets | 2.08% | 2.83% | 1.37% | 0.54% | (0.41%) |
Portfolio Turnover Rate2 | 26% | 25% | 27% | 28% | 26% |
1 Calculated based on average shares outstanding.
2 Excludes the value of portfolio securities received or delivered as a result of in-kind purchases or redemptions of the fund’s capital shares, including ETF Creation Units.
See accompanying Notes, which are an integral part of the Financial Statements.
15
Short-Term Inflation-Protected Securities Index Fund
Notes to Financial Statements
Vanguard Short-Term Inflation-Protected Securities Index Fund is registered under the Investment Company Act of 1940 as an open-end investment company, or mutual fund. The fund offers four classes of shares: Investor Shares, ETF Shares, Admiral Shares, and Institutional Shares. Each of the share classes has different eligibility and minimum purchase requirements, and is designed for different types of investors. ETF Shares are listed for trading on Nasdaq; they can be purchased and sold through a broker.
A. The following significant accounting policies conform to generally accepted accounting principles for U.S. investment companies. The fund consistently follows such policies in preparing its financial statements.
1. Security Valuation: Securities are valued as of the close of trading on the New York Stock Exchange (generally 4 p.m., Eastern time) on the valuation date. Bonds and temporary cash investments are valued using the latest bid prices or using valuations based on a matrix system (which considers such factors as security prices, yields, maturities, and ratings), both as furnished by independent pricing services. Investments in Vanguard Market Liquidity Fund are valued at that fund’s net asset value. Securities for which market quotations are not readily available, or whose values have been affected by events occurring before the fund’s pricing time but after the close of the securities’ primary markets, are valued by methods deemed by the board of trustees to represent fair value.
2. Futures Contracts: The fund uses futures contracts to invest in fixed income asset classes with greater efficiency and lower cost than is possible through direct investment, to add value when these instruments are attractively priced, or to adjust sensitivity to changes in interest rates. The primary risks associated with the use of futures contracts are imperfect correlation between changes in market values of bonds held by the fund and the prices of futures contracts, and the possibility of an illiquid market. Counterparty risk involving futures is mitigated because a regulated clearinghouse is the counterparty instead of the clearing broker. To further mitigate counterparty risk, the fund trades futures contracts on an exchange, monitors the financial strength of its clearing brokers and clearinghouse, and has entered into clearing agreements with its clearing brokers. The clearinghouse imposes initial margin requirements to secure the fund’s performance and requires daily settlement of variation margin representing changes in the market value of each contract. Any assets pledged as initial margin for open contracts are noted in the Statement of Net Assets.
Futures contracts are valued at their quoted daily settlement prices. The notional amounts of the contracts are not recorded in the Statement of Net Assets. Fluctuations in the value of the contracts are recorded in the Statement of Net Assets as an asset (liability) and in the Statement of Operations as unrealized appreciation (depreciation) until the contracts are closed, when they are recorded as realized futures gains (losses).
During the year ended September 30, 2019, the fund’s average investments in long and short futures contracts each represented 0% of net assets, based on the average of the notional amounts at each quarter-end during the period. The fund had no open futures contracts at September 30, 2019.
3. Federal Income Taxes: The fund intends to continue to qualify as a regulated investment company and distribute all of its taxable income. Management has analyzed the fund’s tax positions taken for all open federal income tax years (September 30, 2016–2019), and has concluded that no provision for federal income tax is required in the fund’s financial statements.
16
Short-Term Inflation-Protected Securities Index Fund
4. Distributions: Distributions to shareholders are recorded on the ex-dividend date. Distributions are determined on a tax basis and may differ from net investment income and realized capital gains for financial reporting purposes.
5. Credit Facility: The fund and certain other funds managed by The Vanguard Group (“Vanguard”) participate in a $4.3 billion committed credit facility provided by a syndicate of lenders pursuant to a credit agreement that may be renewed annually; each fund is individually liable for its borrowings, if any, under the credit facility. Borrowings may be utilized for temporary and emergency purposes, and are subject to the fund’s regulatory and contractual borrowing restrictions. The participating funds are charged administrative fees and an annual commitment fee of 0.10% of the undrawn amount of the facility; these fees are allocated to the funds based on a method approved by the fund’s board of trustees and included in Management and Administrative expenses on the fund’s Statement of Operations. Any borrowings under this facility bear interest at a rate based upon the higher of the one-month London Interbank Offered Rate, federal funds effective rate, or overnight bank funding rate plus an agreed-upon spread.
The fund had no borrowings outstanding at September 30, 2019, or at any time during the period then ended.
6. Other: Interest income includes income distributions received from Vanguard Market Liquidity Fund and is accrued daily. Premiums and discounts on debt securities purchased are amortized and accreted, respectively, to interest income over the lives of the respective securities. Inflation adjustments to the face amount of inflation-indexed securities are included in interest income. Security transactions are accounted for on the date securities are bought or sold. Costs used to determine realized gains (losses) on the sale of investment securities are those of the specific securities sold.
Each class of shares has equal rights as to assets and earnings, except that each class separately bears certain class-specific expenses related to maintenance of shareholder accounts (included in Management and Administrative expenses) and shareholder reporting. Marketing and distribution expenses are allocated to each class of shares based on a method approved by the board of trustees. Income, other non-class-specific expenses, and gains and losses on investments are allocated to each class of shares based on its relative net assets.
B. In accordance with the terms of a Funds’ Service Agreement (the “FSA”) between Vanguard and the fund, Vanguard furnishes to the fund investment advisory, corporate management, administrative, marketing, and distribution services at Vanguard’s cost of operations (as defined by the FSA). These costs of operations are allocated to the fund based on methods and guidelines approved by the board of trustees. Vanguard does not require reimbursement in the current period for certain costs of operations (such as deferred compensation/benefits and risk/insurance costs); the fund’s liability for these costs of operations is included in Payables to Vanguard on the Statement of Net Assets. All other costs of operations payable to Vanguard are generally settled twice a month.
Upon the request of Vanguard, the fund may invest up to 0.40% of its net assets as capital in Vanguard. At September 30, 2019, the fund had contributed to Vanguard capital in the amount of $1,460,000, representing less than 0.01% of the fund’s net assets and 0.58% of Vanguard’s capital received pursuant to the FSA. The fund’s trustees and officers are also directors and employees, respectively, of Vanguard.
17
Short-Term Inflation-Protected Securities Index Fund
C. Various inputs may be used to determine the value of the fund’s investments. These inputs are summarized in three broad levels for financial statement purposes. The inputs or methodologies used to value securities are not necessarily an indication of the risk associated with investing in those securities.
Level 1—Quoted prices in active markets for identical securities.
Level 2—Other significant observable inputs (including quoted prices for similar securities, interest rates, prepayment speeds, credit risk, etc.).
Level 3—Significant unobservable inputs (including the fund’s own assumptions used to determine the fair value of investments). Any investments valued with significant unobservable inputs are noted on the Statement of Net Assets.
The following table summarizes the market value of the fund’s investments as of September 30, 2019, based on the inputs used to value them:
| | Level 1 | | Level 2 | | Level 3 | |
Investments | | ($000 | ) | ($000 | ) | ($000 | ) |
U.S. Government and Agency Obligations | | — | | 31,156,227 | | — | |
Temporary Cash Investments | | 3,098 | | — | | — | |
Total | | 3,098 | | 31,156,227 | | — | |
D. Permanent differences between book-basis and tax-basis components of net assets are reclassified among capital accounts in the financial statements to reflect their tax character. These reclassifications have no effect on net assets or net asset value per share. As of period end, permanent differences primarily attributable to the accounting for in-kind redemptions and inflation adjustments were reclassified between the following accounts:
| | Amount | |
| | ($000 | ) |
Paid-in Capital | | (74,084 | ) |
Total Distributable Earnings (Loss) | | 74,084 | |
Temporary differences between book-basis and tax-basis components of total distributable earnings (loss) arise when certain items of income, gain, or loss are recognized in different periods for financial statement and tax purposes; these differences will reverse at some time in the future. The differences are primarily related to the tax deferral of losses on wash sales. As of period end, the tax-basis components of total distributable earnings (loss) are detailed in the table as follows:
| | Amount | |
| | ($000 | ) |
Undistributed Ordinary Income | | 111,371 | |
Undistributed Long-Term Gains | | — | |
Capital Loss Carryforwards (Non-expiring) | | (146,643 | ) |
Net Unrealized Gains (Losses) | | (11,240 | ) |
18
Short-Term Inflation-Protected Securities Index Fund
As of September 30, 2019, gross unrealized appreciation and depreciation for investments based on cost for U.S. federal income tax purposes were as follows:
| | Amount | |
| | ($000 | ) |
Tax Cost | | 31,170,565 | |
Gross Unrealized Appreciation | | 141,680 | |
Gross Unrealized Depreciation | | (152,920 | ) |
Net Unrealized Appreciation (Depreciation) | | (11,240 | ) |
E. During the year ended September 30, 2019, the fund purchased $11,338,499,000 of investment securities and sold $7,908,351,000 of investment securities, other than temporary cash investments. Purchases and sales include $1,672,111,000 and $695,828,000, respectively, in connection with in-kind purchases and redemptions of the fund’s capital shares.
F. Capital share transactions for each class of shares were:
| | Year Ended September 30, | |
| | 2019 | | 2018 | |
| | Amount | | Shares | | Amount | | Shares | |
| | ($000 | ) | (000) | | ($000 | ) | (000 | ) |
Investor Shares | | | | | | | | | |
Issued | | 691,395 | | 28,334 | | 938,053 | | 38,252 | |
Issued in Lieu of Cash Distributions | | 129,344 | | 5,315 | | 196,139 | | 8,067 | |
Redeemed1 | | (580,148 | ) | (23,840) | | (221,815 | ) | (9,082 | ) |
Net Increase (Decrease)—Investor Shares | | 240,591 | | 9,809 | | 912,377 | | 37,237 | |
ETF Shares | | | | | | | | | |
Issued | | 2,120,465 | | 43,511 | | 2,079,941 | | 42,425 | |
Issued in Lieu of Cash Distributions | | — | | — | | — | | — | |
Redeemed | | (770,093 | ) | (15,900) | | (398,275 | ) | (8,175 | ) |
Net Increase (Decrease)—ETF Shares | | 1,350,372 | | 27,611 | | 1,681,666 | | 34,250 | |
Admiral Shares | | | | | | | | | |
Issued1 | | 2,001,963 | | 82,149 | | 2,310,017 | | 94,161 | |
Issued in Lieu of Cash Distributions | | 125,948 | | 5,168 | | 170,230 | | 6,995 | |
Redeemed | | (1,418,673 | ) | (58,249) | | (907,090 | ) | (36,988 | ) |
Net Increase (Decrease)—Admiral Shares | | 709,238 | | 29,068 | | 1,573,157 | | 64,168 | |
Institutional Shares | | | | | | | | | |
Issued | | 2,596,338 | | 106,113 | | 1,960,417 | | 79,837 | |
Issued in Lieu of Cash Distributions | | 174,645 | | 7,159 | | 238,639 | | 9,799 | |
Redeemed | | (995,862 | ) | (40,784) | | (953,531 | ) | (38,884 | ) |
Net Increase (Decrease)—Institutional Shares | | 1,775,121 | | 72,488 | | 1,245,525 | | 50,752 | |
1 In November 2018, the fund announced changes to the availability and minimum investment criteria of the Investor and Admiral share classes. As a result, all of the outstanding Investor Shares automatically converted to Admiral Shares beginning in April 2019, with the exception of those held by Vanguard funds and certain other institutional investors. Investor Shares—Redeemed and Admiral Shares—Issued include $92,222,000 from the conversion during the year ended September 30, 2019.
19
Short-Term Inflation-Protected Securities Index Fund
At September 30, 2019, several Vanguard funds and trusts managed by Vanguard or its affiliates were each a record or beneficial owner of the fund, and had combined ownership of 53% of the fund’s net assets. If any of these shareholders were to redeem their investment in the fund, the redemption might result in an increase in the fund’s expense ratio, cause the fund to incur higher transaction costs, or lead to the realization of taxable capital gains.
G. Management has determined that no events or transactions occurred subsequent to September 30, 2019, that would require recognition or disclosure in these financial statements.
20
Report of Independent Registered Public Accounting Firm
To the Board of Trustees of Vanguard Malvern Funds and Shareholders of Vanguard Short-Term Inflation-Protected Securities Index Fund
Opinion on the Financial Statements
We have audited the accompanying statement of net assets of Vanguard Short-Term Inflation-Protected Securities Index Fund (one of the funds constituting Vanguard Malvern Funds, referred to hereafter as the “Fund”) as of September 30, 2019, the related statement of operations for the year ended September 30, 2019, the statement of changes in net assets for each of the two years in the period ended September 30, 2019, including the related notes, and the financial highlights for each of the five years in the period ended September 30, 2019 (collectively referred to as the “financial statements”). In our opinion, the financial statements present fairly, in all material respects, the financial position of the Fund as of September 30, 2019, the results of its operations for the year then ended, the changes in its net assets for each of the two years in the period ended September 30, 2019 and the financial highlights for each of the five years in the period ended September 30, 2019 in conformity with accounting principles generally accepted in the United States of America.
Basis for Opinion
These financial statements are the responsibility of the Fund’s management. Our responsibility is to express an opinion on the Fund’s financial statements based on our audits. We are a public accounting firm registered with the Public Company Accounting Oversight Board (United States) (“PCAOB”) and are required to be independent with respect to the Fund in accordance with the U.S. federal securities laws and the applicable rules and regulations of the Securities and Exchange Commission and the PCAOB.
We conducted our audits of these financial statements in accordance with the standards of the PCAOB. Those standards require that we plan and perform the audit to obtain reasonable assurance about whether the financial statements are free of material misstatement, whether due to error or fraud.
Our audits included performing procedures to assess the risks of material misstatement of the financial statements, whether due to error or fraud, and performing procedures that respond to those risks. Such procedures included examining, on a test basis, evidence regarding the amounts and disclosures in the financial statements. Our audits also included evaluating the accounting principles used and significant estimates made by management, as well as evaluating the overall presentation of the financial statements. Our procedures included confirmation of securities owned as of September 30, 2019 by correspondence with the custodian, transfer agent and brokers; when replies were not received from brokers, we performed other auditing procedures. We believe that our audits provide a reasonable basis for our opinion.
/s/PricewaterhouseCoopers LLP
Philadelphia, Pennsylvania
November 19, 2019
We have served as the auditor of one or more investment companies in The Vanguard Group of Funds since 1975.
21
Special 2019 tax information (unaudited) for Vanguard Short-Term Inflation-Protected Securities Index Fund
This information for the fiscal year ended September 30, 2019, is included pursuant to provisions of the Internal Revenue Code.
For nonresident alien shareholders, 100% of income dividends are interest-related dividends.
22
BLOOMBERG is a trademark and service mark of Bloomberg Finance L.P. BARCLAYS is a trademark and service mark of Barclays Bank Plc, used under license. Bloomberg Finance L.P. and its affiliates, including Bloomberg Index Services Limited (BISL) (collectively, Bloomberg), or Bloomberg’s licensors, own all proprietary rights in the Bloomberg Barclays U.S. Treasury Inflation-Protected Securities (Tips) 0–5 Year Index (Index or Bloomberg Barclays Index).
Neither Barclays Bank Plc, Barclays Capital Inc., or any affiliate (collectively Barclays) or Bloomberg is the issuer or producer of the Short-Term Inflation-Protected Securities Index Fund and neither Bloomberg nor Barclays has any responsibilities, obligations or duties to investors in the Short-Term Inflation-Protected Securities Index Fund. The Index is licensed for use by The Vanguard Group, Inc. (Vanguard) as the sponsor of the Short-Term Inflation-Protected Securities Index Fund. Bloomberg and Barclays’ only relationship with Vanguard in respect of the Index is the licensing of the Index, which is determined, composed and calculated by BISL, or any successor thereto, without regard to the Issuer or the Short-Term Inflation-Protected Securities Index Fund or the owners of the Short-Term Inflation-Protected Securities Index Fund.
Additionally, Vanguard may for itself execute transaction(s) with Barclays in or relating to the Index in connection with the Short-Term Inflation-Protected Securities Index Fund. Investors acquire the Short-Term Inflation-Protected Securities Index Fund from Vanguard and investors neither acquire any interest in the Index nor enter into any relationship of any kind whatsoever with Bloomberg or Barclays upon making an investment in the Short-Term Inflation-Protected Securities Index Fund. The Short-Term Inflation-Protected Securities Index Fund is not sponsored, endorsed, sold or promoted by Bloomberg or Barclays. Neither Bloomberg nor Barclays makes any representation or warranty, express or implied regarding the advisability of investing in the Short-Term Inflation-Protected Securities Index Fund or the advisability of investing in securities generally or the ability of the Index to track corresponding or relative market performance. Neither Bloomberg nor Barclays has passed on the legality or suitability of the Short-Term Inflation-Protected Securities Index Fund with respect to any person or entity. Neither Bloomberg nor Barclays is responsible for and has not participated in the determination of the timing of, prices at, or quantities of the Short-Term Inflation-Protected Securities Index Fund to be issued. Neither Bloomberg nor Barclays has any obligation to take the needs of the Issuer or the owners of the Short-Term Inflation-Protected Securities Index Fund or any other third party into consideration in determining, composing or calculating the Index. Neither Bloomberg nor Barclays has any obligation or liability in connection with administration, marketing or trading of the Short-Term Inflation-Protected Securities Index Fund.
23
The licensing agreement between Bloomberg and Barclays is solely for the benefit of Bloomberg and Barclays and not for the benefit of the owners of the Short-Term Inflation-Protected Securities Index Fund, investors or other third parties. In addition, the licensing agreement between Vanguard and Bloomberg is solely for the benefit of Vanguard and Bloomberg and not for the benefit of the owners of the Short-Term Inflation-Protected Securities Index Fund, investors or other third parties.
NEITHER BLOOMBERG NOR BARCLAYS SHALL HAVE ANY LIABILITY TO THE ISSUER, INVESTORS OR TO OTHER THIRD PARTIES FOR THE QUALITY, ACCURACY AND/OR COMPLETENESS OF THE BLOOMBERG BARCLAYS INDEX OR ANY DATA INCLUDED THEREIN OR FOR INTERRUPTIONS IN THE DELIVERY OF THE BLOOMBERG BARCLAYS INDEX. NEITHER BLOOMBERG NOR BARCLAYS MAKES ANY WARRANTY, EXPRESS OR IMPLIED, AS TO RESULTS TO BE OBTAINED BY THE ISSUER, THE INVESTORS OR ANY OTHER PERSON OR ENTITY FROM THE USE OF THE BLOOMBERG BARCLAYS INDEX OR ANY DATA INCLUDED THEREIN. NEITHER BLOOMBERG NOR BARCLAYS MAKES ANY EXPRESS OR IMPLIED WARRANTIES, AND EACH HEREBY EXPRESSLY DISCLAIMS ALL WARRANTIES OF MERCHANTABILITY OR FITNESS FOR A PARTICULAR PURPOSE OR USE WITH RESPECT TO THE BLOOMBERG BARCLAYS INDEX OR ANY DATA INCLUDED THEREIN. BLOOMBERG RESERVES THE RIGHT TO CHANGE THE METHODS OF CALCULATION OR PUBLICATION, OR TO CEASE THE CALCULATION OR PUBLICATION OF THE BLOOMBERG BARCLAYS INDEX, AND NEITHER BLOOMBERG NOR BARCLAYS SHALL BE LIABLE FOR ANY MISCALCULATION OF OR ANY INCORRECT, DELAYED OR INTERRUPTED PUBLICATION WITH RESPECT TO ANY OF THE BLOOMBERG BARCLAYS INDEX. NEITHER BLOOMBERG NOR BARCLAYS SHALL BE LIABLE FOR ANY DAMAGES, INCLUDING, WITHOUT LIMITATION, ANY SPECIAL, INDIRECT OR CONSEQUENTIAL DAMAGES, OR ANY LOST PROFITS AND EVEN IF ADVISED OF THE POSSIBILITY OF SUCH, RESULTING FROM THE USE OF THE BLOOMBERG BARCLAYS INDEX OR ANY DATA INCLUDED THEREIN OR WITH RESPECT TO THE SHORT-TERM INFLATION-PROTECTED SECURITIES INDEX FUND.
None of the information supplied by Bloomberg or Barclays and used in this publication may be reproduced in any manner without the prior written permission of both Bloomberg and Barclays Capital, the investment banking division of Barclays Bank Plc. Barclays Bank Plc is registered in England No. 1026167. Registered office 1 Churchill Place London E14 5HP.
© 2019 Bloomberg. Used with Permission.
Source: Bloomberg Index Services Limited. Copyright 2019, Bloomberg. All rights reserved.
24
This page intentionally left blank.
This page intentionally left blank.
The People Who Govern Your Fund
The trustees of your mutual fund are there to see that the fund is operated and managed in your best interests since, as a shareholder, you are a part owner of the fund. Your fund’s trustees also serve on the board of directors of The Vanguard Group, Inc., which is owned by the Vanguard funds and provides services to them.
A majority of Vanguard’s board members are independent, meaning that they have no affiliation with Vanguard or the funds they oversee, apart from the sizable personal investments they have made as private individuals. The independent board members have distinguished backgrounds in business, academia, and public service. Each of the trustees and executive officers oversees 212 Vanguard funds.
Information for each trustee and executive officer of the fund appears below. That information, as well as the Vanguard fund count, is as of the date on the cover of this fund report. The mailing address of the trustees and officers is P.O. Box 876, Valley Forge, PA 19482. More information about the trustees is in the Statement of Additional Information, which can be obtained, without charge, by contacting Vanguard at 800-662-7447, or online at vanguard.com.
Interested Trustee1
Mortimer J. Buckley
Born in 1969. Trustee since January 2018. Principal occupation(s) during the past five years and other experience: chairman of the board (January 2019–present) of Vanguard and of each of the investment companies served by Vanguard; chief executive officer (January 2018–present) of Vanguard; chief executive officer, president, and trustee (January 2018–present) of each of the investment companies served by Vanguard; president and director (2017–present) of Vanguard; and president (February 2018–present) of Vanguard Marketing Corporation. Chief investment officer (2013–2017), managing director (2002–2017), head of the Retail Investor Group (2006–2012), and chief information officer (2001–2006) of Vanguard. Chairman of the board (2011–2017) and trustee (2009–2017) of the Children’s Hospital of Philadelphia; trustee (2018–present) of The Shipley School.
Independent Trustees
Emerson U. Fullwood
Born in 1948. Trustee since January 2008. Principal occupation(s) during the past five years and other experience: executive chief staff and marketing officer for North America and corporate vice president (retired 2008) of Xerox Corporation (document management products and services). Former president of the Worldwide Channels Group, Latin America, and Worldwide Customer Service and executive chief staff officer of Developing Markets of Xerox. Executive in residence and 2009–2010 Distinguished Minett Professor at the Rochester Institute of Technology. Director of SPX FLOW, Inc. (multi-industry manufacturing). Director of the University of Rochester Medical Center, the Monroe Community College Foundation, the United Way of Rochester, North Carolina A&T University, and Roberts Wesleyan College. Trustee of the University of Rochester.
Amy Gutmann
Born in 1949. Trustee since June 2006. Principal occupation(s) during the past five years and other experience: president (2004–present) of the University of Pennsylvania. Christopher H. Browne Distinguished Professor of Political Science, School of Arts and Sciences, and professor of communication, Annenberg School for Communication, with secondary faculty appointments in the Department of Philosophy, School of Arts and Sciences, and at the Graduate School of Education, University of Pennsylvania. Trustee of the National Constitution Center.
F. Joseph Loughrey
Born in 1949. Trustee since October 2009. Principal occupation(s) during the past five years and other experience: president and chief operating officer (retired 2009) and vice chairman of the board (2008–2009) of Cummins Inc. (industrial machinery). Chairman of the board of Hillenbrand, Inc. (specialized consumer services), and the Lumina Foundation.
1 Mr. Buckley is considered an “interested person,” as defined in the Investment Company Act of 1940, because he is an officer of the Vanguard funds.
Director of the V Foundation and Oxfam America. Member of the advisory council for the College of Arts and Letters and chair of the advisory board to the Kellogg Institute for International Studies, both at the University of Notre Dame.
Mark Loughridge
Born in 1953. Trustee since March 2012. Principal occupation(s) during the past five years and other experience: senior vice president and chief financial officer (retired 2013) of IBM (information technology services). Fiduciary member of IBM’s Retirement Plan Committee (2004–2013), senior vice president and general manager (2002–2004) of IBM Global Financing, vice president and controller (1998–2002) of IBM, and a variety of other prior management roles at IBM. Member of the Council on Chicago Booth.
Scott C. Malpass
Born in 1962. Trustee since March 2012. Principal occupation(s) during the past five years and other experience: chief investment officer (1989–present) and vice president (1996–present) of the University of Notre Dame. Assistant professor of finance at the Mendoza College of Business, University of Notre Dame, and member of the Notre Dame 403(b) Investment Committee. Chairman of the board of TIFF Advisory Services, Inc. Member of the board of Catholic Investment Services, Inc. (investment advisors) and the board of superintendence of the Institute for the Works of Religion.
Deanna Mulligan
Born in 1963. Trustee since January 2018. Principal occupation(s) during the past five years and other experience: president (2010–present) and chief executive officer (2011–present) of The Guardian Life Insurance Company of America. Chief operating officer (2010–2011) and executive vice president (2008–2010) of Individual Life and Disability of The Guardian Life Insurance Company of America. Member of the board of The Guardian Life Insurance Company of America, the American Council of Life Insurers, the Partnership for New York City (business leadership), and the Committee Encouraging Corporate Philanthropy. Trustee of the Economic Club of New York and the Bruce Museum (arts and science). Member of the Advisory Council for the Stanford Graduate School of Business.
André F. Perold
Born in 1952. Trustee since December 2004. Principal occupation(s) during the past five years and other experience: George Gund Professor of Finance and Banking, Emeritus at the Harvard Business School (retired 2011). Chief investment officer and co-managing partner of HighVista Strategies LLC (private investment firm). Board of advisors and investment committee member of the Museum of Fine Arts Boston. Board member (2018–present) of RIT Capital Partners (investment firm); investment committee member of Partners Health Care System.
Sarah Bloom Raskin
Born in 1961. Trustee since January 2018. Principal occupation(s) during the past five years and other experience: deputy secretary (2014–2017) of the United States Department of the Treasury. Governor (2010–2014) of the Federal Reserve Board. Commissioner (2007–2010) of financial regulation for the State of Maryland. Member of the board of directors (2012–2014) of Neighborhood Reinvestment Corporation. Director (2017–present) of i(x) Investments, LLC; director (2017–present) of Reserve Trust. Rubinstein Fellow (2017–present) of Duke University; trustee (2017–present) of Amherst College.
Peter F. Volanakis
Born in 1955. Trustee since July 2009. Principal occupation(s) during the past five years and other experience: president and chief operating officer (retired 2010) of Corning Incorporated (communications equipment) and director of Corning Incorporated (2000–2010) and Dow Corning (2001–2010). Director (2012) of SPX Corporation (multi-industry manufacturing). Overseer of the Amos Tuck School of Business Administration, Dartmouth College (2001–2013). Chairman of the board of trustees of Colby-Sawyer College. Member of the board of Hypertherm Inc. (industrial cutting systems, software, and consumables).
Executive Officers
Glenn Booraem
Born in 1967. Principal occupation(s) during the past five years and other experience: principal of Vanguard. Investment stewardship officer (2017–present), treasurer (2015–2017), controller (2010–2015), and assistant controller (2001–2010) of each of the investment companies served by Vanguard.
Christine M. Buchanan
Born in 1970. Principal occupation(s) during the past five years and other experience: principal of Vanguard and global head of Fund Administration at Vanguard. Treasurer (2017–present) of each of the investment companies served by Vanguard. Partner (2005–2017) at KPMG LLP (audit, tax, and advisory services).
Thomas J. Higgins
Born in 1957. Principal occupation(s) during the past five years and other experience: principal of Vanguard. Chief financial officer (2008–present) and treasurer (1998–2008) of each of the investment companies served by Vanguard.
Peter Mahoney
Born in 1974. Principal occupation(s) during the past five years and other experience: principal of Vanguard. Controller (2015–present) of each of the investment companies served by Vanguard. Head of International Fund Services (2008–2014) at Vanguard.
Anne E. Robinson
Born in 1970. Principal occupation(s) during the past five years and other experience: general counsel (2016–present) of Vanguard. Secretary (2016–present) of Vanguard and of each of the investment companies served by Vanguard. Managing director (2016–present) of Vanguard. Director and senior vice president (2016–2018) of Vanguard Marketing Corporation. Managing director and general counsel of Global Cards and Consumer Services (2014–2016) at Citigroup. Counsel (2003–2014) at American Express.
Michael Rollings
Born in 1963. Principal occupation(s) during the past five years and other experience: finance director (2017–present) and treasurer (2017) of each of the investment companies served by Vanguard. Managing director (2016–present) of Vanguard. Chief financial officer (2016–present) of Vanguard. Director (2016–present) of Vanguard Marketing Corporation. Executive vice president and chief financial officer (2006–2016) of MassMutual Financial Group.
John E. Schadl
Born in 1972. Principal occupation(s) during the past five years and other experience: principal of Vanguard. Chief compliance officer (2019–present) of Vanguard and of each of the investment companies served by Vanguard. Assistant vice president (May 2019–present) of Vanguard Marketing Corporation.
Vanguard Senior Management Team |
| |
Joseph Brennan | Chris D. McIsaac |
Mortimer J. Buckley | James M. Norris |
Gregory Davis | Thomas M. Rampulla |
John James | Karin A. Risi |
Martha G. King | Anne E. Robinson |
John T. Marcante | Michael Rollings |
| 
P.O. Box 2600 Valley Forge, PA 19482-2600 |
Connect with Vanguard® > vanguard.com
Fund Information > 800-662-7447
Direct Investor Account Services > 800-662-2739
Institutional Investor Services > 800-523-1036
Text Telephone for People
Who Are Deaf or Hard of Hearing > 800-749-7273
This material may be used in conjunction with the offering of shares of any Vanguard fund only if preceded or accompanied by the fund’s current prospectus.
All comparative mutual fund data are from Morningstar, Inc., unless otherwise noted.
You can obtain a free copy of Vanguard’s proxy voting guidelines by visiting vanguard.com/proxyreporting or by calling Vanguard at 800-662-2739. The guidelines are also available from the SEC’s website, www.sec.gov. In addition, you may obtain a free report on how your fund voted the proxies for securities it owned during the 12 months ended June 30. To get the report, visit either vanguard.com/proxyreporting or www.sec.gov.
You can review information about your fund on the SEC’s website, and you can receive copies of this information, for a fee, by sending a request via email addressed to publicinfo@sec.gov.
| © 2019 The Vanguard Group, Inc. All rights reserved. U.S. Patent Nos. 6,879,964; 7,337,138; 7,720,749; 7,925,573; 8,090,646; 8,417,623; and 8,626,636. Vanguard Marketing Corporation, Distributor. Q19670 112019 |

Annual Report | September 30, 2019 Vanguard Core Bond Fund |
See the inside front cover for important information about access to your fund’s annual and semiannual shareholder reports. |
Important information about access to shareholder reports
Beginning on January 1, 2021, as permitted by regulations adopted by the Securities and Exchange Commission, paper copies of your fund’s annual and semiannual shareholder reports will no longer be sent to you by mail, unless you specifically request them. Instead, you will be notified by mail each time a report is posted on the website and will be provided with a link to access the report.
If you have already elected to receive shareholder reports electronically, you will not be affected by this change and do not need to take any action. You may elect to receive shareholder reports and other communications from the fund electronically by contacting your financial intermediary (such as a broker-dealer or bank) or, if you invest directly with the fund, by calling Vanguard at one of the phone numbers on the back cover of this report or by logging on to vanguard.com.
You may elect to receive paper copies of all future shareholder reports free of charge. If you invest through a financial intermediary, you can contact the intermediary to request that you continue to receive paper copies. If you invest directly with the fund, you can call Vanguard at one of the phone numbers on the back cover of this report or log on to vanguard.com. Your election to receive paper copies will apply to all the funds you hold through an intermediary or directly with Vanguard.
Contents | |
| |
| |
A Note From Our Chairman | 1 |
| |
Your Fund’s Performance at a Glance | 2 |
| |
Advisor’s Report | 3 |
| |
About Your Fund’s Expenses | 6 |
| |
Performance Summary | 8 |
| |
Financial Statements | 10 |
Please note: The opinions expressed in this report are just that—informed opinions. They should not be considered promises or advice. Also, please keep in mind that the information and opinions cover the period through the date on the front of this report. Of course, the risks of investing in your fund are spelled out in the prospectus.
A Note From Our Chairman

Tim Buckley
Chairman and Chief Executive Officer
Dear Shareholder,
Recent volatility in financial markets—affecting stocks, bonds, and commodities—has been a good reminder of the wise old adage, “Never keep all your eggs in one basket.” Maintaining balance and diversification in your investment portfolio can help to both limit risk and set you up for long-term success.
It’s understandable why some investors might become complacent after a long market run-up like the one that lifted stock prices, especially U.S. stock prices, in the years following the global financial crisis. But failing to rebalance regularly can leave a portfolio with a much different mix of assets than intended and, often, more risk than intended.
Balance across and diversification within asset classes are powerful tools for managing risk and achieving your investment goals. A portfolio’s allocation will determine a large portion of its long-term return and also the majority of its volatility risk. A well-diversified portfolio is less vulnerable to significant swings in the performance of any one segment of the asset classes in which it invests.
Balance and diversification will never eliminate the risk of loss, nor will they guarantee positive returns in a declining market. But they should reduce the chance that you’ll suffer disproportionate losses in one particular high-flying asset class or sector when it comes back to earth. And exposure to all key market components should give you at least some participation in the sectors that are performing best at any given time.
Vanguard is committed to helping you achieve balance and diversification in your portfolios to help meet your investment goals. We thank you for your continued loyalty.
Sincerely,

Mortimer J. Buckley
Chairman and Chief Executive Officer
October 14, 2019
1
Your Fund’s Performance at a Glance
· For the 12 months ended September 30, 2019, Vanguard Core Bond Fund returned 10.31% for Admiral Shares. It slightly trailed its benchmark, the Bloomberg Barclays U.S. Aggregate Float Adjusted Index, which returned 10.44%.
· Worries about the pace of global economic growth and central bank plans to loosen monetary policies virtually worldwide encouraged investment in bonds, sending their yields lower and their prices markedly higher during the fund’s fiscal year.
· The fund’s modest underperformance owed in large part to holdings in inflation-protected U.S. Treasuries, which lagged conventional Treasuries, and in General Electric, which sank amid a restructuring.
· The fund’s potential annual rate of income, measured by the 30-day SEC yield of its Admiral Shares, declined from 3.50% at the beginning of the period to 2.53% as of September 30, 2019.
· The fund regularly uses derivatives to limit portfolio risks. The fund’s derivatives positions, including both hedges and active positions, boosted performance slightly.
Market Barometer | | | | | | | |
| | Average Annual Total Returns | |
| | Periods Ended September 30, 2019 | |
| | One Year | | Three Years | | Five Years | |
Stocks | | | | | | | |
Russell 1000 Index (Large-caps) | | 3.87% | | 13.19% | | 10.62% | |
Russell 2000 Index (Small-caps) | | -8.89 | | 8.23 | | 8.19 | |
Russell 3000 Index (Broad U.S. market) | | 2.92 | | 12.83 | | 10.44 | |
FTSE All-World ex US Index (International) | | -1.12 | | 6.46 | | 3.24 | |
| | | | | | | |
Bonds | | | | | | | |
Bloomberg Barclays U.S. Aggregate Bond Index | | | | | | | |
(Broad taxable market) | | 10.30% | | 2.92% | | 3.38% | |
Bloomberg Barclays Municipal Bond Index | | | | | | | |
(Broad tax-exempt market) | | 8.55 | | 3.19 | | 3.66 | |
FTSE Three-Month U.S. Treasury Bill Index | | 2.36 | | 1.52 | | 0.95 | |
| | | | | | | |
CPI | | | | | | | |
Consumer Price Index | | 1.71% | | 2.07% | | 1.53% | |
2
Advisor’s Report
For the 12 months ended September 30, 2019, Vanguard Core Bond Fund returned 10.15% for Investor Shares and 10.31% for Admiral Shares. It slightly lagged its benchmark, the Bloomberg Barclays U.S. Aggregate Float Adjusted Index, which returned 10.44%.
As bond prices rose, yields fell. The 30-day SEC yield of the fund’s Investor Shares declined to 2.35% by the close of the period compared with 3.31% a year earlier. Admiral Shares’ ending yield was 2.53%, down from 3.50%. The 30-day SEC yield is a proxy for a fund’s potential annualized rate of income.
The investment environment
The markets were driven largely by shifts in the outlook for global growth and monetary policy. Toward the end of 2018, investors grew skittish at the prospect of reduced monetary policy accommodation by some major central banks, especially as the global economy seemed to be losing steam. In December, the U.S. Federal Reserve hiked its target for short-term interest rates for the fourth time that year, and the European Central Bank (ECB) brought its asset-purchase program to an end.
Other concerns on investors’ minds as 2018 drew to a close were flare-ups in ongoing trade disputes, signs of China’s economy slowing, and heightened geopolitical tensions in the Middle East. Greater risk aversion led to a sell-off in stocks and lower-quality bonds and a boost in demand for safer assets, including government bonds.
Further signs of a global slowdown and tepid inflation in 2019, however, led to a pivot in monetary policy from a tightening to a loosening bias across much of the world. In March, the Fed announced that it would end its balance sheet tapering; it went on to reduce interest rates in August and September. Those cuts, the first in more than a decade, were justified by policy-makers as “insurance” meant to cushion the effects of trade policies and prolong an economic expansion already in its tenth year.
In September, the ECB pushed its deposit rate further into negative territory and announced a new round of asset purchases. At the same time, it cut its projections for euro-zone growth and inflation for 2019 and 2020.
Yields of U.S. Treasury Securities | | |
| | |
| September 30, | September 30, |
Maturity | 2018 | 2019 |
2 years | 2.82% | 1.62% |
5 years | 2.95 | 1.54 |
10 years | 3.06 | 1.66 |
30 years | 3.21 | 2.11 |
Source: Vanguard. | | |
3
For emerging markets, dimmer prospects for global growth were a headwind, but the knock-on effect of more accommodative monetary policy in developed markets was supportive. In general, emerging markets benefited from looser financial conditions, a lower cost of borrowing in dollars, and an upturn in capital inflows.
Management of the fund
The fund benefited during fiscal 2019 from management of interest rate exposure, a modest overweight to investment-grade corporate bonds, and security selection in emerging markets.
Amid record or near-record low unemployment and solid if weakening U.S. economic growth, we favored credit sectors over U.S. Treasuries. We took no large stakes in individual credit sectors but sought relative performance advantages from a variety of strategies. Security selection in corporate bonds generally added value. We fared especially well with consumer cyclical issuers, including gaming and restaurant companies. We also maintained a greater-than-benchmark level of sensitivity to interest rates for much of the year, which helped the fund as rates declined.
In emerging markets, we were able to add value through a number of investment strategies focused primarily on defensive, short-term issues. While we don’t usually take significant directional bets on the market, we did going into 2019. The market had cheapened to the point where we went long on some higher-beta issuers with underlying stories that suggested they would benefit most from a rebound. This tactical move worked out well for the fund, though these bonds accounted for only modest portions of its assets.
For much of the period, however, we were more focused on finding relative value opportunities within and across markets. Brazil is one of the countries where we succeeded. We were over-weighted in U.S. dollar-denominated debt issued by Brazil for two main reasons. A number of structural reforms, including pension reform, were under way there, along with an easing in interest rates because of the sluggish economy and below-target inflation. This positioning paid off handsomely over the period. Small stakes in dollar-denominated Mexican and South African government debt also helped.
The fund’s modest underperformance owed in large part to poor performance in the fourth quarter of 2018, when several of the fund’s positions, including holdings in General Electric bonds and some mortgage-backed securities, came under stress. The fund was able to recoup almost all of the losses in 2019 through strong security selection allocations to emerging markets and a modest position in speculative-grade bonds.
4
Our allocation to U.S. Treasury Inflation-Protected Securities (TIPS) was also a drag on performance as they lagged conventional Treasuries during the yield rally.
Outlook
The investment environment is likely to be complicated.
We expect global growth to continue softening, in part because of further down drafts from trade tensions and policy uncertainty. The U.S. economy may slow to a below-trend pace of around 0.5%–1.5% in 2020 after adjusting for inflation, with a not-negligible risk of a recession.
China, the world’s second-largest economy, is set to grow at around 5.8% next year, but that figure could be markedly lower without further stimulus. Growth may also stay below trend in the euro area, at about 0.7%, given recent indications that manufacturing weakness is spilling over into supply chains and the services sector.
The weakest issuers will be the most sensitive and at risk of a further deceleration in global growth, making rigorous credit analysis and dynamic management key to performance in 2020. On the other hand, subdued inflation and accommodative central banks should provide some support to risky assets.
Accordingly, we enter the fund’s new fiscal year broadly neutral on credit, preferring to focus on security selection and cross-sector relative value opportunities. If more bouts of volatility occur as the global economy slows, our tactically defensive stance should allow us to take advantage of price dislocations as they arise.
Portfolio Managers:
Brian W. Quigley
Gemma Wright-Casparius, Principal
Daniel Shaykevich, Principal
Samuel C. Martinez, CFA
Vanguard Fixed Income Group
October 25, 2019
5
About Your Fund’s Expenses
As a shareholder of the fund, you incur ongoing costs, which include costs for portfolio management, administrative services, and shareholder reports (like this one), among others. Operating expenses, which are deducted from a fund’s gross income, directly reduce the investment return of the fund.
A fund’s expenses are expressed as a percentage of its average net assets. This figure is known as the expense ratio. The following examples are intended to help you understand the ongoing costs (in dollars) of investing in your fund and to compare these costs with those of other mutual funds. The examples are based on an investment of $1,000 made at the beginning of the period shown and held for the entire period.
The accompanying table illustrates your fund’s costs in two ways:
· Based on actual fund return. This section helps you to estimate the actual expenses that you paid over the period. The “Ending Account Value” shown is derived from the fund’s actual return, and the third column shows the dollar amount that would have been paid by an investor who started with $1,000 in the fund. You may use the information here, together with the amount you invested, to estimate the expenses that you paid over the period.
To do so, simply divide your account value by $1,000 (for example, an $8,600 account value divided by $1,000 = 8.6), then multiply the result by the number given for your fund under the heading “Expenses Paid During Period.”
· Based on hypothetical 5% yearly return. This section is intended to help you compare your fund’s costs with those of other mutual funds. It assumes that the fund had a yearly return of 5% before expenses, but that the expense ratio is unchanged. In this case—because the return used is not the fund’s actual return—the results do not apply to your investment. The example is useful in making comparisons because the Securities and Exchange Commission requires all mutual funds to calculate expenses based on a 5% return. You can assess your fund’s costs by comparing this hypothetical example with the hypothetical examples that appear in shareholder reports of other funds.
Note that the expenses shown in the table are meant to highlight and help you compare ongoing costs only and do not reflect transaction costs incurred by the fund for buying and selling securities. Further, the expenses do not include any purchase, redemption, or account service fees described in the fund prospectus. If such fees were applied to your account, your costs would be higher. Your fund does not carry a “sales load.”
The calculations assume no shares were bought or sold during the period. Your actual costs may have been higher or lower, depending on the amount of your investment and the timing of any purchases or redemptions.
You can find more information about the fund’s expenses, including annual expense ratios, in the Financial Statements section of this report. For additional information on operating expenses and other shareholder costs, please refer to your fund’s current prospectus.
6
Six Months Ended September 30, 2019 | | | |
| Beginning | Ending | Expenses |
| Account Value | Account Value | Paid During |
Core Bond Fund | 3/31/2019 | 9/30/2019 | Period |
Based on Actual Fund Return | | | |
Investor Shares | $1,000.00 | $1,054.21 | $1.29 |
Admiral™ Shares | 1,000.00 | 1,055.66 | 0.36 |
Based on Hypothetical 5% Yearly Return | | | |
Investor Shares | $1,000.00 | $1,023.82 | $1.27 |
Admiral Shares | 1,000.00 | 1,024.72 | 0.36 |
The calculations are based on expenses incurred in the most recent six-month period. The fund’s annualized six-month expense ratios for that period are 0.25% for Investor Shares and 0.07% for Admiral Shares. The dollar amounts shown as “Expenses Paid” are equal to the annualized expense ratio multiplied by the average account value over the period, multiplied by the number of days in the most recent six-month period, then divided by the number of days in the most recent 12-month period (183/365).
7
Core Bond Fund
Performance Summary
All of the returns in this report represent past performance, which is not a guarantee of future results that may be achieved by the fund. (Current performance may be lower or higher than the performance data cited. For performance data current to the most recent month-end, visit our website at vanguard.com/performance.) Note, too, that both investment returns and principal value can fluctuate widely, so an investor’s shares, when sold, could be worth more or less than their original cost. The returns shown do not reflect taxes that a shareholder would pay on fund distributions or on the sale of fund shares.
Cumulative Performance: March 28, 2016, Through September 30, 2019
Initial Investment of $10,000

| | Average Annual Total Returns | |
| | Periods Ended September 30, 2019 | |
| | | Since | Final Value |
| | One | Inception | of a $10,000 |
| | Year | (3/28/2016) | Investment |

| Core Bond Fund Investor Shares | 10.15% | 3.44% | $11,261 |

| Bloomberg Barclays U.S. Aggregate Float Adjusted Index | 10.44 | 3.48 | 11,275 |
“Since Inception” performance is calculated from the Investor Shares’ inception date for both the fund and its comparative standards.
| | Since | Final Value |
| One | Inception | of a $50,000 |
| Year | (3/28/2016) | Investment |
Core Bond Fund Admiral Shares | 10.31% | 3.57% | $56,555 |
Bloomberg Barclays U.S. Aggregate Float Adjusted Index | 10.44 | 3.48 | 56,373 |
“Since Inception” performance is calculated from the Admiral Shares’ inception date for both the fund and its comparative standards.
See Financial Highlights for dividend and capital gains information.
8
Core Bond Fund
Sector Diversification
As of September 30, 2019
Asset-Backed/Commercial Mortgage-Backed | 8.9% |
Finance | 8.0 |
Foreign | 9.9 |
Government Mortgage-Backed | 24.9 |
Industrial | 20.2 |
Treasury/Agency | 23.9 |
Utilities | 4.0 |
Other | 0.2 |
The table reflects the fund’s market exposure. Any holdings in short-term reserves are excluded. The agency and mortgage-backed securities sectors may include issues from government-sponsored enterprises; such issues are generally not backed by the full faith and credit of the U.S. government.
9
Core Bond Fund
Financial Statements
Statement of Net Assets
As of September 30, 2019
The fund files its complete schedule of portfolio holdings with the Securities and Exchange Commission (SEC) for the first and third quarters of each fiscal year as an exhibit to its reports on Form N-PORT. The fund’s Form N-PORT reports are available on the SEC’s website at www.sec.gov.
| | | | | | | Face | | Market | |
| | | | | Maturity | | Amount | | Value· | |
| | | Coupon | | Date | | ($000 | ) | ($000 | ) |
U.S. Government and Agency Obligations (48.2%) | |
U.S. Government Securities (21.4%) |
| United States Treasury Inflation Indexed Bonds | | 0.250% | | 7/15/29 | | 58,000 | | 58,794 | |
| United States Treasury Note/Bond | | 2.875% | | 10/31/20 | | 10,000 | | 10,112 | |
| United States Treasury Note/Bond | | 2.750% | | 11/30/20 | | 1,700 | | 1,718 | |
| United States Treasury Note/Bond | | 2.375% | | 3/15/21 | | 1,500 | | 1,513 | |
| United States Treasury Note/Bond | | 2.250% | | 4/30/21 | | 2,300 | | 2,318 | |
| United States Treasury Note/Bond | | 2.625% | | 6/15/21 | | 330 | | 335 | |
| United States Treasury Note/Bond | | 2.125% | | 8/15/21 | | 6,600 | | 6,653 | |
| United States Treasury Note/Bond | | 2.125% | | 9/30/21 | | 7,000 | | 7,063 | |
| United States Treasury Note/Bond | | 1.750% | | 7/15/22 | | 4,000 | | 4,016 | |
| United States Treasury Note/Bond | | 1.500% | | 8/15/22 | | 10,000 | | 9,978 | |
| United States Treasury Note/Bond | | 1.625% | | 8/31/22 | | 15,000 | | 15,016 | |
| United States Treasury Note/Bond | | 1.875% | | 9/30/22 | | 1,800 | | 1,816 | |
| United States Treasury Note/Bond | | 1.875% | | 10/31/22 | | 1,400 | | 1,412 | |
| United States Treasury Note/Bond | | 2.000% | | 11/30/22 | | 5,076 | | 5,141 | |
| United States Treasury Note/Bond | | 2.375% | | 1/31/23 | | 7,095 | | 7,276 | |
| United States Treasury Note/Bond | | 2.625% | | 2/28/23 | | 5,000 | | 5,173 | |
| United States Treasury Note/Bond | | 2.750% | | 4/30/23 | | 8,100 | | 8,429 | |
| United States Treasury Note/Bond | | 1.625% | | 10/31/23 | | 2,000 | | 2,005 | |
| United States Treasury Note/Bond | | 2.875% | | 11/30/23 | | 2,400 | | 2,526 | |
| United States Treasury Note/Bond | | 2.250% | | 12/31/23 | | 2,300 | | 2,364 | |
| United States Treasury Note/Bond | | 3.000% | | 10/31/25 | | 250 | | 270 | |
| United States Treasury Note/Bond | | 1.625% | | 2/15/26 | | 3 | | 3 | |
| United States Treasury Note/Bond | | 1.875% | | 7/31/26 | | 3,000 | | 3,050 | |
1 | United States Treasury Note/Bond | | 4.500% | | 2/15/36 | | 18,400 | | 25,381 | |
| United States Treasury Note/Bond | | 4.500% | | 5/15/38 | | 1,000 | | 1,410 | |
| United States Treasury Note/Bond | | 3.500% | | 2/15/39 | | 350 | | 439 | |
| United States Treasury Note/Bond | | 4.375% | | 11/15/39 | | 6,630 | | 9,305 | |
| United States Treasury Note/Bond | | 4.625% | | 2/15/40 | | 425 | | 616 | |
| United States Treasury Note/Bond | | 4.375% | | 5/15/40 | | 6,400 | | 9,007 | |
| United States Treasury Note/Bond | | 3.750% | | 8/15/41 | | 650 | | 848 | |
| United States Treasury Note/Bond | | 3.125% | | 11/15/41 | | 600 | | 716 | |
| United States Treasury Note/Bond | | 3.125% | | 2/15/42 | | 650 | | 776 | |
| United States Treasury Note/Bond | | 2.750% | | 8/15/42 | | 130 | | 146 | |
| United States Treasury Note/Bond | | 3.625% | | 8/15/43 | | 2,200 | | 2,840 | |
2 | United States Treasury Note/Bond | | 3.375% | | 5/15/44 | | 4,000 | | 4,987 | |
| United States Treasury Note/Bond | | 3.125% | | 8/15/44 | | 12,000 | | 14,391 | |
| United States Treasury Note/Bond | | 2.875% | | 8/15/45 | | 550 | | 634 | |
3 | United States Treasury Note/Bond | | 2.500% | | 2/15/46 | | 13,000 | | 14,007 | |
| United States Treasury Note/Bond | | 2.500% | | 5/15/46 | | 640 | | 690 | |
10
Core Bond Fund
| | | | | | | Face | | Market | |
| | | | | Maturity | | Amount | | Value· | |
| | | Coupon | | Date | | ($000 | ) | ($000 | ) |
| United States Treasury Note/Bond | | 3.000% | | 2/15/48 | | 6,000 | | 7,129 | |
| United States Treasury Note/Bond | | 3.125% | | 5/15/48 | | 5,500 | | 6,689 | |
| United States Treasury Note/Bond | | 3.375% | | 11/15/48 | | 5,000 | | 6,376 | |
| | | | | | | | | 263,368 | |
Agency Bonds and Notes (1.0%) | | | | | | | | | |
4 | AID-Israel | | 0.000% | | 11/1/24 | | 1,300 | | 1,181 | |
| Government Trust Certificate | | 0.000% | | 10/1/20 | | 1,479 | | 1,449 | |
| Private Export Funding Corp. | | 3.550% | | 1/15/24 | | 1,000 | | 1,074 | |
| Resolution Funding Corp. Interest Strip | | 0.000% | | 1/15/27 | | 1,965 | | 1,709 | |
| Resolution Funding Corp. Interest Strip | | 0.000% | | 10/15/27 | | 1,194 | | 1,021 | |
| Resolution Funding Corp. Interest Strip | | 0.000% | | 1/15/28 | | 800 | | 680 | |
| Resolution Funding Corp. Interest Strip | | 0.000% | | 4/15/28 | | 3,595 | | 3,032 | |
| Tennessee Valley Authority Principal Strip | | 0.000% | | 11/1/25 | | 3,000 | | 2,667 | |
| | | | | | | | | 12,813 | |
Conventional Mortgage-Backed Securities (23.2%) | | | | | | | |
5,6 | Fannie Mae Pool | | 2.500% | | 2/1/28–8/1/34 | | 5,515 | | 5,567 | |
5,6 | Fannie Mae Pool | | 3.000% | | 4/1/33–10/1/49 | | 19,185 | | 19,711 | |
5,6 | Fannie Mae Pool | | 3.500% | | 3/1/27–10/1/49 | | 37,528 | | 39,036 | |
5,6 | Fannie Mae Pool | | 4.500% | | 1/1/41–10/1/49 | | 34,558 | | 36,874 | |
5,6 | Fannie Mae Pool | | 5.000% | | 3/1/38–1/1/49 | | 4,842 | | 5,333 | |
5,6 | Fannie Mae Pool | | 6.000% | | 5/1/37 | | 589 | | 674 | |
5,6 | Freddie Mac Gold Pool | | 2.500% | | 10/1/31 | | 664 | | 672 | |
5,6 | Freddie Mac Gold Pool | | 3.000% | | 9/1/46–8/1/47 | | 4,419 | | 4,541 | |
5,6 | Freddie Mac Gold Pool | | 3.500% | | 3/1/45–5/1/49 | | 9,567 | | 10,016 | |
5,6 | Freddie Mac Gold Pool | | 4.000% | | 8/1/45–10/1/47 | | 6,632 | | 6,960 | |
5,6 | Freddie Mac Gold Pool | | 4.500% | | 7/1/47–2/1/49 | | 2,023 | | 2,155 | |
5 | Ginnie Mae I Pool | | 3.000% | | 4/15/45 | | 403 | | 414 | |
5 | Ginnie Mae I Pool | | 3.500% | | 6/15/47 | | 1,513 | | 1,599 | |
5 | Ginnie Mae I Pool | | 4.000% | | 7/15/45–8/15/45 | | 153 | | 161 | |
5 | Ginnie Mae I Pool | | 4.500% | | 2/15/39–9/15/46 | | 1,070 | | 1,170 | |
5 | Ginnie Mae I Pool | | 5.000% | | 3/15/38–2/15/40 | | 2,364 | | 2,602 | |
5,7 | Ginnie Mae II Pool | | 3.000% | | 5/20/43–11/1/49 | | 20,311 | | 20,830 | |
5,7 | Ginnie Mae II Pool | | 3.500% | | 4/20/43–10/1/49 | | 23,555 | | 24,512 | |
5,7 | Ginnie Mae II Pool | | 4.000% | | 11/20/42–10/1/49 | | 17,155 | | 17,885 | |
5 | Ginnie Mae II Pool | | 4.500% | | 11/20/44–4/20/49 | | 19,230 | | 20,203 | |
5 | Ginnie Mae II Pool | | 5.000% | | 8/20/48 | | 1,302 | | 1,383 | |
5 | Ginnie Mae II Pool | | 6.000% | | 5/20/48 | | 266 | | 302 | |
5 | UMBS Pool | | 2.500% | | 9/1/34 | | 2,380 | | 2,402 | |
5 | UMBS Pool | | 3.000% | | 9/1/34–9/1/49 | | 4,699 | | 4,804 | |
5 | UMBS Pool | | 3.500% | | 3/1/48–8/1/49 | | 6,481 | | 6,671 | |
5 | UMBS Pool | | 4.000% | | 2/1/49–8/1/49 | | 38,762 | | 40,338 | |
5 | UMBS Pool | | 4.500% | | 9/1/49 | | 5,282 | | 5,459 | |
5,7 | UMBS TBA | | 3.000% | | 9/1/49 | | 1,750 | | 1,778 | |
5,7 | UMBS TBA | | 4.000% | | 10/1/34–7/1/49 | | 1,500 | | 1,560 | |
| | | | | | | | | 285,612 | |
Nonconventional Mortgage-Backed Securities (2.6%) | | | | | | | |
5,6,8 | Fannie Mae REMICS 2005-95, 1M USD LIBOR + 0.410% | | 2.428% | | 11/25/35 | | 1 | | 1 | |
5,6,8 | Fannie Mae REMICS 2012-122, 1M USD LIBOR + 0.400% | | 2.418% | | 11/25/42 | | 2 | | 2 | |
5,6,8 | Fannie Mae REMICS 2013-19, 1M USD LIBOR + 0.300% | | 2.318% | | 9/25/41 | | 1 | | 1 | |
5,6,8 | Fannie Mae REMICS 2013-39, 1M USD LIBOR + 0.350% | | 2.368% | | 5/25/43 | | 2 | | 2 | |
11
Core Bond Fund
| | | | | | | Face | | Market | |
| | | | | Maturity | | Amount | | Value· | |
| | | Coupon | | Date | | ($000 | ) | ($000 | ) |
5,6,8 | Fannie Mae REMICS 2015-22, 1M USD LIBOR + 0.300% | | 2.318% | | 4/25/45 | | 2 | | 2 | |
5,6,8 | Fannie Mae REMICS 2016-55, 1M USD LIBOR + 0.500% | | 2.518% | | 8/25/46 | | 4 | | 4 | |
5,6 | Fannie Mae REMICS 2017-109 | | 3.500% | | 11/25/45 | | 690 | | 722 | |
5,6 | Fannie Mae REMICS 2017-60 | | 2.750% | | 8/25/47 | | 1,687 | | 1,703 | |
5,6 | Fannie Mae REMICS 2018-13 | | 3.000% | | 3/25/48 | | 3,247 | | 3,306 | |
5,6 | Fannie Mae REMICS 2018-15 | | 3.500% | | 10/25/44 | | 774 | | 807 | |
5,6 | Fannie Mae REMICS 2018-58 | | 3.000% | | 8/25/48 | | 3,247 | | 3,298 | |
5,6 | Fannie Mae REMICS 2018-64 | | 3.000% | | 9/25/48 | | 1,210 | | 1,229 | |
5,6 | Fannie Mae REMICS 2018-65 | | 3.000% | | 9/25/48 | | 2,467 | | 2,517 | |
5,6 | Fannie Mae REMICS 2018-66 | | 3.000% | | 5/25/47 | | 2,325 | | 2,357 | |
5,6 | Freddie Mac REMICS | | 3.000% | | 12/15/47 | | 1,236 | | 1,248 | |
5,6 | Freddie Mac REMICS 2017-91 | | 3.000% | | 11/25/47 | | 1,679 | | 1,697 | |
5 | Ginnie Mae REMICS | | 3.000% | | 12/20/47–7/20/48 | | 6,381 | | 6,524 | |
5 | Ginnie Mae REMICS | | 3.500% | | 7/20/48 | | 4,998 | | 5,195 | |
5,9 | Ginnie Mae REMICS | | 4.000% | | 1/20/45–10/20/47 | | 1,802 | | 682 | |
5,8,10 | Ginnie Mae REMICS, 6.150% - 1M USD LIBOR | | 4.106% | | 6/20/47 | | 4,182 | | 745 | |
| | | | | | | | | 32,042 | |
Total U.S. Government and Agency Obligations (Cost $573,792) | | | | 593,835 | |
Asset-Backed/Commercial Mortgage-Backed Securities (8.4%) | | |
5,11 | American Homes 4 Rent 2014-SFR3 | | 3.678% | | 12/17/36 | | 92 | | 96 | |
5 | AmeriCredit Automobile Receivables Trust 2016-2 | | 3.650% | | 5/9/22 | | 125 | | 127 | |
5 | AmeriCredit Automobile Receivables Trust 2016-3 | | 2.710% | | 9/8/22 | | 200 | | 201 | |
5 | AmeriCredit Automobile Receivables Trust 2018-2 | | 4.010% | | 7/18/24 | | 390 | | 405 | |
5 | AmeriCredit Automobile Receivables Trust 2019-1 | | 3.620% | | 3/18/25 | | 580 | | 599 | |
5,11 | Applebee’s Funding LLC / IHOP Funding LLC 2019-1 | | 4.194% | | 6/7/49 | | 50 | | 51 | |
5,11 | ARL Second LLC 2014-1A | | 2.920% | | 6/15/44 | | 45 | | 45 | |
5,11 | Aventura Mall Trust 2013-AVM | | 3.867% | | 12/5/32 | | 800 | | 817 | |
5,11 | Aventura Mall Trust 2018-AVM | | 4.249% | | 7/5/40 | | 700 | | 795 | |
5,11 | Avis Budget Rental Car Funding AESOP LLC 2015-2A | | 2.630% | | 12/20/21 | | 380 | | 381 | |
5,11 | Avis Budget Rental Car Funding AESOP LLC 2016-1A | | 2.990% | | 6/20/22 | | 500 | | 506 | |
5,11 | Avis Budget Rental Car Funding AESOP LLC 2017-1A | | 3.070% | | 9/20/23 | | 355 | | 362 | |
5,11 | Avis Budget Rental Car Funding AESOP LLC 2017-2A | | 2.970% | | 3/20/24 | | 100 | | 102 | |
5,11 | Avis Budget Rental Car Funding AESOP LLC 2018-1A | | 3.700% | | 9/20/24 | | 100 | | 105 | |
5,11 | Avis Budget Rental Car Funding AESOP LLC 2018-2A | | 4.000% | | 3/20/25 | | 200 | | 213 | |
5,11 | Avis Budget Rental Car Funding AESOP LLC 2019-1A | | 3.450% | | 3/20/23 | | 130 | | 134 | |
5 | Banc of America Commercial Mortgage Trust 2015-UBS7 | | 3.705% | | 9/15/48 | | 160 | | 172 | |
5 | BANK 2017 - BNK4 | | 3.625% | | 5/15/50 | | 19 | | 21 | |
12
Core Bond Fund
| | | | | | | Face | | Market | |
| | | | | Maturity | | Amount | | Value· | |
| | | Coupon | | Date | | ($000 | ) | ($000 | ) |
5 | BANK 2017 - BNK5 | | 3.390% | | 6/15/60 | | 25 | | 27 | |
5 | BANK 2017 - BNK6 | | 3.254% | | 7/15/60 | | 70 | | 74 | |
5 | BANK 2017 - BNK6 | | 3.518% | | 7/15/60 | | 80 | | 86 | |
5 | BANK 2017 - BNK6 | | 3.741% | | 7/15/60 | | 50 | | 54 | |
5 | BANK 2017 - BNK7 | | 3.435% | | 9/15/60 | | 100 | | 108 | |
5 | BANK 2017 - BNK8 | | 3.488% | | 11/15/50 | | 180 | | 194 | |
5 | BANK 2017 - BNK9 | | 3.538% | | 11/15/54 | | 260 | | 282 | |
5 | BANK 2018 - BN13 | | 4.217% | | 8/15/61 | | 70 | | 79 | |
5 | BANK 2018 - BN14 | | 4.185% | | 9/15/60 | | 25 | | 28 | |
5 | BANK 2018 - BN14 | | 4.231% | | 9/15/60 | | 15 | | 17 | |
5 | BENCHMARK 2018-B1 Mortgage Trust | | 3.666% | | 1/15/51 | | 40 | | 44 | |
5 | BENCHMARK 2018-B1 Mortgage Trust | | 3.878% | | 1/15/51 | | 70 | | 76 | |
5 | BENCHMARK 2018-B1 Mortgage Trust | | 4.059% | | 1/15/51 | | 220 | | 241 | |
5 | BENCHMARK 2018-B1 Mortgage Trust | | 4.255% | | 1/15/51 | | 350 | | 377 | |
5 | BENCHMARK 2018-B2 Mortgage Trust | | 3.882% | | 2/15/51 | | 125 | | 138 | |
5 | BENCHMARK 2018-B6 Mortgage Trust | | 4.170% | | 10/10/51 | | 69 | | 76 | |
5,11 | CAL Funding II Ltd. Series 2018-2A | | 4.340% | | 9/25/43 | | 252 | | 257 | |
5 | California Republic Auto Receivables Trust 2016-2 | | 2.520% | | 5/16/22 | | 210 | | 210 | |
5 | California Republic Auto Receivables Trust 2016-2 | | 3.510% | | 3/15/23 | | 210 | | 211 | |
5,11 | Canadian Pacer Auto Receivables Trust A Series 2017 | | 2.286% | | 1/19/22 | | 100 | | 100 | |
5,11 | Canadian Pacer Auto Receivables Trust A Series 2018 | | 3.220% | | 9/19/22 | | 140 | | 141 | |
5,11 | Canadian Pacer Auto Receivables Trust A Series 2018 | | 3.440% | | 8/21/23 | | 50 | | 51 | |
5 | Capital Auto Receivables Asset Trust 2016-2 | | 3.160% | | 11/20/23 | | 220 | | 221 | |
5 | Capital Auto Receivables Asset Trust 2016-3 | | 2.350% | | 9/20/21 | | 50 | | 50 | |
5 | Capital Auto Receivables Asset Trust 2016-3 | | 2.650% | | 1/20/24 | | 40 | | 40 | |
5 | CarMax Auto Owner Trust 2016-2 | | 2.160% | | 12/15/21 | | 100 | | 100 | |
5 | CarMax Auto Owner Trust 2016-2 | | 3.250% | | 11/15/22 | | 100 | | 100 | |
5 | CarMax Auto Owner Trust 2016-3 | | 1.900% | | 4/15/22 | | 200 | | 200 | |
5 | CarMax Auto Owner Trust 2016-3 | | 2.200% | | 6/15/22 | | 190 | | 190 | |
5 | CarMax Auto Owner Trust 2016-3 | | 2.940% | | 1/17/23 | | 190 | | 190 | |
5 | CarMax Auto Owner Trust 2017-4 | | 2.330% | | 5/15/23 | | 90 | | 91 | |
5 | CarMax Auto Owner Trust 2017-4 | | 2.460% | | 8/15/23 | | 40 | | 40 | |
5 | CarMax Auto Owner Trust 2017-4 | | 2.700% | | 10/16/23 | | 40 | | 40 | |
5 | CarMax Auto Owner Trust 2018-1 | | 2.640% | | 6/15/23 | | 50 | | 51 | |
5 | CarMax Auto Owner Trust 2018-1 | | 2.830% | | 9/15/23 | | 90 | | 91 | |
5 | CarMax Auto Owner Trust 2018-1 | | 2.950% | | 11/15/23 | | 50 | | 50 | |
5 | CarMax Auto Owner Trust 2018-2 | | 3.370% | | 10/16/23 | | 90 | | 93 | |
5 | CarMax Auto Owner Trust 2018-2 | | 3.570% | | 12/15/23 | | 130 | | 134 | |
5 | CarMax Auto Owner Trust 2018-2 | | 3.990% | | 4/15/25 | | 100 | | 103 | |
5 | CarMax Auto Owner Trust 2018-4 | | 3.480% | | 2/15/24 | | 110 | | 115 | |
5 | CarMax Auto Owner Trust 2018-4 | | 3.670% | | 5/15/24 | | 100 | | 104 | |
5 | CarMax Auto Owner Trust 2018-4 | | 3.850% | | 7/15/24 | | 70 | | 73 | |
5 | CarMax Auto Owner Trust 2018-4 | | 4.150% | | 4/15/25 | | 100 | | 105 | |
5 | CD 2016-CD1 Commercial Mortgage Trust | | 2.724% | | 8/10/49 | | 10 | | 10 | |
5 | CD 2016-CD1 Commercial Mortgage Trust | | 3.631% | | 8/10/49 | | 270 | | 278 | |
5 | CD 2017-CD4 Commercial Mortgage Trust | | 3.514% | | 5/10/50 | | 60 | | 65 | |
13
Core Bond Fund
| | | | | | | Face | | Market | |
| | | | | Maturity | | Amount | | Value· | |
| | | Coupon | | Date | | ($000 | ) | ($000 | ) |
5 | CD 2017-CD5 Commercial Mortgage Trust | | 3.431% | | 8/15/50 | | 85 | | 91 | |
5 | CD 2017-CD6 Commercial Mortgage Trust | | 3.456% | | 11/13/50 | | 19 | | 20 | |
5 | CFCRE Commercial Mortgage Trust 2016-C4 | | 3.283% | | 5/10/58 | | 61 | | 64 | |
5,11 | Chesapeake Funding II LLC 2018-1 | | 3.040% | | 4/15/30 | | 214 | | 216 | |
5,11 | Chrysler Capital Auto Receivables Trust 2016-AA | | 4.220% | | 2/15/23 | | 90 | | 91 | |
5 | Citigroup Commercial Mortgage Trust 2013-GC15 | | 4.371% | | 9/10/46 | | 30 | | 32 | |
5 | Citigroup Commercial Mortgage Trust 2014-GC19 | | 4.023% | | 3/10/47 | | 320 | | 343 | |
5 | Citigroup Commercial Mortgage Trust 2014-GC21 | | 3.575% | | 5/10/47 | | 177 | | 187 | |
5 | Citigroup Commercial Mortgage Trust 2014-GC23 | | 3.622% | | 7/10/47 | | 350 | | 373 | |
5 | Citigroup Commercial Mortgage Trust 2014-GC23 | | 4.175% | | 7/10/47 | | 230 | | 239 | |
5 | Citigroup Commercial Mortgage Trust 2014-GC25 | | 3.372% | | 10/10/47 | | 10 | | 11 | |
5 | Citigroup Commercial Mortgage Trust 2014-GC25 | | 3.635% | | 10/10/47 | | 360 | | 384 | |
5 | Citigroup Commercial Mortgage Trust 2014-GC25 | | 4.345% | | 10/10/47 | | 140 | | 149 | |
5 | Citigroup Commercial Mortgage Trust 2014-GC25 | | 4.677% | | 10/10/47 | | 175 | | 187 | |
5 | Citigroup Commercial Mortgage Trust 2015-GC27 | | 3.137% | | 2/10/48 | | 228 | | 238 | |
5 | Citigroup Commercial Mortgage Trust 2015-GC31 | | 3.762% | | 6/10/48 | | 110 | | 119 | |
5 | Citigroup Commercial Mortgage Trust 2015-GC33 | | 3.778% | | 9/10/58 | | 410 | | 444 | |
5 | Citigroup Commercial Mortgage Trust 2016-C1 | | 3.209% | | 5/10/49 | | 141 | | 148 | |
5 | Citigroup Commercial Mortgage Trust 2016-P4 | | 2.902% | | 7/10/49 | | 20 | | 21 | |
5 | Citigroup Commercial Mortgage Trust 2017-P8 | | 4.192% | | 9/15/50 | | 60 | | 65 | |
5 | Citigroup Commercial Mortgage Trust 2017-P8 | | 4.412% | | 9/15/50 | | 110 | | 117 | |
5 | Citigroup Commercial Mortgage Trust 2018-C5 | | 4.228% | | 6/10/51 | | 45 | | 51 | |
5 | Citigroup Commercial Mortgage Trust 2018-C6 | | 4.343% | | 11/10/51 | | 580 | | 652 | |
5,11 | COMM 2012-CCRE3 Mortgage Trust | | 3.416% | | 10/15/45 | | 40 | | 41 | |
5 | COMM 2012-CCRE4 Mortgage Trust | | 3.251% | | 10/15/45 | | 500 | | 506 | |
5 | COMM 2013-CCRE12 Mortgage Trust | | 3.765% | | 10/10/46 | | 60 | | 63 | |
5 | COMM 2013-CCRE12 Mortgage Trust | | 4.046% | | 10/10/46 | | 500 | | 533 | |
5 | COMM 2013-CCRE13 Mortgage Trust | | 4.194% | | 11/10/46 | | 230 | | 248 | |
5,11 | COMM 2013-CCRE6 Mortgage Trust | | 3.147% | | 3/10/46 | | 150 | | 153 | |
5,11 | COMM 2013-CCRE6 Mortgage Trust | | 3.397% | | 3/10/46 | | 210 | | 215 | |
5 | COMM 2013-CCRE8 Mortgage Trust | | 3.612% | | 6/10/46 | | 10 | | 11 | |
5,11 | COMM 2013-CCRE9 Mortgage Trust | | 4.397% | | 7/10/45 | | 230 | | 228 | |
5,11 | COMM 2014-277P Mortgage Trust | | 3.732% | | 8/10/49 | | 200 | | 213 | |
5 | COMM 2014-CCRE14 Mortgage Trust | | 4.236% | | 2/10/47 | | 30 | | 32 | |
5 | COMM 2014-CCRE15 Mortgage Trust | | 4.074% | | 2/10/47 | | 300 | | 323 | |
14
Core Bond Fund
| | | | | | | Face | | Market | |
| | | | | Maturity | | Amount | | Value· | |
| | | Coupon | | Date | | ($000 | ) | ($000 | ) |
5 | COMM 2014-CCRE17 Mortgage Trust | | 3.700% | | 5/10/47 | | 20 | | 21 | |
5 | COMM 2014-CCRE17 Mortgage Trust | | 3.977% | | 5/10/47 | | 350 | | 376 | |
5 | COMM 2014-CCRE17 Mortgage Trust | | 4.948% | | 5/10/47 | | 190 | | 201 | |
5 | COMM 2014-CCRE18 Mortgage Trust | | 3.550% | | 7/15/47 | | 30 | | 31 | |
5 | COMM 2014-CCRE20 Mortgage Trust | | 3.326% | | 11/10/47 | | 20 | | 21 | |
5 | COMM 2014-CCRE20 Mortgage Trust | | 3.590% | | 11/10/47 | | 350 | | 372 | |
5 | COMM 2014-CCRE21 Mortgage Trust | | 3.528% | | 12/10/47 | | 47 | | 50 | |
5 | COMM 2015-CCRE22 Mortgage Trust | | 3.309% | | 3/10/48 | | 228 | | 239 | |
5 | COMM 2015-CCRE25 Mortgage Trust | | 3.759% | | 8/10/48 | | 120 | | 129 | |
5 | COMM 2015-LC19 Mortgage Trust | | 3.183% | | 2/10/48 | | 124 | | 129 | |
5 | CSAIL 2015-C4 Commercial Mortgage Trust | | 3.808% | | 11/15/48 | | 358 | | 387 | |
5 | CSAIL 2016-C7 Commercial Mortgage Trust | | 3.502% | | 11/15/49 | | 130 | | 139 | |
5 | CSAIL 2018-CX12 Commercial Mortgage Trust | | 4.224% | | 8/15/51 | | 200 | | 226 | |
5 | CSAIL 2019-C15 Commercial Mortgage Trust | | 4.053% | | 3/15/52 | | 100 | | 112 | |
5 | DBJPM 16-C1 Mortgage Trust | | 3.502% | | 5/10/49 | | 140 | | 140 | |
5,8,11 | DELAM 2018-1, 1M USD LIBOR + 0.700% | | 2.757% | | 11/19/25 | | 660 | | 660 | |
5,11 | DLL Securitization Trust Series 2018-A3 | | 3.460% | | 1/20/22 | | 740 | | 749 | |
5,11 | DLL Securitization Trust Series 2018-A4 | | 3.590% | | 6/20/24 | | 180 | | 185 | |
5,11 | DLL Securitization Trust Series 2019-DA1 | | 2.920% | | 4/20/27 | | 260 | | 265 | |
5,11 | DRB Prime Student Loan Trust 2017-C | | 2.810% | | 11/25/42 | | 328 | | 333 | |
5,11 | Drive Auto Receivables Trust 2015-DA | | 4.590% | | 1/17/23 | | 93 | | 94 | |
5,11 | Drive Auto Receivables Trust 2016-BA | | 4.530% | | 8/15/23 | | 167 | | 169 | |
5,11 | Drive Auto Receivables Trust 2016-C | | 4.180% | | 3/15/24 | | 90 | | 91 | |
5 | Drive Auto Receivables Trust 2017-1 | | 3.840% | | 3/15/23 | | 50 | | 51 | |
5 | Drive Auto Receivables Trust 2018-2 | | 3.220% | | 4/15/22 | | 139 | | 139 | |
5 | Drive Auto Receivables Trust 2018-2 | | 3.630% | | 8/15/24 | | 560 | | 564 | |
5 | Drive Auto Receivables Trust 2018-2 | | 4.140% | | 8/15/24 | | 390 | | 400 | |
5 | Drive Auto Receivables Trust 2018-3 | | 3.370% | | 9/15/22 | | 449 | | 450 | |
5 | Drive Auto Receivables Trust 2018-3 | | 3.720% | | 9/16/24 | | 480 | | 485 | |
5 | Drive Auto Receivables Trust 2018-3 | | 4.300% | | 9/16/24 | | 260 | | 267 | |
5 | Drive Auto Receivables Trust 2018-5 | | 3.680% | | 7/15/23 | | 500 | | 507 | |
5 | Drive Auto Receivables Trust 2018-5 | | 3.990% | | 1/15/25 | | 480 | | 493 | |
5 | Drive Auto Receivables Trust 2018-5 | | 4.300% | | 4/15/26 | | 650 | | 675 | |
5,11 | EDvestinU Private Education Loan Trust (EDVES) 2019-A | | 3.580% | | 11/25/38 | | 95 | | 98 | |
5,11 | ELFI Graduate Loan Program 2018-A LLC | | 3.430% | | 8/25/42 | | 229 | | 237 | |
5,6,8 | Fannie Mae Connecticut Avenue Securities 2016-C04, 1M USD LIBOR + 1.450% | | 3.468% | | 1/25/29 | | 23 | | 24 | |
5,6,8,11 | Fannie Mae Connecticut Avenue Securities 2019-R03, 1M USD LIBOR + 0.750% | | 2.768% | | 9/25/31 | | 461 | | 461 | |
5,6,8,11 | Fannie Mae Connecticut Avenue Securities 2019-R04, 1M USD LIBOR + 0.750% | | 2.768% | | 6/25/39 | | 540 | | 541 | |
5,6 | Fannie Mae Grantor Trust 2017-T1 | | 2.898% | | 6/25/27 | | 20 | | 21 | |
5 | Ford Credit Auto Lease Trust 2018-A | | 3.170% | | 9/15/21 | | 220 | | 222 | |
5 | Ford Credit Auto Lease Trust 2019-A | | 3.250% | | 7/15/22 | | 600 | | 609 | |
5,11 | Ford Credit Auto Owner Trust 2017-1 | | 2.620% | | 8/15/28 | | 450 | | 456 | |
5,11 | Ford Credit Auto Owner Trust 2017-2 | | 2.360% | | 3/15/29 | | 650 | | 653 | |
5,11 | Ford Credit Auto Owner Trust 2017-2 | | 2.600% | | 3/15/29 | | 120 | | 121 | |
5,11 | Ford Credit Auto Owner Trust 2017-2 | | 2.750% | | 3/15/29 | | 250 | | 252 | |
5,11 | Ford Credit Auto Owner Trust 2018-2 | | 3.760% | | 1/15/30 | | 120 | | 125 | |
5,11 | Ford Credit Auto Owner Trust 2018-REV1 | | 3.190% | | 7/15/31 | | 250 | | 259 | |
5,11 | Ford Credit Auto Owner Trust 2018-REV1 | | 3.340% | | 7/15/31 | | 100 | | 103 | |
5,11 | Ford Credit Auto Owner Trust 2018-REV2 | | 3.470% | | 1/15/30 | | 430 | | 450 | |
5,11 | Ford Credit Auto Owner Trust 2018-REV2 | | 3.610% | | 1/15/30 | | 260 | | 269 | |
15
Core Bond Fund
| | | | | | | Face | | Market | |
| | | | | Maturity | | Amount | | Value· | |
| | | Coupon | | Date | | ($000 | ) | ($000 | ) |
5,11 | Ford Credit Auto Owner Trust 2019-1 | | 3.520% | | 7/15/30 | | 660 | | 697 | |
5 | Ford Credit Auto Owner Trust 2019-A | | 3.020% | | 10/15/24 | | 320 | | 329 | |
5 | Ford Credit Auto Owner Trust 2019-A | | 3.250% | | 9/15/25 | | 340 | | 349 | |
5 | Ford Credit Floorplan Master Owner Trust A Series 2019-2 | | 3.250% | | 4/15/26 | | 170 | | 176 | |
5,6,11 | Freddie Mac Structured Agency Credit Risk Debt Notes 2018-SPI1 | | 3.740% | | 2/25/48 | | 266 | | 267 | |
5,6,11 | Freddie Mac Structured Agency Credit Risk Debt Notes 2018-SPI2 | | 3.817% | | 5/25/48 | | 146 | | 147 | |
5,6,11 | Freddie Mac Structured Agency Credit Risk Debt Notes 2018-SPI3 | | 4.160% | | 8/25/48 | | 78 | | 79 | |
5,6,11 | Freddie Mac Structured Agency Credit Risk Debt Notes 2018-SPI4 | | 4.459% | | 11/25/48 | | 125 | | 126 | |
5,6,8,11 | Freddie Mac Structured Agency Credit Risk Debt Notes, 1M USD LIBOR + 0.700% | | 2.718% | | 4/25/49 | | 284 | | 284 | |
5,6,8,11 | Freddie Mac Structured Agency Credit Risk Debt Notes, 1M USD LIBOR + 0.800% | | 2.818% | | 3/25/49 | | 62 | | 62 | |
5,6,8 | Freddie Mac Structured Agency Credit Risk Debt Notes, 1M USD LIBOR + 2.000% | | 4.018% | | 12/25/28 | | 82 | | 82 | |
5 | GM Financial Automobile Leasing Trust 2017-3 | | 2.730% | | 9/20/21 | | 40 | | 40 | |
5,11 | GM Financial Consumer Automobile 2017-3 | | 2.330% | | 3/16/23 | | 40 | | 40 | |
5,11 | GMF Floorplan Owner Revolving Trust 2017-2 | | 2.440% | | 7/15/22 | | 260 | | 260 | |
5,11 | GMF Floorplan Owner Revolving Trust 2017-2 | | 2.630% | | 7/15/22 | | 140 | | 140 | |
5,11 | Golden Credit Card Trust 2018-4A | | 3.440% | | 10/15/25 | | 1,700 | | 1,788 | |
5,8,11 | Gosforth Funding 2018-1A plc, 3M USD LIBOR + 0.450% | | 2.582% | | 8/25/60 | | 228 | | 227 | |
5,11 | GreatAmerica Leasing Receivables Funding LLC Series 2018-1 | | 2.830% | | 6/17/24 | | 110 | | 111 | |
5 | GS Mortgage Securities Trust 2013-GCJ12 | | 3.135% | | 6/10/46 | | 350 | | 361 | |
5 | GS Mortgage Securities Trust 2013-GCJ14 | | 3.955% | | 8/10/46 | | 30 | | 32 | |
5 | GS Mortgage Securities Trust 2014-GC20 | | 3.998% | | 4/10/47 | | 300 | | 321 | |
5 | GS Mortgage Securities Trust 2014-GC24 | | 3.931% | | 9/10/47 | | 390 | | 419 | |
5 | GS Mortgage Securities Trust 2014-GC24 | | 4.646% | | 9/10/47 | | 170 | | 179 | |
5 | GS Mortgage Securities Trust 2014-GC24 | | 4.667% | | 9/10/47 | | 150 | | 140 | |
5 | GS Mortgage Securities Trust 2014-GC26 | | 3.364% | | 11/10/47 | | 150 | | 158 | |
5 | GS Mortgage Securities Trust 2014-GC26 | | 3.629% | | 11/10/47 | | 140 | | 149 | |
5 | GS Mortgage Securities Trust 2015-GC28 | | 3.136% | | 2/10/48 | | 30 | | 31 | |
5 | GS Mortgage Securities Trust 2015-GC28 | | 3.396% | | 2/10/48 | | 203 | | 214 | |
5 | GS Mortgage Securities Trust 2015-GC30 | | 3.382% | | 5/10/50 | | 113 | | 119 | |
5 | GS Mortgage Securities Trust 2015-GC34 | | 3.506% | | 10/10/48 | | 50 | | 53 | |
5 | GS Mortgage Securities Trust 2016-GS3 | | 2.850% | | 10/10/49 | | 60 | | 62 | |
11 | GTP Acquisition Partners I LLC | | 2.350% | | 6/15/20 | | 70 | | 70 | |
5,11 | Hardee’s Funding HNGRY 2018-1 | | 4.959% | | 6/20/48 | | 50 | | 51 | |
5,11 | Hardee’s Funding HNGRY 2018-1A | | 5.710% | | 6/20/48 | | 574 | | 606 | |
5,11 | Harley Marine Financing LLC Barge 2018-1 | | 5.682% | | 5/15/43 | | 181 | | 160 | |
5,11 | Hertz Fleet Lease Funding LP 2018-1 | | 3.230% | | 5/10/32 | | 645 | | 649 | |
5,11 | Hertz Vehicle Financing II LP 2016-2A | | 2.950% | | 3/25/22 | | 100 | | 101 | |
5,11 | Hilton USA Trust 2016-HHV | | 3.719% | | 11/5/38 | | 20 | | 22 | |
5,8,11 | Holmes Master Issuer plc 2018-1, 3M USD LIBOR + 0.360% | | 2.663% | | 10/15/54 | | 409 | | 408 | |
5,8,11 | Holmes Master Issuer plc 2018-2A, 3M USD LIBOR + 0.420% | | 2.723% | | 10/15/54 | | 375 | | 374 | |
5,11 | Houston Galleria Mall Trust 2015-HGLR | | 3.087% | | 3/5/37 | | 250 | | 259 | |
12 | Intu SGS Finance plc | | 4.250% | | 9/17/30 | | 100 | | 101 | |
16
Core Bond Fund
| | | | | | | Face | | Market | |
| | | | | Maturity | | Amount | | Value· | |
| | | Coupon | | Date | | ($000 | ) | ($000 | ) |
5,8,11 | Invitation Homes 2017-SFR2 Trust, 1M USD LIBOR + 0.850% | | 2.875% | | 12/17/36 | | 358 | | 356 | |
5,8,11 | Invitation Homes 2017-SFR2 Trust, 1M USD LIBOR + 1.150% | | 3.175% | | 12/17/36 | | 130 | | 130 | |
5,8,11 | Invitation Homes 2018-SFR1 Trust, 1M USD LIBOR + 0.700% | | 2.725% | | 3/17/37 | | 276 | | 272 | |
5,8,11 | Invitation Homes 2018-SFR1 Trust, 1M USD LIBOR + 0.950% | | 2.975% | | 3/17/37 | | 100 | | 99 | |
5,11 | JP Morgan Chase Commercial Mortgage Securities Trust 2011-C3 | | 4.717% | | 2/15/46 | | 1,481 | | 1,520 | |
5,11 | JP Morgan Chase Commercial Mortgage Securities Trust 2011-C5 | | 5.554% | | 8/15/46 | | 550 | | 577 | |
5,11 | JP Morgan Chase Commercial Mortgage Securities Trust 2011-RR1 | | 4.717% | | 3/16/46 | | 20 | | 21 | |
5,11 | JP Morgan Chase Commercial Mortgage Securities Trust 2012-C8 | | 3.424% | | 10/15/45 | | 90 | | 93 | |
5 | JP Morgan Chase Commercial Mortgage Securities Trust 2013-C13 | | 4.201% | | 1/15/46 | | 230 | | 241 | |
5 | JP Morgan Chase Commercial Mortgage Securities Trust 2013-C16 | | 3.881% | | 12/15/46 | | 10 | | 11 | |
5 | JP Morgan Chase Commercial Mortgage Securities Trust 2013-LC11 | | 2.960% | | 4/15/46 | | 80 | | 82 | |
5 | JP Morgan Chase Commercial Mortgage Securities Trust 2016-JP3 | | 2.870% | | 8/15/49 | | 50 | | 52 | |
5 | JP Morgan Chase Commercial Mortgage Securities Trust 2016-JP4 | | 3.648% | | 12/15/49 | | 90 | | 98 | |
5 | JP Morgan Chase Commercial Mortgage Securities Trust 2017-JP6 | | 3.490% | | 7/15/50 | | 30 | | 32 | |
5 | JPMBB Commercial Mortgage Securities Trust 2013-C12 | | 3.363% | | 7/15/45 | | 1,205 | | 1,251 | |
5 | JPMBB Commercial Mortgage Securities Trust 2013-C14 | | 4.133% | | 8/15/46 | | 30 | | 32 | |
5 | JPMBB Commercial Mortgage Securities Trust 2013-C15 | | 5.372% | | 11/15/45 | | 30 | | 33 | |
5 | JPMBB Commercial Mortgage Securities Trust 2014-C18 | | 4.079% | | 2/15/47 | | 330 | | 355 | |
5 | JPMBB Commercial Mortgage Securities Trust 2014-C19 | | 3.997% | | 4/15/47 | | 10 | | 11 | |
5 | JPMBB Commercial Mortgage Securities Trust 2014-C24 | | 3.639% | | 11/15/47 | | 144 | | 153 | |
5 | JPMBB Commercial Mortgage Securities Trust 2014-C26 | | 3.231% | | 1/15/48 | | 350 | | 364 | |
5 | JPMBB Commercial Mortgage Securities Trust 2014-C26 | | 3.494% | | 1/15/48 | | 350 | | 371 | |
5 | JPMBB Commercial Mortgage Securities Trust 2015-C27 | | 3.179% | | 2/15/48 | | 258 | | 269 | |
5 | JPMBB Commercial Mortgage Securities Trust 2015-C30 | | 3.822% | | 7/15/48 | | 80 | | 87 | |
5 | JPMBB Commercial Mortgage Securities Trust 2015-C31 | | 3.801% | | 8/15/48 | | 100 | | 108 | |
5 | JPMCC Commercial Mortgage Securities Trust 2017-JP5 | | 3.723% | | 3/15/50 | | 70 | | 76 | |
5 | JPMCC Commercial Mortgage Securities Trust 2017-JP7 | | 3.454% | | 9/15/50 | | 60 | | 64 | |
17
Core Bond Fund
| | | | | | | Face | | Market | |
| | | | | Maturity | | Amount | | Value· | |
| | | Coupon | | Date | | ($000 | ) | ($000 | ) |
5 | JPMDB Commercial Mortgage Securities Trust 2016-C4 | | 3.141% | | 12/15/49 | | 30 | | 32 | |
5 | JPMDB Commercial Mortgage Securities Trust 2017-C7 | | 3.409% | | 10/15/50 | | 60 | | 64 | |
5 | JPMDB Commercial Mortgage Securities Trust 2018-C8 | | 4.211% | | 6/15/51 | | 50 | | 57 | |
5,8,11 | Lanark Master Issuer plc 2018-1A, 3M USD LIBOR + 0.420% | | 2.570% | | 12/22/69 | | 122 | | 121 | |
5,8,11 | Lanark Master Issuer plc 2018-2A, 3M USD LIBOR + 0.420% | | 2.570% | | 12/22/69 | | 198 | | 198 | |
5,11 | Laurel Road Prime Student Loan Trust 2018-B | | 3.540% | | 5/26/43 | | 580 | | 604 | |
5,11 | MMAF Equipment Finance LLC 2018-A | | 3.390% | | 1/10/25 | | 120 | | 124 | |
5,11 | MMAF Equipment Finance LLC 2018-A | | 3.610% | | 3/10/42 | | 100 | | 105 | |
5 | Morgan Stanley Bank of America Merrill Lynch Trust 2012-C5 | | 3.792% | | 8/15/45 | | 100 | | 104 | |
5 | Morgan Stanley Bank of America Merrill Lynch Trust 2013-C10 | | 4.218% | | 7/15/46 | | 200 | | 205 | |
5 | Morgan Stanley Bank of America Merrill Lynch Trust 2013-C12 | | 4.259% | | 10/15/46 | | 400 | | 429 | |
5 | Morgan Stanley Bank of America Merrill Lynch Trust 2014-C15 | | 3.773% | | 4/15/47 | | 302 | | 320 | |
5 | Morgan Stanley Bank of America Merrill Lynch Trust 2014-C15 | | 4.051% | | 4/15/47 | | 10 | | 11 | |
5 | Morgan Stanley Bank of America Merrill Lynch Trust 2014-C15 | | 5.074% | | 4/15/47 | | 150 | | 163 | |
5 | Morgan Stanley Bank of America Merrill Lynch Trust 2014-C16 | | 3.892% | | 6/15/47 | | 20 | | 21 | |
5 | Morgan Stanley Bank of America Merrill Lynch Trust 2014-C16 | | 4.496% | | 6/15/47 | | 80 | | 86 | |
5 | Morgan Stanley Bank of America Merrill Lynch Trust 2014-C17 | | 3.741% | | 8/15/47 | | 350 | | 372 | |
5 | Morgan Stanley Bank of America Merrill Lynch Trust 2014-C18 | | 3.923% | | 10/15/47 | | 350 | | 376 | |
5 | Morgan Stanley Bank of America Merrill Lynch Trust 2014-C19 | | 3.526% | | 12/15/47 | | 390 | | 414 | |
5 | Morgan Stanley Bank of America Merrill Lynch Trust 2015-C20 | | 3.249% | | 2/15/48 | | 188 | | 196 | |
5 | Morgan Stanley Bank of America Merrill Lynch Trust 2015-C23 | | 3.719% | | 7/15/50 | | 100 | | 107 | |
5 | Morgan Stanley Bank of America Merrill Lynch Trust 2015-C24 | | 3.732% | | 5/15/48 | | 975 | | 1,048 | |
5 | Morgan Stanley Bank of America Merrill Lynch Trust 2015-C25 | | 3.635% | | 10/15/48 | | 180 | | 193 | |
5 | Morgan Stanley Bank of America Merrill Lynch Trust 2016-C29 | | 3.325% | | 5/15/49 | | 130 | | 137 | |
5 | Morgan Stanley Bank of America Merrill Lynch Trust 2016-C29 | | 4.908% | | 5/15/49 | | 160 | | 173 | |
5 | Morgan Stanley Bank of America Merrill Lynch Trust 2016-C32 | | 3.720% | | 12/15/49 | | 310 | | 337 | |
5 | Morgan Stanley Bank of America Merrill Lynch Trust 2017-C34 | | 3.536% | | 11/15/52 | | 90 | | 97 | |
5 | Morgan Stanley Capital I Trust 2015-UBS8 | | 3.809% | | 12/15/48 | | 499 | | 538 | |
5 | Morgan Stanley Capital I Trust 2016-BNK2 | | 3.049% | | 11/15/49 | | 50 | | 52 | |
5 | Morgan Stanley Capital I Trust 2016-UB11 | | 2.782% | | 8/15/49 | | 100 | | 102 | |
18
Core Bond Fund
| | | | | | | Face | | Market | |
| | | | | Maturity | | Amount | | Value· | |
| | | Coupon | | Date | | ($000 | ) | ($000 | ) |
5 | Morgan Stanley Capital I Trust 2016-UBS9 | | 3.594% | | 3/15/49 | | 150 | | 161 | |
5 | Morgan Stanley Capital I Trust 2017-HR2 | | 3.587% | | 12/15/50 | | 55 | | 59 | |
5 | Morgan Stanley Capital I Trust 2018-H4 | | 4.247% | | 12/15/51 | | 30 | | 33 | |
5,8,11 | Motor plc 2017-1A, 1M USD LIBOR + 0.530% | | 2.548% | | 9/25/24 | | 329 | | 329 | |
5,11 | MSBAM Commercial Mortgage Securities Trust 2012-CKSV | | 3.277% | | 10/15/30 | | 1,630 | | 1,649 | |
5,8,11 | Navient Student Loan Trust 2016-2, 1M USD LIBOR + 1.050% | | 3.068% | | 6/25/65 | | 131 | | 131 | |
5,8,11 | Navient Student Loan Trust 2016-3, 1M USD LIBOR + 0.850% | | 2.868% | | 6/25/65 | | 28 | | 28 | |
5,8,11 | Navient Student Loan Trust 2016-6A, 1M USD LIBOR + 0.750% | | 2.768% | | 3/25/66 | | 80 | | 81 | |
5,11 | Navient Student Loan Trust 2017-A | | 2.880% | | 12/16/58 | | 240 | | 243 | |
5,11 | Navient Student Loan Trust 2018-BA | | 3.610% | | 12/15/59 | | 430 | | 445 | |
5,11 | Navient Student Loan Trust 2018-BA | | 4.000% | | 12/15/59 | | 1,320 | | 1,411 | |
5,11 | Navient Student Loan Trust 2018-CA | | 3.520% | | 6/16/42 | | 550 | | 572 | |
5,11 | Navient Student Loan Trust 2018-DA | | 4.000% | | 12/15/59 | | 640 | | 665 | |
5 | Nissan Auto Receivables 2017-C Owner Trust | | 2.280% | | 2/15/24 | | 320 | | 322 | |
5,11 | Palisades Center Trust 2016-PLSD | | 2.713% | | 4/13/33 | | 700 | | 703 | |
5,8,11 | Pepper Residential Securities Trust 2017-A, 1M USD LIBOR + 1.100% | | 3.149% | | 3/10/58 | | 13 | | 13 | |
5,8,11 | Pepper Residential Securities Trust 2021-A1U, 1M USD LIBOR + 0.880% | | 2.908% | | 1/16/60 | | 511 | | 511 | |
5,8,11 | Pepper Residential Securities Trust 2022-A1U, 1M USD LIBOR + 0.350% | | 3.044% | | 6/20/60 | | 360 | | 361 | |
5,8,11 | Pepper Residential Securities Trust 2023-A1U, 1M USD LIBOR + 0.950% | | 2.991% | | 8/18/60 | | 327 | | 327 | |
5,8,11 | Permanent Master Issuer plc 2018-1A, 3M USD LIBOR + 0.380% | | 2.683% | | 7/15/58 | | 250 | | 251 | |
5,11 | PFS Financing Corp. 2017-B | | 2.220% | | 7/15/22 | | 340 | | 340 | |
5,8,11 | PFS Financing Corp. 2017-C, 1M USD LIBOR + 0.470% | | 2.498% | | 10/15/21 | | 410 | | 410 | |
5,11 | PFS Financing Corp. 2017-D | | 2.400% | | 10/17/22 | | 430 | | 431 | |
5,11 | PFS Financing Corp. 2018-D | | 3.190% | | 4/17/23 | | 250 | | 254 | |
5,8,11 | PHEAA Student Loan Trust 2016-2A, 1M USD LIBOR + 0.950% | | 2.968% | | 11/25/65 | | 145 | | 145 | |
5,11 | Progress Residential 2015-SFR3 Trust | | 3.067% | | 11/12/32 | | 410 | | 409 | |
5,11 | Progress Residential 2017-SFR2 Trust | | 2.897% | | 12/17/34 | | 200 | | 199 | |
5,11 | Progress Residential 2017-SFR2 Trust | | 3.196% | | 12/17/34 | | 100 | | 100 | |
5,11 | Progress Residential 2018-SFR1 Trust | | 3.255% | | 3/17/35 | | 390 | | 392 | |
5,11 | Progress Residential 2018-SFR1 Trust | | 3.484% | | 3/17/35 | | 100 | | 101 | |
5,11 | Progress Residential 2018-SFR3 Trust | | 3.880% | | 10/17/35 | | 580 | | 600 | |
5,8,11 | Resimac Premier Series 2018-1A, 1M USD LIBOR + 0.800% | | 2.849% | | 11/10/49 | | 412 | | 411 | |
5,8,11 | Resimac Premier Series 2018-1NCA, 1M USD LIBOR + 0.850% | | 2.917% | | 12/5/59 | | 590 | | 589 | |
5,8,11 | Resimac Premier Series 2018-2, 1M USD LIBOR + 0.850% | | 2.899% | | 4/10/50 | | 120 | | 120 | |
5 | Santander Drive Auto Receivables Trust 2016-2 | | 3.390% | | 4/15/22 | | 140 | | 141 | |
5 | Santander Drive Auto Receivables Trust 2017-3 | | 2.760% | | 12/15/22 | | 110 | | 110 | |
19
Core Bond Fund
| | | | | | | Face | | Market | |
| | | | | Maturity | | Amount | | Value· | |
| | | Coupon | | Date | | ($000 | ) | ($000 | ) |
5 | Santander Drive Auto Receivables Trust 2018-1 | | 2.960% | | 3/15/24 | | 310 | | 312 | |
5 | Santander Drive Auto Receivables Trust 2018-1 | | 3.320% | | 3/15/24 | | 140 | | 142 | |
5 | Santander Drive Auto Receivables Trust 2018-3 | | 3.290% | | 10/17/22 | | 460 | | 462 | |
5 | Santander Drive Auto Receivables Trust 2018-3 | | 4.070% | | 8/15/24 | | 760 | | 782 | |
5 | Santander Drive Auto Receivables Trust 2018-4 | | 3.980% | | 12/15/25 | | 470 | | 484 | |
5 | Santander Drive Auto Receivables Trust 2018-5 | | 4.190% | | 12/16/24 | | 540 | | 558 | |
5,11 | Santander Retail Auto Lease Trust 2018-A | | 3.490% | | 5/20/22 | | 325 | | 328 | |
5,11 | Securitized Term Auto Receivables Trust 2017-2A | | 2.289% | | 3/25/22 | | 180 | | 179 | |
5,11 | Securitized Term Auto Receivables Trust 2018-2A | | 3.544% | | 6/26/23 | | 130 | | 134 | |
5 | Small Business Administration Participation Certs 2018-20J | | 3.770% | | 10/1/38 | | 3,575 | | 3,899 | |
5 | Small Business Administration Participation Certs 2018-20K | | 3.870% | | 11/1/38 | | 2,553 | | 2,784 | |
5 | Small Business Administration Participation Certs 2018-20L | | 3.540% | | 12/1/38 | | 785 | | 843 | |
5 | Small Business Administration Participation Certs 2019-25E | | 3.070% | | 5/1/44 | | 1,330 | | 1,400 | |
5 | SMART ABS Series 2016-2US Trust | | 2.050% | | 12/14/22 | | 40 | | 40 | |
5,11 | SMB Private Education Loan Trust 2016-A | | 2.700% | | 5/15/31 | | 284 | | 288 | |
5,8,11 | SMB Private Education Loan Trust 2016-B, 1M USD LIBOR + 1.500% | | 3.477% | | 2/17/32 | | 185 | | 189 | |
5,8,11 | SMB Private Education Loan Trust 2016-C, 1M USD LIBOR + 1.100% | | 3.128% | | 9/15/34 | | 75 | | 75 | |
5,8,11 | SMB Private Education Loan Trust 2017-A, 1M USD LIBOR + 0.900% | | 2.927% | | 9/15/34 | | 99 | | 99 | |
5,11 | SMB Private Education Loan Trust 2017-B | | 2.820% | | 10/15/35 | | 252 | | 255 | |
5,11 | SMB Private Education Loan Trust 2018-B | | 3.600% | | 1/15/37 | | 450 | | 465 | |
5,11 | SMB Private Education Loan Trust 2018-C | | 3.630% | | 11/15/35 | | 570 | | 593 | |
5,11 | SoFi Professional Loan Program 2016-B LLC | | 2.740% | | 10/25/32 | | 279 | | 281 | |
5,11 | SoFi Professional Loan Program 2016-C LLC | | 2.360% | | 12/27/32 | | 429 | | 430 | |
5,11 | SoFi Professional Loan Program 2016-D LLC | | 2.340% | | 4/25/33 | | 78 | | 78 | |
5,8,11 | SoFi Professional Loan Program 2016-D LLC, 1M USD LIBOR + 0.950% | | 2.968% | | 1/25/39 | | 21 | | 22 | |
5,11 | SoFi Professional Loan Program 2017-B LLC | | 2.740% | | 5/25/40 | | 10 | | 10 | |
5,11 | SoFi Professional Loan Program 2017-D LLC | | 2.650% | | 9/25/40 | | 120 | | 121 | |
5,11 | SoFi Professional Loan Program 2017-E LLC | | 2.720% | | 11/26/40 | | 130 | | 132 | |
5,11 | SoFi Professional Loan Program 2017-F LLC | | 2.840% | | 1/25/41 | | 180 | | 182 | |
5,11 | SoFi Professional Loan Program 2018-A LLC | | 2.950% | | 2/25/42 | | 100 | | 102 | |
5,11 | SoFi Professional Loan Program 2018-C LLC | | 3.590% | | 1/25/48 | | 670 | | 698 | |
5,11 | SoFi Professional Loan Program 2018-D LLC | | 3.600% | | 2/25/48 | | 400 | | 421 | |
5,11 | Stack Infrastructure Issuer LLC 2019-1A | | 4.540% | | 2/25/44 | | 55 | | 57 | |
5 | Synchrony Credit Card Master Note Trust 2016-2 | | 2.950% | | 5/15/24 | | 140 | | 141 | |
5 | Synchrony Credit Card Master Note Trust 2017-2 | | 2.620% | | 10/15/25 | | 560 | | 570 | |
20
Core Bond Fund
| | | | | | | Face | | Market | |
| | | | | Maturity | | Amount | | Value· | |
| | | Coupon | | Date | | ($000 | ) | ($000 | ) |
5 | Synchrony Credit Card Master Note Trust 2017-2 | | 2.820% | | 10/15/25 | | 170 | | 173 | |
5 | Synchrony Credit Card Master Note Trust 2017-2 | | 3.010% | | 10/15/25 | | 230 | | 234 | |
5,11 | Taco Bell Funding LLC 2016-1A | | 4.377% | | 5/25/46 | | 35 | | 36 | |
5,11 | Taco Bell Funding LLC 2018-1 | | 4.940% | | 11/25/48 | | 387 | | 424 | |
5,11 | Tesla Auto Lease Trust 2018-A | | 2.320% | | 12/20/19 | | 13 | | 13 | |
5,11 | Tesla Auto Lease Trust 2018-B | | 3.710% | | 8/20/21 | | 1,583 | | 1,609 | |
5,11 | Tesla Auto Lease Trust 2018-B | | 4.120% | | 10/20/21 | | 320 | | 328 | |
5,11 | Tesla Auto Lease Trust 2018-B | | 4.360% | | 10/20/21 | | 200 | | 204 | |
5,11 | Textainer Marine Containers Limited 2019-A | | 3.960% | | 4/20/44 | | 271 | | 275 | |
5,11 | Tidewater Auto Receivables Trust 2018-AA | | 3.120% | | 7/15/22 | | 128 | | 128 | |
5,11 | Tidewater Auto Receivables Trust 2018-AA | | 3.450% | | 11/15/24 | | 100 | | 101 | |
5,11 | Tidewater Auto Receivables Trust 2018-AA | | 3.840% | | 11/15/24 | | 100 | | 102 | |
5,11 | Tidewater Auto Receivables Trust 2018-AA | | 4.300% | | 11/15/24 | | 100 | | 103 | |
5,11 | TMSQ 2014-1500 Mortgage Trust | | 3.680% | | 10/10/36 | | 100 | | 106 | |
5,11 | Trafigura Securitisation Finance plc 2017-1A | | 2.470% | | 12/15/20 | | 890 | | 885 | |
5,11 | Trafigura Securitisation Finance plc 2018-1A | | 3.730% | | 3/15/22 | | 620 | | 623 | |
5,11 | Trinity Rail Leasing LP 2018-1A | | 4.620% | | 6/17/48 | | 440 | | 477 | |
5,11 | Trip Rail Master Funding LLC 2017-1A | | 2.709% | | 8/15/47 | | 58 | | 58 | |
5,11 | Triton Container Finance LLC 2018-A2 | | 4.190% | | 6/22/43 | | 586 | | 595 | |
5 | UBS Commercial Mortgage Trust 2017-C7 | | 3.679% | | 12/15/50 | | 12 | | 13 | |
5 | UBS-Barclays Commercial Mortgage Trust 2013-C6 | | 3.469% | | 4/10/46 | | 10 | | 10 | |
5,11 | Vantage Data Centers LLC 2018-1A | | 4.072% | | 2/16/43 | | 118 | | 122 | |
5,11 | Verizon Owner Trust 2017-3 | | 2.380% | | 4/20/22 | | 240 | | 240 | |
5,11 | Verizon Owner Trust 2017-3 | | 2.530% | | 4/20/22 | | 250 | | 251 | |
5,11 | Verizon Owner Trust 2018-1 | | 3.050% | | 9/20/22 | | 350 | | 354 | |
5 | Verizon Owner Trust 2018-A | | 3.230% | | 4/20/23 | | 340 | | 347 | |
5 | Wells Fargo Commercial Mortgage Trust 2012- LC5 | | 3.539% | | 10/15/45 | | 40 | | 41 | |
5 | Wells Fargo Commercial Mortgage Trust 2013-LC12 | | 4.218% | | 7/15/46 | | 350 | | 374 | |
5 | Wells Fargo Commercial Mortgage Trust 2013-LC12 | | 4.420% | | 7/15/46 | | 450 | | 480 | |
5 | Wells Fargo Commercial Mortgage Trust 2014-LC18 | | 3.405% | | 12/15/47 | | 190 | | 200 | |
5 | Wells Fargo Commercial Mortgage Trust 2015-C26 | | 3.166% | | 2/15/48 | | 120 | | 125 | |
5 | Wells Fargo Commercial Mortgage Trust 2015-C27 | | 3.190% | | 2/15/48 | | 350 | | 364 | |
5 | Wells Fargo Commercial Mortgage Trust 2015-C27 | | 3.451% | | 2/15/48 | | 2,260 | | 2,392 | |
5 | Wells Fargo Commercial Mortgage Trust 2015-C29 | | 3.637% | | 6/15/48 | | 590 | | 632 | |
5 | Wells Fargo Commercial Mortgage Trust 2015-C30 | | 4.646% | | 9/15/58 | | 200 | | 212 | |
5 | Wells Fargo Commercial Mortgage Trust 2015-LC22 | | 3.839% | | 9/15/58 | | 170 | | 184 | |
5 | Wells Fargo Commercial Mortgage Trust 2015-LC22 | | 4.695% | | 9/15/58 | | 160 | | 170 | |
5 | Wells Fargo Commercial Mortgage Trust 2015-SG1 | | 3.789% | | 9/15/48 | | 90 | | 97 | |
21
Core Bond Fund
| | | | | | | Face | | Market | |
| | | | | Maturity | | Amount | | Value· | |
| | | Coupon | | Date | | ($000 | ) | ($000 | ) |
5 | Wells Fargo Commercial Mortgage Trust 2016-BNK1 | | 2.652% | | 8/15/49 | | 100 | | 102 | |
5 | Wells Fargo Commercial Mortgage Trust 2016-C32 | | 3.560% | | 1/15/59 | | 160 | | 171 | |
5 | Wells Fargo Commercial Mortgage Trust 2016-C37 | | 3.525% | | 12/15/49 | | 20 | | 21 | |
5 | Wells Fargo Commercial Mortgage Trust 2016-C37 | | 3.794% | | 12/15/49 | | 70 | | 76 | |
5 | Wells Fargo Commercial Mortgage Trust 2017-C38 | | 3.453% | | 7/15/50 | | 90 | | 97 | |
5 | Wells Fargo Commercial Mortgage Trust 2017-C39 | | 3.157% | | 9/15/50 | | 10 | | 11 | |
5 | Wells Fargo Commercial Mortgage Trust 2017-C40 | | 3.581% | | 10/15/50 | | 20 | | 22 | |
5 | Wells Fargo Commercial Mortgage Trust 2017-C41 | | 3.472% | | 11/15/50 | | 100 | | 107 | |
5 | Wells Fargo Commercial Mortgage Trust 2017-C42 | | 3.589% | | 12/15/50 | | 55 | | 60 | |
5 | Wells Fargo Commercial Mortgage Trust 2017-RC1 | | 3.631% | | 1/15/60 | | 42 | | 45 | |
5 | Wells Fargo Commercial Mortgage Trust 2018-C43 | | 4.514% | | 3/15/51 | | 50 | | 54 | |
5 | Wells Fargo Commercial Mortgage Trust 2018-C46 | | 4.152% | | 8/15/51 | | 30 | | 34 | |
5 | Wells Fargo Commercial Mortgage Trust 2018-C47 | | 4.365% | | 9/15/61 | | 250 | | 280 | |
5 | Wells Fargo Commercial Mortgage Trust 2018-C48 | | 4.245% | | 1/15/52 | | 50 | | 56 | |
5 | Wells Fargo Commercial Mortgage Trust 2019-C49 | | 3.933% | | 3/15/52 | | 80 | | 88 | |
5 | Wells Fargo Commercial Mortgage Trust 2019-C50 | | 3.635% | | 5/15/52 | | 70 | | 76 | |
5,11 | Wendys Funding LLC 2015-1A | | 4.497% | | 6/15/45 | | 48 | | 50 | |
5,11 | Wendys Funding LLC 2018-1 | | 3.573% | | 3/15/48 | | 98 | | 100 | |
5,11 | Wendys Funding LLC 2018-1 | | 3.884% | | 3/15/48 | | 138 | | 140 | |
5 | WFRBS Commercial Mortgage Trust 2013-C15 | | 4.153% | | 8/15/46 | | 100 | | 107 | |
5 | WFRBS Commercial Mortgage Trust 2013-C18 | | 4.162% | | 12/15/46 | | 20 | | 22 | |
5 | WFRBS Commercial Mortgage Trust 2014-C19 | | 3.829% | | 3/15/47 | | 170 | | 180 | |
5 | WFRBS Commercial Mortgage Trust 2014-C20 | | 3.995% | | 5/15/47 | | 20 | | 21 | |
5 | WFRBS Commercial Mortgage Trust 2014-C21 | | 3.410% | | 8/15/47 | | 10 | | 10 | |
5 | WFRBS Commercial Mortgage Trust 2014-C21 | | 3.678% | | 8/15/47 | | 360 | | 383 | |
5 | WFRBS Commercial Mortgage Trust 2014-C23 | | 3.650% | | 10/15/57 | | 243 | | 258 | |
5 | WFRBS Commercial Mortgage Trust 2014-C24 | | 3.607% | | 11/15/47 | | 380 | | 404 | |
5 | WFRBS Commercial Mortgage Trust 2014-LC14 | | 4.045% | | 3/15/47 | | 350 | | 375 | |
22
Core Bond Fund
| | | | | | | Face | | Market | |
| | | | | Maturity | | Amount | | Value· | |
| | | Coupon | | Date | | ($000 | ) | ($000 | ) |
5 | World Omni Auto Receivables Trust 2018-A | | 2.890% | | 4/15/25 | | 40 | | 41 | |
5 | World Omni Auto Receivables Trust 2019-B | | 2.860% | | 6/16/25 | | 110 | | 113 | |
5 | World Omni Automobile Lease Securitization Trust 2019-B | | 3.240% | | 7/15/24 | | 160 | | 162 | |
Total Asset-Backed/Commercial Mortgage-Backed Securities (Cost $99,623) | | 102,534 | |
Corporate Bonds (30.1%) | | | | | | | |
Finance (7.5%) | | | | | | | | | |
| Banking (5.5%) | | | | | | | | | |
| American Express Co. | | 2.500% | | 7/30/24 | | 3,000 | | 3,022 | |
5 | Bank of America Corp. | | 3.366% | | 1/23/26 | | 2,470 | | 2,576 | |
5 | Bank of America Corp. | | 3.824% | | 1/20/28 | | 1,500 | | 1,617 | |
5 | Bank of America Corp. | | 3.974% | | 2/7/30 | | 3,090 | | 3,388 | |
| Bank of Montreal | | 3.300% | | 2/5/24 | | 96 | | 100 | |
5 | Barclays plc | | 3.932% | | 5/7/25 | | 1,200 | | 1,239 | |
5,13 | BPCE SA | | 5.400% | | 10/27/25 | | 1,070 | | 744 | |
| Citigroup Inc. | | 3.200% | | 10/21/26 | | 1,000 | | 1,032 | |
5 | Citigroup Inc. | | 3.668% | | 7/24/28 | | 936 | | 991 | |
11 | Commonwealth Bank of Australia | | 3.610% | | 9/12/34 | | 2,600 | | 2,602 | |
11 | Commonwealth Bank of Australia | | 3.743% | | 9/12/39 | | 1,000 | | 997 | |
8,13 | Cooperatieve Rabobank UA, 3M Australian Bank Bill Rate + 2.500% | | 3.677% | | 7/2/25 | | 6,550 | | 4,471 | |
| Goldman Sachs Group Inc. | | 3.750% | | 5/22/25 | | 1,035 | | 1,095 | |
5 | Goldman Sachs Group Inc. | | 4.223% | | 5/1/29 | | 1,100 | | 1,199 | |
5 | HSBC Holdings plc | | 3.803% | | 3/11/25 | | 3,650 | | 3,801 | |
11 | Intesa Sanpaolo SPA | | 4.000% | | 9/23/29 | | 4,000 | | 3,992 | |
| JPMorgan Chase & Co. | | 2.295% | | 8/15/21 | | 1,780 | | 1,783 | |
5 | JPMorgan Chase & Co. | | 3.540% | | 5/1/28 | | 4,910 | | 5,179 | |
5 | JPMorgan Chase & Co. | | 3.509% | | 1/23/29 | | 122 | | 129 | |
5 | JPMorgan Chase & Co. | | 2.739% | | 10/15/30 | | 2,325 | | 2,308 | |
8,13 | Lloyds Banking Group plc, 3M Australian Bank Bill Rate + 1.400% | | 2.408% | | 3/7/25 | | 1,000 | | 660 | |
5 | Morgan Stanley | | 2.720% | | 7/22/25 | | 2,000 | | 2,018 | |
5 | Morgan Stanley | | 3.591% | | 7/22/28 | | 335 | | 353 | |
12 | NIBC Bank NV | | 3.125% | | 11/15/23 | | 400 | | 510 | |
| PNC Financial Services Group Inc. | | 3.450% | | 4/23/29 | | 1,685 | | 1,797 | |
5 | Royal Bank of Scotland Group plc | | 4.269% | | 3/22/25 | | 500 | | 523 | |
5,12 | Royal Bank of Scotland Group plc | | 2.875% | | 9/19/26 | | 355 | | 449 | |
| Santander Holdings USA Inc. | | 3.500% | | 6/7/24 | | 2,000 | | 2,051 | |
12 | Santander UK plc | | 3.875% | | 10/15/29 | | 180 | | 263 | |
| Sumitomo Mitsui Financial Group Inc. | | 3.040% | | 7/16/29 | | 1,500 | | 1,530 | |
| SunTrust Bank | | 2.800% | | 5/17/22 | | 2,900 | | 2,952 | |
| Svenska Handelsbanken AB | | 3.900% | | 11/20/23 | | 3,000 | | 3,206 | |
14 | Unione di Banche Italiane SPA | | 1.500% | | 4/10/24 | | 800 | | 898 | |
| Wells Fargo & Co. | | 4.150% | | 1/24/29 | | 1,550 | | 1,715 | |
8,13 | Wells Fargo & Co., 3M Australian Bank Bill Rate + 1.100% | | 2.128% | | 4/27/22 | | 1,500 | | 1,019 | |
| Westpac Banking Corp. | | 3.300% | | 2/26/24 | | 4,320 | | 4,519 | |
| Westpac Banking Corp. | | 4.110% | | 7/24/34 | | 675 | | 701 | |
23
Core Bond Fund
| | | | | | | Face | | Market | |
| | | | | Maturity | | Amount | | Value· | |
| | | Coupon | | Date | | ($000 | ) | ($000 | ) |
| Brokerage (0.2%) | | | | | | | | | |
| BlackRock Inc. | | 3.250% | | 4/30/29 | | 2,250 | | 2,402 | |
| | | | | | | | | | |
| Insurance (0.7%) | | | | | | | | | |
14 | Berkshire Hathaway Inc. | | 1.125% | | 3/16/27 | | 400 | | 463 | |
12 | BUPA Finance plc | | 5.000% | | 12/8/26 | | 300 | | 417 | |
| Enstar Group Ltd. | | 4.950% | | 6/1/29 | | 1,430 | | 1,517 | |
| Principal Financial Group Inc. | | 3.700% | | 5/15/29 | | 655 | | 706 | |
5,12 | Society of Lloyd’s | | 4.875% | | 2/7/47 | | 300 | | 403 | |
| UnitedHealth Group Inc. | | 3.500% | | 8/15/39 | | 4,500 | | 4,668 | |
| | | | | | | | | | |
| Other Finance (0.1%) | | | | | | | | | |
12 | Aroundtown SA | | 3.250% | | 7/18/27 | | 400 | | 507 | |
14 | Aroundtown SA | | 1.625% | | 1/31/28 | | 200 | | 225 | |
14 | Samhallsbyggnadsbolaget i Norden AB | | 1.750% | | 1/14/25 | | 600 | | 678 | |
| | | | | | | | | | |
| Real Estate Investment Trusts (1.0%) | | | | | | | | | |
| Alexandria Real Estate Equities Inc. | | 4.000% | | 2/1/50 | | 550 | | 596 | |
| Camden Property Trust | | 3.350% | | 11/1/49 | | 1,070 | | 1,077 | |
| ERP Operating LP | | 2.500% | | 2/15/30 | | 2,470 | | 2,429 | |
| HCP Inc. | | 3.250% | | 7/15/26 | | 1,195 | | 1,228 | |
| HCP Inc. | | 3.500% | | 7/15/29 | | 2,790 | | 2,895 | |
| Mid-America Apartments LP | | 3.950% | | 3/15/29 | | 1,500 | | 1,633 | |
| Omega Healthcare Investors Inc. | | 3.625% | | 10/1/29 | | 1,250 | | 1,244 | |
| Sabra Health Care LP | | 3.900% | | 10/15/29 | | 1,500 | | 1,484 | |
| | | | | | | | | 92,001 | |
Industrial (18.9%) | | | | | | | | | |
| Basic Industry (1.0%) | | | | | | | | | |
| Celulosa Arauco y Constitucion SA | | 5.500% | | 11/2/47 | | 225 | | 251 | |
11 | Dow Chemical Co. | | 3.625% | | 5/15/26 | | 450 | | 469 | |
| Dow Chemical Co. | | 4.375% | | 11/15/42 | | 300 | | 310 | |
| DuPont de Nemours Inc. | | 4.725% | | 11/15/28 | | 300 | | 342 | |
| DuPont de Nemours Inc. | | 5.319% | | 11/15/38 | | 200 | | 243 | |
| Eastman Chemical Co. | | 4.500% | | 12/1/28 | | 100 | | 110 | |
| Eastman Chemical Co. | | 4.650% | | 10/15/44 | | 50 | | 54 | |
| FMC Corp. | | 3.200% | | 10/1/26 | | 350 | | 353 | |
| FMC Corp. | | 4.500% | | 10/1/49 | | 135 | | 140 | |
| Newmont Goldcorp Corp. | | 2.800% | | 10/1/29 | | 2,085 | | 2,060 | |
| Nutrien Ltd. | | 4.125% | | 3/15/35 | | 180 | | 187 | |
14 | Praxair Inc. | | 1.200% | | 2/12/24 | | 1,100 | | 1,261 | |
| Sherwin-Williams Co. | | 2.950% | | 8/15/29 | | 600 | | 601 | |
11 | Suzano Austria GmbH | | 7.000% | | 3/16/47 | | 1,000 | | 1,145 | |
| Vale Overseas Ltd. | | 6.250% | | 8/10/26 | | 359 | | 415 | |
14 | Vale SA | | 3.750% | | 1/10/23 | | 1,300 | | 1,533 | |
| WRKCo Inc. | | 4.650% | | 3/15/26 | | 2,800 | | 3,072 | |
| | | | | | | | | | |
| Capital Goods (2.1%) | | | | | | | | | |
14 | Airbus Finance BV | | 2.375% | | 4/2/24 | | 1,000 | | 1,204 | |
14 | Airbus Finance BV | | 1.375% | | 5/13/31 | | 160 | | 192 | |
| Ball Corp. | | 4.875% | | 3/15/26 | | 65 | | 70 | |
11 | Berry Global Inc. | | 4.500% | | 2/15/26 | | 110 | | 108 | |
11 | Berry Global Inc. | | 4.875% | | 7/15/26 | | 90 | | 93 | |
| Boeing Co. | | 2.600% | | 10/30/25 | | 500 | | 507 | |
| Boeing Co. | | 2.250% | | 6/15/26 | | 1,250 | | 1,240 | |
24
Core Bond Fund
| | | | | | | Face | | Market | |
| | | | | Maturity | | Amount | | Value· | |
| | | Coupon | | Date | | ($000 | ) | ($000 | ) |
| Boeing Co. | | 2.700% | | 2/1/27 | | 3,000 | | 3,064 | |
| Boeing Co. | | 2.800% | | 3/1/27 | | 500 | | 511 | |
| Boeing Co. | | 3.200% | | 3/1/29 | | 300 | | 315 | |
11 | CFX Escrow Corp. | | 6.375% | | 2/15/26 | | 100 | | 107 | |
11 | Clean Harbors Inc. | | 4.875% | | 7/15/27 | | 95 | | 99 | |
11 | Clean Harbors Inc. | | 5.125% | | 7/15/29 | | 95 | | 101 | |
| Embraer SA | | 5.150% | | 6/15/22 | | 1,400 | | 1,483 | |
| Lockheed Martin Corp. | | 3.800% | | 3/1/45 | | 3,360 | | 3,731 | |
11 | Mueller Water Products Inc. | | 5.500% | | 6/15/26 | | 320 | | 334 | |
| Parker-Hannifin Corp. | | 2.700% | | 6/14/24 | | 3,375 | | 3,438 | |
| Precision Castparts Corp. | | 2.500% | | 1/15/23 | | 6,545 | | 6,658 | |
11 | Resideo Funding Inc. | | 6.125% | | 11/1/26 | | 171 | | 182 | |
11 | Reynolds Group Issuer Inc. / Reynolds Group Issuer LLC / Reynolds Group Issuer Lu | | 5.125% | | 7/15/23 | | 15 | | 15 | |
8,11 | Reynolds Group Issuer Inc. / Reynolds Group Issuer LLC / Reynolds Group Issuer Lu, 3M USD LIBOR + 3.500% | | 5.803% | | 7/15/21 | | 250 | | 250 | |
| TransDigm Inc. | | 6.500% | | 7/15/24 | | 65 | | 67 | |
11 | TransDigm Inc. | | 6.250% | | 3/15/26 | | 300 | | 322 | |
| TransDigm Inc. | | 7.500% | | 3/15/27 | | 70 | | 76 | |
11 | Trivium Packaging Finance BV | | 5.500% | | 8/15/26 | | 35 | | 37 | |
11 | Trivium Packaging Finance BV | | 8.500% | | 8/15/27 | | 35 | | 38 | |
| United Rentals North America Inc. | | 4.625% | | 10/15/25 | | 125 | | 128 | |
| United Rentals North America Inc. | | 6.500% | | 12/15/26 | | 215 | | 234 | |
| United Technologies Corp. | | 4.625% | | 11/16/48 | | 1,000 | | 1,251 | |
| | | | | | | | | | |
| Communication (2.7%) | | | | | | | | | |
| AT&T Inc. | | 3.400% | | 5/15/25 | | 3,000 | | 3,133 | |
| AT&T Inc. | | 4.500% | | 3/9/48 | | 350 | | 375 | |
11 | CCO Holdings LLC / CCO Holdings Capital Corp. | | 4.750% | | 3/1/30 | | 75 | | 76 | |
| Charter Communications Operating LLC / Charter Communications Operating Capital | | 5.125% | | 7/1/49 | | 2,264 | | 2,412 | |
| Comcast Corp. | | 3.375% | | 8/15/25 | | 5,875 | | 6,204 | |
| Comcast Corp. | | 4.150% | | 10/15/28 | | 1,735 | | 1,940 | |
11 | Connect Finco SARL / Connect US Finco LLC | | 6.750% | | 10/1/26 | | 70 | | 71 | |
| Crown Castle International Corp. | | 3.700% | | 6/15/26 | | 4,000 | | 4,217 | |
11 | CSC Holdings LLC | | 5.375% | | 2/1/28 | | 200 | | 211 | |
11 | CSC Holdings LLC | | 5.750% | | 1/15/30 | | 280 | | 293 | |
11 | Diamond Sports Group LLC / Diamond Sports Finance Co. | | 6.625% | | 8/15/27 | | 105 | | 109 | |
| Discovery Communications LLC | | 5.300% | | 5/15/49 | | 1,770 | | 1,952 | |
11 | Fox Corp. | | 5.576% | | 1/25/49 | | 975 | | 1,228 | |
11 | Level 3 Financing Inc. | | 4.625% | | 9/15/27 | | 230 | | 232 | |
| Netflix Inc. | | 4.375% | | 11/15/26 | | 120 | | 121 | |
11 | Nexstar Escrow Inc. | | 5.625% | | 7/15/27 | | 35 | | 37 | |
11 | Sirius XM Radio Inc. | �� | 4.625% | | 7/15/24 | | 65 | | 67 | |
11 | Sirius XM Radio Inc. | | 5.000% | | 8/1/27 | | 70 | | 72 | |
| Sprint Corp. | | 7.125% | | 6/15/24 | | 60 | | 65 | |
| Sprint Corp. | | 7.625% | | 2/15/25 | | 60 | | 66 | |
| T-Mobile USA Inc. | | 4.500% | | 2/1/26 | | 150 | | 154 | |
| T-Mobile USA Inc. | | 4.750% | | 2/1/28 | | 75 | | 78 | |
| Telefonica Emisiones SAU | | 4.895% | | 3/6/48 | | 1,900 | | 2,119 | |
13 | Verizon Communications Inc. | | 4.050% | | 2/17/25 | | 1,250 | | 933 | |
25
Core Bond Fund
| | | | | | | Face | | Market | |
| | | | | Maturity | | Amount | | Value· | |
| | | Coupon | | Date | | ($000 | ) | ($000 | ) |
| Verizon Communications Inc. | | 4.125% | | 3/16/27 | | 2,375 | | 2,617 | |
| Verizon Communications Inc. | | 4.016% | | 12/3/29 | | 2,000 | | 2,224 | |
14 | Verizon Communications Inc. | | 2.875% | | 1/15/38 | | 100 | | 135 | |
| Verizon Communications Inc. | | 4.522% | | 9/15/48 | | 1,500 | | 1,773 | |
| | | | | | | | | | |
| Consumer Cyclical (2.1%) | | | | | | | | | |
11 | 1011778 BC ULC / New Red Finance Inc. | | 5.000% | | 10/15/25 | | 140 | | 144 | |
11 | 1011778 BC ULC / New Red Finance Inc. | | 3.875% | | 1/15/28 | | 175 | | 176 | |
11 | Alimentation Couche-Tard Inc. | | 4.500% | | 7/26/47 | | 815 | | 886 | |
11 | Allison Transmission Inc. | | 4.750% | | 10/1/27 | | 175 | | 180 | |
11 | Churchill Downs Inc. | | 5.500% | | 4/1/27 | | 100 | | 106 | |
11 | Churchill Downs Inc. | | 4.750% | | 1/15/28 | | 130 | | 133 | |
11 | Eagle Intermediate Global Holding BV / Ruyi US Finance LLC | | 7.500% | | 5/1/25 | | 350 | | 314 | |
| General Motors Co. | | 4.875% | | 10/2/23 | | 6,000 | | 6,422 | |
| General Motors Co. | | 5.200% | | 4/1/45 | | 400 | | 393 | |
| General Motors Financial Co. Inc. | | 4.200% | | 3/1/21 | | 300 | | 306 | |
| General Motors Financial Co. Inc. | | 4.375% | | 9/25/21 | | 510 | | 527 | |
| General Motors Financial Co. Inc. | | 3.500% | | 11/7/24 | | 1,242 | | 1,256 | |
| General Motors Financial Co. Inc. | | 5.250% | | 3/1/26 | | 400 | | 432 | |
| Hilton Domestic Operating Co. Inc. | | 5.125% | | 5/1/26 | | 104 | | 109 | |
| Home Depot Inc. | | 2.950% | | 6/15/29 | | 1,300 | | 1,358 | |
| Lennar Corp. | | 5.250% | | 6/1/26 | | 100 | | 108 | |
11 | Live Nation Entertainment Inc. | | 5.625% | | 3/15/26 | | 70 | | 75 | |
| Lowe’s Cos. Inc. | | 3.100% | | 5/3/27 | | 2,180 | | 2,245 | |
| Mastercard Inc. | | 3.650% | | 6/1/49 | | 1,800 | | 2,026 | |
| McDonald’s Corp. | | 2.625% | | 9/1/29 | | 2,500 | | 2,491 | |
| MGM Growth Properties Operating Partnership LP / MGP Finance Co-Issuer Inc. | | 4.500% | | 9/1/26 | | 170 | | 180 | |
12 | Motability Operations Group plc | | 3.625% | | 3/10/36 | | 240 | | 367 | |
11 | Panther BF Aggregator 2 LP / Panther Finance Co. Inc. | | 8.500% | | 5/15/27 | | 185 | | 187 | |
11 | Performance Food Group Inc. | | 5.500% | | 6/1/24 | | 275 | | 282 | |
11 | Performance Food Group Inc. | | 5.500% | | 10/15/27 | | 150 | | 158 | |
| PulteGroup Inc. | | 5.500% | | 3/1/26 | | 125 | | 137 | |
14 | Richemont International Holding SA | | 1.000% | | 3/26/26 | | 1,000 | | 1,147 | |
| Toll Brothers Finance Corp. | | 3.800% | | 11/1/29 | | 40 | | 39 | |
11 | Volkswagen Group of America Finance LLC | | 2.700% | | 9/26/22 | | 4,000 | | 4,018 | |
11 | Yum Brands Inc. | | 4.750% | | 1/15/30 | | 40 | | 41 | |
| | | | | | | | | | |
| Consumer Noncyclical (4.2%) | | | | | | | | | |
| AbbVie Inc. | | 3.600% | | 5/14/25 | | 3,550 | | 3,688 | |
| AbbVie Inc. | | 4.875% | | 11/14/48 | | 1,745 | | 1,918 | |
| Allina Health System | | 3.887% | | 4/15/49 | | 1,000 | | 1,133 | |
| Altria Group Inc. | | 4.400% | | 2/14/26 | | 2,570 | | 2,747 | |
| Altria Group Inc. | | 4.800% | | 2/14/29 | | 2,595 | | 2,838 | |
| Altria Group Inc. | | 5.375% | | 1/31/44 | | 325 | | 360 | |
| Altria Group Inc. | | 5.950% | | 2/14/49 | | 135 | | 158 | |
| Anheuser-Busch Cos. LLC / Anheuser-Busch InBev Worldwide Inc. | | 4.700% | | 2/1/36 | | 500 | | 578 | |
| Anheuser-Busch InBev Worldwide Inc. | | 4.750% | | 1/23/29 | | 2,000 | | 2,323 | |
| Anheuser-Busch InBev Worldwide Inc. | | 3.750% | | 7/15/42 | | 900 | | 922 | |
| Anheuser-Busch InBev Worldwide Inc. | | 4.600% | | 4/15/48 | | 1,445 | | 1,668 | |
11 | Aramark Services Inc. | | 5.000% | | 2/1/28 | | 60 | | 62 | |
26
Core Bond Fund
| | | | | | | Face | | Market | |
| | | | | Maturity | | Amount | | Value· | |
| | | Coupon | | Date | | ($000 | ) | ($000 | ) |
11 | Bausch Health Americas Inc. | | 9.250% | | 4/1/26 | | 30 | | 34 | |
11 | Bausch Health Cos. Inc. | | 5.750% | | 8/15/27 | | 65 | | 70 | |
11 | Bausch Health Cos. Inc. | | 7.000% | | 1/15/28 | | 100 | | 108 | |
11 | Bristol-Myers Squibb Co. | | 3.200% | | 6/15/26 | | 3,675 | | 3,847 | |
11 | Bristol-Myers Squibb Co. | | 3.400% | | 7/26/29 | | 1,500 | | 1,603 | |
| Celgene Corp. | | 4.550% | | 2/20/48 | | 875 | | 1,048 | |
| Cigna Corp. | | 4.800% | | 8/15/38 | | 890 | | 1,003 | |
| CommonSpirit Health | | 2.760% | | 10/1/24 | | 615 | | 621 | |
| Constellation Brands Inc. | | 3.150% | | 8/1/29 | | 750 | | 765 | |
| CVS Health Corp. | | 3.000% | | 8/15/26 | | 2,000 | | 2,007 | |
| CVS Health Corp. | | 4.300% | | 3/25/28 | | 2,502 | | 2,704 | |
| CVS Health Corp. | | 3.250% | | 8/15/29 | | 1,000 | | 1,005 | |
| CVS Health Corp. | | 5.050% | | 3/25/48 | | 935 | | 1,061 | |
| DaVita Inc. | | 5.125% | | 7/15/24 | | 150 | | 152 | |
| DaVita Inc. | | 5.000% | | 5/1/25 | | 35 | | 35 | |
| Encompass Health Corp. | | 4.500% | | 2/1/28 | | 70 | | 71 | |
| Encompass Health Corp. | | 4.750% | | 2/1/30 | | 70 | | 71 | |
| HCA Inc. | | 5.250% | | 6/15/26 | | 505 | | 562 | |
| HCA Inc. | | 5.375% | | 9/1/26 | | 200 | | 220 | |
| HCA Inc. | | 4.125% | | 6/15/29 | | 1,635 | | 1,717 | |
| HCA Inc. | | 5.250% | | 6/15/49 | | 975 | | 1,070 | |
11 | Hill-Rom Holdings Inc. | | 4.375% | | 9/15/27 | | 75 | | 77 | |
11 | Hologic Inc. | | 4.375% | | 10/15/25 | | 110 | | 113 | |
| Kaiser Foundation Hospitals | | 3.150% | | 5/1/27 | | 7,750 | | 8,163 | |
11 | Kraft Heinz Foods Co. | | 3.750% | | 4/1/30 | | 225 | | 226 | |
| Kroger Co. | | 3.700% | | 8/1/27 | | 600 | | 633 | |
11 | Lamb Weston Holdings Inc. | | 4.875% | | 11/1/26 | | 70 | | 73 | |
14 | Medtronic Global Holdings SCA | | 1.500% | | 7/2/39 | | 200 | | 232 | |
14 | Mylan NV | | 3.125% | | 11/22/28 | | 250 | | 308 | |
| Pfizer Inc. | | 3.600% | | 9/15/28 | | 1,760 | | 1,926 | |
11 | Post Holdings Inc. | | 5.500% | | 12/15/29 | | 70 | | 73 | |
11 | Tenet Healthcare Corp. | | 4.625% | | 9/1/24 | | 15 | | 15 | |
11 | Tenet Healthcare Corp. | | 4.875% | | 1/1/26 | | 100 | | 103 | |
11 | Tenet Healthcare Corp. | | 5.125% | | 11/1/27 | | 35 | | 36 | |
14 | Thermo Fisher Scientific Inc. | | 0.875% | | 10/1/31 | | 400 | | 440 | |
| Unilever Capital Corp. | | 2.600% | | 5/5/24 | | 1,000 | | 1,027 | |
| | | | | | | | | | |
| Energy (3.0%) | | | | | | | | | |
| BP Capital Markets America Inc. | | 3.796% | | 9/21/25 | | 2,000 | | 2,161 | |
| BP Capital Markets plc | | 3.279% | | 9/19/27 | | 635 | | 668 | |
| Cheniere Corpus Christi Holdings LLC | | 5.875% | | 3/31/25 | | 1,095 | | 1,218 | |
| Cheniere Corpus Christi Holdings LLC | | 5.125% | | 6/30/27 | | 705 | | 772 | |
| Cimarex Energy Co. | | 3.900% | | 5/15/27 | | 170 | | 173 | |
| Cimarex Energy Co. | | 4.375% | | 3/15/29 | | 320 | | 336 | |
| Concho Resources Inc. | | 3.750% | | 10/1/27 | | 400 | | 415 | |
| Concho Resources Inc. | | 4.850% | | 8/15/48 | | 300 | | 340 | |
| ConocoPhillips Co. | | 4.300% | | 11/15/44 | | 500 | | 579 | |
| Devon Energy Corp. | | 5.850% | | 12/15/25 | | 1,000 | | 1,189 | |
| Devon Energy Corp. | | 5.000% | | 6/15/45 | | 1,000 | | 1,158 | |
| Diamondback Energy Inc. | | 4.750% | | 11/1/24 | | 456 | | 466 | |
| Energy Transfer Operating LP | | 5.500% | | 6/1/27 | | 500 | | 564 | |
| Energy Transfer Partners LP | | 4.950% | | 6/15/28 | | 1,275 | | 1,402 | |
| Enterprise Products Operating LLC | | 4.050% | | 2/15/22 | | 3,000 | | 3,140 | |
| Enterprise Products Operating LLC | | 3.125% | | 7/31/29 | | 1,250 | | 1,278 | |
| Enterprise Products Operating LLC | | 5.950% | | 2/1/41 | | 500 | | 634 | |
27
Core Bond Fund
| | | | | | | Face | | Market | |
| | | | | Maturity | | Amount | | Value· | |
| | | Coupon | | Date | | ($000 | ) | ($000 | ) |
| Enterprise Products Operating LLC | | 4.800% | | 2/1/49 | | 500 | | 579 | |
| EQT Corp. | | 3.900% | | 10/1/27 | | 100 | | 87 | |
| Kinder Morgan Energy Partners LP | | 5.800% | | 3/15/35 | | 111 | | 130 | |
| Marathon Petroleum Corp. | | 4.500% | | 4/1/48 | | 200 | | 208 | |
11 | MEG Energy Corp. | | 6.500% | | 1/15/25 | | 35 | | 36 | |
| MPLX LP | | 4.000% | | 3/15/28 | | 400 | | 416 | |
| MPLX LP | | 4.700% | | 4/15/48 | | 300 | | 311 | |
| Occidental Petroleum Corp. | | 2.900% | | 8/15/24 | | 2,000 | | 2,011 | |
| Occidental Petroleum Corp. | | 5.550% | | 3/15/26 | | 360 | | 407 | |
| Occidental Petroleum Corp. | | 6.450% | | 9/15/36 | | 150 | | 185 | |
| ONEOK Inc. | | 4.450% | | 9/1/49 | | 810 | | 808 | |
11 | Parsley Energy LLC / Parsley Finance Corp. | | 6.250% | | 6/1/24 | | 75 | | 77 | |
11 | Parsley Energy LLC / Parsley Finance Corp. | | 5.625% | | 10/15/27 | | 100 | | 103 | |
| Phillips 66 Partners LP | | 3.150% | | 12/15/29 | | 255 | | 251 | |
| Plains All American Pipeline LP / PAA Finance Corp. | | 3.550% | | 12/15/29 | | 760 | | 741 | |
| Sabine Pass Liquefaction LLC | | 5.875% | | 6/30/26 | | 1,350 | | 1,547 | |
| SM Energy Co. | | 6.125% | | 11/15/22 | | 50 | | 48 | |
| Sunoco Logistics Partners Operations LP | | 5.950% | | 12/1/25 | | 6,245 | | 7,153 | |
11 | Targa Resources Partners LP / Targa Resources Partners Finance Corp. | | 6.500% | | 7/15/27 | | 75 | | 82 | |
11 | Targa Resources Partners LP / Targa Resources Partners Finance Corp. | | 6.875% | | 1/15/29 | | 75 | | 82 | |
14 | Total Capital International SA | | 1.375% | | 10/4/29 | | 600 | | 727 | |
| TransCanada PipeLines Ltd. | | 4.250% | | 5/15/28 | | 1,390 | | 1,534 | |
| TransCanada PipeLines Ltd. | | 4.875% | | 5/15/48 | | 1,000 | | 1,158 | |
| Valero Energy Corp. | | 4.000% | | 4/1/29 | | 300 | | 318 | |
| Valero Energy Corp. | | 4.900% | | 3/15/45 | | 100 | | 111 | |
| Williams Cos. Inc. | | 3.750% | | 6/15/27 | | 800 | | 825 | |
| | | | | | | | | | |
| Technology (2.8 %) | | | | | | | | | |
| Apple Inc. | | 3.850% | | 5/4/43 | | 4,000 | | 4,482 | |
11 | Broadcom Inc. | | 4.250% | | 4/15/26 | | 470 | | 486 | |
11 | CDK Global Inc. | | 5.250% | | 5/15/29 | | 100 | | 103 | |
| CDW LLC / CDW Finance Corp. | | 4.250% | | 4/1/28 | | 105 | | 107 | |
11 | CommScope Finance LLC | | 5.500% | | 3/1/24 | | 25 | | 26 | |
11 | CommScope Finance LLC | | 8.250% | | 3/1/27 | | 95 | | 93 | |
| Equinix Inc. | | 5.375% | | 5/15/27 | | 100 | | 108 | |
| Fiserv Inc. | | 2.750% | | 7/1/24 | | 2,000 | | 2,035 | |
| Fiserv Inc. | | 3.200% | | 7/1/26 | | 2,000 | | 2,070 | |
| Intel Corp. | | 3.700% | | 7/29/25 | | 2,500 | | 2,707 | |
| Intel Corp. | | 3.734% | | 12/8/47 | | 2,075 | | 2,298 | |
| International Business Machines Corp. | | 3.300% | | 5/15/26 | | 2,610 | | 2,750 | |
11 | Iron Mountain Inc. | | 4.875% | | 9/15/29 | | 105 | | 106 | |
| Lam Research Corp. | | 3.750% | | 3/15/26 | | 1,000 | | 1,067 | |
11 | NXP BV / NXP Funding LLC | | 4.875% | | 3/1/24 | | 7,000 | | 7,586 | |
| PayPal Holdings Inc. | | 2.400% | | 10/1/24 | | 2,500 | | 2,515 | |
11 | Qorvo Inc. | | 4.375% | | 10/15/29 | | 245 | | 247 | |
| QUALCOMM Inc. | | 3.450% | | 5/20/25 | | 2,000 | | 2,113 | |
14 | SAP SE | | 1.625% | | 3/10/31 | | 500 | | 618 | |
11 | SS&C Technologies Inc. | | 5.500% | | 9/30/27 | | 100 | | 104 | |
| Verisk Analytics Inc. | | 4.125% | | 3/15/29 | | 1,065 | | 1,170 | |
| Verisk Analytics Inc. | | 5.500% | | 6/15/45 | | 1,000 | | 1,246 | |
| Western Digital Corp. | | 4.750% | | 2/15/26 | | 88 | | 90 | |
28
Core Bond Fund
| | | | | | | Face | | Market | |
| | | | | Maturity | | Amount | | Value· | |
| | | Coupon | | Date | | ($000 | ) | ($000 | ) |
| Transportation (1.0%) | | | | | | | | | |
13 | Aurizon Network Pty Ltd. | | 4.000% | | 6/21/24 | | 2,500 | | 1,805 | |
| Burlington Northern Santa Fe LLC | | 3.550% | | 2/15/50 | | 1,275 | | 1,350 | |
| CSX Corp. | | 4.250% | | 3/15/29 | | 2,960 | | 3,338 | |
| FedEx Corp. | | 3.100% | | 8/5/29 | | 1,955 | | 1,943 | |
14 | International Consolidated Airlines Group SA | | 1.500% | | 7/4/27 | | 200 | | 216 | |
13 | Pacific National Finance Pty Ltd. | | 5.400% | | 5/12/27 | | 1,000 | | 788 | |
13 | Qantas Airways Ltd. | | 7.500% | | 6/11/21 | | 2,500 | | 1,851 | |
| Union Pacific Corp. | | 4.500% | | 9/10/48 | | 1,325 | | 1,572 | |
| | | | | | | | | 232,590 | |
Utilities (3.7%) | | | | | | | | | |
| Electric (3.6%) | | | | | | | | | |
| AEP Transmission Co. LLC | | 3.800% | | 6/15/49 | | 750 | | 823 | |
| Appalachian Power Co. | | 4.500% | | 3/1/49 | | 300 | | 359 | |
| Arizona Public Service Co. | | 2.600% | | 8/15/29 | | 725 | | 725 | |
| CenterPoint Energy Houston Electric LLC | | 3.000% | | 2/1/27 | | 356 | | 368 | |
| Commonwealth Edison Co. | | 3.800% | | 10/1/42 | | 685 | | 750 | |
| Commonwealth Edison Co. | | 3.750% | | 8/15/47 | | 815 | | 895 | |
| Connecticut Light & Power Co. | | 3.200% | | 3/15/27 | | 3,500 | | 3,702 | |
| Dominion Energy Inc. | | 2.750% | | 1/15/22 | | 500 | | 506 | |
| Dominion Energy Inc. | | 4.900% | | 8/1/41 | | 200 | | 237 | |
| Dominion Energy Inc. | | 4.050% | | 9/15/42 | | 475 | | 504 | |
| DTE Energy Co. | | 2.600% | | 6/15/22 | | 4,000 | | 4,033 | |
| DTE Energy Co. | | 3.800% | | 3/15/27 | | 2,400 | | 2,568 | |
| Duke Energy Carolinas LLC | | 2.450% | | 8/15/29 | | 970 | | 971 | |
| Duke Energy Carolinas LLC | | 4.250% | | 12/15/41 | | 550 | | 630 | |
| Duke Energy Corp. | | 3.400% | | 6/15/29 | | 2,800 | | 2,931 | |
| Duke Energy Florida LLC | | 3.400% | | 10/1/46 | | 410 | | 423 | |
| Duke Energy Progress LLC | | 4.100% | | 5/15/42 | | 550 | | 617 | |
| Entergy Louisiana LLC | | 4.200% | | 9/1/48 | | 500 | | 585 | |
| Entergy Texas Inc. | | 3.550% | | 9/30/49 | | 810 | | 842 | |
| Evergy Inc. | | 2.900% | | 9/15/29 | | 2,425 | | 2,405 | |
| Exelon Corp. | | 3.950% | | 6/15/25 | | 130 | | 139 | |
| Exelon Corp. | | 4.450% | | 4/15/46 | | 500 | | 566 | |
| Florida Power & Light Co. | | 3.700% | | 12/1/47 | | 500 | | 553 | |
14 | innogy Finance BV | | 5.750% | | 2/14/33 | | 100 | | 177 | |
11 | Mid-Atlantic Interstate Transmission LLC | | 4.100% | | 5/15/28 | | 400 | | 439 | |
| National Rural Utilities Cooperative Finance Corp. | | 4.300% | | 3/15/49 | | 1,200 | | 1,440 | |
| NextEra Energy Capital Holdings Inc. | | 3.550% | | 5/1/27 | | 2,850 | | 3,008 | |
| NRG Energy Inc. | | 7.250% | | 5/15/26 | | 70 | | 77 | |
| Oncor Electric Delivery Co. LLC | | 2.950% | | 4/1/25 | | 1,300 | | 1,350 | |
| Oncor Electric Delivery Co. LLC | | 3.800% | | 9/30/47 | | 510 | | 567 | |
| PacifiCorp | | 4.150% | | 2/15/50 | | 1,150 | | 1,339 | |
| PECO Energy Co. | | 4.150% | | 10/1/44 | | 815 | | 944 | |
| Public Service Co. of Colorado | | 3.200% | | 3/1/50 | | 810 | | 826 | |
| Public Service Electric & Gas Co. | | 3.200% | | 8/1/49 | | 250 | | 255 | |
| Union Electric Co. | | 4.000% | | 4/1/48 | | 410 | | 463 | |
| Union Electric Co. | | 3.250% | | 10/1/49 | | 405 | | 406 | |
| Virginia Electric & Power Co. | | 3.450% | | 2/15/24 | | 4,500 | | 4,688 | |
| Virginia Electric & Power Co. | | 3.150% | | 1/15/26 | | 425 | | 443 | |
| Virginia Electric & Power Co. | | 2.950% | | 11/15/26 | | 1,420 | | 1,468 | |
29
Core Bond Fund
| | | | | | | Face | | Market | |
| | | | | Maturity | | Amount | | Value· | |
| | | Coupon | | Date | | ($000 | ) | ($000 | ) |
| Natural Gas (0.1%) | | | | | | | | | |
14 | Engie SA | | 1.000% | | 3/13/26 | | 900 | | 1,036 | |
14 | Redexis Gas Finance BV | | 1.875% | | 4/27/27 | | 160 | | 179 | |
| | | | | | | | | | |
| Other Utility (0.0%) | | | | | | | | | |
13 | DBNGP Finance Co. Pty Ltd. | | 4.225% | | 5/28/25 | | 750 | | 561 | |
| | | | | | | | | 45,798 | |
Total Corporate Bonds (Cost $358,136) | | | | | | | | 370,389 | |
Sovereign Bonds (9.3%) | | | | | | | | | |
11 | African Export-Import Bank | | 3.994% | | 9/21/29 | | 1,360 | | 1,364 | |
| Argentine Republic | | 6.875% | | 4/22/21 | | 328 | | 160 | |
| Argentine Republic | | 5.625% | | 1/26/22 | | 672 | | 289 | |
5 | Bermuda | | 4.750% | | 2/15/29 | | 360 | | 407 | |
| Corp. Financiera de Desarrollo SA | | 4.750% | | 2/8/22 | | 2,500 | | 2,618 | |
11 | Emirate of Abu Dhabi | | 2.125% | | 9/30/24 | | 6,000 | | 5,966 | |
11 | Emirate of Abu Dhabi | | 3.125% | | 9/30/49 | | 3,075 | | 3,010 | |
| Empresa Nacional del Petroleo | | 4.750% | | 12/6/21 | | 3,200 | | 3,344 | |
| Equinor ASA | | 2.450% | | 1/17/23 | | 600 | | 609 | |
| Export-Import Bank of India | | 3.875% | | 10/2/19 | | 500 | | 500 | |
11 | Export-Import Bank of India | | 3.875% | | 2/1/28 | | 240 | | 254 | |
5 | Federative Republic of Brazil | | 4.500% | | 5/30/29 | | 1,770 | | 1,845 | |
| Korea Hydro & Nuclear Power Co. Ltd. | | 3.000% | | 9/19/22 | | 200 | | 204 | |
11 | Korea National Oil Corp. | | 2.875% | | 3/27/22 | | 200 | | 203 | |
| NTPC Ltd. | | 4.250% | | 2/26/26 | | 250 | | 265 | |
11 | Ontario Teachers’ Cadillac Fairview Properties Trust | | 3.125% | | 3/20/22 | | 200 | | 204 | |
11 | Ontario Teachers’ Cadillac Fairview Properties Trust | | 3.875% | | 3/20/27 | | 200 | | 217 | |
11 | Ontario Teachers’ Cadillac Fairview Properties Trust | | 4.125% | | 2/1/29 | | 560 | | 626 | |
| Petroleos Mexicanos | | 6.875% | | 8/4/26 | | 4,300 | | 4,622 | |
11 | Petroleos Mexicanos | | 6.490% | | 1/23/27 | | 2,600 | | 2,703 | |
| Petroleos Mexicanos | | 6.750% | | 9/21/47 | | 2,500 | | 2,383 | |
11 | Petroleos Mexicanos | | 7.690% | | 1/23/50 | | 1,600 | | 1,669 | |
| Province of Quebec | | 7.125% | | 2/9/24 | | 200 | | 243 | |
5 | Republic of Colombia | | 4.500% | | 1/28/26 | | 7,583 | | 8,275 | |
| Republic of Colombia | | 10.375% | | 1/28/33 | | 1,652 | | 2,641 | |
| Republic of Croatia | | 6.750% | | 11/5/19 | | 1,500 | | 1,505 | |
| Republic of El Salvador | | 7.375% | | 12/1/19 | | 2,142 | | 2,152 | |
5,11 | Republic of El Salvador | | 7.125% | | 1/20/50 | | 775 | | 790 | |
| Republic of Honduras | | 8.750% | | 12/16/20 | | 2,500 | | 2,672 | |
| Republic of Hungary | | 6.375% | | 3/29/21 | | 6,734 | | 7,145 | |
| Republic of Indonesia | | 4.750% | | 1/8/26 | | 2,000 | | 2,210 | |
11,14 | Republic of Italy | | 3.850% | | 9/1/49 | | 2,020 | | 3,183 | |
| Republic of Latvia | | 2.750% | | 1/12/20 | | 2,000 | | 2,000 | |
| Republic of Lithuania | | 6.125% | | 3/9/21 | | 365 | | 385 | |
| Republic of Lithuania | | 6.625% | | 2/1/22 | | 2,000 | | 2,208 | |
| Republic of Panama | | 8.125% | | 4/28/34 | | 150 | | 202 | |
| Republic of Paraguay | | 5.000% | | 4/15/26 | | 800 | | 873 | |
15 | Republic of Peru | | 6.150% | | 8/12/32 | | 7,500 | | 2,537 | |
| Republic of Serbia | | 7.250% | | 9/28/21 | | 830 | | 908 | |
| Republic of South Africa | | 5.500% | | 3/9/20 | | 1,500 | | 1,515 | |
| Republic of South Africa | | 5.875% | | 9/16/25 | | 3,563 | | 3,884 | |
30
Core Bond Fund
| | | | | | | Face | | Market | |
| | | | | Maturity | | Amount | | Value· | |
| | | Coupon | | Date | | ($000 | ) | ($000 | ) |
16 | Republic of South Africa | | 10.500% | | 12/21/26 | | 100,000 | | 7,374 | |
| Republic of South Africa | | 4.850% | | 9/30/29 | | 2,890 | | 2,886 | |
| Republic of South Africa | | 5.750% | | 9/30/49 | | 1,800 | | 1,798 | |
| Socialist Republic of Vietnam | | 6.750% | | 1/29/20 | | 800 | | 811 | |
14 | State of Israel | | 2.875% | | 1/29/24 | | 550 | | 680 | |
| United Mexican States | | 4.125% | | 1/21/26 | | 3,838 | | 4,065 | |
17 | United Mexican States | | 5.750% | | 3/5/26 | | 129,350 | | 6,208 | |
14 | United Mexican States | | 1.625% | | 4/8/26 | | 2,696 | | 3,062 | |
| United Mexican States | | 4.150% | | 3/28/27 | | 8,250 | | 8,728 | |
Total Sovereign Bonds (Cost $113,447) | | | | | | | | 114,402 | |
Taxable Municipal Bonds (0.2%) | | | | | | | | | |
| California GO | | 7.550% | | 4/1/39 | | 500 | | 827 | |
18 | New Jersey Economic Development Authority Revenue (State Pension Funding) | | 7.425% | | 2/15/29 | | 800 | | 1,022 | |
| Wisconsin Annual Appropriation Revenue | | 3.954% | | 5/1/36 | | 500 | | 545 | |
Total Taxable Municipal Bonds (Cost $2,221) | | | | | | | | 2,394 | |
| | | | | | | | | | |
| | | | | | | Shares | | | |
Temporary Cash Investment (3.0%) | | | | | | | | | |
Money Market Fund (3.0%) | | | | | | | | | |
19 | Vanguard Market Liquidity Fund | | | | | | | | | |
| (Cost $37,225) | | 2.098% | | | | 372,214 | | 37,225 | |
| | | | | | | | | Notional | | | |
| | | | | | | | | Amount on | | | |
| | | | | | | | | Underlying | | | |
| | | | | Expiration | | Exercise | | Swap | | | |
| | | Counterparty | | Date | | Rate | | ($000 | ) | | |
Options Purchased (0.0%) | | | | | | | | | | | |
Over-the-Counter Swaptions (0.0%) | | | | | | | | | |
Call Swaptions | | | | | | | | | | | |
| 10-Year Interest Rate Swap, Pays 3M USD LIBOR Quarterly, Receives 1.130% Semiannually | | BNPSW | | 9/21/20 | | 1.130% | | 3,662 | | 42 | |
| ISDAFIX USD 10-Year CMS Rate minus USD 2-Year CMS Rate | | CITNA | | 12/12/19 | | 0.780% | | 100,000 | | — | |
| | | | | | | | | | | 42 | |
31
Core Bond Fund
| | | | | | | | | Notional | | | |
| | | | | | | | | Amount on | | | |
| | | | | | | | | Underlying | | Market | |
| | | | | Expiration | | Exercise | | Swap | | Value· | |
| | | Counterparty | | Date | | Rate | | ($000 | ) | ($000 | ) |
Put Swaptions | | | | | | | | | | | |
| 2-Year Interest Rate Swap, Receives 3M USD LIBOR Quarterly, Pays 1.668% Semiannually | | MSCS | | 12/19/19 | | 1.668% | | 33,407 | | 53 | |
| 5-Year iTraxx Europe-S31-V1, Credit Protection Sold, Receives 1.000% Quarterly | | GSI | | 11/20/19 | | 0.575% | | 60,50020 | | 50 | |
| 5-Year CDX-NA-IG-S32-V1, Credit Protection Sold, Receives 1.000% Quarterly | | GSI | | 11/20/19 | | 0.625% | | 3,715 | | 3 | |
| ISDAFIX USD 10-Year CMS Rate minus USD 2-Year CMS Rate | | MSCS | | 12/6/19 | | 0.033% | | 30,000 | | 16 | |
| | | | | | | | | | | 122 | |
Total Options Purchased (Cost $278) | | | | | | | | 164 | |
Total Investments (99.2%) (Cost $1,184,722) | | | | | | | | 1,220,943 | |
| | | | | | | Face | | Market | |
| | | | | Maturity | | Amount | | Value· | |
| | | Coupon | | Date | | ($000 | ) | ($000 | ) |
Conventional Mortgage-Backed Securities—Liability for Sale Commitments (-2.5%) | |
5,6,7 | Fannie Mae Pool | | | | 4.000% | | 12/1/38–11/1/49 | | (7,428 | ) | (7,470 | ) |
5,7 | UMBS TBA | | | | 3.000% | | 11/1/49 | | (8,100 | ) | (8,215 | ) |
5,7 | UMBS TBA | | | | 3.500% | | 11/1/49 | | (8,800 | ) | (9,027 | ) |
5,7 | UMBS TBA | | | | 4.500% | | 11/1/49 | | (5,300 | ) | (5,583 | ) |
Total Conventional Mortgage-Backed Securities—Liability for Sale Commitments (Proceeds $30,348) | | | | | | (30,295 | ) |
Other Assets and Liabilities (3.3%) | | | | | | | |
Other Assets | | | | | | | | | | 202,789 | |
Other Liabilities | | | | | | | | | | (162,809 | ) |
| | | | | | | | | | 39,980 | |
Net Assets (100%) | | | | | | | | | | 1,230,628 | |
32
Core Bond Fund
| Amount |
| ($000) |
Statement of Assets and Liabilities | |
Assets | |
Investments in Securities, at Value | |
Unaffiliated Issuers | 1,183,554 |
Affiliated Issuers | 37,225 |
Options Purchased | 164 |
Total Investments in Securities | 1,220,943 |
Investment in Vanguard | 58 |
Receivables for Investment Securities Sold | 193,018 |
Receivables for Accrued Income | 6,722 |
Receivables for Capital Shares Issued | 2,292 |
Variation Margin Receivable—Futures Contracts | 57 |
Variation Margin Receivable—CC Swap Contracts | — |
Unrealized Appreciation—Forward Currency Contracts | 151 |
Unrealized Appreciation—OTC Swap Contracts | 79 |
Other Assets | 412 |
Total Assets | 1,423,732 |
Liabilities | |
Payables for Investment Securities Purchased | 160,737 |
Payables for Capital Shares Redeemed | 552 |
Payables for Distributions | 487 |
Payables to Vanguard | 99 |
Liability for Sale Commitments | 30,295 |
Options Written, at Value21 | 516 |
Variation Margin Payable—Futures Contracts | 76 |
Variation Margin Payable—CC Swap Contracts | 128 |
Unrealized Depreciation—OTC Swap Contracts | 94 |
Other Liabilities | 120 |
Total Liabilities | 193,104 |
Net Assets | 1,230,628 |
At September 30, 2019, net assets consisted of:
| Amount |
| ($000) |
Paid-in Capital | 1,204,115 |
Total Distributable Earnings (Loss) | 26,513 |
Net Assets | 1,230,628 |
| |
Investor Shares—Net Assets | |
Applicable to 11,391,408 outstanding $.001 par value shares of beneficial interest (unlimited authorization) | 116,660 |
Net Asset Value Per Share—Investor Shares | $10.24 |
33
Core Bond Fund
| Amount |
| ($000) |
Admiral Shares—Net Assets | |
Applicable to 54,401,988 outstanding $.001 par value shares of beneficial interest (unlimited authorization) | 1,113,968 |
Net Asset Value Per Share—Admiral Shares | $20.48 |
· See Note A in Notes to Financial Statements.
1 Securities with a value of $463,000 have been segregated as collateral for open forward currency contracts and over-the-counter swap contracts.
2 Securities with a value of $1,652,000 have been segregated as initial margin for open centrally cleared swap contracts.
3 Securities with a value of $1,562,000 have been segregated as initial margin for open futures contracts.
4 U.S. government-guaranteed.
5 The average or expected maturity is shorter than the final maturity shown because of the possibility of interim principal payments and prepayments or the possibility of the issue being called.
6 The issuer was placed under federal conservatorship in September 2008; since that time, its daily operations have been managed by the Federal Housing Finance Agency and it receives capital from the U.S. Treasury, as needed to maintain a positive net worth, in exchange for senior preferred stock.
7 Includes securities purchased on a when-issued or delayed-delivery basis for which the fund has not taken delivery as of September 30, 2019.
8 Adjustable-rate security; rate shown is effective rate at period end. Certain adjustable-rate securities are not based on a published reference rate and spread but are determined by the issuer or agent based on current market conditions.
9 Interest-only security.
10 Inverse interest-only security.
11 Security exempt from registration under Rule 144A of the Securities Act of 1933. Such securities may be sold in transactions exempt from registration, normally to qualified institutional buyers. At September 30, 2019, the aggregate value of these securities was $103,902,000, representing 8.4% of net assets.
12 Face amount denominated in British pounds.
13 Face amount denominated in Australian dollars.
14 Face amount denominated in euro.
15 Face amount denominated in Peruvian soles.
16 Face amount denominated in South African rand.
17 Face amount denominated in Mexican pesos.
18 Scheduled principal and interest payments are guaranteed by National Public Finance Guarantee Corp.
19 Affiliated money market fund available only to Vanguard funds and certain trusts and accounts managed by Vanguard. Rate shown is the 7-day yield.
20 Notional amount denominated in euro.
21 Includes premium received of $649,000.
BNPSW—BNP Paribas.
CC—Centrally Cleared.
CITNA—Citibank, N.A.
CMS—Constant Maturity Swap Rate.
GO—General Obligation Bond.
GSI—Goldman Sachs International.
LIBOR—London Interbank Offered Rate.
MSCS—Morgan Stanley Capital Services LLC.
OTC—Over-the-Counter.
REMICS—Real Estate Mortgage Investment Conduits.
TBA—To Be Announced.
UMBS—Uniform Mortgage Backed Securities.
34
Core Bond Fund
Derivative Financial Instruments Outstanding as of Period End |
Options Written | | | | | | | | | | | |
| | | | | | | | Notional | | Market | |
| | Expiration | | | | Exercise | | Amount | | Value | |
| | Date | | Contracts | | Price | | ($000 | ) | ($000 | ) |
Exchange-Traded Options | | | | | | | | | | | |
Call Options | | | | | | | | | | | |
10-Year U.S. Treasury Note Futures Contracts | | 11/22/2019 | | 115 | | $132.00 | | 15,180 | | (47 | ) |
| | | | | | | | | | | |
Put Options | | | | | | | | | | | |
10-Year U.S. Treasury Note Futures Contracts | | 11/22/2019 | | 115 | | $128.00 | | 14,720 | | (27 | ) |
| | | | | | | | | | (74 | ) |
| | | | | | | | Notional | | | |
| | | | | | | | Amount on | | | |
| | | | | | | | Underlying | | Market | |
| | | | Expiration | | Exercise | | Swap | | Value | |
| | Counterparty | | Date | | Rate | | ($000 | ) | ($000 | ) |
Over-the-Counter Swaptions | | | | | | | | | | | |
Call Swaptions | | | | | | | | | | | |
10-Year Interest Rate Swap, Receives 3M USD LIBOR Quarterly, Pays 1.375% Semiannually | | DBAG | | 3/18/20 | | 1.375% | | 4,910 | | (57 | ) |
5-Year iTraxx Europe-S31-V1, Credit Protection Sold, Receives 1.000% Quarterly | | GSI | | 11/20/19 | | 0.500% | | 60,5001 | | (122 | ) |
5-Year CDX-NA-IG-S32-V1, Credit Protection Sold, Receives 1.000% Quarterly | | GSI | | 11/20/19 | | 0.550% | | 3,715 | | (7 | ) |
| | | | | | | | | | (186 | ) |
35
Core Bond Fund
| | | | | | | | Notional | | | |
| | | | | | | | Amount on | | | |
| | | | | | | | Underlying | | Market | |
| | | | Expiration | | Exercise | | Swap | | Value | |
| | Counterparty | | Date | | Rate | | ($000 | ) | ($000 | ) |
Put Swaptions | | | | | | | | | | | |
10-Year Interest Rate Swap, Pays 3M USD LIBOR Quarterly, Receives 1.875% Semiannually | | DBAG | | 3/18/20 | | 1.875% | | 4,910 | | (35 | ) |
2-Year Interest Rate Swap, Pays 3M USD LIBOR Quarterly, Receives 1.818% Semiannually | | MSCS | | 12/19/19 | | 1.818% | | 66,814 | | (48 | ) |
5-Year iTraxx Europe-S31-V1, Credit Protection Purchased, Pays 1.000% Quarterly | | GSI | | 11/20/19 | | 0.500% | | 60,5001 | | (107 | ) |
5-Year CDX-NA-IG-S32-V1 Credit Protection Purchased, Pays 1.000% Quarterly | | GSI | | 11/20/19 | | 0.550% | | 3,715 | | (6 | ) |
ISDAFIX USD 10-Year CMS Rate minus USD 2-Year CMS Rate | | MSCS | | 12/6/2019 | | 0.058% | | 60,000 | | (60 | ) |
| | | | | | | | | | (256 | ) |
| | | | | | | | | | (442 | ) |
Total Options Written (Premiums Received $649) | | | | | | | | (516 | ) |
1 Notional amount denominated in euro.
DBAG—Deutsche Bank AG.
GSI—Goldman Sachs International.
MSCS—Morgan Stanley Capital Services LLC.
36
Core Bond Fund
| | | | | | | | ($000 | ) |
| | | | | | | | Value and | |
| | | | Number of | | | | Unrealized | |
| | | | Long (Short | ) | Notional | | Appreciation | |
| | Expiration | | Contracts | | Amount | | (Depreciation | ) |
Long Futures Contracts | | | | | | | | | |
2-Year U.S. Treasury Note | | December 2019 | | 785 | | 169,168 | | (168 | ) |
5-Year U.S. Treasury Note | | December 2019 | | 567 | | 67,557 | | (177 | ) |
Ultra Long U.S. Treasury Bond | | December 2019 | | 117 | | 22,453 | | 146 | |
30-Year U.S. Treasury Bond | | December 2019 | | 37 | | 6,006 | | 96 | |
| | | | | | | | (103 | ) |
| | | | | | | | | |
Short Futures Contracts | | | | | | | | | |
Ultra 10-Year U.S. Treasury Note | | December 2019 | | (697 | ) | (99,257 | ) | 1,417 | |
Euro-BTP | | December 2019 | | (50 | ) | (7,948 | ) | (31 | ) |
Euro-Bobl | | December 2019 | | (46 | ) | (6,801 | ) | 21 | |
Euro-Bund | | December 2019 | | (28 | ) | (5,318 | ) | 51 | |
AUD 3-Year Treasury Bond | | December 2019 | | (60 | ) | (4,685 | ) | (18 | ) |
10-Year U.S. Treasury Note | | December 2019 | | (27 | ) | (3,518 | ) | (1 | ) |
Long Gilt | | December 2019 | | (15 | ) | (2,476 | ) | (6 | ) |
AUD 10-Year Treasury Bond | | December 2019 | | (14 | ) | (1,392 | ) | (14 | ) |
Euro-Buxl | | December 2019 | | (2 | ) | (474 | ) | 4 | |
| | | | | | | | 1,423 | |
| | | | | | | | 1,320 | |
Forward Currency Contracts |
| | Contract | | | | | | | | | | Unrealized | | Unrealized | |
| | Settlement | | Contract Amount (000) | | Appreciation | | (Depreciation | ) |
Counterparty | | Date | | | | Receive | | | | Deliver | | ($000 | ) | ($000 | ) |
Royal Bank of Canada | | 10/15/19 | | USD | | 18,712 | | EUR | | 17,104 | | 46 | | — | |
Toronto-Dominion Bank | | 10/15/19 | | USD | | 13,064 | | AUD | | 19,340 | | 3 | | — | |
Bank of America, N.A. | | 12/18/19 | | USD | | 7,464 | | ZAR | | 113,576 | | 42 | | — | |
Royal Bank of Canada | | 10/31/19 | | USD | | 5,708 | | MXN | | 112,592 | | 35 | | — | |
HSBC Bank USA, N.A. | | 10/15/19 | | USD | | 3,127 | | GBP | | 2,532 | | 11 | | — | |
BNP Paribas | | 10/10/19 | | USD | | 2,600 | | PEN | | 8,718 | | 14 | | — | |
| | | | | | | | | | | | 151 | | — | |
AUD—Australian dollar.
EUR—euro.
GBP—British pound.
MXN—Mexican peso.
PEN—Peruvian sol.
USD—U.S. dollar.
ZAR—South African rand.
37
Core Bond Fund
Centrally Cleared Credit Default Swaps |
| | | | | | Periodic | | | | | |
| | | | | | Premium | | | | Unrealized | |
| | | | | | Received | | | | Appreciation | |
| | Termination | | Notional Amount | | (Paid | )1 | Value | | (Depreciation | ) |
Reference Entity | | Date | | (000 | ) | (% | ) | ($000 | ) | ($000 | ) |
Credit Protection Purchased | | | | | | | | | | | |
CDX-NA-IG-S33-V1 | | 12/20/24 | | USD | 134,630 | | (1.000 | ) | (2,673 | ) | 54 | |
iTraxx Europe-S32-V1 | | 12/20/24 | | EUR | 4,370 | | (1.000 | ) | (113 | ) | 2 | |
| | | | | | | | | | 56 | |
1 Periodic premium received/paid quarterly.
EUR–euro.
USD–U.S. dollar.
Over-the-Counter Credit Default Swaps |
| | | | | | | | | | | | Remaining | | | | | |
| | | | | | | | Periodic | | | | Up-Front | | | | | |
| | | | | | | | Premium | | | | Premium | | | | | |
| | | | | | Notional | | Received | | | | Received | | Unrealized | | Unrealized | |
Reference | | Termination | | | | Amount | | (Paid | )2 | Value | | (Paid | ) | Appreciation | | (Depreciation | ) |
Entity | | Date | | Counterparty | | ($000 | ) | (% | ) | ($000 | ) | ($000 | ) | ($000 | ) | ($000 | ) |
Credit Protection Sold/Moody’s Rating | | | | | | | | | | | | | |
Berkshire Hathaway Inc./Aa2 | | 6/20/22 | | BARC | | 450 | | 1.000 | | 8 | | (4 | ) | 4 | | — | |
Berkshire Hathaway Inc./Aa2 | | 12/20/22 | | BARC | | 400 | | 1.000 | | 8 | | (4 | ) | 4 | | — | |
Berkshire Hathaway Inc./Aa2 | | 6/20/24 | | BARC | | 600 | | 1.000 | | 13 | | (5 | ) | 8 | | — | |
Berkshire Hathaway Inc./Aa2 | | 6/20/24 | | JPMC | | 600 | | 1.000 | | 13 | | (4 | ) | 9 | | — | |
Metlife Inc./A3 | | 12/20/21 | | BARC | | 100 | | 1.000 | | 2 | | — | | 2 | | — | |
Metlife Inc./A3 | | 6/20/24 | | BARC | | 700 | | 1.000 | | 11 | | (1 | ) | 10 | | — | |
People’s Republic of China/A3 | | 6/20/22 | | BNPSW | | 200 | | 1.000 | | 4 | | (1 | ) | 3 | | — | |
| | | | | | | | | | 59 | | (19 | ) | 40 | | — | |
| | | | | | | | | | | | | | | | | |
Credit Protection Purchased | | | | | | | | | | | | | | | |
Bank of China Ltd. | | 12/20/21 | | BNPSW | | 100 | | (1.000 | ) | (2 | ) | — | | — | | (2 | ) |
Bank of China Ltd. | | 6/20/22 | | BNPSW | | 200 | | (1.000 | ) | (4 | ) | — | | — | | (4 | ) |
Commerzbank AG | | 6/20/21 | | BOANA | | 505 | | (1.000 | ) | (7 | ) | (3 | ) | — | | (10 | ) |
Deutsche Bank AG | | 12/20/22 | | JPMC | | 440 | | (1.000 | ) | 5 | | 1 | | 6 | | — | |
Deutsche Bank AG | | 12/20/24 | | GSI | | 1501 | | (1.000 | ) | 5 | | (4 | ) | 1 | | — | |
38
Core Bond Fund
Over-the-Counter Credit Default Swaps (continued) |
| | | | | | | | | | | | Remaining | | | | | |
| | | | | | | | Periodic | | | | Up-Front | | | | | |
| | | | | | | | Premium | | | | Premium | | | | | |
| | | | | | Notional | | Received | | | | Received | | Unrealized | | Unrealized | |
Reference | | Termination | | | | Amount | | (Paid | )2 | Value | | (Paid | ) | Appreciation | | (Depreciation | ) |
Entity | | Date | | Counterparty | | ($000 | ) | (% | ) | ($000 | ) | ($000 | ) | ($000 | ) | ($000 | ) |
Federation of Malaysia | | 12/20/24 | | BNPSW | | 3,000 | | (1.000 | ) | (73 | ) | 74 | | 1 | | — | |
Federative Republic of Brazil | | 12/20/24 | | JPMC | | 3,100 | | (1.000 | ) | 53 | | (55 | ) | — | | (2 | ) |
Federative Republic of Brazil | | 12/20/24 | | MSCS | | 4,550 | | (1.000 | ) | 78 | | (80 | ) | — | | (2 | ) |
Lincoln National Corp. | | 6/20/21 | | BARC | | 35 | | (1.000 | ) | — | | — | | — | | — | |
Lincoln National Corp. | | 6/20/21 | | BARC | | 25 | | (1.000 | ) | — | | — | | — | | — | |
Lincoln National Corp. | | 12/20/21 | | BARC | | 100 | | (1.000 | ) | (2 | ) | — | | — | | (2 | ) |
McDonald’s Corp. | | 6/20/22 | | GSI | | 325 | | (1.000 | ) | (8 | ) | 6 | | — | | (2 | ) |
People’s Republic of China | | 6/20/23 | | GSI | | 1,200 | | (1.000 | ) | (31 | ) | 13 | | — | | (18 | ) |
Republic of Chile | | 12/20/24 | | GSI | | 5,500 | | (1.000 | ) | (178 | ) | 169 | | — | | (9 | ) |
Republic of Colombia | | 12/20/24 | | JPMC | | 9,000 | | (1.000 | ) | (35 | ) | 36 | | 1 | | — | |
Republic of Colombia | | 12/20/24 | | MSCS | | 9,950 | | (1.000 | ) | (38 | ) | 39 | | 1 | | — | |
Republic of Peru | | 12/20/24 | | CITNA | | 1,500 | | (1.000 | ) | (34 | ) | 37 | | 3 | | — | |
Republic of South Africa | | 12/20/24 | | JPMC | | 1,280 | | (1.000 | ) | 56 | | (53 | ) | 3 | | — | |
Republic of South Africa | | 12/20/24 | | MSCS | | 2,800 | | (1.000 | ) | 123 | | (110 | ) | 13 | | — | |
Societe Generale SA | | 12/20/21 | | JPMC | | 325 | | (1.000 | ) | (6 | ) | 1 | | — | | (5 | ) |
Standard Chartered Bank | | 12/20/21 | | JPMC | | 185 | | (1.000 | ) | (4 | ) | — | | — | | (4 | ) |
State of Qatar | | 6/20/22 | | BOANA | | 340 | | (1.000 | ) | (7 | ) | (2 | ) | — | | (9 | ) |
State of Qatar | | 6/20/22 | | CITNA | | 660 | | (1.000 | ) | (14 | ) | (4 | ) | — | | (18 | ) |
39
Core Bond Fund
Over-the-Counter Credit Default Swaps (continued) |
| | | | | | | | | | | | Remaining | | | | | |
| | | | | | | | Periodic | | | | Up-Front | | | | | |
| | | | | | | | Premium | | | | Premium | | | | | |
| | | | | | Notional | | Received | | | | Received | | Unrealized | | Unrealized | |
Reference | | Termination | | | | Amount | | (Paid | )2 | Value | | (Paid | ) | Appreciation | | (Depreciation | ) |
Entity | | Date | | Counterparty | | ($000 | ) | (% | ) | ($000 | ) | ($000 | ) | ($000 | ) | ($000 | ) |
United Mexican States | | 12/20/24 | | BARC | | 7,670 | | (1.000 | ) | 56 | | (46 | ) | 10 | | — | |
United Mexican States | | 12/20/24 | | BNPSW | | 4,495 | | (1.000 | ) | 33 | | (38 | ) | — | | (5 | ) |
United Mexican States | | 12/20/24 | | CITNA | | 14,185 | | (1.000 | ) | 104 | | (106 | ) | — | | (2 | ) |
| | | | | | | | | | 70 | | (125 | ) | 39 | | (94 | ) |
| | | | | | | | | | 129 | | (144 | ) | 79 | | (94 | ) |
The notional amount represents the maximum potential amount the portfolio could be required to pay as a seller of credit protection if the reference entity was subject to a credit event.
1 Notional amount denominated in euro.
2 Periodic premium received/paid quarterly.
BARC—Barclays Bank plc.
BNPSW—BNP Paribas.
BOANA—Bank of America, N.A.
CITNA—Citibank, N.A.
GSI—Goldman Sachs International.
JPMC—JPMorgan Chase Bank, N.A.
MSCS—Morgan Stanley Capital Services LLC.
Centrally Cleared Interest Rate Swaps |
| | | | | | Fixed | | Floating | | | | | |
| | | | | | Interest | | Interest | | | | | |
| | | | | | Rate | | Rate | | | | Unrealized | |
| | Future | | Notional | | Received | | Received | | | | Appreciation | |
| | Effective | | Amount | | (Paid | )2 | (Paid | )3 | Value | | (Depreciation | ) |
Termination Date | | Date1 | | ($000 | ) | (% | ) | (% | ) | ($000 | ) | ($000 | ) |
12/18/20 | | 12/18/19 | | 5,400 | | 2.500 | | (0.000 | ) | 43 | | 6 | |
12/20/21 | | 12/18/19 | | 1,885 | | 1.500 | | (0.000 | ) | (2 | ) | 4 | |
12/19/22 | | 12/18/19 | | 390 | | 1.500 | | (0.000 | ) | — | | 1 | |
12/18/23 | | 12/18/19 | | 1,000 | | 1.500 | | (0.000 | ) | 1 | | 5 | |
9/23/30 | | 9/23/20 | | 769 | | (1.630 | ) | 0.000 | | (5 | ) | (4 | ) |
| | | | | | | | | | 37 | | 12 | |
1 Forward interest rate swap. In a forward interest rate swap, the fund and the counterparty agree to make periodic net payments beginning on a specified future effective date.
2 Fixed interest payment received/paid semiannually.
3 Based on 3M LIBOR as of the most recent payment date. Floating interest payment received/paid quarterly.
See accompanying Notes, which are an integral part of the Financial Statements.
40
Core Bond Fund
Statement of Operations
| | Year Ended | |
| | September 30, 2019 | |
| | ($000 | ) |
Investment Income | | | |
Income | | | |
Interest1 | | 35,961 | |
Total Income | | 35,961 | |
Expenses | | | |
The Vanguard Group—Note B | | | |
Investment Advisory Services | | 152 | |
Management and Administrative—Investor Shares | | 189 | |
Management and Administrative—Admiral Shares | | 668 | |
Marketing and Distribution—Investor Shares | | 14 | |
Marketing and Distribution—Admiral Shares | | 61 | |
Custodian Fees | | 51 | |
Auditing Fees | | 43 | |
Shareholders’ Reports—Investor Shares | | 5 | |
Shareholders’ Reports—Admiral Shares | | 9 | |
Trustees’ Fees and Expenses | | 1 | |
Total Expenses | | 1,193 | |
Net Investment Income | | 34,768 | |
Realized Net Gain (Loss) | | | |
Investment Securities Sold1 | | 9,670 | |
Futures Contracts | | (3,640 | ) |
Options Purchased | | (99 | ) |
Options Written | | 702 | |
Swap Contracts | | (3,322 | ) |
Forward Currency Contracts | | 3,958 | |
Foreign Currencies | | 296 | |
Realized Net Gain (Loss) | | 7,565 | |
Change in Unrealized Appreciation (Depreciation) | | | |
Investment Securities1 | | 58,963 | |
Futures Contracts | | 3,615 | |
Options Purchased | | (112 | ) |
Options Written | | 135 | |
Swap Contracts | | 236 | |
Forward Currency Contracts | | (267 | ) |
Foreign Currencies | | (30 | ) |
Change in Unrealized Appreciation (Depreciation) | | 62,540 | |
Net Increase (Decrease) in Net Assets Resulting from Operations | | 104,873 | |
1 Interest income, realized net gain (loss), and change in unrealized appreciation (depreciation) from an affiliated company of the fund were $1,009,000, ($10,000), and $2,000, respectively. Purchases and sales are for temporary cash investment purposes.
See accompanying Notes, which are an integral part of the Financial Statements.
41
Core Bond Fund
Statement of Changes in Net Assets
| | Year Ended September 30, | |
| | 2019 | | 2018 | |
| | ($000 | ) | ($000 | ) |
Increase (Decrease) in Net Assets | | | | | |
Operations | | | | | |
Net Investment Income | | 34,768 | | 27,055 | |
Realized Net Gain (Loss) | | 7,565 | | (16,164 | ) |
Change in Unrealized Appreciation (Depreciation) | | 62,540 | | (22,763 | ) |
Net Increase (Decrease) in Net Assets Resulting from Operations | | 104,873 | | (11,872 | ) |
Distributions | | | | | |
Net Investment Income | | | | | |
Investor Shares | | (2,881 | ) | (2,501 | ) |
Admiral Shares | | (31,289 | ) | (25,700 | ) |
Realized Capital Gain | | | | | |
Investor Shares | | — | | — | |
Admiral Shares | | — | | — | |
Total Distributions | | (34,170 | ) | (28,201 | ) |
Capital Share Transactions | | | | | |
Investor Shares | | 30,625 | | (7,025 | ) |
Admiral Shares | | 144,394 | | 147,597 | |
Net Increase (Decrease) from Capital Share Transactions | | 175,019 | | 140,572 | |
Total Increase (Decrease) | | 245,722 | | 100,499 | |
Net Assets | | | | | |
Beginning of Period | | 984,906 | | 884,407 | |
End of Period | | 1,230,628 | | 984,906 | |
| | | | | | |
See accompanying Notes, which are an integral part of the Financial Statements.
42
Core Bond Fund
Financial Highlights
Investor Shares
| | | | | | | | March 10, | |
| | | | | | | | 20161 to | |
For a Share Outstanding | | Year Ended September 30, | | Sept. 30, | |
Throughout Each Period | | 2019 | | 2018 | | 2017 | | 2016 | |
Net Asset Value, Beginning of Period | | $9.59 | | $10.00 | | $10.26 | | $10.00 | |
Investment Operations | | | | | | | | | |
Net Investment Income | | .311 | 2 | .269 | 2 | .217 | 2 | .097 | |
Net Realized and Unrealized Gain (Loss) on Investments | | .645 | | (.400 | ) | (.219 | ) | .259 | |
Total from Investment Operations | | .956 | | (.131 | ) | (.002 | ) | .356 | |
Distributions | | | | | | | | | |
Dividends from Net Investment Income | | (.306 | ) | (.279 | ) | (.197 | ) | (.096 | ) |
Distributions from Realized Capital Gains | | — | | — | | (.061 | ) | — | |
Total Distributions | | (.306 | ) | (.279 | ) | (.258 | ) | (.096 | ) |
Net Asset Value, End of Period | | $10.24 | | $9.59 | | $10.00 | | $10.26 | |
| | | | | | | | | |
Total Return3 | | 10.15% | | -1.32% | | 0.03% | | 3.57% | |
| | | | | | | | | |
Ratios/Supplemental Data | | | | | | | | | |
Net Assets, End of Period (Millions) | | $117 | | $80 | | $91 | | $65 | |
Ratio of Total Expenses to Average Net Assets | | 0.25% | | 0.25% | | 0.25% | | 0.25%5 | |
Ratio of Net Investment Income to Average Net Assets | | 3.16% | | 2.76% | | 2.18% | | 2.00%5 | |
Portfolio Turnover Rate4 | | 406% | | 263% | | 232% | | 229% | |
1 Subscription period for the fund was March 10, 2016, to March 24, 2016, during which time all assets were held in money market instruments. Performance measurement began March 28, 2016, the first business day after the subscription period, at a net asset value of $10.00.
2 Calculated based on average shares outstanding.
3 Total returns do not include account service fees that may have applied in the periods shown. Fund prospectuses provide information about any applicable account service fees.
4 Includes 32%, 60%, 81%, and 58%, attributable to mortgage-dollar-roll activity.
5 Annualized.
See accompanying Notes, which are an integral part of the Financial Statements.
43
Core Bond Fund
Financial Highlights
Admiral Shares
| | | | | | | | March 10, | |
| | | | | | | | 20161 to | |
For a Share Outstanding | | Year Ended September 30, | | Sept. 30, | |
Throughout Each Period | | 2019 | | 2018 | | 2017 | | 2016 | |
Net Asset Value, Beginning of Period | | $19.18 | | $20.00 | | $20.53 | | $20.00 | |
Investment Operations | | | | | | | | | |
Net Investment Income | | .651 | 2 | .563 | 2 | .454 | 2 | .205 | |
Net Realized and Unrealized Gain (Loss) on Investments | | 1.290 | | (.800 | ) | (.445 | ) | .528 | |
Total from Investment Operations | | 1.941 | | (.237 | ) | .009 | | .733 | |
Distributions | | | | | | | | | |
Dividends from Net Investment Income | | (.641 | ) | (.583 | ) | (.417 | ) | (.203 | ) |
Distributions from Realized Capital Gains | | — | | — | | (.122 | ) | — | |
Total Distributions | | (.641 | ) | (.583 | ) | (.539 | ) | (.203 | ) |
Net Asset Value, End of Period | | $20.48 | | $19.18 | | $20.00 | | $20.53 | |
| | | | | | | | | |
Total Return3 | | 10.31% | | -1.19% | | 0.10% | | 3.67% | |
| | | | | | | | | |
Ratios/Supplemental Data | | | | | | | | | |
Net Assets, End of Period (Millions) | | $1,114 | | $905 | | $794 | | $578 | |
Ratio of Total Expenses to Average Net Assets | | 0.10% | | 0.13% | | 0.15% | | 0.15%5 | |
Ratio of Net Investment Income to Average Net Assets | | 3.31% | | 2.88% | | 2.28% | | 2.10%5 | |
Portfolio Turnover Rate4 | | 406% | | 263% | | 232% | | 229% | |
1 Subscription period for the fund was March 10, 2016, to March 24, 2016, during which time all assets were held in money market instruments. Performance measurement began March 28, 2016, the first business day after the subscription period, at a net asset value of $20.00.
2 Calculated based on average shares outstanding.
3 Total returns do not include account service fees that may have applied in the periods shown. Fund prospectuses provide information about any applicable account service fees.
4 Includes 32%, 60%, 81%, and 58%, attributable to mortgage-dollar-roll activity.
5 Annualized.
See accompanying Notes, which are an integral part of the Financial Statements.
44
Core Bond Fund
Notes to Financial Statements
Vanguard Core Bond Fund is registered under the Investment Company Act of 1940 as an open-end investment company, or mutual fund. Certain of the fund’s investments are in corporate debt instruments; the issuers’ abilities to meet their obligations may be affected by economic developments in their respective industries. The fund invests in securities of foreign issuers, which may subject it to investment risks not normally associated with investing in securities of U.S. corporations. To minimize the currency risk associated with investment in securities denominated in currencies other than the U.S. dollar, the fund attempts to hedge its currency exposures. The fund offers two classes of shares: Investor Shares and Admiral Shares. Each of the share classes has different eligibility and minimum purchase requirements, and is designed for different types of investors.
A. The following significant accounting policies conform to generally accepted accounting principles for U.S. investment companies. The fund consistently follows such policies in preparing its financial statements.
1. Security Valuation: Securities are valued as of the close of trading on the New York Stock Exchange (generally 4 p.m., Eastern time) on the valuation date. Bonds and temporary cash investments are valued using the latest bid prices or using valuations based on a matrix system (which considers such factors as security prices, yields, maturities, and ratings), both as furnished by independent pricing services. Structured debt securities, including mortgages and asset-backed securities, are valued using the latest bid prices or using valuations based on a matrix system that considers such factors as issuer, tranche, nominal or option-adjusted spreads, weighted average coupon, weighted average maturity, credit enhancements, and collateral. Investments in Vanguard Market Liquidity Fund are valued at that fund’s net asset value. Securities for which market quotations are not readily available, or whose values have been affected by events occurring before the fund’s pricing time but after the close of the securities’ primary markets, are valued at their fair values calculated according to procedures adopted by the board of trustees. These procedures include obtaining quotations from an independent pricing service, monitoring news to identify significant market- or security-specific events, and evaluating changes in the values of foreign market proxies (for example, ADRs, futures contracts, or exchange-traded funds), between the time the foreign markets close and the fund’s pricing time. When fair-value pricing is employed, the prices of securities used by a fund to calculate its net asset value may differ from quoted or published prices for the same securities.
2. Foreign Currency: Securities and other assets and liabilities denominated in foreign currencies are translated into U.S. dollars using exchange rates obtained from an independent third party as of the fund’s pricing time on the valuation date. Realized gains (losses) and unrealized appreciation (depreciation) on investment securities include the effects of changes in exchange rates since the securities were purchased, combined with the effects of changes in security prices. Fluctuations in the value of other assets and liabilities resulting from changes in exchange rates are recorded as unrealized foreign currency gains (losses) until the assets or liabilities are settled in cash, at which time they are recorded as realized foreign currency gains (losses).
3. Futures Contracts: The fund uses futures contracts to invest in fixed income asset classes with greater efficiency and lower cost than is possible through direct investment, to add value when these instruments are attractively priced, or to adjust sensitivity to changes in interest rates. The primary risks associated with the use of futures contracts are imperfect correlation between changes in market values of bonds held by the fund and the prices of futures contracts, and the possibility of an illiquid market. Counterparty risk involving futures is mitigated because a regulated clearinghouse is the counterparty instead of the clearing broker. To further mitigate counterparty
45
Core Bond Fund
risk, the fund trades futures contracts on an exchange, monitors the financial strength of its clearing brokers and clearinghouse, and has entered into clearing agreements with its clearing brokers. The clearinghouse imposes initial margin requirements to secure the fund’s performance and requires daily settlement of variation margin representing changes in the market value of each contract. Any assets pledged as initial margin for open contracts are noted in the Statement of Net Assets.
Futures contracts are valued at their quoted daily settlement prices. The notional amounts of the contracts are not recorded in the Statement of Net Assets. Fluctuations in the value of the contracts are recorded in the Statement of Assets and Liabilities as an asset (liability) and in the Statement of Operations as unrealized appreciation (depreciation) until the contracts are closed, when they are recorded as realized futures gains (losses).
During the year ended September 30, 2019, the fund’s average investments in long and short futures contracts represented 19% and 7% of net assets, respectively, based on the average of the notional amounts at each quarter-end during the period.
4. Forward Currency Contracts: The fund enters into forward currency contracts to protect the value of securities and related receivables and payables against changes in future foreign exchange rates. The fund’s risks in using these contracts include movement in the values of the foreign currencies relative to the U.S. dollar and the ability of the counterparties to fulfill their obligations under the contracts. The fund mitigates its counterparty risk by entering into forward currency contracts only with a diverse group of prequalified counterparties, monitoring their financial strength, entering into master netting arrangements with its counterparties, and requiring its counterparties to transfer collateral as security for their performance. In the absence of a default, the collateral pledged or received by the fund cannot be repledged, resold, or rehypothecated. The master netting arrangements provide that, in the event of a counterparty’s default (including bankruptcy), the fund may terminate the forward currency contracts, determine the net amount owed by either party in accordance with its master netting arrangements, and sell or retain any collateral held up to the net amount owed to the fund under the master netting arrangements. The forward currency contracts contain provisions whereby a counterparty may terminate open contracts if the fund’s net assets decline below a certain level, triggering a payment by the fund if the fund is in a net liability position at the time of the termination. The payment amount would be reduced by any collateral the fund has pledged. Any assets pledged as collateral for open contracts are noted in the Statement of Net Assets. The value of collateral received or pledged is compared daily to the value of the forward currency contracts exposure with each counterparty, and any difference, if in excess of a specified minimum transfer amount, is adjusted and settled within two business days.
Forward currency contracts are valued at their quoted daily prices obtained from an independent third party, adjusted for currency risk based on the expiration date of each contract. The notional amounts of the contracts are not recorded in the Statement of Net Assets. Fluctuations in the value of the contracts are recorded in the Statement of Assets and Liabilities as an asset (liability) and in the Statement of Operations as unrealized appreciation (depreciation) until the contracts are closed, when they are recorded as realized forward currency contract gains (losses).
During the year ended September 30, 2019, the fund’s average investment in forward currency contracts represented 6% of net assets, based on the average of notional amounts at each quarter-end during the period.
46
Core Bond Fund
5. Swap Contracts: The fund invests in credit default swaps to adjust the overall credit risk of the fund or to actively overweight or underweight credit risk to a specific issuer or group of issuers. The fund may sell credit protection through credit default swaps to simulate investments in long positions that are either unavailable or considered to be less attractively priced in the bond market. The fund may purchase credit protection through credit default swaps to reduce credit exposure to a given issuer or issuers. Under the terms of the swaps, an up-front payment may be exchanged between the seller and buyer. In addition, the seller of the credit protection receives a periodic payment of premium from the buyer that is a fixed percentage applied to a notional amount. If, for example, the reference entity is subject to a credit event (such as bankruptcy, failure to pay, or obligation acceleration) during the term of the swap, the seller agrees to either physically settle or cash settle the swap contract. If the swap is physically settled, the seller agrees to pay the buyer an amount equal to the notional amount and take delivery of a debt instrument of the reference issuer with a par amount equal to such notional amount. If the swap is cash settled, the seller agrees to pay the buyer the difference between the notional amount and the final price for the relevant debt instrument, as determined either in a market auction or pursuant to a pre-agreed-upon valuation procedure.
The fund enters into interest rate swap transactions to adjust the fund’s sensitivity to changes in interest rates and maintain the ability to generate income at prevailing market rates. Under the terms of the swaps, one party pays the other an amount that is a fixed percentage rate applied to a notional amount. In return, the counterparty agrees to pay a floating rate, which is reset periodically based on short-term interest rates, applied to the same notional amount.
The notional amounts of swap contracts are not recorded in the Statement of Net Assets. Swaps are valued daily based on market quotations received from independent pricing services or recognized dealers and the change in value is recorded in the Statement of Assets and Liabilities as an asset (liability) and in the Statement of Operations as unrealized appreciation (depreciation) until the seller of credit protection is required to take delivery (or, in a cash settled swap, pay the settlement amount determined) upon occurrence of a credit event, periodic payments are made, or the swap terminates, at which time realized gain (loss) is recorded. The net premium to be received or paid by the fund under swap contracts is accrued daily and recorded as realized gain (loss) over the life of the contract.
The primary risk associated with selling credit protection is that, upon the occurrence of a defined credit event, the market value of the debt instrument received by the fund (or, in a cash settled swap, the debt instruments used to determine the settlement payment by the fund) will be significantly less than the amount paid by the fund and, in a physically settled swap, the fund may receive an illiquid debt instrument. A risk associated with all types of swaps is the possibility that a counterparty may default on its obligation to pay net amounts due to the fund. The fund’s maximum amount subject to counterparty risk is the unrealized appreciation on the swap contract. The fund mitigates its counterparty risk by entering into swaps only with a diverse group of prequalified counterparties, monitoring their financial strength, entering into master netting arrangements with its counterparties, and requiring its counterparties to transfer collateral as security for their performance. In the absence of a default, the collateral pledged or received by the fund cannot be repledged, resold, or rehypothecated. In the event of a counterparty’s default (including bankruptcy), the fund may terminate any swap contracts with that counterparty, determine the net amount owed by either party in accordance with its master netting arrangements, and sell or retain any collateral held up to the net amount owed to the fund under the master netting arrangements. The swap contracts contain provisions whereby a counterparty may terminate open contracts if the fund’s net assets decline below a certain level, triggering a payment by the fund if the fund is in a
47
Core Bond Fund
net liability position at the time of the termination. The payment amount would be reduced by any collateral the fund has pledged. Any securities pledged as collateral for open contracts are noted in the Statement of Net Assets. The value of collateral received or pledged is compared daily to the value of the swap contracts exposure with each counterparty, and any difference, if in excess of a specified minimum transfer amount, is adjusted and settled within two business days.
The fund enters into centrally cleared interest rate and credit default swaps to achieve the same objectives specified with respect to the equivalent over-the-counter swaps but with less counterparty risk because a regulated clearinghouse is the counterparty instead of the clearing broker or executing broker. The clearinghouse imposes initial margin requirements to secure the fund’s performance, and requires daily settlement of variation margin representing changes in the market value of each contract. To further mitigate counterparty risk, the fund trades with a diverse group of prequalified executing brokers; monitors the financial strength of its clearing brokers, executing brokers, and clearinghouse; and has entered into agreements with its clearing brokers and executing brokers.
During the year ended September 30, 2019, the fund’s average amounts of investments in credit protection sold and credit protection purchased represented 1% and 8% of net assets, respectively, based on the average of notional amounts at each quarter-end during the period. The average amount of investments in interest rate swaps represented 1% of net assets, based on the average of notional amounts at each quarter-end during the period.
6. Options: The fund invests in options contracts on futures and swaps to adjust its exposure to the underlying investments. The primary risk associated with purchasing options is that the value of the underlying investments may move in such a way that the option is out-of-the-money (the exercise price of the option exceeds the value of the underlying investment), the position is worthless at expiration, and the fund loses the premium paid. The primary risk associated with selling options is that the value of the underlying investments may move in such a way that the option is in-the-money (the exercise price of the option exceeds the value of the underlying investment), the counterparty exercises the option, and the fund loses an amount equal to the market value of the option written less the premium received.
The fund invests in options on futures, which are exchange-traded. Counterparty risk involving exchange-traded options on futures is mitigated because a regulated clearinghouse is the counterparty instead of the clearing broker. To further mitigate counterparty risk, the fund trades options on futures on an exchange, monitors the financial strength of its clearing brokers and clearinghouses, and has entered into clearing agreements with its clearing brokers.
The fund invests in options on swaps (swaptions), which are transacted over-the-counter (OTC) and not on an exchange. A receiver swaption gives the owner the right to receive the total return of a specified asset, reference rate, or index. A payer swaption gives the owner the right to pay the total return of a specified asset, reference rate, or index. Swaptions also include options that allow an existing swap to be terminated or extended by one of the counterparties. Unlike exchange-traded options, which are standardized with respect to the underlying instrument, expiration date, contract size, and strike price, the terms of OTC options generally are established through negotiation with the other party to the option contract. Although this type of arrangement allows the purchaser or writer greater flexibility to tailor an option to its needs, OTC options generally involve greater credit risk than exchange-traded options. Credit risk involves the possibility that a counterparty may default on its obligation to pay net amounts due to the fund. The fund mitigates its counterparty risk by entering into swaptions with a diverse group of prequalified counterparties and monitoring their financial strength.
48
Core Bond Fund
Options on futures contracts are valued at their quoted daily settlement prices. Swaptions are valued daily based on market quotations received from independent pricing services or recognized dealers. The premium paid for a purchased option is recorded in the Statement of Assets and Liabilities as an asset that is subsequently adjusted daily to the current market value of the option purchased. The premium received for a written option is recorded in the Statement of Assets and Liabilities as an asset with an equal liability that is subsequently adjusted daily to the current market value of the option written. Fluctuations in the value of the options are recorded in the Statement of Operations as unrealized appreciation (depreciation) until expired, closed, or exercised, at which time realized gains (losses) are recognized.
During the year ended September 30, 2019, the fund’s average value of investments in options purchased and options written each represented less than 1% of net assets, based on the average market values at each quarter-end during the period.
7. To Be Announced (TBA) Transactions: A TBA transaction is an agreement to buy or sell mortgage-backed securities with agreed-upon characteristics (face amount, coupon, maturity) for settlement at a future date. The fund may be a seller of TBA transactions to reduce its exposure to the mortgage-backed securities market or in order to sell mortgage-backed securities it owns under delayed-delivery arrangements. When the fund is a buyer of TBA transactions, it maintains cash or short-term investments in an amount sufficient to meet the purchase price at the settlement date of the TBA transaction. The primary risk associated with TBA transactions is that a counterparty may default on its obligations. The fund mitigates its counterparty risk by, among other things, performing a credit analysis of counterparties, allocating transactions among numerous counterparties, and monitoring its exposure to each counterparty. The fund may also enter into a Master Securities Forward Transaction Agreement (MSFTA) with certain counterparties and require them to transfer collateral as security for their performance. In the absence of a default, the collateral pledged or received by the fund cannot be repledged, resold, or rehypothecated. Under an MSFTA, upon a counterparty default (including bankruptcy), the fund may terminate any TBA transactions with that counterparty, determine the net amount owed by either party in accordance with its master netting arrangements, and sell or retain any collateral held up to the net amount owed to the fund under the master netting arrangements.
8. Mortgage Dollar Rolls: The fund enters into mortgage-dollar-roll transactions, in which the fund sells mortgage-backed securities to a dealer and simultaneously agrees to purchase similar securities in the future at a predetermined price. The proceeds of the securities sold in mortgage-dollar-roll transactions are typically invested in high-quality short-term fixed income securities. The fund forgoes principal and interest paid on the securities sold, and is compensated by interest earned on the proceeds of the sale and by a lower price on the securities to be repurchased. The fund has also entered into mortgage-dollar-roll transactions in which the fund buys mortgage-backed securities from a dealer pursuant to a TBA transaction and simultaneously agrees to sell similar securities in the future at a predetermined price. The securities bought in mortgage-dollar-roll transactions are used to cover an open TBA sell position. The fund continues to earn interest on mortgage-backed security pools already held and receives a lower price on the securities to be sold in the future. The fund accounts for mortgage-dollar-roll transactions as purchases and sales; as such, these transactions may increase the fund’s portfolio turnover rate. Amounts to be received or paid in connection with open mortgage dollar rolls are included in Receivables for Investment Securities Sold or Payables for Investment Securities Purchased in the Statement of Assets and Liabilities.
49
Core Bond Fund
9. Federal Income Taxes: The fund intends to continue to qualify as a regulated investment company and distribute all of its taxable income. Management has analyzed the fund’s tax positions taken for all open federal income tax years (September 30, 2016–2019), and has concluded that no provision for federal income tax is required in the fund’s financial statements.
10. Distributions: Distributions to shareholders are recorded on the ex-dividend date. Distributions are determined on a tax basis and may differ from net investment income and realized capital gains for financial reporting purposes.
11. Credit Facility: The fund and certain other funds managed by The Vanguard Group (“Vanguard”) participate in a $4.3 billion committed credit facility provided by a syndicate of lenders pursuant to a credit agreement that may be renewed annually; each fund is individually liable for its borrowings, if any, under the credit facility. Borrowings may be utilized for temporary and emergency purposes, and are subject to the fund’s regulatory and contractual borrowing restrictions. The participating funds are charged administrative fees and an annual commitment fee of 0.10% of the undrawn amount of the facility; these fees are allocated to the funds based on a method approved by the fund’s board of trustees and included in Management and Administrative expenses on the fund’s Statement of Operations. Any borrowings under this facility bear interest at a rate based upon the higher of the one-month London Interbank Offered Rate, federal funds effective rate, or overnight bank funding rate plus an agreed-upon spread.
The fund had no borrowings outstanding at September 30, 2019, or at any time during the period then ended.
12. Other: Interest income includes income distributions received from Vanguard Market Liquidity Fund and is accrued daily. Premiums and discounts on debt securities purchased are amortized and accreted, respectively, to interest income over the lives of the respective securities. Security transactions are accounted for on the date securities are bought or sold. Costs used to determine realized gains (losses) on the sale of investment securities are those of the specific securities sold.
Each class of shares has equal rights as to assets and earnings, except that each class separately bears certain class-specific expenses related to maintenance of shareholder accounts (included in Management and Administrative expenses) and shareholder reporting. Marketing and distribution expenses are allocated to each class of shares based on a method approved by the board of trustees. Income, other non-class-specific expenses, and gains and losses on investments are allocated to each class of shares based on its relative net assets.
B. In accordance with the terms of a Funds’ Service Agreement (the “FSA”) between Vanguard and the fund, Vanguard furnishes to the fund investment advisory, corporate management, administrative, marketing, and distribution services at Vanguard’s cost of operations (as defined by the FSA). These costs of operations are allocated to the fund based on methods and guidelines approved by the board of trustees. Vanguard does not require reimbursement in the current period for certain costs of operations (such as deferred compensation/benefits and risk/insurance costs); the fund’s liability for these costs of operations is included in Payables to Vanguard on the Statement of Assets and Liabilities. All other costs of operations payable to Vanguard are generally settled twice a month.
50
Core Bond Fund
Upon the request of Vanguard, the fund may invest up to 0.40% of its net assets as capital in Vanguard. At September 30, 2019, the fund had contributed to Vanguard capital in the amount of $58,000, representing less than 0.01% of the fund’s net assets and 0.02% of Vanguard’s capital received pursuant to the FSA. The fund’s trustees and officers are also directors and employees, respectively, of Vanguard.
C. Various inputs may be used to determine the value of the fund’s investments. These inputs are summarized in three broad levels for financial statement purposes. The inputs or methodologies used to value securities are not necessarily an indication of the risk associated with investing in those securities.
Level 1—Quoted prices in active markets for identical securities.
Level 2—Other significant observable inputs (including quoted prices for similar securities, interest rates, prepayment speeds, credit risk, etc.).
Level 3—Significant unobservable inputs (including the fund’s own assumptions used to determine the fair value of investments). Any investments valued with significant unobservable inputs are noted on the Statement of Net Assets.
The following table summarizes the market value of the fund’s investments and derivatives as of September 30, 2019, based on the inputs used to value them:
| | Level 1 | | Level 2 | | Level 3 | |
Investments | | ($000 | ) | ($000 | ) | ($000 | ) |
U.S. Government and Agency Obligations | | — | | 593,835 | | — | |
Asset-Backed/Commercial Mortgage-Backed Securities | | — | | 102,534 | | — | |
Corporate Bonds | | — | | 370,389 | | — | |
Sovereign Bonds | | — | | 114,402 | | — | |
Taxable Municipal Bonds | | — | | 2,394 | | — | |
Temporary Cash Investments | | 37,225 | | — | | — | |
Options Purchased | | — | | 164 | | — | |
Conventional Mortgage-Backed Securities- | | | | | | | |
Liability for Sale Commitments | | — | | (30,295 | ) | — | |
Options Written | | (74 | ) | (442 | ) | — | |
Futures Contracts—Assets1 | | 57 | | — | | — | |
Futures Contracts—Liabilities1 | | (76 | ) | — | | — | |
Forward Currency Contracts—Assets | | — | | 151 | | — | |
Swap Contracts—Assets | | — | 1 | 79 | | — | |
Swap Contracts—Liabilities | | (128 | )1 | (94 | ) | — | |
Total | | 37,004 | | 1,153,117 | | — | |
1 Represents variation margin on the last day of the reporting period.
51
Core Bond Fund
D. At September 30, 2019, the fair values of derivatives were reflected in the Statement of Assets and Liabilities as follows:
| | Interest Rate | | Currency | | Credit | | | |
| | Contracts | | Contracts | | Contracts | | Total | |
Statement of Assets and Liabilities Caption | | ($000 | ) | ($000 | ) | ($000 | ) | ($000 | ) |
Options Purchased | | 111 | | — | | 53 | | 164 | |
Variation Margin Receivable—Futures Contracts | | 57 | | — | | — | | 57 | |
Variation Margin Receivable—CC Swap Contracts | | — | | — | | — | | — | |
Unrealized Appreciation—Forward Currency Contracts | | — | | 151 | | — | | 151 | |
Unrealized Appreciation—OTC Swap Contracts | | — | | — | | 79 | | 79 | |
Total Assets | | 168 | | 151 | | 132 | | 451 | |
| | | | | | | | | |
Options Written | | (274 | ) | — | | (242 | ) | (516 | ) |
Variation Margin Payable—Futures Contracts | | (76 | ) | — | | — | | (76 | ) |
Variation Margin Payable—CC Swap Contracts | | (1 | ) | — | | (127 | ) | (128 | ) |
Unrealized Depreciation—OTC Swap Contracts | | — | | — | | (94 | ) | (94 | ) |
Total Liabilities | | (351 | ) | — | | (463 | ) | (814 | ) |
Realized net gain (loss) and the change in unrealized appreciation (depreciation) on derivatives for the year ended September 30, 2019, were:
| | Interest Rate | | Currency | | Credit | | | |
| | Contracts | | Contracts | | Contracts | | Total | |
Realized Net Gain (Loss) on Derivatives | | ($000 | ) | ($000 | ) | ($000 | ) | ($000 | ) |
Futures Contracts | | (3,640 | ) | — | | — | | (3,640 | ) |
Options Purchased | | (84 | ) | — | | (15 | ) | (99 | ) |
Options Written | | 579 | | — | | 123 | | 702 | |
Swap Contracts | | (755 | ) | — | | (2,567 | ) | (3,322 | ) |
Forward Currency Contracts | | — | | 3,958 | | — | | 3,958 | |
Realized Net Gain (Loss) on Derivatives | | (3,900 | ) | 3,958 | | (2,459 | ) | (2,401 | ) |
| | | | | | | | | |
Change in Unrealized Appreciation (Depreciation) on Derivatives | | | | | | | |
Futures Contracts | | 3,615 | | — | | — | | 3,615 | |
Options Purchased | | (49 | ) | — | | (63 | ) | (112 | ) |
Options Written | | 12 | | — | | 123 | | 135 | |
Swap Contracts | | 28 | | — | | 208 | | 236 | |
Forward Currency Contracts | | — | | (267 | ) | — | | (267 | ) |
Change in Unrealized Appreciation (Depreciation) on Derivatives | | 3,606 | | (267 | ) | 268 | | 3,607 | |
52
Core Bond Fund
E. Permanent differences between book-basis and tax-basis components of net assets are reclassified among capital accounts in the financial statements to reflect their tax character. These reclassifications have no effect on net assets or net asset value per share. As of period end, permanent differences primarily attributable to the accounting for foreign currency transactions and swap agreements were reclassified between the individual components of total distributable earnings (loss).
| | Amount | |
| | ($000 | ) |
Paid-in Capital | | — | |
Total Distributable Earnings (Loss) | | — | |
Temporary differences between book-basis and tax-basis components of total distributable earnings (loss) arise when certain items of income, gain, or loss are recognized in different periods for financial statement and tax purposes; these differences will reverse at some time in the future. The differences are primarily related to the tax deferral of losses on wash sales and straddles; the realization of unrealized gains or losses on certain futures contracts, forward currency contracts, and options; payables for distributions; and the tax recognition of gain or loss from foreign currency hedges. As of period end, the tax-basis components of total distributable earnings (loss) are detailed in the table as follows:
| | Amount | |
| | ($000 | ) |
Undistributed Ordinary Income | | 1,139 | |
Undistributed Long-Term Gains | | — | |
Capital Loss Carryforwards (Non-expiring)* | | (12,750 | ) |
Net Unrealized Gains (Losses) | | 38,657 | |
* The fund used capital loss carryforwards of $9,775,000 to offset taxable capital gains realized during the year ended September 30, 2019.
As of September 30, 2019, gross unrealized appreciation and depreciation for investments, derivatives, and sale commitments based on cost for U.S. federal income tax purposes were as follows:
| | Amount | |
| | ($000 | ) |
Tax Cost | | 1,182,094 | |
Gross Unrealized Appreciation | | 44,014 | |
Gross Unrealized Depreciation | | (5,355 | ) |
Net Unrealized Appreciation (Depreciation) | | 38,659 | |
53
Core Bond Fund
F. During the year ended September 30, 2019, the fund purchased $1,183,919,000 of investment securities and sold $1,092,212,000 of investment securities, other than U.S. government securities and temporary cash investments. Purchases and sales of U.S. government securities were $3,040,115,000 and $2,949,815,000, respectively.
G. Capital share transactions for each class of shares were:
| | Year Ended September 30, | |
| | | | 2019 | | | | 2018 | |
| | Amount | | Shares | | Amount | | Shares | |
| | ($000 | ) | (000 | ) | ($000 | ) | (000 | ) |
Investor Shares | | | | | | | | | |
Issued | | 67,150 | | 6,786 | | 51,084 | | 5,197 | |
Issued in Lieu of Cash Distributions | | 2,518 | | 255 | | 2,243 | | 230 | |
Redeemed | | (39,043 | ) | (3,977 | ) | (60,352 | ) | (6,161 | ) |
Net Increase (Decrease)—Investor Shares | | 30,625 | | 3,064 | | (7,025 | ) | (734 | ) |
Admiral Shares | | | | | | | | | |
Issued | | 597,329 | | 30,357 | | 414,173 | | 21,169 | |
Issued in Lieu of Cash Distributions | | 25,663 | | 1,304 | | 21,820 | | 1,120 | |
Redeemed | | (478,598 | ) | (24,458 | ) | (288,396 | ) | (14,775 | ) |
Net Increase (Decrease)—Admiral Shares | | 144,394 | | 7,203 | | 147,597 | | 7,514 | |
H. Management has determined that no events or transactions occurred subsequent to September 30, 2019, that would require recognition or disclosure in these financial statements.
54
Report of Independent Registered Public Accounting Firm
To the Board of Trustees of Vanguard Malvern Funds and Shareholders of Vanguard Core Bond Fund
Opinion on the Financial Statements
We have audited the accompanying statement of net assets and statement of assets and liabilities of Vanguard Core Bond Fund (one of the funds constituting Vanguard Malvern Funds, referred to hereafter as the “Fund”) as of September 30, 2019, the related statement of operations for the year ended September 30, 2019, the statement of changes in net assets for each of the two years in the period ended September 30, 2019, including the related notes, and the financial highlights for each of the periods indicated therein (collectively referred to as the “financial statements”). In our opinion, the financial statements present fairly, in all material respects, the financial position of the Fund as of September 30, 2019, the results of its operations for the year then ended, the changes in its net assets for each of the two years in the period ended September 30, 2019 and the financial highlights for each of the periods indicated therein in conformity with accounting principles generally accepted in the United States of America.
Basis for Opinion
These financial statements are the responsibility of the Fund’s management. Our responsibility is to express an opinion on the Fund’s financial statements based on our audits. We are a public accounting firm registered with the Public Company Accounting Oversight Board (United States) (“PCAOB”) and are required to be independent with respect to the Fund in accordance with the U.S. federal securities laws and the applicable rules and regulations of the Securities and Exchange Commission and the PCAOB.
We conducted our audits of these financial statements in accordance with the standards of the PCAOB. Those standards require that we plan and perform the audit to obtain reasonable assurance about whether the financial statements are free of material misstatement, whether due to error or fraud.
Our audits included performing procedures to assess the risks of material misstatement of the financial statements, whether due to error or fraud, and performing procedures that respond to those risks. Such procedures included examining, on a test basis, evidence regarding the amounts and disclosures in the financial statements. Our audits also included evaluating the accounting principles used and significant estimates made by management, as well as evaluating the overall presentation of the financial statements. Our procedures included confirmation of securities owned as of September 30, 2019 by correspondence with the custodian, transfer agent and brokers; when replies were not received from brokers, we performed other auditing procedures. We believe that our audits provide a reasonable basis for our opinion.
/s/PricewaterhouseCoopers LLP
Philadelphia, Pennsylvania
November 19, 2019
We have served as the auditor of one or more investment companies in The Vanguard Group of Funds since 1975.
55
Special 2019 tax information (unaudited) for Vanguard Core Bond Fund
This information for the fiscal year ended September 30, 2019, is included pursuant to provisions of the Internal Revenue Code.
For nonresident alien shareholders, 84.5% of income dividends are interest-related dividends.
56
BLOOMBERG is a trademark and service mark of Bloomberg Finance L.P. BARCLAYS is a trademark and service mark of Barclays Bank Plc, used under license. Bloomberg Finance L.P. and its affiliates, including Bloomberg Index Services Limited (BISL) (collectively, Bloomberg), or Bloomberg’s licensors, own all proprietary rights in the Bloomberg Barclays U.S. Aggregate Float Adjusted Index (Index or Bloomberg Barclays Index).
Neither Barclays Bank Plc, Barclays Capital Inc., or any affiliate (collectively Barclays) or Bloomberg is the issuer or producer of the Core Bond Fund and neither Bloomberg nor Barclays has any responsibilities, obligations or duties to investors in the Core Bond Fund. The Index is licensed for use by The Vanguard Group, Inc. (Vanguard) as the sponsor of the Core Bond Fund. Bloomberg and Barclays’ only relationship with Vanguard in respect of the Index is the licensing of the Index, which is determined, composed and calculated by BISL, or any successor thereto, without regard to the Issuer or the Core Bond Fund or the owners of the Core Bond Fund.
Additionally, Vanguard may for itself execute transaction(s) with Barclays in or relating to the Index in connection with the Core Bond Fund. Investors acquire the Core Bond Fund from Vanguard and investors neither acquire any interest in the Index nor enter into any relationship of any kind whatsoever with Bloomberg or Barclays upon making an investment in the Core Bond Fund. The Core Bond Fund is not sponsored, endorsed, sold or promoted by Bloomberg or Barclays. Neither Bloomberg nor Barclays makes any representation or warranty, express or implied regarding the advisability of investing in the Core Bond Fund or the advisability of investing in securities generally or the ability of the Index to track corresponding or relative market performance. Neither Bloomberg nor Barclays has passed on the legality or suitability of the Core Bond Fund with respect to any person or entity. Neither Bloomberg nor Barclays is responsible for and has not participated in the determination of the timing of, prices at, or quantities of the Core Bond Fund to be issued. Neither Bloomberg nor Barclays has any obligation to take the needs of the Issuer or the owners of the Core Bond Fund or any other third party into consideration in determining, composing or calculating the Index. Neither Bloomberg nor Barclays has any obligation or liability in connection with administration, marketing or trading of the Core Bond Fund.
The licensing agreement between Bloomberg and Barclays is solely for the benefit of Bloomberg and Barclays and not for the benefit of the owners of the Core Bond Fund, investors or other third parties. In addition, the licensing agreement between Vanguard and Bloomberg is solely for the benefit of Vanguard and Bloomberg and not for the benefit of the owners of the Core Bond Fund, investors or other third parties.
NEITHER BLOOMBERG NOR BARCLAYS SHALL HAVE ANY LIABILITY TO THE ISSUER, INVESTORS OR TO OTHER THIRD PARTIES FOR THE QUALITY, ACCURACY AND/OR COMPLETENESS OF THE BLOOMBERG BARCLAYS INDEX OR ANY DATA INCLUDED THEREIN OR FOR INTERRUPTIONS IN THE DELIVERY OF THE BLOOMBERG BARCLAYS INDEX. NEITHER BLOOMBERG NOR BARCLAYS MAKES ANY WARRANTY, EXPRESS OR IMPLIED, AS TO RESULTS TO BE OBTAINED BY THE ISSUER, THE INVESTORS OR ANY OTHER PERSON OR ENTITY FROM THE USE OF THE BLOOMBERG BARCLAYS INDEX OR ANY DATA INCLUDED THEREIN. NEITHER BLOOMBERG NOR BARCLAYS MAKES ANY EXPRESS OR IMPLIED WARRANTIES, AND EACH HEREBY EXPRESSLY DISCLAIMS ALL WARRANTIES OF MERCHANTABILITY OR FITNESS FOR A PARTICULAR PURPOSE OR USE WITH RESPECT TO THE BLOOMBERG BARCLAYS INDEX OR ANY DATA INCLUDED THEREIN. BLOOMBERG RESERVES THE RIGHT TO CHANGE THE METHODS OF CALCULATION OR PUBLICATION, OR TO CEASE THE CALCULATION OR PUBLICATION OF THE BLOOMBERG BARCLAYS INDEX, AND NEITHER BLOOMBERG NOR BARCLAYS SHALL BE LIABLE FOR ANY MISCALCULATION OF OR ANY INCORRECT, DELAYED OR INTERRUPTED PUBLICATION WITH RESPECT TO THE BLOOMBERG BARCLAYS INDEX. NEITHER BLOOMBERG NOR BARCLAYS SHALL BE LIABLE FOR ANY DAMAGES, INCLUDING, WITHOUT LIMITATION, ANY SPECIAL, INDIRECT OR CONSEQUENTIAL DAMAGES, OR ANY LOST PROFITS AND EVEN IF ADVISED OF THE POSSIBILITY OF SUCH, RESULTING FROM THE USE OF THE BLOOMBERG BARCLAYS INDEX OR ANY DATA INCLUDED THEREIN OR WITH RESPECT TO THE CORE BOND FUND.
None of the information supplied by Bloomberg or Barclays and used in this publication may be reproduced in any manner without the prior written permission of both Bloomberg and Barclays Capital, the investment banking division of Barclays Bank Plc. Barclays Bank Plc is registered in England No. 1026167. Registered office 1 Churchill Place London E14 5HP.
© 2019 Bloomberg. Used with Permission.
Source: Bloomberg Index Services Limited. Copyright 2019, Bloomberg. All rights reserved.
57
This page intentionally left blank.
The People Who Govern Your Fund
The trustees of your mutual fund are there to see that the fund is operated and managed in your best interests since, as a shareholder, you are a part owner of the fund. Your fund’s trustees also serve on the board of directors of The Vanguard Group, Inc., which is owned by the Vanguard funds and provides services to them.
A majority of Vanguard’s board members are independent, meaning that they have no affiliation with Vanguard or the funds they oversee, apart from the sizable personal investments they have made as private individuals. The independent board members have distinguished backgrounds in business, academia, and public service. Each of the trustees and executive officers oversees 212 Vanguard funds.
Information for each trustee and executive officer of the fund appears below. That information, as well as the Vanguard fund count, is as of the date on the cover of this fund report. The mailing address of the trustees and officers is P.O. Box 876, Valley Forge, PA 19482. More information about the trustees is in the Statement of Additional Information, which can be obtained, without charge, by contacting Vanguard at 800-662-7447, or online at vanguard.com.
Interested Trustee1
Mortimer J. Buckley
Born in 1969. Trustee since January 2018. Principal occupation(s) during the past five years and other experience: chairman of the board (January 2019–present) of Vanguard and of each of the investment companies served by Vanguard; chief executive officer (January 2018–present) of Vanguard; chief executive officer, president, and trustee (January 2018–present) of each of the investment companies served by Vanguard; president and director (2017–present) of Vanguard; and president (February 2018–present) of Vanguard Marketing Corporation. Chief investment officer (2013–2017), managing director (2002–2017), head of the Retail Investor Group (2006–2012), and chief information officer (2001–2006) of Vanguard. Chairman of the board (2011–2017) and trustee (2009–2017) of the Children’s Hospital of Philadelphia; trustee (2018–present) of The Shipley School.
Independent Trustees
Emerson U. Fullwood
Born in 1948. Trustee since January 2008. Principal occupation(s) during the past five years and other experience: executive chief staff and marketing officer for North America and corporate vice president (retired 2008) of Xerox Corporation (document management products and services). Former president of the Worldwide Channels Group, Latin America, and Worldwide Customer Service and executive chief staff officer of Developing Markets of Xerox. Executive in residence and 2009–2010 Distinguished Minett Professor at the Rochester Institute of Technology. Director of SPX FLOW, Inc. (multi-industry manufacturing). Director of the University of Rochester Medical Center, the Monroe Community College Foundation, the United Way of Rochester, North Carolina A&T University, and Roberts Wesleyan College. Trustee of the University of Rochester.
Amy Gutmann
Born in 1949. Trustee since June 2006. Principal occupation(s) during the past five years and other experience: president (2004–present) of the University of Pennsylvania. Christopher H. Browne Distinguished Professor of Political Science, School of Arts and Sciences, and professor of communication, Annenberg School for Communication, with secondary faculty appointments in the Department of Philosophy, School of Arts and Sciences, and at the Graduate School of Education, University of Pennsylvania. Trustee of the National Constitution Center.
F. Joseph Loughrey
Born in 1949. Trustee since October 2009. Principal occupation(s) during the past five years and other experience: president and chief operating officer (retired 2009) and vice chairman of the board (2008–2009) of Cummins Inc. (industrial machinery). Chairman of the board of Hillenbrand, Inc. (specialized consumer services), and the Lumina Foundation.
1 Mr. Buckley is considered an “interested person,” as defined in the Investment Company Act of 1940, because he is an officer of the Vanguard funds.
Director of the V Foundation and Oxfam America. Member of the advisory council for the College of Arts and Letters and chair of the advisory board to the Kellogg Institute for International Studies, both at the University of Notre Dame.
Mark Loughridge
Born in 1953. Trustee since March 2012. Principal occupation(s) during the past five years and other experience: senior vice president and chief financial officer (retired 2013) of IBM (information technology services). Fiduciary member of IBM’s Retirement Plan Committee (2004–2013), senior vice president and general manager (2002–2004) of IBM Global Financing, vice president and controller (1998–2002) of IBM, and a variety of other prior management roles at IBM. Member of the Council on Chicago Booth.
Scott C. Malpass
Born in 1962. Trustee since March 2012. Principal occupation(s) during the past five years and other experience: chief investment officer (1989–present) and vice president (1996–present) of the University of Notre Dame. Assistant professor of finance at the Mendoza College of Business, University of Notre Dame, and member of the Notre Dame 403(b) Investment Committee. Chairman of the board of TIFF Advisory Services, Inc. Member of the board of Catholic Investment Services, Inc. (investment advisors) and the board of superintendence of the Institute for the Works of Religion.
Deanna Mulligan
Born in 1963. Trustee since January 2018. Principal occupation(s) during the past five years and other experience: president (2010–present) and chief executive officer (2011–present) of The Guardian Life Insurance Company of America. Chief operating officer (2010–2011) and executive vice president (2008–2010) of Individual Life and Disability of The Guardian Life Insurance Company of America. Member of the board of The Guardian Life Insurance Company of America, the American Council of Life Insurers, the Partnership for New York City (business leadership), and the Committee Encouraging Corporate Philanthropy. Trustee of the Economic Club of New York and the Bruce Museum (arts and science). Member of the Advisory Council for the Stanford Graduate School of Business.
André F. Perold
Born in 1952. Trustee since December 2004. Principal occupation(s) during the past five years and other experience: George Gund Professor of Finance and Banking, Emeritus at the Harvard Business School (retired 2011). Chief investment officer and co-managing partner of HighVista Strategies LLC (private investment firm). Board of advisors and investment committee member of the Museum of Fine Arts Boston. Board member (2018–present) of RIT Capital Partners (investment firm); investment committee member of Partners Health Care System.
Sarah Bloom Raskin
Born in 1961. Trustee since January 2018. Principal occupation(s) during the past five years and other experience: deputy secretary (2014–2017) of the United States Department of the Treasury. Governor (2010–2014) of the Federal Reserve Board. Commissioner (2007–2010) of financial regulation for the State of Maryland. Member of the board of directors (2012–2014) of Neighborhood Reinvestment Corporation. Director (2017–present) of i(x) Investments, LLC; director (2017–present) of Reserve Trust. Rubinstein Fellow (2017–present) of Duke University; trustee (2017–present) of Amherst College.
Peter F. Volanakis
Born in 1955. Trustee since July 2009. Principal occupation(s) during the past five years and other experience: president and chief operating officer (retired 2010) of Corning Incorporated (communications equipment) and director of Corning Incorporated (2000–2010) and Dow Corning (2001–2010). Director (2012) of SPX Corporation (multi-industry manufacturing). Overseer of the Amos Tuck School of Business Administration, Dartmouth College (2001–2013). Chairman of the board of trustees of Colby-Sawyer College. Member of the board of Hypertherm Inc. (industrial cutting systems, software, and consumables).
Executive Officers
Glenn Booraem
Born in 1967. Principal occupation(s) during the past five years and other experience: principal of Vanguard. Investment stewardship officer (2017–present), treasurer (2015–2017), controller (2010–2015), and assistant controller (2001–2010) of each of the investment companies served by Vanguard.
Christine M. Buchanan
Born in 1970. Principal occupation(s) during the past five years and other experience: principal of Vanguard and global head of Fund Administration at Vanguard. Treasurer (2017–present) of each of the investment companies served by Vanguard. Partner (2005–2017) at KPMG LLP (audit, tax, and advisory services).
Thomas J. Higgins
Born in 1957. Principal occupation(s) during the past five years and other experience: principal of Vanguard. Chief financial officer (2008–present) and treasurer (1998–2008) of each of the investment companies served by Vanguard.
Peter Mahoney
Born in 1974. Principal occupation(s) during the past five years and other experience: principal of Vanguard. Controller (2015–present) of each of the investment companies served by Vanguard. Head of International Fund Services (2008–2014) at Vanguard.
Anne E. Robinson
Born in 1970. Principal occupation(s) during the past five years and other experience: general counsel (2016–present) of Vanguard. Secretary (2016–present) of Vanguard and of each of the investment companies served by Vanguard. Managing director (2016–present) of Vanguard. Director and senior vice president (2016–2018) of Vanguard Marketing Corporation. Managing director and general counsel of Global Cards and Consumer Services (2014–2016) at Citigroup. Counsel (2003–2014) at American Express.
Michael Rollings
Born in 1963. Principal occupation(s) during the past five years and other experience: finance director (2017–present) and treasurer (2017) of each of the investment companies served by Vanguard. Managing director (2016–present) of Vanguard. Chief financial officer (2016–present) of Vanguard. Director (2016–present) of Vanguard Marketing Corporation. Executive vice president and chief financial officer (2006–2016) of MassMutual Financial Group.
John E. Schadl
Born in 1972. Principal occupation(s) during the past five years and other experience: principal of Vanguard. Chief compliance officer (2019–present) of Vanguard and of each of the investment companies served by Vanguard. Assistant vice president (May 2019–present) of Vanguard Marketing Corporation.
Vanguard Senior Management Team
Joseph Brennan | Chris D. McIsaac |
Mortimer J. Buckley | James M. Norris |
Gregory Davis | Thomas M. Rampulla |
John James | Karin A. Risi |
Martha G. King | Anne E. Robinson |
John T. Marcante | Michael Rollings |
| | 
|
| | |
| | P.O. Box 2600 |
| | Valley Forge, PA 19482-2600 |
Connect with Vanguard® > vanguard.com
Fund Information > 800-662-7447 | |
Direct Investor Account Services > 800-662-2739
Institutional Investor Services > 800-523-1036
Text Telephone for People
Who Are Deaf or Hard of Hearing > 800-749-7273
This material may be used in conjunction with the offering of shares of any Vanguard fund only if preceded or accompanied by the fund’s current prospectus.
All comparative mutual fund data are from Morningstar, Inc., unless otherwise noted.
You can obtain a free copy of Vanguard’s proxy voting guidelines by visiting vanguard.com/proxyreporting or by calling Vanguard at 800-662-2739. The guidelines are also available from the SEC’s website, www.sec.gov. In addition, you may obtain a free report on how your fund voted the proxies for securities it owned during the 12 months ended June 30. To get the report, visit either vanguard.com/proxyreporting or www.sec.gov.
You can review information about your fund on the SEC’s website, and you can receive copies of this information, for a fee, by sending a request via email addressed to publicinfo@sec.gov.
CFA® is a registered trademark owned by CFA Institute.
| | © 2019 The Vanguard Group, Inc. |
| | All rights reserved. |
| | Vanguard Marketing Corporation, Distributor. |
| | |
| | Q13200 112019 |

Annual Report | September 30, 2019 Vanguard Emerging Markets Bond Fund |
See the inside front cover for important information about access to your fund’s annual and semiannual shareholder reports. |
Important information about access to shareholder reports
Beginning on January 1, 2021, as permitted by regulations adopted by the Securities and Exchange Commission, paper copies of your fund’s annual and semiannual shareholder reports will no longer be sent to you by mail, unless you specifically request them. Instead, you will be notified by mail each time a report is posted on the website and will be provided with a link to access the report.
If you have already elected to receive shareholder reports electronically, you will not be affected by this change and do not need to take any action. You may elect to receive shareholder reports and other communications from the fund electronically by contacting your financial intermediary (such as a broker-dealer or bank) or, if you invest directly with the fund, by calling Vanguard at one of the phone numbers on the back cover of this report or by logging on to vanguard.com.
You may elect to receive paper copies of all future shareholder reports free of charge. If you invest through a financial intermediary, you can contact the intermediary to request that you continue to receive paper copies. If you invest directly with the fund, you can call Vanguard at one of the phone numbers on the back cover of this report or log on to vanguard.com. Your election to receive paper copies will apply to all the funds you hold through an intermediary or directly with Vanguard.
Contents | |
| |
| |
A Note From Our Chairman | 1 |
| |
Your Fund’s Performance at a Glance | 2 |
| |
Advisor’s Report | 3 |
| |
About Your Fund’s Expenses | 6 |
| |
Performance Summary | 8 |
| |
Financial Statements | 10 |
Please note: The opinions expressed in this report are just that—informed opinions. They should not be considered promises or advice. Also, please keep in mind that the information and opinions cover the period through the date on the front of this report. Of course, the risks of investing in your fund are spelled out in the prospectus.
A Note From Our Chairman

Tim Buckley
Chairman and Chief Executive Officer
Dear Shareholder,
Recent volatility in financial markets—affecting stocks, bonds, and commodities—has been a good reminder of the wise old adage, “Never keep all your eggs in one basket.” Maintaining balance and diversification in your investment portfolio can help to both limit risk and set you up for long-term success.
It’s understandable why some investors might become complacent after a long market run-up like the one that lifted stock prices, especially U.S. stock prices, in the years following the global financial crisis. But failing to rebalance regularly can leave a portfolio with a much different mix of assets than intended and, often, more risk than intended.
Balance across and diversification within asset classes are powerful tools for managing risk and achieving your investment goals. A portfolio’s allocation will determine a large portion of its long-term return and also the majority of its volatility risk. A well-diversified portfolio is less vulnerable to significant swings in the performance of any one segment of the asset classes in which it invests.
Balance and diversification will never eliminate the risk of loss, nor will they guarantee positive returns in a declining market. But they should reduce the chance that you’ll suffer disproportionate losses in one particular high-flying asset class or sector when it comes back to earth. And exposure to all key market components should give you at least some participation in the sectors that are performing best at any given time.
Vanguard is committed to helping you achieve balance and diversification in your portfolios to help meet your investment goals. We thank you for your continued loyalty.
Sincerely,

Mortimer J. Buckley
Chairman and Chief Executive Officer
October 14, 2019
1
Your Fund’s Performance at a Glance
· For the 12 months ended September 30, 2019, Vanguard Emerging Markets Bond Fund returned 13.40% for Investor Shares, outpacing the return of its benchmark by almost 2 percentage points.
· Emerging-market bonds slumped toward the end of 2018 amid concerns about global growth, the impact of tighter monetary policy, a slowdown in China, and growing trade tension. Later in the period, they made solid gains as major central banks turned more accommodative, growth concerns eased a bit, and investors again reached for yield.
· The bulk of the fund’s outperformance came from strong issuer selection. Latin America stood out, with selection in Mexico and an overweight allocation to Brazil boosting returns relative to the benchmark.
· A modest overweight to Argentina, where the political situation grew more clouded, detracted most from returns.
· The use of derivatives to hedge portfolio risks is common in the fund. The fund’s derivatives position, including both hedges and active positions, had a net positive contribution to performance.
Market Barometer | | | |
| Average Annual Total Returns |
| Periods Ended September 30, 2019 |
| One Year | Three Years | Five Years |
Stocks | | | |
Russell 1000 Index (Large-caps) | 3.87% | 13.19% | 10.62% |
Russell 2000 Index (Small-caps) | -8.89 | 8.23 | 8.19 |
Russell 3000 Index (Broad U.S. market) | 2.92 | 12.83 | 10.44 |
FTSE All-World ex US Index (International) | -1.12 | 6.46 | 3.24 |
| | | |
Bonds | | | |
Bloomberg Barclays U.S. Aggregate Bond Index (Broad taxable market) | 10.30% | 2.92% | 3.38% |
Bloomberg Barclays Municipal Bond Index (Broad tax-exempt market) | 8.55 | 3.19 | 3.66 |
FTSE Three-Month U.S. Treasury Bill Index | 2.36 | 1.52 | 0.95 |
| | | |
CPI | | | |
Consumer Price Index | 1.71% | 2.07% | 1.53% |
2
Advisor’s Report
For the 12 months ended September 30, 2019, Vanguard Emerging Markets Bond Fund returned 13.40% for Investor Shares and 13.53% for Admiral Shares. The fund’s benchmark, the JP Morgan EMBI Global Diversified, returned 11.57%. The average return of its peer group of emerging-market hard currency debt funds was 8.95%. (A “hard currency” is one that is issued by an economically and politically stable country and is widely used around the world as payment for goods and services.)
With bond prices rising, yields fell. The 30-day SEC yield declined to 4.08% for the fund’s Investor Shares by the close of the period compared with 5.24% a year earlier. For Admiral Shares, that ending yield was 4.23%, down from 5.39%. The 30-day SEC yield is a proxy for a fund’s potential annualized rate of income.
The investment environment
The markets were driven largely by shifts in the outlook for global growth and monetary policy during the period.
Toward the end of 2018, emerging-market investors grew skittish on the prospect of a reduction in monetary policy accommodation by some major central banks, especially as the global economy seemed to be losing steam. An interest rate increase in December by the U.S. Federal Reserve marked its fourth hike of 2018. The European Central Bank (ECB) brought its asset-purchase program to an end. Other concerns on investors’ minds as 2018 drew to a close were flare-ups in ongoing trade disputes, signs of China’s economy slowing, and heightened geopolitical tensions in the Middle East. Greater risk aversion led to a sell-off in stocks and lower-quality bonds and a boost in demand for safer assets, including government bonds.
Further signs of a global slowdown and tepid inflation in the new year, however, led to a pivot in monetary policy from a tightening to a loosening bias across much of the world. In March, the Fed announced that it would end its balance sheet tapering; it went on to reduce short-term interest rates in August and September. Those cuts, the first in more than a decade, were justified by policymakers as “insurance” meant to cushion the effects of trade policies and prolong an economic expansion already in its tenth year. In September, the ECB pushed its deposit rate further into negative territory and announced a new round of asset purchases; at the same time, it cut its projections for euro zone growth and inflation for 2019 and 2020.
For emerging markets, dimmer prospects for global growth were a headwind—but the knock-on effect of more accommodative monetary policy in developed markets was supportive. In general, these markets benefited from looser financial conditions, a lower cost of borrowing in dollars, and an upturn in capital inflows.
3
Management of the fund
We were able to add value through a number of different strategies during the period. While we don’t usually take significant directional bets on the market, we did going into 2019. The market had cheapened to the point where we went long on some higher-beta issuers with underlying stories that suggested they would benefit most from a rebound. This tactical move worked out well for the fund.
For much of the period, however, we were more focused on finding relative value opportunities within and across markets. Brazil is one of the countries where we were successful in doing that. We were overweight Brazilian quasi-sovereign debt and local interest rates mainly for two reasons: the number of structural reforms, including pension reform, under way there, and the easing in interest rates taking place because of the sluggish economy and below-target inflation. This positioning paid off handsomely for the fund over the period.
Underweighting Turkey and Lebanon also added significant value, and overweights to Central America and Ukraine helped performance. A big positive contribution came from purchasing euro-denominated bonds of countries in emerging Europe on a currency- and interest-rate hedged basis. These bonds significantly outperformed their dollar-denominated counterparts.
Another positive was our out-of-benchmark allocation to local-currency bonds. As global monetary policy turned more accommodative, we seized some opportunities in countries where bonds in local currencies appeared to have more scope for upside than their U.S.-dollar-denominated counterparts. Those countries included Mexico, South Africa, Ukraine, and Egypt.
Argentina was the largest detractor. We had overweighted our allocation to this country, given the market-friendly policies of President Mauricio Macri and the line of credit secured from the International Monetary Fund last year. Argentina’s credit repriced sharply, however, following a strong primary showing by Macri’s political rival ahead of the general election to be held at the end of October. Our position therefore hurt the fund. We were, however, able to limit the impact after the fact through selection and active management.
Defensive underweights to some of the tightest-trading issuers in August also dampened the fund’s return, as demand for Treasury-sensitive assets helped countries like Qatar and Saudi Arabia outperform.
Outlook
The investment environment is likely to be complicated for emerging markets.
We expect global growth to continue softening, owing in part to further downdrafts from trade tensions and policy uncertainty. The U.S. economy may slow to a below-trend pace of around 0.5%–1.5% in 2020 after adjusting for inflation, with a not-negligible risk of a recession.
4
China, the world’s second-largest economy, is set to grow at around 5.8% next year—but that figure could be markedly lower without further stimulus. Growth may stay below trend in the euro area, to about 0.7%, given recent indications that manufacturing weakness is spilling over into supply chains and the services sector.
The weakest issuers in the emerging markets will be the most sensitive and at risk to a further deceleration in global growth, making rigorous credit analysis and dynamic management key to performance in 2020 in this asset class.
On the other hand, weaker inflation and more easing by major central banks should be positive for emerging markets. It will make it easier for them to obtain external financing and give their central banks more room to cut rates, which in turn should be supportive of emerging-market credit sectors and local-currency fixed income.
Valuations for the high-credit-quality portion of emerging-market debt are unappealingly high, given both the appetite investors have shown for safety and yield and the additional supply that’s expected to come to market. The lowest-credit-quality portion is most at risk from further disappointments regarding growth.
Accordingly, we are entering the fund’s new fiscal year conservatively positioned in the middle of the credit-quality spectrum, where valuations offer the prospect of additional upside from issuers with stable or improving fundamentals.
Because we are likely to see more bouts of volatility as the global economy slows, our tactically defensive stance should allow us to take advantage of price dislocations as they arise.
Daniel Shaykevich, Portfolio Manager
Vanguard Fixed Income Group
October 23, 2019
5
About Your Fund’s Expenses
As a shareholder of the fund, you incur ongoing costs, which include costs for portfolio management, administrative services, and shareholder reports (like this one), among others. Operating expenses, which are deducted from a fund’s gross income, directly reduce the investment return of the fund.
A fund’s expenses are expressed as a percentage of its average net assets. This figure is known as the expense ratio. The following examples are intended to help you understand the ongoing costs (in dollars) of investing in your fund and to compare these costs with those of other mutual funds. The examples are based on an investment of $1,000 made at the beginning of the period shown and held for the entire period.
The accompanying table illustrates your fund’s costs in two ways:
· Based on actual fund return. This section helps you to estimate the actual expenses that you paid over the period. The “Ending Account Value” shown is derived from the fund’s actual return, and the third column shows the dollar amount that would have been paid by an investor who started with $1,000 in the fund. You may use the information here, together with the amount you invested, to estimate the expenses that you paid over the period.
To do so, simply divide your account value by $1,000 (for example, an $8,600 account value divided by $1,000 = 8.6), then multiply the result by the number given for your fund under the heading “Expenses Paid During Period.”
· Based on hypothetical 5% yearly return. This section is intended to help you compare your fund’s costs with those of other mutual funds. It assumes that the fund had a yearly return of 5% before expenses, but that the expense ratio is unchanged. In this case—because the return used is not the fund’s actual return—the results do not apply to your investment. The example is useful in making comparisons because the Securities and Exchange Commission requires all mutual funds to calculate expenses based on a 5% return. You can assess your fund’s costs by comparing this hypothetical example with the hypothetical examples that appear in shareholder reports of other funds.
Note that the expenses shown in the table are meant to highlight and help you compare ongoing costs only and do not reflect transaction costs incurred by the fund for buying and selling securities. Further, the expenses do not include any purchase, redemption, or account service fees described in the fund prospectus. If such fees were applied to your account, your costs would be higher. Your fund does not carry a “sales load.”
The calculations assume no shares were bought or sold during the period. Your actual costs may have been higher or lower, depending on the amount of your investment and the timing of any purchases or redemptions.
You can find more information about the fund’s expenses, including annual expense ratios, in the Financial Statements section of this report. For additional information on operating expenses and other shareholder costs, please refer to your fund’s current prospectus.
6
Six Months Ended September 30, 2019
| Beginning | Ending | Expenses |
| Account Value | Account Value | Paid During |
Emerging Markets Bond Fund | 3/31/2019 | 9/30/2019 | Period |
Based on Actual Fund Return | | | |
Investor Shares | $1,000.00 | $1,056.32 | $3.09 |
Admiral™ Shares | 1,000.00 | 1,057.12 | 2.32 |
Based on Hypothetical 5% Yearly Return | | | |
Investor Shares | $1,000.00 | $1,022.06 | $3.04 |
Admiral Shares | 1,000.00 | 1,022.81 | 2.28 |
The calculations are based on expenses incurred in the most recent six-month period. The fund’s annualized six-month expense ratios for that period are 0.60% for Investor Shares and 0.45% for Admiral Shares. The dollar amounts shown as “Expenses Paid” are equal to the annualized expense ratio multiplied by the average account value over the period, multiplied by the number of days in the most recent six-month period, then divided by the number of days in the most recent 12-month period (183/365).
7
Emerging Markets Bond Fund
Performance Summary
All of the returns in this report represent past performance, which is not a guarantee of future results that may be achieved by the fund. (Current performance may be lower or higher than the performance data cited. For performance data current to the most recent month-end, visit our website at vanguard.com/performance.) Note, too, that both investment returns and principal value can fluctuate widely, so an investor’s shares, when sold, could be worth more or less than their original cost. The returns shown do not reflect taxes that a shareholder would pay on fund distributions or on the sale of fund shares.
Cumulative Performance: March 10, 2016, Through September 30, 2019
Initial Investment of $10,000

| | Average Annual Total Returns | |
| | Periods Ended September 30, 2019 | |
| | | Since | Final Value |
| | One | Inception | of a $10,000 |
| | Year | (3/10/2016) | Investment |

| Emerging Markets Bond Fund Investor | | | |
Shares | 13.40% | 10.15% | $14,104 |

| JP Morgan EMBI Global Diversified | 11.57 | 7.06 | 12,747 |
“Since Inception” performance is calculated from the Investor Shares’ inception date for both the fund and its comparative standards.
| | Since | Final Value |
| One | Inception | of a $50,000 |
| Year | (12/6/2017) | Investment |
Emerging Markets Bond Fund Admiral Shares | 13.53% | 7.77% | $57,283 |
JP Morgan EMBI Global Diversified | 11.57 | 4.63 | 54,287 |
“Since Inception” performance is calculated from the Admiral Shares’ inception date for both the fund and its comparative standards.
See Financial Highlights for dividend and capital gains information.
8
Emerging Markets Bond Fund
Sector Diversification
As of September 30, 2019
Sovereign | | 98.8 | % |
Corporate | | 1.2 | |
The agency and mortgage-backed securities sectors may include issues from government-sponsored enterprises; such issues are generally not backed by the full faith and credit of the U.S. government.
9
Emerging Markets Bond Fund
Financial Statements
Statement of Net Assets
As of September 30, 2019
The fund files its complete schedule of portfolio holdings with the Securities and Exchange Commission (SEC) for the first and third quarters of each fiscal year as an exhibit to its reports on Form N-PORT. The fund’s Form N-PORT reports are available on the SEC’s website at www.sec.gov.
| | | | | | | Face | | Market | |
| | | | | Maturity | | Amount | | Value· | |
| | | Coupon | | Date | | ($000 | ) | ($000 | ) |
Angola (1.0%) | | | | | | | | | |
Sovereign Bond (1.0%) | | | | | | | | | |
| Republic of Angola | | 9.375% | | 5/8/48 | | 3,450 | | 3,638 | |
Total Angola (Cost $3,593) | | | | | | | | 3,638 | |
Argentina (2.0%) | | | | | | | | | |
| Sovereign Bonds (2.0%) | | | | | | | | | |
| Argentine Republic | | 6.875% | | 4/22/21 | | 4,200 | | 2,053 | |
| Argentine Republic | | 5.625% | | 1/26/22 | | 6,900 | | 2,967 | |
| Argentine Republic | | 4.625% | | 1/11/23 | | 500 | | 208 | |
| Argentine Republic | | 6.875% | | 1/26/27 | | 4,312 | | 1,806 | |
1 | Argentine Republic | | 3.750% | | 12/31/38 | | 700 | | 277 | |
| Argentine Republic | | 6.875% | | 1/11/48 | | 500 | | 210 | |
Total Argentina (Cost $12,880) | | | | | | | | 7,521 | |
Armenia (1.3%) | | | | | | | | | |
Sovereign Bond (1.3%) | | | | | | | | | |
| Republic of Armenia | | 7.150% | | 3/26/25 | | 4,200 | | 4,900 | |
Total Armenia (Cost $4,856) | | | | | | | | 4,900 | |
Azerbaijan (1.4%) | | | | | | | | | |
Sovereign Bonds (1.4%) | | | | | | | | | |
| Republic of Azerbaijan | | 4.750% | | 3/18/24 | | 3,000 | | 3,181 | |
1 | Republic of Azerbaijan | | 3.500% | | 9/1/32 | | 2,000 | | 1,937 | |
Total Azerbaijan (Cost $4,887) | | | | | | | | 5,118 | |
Bahrain (1.0%) | | | | | | | | | |
Sovereign Bond (1.0%) | | | | | | | | | |
2 | Kingdom of Bahrain | | 5.625% | | 9/30/31 | | 2,500 | | 2,494 | |
| Kingdom of Bahrain | | 7.500% | | 9/20/47 | | 1,000 | | 1,138 | |
Total Bahrain (Cost $3,562) | | | | | | | | 3,632 | |
Brazil (3.7%) | | | | | | | | | |
Corporate Bonds (1.0%) | | | | | | | | | |
2 | Suzano Austria GmbH | | 7.000% | | 3/16/47 | | 2,830 | | 3,239 | |
| Vale Overseas Ltd. | | 6.250% | | 8/10/26 | | 527 | | 609 | |
| | | | | | | | | 3,848 | |
Sovereign Bonds (2.7%) | | | | | | | | | |
1 | Federative Republic of Brazil | | 4.500% | | 5/30/29 | | 6,000 | | 6,255 | |
| Petrobras Global Finance BV | | 6.900% | | 3/19/49 | | 3,145 | | 3,624 | |
| | | | | | | | | 9,879 | |
Total Brazil (Cost $13,506) | | | | | | | | 13,727 | |
10
Emerging Markets Bond Fund
| | | | | | | Face | | Market | |
| | | | | Maturity | | Amount | | Value· | |
| | | Coupon | | Date | | ($000 | ) | ($000 | ) |
Cameroon (0.5%) | | | | | | | | | |
Sovereign Bond (0.5%) | | | | | | | | | |
1 | Republic of Cameroon | | 9.500% | | 11/19/25 | | 1,750 | | 1,916 | |
Total Cameroon (Cost $1,897) | | | | | | | | 1,916 | |
Chile (1.6%) | | | | | | | | | |
Corporate Bond (0.2%) | | | | | | | | | |
| Celulosa Arauco y Constitucion SA | | 5.500% | | 11/2/47 | | 600 | | 669 | |
| | | | | | | | | 669 | |
Sovereign Bonds (1.4%) | | | | | | | | | |
| Empresa Nacional del Petroleo | | 4.750% | | 12/6/21 | | 200 | | 209 | |
| Empresa Nacional del Petroleo | | 4.375% | | 10/30/24 | | 2,600 | | 2,764 | |
| Empresa Nacional del Petroleo | | 3.750% | | 8/5/26 | | 2,250 | | 2,325 | |
| | | | | | | | | 5,298 | |
Total Chile (Cost $5,897) | | | | | | | | 5,967 | |
China (1.2%) | | | | | | | | | |
Sovereign Bonds (1.2%) | | | | | | | | | |
| Sinopec Group Overseas Development 2017 Ltd. | | 3.250% | | 9/13/27 | | 2,000 | | 2,059 | |
| State Grid Overseas Investment 2016 Ltd. | | 2.875% | | 5/18/26 | | 750 | | 763 | |
| State Grid Overseas Investment 2016 Ltd. | | 3.500% | | 5/4/27 | | 1,500 | | 1,584 | |
Total China (Cost $4,193) | | | | | | | | 4,406 | |
Colombia (3.0%) | | | | | | | | | |
Sovereign Bonds (3.0%) | | | | | | | | | |
| Republic of Colombia | | 4.375% | | 7/12/21 | | 3,000 | | 3,105 | |
1 | Republic of Colombia | | 4.500% | | 1/28/26 | | 6,290 | | 6,864 | |
| Republic of Colombia | | 10.375% | | 1/28/33 | | 615 | | 983 | |
Total Colombia (Cost $10,611) | | | | | | | | 10,952 | |
Costa Rica (0.7%) | | | | | | | | | |
Sovereign Bonds (0.7%) | | | | | | | | | |
| Republic of Costa Rica | | 7.000% | | 4/4/44 | | 1,400 | | 1,392 | |
| Republic of Costa Rica | | 7.158% | | 3/12/45 | | 1,300 | | 1,303 | |
Total Costa Rica (Cost $2,542) | | | | | | | | 2,695 | |
Cote d’Ivoire (1.4%) | | | | | | | | | |
Sovereign Bonds (1.4%) | | | | | | | | | |
1 | Republic of Cote d’Ivoire | | 6.375% | | 3/3/28 | | 1,000 | | 1,024 | |
1 | Republic of Cote d’Ivoire | | 6.125% | | 6/15/33 | | 4,200 | | 4,051 | |
Total Cote d’Ivoire (Cost $4,859) | | | | | | | | 5,075 | |
Croatia (2.0%) | | | | | | | | | |
Sovereign Bonds (2.0%) | | | | | | | | | |
| Republic of Croatia | | 6.625% | | 7/14/20 | | 2,500 | | 2,581 | |
3 | Republic of Croatia | | 3.000% | | 3/20/27 | | 500 | | 648 | |
3 | Republic of Croatia | | 1.125% | | 6/19/29 | | 3,500 | | 4,046 | |
Total Croatia (Cost $7,176) | | | | | | | | 7,275 | |
Dominican Republic (1.1%) | | | | | | | | | |
Sovereign Bonds (1.1%) | | | | | | | | | |
| Dominican Republic | | 5.500% | | 1/27/25 | | 1,200 | | 1,266 | |
| Dominican Republic | | 6.400% | | 6/5/49 | | 2,490 | | 2,655 | |
Total Dominican Republic (Cost $3,777) | | | | | | | | 3,921 | |
11
Emerging Markets Bond Fund
| | | | | | | Face | | Market | |
| | | | | Maturity | | Amount | | Value· | |
| | | Coupon | | Date | | ($000 | ) | ($000 | ) |
Ecuador (1.2%) | | | | | | | | | |
Sovereign Bonds (1.2%) | | | | | | | | | |
| Republic of Ecuador | | 9.650% | | 12/13/26 | | 500 | | 528 | |
2 | Republic of Ecuador | | 9.500% | | 3/27/30 | | 4,000 | | 4,047 | |
Total Ecuador (Cost $4,527) | | | | | | | | 4,575 | |
Egypt (1.1%) | | | | | | | | | |
Sovereign Bond (1.1%) | | | | | | | | | |
| Arab Republic of Egypt | | 8.700% | | 3/1/49 | | 3,900 | | 4,196 | |
Total Egypt (Cost $3,996) | | | | | | | | 4,196 | |
El Salvador (2.0%) | | | | | | | | | |
Sovereign Bonds (2.0%) | | | | | | | | | |
| Republic of El Salvador | | 6.375% | | 1/18/27 | | 3,600 | | 3,741 | |
1,2 | Republic of El Salvador | | 7.125% | | 1/20/50 | | 3,530 | | 3,600 | |
Total El Salvador (Cost $7,115) | | | | | | | | 7,341 | |
Ghana (0.2%) | | | | | | | | | |
Sovereign Bonds (0.2%) | | | | | | | | | |
1 | Republic of Ghana | | 8.125% | | 3/26/32 | | 400 | | 402 | |
1 | Republic of Ghana | | 8.627% | | 6/16/49 | | 500 | | 499 | |
Total Ghana (Cost $844) | | | | | | | | 901 | |
Guatemala (1.6%) | | | | | | | | | |
Sovereign Bonds (1.6%) | | | | | | | | | |
| Republic of Guatemala | | 4.500% | | 5/3/26 | | 3,100 | | 3,199 | |
| Republic of Guatemala | | 4.375% | | 6/5/27 | | 2,500 | | 2,555 | |
Total Guatemala (Cost $5,830) | | | | | | | | 5,754 | |
Honduras (1.4%) | | | | | | | | | |
Sovereign Bonds (1.4%) | | | | | | | | | |
| Republic of Honduras | | 8.750% | | 12/16/20 | | 500 | | 534 | |
1 | Republic of Honduras | | 7.500% | | 3/15/24 | | 700 | | 777 | |
| Republic of Honduras | | 6.250% | | 1/19/27 | | 3,650 | | 3,946 | |
Total Honduras (Cost $5,178) | | | | | | | | 5,257 | |
Hungary (1.0%) | | | | | | | | | |
Sovereign Bonds (1.0%) | | | | | | | | | |
| Republic of Hungary | | 6.375% | | 3/29/21 | | 600 | | 636 | |
4 | Republic of Hungary | | 3.000% | | 8/21/30 | | 900,000 | | 3,215 | |
Total Hungary (Cost $4,006) | | | | | | | | 3,851 | |
India (1.3%) | | | | | | | | | |
Sovereign Bonds (1.3%) | | | | | | | | | |
| Export-Import Bank of India | | 3.875% | | 3/12/24 | | 500 | | 523 | |
2 | Export-Import Bank of India | | 3.875% | | 2/1/28 | | 1,315 | | 1,391 | |
| NTPC Ltd. | | 3.750% | | 4/3/24 | | 3,000 | | 3,092 | |
Total India (Cost $4,866) | | | | | | | | 5,006 | |
Indonesia (4.7%) | | | | | | | | | |
Sovereign Bonds (4.7%) | | | | | | | | | |
| Perusahaan Penerbit SBSN Indonesia III | | 4.350% | | 9/10/24 | | 1,000 | | 1,070 | |
| Perusahaan Penerbit SBSN Indonesia III | | 4.325% | | 5/28/25 | | 320 | | 343 | |
| Perusahaan Penerbit SBSN Indonesia III | | 4.550% | | 3/29/26 | | 200 | | 218 | |
| Perusahaan Penerbit SBSN Indonesia III | | 4.150% | | 3/29/27 | | 300 | | 321 | |
12
Emerging Markets Bond Fund
| | | | | | | Face | | Market | |
| | | | | Maturity | | Amount | | Value· | |
| | | Coupon | | Date | | ($000 | ) | ($000 | ) |
| Republic of Indonesia | | 3.750% | | 4/25/22 | | 2,000 | | 2,062 | |
| Republic of Indonesia | | 3.375% | | 4/15/23 | | 2,580 | | 2,644 | |
| Republic of Indonesia | | 5.875% | | 1/15/24 | | 3,650 | | 4,102 | |
| Republic of Indonesia | | 4.125% | | 1/15/25 | | 1,500 | | 1,596 | |
| Republic of Indonesia | | 4.750% | | 1/8/26 | | 4,500 | | 4,972 | |
Total Indonesia (Cost $16,590) | | | | | | | | 17,328 | |
Jamaica (1.9%) | | | | | | | | | |
Sovereign Bond (1.9%) | | | | | | | | | |
| Jamaica | | 7.875% | | 7/28/45 | | 5,250 | | 6,864 | |
Total Jamaica (Cost $6,696) | | | | | | | | 6,864 | |
Jordan (0.3%) | | | | | | | | | |
Sovereign Bonds (0.3%) | | | | | | | | | |
| Hashemite Kingdom of Jordan | | 6.125% | | 1/29/26 | | 500 | | 524 | |
| Hashemite Kingdom of Jordan | | 7.375% | | 10/10/47 | | 500 | | 527 | |
Total Jordan (Cost $987) | | | | | | | | 1,051 | |
Kazakhstan (1.2%) | | | | | | | | | |
Sovereign Bonds (1.2%) | | | | | | | | | |
| Development Bank of Kazakhstan JSC | | 4.125% | | 12/10/22 | | 700 | | 726 | |
| Kazakhstan Temir Zholy Finance BV | | 6.950% | | 7/10/42 | | 600 | | 803 | |
| KazMunayGas National Co. JSC | | 4.400% | | 4/30/23 | | 700 | | 735 | |
| KazMunayGas National Co. JSC | | 6.375% | | 10/24/48 | | 1,750 | | 2,179 | |
Total Kazakhstan (Cost $4,109) | | | | | | | | 4,443 | |
Kenya (0.6%) | | | | | | | | | |
Sovereign Bond (0.6%) | | | | | | | | | |
1 | Republic of Kenya | | 8.000% | | 5/22/32 | | 2,000 | | 2,097 | |
Total Kenya (Cost $2,000) | | | | | | | | 2,097 | |
Latvia (0.1%) | | | | | | | | | |
Sovereign Bond (0.1%) | | | | | | | | | |
| Republic of Latvia | | 2.750% | | 1/12/20 | | 200 | | 200 | |
Total Latvia (Cost $200) | | | | | | | | 200 | |
Lebanon (0.9%) | | | | | | | | | |
Sovereign Bonds (0.9%) | | | | | | | | | |
| Lebanese Republic | | 6.100% | | 10/4/22 | | 3,500 | | 2,479 | |
| Lebanese Republic | | 6.600% | | 11/27/26 | | 1,500 | | 975 | |
Total Lebanon (Cost $3,783) | | | | | | | | 3,454 | |
Lithuania (0.2%) | | | | | | | | | |
Sovereign Bonds (0.2%) | | | | | | | | | |
| Republic of Lithuania | | 6.125% | | 3/9/21 | | 170 | | 179 | |
| Republic of Lithuania | | 6.625% | | 2/1/22 | | 500 | | 552 | |
Total Lithuania (Cost $712) | | | | | | | | 731 | |
Mexico (11.1%) | | | | | | | | | |
Sovereign Bonds (11.1%) | | | | | | | | | |
| Petroleos Mexicanos | | 6.875% | | 8/4/26 | | 6,500 | | 6,987 | |
2 | Petroleos Mexicanos | | 6.490% | | 1/23/27 | | 3,250 | | 3,378 | |
| Petroleos Mexicanos | | 5.625% | | 1/23/46 | | 4,250 | | 3,619 | |
| Petroleos Mexicanos | | 6.750% | | 9/21/47 | | 1,500 | | 1,430 | |
13
Emerging Markets Bond Fund
| | | | | | | Face | | Market | |
| | | | | Maturity | | Amount | | Value· | |
| | | Coupon | | Date | | ($000 | ) | ($000 | ) |
2 | Petroleos Mexicanos | | 7.690% | | 1/23/50 | | 4,300 | | 4,486 | |
| United Mexican States | | 4.125% | | 1/21/26 | | 6,560 | | 6,948 | |
5 | United Mexican States | | 5.750% | | 3/5/26 | | 124,380 | | 5,970 | |
| United Mexican States | | 4.150% | | 3/28/27 | | 4,200 | | 4,443 | |
5 | United Mexican States | | 7.500% | | 6/3/27 | | 40,000 | | 2,104 | |
5 | United Mexican States | | 8.000% | | 11/7/47 | | 35,000 | | 1,909 | |
Total Mexico (Cost $40,036) | | | | | | | | 41,274 | |
Nigeria (0.6%) | | | | | | | | | |
Sovereign Bond (0.6%) | | | | | | | | | |
| Federal Republic of Nigeria | | 7.625% | | 11/28/47 | | 2,400 | | 2,370 | |
Total Nigeria (Cost $2,330) | | | | | | | | 2,370 | |
Oman (1.9%) | | | | | | | | | |
Sovereign Bonds (1.9%) | | | | | | | | | |
| Sultanate of Oman | | 5.375% | | 3/8/27 | | 5,000 | | 4,916 | |
| Sultanate of Oman | | 6.750% | | 1/17/48 | | 2,200 | | 2,076 | |
Total Oman (Cost $6,897) | | | | | | | | 6,992 | |
Panama (0.6%) | | | | | | | | | |
Sovereign Bond (0.6%) | | | | | | | | | |
| Republic of Panama | | 7.125% | | 1/29/26 | | 1,700 | | 2,136 | |
Total Panama (Cost $2,038) | | | | | | | | 2,136 | |
Paraguay (3.1%) | | | | | | | | | |
Sovereign Bond (3.1%) | | | | | | | | | |
| Republic of Paraguay | | 5.000% | | 4/15/26 | | 7,500 | | 8,181 | |
| Republic of Paraguay | | 5.600% | | 3/13/48 | | 930 | | 1,076 | |
1 | Republic of Paraguay | | 5.400% | | 3/30/50 | | 2,000 | | 2,266 | |
Total Paraguay (Cost $11,580) | | | | | | | | 11,523 | |
Peru (2.3%) | | | | | | | | | |
Sovereign Bonds (2.3%) | | | | | | | | | |
| Corp. Financiera de Desarrollo SA | | 4.750% | | 2/8/22 | | 1,000 | | 1,047 | |
| Corp. Financiera de Desarrollo SA | | 4.750% | | 7/15/25 | | 900 | | 992 | |
2,6 | Republic of Peru | | 6.150% | | 8/12/32 | | 18,880 | | 6,386 | |
Total Peru (Cost $8,238) | | | | | | | | 8,425 | |
Romania (1.7%) | | | | | | | | | |
Sovereign Bonds (1.7%) | | | | | | | | | |
| Republic of Romania | | 4.375% | | 8/22/23 | | 1,000 | | 1,069 | |
3 | Republic of Romania | | 2.375% | | 4/19/27 | | 2,500 | | 2,981 | |
2,3 | Republic of Romania | | 4.625% | | 4/3/49 | | 1,687 | | 2,375 | |
Total Romania (Cost $6,337) | | | | | | | | 6,425 | |
Russia (5.7%) | | | | | | | | | |
Sovereign Bonds (5.7%) | | | | | | | | | |
| Gazprom OAO Via Gaz Capital SA | | 6.510% | | 3/7/22 | | 1,750 | | 1,904 | |
| Russian Federation | | 4.750% | | 5/27/26 | | 9,200 | | 10,048 | |
| Russian Federation | | 4.250% | | 6/23/27 | | 800 | | 852 | |
7 | Russian Federation | | 7.050% | | 1/19/28 | | 227,000 | | 3,548 | |
| Russian Federation | | 4.375% | | 3/21/29 | | 1,200 | | 1,285 | |
| Russian Federation | | 5.100% | | 3/28/35 | | 3,000 | | 3,392 | |
Total Russia (Cost $19,868) | | | | | | | | 21,029 | |
14
Emerging Markets Bond Fund
| | | | | | | Face | | Market | |
| | | | | Maturity | | Amount | | Value· | |
| | | Coupon | | Date | | ($000 | ) | ($000 | ) |
Senegal (1.1%) | | | | | | | | | |
Sovereign Bond (1.1%) | | | | | | | | | |
1 | Republic of Senegal | | 6.750% | | 3/13/48 | | 4,150 | | 4,002 | |
Total Senegal (Cost $3,896) | | | | | | | | 4,002 | |
Serbia (0.7%) | | | | | | | | | |
Sovereign Bond (0.7%) | | | | | | | | | |
| Republic of Serbia | | 4.875% | | 2/25/20 | | 2,564 | | 2,585 | |
Total Serbia (Cost $2,583) | | | | | | | | 2,585 | |
South Africa (6.5%) | | | | | | | | | |
Sovereign Bonds (6.5%) | | | | | | | | | |
| Republic of South Africa | | 5.500% | | 3/9/20 | | 1,000 | | 1,010 | |
| Republic of South Africa | | 5.875% | | 9/16/25 | | 5,000 | | 5,450 | |
8 | Republic of South Africa | | 10.500% | | 12/21/26 | | 67,000 | | 4,941 | |
| Republic of South Africa | | 4.850% | | 9/30/29 | | 5,780 | | 5,771 | |
8 | Republic of South Africa | | 6.500% | | 2/28/41 | | 56,250 | | 2,607 | |
| Republic of South Africa | | 5.750% | | 9/30/49 | | 4,200 | | 4,195 | |
Total South Africa (Cost $24,410) | | | | | | | | 23,974 | |
Sri Lanka (1.4%) | | | | | | | | | |
Sovereign Bonds (1.4%) | | | | | | | | | |
| Democratic Socialist Republic of Sri Lanka | | 6.750% | | 4/18/28 | | 4,200 | | 4,014 | |
| Democratic Socialist Republic of Sri Lanka | | 7.850% | | 3/14/29 | | 1,000 | | 1,009 | |
Total Sri Lanka (Cost $5,015) | | | | | | | | 5,023 | |
Supranational (2.0%) | | | | | | | | | |
Sovereign Bonds (2.0%) | | | | | | | | | |
2 | African Export-Import Bank | | 3.994% | | 9/21/29 | | 2,720 | | 2,729 | |
2 | Arab Petroleum Investments Corp. | | 4.125% | | 9/18/23 | | 800 | | 847 | |
| Arab Petroleum Investments Corp. | | 4.125% | | 9/18/23 | | 2,200 | | 2,324 | |
| Banque Ouest Africaine de Developpement | | 5.500% | | 5/6/21 | | 1,000 | | 1,039 | |
| Banque Ouest Africaine de Developpement | | 5.000% | | 7/27/27 | | 500 | | 532 | |
Total Supranational (Cost $7,344) | | | | | | | | 7,471 | |
Trinidad and Tobago (1.6%) | | | | | | | | | |
Sovereign Bond (1.6%) | | | | | | | | | |
| Republic of Trinidad and Tobago | | 4.500% | | 8/4/26 | | 5,800 | | 6,009 | |
Total Trinidad and Tobago (Cost $5,787) | | | | | | | | 6,009 | |
Turkey (0.7%) | | | | | | | | | |
Sovereign Bond (0.7%) | | | | | | | | | |
| Republic of Turkey | | 6.000% | | 1/14/41 | | 3,000 | | 2,685 | |
Total Turkey (Cost $2,402) | | | | | | | | 2,685 | |
Ukraine (3.4%) | | | | | | | | | |
Sovereign Bonds (3.4%) | | | | | | | | | |
| Ukraine | | 8.994% | | 2/1/24 | | 500 | | 550 | |
| Ukraine | | 7.750% | | 9/1/24 | | 500 | | 529 | |
| Ukraine | | 7.750% | | 9/1/25 | | 5,850 | | 6,152 | |
| Ukraine | | 7.750% | | 9/1/26 | | 1,500 | | 1,571 | |
1 | Ukraine | | 7.375% | | 9/25/32 | | 3,500 | | 3,536 | |
1 | Ukreximbank Via Biz Finance plc | | 9.750% | | 1/22/25 | | 400 | | 426 | |
Total Ukraine (Cost $12,394) | | | | | | | | 12,764 | |
15
Emerging Markets Bond Fund
| | | | | | | Face | | Market | |
| | | | | Maturity | | Amount | | Value· | |
| | | Coupon | | Date | | ($000 | ) | ($000 | ) |
United Arab Emirates (3.2%) | | | | | | | | | |
Sovereign Bonds (3.2%) | | | | | | | | | |
2 | Emirate of Abu Dhabi | | 2.125% | | 9/30/24 | | 5,000 | | 4,972 | |
2 | Emirate of Abu Dhabi | | 3.125% | | 9/30/49 | | 6,975 | | 6,827 | |
Total United Arab Emirates (Cost $11,785) | | | | | | | | 11,799 | |
United States (1.1%) | | | | | | | | | |
U.S. Government and Agency Obligations (1.1%) | | | | | | | | | |
| United States Treasury Note/Bond | | 1.375% | | 8/31/26 | | 4,000 | | 3,936 | |
Total United States (Cost $3,923) | | | | | | | | 3,936 | |
Uruguay (0.2%) | | | | | | | | | |
Sovereign Bond (0.2%) | | | | | | | | | |
1 | Oriental Republic of Uruguay | | 4.375% | | 1/23/31 | | 550 | | 608 | |
Total Uruguay (Cost $621) | | | | | | | | 608 | |
Uzbekistan (1.2%) | | | | | | | | | |
Sovereign Bonds (1.2%) | | | | | | | | | |
| Republic of Uzbekistan | | 4.750% | | 2/20/24 | | 1,500 | | 1,573 | |
| Republic of Uzbekistan | | 5.375% | | 2/20/29 | | 2,550 | | 2,800 | |
Total Uzbekistan (Cost $4,198) | | | | | | | | 4,373 | |
Venezuela (0.1%) | | | | | | | | | |
Sovereign Bonds (0.1%) | | | | | | | | | |
* | Bolivarian Republic of Venezuela | | 11.750% | | 10/21/26 | | 640 | | 63 | |
* | Bolivarian Republic of Venezuela | | 7.000% | | 3/31/38 | | 1,500 | | 146 | |
*,1 | Petroleos de Venezuela SA | | 6.000% | | 11/15/26 | | 2,850 | | 228 | |
* | Petroleos de Venezuela SA | | 5.375% | | 4/12/27 | | 462 | | 39 | |
Total Venezuela (Cost $1,359) | | | | | | | | 476 | |
Vietnam (1.2%) | | | | | | | | | |
Sovereign Bond (1.2%) | | | | | | | | | |
| Socialist Republic of Vietnam | | 4.800% | | 11/19/24 | | 4,000 | | 4,384 | |
Total Vietnam (Cost $4,394) | | | | | | | | 4,384 | |
| | | | | | | | | | |
| | | | | | | Shares | | | |
Temporary Cash Investments (4.6%) | | | | | | | | | |
Money Market Fund (4.6%) | | | | | | | | | |
9 | Vanguard Market Liquidity Fund | | 2.098% | | | | 171,059 | | 17,108 | |
Total Temporary Cash Investments (Cost $17,107) | | | | | | | | 17,108 | |
16
Emerging Markets Bond Fund
| | | | | | | Notional | | Market | |
| | | Expiration | | Exercise | | Amount | | Value· | |
| | Counterparty | Date | | Price | | ($000 | ) | ($000 | ) |
Options Purchased (0.4%) | | | | | | | | | |
Foreign Currency Options | | | | | | | | | |
Call Options | | | | | | | | | |
EUR | DBAG | 4/22/21 | | USD 1.190 | | EUR 5,000 | | 46 | |
| | | | | | | | | |
Put Options | | | | | | | | | |
EUR | DBAG | 4/21/21 | | USD 1.175 | | EUR 13,000 | | 800 | |
USD | BNPSW | 7/20/22 | | JPY 94.765 | | USD 22,000 | | 568 | |
USD | BNPSW | 7/21/22 | | JPY 95.100 | | USD 10,000 | | 266 | |
| | | | | | | | 1,634 | |
Total Options Purchased (Cost $1,461) | | | | | | | | 1,680 | |
Total Investments (98.0%) (Cost $361,678) | | | | | | | | 362,843 | |
Other Assets and Liabilities (2.0%) | | | | | | | | | |
Other Assets10 | | | | | | | | 12,710 | |
Liabilities | | | | | | | | (5,443 | ) |
| | | | | | | | 7,267 | |
Net Assets (100%) | | | | | | | | 370,110 | |
| | Amount | |
| | ($000 | ) |
Statement of Assets and Liabilities | | | |
Assets | | | |
Investments in Securities, at Value | | | |
Unaffiliated Issuers | | 344,055 | |
Affiliated Issuers | | 17,108 | |
Options Purchased | | 1,680 | |
Total Investments in Securities | | 362,843 | |
Investment in Vanguard | | 16 | |
Receivables for Investment Securities Sold | | 6,531 | |
Receivables for Accrued Income | | 3,618 | |
Receivables for Capital Shares Issued | | 551 | |
Variation Margin Receivable—Futures Contracts | | 20 | |
Unrealized Appreciation—Forward Currency Contracts | | 916 | |
Unrealized Appreciation—OTC Swap Contracts | | 20 | |
Other Assets10 | | 1,038 | |
Total Assets | | 375,553 | |
Liabilities | | | |
Payables for Investment Securities Purchased | | 4,052 | |
Payables for Capital Shares Redeemed | | 597 | |
Payables for Distributions | | 308 | |
Payables to Vanguard | | 86 | |
Variation Margin Payable—Futures Contracts | | 13 | |
Unrealized Depreciation—Forward Currency Contracts | | 378 | |
Unrealized Depreciation—OTC Swap Contracts | | 9 | |
Total Liabilities | | 5,443 | |
Net Assets | | 370,110 | |
17
Emerging Markets Bond Fund
At September 30, 2019, net assets consisted of:
| | Amount | |
| | ($000 | ) |
Paid-in Capital | | 360,811 | |
Total Distributable Earnings (Loss) | | 9,299 | |
Net Assets | | 370,110 | |
| | | |
Investor Shares—Net Assets | | | |
Applicable to 5,736,850 outstanding $.001 par value shares of beneficial interest (unlimited authorization) | | 64,179 | |
|
Net Asset Value Per Share—Investor Shares | | $11.19 | |
| | | |
Admiral Shares—Net Assets | | | |
Applicable to 11,753,908 outstanding $.001 par value shares of beneficial interest (unlimited authorization) | | 305,931 | |
|
Net Asset Value Per Share—Admiral Shares | | $26.03 | |
· | See Note A in Notes to Financial Statements. |
| |
* | Non-income-producing security—security in default. |
| |
1 | The average or expected maturity is shorter than the final maturity shown because of the possibility of interim principal payments and prepayments or the possibility of the issue being called. |
| |
2 | Security exempt from registration under Rule 144A of the Securities Act of 1933. Such securities may be sold in transactions exempt from registration, normally to qualified institutional buyers. At September 30, 2019, the aggregate value of these securities was $46,771,000, representing 12.6% of net assets. |
| |
3 | Face amount denominated in euro. |
| |
4 | Face amount denominated in Hungarian forint. |
| |
5 | Face amount denominated in Mexican pesos. |
| |
6 | Face amount denominated in Peruvian sol. |
| |
7 | Face amount denominated in Russian ruble. |
| |
8 | Face amount denominated in South African rand. |
| |
9 | Affiliated money market fund available only to Vanguard funds and certain trusts and accounts managed by Vanguard. Rate shown is the 7-day yield. |
| |
10 | Cash of $343,000 has been segregated as initial margin for open futures contracts. |
18
Emerging Markets Bond Fund
Derivative Financial Instruments Outstanding as of Period End | |
| | | | | | | | | |
Futures Contracts | | | | | | | | | |
| | | | | | | | ($000 | ) |
| | | | | | | | Value and | |
| | | | Number of | | | | Unrealized | |
| | | | Long (Short | ) | Notional | | Appreciation | |
| | Expiration | | Contracts | | Amount | | (Depreciation | ) |
Long Futures Contracts | | | | | | | | | |
Ultra 10-Year U.S. Treasury Note | | December 2019 | | 126 | | 17,943 | | (152 | ) |
10-Year U.S. Treasury Note | | December 2019 | | 83 | | 10,816 | | 17 | |
| | | | | | | | (135 | ) |
| | | | | | | | | |
Short Futures Contracts | | | | | | | | | |
Euro-Buxl | | December 2019 | | (3 | ) | (711 | ) | 6 | |
Ultra Long U.S. Treasury Bond | | December 2019 | | (6 | ) | (1,151 | ) | (9 | ) |
Euro-Bund | | December 2019 | | (43 | ) | (8,167 | ) | 63 | |
5-Year U.S. Treasury Note | | December 2019 | | (188 | ) | (22,400 | ) | 105 | |
| | | | | | | | 165 | |
| | | | | | | | 30 | |
Forward Currency Contracts
| | Contract | | | | | | Unrealized | | Unrealized | |
| | Settlement | | Contract Amount (000) | | Appreciation | | (Depreciation | ) |
Counterparty | | Date | | Receive | | Deliver | | ($000 | ) | ($000 | ) |
Goldman Sachs Bank | | 10/15/19 | | JPY | 496,499 | | USD | 4,612 | | — | | (15 | ) |
Morgan Stanley Capital Services LLC | | 10/10/19 | | PEN | 12,350 | | USD | 3,650 | | 13 | | — | |
Bank of America, N.A. | | 10/10/19 | | RUB | 232,380 | | USD | 3,600 | | — | | (22 | ) |
HSBC Bank, N.A. | | 10/2/19 | | BRL | 12,404 | | USD | 3,000 | | — | | (15 | ) |
Citigroup Global Markets Inc. | | 10/17/19 | | EUR | 2,617 | | USD | 2,887 | | — | | (31 | ) |
Bank of America, N.A. | | 10/15/19 | | EUR | 2,495 | | USD | 2,749 | | — | | (26 | ) |
State Street Bank & Trust Co. | | 10/15/19 | | EUR | 2,394 | | USD | 2,644 | | — | | (32 | ) |
Bank of America, N.A. | | 10/4/19 | | UAH | 67,179 | | USD | 2,615 | | 170 | | — | |
Citigroup Global Markets Inc. | | 10/11/19 | | TRY | 12,336 | | USD | 2,120 | | 56 | | — | |
HSBC Bank, N.A. | | 10/15/19 | | EUR | 1,650 | | USD | 1,813 | | — | | (12 | ) |
HSBC Bank, N.A. | | 10/29/19 | | CNH | 7,050 | | USD | 1,041 | | — | | (54 | ) |
Goldman Sachs Bank | | 10/15/19 | | MXN | 16,211 | | USD | 833 | | — | | (14 | ) |
BNP Paribas | | 10/11/19 | | TRY | 4,137 | | USD | 707 | | 23 | | — | |
HSBC Bank, N.A. | | 10/15/19 | | ZAR | 1,698 | | USD | 115 | | — | | (3 | ) |
Toronto-Dominion Bank | | 10/29/19 | | CNH | 5 | | USD | 1 | | — | | — | |
BNP Paribas | | 10/15/19 | | USD | 10,778 | | MXN | 211,357 | | 97 | | — | |
Bank of America, N.A. | | 10/15/19 | | USD | 7,994 | | ZAR | 117,698 | | 238 | | — | |
Deutsche Bank AG | | 10/10/19 | | USD | 6,500 | | PEN | 21,796 | | 35 | | — | |
19
Emerging Markets Bond Fund
Forward Currency Contracts (continued)
| | Contract | | | | | | Unrealized | | Unrealized | |
| | Settlement | | Contract Amount (000) | | Appreciation | | (Depreciation | ) |
Counterparty | | Date | | Receive | | Deliver | | ($000 | ) | ($000 | ) |
HSBC Bank USA, N.A. | | 10/15/19 | | USD | 5,424 | | EUR | 4,900 | | 76 | | — | |
Barclays Bank plc | | 10/15/19 | | USD | 3,328 | | HUF | 1,001,281 | | 66 | | — | |
Goldman Sachs Bank USA | | 10/2/19 | | USD | 2,990 | | BRL | 12,481 | | — | | (14 | ) |
Royal Bank of Canada | | 10/11/19 | | USD | 1,519 | | TRY | 9,067 | | — | | (81 | ) |
Toronto-Dominion Bank | | 10/29/19 | | USD | 1,000 | | CNH | 7,055 | | 13 | | — | |
Deutsche Bank AG | | 10/10/19 | | USD | 925 | | RUB | 60,763 | | — | | (11 | ) |
Morgan Stanley Capital Services LLC | | 10/10/19 | | USD | 925 | | RUB | 60,658 | | — | | (9 | ) |
J.P. Morgan Securities LLC | | 10/11/19 | | USD | 850 | | TRY | 4,936 | | — | | (21 | ) |
BNP Paribas | | 10/11/19 | | USD | 450 | | TRY | 2,607 | | — | | (10 | ) |
Deutsche Bank AG | | 10/15/19 | | USD | 4 | | EUR | 4 | | — | | — | |
BNP Paribas | | 7/22/22 | | USD | 3,500 | | JPY | 349,895 | | 61 | | — | |
BNP Paribas | | 7/22/22 | | USD | 6,183 | | JPY | 622,050 | | 68 | | — | |
Goldman Sachs Bank USA | | 10/17/19 | | HUF | 550,036 | | EUR | 1,650 | | — | | (8 | ) |
| | | | | | | | | | 916 | | (378 | ) |
BRL—Brazilian real.
CNH—Chinese yuan (offshore).
EUR—euro.
HUF—Hungarian forint.
JPY—Japanese yen.
MXN—Mexican peso.
PEN—Peruvan sol.
RUB—Russian ruble.
TRY—Turkish lira.
UAH—Ukrainian hryvnia.
USD—U.S. dollar.
ZAR—South African rand.
20
Emerging Markets Bond Fund
Over-the-Counter Credit Default Swaps
| | | | | | | | | | | | Remaining | | | | | |
| | | | | | | | Periodic | | | | Up-Front | | | | | |
| | | | | | | | Premium | | | | Premium | | | | | |
| | | | | | Notional | | Received | | | | Received | | Unrealized | | Unrealized | |
Reference | | Termination | | | | Amount | | (Paid | )1 | Value | | (Paid | ) | Appreciation | | (Depreciation | ) |
Entity | | Date | | Counterparty | | ($000 | ) | (% | ) | ($000 | ) | ($000 | ) | ($000 | ) | ($000 | ) |
Credit Protection Sold/Moody’s Rating | | | | | | | | | | | | | | | | | |
Oriental Republic of Uruguay/Baa2 | | 9/20/20 | | BOANA | | 5,000 | | 1.000 | | 36 | | (21 | ) | 15 | | — | |
| | | | | | | | | | | | | | | | | |
Credit Protection Purchased | | | | | | | | | | | | | | | |
Federative Republic of Brazil | | 12/20/24 | | MSCS | | 5,000 | | (1.000 | ) | 86 | | (88 | ) | — | | (2 | ) |
Republic of Colombia | | 12/20/24 | | JPMC | | 4,500 | | (1.000 | ) | (18 | ) | 18 | | — | | — | |
Republic of Colombia | | 12/20/24 | | MSCS | | 3,585 | | (1.000 | ) | (14 | ) | 14 | | — | | — | |
Republic of Indonesia | | 6/20/24 | | BARC | | 2,000 | | (1.000 | ) | (19 | ) | 12 | | — | | (7 | ) |
United Mexican States | | 12/20/24 | | BARC | | 3,840 | | (1.000 | ) | 28 | | (23 | ) | 5 | | — | |
United Mexican States | | 12/20/24 | | CITNA | | 2,500 | | (1.000 | ) | 19 | | (19 | ) | — | | — | |
| | | | | | | | | | 82 | | (86 | ) | 5 | | (9 | ) |
| | | | | | | | | | 118 | | (107 | ) | 20 | | (9 | ) |
1 Periodic premium received/paid quarterly.
BARC—Barclays Bank plc.
BOANA—Bank of America NA.
CITNA— Citibank N.A.
JPMC—JP Morgan Chase Bank NA.
MSCS— Morgan Stanley Capital Services LLC.
The notional amount represents the maximum potential amount the fund could be required to pay as a seller of credit protection if the reference entity was subject to a credit event.
At September 30, 2019, the counterparties had deposited in segregated accounts securities with a value of $1,232,000 and cash of $590,000 in connection with open forward currency contracts and open over-the-counter swap contracts.
See accompanying Notes, which are an integral part of the Financial Statements.
21
Emerging Markets Bond Fund
Statement of Operations
| | Year Ended | |
| | September 30, 2019 | |
| | ($000 | ) |
Investment Income | | | |
Income | | | |
Interest1 | | 9,586 | |
Total Income | | 9,586 | |
Expenses | | | |
The Vanguard Group—Note B | | | |
Investment Advisory Services | | 23 | |
Management and Administrative—Investor Shares | | 192 | |
Management and Administrative—Admiral Shares | | 564 | |
Marketing and Distribution—Investor Shares | | 5 | |
Marketing and Distribution—Admiral Shares | | 8 | |
Custodian Fees | | 27 | |
Auditing Fees | | 44 | |
Shareholders’ Reports—Investor Shares | | 4 | |
Shareholders’ Reports—Admiral Shares | | 3 | |
Total Expenses | | 870 | |
Net Investment Income | | 8,716 | |
Realized Net Gain (Loss) | | | |
Investment Securities Sold1 | | 7,650 | |
Futures Contracts | | 744 | |
Options Purchased | | (264 | ) |
Swap Contracts | | 353 | |
Forward Currency Contracts | | 1,059 | |
Foreign Currencies | | 87 | |
Realized Net Gain (Loss) | | 9,629 | |
Change in Unrealized Appreciation (Depreciation) | | | |
Investment Securities1 | | 1,619 | |
Futures Contracts | | 78 | |
Options Purchased | | 215 | |
Swap Contracts | | (9 | ) |
Forward Currency Contracts | | 517 | |
Foreign Currencies | | (22 | ) |
Change in Unrealized Appreciation (Depreciation) | | 2,398 | |
Net Increase (Decrease) in Net Assets Resulting from Operations | | 20,743 | |
1 Interest income, realized net gain (loss), and change in unrealized appreciation (depreciation) from affiliated companies of the fund were $296,000, ($5,000), and $1,000. Purchases and sales are for temporary cash investment purposes.
See accompanying Notes, which are an integral part of the Financial Statements.
22
Emerging Markets Bond Fund
Statement of Changes in Net Assets
| | Year Ended September 30, | |
| | 2019 | | 2018 | |
| | ($000 | ) | ($000 | ) |
Increase (Decrease) in Net Assets | | | | | |
Operations | | | | | |
Net Investment Income | | 8,716 | | 3,055 | |
Realized Net Gain (Loss) | | 9,629 | | (940 | ) |
Change in Unrealized Appreciation (Depreciation) | | 2,398 | | (949 | ) |
Net Increase (Decrease) in Net Assets Resulting from Operations | | 20,743 | | 1,166 | |
Distributions | | | | | |
Net Investment Income | | | | | |
Investor Shares | | (1,920 | ) | (1,458 | ) |
Admiral Shares | | (6,932 | ) | (1,797 | ) |
Realized Capital Gain | | | | | |
Investor Shares1 | | — | | (630 | ) |
Admiral Shares | | — | | — | |
Total Distributions | | (8,852 | ) | (3,885 | ) |
Capital Share Transactions | | | | | |
Investor Shares | | 36,597 | | 14,419 | |
Admiral Shares | | 220,764 | | 77,011 | |
Net Increase (Decrease) from Capital Share Transactions | | 257,361 | | 91,430 | |
Total Increase (Decrease) | | 269,252 | | 88,711 | |
Net Assets | | | | | |
Beginning of Period | | 100,858 | | 12,147 | |
End of Period | | 370,110 | | 100,858 | |
1 Includes fiscal 2019 and 2018 short-term gain distributions totaling $0 and $531,000, respectively. Short-term gain distributions are treated as ordinary income dividends for tax purposes.
See accompanying Notes, which are an integral part of the Financial Statements.
23
Emerging Markets Bond Fund
Financial Highlights
Investor Shares
| | | | March 10, |
| | | | 20161 to |
For a Share Outstanding | Year Ended September 30, | | Sept. 30, |
Throughout Each Period | 2019 | 2018 | 2017 | | 2016 |
Net Asset Value, Beginning of Period | $10.36 | $10.76 | $11.07 | $10.00 |
Investment Operations | | | | |
Net Investment Income | .5242 | .4432 | .5042 | .286 |
Net Realized and Unrealized Gain (Loss) on Investments | .826 | (.193) | .184 | 1.050 |
Total from Investment Operations | 1.350 | .250 | .688 | 1.336 |
Distributions | | | | |
Dividends from Net Investment Income | (.520) | (.439) | (.514) | (.266) |
Distributions from Realized Capital Gains | — | (.211) | (.484) | — |
Total Distributions | (.520) | (.650) | (.998) | (.266) |
Net Asset Value, End of Period | $11.19 | $10.36 | $10.76 | $11.07 |
| | | | |
Total Return3 | 13.40% | 2.39% | 7.01% | 13.51% |
| | | | |
Ratios/Supplemental Data | | | | |
Net Assets, End of Period (Millions) | $64 | $25 | $12 | $11 |
Ratio of Total Expenses to Average Net Assets | 0.60% | 0.60% | 0.60% | 0.60%4 |
Ratio of Net Investment Income to Average Net Assets | 4.73% | 4.29% | 4.79% | 4.85%4 |
Portfolio Turnover Rate | 272% | 350% | 261% | 153% |
1 Inception.
2 Calculated based on average shares outstanding.
3 Total returns do not include account service fees that may have applied in the periods shown. Fund prospectuses provide information about any applicable account service fees.
4 Annualized.
See accompanying Notes, which are an integral part of the Financial Statements.
24
Emerging Markets Bond Fund
Financial Highlights
Admiral Shares
| | Year | | Dec. 6, | |
| | Ended | | 20171 to | |
| | Sept. 30, | | Sept. 30, | |
For a Share Outstanding Throughout Each Period | | 2019 | | 2018 | |
Net Asset Value, Beginning of Period | | $24.11 | | $24.80 | |
Investment Operations | | | | | |
Net Investment Income2 | | 1.228 | | .875 | |
Net Realized and Unrealized Gain (Loss) on Investments | | 1.940 | | (.659 | ) |
Total from Investment Operations | | 3.168 | | .216 | |
Distributions | | | | | |
Dividends from Net Investment Income | | (1.248 | ) | (.906 | ) |
Distributions from Realized Capital Gains | | — | | — | |
Total Distributions | | (1.248 | ) | (.906 | ) |
Net Asset Value, End of Period | | $26.03 | | $24.11 | |
| | | | | |
Total Return3 | | 13.53% | | 0.92% | |
| | | | | |
Ratios/Supplemental Data | | | | | |
Net Assets, End of Period (Millions) | | $306 | | $76 | |
Ratio of Total Expenses to Average Net Assets | | 0.45% | | 0.45%4 | |
Ratio of Net Investment Income to Average Net Assets | | 4.88% | | 4.44%4 | |
Portfolio Turnover Rate | | 272% | | 350% | |
1 Inception.
2 Calculated based on average shares outstanding.
3 Total returns do not include account service fees that may have applied in the periods shown. Fund prospectuses provide information about any applicable account service fees.
4 Annualized.
See accompanying Notes, which are an integral part of the Financial Statements.
25
Emerging Markets Bond Fund
Notes to Financial Statements
Vanguard Emerging Markets Bond Fund is registered under the Investment Company Act of 1940 as an open-end investment company, or mutual fund. Certain of the fund’s investments are in corporate debt instruments; the issuers’ abilities to meet their obligations may be affected by economic developments in their respective industries. The fund invests in securities of foreign issuers, which may subject it to investment risks not normally associated with investing in securities of U.S. corporations. To minimize the currency risk associated with investment in securities denominated in currencies other than the U.S. dollar, the fund attempts to hedge its currency exposures. The fund offers two classes of shares: Investor Shares and Admiral Shares. Each of the share classes has different eligibility and minimum purchase requirements, and is designed for different types of investors.
A. The following significant accounting policies conform to generally accepted accounting principles for U.S. investment companies. The fund consistently follows such policies in preparing its financial statements.
1. Security Valuation: Securities are valued as of the close of trading on the New York Stock Exchange (generally 4 p.m., Eastern time) on the valuation date. Bonds and temporary cash investments are valued using the latest bid prices or using valuations based on a matrix system (which considers such factors as security prices, yields, maturities, and ratings), both as furnished by independent pricing services. Investments in Vanguard Market Liquidity Fund are valued at that fund’s net asset value. Securities for which market quotations are not readily available, or whose values have been affected by events occurring before the fund’s pricing time but after the close of the securities’ primary markets, are valued at their fair values calculated according to procedures adopted by the board of trustees. These procedures include obtaining quotations from an independent pricing service, monitoring news to identify significant market- or security-specific events, and evaluating changes in the values of foreign market proxies (for example, ADRs, futures contracts, or exchange-traded funds), between the time the foreign markets close and the fund’s pricing time. When fair-value pricing is employed, the prices of securities used by a fund to calculate its net asset value may differ from quoted or published prices for the same securities.
2. Foreign Currency: Securities and other assets and liabilities denominated in foreign currencies are translated into U.S. dollars using exchange rates obtained from an independent third party as of the fund’s pricing time on the valuation date. Realized gains (losses) and unrealized appreciation (depreciation) on investment securities include the effects of changes in exchange rates since the securities were purchased, combined with the effects of changes in security prices. Fluctuations in the value of other assets and liabilities resulting from changes in exchange rates are recorded as unrealized foreign currency gains (losses) until the assets or liabilities are settled in cash, at which time they are recorded as realized foreign currency gains (losses).
3. Futures Contracts: The fund uses futures contracts to invest in fixed income asset classes with greater efficiency and lower cost than is possible through direct investment, to add value when these instruments are attractively priced, or to adjust sensitivity to changes in interest rates. The primary risks associated with the use of futures contracts are imperfect correlation between changes in market values of bonds held by the fund and the prices of futures contracts, and the possibility of an illiquid market. Counterparty risk involving futures is mitigated because a regulated clearinghouse is the counterparty instead of the clearing broker. To further mitigate counterparty risk, the fund trades futures contracts on an exchange, monitors the financial strength of its clearing brokers and clearinghouse, and has entered into clearing agreements with its clearing brokers. The
26
Emerging Markets Bond Fund
clearinghouse imposes initial margin requirements to secure the fund’s performance and requires daily settlement of variation margin representing changes in the market value of each contract. Any assets pledged as initial margin for open contracts are noted in the Statement of Net Assets.
Futures contracts are valued at their quoted daily settlement prices. The notional amounts of the contracts are not recorded in the Statement of Net Assets. Fluctuations in the value of the contracts are recorded in the Statement of Assets and Liabilities as an asset (liability) and in the Statement of Operations as unrealized appreciation (depreciation) until the contracts are closed, when they are recorded as realized futures gains (losses).
During the year ended September 30, 2019, the fund’s average investments in long and short futures contracts represented 5% and 7% of net assets, respectively, based on the average of the notional amounts at each quarter-end during the period.
4. Forward Currency Contracts: The fund enters into forward currency contracts to protect the value of securities and related receivables and payables against changes in future foreign exchange rates. The fund’s risks in using these contracts include movement in the values of the foreign currencies relative to the U.S. dollar and the ability of the counterparties to fulfill their obligations under the contracts. The fund mitigates its counterparty risk by entering into forward currency contracts only with a diverse group of prequalified counterparties, monitoring their financial strength, entering into master netting arrangements with its counterparties, and requiring its counterparties to transfer collateral as security for their performance. In the absence of a default, the collateral pledged or received by the fund cannot be repledged, resold, or rehypothecated. The master netting arrangements provide that, in the event of a counterparty’s default (including bankruptcy), the fund may terminate the forward currency contracts, determine the net amount owed by either party in accordance with its master netting arrangements, and sell or retain any collateral held up to the net amount owed to the fund under the master netting arrangements. The forward currency contracts contain provisions whereby a counterparty may terminate open contracts if the fund’s net assets decline below a certain level, triggering a payment by the fund if the fund is in a net liability position at the time of the termination. The payment amount would be reduced by any collateral the fund has pledged. Any assets pledged as collateral for open contracts are noted in the Statement of Net Assets. The value of collateral received or pledged is compared daily to the value of the forward currency contracts exposure with each counterparty, and any difference, if in excess of a specified minimum transfer amount, is adjusted and settled within two business days.
Forward currency contracts are valued at their quoted daily prices obtained from an independent third party, adjusted for currency risk based on the expiration date of each contract. The notional amounts of the contracts are not recorded in the Statement of Net Assets. Fluctuations in the value of the contracts are recorded in the Statement of Assets and Liabilities as an asset (liability) and in the Statement of Operations as unrealized appreciation (depreciation) until the contracts are closed, when they are recorded as realized forward currency contract gains (losses).
During the year ended September 30, 2019, the fund’s average investment in forward currency contracts represented 22% of net assets, based on the average of notional amounts at each quarter-end during the period.
27
Emerging Markets Bond Fund
5. Swap Contracts: The fund invests in credit default swaps to adjust the overall credit risk of the fund or to actively overweight or underweight credit risk to a specific issuer or group of issuers. The fund may sell credit protection through credit default swaps to simulate investments in long positions that are either unavailable or considered to be less attractively priced in the bond market. The fund may purchase credit protection through credit default swaps to reduce credit exposure to a given issuer or issuers. Under the terms of the swaps, an up-front payment may be exchanged between the seller and buyer. In addition, the seller of the credit protection receives a periodic payment of premium from the buyer that is a fixed percentage applied to a notional amount. If, for example, the reference entity is subject to a credit event (such as bankruptcy, failure to pay, or obligation acceleration) during the term of the swap, the seller agrees to either physically settle or cash settle the swap contract. If the swap is physically settled, the seller agrees to pay the buyer an amount equal to the notional amount and take delivery of a debt instrument of the reference issuer with a par amount equal to such notional amount. If the swap is cash settled, the seller agrees to pay the buyer the difference between the notional amount and the final price for the relevant debt instrument, as determined either in a market auction or pursuant to a pre-agreed-upon valuation procedure.
The fund enters into interest rate swap transactions to adjust the fund’s sensitivity to changes in interest rates and maintain the ability to generate income at prevailing market rates. Under the terms of the swaps, one party pays the other an amount that is a fixed percentage rate applied to a notional amount. In return, the counterparty agrees to pay a floating rate, which is reset periodically based on short-term interest rates, applied to the same notional amount.
The notional amounts of swap contracts are not recorded in the Statement of Net Assets. Swaps are valued daily based on market quotations received from independent pricing services or recognized dealers and the change in value is recorded in the Statement of Assets and Liabilities as an asset (liability) and in the Statement of Operations as unrealized appreciation (depreciation) until the seller of credit protection is required to take delivery (or, in a cash settled swap, pay the settlement amount determined) upon occurrence of a credit event, periodic payments are made, or the swap terminates, at which time realized gain (loss) is recorded. The net premium to be received or paid by the fund under swap contracts is accrued daily and recorded as realized gain (loss) over the life of the contract.
The primary risk associated with selling credit protection is that, upon the occurrence of a defined credit event, the market value of the debt instrument received by the fund (or, in a cash settled swap, the debt instruments used to determine the settlement payment by the fund) will be significantly less than the amount paid by the fund and, in a physically settled swap, the fund may receive an illiquid debt instrument. A risk associated with all types of swaps is the possibility that a counterparty may default on its obligation to pay net amounts due to the fund. The fund’s maximum amount subject to counterparty risk is the unrealized appreciation on the swap contract. The fund mitigates its counterparty risk by entering into swaps only with a diverse group of prequalified counterparties, monitoring their financial strength, entering into master netting arrangements with its counterparties, and requiring its counterparties to transfer collateral as security for their performance. In the absence of a default, the collateral pledged or received by the fund cannot be repledged, resold, or rehypothecated. In the event of a counterparty’s default (including bankruptcy), the fund may terminate any swap contracts with that counterparty, determine the net amount owed by either party in accordance with its master netting arrangements, and sell or retain any collateral held up to the
28
Emerging Markets Bond Fund
net amount owed to the fund under the master netting arrangements. The swap contracts contain provisions whereby a counterparty may terminate open contracts if the fund’s net assets decline below a certain level, triggering a payment by the fund if the fund is in a net liability position at the time of the termination. The payment amount would be reduced by any collateral the fund has pledged. Any securities pledged as collateral for open contracts are noted in the Statement of Net Assets. The value of collateral received or pledged is compared daily to the value of the swap contracts exposure with each counterparty, and any difference, if in excess of a specified minimum transfer amount, is adjusted and settled within two business days.
The fund enters into centrally cleared interest rate swaps to achieve the same objectives specified with respect to the equivalent over-the-counter swaps but with less counterparty risk because a regulated clearinghouse is the counterparty instead of the clearing broker or executing broker. The clearinghouse imposes initial margin requirements to secure the fund’s performance, and requires daily settlement of variation margin representing changes in the market value of each contract. To further mitigate counterparty risk, the fund trades with a diverse group of prequalified executing brokers; monitors the financial strength of its clearing brokers, executing brokers, and clearinghouse; and has entered into agreements with its clearing brokers and executing brokers.
During the year ended September 30, 2019, the fund’s average amounts of investments in credit protection sold and credit protection purchased represented 7% and 4% of net assets, respectively, based on the average of notional amounts at each quarter-end during the period. The average amount of investments in interest rate swaps represented 2% of net assets, based on the average of notional amounts at each quarter-end during the period. The fund has no open interest rate swap contracts at September 30, 2019.
6. Options: The fund invests in options on foreign currency, which are transacted over-the-counter (OTC) and not on an exchange. Unlike exchange-traded options, which are standardized with respect to the underlying instrument, expiration date, contract size, and strike price, the terms of OTC options generally are established through negotiation with the other party to the option contract. Although this type of arrangement allows the purchaser or writer greater flexibility to tailor an option to its needs, OTC options generally involve greater credit risk than exchange-traded options. Credit risk involves the possibility that a counterparty may default on its obligation to pay net amounts due to the fund. The fund mitigates its counterparty risk by entering into options with a diverse group of prequalified counterparties and monitoring their financial strength. The primary risk associated with purchasing options on foreign currency is that the value of the underlying foreign currencies may move in such a way that the option is out-of-the-money (the exercise price of the option exceeds the value of the underlying investment), the position is worthless at expiration, and the fund loses the premium paid. The primary risk associated with selling options on foreign currency is that the value of the underlying foreign currencies may move in such a way that the option is in-the-money (the exercise price of the option exceeds the value of the underlying investment), the counterparty exercises the option, and the fund loses an amount equal to the market value of the option written less the premium received. Options on foreign currency are valued daily based on market quotations received from independent pricing services or recognized dealers. The premium paid for a purchased option is recorded in the Statement of Assets and Liabilities as an asset that is subsequently adjusted daily to the current market value of the option purchased. The premium received for a written
29
Emerging Markets Bond Fund
option is recorded in the Statement of Assets and Liabilities as an asset with an equal liability that is subsequently adjusted daily to the current market value of the option written. Fluctuations in the value of the options are recorded as unrealized appreciation (depreciation) until expired, closed, or exercised, at which time realized gains (losses) are recognized.
During the year ended September 30, 2019, the fund’s average value of options purchased and options written represented less than 1% and 0% of net assets, respectively, based on the average market values at each quarter-end during the period.
7. Federal Income Taxes: The fund intends to continue to qualify as a regulated investment company and distribute all of its taxable income. Management has analyzed the fund’s tax positions taken for all open federal income tax years (September 30, 2016–2019), and has concluded that no provision for federal income tax is required in the fund’s financial statements.
8. Distributions: Distributions to shareholders are recorded on the ex-dividend date. Distributions are determined on a tax basis and may differ from net investment income and realized capital gains for financial reporting purposes.
9. Credit Facility: The fund and certain other funds managed by The Vanguard Group (“Vanguard”) participate in a $4.3 billion committed credit facility provided by a syndicate of lenders pursuant to a credit agreement that may be renewed annually; each fund is individually liable for its borrowings, if any, under the credit facility. Borrowings may be utilized for temporary and emergency purposes, and are subject to the fund’s regulatory and contractual borrowing restrictions. The participating funds are charged administrative fees and an annual commitment fee of 0.10% of the undrawn amount of the facility; these fees are allocated to the funds based on a method approved by the fund’s board of trustees and included in Management and Administrative expenses on the fund’s Statement of Operations. Any borrowings under this facility bear interest at a rate based upon the higher of the one-month London Interbank Offered Rate, federal funds effective rate, or overnight bank funding rate plus an agreed-upon spread.
The fund had no borrowings outstanding at September 30, 2019, or at any time during the period then ended.
10. Other: Interest income includes income distributions received from Vanguard Market Liquidity Fund and is accrued daily. Premiums and discounts on debt securities purchased are amortized and accreted, respectively, to interest income over the lives of the respective securities. Security transactions are accounted for on the date securities are bought or sold. Costs used to determine realized gains (losses) on the sale of investment securities are those of the specific securities sold.
Each class of shares has equal rights as to assets and earnings, except that each class separately bears certain class-specific expenses related to maintenance of shareholder accounts (included in Management and Administrative expenses) and shareholder reporting. Marketing and distribution expenses are allocated to each class of shares based on a method approved by the board of trustees. Income, other non-class-specific expenses, and gains and losses on investments are allocated to each class of shares based on its relative net assets.
30
Emerging Markets Bond Fund
B. In accordance with the terms of a Funds’ Service Agreement (the “FSA”) between Vanguard and the fund, Vanguard furnishes to the fund investment advisory, corporate management, administrative, marketing, and distribution services at Vanguard’s cost of operations (as defined by the FSA). These costs of operations are allocated to the fund based on methods and guidelines approved by the board of trustees. Vanguard does not require reimbursement in the current period for certain costs of operations (such as deferred compensation/benefits and risk/insurance costs); the fund’s liability for these costs of operations is included in Payables to Vanguard on the Statement of Assets and Liabilities. All other costs of operations payable to Vanguard are generally settled twice a month.
Upon the request of Vanguard, the fund may invest up to 0.40% of its net assets as capital in Vanguard. At September 30, 2019, the fund had contributed to Vanguard capital in the amount of $16,000, change to less than 0.01% of the fund’s net assets and 0.01% of Vanguard’s capital received pursuant to the FSA. The fund’s trustees and officers are also directors and employees, respectively, of Vanguard.
C. Various inputs may be used to determine the value of the fund’s investments. These inputs are summarized in three broad levels for financial statement purposes. The inputs or methodologies used to value securities are not necessarily an indication of the risk associated with investing in those securities.
Level 1—Quoted prices in active markets for identical securities.
Level 2—Other significant observable inputs (including quoted prices for similar securities, interest rates, prepayment speeds, credit risk, etc.).
Level 3—Significant unobservable inputs (including the fund’s own assumptions used to determine the fair value of investments). Any investments valued with significant unobservable inputs are noted on the Statement of Net Assets.
The following table summarizes the market value of the fund’s investments and derivatives as of September 30, 2019, based on the inputs used to value them:
| | Level 1 | | Level 2 | | Level 3 | |
Investments | | ($000 | ) | ($000 | ) | ($000 | ) |
U.S. Government and Agency Obligations | | — | | 3,936 | | — | |
Corporate Bonds | | — | | 4,517 | | — | |
Sovereign Bonds | | — | | 335,602 | | — | |
Temporary Cash Investments | | 17,108 | | — | | — | |
Options Purchased | | 1,680 | | — | | — | |
Futures Contracts—Assets1 | | 20 | | — | | — | |
Futures Contracts—Liabilities1 | | (13 | ) | — | | — | |
Forward Currency Contracts—Assets | | | | 916 | | — | |
Forward Currency Contracts—Liabilities | | | | (378 | ) | — | |
Swap Contracts—Assets | | — | | 20 | | — | |
Swap Contracts—Liabilities | | — | | (9 | ) | — | |
Total | | 18,795 | | 344,604 | | — | |
1 Represents variation margin on the last day of the reporting period.
31
Emerging Markets Bond Fund
D. At September 30, 2019, the fair values of derivatives were reflected in the Statement of Assets and Liabilities as follows:
| | Credit | | Currency | | Interest Rate | | | |
| | Contracts | | Contracts | | Contracts | | Total | |
Statement of Assets and Liabilities Caption | | ($000 | ) | ($000 | ) | ($000 | ) | ($000 | ) |
Options Purchased | | — | | 1,680 | | — | | 1,680 | |
Variation Margin Receivable—Futures Contracts | | — | | — | | 20 | | 20 | |
Unrealized Appreciation—Forward Currency Contracts | | — | | 916 | | — | | 916 | |
Unrealized Appreciation—OTC Swap Contracts | | 20 | | — | | — | | 20 | |
Total Assets | | 20 | | 2,596 | | 20 | | 2,636 | |
| | | | | | | | | |
Variation Margin Payable—Futures Contracts | | — | | — | | (13 | ) | (13 | ) |
Unrealized Depreciation—Forward Currency Contracts | | — | | (378 | ) | — | | (378 | ) |
Unrealized Depreciation—OTC Swap Contracts | | (9 | ) | — | | — | | (9 | ) |
Total Liabilities | | (9 | ) | (378 | ) | (13 | ) | (400 | ) |
Realized net gain (loss) and the change in unrealized appreciation (depreciation) on derivatives for the year ended September 30, 2019, were:
| | Credit | | Currency | | Interest Rate | | | |
| | Contracts | | Contracts | | Contracts | | Total | |
Realized Net Gain (Loss) on Derivatives | | ($000 | ) | ($000 | ) | ($000 | ) | ($000 | ) |
Futures Contracts | | — | | — | | 744 | | 744 | |
Options Purchased | | — | | (264 | ) | — | | (264 | ) |
Swap Contracts | | (133 | ) | — | | 486 | | 353 | |
Forward Currency Contracts | | — | | 1,059 | | — | | 1,059 | |
Realized Net Gain (Loss) on Derivatives | | (133 | ) | 795 | | 1,230 | | 1,892 | |
| | | | | | | | | |
Change in Unrealized Appreciation (Depreciation) on Derivatives | | | | | | | |
Futures Contracts | | — | | — | | 78 | | 78 | |
Options Purchased | | — | | 215 | | — | | 215 | |
Swap Contracts | | (34 | ) | — | | 25 | | (9 | ) |
Forward Currency Contracts | | — | | 517 | | — | | 517 | |
Change in Unrealized Appreciation (Depreciation) on Derivatives | | (34 | ) | 732 | | 103 | | 801 | |
32
Emerging Markets Bond Fund
E. Permanent differences between book-basis and tax-basis components of net assets are reclassified among capital accounts in the financial statements to reflect their tax character. These reclassifications have no effect on net assets or net asset value per share. As of period end, permanent differences primarily attributable to the accounting for foreign currency transactions, distributions in connection with fund share redemptions, and swap agreements were reclassified between the following accounts:
| | Amount | |
| | ($000 | ) |
Paid-in Capital | | 693 | |
Total Distributable Earnings (Loss) | | (693 | ) |
Temporary differences between book-basis and tax-basis components of total distributable earnings (loss) arise when certain items of income, gain, or loss are recognized in different periods for financial statement and tax purposes; these differences will reverse at some time in the future. The differences are primarily related to the tax deferral of losses on wash sales and straddles; the realization of unrealized gains or losses on certain futures contracts, forward currency contracts and options; payables for distributions; and the tax recognition of gain or loss from foreign currency hedges. As of period end, the tax-basis components of total distributable earnings (loss) are detailed in the table as follows:
| | Amount | |
| | ($000 | ) |
Undistributed Ordinary Income | | 7,217 | |
Undistributed Long-Term Gains | | 450 | |
Capital Loss Carryforwards (Non-expiring) | | — | |
Net Unrealized Gains (Losses) | | 1,941 | |
As of September 30, 2019, gross unrealized appreciation and depreciation for investments and derivatives based on cost for U.S. federal income tax purposes were as follows:
| | Amount | |
| | ($000 | ) |
Tax Cost | | 359,341 | |
Gross Unrealized Appreciation | | 9,778 | |
Gross Unrealized Depreciation | | (7,837 | ) |
Net Unrealized Appreciation (Depreciation) | | 1,941 | |
33
Emerging Markets Bond Fund
F. During the year ended September 30, 2019, the fund purchased $635,912,000 of investment securities and sold $423,060,000 of investment securities, other than U.S. government securities and temporary cash investments. Purchases and sales of U.S. government securities were $23,826,000 and $20,092,000, respectively.
G. Capital share transactions for each class of shares were:
| | Year Ended September 30, | |
| | 2019 | | 2018 | |
| | Amount | | Shares | | Amount | | Shares | |
| | ($000 | ) | (000 | ) | ($000 | ) | (000 | ) |
Investor Shares | | | | | | | | | |
Issued | | 63,399 | | 5,855 | | 53,674 | | 5,051 | |
Issued in Lieu of Cash Distributions | | 1,586 | | 147 | | 1,989 | | 189 | |
Redeemed | | (28,388 | ) | (2,633 | ) | (41,244 | ) | (4,001 | ) |
Net Increase (Decrease)—Investor Shares | | 36,597 | | 3,369 | | 14,419 | | 1,239 | |
Admiral Shares1 | | | | | | | | | |
Issued | | 287,665 | | 11,301 | | 97,472 | | 4,015 | |
Issued in Lieu of Cash Distributions | | 4,933 | | 195 | | 1,453 | | 60 | |
Redeemed | | (71,834 | ) | (2,908 | ) | (21,914 | ) | (909 | ) |
Net Increase (Decrease)—Admiral Shares | | 220,764 | | 8,588 | | 77,011 | | 3,166 | |
1 Inception was December 6, 2017, for Admiral Shares.
H. Management has determined that no events or transactions occurred subsequent to September 30, 2019, that would require recognition or disclosure in these financial statements.
34
Report of Independent Registered Public Accounting Firm
To the Board of Trustees of Vanguard Malvern Funds and Shareholders of Vanguard Emerging Markets Bond Fund
Opinion on the Financial Statements
We have audited the accompanying statement of net assets and statement of assets and liabilities of Vanguard Emerging Markets Bond Fund (one of the funds constituting Vanguard Malvern Funds, referred to hereafter as the “Fund”) as of September 30, 2019, the related statement of operations for the year ended September 30, 2019, the statement of changes in net assets for each of the two years in the period ended September 30, 2019, including the related notes, and the financial highlights for each of the periods indicated therein (collectively referred to as the “financial statements”). In our opinion, the financial statements present fairly, in all material respects, the financial position of the Fund as of September 30, 2019, the results of its operations for the year then ended, the changes in its net assets for each of the two years in the period ended September 30, 2019 and the financial highlights for each of the periods indicated therein in conformity with accounting principles generally accepted in the United States of America.
Basis for Opinion
These financial statements are the responsibility of the Fund’s management. Our responsibility is to express an opinion on the Fund’s financial statements based on our audits. We are a public accounting firm registered with the Public Company Accounting Oversight Board (United States) (“PCAOB”) and are required to be independent with respect to the Fund in accordance with the U.S. federal securities laws and the applicable rules and regulations of the Securities and Exchange Commission and the PCAOB.
We conducted our audits of these financial statements in accordance with the standards of the PCAOB. Those standards require that we plan and perform the audit to obtain reasonable assurance about whether the financial statements are free of material misstatement, whether due to error or fraud.
Our audits included performing procedures to assess the risks of material misstatement of the financial statements, whether due to error or fraud, and performing procedures that respond to those risks. Such procedures included examining, on a test basis, evidence regarding the amounts and disclosures in the financial statements. Our audits also included evaluating the accounting principles used and significant estimates made by management, as well as evaluating the overall presentation of the financial statements. Our procedures included confirmation of securities owned as of September 30, 2019 by correspondence with the custodian, transfer agent and brokers; when replies were not received from brokers, we performed other auditing procedures. We believe that our audits provide a reasonable basis for our opinion.
/s/PricewaterhouseCoopers LLP
Philadelphia, Pennsylvania
November 19, 2019
We have served as the auditor of one or more investment companies in The Vanguard Group of Funds since 1975.
35
Special 2019 tax information (unaudited) for Vanguard Emerging Markets Bond Fund
This information for the fiscal year ended September 30, 2019, is included pursuant to provisions of the Internal Revenue Code.
The fund distributed $44,000 as capital gain dividends (20% rate gain distributions) to shareholders during the fiscal year.
36
This page intentionally left blank.
This page intentionally left blank.
The People Who Govern Your Fund
The trustees of your mutual fund are there to see that the fund is operated and managed in your best interests since, as a shareholder, you are a part owner of the fund. Your fund’s trustees also serve on the board of directors of The Vanguard Group, Inc., which is owned by the Vanguard funds and provides services to them.
A majority of Vanguard’s board members are independent, meaning that they have no affiliation with Vanguard or the funds they oversee, apart from the sizable personal investments they have made as private individuals. The independent board members have distinguished backgrounds in business, academia, and public service. Each of the trustees and executive officers oversees 212 Vanguard funds.
Information for each trustee and executive officer of the fund appears below. That information, as well as the Vanguard fund count, is as of the date on the cover of this fund report. The mailing address of the trustees and officers is P.O. Box 876, Valley Forge, PA 19482. More information about the trustees is in the Statement of Additional Information, which can be obtained, without charge, by contacting Vanguard at 800-662-7447, or online at vanguard.com.
Interested Trustee1
Mortimer J. Buckley
Born in 1969. Trustee since January 2018. Principal occupation(s) during the past five years and other experience: chairman of the board (January 2019–present) of Vanguard and of each of the investment companies served by Vanguard; chief executive officer (January 2018–present) of Vanguard; chief executive officer, president, and trustee (January 2018–present) of each of the investment companies served by Vanguard; president and director (2017–present) of Vanguard; and president (February 2018–present) of Vanguard Marketing Corporation. Chief investment officer (2013–2017), managing director (2002–2017), head of the Retail Investor Group (2006–2012), and chief information officer (2001–2006) of Vanguard. Chairman of the board (2011–2017) and trustee (2009–2017) of the Children’s Hospital of Philadelphia; trustee (2018–present) of The Shipley School.
Independent Trustees
Emerson U. Fullwood
Born in 1948. Trustee since January 2008. Principal occupation(s) during the past five years and other experience: executive chief staff and marketing officer for North America and corporate vice president (retired 2008) of Xerox Corporation (document management products and services). Former president of the Worldwide Channels Group, Latin America, and Worldwide Customer Service and executive chief staff officer of Developing Markets of Xerox. Executive in residence and 2009–2010 Distinguished Minett Professor at the Rochester Institute of Technology. Director of SPX FLOW, Inc. (multi-industry manufacturing). Director of the University of Rochester Medical Center, the Monroe Community College Foundation, the United Way of Rochester, North Carolina A&T University, and Roberts Wesleyan College. Trustee of the University of Rochester.
Amy Gutmann
Born in 1949. Trustee since June 2006. Principal occupation(s) during the past five years and other experience: president (2004–present) of the University of Pennsylvania. Christopher H. Browne Distinguished Professor of Political Science, School of Arts and Sciences, and professor of communication, Annenberg School for Communication, with secondary faculty appointments in the Department of Philosophy, School of Arts and Sciences, and at the Graduate School of Education, University of Pennsylvania. Trustee of the National Constitution Center.
F. Joseph Loughrey
Born in 1949. Trustee since October 2009. Principal occupation(s) during the past five years and other experience: president and chief operating officer (retired 2009) and vice chairman of the board (2008–2009) of Cummins Inc. (industrial machinery). Chairman of the board of Hillenbrand, Inc. (specialized consumer services), and the Lumina Foundation.
1 Mr. Buckley is considered an “interested person,” as defined in the Investment Company Act of 1940, because he is an officer of the Vanguard funds.
Director of the V Foundation and Oxfam America. Member of the advisory council for the College of Arts and Letters and chair of the advisory board to the Kellogg Institute for International Studies, both at the University of Notre Dame.
Mark Loughridge
Born in 1953. Trustee since March 2012. Principal occupation(s) during the past five years and other experience: senior vice president and chief financial officer (retired 2013) of IBM (information technology services). Fiduciary member of IBM’s Retirement Plan Committee (2004–2013), senior vice president and general manager (2002–2004) of IBM Global Financing, vice president and controller (1998–2002) of IBM, and a variety of other prior management roles at IBM. Member of the Council on Chicago Booth.
Scott C. Malpass
Born in 1962. Trustee since March 2012. Principal occupation(s) during the past five years and other experience: chief investment officer (1989–present) and vice president (1996–present) of the University of Notre Dame. Assistant professor of finance at the Mendoza College of Business, University of Notre Dame, and member of the Notre Dame 403(b) Investment Committee. Chairman of the board of TIFF Advisory Services, Inc. Member of the board of Catholic Investment Services, Inc. (investment advisors) and the board of superintendence of the Institute for the Works of Religion.
Deanna Mulligan
Born in 1963. Trustee since January 2018. Principal occupation(s) during the past five years and other experience: president (2010–present) and chief executive officer (2011–present) of The Guardian Life Insurance Company of America. Chief operating officer (2010–2011) and executive vice president (2008–2010) of Individual Life and Disability of The Guardian Life Insurance Company of America. Member of the board of The Guardian Life Insurance Company of America, the American Council of Life Insurers, the Partnership for New York City (business leadership), and the Committee Encouraging Corporate Philanthropy. Trustee of the Economic Club of New York and the Bruce Museum (arts and science). Member of the Advisory Council for the Stanford Graduate School of Business.
André F. Perold
Born in 1952. Trustee since December 2004. Principal occupation(s) during the past five years and other experience: George Gund Professor of Finance and Banking, Emeritus at the Harvard Business School (retired 2011). Chief investment officer and co-managing partner of HighVista Strategies LLC (private investment firm). Board of advisors and investment committee member of the Museum of Fine Arts Boston. Board member (2018–present) of RIT Capital Partners (investment firm); investment committee member of Partners Health Care System.
Sarah Bloom Raskin
Born in 1961. Trustee since January 2018. Principal occupation(s) during the past five years and other experience: deputy secretary (2014–2017) of the United States Department of the Treasury. Governor (2010–2014) of the Federal Reserve Board. Commissioner (2007–2010) of financial regulation for the State of Maryland. Member of the board of directors (2012–2014) of Neighborhood Reinvestment Corporation. Director (2017–present) of i(x) Investments, LLC; director (2017–present) of Reserve Trust. Rubinstein Fellow (2017–present) of Duke University; trustee (2017–present) of Amherst College.
Peter F. Volanakis
Born in 1955. Trustee since July 2009. Principal occupation(s) during the past five years and other experience: president and chief operating officer (retired 2010) of Corning Incorporated (communications equipment) and director of Corning Incorporated (2000–2010) and Dow Corning (2001–2010). Director (2012) of SPX Corporation (multi-industry manufacturing). Overseer of the Amos Tuck School of Business Administration, Dartmouth College (2001–2013). Chairman of the board of trustees of Colby-Sawyer College. Member of the board of Hypertherm Inc. (industrial cutting systems, software, and consumables).
Executive Officers
Glenn Booraem
Born in 1967. Principal occupation(s) during the past five years and other experience: principal of Vanguard. Investment stewardship officer (2017–present), treasurer (2015–2017), controller (2010–2015), and assistant controller (2001–2010) of each of the investment companies served by Vanguard.
Christine M. Buchanan
Born in 1970. Principal occupation(s) during the past five years and other experience: principal of Vanguard and global head of Fund Administration at Vanguard. Treasurer (2017–present) of each of the investment companies served by Vanguard. Partner (2005–2017) at KPMG LLP (audit, tax, and advisory services).
Thomas J. Higgins
Born in 1957. Principal occupation(s) during the past five years and other experience: principal of Vanguard. Chief financial officer (2008–present) and treasurer (1998–2008) of each of the investment companies served by Vanguard.
Peter Mahoney
Born in 1974. Principal occupation(s) during the past five years and other experience: principal of Vanguard. Controller (2015–present) of each of the investment companies served by Vanguard. Head of International Fund Services (2008–2014) at Vanguard.
Anne E. Robinson
Born in 1970. Principal occupation(s) during the past five years and other experience: general counsel (2016–present) of Vanguard. Secretary (2016–present) of Vanguard and of each of the investment companies served by Vanguard. Managing director (2016–present) of Vanguard. Director and senior vice president (2016–2018) of Vanguard Marketing Corporation. Managing director and general counsel of Global Cards and Consumer Services (2014–2016) at Citigroup. Counsel (2003–2014) at American Express.
Michael Rollings
Born in 1963. Principal occupation(s) during the past five years and other experience: finance director (2017–present) and treasurer (2017) of each of the investment companies served by Vanguard. Managing director (2016–present) of Vanguard. Chief financial officer (2016–present) of Vanguard. Director (2016–present) of Vanguard Marketing Corporation. Executive vice president and chief financial officer (2006–2016) of MassMutual Financial Group.
John E. Schadl
Born in 1972. Principal occupation(s) during the past five years and other experience: principal of Vanguard. Chief compliance officer (2019–present) of Vanguard and of each of the investment companies served by Vanguard. Assistant vice president (May 2019–present) of Vanguard Marketing Corporation.
Vanguard Senior Management Team |
| |
Joseph Brennan | Chris D. McIsaac |
Mortimer J. Buckley | James M. Norris |
Gregory Davis | Thomas M. Rampulla |
John James | Karin A. Risi |
Martha G. King | Anne E. Robinson |
John T. Marcante | Michael Rollings |
| 
P.O. Box 2600 Valley Forge, PA 19482-2600 |
Connect with Vanguard® > vanguard.com
Fund Information > 800-662-7447
Direct Investor Account Services > 800-662-2739
Institutional Investor Services > 800-523-1036
Text Telephone for People
Who Are Deaf or Hard of Hearing > 800-749-7273
This material may be used in conjunction with the offering of shares of any Vanguard fund only if preceded or accompanied by the fund’s current prospectus.
All comparative mutual fund data are from Morningstar, Inc., unless otherwise noted.
You can obtain a free copy of Vanguard’s proxy voting guidelines by visiting vanguard.com/proxyreporting or by calling Vanguard at 800-662-2739. The guidelines are also available from the SEC’s website, www.sec.gov. In addition, you may obtain a free report on how your fund voted the proxies for securities it owned during the 12 months ended June 30. To get the report, visit either vanguard.com/proxyreporting or www.sec.gov.
You can review information about your fund on the SEC’s website, and you can receive copies of this information, for a fee, by sending a request via email addressed to publicinfo@sec.gov.
Source for Bloomberg Barclays indexes: Bloomberg Index Services Limited. Copyright 2019, Bloomberg. All rights reserved.
| © 2019 The Vanguard Group, Inc. All rights reserved. Vanguard Marketing Corporation, Distributor. Q14310 112019 |

Annual Report | September 30, 2019 Vanguard Institutional Bond Funds |
Vanguard Institutional Short-Term Bond Fund Vanguard Institutional Intermediate-Term Bond Fund See the inside front cover for important information about access to your fund’s annual and semiannual shareholder reports. |
Important information about access to shareholder reports
Beginning on January 1, 2021, as permitted by regulations adopted by the Securities and Exchange Commission, paper copies of your fund’s annual and semiannual shareholder reports will no longer be sent to you by mail, unless you specifically request them. Instead, you will be notified by mail each time a report is posted on the website and will be provided with a link to access the report.
If you have already elected to receive shareholder reports electronically, you will not be affected by this change and do not need to take any action. You may elect to receive shareholder reports and other communications from the fund electronically by contacting your financial intermediary (such as a broker-dealer or bank) or, if you invest directly with the fund, by calling Vanguard at one of the phone numbers on the back cover of this report or by logging on to vanguard.com.
You may elect to receive paper copies of all future shareholder reports free of charge. If you invest through a financial intermediary, you can contact the intermediary to request that you continue to receive paper copies. If you invest directly with the fund, you can call Vanguard at one of the phone numbers on the back cover of this report or log on to vanguard.com. Your election to receive paper copies will apply to all the funds you hold through an intermediary or directly with Vanguard.
Contents | |
| |
A Note From Our Chairman | 1 |
Your Fund’s Performance at a Glance | 2 |
About Your Fund’s Expenses | 3 |
Institutional Short-Term Bond Fund | 5 |
Institutional Intermediate-Term Bond Fund | 39 |
Please note: The opinions expressed in this report are just that—informed opinions. They should not be considered promises or advice. Also, please keep in mind that the information and opinions cover the period through the date on the front of this report. Of course, the risks of investing in your fund are spelled out in the prospectus.
A Note From Our Chairman

Tim Buckley
Chairman and Chief Executive Officer
Dear Shareholder,
Recent volatility in financial markets—affecting stocks, bonds, and commodities—has been a good reminder of the wise old adage, “Never keep all your eggs in one basket.” Maintaining balance and diversification in your investment portfolio can help to both limit risk and set you up for long-term success.
It’s understandable why some investors might become complacent after a long market run-up like the one that lifted stock prices, especially U.S. stock prices, in the years following the global financial crisis. But failing to rebalance regularly can leave a portfolio with a much different mix of assets than intended and, often, more risk than intended.
Balance across and diversification within asset classes are powerful tools for managing risk and achieving your investment goals. A portfolio’s allocation will determine a large portion of its long-term return and also the majority of its volatility risk. A well-diversified portfolio is less vulnerable to significant swings in the performance of any one segment of the asset classes in which it invests.
Balance and diversification will never eliminate the risk of loss, nor will they guarantee positive returns in a declining market. But they should reduce the chance that you’ll suffer disproportionate losses in one particular high-flying asset class or sector when it comes back to earth. And exposure to all key market components should give you at least some participation in the sectors that are performing best at any given time.
Vanguard is committed to helping you achieve balance and diversification in your portfolios to help meet your investment goals. We thank you for your continued loyalty.
Sincerely, | |
| |

| |
Mortimer J. Buckley | |
Chairman and Chief Executive Officer | |
October 14, 2019 | |
1
Your Fund’s Performance at a Glance
· For the 12 months ended September 30, 2019, Vanguard Institutional Intermediate-Term Bond Fund returned 7.66% and Vanguard Institutional Short-Term Bond Fund returned 4.81%. The Intermediate-Term Fund lagged its benchmark, the Bloomberg Barclays U.S. Intermediate Aggregate ex Baa Index (+7.84%). The Short-Term Bond Fund outperformed its benchmark, the Bloomberg Barclays U.S. Government/Credit 1–3 Year ex Baa Index (+4.53%).
· For both funds, relative results were hurt by the mix of their bonds’ terms to maturity. This yield curve positioning was designed to exploit a return to a more normal yield curve, where yields get progressively higher as maturities rise. Instead, the curve flattened.
· Security selection outside of the U.S. Treasury market benefited both funds.
· The funds’ potential annual rates of income, as measured by their 30-day SEC yields, declined along with bond yields. The Intermediate-Term Fund’s yield fell 75 basis points to 2.31%. The Short-Term Fund’s yield fell 42 basis points to 2.33%. (A basis point is one-hundredth of a percentage point.)
· The Short-Term Fund regularly uses derivatives to limit portfolio risks. The fund’s active derivative positions had a net negative impact on performance.
Market Barometer
| | | | Average Annual Total Returns |
| | | | Periods Ended September 30, 2019 |
| | One Year | | Three Years | | Five Years |
Stocks | | | | | | |
Russell 1000 Index (Large-caps) | | 3.87% | | 13.19% | | 10.62% |
Russell 2000 Index (Small-caps) | | -8.89 | | 8.23 | | 8.19 |
Russell 3000 Index (Broad U.S. market) | | 2.92 | | 12.83 | | 10.44 |
FTSE All-World ex US Index (International) | | -1.12 | | 6.46 | | 3.24 |
| | | | | | |
Bonds | | | | | | |
Bloomberg Barclays U.S. Aggregate Bond Index (Broad taxable market) | | 10.30% | | 2.92% | | 3.38% |
Bloomberg Barclays Municipal Bond Index (Broad tax-exempt market) | | 8.55 | | 3.19 | | 3.66 |
FTSE Three-Month U.S. Treasury Bill Index | | 2.36 | | 1.52 | | 0.95 |
| | | | | | |
CPI | | | | | | |
Consumer Price Index | | 1.71% | | 2.07% | | 1.53% |
2
About Your Fund’s Expenses
As a shareholder of the fund, you incur ongoing costs, which include costs for portfolio management, administrative services, and shareholder reports (like this one), among others. Operating expenses, which are deducted from a fund’s gross income, directly reduce the investment return of the fund.
A fund’s expenses are expressed as a percentage of its average net assets. This figure is known as the expense ratio. The following examples are intended to help you understand the ongoing costs (in dollars) of investing in your fund and to compare these costs with those of other mutual funds. The examples are based on an investment of $1,000 made at the beginning of the period shown and held for the entire period.
The accompanying table illustrates your fund’s costs in two ways:
· Based on actual fund return. This section helps you to estimate the actual expenses that you paid over the period. The “Ending Account Value” shown is derived from the fund’s actual return, and the third column shows the dollar amount that would have been paid by an investor who started with $1,000 in the fund. You may use the information here, together with the amount you invested, to estimate the expenses that you paid over the period.
To do so, simply divide your account value by $1,000 (for example, an $8,600 account value divided by $1,000 = 8.6), then multiply the result by the number given for your fund under the heading “Expenses Paid During Period.”
· Based on hypothetical 5% yearly return. This section is intended to help you compare your fund’s costs with those of other mutual funds. It assumes that the fund had a yearly return of 5% before expenses, but that the expense ratio is unchanged. In this case—because the return used is not the fund’s actual return—the results do not apply to your investment. The example is useful in making comparisons because the Securities and Exchange Commission requires all mutual funds to calculate expenses based on a 5% return. You can assess your fund’s costs by comparing this hypothetical example with the hypothetical examples that appear in shareholder reports of other funds.
Note that the expenses shown in the table are meant to highlight and help you compare ongoing costs only and do not reflect transaction costs incurred by the fund for buying and selling securities. Further, the expenses do not include any purchase, redemption, or account service fees described in the fund prospectus. If such fees were applied to your account, your costs would be higher. Your fund does not carry a “sales load.”
The calculations assume no shares were bought or sold during the period. Your actual costs may have been higher or lower, depending on the amount of your investment and the timing of any purchases or redemptions.
You can find more information about the fund’s expenses, including annual expense ratios, in the Financial Statements section of this report. For additional information on operating expenses and other shareholder costs, please refer to your fund’s current prospectus.
3
Six Months Ended September 30, 2019
| | Beginning | | Ending | | Expenses |
| | Account Value | | Account Value | | Paid During |
| | 3/31/2019 | | 9/30/2019 | | Period |
Based on Actual Fund Return | | | | | | |
Institutional Short-Term Bond Fund | | $1,000.00 | | $1,022.58 | | $0.10 |
Institutional Intermediate-Term Bond Fund | | $1,000.00 | | $1,036.73 | | $0.10 |
Based on Hypothetical 5% Yearly Return | | | | | | |
Institutional Short-Term Bond Fund | | $1,000.00 | | $1,024.97 | | $0.10 |
Institutional Intermediate-Term Bond Fund | | $1,000.00 | | $1,024.97 | | $0.10 |
The calculations are based on expenses incurred in the most recent six-month period. The funds’ annualized six-month expense ratios for that period are: for the Institutional Short-Term Bond Fund Institutional Plus Shares, 0.02%, and for the Institutional Intermediate-Term Bond Fund Institutional Plus Shares, 0.02%. The dollar amounts shown as “Expenses Paid” are equal to the annualized expense ratio multiplied by the average account value over the period, multiplied by the number of days in the most recent six-month period, then divided by the number of days in the most recent 12-month period (183/365).
4
Institutional Short-Term Bond Fund
Performance Summary
All of the returns in this report represent past performance, which is not a guarantee of future results that may be achieved by the fund. (Current performance may be lower or higher than the performance data cited. For performance data current to the most recent month-end, visit our website at vanguard.com/performance.) Note, too, that both investment returns and principal value can fluctuate widely, so an investor’s shares, when sold, could be worth more or less than their original cost. The returns shown do not reflect taxes that a shareholder would pay on fund distributions or on the sale of fund shares.
Cumulative Performance: September 30, 2009, Through September 30, 2019
Initial Investment of $10,000,000

| | | | Average Annual Total Returns | | |
| | | | Periods Ended September 30, 2019 | | |
| | | | | | Final Value |
| | | | One | | Five | | Ten | | of a $10,000,000 |
| | | | Year | | Years | | Years | | Investment |

| | Institutional Short-Term Bond Fund Institutional Plus Shares | | 4.81% | | 1.92% | | 1.85% | | $12,016,510 |

| | Bloomberg Barclays U.S. 1–3 Year Government/Credit ex Baa Index | | 4.53 | | 1.49 | | 1.40 | | 11,488,032 |

| | Spliced Bloomberg Barclays U.S. Aggregate Float Adjusted Index | | 10.44 | | 3.40 | | 3.78 | | 14,495,102 |
Spliced Bloomberg Barclays U.S. Aggregate Float Adjusted Index: Bloomberg Barclays U.S. Aggregate Bond Index through December 31, 2009; Bloomberg Barclays U.S. Aggregate Float Adjusted Index thereafter.
The fund is the successor to VFTC Short-Term Bond Trust (the predecessor trust), a collective trust managed by Vanguard Fiduciary Trust Company, an affiliate of The Vanguard Group, Inc. The predecessor trust transferred its assets to the fund in connection with the fund’s commencement of operations on or about June 19, 2015. The performance of the fund’s Institutional Plus Shares includes the performance of the predecessor trust prior to the commencement of the fund’s operations. The performance of the predecessor trust has not been adjusted to reflect the expenses of the fund’s Institutional Plus Shares. If the performance of the predecessor trust was adjusted to reflect the expenses of the fund’s Institutional Plus Shares, the predecessor trust’s performance would have been lower. The fund is managed with the same investment objective, strategies, policies, and risks as the predecessor trust. The predecessor trust was not an investment company registered under the Investment Company Act of 1940. If the predecessor trust had been an investment company, its performance may have been different.
See Financial Highlights for dividend and capital gains information.
5
Institutional Short-Term Bond Fund
Sector Diversification
As of September 30, 2019
Asset-Backed | | 43.0% |
Commercial Mortgage-Backed | | 3.2 |
Finance | | 18.8 |
Foreign | | 9.4 |
Industrial | | 5.7 |
Treasury/Agency | | 19.8 |
Utilities | | 0.1 |
The table reflects the fund’s market exposure. Any holdings in short-term reserves are excluded. The agency and mortgage-backed securities sectors may include issues from government-sponsored enterprises; such issues are generally not backed by the full faith and credit of the U.S. government.
6
Institutional Short-Term Bond Fund
Financial Statements
Statement of Net Assets
As of September 30, 2019
The fund files its complete schedule of portfolio holdings with the Securities and Exchange Commission (SEC) for the first and third quarters of each fiscal year as an exhibit to its reports on Form N-PORT. The fund’s Form N-PORT reports are available on the SEC’s website at www.sec.gov.
| | | | | | | Face | | Market | |
| | | | | Maturity | | Amount | | Value· | |
| | | Coupon | | Date | | ($000 | ) | ($000 | ) |
U.S. Government and Agency Obligations (19.2%) | | | | | | | | | |
U.S. Government Securities (11.1%) | | | | | | | | | |
| United States Treasury Note/Bond | | 2.750% | | 9/30/20 | | 211,000 | | 212,912 | |
| United States Treasury Note/Bond | | 2.500% | | 12/31/20 | | 150,000 | | 151,288 | |
| United States Treasury Note/Bond | | 2.625% | | 6/15/21 | | 52,000 | | 52,796 | |
1,2 | United States Treasury Note/Bond | | 1.625% | | 6/30/21 | | 108,400 | | 108,265 | |
| United States Treasury Note/Bond | | 1.750% | | 7/31/21 | | 105,000 | | 105,148 | |
| United States Treasury Note/Bond | | 1.500% | | 8/15/22 | | 100,000 | | 99,781 | |
| United States Treasury Note/Bond | | 1.500% | | 9/15/22 | | 133,000 | | 132,771 | |
| United States Treasury Note/Bond | | 1.625% | | 8/15/29 | | 1,900 | | 1,892 | |
| | | | | | | | | 864,853 | |
Agency Bonds and Notes (8.1%) | | | | | | | | | |
| Federal Home Loan Banks | | 1.500% | | 8/15/24 | | 55,000 | | 54,728 | |
| Federal Home Loan Banks | | 3.250% | | 11/16/28 | | 8,000 | | 8,927 | |
3 | Federal National Mortgage Assn. | | 2.250% | | 4/12/22 | | 182,000 | | 184,832 | |
3 | Federal National Mortgage Assn. | | 1.375% | | 9/6/22 | | 55,000 | | 54,648 | |
3 | Federal National Mortgage Assn. | | 2.875% | | 9/12/23 | | 98,700 | | 103,473 | |
3 | Federal National Mortgage Assn. | | 2.500% | | 2/5/24 | | 40,000 | | 41,529 | |
3 | Federal National Mortgage Assn. | | 1.750% | | 7/2/24 | | 149,000 | | 150,048 | |
| Tennessee Valley Authority | | 2.250% | | 3/15/20 | | 30,100 | | 30,142 | |
| | | | | | | | | 628,327 | |
Conventional Mortgage-Backed Securities (0.0%) | | | | | | | | | |
3,4 | Freddie Mac Gold Pool | | 6.000% | | 4/1/28 | | 5 | | 6 | |
Total U.S. Government and Agency Obligations (Cost $1,477,997) | | | | | | 1,493,186 | |
Asset-Backed/Commercial Mortgage-Backed Securities (44.9%) | | | | | | | |
4 | Ally Auto Receivables Trust 2017-5 | | 2.220% | | 10/17/22 | | 7,700 | | 7,722 | |
4 | Ally Auto Receivables Trust 2018-1 | | 2.530% | | 2/15/23 | | 1,490 | | 1,501 | |
4 | Ally Auto Receivables Trust 2019-1 | | 3.020% | | 4/15/24 | | 5,520 | | 5,682 | |
4 | Ally Auto Receivables Trust 2019-3 | | 1.930% | | 5/15/24 | | 11,670 | | 11,679 | |
4 | Ally Master Owner Trust Series 2017-3 | | 2.040% | | 6/15/22 | | 29,190 | | 29,164 | |
4 | Ally Master Owner Trust Series 2018-2 | | 3.290% | | 5/15/23 | | 29,540 | | 30,132 | |
4 | Ally Master Owner Trust Series 2018-2 | | 3.300% | | 7/17/23 | | 33,960 | | 34,696 | |
4 | American Express Credit Account Master Trust 2019-1 | | 2.870% | | 10/15/24 | | 11,940 | | 12,233 | |
4,5 | Americold 2010 LLC Trust Series 2010-ARTA | | 4.954% | | 1/14/29 | | 3,145 | | 3,258 | |
4 | AmeriCredit Automobile Receivables Trust 2016-4 | | 2.410% | | 7/8/22 | | 9,910 | | 9,931 | |
4,5 | Aventura Mall Trust 2013-AVM | | 3.867% | | 12/5/32 | | 708 | | 723 | |
4,5 | Aventura Mall Trust 2018-AVM | | 4.249% | | 7/5/40 | | 740 | | 841 | |
7
Institutional Short-Term Bond Fund
| | | | | | | Face | | Market | |
| | | | | Maturity | | Amount | | Value· | |
| | | Coupon | | Date | | ($000 | ) | ($000 | ) |
4,5 | Avis Budget Rental Car Funding AESOP LLC 2017-1A | | 3.070% | | 9/20/23 | | 5,215 | | 5,321 | |
4,5 | Avis Budget Rental Car Funding AESOP LLC 2017-2A | | 2.970% | | 3/20/24 | | 3,490 | | 3,567 | |
4,5 | Avis Budget Rental Car Funding AESOP LLC 2018-1A | | 3.700% | | 9/20/24 | | 4,020 | | 4,215 | |
4,5 | Avis Budget Rental Car Funding AESOP LLC 2018-2A | | 4.000% | | 3/20/25 | | 9,120 | | 9,724 | |
4,5 | Avis Budget Rental Car Funding AESOP LLC 2019-1A | | 3.450% | | 3/20/23 | | 5,590 | | 5,740 | |
4 | Banc of America Commercial Mortgage Trust 2015-UBS7 | | 3.429% | | 9/15/48 | | 290 | | 303 | |
4 | Banc of America Commercial Mortgage Trust 2015-UBS7 | | 3.705% | | 9/15/48 | | 749 | | 807 | |
4 | Banc of America Commercial Mortgage Trust 2017-BNK3 | | 3.574% | | 2/15/50 | | 160 | | 173 | |
4 | BANK 2017 - BNK4 | | 3.625% | | 5/15/50 | | 255 | | 277 | |
4 | BANK 2017 - BNK5 | | 3.390% | | 6/15/60 | | 270 | | 289 | |
4 | BANK 2017 - BNK6 | | 3.254% | | 7/15/60 | | 440 | | 468 | |
4 | BANK 2017 - BNK6 | | 3.518% | | 7/15/60 | | 420 | | 454 | |
4 | BANK 2017 - BNK6 | | 3.741% | | 7/15/60 | | 30 | | 33 | |
4 | BANK 2017 - BNK7 | | 3.435% | | 9/15/60 | | 380 | | 408 | |
4 | BANK 2017 - BNK8 | | 3.488% | | 11/15/50 | | 1,120 | | 1,208 | |
4 | BANK 2017 - BNK9 | | 3.538% | | 11/15/54 | | 505 | | 547 | |
4 | BANK 2018 - BN10 | | 3.641% | | 2/15/61 | | 380 | | 408 | |
4 | BANK 2018 - BN12 | | 4.255% | | 5/15/61 | | 500 | | 568 | |
4 | BANK 2018 - BN13 | | 4.217% | | 8/15/61 | | 210 | | 238 | |
4 | BANK 2018 - BN14 | | 4.185% | | 9/15/60 | | 445 | | 493 | |
4 | BANK 2018 - BN14 | | 4.231% | | 9/15/60 | | 410 | | 465 | |
4 | BANK 2019 - BN17 | | 3.623% | | 4/15/52 | | 181 | | 196 | |
4 | BANK 2019 - BN17 | | 3.714% | | 4/15/52 | | 576 | | 638 | |
4 | BANK 2019 - BN18 | | 3.584% | | 5/15/62 | | 570 | | 626 | |
4 | BANK 2019 - BN19 | | 3.183% | | 8/15/61 | | 470 | | 501 | |
4 | BANK 2019 - BN20 | | 3.011% | | 9/15/61 | | 100 | | 105 | |
4,6 | BANK 2019 - BN21 | | 2.851% | | 10/17/52 | | 460 | | 474 | |
4 | Benchmark 2018-B1 Mortgage Trust | | 3.602% | | 1/15/51 | | 110 | | 117 | |
4 | Benchmark 2018-B1 Mortgage Trust | | 3.666% | | 1/15/51 | | 590 | | 643 | |
4 | Benchmark 2018-B1 Mortgage Trust | | 3.878% | | 1/15/51 | | 60 | | 65 | |
4 | Benchmark 2018-B2 Mortgage Trust | | 3.882% | | 2/15/51 | | 830 | | 919 | |
4 | Benchmark 2018-B3 Mortgage Trust | | 4.025% | | 4/10/51 | | 580 | | 649 | |
4 | Benchmark 2018-B5 Mortgage Trust | | 4.208% | | 7/15/51 | | 590 | | 670 | |
4 | Benchmark 2018-B6 Mortgage Trust | | 4.170% | | 10/10/51 | | 1,118 | | 1,236 | |
4 | Benchmark 2019-B10 Mortgage Trust | | 3.615% | | 3/15/62 | | 194 | | 210 | |
4 | BMW Vehicle Lease Trust 2018-1A | | 3.260% | | 7/20/21 | | 16,420 | | 16,611 | |
4 | BMW Vehicle Owner Trust 2018-A | | 1.920% | | 1/25/24 | | 23,060 | | 23,074 | |
4 | BMW Vehicle Owner Trust 2018-A | | 2.510% | | 6/25/24 | | 2,220 | | 2,245 | |
4,7 | Brazos Higher Education Authority Inc. Series 2005, 3M USD LIBOR + 0.200% | | 2.549% | | 6/25/26 | | 1,287 | | 1,281 | |
4,7 | Brazos Higher Education Authority Inc. Series 2011, 3M USD LIBOR + 0.800% | | 2.932% | | 2/25/30 | | 2,288 | | 2,284 | |
4,5 | Canadian Pacer Auto Receivables Trust A Series 2017 | | 2.286% | | 1/19/22 | | 990 | | 986 | |
4,5 | Canadian Pacer Auto Receivables Trust A Series 2018 | | 3.220% | | 9/19/22 | | 4,920 | | 4,962 | |
8
Institutional Short-Term Bond Fund
| | | | | | | Face | | Market | |
| | | | | Maturity | | Amount | | Value· | |
| | | Coupon | | Date | | ($000 | ) | ($000 | ) |
4,5 | Canadian Pacer Auto Receivables Trust A Series 2019 | | 2.960% | | 6/19/24 | | 1,900 | | 1,953 | |
4,5 | Canadian Pacer Auto Receiveable Trust A Series 2018 | | 3.270% | | 12/19/22 | | 14,350 | | 14,468 | |
4,5 | Canadian Pacer Auto Receiveable Trust A Series 2018 | | 3.440% | | 8/21/23 | | 6,380 | | 6,527 | |
4 | Capital Auto Receivables Asset Trust 2016-2 | | 1.630% | | 1/20/21 | | 35 | | 35 | |
4 | Capital Auto Receivables Asset Trust 2016-3 | | 1.690% | | 3/20/21 | | 33 | | 33 | |
4 | Capital One Auto Receivables Trust 2019-1 | | 2.510% | | 11/15/23 | | 15,950 | | 16,136 | |
4 | Capital One Auto Receivables Trust 2019-1 | | 2.560% | | 10/15/24 | | 5,380 | | 5,481 | |
4 | Capital One Auto Receivables Trust 2019-2 | | 1.920% | | 5/15/24 | | 27,130 | | 27,153 | |
4 | Capital One Multi-Asset Execution Trust 2019-A1 | | 2.840% | | 12/15/24 | | 37,760 | | 38,613 | |
4 | CarMax Auto Owner Trust 2016-4 | | 1.600% | | 6/15/22 | | 11,690 | | 11,642 | |
4 | CarMax Auto Owner Trust 2017-3 | | 2.220% | | 11/15/22 | | 13,510 | | 13,566 | |
4 | CarMax Auto Owner Trust 2017-4 | | 2.330% | | 5/15/23 | | 4,040 | | 4,068 | |
4 | CarMax Auto Owner Trust 2018-1 | | 2.480% | | 11/15/22 | | 10,620 | | 10,661 | |
4 | CarMax Auto Owner Trust 2018-1 | | 2.640% | | 6/15/23 | | 1,680 | | 1,705 | |
4 | CarMax Auto Owner Trust 2018-3 | | 3.130% | | 6/15/23 | | 29,670 | | 30,100 | |
4 | CarMax Auto Owner Trust 2018-3 | | 3.270% | | 3/15/24 | | 14,840 | | 15,317 | |
4 | CarMax Auto Owner Trust 2018-4 | | 3.360% | | 9/15/23 | | 14,160 | | 14,495 | |
4 | CarMax Auto Owner Trust 2018-4 | | 3.480% | | 2/15/24 | | 5,210 | | 5,446 | |
4 | CarMax Auto Owner Trust 2019-3 | | 2.180% | | 8/15/24 | | 29,590 | | 29,705 | |
4 | CarMax Auto Owner Trust 2019-3 | | 2.300% | | 4/15/25 | | 5,400 | | 5,448 | |
4 | CD 2016-CD1 Commercial Mortgage Trust | | 2.724% | | 8/10/49 | | 540 | | 554 | |
4 | CD 2017-CD3 Commercial Mortgage Trust | | 3.631% | | 2/10/50 | | 815 | | 882 | |
4 | CD 2017-CD4 Commercial Mortgage Trust | | 3.514% | | 5/10/50 | | 380 | | 409 | |
4 | CD 2017-CD5 Commercial Mortgage Trust | | 3.431% | | 8/15/50 | | 555 | | 595 | |
4 | CD 2017-CD6 Commercial Mortgage Trust | | 3.456% | | 11/13/50 | | 1,130 | | 1,212 | |
4 | CD 2019-CD8 Commercial Mortgage Trust | | 2.912% | | 8/15/57 | | 200 | | 208 | |
4 | CenterPoint Energy Transition Bond Co. IV LLC 2012-1 | | 2.161% | | 10/15/21 | | 3,958 | | 3,955 | |
4,5 | CFCRE Commercial Mortgage Trust 2011-C2 | | 5.939% | | 12/15/47 | | 2,072 | | 2,195 | |
4 | CFCRE Commercial Mortgage Trust 2016-C4 | | 3.283% | | 5/10/58 | | 472 | | 497 | |
4,5 | Chesapeake Funding II LLC 2018-1 | | 3.040% | | 4/15/30 | | 17,653 | | 17,813 | |
4,5 | Chesapeake Funding II LLC 2019-1 | | 2.940% | | 4/15/31 | | 8,617 | | 8,723 | |
4,5 | Chrysler Capital Auto Receivables Trust 2016-BA | | 1.640% | | 7/15/21 | | 370 | | 369 | |
4 | Citibank Credit Card Issuance Trust 2018-A1 | | 2.490% | | 1/20/23 | | 1,950 | | 1,964 | |
4,5 | Citigroup Commercial Mortgage Trust 2012-GC8 | | 3.683% | | 9/10/45 | | 450 | | 464 | |
4 | Citigroup Commercial Mortgage Trust 2013-GC11 | | 3.093% | | 4/10/46 | | 952 | | 981 | |
4 | Citigroup Commercial Mortgage Trust 2013-GC15 | | 3.942% | | 9/10/46 | | 226 | | 234 | |
4 | Citigroup Commercial Mortgage Trust 2014-GC19 | | 4.023% | | 3/10/47 | | 3,415 | | 3,663 | |
4 | Citigroup Commercial Mortgage Trust 2014-GC21 | | 3.575% | | 5/10/47 | | 687 | | 726 | |
4 | Citigroup Commercial Mortgage Trust 2014-GC21 | | 3.855% | | 5/10/47 | | 2,026 | | 2,164 | |
4 | Citigroup Commercial Mortgage Trust 2014-GC23 | | 3.622% | | 7/10/47 | | 756 | | 805 | |
9
Institutional Short-Term Bond Fund
| | | | | | | Face | | Market | |
| | | | | Maturity | | Amount | | Value· | |
| | | Coupon | | Date | | ($000 | ) | ($000 | ) |
4 | Citigroup Commercial Mortgage Trust 2014-GC23 | | 3.863% | | 7/10/47 | | 255 | | 270 | |
4 | Citigroup Commercial Mortgage Trust 2014-GC25 | | 3.372% | | 10/10/47 | | 591 | | 621 | |
4 | Citigroup Commercial Mortgage Trust 2014-GC25 | | 3.635% | | 10/10/47 | | 3,132 | | 3,341 | |
4 | Citigroup Commercial Mortgage Trust 2015-GC27 | | 3.137% | | 2/10/48 | | 50 | | 52 | |
4 | Citigroup Commercial Mortgage Trust 2015-GC31 | | 3.762% | | 6/10/48 | | 950 | | 1,025 | |
4 | Citigroup Commercial Mortgage Trust 2015-GC33 | | 3.778% | | 9/10/58 | | 4,095 | | 4,430 | |
4 | Citigroup Commercial Mortgage Trust 2016-C1 | | 3.209% | | 5/10/49 | | 1,456 | | 1,537 | |
4 | Citigroup Commercial Mortgage Trust 2016-P4 | | 2.902% | | 7/10/49 | | 280 | | 290 | |
4 | Citigroup Commercial Mortgage Trust 2017-C4 | | 3.471% | | 10/12/50 | | 520 | | 559 | |
4 | Citigroup Commercial Mortgage Trust 2017-P8 | | 3.465% | | 9/15/50 | | 1,085 | | 1,165 | |
4 | Citigroup Commercial Mortgage Trust 2018-C5 | | 4.228% | | 6/10/51 | | 230 | | 261 | |
4 | Citigroup Commercial Mortgage Trust 2018-C6 | | 4.343% | | 11/10/51 | | 1,040 | | 1,169 | |
4 | CNH Equipment Trust 2016-B | | 1.970% | | 11/15/21 | | 9,000 | | 8,989 | |
4 | COMM 2012-CCRE2 Mortgage Trust | | 3.147% | | 8/15/45 | | 363 | | 372 | |
4 | COMM 2012-CCRE2 Mortgage Trust | | 3.791% | | 8/15/45 | | 901 | | 929 | |
4 | COMM 2012-CCRE3 Mortgage Trust | | 2.822% | | 10/15/45 | | 572 | | 581 | |
4,5 | COMM 2012-CCRE3 Mortgage Trust | | 3.416% | | 10/15/45 | | 340 | | 348 | |
4 | COMM 2012-CCRE4 Mortgage Trust | | 2.853% | | 10/15/45 | | 547 | | 556 | |
4 | COMM 2012-CCRE5 Mortgage Trust | | 2.771% | | 12/10/45 | | 291 | | 297 | |
4 | COMM 2013-CCRE11 Mortgage Trust | | 3.983% | | 8/10/50 | | 924 | | 983 | |
4 | COMM 2013-CCRE11 Mortgage Trust | | 4.258% | | 8/10/50 | | 813 | | 873 | |
4 | COMM 2013-CCRE12 Mortgage Trust | | 3.623% | | 10/10/46 | | 445 | | 458 | |
4 | COMM 2013-CCRE12 Mortgage Trust | | 4.046% | | 10/10/46 | | 1,152 | | 1,228 | |
4 | COMM 2013-CCRE13 Mortgage Trust | | 4.194% | | 11/10/46 | | 837 | | 902 | |
4 | COMM 2013-CCRE8 Mortgage Trust | | 3.612% | | 6/10/46 | | 20 | | 21 | |
4 | COMM 2013-CCRE9 Mortgage Trust | | 4.373% | | 7/10/45 | | 1,194 | | 1,278 | |
4,5 | COMM 2013-CCRE9 Mortgage Trust | | 4.397% | | 7/10/45 | | 3,169 | | 3,344 | |
4,5 | COMM 2013-LC13 Mortgage Trust | | 3.774% | | 8/10/46 | | 330 | | 341 | |
4 | COMM 2013-LC13 Mortgage Trust | | 4.205% | | 8/10/46 | | 150 | | 161 | |
4 | COMM 2013-LC6 Mortgage Trust | | 2.941% | | 1/10/46 | | 984 | | 1,006 | |
4,5 | COMM 2013-SFS Mortgage Trust | | 3.086% | | 4/12/35 | | 1,098 | | 1,128 | |
4 | COMM 2014-CCRE14 Mortgage Trust | | 3.955% | | 2/10/47 | | 20 | | 21 | |
4 | COMM 2014-CCRE14 Mortgage Trust | | 4.236% | | 2/10/47 | | 505 | | 545 | |
4 | COMM 2014-CCRE15 Mortgage Trust | | 4.074% | | 2/10/47 | | 30 | | 32 | |
4 | COMM 2014-CCRE17 Mortgage Trust | | 3.977% | | 5/10/47 | | 1,060 | | 1,138 | |
4 | COMM 2014-CCRE17 Mortgage Trust | | 4.174% | | 5/10/47 | | 350 | | 374 | |
4 | COMM 2014-CCRE18 Mortgage Trust | | 3.550% | | 7/15/47 | | 350 | | 365 | |
4 | COMM 2014-CCRE18 Mortgage Trust | | 3.828% | | 7/15/47 | | 3,106 | | 3,319 | |
4 | COMM 2014-CCRE20 Mortgage Trust | | 3.326% | | 11/10/47 | | 80 | | 84 | |
4 | COMM 2014-CCRE20 Mortgage Trust | | 3.590% | | 11/10/47 | | 2,492 | | 2,651 | |
4 | COMM 2014-CCRE21 Mortgage Trust | | 3.528% | | 12/10/47 | | 1,257 | | 1,329 | |
4 | COMM 2014-LC17 Mortgage Trust | | 3.917% | | 10/10/47 | | 1,987 | | 2,142 | |
10
Institutional Short-Term Bond Fund
| | | | | | | Face | | Market | |
| | | | | Maturity | | Amount | | Value· | |
| | | Coupon | | Date | | ($000 | ) | ($000 | ) |
4 | COMM 2015-CCRE22 Mortgage Trust | | 3.309% | | 3/10/48 | | 855 | | 899 | |
4 | COMM 2015-CCRE24 Mortgage Trust | | 3.696% | | 8/10/48 | | 855 | | 917 | |
4 | COMM 2015-CCRE25 Mortgage Trust | | 3.759% | | 8/10/48 | | 976 | | 1,051 | |
4 | COMM 2015-CCRE27 Mortgage Trust | | 3.612% | | 10/10/48 | | 487 | | 521 | |
4 | COMM 2015-LC19 Mortgage Trust | | 3.183% | | 2/10/48 | | 44 | | 46 | |
4,5 | Core Industrial Trust 2015-TEXW | | 3.077% | | 2/10/34 | | 496 | | 507 | |
4 | CSAIL 2015-C4 Commercial Mortgage Trust | | 3.808% | | 11/15/48 | | 2,004 | | 2,168 | |
4 | CSAIL 2016-C7 Commercial Mortgage Trust | | 3.502% | | 11/15/49 | | 1,580 | | 1,686 | |
4 | CSAIL 2017-C8 Commercial Mortgage Trust | | 3.392% | | 6/15/50 | | 520 | | 554 | |
4 | CSAIL 2019-C15 Commercial Mortgage Trust | | 4.053% | | 3/15/52 | | 520 | | 584 | |
4,5 | Daimler Trucks Retail Trust 2018 -1 | | 3.030% | | 11/15/24 | | 11,840 | | 11,942 | |
4,5 | Daimler Trucks Retail Trust 2019-1 | | 2.770% | | 8/15/22 | | 29,690 | | 29,983 | |
4,5 | Daimler Trucks Retail Trust 2019-1 | | 2.790% | | 5/15/25 | | 3,980 | | 4,047 | |
4 | DBJPM 17-C6 Mortgage Trust | | 3.328% | | 6/10/50 | | 740 | | 789 | |
4,5,7 | DELAM 2018-1, 1M USD LIBOR + 0.700% | | 2.757% | | 11/19/25 | | 16,440 | | 16,432 | |
4,5 | Dell Equipment Finance Trust 2018-2 | | 3.160% | | 2/22/21 | | 16,149 | | 16,221 | |
4,5 | Dell Equipment Finance Trust 2019-1 | | 2.830% | | 3/22/24 | | 10,610 | | 10,761 | |
4 | Discover Card Execution Note Trust 2018-A5 | | 3.320% | | 3/15/24 | | 22,440 | | 23,053 | |
4 | Discover Card Execution Note Trust 2019-A1 | | 3.040% | | 7/15/24 | | 14,110 | | 14,485 | |
4,5 | DLL Securitization Trust Series 2018-1 | | 3.100% | | 4/18/22 | | 13,535 | | 13,649 | |
4,5 | DLL Securitization Trust Series 2018-A3 | | 3.460% | | 1/20/22 | | 27,790 | | 28,135 | |
4,5 | DLL Securitization Trust Series 2018-A4 | | 3.590% | | 6/20/24 | | 6,700 | | 6,881 | |
4,5 | DLL Securitization Trust Series 2019-DA1 | | 2.890% | | 4/20/23 | | 13,970 | | 14,119 | |
4,5 | DLL Securitization Trust Series 2019-DA1 | | 2.920% | | 4/20/27 | | 10,190 | | 10,385 | |
4,5 | DLL Securitization Trust Series 2019-MA2 | | 2.340% | | 9/20/23 | | 21,160 | | 21,187 | |
4 | Drive Auto Receivables Trust 2019-2 | | 3.040% | | 3/15/23 | | 7,110 | | 7,169 | |
4,5,7 | Edsouth Indenture No. 9 LLC 2015-1, 1M USD LIBOR + 0.800% | | 2.818% | | 10/25/56 | | 543 | | 539 | |
4,5 | Enterprise Fleet Financing LLC Series 2018-3 | | 3.380% | | 5/20/24 | | 10,187 | | 10,311 | |
4,5 | Enterprise Fleet Financing LLC Series 2019-1 | | 2.980% | | 10/22/24 | | 4,260 | | 4,305 | |
4,5 | Enterprise Fleet Financing LLC Series 2019-1 | | 3.070% | | 10/22/24 | | 6,160 | | 6,335 | |
3,4 | Fannie Mae Grantor Trust 2017-T1 | | 2.898% | | 6/25/27 | | 12,998 | | 13,511 | |
4 | Fifth Third Auto Trust 2017-1 | | 2.030% | | 7/15/24 | | 13,390 | | 13,396 | |
4,7 | First National Master Note Trust 2017-2, 1M USD LIBOR + 0.440% | | 2.468% | | 10/16/23 | | 6,030 | | 6,036 | |
4 | Ford Credit Auto Lease Trust 2018-A | | 3.050% | | 8/15/21 | | 5,350 | | 5,396 | |
4 | Ford Credit Auto Lease Trust 2018-B | | 3.190% | | 12/15/21 | | 15,260 | | 15,394 | |
4 | Ford Credit Auto Lease Trust 2019-A | | 2.900% | | 5/15/22 | | 29,360 | | 29,689 | |
4,5 | Ford Credit Auto Owner Trust 2015-REV2 | | 2.440% | | 1/15/27 | | 39,000 | | 39,095 | |
4,5 | Ford Credit Auto Owner Trust 2016-REV1 | | 2.310% | | 8/15/27 | | 36,545 | | 36,665 | |
4,5 | Ford Credit Auto Owner Trust 2016-REV2 | | 2.030% | | 12/15/27 | | 21,710 | | 21,686 | |
4,5 | Ford Credit Auto Owner Trust 2017-1 | | 2.620% | | 8/15/28 | | 61,220 | | 61,994 | |
4,5 | Ford Credit Auto Owner Trust 2017-2 | | 2.360% | | 3/15/29 | | 30,610 | | 30,754 | |
4 | Ford Credit Auto Owner Trust 2018-A | | 3.030% | | 11/15/22 | | 26,200 | | 26,467 | |
4 | Ford Credit Auto Owner Trust 2018-B | | 3.240% | | 4/15/23 | | 40,870 | | 41,639 | |
4 | Ford Credit Auto Owner Trust 2018-B | | 3.380% | | 3/15/24 | | 14,050 | | 14,487 | |
4,5 | Ford Credit Auto Owner Trust 2018-REV1 | | 3.190% | | 7/15/31 | | 6,560 | | 6,790 | |
4,5 | Ford Credit Auto Owner Trust 2018-REV2 | | 3.470% | | 1/15/30 | | 31,840 | | 33,304 | |
4,5 | Ford Credit Auto Owner Trust 2019-1 | | 3.520% | | 7/15/30 | | 33,950 | | 35,877 | |
4 | Ford Credit Auto Owner Trust 2019-A | | 2.780% | | 9/15/23 | | 34,570 | | 35,055 | |
4 | Ford Credit Auto Owner Trust 2019-A | | 2.850% | | 8/15/24 | | 18,140 | | 18,602 | |
4 | Ford Credit Floorplan Master Owner Trust A Series 2015-5 | | 2.390% | | 8/15/22 | | 2,115 | | 2,120 | |
11
Institutional Short-Term Bond Fund
| | | | | | | Face | | Market | |
| | | | | Maturity | | Amount | | Value· | |
| | | Coupon | | Date | | ($000 | ) | ($000 | ) |
4 | Ford Credit Floorplan Master Owner Trust A Series 2017-1 | | 2.070% | | 5/15/22 | | 36,150 | | 36,125 | |
4 | Ford Credit Floorplan Master Owner Trust A Series 2017-2 | | 2.160% | | 9/15/22 | | 30,110 | | 30,119 | |
4 | Ford Credit Floorplan Master Owner Trust A Series 2018-1 | | 2.950% | | 5/15/23 | | 40,300 | | 40,857 | |
4 | Ford Credit Floorplan Master Owner Trust A Series 2018-3 | | 3.520% | | 10/15/23 | | 40,960 | | 42,070 | |
4 | Ford Credit Floorplan Master Owner Trust A Series 2019-1 | | 2.840% | | 3/15/24 | | 18,220 | | 18,548 | |
4 | GM Financial Automobile Leasing Trust 2017-1 | | 2.260% | | 8/20/20 | | 242 | | 242 | |
4 | GM Financial Automobile Leasing Trust 2018-2 | | 3.060% | | 6/21/21 | | 29,110 | | 29,231 | |
4 | GM Financial Automobile Leasing Trust 2018-3 | | 3.180% | | 6/21/21 | | 10,950 | | 11,030 | |
4 | GM Financial Automobile Leasing Trust 2019-3 | | 2.030% | | 6/20/22 | | 22,230 | | 22,204 | |
4,5 | GM Financial Consumer Automobile 2017-3 | | 2.130% | | 3/16/23 | | 7,860 | | 7,881 | |
4 | GM Financial Consumer Automobile 2018-2 | | 3.020% | | 12/18/23 | | 5,945 | | 6,079 | |
4 | GM Financial Consumer Automobile 2018-3 | | 3.020% | | 5/16/23 | | 31,600 | | 32,053 | |
4 | GM Financial Consumer Automobile 2018-3 | | 3.160% | | 1/16/24 | | 9,990 | | 10,302 | |
4 | GM Financial Consumer Automobile 2018-4 | | 3.210% | | 10/16/23 | | 35,400 | | 36,061 | |
4 | GM Financial Consumer Automobile 2018-4 | | 3.320% | | 6/17/24 | | 20,490 | | 21,311 | |
4 | GM Financial Consumer Automobile 2019-1 | | 3.110% | | 7/16/24 | | 14,060 | | 14,534 | |
4 | GM Financial Consumer Automobile 2019-2 | | 2.650% | | 2/16/24 | | 22,660 | | 22,912 | |
4 | GM Financial Consumer Automobile 2019-2 | | 2.710% | | 8/16/24 | | 6,850 | | 7,017 | |
4 | GM Financial Consumer Automobile 2019-3 | | 2.180% | | 4/16/24 | | 25,100 | | 25,252 | |
4,5 | GMF Floorplan Owner Revolving Trust 2017-2 | | 2.130% | | 7/15/22 | | 29,660 | | 29,652 | |
4,5 | GMF Floorplan Owner Revolving Trust 2018-2 | | 3.130% | | 3/15/23 | | 27,050 | | 27,428 | |
4,5 | GMF Floorplan Owner Revolving Trust 2019-1 | | 2.700% | | 4/15/24 | | 5,600 | | 5,683 | |
4,5 | Golden Credit Card Trust 2018-1A | | 2.620% | | 1/15/23 | | 22,260 | | 22,406 | |
4,5 | Golden Credit Card Trust 2018-4A | | 3.440% | | 10/15/25 | | 31,290 | | 32,907 | |
4,5,7 | Gosforth Funding 2016-1A plc, 3M USD LIBOR + 0.700% | | 2.858% | | 2/15/58 | | 609 | | 609 | |
4,5,7 | Gosforth Funding 2018-1A plc, 3M USD LIBOR + 0.450% | | 2.582% | | 8/25/60 | | 14,564 | | 14,530 | |
4,5 | GreatAmerica Leasing Receivables Funding LLC Series 2018-1 | | 2.830% | | 6/17/24 | | 2,580 | | 2,605 | |
4,5 | GreatAmerica Leasing Receivables Funding LLC Series 2019-1 | | 3.210% | | 2/18/25 | | 4,630 | | 4,764 | |
4,5 | GS Mortgage Securities Trust 2012-GC6 | | 4.948% | | 1/10/45 | | 217 | | 228 | |
4 | GS Mortgage Securities Trust 2013-GC13 | | 4.186% | | 7/10/46 | | 1,338 | | 1,432 | |
4 | GS Mortgage Securities Trust 2013-GCJ12 | | 3.135% | | 6/10/46 | | 1,176 | | 1,212 | |
4 | GS Mortgage Securities Trust 2013-GCJ14 | | 3.955% | | 8/10/46 | | 60 | | 63 | |
4 | GS Mortgage Securities Trust 2014-GC20 | | 3.998% | | 4/10/47 | | 3,596 | | 3,851 | |
4 | GS Mortgage Securities Trust 2014-GC24 | | 3.931% | | 9/10/47 | | 110 | | 118 | |
4 | GS Mortgage Securities Trust 2014-GC24 | | 4.162% | | 9/10/47 | | 60 | | 64 | |
4 | GS Mortgage Securities Trust 2014-GC26 | | 3.364% | | 11/10/47 | | 620 | | 653 | |
4 | GS Mortgage Securities Trust 2014-GC26 | | 3.629% | | 11/10/47 | | 1,380 | | 1,472 | |
4 | GS Mortgage Securities Trust 2015-GC28 | | 3.136% | | 2/10/48 | | 460 | | 479 | |
4 | GS Mortgage Securities Trust 2015-GC28 | | 3.396% | | 2/10/48 | | 80 | | 84 | |
4 | GS Mortgage Securities Trust 2015-GC30 | | 3.382% | | 5/10/50 | | 5 | | 5 | |
4 | GS Mortgage Securities Trust 2015-GC34 | | 3.506% | | 10/10/48 | | 1,170 | | 1,249 | |
4 | GS Mortgage Securities Trust 2016-GS3 | | 2.850% | | 10/10/49 | | 580 | | 600 | |
4 | GS Mortgage Securities Trust 2018-GS10 | | 4.155% | | 7/10/51 | | 555 | | 627 | |
4 | GS Mortgage Securities Trust 2019-GC40 | | 3.160% | | 7/10/52 | | 140 | | 149 | |
4 | GS Mortgage Securities Trust 2019-GS4 | | 3.001% | | 9/1/52 | | 500 | | 526 | |
12
Institutional Short-Term Bond Fund
| | | | | | | Face | | Market | |
| | | | | Maturity | | Amount | | Value· | |
| | | Coupon | | Date | | ($000 | ) | ($000 | ) |
4 | Harley-Davidson Motorcycle Trust 2019-A | | 2.340% | | 2/15/24 | | 16,180 | | 16,268 | |
4 | Harley-Davidson Motorcycle Trust 2019-A | | 2.390% | | 11/15/26 | | 3,600 | | 3,633 | |
4,5 | Hertz Vehicle Financing II LP 2015-3A | | 2.670% | | 9/25/21 | | 10,525 | | 10,566 | |
4,5 | Hertz Vehicle Financing II LP 2016-2A | | 2.950% | | 3/25/22 | | 8,760 | | 8,837 | |
4,5,7 | Holmes Master Issuer plc 2018-1, 3M USD LIBOR + 0.360% | | 2.663% | | 10/15/54 | | 11,325 | | 11,314 | |
4,5,7 | Holmes Master Issuer plc 2018-2A, 3M USD LIBOR + 0.420% | | 2.723% | | 10/15/54 | | 26,341 | | 26,308 | |
4 | Honda Auto Receivables 2017-3 Owner Trust | | 1.980% | | 11/20/23 | | 8,510 | | 8,510 | |
4 | Honda Auto Receivables 2017-4 Owner Trust | | 2.210% | | 3/21/24 | | 4,910 | | 4,924 | |
4 | Honda Auto Receivables 2018-2 Owner Trust | | 3.010% | | 5/18/22 | | 13,990 | | 14,124 | |
4 | Honda Auto Receivables 2018-3 Owner Trust | | 2.950% | | 8/22/22 | | 22,120 | | 22,380 | |
4 | Honda Auto Receivables 2018-3 Owner Trust | | 3.070% | | 11/21/24 | | 8,110 | | 8,304 | |
4 | Honda Auto Receivables 2018-4 Owner Trust | | 2.520% | | 6/21/23 | | 6,240 | | 6,309 | |
4 | Honda Auto Receivables 2018-4 Owner Trust | | 2.540% | | 3/21/25 | | 1,270 | | 1,292 | |
4 | Honda Auto Receivables 2018-4 Owner Trust | | 3.300% | | 7/15/25 | | 6,680 | | 6,902 | |
4 | Honda Auto Receivables 2019-1 Owner Trust | | 2.900% | | 6/18/24 | | 5,320 | | 5,452 | |
4 | Honda Auto Receivables 2019-3 Owner Trust | | 1.780% | | 8/15/23 | | 26,800 | | 26,732 | |
4 | Honda Auto Receivables 2019-3 Owner Trust | | 1.850% | | 8/15/25 | | 7,800 | | 7,770 | |
4,5 | Houston Galleria Mall Trust 2015-HGLR | | 3.087% | | 3/5/37 | | 3,082 | | 3,194 | |
4,5 | HPEFS Equipment Trust 2019-1 | | 2.190% | | 9/20/29 | | 6,400 | | 6,400 | |
4,5 | HPEFS Equipment Trust 2019-1 | | 2.210% | | 9/20/29 | | 1,300 | | 1,299 | |
4,5 | Hudson Yards 2019-30HY | | 3.228% | | 7/10/39 | | 420 | | 450 | |
4,5 | Hyundai Auto Lease Securitization Trust 2018-A | | 2.890% | | 3/15/22 | | 8,250 | | 8,306 | |
4,5 | Hyundai Auto Lease Securitization Trust 2018-B | | 3.040% | | 10/15/21 | | 25,740 | | 25,965 | |
4,5 | Hyundai Auto Lease Securitization Trust 2019-A | | 2.980% | | 7/15/ 22 | | 12,240 | | 12,387 | |
4,5 | Hyundai Auto Lease Securitization Trust 2019-A | | 3.050% | | 12/15/22 | | 2,010 | | 2,048 | |
4,5 | Hyundai Auto Lease Securitization Trust 2019-B | | 2.040% | | 8/15/22 | | 25,950 | | 25,915 | |
4 | Hyundai Auto Receivables Trust 2017-B | | 1.960% | | 2/15/23 | | 6,960 | | 6,958 | |
4 | Hyundai Auto Receivables Trust 2019-A | | 2.710% | | 5/15/25 | | 3,260 | | 3,331 | |
4,5 | Hyundai Floorplan Master Owner Trust Series 2019-1A | | 2.680% | | 4/15/24 | | 7,000 | | 7,106 | |
4,5 | Irvine Core Office Trust 2013-IRV | | 3.279% | | 5/15/48 | | 2,036 | | 2,111 | |
4 | John Deere Owner Trust 2016-B | | 1.490% | | 5/15/23 | | 1,862 | | 1,858 | |
4 | John Deere Owner Trust 2017-A | | 2.110% | | 12/15/23 | | 11,350 | | 11,345 | |
4 | John Deere Owner Trust 2017-B | | 2.110% | | 7/15/24 | | 6,770 | | 6,770 | |
4 | John Deere Owner Trust 2018-B | | 3.080% | | 11/15/22 | | 36,300 | | 36,769 | |
4 | John Deere Owner Trust 2018-B | | 2.910% | | 7/17/23 | | 25,490 | | 25,917 | |
4 | John Deere Owner Trust 2018-B | | 3.230% | | 6/16/25 | | 11,550 | | 11,882 | |
4 | John Deere Owner Trust 2018-B | | 3.000% | | 1/15/26 | | 4,030 | | 4,144 | |
4 | John Deere Owner Trust 2019-B | | 2.210% | | 12/15/23 | | 15,670 | | 15,730 | |
4 | John Deere Owner Trust 2019-B | | 2.320% | | 5/15/26 | | 8,340 | | 8,400 | |
4,5 | JP Morgan Chase Commercial Mortgage Securities Trust 2010-C1 | | 4.608% | | 6/15/43 | | 24 | | 24 | |
4,5 | JP Morgan Chase Commercial Mortgage Securities Trust 2010-C2 | | 4.070% | | 11/15/43 | | 299 | | 302 | |
4,5 | JP Morgan Chase Commercial Mortgage Securities Trust 2011-C3 | | 4.717% | | 2/15/46 | | 1,368 | | 1,405 | |
13
Institutional Short-Term Bond Fund
| | | | | | | Face | | Market | |
| | | | | Maturity | | Amount | | Value· | |
| | | Coupon | | Date | | ($000 | ) | ($000 | ) |
4,5 | JP Morgan Chase Commercial Mortgage Securities Trust 2011-C5 | | 5.554% | | 8/15/46 | | 867 | | 911 | |
4,5 | JP Morgan Chase Commercial Mortgage Securities Trust 2011-RR1 | | 4.717% | | 3/16/46 | | 4,957 | | 5,087 | |
4 | JP Morgan Chase Commercial Mortgage Securities Trust 2012-C8 | | 2.829% | | 10/15/45 | | 324 | | 330 | |
4,5 | JP Morgan Chase Commercial Mortgage Securities Trust 2012-C8 | | 3.424% | | 10/15/45 | | 1,627 | | 1,673 | |
4,5 | JP Morgan Chase Commercial Mortgage Securities Trust 2012-HSBC | | 3.093% | | 7/5/32 | | 1,096 | | 1,120 | |
4 | JP Morgan Chase Commercial Mortgage Securities Trust 2013-C13 | | 3.994% | | 1/15/46 | | 2,026 | | 2,143 | |
4 | JP Morgan Chase Commercial Mortgage Securities Trust 2013-C16 | | 3.674% | | 12/15/46 | | 294 | | 303 | |
4 | JP Morgan Chase Commercial Mortgage Securities Trust 2013-C16 | | 3.881% | | 12/15/46 | | 264 | | 280 | |
4 | JP Morgan Chase Commercial Mortgage Securities Trust 2013-C16 | | 4.166% | | 12/15/46 | | 1,250 | | 1,342 | |
4 | JP Morgan Chase Commercial Mortgage Securities Trust 2013-LC11 | | 2.960% | | 4/15/46 | | 1,315 | | 1,348 | |
4 | JP Morgan Chase Commercial Mortgage Securities Trust 2014-C20 | | 3.461% | | 7/15/47 | | 328 | | 338 | |
4 | JP Morgan Chase Commercial Mortgage Securities Trust 2016-JP3 | | 2.870% | | 8/15/49 | | 1,650 | | 1,709 | |
4 | JP Morgan Chase Commercial Mortgage Securities Trust 2016-JP4 | | 3.648% | | 12/15/49 | | 110 | | 119 | |
4 | JP Morgan Chase Commercial Mortgage Securities Trust 2017-JP6 | | 3.490% | | 7/15/50 | | 310 | | 334 | |
4 | JPMBB Commercial Mortgage Securities Trust 2013-C12 | | 3.664% | | 7/15/45 | | 2,043 | | 2,147 | |
4 | JPMBB Commercial Mortgage Securities Trust 2013-C12 | | 4.176% | | 7/15/45 | | 1,835 | | 1,939 | |
4 | JPMBB Commercial Mortgage Securities Trust 2013-C14 | | 3.761% | | 8/15/46 | | 206 | | 212 | |
4 | JPMBB Commercial Mortgage Securities Trust 2013-C14 | | 4.133% | | 8/15/46 | | 277 | | 296 | |
4 | JPMBB Commercial Mortgage Securities Trust 2013-C15 | | 3.659% | | 11/15/45 | | 198 | | 204 | |
4 | JPMBB Commercial Mortgage Securities Trust 2013-C17 | | 4.199% | | 1/15/47 | | 2,947 | | 3,178 | |
4 | JPMBB Commercial Mortgage Securities Trust 2014-C18 | | 4.079% | | 2/15/47 | | 1,460 | | 1,571 | |
4 | JPMBB Commercial Mortgage Securities Trust 2014-C18 | | 4.439% | | 2/15/47 | | 700 | | 753 | |
4 | JPMBB Commercial Mortgage Securities Trust 2014-C19 | | 3.997% | | 4/15/47 | | 120 | | 129 | |
4 | JPMBB Commercial Mortgage Securities Trust 2014-C21 | | 3.493% | | 8/15/47 | | 233 | | 245 | |
4 | JPMBB Commercial Mortgage Securities Trust 2014-C24 | | 3.639% | | 11/15/47 | | 1,183 | | 1,260 | |
4 | JPMBB Commercial Mortgage Securities Trust 2014-C26 | | 3.231% | | 1/15/48 | | 390 | | 406 | |
4 | JPMBB Commercial Mortgage Securities Trust 2014-C26 | | 3.494% | | 1/15/48 | | 10 | | 11 | |
14
Institutional Short-Term Bond Fund
| | | | | | | Face | | Market | |
| | | | | Maturity | | Amount | | Value· | |
| | | Coupon | | Date | | ($000 | ) | ($000 | ) |
4 | JPMBB Commercial Mortgage Securities Trust 2015-C27 | | 3.179% | | 2/15/48 | | 330 | | 345 | |
4 | JPMBB Commercial Mortgage Securities Trust 2015-C30 | | 3.822% | | 7/15/48 | | 40 | | 43 | |
4 | JPMBB Commercial Mortgage Securities Trust 2015-C31 | | 3.801% | | 8/15/48 | | 220 | | 238 | |
4 | JPMBB Commercial Mortgage Securities Trust 2015-C32 | | 3.598% | | 11/15/48 | | 490 | | 526 | |
4 | JPMCC Commercial Mortgage Securities Trust 2017-JP5 | | 3.723% | | 3/15/50 | | 860 | | 938 | |
4 | JPMCC Commercial Mortgage Securities Trust 2017-JP7 | | 3.454% | | 9/15/50 | | 340 | | 365 | |
4 | JPMDB Commercial Mortgage Securities Trust 2016-C4 | | 3.141% | | 12/15/49 | | 80 | | 84 | |
4 | JPMDB Commercial Mortgage Securities Trust 2017-C7 | | 3.409% | | 10/15/50 | | 240 | | 257 | |
4 | JPMDB Commercial Mortgage Securities Trust 2018-C8 | | 4.211% | | 6/15/51 | | 230 | | 261 | |
4,5,7 | Lanark Master Issuer plc 2018-1A, 3M USD LIBOR + 0.420% | | 2.570% | | 12/22/69 | | 3,206 | | 3,202 | |
4,5,7 | Lanark Master Issuer plc 2018-2A, 3M USD LIBOR + 0.420% | | 2.570% | | 12/22/69 | | 12,228 | | 12,259 | |
| Louisiana Local Government Environmental Facilities & Community Development Authority Revenue 2010-ELL | | 3.450% | | 2/1/22 | | 866 | | 867 | |
4 | Mercedes-Benz Auto Receivables Trust 2018-1 | | 3.150% | | 10/15/24 | | 12,310 | | 12,684 | |
4 | Mercedes-Benz Auto Receivables Trust 2019-1 | | 2.040% | | 1/15/26 | | 9,370 | | 9,391 | |
4,5 | Mercedes-Benz Master Owner Trust 2019-B | | 2.610% | | 5/15/24 | | 23,330 | | 23,702 | |
4,5 | MMAF Equipment Finance LLC 2015-AA | | 2.490% | | 2/19/36 | | 1,083 | | 1,088 | |
4,5 | MMAF Equipment Finance LLC 2016-AA | | 2.210% | | 12/15/32 | | 8,390 | | 8,414 | |
4,5 | MMAF Equipment Finance LLC 2017-A | | 2.410% | | 8/16/24 | | 10,320 | | 10,338 | |
4,5 | MMAF Equipment Finance LLC 2017-A | | 2.680% | | 7/16/27 | | 5,160 | | 5,256 | |
4,5 | MMAF Equipment Finance LLC 2018-A | | 3.390% | | 1/10/25 | | 6,490 | | 6,682 | |
4,5 | MMAF Equipment Finance LLC 2018-A | | 3.610% | | 3/10/42 | | 3,550 | | 3,711 | |
4,5 | MMAF Equipment Finance LLC 2019-A | | 3.080% | | 11/12/41 | | 4,320 | | 4,456 | |
4 | Morgan Stanley Bank of America Merrill Lynch Trust 2012-C5 | | 3.176% | | 8/15/45 | | 879 | | 900 | |
4 | Morgan Stanley Bank of America Merrill Lynch Trust 2012-C5 | | 3.792% | | 8/15/45 | | 694 | | 719 | |
4 | Morgan Stanley Bank of America Merrill Lynch Trust 2012-C6 | | 2.858% | | 11/15/45 | | 388 | | 394 | |
4 | Morgan Stanley Bank of America Merrill Lynch Trust 2013-C10 | | 4.218% | | 7/15/46 | | 3,023 | | 3,222 | |
4 | Morgan Stanley Bank of America Merrill Lynch Trust 2013-C11 | | 3.960% | | 8/15/46 | | 1,023 | | 1,081 | |
4 | Morgan Stanley Bank of America Merrill Lynch Trust 2013-C11 | | 4.299% | | 8/15/46 | | 70 | | 75 | |
4 | Morgan Stanley Bank of America Merrill Lynch Trust 2013-C12 | | 3.824% | | 10/15/46 | | 235 | | 242 | |
4 | Morgan Stanley Bank of America Merrill Lynch Trust 2013-C12 | | 4.259% | | 10/15/46 | | 70 | | 75 | |
4 | Morgan Stanley Bank of America Merrill Lynch Trust 2013-C13 | | 4.039% | | 11/15/46 | | 150 | | 160 | |
15
Institutional Short-Term Bond Fund
| | | | | | | Face | | Market | |
| | | | | Maturity | | Amount | | Value· | |
| | | Coupon | | Date | | ($000 | ) | ($000 | ) |
4 | Morgan Stanley Bank of America Merrill Lynch Trust 2014-C14 | | 4.064% | | 2/15/47 | | 250 | | 268 | |
4 | Morgan Stanley Bank of America Merrill Lynch Trust 2014-C14 | | 4.384% | | 2/15/47 | | 250 | | 271 | |
4 | Morgan Stanley Bank of America Merrill Lynch Trust 2014-C15 | | 3.773% | | 4/15/47 | | 1,489 | | 1,578 | |
4 | Morgan Stanley Bank of America Merrill Lynch Trust 2014-C15 | | 4.051% | | 4/15/47 | | 2,065 | | 2,217 | |
4 | Morgan Stanley Bank of America Merrill Lynch Trust 2014-C16 | | 3.892% | | 6/15/47 | | 2,008 | | 2,146 | |
4 | Morgan Stanley Bank of America Merrill Lynch Trust 2014-C16 | | 4.094% | | 6/15/47 | | 465 | | 496 | |
4 | Morgan Stanley Bank of America Merrill Lynch Trust 2014-C17 | | 3.741% | | 8/15/47 | | 70 | | 74 | |
4 | Morgan Stanley Bank of America Merrill Lynch Trust 2014-C18 | | 3.923% | | 10/15/47 | | 20 | | 21 | |
4 | Morgan Stanley Bank of America Merrill Lynch Trust 2014-C19 | | 3.326% | | 12/15/47 | | 200 | | 206 | |
4 | Morgan Stanley Bank of America Merrill Lynch Trust 2014-C19 | | 3.526% | | 12/15/47 | | 20 | | 21 | |
4 | Morgan Stanley Bank of America Merrill Lynch Trust 2015-C20 | | 3.069% | | 2/15/48 | | 250 | | 257 | |
4 | Morgan Stanley Bank of America Merrill Lynch Trust 2015-C20 | | 3.249% | | 2/15/48 | | 90 | | 94 | |
4 | Morgan Stanley Bank of America Merrill Lynch Trust 2015-C23 | | 3.451% | | 7/15/50 | | 230 | | 243 | |
4 | Morgan Stanley Bank of America Merrill Lynch Trust 2015-C23 | | 3.719% | | 7/15/50 | | 1,450 | | 1,558 | |
4 | Morgan Stanley Bank of America Merrill Lynch Trust 2015-C24 | | 3.732% | | 5/15/48 | | 1,190 | | 1,279 | |
4 | Morgan Stanley Bank of America Merrill Lynch Trust 2015-C25 | | 3.635% | | 10/15/48 | | 2,372 | | 2,545 | |
4 | Morgan Stanley Bank of America Merrill Lynch Trust 2016-C29 | | 3.325% | | 5/15/49 | | 1,800 | | 1,902 | |
4 | Morgan Stanley Bank of America Merrill Lynch Trust 2016-C32 | | 3.720% | | 12/15/49 | | 3,050 | | 3,317 | |
4 | Morgan Stanley Bank of America Merrill Lynch Trust 2017-C34 | | 3.536% | | 11/15/52 | | 460 | | 496 | |
4,5 | Morgan Stanley Capital I Trust 2012-STAR | | 3.201% | | 8/5/34 | | 1,344 | | 1,383 | |
4 | Morgan Stanley Capital I Trust 2015-UBS8 | | 3.809% | | 12/15/48 | | 6,630 | | 7,155 | |
4 | Morgan Stanley Capital I Trust 2016-BNK2 | | 3.049% | | 11/15/49 | | 150 | | 157 | |
4 | Morgan Stanley Capital I Trust 2016-UB11 | | 2.782% | | 8/15/49 | | 1,580 | | 1,616 | |
4 | Morgan Stanley Capital I Trust 2016-UBS9 | | 3.594% | | 3/15/49 | | 1,760 | | 1,883 | |
4 | Morgan Stanley Capital I Trust 2017-HR2 | | 3.509% | | 12/15/50 | | 180 | | 192 | |
4 | Morgan Stanley Capital I Trust 2017-HR2 | | 3.587% | | 12/15/50 | | 222 | | 240 | |
4 | Morgan Stanley Capital I Trust 2018-H4 | | 4.247% | | 12/15/51 | | 170 | | 190 | |
4,5,7 | Motor plc 2017-1A, 1M USD LIBOR + 0.530% | | 2.548% | | 9/25/24 | | 6,045 | | 6,044 | |
4,7 | Navient Student Loan Trust 2014-8, 1M USD LIBOR + 0.600% | | 2.458% | | 4/25/23 | | 367 | | 367 | |
4,5,7 | Navient Student Loan Trust 2016-2, 1M USD LIBOR + 1.050% | | 3.068% | | 6/25/65 | | 4,069 | | 4,087 | |
4,5,7 | Navient Student Loan Trust 2016-3, 1M USD LIBOR + 0.850% | | 2.868% | | 6/25/65 | | 2,621 | | 2,628 | |
16
Institutional Short-Term Bond Fund
| | | | | | | Face | | Market | |
| | | | | Maturity | | Amount | | Value· | |
| | | Coupon | | Date | | ($000 | ) | ($000 | ) |
4,5,7 | Navient Student Loan Trust 2016-6A, 1M USD LIBOR + 0.750% | | 2.768% | | 3/25/66 | | 29,643 | | 29,794 | |
4,5,7 | Navient Student Loan Trust 2017-1, 1M USD LIBOR + 0.750% | | 2.768% | | 7/26/66 | | 9,576 | | 9,598 | |
4 | Nissan Auto Lease Trust 2017-A | | 2.040% | | 9/15/22 | | 3,688 | | 3,688 | |
4 | Nissan Auto Lease Trust 2018-B | | 3.250% | | 9/15/21 | | 31,440 | | 31,790 | |
4 | Nissan Auto Lease Trust 2018-B | | 3.350% | | 9/15/23 | | 12,040 | | 12,231 | |
4 | Nissan Auto Lease Trust 2019-A | | 2.760% | | 3/15/22 | | 10,180 | | 10,290 | |
4 | Nissan Auto Lease Trust 2019-A | | 2.780% | | 7/15/24 | | 5,000 | | 5,083 | |
4 | Nissan Auto Receivables 2017-C Owner Trust | | 2.120% | | 4/18/22 | | 15,700 | | 15,707 | |
4 | Nissan Auto Receivables 2017-C Owner Trust | | 2.280% | | 2/15/24 | | 8,850 | | 8,891 | |
4 | Nissan Auto Receivables 2018-B Owner Trust | | 3.160% | | 12/16/24 | | 12,310 | | 12,686 | |
4 | Nissan Auto Receivables 2019-A Owner Trust | | 3.000% | | 9/15/25 | | 6,410 | | 6,630 | |
4 | Nissan Auto Receivables 2019-B Owner Trust | | 2.500% | | 11/15/23 | | 6,420 | | 6,500 | |
4 | Nissan Auto Receivables 2019-B Owner Trust | | 2.540% | | 12/15/25 | | 1,250 | | 1,278 | |
4,5 | OBP Depositor LLC Trust 2010-OBP | | 4.646% | | 7/15/45 | | 654 | | 664 | |
4,5 | Palisades Center Trust 2016-PLSD | | 2.713% | | 4/13/33 | | 510 | | 512 | |
4,5,7 | Pepper Residential Securities Trust 2017-A, 1M USD LIBOR + 1.100% | | 3.149% | | 3/10/58 | | 59 | | 59 | |
4,5,7 | Pepper Residential Securities Trust 2018-A, 1M USD LIBOR + 0.950% | | 2.989% | | 3/12/47 | | 38 | | 38 | |
4,5,7 | Pepper Residential Securities Trust 2021-A1U, 1M USD LIBOR + 0.880% | | 2.908% | | 1/16/60 | | 2,220 | | 2,219 | |
4,5,7 | Pepper Residential Securities Trust 2022-A1U, 1M USD LIBOR + 0.350% | | 3.044% | | 6/20/60 | | 11,973 | | 12,016 | |
4,5,7 | Pepper Residential Securities Trust 2023-A1U, 1M USD LIBOR + 0.950% | | 2.991% | | 8/18/60 | | 5,219 | | 5,220 | |
4,5,7 | Permanent Master Issuer plc 2018-1A, 3M USD LIBOR + 0.380% | | 2.683% | | 7/15/58 | | 13,840 | | 13,873 | |
4,5 | PFS Financing Corp. 2017-B | | 2.220% | | 7/15/22 | | 1,020 | | 1,021 | |
4,5,7 | PFS Financing Corp. 2017-C, 1M USD LIBOR + 0.470% | | 2.498% | | 10/15/21 | | 1,440 | | 1,440 | |
4,5 | PFS Financing Corp. 2017-D | | 2.400% | | 10/17/22 | | 1,500 | | 1,503 | |
4,5 | PFS Financing Corp. 2018-D | | 3.190% | | 4/17/23 | | 640 | | 650 | |
4,5,7 | PHEAA Student Loan Trust 2016-2A, 1M USD LIBOR + 0.950% | | 2.968% | | 11/25/65 | | 10,798 | | 10,818 | |
4 | Public Service New Hampshire Funding LLC 2018-1 | | 3.094% | | 2/1/26 | | 5,097 | | 5,217 | |
4,5,7 | Resimac Premier Series 2017-1A, 1M USD LIBOR + 0.950% | | 2.999% | | 9/11/48 | | 2,758 | | 2,760 | |
4,5,7 | Resimac Premier Series 2018-1A, 1M USD LIBOR + 0.800% | | 2.849% | | 11/10/49 | | 1,640 | | 1,639 | |
4,5,7 | Resimac Premier Series 2018-1NCA, 1M USD LIBOR + 0.850% | | 2.917% | | 12/5/59 | | 2,538 | | 2,535 | |
4,5,7 | Resimac Premier Series 2018-2, 1M USD LIBOR + 0.850% | | 2.899% | | 4/10/50 | | 4,206 | | 4,205 | |
4,5 | Santander Retail Auto Lease Trust 2018-A | | 2.930% | | 5/20/21 | | 16,210 | | 16,287 | |
4,5 | Santander Retail Auto Lease Trust 2018-A | | 3.060% | | 4/20/22 | | 5,680 | | 5,729 | |
4,5 | Santander Retail Auto Lease Trust 2019-A | | 2.770% | | 6/20/22 | | 20,730 | | 21,046 | |
4,5 | Securitized Term Auto Receivables Trust 2017-1A | | 1.890% | | 8/25/20 | | 1,230 | | 1,229 | |
4,5 | Securitized Term Auto Receivables Trust 2017-1A | | 2.209% | | 6/25/21 | | 12,900 | | 12,907 | |
17
Institutional Short-Term Bond Fund
| | | | | | | Face | | Market | |
| | | | | Maturity | | Amount | | Value· | |
| | | Coupon | | Date | | ($000 | ) | ($000 | ) |
4,5 | Securitized Term Auto Receivables Trust 2017-2A | | 2.289% | | 3/25/22 | | 4,160 | | 4,148 | |
4,5 | Securitized Term Auto Receivables Trust 2018-1A | | 3.068% | | 1/25/22 | | 11,310 | | 11,397 | |
4,5 | Securitized Term Auto Receivables Trust 2018-1A | | 3.298% | | 11/25/22 | | 4,030 | | 4,117 | |
4,5 | Securitized Term Auto Receivables Trust 2018-2A | | 3.544% | | 6/26/23 | | 3,820 | | 3,939 | |
4 | SMART ABS Series 2016-2US Trust | | 2.050% | | 12/14/22 | | 2,330 | | 2,322 | |
4,5 | SMB Private Education Loan Trust 2016-A | | 2.700% | | 5/15/31 | | 374 | | 379 | |
4,5,7 | SMB Private Education Loan Trust 2016-B, 1M USD LIBOR + 1.500% | | 3.477% | | 2/17/32 | | 304 | | 311 | |
4,5,7 | SMB Private Education Loan Trust 2016-C, 1M USD LIBOR + 1.100% | | 3.128% | | 9/15/34 | | 509 | | 512 | |
4,5,7 | SMB Private Education Loan Trust 2017-A, 1M USD LIBOR + 0.900% | | 2.927% | | 9/15/34 | | 2,572 | | 2,578 | |
4,5 | SMB Private Education Loan Trust 2017-B | | 2.820% | | 10/15/35 | | 766 | | 776 | |
4,5 | SMB Private Education Loan Trust 2018-A | | 3.500% | | 2/15/36 | | 2,320 | | 2,433 | |
4,5 | SMB Private Education Loan Trust 2018-B | | 3.600% | | 1/15/37 | | 1,370 | | 1,416 | |
4,5 | SMB Private Education Loan Trust 2018-C | | 3.630% | | 11/15/35 | | 2,530 | | 2,632 | |
4,5 | SoFi Professional Loan Program 2017-A LLC | | 2.400% | | 3/26/40 | | 3,366 | | 3,373 | |
4,5,7 | SoFi Professional Loan Program 2017-A LLC, 1M USD LIBOR + 0.700% | | 2.718% | | 3/26/40 | | 1,262 | | 1,264 | |
4,5 | SoFi Professional Loan Program 2017-B LLC | | 2.740% | | 5/25/40 | | 863 | | 875 | |
4,5 | SoFi Professional Loan Program 2017-D LLC | | 2.650% | | 9/25/40 | | 600 | | 605 | |
4,5 | SoFi Professional Loan Program 2017-E LLC | | 1.860% | | 11/26/40 | | 459 | | 458 | |
4,5 | SoFi Professional Loan Program 2017-E LLC | | 2.720% | | 11/26/40 | | 350 | | 355 | |
4,5 | SoFi Professional Loan Program 2017-F LLC | | 2.050% | | 1/25/41 | | 468 | | 467 | |
4,5 | SoFi Professional Loan Program 2017-F LLC | | 2.840% | | 1/25/41 | | 580 | | 588 | |
4,5 | SoFi Professional Loan Program 2018-A LLC | | 2.390% | | 2/25/42 | | 236 | | 237 | |
4,5 | SoFi Professional Loan Program 2018-A LLC | | 2.950% | | 2/25/42 | | 230 | | 234 | |
4,5 | SoFi Professional Loan Program 2018-B LLC | | 3.340% | | 8/25/47 | | 1,600 | | 1,644 | |
4,5 | SoFi Professional Loan Program 2018-C LLC | | 3.590% | | 1/25/48 | | 3,590 | | 3,740 | |
4,5 | SoFi Professional Loan Program 2018-D LLC | | 3.600% | | 2/25/48 | | 2,000 | | 2,107 | |
4 | Synchrony Card Issuance Trust 2018-A1 | | 3.380% | | 9/15/24 | | 13,520 | | 13,863 | |
4 | Synchrony Card Issuance Trust 2019-2A | | 2.340% | | 6/15/25 | | 20,100 | | 20,260 | |
4 | Synchrony Credit Card Master Note Trust 2015-4 | | 2.380% | | 9/15/23 | | 24,190 | | 24,268 | |
4 | Synchrony Credit Card Master Note Trust 2016-2 | | 2.210% | | 5/15/24 | | 210 | | 211 | |
4 | Synchrony Credit Card Master Note Trust 2017-2 | | 2.620% | | 10/15/25 | | 5,240 | | 5,334 | |
4,5 | TMSQ 2014-1500 Mortgage Trust | | 3.680% | | 10/10/36 | | 100 | | 106 | |
4 | Toyota Auto Receivables 2017-D Owner Trust | | 2.120% | | 2/15/23 | | 840 | | 842 | |
4 | Toyota Auto Receivables 2018-A Owner Trust | | 2.520% | | 5/15/23 | | 480 | | 485 | |
4 | Toyota Auto Receivables 2018-B Owner Trust | | 3.110% | | 11/15/23 | | 5,060 | | 5,189 | |
4 | Toyota Auto Receivables 2018-C Owner Trust | | 3.020% | | 12/15/22 | | 30,750 | | 31,186 | |
4 | Toyota Auto Receivables 2018-C Owner Trust | | 3.130% | | 2/15/24 | | 14,270 | | 14,725 | |
4 | Toyota Auto Receivables 2019-A Owner Trust | | 2.910% | | 7/17/23 | | 50,390 | | 51,288 | |
4 | Toyota Auto Receivables 2019-A Owner Trust | | 3.000% | | 5/15/24 | | 4,280 | | 4,415 | |
4 | Toyota Auto Receivables 2019-C Owner Trust | | 1.910% | | 9/15/23 | | 32,870 | | 32,852 | |
4,5 | Trafigura Securitisation Finance plc 2017-1A | | 2.470% | | 12/15/20 | | 2,350 | | 2,336 | |
4,5 | Trafigura Securitisation Finance plc 2018-1A | | 3.730% | | 3/15/22 | | 4,940 | | 4,964 | |
4,5 | Trillium Credit Card Trust II 2019-2A | | 3.038% | | 1/26/24 | | 40,460 | | 40,948 | |
18
Institutional Short-Term Bond Fund
| | | | | | | Face | | Market | |
| | | | | Maturity | | Amount | | Value· | |
| | | Coupon | | Date | | ($000 | ) | ($000 | ) |
4 | UBS Commercial Mortgage Trust 2012-C1 | | 4.171% | | 5/10/45 | | 247 | | 257 | |
4 | UBS Commercial Mortgage Trust 2017-C7 | | 3.679% | | 12/15/50 | | 495 | | 538 | |
4 | UBS Commercial Mortgage Trust 2019-C16 | | 3.460% | | 4/15/52 | | 214 | | 229 | |
4,5 | UBS-BAMLL Trust 2012-WRM | | 3.663% | | 6/10/30 | | 2,364 | | 2,434 | |
4 | UBS-Barclays Commercial Mortgage Trust 2012-C4 | | 2.850% | | 12/10/45 | | 521 | | 532 | |
4 | UBS-Barclays Commercial Mortgage Trust 2013-C6 | | 3.244% | | 4/10/46 | | 100 | | 103 | |
4 | UBS-Barclays Commercial Mortgage Trust 2013-C6 | | 3.469% | | 4/10/46 | | 60 | | 62 | |
4 | USAA Auto Owner Trust 2017-1 | | 1.880% | | 9/15/22 | | 7,560 | | 7,539 | |
4 | USAA Auto Owner Trust 2019-1 | | 2.160% | | 7/17/23 | | 9,440 | | 9,464 | |
4,5 | Verizon Owner Trust 2018-1 | | 2.820% | | 9/20/22 | | 35,740 | | 35,993 | |
4 | Verizon Owner Trust 2018-A | | 3.230% | | 4/20/23 | | 40,810 | | 41,596 | |
4 | Verizon Owner Trust 2019-A | | 2.930% | | 9/20/23 | | 13,810 | | 14,057 | |
4,5 | VNDO 2012-6AVE Mortgage Trust | | 2.996% | | 11/15/30 | | 2,236 | | 2,287 | |
4 | Volkswagen Auto Loan Enhanced Trust 2018-1 | | 3.020% | | 11/21/22 | | 18,810 | | 19,041 | |
4 | Volkswagen Auto Loan Enhanced Trust 2018-1 | | 3.150% | | 7/22/24 | | 8,520 | | 8,732 | |
4 | Volkswagen Auto Loan Enhanced Trust 2018-2 | | 3.250% | | 4/20/23 | | 39,670 | | 40,343 | |
4 | Volkswagen Auto Loan Enhanced Trust 2018-2 | | 3.330% | | 2/20/25 | | 11,540 | | 11,945 | |
4 | Wells Fargo Commercial Mortgage Trust 2012-LC5 | | 2.918% | | 10/15/45 | | 513 | | 523 | |
4 | Wells Fargo Commercial Mortgage Trust 2012-LC5 | | 3.539% | | 10/15/45 | | 434 | | 448 | |
4 | Wells Fargo Commercial Mortgage Trust 2013-LC12 | | 3.928% | | 7/15/46 | | 260 | | 269 | |
4 | Wells Fargo Commercial Mortgage Trust 2013-LC12 | | 4.218% | | 7/15/46 | | 1,306 | | 1,396 | |
4 | Wells Fargo Commercial Mortgage Trust 2013-LC12 | | 4.420% | | 7/15/46 | | 350 | | 373 | |
4 | Wells Fargo Commercial Mortgage Trust 2014-LC16 | | 3.548% | | 8/15/50 | | 90 | | 95 | |
4 | Wells Fargo Commercial Mortgage Trust 2014-LC16 | | 3.817% | | 8/15/50 | | 20 | | 21 | |
4 | Wells Fargo Commercial Mortgage Trust 2014-LC18 | | 3.405% | | 12/15/47 | | 10 | | 11 | |
4 | Wells Fargo Commercial Mortgage Trust 2015-C26 | | 3.166% | | 2/15/48 | | 1,010 | | 1,054 | |
4 | Wells Fargo Commercial Mortgage Trust 2015-C27 | | 3.190% | | 2/15/48 | | 72 | | 75 | |
4 | Wells Fargo Commercial Mortgage Trust 2015-C27 | | 3.451% | | 2/15/48 | | 460 | | 487 | |
4 | Wells Fargo Commercial Mortgage Trust 2015-C29 | | 3.637% | | 6/15/48 | | 2,674 | | 2,864 | |
4 | Wells Fargo Commercial Mortgage Trust 2015-C30 | | 3.664% | | 9/15/58 | | 700 | | 752 | |
4 | Wells Fargo Commercial Mortgage Trust 2015-LC22 | | 3.839% | | 9/15/58 | | 1,771 | | 1,919 | |
4 | Wells Fargo Commercial Mortgage Trust 2015-SG1 | | 3.789% | | 9/15/48 | | 2,594 | | 2,793 | |
4 | Wells Fargo Commercial Mortgage Trust 2016-BNK1 | | 2.652% | | 8/15/49 | | 880 | | 897 | |
4 | Wells Fargo Commercial Mortgage Trust 2016-C32 | | 3.560% | | 1/15/59 | | 2,460 | | 2,631 | |
19
Institutional Short-Term Bond Fund
| | | | | | | Face | | Market | |
| | | | | Maturity | | Amount | | Value· | |
| | | Coupon | | Date | | ($000 | ) | ($000 | ) |
4 | Wells Fargo Commercial Mortgage Trust 2016-C37 | | 3.525% | | 12/15/49 | | 360 | | 385 | |
4 | Wells Fargo Commercial Mortgage Trust 2016-C37 | | 3.794% | | 12/15/49 | | 90 | | 98 | |
4 | Wells Fargo Commercial Mortgage Trust 2017-C38 | | 3.453% | | 7/15/50 | | 520 | | 558 | |
4 | Wells Fargo Commercial Mortgage Trust 2017-C39 | | 3.157% | | 9/15/50 | | 190 | | 200 | |
4 | Wells Fargo Commercial Mortgage Trust 2017-C39 | | 3.418% | | 9/15/50 | | 2,135 | | 2,284 | |
4 | Wells Fargo Commercial Mortgage Trust 2017-C40 | | 3.581% | | 10/15/50 | | 1,160 | | 1,255 | |
4 | Wells Fargo Commercial Mortgage Trust 2 017-C41 | | 3.472% | | 11/15/50 | | 1,430 | | 1,536 | |
4 | Wells Fargo Commercial Mortgage Trust 2017-C42 | | 3.589% | | 12/15/50 | | 580 | | 628 | |
4 | Wells Fargo Commercial Mortgage Trust 2017-RC1 | | 3.631% | | 1/15/60 | | 246 | | 266 | |
4 | Wells Fargo Commercial Mortgage Trust 2018-C46 | | 4.152% | | 8/15/51 | | 235 | | 265 | |
4 | Wells Fargo Commercial Mortgage Trust 2018-C47 | | 4.365% | | 9/15/61 | | 3,410 | | 3,815 | |
4 | Wells Fargo Commercial Mortgage Trust 2018-C48 | | 4.245% | | 1/15/52 | | 280 | | 311 | |
4 | Wells Fargo Commercial Mortgage Trust 2019-C49 | | 3.933% | | 3/15/52 | | 230 | | 252 | |
4 | Wells Fargo Commercial Mortgage Trust 2019-C49 | | 4.023% | | 3/15/52 | | 190 | | 214 | |
4 | Wells Fargo Commercial Mortgage Trust 2019-C50 | | 3.635% | | 5/15/52 | | 250 | | 270 | |
4 | Wells Fargo Commercial Mortgage Trust 2019-C52 | | 2.892% | | 8/15/52 | | 240 | | 249 | |
4,5 | WFRBS Commercial Mortgage Trust 2011-C3 | | 4.375% | | 3/15/44 | | 614 | | 631 | |
4 | WFRBS Commercial Mortgage Trust 2012-C7 | | 3.431% | | 6/15/45 | | 597 | | 615 | |
4 | WFRBS Commercial Mortgage Trust 2012-C7 | | 4.090% | | 6/15/45 | | 752 | | 782 | |
4 | WFRBS Commercial Mortgage Trust 2012-C8 | | 3.001% | | 8/15/45 | | 385 | | 393 | |
4 | WFRBS Commercial Mortgage Trust 2012-C9 | | 2.870% | | 11/15/45 | | 1,152 | | 1,178 | |
4 | WFRBS Commercial Mortgage Trust 2012-C9 | | 3.388% | | 11/15/45 | | 567 | | 584 | |
4 | WFRBS Commercial Mortgage Trust 2013-C15 | | 3.720% | | 8/15/46 | | 298 | | 307 | |
4 | WFRBS Commercial Mortgage Trust 2013-C15 | | 4.153% | | 8/15/46 | | 526 | | 562 | |
4 | WFRBS Commercial Mortgage Trust 2013-C17 | | 3.558% | | 12/15/46 | | 181 | | 186 | |
4 | WFRBS Commercial Mortgage Trust 2013-C18 | | 3.676% | | 12/15/46 | | 300 | | 310 | |
4 | WFRBS Commercial Mortgage Trust 2013-C18 | | 4.162% | | 12/15/46 | | 1,042 | | 1,121 | |
4 | WFRBS Commercial Mortgage Trust 2014-C19 | | 3.829% | | 3/15/47 | | 960 | | 1,019 | |
4 | WFRBS Commercial Mortgage Trust 2014-C19 | | 4.101% | | 3/15/47 | | 110 | | 118 | |
4 | WFRBS Commercial Mortgage Trust 2014-C20 | | 3.995% | | 5/15/47 | | 30 | | 32 | |
4 | WFRBS Commercial Mortgage Trust 2014-C21 | | 3.410% | | 8/15/47 | | 80 | | 84 | |
4 | WFRBS Commercial Mortgage Trust 2014-C21 | | 3.678% | | 8/15/47 | | 230 | | 244 | |
4 | WFRBS Commercial Mortgage Trust 2014-C23 | | 3.650% | | 10/15/57 | | 791 | | 839 | |
4 | WFRBS Commercial Mortgage Trust 2014-C23 | | 3.917% | | 10/15/57 | | 1,038 | | 1,116 | |
4 | WFRBS Commercial Mortgage Trust 2014-C24 | | 3.607% | | 11/15/47 | | 2,251 | | 2,390 | |
20
Institutional Short-Term Bond Fund
| | | | | | | Face | | Market | |
| | | | | Maturity | | Amount | | Value· | |
| | | Coupon | | Date | | ($000 | ) | ($000 | ) |
4 | WFRBS Commercial Mortgage Trust 2014-LC14 | | 3.766% | | 3/15/47 | | 60 | | 64 | |
4 | WFRBS Commercial Mortgage Trust 2014-LC14 | | 4.045% | | 3/15/47 | | 1,179 | | 1,264 | |
4,5 | Wheels SPV 2 LLC 2016-1A | | 1.870% | | 5/20/25 | | 637 | | 636 | |
4 | World Financial Network Credit Card Master Note Trust Series 2015-B | | 2.550% | | 6/17/24 | | 3,270 | | 3,280 | |
4 | World Omni Auto Receivables Trust 2018-A | | 2.730% | | 2/15/24 | | 5,280 | | 5,353 | |
4 | World Omni Auto Receivables Trust 2018-D | | 3.330% | | 4/15/24 | | 47,300 | | 48,290 | |
4 | World Omni Auto Receivables Trust 2018-D | | 3.440% | | 12/16/24 | | 5,870 | | 6,134 | |
4 | World Omni Auto Receivables Trust 2019-A | | 3.220% | | 6/16/25 | | 6,420 | | 6,667 | |
4 | World Omni Automobile Lease Securitization Trust 2018-A | | 2.830% | | 7/15/21 | | 11,810 | | 11,865 | |
4 | World Omni Automobile Lease Securitization Trust 2018-B | | 3.190% | | 12/15/21 | | 23,160 | | 23,499 | |
4 | World Omni Automobile Lease Securitization Trust 2019-B | | 2.030% | | 11/15/22 | | 22,200 | | 22,118 | |
4,5 | World Omni Select Auto Trust A Series 2018-1 A2 | | 3.240% | | 4/15/22 | | 20,112 | | 20,177 | |
4,5 | World Omni Select Auto Trust A Series 2018-1 A3 | | 3.460% | | 3/15/23 | | 9,120 | | 9,245 | |
Total Asset-Backed/Commercial Mortgage-Backed Securities (Cost $3,438,492) | | | | 3,493,398 | |
Corporate Bonds (23.3%) | | | | | | | | | |
Finance (17.7%) | | | | | | | | | |
| Banking (16.9%) | | | | | | | | | |
5 | ABN AMRO Bank NV | | 3.400% | | 8/27/21 | | 7,500 | | 7,643 | |
| American Express Co. | | 2.200% | | 10/30/20 | | 605 | | 605 | |
| American Express Co. | | 3.700% | | 11/5/21 | | 10,550 | | 10,898 | |
| American Express Co. | | 2.750% | | 5/20/22 | | 3,000 | | 3,045 | |
| American Express Credit Corp. | | 2.250% | | 5/5/21 | | 10,459 | | 10,483 | |
5 | Australia & New Zealand Banking Group Ltd. | | 2.250% | | 12/19/19 | | 15,855 | | 15,860 | |
| Australia & New Zealand Banking Group Ltd. | | 2.625% | | 11/9/22 | | 4,215 | | 4,287 | |
| Banco Santander SA | | 2.706% | | 6/27/24 | | 5,000 | | 5,056 | |
4 | Bank of America Corp. | | 2.369% | | 7/21/21 | | 1,515 | | 1,517 | |
4 | Bank of America Corp. | | 2.328% | | 10/1/21 | | 4,660 | | 4,664 | |
4 | Bank of America Corp. | | 2.738% | | 1/23/22 | | 33,000 | | 33,227 | |
| Bank of Montreal | | 3.300% | | 2/5/24 | | 4,000 | | 4,167 | |
| Bank of Nova Scotia | | 2.228% | | 12/11/19 | | 31,695 | | 31,698 | |
| Bank of Nova Scotia | | 2.350% | | 10/21/20 | | 4,245 | | 4,251 | |
| Bank of Nova Scotia | | 3.400% | | 2/11/24 | | 5,435 | | 5,687 | |
5 | Banque Federative du Credit Mutuel SA | | 2.200% | | 7/20/20 | | 26,854 | | 26,885 | |
5 | Banque Federative du Credit Mutuel SA | | 2.500% | | 4/13/21 | | 4,375 | | 4,382 | |
5 | Banque Federative du Credit Mutuel SA | | 2.700% | | 7/20/22 | | 22,303 | | 22,574 | |
| BB&T Corp. | | 3.050% | | 6/20/22 | | 10,000 | | 10,233 | |
| Branch Banking & Trust Co. | | 2.625% | | 1/15/22 | | 4,000 | | 4,036 | |
| Canadian Imperial Bank of Commerce | | 3.500% | | 9/13/23 | | 20,360 | | 21,430 | |
| Citibank NA | | 2.125% | | 10/20/20 | | 17,095 | | 17,111 | |
| Citibank NA | | 2.850% | | 2/12/21 | | 31,060 | | 31,408 | |
5 | Commonwealth Bank of Australia | | 5.000% | | 10/15/19 | | 12,667 | | 12,681 | |
| Commonwealth Bank of Australia | | 2.300% | | 3/12/20 | | 1,100 | | 1,101 | |
| Commonwealth Bank of Australia | | 2.400% | | 11/2/20 | | 2,045 | | 2,053 | |
5 | Commonwealth Bank of Australia | | 2.000% | | 9/6/21 | | 25,776 | | 25,724 | |
5 | Commonwealth Bank of Australia | | 2.750% | | 3/10/22 | | 4,760 | | 4,834 | |
21
Institutional Short-Term Bond Fund
| | | | | | | Face | | Market | |
| | | | | Maturity | | Amount | | Value· | |
| | | Coupon | | Date | | ($000 | ) | ($000 | ) |
5 | Commonwealth Bank of Australia | | 3.450% | | 3/16/23 | | 2,457 | | 2,567 | |
5 | Commonwealth Bank of Australia | | 3.350% | | 6/4/24 | | 7,650 | | 8,023 | |
| Cooperatieve Rabobank UA | | 3.875% | | 2/8/22 | | 13,745 | | 14,288 | |
5 | Danske Bank A/S | | 2.750% | | 9/17/20 | | 8,000 | | 8,018 | |
5 | Danske Bank A/S | | 2.000% | | 9/8/21 | | 850 | | 843 | |
5 | Federation des Caisses Desjardins du Quebec | | 2.250% | | 10/30/20 | | 11,220 | | 11,237 | |
| Fifth Third Bank | | 2.200% | | 10/30/20 | | 825 | | 826 | |
| Fifth Third Bank | | 2.875% | | 10/1/21 | | 1,450 | | 1,467 | |
| Goldman Sachs Group Inc. | | 2.550% | | 10/23/19 | | 12,800 | | 12,803 | |
| Goldman Sachs Group Inc. | | 2.600% | | 12/27/20 | | 6,415 | | 6,421 | |
| Goldman Sachs Group Inc. | | 2.875% | | 2/25/21 | | 8,856 | | 8,934 | |
| Goldman Sachs Group Inc. | | 2.625% | | 4/25/21 | | 2,250 | | 2,264 | |
| Goldman Sachs Group Inc. | | 3.000% | | 4/26/22 | | 3,000 | | 3,033 | |
| Goldman Sachs Group Inc. | | 3.625% | | 2/20/24 | | 10,000 | | 10,474 | |
| HSBC Holdings plc | | 2.650% | | 1/5/22 | | 36,300 | | 36,554 | |
4 | HSBC Holdings plc | | 3.033% | | 11/22/23 | | 7,020 | | 7,097 | |
4 | HSBC Holdings plc | | 3.950% | | 5/18/24 | | 17,510 | | 18,276 | |
4 | HSBC Holdings plc | | 3.803% | | 3/11/25 | | 1,900 | | 1,979 | |
| Huntington National Bank | | 2.375% | | 3/10/20 | | 5,300 | | 5,305 | |
| JPMorgan Chase & Co. | | 2.550% | | 10/29/20 | | 28,960 | | 29,109 | |
| JPMorgan Chase & Co. | | 2.550% | | 3/1/21 | | 19,218 | | 19,329 | |
4 | JPMorgan Chase & Co. | | 3.514% | | 6/18/22 | | 16,310 | | 16,666 | |
| JPMorgan Chase & Co. | | 3.250% | | 9/23/22 | | 7,585 | | 7,841 | |
4 | JPMorgan Chase & Co. | | 2.776% | | 4/25/23 | | 15,045 | | 15,229 | |
4 | JPMorgan Chase Bank NA | | 3.086% | | 4/26/21 | | 93,000 | | 93,458 | |
| Lloyds Bank plc | | 3.300% | | 5/7/21 | | 25,000 | | 25,426 | |
4 | Lloyds Banking Group plc | | 2.907% | | 11/7/23 | | 10,010 | | 10,043 | |
| Manufacturers & Traders Trust Co. | | 2.050% | | 8/17/20 | | 4,815 | | 4,817 | |
| Manufacturers & Traders Trust Co. | | 2.500% | | 5/18/22 | | 2,440 | | 2,461 | |
| Mitsubishi UFJ Financial Group Inc. | | 2.950% | | 3/1/21 | | 5,278 | | 5,326 | |
| Mitsubishi UFJ Financial Group Inc. | | 3.535% | | 7/26/21 | | 2,500 | | 2,554 | |
| Mitsubishi UFJ Financial Group Inc. | | 2.190% | | 9/13/21 | | 1,930 | | 1,923 | |
| Mitsubishi UFJ Financial Group Inc. | | 3.218% | | 3/7/22 | | 2,400 | | 2,453 | |
| Mitsubishi UFJ Financial Group Inc. | | 2.623% | | 7/18/22 | | 7,000 | | 7,053 | |
| Mitsubishi UFJ Financial Group Inc. | | 2.665% | | 7/25/22 | | 11,390 | | 11,499 | |
| Mitsubishi UFJ Financial Group Inc. | | 3.761% | | 7/26/23 | | 24,765 | | 26,028 | |
5 | Mitsubishi UFJ Trust & Banking Corp. | | 2.450% | | 10/16/19 | | 2,710 | | 2,710 | |
5 | Mitsubishi UFJ Trust & Banking Corp. | | 2.650% | | 10/19/20 | | 18,515 | | 18,626 | |
| Mizuho Financial Group Inc. | | 2.953% | | 2/28/22 | | 2,680 | | 2,719 | |
| Morgan Stanley | | 2.800% | | 6/16/20 | | 808 | | 812 | |
| Morgan Stanley | | 2.500% | | 4/21/21 | | 14,738 | | 14,815 | |
| Morgan Stanley | | 2.625% | | 11/17/21 | | 14,452 | | 14,581 | |
| Morgan Stanley | | 2.750% | | 5/19/22 | | 32,935 | | 33,393 | |
5 | MUFG Bank Ltd. | | 2.300% | | 3/5/20 | | 1,830 | | 1,831 | |
5 | MUFG Bank Ltd. | | 2.750% | | 9/14/20 | | 8,725 | | 8,780 | |
5 | MUFG Bank Ltd. | | 2.850% | | 9/8/21 | | 3,990 | | 4,026 | |
| MUFG Union Bank NA | | 3.150% | | 4/1/22 | | 15,875 | | 16,258 | |
| National Australia Bank Ltd. | | 1.875% | | 7/12/21 | | 15,000 | | 14,950 | |
| National Bank of Canada | | 2.150% | | 6/12/20 | | 7,000 | | 7,010 | |
| PNC Bank NA | | 2.550% | | 12/9/21 | | 1,120 | | 1,129 | |
| PNC Bank NA | | 2.625% | | 2/17/22 | | 850 | | 859 | |
| PNC Bank NA | | 2.700% | | 11/1/22 | | 4,000 | | 4,047 | |
| Royal Bank of Canada | | 2.150% | | 10/26/20 | | 16,860 | | 16,885 | |
| Royal Bank of Canada | | 3.700% | | 10/5/23 | | 4,670 | | 4,940 | |
22
Institutional Short-Term Bond Fund
| | | | | | | Face | | Market | |
| | | | | Maturity | | Amount | | Value· | |
| | | Coupon | | Date | | ($000 | ) | ($000 | ) |
| Royal Bank of Canada | | 2.550% | | 7/16/24 | | 1,366 | | 1,382 | |
| Santander UK plc | | 3.400% | | 6/1/21 | | 24,000 | | 24,370 | |
| State Street Corp. | | 4.375% | | 3/7/21 | | 3,200 | | 3,305 | |
| Sumitomo Mitsui Banking Corp. | | 2.514% | | 1/17/20 | | 14,190 | | 14,203 | |
| Sumitomo Mitsui Financial Group Inc. | | 2.442% | | 10/19/21 | | 1,950 | | 1,957 | |
| Sumitomo Mitsui Financial Group Inc. | | 3.748% | | 7/19/23 | | 4,695 | | 4,930 | |
| SunTrust Bank | | 2.800% | | 5/17/22 | | 21,000 | | 21,380 | |
| Svenska Handelsbanken AB | | 2.450% | | 3/30/21 | | 800 | | 804 | |
| Svenska Handelsbanken AB | | 1.875% | | 9/7/21 | | 5,215 | | 5,197 | |
| Toronto-Dominion Bank | | 1.900% | | 10/24/19 | | 28,630 | | 28,628 | |
| Toronto-Dominion Bank | | 3.150% | | 9/17/20 | | 17,185 | | 17,358 | |
| Toronto-Dominion Bank | | 3.250% | | 6/11/21 | | 21,675 | | 22,120 | |
| Toronto-Dominion Bank | | 3.500% | | 7/19/23 | | 15,085 | | 15,899 | |
5 | UBS AG | | 2.450% | | 12/1/20 | | 21,355 | | 21,468 | |
5 | UBS Group Funding Jersey Ltd. | | 3.000% | | 4/15/21 | | 6,579 | | 6,655 | |
5 | UBS Group Funding Switzerland AG | | 3.491% | | 5/23/23 | | 3,400 | | 3,493 | |
| US Bancorp | | 2.950% | | 7/15/22 | | 4,800 | | 4,908 | |
| US Bank NA | | 3.450% | | 11/16/21 | | 5,750 | | 5,904 | |
| US Bank NA | | 2.650% | | 5/23/22 | | 8,395 | | 8,539 | |
| Wells Fargo & Co. | | 3.750% | | 1/24/24 | | 11,800 | | 12,460 | |
| Wells Fargo Bank NA | | 2.400% | | 1/15/20 | | 38,900 | | 38,932 | |
| Wells Fargo Bank NA | | 2.600% | | 1/15/21 | | 20,000 | | 20,147 | |
4 | Wells Fargo Bank NA | | 3.325% | | 7/23/21 | | 37,575 | | 37,913 | |
| Wells Fargo Bank NA | | 3.625% | | 10/22/21 | | 19,400 | | 19,953 | |
4 | Wells Fargo Bank NA | | 2.082% | | 9/9/22 | | 3,000 | | 2,991 | |
| Wells Fargo Bank NA | | 3.550% | | 8/14/23 | | 9,525 | | 10,000 | |
| Westpac Banking Corp. | | 2.000% | | 8/19/21 | | 5,000 | | 4,996 | |
| Westpac Banking Corp. | | 2.750% | | 1/11/23 | | 11,725 | | 11,970 | |
| Westpac Banking Corp. | | 3.300% | | 2/26/24 | | 4,310 | | 4,509 | |
| | | | | | | | | | |
| Brokerage (0.0%) | | | | | | | | | |
| Ameriprise Financial Inc. | | 3.000% | | 3/22/22 | | 2,000 | | 2,036 | |
| | | | | | | | | | |
| Insurance (0.6%) | | | | | | | | | |
5 | AIG Global Funding | | 2.700% | | 12/15/21 | | 2,570 | | 2,589 | |
| Berkshire Hathaway Inc. | | 2.750% | | 3/15/23 | | 7,800 | | 7,987 | |
5 | Principal Life Global Funding II | | 2.204% | | 12/11/19 | | 27,685 | | 27,679 | |
| UnitedHealth Group Inc. | | 2.375% | | 10/15/22 | | 2,339 | | 2,352 | |
| UnitedHealth Group Inc. | | 3.500% | | 2/15/24 | | 2,350 | | 2,474 | |
| | | | | | | | | | |
| Real Estate Investment Trusts (0.2%) | | | | | | | | | |
| Realty Income Corp. | | 3.250% | | 10/15/22 | | 2,475 | | 2,546 | |
| Simon Property Group LP | | 4.375% | | 3/1/21 | | 10,000 | | 10,275 | |
| Simon Property Group LP | | 2.500% | | 7/15/21 | | 2,285 | | 2,300 | |
| Simon Property Group LP | | 2.350% | | 1/30/22 | | 3,000 | | 3,021 | |
| | | | | | | | | 1,377,165 | |
Industrial (5.5%) | | | | | | | | | |
| Basic Industry (0.3%) | | | | | | | | | |
| Airgas Inc. | | 2.375% | | 2/15/20 | | 12,470 | | 12,481 | |
5 | Chevron Phillips Chemical Co LLC / Chevron Phillips Chemical Co LP | | 2.450% | | 5/1/20 | | 4,285 | | 4,293 | |
5 | Chevron Phillips Chemical Co. LLC / Chevron Phillips Chemical Co. LP | | 3.300% | | 5/1/23 | | 3,413 | | 3,505 | |
23
Institutional Short-Term Bond Fund
| | | | | | | Face | | Market | |
| | | | | Maturity | | Amount | | Value· | |
| | | Coupon | | Date | | ($000 | ) | ($000 | ) |
| Capital Goods (1.1%) | | | | | | | | | |
| 3M Co. | | 1.750% | | 2/14/23 | | 4,425 | | 4,407 | |
| 3M Co. | | 2.250% | | 3/15/23 | | 3,289 | | 3,322 | |
| Boeing Co. | | 2.300% | | 8/1/21 | | 15,355 | | 15,417 | |
| Caterpillar Financial Services Corp. | | 2.250% | | 12/1/19 | | 15,025 | | 15,026 | |
| Caterpillar Financial Services Corp. | | 1.850% | | 9/4/20 | | 20,000 | | 19,974 | |
| Caterpillar Financial Services Corp. | | 2.500% | | 11/13/20 | | 4,850 | | 4,869 | |
| Caterpillar Financial Services Corp. | | 2.650% | | 5/17/21 | | 12,865 | | 12,996 | |
| Caterpillar Financial Services Corp. | | 1.931% | | 10/1/21 | | 1,130 | | 1,126 | |
| Caterpillar Financial Services Corp. | | 2.400% | | 6/6/22 | | 1,016 | | 1,026 | |
| Caterpillar Financial Services Corp. | | 1.900% | | 9/6/22 | | 7,725 | | 7,712 | |
| John Deere Capital Corp. | | 1.950% | | 6/13/22 | | 2,760 | | 2,759 | |
| | | | | | | | | | |
| Communication (0.2%) | | | | | | | | | |
| America Movil SAB de CV | | 5.000% | | 3/30/20 | | 2,433 | | 2,464 | |
5 | Sky plc | | 3.125% | | 11/26/22 | | 9,480 | | 9,789 | |
| Walt Disney Co. | | 1.650% | | 9/1/22 | | 3,310 | | 3,300 | |
| | | | | | | | | | |
| Consumer Cyclical (0.5%) | | | | | | | | | |
| American Honda Finance Corp. | | 3.000% | | 6/16/20 | | 8,450 | | 8,510 | |
| American Honda Finance Corp. | | 1.650% | | 7/12/21 | | 1,000 | | 994 | |
5 | BMW US Capital LLC | | 3.250% | | 8/14/20 | | 6,300 | | 6,355 | |
5 | Nissan Motor Acceptance Corp. | | 2.150% | | 7/13/20 | | 3,500 | | 3,496 | |
5 | Nissan Motor Acceptance Corp. | | 2.150% | | 9/28/20 | | 5,000 | | 5,004 | |
5 | Nissan Motor Acceptance Corp. | | 2.550% | | 3/8/21 | | 600 | | 601 | |
5 | Nissan Motor Acceptance Corp. | | 3.650% | | 9/21/21 | | 3,500 | | 3,575 | |
5 | Nissan Motor Acceptance Corp. | | 2.600% | | 9/28/22 | | 700 | | 702 | |
| Toyota Motor Corp. | | 3.183% | | 7/20/21 | | 6,600 | | 6,742 | |
| Toyota Motor Credit Corp. | | 2.750% | | 5/17/21 | | 1,000 | | 1,013 | |
| | | | | | | | | | |
| Consumer Noncyclical (1.1%) | | | | | | | | | |
5 | Bristol-Myers Squibb Co. | | 2.550% | | 5/14/21 | | 15,210 | | 15,364 | |
5 | Bristol-Myers Squibb Co. | | 2.600% | | 5/16/22 | | 12,870 | | 13,083 | |
| Gilead Sciences Inc. | | 2.350% | | 2/1/20 | | 14,075 | | 14,077 | |
| GlaxoSmithKline Capital plc | | 2.875% | | 6/1/22 | | 38,600 | | 39,441 | |
| SSM Health Care Corp. | | 3.688% | | 6/1/23 | | 6,485 | | 6,822 | |
| | | | | | | | | | |
| Energy (1.2%) | | | | | | | | | |
| Baker Hughes a GE Co. LLC | | 3.200% | | 8/15/21 | | 12,522 | | 12,709 | |
| BP Capital Markets America Inc. | | 4.500% | | 10/1/20 | | 7,940 | | 8,129 | |
| BP Capital Markets America Inc. | | 3.245% | | 5/6/22 | | 1,135 | | 1,168 | |
| BP Capital Markets plc | | 2.521% | | 1/15/20 | | 480 | | 481 | |
| BP Capital Markets plc | | 2.315% | | 2/13/20 | | 14,647 | | 14,662 | |
| Chevron Corp. | | 2.411% | | 3/3/22 | | 13,980 | | 14,041 | |
| Exxon Mobil Corp. | | 1.902% | | 8/16/22 | | 5,000 | | 5,021 | |
| Shell International Finance BV | | 1.750% | | 9/12/21 | | 11,925 | | 11,884 | |
| Total Capital International SA | | 2.218% | | 7/12/21 | | 10,000 | | 10,038 | |
| Total Capital International SA | | 2.875% | | 2/17/22 | | 18,000 | | 18,406 | |
| | | | | | | | | | |
| Other Industrial (0.2%) | | | | | | | | | |
5 | CK Hutchison International 17 II Ltd. | | 2.250% | | 9/29/20 | | 12,480 | | 12,463 | |
24
Institutional Short-Term Bond Fund
| | | | | | | Face | | Market | |
| | | | | Maturity | | Amount | | Value· | |
| | | Coupon | | Date | | ($000 | ) | ($000 | ) |
| Technology (0.7%) | | | | | | | | | |
| Apple Inc. | | 1.700% | | 9/11/22 | | 8,000 | | 7,988 | |
| International Business Machines Corp. | | 2.800% | | 5/13/21 | | 18,700 | | 18,951 | |
| International Business Machines Corp. | | 2.850% | | 5/13/22 | | 23,380 | | 23,896 | |
| | | | | | | | | | |
| Transportation (0.2%) | | | | | | | | | |
| Burlington Northern Santa Fe LLC | | 4.700% | | 10/1/19 | | 9,257 | | 9,258 | |
4 | Delta Air Lines 2012-1 Class A Pass Through Trust | | 4.750% | | 11/7/21 | | 5,280 | | 5,345 | |
4 | Northwest Airlines 2007-1 Class A Pass Through Trust | | 7.027% | | 5/1/21 | | 3,883 | | 3,895 | |
| | | | | | | | | 428,580 | |
Utilities (0.1%) | | | | | | | | | |
| Electric (0.1%) | | | | | | | | | |
| Berkshire Hathaway Energy Co. | | 2.375% | | 1/15/21 | | 3,325 | | 3,337 | |
| Duke Energy Florida LLC | | 4.550% | | 4/1/20 | | 200 | | 202 | |
| National Rural Utilities Cooperative Finance Corp. | | 3.050% | | 2/15/22 | | 2,023 | | 2,067 | |
| National Rural Utilities Cooperative Finance Corp. | | 2.400% | | 4/25/22 | | 2,000 | | 2,018 | |
| NSTAR Electric Co. | | 3.500% | | 9/15/21 | | 830 | | 849 | |
| Public Service Electric & Gas Co. | | 3.500% | | 8/15/20 | | 1,297 | | 1,313 | |
| | | | | | | | | 9,786 | |
Total Corporate Bonds (Cost $1,791,494) | | | | | | | | 1,815,531 | |
Sovereign Bonds (9.1%) | | | | | | | | | |
5 | Avi Funding Co. Ltd. | | 2.850% | | 9/16/20 | | 7,700 | | 7,738 | |
5 | Bermuda | | 4.138% | | 1/3/23 | | 7,000 | | 7,401 | |
| Bermuda | | 4.138% | | 1/3/23 | | 7,800 | | 8,176 | |
5 | BNG Bank NV | | 1.750% | | 10/30/19 | | 35,000 | | 34,995 | |
5 | CDP Financial Inc. | | 4.400% | | 11/25/19 | | 12,903 | | 12,943 | |
5 | CDP Financial Inc. | | 2.750% | | 3/7/22 | | 32,500 | | 33,262 | |
5 | CDP Financial Inc. | | 3.150% | | 7/24/24 | | 1,750 | | 1,845 | |
| CNOOC Finance 2015 Australia Pty Ltd. | | 2.625% | | 5/5/20 | | 1,850 | | 1,852 | |
| Corp Nacional del Cobre de Chile | | 3.750% | | 11/4/20 | | 1,500 | | 1,523 | |
| Corp. Andina de Fomento | | 2.200% | | 7/18/20 | | 2,307 | | 2,305 | |
5 | CPPIB Capital Inc. | | 2.750% | | 7/22/21 | | 8,000 | | 8,132 | |
5,8 | Dexia Credit Local SA | | 1.875% | | 9/15/21 | | 10,000 | | 9,992 | |
5 | Dexia Credit Local SA | | 2.375% | | 9/20/22 | | 10,290 | | 10,439 | |
5 | Dexia Credit Local SA | | 3.250% | | 9/26/23 | | 50,000 | | 52,567 | |
| Emirate of Abu Dhabi | | 2.500% | | 10/11/22 | | 17,000 | | 17,181 | |
5 | Emirate of Abu Dhabi | | 2.125% | | 9/30/24 | | 13,500 | | 13,424 | |
| Equinor ASA | | 3.150% | | 1/23/22 | | 3,000 | | 3,080 | |
| Equinor ASA | | 2.650% | | 1/15/24 | | 2,000 | | 2,052 | |
| Export-Import Bank of Korea | | 1.500% | | 10/21/19 | | 19,500 | | 19,494 | |
| Export-Import Bank of Korea | | 5.125% | | 6/29/20 | | 1,500 | | 1,533 | |
| Export-Import Bank of Korea | | 4.000% | | 1/29/21 | | 5,200 | | 5,325 | |
| Export-Import Bank of Korea | | 3.000% | | 11/1/22 | | 2,400 | | 2,459 | |
5 | Harvest Operations Corp. | | 4.200% | | 6/1/23 | | 2,000 | | 2,130 | |
| IDB Trust Services Ltd. | | 2.393% | | 4/12/22 | | 25,625 | | 25,805 | |
7 | Industrial & Commercial Bank of China Ltd., 3M USD LIBOR + 0.750% | | 2.937% | | 11/8/20 | | 4,500 | | 4,505 | |
25
Institutional Short-Term Bond Fund
| | | | | | | Face | | Market | |
| | | | | Maturity | | Amount | | Value· | |
| | | Coupon | | Date | | ($000 | ) | ($000 | ) |
| Inter-American Development Bank | | 2.125% | | 11/9/20 | | 150 | | 151 | |
9 | Japan Bank for International Cooperation | | 2.125% | | 11/16/20 | | 12,500 | | 12,518 | |
9 | Japan Bank for International Cooperation | | 3.125% | | 7/20/21 | | 24,300 | | 24,829 | |
9 | Japan Bank for International Cooperation | | 2.500% | | 5/23/24 | | 5,000 | | 5,131 | |
| Kingdom of Saudi Arabia | | 2.375% | | 10/26/21 | | 14,000 | | 14,025 | |
| Korea Development Bank | | 4.625% | | 11/16/21 | | 2,315 | | 2,431 | |
| Korea Development Bank | | 3.000% | | 3/19/22 | | 12,500 | | 12,760 | |
7 | Korea Development Bank, 3M USD LIBOR + 0.475% | | 2.574% | | 10/1/22 | | 50,000 | | 50,009 | |
7 | Korea Development Bank, 3M USD LIBOR + 0.550% | | 2.669% | | 3/12/21 | | 10,000 | | 10,012 | |
7 | Korea Development Bank, 3M USD LIBOR + 0.675% | | 2.839% | | 9/19/20 | | 11,225 | | 11,251 | |
| Korea Hydro & Nuclear Power Co. Ltd. | | 4.750% | | 7/13/21 | | 5,366 | | 5,598 | |
| Korea Hydro & Nuclear Power Co. Ltd. | | 3.000% | | 9/19/22 | | 4,786 | | 4,883 | |
| Korea Midland Power Co. Ltd. | | 2.500% | | 7/21/21 | | 533 | | 535 | |
| Korea Midland Power Co. Ltd. | | 3.375% | | 1/22/22 | | 1,605 | | 1,644 | |
5 | Ontario Teachers’ Finance Trust | | 2.125% | | 9/19/22 | | 20,000 | | 20,195 | |
| Petronas Global Sukuk Ltd. | | 2.707% | | 3/18/20 | | 1,000 | | 1,001 | |
| Province of Alberta | | 1.900% | | 12/6/19 | | 20,000 | | 19,991 | |
5 | Province of Alberta | | 1.750% | | 8/26/20 | | 9,350 | | 9,329 | |
| Province of Manitoba | | 2.100% | | 9/6/22 | | 1,400 | | 1,414 | |
| Province of Ontario | | 4.000% | | 10/7/19 | | 2,575 | | 2,576 | |
| Province of Ontario | | 4.400% | | 4/14/20 | | 19,500 | | 19,722 | |
| Province of Quebec | | 2.750% | | 8/25/21 | | 6,350 | | 6,466 | |
| Republic of Chile | | 3.875% | | 8/5/20 | | 17,600 | | 17,864 | |
| Republic of Chile | | 3.250% | | 9/14/21 | | 650 | | 665 | |
| Republic of Lithuania | | 7.375% | | 2/11/20 | | 40,260 | | 40,995 | |
| Republic of Lithuania | | 6.125% | | 3/9/21 | | 17,510 | | 18,491 | |
| Republic of Lithuania | | 6.625% | | 2/1/22 | | 20,500 | | 22,633 | |
| Republic of Poland | | 5.125% | | 4/21/21 | | 1,350 | | 1,416 | |
| Republic of Poland | | 5.000% | | 3/23/22 | | 20,630 | | 22,126 | |
| State Grid Overseas Investment 2016 Ltd. | | 2.750% | | 5/4/22 | | 5,542 | | 5,585 | |
| State Grid Overseas Investment 2016 Ltd. | | 3.500% | | 5/4/27 | | 3,630 | | 3,833 | |
| State of Israel | | 3.150% | | 6/30/23 | | 2,000 | | 2,084 | |
| State of Kuwait | | 2.750% | | 3/20/22 | | 9,727 | | 9,859 | |
| State of Qatar | | 3.875% | | 4/23/23 | | 9,734 | | 10,295 | |
| State of Qatar | | 3.375% | | 3/14/24 | | 14,800 | | 15,490 | |
5 | Temasek Financial I Ltd. | | 4.300% | | 10/25/19 | | 2,500 | | 2,503 | |
5 | Temasek Financial I Ltd. | | 2.375% | | 1/23/23 | | 5,000 | | 5,065 | |
Total Sovereign Bonds (Cost $694,514) | | | | | | | | 705,533 | |
| | | | | | | | | | |
| | | | | | | Shares | | | |
Temporary Cash Investments (2.7%) | | | | | | | | | |
Money Market Fund (1.3%) | | | | | | | | | |
10 | Vanguard Market Liquidity Fund | | 2.098% | | | | 1,023,134 | | 102,324 | |
26
Institutional Short-Term Bond Fund
| | | | | | | Face | | Market | |
| | | | | Maturity | | Amount | | Value· | |
| | | Coupon | | Date | | ($000 | ) | ($000 | ) |
U.S. Government and Agency Obligations (1.0%) | | | | | | | | | |
| United States Treasury Bill | 1.768%–1.834% | | 9/10/20 | | 80,729 | | 79,401 | |
| | | | | | | | | | |
Certificates of Deposit (0.4%) | | | | | | | | | |
| Cooperatieve Rabobank UA | | 1.980% | | 10/25/19 | | 32,235 | | 32,232 | |
Total Temporary Cash Investments (Cost $213,905) | | | | | | | | 213,957 | |
Total Investments (99.2%) (Cost $7,616,402) | | | | | | | | 7,721,605 | |
| | | | | | | | | | |
| | | | | | | | | Amount | |
| | | | | | | | | ($000 | ) |
Other Assets and Liabilities (0.8%) | | | | | | | | | |
Other Assets | | | | | | | | | |
Investment in Vanguard | | | | | | | | 371 | |
Receivables for Investment Securities Sold | | | | | | | | 88,952 | |
Receivables for Accrued Income | | | | | | | | 28,917 | |
Variation Margin Receivable—Futures Contracts | | | | | | | | 794 | |
Variation Margin Receivable—CC Swap Contracts | | | | | | | | 24 | |
Other Assets | | | | | | | | 899 | |
Total Other Assets | | | | | | | | 119,957 | |
Liabilities | | | | | | | | | |
Payables for Investment Securities Purchased | | | | | | | | (58,689 | ) |
Payables to Vanguard | | | | | | | | (877 | ) |
Variation Margin Payable—Futures Contracts | | | | | | | | (807 | ) |
Variation Margin Payable—CC Swap Contracts | | | | | | | | (22 | ) |
Unrealized Depreciation—OTC Swap Contracts | | | | | | | | (216 | ) |
Other Liabilities | | | | | | | | (1 | ) |
Total Liabilities | | | | | | | | (60,612 | ) |
Net Assets (100%) | | | | | | | | | |
Applicable to 563,146,218 outstanding $.001 par value shares of beneficial interest (unlimited authorization) | | | | | | | | 7,780,950 | |
Net Asset Value Per Share | | | | | | | | $13.82 | |
| | | | | | | | | | | |
27
Institutional Short-Term Bond Fund
At September 30, 2019, net assets consisted of:
| | | | | | | | | Amount | |
| | | | | | | | | ($000 | ) |
Paid-in Capital | | | | | | | | 7,725,451 | |
Total Distributable Earnings (Loss) | | | | | | | | 55,499 | |
Net Assets | | | | | | | | 7,780,950 | |
· See Note A in Notes to Financial Statements.
1 Securities with a value of $4,120,000 have been segregated as initial margin for open futures contracts.
2 Securities with a value of $10,737,000 have been segregated as initial margin for open centrally cleared swap contracts.
3 The issuer was placed under federal conservatorship in September 2008; since that time, its daily operations have been managed by the Federal Housing Finance Agency and it receives capital from the U.S. Treasury, as needed to maintain a positive net worth, in exchange for senior preferred stock.
4 The average or expected maturity is shorter than the final maturity shown because of the possibility of interim principal payments and prepayments or the possibility of the issue being called.
5 Security exempt from registration under Rule 144A of the Securities Act of 1933. Such securities may be sold in transactions exempt from registration, normally to qualified institutional buyers. At September 30, 2019, the aggregate value of these securities was $1,861,007,000, representing 23.9% of net assets.
6 Security purchased on a when-issued or delayed-delivery basis for which the fund has not taken delivery as of September 30, 2019.
7 Adjustable-rate security; rate shown is effective rate at period end. Certain adjustable-rate securities are not based on a published reference rate and spread but are determined by the issuer or agent based on current market conditions.
8 Guaranteed by multiple countries.
9 Guaranteed by the Government of Japan.
10 Affiliated money market fund available only to Vanguard funds and certain trusts and accounts managed by Vanguard. Rate shown is the 7-day yield.
CC—Centrally Cleared.
LIBOR—London Interbank Offered Rate.
OTC—Over-the-Counter.
Derivative Financial Instruments Outstanding as of Period End | | | | |
| | | | | | | | | |
Futures Contracts | | | | | | | | | |
| | | | | | | | ($000 | ) |
| | | | | | | | Value and | |
| | | | Number of | | | | Unrealized | |
| | | | Long (Short | ) | Notional | | Appreciation | |
| | Expiration | | Contracts | | Amount | | (Depreciation | ) |
Long Futures Contracts | | | | | | | | | |
2-Year U.S. Treasury Note | | December 2019 | | 7,510 | | 1,618,405 | | (3,757 | ) |
30-Year U.S. Treasury Bond | | December 2019 | | 69 | | 11,200 | | (78 | ) |
| | | | | | | | (3,835 | ) |
| | | | | | | | | |
Short Futures Contracts | | | | | | | | | |
5-Year U.S. Treasury Note | | December 2019 | | (2,536 | ) | (302,160 | ) | 301 | |
10-Year U.S. Treasury Note | | December 2019 | | (209 | ) | (27,235 | ) | (10 | ) |
Ultra 10-Year U.S. Treasury Note | | December 2019 | | (64 | ) | (9,114 | ) | (54 | ) |
| | | | | | | | 237 | |
| | | | | | | | (3,598 | ) |
28
Institutional Short-Term Bond Fund
Over-the-Counter Credit Default Swaps | | | | | | | | | |
| | | | | | | | | | | | Remaining | | | | | |
| | | | | | | | Periodic | | | | Up-Front | | | | | |
| | | | | | | | Premium | | | | Premium | | | | | |
| | | | | | Notional | | Received | | | | Received | | Unrealized | | Unrealized | |
Reference | | Termination | | | | Amount | | (Paid | )1 | Value | | (Paid | ) | Appreciation | | (Depreciation | ) |
Entity | | Date | | Counterparty | | ($000 | ) | (% | ) | ($000 | ) | ($000 | ) | ($000 | ) | ($000 | ) |
Credit Protection Purchased | | | | | | | | | | | | | | | |
State of Qatar | | 6/20/22 | | BOANA | | 2,720 | | (1.000 | ) | (56 | ) | (18 | ) | — | | (74 | ) |
State of Qatar | | 6/20/22 | | CITNA | | 5,280 | | (1.000 | ) | (108 | ) | (34 | ) | — | | (142 | ) |
| | | | | | | | | | (164 | ) | (52 | ) | — | | (216 | ) |
1 Periodic premium received/paid quarterly.
BOANA—Bank of America, N.A.
CITNA—Citibank N.A.
Centrally Cleared Interest Rate Swaps | | | | | | | |
| | | | | | Fixed | | Floating | | | | | |
| | | | | | Interest | | Interest | | | | | |
| | | | | | Rate | | Rate | | | | Unrealized | |
| | Future | | Notional | | Received | | Received | | | | Appreciation | |
| | Effective | | Amount | | (Paid | )2 | (Paid | )3 | Value | | (Depreciation | ) |
Termination Date | | Date | | ($000 | ) | (% | ) | (% | ) | ($000 | ) | ($000 | ) |
12/18/20 | | 12/18/191 | | 114,572 | | 2.500 | | (0.000 | ) | 910 | | 128 | |
12/20/21 | | 12/18/191 | | 177,164 | | (1.500 | ) | 0.000 | | 180 | | (386 | ) |
12/19/22 | | 12/18/191 | | 165,734 | | (1.500 | ) | 0.000 | | (7 | ) | (592 | ) |
12/18/23 | | 12/18/191 | | 162,807 | | (1.500 | ) | 0.000 | | (138 | ) | (830 | ) |
12/18/24 | | 12/18/191 | | 85,256 | | (1.500 | ) | 0.000 | | (95 | ) | (547 | ) |
12/18/26 | | 12/18/191 | | 64,988 | | (1.750 | ) | 0.000 | | (1,088 | ) | (635 | ) |
| | | | | | | | | | (238 | ) | (2,862 | ) |
1 Forward interest rate swap. In a forward interest rate swap, the fund and the counterparty agree to make periodic net payments beginning on a specified future effective date.
2 Fixed interest payment received/paid semiannually.
3 Based on 3-month LIBOR as of the most recent payment date. Floating interest payment received/paid quarterly.
See accompanying Notes, which are an integral part of the Financial Statements.
29
Institutional Short-Term Bond Fund
Statement of Operations
| | Year Ended | |
| | September 30, 2019 | |
| | ($000 | ) |
Investment Income | | | |
Income | | | |
Interest1 | | 218,353 | |
Total Income | | 218,353 | |
Expenses | | | |
The Vanguard Group—Note B | | | |
Investment Advisory Services | | 283 | |
Management and Administrative | | 1,139 | |
Marketing and Distribution | | 76 | |
Custodian Fees | | 53 | |
Auditing Fees | | 36 | |
Trustees’ Fees and Expenses | | 3 | |
Total Expenses | | 1,590 | |
Net Investment Income | | 216,763 | |
Realized Net Gain (Loss) | | | |
Investment Securities Sold1 | | 20,106 | |
Futures Contracts | | 3,772 | |
Swap Contracts | | (28,253 | ) |
Realized Net Gain (Loss) | | (4,375 | ) |
Change in Unrealized Appreciation (Depreciation) | | | |
Investment Securities1 | | 162,985 | |
Futures Contracts | | (291 | ) |
Swap Contracts | | (3,917 | ) |
Change in Unrealized Appreciation (Depreciation) | | 158,777 | |
Net Increase (Decrease) in Net Assets Resulting from Operations | | 371,165 | |
1 Interest income, realized net gain (loss), and change in unrealized appreciation (depreciation) from an affiliated company of the fund were $5,812,000, $38,000, and $24,000, respectively. Purchases and sales are for temporary cash investment purposes.
See accompanying Notes, which are an integral part of the Financial Statements.
30
Institutional Short-Term Bond Fund
Statement of Changes in Net Assets
| | Year Ended September 30, | |
| | 2019 | | 2018 | |
| | ($000 | ) | ($000 | ) |
Increase (Decrease) in Net Assets | | | | | |
Operations | | | | | |
Net Investment Income | | 216,763 | | 145,799 | |
Realized Net Gain (Loss) | | (4,375 | ) | (37,611 | ) |
Change in Unrealized Appreciation (Depreciation) | | 158,777 | | (59,002 | ) |
Net Increase (Decrease) in Net Assets Resulting from Operations | | 371,165 | | 49,186 | |
Distributions | | | | | |
Net Investment Income | | (216,604 | ) | (145,766 | ) |
Realized Capital Gain | | — | | — | |
Total Distributions | | (216,604 | ) | (145,766 | ) |
Capital Share Transactions | | | | | |
Issued | | 362,489 | | 1,370,015 | |
Issued in Lieu of Cash Distributions | | 216,604 | | 145,766 | |
Redeemed | | (748,794 | ) | (855,959 | ) |
Net Increase (Decrease) from Capital Share Transactions | | (169,701 | ) | 659,822 | |
Total Increase (Decrease) | | (15,140 | ) | 563,242 | |
Net Assets | | | | | |
Beginning of Period | | 7,796,090 | | 7,232,848 | |
End of Period | | 7,780,950 | | 7,796,090 | |
See accompanying Notes, which are an integral part of the Financial Statements.
31
Institutional Short-Term Bond Fund
Financial Highlights
| | | | | | | | | | June 19, |
| | | | | | | | | | 20151 to |
For a Share Outstanding | | Year Ended September 30, | | Sept. 30, |
Throughout Each Period | | 2019 | | 2018 | | 2017 | | 2016 | | 2015 |
Net Asset Value, Beginning of Period | | $13.55 | | $13.75 | | $13.84 | | $13.79 | | $13.79 |
Investment Operations | | | | | | | | | | |
Net Investment Income | | .3732 | | .2932 | | .2212 | | .188 | | .047 |
Net Realized and Unrealized Gain (Loss) | | | | | | | | | | |
on Investments | | .271 | | (.202) | | (.071) | | .052 | | .001 |
Total from Investment Operations | | .644 | | .091 | | .150 | | .240 | | .048 |
Distributions | | | | | | | | | | |
Dividends from Net Investment Income | | (.374) | | (.291) | | (.229) | | (.187) | | (.048) |
Distributions from Realized Capital Gains | | — | | — | | (.011) | | (.003) | | — |
Total Distributions | | (.374) | | (.291) | | (.240) | | (.190) | | (.048) |
Net Asset Value, End of Period | | $13.82 | | $13.55 | | $13.75 | | $13.84 | | $13.79 |
| | | | | | | | | | |
Total Return | | 4.81% | | 0.67% | | 1.10% | | 1.75% | | 0.35% |
| | | | | | | | | | |
Ratios/Supplemental Data | | | | | | | | | | |
Net Assets, End of Period (Millions) | | $7,781 | | $7,796 | | $7,233 | | $10,397 | | $10,270 |
Ratio of Total Expenses to Average Net Assets | | 0.02% | | 0.02% | | 0.02% | | 0.02% | | 0.02%3 |
Ratio of Net Investment Income to | | | | | | | | | | |
Average Net Assets | | 2.73% | | 2.15% | | 1.61% | | 1.37% | | 1.22%3 |
Portfolio Turnover Rate | | 83% | | 118%4 | | 66% | | 119% | | 28% |
1 Commencement of operations as a registered investment company.
2 Calculated based on average shares outstanding.
3 Annualized.
4 Excludes the value of portfolio securities received or delivered as a result of in-kind purchases or redemptions of the fund’s capital shares.
See accompanying Notes, which are an integral part of the Financial Statements.
32
Institutional Short-Term Bond Fund
Notes to Financial Statements
Vanguard Institutional Short-Term Bond Fund is registered under the Investment Company Act of 1940 as an open-end investment company, or mutual fund. The fund has been established by Vanguard as an investment vehicle for certain collective trusts and other accounts managed by Vanguard or its affiliates and qualifying education savings plans. The fund is offered to investors who meet certain administrative and service criteria and invest a minimum of $10 million. Certain of the fund’s investments are in corporate debt instruments; the issuers’ abilities to meet their obligations may be affected by economic developments in their respective industries.
A. The following significant accounting policies conform to generally accepted accounting principles for U.S. investment companies. The fund consistently follows such policies in preparing its financial statements.
1. Security Valuation: Securities are valued as of the close of trading on the New York Stock Exchange (generally 4 p.m., Eastern time) on the valuation date. Bonds and temporary cash investments are valued using the latest bid prices or using valuations based on a matrix system (which considers such factors as security prices, yields, maturities, and ratings), both as furnished by independent pricing services. Structured debt securities, including mortgages and asset-backed securities, are valued using the latest bid prices or using valuations based on a matrix system that considers such factors as issuer, tranche, nominal or option-adjusted spreads, weighted average coupon, weighted average maturity, credit enhancements, and collateral. Investments in Vanguard Market Liquidity Fund are valued at that fund’s net asset value. Securities for which market quotations are not readily available, or whose values have been affected by events occurring before the fund’s pricing time but after the close of the securities’ primary markets, are valued by methods deemed by the board of trustees to represent fair value.
2. Futures Contracts: The fund uses futures contracts to invest in fixed income asset classes with greater efficiency and lower cost than is possible through direct investment, to add value when these instruments are attractively priced, or to adjust sensitivity to changes in interest rates. The primary risks associated with the use of futures contracts are imperfect correlation between changes in market values of bonds held by the fund and the prices of futures contracts, and the possibility of an illiquid market. Counterparty risk involving futures is mitigated because a regulated clearinghouse is the counterparty instead of the clearing broker. To further mitigate counterparty risk, the fund trades futures contracts on an exchange, monitors the financial strength of its clearing brokers and clearinghouse, and has entered into clearing agreements with its clearing brokers. The clearinghouse imposes initial margin requirements to secure the fund’s performance and requires daily settlement of variation margin representing changes in the market value of each contract. Any assets pledged as initial margin for open contracts are noted in the Statement of Net Assets.
Futures contracts are valued at their quoted daily settlement prices. The notional amounts of the contracts are not recorded in the Statement of Net Assets. Fluctuations in the value of the contracts are recorded in the Statement of Net Assets as an asset (liability) and in the Statement of Operations as unrealized appreciation (depreciation) until the contracts are closed, when they are recorded as realized futures gains (losses).
During the year ended September 30, 2019, the fund’s average investments in long and short futures contracts represented 21% and 4% of net assets, respectively, based on the average of the notional amounts at each quarter-end during the period.
33
Institutional Short-Term Bond Fund
3. Swap Contracts: The fund invests in credit default swaps to adjust the overall credit risk of the fund or to actively overweight or underweight credit risk to a specific issuer or group of issuers. The fund may sell credit protection through credit default swaps to simulate investments in long positions that are either unavailable or considered to be less attractively priced in the bond market. The fund may purchase credit protection through credit default swaps to reduce credit exposure to a given issuer or issuers. Under the terms of the swaps, an up-front payment may be exchanged between the seller and buyer. In addition, the seller of the credit protection receives a periodic payment of premium from the buyer that is a fixed percentage applied to a notional amount. If, for example, the reference entity is subject to a credit event (such as bankruptcy, failure to pay, or obligation acceleration) during the term of the swap, the seller agrees to either physically settle or cash settle the swap contract. If the swap is physically settled, the seller agrees to pay the buyer an amount equal to the notional amount and take delivery of a debt instrument of the reference issuer with a par amount equal to such notional amount. If the swap is cash settled, the seller agrees to pay the buyer the difference between the notional amount and the final price for the relevant debt instrument, as determined either in a market auction or pursuant to a pre-agreed-upon valuation procedure.
The fund enters into interest rate swap transactions to adjust the fund’s sensitivity to changes in interest rates and maintain the ability to generate income at prevailing market rates. Under the terms of the swaps, one party pays the other an amount that is a fixed percentage rate applied to a notional amount. In return, the counterparty agrees to pay a floating rate, which is reset periodically based on short-term interest rates, applied to the same notional amount.
The notional amounts of swap contracts are not recorded in the Statement of Net Assets. Swaps are valued daily based on market quotations received from independent pricing services or recognized dealers and the change in value is recorded in the Statement of Net Assets as an asset (liability) and in the Statement of Operations as unrealized appreciation (depreciation) until the seller of credit protection is required to take delivery (or, in a cash settled swap, pay the settlement amount determined) upon occurrence of a credit event, periodic payments are made, or the swap terminates, at which time realized gain (loss) is recorded. The net premium to be received or paid by the fund under swap contracts is accrued daily and recorded as realized gain (loss) over the life of the contract.
The primary risk associated with selling credit protection is that, upon the occurrence of a defined credit event, the market value of the debt instrument received by the fund (or, in a cash settled swap, the debt instruments used to determine the settlement payment by the fund) will be significantly less than the amount paid by the fund and, in a physically settled swap, the fund may receive an illiquid debt instrument. A risk associated with all types of swaps is the possibility that a counterparty may default on its obligation to pay net amounts due to the fund. The fund’s maximum amount subject to counterparty risk is the unrealized appreciation on the swap contract. The fund mitigates its counterparty risk by entering into swaps only with a diverse group of prequalified counterparties, monitoring their financial strength, entering into master netting arrangements with its counterparties, and requiring its counterparties to transfer collateral as security for their performance. In the absence of a default, the collateral pledged or received by the fund cannot be repledged, resold, or rehypothecated. In the event of a counterparty’s default (including bankruptcy), the fund may terminate any swap contracts with that counterparty, determine the net amount owed by either party in accordance with its master netting arrangements, and sell or retain any collateral held up to the net amount owed to the fund under the master netting arrangements. The swap contracts contain provisions whereby a counterparty may terminate open contracts if the fund’s net assets decline below a certain level, triggering a payment by the fund if the fund is in a net liability position
34
Institutional Short-Term Bond Fund
at the time of the termination. The payment amount would be reduced by any collateral the fund has pledged. Any securities pledged as collateral for open contracts are noted in the Statement of Net Assets. The value of collateral received or pledged is compared daily to the value of the swap contracts exposure with each counterparty, and any difference, if in excess of a specified minimum transfer amount, is adjusted and settled within two business days.
The fund enters into centrally cleared interest rate and credit default swaps to achieve the same objectives specified with respect to the equivalent over-the-counter swaps but with less counterparty risk because a regulated clearinghouse is the counterparty instead of the clearing broker or executing broker. The clearinghouse imposes initial margin requirements to secure the fund’s performance, and requires daily settlement of variation margin representing changes in the market value of each contract. To further mitigate counterparty risk, the fund trades with a diverse group of prequalified executing brokers; monitors the financial strength of its clearing brokers, executing brokers, and clearinghouse; and has entered into agreements with its clearing brokers and executing brokers.
During the year ended September 30, 2019, the fund’s average amounts of investments in credit protection sold and credit protection purchased each represented less than 1% of net assets, based on the average of notional amounts at each quarter-end during the period. The average amount of investments in interest rate swaps represented 8% of net assets, based on the average of notional amounts at each quarter-end during the period.
4. Federal Income Taxes: The fund intends to continue to qualify as a regulated investment company and distribute all of its taxable income. Management has analyzed the fund’s tax positions taken for all open federal income tax years (September 30, 2016–2019), and has concluded that no provision for federal income tax is required in the fund’s financial statements.
5. Distributions: Distributions to shareholders are recorded on the ex-dividend date. Distributions are determined on a tax basis and may differ from net investment income and realized capital gains for financial reporting purposes.
6. Credit Facility: The fund and certain other funds managed by The Vanguard Group (“Vanguard”) participate in a $4.3 billion committed credit facility provided by a syndicate of lenders pursuant to a credit agreement that may be renewed annually; each fund is individually liable for its borrowings, if any, under the credit facility. Borrowings may be utilized for temporary and emergency purposes, and are subject to the fund’s regulatory and contractual borrowing restrictions. The participating funds are charged administrative fees and an annual commitment fee of 0.10% of the undrawn amount of the facility; these fees are allocated to the funds based on a method approved by the fund’s board of trustees and included in Management and Administrative expenses on the fund’s Statement of Operations. Any borrowings under this facility bear interest at a rate based upon the higher of the one-month London Interbank Offered Rate, federal funds effective rate, or overnight bank funding rate plus an agreed-upon spread.
The fund had no borrowings outstanding at September 30, 2019, or at any time during the period then ended.
7. Other: Interest income includes income distributions received from Vanguard Market Liquidity Fund and is accrued daily. Premiums and discounts on debt securities purchased are amortized and accreted, respectively, to interest income over the lives of the respective securities. Security transactions are accounted for on the date securities are bought or sold. Costs used to determine realized gains (losses) on the sale of investment securities are those of the specific securities sold.
35
Institutional Short-Term Bond Fund
B. In accordance with the terms of a Funds’ Service Agreement (the “FSA”) between Vanguard and the fund, Vanguard furnishes to the fund investment advisory, corporate management, administrative, marketing, and distribution services at Vanguard’s cost of operations (as defined by the FSA). These costs of operations are allocated to the fund based on methods and guidelines approved by the board of trustees. Vanguard does not require reimbursement in the current period for certain costs of operations (such as deferred compensation/benefits and risk/insurance costs); the fund’s liability for these costs of operations is included in Payables to Vanguard on the Statement of Net Assets. All other costs of operations payable to Vanguard are generally settled twice a month.
Upon the request of Vanguard, the fund may invest up to 0.40% of its net assets as capital in Vanguard. At September 30, 2019, the fund had contributed to Vanguard capital in the amount of $371,000, representing less than 0.01% of the fund’s net assets and 0.15% of Vanguard’s capital received pursuant to the FSA. The fund’s trustees and officers are also directors and employees, respectively, of Vanguard.
C. Various inputs may be used to determine the value of the fund’s investments. These inputs are summarized in three broad levels for financial statement purposes. The inputs or methodologies used to value securities are not necessarily an indication of the risk associated with investing in those securities.
Level 1—Quoted prices in active markets for identical securities.
Level 2—Other significant observable inputs (including quoted prices for similar securities, interest rates, prepayment speeds, credit risk, etc.).
Level 3—Significant unobservable inputs (including the fund’s own assumptions used to determine the fair value of investments). Any investments valued with significant unobservable inputs are noted on the Statement of Net Assets.
The following table summarizes the market value of the fund’s investments and derivatives as of September 30, 2019, based on the inputs used to value them:
| Level 1 | Level 2 | Level 3 |
Investments | ($000) | ($000) | ($000) |
U.S. Government and Agency Obligations | — | 1,493,186 | — |
Asset-Backed/Commercial Mortgage-Backed Securities | — | 3,493,398 | — |
Corporate Bonds | — | 1,815,531 | — |
Sovereign Bonds | — | 705,533 | — |
Temporary Cash Investments | 102,324 | 111,633 | — |
Futures Contracts—Assets1 | 794 | — | — |
Futures Contracts—Liabilities1 | (807) | — | — |
Swap Contracts—Assets | 241 | — | — |
Swap Contracts—Liabilities | (22)1 | (216) | — |
Total | 102,313 | 7,619,065 | — |
1 Represents variation margin on the last day of the reporting period.
36
Institutional Short-Term Bond Fund
D. At September 30, 2019, the fair values of derivatives were reflected in the Statement of Net Assets as follows:
| | Interest Rate | | Credit | | | |
| | Contracts | | Contracts | | Total | |
Statement of Net Assets Caption | | ($000 | ) | ($000 | ) | ($000 | ) |
Variation Margin Receivable—Futures Contracts | | 794 | | — | | 794 | |
Variation Margin Receivable—CC Swap Contracts | | 24 | | — | | 24 | |
Total Assets | | 818 | | — | | 818 | |
| | | | | | | |
Variation Margin Payable—Futures Contracts | | (807 | ) | — | | (807 | ) |
Variation Margin Payable—CC Swap Contracts | | (22 | ) | — | | (22 | ) |
Unrealized Depreciation—OTC Swap Contracts | | — | | (216 | ) | (216 | ) |
Total Liabilities | | (829 | ) | (216 | ) | (1,045 | ) |
Realized net gain (loss) and the change in unrealized appreciation (depreciation) on derivatives for the year ended September 30, 2019, were:
| | Interest Rate | | Credit | | | |
| | Contracts | | Contracts | | Total | |
Realized Net Gain (Loss) on Derivatives | | ($000 | ) | ($000 | ) | ($000 | ) |
Futures Contracts | | 3,772 | | — | | 3,772 | |
Swap Contracts | | (28,234 | ) | (19 | ) | (28,253 | ) |
Realized Net Gain (Loss) on Derivatives | | (24,462 | ) | (19 | ) | (24,481 | ) |
| | | | | | | |
Change in Unrealized Appreciation (Depreciation) on Derivatives | | | | | | | |
Futures Contracts | | (291 | ) | — | | (291 | ) |
Swap Contracts | | (3,941 | ) | 24 | | (3,917 | ) |
Change in Unrealized Appreciation (Depreciation) on Derivatives | | (4,232 | ) | 24 | | (4,208 | ) |
E. Permanent differences between book-basis and tax-basis components of net assets are reclassified among capital accounts in the financial statements to reflect their tax character. These reclassifications have no effect on net assets or net asset value per share. As of period end, permanent differences primarily attributable to the accounting for swap agreements were reclassified between the individual components of total distributable earnings (loss).
| | Amount | |
| | ($000 | ) |
Paid-in Capital | | — | |
Total Distributable Earnings (Loss) | | — | |
Temporary differences between book-basis and tax-basis components of total distributable earnings (loss) arise when certain items of income, gain, or loss are recognized in different periods for financial statement and tax purposes; these differences will reverse at some time in the future.
37
Institutional Short-Term Bond Fund
The differences are primarily related to the tax deferral of losses on wash sales and straddles; and the realization of unrealized gains or losses on certain futures contracts. As of period end, the tax-basis components of total distributable earnings (loss) are detailed in the table as follows:
| | Amount | |
| | ($000 | ) |
Undistributed Ordinary Income | | 933 | |
Undistributed Long-Term Gains | | — | |
Capital Loss Carryforwards (Non-expiring) | | (45,992 | ) |
Net Unrealized Gains (Losses) | | 101,359 | |
As of September 30, 2019, gross unrealized appreciation and depreciation for investments and derivatives based on cost for U.S. federal income tax purposes were as follows:
| | Amount | |
| | ($000 | ) |
Tax Cost | | 7,617,221 | |
Gross Unrealized Appreciation | | 107,098 | |
Gross Unrealized Depreciation | | (5,739 | ) |
Net Unrealized Appreciation (Depreciation) | | 101,359 | |
F. During the year ended September 30, 2019, the fund purchased $2,624,577,000 of investment securities and sold $2,882,606,000 of investment securities, other than U.S. government securities and temporary cash investments. Purchases and sales of U.S. government securities were $3,745,599,000 and $3,334,692,000, respectively. Total purchases and sales include $783,000 and $0, respectively, in connection with in-kind purchases and redemptions of the fund’s capital shares.
G. Capital shares issued and redeemed were:
| | Year Ended September 30, | |
| | 2019 | | 2018 | |
| | Shares | | Shares | |
| | (000 | ) | (000 | ) |
Issued | | 26,336 | | 100,885 | |
Issued in Lieu of Cash Distributions | | 15,817 | | 10,716 | |
Redeemed | | (54,155 | ) | (62,628 | ) |
Net Increase (Decrease) in Shares Outstanding | | (12,002 | ) | 48,973 | |
H. Management has determined that no events or transactions occurred subsequent to September 30, 2019, that would require recognition or disclosure in these financial statements.
38
Institutional Intermediate-Term Bond Fund
Performance Summary
All of the returns in this report represent past performance, which is not a guarantee of future results that may be achieved by the fund. (Current performance may be lower or higher than the performance data cited. For performance data current to the most recent month-end, visit our website at vanguard.com/performance.) Note, too, that both investment returns and principal value can fluctuate widely, so an investor’s shares, when sold, could be worth more or less than their original cost. The returns shown do not reflect taxes that a shareholder would pay on fund distributions or on the sale of fund shares.
Cumulative Performance: September 30, 2009, Through September 30, 2019
Initial Investment of $10,000,000
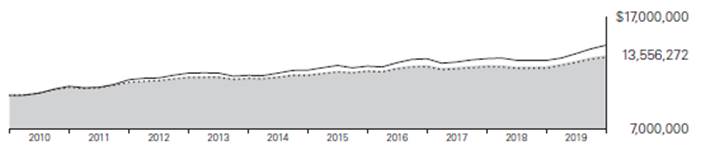
| | Average Annual Total Returns | | |
| | Periods Ended September 30, 2019 | | |
| | | | | | | | Final Value |
| | One | | Five | | Ten | | of a $10,000,000 |
| | Year | | Years | | Years | | Investment |

| Institutional Intermediate-Term Bond Fund Institutional Plus Shares | | 7.66% | | 2.68% | | 3.09% | | $13,556,272 |

| Bloomberg Barclays U.S. Intermediate Aggregate ex Baa Index | | 7.84 | | 2.60 | | 2.96 | | 13,388,592 |

| Bloomberg Barclays U.S. Aggregate Bond Index | | 10.30 | | 3.38 | | 3.75 | | 14,448,197 |
The fund is the successor to VFTC Intermediate-Term Bond Trust (the predecessor trust), a collective trust managed by Vanguard Fiduciary Trust Company, an affiliate of The Vanguard Group, Inc. The predecessor trust transferred its assets to the fund in connection with the fund’s commencement of operations on or about June 19, 2015. The performance of the fund’s Institutional Plus Shares includes the performance of the predecessor trust prior to the commencement of the fund’s operations. The performance of the predecessor trust has not been adjusted to reflect the expenses of the fund’s Institutional Plus Shares. If the performance of the predecessor trust was adjusted to reflect the expenses of the fund’s Institutional Plus Shares, the predecessor trust’s performance would have been lower. The fund is managed with the same investment objective, strategies, policies, and risks as the predecessor trust. The predecessor trust was not an investment company registered under the Investment Company Act of 1940. If the predecessor trust had been an investment company, its performance may have been different.
See Financial Highlights for dividend and capital gains information.
39
Institutional Intermediate-Term Bond Fund
Sector Diversification
As of September 30, 2019
Asset-Backed | 13.5% |
Commercial Mortgage-Backed | 2.4 |
Finance | 12.8 |
Foreign | 6.7 |
Government Mortgage-Backed | 30.4 |
Industrial | 7.4 |
Treasury/Agency | 25.7 |
Utilities | 1.1 |
The table reflects the fund’s market exposure. Any holdings in short-term reserves are excluded. The agency and mortgage-backed securities sectors may include issues from government-sponsored enterprises; such issues are generally not backed by the full faith and credit of the U.S. government.
40
Institutional Intermediate-Term Bond Fund
Financial Statements
Statement of Net Assets
As of September 30, 2019
The fund files its complete schedule of portfolio holdings with the Securities and Exchange Commission (SEC) for the first and third quarters of each fiscal year as an exhibit to its reports on Form N-PORT. The fund’s Form N-PORT reports are available on the SEC’s website at www.sec.gov.
| | | | | | Face | | Market | |
| | | | Maturity | | Amount | | Value· | |
| | | Coupon | Date | | ($000 | ) | ($000 | ) |
U.S. Government and Agency Obligations (54.6%) | | | | | | | | |
U.S. Government Securities (23.8%) | | | | | | | | |
| United States Treasury Note/Bond | | 1.375% | 4/30/21 | | 43,990 | | 43,749 | |
| United States Treasury Note/Bond | | 1.375% | 5/31/21 | | 266,000 | | 264,505 | |
| United States Treasury Note/Bond | | 2.125% | 5/31/21 | | 77,600 | | 78,121 | |
| United States Treasury Note/Bond | | 1.625% | 6/30/21 | | 60,000 | | 59,925 | |
| United States Treasury Note/Bond | | 1.500% | 8/31/21 | | 100,000 | | 99,703 | |
| United States Treasury Note/Bond | | 2.000% | 10/31/21 | | 37,000 | | 37,255 | |
| United States Treasury Note/Bond | | 2.125% | 12/31/21 | | 103,000 | | 104,127 | |
| United States Treasury Note/Bond | | 1.500% | 1/31/22 | | 10,000 | | 9,972 | |
| United States Treasury Note/Bond | | 2.500% | 2/15/22 | | 47,025 | | 47,973 | |
1 | United States Treasury Note/Bond | | 1.875% | 2/28/22 | | 285,000 | | 286,693 | |
| United States Treasury Note/Bond | | 1.750% | 3/31/22 | | 27,115 | | 27,217 | |
| United States Treasury Note/Bond | | 1.750% | 4/30/22 | | 18,000 | | 18,068 | |
| United States Treasury Note/Bond | | 2.125% | 6/30/22 | | 12,175 | | 12,354 | |
| United States Treasury Note/Bond | | 1.500% | 8/15/22 | | 200,000 | | 199,562 | |
| United States Treasury Note/Bond | | 1.500% | 9/15/22 | | 382,856 | | 382,197 | |
| United States Treasury Note/Bond | | 1.750% | 9/30/22 | | 26,500 | | 26,633 | |
2 | United States Treasury Note/Bond | | 1.625% | 11/15/22 | | 15,050 | | 15,073 | |
| United States Treasury Note/Bond | | 2.000% | 11/30/22 | | 18,700 | | 18,940 | |
| United States Treasury Note/Bond | | 2.000% | 2/15/23 | | 20,000 | | 20,275 | |
3 | United States Treasury Note/Bond | | 2.750% | 4/30/23 | | 17,975 | | 18,705 | |
| United States Treasury Note/Bond | | 1.750% | 5/15/23 | | 41,300 | | 41,545 | |
| United States Treasury Note/Bond | | 1.375% | 6/30/23 | | 14,500 | | 14,396 | |
3 | United States Treasury Note/Bond | | 2.875% | 10/31/23 | | 443,500 | | 466,300 | |
| United States Treasury Note/Bond | | 2.750% | 11/15/23 | | 20,000 | | 20,934 | |
| United States Treasury Note/Bond | | 2.125% | 11/30/23 | | 20,200 | | 20,648 | |
| United States Treasury Note/Bond | | 2.625% | 12/31/23 | | 424,000 | | 442,351 | |
| United States Treasury Note/Bond | | 2.750% | 2/15/24 | | 28,820 | | 30,252 | |
| United States Treasury Note/Bond | | 2.375% | 2/29/24 | | 50,000 | | 51,735 | |
| United States Treasury Note/Bond | | 2.000% | 4/30/24 | | 100,000 | | 101,922 | |
| United States Treasury Note/Bond | | 2.000% | 5/31/24 | | 85,000 | | 86,726 | |
| United States Treasury Note/Bond | | 1.750% | 6/30/24 | | 100,000 | | 100,859 | |
| United States Treasury Note/Bond | | 1.750% | 7/31/24 | | 50,000 | | 50,453 | |
| United States Treasury Note/Bond | | 1.250% | 8/31/24 | | 150,000 | | 147,937 | |
| United States Treasury Note/Bond | | 2.250% | 11/15/24 | | 80,000 | | 82,638 | |
| United States Treasury Note/Bond | | 3.000% | 10/31/25 | | 20,000 | | 21,606 | |
| United States Treasury Note/Bond | | 2.250% | 11/15/25 | | 100,000 | | 103,719 | |
| United States Treasury Note/Bond | | 2.500% | 2/28/26 | | 309,000 | | 325,609 | |
| United States Treasury Note/Bond | | 2.375% | 4/30/26 | | 12,800 | | 13,404 | |
| United States Treasury Note/Bond | | 1.875% | 6/30/26 | | 300,000 | | 304,968 | |
41
Institutional Intermediate-Term Bond Fund
| | | | | | Face | | Market | |
| | | | Maturity | | Amount | | Value· | |
| | | Coupon | Date | | ($000 | ) | ($000 | ) |
| United States Treasury Note/Bond | | 1.875% | 7/31/26 | | 100,000 | | 101,656 | |
| United States Treasury Note/Bond | | 1.500% | 8/15/26 | | 200,000 | | 198,406 | |
| United States Treasury Note/Bond | | 1.375% | 8/31/26 | | 46,476 | | 45,728 | |
| United States Treasury Note/Bond | | 2.250% | 2/15/27 | | 77,000 | | 80,345 | |
| United States Treasury Note/Bond | | 2.375% | 5/15/27 | | 75,000 | | 79,031 | |
| United States Treasury Note/Bond | | 2.250% | 8/15/27 | | 77,000 | | 80,501 | |
| United States Treasury Note/Bond | | 2.250% | 11/15/27 | | 77,000 | | 80,561 | |
| United States Treasury Note/Bond | | 2.625% | 2/15/29 | | 215,000 | | 232,772 | |
| United States Treasury Note/Bond | | 2.375% | 5/15/29 | | 97,750 | | 103,829 | |
| United States Treasury Note/Bond | | 1.625% | 8/15/29 | | 20,200 | | 20,112 | |
| | | | | | | | 5,221,990 | |
Agency Bonds and Notes (0.5%) | | | | | | | | |
4 | AID-Israel | | 5.500% | 12/4/23 | | 250 | | 288 | |
5 | Fannie Mae Principal Strip | | 0.000% | 1/15/30 | | 4,900 | | 3,943 | |
| Federal Home Loan Banks | | 1.700% | 5/15/20 | | 3,300 | | 3,296 | |
| Federal Home Loan Banks | | 3.125% | 6/13/25 | | 6,300 | | 6,792 | |
| Federal Home Loan Banks | | 3.125% | 9/12/25 | | 7,050 | | 7,602 | |
| Federal Home Loan Banks | | 2.500% | 12/10/27 | | 8,450 | | 8,844 | |
| Federal Home Loan Banks | | 3.000% | 3/10/28 | | 3,250 | | 3,529 | |
| Federal Home Loan Banks | | 3.250% | 6/9/28 | | 2,100 | | 2,327 | |
| Federal Home Loan Banks | | 3.250% | 11/16/28 | | 43,275 | | 48,289 | |
5,6 | Federal Home Loan Mortgage Corp. | | 2.700% | 4/8/22 | | 3,150 | | 3,151 | |
5 | Federal National Mortgage Assn. | | 1.875% | 9/24/26 | | 11,675 | | 11,807 | |
| Tennessee Valley Authority | | 2.250% | 3/15/20 | | 6,500 | | 6,509 | |
| Tennessee Valley Authority | | 2.875% | 2/1/27 | | 1,280 | | 1,359 | |
| | | | | | | | 107,736 | |
Conventional Mortgage-Backed Securities (27.1%) | | | | | | | | |
5,6 | Fannie Mae Pool | | 2.000% | 5/1/28–8/1/28 | | 3,469 | | 3,455 | |
5,6 | Fannie Mae Pool | | 2.500% | 9/1/27–3/1/47 | | 118,767 | | 119,680 | |
5,6 | Fannie Mae Pool | | 3.000% | 8/1/21–10/1/49 | | 506,783 | | 520,194 | |
5,6 | Fannie Mae Pool | | 3.500% | 8/1/20–10/1/49 | | 706,359 | | 732,899 | |
5,6 | Fannie Mae Pool | | 4.000% | 12/1/19–11/1/49 | | 16,635 | | 22,097 | |
5,6 | Fannie Mae Pool | | 4.500% | 12/1/19–10/1/49 | | 486,684 | | 518,679 | |
5,6 | Fannie Mae Pool | | 5.000% | 10/1/19–1/1/49 | | 85,459 | | 93,080 | |
5,6 | Fannie Mae Pool | | 5.500% | 11/1/19–9/1/41 | | 27,267 | | 30,634 | |
5,6 | Fannie Mae Pool | | 6.000% | 3/1/21–7/1/41 | | 14,834 | | 17,080 | |
5,6 | Fannie Mae Pool | | 6.500% | 8/1/21–6/1/40 | | 7,009 | | 7,914 | |
5,6 | Fannie Mae Pool | | 7.000% | 9/1/28–12/1/38 | | 2,990 | | 3,443 | |
5,6 | Fannie Mae Pool | | 7.500% | 8/1/30–6/1/32 | | 214 | | 249 | |
5,6 | Fannie Mae Pool | | 8.000% | 7/1/30–1/1/31 | | 11 | | 13 | |
5,6 | Fannie Mae Pool | | 8.500% | 12/1/30 | | 8 | | 9 | |
5,6 | Freddie Mac Gold Pool | | 2.000% | 9/1/28–1/1/32 | | 5,472 | | 5,431 | |
5,6 | Freddie Mac Gold Pool | | 2.500% | 4/1/27–3/1/47 | | 24,271 | | 24,530 | |
5,6 | Freddie Mac Gold Pool | | 3.000% | 2/1/27–8/1/47 | | 137,972 | | 141,648 | |
5,6 | Freddie Mac Gold Pool | | 3.500% | 8/1/20–3/1/49 | | 367,734 | | 381,865 | |
5,6 | Freddie Mac Gold Pool | | 4.000% | 12/1/19–5/1/49 | | 217,424 | | 227,605 | |
5,6 | Freddie Mac Gold Pool | | 4.500% | 3/1/21–2/1/49 | | 71,596 | | 76,577 | |
5,6 | Freddie Mac Gold Pool | | 5.000% | 3/1/20–2/1/49 | | 15,595 | | 16,972 | |
5,6 | Freddie Mac Gold Pool | | 5.500% | 12/1/32–8/1/40 | | 11,891 | | 13,218 | |
5,6 | Freddie Mac Gold Pool | | 6.000% | 7/1/20–5/1/40 | | 17,499 | | 19,941 | |
5,6 | Freddie Mac Gold Pool | | 6.500% | 2/1/29–9/1/38 | | 3,011 | | 3,332 | |
5,6 | Freddie Mac Gold Pool | | 7.000% | 5/1/28–6/1/38 | | 1,599 | | 1,806 | |
5,6 | Freddie Mac Gold Pool | | 7.500% | 3/1/30–5/1/32 | | 196 | | 224 | |
5,6 | Freddie Mac Gold Pool | | 8.000% | 4/1/30–1/1/31 | | 15 | | 16 | |
42
Institutional Intermediate-Term Bond Fund
| | | | | | Face | | Market | |
| | | | Maturity | | Amount | | Value· | |
| | | Coupon | Date | | ($000 | ) | ($000 | ) |
6 | Ginnie Mae I Pool | | 2.500% | 1/15/43–6/15/43 | | 878 | | 887 | |
6 | Ginnie Mae I Pool | | 3.000% | 9/15/42–8/15/45 | | 33,462 | | 34,405 | |
6 | Ginnie Mae I Pool | | 3.500% | 1/15/42–6/15/47 | | 49,287 | | 51,904 | |
6 | Ginnie Mae I Pool | | 4.000% | 4/15/39–12/15/46 | | 5,988 | | 6,313 | |
6 | Ginnie Mae I Pool | | 4.500% | 7/15/33–12/15/46 | | 29,054 | | 31,319 | |
6 | Ginnie Mae I Pool | | 5.000% | 9/15/33–9/15/41 | | 13,565 | | 15,021 | |
6 | Ginnie Mae I Pool | | 5.500% | 3/15/31–2/15/41 | | 7,845 | | 8,549 | |
6 | Ginnie Mae I Pool | | 6.000% | 12/15/28–3/15/41 | | 3,607 | | 3,987 | |
6 | Ginnie Mae I Pool | | 6.500% | 12/15/27–6/15/38 | | 2,957 | | 3,301 | |
6 | Ginnie Mae I Pool | | 7.000% | 8/15/24–11/15/31 | | 166 | | 183 | |
6 | Ginnie Mae I Pool | | 7.500% | 4/15/31–3/15/32 | | 38 | | 43 | |
6 | Ginnie Mae I Pool | | 8.000% | 4/15/30–10/15/30 | | 44 | | 49 | |
6 | Ginnie Mae I Pool | | 8.500% | 7/15/30 | | 18 | | 20 | |
6 | Ginnie Mae I Pool | | 9.000% | 5/15/21–7/15/21 | | 1 | | 1 | |
6 | Ginnie Mae II Pool | | 2.500% | 3/20/43–12/20/46 | | 4,232 | | 4,282 | |
6,7 | Ginnie Mae II Pool | | 3.000% | 3/20/27–11/1/49 | | 401,245 | | 411,597 | |
6,7 | Ginnie Mae II Pool | | 3.500% | 6/20/42–10/1/49 | | 452,472 | | 472,019 | |
6,7 | Ginnie Mae II Pool | | 4.000% | 2/20/34–10/1/49 | | 391,896 | | 409,817 | |
6 | Ginnie Mae II Pool | | 4.500% | 3/20/33–4/20/49 | | 356,277 | | 374,225 | |
6 | Ginnie Mae II Pool | | 5.000% | 5/20/39–2/20/42 | | 21,595 | | 23,547 | |
6 | Ginnie Mae II Pool | | 5.500% | 4/20/37–3/20/41 | | 3,153 | | 3,512 | |
6 | Ginnie Mae II Pool | | 6.000% | 5/20/36–10/20/41 | | 4,421 | | 5,086 | |
6 | Ginnie Mae II Pool | | 6.500% | 3/20/38–7/20/39 | | 56 | | 65 | |
6 | UMBS Pool | | 2.500% | 9/1/34 | | 31,440 | | 31,720 | |
6 | UMBS Pool | | 3.000% | 9/1/34 | | 78,518 | | 80,216 | |
6 | UMBS Pool | | 3.500% | 3/1/48–8/1/49 | | 145,296 | | 149,457 | |
6 | UMBS Pool | | 4.000% | 2/1/49–8/1/49 | | 665,381 | | 693,030 | |
6 | UMBS Pool | | 4.500% | 9/1/49 | | 91,258 | | 94,327 | |
6,7 | UMBS TBA | | 2.500% | 7/1/34–8/1/34 | | — | | — | |
6,7 | UMBS TBA | | 3.000% | 9/1/49 | | 32,443 | | 32,970 | |
6,7 | UMBS TBA | | 4.000% | 10/1/34–7/1/49 | | 20,000 | | 20,806 | |
| | | | | | | | 5,945,249 | |
Nonconventional Mortgage-Backed Securities (3.2%) | | | | | | | | |
5,6,8 | Fannie Mae Pool, 12M USD LIBOR + 1.785% | | 4.035% | 8/1/33 | | 24 | | 25 | |
5,6,8 | Fannie Mae Pool, 12M USD LIBOR + 1.785% | | 4.410% | 8/1/33 | | 21 | | 21 | |
5,6,8 | Fannie Mae Pool, 12M USD LIBOR + 1.800% | | 4.491% | 7/1/33 | | 87 | | 90 | |
5,6,8 | Fannie Mae Pool, 12M USD LIBOR + 1.960% | | 4.757% | 5/1/33 | | 10 | | 10 | |
5,6,8 | Fannie Mae Pool, 1YR CMT + 2.000% | | 4.546% | 12/1/32 | | 5 | | 5 | |
5,6,8 | Fannie Mae Pool, 1YR CMT + 2.210% | | 4.731% | 5/1/33 | | 45 | | 47 | |
5,6 | Fannie Mae REMICS 2007-4, 1M USD LIBOR + 0.445% | | 2.463% | 2/25/37 | | 5 | | 5 | |
5,6 | Fannie Mae REMICS 2013-39, 1M USD LIBOR + 0.350% | | 2.368% | 5/25/43 | | 41 | | 41 | |
5,6 | Fannie Mae REMICS 2017-109 | | 3.500% | 11/25/45 | | 11,739 | | 12,280 | |
5,6 | Fannie Mae REMICS 2017-60 | | 2.750% | 8/25/47 | | 29,585 | | 29,855 | |
5,6 | Fannie Mae REMICS 2018-13 | | 3.000% | 3/25/48 | | 48,042 | | 48,914 | |
5,6 | Fannie Mae REMICS 2018-15 | | 3.500% | 10/25/44 | | 13,155 | | 13,713 | |
5,6 | Fannie Mae REMICS 2018-58 | | 3.000% | 8/25/48 | | 40,564 | | 41,203 | |
5,6 | Fannie Mae REMICS 2018-64 | | 3.000% | 9/25/48 | | 20,401 | | 20,723 | |
5,6 | Fannie Mae REMICS 2018-65 | | 3.000% | 9/25/48 | | 41,698 | | 42,539 | |
5,6 | Fannie Mae REMICS 2018-66 | | 3.000% | 5/25/47 | | 39,351 | | 39,894 | |
5,6,8 | Freddie Mac Non Gold Pool, 12M USD LIBOR + 1.750% | | 4.367% | 8/1/37 | | 62 | | 65 | |
5,6,8 | Freddie Mac Non Gold Pool, 12M USD LIBOR + 1.961% | | 4.815% | 10/1/32 | | 13 | | 14 | |
43
Institutional Intermediate-Term Bond Fund
| | | | | | Face | | Market | |
| | | | Maturity | | Amount | | Value· | |
| | | Coupon | Date | | ($000 | ) | ($000 | ) |
5,6,8 | Freddie Mac Non Gold Pool, 12M USD LIBOR + 1.961% | | 5.000% | 1/1/33 | | 4 | | 5 | |
5,6,8 | Freddie Mac Non Gold Pool, 12M USD LIBOR + 1.961% | | 5.086% | 2/1/33 | | 21 | | 21 | |
5,6 | Freddie Mac REMICS | | 3.000% | 12/15/47 | | 20,915 | | 21,132 | |
5,6 | Freddie Mac REMICS | | 6.500% | 12/15/44–11/15/47 | | 115,743 | | 138,114 | |
5,6 | Freddie Mac REMICS 2017-91 | | 3.000% | 11/25/47 | | 19,021 | | 19,231 | |
6 | Ginnie Mae REMICS | | 3.000% | 12/20/47–7/20/48 | | 106,733 | | 109,133 | |
6 | Ginnie Mae REMICS | | 3.500% | 7/20/48 | | 84,246 | | 87,558 | |
6 | Ginnie Mae REMICS | | 4.000% | 10/20/47 | | 7,509 | | 7,847 | |
6 | Ginnie Mae REMICS | | 6.500% | 6/20/47–9/20/47 | | 47,569 | | 56,256 | |
| | | | | | | | 688,741 | |
Total U.S. Government and Agency Obligations (Cost $11,827,844) | | | | 11,963,716 | |
Asset-Backed/Commercial Mortgage-Backed Securities (15.1%) | | | | | |
6 | Ally Auto Receivables Trust 2018-1 | | 2.530% | 2/15/23 | | 1,770 | | 1,783 | |
6 | Ally Auto Receivables Trust 2018-3 | | 3.000% | 1/17/23 | | 2,270 | | 2,290 | |
6 | Ally Auto Receivables Trust 2019-1 | | 3.020% | 4/15/24 | | 4,910 | | 5,054 | |
6 | Ally Auto Receivables Trust 2019-3 | | 1.930% | 5/15/24 | | 12,310 | | 12,320 | |
6 | Ally Master Owner Trust Series 2018-2 | | 3.290% | 5/15/23 | | 21,500 | | 21,931 | |
6 | Ally Master Owner Trust Series 2018-2 | | 3.300% | 7/17/23 | | 25,780 | | 26,339 | |
6 | American Express Credit Account Master Trust 2019-1 | | 2.870% | 10/15/24 | | 9,530 | | 9,763 | |
6,9 | Americold 2010 LLC Trust Series 2010-ARTA | | 4.954% | 1/14/29 | | 5,406 | | 5,601 | |
6 | AmeriCredit Automobile Receivables Trust 2016-4 | | 2.410% | 7/8/22 | | 24,090 | | 24,141 | |
6,9 | Aventura Mall Trust 2013-AVM | | 3.867% | 12/5/32 | | 600 | | 612 | |
6,9 | Aventura Mall Trust 2018-AVM | | 4.249% | 7/5/40 | | 460 | | 523 | |
6,9 | Avis Budget Rental Car Funding AESOP LLC 2017-1A | | 3.070% | 9/20/23 | | 2,745 | | 2,801 | |
6,9 | Avis Budget Rental Car Funding AESOP LLC 2017-2A | | 2.970% | 3/20/24 | | 3,670 | | 3,750 | |
6,9 | Avis Budget Rental Car Funding AESOP LLC 2018-1A | | 3.700% | 9/20/24 | | 3,070 | | 3,219 | |
6,9 | Avis Budget Rental Car Funding AESOP LLC 2018-2A | | 4.000% | 3/20/25 | | 7,500 | | 7,997 | |
6,9 | Avis Budget Rental Car Funding AESOP LLC 2019-1A | | 3.450% | 3/20/23 | | 4,430 | | 4,549 | |
6 | Banc of America Commercial Mortgage Trust 2015-UBS7 | | 3.429% | 9/15/48 | | 280 | | 293 | |
6 | Banc of America Commercial Mortgage Trust 2015-UBS7 | | 3.705% | 9/15/48 | | 2,305 | | 2,482 | |
6 | Banc of America Commercial Mortgage Trust 2017-BNK3 | | 3.574% | 2/15/50 | | 320 | | 345 | |
6 | BANK 2017 - BNK4 | | 3.625% | 5/15/50 | | 580 | | 629 | |
6 | BANK 2017 - BNK5 | | 3.390% | 6/15/60 | | 660 | | 707 | |
6 | BANK 2017 - BNK6 | | 3.254% | 7/15/60 | | 1,060 | | 1,126 | |
6 | BANK 2017 - BNK6 | | 3.518% | 7/15/60 | | 1,110 | | 1,200 | |
6 | BANK 2017 - BNK6 | | 3.741% | 7/15/60 | | 440 | | 479 | |
6 | BANK 2017 - BNK7 | | 3.435% | 9/15/60 | | 1,040 | | 1,118 | |
6 | BANK 2017 - BNK8 | | 3.488% | 11/15/50 | | 2,670 | | 2,879 | |
6 | BANK 2017 - BNK9 | | 3.538% | 11/15/54 | | 6,665 | | 7,216 | |
6 | BANK 2018 - BN10 | | 3.641% | 2/15/61 | | 1,030 | | 1,106 | |
6 | BANK 2018 - BN12 | | 4.255% | 5/15/61 | | 780 | | 886 | |
44
Institutional Intermediate-Term Bond Fund
| | | | | | Face | | Market | |
| | | | Maturity | | Amount | | Value· | |
| | | Coupon | Date | | ($000 | ) | ($000 | ) |
6 | BANK 2018 - BN13 | | 4.217% | 8/15/61 | | 220 | | 249 | |
6 | BANK 2018 - BN14 | | 4.185% | 9/15/60 | | 160 | | 177 | |
6 | BANK 2018 - BN14 | | 4.231% | 9/15/60 | | 1,055 | | 1,198 | |
6 | BANK 2019 - BN17 | | 3.623% | 4/15/52 | | 285 | | 308 | |
6 | BANK 2019 - BN17 | | 3.714% | 4/15/52 | | 1,214 | | 1,345 | |
6 | BANK 2019 - BN18 | | 3.584% | 5/15/62 | | 1,270 | | 1,395 | |
6 | BANK 2019 - BN19 | | 3.183% | 8/15/61 | | 1,010 | | 1,077 | |
6 | BANK 2019 - BN20 | | 3.011% | 9/15/61 | | 700 | | 738 | |
6,10 | BANK 2019 - BN21 | | 2.851% | 10/17/52 | | 970 | | 999 | |
6 | Benchmark 2018-B1 Mortgage Trust | | 3.602% | 1/15/51 | | 640 | | 683 | |
6 | Benchmark 2018-B1 Mortgage Trust | | 3.666% | 1/15/51 | | 1,630 | | 1,778 | |
6 | Benchmark 2018-B1 Mortgage Trust | | 3.878% | 1/15/51 | | 1,360 | | 1,482 | |
6 | Benchmark 2018-B2 Mortgage Trust | | 3.882% | 2/15/51 | | 4,325 | | 4,790 | |
6 | Benchmark 2018-B3 Mortgage Trust | | 4.025% | 4/10/51 | | 1,730 | | 1,936 | |
6 | Benchmark 2018-B5 Mortgage Trust | | 4.208% | 7/15/51 | | 790 | | 898 | |
6 | Benchmark 2018-B6 Mortgage Trust | | 4.170% | 10/10/51 | | 211 | | 233 | |
6 | Benchmark 2019-B10 Mortgage Trust | | 3.615% | 3/15/62 | | 305 | | 331 | |
6 | BMW Vehicle Lease Trust 2018-1A | | 3.260% | 7/20/21 | | 9,630 | | 9,742 | |
6 | BMW Vehicle Owner Trust 2018-A | | 1.920% | 1/25/24 | | 24,330 | | 24,345 | |
6 | BMW Vehicle Owner Trust 2018-A | | 2.510% | 6/25/24 | | 2,530 | | 2,558 | |
6,8 | Brazos Higher Education Authority Inc. Series 2005, 3M USD LIBOR + 0.200% | | 2.549% | 6/25/26 | | 1,406 | | 1,400 | |
6,8 | Brazos Higher Education Authority Inc. Series 2011, 3M USD LIBOR + 0.800% | | 2.932% | 2/25/30 | | 1,056 | | 1,054 | |
6,9 | Canadian Pacer Auto Receivables Trust A Series 2017 | | 2.286% | 1/19/22 | | 1,600 | | 1,594 | |
6,9 | Canadian Pacer Auto Receivables Trust A Series 2018 | | 3.220% | 9/19/22 | | 4,080 | | 4,115 | |
6,9 | Canadian Pacer Auto Receivables Trust A Series 2019 | | 2.960% | 6/19/24 | | 1,300 | | 1,336 | |
6,9 | Canadian Pacer Auto Receiveable Trust A Series 2018 | | 3.270% | 12/19/22 | | 5,910 | | 5,958 | |
6,9 | Canadian Pacer Auto Receiveable Trust A Series 2018 | | 3.440% | 8/21/23 | | 2,630 | | 2,691 | |
6 | Capital Auto Receivables Asset Trust 2016-2 | | 1.630% | 1/20/21 | | 21 | | 21 | |
6 | Capital Auto Receivables Asset Trust 2016-3 | | 1.690% | 3/20/21 | | 20 | | 20 | |
6 | Capital One Auto Receivables Trust 2019-1 | | 2.510% | 11/15/23 | | 12,470 | | 12,615 | |
6 | Capital One Auto Receivables Trust 2019-1 | | 2.560% | 10/15/24 | | 4,210 | | 4,289 | |
6 | Capital One Auto Receivables Trust 2019-2 | | 1.920% | 5/15/24 | | 28,620 | | 28,645 | |
6 | Capital One Multi-Asset Execution Trust 2015-A2 | | 2.080% | 3/15/23 | | 6,480 | | 6,481 | |
6 | Capital One Multi-Asset Execution Trust 2019-A1 | | 2.840% | 12/15/24 | | 29,470 | | 30,136 | |
6,9 | CARDS II Trust 2018-2A | | 3.047% | 4/17/23 | | 11,350 | | 11,384 | |
6 | CarMax Auto Owner Trust 2016-4 | | 1.600% | 6/15/22 | | 2,230 | | 2,221 | |
6 | CarMax Auto Owner Trust 2017-3 | | 2.220% | 11/15/22 | | 9,990 | | 10,031 | |
6 | CarMax Auto Owner Trust 2017-4 | | 2.330% | 5/15/23 | | 2,380 | | 2,396 | |
6 | CarMax Auto Owner Trust 2018-1 | | 2.480% | 11/15/22 | | 12,130 | | 12,177 | |
6 | CarMax Auto Owner Trust 2018-1 | | 2.640% | 6/15/23 | | 1,910 | | 1,939 | |
6 | CarMax Auto Owner Trust 2018-3 | | 3.130% | 6/15/23 | | 19,380 | | 19,661 | |
6 | CarMax Auto Owner Trust 2018-3 | | 3.270% | 3/15/24 | | 9,680 | | 9,991 | |
6 | CarMax Auto Owner Trust 2018-4 | | 3.360% | 9/15/23 | | 11,640 | | 11,915 | |
6 | CarMax Auto Owner Trust 2018-4 | | 3.480% | 2/15/24 | | 4,290 | | 4,484 | |
6 | CarMax Auto Owner Trust 2019-3 | | 2.180% | 8/15/24 | | 27,410 | | 27,516 | |
45
Institutional Intermediate-Term Bond Fund
| | | | | | Face | | Market | |
| | | | Maturity | | Amount | | Value· | |
| | | Coupon | Date | | ($000 | ) | ($000 | ) |
6 | CarMax Auto Owner Trust 2019-3 | | 2.300% | 4/15/25 | | 5,000 | | 5,045 | |
6 | CCUBS Commercial Mortgage Trust 2017-C1 | | 3.283% | 11/15/50 | | 5,000 | | 5,286 | |
6 | CD 2016-CD1 Commercial Mortgage Trust | | 2.724% | 8/10/49 | | 110 | | 113 | |
6 | CD 2017-CD3 Commercial Mortgage Trust | | 3.631% | 2/10/50 | | 1,550 | | 1,677 | |
6 | CD 2017-CD4 Commercial Mortgage Trust | | 3.514% | 5/10/50 | | 880 | | 947 | |
6 | CD 2017-CD5 Commercial Mortgage Trust | | 3.431% | 8/15/50 | | 1,175 | | 1,260 | |
6 | CD 2017-CD6 Commercial Mortgage Trust | | 3.456% | 11/13/50 | | 535 | | 574 | |
6 | CD 2019-CD8 Commercial Mortgage Trust | | 2.912% | 8/15/57 | | 700 | | 729 | |
6 | CenterPoint Energy Transition Bond Co. IV LLC 2012-1 | | 2.161% | 10/15/21 | | 2,242 | | 2,240 | |
6,9 | CFCRE Commercial Mortgage Trust 2011-C2 | | 5.939% | 12/15/47 | | 2,298 | | 2,435 | |
6 | CFCRE Commercial Mortgage Trust 2016-C4 | | 3.283% | 5/10/58 | | 3,376 | | 3,557 | |
6,9 | Chesapeake Funding II LLC 2018-1 | | 3.040% | 4/15/30 | | 13,506 | | 13,628 | |
6,9 | Chesapeake Funding II LLC 2019-1 | | 2.940% | 4/15/31 | | 25,382 | | 25,694 | |
6,9 | Chrysler Capital Auto Receivables Trust 2016-BA | | 1.640% | 7/15/21 | | 80 | | 80 | |
6 | Citibank Credit Card Issuance Trust 2014-A1 | | 2.880% | 1/23/23 | | 8,576 | | 8,690 | |
6 | Citibank Credit Card Issuance Trust 2018-A1 | | 2.490% | 1/20/23 | | 6,710 | | 6,758 | |
6,9 | Citigroup Commercial Mortgage Trust 2012-GC8 | | 3.683% | 9/10/45 | | 500 | | 516 | |
6 | Citigroup Commercial Mortgage Trust 2013-GC11 | | 3.093% | 4/10/46 | | 1,527 | | 1,575 | |
6 | Citigroup Commercial Mortgage Trust 2013-GC15 | | 3.942% | 9/10/46 | | 302 | | 313 | |
6 | Citigroup Commercial Mortgage Trust 2014-GC19 | | 3.753% | 3/10/47 | | 111 | | 117 | |
6 | Citigroup Commercial Mortgage Trust 2014-GC19 | | 4.023% | 3/10/47 | | 8,709 | | 9,341 | |
6 | Citigroup Commercial Mortgage Trust 2014-GC21 | | 3.575% | 5/10/47 | | 742 | | 783 | |
6 | Citigroup Commercial Mortgage Trust 2014-GC21 | | 3.855% | 5/10/47 | | 4,082 | | 4,361 | |
6 | Citigroup Commercial Mortgage Trust 2014-GC23 | | 3.622% | 7/10/47 | | 1,575 | | 1,678 | |
6 | Citigroup Commercial Mortgage Trust 2014-GC23 | | 3.863% | 7/10/47 | | 275 | | 292 | |
6 | Citigroup Commercial Mortgage Trust 2014-GC25 | | 3.372% | 10/10/47 | | 1,640 | | 1,724 | |
6 | Citigroup Commercial Mortgage Trust 2014-GC25 | | 3.635% | 10/10/47 | | 4,442 | | 4,738 | |
6 | Citigroup Commercial Mortgage Trust 2015-GC27 | | 3.137% | 2/10/48 | | 20 | | 21 | |
6 | Citigroup Commercial Mortgage Trust 2015-GC31 | | 3.762% | 6/10/48 | | 620 | | 669 | |
6 | Citigroup Commercial Mortgage Trust 2015-GC33 | | 3.778% | 9/10/58 | | 6,312 | | 6,829 | |
6 | Citigroup Commercial Mortgage Trust 2015-GC36 | | 3.349% | 2/10/49 | | 2,600 | | 2,746 | |
6 | Citigroup Commercial Mortgage Trust 2016-C1 | | 3.209% | 5/10/49 | | 1,453 | | 1,534 | |
6 | Citigroup Commercial Mortgage Trust 2016-C2 | | 2.575% | 8/10/49 | | 3,500 | | 3,530 | |
6 | Citigroup Commercial Mortgage Trust 2016-GC37 | | 3.314% | 4/10/49 | | 4,000 | | 4,228 | |
46
Institutional Intermediate-Term Bond Fund
| | | | | | Face | | Market | |
| | | | Maturity | | Amount | | Value· | |
| | | Coupon | Date | | ($000 | ) | ($000 | ) |
6 | Citigroup Commercial Mortgage Trust 2016-P4 | | 2.902% | 7/10/49 | | 120 | | 124 | |
6 | Citigroup Commercial Mortgage Trust 2017-C4 | | 3.471% | 10/12/50 | | 1,070 | | 1,150 | |
6 | Citigroup Commercial Mortgage Trust 2017-P8 | | 3.203% | 9/15/50 | | 4,200 | | 4,431 | |
6 | Citigroup Commercial Mortgage Trust 2017-P8 | | 3.465% | 9/15/50 | | 2,445 | | 2,626 | |
6 | Citigroup Commercial Mortgage Trust 2018-C5 | | 4.228% | 6/10/51 | | 65 | | 74 | |
6 | Citigroup Commercial Mortgage Trust 2018-C6 | | 4.343% | 11/10/51 | | 2,650 | | 2,979 | |
6 | CNH Equipment Trust 2016-B | | 1.970% | 11/15/21 | | 3,540 | | 3,536 | |
6 | CNH Equipment Trust 2017-C | | 2.080% | 2/15/23 | | 4,500 | | 4,499 | |
6 | COMM 2012-CCRE2 Mortgage Trust | | 3.147% | 8/15/45 | | 666 | | 683 | |
6 | COMM 2012-CCRE2 Mortgage Trust | | 3.791% | 8/15/45 | | 999 | | 1,030 | |
6 | COMM 2012-CCRE3 Mortgage Trust | | 2.822% | 10/15/45 | | 1,673 | | 1,697 | |
6,9 | COMM 2012-CCRE3 Mortgage Trust | | 3.416% | 10/15/45 | | 770 | | 787 | |
6 | COMM 2012-CCRE4 Mortgage Trust | | 2.853% | 10/15/45 | | 1,357 | | 1,379 | |
6 | COMM 2012-CCRE4 Mortgage Trust | | 3.251% | 10/15/45 | | 50 | | 51 | |
6 | COMM 2012-CCRE5 Mortgage Trust | | 2.771% | 12/10/45 | | 580 | | 591 | |
6,9 | COMM 2013-300P Mortgage Trust | | 4.353% | 8/10/30 | | 910 | | 985 | |
6 | COMM 2013-CCRE11 Mortgage Trust | | 3.983% | 8/10/50 | | 2,059 | | 2,191 | |
6 | COMM 2013-CCRE11 Mortgage Trust | | 4.258% | 8/10/50 | | 922 | | 990 | |
6 | COMM 2013-CCRE12 Mortgage Trust | | 3.623% | 10/10/46 | | 614 | | 634 | |
6 | COMM 2013-CCRE12 Mortgage Trust | | 3.765% | 10/10/46 | | 390 | | 410 | |
6 | COMM 2013-CCRE12 Mortgage Trust | | 4.046% | 10/10/46 | | 2,115 | | 2,254 | |
6 | COMM 2013-CCRE13 Mortgage Trust | | 4.194% | 11/10/46 | | 7,500 | | 8,082 | |
6 | COMM 2013-CCRE8 Mortgage Trust | | 3.612% | 6/10/46 | | 10 | | 10 | |
6 | COMM 2013-CCRE9 Mortgage Trust | | 4.373% | 7/10/45 | | 1,910 | | 2,044 | |
6,9 | COMM 2013-CCRE9 Mortgage Trust | | 4.397% | 7/10/45 | | 2,331 | | 2,460 | |
6,9 | COMM 2013-LC13 Mortgage Trust | | 3.774% | 8/10/46 | | 445 | | 459 | |
6 | COMM 2013-LC13 Mortgage Trust | | 4.205% | 8/10/46 | | 160 | | 171 | |
6 | COMM 2013-LC6 Mortgage Trust | | 2.941% | 1/10/46 | | 933 | | 953 | |
6,9 | COMM 2013-SFS Mortgage Trust | | 3.086% | 4/12/35 | | 600 | | 616 | |
6,9 | COMM 2014-277P Mortgage Trust | | 3.732% | 8/10/49 | | 100 | | 106 | |
6 | COMM 2014-CCRE14 Mortgage Trust | | 3.955% | 2/10/47 | | 4,000 | | 4,276 | |
6 | COMM 2014-CCRE14 Mortgage Trust | | 4.236% | 2/10/47 | | 993 | | 1,070 | |
6 | COMM 2014-CCRE15 Mortgage Trust | | 4.074% | 2/10/47 | | 10 | | 11 | |
6 | COMM 2014-CCRE17 Mortgage Trust | | 3.977% | 5/10/47 | | 1,315 | | 1,412 | |
6 | COMM 2014-CCRE17 Mortgage Trust | | 4.174% | 5/10/47 | | 330 | | 353 | |
6 | COMM 2014-CCRE18 Mortgage Trust | | 3.550% | 7/15/47 | | 6,360 | | 6,626 | |
6 | COMM 2014-CCRE18 Mortgage Trust | | 3.828% | 7/15/47 | | 3,812 | | 4,074 | |
6 | COMM 2014-CCRE20 Mortgage Trust | | 3.326% | 11/10/47 | | 1,050 | | 1,102 | |
6 | COMM 2014-CCRE20 Mortgage Trust | | 3.590% | 11/10/47 | | 3,917 | | 4,167 | |
6 | COMM 2014-CCRE21 Mortgage Trust | | 3.528% | 12/10/47 | | 5,207 | | 5,503 | |
6 | COMM 2014-LC17 Mortgage Trust | | 3.917% | 10/10/47 | | 1,540 | | 1,660 | |
6 | COMM 2015-CCRE22 Mortgage Trust | | 3.309% | 3/10/48 | | 570 | | 599 | |
6 | COMM 2015-CCRE24 Mortgage Trust | | 3.432% | 8/10/48 | | 2,600 | | 2,743 | |
6 | COMM 2015-CCRE24 Mortgage Trust | | 3.696% | 8/10/48 | | 2,775 | | 2,976 | |
6 | COMM 2015-CCRE25 Mortgage Trust | | 3.759% | 8/10/48 | | 1,800 | | 1,939 | |
6 | COMM 2015-CCRE27 Mortgage Trust | | 3.612% | 10/10/48 | | 3,386 | | 3,624 | |
6 | COMM 2015-LC19 Mortgage Trust | | 3.183% | 2/10/48 | | 125 | | 131 | |
6,9 | Core Industrial Trust 2015-TEXW | | 3.077% | 2/10/34 | | 179 | | 183 | |
47
Institutional Intermediate-Term Bond Fund
| | | | | | Face | | Market | |
| | | | Maturity | | Amount | | Value· | |
| | | Coupon | Date | | ($000 | ) | ($000 | ) |
6 | CSAIL 2015-C4 Commercial Mortgage Trust | | 3.808% | 11/15/48 | | 845 | | 914 | |
6 | CSAIL 2016-C7 Commercial Mortgage Trust | | 3.210% | 11/15/49 | | 3,400 | | 3,558 | |
6 | CSAIL 2016-C7 Commercial Mortgage Trust | | 3.502% | 11/15/49 | | 2,660 | | 2,839 | |
6 | CSAIL 2017-C8 Commercial Mortgage Trust | | 3.392% | 6/15/50 | | 1,280 | | 1,363 | |
6 | CSAIL 2019-C15 Commercial Mortgage Trust | | 4.053% | 3/15/52 | | 1,110 | | 1,247 | |
6,9 | Daimler Trucks Retail Trust 2018-1 | | 2.850% | 7/15/21 | | 20,152 | | 20,205 | |
6,9 | Daimler Trucks Retail Trust 2018-1 | | 3.030% | 11/15/24 | | 11,230 | | 11,327 | |
6,9 | Daimler Trucks Retail Trust 2019-1 | | 2.770% | 8/15/22 | | 55,310 | | 55,856 | |
6,9 | Daimler Trucks Retail Trust 2019-1 | | 2.790% | 5/15/25 | | 7,420 | | 7,545 | |
6 | DBJPM 17-C6 Mortgage Trust | | 3.328% | 6/10/50 | | 1,790 | | 1,908 | |
6,8,9 | DELAM 2018-1, 1M USD LIBOR + 0.700% | | 2.757% | 11/19/25 | | 27,600 | | 27,586 | |
6,9 | Dell Equipment Finance Trust 2018-2 | | 3.160% | 2/22/21 | | 8,434 | | 8,471 | |
6,9 | Dell Equipment Finance Trust 2019-1 | | 2.830% | 3/22/24 | | 19,770 | | 20,052 | |
6 | Discover Card Execution Note Trust 2015-A4 | | 2.190% | 4/17/23 | | 9,500 | | 9,525 | |
6 | Discover Card Execution Note Trust 2018-A5 | | 3.320% | 3/15/24 | | 12,560 | | 12,903 | |
6 | Discover Card Execution Note Trust 2019-A1 | | 3.040% | 7/15/24 | | 12,100 | | 12,422 | |
6,9 | DLL Securitization Trust Series 2018-1 | | 3.100% | 4/18/22 | | 12,465 | | 12,570 | |
6,9 | DLL Securitization Trust Series 2018-A3 | | 3.460% | 1/20/22 | | 28,490 | | 28,843 | |
6,9 | DLL Securitization Trust Series 2018-A4 | | 3.590% | 6/20/24 | | 6,870 | | 7,056 | |
6,9 | DLL Securitization Trust Series 2019-DA1 | | 2.890% | 4/20/23 | | 11,180 | | 11,299 | |
6,9 | DLL Securitization Trust Series 2019-DA1 | | 2.920% | 4/20/27 | | 8,160 | | 8,316 | |
6 | Drive Auto Receivables Trust 2019-2 | | 3.040% | 3/15/23 | | 11,260 | | 11,353 | |
6,8,9 | Edsouth Indenture No. 9 LLC 2015-1, 1M USD LIBOR + 0.800% | | 2.818% | 10/25/56 | | 276 | | 273 | |
6,9 | Enterprise Fleet Financing LLC Series 2018-3 | | 3.380% | 5/20/24 | | 11,940 | | 12,085 | |
6,9 | Enterprise Fleet Financing LLC Series 2019-1 | | 2.980% | 10/22/24 | | 6,740 | | 6,811 | |
6,9 | Enterprise Fleet Financing LLC Series 2019-1 | | 3.070% | 10/22/24 | | 9,750 | | 10,026 | |
5,6 | Fannie Mae Grantor Trust 2017-T1 | | 2.898% | 6/25/27 | | 6,928 | | 7,202 | |
6 | Fifth Third Auto Trust 2017-1 | | 2.030% | 7/15/24 | | 13,110 | | 13,115 | |
6,8 | First National Master Note Trust 2017-2, 1M USD LIBOR + 0.440% | | 2.468% | 10/16/23 | | 6,240 | | 6,246 | |
6 | Ford Credit Auto Lease Trust 2018-A | | 3.050% | 8/15/21 | | 3,820 | | 3,853 | |
6 | Ford Credit Auto Lease Trust 2018-B | | 3.190% | 12/15/21 | | 13,910 | | 14,032 | |
6 | Ford Credit Auto Lease Trust 2019-A | | 2.900% | 5/15/22 | | 27,110 | | 27,414 | |
6,9 | Ford Credit Auto Owner Trust 2015-REV2 | | 2.440% | 1/15/27 | | 10,500 | | 10,526 | |
6,9 | Ford Credit Auto Owner Trust 2016-REV1 | | 2.310% | 8/15/27 | | 13,230 | | 13,274 | |
6,9 | Ford Credit Auto Owner Trust 2016-REV2 | | 2.030% | 12/15/27 | | 11,072 | | 11,060 | |
6,9 | Ford Credit Auto Owner Trust 2017-1 | | 2.620% | 8/15/28 | | 39,440 | | 39,939 | |
6,9 | Ford Credit Auto Owner Trust 2017-2 | | 2.360% | 3/15/29 | | 16,690 | | 16,769 | |
6 | Ford Credit Auto Owner Trust 2017-A | | 1.670% | 6/15/21 | | 1,116 | | 1,115 | |
6 | Ford Credit Auto Owner Trust 2017-B | | 1.870% | 9/15/22 | | 7,500 | | 7,487 | |
6 | Ford Credit Auto Owner Trust 2017-C | | 2.010% | 3/15/22 | | 4,720 | | 4,719 | |
6 | Ford Credit Auto Owner Trust 2018-A | | 3.030% | 11/15/22 | | 26,760 | | 27,033 | |
6 | Ford Credit Auto Owner Trust 2018-B | | 3.240% | 4/15/23 | | 24,130 | | 24,584 | |
6 | Ford Credit Auto Owner Trust 2018-B | | 3.380% | 3/15/24 | | 8,300 | | 8,558 | |
6,9 | Ford Credit Auto Owner Trust 2018-REV1 | | 3.190% | 7/15/31 | | 7,750 | | 8,022 | |
6,9 | Ford Credit Auto Owner Trust 2018-REV2 | | 3.470% | 1/15/30 | | 17,320 | | 18,116 | |
6,9 | Ford Credit Auto Owner Trust 2019-1 | | 3.520% | 7/15/30 | | 24,080 | | 25,447 | |
6 | Ford Credit Auto Owner Trust 2019-A | | 2.780% | 9/15/23 | | 35,430 | | 35,927 | |
6 | Ford Credit Auto Owner Trust 2019-A | | 2.850% | 8/15/24 | | 18,600 | | 19,074 | |
6 | Ford Credit Floorplan Master Owner Trust A Series 2015-5 | | 2.390% | 8/15/22 | | 9,260 | | 9,283 | |
6 | Ford Credit Floorplan Master Owner Trust A Series 2017-1 | | 2.070% | 5/15/22 | | 38,780 | | 38,753 | |
48
Institutional Intermediate-Term Bond Fund
| | | | | | Face | | Market | |
| | | | Maturity | | Amount | | Value· | |
| | | Coupon | Date | | ($000 | ) | ($000 | ) |
6 | Ford Credit Floorplan Master Owner Trust A Series 2017-2 | | 2.160% | 9/15/22 | | 23,030 | | 23,037 | |
6 | Ford Credit Floorplan Master Owner Trust A Series 2018-1 | | 2.950% | 5/15/23 | | 54,110 | | 54,858 | |
6 | Ford Credit Floorplan Master Owner Trust A Series 2018-3 | | 3.520% | 10/15/23 | | 46,100 | | 47,349 | |
6 | Ford Credit Floorplan Master Owner Trust A Series 2019-1 | | 2.840% | 3/15/24 | | 25,280 | | 25,736 | |
6 | GM Financial Automobile Leasing Trust 2017-1 | | 2.260% | 8/20/20 | | 131 | | 131 | |
6 | GM Financial Automobile Leasing Trust 2018-1 | | 2.610% | 1/20/21 | | 31,034 | | 31,064 | |
6 | GM Financial Automobile Leasing Trust 2018-2 | | 3.060% | 6/21/21 | | 19,755 | | 19,837 | |
6 | GM Financial Automobile Leasing Trust 2018-3 | | 3.180% | 6/21/21 | | 9,920 | | 9,993 | |
6 | GM Financial Automobile Leasing Trust 2019-3 | | 2.030% | 6/20/22 | | 23,630 | | 23,603 | |
6 | GM Financial Consumer Automobile 2018-2 | | 3.020% | 12/18/23 | | 4,430 | | 4,530 | |
6 | GM Financial Consumer Automobile 2018-3 | | 3.020% | 5/16/23 | | 18,400 | | 18,664 | |
6 | GM Financial Consumer Automobile 2018-3 | | 3.160% | 1/16/24 | | 5,820 | | 6,002 | |
6 | GM Financial Consumer Automobile 2018-4 | | 3.210% | 10/16/23 | | 14,600 | | 14,873 | |
6 | GM Financial Consumer Automobile 2018-4 | | 3.320% | 6/17/24 | | 8,450 | | 8,788 | |
6 | GM Financial Consumer Automobile 2019-1 | | 3.110% | 7/16/24 | | 11,470 | | 11,857 | |
6 | GM Financial Consumer Automobile 2019-2 | | 2.650% | 2/16/24 | | 27,340 | | 27,644 | |
6 | GM Financial Consumer Automobile 2019-2 | | 2.710% | 8/16/24 | | 8,260 | | 8,462 | |
6 | GM Financial Consumer Automobile 2019-3 | | 2.180% | 4/16/24 | | 15,340 | | 15,433 | |
6,9 | GMF Floorplan Owner Revolving Trust 2017-2 | | 2.130% | 7/15/22 | | 21,600 | | 21,594 | |
6,9 | GMF Floorplan Owner Revolving Trust 2018-2 | | 3.130% | 3/15/23 | | 30,050 | | 30,470 | |
6,9 | GMF Floorplan Owner Revolving Trust 2019-1 | | 2.700% | 4/15/24 | | 4,170 | | 4,232 | |
6,9 | Golden Credit Card Trust 2018-1A | | 2.620% | 1/15/23 | | 20,690 | | 20,826 | |
6,9 | Golden Credit Card Trust 2018-4A | | 3.440% | 10/15/25 | | 29,270 | | 30,783 | |
6,8,9 | Gosforth Funding 2018-1A plc, 3M USD LIBOR + 0.450% | | 2.582% | 8/25/60 | | 10,655 | | 10,630 | |
6,9 | GreatAmerica Leasing Receivables Funding LLC Series 2018-1 | | 2.830% | 6/17/24 | | 3,690 | | 3,726 | |
6,9 | GreatAmerica Leasing Receivables Funding LLC Series 2019-1 | | 3.210% | 2/18/25 | | 4,110 | | 4,229 | |
6,9 | GS Mortgage Securities Trust 2012-GC6 | | 4.948% | 1/10/45 | | 233 | | 245 | |
6 | GS Mortgage Securities Trust 2013-GCJ12 | | 3.135% | 6/10/46 | | 1,055 | | 1,088 | |
6 | GS Mortgage Securities Trust 2013-GCJ14 | | 3.955% | 8/10/46 | | 30 | | 32 | |
6 | GS Mortgage Securities Trust 2014-GC20 | | 3.998% | 4/10/47 | | 5,545 | | 5,939 | |
6 | GS Mortgage Securities Trust 2014-GC24 | | 3.931% | 9/10/47 | | 210 | | 226 | |
6 | GS Mortgage Securities Trust 2014-GC24 | | 4.162% | 9/10/47 | | 140 | | 149 | |
6 | GS Mortgage Securities Trust 2014-GC26 | | 3.364% | 11/10/47 | | 1,680 | | 1,769 | |
6 | GS Mortgage Securities Trust 2014-GC26 | | 3.629% | 11/10/47 | | 3,630 | | 3,872 | |
6 | GS Mortgage Securities Trust 2015-GC28 | | 3.136% | 2/10/48 | | 90 | | 94 | |
6 | GS Mortgage Securities Trust 2015-GC28 | | 3.396% | 2/10/48 | | 40 | | 42 | |
6 | GS Mortgage Securities Trust 2015-GC30 | | 3.382% | 5/10/50 | | 5 | | 5 | |
6 | GS Mortgage Securities Trust 2015-GC32 | | 3.498% | 7/10/48 | | 7,000 | | 7,449 | |
6 | GS Mortgage Securities Trust 2015-GC34 | | 3.506% | 10/10/48 | | 2,520 | | 2,691 | |
6 | GS Mortgage Securities Trust 2016-GS3 | | 2.850% | 10/10/49 | | 180 | | 186 | |
6 | GS Mortgage Securities Trust 2018-GS10 | | 4.155% | 7/10/51 | | 720 | | 813 | |
6 | GS Mortgage Securities Trust 2019-GC40 | | 3.160% | 7/10/52 | | 300 | | 319 | |
6 | GS Mortgage Securities Trust 2019-GS4 | | 3.001% | 9/1/52 | | 1,100 | | 1,157 | |
6 | Harley-Davidson Motorcycle Trust 2019-A | | 2.340% | 2/15/24 | | 13,310 | | 13,383 | |
6 | Harley-Davidson Motorcycle Trust 2019-A | | 2.390% | 11/15/26 | | 2,960 | | 2,987 | |
6,9 | Hertz Vehicle Financing II LP 2015-3A | | 2.670% | 9/25/21 | | 2,790 | | 2,801 | |
6,9 | Hertz Vehicle Financing II LP 2016-2A | | 2.950% | 3/25/22 | | 4,141 | | 4,177 | |
49
Institutional Intermediate-Term Bond Fund
| | | | | | Face | | Market | |
| | | | Maturity | | Amount | | Value· | |
| | | Coupon | Date | | ($000 | ) | ($000 | ) |
6,9 | Hilton USA Trust 2016-HHV | | 3.719% | 11/5/38 | | 30 | | 32 | |
6,8,9 | Holmes Master Issuer plc 2018-1, 3M USD LIBOR + 0.360% | | 2.663% | 10/15/54 | | 13,770 | | 13,757 | |
6,8,9 | Holmes Master Issuer plc 2018-2A, 3M USD LIBOR + 0.420% | | 2.723% | 10/15/54 | | 15,966 | | 15,946 | |
6 | Honda Auto Receivables 2017-2 Owner Trust | | 1.870% | 9/15/23 | | 10,000 | | 9,984 | |
6 | Honda Auto Receivables 2017-3 Owner Trust | | 1.980% | 11/20/23 | | 6,490 | | 6,490 | |
6 | Honda Auto Receivables 2018-2 Owner Trust | | 3.010% | 5/18/22 | | 10,180 | | 10,277 | |
6 | Honda Auto Receivables 2018-3 Owner Trust | | 3.070% | 11/21/24 | | 5,020 | | 5,140 | |
6 | Honda Auto Receivables 2018-4 Owner Trust | | 2.520% | 6/21/23 | | 12,490 | | 12,627 | |
6 | Honda Auto Receivables 2018-4 Owner Trust | | 2.540% | 3/21/25 | | 2,530 | | 2,575 | |
6 | Honda Auto Receivables 2018-4 Owner Trust | | 3.300% | 7/15/25 | | 11,220 | | 11,593 | |
6 | Honda Auto Receivables 2019-1 Owner Trust | | 2.900% | 6/18/24 | | 5,000 | | 5,124 | |
6 | Honda Auto Receivables 2019-3 Owner Trust | | 1.780% | 8/15/23 | | 33,200 | | 33,116 | |
6 | Honda Auto Receivables 2019-3 Owner Trust | | 1.850% | 8/15/25 | | 9,700 | | 9,662 | |
6,9 | Houston Galleria Mall Trust 2015-HGLR | | 3.087% | 3/5/37 | | 13,080 | | 13,554 | |
6,9 | HPEFS Equipment Trust 2019-1 | | 2.190% | 9/20/29 | | 7,800 | | 7,799 | |
6,9 | HPEFS Equipment Trust 2019-1 | | 2.210% | 9/20/29 | | 1,500 | | 1,499 | |
6,9 | Hudson Yards 2019-30HY | | 3.228% | 7/10/39 | | 910 | | 974 | |
6,9 | Hyundai Auto Lease Securitization Trust 2018-A | | 2.810% | 4/15/21 | | 19,090 | | 19,154 | |
6,9 | Hyundai Auto Lease Securitization Trust 2018-A | | 2.890% | 3/15/22 | | 8,100 | | 8,155 | |
6,9 | Hyundai Auto Lease Securitization Trust 2018-B | | 3.040% | 10/15/21 | | 22,490 | | 22,687 | |
6,9 | Hyundai Auto Lease Securitization Trust 2019-A | | 2.980% | 7/15/22 | | 21,560 | | 21,819 | |
6,9 | Hyundai Auto Lease Securitization Trust 2019-A | | 3.050% | 12/15/22 | | 3,540 | | 3,608 | |
6,9 | Hyundai Auto Lease Securitization Trust 2019-B | | 2.040% | 8/15/22 | | 27,590 | | 27,553 | |
6 | Hyundai Auto Receivables Trust 2017-B | | 1.960% | 2/15/23 | | 11,040 | | 11,037 | |
6 | Hyundai Auto Receivables Trust 2019-A | | 2.710% | 5/15/25 | | 6,050 | | 6,183 | |
6,9 | Hyundai Floorplan Master Owner Trust Series 2019-1A | | 2.680% | 4/15/24 | | 5,210 | | 5,289 | |
6,9 | Irvine Core Office Trust 2013-IRV | | 3.279% | 5/15/48 | | 2,184 | | 2,263 | |
6 | John Deere Owner Trust 2016-B | | 1.490% | 5/15/23 | | 872 | | 870 | |
6 | John Deere Owner Trust 2017-A | | 2.110% | 12/15/23 | | 7,650 | | 7,647 | |
6 | John Deere Owner Trust 2017-B | | 2.110% | 7/15/24 | | 7,960 | | 7,960 | |
6 | John Deere Owner Trust 2018-B | | 3.080% | 11/15/22 | | 26,300 | | 26,640 | |
6 | John Deere Owner Trust 2018-B | | 2.910% | 7/17/23 | | 27,010 | | 27,463 | |
6 | John Deere Owner Trust 2018-B | | 3.230% | 6/16/25 | | 7,720 | | 7,942 | |
6 | John Deere Owner Trust 2018-B | | 3.000% | 1/15/26 | | 4,270 | | 4,391 | |
6 | John Deere Owner Trust 2019-B | | 2.210% | 12/15/23 | | 9,580 | | 9,617 | |
6 | John Deere Owner Trust 2019-B | | 2.320% | 5/15/26 | | 5,100 | | 5,137 | |
6,9 | JP Morgan Chase Commercial Mortgage Securities Trust 2011-C3 | | 4.717% | 2/15/46 | | 2,748 | | 2,820 | |
6,9 | JP Morgan Chase Commercial Mortgage Securities Trust 2011-C5 | | 5.554% | 8/15/46 | | 1,383 | | 1,451 | |
6,9 | JP Morgan Chase Commercial Mortgage Securities Trust 2011-RR1 | | 4.717% | 3/16/46 | | 9,826 | | 10,084 | |
6 | JP Morgan Chase Commercial Mortgage Securities Trust 2012-C6 | | 3.507% | 5/15/45 | | 343 | | 353 | |
50
Institutional Intermediate-Term Bond Fund
| | | | | | Face | | Market | |
| | | | Maturity | | Amount | | Value· | |
| | | Coupon | Date | | ($000 | ) | ($000 | ) |
6 | JP Morgan Chase Commercial Mortgage Securities Trust 2012-C8 | | 2.829% | 10/15/45 | | 828 | | 842 | |
6,9 | JP Morgan Chase Commercial Mortgage Securities Trust 2012-C8 | | 3.424% | 10/15/45 | | 1,523 | | 1,565 | |
6,9 | JP Morgan Chase Commercial Mortgage Securities Trust 2012-HSBC | | 3.093% | 7/5/32 | | 1,644 | | 1,680 | |
6 | JP Morgan Chase Commercial Mortgage Securities Trust 2013-C13 | | 3.994% | 1/15/46 | | 2,616 | | 2,767 | |
6 | JP Morgan Chase Commercial Mortgage Securities Trust 2013-C16 | | 3.674% | 12/15/46 | | 404 | | 416 | |
6 | JP Morgan Chase Commercial Mortgage Securities Trust 2013-C16 | | 3.881% | 12/15/46 | | 185 | | 196 | |
6 | JP Morgan Chase Commercial Mortgage Securities Trust 2013-C16 | | 4.166% | 12/15/46 | | 1,250 | | 1,342 | |
6 | JP Morgan Chase Commercial Mortgage Securities Trust 2013-LC11 | | 2.960% | 4/15/46 | | 2,807 | | 2,878 | |
6 | JP Morgan Chase Commercial Mortgage Securities Trust 2014-C20 | | 3.461% | 7/15/47 | | 192 | | 197 | |
6 | JP Morgan Chase Commercial Mortgage Securities Trust 2016-JP3 | | 2.870% | 8/15/49 | | 1,480 | | 1,533 | |
6 | JP Morgan Chase Commercial Mortgage Securities Trust 2016-JP4 | | 3.648% | 12/15/49 | | 470 | | 510 | |
6 | JP Morgan Chase Commercial Mortgage Securities Trust 2017-JP6 | | 3.490% | 7/15/50 | | 750 | | 807 | |
6 | JPMBB Commercial Mortgage Securities Trust 2013-C12 | | 3.363% | 7/15/45 | | 1,220 | | 1,266 | |
6 | JPMBB Commercial Mortgage Securities Trust 2013-C12 | | 3.664% | 7/15/45 | | 3,137 | | 3,296 | |
6 | JPMBB Commercial Mortgage Securities Trust 2013-C12 | | 4.176% | 7/15/45 | | 1,465 | | 1,549 | |
6 | JPMBB Commercial Mortgage Securities Trust 2013-C14 | | 3.761% | 8/15/46 | | 307 | | 316 | |
6 | JPMBB Commercial Mortgage Securities Trust 2013-C14 | | 4.133% | 8/15/46 | | 490 | | 524 | |
6 | JPMBB Commercial Mortgage Securities Trust 2013-C15 | | 3.659% | 11/15/45 | | 158 | | 163 | |
6 | JPMBB Commercial Mortgage Securities Trust 2013-C17 | | 4.199% | 1/15/47 | | 4,238 | | 4,569 | |
6 | JPMBB Commercial Mortgage Securities Trust 2014-C18 | | 4.079% | 2/15/47 | | 5,130 | | 5,519 | |
6 | JPMBB Commercial Mortgage Securities Trust 2014-C18 | | 4.439% | 2/15/47 | | 450 | | 484 | |
6 | JPMBB Commercial Mortgage Securities Trust 2014-C19 | | 3.997% | 4/15/47 | | 90 | | 97 | |
6 | JPMBB Commercial Mortgage Securities Trust 2014-C21 | | 3.493% | 8/15/47 | | 184 | | 194 | |
6 | JPMBB Commercial Mortgage Securities Trust 2014-C24 | | 3.639% | 11/15/47 | | 1,090 | | 1,161 | |
6 | JPMBB Commercial Mortgage Securities Trust 2014-C26 | | 3.231% | 1/15/48 | | 90 | | 94 | |
6 | JPMBB Commercial Mortgage Securities Trust 2014-C26 | | 3.494% | 1/15/48 | | 10 | | 11 | |
6 | JPMBB Commercial Mortgage Securities Trust 2015-C27 | | 3.179% | 2/15/48 | | 110 | | 115 | |
51
Institutional Intermediate-Term Bond Fund
| | | | | | Face | | Market | |
| | | | Maturity | | Amount | | Value· | |
| | | Coupon | Date | | ($000 | ) | ($000 | ) |
6 | JPMBB Commercial Mortgage Securities Trust 2015-C30 | | 3.822% | 7/15/48 | | 20 | | 22 | |
6 | JPMBB Commercial Mortgage Securities Trust 2015-C31 | | 3.801% | 8/15/48 | | 150 | | 162 | |
6 | JPMBB Commercial Mortgage Securities Trust 2015-C32 | | 3.598% | 11/15/48 | | 3,403 | | 3,651 | |
6 | JPMCC Commercial Mortgage Securities Trust 2017-JP5 | | 3.723% | 3/15/50 | | 6,180 | | 6,739 | |
6 | JPMCC Commercial Mortgage Securities Trust 2017-JP7 | | 3.454% | 9/15/50 | | 895 | | 961 | |
6 | JPMDB Commercial Mortgage Securities Trust 2016-C4 | | 3.141% | 12/15/49 | | 400 | | 421 | |
6 | JPMDB Commercial Mortgage Securities Trust 2017-C7 | | 3.409% | 10/15/50 | | 660 | | 707 | |
6 | JPMDB Commercial Mortgage Securities Trust 2018-C8 | | 4.211% | 6/15/51 | | 60 | | 68 | |
6,8,9 | Lanark Master Issuer plc 2018-1A, 3M USD LIBOR + 0.420% | | 2.570% | 12/22/69 | | 3,424 | | 3,419 | |
6,8,9 | Lanark Master Issuer plc 2018-2A, 1M USD LIBOR + 0.420% | | 2.570% | 12/22/69 | | 8,026 | | 8,046 | |
| Louisiana Local Government Environmental Facilities & Community Development Authority Revenue 2010-ELL | | 3.450% | 2/1/22 | | 120 | | 120 | |
6 | Mercedes-Benz Auto Lease Trust 2018-A | | 2.410% | 2/16/21 | | 550 | | 550 | |
6 | Mercedes-Benz Auto Lease Trust 2018-B | | 3.210% | 9/15/21 | | 3,000 | | 3,029 | |
6 | Mercedes-Benz Auto Lease Trust 2019-A | | 3.100% | 11/15/21 | | 2,000 | | 2,021 | |
6 | Mercedes-Benz Auto Receivables Trust 2018-1 | | 3.150% | 10/15/24 | | 6,700 | | 6,904 | |
6 | Mercedes-Benz Auto Receivables Trust 2019-1 | | 2.040% | 1/15/26 | | 11,300 | | 11,326 | |
6,9 | Mercedes-Benz Master Owner Trust 2019-B | | 2.610% | 5/15/24 | | 17,360 | | 17,637 | |
6,9 | MMAF Equipment Finance LLC 2015-AA | | 2.490% | 2/19/36 | | 527 | | 530 | |
6,9 | MMAF Equipment Finance LLC 2016-AA | | 2.210% | 12/15/32 | | 6,130 | | 6,148 | |
6,9 | MMAF Equipment Finance LLC 2017-A | | 2.410% | 8/16/24 | | 6,180 | | 6,191 | |
6,9 | MMAF Equipment Finance LLC 2017-A | | 2.680% | 7/16/27 | | 3,090 | | 3,148 | |
6,9 | MMAF Equipment Finance LLC 2018-A | | 3.390% | 1/10/25 | | 4,730 | | 4,870 | |
6,9 | MMAF Equipment Finance LLC 2018-A | | 3.610% | 3/10/42 | | 2,580 | | 2,697 | |
6,9 | MMAF Equipment Finance LLC 2019-A | | 3.080% | 11/12/41 | | 4,430 | | 4,569 | |
6 | Morgan Stanley Bank of America Merrill Lynch Trust 2012-C5 | | 3.176% | 8/15/45 | | 2,605 | | 2,666 | |
6 | Morgan Stanley Bank of America Merrill Lynch Trust 2012-C5 | | 3.792% | 8/15/45 | | 1,116 | | 1,157 | |
6 | Morgan Stanley Bank of America Merrill Lynch Trust 2012-C6 | | 2.858% | 11/15/45 | | 1,068 | | 1,085 | |
6 | Morgan Stanley Bank of America Merrill Lynch Trust 2013-C10 | | 4.218% | 7/15/46 | | 5,387 | | 5,742 | |
6 | Morgan Stanley Bank of America Merrill Lynch Trust 2013-C11 | | 3.960% | 8/15/46 | | 1,236 | | 1,305 | |
6 | Morgan Stanley Bank of America Merrill Lynch Trust 2013-C11 | | 4.299% | 8/15/46 | | 190 | | 203 | |
6 | Morgan Stanley Bank of America Merrill Lynch Trust 2013-C12 | | 3.824% | 10/15/46 | | 323 | | 333 | |
6 | Morgan Stanley Bank of America Merrill Lynch Trust 2013-C12 | | 4.259% | 10/15/46 | | 150 | | 161 | |
6 | Morgan Stanley Bank of America Merrill Lynch Trust 2013-C13 | | 4.039% | 11/15/46 | | 85 | | 91 | |
52
Institutional Intermediate-Term Bond Fund
| | | | | | Face | | Market | |
| | | | Maturity | | Amount | | Value· | |
| | | Coupon | Date | | ($000 | ) | ($000 | ) |
6 | Morgan Stanley Bank of America Merrill Lynch Trust 2014-C14 | | 4.064% | 2/15/47 | | 400 | | 429 | |
6 | Morgan Stanley Bank of America Merrill Lynch Trust 2014-C14 | | 4.384% | 2/15/47 | | 200 | | 216 | |
6 | Morgan Stanley Bank of America Merrill Lynch Trust 2014-C15 | | 3.773% | 4/15/47 | | 1,935 | | 2,050 | |
6 | Morgan Stanley Bank of America Merrill Lynch Trust 2014-C15 | | 4.051% | 4/15/47 | | 5,400 | | 5,796 | |
6 | Morgan Stanley Bank of America Merrill Lynch Trust 2014-C16 | | 3.892% | 6/15/47 | | 3,243 | | 3,465 | |
6 | Morgan Stanley Bank of America Merrill Lynch Trust 2014-C16 | | 4.094% | 6/15/47 | | 330 | | 352 | |
6 | Morgan Stanley Bank of America Merrill Lynch Trust 2014-C17 | | 3.741% | 8/15/47 | | 570 | | 606 | |
6 | Morgan Stanley Bank of America Merrill Lynch Trust 2014-C18 | | 3.923% | 10/15/47 | | 60 | | 64 | |
6 | Morgan Stanley Bank of America Merrill Lynch Trust 2014-C19 | | 3.326% | 12/15/47 | | 120 | | 124 | |
6 | Morgan Stanley Bank of America Merrill Lynch Trust 2014-C19 | | 3.526% | 12/15/47 | | 10 | | 11 | |
6 | Morgan Stanley Bank of America Merrill Lynch Trust 2015-C20 | | 3.069% | 2/15/48 | | 150 | | 154 | |
6 | Morgan Stanley Bank of America Merrill Lynch Trust 2015-C20 | | 3.249% | 2/15/48 | | 60 | | 63 | |
6 | Morgan Stanley Bank of America Merrill Lynch Trust 2015-C23 | | 3.451% | 7/15/50 | | 11,030 | | 11,632 | |
6 | Morgan Stanley Bank of America Merrill Lynch Trust 2015-C23 | | 3.719% | 7/15/50 | | 7,330 | | 7,877 | |
6 | Morgan Stanley Bank of America Merrill Lynch Trust 2015-C24 | | 3.732% | 5/15/48 | | 780 | | 838 | |
6 | Morgan Stanley Bank of America Merrill Lynch Trust 2015-C25 | | 3.372% | 10/15/48 | | 2,500 | | 2,646 | |
6 | Morgan Stanley Bank of America Merrill Lynch Trust 2015-C25 | | 3.635% | 10/15/48 | | 4,458 | | 4,783 | |
6 | Morgan Stanley Bank of America Merrill Lynch Trust 2016-C29 | | 3.325% | 5/15/49 | | 2,020 | | 2,134 | |
6 | Morgan Stanley Bank of America Merrill Lynch Trust 2016-C32 | | 3.459% | 12/15/49 | | 5,600 | | 5,996 | |
6 | Morgan Stanley Bank of America Merrill Lynch Trust 2016-C32 | | 3.720% | 12/15/49 | | 3,682 | | 4,004 | |
6 | Morgan Stanley Bank of America Merrill Lynch Trust 2017-C34 | | 3.536% | 11/15/52 | | 1,250 | | 1,348 | |
6,9 | Morgan Stanley Capital I Trust 2012-STAR | | 3.201% | 8/5/34 | | 2,251 | | 2,316 | |
6 | Morgan Stanley Capital I Trust 2015-UBS8 | | 3.809% | 12/15/48 | | 7,050 | | 7,608 | |
6 | Morgan Stanley Capital I Trust 2016-BNK2 | | 3.049% | 11/15/49 | | 760 | | 794 | |
6 | Morgan Stanley Capital I Trust 2016-UB11 | | 2.782% | 8/15/49 | | 680 | | 695 | |
6 | Morgan Stanley Capital I Trust 2016-UBS9 | | 3.594% | 3/15/49 | | 5,240 | | 5,607 | |
6 | Morgan Stanley Capital I Trust 2017-HR2 | | 3.509% | 12/15/50 | | 1,260 | | 1,341 | |
6 | Morgan Stanley Capital I Trust 2017-HR2 | | 3.587% | 12/15/50 | | 4,257 | | 4,598 | |
6 | Morgan Stanley Capital I Trust 2018-H4 | | 4.247% | 12/15/51 | | 790 | | 881 | |
6,8,9 | Motor plc 2017-1A, 1M USD LIBOR + 0.530% | | 2.548% | 9/25/24 | | 6,743 | | 6,741 | |
6,9 | MSBAM Commercial Mortgage Securities Trust 2012-CKSV | | 3.277% | 10/15/30 | | 110 | | 111 | |
53
Institutional Intermediate-Term Bond Fund
| | | | | | Face | | Market | |
| | | | Maturity | | Amount | | Value· | |
| | | Coupon | Date | | ($000 | ) | ($000 | ) |
6,8 | Navient Student Loan Trust 2014-8, 1M USD LIBOR + 0.600% | | 2.458% | 4/25/23 | | 107 | | 107 | |
6,8,9 | Navient Student Loan Trust 2016-2, 1M USD LIBOR + 1.050% | | 3.068% | 6/25/65 | | 1,078 | | 1,082 | |
6,8,9 | Navient Student Loan Trust 2016-3, 1M USD LIBOR + 0.850% | | 2.868% | 6/25/65 | | 1,009 | | 1,011 | |
6,8,9 | Navient Student Loan Trust 2016-6A, 1M USD LIBOR + 0.750% | | 2.768% | 3/25/66 | | 5,982 | | 6,012 | |
6,8,9 | Navient Student Loan Trust 2017-1, 1M USD LIBOR + 0.750% | | 2.768% | 7/26/66 | | 16,304 | | 16,342 | |
6 | Nissan Auto Lease Trust 2017-A | | 2.040% | 9/15/22 | | 3,445 | | 3,444 | |
6 | Nissan Auto Lease Trust 2018-B | | 3.250% | 9/15/21 | | 18,560 | | 18,767 | |
6 | Nissan Auto Lease Trust 2018-B | | 3.350% | 9/15/23 | | 7,110 | | 7,223 | |
6 | Nissan Auto Lease Trust 2019-A | | 2.760% | 3/15/22 | | 12,290 | | 12,423 | |
6 | Nissan Auto Lease Trust 2019-A | | 2.780% | 7/15/24 | | 6,030 | | 6,131 | |
6 | Nissan Auto Receivables 2017-C Owner Trust | | 2.120% | 4/18/22 | | 11,250 | | 11,255 | |
6 | Nissan Auto Receivables 2017-C Owner Trust | | 2.280% | 2/15/24 | | 12,380 | | 12,438 | |
6 | Nissan Auto Receivables 2018-B Owner Trust | | 3.160% | 12/16/24 | | 6,700 | | 6,905 | |
6 | Nissan Auto Receivables 2019-A Owner Trust | | 3.000% | 9/15/25 | | 5,690 | | 5,885 | |
6 | Nissan Auto Receivables 2019-B Owner Trust | | 2.500% | 11/15/23 | | 12,860 | | 13,020 | |
6 | Nissan Auto Receivables 2019-B Owner Trust | | 2.540% | 12/15/25 | | 2,500 | | 2,556 | |
6,9 | Palisades Center Trust 2016-PLSD | | 2.713% | 4/13/33 | | 1,250 | | 1,255 | |
6,8,9 | Pepper Residential Securities Trust 2017-A, 1M USD LIBOR + 1.100% | | 3.149% | 3/10/58 | | 35 | | 35 | |
6,8,9 | Pepper Residential Securities Trust 2018-A, 1M USD LIBOR + 0.950% | | 2.989% | 3/12/47 | | 18 | | 18 | |
6,8,9 | Pepper Residential Securities Trust 2021-A1U, 1M USD LIBOR + 0.880% | | 2.908% | 1/16/60 | | 1,178 | | 1,178 | |
6,8,9 | Pepper Residential Securities Trust 2022-A1U, 1M USD LIBOR + 0.350% | | 3.044% | 6/20/60 | | 14,007 | | 14,057 | |
6,8,9 | Pepper Residential Securities Trust 2023-A1U, 1M USD LIBOR + 0.950% | | 2.991% | 8/18/60 | | 7,776 | | 7,777 | |
6,8,9 | Permanent Master Issuer plc 2018-1A, 3M USD LIBOR + 0.380% | | 2.683% | 7/15/58 | | 9,060 | | 9,081 | |
6,9 | PFS Financing Corp. 2017-B | | 2.220% | 7/15/22 | | 630 | | 630 | |
6,8,9 | PFS Financing Corp. 2017-C, 1M USD LIBOR + 0.470% | | 2.498% | 10/15/21 | | 840 | | 840 | |
6,9 | PFS Financing Corp. 2017-D | | 2.400% | 10/17/22 | | 880 | | 882 | |
6,9 | PFS Financing Corp. 2018-D | | 3.190% | 4/17/23 | | 440 | | 447 | |
6,8,9 | PHEAA Student Loan Trust 2016-2A, 1M USD LIBOR + 0.950% | | 2.968% | 11/25/65 | | 4,518 | | 4,526 | |
6 | Public Service New Hampshire Funding LLC 2018-1 | | 3.094% | 2/1/26 | | 3,945 | | 4,038 | |
6,8,9 | Resimac Premier Series 2017-1A, 1M USD LIBOR + 0.950% | | 2.999% | 9/11/48 | | 1,379 | | 1,380 | |
6,8,9 | Resimac Premier Series 2018-1A, 1M USD LIBOR + 0.800% | | 2.849% | 11/10/49 | | 852 | | 851 | |
6,8,9 | Resimac Premier Series 2018-1NCA, 1M USD LIBOR + 0.850% | | 2.917% | 12/5/59 | | 1,404 | | 1,402 | |
6,8,9 | Resimac Premier Series 2018-2, 1M USD LIBOR + 0.850% | | 2.899% | 4/10/50 | | 4,259 | | 4,257 | |
6,9 | Santander Retail Auto Lease Trust 2018-A | | 2.930% | 5/20/21 | | 17,750 | | 17,834 | |
6,9 | Santander Retail Auto Lease Trust 2018-A | | 3.060% | 4/20/22 | | 6,220 | | 6,274 | |
6,9 | Santander Retail Auto Lease Trust 2019-A | | 2.770% | 6/20/22 | | 15,850 | | 16,091 | |
54
Institutional Intermediate-Term Bond Fund
| | | | | | Face | | Market | |
| | | | Maturity | | Amount | | Value· | |
| | | Coupon | Date | | ($000 | ) | ($000 | ) |
6,9 | Securitized Term Auto Receivables Trust 2017-1A | | 1.890% | 8/25/20 | | 557 | | 556 | |
6,9 | Securitized Term Auto Receivables Trust 2017-1A | | 2.209% | 6/25/21 | | 4,600 | | 4,602 | |
6,9 | Securitized Term Auto Receivables Trust 2017-2A | | 2.289% | 3/25/22 | | 3,750 | | 3,739 | |
6,9 | Securitized Term Auto Receivables Trust 2018-1A | | 3.068% | 1/25/22 | | 8,690 | | 8,757 | |
6,9 | Securitized Term Auto Receivables Trust 2018-1A | | 3.298% | 11/25/22 | | 3,100 | | 3,167 | |
6,9 | Securitized Term Auto Receivables Trust 2018-2A | | 3.544% | 6/26/23 | | 5,000 | | 5,155 | |
6 | SMART ABS Series 2016-2US Trust | | 2.050% | 12/14/22 | | 910 | | 907 | |
6,9 | SMB Private Education Loan Trust 2016-A | | 2.700% | 5/15/31 | | 248 | | 252 | |
6,8,9 | SMB Private Education Loan Trust 2016-B, 1M USD LIBOR + 1.500% | | 3.477% | 2/17/32 | | 185 | | 189 | |
6,8,9 | SMB Private Education Loan Trust 2016-C, 1M USD LIBOR + 1.100% | | 3.128% | 9/15/34 | | 299 | | 301 | |
6,8,9 | SMB Private Education Loan Trust 2017-A, 1M USD LIBOR + 0.900% | | 2.927% | 9/15/34 | | 372 | | 373 | |
6,9 | SMB Private Education Loan Trust 2017-B | | 2.820% | 10/15/35 | | 504 | | 511 | |
6,9 | SMB Private Education Loan Trust 2018-A | | 3.500% | 2/15/36 | | 1,890 | | 1,982 | |
6,9 | SMB Private Education Loan Trust 2018-B | | 3.600% | 1/15/37 | | 840 | | 868 | |
6,9 | SMB Private Education Loan Trust 2018-C | | 3.630% | 11/15/35 | | 1,390 | | 1,446 | |
6,9 | SoFi Professional Loan Program 2017-A LLC | | 2.400% | 3/26/40 | | 87 | | 87 | |
6,9 | SoFi Professional Loan Program 2017-B LLC | | 2.740% | 5/25/40 | | 427 | | 433 | |
6,9 | SoFi Professional Loan Program 2017-D LLC | | 2.650% | 9/25/40 | | 340 | | 343 | |
6,9 | SoFi Professional Loan Program 2017-E LLC | | 1.860% | 11/26/40 | | 325 | | 324 | |
6,9 | SoFi Professional Loan Program 2017-E LLC | | 2.720% | 11/26/40 | | 250 | | 253 | |
6,9 | SoFi Professional Loan Program 2017-F LLC | | 2.050% | 1/25/41 | | 318 | | 317 | |
6,9 | SoFi Professional Loan Program 2017-F LLC | | 2.840% | 1/25/41 | | 390 | | 395 | |
6,9 | SoFi Professional Loan Program 2018-A LLC | | 2.390% | 2/25/42 | | 134 | | 135 | |
6,9 | SoFi Professional Loan Program 2018-A LLC | | 2.950% | 2/25/42 | | 130 | | 132 | |
6,9 | SoFi Professional Loan Program 2018-B LLC | | 3.340% | 8/25/47 | | 1,070 | | 1,100 | |
6,9 | SoFi Professional Loan Program 2018-C LLC | | 3.590% | 1/25/48 | | 1,850 | | 1,927 | |
6,9 | SoFi Professional Loan Program 2018-D LLC | | 3.120% | 2/25/48 | | 251 | | 253 | |
6,9 | SoFi Professional Loan Program 2018-D LLC | | 3.600% | 2/25/48 | | 1,100 | | 1,159 | |
6 | Synchrony Card Issuance Trust 2018-A1 | | 3.380% | 9/15/24 | | 10,630 | | 10,900 | |
6 | Synchrony Card Issuance Trust 2019-2A | | 2.340% | 6/15/25 | | 14,980 | | 15,100 | |
6 | Synchrony Credit Card Master Note Trust 2015-4 | | 2.380% | 9/15/23 | | 7,153 | | 7,176 | |
6 | Synchrony Credit Card Master Note Trust 2016-2 | | 2.210% | 5/15/24 | | 6,820 | | 6,845 | |
6 | Synchrony Credit Card Master Note Trust 2017-2 | | 2.620% | 10/15/25 | | 10,670 | | 10,861 | |
6,9 | TMSQ 2014-1500 Mortgage Trust | | 3.680% | 10/10/36 | | 100 | | 106 | |
6 | Toyota Auto Receivables 2016-B Owner Trust | | 1.520% | 8/16/21 | | 1,653 | | 1,650 | |
6 | Toyota Auto Receivables 2017-D Owner Trust | | 2.120% | 2/15/23 | | 955 | | 957 | |
6 | Toyota Auto Receivables 2018-A Owner Trust | | 2.520% | 5/15/23 | | 540 | | 546 | |
6 | Toyota Auto Receivables 2018-B Owner Trust | | 3.110% | 11/15/23 | | 4,160 | | 4,266 | |
6 | Toyota Auto Receivables 2018-C Owner Trust | | 3.130% | 2/15/24 | | 10,070 | | 10,391 | |
6 | Toyota Auto Receivables 2019-A Owner Trust | | 2.910% | 7/17/23 | | 44,780 | | 45,578 | |
6 | Toyota Auto Receivables 2019-A Owner Trust | | 3.000% | 5/15/24 | | 3,800 | | 3,920 | |
6 | Toyota Auto Receivables 2019-C Owner Trust | | 1.910% | 9/15/23 | | 34,940 | | 34,920 | |
55
Institutional Intermediate-Term Bond Fund
| | | | | | Face | | Market | |
| | | | Maturity | | Amount | | Value· | |
| | | Coupon | Date | | ($000 | ) | ($000 | ) |
6,9 | Trafigura Securitisation Finance plc 2017-1A | | 2.470% | 12/15/20 | | 1,590 | | 1,581 | |
6,9 | Trafigura Securitisation Finance plc 2018-1A | | 3.730% | 3/15/22 | | 4,040 | | 4,060 | |
6,9 | Trillium Credit Card Trust II 2019-2A | | 3.038% | 1/26/24 | | 33,390 | | 33,793 | |
6 | UBS Commercial Mortgage Trust 2012-C1 | | 4.171% | 5/10/45 | | 273 | | 284 | |
6 | UBS Commercial Mortgage Trust 2017-C7 | | 3.679% | 12/15/50 | | 1,235 | | 1,343 | |
6 | UBS Commercial Mortgage Trust 2019-C16 | | 3.460% | 4/15/52 | | 453 | | 484 | |
6,9 | UBS-BAMLL Trust 2012-WRM | | 3.663% | 6/10/30 | | 4,409 | | 4,539 | |
6 | UBS-Barclays Commercial Mortgage Trust 2012-C4 | | 2.850% | 12/10/45 | | 1,499 | | 1,528 | |
6 | UBS-Barclays Commercial Mortgage Trust 2013-C6 | | 3.244% | 4/10/46 | | 220 | | 227 | |
6 | UBS-Barclays Commercial Mortgage Trust 2013-C6 | | 3.469% | 4/10/46 | | 150 | | 156 | |
6 | USAA Auto Owner Trust 2017-1 | | 1.880% | 9/15/22 | | 8,440 | | 8,417 | |
6,9 | Verizon Owner Trust 2017-2A | | 1.920% | 12/20/21 | | 11,907 | | 11,896 | |
6,9 | Verizon Owner Trust 2018-1 | | 2.820% | 9/20/22 | | 34,730 | | 34,976 | |
6 | Verizon Owner Trust 2018-A | | 3.230% | 4/20/23 | | 16,830 | | 17,154 | |
6 | Verizon Owner Trust 2019-A | | 2.930% | 9/20/23 | | 14,630 | | 14,892 | |
6,9 | VNDO 2012-6AVE Mortgage Trust | | 2.996% | 11/15/30 | | 2,836 | | 2,902 | |
6 | Volkswagen Auto Loan Enhanced Trust 2018-1 | | 3.020% | 11/21/22 | | 13,794 | | 13,963 | |
6 | Volkswagen Auto Loan Enhanced Trust 2018-1 | | 3.150% | 7/22/24 | | 5,610 | | 5,750 | |
6 | Volkswagen Auto Loan Enhanced Trust 2018-2 | | 3.250% | 4/20/23 | | 32,530 | | 33,082 | |
6 | Volkswagen Auto Loan Enhanced Trust 2018-2 | | 3.330% | 2/20/25 | | 8,820 | | 9,130 | |
6 | Wells Fargo Commercial Mortgage Trust 2012-LC5 | | 2.918% | 10/15/45 | | 925 | | 944 | |
6 | Wells Fargo Commercial Mortgage Trust 2012-LC5 | | 3.539% | 10/15/45 | | 626 | | 647 | |
6 | Wells Fargo Commercial Mortgage Trust 2013-LC12 | | 3.928% | 7/15/46 | | 379 | | 393 | |
6 | Wells Fargo Commercial Mortgage Trust 2013-LC12 | | 4.218% | 7/15/46 | | 311 | | 332 | |
6 | Wells Fargo Commercial Mortgage Trust 2014-LC16 | | 3.548% | 8/15/50 | | 30 | | 32 | |
6 | Wells Fargo Commercial Mortgage Trust 2014-LC16 | | 3.817% | 8/15/50 | | 10 | | 11 | |
6 | Wells Fargo Commercial Mortgage Trust 2014-LC18 | | 3.405% | 12/15/47 | | 10 | | 11 | |
6 | Wells Fargo Commercial Mortgage Trust 2015-C26 | | 3.166% | 2/15/48 | | 1,715 | | 1,790 | |
6 | Wells Fargo Commercial Mortgage Trust 2015-C27 | | 3.190% | 2/15/48 | | 108 | | 113 | |
6 | Wells Fargo Commercial Mortgage Trust 2015-C27 | | 3.451% | 2/15/48 | | 440 | | 466 | |
6 | Wells Fargo Commercial Mortgage Trust 2015-C29 | | 3.637% | 6/15/48 | | 3,130 | | 3,352 | |
6 | Wells Fargo Commercial Mortgage Trust 2015-C30 | | 3.664% | 9/15/58 | | 2,120 | | 2,277 | |
6 | Wells Fargo Commercial Mortgage Trust 2015-LC22 | | 3.839% | 9/15/58 | | 4,935 | | 5,347 | |
6 | Wells Fargo Commercial Mortgage Trust 2015-SG1 | | 3.789% | 9/15/48 | | 3,480 | | 3,748 | |
6 | Wells Fargo Commercial Mortgage Trust 2016-BNK1 | | 2.652% | 8/15/49 | | 190 | | 194 | |
56
Institutional Intermediate-Term Bond Fund
| | | | | | Face | | Market | |
| | | | Maturity | | Amount | | Value· | |
| | | Coupon | Date | | ($000 | ) | ($000 | ) |
6 | Wells Fargo Commercial Mortgage Trust 2016-C32 | | 3.560% | 1/15/59 | | 2,070 | | 2,214 | |
6 | Wells Fargo Commercial Mortgage Trust 2016-C37 | | 3.525% | 12/15/49 | | 470 | | 502 | |
6 | Wells Fargo Commercial Mortgage Trust 2016-C37 | | 3.794% | 12/15/49 | | 390 | | 426 | |
6 | Wells Fargo Commercial Mortgage Trust 2017-C38 | | 3.453% | 7/15/50 | | 1,285 | | 1,378 | |
6 | Wells Fargo Commercial Mortgage Trust 2017-C39 | | 3.157% | 9/15/50 | | 30 | | 32 | |
6 | Wells Fargo Commercial Mortgage Trust 2017-C39 | | 3.418% | 9/15/50 | | 2,505 | | 2,679 | |
6 | Wells Fargo Commercial Mortgage Trust 2017-C40 | | 3.581% | 10/15/50 | | 3,040 | | 3,289 | |
6 | Wells Fargo Commercial Mortgage Trust 2017-C41 | | 3.472% | 11/15/50 | | 1,790 | | 1,923 | |
6 | Wells Fargo Commercial Mortgage Trust 2017-C42 | | 3.589% | 12/15/50 | | 6,685 | | 7,234 | |
6 | Wells Fargo Commercial Mortgage Trust 2017-RC1 | | 3.631% | 1/15/60 | | 396 | | 428 | |
6 | Wells Fargo Commercial Mortgage Trust 2018-C46 | | 4.152% | 8/15/51 | | 1,095 | | 1,233 | |
6 | Wells Fargo Commercial Mortgage Trust 2018-C47 | | 4.365% | 9/15/61 | | 2,470 | | 2,764 | |
6 | Wells Fargo Commercial Mortgage Trust 2018-C48 | | 4.245% | 1/15/52 | | 960 | | 1,067 | |
6 | Wells Fargo Commercial Mortgage Trust 2019-C49 | | 3.933% | 3/15/52 | | 310 | | 340 | |
6 | Wells Fargo Commercial Mortgage Trust 2019-C49 | | 4.023% | 3/15/52 | | 470 | | 529 | |
6 | Wells Fargo Commercial Mortgage Trust 2019-C50 | | 3.635% | 5/15/52 | | 390 | | 421 | |
6 | Wells Fargo Commercial Mortgage Trust 2019-C52 | | 2.892% | 8/15/52 | | 990 | | 1,029 | |
6 | Wells Fargo Commercial Mortgate Trust 2018-C47 | | 4.442% | 9/15/61 | | 1,070 | | 1,230 | |
6,9 | WFRBS Commercial Mortgage Trust 2011-C3 | | 4.375% | 3/15/44 | | 1,366 | | 1,403 | |
6 | WFRBS Commercial Mortgage Trust 2012-C7 | | 3.431% | 6/15/45 | | 1,199 | | 1,235 | |
6 | WFRBS Commercial Mortgage Trust 2012-C7 | | 4.090% | 6/15/45 | | 683 | | 710 | |
6 | WFRBS Commercial Mortgage Trust 2012-C8 | | 3.001% | 8/15/45 | | 233 | | 238 | |
6 | WFRBS Commercial Mortgage Trust 2012-C9 | | 2.870% | 11/15/45 | | 2,374 | | 2,427 | |
6 | WFRBS Commercial Mortgage Trust 2012-C9 | | 3.388% | 11/15/45 | | 633 | | 652 | |
6 | WFRBS Commercial Mortgage Trust 2013-C15 | | 3.720% | 8/15/46 | | 436 | | 449 | |
6 | WFRBS Commercial Mortgage Trust 2013-C15 | | 4.153% | 8/15/46 | | 255 | | 272 | |
6 | WFRBS Commercial Mortgage Trust 2013-C17 | | 3.558% | 12/15/46 | | 151 | | 155 | |
6 | WFRBS Commercial Mortgage Trust 2013-C18 | | 3.676% | 12/15/46 | | 575 | | 593 | |
6 | WFRBS Commercial Mortgage Trust 2013-C18 | | 4.162% | 12/15/46 | | 1,665 | | 1,792 | |
6 | WFRBS Commercial Mortgage Trust 2014-C19 | | 3.829% | 3/15/47 | | 2,540 | | 2,696 | |
6 | WFRBS Commercial Mortgage Trust 2014-C19 | | 4.101% | 3/15/47 | | 1,215 | | 1,308 | |
6 | WFRBS Commercial Mortgage Trust 2014-C20 | | 3.995% | 5/15/47 | | 30 | | 32 | |
6 | WFRBS Commercial Mortgage Trust 2014-C21 | | 3.410% | 8/15/47 | | 20 | | 21 | |
6 | WFRBS Commercial Mortgage Trust 2014-C21 | | 3.678% | 8/15/47 | | 80 | | 85 | |
6 | WFRBS Commercial Mortgage Trust 2014-C23 | | 3.650% | 10/15/57 | | 5,437 | | 5,769 | |
57
Institutional Intermediate-Term Bond Fund
| | | | | | Face | | Market | |
| | | | Maturity | | Amount | | Value· | |
| | | Coupon | Date | | ($000 | ) | ($000 | ) |
6 | WFRBS Commercial Mortgage Trust 2014-C23 | | 3.917% | 10/15/57 | | 925 | | 995 | |
6 | WFRBS Commercial Mortgage Trust 2014-C24 | | 3.607% | 11/15/47 | | 3,030 | | 3,218 | |
6 | WFRBS Commercial Mortgage Trust 2014-LC14 | | 3.766% | 3/15/47 | | 2,570 | | 2,722 | |
6 | WFRBS Commercial Mortgage Trust 2014-LC14 | | 4.045% | 3/15/47 | | 2,570 | | 2,756 | |
6,9 | Wheels SPV 2 LLC 2016-1A | | 1.870% | 5/20/25 | | 257 | | 256 | |
6 | World Financial Network Credit Card Master Note Trust Series 2015-B | | 2.550% | 6/17/24 | | 1,520 | | 1,525 | |
6 | World Omni Auto Receivables Trust 2015-B | | 1.840% | 1/17/22 | | 9,907 | | 9,905 | |
6 | World Omni Auto Receivables Trust 2018-A | | 2.730% | 2/15/24 | | 3,590 | | 3,640 | |
6 | World Omni Auto Receivables Trust 2018-D | | 3.330% | 4/15/24 | | 24,700 | | 25,217 | |
6 | World Omni Auto Receivables Trust 2018-D | | 3.440% | 12/16/24 | | 3,070 | | 3,208 | |
6 | World Omni Auto Receivables Trust 2019-A | | 3.220% | 6/16/25 | | 5,230 | | 5,431 | |
6 | World Omni Automobile Lease Securitization Trust 2018-A | | 2.830% | 7/15/21 | | 11,480 | | 11,533 | |
6 | World Omni Automobile Lease Securitization Trust 2018-B | | 3.190% | 12/15/21 | | 16,800 | | 17,046 | |
6 | World Omni Automobile Lease Securitization Trust 2019-B | | 2.030% | 11/15/22 | | 27,800 | | 27,697 | |
6,9 | World Omni Select Auto Trust A Series 2018-1 A2 | | 3.240% | 4/15/22 | | 20,625 | | 20,692 | |
6,9 | World Omni Select Auto Trust A Series 2018-1 A3 | | 3.460% | 3/15/23 | | 9,350 | | 9,478 | |
Total Asset-Backed/Commercial Mortgage-Backed Securities (Cost $3,258,797) | | | | 3,313,649 | |
Corporate Bonds (20.2%) | | | | | |
Finance (12.2%) | | | | | |
| Banking (10.5%) | | | | | | | | |
| American Express Co. | | 3.700% | 8/3/23 | | 37,405 | | 39,387 | |
| American Express Co. | | 3.000% | 10/30/24 | | 18,265 | | 18,843 | |
9 | Australia & New Zealand Banking Group Ltd. | | 4.875% | 1/12/21 | | 500 | | 518 | |
| Banco Santander SA | | 4.379% | 4/12/28 | | 2,585 | | 2,818 | |
| Banco Santander SA | | 3.306% | 6/27/29 | | 4,800 | | 4,942 | |
6 | Bank of America Corp. | | 2.369% | 7/21/21 | | 3,005 | | 3,010 | |
6 | Bank of America Corp. | | 2.328% | 10/1/21 | | 9,260 | | 9,268 | |
6 | Bank of America Corp. | | 3.550% | 3/5/24 | | 142,215 | | 147,821 | |
6 | Bank of America Corp. | | 3.864% | 7/23/24 | | 11,390 | | 11,980 | |
6 | Bank of America Corp. | | 3.458% | 3/15/25 | | 7,500 | | 7,823 | |
6 | Bank of America Corp. | | 3.366% | 1/23/26 | | 35,445 | | 36,970 | |
| Bank of America Corp. | | 3.248% | 10/21/27 | | 4,500 | | 4,683 | |
6 | Bank of America Corp. | | 3.824% | 1/20/28 | | 24,526 | | 26,433 | |
6 | Bank of America Corp. | | 3.705% | 4/24/28 | | 5,800 | | 6,172 | |
| Bank of America Corp. | | 3.419% | 12/20/28 | | 4,500 | | 4,690 | |
6 | Bank of America Corp. | | 3.970% | 3/5/29 | | 3,000 | | 3,250 | |
6 | Bank of America Corp. | | 3.974% | 2/7/30 | | 20,990 | | 23,016 | |
6 | Bank of America Corp. | | 3.194% | 7/23/30 | | 10,000 | | 10,291 | |
| Bank of Montreal | | 3.300% | 2/5/24 | | 20,000 | | 20,834 | |
| Bank of New York Mellon Corp. | | 4.150% | 2/1/21 | | 2,000 | | 2,055 | |
| Bank of New York Mellon Corp. | | 2.050% | 5/3/21 | | 3,685 | | 3,688 | |
| Bank of New York Mellon Corp. | | 3.450% | 8/11/23 | | 17,780 | | 18,619 | |
| Bank of New York Mellon Corp. | | 3.400% | 5/15/24 | | 2,100 | | 2,207 | |
| Bank of New York Mellon Corp. | | 3.000% | 2/24/25 | | 700 | | 726 | |
58
Institutional Intermediate-Term Bond Fund
| | | | | | Face | | Market | |
| | | | Maturity | | Amount | | Value· | |
| | | Coupon | Date | | ($000 | ) | ($000 | ) |
| Bank of Nova Scotia | | 3.400% | 2/11/24 | | 19,965 | | 20,891 | |
| Bank of Nova Scotia | | 2.700% | 8/3/26 | | 11,250 | | 11,396 | |
9 | Banque Federative du Credit Mutuel SA | | 2.500% | 4/13/21 | | 13,875 | | 13,896 | |
9 | Banque Federative du Credit Mutuel SA | | 2.700% | 7/20/22 | | 37,330 | | 37,783 | |
9 | Banque Federative du Credit Mutuel SA | | 3.750% | 7/20/23 | | 48,800 | | 51,367 | |
| BB&T Corp. | | 3.750% | 12/6/23 | | 13,835 | | 14,632 | |
| BB&T Corp. | | 2.500% | 8/1/24 | | 25,469 | | 25,658 | |
| BNP Paribas SA | | 5.000% | 1/15/21 | | 5,000 | | 5,177 | |
| Branch Banking & Trust Co. | | 2.850% | 4/1/21 | | 1,525 | | 1,541 | |
| Canadian Imperial Bank of Commerce | | 3.500% | 9/13/23 | | 19,475 | | 20,499 | |
| Canadian Imperial Bank of Commerce | | 3.100% | 4/2/24 | | 3,800 | | 3,920 | |
| Citibank NA | | 3.400% | 7/23/21 | | 5,000 | | 5,121 | |
| Comerica Inc. | | 3.700% | 7/31/23 | | 23,915 | | 25,113 | |
| Commonwealth Bank of Australia | | 2.300% | 3/12/20 | | 1,500 | | 1,502 | |
| Commonwealth Bank of Australia | | 2.400% | 11/2/20 | | 870 | | 873 | |
9 | Commonwealth Bank of Australia | | 2.000% | 9/6/21 | | 11,329 | | 11,306 | |
9 | Commonwealth Bank of Australia | | 2.750% | 3/10/22 | | 9,180 | | 9,323 | |
9 | Commonwealth Bank of Australia | | 3.450% | 3/16/23 | | 1,580 | | 1,650 | |
9 | Commonwealth Bank of Australia | | 3.350% | 6/4/24 | | 16,700 | | 17,513 | |
9 | Commonwealth Bank of Australia | | 3.150% | 9/19/27 | | 12,000 | | 12,637 | |
| Cooperatieve Rabobank UA | | 2.750% | 1/10/23 | | 56,410 | | 57,445 | |
9 | Cooperatieve Rabobank UA | | 3.875% | 9/26/23 | | 10,635 | | 11,271 | |
9 | Cooperatieve Rabobank UA | | 2.625% | 7/22/24 | | 5,990 | | 6,074 | |
| Credit Suisse AG | | 3.000% | 10/29/21 | | 4,150 | | 4,208 | |
| Credit Suisse AG | | 3.625% | 9/9/24 | | 8,000 | | 8,455 | |
9 | Danske Bank A/S | | 2.750% | 9/17/20 | | 1,155 | | 1,158 | |
| Fifth Third Bank | | 2.250% | 6/14/21 | | 6,133 | | 6,150 | |
| First Republic Bank | | 2.500% | 6/6/22 | | 17,170 | | 17,259 | |
| Goldman Sachs Group Inc. | | 2.300% | 12/13/19 | | 24,740 | | 24,752 | |
| Goldman Sachs Group Inc. | | 2.600% | 12/27/20 | | 9,715 | | 9,725 | |
| Goldman Sachs Group Inc. | | 5.750% | 1/24/22 | | 11,320 | | 12,153 | |
6 | Goldman Sachs Group Inc. | | 2.876% | 10/31/22 | | 6,270 | | 6,337 | |
| Goldman Sachs Group Inc. | | 3.625% | 1/22/23 | | 295 | | 307 | |
6 | Goldman Sachs Group Inc. | | 2.908% | 6/5/23 | | 30,600 | | 31,020 | |
6 | Goldman Sachs Group Inc. | | 2.905% | 7/24/23 | | 4,750 | | 4,817 | |
| Goldman Sachs Group Inc. | | 3.850% | 7/8/24 | | 2,100 | | 2,223 | |
| Goldman Sachs Group Inc. | | 3.500% | 1/23/25 | | 5,675 | | 5,914 | |
| Goldman Sachs Group Inc. | | 3.750% | 5/22/25 | | 8,560 | | 9,055 | |
6 | Goldman Sachs Group Inc. | | 3.272% | 9/29/25 | | 7,755 | | 8,010 | |
| Goldman Sachs Group Inc. | | 3.850% | 1/26/27 | | 8,025 | | 8,510 | |
6 | Goldman Sachs Group Inc. | | 3.691% | 6/5/28 | | 14,140 | | 14,834 | |
| HSBC Bank USA NA | | 4.875% | 8/24/20 | | 13,562 | | 13,894 | |
| HSBC Holdings plc | | 2.650% | 1/5/22 | | 7,210 | | 7,260 | |
| HSBC Holdings plc | | 4.875% | 1/14/22 | | 2,030 | | 2,146 | |
6 | HSBC Holdings plc | | 3.262% | 3/13/23 | | 16,050 | | 16,325 | |
| HSBC Holdings plc | | 3.600% | 5/25/23 | | 4,085 | | 4,246 | |
6 | HSBC Holdings plc | | 3.033% | 11/22/23 | | 17,615 | | 17,808 | |
6 | HSBC Holdings plc | | 3.950% | 5/18/24 | | 16,615 | | 17,342 | |
6 | HSBC Holdings plc | | 3.803% | 3/11/25 | | 2,855 | | 2,973 | |
| HSBC Holdings plc | | 3.900% | 5/25/26 | | 3,650 | | 3,866 | |
6 | HSBC Holdings plc | | 4.292% | 9/12/26 | | 5,050 | | 5,405 | |
| HSBC Holdings plc | | 4.375% | 11/23/26 | | 985 | | 1,055 | |
6 | HSBC Holdings plc | | 4.041% | 3/13/28 | | 55,181 | | 58,577 | |
6 | HSBC Holdings plc | | 4.583% | 6/19/29 | | 18,855 | | 20,909 | |
59
Institutional Intermediate-Term Bond Fund
| | | | | | Face | | Market | |
| | | | Maturity | | Amount | | Value· | |
| | | Coupon | Date | | ($000 | ) | ($000 | ) |
6 | HSBC Holdings plc | | 3.973% | 5/22/30 | | 8,635 | | 9,182 | |
| Huntington National Bank | | 2.375% | 3/10/20 | | 8,455 | | 8,462 | |
| Huntington National Bank | | 3.250% | 5/14/21 | | 1,100 | | 1,118 | |
| Huntington National Bank | | 2.500% | 8/7/22 | | 4,685 | | 4,722 | |
| Huntington National Bank | | 3.550% | 10/6/23 | | 15,270 | | 16,025 | |
| JPMorgan Chase & Co. | | 2.550% | 10/29/20 | | 21,890 | | 22,003 | |
| JPMorgan Chase & Co. | | 2.550% | 3/1/21 | | 11,356 | | 11,422 | |
| JPMorgan Chase & Co. | | 4.350% | 8/15/21 | | 3,000 | | 3,122 | |
| JPMorgan Chase & Co. | | 4.500% | 1/24/22 | | 5,296 | | 5,581 | |
| JPMorgan Chase & Co. | | 2.972% | 1/15/23 | | 27,933 | | 28,439 | |
| JPMorgan Chase & Co. | | 3.200% | 1/25/23 | | 1,955 | | 2,018 | |
6 | JPMorgan Chase & Co. | | 2.776% | 4/25/23 | | 8,975 | | 9,085 | |
| JPMorgan Chase & Co. | | 2.700% | 5/18/23 | | 6,106 | | 6,205 | |
| JPMorgan Chase & Co. | | 3.875% | 2/1/24 | | 4,000 | | 4,267 | |
6 | JPMorgan Chase & Co. | | 3.559% | 4/23/24 | | 55,490 | | 57,813 | |
| JPMorgan Chase & Co. | | 3.625% | 5/13/24 | | 6,500 | | 6,880 | |
6 | JPMorgan Chase & Co. | | 4.023% | 12/5/24 | | 10,000 | | 10,654 | |
| JPMorgan Chase & Co. | | 3.125% | 1/23/25 | | 8,856 | | 9,167 | |
6 | JPMorgan Chase & Co. | | 3.220% | 3/1/25 | | 32,655 | | 33,803 | |
| JPMorgan Chase & Co. | | 3.900% | 7/15/25 | | 14,605 | | 15,705 | |
6 | JPMorgan Chase & Co. | | 2.301% | 10/15/25 | | 18,250 | | 18,159 | |
| JPMorgan Chase & Co. | | 3.200% | 6/15/26 | | 11,430 | | 11,865 | |
6 | JPMorgan Chase & Co. | | 3.540% | 5/1/28 | | 12,890 | | 13,596 | |
6 | JPMorgan Chase & Co. | | 3.509% | 1/23/29 | | 8,575 | | 9,038 | |
6 | JPMorgan Chase & Co. | | 4.005% | 4/23/29 | | 28,335 | | 30,937 | |
6 | JPMorgan Chase & Co. | | 4.452% | 12/5/29 | | 15,000 | | 16,945 | |
6 | JPMorgan Chase & Co. | | 3.702% | 5/6/30 | | 4,600 | | 4,924 | |
| KeyBank NA | | 2.500% | 11/22/21 | | 1,860 | | 1,872 | |
| Lloyds Banking Group plc | | 4.450% | 5/8/25 | | 15,000 | | 16,106 | |
| Manufacturers & Traders Trust Co. | | 2.500% | 5/18/22 | | 3,890 | | 3,924 | |
| Manufacturers & Traders Trust Co. | | 2.900% | 2/6/25 | | 3,700 | | 3,811 | |
| Mitsubishi UFJ Financial Group Inc. | | 2.950% | 3/1/21 | | 24,101 | | 24,318 | |
| Mitsubishi UFJ Financial Group Inc. | | 2.190% | 9/13/21 | | 1,470 | | 1,465 | |
| Mitsubishi UFJ Financial Group Inc. | | 2.665% | 7/25/22 | | 15,569 | | 15,719 | |
| Mitsubishi UFJ Financial Group Inc. | | 3.761% | 7/26/23 | | 32,435 | | 34,089 | |
| Mitsubishi UFJ Financial Group Inc. | | 2.527% | 9/13/23 | | 1,025 | | 1,030 | |
| Mitsubishi UFJ Financial Group Inc. | | 3.777% | 3/2/25 | | 43,860 | | 46,651 | |
| Mitsubishi UFJ Financial Group Inc. | | 3.741% | 3/7/29 | | 7,000 | | 7,583 | |
| Mitsubishi UFJ Financial Group Inc. | | 3.195% | 7/18/29 | | 8,000 | | 8,281 | |
9 | Mitsubishi UFJ Trust & Banking Corp. | | 2.650% | 10/19/20 | | 12,470 | | 12,545 | |
9 | Mizuho Financial Group Inc. | | 2.632% | 4/12/21 | | 3,000 | | 3,012 | |
6 | Mizuho Financial Group Inc. | | 3.153% | 7/16/30 | | 5,400 | | 5,522 | |
6 | Mizuho Financial Group Inc. | | 2.869% | 9/13/30 | | 4,000 | | 3,977 | |
| Morgan Stanley | | 5.750% | 1/25/21 | | 2,250 | | 2,352 | |
| Morgan Stanley | | 3.875% | 4/29/24 | | 8,205 | | 8,702 | |
| Morgan Stanley | | 3.700% | 10/23/24 | | 6,138 | | 6,495 | |
6 | Morgan Stanley | | 2.720% | 7/22/25 | | 10,000 | | 10,089 | |
| Morgan Stanley | | 4.000% | 7/23/25 | | 1,355 | | 1,461 | |
| Morgan Stanley | | 3.875% | 1/27/26 | | 8,295 | | 8,907 | |
| Morgan Stanley | | 3.625% | 1/20/27 | | 3,625 | | 3,833 | |
| MUFG Americas Holdings Corp. | | 3.500% | 6/18/22 | | 7,000 | | 7,229 | |
| MUFG Americas Holdings Corp. | | 3.000% | 2/10/25 | | 1,600 | | 1,638 | |
9 | MUFG Bank Ltd. | | 2.750% | 9/14/20 | | 6,890 | | 6,934 | |
9 | MUFG Bank Ltd. | | 2.850% | 9/8/21 | | 3,010 | | 3,037 | |
| PNC Bank NA | | 2.600% | 7/21/20 | | 5,735 | | 5,759 | |
60
Institutional Intermediate-Term Bond Fund
| | | | | | Face | | Market | |
| | | | Maturity | | Amount | | Value· | |
| | | Coupon | Date | | ($000 | ) | ($000 | ) |
| PNC Bank NA | | 2.150% | 4/29/21 | | 2,294 | | 2,296 | |
| PNC Bank NA | | 2.550% | 12/9/21 | | 5,135 | | 5,178 | |
| PNC Bank NA | | 2.625% | 2/17/22 | | 3,980 | | 4,024 | |
| PNC Bank NA | | 2.700% | 11/1/22 | | 3,400 | | 3,440 | |
| PNC Bank NA | | 2.950% | 2/23/25 | | 5,360 | | 5,526 | |
| PNC Bank NA | | 3.250% | 6/1/25 | | 27 | | 28 | |
| PNC Financial Services Group Inc. | | 2.854% | 11/9/22 | | 1,335 | | 1,362 | |
| PNC Financial Services Group Inc. | | 2.600% | 7/23/26 | | 3,820 | | 3,863 | |
| PNC Financial Services Group Inc. | | 3.450% | 4/23/29 | | 26,170 | | 27,917 | |
| PNC Funding Corp. | | 5.125% | 2/8/20 | | 3,840 | | 3,881 | |
| Royal Bank of Canada | | 3.700% | 10/5/23 | | 9,880 | | 10,451 | |
| Royal Bank of Canada | | 2.550% | 7/16/24 | | 14,025 | | 14,192 | |
| Santander UK plc | | 3.400% | 6/1/21 | | 54,275 | | 55,111 | |
| State Street Corp. | | 4.375% | 3/7/21 | | 6,800 | | 7,024 | |
| Sumitomo Mitsui Banking Corp. | | 2.514% | 1/17/20 | | 6,000 | | 6,005 | |
| Sumitomo Mitsui Banking Corp. | | 2.650% | 7/23/20 | | 2,520 | | 2,530 | |
| Sumitomo Mitsui Financial Group Inc. | | 2.442% | 10/19/21 | | 3,470 | | 3,483 | |
| Sumitomo Mitsui Financial Group Inc. | | 2.784% | 7/12/22 | | 5,795 | | 5,872 | |
| Sumitomo Mitsui Financial Group Inc. | | 2.778% | 10/18/22 | | 6,840 | | 6,932 | |
| Sumitomo Mitsui Financial Group Inc. | | 3.748% | 7/19/23 | | 9,975 | | 10,474 | |
| Sumitomo Mitsui Financial Group Inc. | | 2.632% | 7/14/26 | | 4,500 | | 4,502 | |
| Sumitomo Mitsui Financial Group Inc. | | 3.040% | 7/16/29 | | 13,550 | | 13,823 | |
| Svenska Handelsbanken AB | | 3.900% | 11/20/23 | | 12,150 | | 12,984 | |
| Toronto-Dominion Bank | | 3.500% | 7/19/23 | | 32,065 | | 33,796 | |
| Toronto-Dominion Bank | | 2.650% | 6/12/24 | | 1,875 | | 1,908 | |
9 | UBS Group Funding Jersey Ltd. | | 3.000% | 4/15/21 | | 5,470 | | 5,533 | |
9 | UBS Group Funding Jersey Ltd. | | 2.650% | 2/1/22 | | 24,139 | | 24,335 | |
9 | UBS Group Funding Switzerland AG | | 3.491% | 5/23/23 | | 3,535 | | 3,632 | |
6,9 | UBS Group Funding Switzerland AG | | 2.859% | 8/15/23 | | 26,640 | | 26,928 | |
9 | UBS Group Funding Switzerland AG | | 4.125% | 9/24/25 | | 10,925 | | 11,788 | |
| US Bancorp | | 2.350% | 1/29/21 | | 750 | | 753 | |
| US Bancorp | | 3.700% | 1/30/24 | | 1,735 | | 1,849 | |
| US Bancorp | | 3.375% | 2/5/24 | | 5,650 | | 5,943 | |
| US Bancorp | | 3.950% | 11/17/25 | | 14,450 | | 15,888 | |
| US Bancorp | | 3.000% | 7/30/29 | | 3,000 | | 3,092 | |
| Wells Fargo & Co. | | 3.000% | 1/22/21 | | 2,240 | | 2,265 | |
| Wells Fargo & Co. | | 2.625% | 7/22/22 | | 19,780 | | 19,989 | |
| Wells Fargo & Co. | | 3.450% | 2/13/23 | | 8,300 | | 8,561 | |
| Wells Fargo & Co. | | 3.300% | 9/9/24 | | 8,943 | | 9,335 | |
| Wells Fargo & Co. | | 3.000% | 2/19/25 | | 8,170 | | 8,384 | |
| Wells Fargo & Co. | | 3.000% | 10/23/26 | | 7,620 | | 7,821 | |
6 | Wells Fargo & Co. | | 3.196% | 6/17/27 | | 18,850 | | 19,475 | |
| Wells Fargo & Co. | | 4.150% | 1/24/29 | | 30,575 | | 33,830 | |
| Wells Fargo Bank NA | | 3.550% | 8/14/23 | | 39,805 | | 41,790 | |
| Westpac Banking Corp. | | 2.100% | 5/13/21 | | 4,820 | | 4,822 | |
| Westpac Banking Corp. | | 2.000% | 8/19/21 | | 7,665 | | 7,658 | |
| Westpac Banking Corp. | | 2.750% | 1/11/23 | | 21,690 | | 22,144 | |
| Westpac Banking Corp. | | 3.350% | 3/8/27 | | 18,935 | | 20,202 | |
| | | | | | | | | |
| Brokerage (0.4%) | | | | | | | | |
| Ameriprise Financial Inc. | | 3.000% | 3/22/22 | | 1,875 | | 1,909 | |
9 | Apollo Management Holdings LP | | 4.872% | 2/15/29 | | 2,000 | | 2,233 | |
| BlackRock Inc. | | 3.200% | 3/15/27 | | 1,545 | | 1,634 | |
| BlackRock Inc. | | 3.250% | 4/30/29 | | 7,750 | | 8,276 | |
| Charles Schwab Corp. | | 3.850% | 5/21/25 | | 17,155 | | 18,489 | |
61
Institutional Intermediate-Term Bond Fund
| | | | | | Face | | Market | |
| | | | Maturity | | Amount | | Value· | |
| | | Coupon | Date | | ($000 | ) | ($000 | ) |
| Charles Schwab Corp. | | 4.000% | 2/1/29 | | 15,980 | | 17,740 | |
| Invesco Finance plc | | 3.125% | 11/30/22 | | 5,203 | | 5,328 | |
| Invesco Finance plc | | 4.000% | 1/30/24 | | 4,000 | | 4,242 | |
| Invesco Finance plc | | 3.750% | 1/15/26 | | 3,427 | | 3,639 | |
| TD Ameritrade Holding Corp. | | 2.950% | 4/1/22 | | 10,571 | | 10,794 | |
| TD Ameritrade Holding Corp. | | 3.625% | 4/1/25 | | 3,670 | | 3,881 | |
| TD Ameritrade Holding Corp. | | 2.750% | 10/1/29 | | 3,330 | | 3,343 | |
| | | | | | | | | |
| Insurance (0.8%) | | | | | | | | |
9 | AIA Group Ltd. | | 3.600% | 4/9/29 | | 12,000 | | 12,806 | |
9 | AIG Global Funding | | 2.700% | 12/15/21 | | 2,625 | | 2,645 | |
| Berkshire Hathaway Inc. | | 2.750% | 3/15/23 | | 17,376 | | 17,792 | |
| Berkshire Hathaway Inc. | | 3.125% | 3/15/26 | | 3,877 | | 4,086 | |
| Chubb INA Holdings Inc. | | 2.700% | 3/13/23 | | 2,940 | | 2,993 | |
| Chubb INA Holdings Inc. | | 3.350% | 5/15/24 | | 4,390 | | 4,622 | |
| Chubb INA Holdings Inc. | | 3.150% | 3/15/25 | | 1,545 | | 1,620 | |
| Chubb INA Holdings Inc. | | 3.350% | 5/3/26 | | 7,770 | | 8,268 | |
9 | Jackson National Life Global Funding | | 3.300% | 2/1/22 | | 1,625 | | 1,666 | |
| Manulife Financial Corp. | | 4.900% | 9/17/20 | | 7,455 | | 7,643 | |
| Marsh & McLennan Cos. Inc. | | 4.800% | 7/15/21 | | 5,500 | | 5,712 | |
| Marsh & McLennan Cos. Inc. | | 3.500% | 6/3/24 | | 2,370 | | 2,497 | |
| Marsh & McLennan Cos. Inc. | | 3.500% | 3/10/25 | | 10,130 | | 10,699 | |
9 | MassMutual Global Funding II | | 2.500% | 10/17/22 | | 950 | | 960 | |
9 | MassMutual Global Funding II | | 2.750% | 6/22/24 | | 14,920 | | 15,260 | |
9 | MassMutual Global Funding II | | 2.950% | 1/11/25 | | 2,500 | | 2,577 | |
9 | Metropolitan Life Global Funding I | | 3.600% | 1/11/24 | | 7,390 | | 7,803 | |
9 | Metropolitan Life Global Funding I | | 3.450% | 12/18/26 | | 4,660 | | 5,007 | |
9 | Pricoa Global Funding I | | 2.550% | 11/24/20 | | 2,435 | | 2,447 | |
9 | Swiss Re Treasury US Corp. | | 2.875% | 12/6/22 | | 7,330 | | 7,463 | |
| UnitedHealth Group Inc. | | 2.875% | 3/15/23 | | 3,000 | | 3,072 | |
| UnitedHealth Group Inc. | | 3.500% | 6/15/23 | | 4,500 | | 4,721 | |
| UnitedHealth Group Inc. | | 3.500% | 2/15/24 | | 970 | | 1,021 | |
| UnitedHealth Group Inc. | | 3.750% | 7/15/25 | | 5,915 | | 6,365 | |
| UnitedHealth Group Inc. | | 3.450% | 1/15/27 | | 2,115 | | 2,247 | |
| UnitedHealth Group Inc. | | 2.950% | 10/15/27 | | 10,000 | | 10,324 | |
| UnitedHealth Group Inc. | | 3.875% | 12/15/28 | | 3,290 | | 3,612 | |
| UnitedHealth Group Inc. | | 2.875% | 8/15/29 | | 16,966 | | 17,276 | |
| | | | | | | | | |
| Real Estate Investment Trusts (0.5%) | | | | | | | | |
| AvalonBay Communities Inc. | | 3.350% | 5/15/27 | | 2,960 | | 3,131 | |
| AvalonBay Communities Inc. | | 3.200% | 1/15/28 | | 2,250 | | 2,355 | |
| Camden Property Trust | | 4.875% | 6/15/23 | | 5,935 | | 6,455 | |
| Camden Property Trust | | 4.250% | 1/15/24 | | 1,738 | | 1,867 | |
| Camden Property Trust | | 3.500% | 9/15/24 | | 435 | | 457 | |
| Camden Property Trust | | 4.100% | 10/15/28 | | 7,380 | | 8,214 | |
| ERP Operating LP | | 4.150% | 12/1/28 | | 7,345 | | 8,209 | |
| ERP Operating LP | | 2.500% | 2/15/30 | | 1,500 | | 1,475 | |
| Federal Realty Investment Trust | | 3.000% | 8/1/22 | | 9,455 | | 9,641 | |
| Federal Realty Investment Trust | | 2.750% | 6/1/23 | | 5,330 | | 5,424 | |
| Federal Realty Investment Trust | | 3.250% | 7/15/27 | | 6,335 | | 6,593 | |
| Public Storage | | 3.385% | 5/1/29 | | 8,880 | | 9,539 | |
9 | Scentre Group Trust 1 / Scentre Group Trust 2 | | 3.750% | 3/23/27 | | 6,810 | | 7,176 | |
| Simon Property Group LP | | 4.375% | 3/1/21 | | 4,750 | | 4,881 | |
| Simon Property Group LP | | 4.125% | 12/1/21 | | 3,000 | | 3,116 | |
| Simon Property Group LP | | 3.750% | 2/1/24 | | 1,000 | | 1,059 | |
62
Institutional Intermediate-Term Bond Fund
| | | | | | Face | | Market | |
| | | | Maturity | | Amount | | Value· | |
| | | Coupon | Date | | ($000 | ) | ($000 | ) |
| Simon Property Group LP | | 3.500% | 9/1/25 | | 1,003 | | 1,061 | |
| Simon Property Group LP | | 3.300% | 1/15/26 | | 5,080 | | 5,320 | |
| Simon Property Group LP | | 3.375% | 6/15/27 | | 5,500 | | 5,810 | |
| Simon Property Group LP | | 3.375% | 12/1/27 | | 6,775 | | 7,167 | |
| Simon Property Group LP | | 2.450% | 9/13/29 | | 3,300 | | 3,216 | |
| | | | | | | | 2,660,300 | |
Industrial (7.0%) | | | | | | | | |
| Basic Industry (0.3%) | | | | | | | | |
9 | Air Liquide Finance SA | | 1.750% | 9/27/21 | | 18,481 | | 18,345 | |
9 | Air Liquide Finance SA | | 2.250% | 9/27/23 | | 14,180 | | 14,203 | |
| Airgas Inc. | | 2.900% | 11/15/22 | | 2,575 | | 2,619 | |
9 | Chevron Phillips Chemical Co. LLC / Chevron Phillips Chemical Co. LP | | 3.400% | 12/1/26 | | 9,090 | | 9,566 | |
9 | Chevron Phillips Chemical Co. LLC / Chevron Phillips Chemical Co. LP | | 3.700% | 6/1/28 | | 15,515 | | 16,524 | |
| | | | | | | | | |
| Capital Goods (1.0%) | | | | | | | | |
| 3M Co. | | 2.000% | 2/14/25 | | 32,235 | | 32,040 | |
| Boeing Co. | | 2.600% | 10/30/25 | | 3,000 | | 3,044 | |
| Boeing Co. | | 3.100% | 5/1/26 | | 13,500 | | 14,145 | |
| Boeing Co. | | 2.250% | 6/15/26 | | 9,200 | | 9,128 | |
| Boeing Co. | | 2.800% | 3/1/27 | | 2,285 | | 2,333 | |
| Boeing Co. | | 3.250% | 3/1/28 | | 815 | | 857 | |
| Boeing Co. | | 3.200% | 3/1/29 | | 2,416 | | 2,538 | |
| Caterpillar Financial Services Corp. | | 2.850% | 6/1/22 | | 7,100 | | 7,247 | |
| Caterpillar Financial Services Corp. | | 2.400% | 6/6/22 | | 13,610 | | 13,747 | |
| Caterpillar Financial Services Corp. | | 3.750% | 11/24/23 | | 6,005 | | 6,402 | |
| Caterpillar Inc. | | 3.900% | 5/27/21 | | 1,613 | | 1,662 | |
| Caterpillar Inc. | | 2.600% | 6/26/22 | | 1,755 | | 1,785 | |
| Caterpillar Inc. | | 2.600% | 9/19/29 | | 12,000 | | 12,101 | |
| Deere & Co. | | 2.600% | 6/8/22 | | 5,825 | | 5,933 | |
| General Dynamics Corp. | | 3.000% | 5/11/21 | | 2,000 | | 2,034 | |
| General Dynamics Corp. | | 2.625% | 11/15/27 | | 28,665 | | 29,363 | |
| Illinois Tool Works Inc. | | 2.650% | 11/15/26 | | 12,675 | | 13,087 | |
| John Deere Capital Corp. | | 2.750% | 3/15/22 | | 5,830 | | 5,941 | |
| John Deere Capital Corp. | | 2.950% | 4/1/22 | | 2,675 | | 2,738 | |
| John Deere Capital Corp. | | 2.650% | 6/24/24 | | 10,000 | | 10,225 | |
| John Deere Capital Corp. | | 2.250% | 9/14/26 | | 8,040 | | 8,011 | |
| Parker-Hannifin Corp. | | 3.500% | 9/15/22 | | 1,885 | | 1,956 | |
| Parker-Hannifin Corp. | | 2.700% | 6/14/24 | | 1,800 | | 1,834 | |
| Precision Castparts Corp. | | 2.500% | 1/15/23 | | 15,000 | | 15,259 | |
9 | Siemens Financieringsmaatschappij NV | | 2.700% | 3/16/22 | | 12,300 | | 12,458 | |
| | | | | | | | | |
| Communication (0.8%) | | | | | | | | |
| America Movil SAB de CV | | 5.000% | 3/30/20 | | 2,246 | | 2,274 | |
| America Movil SAB de CV | | 3.125% | 7/16/22 | | 1,160 | | 1,189 | |
| Comcast Cable Communications Holdings Inc. | | 9.455% | 11/15/22 | | 1,700 | | 2,082 | |
| Comcast Corp. | | 3.125% | 7/15/22 | | 2,905 | | 3,001 | |
| Comcast Corp. | | 3.600% | 3/1/24 | | 9,390 | | 9,974 | |
| Comcast Corp. | | 3.375% | 2/15/25 | | 29,805 | | 31,395 | |
| Comcast Corp. | | 3.375% | 8/15/25 | | 23,444 | | 24,758 | |
| Comcast Corp. | | 4.150% | 10/15/28 | | 24,375 | | 27,249 | |
| NBCUniversal Media LLC | | 2.875% | 1/15/23 | | 27,000 | | 27,753 | |
| S&P Global Inc. | | 4.400% | 2/15/26 | | 5,000 | | 5,573 | |
63
Institutional Intermediate-Term Bond Fund
| | | | | | Face | | Market | |
| | | | Maturity | | Amount | | Value· | |
| | | Coupon | Date | | ($000 | ) | ($000 | ) |
| Walt Disney Co. | | 1.750% | 8/30/24 | | 20,120 | | 19,899 | |
9 | Walt Disney Co. | | 3.375% | 11/15/26 | | 10,000 | | 10,706 | |
| | | | | | | | | |
| Consumer Cyclical (0.7%) | | | | | | | | |
| American Honda Finance Corp. | | 2.150% | 9/10/24 | | 15,000 | | 14,905 | |
9 | BMW US Capital LLC | | 3.400% | 8/13/21 | | 14,100 | | 14,429 | |
| Costco Wholesale Corp. | | 2.750% | 5/18/24 | | 3,380 | | 3,497 | |
| Costco Wholesale Corp. | | 3.000% | 5/18/27 | | 4,225 | | 4,470 | |
| Home Depot Inc. | | 3.900% | 12/6/28 | | 10,000 | | 11,240 | |
| Home Depot Inc. | | 2.950% | 6/15/29 | | 7,000 | | 7,314 | |
| Mastercard Inc. | | 2.950% | 11/21/26 | | 6,000 | | 6,303 | |
| Mastercard Inc. | | 2.950% | 6/1/29 | | 11,000 | | 11,521 | |
9 | Nissan Motor Acceptance Corp. | | 2.550% | 3/8/21 | | 6,215 | | 6,221 | |
9 | Nissan Motor Acceptance Corp. | | 2.600% | 9/28/22 | | 2,825 | | 2,834 | |
| Target Corp. | | 3.375% | 4/15/29 | | 4,500 | | 4,839 | |
| TJX Cos. Inc. | | 2.500% | 5/15/23 | | 1,100 | | 1,118 | |
| TJX Cos. Inc. | | 2.250% | 9/15/26 | | 7,870 | | 7,843 | |
| Toyota Motor Credit Corp. | | 3.650% | 1/8/29 | | 20,000 | | 22,138 | |
| Visa Inc. | | 3.150% | 12/14/25 | | 29,040 | | 30,960 | |
| Walmart Inc. | | 2.350% | 12/15/22 | | 1,165 | | 1,182 | |
| Walmart Inc. | | 3.400% | 6/26/23 | | 3,000 | | 3,153 | |
| Walmart Inc. | | 2.850% | 7/8/24 | | 2,800 | | 2,910 | |
| | | | | | | | | |
| Consumer Noncyclical (1.4%) | | | | | | | | |
9 | Bristol-Myers Squibb Co. | | 2.900% | 7/26/24 | | 3,500 | | 3,608 | |
9 | Bristol-Myers Squibb Co. | | 3.200% | 6/15/26 | | 26,790 | | 28,042 | |
9 | Bristol-Myers Squibb Co. | | 3.400% | 7/26/29 | | 26,395 | | 28,214 | |
| Brown-Forman Corp. | | 2.250% | 1/15/23 | | 5,000 | | 5,003 | |
| Coca-Cola Co. | | 1.750% | 9/6/24 | | 8,000 | | 7,917 | |
| Coca-Cola Femsa SAB de CV | | 3.875% | 11/26/23 | | 1,500 | | 1,591 | |
| Eli Lilly & Co. | | 2.750% | 6/1/25 | | 8,000 | | 8,242 | |
| Eli Lilly & Co. | | 3.375% | 3/15/29 | | 1,500 | | 1,625 | |
| Gilead Sciences Inc. | | 2.500% | 9/1/23 | | 1,600 | | 1,621 | |
| Gilead Sciences Inc. | | 3.700% | 4/1/24 | | 17,810 | | 18,846 | |
| Gilead Sciences Inc. | | 3.500% | 2/1/25 | | 19,025 | | 20,096 | |
| Gilead Sciences Inc. | | 3.650% | 3/1/26 | | 7,600 | | 8,127 | |
| GlaxoSmithKline Capital plc | | 3.000% | 6/1/24 | | 12,000 | | 12,409 | |
| GlaxoSmithKline Capital plc | | 3.375% | 6/1/29 | | 10,000 | | 10,709 | |
| Kaiser Foundation Hospitals | | 3.500% | 4/1/22 | | 1,235 | | 1,286 | |
| Kaiser Foundation Hospitals | | 3.150% | 5/1/27 | | 965 | | 1,016 | |
| Kimberly-Clark Corp. | | 3.625% | 8/1/20 | | 700 | | 710 | |
| Medtronic Inc. | | 3.500% | 3/15/25 | | 25,808 | | 27,643 | |
| Merck & Co. Inc. | | 3.400% | 3/7/29 | | 20,000 | | 21,648 | |
| Mercy Health | | 4.302% | 7/1/28 | | 7,000 | | 7,887 | |
| Pfizer Inc. | | 3.450% | 3/15/29 | | 5,000 | | 5,414 | |
| Philip Morris International Inc. | | 3.125% | 8/17/27 | | 5,000 | | 5,167 | |
| Providence St. Joseph Health Obligated Group | | 2.746% | 10/1/26 | | 300 | | 304 | |
| Providence St. Joseph Health Obligated Group | | 2.532% | 10/1/29 | | 5,000 | | 4,982 | |
9 | Reckitt Benckiser Treasury Services plc | | 2.375% | 6/24/22 | | 1,150 | | 1,155 | |
9 | Reckitt Benckiser Treasury Services plc | | 2.750% | 6/26/24 | | 5,000 | | 5,085 | |
9 | Reckitt Benckiser Treasury Services plc | | 3.000% | 6/26/27 | | 25,000 | | 25,619 | |
9 | Roche Holdings Inc. | | 3.350% | 9/30/24 | | 13,264 | | 14,061 | |
| Sanofi | | 4.000% | 3/29/21 | | 7,000 | | 7,209 | |
| SSM Health Care Corp. | | 3.688% | 6/1/23 | | 13,650 | | 14,360 | |
| Unilever Capital Corp. | | 2.125% | 9/6/29 | | 9,500 | | 9,309 | |
64
Institutional Intermediate-Term Bond Fund
| | | | | | Face | | Market | |
| | | | Maturity | | Amount | | Value· | |
| | | Coupon | Date | | ($000 | ) | ($000 | ) |
| Energy (1.2%) | | | | | | | | |
| Baker Hughes a GE Co. LLC / Baker Hughes Co-Obligor Inc. | | 3.337% | 12/15/27 | | 8,875 | | 9,089 | |
| BP Capital Markets America Inc. | | 4.500% | 10/1/20 | | 3,575 | | 3,660 | |
| BP Capital Markets America Inc. | | 4.742% | 3/11/21 | | 915 | | 950 | |
| BP Capital Markets America Inc. | | 3.245% | 5/6/22 | | 10,875 | | 11,194 | |
| BP Capital Markets America Inc. | | 2.750% | 5/10/23 | | 10,080 | | 10,306 | |
| BP Capital Markets America Inc. | | 3.790% | 2/6/24 | | 5,950 | | 6,329 | |
| BP Capital Markets America Inc. | | 3.224% | 4/14/24 | | 8,400 | | 8,731 | |
| BP Capital Markets America Inc. | | 3.796% | 9/21/25 | | 8,000 | | 8,642 | |
| BP Capital Markets America Inc. | | 3.119% | 5/4/26 | | 19,465 | | 20,265 | |
| BP Capital Markets plc | | 3.561% | 11/1/21 | | 2,387 | | 2,456 | |
| BP Capital Markets plc | | 3.062% | 3/17/22 | | 4,000 | | 4,091 | |
| BP Capital Markets plc | | 2.500% | 11/6/22 | | 1,440 | | 1,458 | |
| BP Capital Markets plc | | 3.994% | 9/26/23 | | 1,000 | | 1,068 | |
| BP Capital Markets plc | | 3.814% | 2/10/24 | | 35,250 | | 37,490 | |
| BP Capital Markets plc | | 3.535% | 11/4/24 | | 8,740 | | 9,272 | |
| BP Capital Markets plc | | 3.506% | 3/17/25 | | 8,000 | | 8,475 | |
| ConocoPhillips Co. | | 4.950% | 3/15/26 | | 17,605 | | 20,293 | |
| EOG Resources Inc. | | 3.150% | 4/1/25 | | 10,555 | | 11,068 | |
| Exxon Mobil Corp. | | 2.275% | 8/16/26 | | 10,000 | | 10,077 | |
| Shell International Finance BV | | 4.375% | 3/25/20 | | 2,050 | | 2,073 | |
| Shell International Finance BV | | 2.250% | 11/10/20 | | 750 | | 753 | |
| Shell International Finance BV | | 1.875% | 5/10/21 | | 825 | | 825 | |
| Shell International Finance BV | | 3.250% | 5/11/25 | | 23,255 | | 24,646 | |
| Shell International Finance BV | | 2.875% | 5/10/26 | | 7,445 | | 7,728 | |
| Total Capital Canada Ltd. | | 2.750% | 7/15/23 | | 3,699 | | 3,801 | |
| Total Capital International SA | | 2.875% | 2/17/22 | | 4,500 | | 4,601 | |
| Total Capital International SA | | 3.700% | 1/15/24 | | 5,830 | | 6,219 | |
| Total Capital International SA | | 2.434% | 1/10/25 | | 10,000 | | 10,128 | |
| Total Capital International SA | | 3.455% | 2/19/29 | | 5,000 | | 5,399 | |
| Total Capital International SA | | 2.829% | 1/10/30 | | 5,000 | | 5,130 | |
| Total Capital SA | | 4.125% | 1/28/21 | | 895 | | 920 | |
| | | | | | | | | |
| Technology (1.4%) | | | | | | | | |
| Apple Inc. | | 3.000% | 2/9/24 | | 11,675 | | 12,152 | |
| Apple Inc. | | 3.450% | 5/6/24 | | 6,000 | | 6,386 | |
| Apple Inc. | | 2.850% | 5/11/24 | | 9,045 | | 9,386 | |
| Apple Inc. | | 2.750% | 1/13/25 | | 10,240 | | 10,569 | |
| Apple Inc. | | 2.500% | 2/9/25 | | 3,430 | | 3,510 | |
| Apple Inc. | | 3.250% | 2/23/26 | | 13,092 | | 13,873 | |
| Apple Inc. | | 2.450% | 8/4/26 | | 7,245 | | 7,333 | |
| Apple Inc. | | 3.350% | 2/9/27 | | 8,158 | | 8,711 | |
| Apple Inc. | | 2.900% | 9/12/27 | | 5,825 | | 6,058 | |
| Intel Corp. | | 3.700% | 7/29/25 | | 10,000 | | 10,827 | |
| International Business Machines Corp. | | 3.450% | 2/19/26 | | 2,500 | | 2,651 | |
| International Business Machines Corp. | | 3.300% | 5/15/26 | | 45,085 | | 47,508 | |
| International Business Machines Corp. | | 3.500% | 5/15/29 | | 18,985 | | 20,393 | |
| Microsoft Corp. | | 2.875% | 2/6/24 | | 19,090 | | 19,918 | |
| Microsoft Corp. | | 2.700% | 2/12/25 | | 1,175 | | 1,218 | |
| Microsoft Corp. | | 3.125% | 11/3/25 | | 3,365 | | 3,574 | |
| Microsoft Corp. | | 2.400% | 8/8/26 | | 15,595 | | 15,876 | |
| Oracle Corp. | | 2.500% | 5/15/22 | | 9,010 | | 9,112 | |
| Oracle Corp. | | 2.400% | 9/15/23 | | 750 | | 759 | |
| Oracle Corp. | | 3.400% | 7/8/24 | | 10,000 | | 10,554 | |
65
Institutional Intermediate-Term Bond Fund
| | | | | | Face | | Market | |
| | | | Maturity | | Amount | | Value· | |
| | | Coupon | Date | | ($000 | ) | ($000 | ) |
| Oracle Corp. | | 2.950% | 11/15/24 | | 21,704 | | 22,531 | |
| Oracle Corp. | | 2.950% | 5/15/25 | | 5,140 | | 5,328 | |
| Oracle Corp. | | 2.650% | 7/15/26 | | 5,115 | | 5,209 | |
| Oracle Corp. | | 3.250% | 11/15/27 | | 14,885 | | 15,717 | |
| QUALCOMM Inc. | | 2.600% | 1/30/23 | | 4,815 | | 4,899 | |
| QUALCOMM Inc. | | 2.900% | 5/20/24 | | 27,920 | | 28,685 | |
| QUALCOMM Inc. | | 3.450% | 5/20/25 | | 5,000 | | 5,283 | |
| QUALCOMM Inc. | | 3.250% | 5/20/27 | | 4,750 | | 4,951 | |
| | | | | | | | | |
| Transportation (0.2%) | | | | | | | | |
6 | Continental Airlines 2012-2 Class A Pass Through Trust | | 4.000% | 4/29/26 | | 405 | | 426 | |
6 | CSX Transportation Inc. | | 6.251% | 1/15/23 | | 1,080 | | 1,190 | |
6 | Delta Air Lines 2007-1 Class A Pass Through Trust | | 6.821% | 2/10/24 | | 4,361 | | 4,804 | |
6 | Northwest Airlines 2007-1 Class A Pass Through Trust | | 7.027% | 5/1/21 | | 3,116 | | 3,126 | |
6 | Southwest Airlines Co. 2007-1 Pass Through Trust | | 6.150% | 2/1/24 | | 2,612 | | 2,757 | |
6 | Spirit Airlines Class A Pass Through Certificates Series 2015-1 | | 4.100% | 10/1/29 | | 16,712 | | 17,615 | |
6 | Spirit Airlines Pass Through Trust 2017-1A | | 3.650% | 2/15/30 | | 14,170 | | 14,604 | |
6 | United Airlines 2013-1 Class A Pass Through Trust | | 4.300% | 2/15/27 | | 1,155 | | 1,214 | |
| United Parcel Service Inc. | | 2.800% | 11/15/24 | | 5,000 | | 5,142 | |
| United Parcel Service Inc. | | 3.400% | 3/15/29 | | 5,000 | | 5,335 | |
| | | | | | | | 1,535,081 | |
Utilities (1.0%) | | | | | | | | |
| Electric (1.0%) | | | | | | | | |
| AEP Transmission Co. LLC | | 3.100% | 12/1/26 | | 1,735 | | 1,806 | |
| Ameren Illinois Co. | | 2.700% | 9/1/22 | | 2,047 | | 2,081 | |
| Arizona Public Service Co. | | 2.200% | 1/15/20 | | 5,568 | | 5,561 | |
| Arizona Public Service Co. | | 2.600% | 8/15/29 | | 5,575 | | 5,573 | |
| Baltimore Gas & Electric Co. | | 2.800% | 8/15/22 | | 950 | | 965 | |
| Berkshire Hathaway Energy Co. | | 2.800% | 1/15/23 | | 4,455 | | 4,551 | |
| Berkshire Hathaway Energy Co. | | 3.750% | 11/15/23 | | 16,200 | | 17,108 | |
| Berkshire Hathaway Energy Co. | | 3.250% | 4/15/28 | | 8,975 | | 9,461 | |
| CenterPoint Energy Houston Electric LLC | | 2.250% | 8/1/22 | | 1,460 | | 1,466 | |
| Commonwealth Edison Co. | | 3.400% | 9/1/21 | | 9,800 | | 10,008 | |
| Commonwealth Edison Co. | | 2.550% | 6/15/26 | | 880 | | 892 | |
| Connecticut Light & Power Co. | | 3.200% | 3/15/27 | | 5,480 | | 5,797 | |
| DTE Electric Co. | | 2.650% | 6/15/22 | | 10,112 | | 10,239 | |
| Duke Energy Carolinas LLC | | 2.450% | 8/15/29 | | 7,430 | | 7,441 | |
| Duke Energy Florida LLC | | 4.550% | 4/1/20 | | 1,375 | | 1,389 | |
| Duke Energy Florida LLC | | 3.800% | 7/15/28 | | 4,415 | | 4,853 | |
| Entergy Arkansas Inc. | | 3.700% | 6/1/24 | | 6,213 | | 6,619 | |
| Entergy Arkansas Inc. | | 3.500% | 4/1/26 | | 10,288 | | 10,927 | |
| Entergy Louisiana LLC | | 3.300% | 12/1/22 | | 1,450 | | 1,505 | |
| Entergy Louisiana LLC | | 2.400% | 10/1/26 | | 5,560 | | 5,530 | |
| Entergy Louisiana LLC | | 3.120% | 9/1/27 | | 9,585 | | 9,986 | |
| Georgia Power Co. | | 2.400% | 4/1/21 | | 9,510 | | 9,538 | |
| Georgia Power Co. | | 2.850% | 5/15/22 | | 1,820 | | 1,849 | |
| National Rural Utilities Cooperative Finance Corp. | | 2.700% | 2/15/23 | | 3,375 | | 3,437 | |
66
Institutional Intermediate-Term Bond Fund
| | | | | | Face | | Market | |
| | | | Maturity | | Amount | | Value· | |
| | | Coupon | Date | | ($000 | ) | ($000 | ) |
| National Rural Utilities Cooperative Finance Corp. | | 2.950% | 2/7/24 | | 3,975 | | 4,097 | |
| National Rural Utilities Cooperative Finance Corp. | | 2.850% | 1/27/25 | | 330 | | 340 | |
| National Rural Utilities Cooperative Finance Corp. | | 3.400% | 2/7/28 | | 7,355 | | 7,894 | |
| National Rural Utilities Cooperative Finance Corp. | | 3.700% | 3/15/29 | | 12,935 | | 14,254 | |
| Oncor Electric Delivery Co. LLC | | 2.950% | 4/1/25 | | 3,080 | | 3,198 | |
| PacifiCorp | | 3.500% | 6/15/29 | | 9,515 | | 10,353 | |
| Public Service Electric & Gas Co. | | 3.000% | 5/15/27 | | 3,430 | | 3,570 | |
| Southwestern Public Service Co. | | 3.300% | 6/15/24 | | 14,881 | | 15,495 | |
| Union Electric Co. | | 2.950% | 6/15/27 | | 1,177 | | 1,209 | |
| Virginia Electric & Power Co. | | 2.950% | 1/15/22 | | 8,540 | | 8,670 | |
| Virginia Electric & Power Co. | | 2.750% | 3/15/23 | | 2,515 | | 2,563 | |
| Virginia Electric & Power Co. | | 3.450% | 2/15/24 | | 1,730 | | 1,802 | |
| Virginia Electric & Power Co. | | 3.100% | 5/15/25 | | 1,510 | | 1,571 | |
| Virginia Electric & Power Co. | | 3.150% | 1/15/26 | | 5,700 | | 5,947 | |
| | | | | | | | | |
Natural Gas (0.0%) | | | | | | | | |
| Atmos Energy Corp. | | 2.625% | 9/15/29 | | 2,400 | | 2,428 | |
| | | | | | | | 221,973 | |
Total Corporate Bonds (Cost $4,248,649) | | | | | | | 4,417,354 | |
Sovereign Bonds (6.4%) | | | | | | | | |
9 | Avi Funding Co. Ltd. | | 2.850% | 9/16/20 | | 10,950 | | 11,005 | |
9 | Banco del Estado de Chile | | 2.668% | 1/8/21 | | 1,175 | | 1,176 | |
9 | Bermuda | | 4.138% | 1/3/23 | | 2,700 | | 2,855 | |
| Bermuda | | 4.138% | 1/3/23 | | 1,150 | | 1,205 | |
9 | Bermuda | | 4.854% | 2/6/24 | | 3,206 | | 3,520 | |
| Bermuda | | 4.854% | 2/6/24 | | 6,751 | | 7,392 | |
9 | BNG Bank NV | | 2.500% | 2/28/20 | | 30,000 | | 30,038 | |
9 | BNG Bank NV | | 2.125% | 12/14/20 | | 13,001 | | 13,036 | |
9 | CDP Financial Inc. | | 4.400% | 11/25/19 | | 30,475 | | 30,569 | |
| CDP Financial Inc. | | 4.400% | 11/25/19 | | 12,455 | | 12,494 | |
9 | CDP Financial Inc. | | 3.150% | 7/24/24 | | 1,519 | | 1,601 | |
| CNOOC Finance 2015 Australia Pty Ltd. | | 2.625% | 5/5/20 | | 2,294 | | 2,297 | |
| CNOOC Finance 2015 USA LLC | | 3.750% | 5/2/23 | | 30,069 | | 31,322 | |
| CNOOC Finance 2015 USA LLC | | 3.500% | 5/5/25 | | 1,295 | | 1,352 | |
| CNOOC Nexen Finance 2014 ULC | | 4.250% | 4/30/24 | | 23,593 | | 25,280 | |
9 | CNPC General Capital Ltd. | | 3.400% | 4/16/23 | | 1,000 | | 1,027 | |
| Corp. Andina de Fomento | | 2.200% | 7/18/20 | | 4,375 | | 4,371 | |
| Corp. Andina de Fomento | | 4.375% | 6/15/22 | | 6,291 | | 6,607 | |
9 | CPPIB Capital Inc. | | 2.250% | 1/25/22 | | 58,500 | | 59,205 | |
9,11 | Development Bank of Japan Inc. | | 3.125% | 9/6/23 | | 12,000 | | 12,533 | |
11 | Development Bank of Japan Inc. | | 2.750% | 9/16/25 | | 8,500 | | 8,872 | |
9,12 | Dexia Credit Local SA | | 1.875% | 9/15/21 | | 15,000 | | 14,988 | |
9 | Dexia Credit Local SA | | 2.375% | 9/20/22 | | 16,910 | | 17,155 | |
9 | Dexia Credit Local SA | | 3.250% | 9/26/23 | | 70,000 | | 73,593 | |
9 | Electricite de France SA | | 2.350% | 10/13/20 | | 1,825 | | 1,827 | |
9 | Emirate of Abu Dhabi | | 2.125% | 9/30/24 | | 37,000 | | 36,790 | |
| Equinor ASA | | 3.150% | 1/23/22 | | 8,000 | | 8,214 | |
| Equinor ASA | | 2.450% | 1/17/23 | | 3,350 | | 3,402 | |
| Equinor ASA | | 3.700% | 3/1/24 | | 7,000 | | 7,486 | |
67
Institutional Intermediate-Term Bond Fund
| | | | | | Face | | Market | |
| | | | Maturity | | Amount | | Value· | |
| | | Coupon | Date | | ($000 | ) | ($000 | ) |
| Export-Import Bank of Korea | | 4.000% | 1/29/21 | | 2,800 | | 2,867 | |
| Export-Import Bank of Korea | | 2.500% | 5/10/21 | | 5,000 | | 5,027 | |
| Export-Import Bank of Korea | | 1.875% | 10/21/21 | | 10,000 | | 9,941 | |
| Export-Import Bank of Korea | | 5.000% | 4/11/22 | | 7,200 | | 7,700 | |
| Export-Import Bank of Korea | | 3.000% | 11/1/22 | | 2,000 | | 2,049 | |
| Export-Import Bank of Korea | | 2.375% | 6/25/24 | | 18,000 | | 18,193 | |
| Export-Import Bank of Korea | | 3.250% | 11/10/25 | | 10,000 | | 10,593 | |
8 | Export-Import Bank of Korea, 3M USD LIBOR + 0.875% | | 3.151% | 1/25/22 | | 10,000 | | 10,100 | |
9 | Harvest Operations Corp. | | 4.200% | 6/1/23 | | 8,000 | | 8,520 | |
| Hydro-Quebec | | 8.050% | 7/7/24 | | 470 | | 596 | |
| IDB Trust Services Ltd. | | 2.393% | 4/12/22 | | 25,624 | | 25,804 | |
| Industrial & Commercial Bank of China Ltd. | | 3.231% | 11/13/19 | | 1,250 | | 1,251 | |
| International Bank for Reconstruction & Development | | 2.000% | 10/30/20 | | 5,200 | | 5,198 | |
11 | Japan Bank for International Cooperation | | 2.250% | 2/24/20 | | 29,500 | | 29,513 | |
11 | Japan Bank for International Cooperation | | 2.125% | 7/21/20 | | 11,000 | | 11,009 | |
11 | Japan Bank for International Cooperation | | 2.125% | 11/16/20 | | 27,100 | | 27,138 | |
11 | Japan Bank for International Cooperation | | 3.375% | 10/31/23 | | 10,000 | | 10,565 | |
11 | Japan Bank for International Cooperation | | 2.500% | 5/23/24 | | 20,000 | | 20,525 | |
| Kingdom of Saudi Arabia | | 2.375% | 10/26/21 | | 6,500 | | 6,511 | |
| Korea Development Bank | | 2.500% | 1/13/21 | | 6,000 | | 6,032 | |
| Korea Development Bank | | 4.625% | 11/16/21 | | 605 | | 635 | |
| Korea Development Bank | | 3.375% | 3/12/23 | | 30,000 | | 31,269 | |
| Korea Development Bank | | 2.125% | 10/1/24 | | 33,000 | | 33,092 | |
8 | Korea Development Bank, 3M USD LIBOR + 0.675% | | 2.839% | 9/19/20 | | 8,850 | | 8,871 | |
| Korea Gas Corp. | | 2.250% | 7/18/26 | | 1,375 | | 1,364 | |
| Korea Hydro & Nuclear Power Co. Ltd. | | 4.750% | 7/13/21 | | 12,634 | | 13,181 | |
9 | Ontario Teachers’ Cadillac Fairview Properties Trust | | 3.125% | 3/20/22 | | 20,096 | | 20,518 | |
9 | Ontario Teachers’ Cadillac Fairview Properties Trust | | 3.875% | 3/20/27 | | 6,600 | | 7,147 | |
9 | Ontario Teachers’ Cadillac Fairview Properties Trust | | 4.125% | 2/1/29 | | 24,580 | | 27,487 | |
| Petronas Global Sukuk Ltd. | | 2.707% | 3/18/20 | | 60,870 | | 60,957 | |
| Province of Alberta | | 1.900% | 12/6/19 | | 15,000 | | 14,994 | |
9 | Province of Alberta | | 1.750% | 8/26/20 | | 1,650 | | 1,646 | |
| Province of Manitoba | | 2.100% | 9/6/22 | | 2,100 | | 2,121 | |
| Province of Ontario | | 4.000% | 10/7/19 | | 6,025 | | 6,027 | |
| Province of Ontario | | 4.400% | 4/14/20 | | 24,595 | | 24,875 | |
| Province of Ontario | | 2.000% | 10/2/29 | | 25,000 | | 25,106 | |
| Province of Quebec | | 2.750% | 8/25/21 | | 10,150 | | 10,335 | |
| Province of Quebec | | 2.375% | 1/31/22 | | 15,700 | | 15,931 | |
| Province of Quebec | | 7.500% | 7/15/23 | | 2,065 | | 2,476 | |
| Province of Quebec | | 7.125% | 2/9/24 | | 2,674 | | 3,246 | |
| Province of Quebec | | 2.750% | 4/12/27 | | 4,730 | | 5,006 | |
6,9 | Ras Laffan Liquefied Natural Gas Co. Ltd. II | | 5.298% | 9/30/20 | | 133 | | 135 | |
| Republic of Chile | | 3.250% | 9/14/21 | | 7,150 | | 7,312 | |
| Republic of Latvia | | 2.750% | 1/12/20 | | 5,260 | | 5,260 | |
| Republic of Lithuania | | 7.375% | 2/11/20 | | 117,326 | | 119,467 | |
| Republic of Lithuania | | 6.125% | 3/9/21 | | 58,266 | | 61,532 | |
| Republic of Lithuania | | 6.625% | 2/1/22 | | 16,300 | | 17,996 | |
| Republic of Poland | | 5.125% | 4/21/21 | | 10,910 | | 11,442 | |
| Republic of Poland | | 5.000% | 3/23/22 | | 30,837 | | 33,073 | |
68
Institutional Intermediate-Term Bond Fund
| | | | | | Face | | Market | |
| | | | Maturity | | Amount | | Value· | |
| | | Coupon | Date | | ($000 | ) | ($000 | ) |
| Republic of Poland | | 4.000% | 1/22/24 | | 10,000 | | 10,825 | |
| Republic of Slovenia | | 5.500% | 10/26/22 | | 3,385 | | 3,731 | |
| Republic of Slovenia | | 5.250% | 2/18/24 | | 18,841 | | 21,358 | |
9 | SABIC Capital II BV | | 4.000% | 10/10/23 | | 17,612 | | 18,559 | |
| Sinopec Group Overseas Development 2013 Ltd. | | 4.375% | 10/17/23 | | 917 | | 984 | |
| Sinopec Group Overseas Development 2015 Ltd. | | 2.500% | 4/28/20 | | 6,000 | | 6,004 | |
9 | Sinopec Group Overseas Development 2017 Ltd. | | 2.375% | 4/12/20 | | 9,000 | | 9,002 | |
9 | Slovak Republic | | 4.375% | 5/21/22 | | 2,500 | | 2,641 | |
| State Grid Overseas Investment 2016 Ltd. | | 2.750% | 5/4/22 | | 12,340 | | 12,436 | |
| State Grid Overseas Investment 2016 Ltd. | | 3.500% | 5/4/27 | | 7,920 | | 8,364 | |
| State of Kuwait | | 2.750% | 3/20/22 | | 12,563 | | 12,734 | |
| State of Qatar | | 3.875% | 4/23/23 | | 2,501 | | 2,645 | |
| State of Qatar | | 3.375% | 3/14/24 | | 22,200 | | 23,235 | |
| State of Qatar | | 4.000% | 3/14/29 | | 10,179 | | 11,280 | |
9 | Temasek Financial I Ltd. | | 2.375% | 1/23/23 | | 2,000 | | 2,026 | |
9 | Temasek Financial I Ltd. | | 3.625% | 8/1/28 | | 20,000 | | 22,200 | |
Total Sovereign Bonds (Cost $1,361,092) | | | | | | | 1,390,869 | |
Taxable Municipal Bonds (0.0%) | | | | | | | | |
| California GO | | 6.200% | 10/1/19 | | 170 | | 170 | |
| Florida Hurricane Catastrophe Fund Finance Corp. Revenue | | 2.995% | 7/1/20 | | 2,250 | | 2,265 | |
| Regents of the University of California Revenue | | 3.063% | 7/1/25 | | 3,430 | | 3,602 | |
Total Taxable Municipal Bonds (Cost $5,892) | | | | | | | 6,037 | |
| | | | | | | | | |
| | | | | | Shares | | | |
Temporary Cash Investment (3.1%) | | | | | | | | |
Money Market Fund (3.1%) | | | | | | | | |
13 | Vanguard Market Liquidity Fund, 2.098%
(Cost $683,524) | | | | | 6,834,863 | | 683,555 | |
Total Investments (99.4%) (Cost $21,385,798) | | | | | | | 21,775,180 | |
Conventional Mortgage-Backed Securities—Liability for Sale Commitments (1.6%) | | | | | |
6,7 | UMBS TBA | | 3.000% | 7/1/49–11/1/49 | | (93,650 | ) | (94,982 | ) |
6,7 | UMBS TBA | | 3.500% | 8/1/34–11/1/49 | | (157,800 | ) | (161,862 | ) |
6,7 | UMBS TBA | | 4.500% | 7/1/49–11/1/49 | | (92,700 | ) | (97,658 | ) |
Total Conventional Mortgage-Backed Securities—Liability for Sale Commitments (Proceeds $354,425) | | | | (354,502 | ) |
Other Assets and Liabilities (2.2%) | | | | | | | | |
Other Assets | | | | | | | 3,434,164 | |
Other Liabilities | | | | | | | (2,949,130 | ) |
| | | | | | | | 485,034 | |
Net Assets (100%) | | | | | | | | |
Applicable to 934,812,230 outstanding $.001 par value shares of beneficial interest (unlimited authorization) | | | | 21,905,712 | |
Net Asset Value Per Share | | | | | | | $23.43 | |
69
Institutional Intermediate-Term Bond Fund
| | Amount | |
| | ($000 | ) |
Statement of Assets and Liabilities | | | |
Assets | | | |
Investments in Securities, at Value | | | |
Unaffiliated Issuers | | 21,091,625 | |
Affiliated Issuers | | 683,555 | |
Total Investments in Securities | | 21,775,180 | |
Investment in Vanguard | | 1,017 | |
Receivables for Investment Securities Sold | | 3,335,305 | |
Receivables for Accrued Income | | 95,975 | |
Variation Margin Receivable—Futures Contracts | | 332 | |
Variation Margin Receivable—CC Swap Contracts | | 19 | |
Unrealized Appreciation—OTC Swap Contracts | | 80 | |
Other Assets | | 1,436 | |
Total Assets | | 25,209,344 | |
Liabilities | | | |
Payables for Investment Securities Purchased | | 2,946,923 | |
Payables to Vanguard | | 1,001 | |
Liability for Sale Commitments | | 354,502 | |
Variation Margin Payable—Futures Contracts | | 828 | |
Variation Margin Payable—CC Swap Contracts | | 17 | |
Unrealized Depreciation—OTC Swap Contracts | | 342 | |
Other Liabilities | | 19 | |
Total Liabilities | | 3,303,632 | |
Net Assets | | 21,905,712 | |
70
Institutional Intermediate-Term Bond Fund
At September 30, 2019, net assets consisted of:
| | Amount | |
| | ($000 | ) |
Paid-in Capital | | 21,606,026 | |
Total Distributable Earnings (Loss) | | 299,686 | |
Net Assets | | 21,905,712 | |
· See Note A in Notes to Financial Statements.
1 Securities with a value of $9,964,000 have been segregated as initial margin for open futures contracts.
2 Securities with a value of $8,889,000 have been segregated as initial margin for open centrally cleared swap contracts.
3 Securities with a value of $1,324,000 have been segregated as collateral for certain open To Be Announced (TBA) transactions.
4 U.S. government-guaranteed.
5 The issuer was placed under federal conservatorship in September 2008; since that time, its daily operations have been managed by the Federal Housing Finance Agency and it receives capital from the U.S. Treasury, as needed to maintain a positive net worth, in exchange for senior preferred stock.
6 The average or expected maturity is shorter than the final maturity shown because of the possibility of interim principal payments and prepayments or the possibility of the issue being called.
7 Includes securities purchased on a when-issued or delayed-delivery basis for which the fund has not taken delivery as of September 30, 2019.
8 Adjustable-rate security; rate shown is effective rate at period end. Certain adjustable-rate securities are not based on a published reference rate and spread but are determined by the issuer or agent based on current market conditions.
9 Security exempt from registration under Rule 144A of the Securities Act of 1933. Such securities may be sold in transactions exempt from registration, normally to qualified institutional buyers. At September 30, 2019, the aggregate value of these securities was $2,137,230,000, representing 9.8% of net assets.
10 Security purchased on a when-issued or delayed-delivery basis for which the fund has not taken delivery as of September 30, 2019.
11 Guaranteed by the Government of Japan.
12 Guaranteed by multiple countries.
13 Affiliated money market fund available only to Vanguard funds and certain trusts and accounts managed by Vanguard. Rate shown is the 7-day yield.
CC—Centrally Cleared.
CMT—Constant Maturing Treasury Rate.
GO—General Obligation Bond.
LIBOR—London Interbank Offered Rate.
OTC—Over-the-Counter.
REMICS—Real Estate Mortgage Investment Conduits.
TBA—To Be Announced.
71
Institutional Intermediate-Term Bond Fund
Derivative Financial Instruments Outstanding as of Period End |
|
Futures Contracts |
| | | | | | | | ($000 | ) |
| | | | | | | | Value and | |
| | | | Number of | | | | Unrealized | |
| | | | Long (Short | ) | Notional | | Appreciation | |
| | Expiration | | Contracts | | Amount | | (Depreciation | ) |
Long Futures Contracts | | | | | | | | | |
2-Year U.S. Treasury Note | | December 2019 | | 10,549 | | 2,273,310 | | (340 | ) |
5-Year U.S. Treasury Note | | December 2019 | | 3,209 | | 382,347 | | 172 | |
10-Year U.S. Treasury Note | | December 2019 | | 757 | | 98,647 | | 188 | |
Ultra 10-Year U.S. Treasury Note | | December 2019 | | 221 | | 31,472 | | 25 | |
30-Year U.S. Treasury Note | | December 2019 | | 22 | | 3,571 | | — | |
| | | | | | | | 45 | |
| | | | | | | | | |
Short Futures Contracts | | | | | | | | | |
Ultra Long U.S. Treasury Bond | | December 2019 | | (66 | ) | (12,666 | ) | 92 | |
| | | | | | | | 137 | |
Over-the-Counter Credit Default Swaps |
| | | | | | | | | | | | Remaining | | | | | |
| | | | | | | | Periodic | | | | Up-Front | | | | | |
| | | | | | | | Premium | | | | Premium | | | | | |
| | | | | | Notional | | Received | | | | Received | | Unrealized | | Unrealized | |
Reference | | Termination | | | | Amount | | (Paid | )1 | Value | | (Paid | ) | Appreciation | | (Depreciation | ) |
Entity | | Date | | Counterparty | | ($000 | ) | (% | ) | ($000 | ) | ($000 | ) | ($000 | ) | ($000 | ) |
Credit Protection Sold/Moody’s Rating | | | | | | | | | | | | | |
America Movil /A3 | | 6/20/23 | | BARC | | 6,200 | | 1.000 | | (4 | ) | 84 | | 80 | | — | |
Credit Protection Purchased | | | | | | | | | | | | | | | |
State of Qatar | | 6/20/22 | | BOANA | | 4,080 | | (1.000 | ) | (84 | ) | (27 | ) | — | | (111 | ) |
State of Qatar | | 6/20/22 | | CITNA | | 7,920 | | (1.000 | ) | (163 | ) | (51 | ) | — | | (214 | ) |
Wells Fargo & Co. | | 9/20/20 | | BOANA | | 3,740 | | (1.000 | ) | (32 | ) | 15 | | — | | (17 | ) |
| | | | | | | | | | (279 | ) | (63 | ) | — | | (342 | ) |
| | | | | | | | | | (283 | ) | 21 | | 80 | | (342 | ) |
The notional amount represents the maximum potential amount the fund could be required to pay as a seller of credit protection if the reference entity was subject to a credit event.
1 Periodic premium received/paid quarterly.
BARC—Barclays Bank plc.
BOANA—Bank of America, N.A.
CITNA—Citibank N.A.
72
Institutional Intermediate-Term Bond Fund
Centrally Cleared Interest Rate Swaps |
| | | | | | Fixed | | Floating | | | | | |
| | | | | | Interest | | Interest | | | | | |
| | | | | | Rate | | Rate | | | | Unrealized | |
| | Future | | Notional | | Received | | Received | | | | Appreciation | |
| | Effective | | Amount | | (Paid | )2 | (Paid | )3 | Value | | (Depreciation | ) |
Termination Date | | Date | | ($000 | ) | (% | ) | (% | ) | ($000 | ) | ($000 | ) |
12/18/20 | | 12/18/191 | | 81,218 | | 2.500 | | (0.000 | ) | 645 | | 91 | |
12/20/21 | | 12/18/191 | | 129,198 | | (1.500 | ) | 0.000 | | 131 | | (281 | ) |
12/19/22 | | 12/18/191 | | 136,982 | | (1.500 | ) | 0.000 | | (6 | ) | (489 | ) |
12/18/23 | | 12/18/191 | | 136,278 | | (1.500 | ) | 0.000 | | (116 | ) | (695 | ) |
12/18/24 | | 12/18/191 | | 69,164 | | (1.500 | ) | 0.000 | | (77 | ) | (444 | ) |
12/18/26 | | 12/18/191 | | 52,945 | | (1.750 | ) | 0.000 | | (886 | ) | (517 | ) |
| | | | | | | | | | (309 | ) | (2,335 | ) |
1 Forward interest rate swap. In a forward interest rate swap, the fund and the counterparty agree to make periodic net payments beginning on a specified future effective date.
2 Fixed interest payment received/paid semiannually.
3 Based on 3-month London Interbank Offered Rate (LIBOR) as of the most recent payment date. Floating interest payment received/ paid quarterly.
See accompanying Notes, which are an integral part of the Financial Statements.
73
Institutional Intermediate-Term Bond Fund
Statement of Operations
| | Year Ended | |
| | September 30, 2019 | |
| | ($000 | ) |
Investment Income | | | |
Income | | | |
Interest1 | | 524,823 | |
Total Income | | 524,823 | |
Expenses | | | |
The Vanguard Group—Note B | | | |
Investment Advisory Services | | 657 | |
Management and Administrative | | 2,655 | |
Marketing and Distribution | | 201 | |
Custodian Fees | | 72 | |
Auditing Fees | | 47 | |
Trustees’ Fees and Expenses | | 7 | |
Total Expenses | | 3,639 | |
Net Investment Income | | 521,184 | |
Realized Net Gain (Loss) | | | |
Investment Securities Sold1 | | 37,143 | |
Futures Contracts | | 86,959 | |
Swap Contracts | | (22,222 | ) |
Realized Net Gain (Loss) | | 101,880 | |
Change in Unrealized Appreciation (Depreciation) | | | |
Investment Securities1 | | 725,615 | |
Futures Contracts | | 373 | |
Swap Contracts | | (3,248 | ) |
Change in Unrealized Appreciation (Depreciation) | | 722,740 | |
Net Increase (Decrease) in Net Assets Resulting from Operations | | 1,345,804 | |
1 Interest income, realized net gain (loss), and change in unrealized appreciation (depreciation) from affiliated companies of the fund were $15,193,000, ($177,000), and $24,000. Purchases and sales are for temporary cash investment purposes.
See accompanying Notes, which are an integral part of the Financial Statements.
74
Institutional Intermediate-Term Bond Fund
Statement of Changes in Net Assets
| | Year Ended September 30, | |
| | 2019 | | 2018 | |
| | ($000 | ) | ($000 | ) |
Increase (Decrease) in Net Assets | | | | | |
Operations | | | | | |
Net Investment Income | | 521,184 | | 367,515 | |
Realized Net Gain (Loss) | | 101,880 | | (153,018 | ) |
Change in Unrealized Appreciation (Depreciation) | | 722,740 | | (324,453 | ) |
Net Increase (Decrease) in Net Assets Resulting from Operations | | 1,345,804 | | (109,956 | ) |
Distributions | | | | | |
Net Investment Income | | (520,840 | ) | (367,615 | ) |
Realized Capital Gain | | — | | — | |
Total Distributions | | (520,840 | ) | (367,615 | ) |
Capital Share Transactions | | | | | |
Issued | | 4,088,563 | | 3,428,096 | |
Issued in Lieu of Cash Distributions | | 520,840 | | 367,615 | |
Redeemed | | (55,172 | ) | (897,177 | ) |
Net Increase (Decrease) from Capital Share Transactions | | 4,554,231 | | 2,898,534 | |
Total Increase (Decrease) | | 5,379,195 | | 2,420,963 | |
Net Assets | | | | | |
Beginning of Period | | 16,526,517 | | 14,105,554 | |
End of Period | | 21,905,712 | | 16,526,517 | |
See accompanying Notes, which are an integral part of the Financial Statements.
75
Institutional Intermediate-Term Bond Fund
Financial Highlights
| | | | | | | | | | June 19, | |
| | | | | | | | | | 20151 to | |
For a Share Outstanding | | Year Ended September 30, | | Sept. 30, | |
Throughout Each Period | | 2019 | | 2018 | | 2017 | | 2016 | | 2015 | |
Net Asset Value, Beginning of Period | | $22.39 | | $23.12 | | $23.79 | | $23.46 | | $23.36 | |
Investment Operations | | | | | | | | | | | |
Net Investment Income | | .6562 | | .5612 | | .4622 | | .473 | | .126 | |
Net Realized and Unrealized Gain (Loss) on Investments | | 1.034 | | (.736) | | (.470) | | .383 | | .101 | |
Total from Investment Operations | | 1.690 | | (.175) | | (.008) | | .856 | | .227 | |
Distributions | | | | | | | | | | | |
Dividends from Net Investment Income | | (.650) | | (.555) | | (.454) | | (.473) | | (.127) | |
Distributions from Realized Capital Gains | | — | | — | | (.208) | | (.053) | | — | |
Total Distributions | | (.650) | | (.555) | | (.662) | | (.526) | | (.127) | |
Net Asset Value, End of Period | | $23.43 | | $22.39 | | $23.12 | | $23.79 | | $23.46 | |
| | | | | | | | | | | |
Total Return | | 7.66% | | -0.75% | | 0.01% | | 3.70% | | 0.97% | |
| | | | | | | | | | | |
Ratios/Supplemental Data | | | | | | | | | | | |
Net Assets, End of Period (Millions) | | $21,906 | | $16,527 | | $14,106 | | $9,821 | | $8,035 | |
Ratio of Total Expenses to Average Net Assets | | 0.02% | | 0.02% | | 0.02% | | 0.02% | | 0.02%3 | |
Ratio of Net Investment Income to Average Net Assets | | 2.86% | | 2.48% | | 1.99% | | 2.02% | | 1.92%3 | |
Portfolio Turnover Rate4 | | 323% | | 182% | | 253% | | 251% | | 45% | |
1 Commencement of operations as a registered investment company.
2 Calculated based on average shares outstanding.
3 Annualized.
4 Includes 46%, 67%, 111%, 67%, and 12% attributable to mortgage-dollar-roll activity.
See accompanying Notes, which are an integral part of the Financial Statements.
76
Institutional Intermediate-Term Bond Fund
Notes to Financial Statements
Vanguard Institutional Intermediate-Term Bond Fund is registered under the Investment Company Act of 1940 as an open-end investment company, or mutual fund. The fund has been established by Vanguard as an investment vehicle for certain collective trusts and other accounts managed by Vanguard or its affiliates and qualifying education savings plans. The fund is offered to investors who meet certain administrative and service criteria and invest a minimum of $10 million. Certain of the fund’s investments are in corporate debt instruments; the issuers’ abilities to meet their obligations may be affected by economic developments in their respective industries.
A. The following significant accounting policies conform to generally accepted accounting principles for U.S. investment companies. The fund consistently follows such policies in preparing its financial statements.
1. Security Valuation: Securities are valued as of the close of trading on the New York Stock Exchange (generally 4 p.m., Eastern time) on the valuation date. Bonds and temporary cash investments are valued using the latest bid prices or using valuations based on a matrix system (which considers such factors as security prices, yields, maturities, and ratings), both as furnished by independent pricing services. Structured debt securities, including mortgages and asset-backed securities, are valued using the latest bid prices or using valuations based on a matrix system that considers such factors as issuer, tranche, nominal or option-adjusted spreads, weighted average coupon, weighted average maturity, credit enhancements, and collateral. Investments in Vanguard Market Liquidity Fund are valued at that fund’s net asset value. Securities for which market quotations are not readily available, or whose values have been affected by events occurring before the fund’s pricing time but after the close of the securities’ primary markets, are valued by methods deemed by the board of trustees to represent fair value.
2. Futures Contracts: The fund uses futures contracts to invest in fixed income asset classes with greater efficiency and lower cost than is possible through direct investment, to add value when these instruments are attractively priced, or to adjust sensitivity to changes in interest rates. The primary risks associated with the use of futures contracts are imperfect correlation between changes in market values of bonds held by the fund and the prices of futures contracts, and the possibility of an illiquid market. Counterparty risk involving futures is mitigated because a regulated clearinghouse is the counterparty instead of the clearing broker. To further mitigate counterparty risk, the fund trades futures contracts on an exchange, monitors the financial strength of its clearing brokers and clearinghouse, and has entered into clearing agreements with its clearing brokers. The clearinghouse imposes initial margin requirements to secure the fund’s performance and requires daily settlement of variation margin representing changes in the market value of each contract. Any assets pledged as initial margin for open contracts are noted in the Statement of Net Assets.
Futures contracts are valued at their quoted daily settlement prices. The notional amounts of the contracts are not recorded in the Statement of Net Assets. Fluctuations in the value of the contracts are recorded in the Statement of Assets and Liabilities as an asset (liability) and in the Statement of Operations as unrealized appreciation (depreciation) until the contracts are closed, when they are recorded as realized futures gains (losses).
During the year ended September 30, 2019, the fund’s average investments in long and short futures contracts represented 14% and less than 1% of net assets, respectively, based on the average of the notional amounts at each quarter-end during the period.
77
Institutional Intermediate-Term Bond Fund
3. Swap Contracts: The fund invests in credit default swaps to adjust the overall credit risk of the fund or to actively overweight or underweight credit risk to a specific issuer or group of issuers. The fund may sell credit protection through credit default swaps to simulate investments in long positions that are either unavailable or considered to be less attractively priced in the bond market. The fund may purchase credit protection through credit default swaps to reduce credit exposure to a given issuer or issuers. Under the terms of the swaps, an up-front payment may be exchanged between the seller and buyer. In addition, the seller of the credit protection receives a periodic payment of premium from the buyer that is a fixed percentage applied to a notional amount. If, for example, the reference entity is subject to a credit event (such as bankruptcy, failure to pay, or obligation acceleration) during the term of the swap, the seller agrees to either physically settle or cash settle the swap contract. If the swap is physically settled, the seller agrees to pay the buyer an amount equal to the notional amount and take delivery of a debt instrument of the reference issuer with a par amount equal to such notional amount. If the swap is cash settled, the seller agrees to pay the buyer the difference between the notional amount and the final price for the relevant debt instrument, as determined either in a market auction or pursuant to a pre-agreed-upon valuation procedure.
The fund enters into interest rate swap transactions to adjust the fund’s sensitivity to changes in interest rates and maintain the ability to generate income at prevailing market rates. Under the terms of the swaps, one party pays the other an amount that is a fixed percentage rate applied to a notional amount. In return, the counterparty agrees to pay a floating rate, which is reset periodically based on short-term interest rates, applied to the same notional amount.
The notional amounts of swap contracts are not recorded in the Statement of Net Assets. Swaps are valued daily based on market quotations received from independent pricing services or recognized dealers and the change in value is recorded in the Statement of Assets and Liabilities as an asset (liability) and in the Statement of Operations as unrealized appreciation (depreciation) until the seller of credit protection is required to take delivery (or, in a cash settled swap, pay the settlement amount determined) upon occurrence of a credit event, periodic payments are made, or the swap terminates, at which time realized gain (loss) is recorded. The net premium to be received or paid by the fund under swap contracts is accrued daily and recorded as realized gain (loss) over the life of the contract.
The primary risk associated with selling credit protection is that, upon the occurrence of a defined credit event, the market value of the debt instrument received by the fund (or, in a cash settled swap, the debt instruments used to determine the settlement payment by the fund) will be significantly less than the amount paid by the fund and, in a physically settled swap, the fund may receive an illiquid debt instrument. A risk associated with all types of swaps is the possibility that a counterparty may default on its obligation to pay net amounts due to the fund. The fund’s maximum amount subject to counterparty risk is the unrealized appreciation on the swap contract. The fund mitigates its counterparty risk by entering into swaps only with a diverse group of prequalified counterparties, monitoring their financial strength, entering into master netting arrangements with its counterparties, and requiring its counterparties to transfer collateral as security for their performance. In the absence of a default, the collateral pledged or received by the fund cannot be repledged, resold, or rehypothecated. In the event of a counterparty’s default (including bankruptcy), the fund may terminate any swap contracts with that counterparty, determine the net amount owed by either party in accordance with its master netting arrangements, and sell or retain any collateral held up to the net amount owed to the fund under the master netting arrangements. The swap contracts contain provisions whereby a counterparty may terminate open contracts if the fund’s net assets
78
Institutional Intermediate-Term Bond Fund
decline below a certain level, triggering a payment by the fund if the fund is in a net liability position at the time of the termination. The payment amount would be reduced by any collateral the fund has pledged. Any securities pledged as collateral for open contracts are noted in the Statement of Net Assets. The value of collateral received or pledged is compared daily to the value of the swap contracts exposure with each counterparty, and any difference, if in excess of a specified minimum transfer amount, is adjusted and settled within two business days.
The fund enters into centrally cleared interest swaps to achieve the same objectives specified with respect to the equivalent over-the-counter swaps but with less counterparty risk because a regulated clearinghouse is the counterparty instead of the clearing broker or executing broker. The clearinghouse imposes initial margin requirements to secure the fund’s performance, and requires daily settlement of variation margin representing changes in the market value of each contract. To further mitigate counterparty risk, the fund trades with a diverse group of prequalified executing brokers; monitors the financial strength of its clearing brokers, executing brokers, and clearinghouse; and has entered into agreements with its clearing brokers and executing brokers.
During the year ended September 30, 2019, the fund’s average amounts of investments in credit protection sold and credit protection purchased each represented less than 1% of net assets, respectively, based on the average of notional amounts at each quarter-end during the period. The average amount of investments in interest rate swaps represented 3% of net assets, based on the average of notional amounts at each quarter-end during the period.
4. To Be Announced (TBA) Transactions: A TBA transaction is an agreement to buy or sell mortgage-backed securities with agreed-upon characteristics (face amount, coupon, maturity) for settlement at a future date. The fund may be a seller of TBA transactions to reduce its exposure to the mortgage-backed securities market or in order to sell mortgage-backed securities it owns under delayed-delivery arrangements. When the fund is a buyer of TBA transactions, it maintains cash or short-term investments in an amount sufficient to meet the purchase price at the settlement date of the TBA transaction. The primary risk associated with TBA transactions is that a counterparty may default on its obligations. The fund mitigates its counterparty risk by, among other things, performing a credit analysis of counterparties, allocating transactions among numerous counterparties, and monitoring its exposure to each counterparty. The fund may also enter into a Master Securities Forward Transaction Agreement (MSFTA) with certain counterparties and require them to transfer collateral as security for their performance. In the absence of a default, the collateral pledged or received by the fund cannot be repledged, resold, or rehypothecated. Under an MSFTA, upon a counterparty default (including bankruptcy), the fund may terminate any TBA transactions with that counterparty, determine the net amount owed by either party in accordance with its master netting arrangements, and sell or retain any collateral held up to the net amount owed to the fund under the master netting arrangements.
At September 30, 2019, counterparties had deposited in segregated accounts cash with a value of $251,000 in connection with TBA transactions.
5. Mortgage Dollar Rolls: The fund enters into mortgage-dollar-roll transactions, in which the fund sells mortgage-backed securities to a dealer and simultaneously agrees to purchase similar securities in the future at a predetermined price. The proceeds of the securities sold in mortgage-dollar-roll transactions are typically invested in high-quality short-term fixed income securities. The fund forgoes principal and interest paid on the securities sold, and is compensated by interest earned on the proceeds of the sale and by a lower price on the securities to be repurchased.
79
Institutional Intermediate-Term Bond Fund
The fund has also entered into mortgage-dollar-roll transactions in which the fund buys mortgage-backed securities from a dealer pursuant to a TBA transaction and simultaneously agrees to sell similar securities in the future at a predetermined price. The securities bought in mortgage-dollar-roll transactions are used to cover an open TBA sell position. The fund continues to earn interest on mortgage-backed security pools already held and receives a lower price on the securities to be sold in the future. The fund accounts for mortgage-dollar-roll transactions as purchases and sales; as such, these transactions may increase the fund’s portfolio turnover rate. Amounts to be received or paid in connection with open mortgage dollar rolls are included in Receivables for Investment Securities Sold or Payables for Investment Securities Purchased in the Statement of Assets and Liabilities.
6. Federal Income Taxes: The fund intends to continue to qualify as a regulated investment company and distribute all of its taxable income. Management has analyzed the fund’s tax positions taken for all open federal income tax years (September 30, 2016–2019), and has concluded that no provision for federal income tax is required in the fund’s financial statements.
7. Distributions: Distributions to shareholders are recorded on the ex-dividend date. Distributions are determined on a tax basis and may differ from net investment income and realized capital gains for financial reporting purposes.
8. Credit Facility: The fund and certain other funds managed by The Vanguard Group (“Vanguard”) participate in a $4.3 billion committed credit facility provided by a syndicate of lenders pursuant to a credit agreement that may be renewed annually; each fund is individually liable for its borrowings, if any, under the credit facility. Borrowings may be utilized for temporary and emergency purposes, and are subject to the fund’s regulatory and contractual borrowing restrictions. The participating funds are charged administrative fees and an annual commitment fee of 0.10% of the undrawn amount of the facility; these fees are allocated to the funds based on a method approved by the fund’s board of trustees and included in Management and Administrative expenses on the fund’s Statement of Operations. Any borrowings under this facility bear interest at a rate based upon the higher of the one-month London Interbank Offered Rate, federal funds effective rate, or overnight bank funding rate plus an agreed-upon spread.
The fund had no borrowings outstanding at September 30, 2019, or at any time during the period then ended.
9. Other: Interest income includes income distributions received from Vanguard Market Liquidity Fund and is accrued daily. Premiums and discounts on debt securities purchased are amortized and accreted, respectively, to interest income over the lives of the respective securities. Security transactions are accounted for on the date securities are bought or sold. Costs used to determine realized gains (losses) on the sale of investment securities are those of the specific securities sold.
B. In accordance with the terms of a Funds’ Service Agreement (the “FSA”) between Vanguard and the fund, Vanguard furnishes to the fund investment advisory, corporate management, administrative, marketing, and distribution services at Vanguard’s cost of operations (as defined by the FSA). These costs of operations are allocated to the fund based on methods and guidelines approved by the board of trustees. Vanguard does not require reimbursement in the current period for certain costs of operations (such as deferred compensation/benefits and risk/insurance costs); the fund’s liability for these costs of operations is included in Payables to Vanguard on the Statement of Assets and Liabilities. All other costs of operations payable to Vanguard are generally settled twice a month.
80
Institutional Intermediate-Term Bond Fund
Upon the request of Vanguard, the fund may invest up to 0.40% of its net assets as capital in Vanguard. At September 30, 2019, the fund had contributed to Vanguard capital in the amount of $1,017,000, representing less than 0.01% of the fund’s net assets and 0.41% of Vanguard’s capital received pursuant to the FSA. The fund’s trustees and officers are also directors and employees, respectively, of Vanguard.
C. Various inputs may be used to determine the value of the fund’s investments. These inputs are summarized in three broad levels for financial statement purposes. The inputs or methodologies used to value securities are not necessarily an indication of the risk associated with investing in those securities.
Level 1—Quoted prices in active markets for identical securities.
Level 2—Other significant observable inputs (including quoted prices for similar securities, interest rates, prepayment speeds, credit risk, etc.).
Level 3—Significant unobservable inputs (including the fund’s own assumptions used to determine the fair value of investments). Any investments valued with significant unobservable inputs are noted on the Statement of Net Assets.
The following table summarizes the market value of the fund’s investments and derivatives as of September 30, 2019, based on the inputs used to value them:
| | Level 1 | | Level 2 | | Level 3 | |
Investments | | ($000 | ) | ($000 | ) | ($000 | ) |
U.S. Government and Agency Obligations | | — | | 11,963,716 | | — | |
Asset-Backed/Commercial Mortgage-Backed Securities | | — | | 3,313,649 | | — | |
Corporate Bonds | | — | | 4,417,354 | | — | |
Sovereign Bonds | | — | | 1,390,869 | | — | |
Taxable Municipal Bonds | | — | | 6,037 | | — | |
Temporary Cash Investments | | 683,555 | | — | | — | |
Futures Contracts—Assets1 | | 332 | | — | | — | |
Futures Contracts—Liabilities1 | | (828 | ) | — | | — | |
Swap Contracts—Assets | | 19 | 1 | 80 | | — | |
Swap Contracts—Liabilities | | (17 | )1 | (342 | ) | — | |
Conventional Mortgage-Backed Securities—Liability for Sale Commitments | | — | | (354,502 | ) | — | |
Total | | 683,061 | | 20,736,861 | | — | |
1 Represents variation margin on the last day of the reporting period.
81
Institutional Intermediate-Term Bond Fund
D. At September 30, 2019, the fair values of derivatives were reflected in the Statement of Assets and Liabilities as follows:
| | Interest Rate | | Credit | | | |
| | Contracts | | Contracts | | Total | |
Statement of Net Assets Caption | | ($000 | ) | ($000 | ) | ($000 | ) |
Variation Margin Receivable—Futures Contracts | | 332 | | — | | 332 | |
Variation Margin Receivable—CC Swap Contracts | | 19 | | — | | 19 | |
Unrealized Appreciation—OTC Swap Contracts | | — | | 80 | | 80 | |
Total Assets | | 351 | | 80 | | 431 | |
| | | | | | | |
Variation Margin Payable—Futures Contracts | | (828 | ) | — | | (828 | ) |
Variation Margin Payable—CC Swap Contracts | | (17 | ) | — | | (17 | ) |
Unrealized Depreciation—OTC Swap Contracts | | — | | (342 | ) | (342 | ) |
Total Liabilities | | (845 | ) | (342 | ) | (1,187 | ) |
Realized net gain (loss) and the change in unrealized appreciation (depreciation) on derivatives for the year ended September 30, 2019, were:
| | Interest Rate | | Credit | | | |
| | Contracts | | Contracts | | Total | |
Realized Net Gain (Loss) on Derivatives | | ($000 | ) | ($000 | ) | ($000 | ) |
Futures Contracts | | 86,959 | | — | | 86,959 | |
Swap Contracts | | (22,377 | ) | 155 | | (22,222 | ) |
Realized Net Gain (Loss) on Derivatives | | 64,582 | | 155 | | 64,737 | |
| | | | | | | |
Change in Unrealized Appreciation (Depreciation) on Derivatives | | | | | | | |
Futures Contracts | | 373 | | — | | 373 | |
Swap Contracts | | (3,317 | ) | 69 | | (3,248 | ) |
Change in Unrealized Appreciation (Depreciation) on Derivatives | | (2,944 | ) | 69 | | (2,875 | ) |
E. Permanent differences between book-basis and tax-basis components of net assets are reclassified among capital accounts in the financial statements to reflect their tax character. These reclassifications have no effect on net assets or net asset value per share. As of period end, permanent differences primarily attributable to the accounting for swap agreements were reclassified between the following accounts:
| | Amount | |
| | ($000 | ) |
Paid-in Capital | | — | |
Total Distributable Earnings (Loss) | | — | |
Temporary differences between book-basis and tax-basis components of total distributable earnings (loss) arise when certain items of income, gain, or loss are recognized in different periods for financial statement and tax purposes; these differences will reverse at some time in the future.
82
Institutional Intermediate-Term Bond Fund
The differences are primarily related to the tax deferral of losses on wash sales; and the realization of unrealized gains or losses on certain futures contracts. As of period end, the tax-basis components of total distributable earnings (loss) are detailed in the table as follows:
| | Amount | |
| | ($000 | ) |
Undistributed Ordinary Income | | 1,263 | |
Undistributed Long-Term Gains | | — | |
Capital Loss Carryforwards (Non-expiring)* | | (87,498 | ) |
Net Unrealized Gains (Losses) | | 386,708 | |
* The fund used capital loss carryforwards of $102,220,000 to offset taxable capital gains realized during the year ended September 30, 2019.
As of September 30, 2019, gross unrealized appreciation and depreciation for investments derivatives and sale commitments based on cost for U.S. federal income tax purposes were as follows:
| | Amount | |
| | ($000 | ) |
Tax Cost | | 21,031,352 | |
Gross Unrealized Appreciation | | 413,420 | |
Gross Unrealized Depreciation | | (26,712 | ) |
Net Unrealized Appreciation (Depreciation) | | 386,708 | |
F. During the year ended September 30, 2019, the fund purchased $4,218,510,000 of investment securities and sold $3,526,442,000 of investment securities, other than U.S. government securities and temporary cash investments. Purchases and sales of U.S. government securities were $56,247,434,000 and $53,553,342,000, respectively. Total purchases and sales include $1,302,699,000 and $0, respectively, in connection with in-kind purchases and redemptions of the fund’s capital shares.
G. Capital shares issued and redeemed were:
| | Year Ended September 30, | |
| | 2019 | | 2018 | |
| | Shares | | Shares | |
| | (000 | ) | (000 | ) |
Issued | | 176,418 | | 150,754 | |
Issued in Lieu of Cash Distributions | | 22,728 | | 16,255 | |
Redeemed | | (2,385 | ) | (39,041 | ) |
Net Increase (Decrease) in Shares Outstanding | | 196,761 | | 127,968 | |
H. Management has determined that no events or transactions occurred subsequent to September 30, 2019, that would require recognition or disclosure in these financial statements.
83
Report of Independent Registered Public Accounting Firm
To the Board of Trustees of Vanguard Malvern Funds and Shareholders of Vanguard Institutional Short-Term Bond Fund and Vanguard Institutional Intermediate-Term Bond Fund
Opinions on the Financial Statements
We have audited the accompanying statement of assets and liabilities of Vanguard Institutional Intermediate-Term Bond Fund and the statements of net assets of Vanguard Institutional Short-Term Bond Fund and Vanguard Institutional Intermediate-Term Bond Fund (two of the funds constituting Vanguard Malvern Funds, hereafter collectively referred to as the “Funds”) as of September 30, 2019, the related statements of operations for the year ended September 30, 2019, the statements of changes in net assets for each of the two years in the period ended September 30, 2019, including the related notes, and the financial highlights for each of the periods indicated therein (collectively referred to as the “financial statements”). In our opinion, the financial statements present fairly, in all material respects, the financial position of each of the Funds as of September 30, 2019, the results of each of their operations for the year then ended, the changes in each of their net assets for each of the two years in the period ended September 30, 2019 and each of the financial highlights for each of the periods indicated therein in conformity with accounting principles generally accepted in the United States of America.
Basis for Opinions
These financial statements are the responsibility of the Funds’ management. Our responsibility is to express an opinion on the Funds’ financial statements based on our audits. We are a public accounting firm registered with the Public Company Accounting Oversight Board (United States) (“PCAOB”) and are required to be independent with respect to the Funds in accordance with the U.S. federal securities laws and the applicable rules and regulations of the Securities and Exchange Commission and the PCAOB.
We conducted our audits of these financial statements in accordance with the standards of the PCAOB. Those standards require that we plan and perform the audit to obtain reasonable assurance about whether the financial statements are free of material misstatement, whether due to error or fraud.
Our audits included performing procedures to assess the risks of material misstatement of the financial statements, whether due to error or fraud, and performing procedures that respond to those risks. Such procedures included examining, on a test basis, evidence regarding the amounts and disclosures in the financial statements. Our audits also included evaluating the accounting principles used and significant estimates made by management, as well as evaluating the overall presentation of the financial statements. Our procedures included confirmation of securities owned as of September 30, 2019 by correspondence with the custodian, transfer agent and brokers; when replies were not received from brokers, we performed other auditing procedures. We believe that our audits provide a reasonable basis for our opinions.
/s/PricewaterhouseCoopers LLP
Philadelphia, Pennsylvania
November 19, 2019
We have served as the auditor of one or more investment companies in The Vanguard Group of Funds since 1975.
84
Special 2019 tax information (unaudited) for Vanguard Institutional Short-Term Bond Fund
This information for the fiscal year ended September 30, 2019, is included pursuant to provisions of the Internal Revenue Code.
For nonresident alien shareholders, 73.1% of income dividends are interest-related dividends.
Special 2019 tax information (unaudited) for Vanguard Institutional Intermediate-Term Bond Fund
This information for the fiscal year ended September 30, 2019, is included pursuant to provisions of the Internal Revenue Code.
For nonresident alien shareholders, 81.6% of income dividends are interest-related dividends.
85
BLOOMBERG is a trademark and service mark of Bloomberg Finance L.P. BARCLAYS is a trademark and service mark of Barclays Bank Plc, used under license. Bloomberg Finance L.P. and its affiliates, including Bloomberg Index Services Limited (BISL) (collectively, Bloomberg), or Bloomberg’s licensors, own all proprietary rights in the Bloomberg Barclays U.S. 1–3 Year Government/Credit ex Baa Index and Bloomberg Barclays U.S. Intermediate Aggregate ex Baa Index (Indices or Bloomberg Barclays Indices).
Neither Barclays Bank Plc, Barclays Capital Inc., or any affiliate (collectively Barclays) or Bloomberg is the issuer or producer of the Institutional Bond Funds and neither Bloomberg nor Barclays has any responsibilities, obligations or duties to investors in the Institutional Bond Funds. The Indices are licensed for use by The Vanguard Group, Inc. (Vanguard) as the sponsor of the Institutional Bond Funds. Bloomberg and Barclays’ only relationship with Vanguard in respect of the Indices is the licensing of the Indices, which are determined, composed and calculated by BISL, or any successor thereto, without regard to the Issuer or the Institutional Bond Funds or the owners of the Institutional Bond Funds.
Additionally, Vanguard may for itself execute transaction(s) with Barclays in or relating to the Indices in connection with the Institutional Bond Funds. Investors acquire the Institutional Bond Funds from Vanguard and investors neither acquire any interest in the Indices nor enter into any relationship of any kind whatsoever with Bloomberg or Barclays upon making an investment in the Institutional Bond Funds. The Institutional Bond Funds are not sponsored, endorsed, sold or promoted by Bloomberg or Barclays. Neither Bloomberg nor Barclays makes any representation or warranty, express or implied regarding the advisability of investing in the Institutional Bond Funds or the advisability of investing in securities generally or the ability of the Indices to track corresponding or relative market performance. Neither Bloomberg nor Barclays has passed on the legality or suitability of the Institutional Bond Funds with respect to any person or entity. Neither Bloomberg nor Barclays is responsible for and has not participated in the determination of the timing of, prices at, or quantities of the Institutional Bond Funds to be issued. Neither Bloomberg nor Barclays has any obligation to take the needs of the Issuer or the owners of the Institutional Bond Funds or any other third party into consideration in determining, composing or calculating the Indices. Neither Bloomberg nor Barclays has any obligation or liability in connection with administration, marketing or trading of the Institutional Bond Funds
The licensing agreement between Bloomberg and Barclays is solely for the benefit of Bloomberg and Barclays and not for the benefit of the owners of the Institutional Bond Funds, investors or other third parties. In addition, the licensing agreement between Vanguard and Bloomberg is solely for the benefit of Vanguard and Bloomberg and not for the benefit of the owners of the Institutional Bond Funds, investors or other third parties.
NEITHER BLOOMBERG NOR BARCLAYS SHALL HAVE ANY LIABILITY TO THE ISSUER, INVESTORS OR TO OTHER THIRD PARTIES FOR THE QUALITY, ACCURACY AND/OR COMPLETENESS OF THE BLOOMBERG BARCLAYS INDICES OR ANY DATA INCLUDED THEREIN OR FOR INTERRUPTIONS IN THE DELIVERY OF THE BLOOMBERG BARCLAYS INDICES. NEITHER BLOOMBERG NOR BARCLAYS MAKES ANY WARRANTY, EXPRESS OR IMPLIED, AS TO RESULTS TO BE OBTAINED BY THE ISSUER, THE INVESTORS OR ANY OTHER PERSON OR ENTITY FROM THE USE OF THE BLOOMBERG BARCLAYS INDICES OR ANY DATA INCLUDED THEREIN. NEITHER BLOOMBERG NOR BARCLAYS MAKES ANY EXPRESS OR IMPLIED WARRANTIES, AND EACH HEREBY EXPRESSLY DISCLAIMS ALL WARRANTIES OF MERCHANTABILITY OR FITNESS FOR A PARTICULAR PURPOSE OR USE WITH RESPECT TO THE BLOOMBERG BARCLAYS INDICES OR ANY DATA INCLUDED THEREIN. BLOOMBERG RESERVES THE RIGHT TO CHANGE THE METHODS OF CALCULATION OR PUBLICATION, OR TO CEASE THE CALCULATION OR PUBLICATION OF THE BLOOMBERG BARCLAYS INDICES, AND NEITHER BLOOMBERG NOR BARCLAYS SHALL BE LIABLE FOR ANY MISCALCULATION OF OR ANY INCORRECT, DELAYED OR INTERRUPTED PUBLICATION WITH RESPECT TO ANY OF THE BLOOMBERG BARCLAYS INDICES. NEITHER BLOOMBERG NOR BARCLAYS SHALL BE LIABLE FOR ANY DAMAGES, INCLUDING, WITHOUT LIMITATION, ANY SPECIAL, INDIRECT OR CONSEQUENTIAL DAMAGES, OR ANY LOST PROFITS AND EVEN IF ADVISED OF THE POSSIBILITY OF SUCH, RESULTING FROM THE USE OF THE BLOOMBERG BARCLAYS INDICES OR ANY DATA INCLUDED THEREIN OR WITH RESPECT TO THE INSTITUTIONAL BOND FUNDS.
None of the information supplied by Bloomberg or Barclays and used in this publication may be reproduced in any manner without the prior written permission of both Bloomberg and Barclays Capital, the investment banking division of Barclays Bank Plc. Barclays Bank Plc is registered in England No. 1026167. Registered office 1 Churchill Place London E14 5HP.
© 2019 Bloomberg. Used with Permission.
Source: Bloomberg Index Services Limited. Copyright 2019, Bloomberg. All rights reserved.
86
The People Who Govern Your Fund
The trustees of your mutual fund are there to see that the fund is operated and managed in your best interests since, as a shareholder, you are a part owner of the fund. Your fund’s trustees also serve on the board of directors of The Vanguard Group, Inc., which is owned by the Vanguard funds and provides services to them.
A majority of Vanguard’s board members are independent, meaning that they have no affiliation with Vanguard or the funds they oversee, apart from the sizable personal investments they have made as private individuals. The independent board members have distinguished backgrounds in business, academia, and public service. Each of the trustees and executive officers oversees 212 Vanguard funds.
Information for each trustee and executive officer of the fund appears below. That information, as well as the Vanguard fund count, is as of the date on the cover of this fund report. The mailing address of the trustees and officers is P.O. Box 876, Valley Forge, PA 19482. More information about the trustees is in the Statement of Additional Information, which can be obtained, without charge, by contacting Vanguard at 800-662-7447, or online at vanguard.com.
Interested Trustee1
Mortimer J. Buckley
Born in 1969. Trustee since January 2018. Principal occupation(s) during the past five years and other experience: chairman of the board (January 2019– present) of Vanguard and of each of the investment companies served by Vanguard; chief executive officer (January 2018–present) of Vanguard; chief executive officer, president, and trustee (January 2018–present) of each of the investment companies served by Vanguard; president and director (2017–present) of Vanguard; and president (February 2018–present) of Vanguard Marketing Corporation. Chief investment officer (2013–2017), managing director (2002–2017), head of the Retail Investor Group (2006–2012), and chief information officer (2001–2006) of Vanguard. Chairman of the board (2011–2017) and trustee (2009–2017) of the Children’s Hospital of Philadelphia; trustee (2018–present) of The Shipley School.
Independent Trustees
Emerson U. Fullwood
Born in 1948. Trustee since January 2008. Principal occupation(s) during the past five years and other experience: executive chief staff and marketing officer for North America and corporate vice president (retired 2008) of Xerox Corporation (document management products and services). Former president of the Worldwide Channels Group, Latin America, and Worldwide Customer Service and executive chief staff officer of Developing Markets of Xerox. Executive in residence and 2009–2010 Distinguished Minett Professor at the Rochester Institute of Technology. Director of SPX FLOW, Inc. (multi-industry manufacturing). Director of the University of Rochester Medical Center, the Monroe Community College Foundation, the United Way of Rochester, North Carolina A&T University, and Roberts Wesleyan College. Trustee of the University of Rochester.
Amy Gutmann
Born in 1949. Trustee since June 2006. Principal occupation(s) during the past five years and other experience: president (2004–present) of the University of Pennsylvania. Christopher H. Browne Distinguished Professor of Political Science, School of Arts and Sciences, and professor of communication, Annenberg School for Communication, with secondary faculty appointments in the Department of Philosophy, School of Arts and Sciences, and at the Graduate School of Education, University of Pennsylvania. Trustee of the National Constitution Center.
F. Joseph Loughrey
Born in 1949. Trustee since October 2009. Principal occupation(s) during the past five years and other experience: president and chief operating officer (retired 2009) and vice chairman of the board (2008–2009) of Cummins Inc. (industrial machinery). Chairman of the board of Hillenbrand, Inc. (specialized consumer services), and the Lumina Foundation.
1 Mr. Buckley is considered an “interested person,” as defined in the Investment Company Act of 1940, because he is an officer of the Vanguard funds.
Director of the V Foundation and Oxfam America. Member of the advisory council for the College of Arts and Letters and chair of the advisory board to the Kellogg Institute for International Studies, both at the University of Notre Dame.
Mark Loughridge
Born in 1953. Trustee since March 2012. Principal occupation(s) during the past five years and other experience: senior vice president and chief financial officer (retired 2013) of IBM (information technology services). Fiduciary member of IBM’s Retirement Plan Committee (2004–2013), senior vice president and general manager (2002–2004) of IBM Global Financing, vice president and controller (1998–2002) of IBM, and a variety of other prior management roles at IBM. Member of the Council on Chicago Booth.
Scott C. Malpass
Born in 1962. Trustee since March 2012. Principal occupation(s) during the past five years and other experience: chief investment officer (1989–present) and vice president (1996–present) of the University of Notre Dame. Assistant professor of finance at the Mendoza College of Business, University of Notre Dame, and member of the Notre Dame 403(b) Investment Committee. Chairman of the board of TIFF Advisory Services, Inc. Member of the board of Catholic Investment Services, Inc. (investment advisors) and the board of superintendence of the Institute for the Works of Religion.
Deanna Mulligan
Born in 1963. Trustee since January 2018. Principal occupation(s) during the past five years and other experience: president (2010–present) and chief executive officer (2011–present) of The Guardian Life Insurance Company of America. Chief operating officer (2010–2011) and executive vice president (2008–2010) of Individual Life and Disability of The Guardian Life Insurance Company of America. Member of the board of The Guardian Life Insurance Company of America, the American Council of Life Insurers, the Partnership for New York City (business leadership), and the Committee Encouraging Corporate Philanthropy. Trustee of the Economic Club of New York and the Bruce Museum (arts and science). Member of the Advisory Council for the Stanford Graduate School of Business.
André F. Perold
Born in 1952. Trustee since December 2004. Principal occupation(s) during the past five years and other experience: George Gund Professor of Finance and Banking, Emeritus at the Harvard Business School (retired 2011). Chief investment officer and co-managing partner of HighVista Strategies LLC (private investment firm). Board of advisors and investment committee member of the Museum of Fine Arts Boston. Board member (2018–present) of RIT Capital Partners (investment firm); investment committee member of Partners Health Care System.
Sarah Bloom Raskin
Born in 1961. Trustee since January 2018. Principal occupation(s) during the past five years and other experience: deputy secretary (2014–2017) of the United States Department of the Treasury. Governor (2010–2014) of the Federal Reserve Board. Commissioner (2007–2010) of financial regulation for the State of Maryland. Member of the board of directors (2012–2014) of Neighborhood Reinvestment Corporation. Director (2017–present) of i(x) Investments, LLC; director (2017–present) of Reserve Trust. Rubinstein Fellow (2017–present) of Duke University; trustee (2017–present) of Amherst College.
Peter F. Volanakis
Born in 1955. Trustee since July 2009. Principal occupation(s) during the past five years and other experience: president and chief operating officer (retired 2010) of Corning Incorporated (communications equipment) and director of Corning Incorporated (2000–2010) and Dow Corning (2001–2010). Director (2012) of SPX Corporation (multi-industry manufacturing). Overseer of the Amos Tuck School of Business Administration, Dartmouth College (2001–2013). Chairman of the board of trustees of Colby-Sawyer College. Member of the board of Hypertherm Inc. (industrial cutting systems, software, and consumables).
Executive Officers
Glenn Booraem
Born in 1967. Principal occupation(s) during the past five years and other experience: principal of Vanguard. Investment stewardship officer (2017–present), treasurer (2015–2017), controller (2010–2015), and assistant controller (2001–2010) of each of the investment companies served by Vanguard.
Christine M. Buchanan
Born in 1970. Principal occupation(s) during the past five years and other experience: principal of Vanguard and global head of Fund Administration at Vanguard. Treasurer (2017–present) of each of the investment companies served by Vanguard. Partner (2005–2017) at KPMG LLP (audit, tax, and advisory services).
Thomas J. Higgins
Born in 1957. Principal occupation(s) during the past five years and other experience: principal of Vanguard. Chief financial officer (2008–present) and treasurer (1998–2008) of each of the investment companies served by Vanguard.
Peter Mahoney
Born in 1974. Principal occupation(s) during the past five years and other experience: principal of Vanguard. Controller (2015–present) of each of the investment companies served by Vanguard. Head of International Fund Services (2008–2014) at Vanguard.
Anne E. Robinson
Born in 1970. Principal occupation(s) during the past five years and other experience: general counsel (2016–present) of Vanguard. Secretary (2016–present) of Vanguard and of each of the investment companies served by Vanguard. Managing director (2016–present) of Vanguard. Director and senior vice president (2016–2018) of Vanguard Marketing Corporation. Managing director and general counsel of Global Cards and Consumer Services (2014–2016) at Citigroup. Counsel (2003–2014) at American Express.
Michael Rollings
Born in 1963. Principal occupation(s) during the past five years and other experience: finance director (2017–present) and treasurer (2017) of each of the investment companies served by Vanguard. Managing director (2016–present) of Vanguard. Chief financial officer (2016–present) of Vanguard. Director (2016–present) of Vanguard Marketing Corporation. Executive vice president and chief financial officer (2006–2016) of MassMutual Financial Group.
John E. Schadl
Born in 1972. Principal occupation(s) during the past five years and other experience: principal of Vanguard. Chief compliance officer (2019–present) of Vanguard and of each of the investment companies served by Vanguard. Assistant vice president (May 2019–present) of Vanguard Marketing Corporation.
Vanguard Senior Management Team |
| |
Joseph Brennan | Chris D. McIsaac |
Mortimer J. Buckley | James M. Norris |
Gregory Davis | Thomas M. Rampulla |
John James | Karin A. Risi |
Martha G. King | Anne E. Robinson |
John T. Marcante | Michael Rollings |
| | 
|
| | |
| | |
| | P.O. Box 2600 |
| | Valley Forge, PA 19482-2600 |
Connect with Vanguard® > vanguard.com
Fund Information > 800-662-7447 | |
Direct Investor Account Services > 800-662-2739
Institutional Investor Services > 800-523-1036
Text Telephone for People
Who Are Deaf or Hard of Hearing > 800-749-7273
This material may be used in conjunction with the offering of shares of any Vanguard fund only if preceded or accompanied by the fund’s current prospectus.
All comparative mutual fund data are from Morningstar, Inc., unless otherwise noted.
You can obtain a free copy of Vanguard’s proxy voting guidelines by visiting vanguard.com/proxyreporting or by calling Vanguard at 800-662-2739. The guidelines are also available from the SEC’s website, www.sec.gov. In addition, you may obtain a free report on how your fund voted the proxies for securities it owned during the 12 months ended June 30. To get the report, visit either vanguard.com/proxyreporting or www.sec.gov.
You can review information about your fund on the SEC’s website, and you can receive copies of this information, for a fee, by sending a request via email addressed to publicinfo@sec.gov.
| | © 2019 The Vanguard Group, Inc. |
| | All rights reserved. |
| | Vanguard Marketing Corporation, Distributor. |
| | |
| | Q4720 112019 |
Item 2: Code of Ethics. The Registrant has adopted a code of ethics that applies to the Registrant’s principal executive officer, principal financial officer, principal accounting officer or controller or persons performing similar functions. The Code of Ethics was amended during the reporting period covered by this report to make certain technical, non-material changes.
Item 3: Audit Committee Financial Expert. All members of the Audit Committee have been determined by the Registrant’s Board of Trustees to be Audit Committee Financial Experts and to be independent: F. Joseph Loughrey, Mark Loughridge, Sarah Bloom Raskin, and Peter F. Volanakis.
Item 4: Principal Accountant Fees and Services.
(a) Audit Fees.
Audit Fees of the Registrant.
Fiscal Year Ended September 30, 2019: $298,000
Fiscal Year Ended September 30, 2018: $306,000
Aggregate Audit Fees of Registered Investment Companies in the Vanguard Group.
Fiscal Year Ended September 30, 2019: $9,568,215
Fiscal Year Ended September 30, 2018: $9,734,277
Includes fees billed in connection with audits of the Registrant, other registered investment companies in the Vanguard complex, The Vanguard Group, Inc., and Vanguard Marketing Corporation.
(b) Audit-Related Fees.
Fiscal Year Ended September 30, 2019: $3,012,031
Fiscal Year Ended September 30, 2018: $5,581,336
Includes fees billed in connection with assurance and related services provided to the Registrant, other registered investment companies in the Vanguard complex, The Vanguard Group, Inc., and Vanguard Marketing Corporation.
(c) Tax Fees.
Fiscal Year Ended September 30, 2019: $357,238
Fiscal Year Ended September 30, 2018: $347,985
Includes fees billed in connection with tax compliance, planning, and advice services provided to the Registrant, other registered investment companies in the Vanguard complex, The Vanguard Group, Inc., and Vanguard Marketing Corporation.
(d) All Other Fees.
Fiscal Year Ended September 30, 2019: $0
Fiscal Year Ended September 30, 2018: $0
Includes fees billed for services related to tax reported information provided to the Registrant, other registered investment companies in the Vanguard complex, The Vanguard Group, Inc., and Vanguard Marketing Corporation.
(e) (1) Pre-Approval Policies. The policy of the Registrant’s Audit Committee is to consider, and, if appropriate, approve before the principal accountant is engaged for such services, all specific audit and non-audit services provided to: the Registrant, other registered investment companies in the Vanguard complex, The Vanguard Group, Inc., and entities controlled by The Vanguard Group, Inc. that provide ongoing services to the Registrant. In making a determination, the Audit Committee considers whether the services are consistent with maintaining the principal accountant’s independence.
In the event of a contingency situation in which the principal accountant is needed to provide services in between scheduled Audit Committee meetings, the Chairman of the Audit Committee would be called on to consider and, if appropriate, pre-approve audit or permitted non-audit services in an amount sufficient to complete services through the next Audit Committee meeting, and to determine if such services would be consistent with maintaining the accountant’s independence. At the next scheduled Audit Committee meeting, services and fees would be presented to the Audit Committee for formal consideration, and, if appropriate, approval by the entire Audit Committee. The Audit Committee would again consider whether such services and fees are consistent with maintaining the principal accountant’s independence.
The Registrant’s Audit Committee is informed at least annually of all audit and non-audit services provided by the principal accountant to the Vanguard complex, whether such services are provided to: the Registrant, other registered investment companies in the Vanguard complex, The Vanguard Group, Inc., or other entities controlled by The Vanguard Group, Inc. that provide ongoing services to the Registrant.
(2) No percentage of the principal accountant’s fees or services were approved pursuant to the waiver provision of paragraph (c)(7)(i)(C) of Rule 2-01 of Regulation S-X.
(f) For the most recent fiscal year, over 50% of the hours worked under the principal accountant’s engagement were not performed by persons other than full-time, permanent employees of the principal accountant.
(g) Aggregate Non-Audit Fees.
Fiscal Year Ended September 30, 2019: $357,238
Fiscal Year Ended September 30, 2018: $347,985
Includes fees billed for non-audit services provided to the Registrant, other registered investment companies in the Vanguard complex, The Vanguard Group, Inc., and Vanguard Marketing Corporation.
(h) For the most recent fiscal year, the Audit Committee has determined that the provision of all non-audit services was consistent with maintaining the principal accountant’s independence.
Item 5: Audit Committee of Listed Registrants.
The Registrant is a listed issuer as defined in rule 10A-3 under the Securities Exchange Act of 1934 (“Exchange Act”). The Registrant has a separately-designated standing audit committee established in accordance with Section 3(a)(58)(A) of the Exchange Act. The Registrant’s audit committee members are: F. Joseph Loughrey, Mark Loughridge, Sarah Bloom Raskin, and Peter F. Volanakis.
Item 6: Investments.
Not applicable.
Item 7: Disclosure of Proxy Voting Policies and Procedures for Closed-End Management Investment Companies.
Not applicable.
Item 8: Portfolio Managers of Closed-End Management Investment Companies.
Not applicable.
Item 9: Purchase of Equity Securities by Closed-End Management Investment Company and Affiliated Purchasers.
Not applicable.
Item 10: Submission of Matters to a Vote of Security Holders.
Not applicable.
Item 11: Controls and Procedures.
(a) Disclosure Controls and Procedures. The Principal Executive and Financial Officers concluded that the Registrant’s Disclosure Controls and Procedures are effective based on their evaluation of the Disclosure Controls and Procedures as of a date within 90 days of the filing date of this report.
(b) Internal Control Over Financial Reporting. There were no significant changes in Registrant’s Internal Control Over Financial Reporting or in other factors that could significantly affect this control subsequent to the date of the evaluation, including any corrective actions with regard to significant deficiencies and material weaknesses.
Item 12: Disclosure of Securities Lending Activities for Closed-End Management Investment Companies.
Not applicable.
Item 13: Exhibits.
(a) Code of Ethics.
(b) Certifications.
Pursuant to the requirements of the Securities Exchange Act of 1934 and the Investment Company Act of 1940, the registrant has duly caused this report to be signed on its behalf by the undersigned, thereunto duly authorized.
| VANGUARD MALVERN FUNDS |
| |
BY: | /s/ MORTIMER J. BUCKLEY* | |
| | |
| MORTIMER J. BUCKLEY | |
| CHIEF EXECUTIVE OFFICER | |
|
Date: November 15, 2019 |
Pursuant to the requirements of the Securities Exchange Act of 1934 and the Investment Company Act of 1940, this report has been signed below by the following persons on behalf of the registrant and in the capacities and on the dates indicated.
| VANGUARD MALVERN FUNDS |
| |
BY: | /s/ MORTIMER J. BUCKLEY* | |
| | |
| MORTIMER J. BUCKLEY | |
| CHIEF EXECUTIVE OFFICER | |
|
Date: November 15, 2019 |
|
| VANGUARD MALVERN FUNDS |
| |
BY: | /s/ JOHN BENDL* | |
| | |
| JOHN BENDL | |
| CHIEF FINANCIAL OFFICER | |
| |
Date: November 15, 2019 | |
* By: /s/ Anne E. Robinson
Anne E. Robinson, pursuant to a Power of Attorney filed on January 18, 2018 (see file Number 33-32216) and a Power of Attorney filed on October 30, 2019 (see file Number 811-02554), Incorporated by Reference.