Voya Government Liquid Assets Portfolio (the “Portfolio”) seeks a high level of current income consistent with the preservation of capital and liquidity. The Portfolio is managed by David S. Yealy, Portfolio Manager of Voya Investment Management Co. LLC (“Voya IM”) — the Sub-Adviser.
Top Ten Holdings
as of December 31, 2019
(as a percentage of net assets) |
| Deutsche Bank Repurchase Agreement dated 12/31/2019, 1.55%, due 1/2/2020, $111,763,623 to be received upon repurchase (Collateralized by $135,443,927, multiple securities, 0.00%, Market Value plus accrued interest $115,106,620 due 2/15/2028-2/15/2031), 1.550% | | 15.4 | % |
| Federal Home Loan Bank Discount Notes, 14.600%, 01/07/20 | | 14.5 | % |
| United States Treasury Bill, 14.340%, 06/18/20 | | 14.3 | % |
| Deutsche Bank Repurchase Agreement dated 12/31/2019, 1.50%, due 1/2/2020, $101,008,697 to be received upon repurchase (Collateralized by $74,642,100, Bond, 4.500%, Market Value plus accrued interest $103,020,131 due 8/15/2039), 1.550% | | 13.9 | % |
| Deutsche Bank Repurchase Agreement dated 12/31/2019, 1.50%, due 1/2/2020, $101,008,417 to be received upon repurchase (Collateralized by $150,941,745, TINT, 0.00%, Market Value plus accrued interest $104,030,000 due 2/15/2028-3/15/2037), 1.500% | | 13.9 | % |
| BlackRock Liquidity Funds, FedFund, Institutional Class, 1.520%, 01/02/20 | | 4.5 | % |
| Federal Farm Credit Banks, 1.791%, 07/02/20 | | 3.7 | % |
| Federal Home Loan Banks, 1.670%, 10/16/20 | | 3.6 | % |
| Federal Home Loan Banks, 1.782%, 03/25/20 | | 3.3 | % |
| Goldman Sachs Financial Square Government Fund — Institutional Shares, 1.550%, 01/02/20 | | 3.1 | % |
| | | | |
Portfolio holdings are subject to change daily. |
| |
The Portfolio maintained a shorter than normal weighted average maturity (“WAM”) during the majority of the period as the market was pricing in a more dovish Fed monetary policy than what we expected. Market yields were fully pricing in the rate cuts prior to the rate moves, which limited the potential to pick up additional yield by extending maturities. The Portfolio maintained an exposure to floating rate money market securities, shifting out of floaters tied to three-month LIBOR and into floaters tied to either one-month LIBOR or floaters tied to one-day SOFR as the three-month LIBOR rate reflected overly optimistic expectations for future rate cuts in our opinion. The Portfolio took advantage of the cheapness of new issue T-bills from time to time, which allowed the Portfolio to capture some capital gains over and above the yield on those securities, and to add incremental total return.
You could lose money by investing in the Portfolio. Although the Portfolio seeks to preserve the value of your investment at $1.00 per share, it cannot guarantee it will do so. An investment in the Portfolio is not insured or guaranteed by the Federal Deposit Insurance Corporation or any other government agency. The Portfolio’s sponsor has no legal obligation to provide financial support to the Portfolio, and you should not expect that the sponsor will provide financial support to the Portfolio at any time.
Portfolio holdings and characteristics are subject to change and may not be representative of current holdings and characteristics. Portfolio holdings are subject to change daily. The outlook for this Portfolio may differ from that presented for other Voya mutual funds. This report contains statements that may be “forward-looking” statements. Actual results may differ materially from those projected in the “forward-looking” statements. The Portfolio’s performance returns shown reflect applicable fee waivers and/or expense limits in effect during this period. Absent such fee waivers/expense limitations, if any, performance would have been lower. Performance for the different classes of shares will vary based on differences in fees associated with each class. An index has no cash in its portfolio and imposes no sales charges. An investor cannot invest directly in an index.
| PORTFOLIO MANAGERS’ REPORT | VY® CLARION GLOBAL REAL ESTATE PORTFOLIO |
| | |
Geographic Diversification
as of December 31, 2019
(as a percentage of net assets) |
| United States | | 54.0 | % |
| Japan | | 11.9 | % |
| Hong Kong | | 6.3 | % |
| United Kingdom | | 6.0 | % |
| Germany | | 4.2 | % |
| Australia | | 3.5 | % |
| Sweden | | 2.7 | % |
| France | | 2.7 | % |
| Singapore | | 2.5 | % |
| Canada | | 2.0 | % |
| Countries between 0.4%–0.8%ˆ | | 3.4 | % |
| Assets in Excess of Other Liabilities* | | 0.8 | % |
| Net Assets | | 100.0 | % |
* Includes short-term investments. |
ˆ Includes 6 countries, which each represents 0.4%–0.8% of net assets. |
Portfolio holdings are subject to change daily. |
VY® Clarion Global Real Estate Portfolio (the “Portfolio”) seeks high total return consisting of capital appreciation and current income. The Portfolio is managed by T. Ritson Ferguson, CFA, Chief Executive Officer and Global Chief Investment Officer, Steven D. Burton, CFA, Co-Chief Investment Officer, and Joseph P. Smith, CFA, President and Co-Chief Investment Officer, Portfolio Managers of CBRE Clarion Securities LLC — the Sub-Adviser.
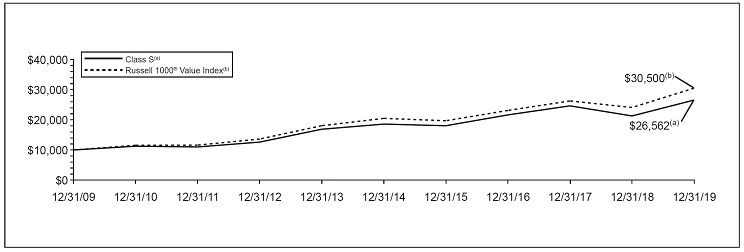
Performance: For the year ended December 31, 2019, the Portfolio’s Class S shares provided a total return of 24.35% compared to the FTSE EPRA Nareit Developed Index and S&P 500® Index, which returned 21.91% and 31.49%, respectively, for the same period.
Portfolio Specifics: Real estate stocks generated a strong total return in 2019. After several lackluster performance years, real estate stocks had an impressive bounce-back year in 2019. Performance was broad-based, led by European and North American companies. Overall, real estate stocks were driven by the stock specific attributes of attractive valuations, stable earnings, and well-covered dividends combined with a favorable macro backdrop as exemplified by three 25 basis point (0.25%) cuts in policy rates by the Federal Open Market Committee (to a now 1.50 – 1.75% range), continued accommodative central bank policies around the world, a possible breakthrough in trade negotiations between the U.S. and China, and a U.K. election in December 2019 that appears to have brought clarity to the direction of the Brexit process in 2020. Given that many of the real estate and macro characteristics that defined 2019 are expected to remain in place for the foreseeable future, we expect 2020 to be another attractive total return year for real estate stocks.
We believe the moderate outlook for global economic growth is good for real estate stocks. In our view, the economic expansion should continue in 2020, but we acknowledge that this economic expansion (which is the longest in generations) could be derailed by geopolitical risks including Brexit, U.S. trade policy uncertainty, and a slowing/bottoming Chinese economy. As a result of these geopolitical risks, we believe that central banks around the world will remain accommodative and interest rate increases will be on-hold for 2020. In our view, inflationary pressures appear tame at present. Despite a slowing pace of growth, we believe that labor markets remain tight at this stage of the economic cycle and the capital markets remain receptive to companies that need to raise or refinance attractively priced debt.
Top Ten Holdings
as of December 31, 2019
(as a percentage of net assets) |
| |
| ProLogis, Inc. | | 5.1 | % |
| Equity Residential | | 3.3 | % |
| Link REIT | | 3.2 | % |
| Simon Property Group, Inc. | | 3.1 | % |
| Invitation Homes, Inc. | | 2.7 | % |
| VEREIT, Inc. | | 2.5 | % |
| Welltower, Inc. | | 2.2 | % |
| Mitsubishi Estate Co., Ltd. | | 2.2 | % |
| Alexandria Real Estate Equities, Inc. | | 2.1 | % |
| GLP J-Reit | | 2.0 | % |
| |
Portfolio holdings are subject to change daily. |
The Portfolio outperformed the FTSE EPRA Nareit Developed Index during the period as value was added in each of the three major geographic regions. Stock selection was the driver of outperformance as sector allocation decisions detracted from relative performance during the period. The Americas region was the top contributor to performance and was led by stock selection in the U.S. Portfolio holdings in the healthcare, technology real estate and net lease sectors were the top contributors. Positions in the office, shopping center and storage sectors also added value. In Europe, holdings in the U.K. and Continental Europe contributed to relative performance. In the U.K., portfolio holdings in the student housing, industrial and storage sectors were the top performers. Selective positioning in German residential and Scandinavian companies drove positive stock selection on the Continent. Stock selection in the Asia-Pacific region was positive during the period as stock selection in Australia, Japan and Singapore contributed to performance, while stock selection in Hong Kong was a modest drag. Sector allocation decisions detracted from relative performance as positioning in the Americas accounted for essentially all of the shortfall. An overweight to the underperforming U.S. technology real estate sector was the primary detractor during the period, while sector allocation in Europe and the Asia-Pacific region was also a slight drag.
Current Strategy and Outlook: We believe that real estate stocks have good earnings growth potential and a 3–4% dividend yield that should grow in line with earnings. In our view, real estate stocks are attractively priced versus the private real estate and fixed income markets. Additionally, in our opinion, there is a significant amount of capital amassing in the private real estate market that could lead to increased M&A activity.
We are positive on property types and markets with valuations that we believe are attractive relative to their growth. In the U.S., we favor data centers, cell towers, West Coast office, grocery anchored shopping centers, medical office, life science, and gaming real estate investment trusts (“REITs”).
In the Asia-Pacific region, we favor Japanese logistics REITs as well as companies that have the potential for corporate governance enhancements. In Hong Kong, given the geopolitical uncertainty, we emphasize companies that have what we believe to be the best in class
5
| VY® CLARION GLOBAL REAL ESTATE PORTFOLIO | PORTFOLIO MANAGERS’ REPORT |
| | |
management teams and conservatively capitalized balance sheets. In Australia, we prefer diversified real estate companies as well as companies that levered their operating expertise and capital as asset managers.
In Europe, we favor the U.K. niche sectors of student housing, self-storage and the industrial sector, all of which continue to generate superior earnings growth on strong fundamentals. In Continental Europe, we continue to prefer property companies in markets with superior growth, including the Nordic region and Spain. We have selectively added deeply discounted names in the retail and office sectors.
We are cautious and selective in markets and property types which, in our view, screen expensive relative to the rate of earnings growth. This includes Singapore, Canada and the U.S. skilled nursing, and industrial sectors. This also includes Class B mall/shopping center companies globally. In Europe, we are cautious on the German residential sector given its renewed regulatory risk in Berlin. We also remain cautious on retail despite more attractive valuations. In Australia, our outlook is mixed as fundamentals range from a robust industrial market to an uncertain retail market, and a residential market which is finding a bottom. Lastly, we remain cautious in Hong Kong, as the geopolitical uncertainly is weighing on property fundamentals.
The views expressed in this commentary are informed opinions. They should not be considered promises or advice. The views expressed reflect those of the portfolio managers, only through the end of the period as stated on the cover. The portfolio managers’ views are subject to change at any time based on market and other conditions.
Portfolio holdings and characteristics are subject to change and may not be representative of current holdings and characteristics. Portfolio holdings are subject to change daily. The outlook for this Portfolio may differ from that presented for other Voya mutual funds. This report contains statements that may be “forward-looking” statements. Actual results may differ materially from those projected in the “forward-looking” statements. The Portfolio’s performance returns shown reflect applicable fee waivers and/or expense limits in effect during this period. Absent such fee waivers/expense limitations, if any, performance would have been lower. Performance for the different classes of shares will vary based on differences in fees associated with each class. An index has no cash in its portfolio and imposes no sales charges. An investor cannot invest directly in an index.
6
| PORTFOLIO MANAGERS’ REPORT | VY® CLARION GLOBAL REAL ESTATE PORTFOLIO |
| | |
| Average Annual Total Returns for the Periods Ended December 31, 2019 |
|---|
| | 1 Year | | 5 Year | | 10 Year |
|---|
| Class ADV | | | 23.99 | % | | | 4.06 | % | | | 6.92 | % |
| Class I | | | 24.74 | % | | | 4.68 | % | | | 7.57 | % |
| Class S | | | 24.35 | % | | | 4.40 | % | | | 7.29 | % |
| Class S2 | | | 24.15 | % | | | 4.26 | % | | | 7.13 | % |
| FTSE EPRA Nareit Developed Index | | | 21.91 | % | | | 5.56 | % | | | 8.37 | % |
S&P 500® Index | | | 31.49 | % | | | 11.70 | % | | | 13.56 | % |
Based on a $10,000 initial investment the graph and table above illustrate the total return of VY® Clarion Global Real Estate Portfolio against the indices indicated. An index is unmanaged and has no cash in its portfolio and imposes no sales charges. An investor cannot invest directly in the index.
The Portfolio’s performance is shown without the imposition of any expenses or charges which are, or may be, imposed under your variable annuity contract or variable life insurance policy. Total returns would have been lower if such expenses or charges were included.
The graph and performance table do not reflect the deduction of taxes that a shareholder will pay on Portfolio distributions or the redemption of Portfolio shares.
The performance shown may include the effect of fee waivers and/or expense reimbursements by the Investment Adviser and/or other service
providers, which have the effect of increasing total return. Had all fees and expenses been considered, the total returns would have been lower.
The performance update illustrates performance for a variable investment option available through a variable annuity contract or a variable life insurance policy. The performance shown indicates past performance and is not a projection or prediction of future results. Actual investment returns and principal value will fluctuate so that shares and/or units, at redemption, may be worth more or less than their original cost. Please log on to www.voyainvestments.com or call (800) 366-0066 to get performance through the most recent month end.
Portfolio holdings are subject to change daily.
7
| VY® INVESCO GROWTH AND INCOME PORTFOLIO | PORTFOLIO MANAGERS’ REPORT |
| | |
Sector Diversification
as of December 31, 2019
(as a percentage of net assets) |
| Financials | | 25.5 | % |
| Health Care | | 16.4 | % |
| Information Technology | | 10.9 | % |
| Energy | | 10.6 | % |
| Consumer Discretionary | | 8.6 | % |
| Consumer Staples | | 7.8 | % |
| Industrials | | 6.6 | % |
| Materials | | 4.1 | % |
| Communication Services | | 4.0 | % |
| Utilities | | 2.1 | % |
| Assets in Excess of Other Liabilities* | | 3.4 | % |
| Net Assets | | 100.0 | % |
* Includes short-term investments. |
Portfolio holdings are subject to change daily. |
VY® Invesco Growth and Income Portfolio (the “Portfolio”) seeks long-term growth of capital and income. The Portfolio is managed* by Brian Jurkash, co-lead portfolio manager, Matthew Titus, co-lead portfolio manager and Sergio Marcheli, portfolio manager, of Invesco Advisers, Inc. — the Sub-Adviser.
Performance: For the year ended December 31, 2019, the Portfolio’s Class S shares provided a total return of 24.73%, compared to the Russell 1000® Value Index, which returned 26.54%, for the same period.
Portfolio Specifics: For the year ended December 31, 2019, the Portfolio underperformed the Russell 1000® Value Index.
Stock selection in consumer discretionary was the largest detractor from relative performance within the Portolio, due largely to Capri Holdings and Carnival Corporation. Capri Holdings’ Michael Kors brand has suffered from declining sales, and the company reduced its outlook for the brand in 2020. Shares of cruise operator Carnival declined in June after the company reported profit declines and a weaker outlook for the remainder of 2019.
The Portfolio’s cash position also detracted from relative returns. While less than 5% on average, cash created a drag in the strong equity market rally.
Materials also detracted from relative returns, due primarily to The Mosaic Company, a potash and phosphate supplier. Mosaic announced plans to reduce phosphate production, which is intended to benefit the company long term, but has the potential to negatively affect short-term earnings.
Security selection in financials, particularly banks, was the largest positive contributor to the Portfolio’s relative returns. Following a sharp sell-off in the fourth quarter of 2018, banks rebounded in the first quarter of 2019, and in our view, performed well throughout the year as revenues have generally improved and companies continue to return capital to shareholders through stock buybacks and increased dividends.
Stock selection in health care also contributed to relative performance. Within the sector, Celgene was a key contributor. The company was acquired by Bristol Meyers Squibb at a significant premium, and shares of the acquisition target rose sharply following the announcement.
Top Ten Holdings
as of December 31, 2019*
(as a percentage of net assets) |
| |
| Johnson & Johnson | | 3.6 | % |
| Bank of America Corp. | | 3.4 | % |
| Philip Morris International, Inc. | | 3.2 | % |
| Citigroup, Inc. | | 3.1 | % |
| American International Group, Inc. | | 2.9 | % |
| Morgan Stanley | | 2.6 | % |
| General Motors Co. | | 2.6 | % |
| PNC Financial Services Group, Inc. | | 2.5 | % |
| General Dynamics Corp. | | 2.2 | % |
| Royal Dutch Shell PLC — Class A | | 2.1 | % |
* Excludes short-term investments. |
Portfolio holdings are subject to change daily. |
| |
The Portfolio held currency forward contracts during the year for the purpose of hedging currency exposure of non-U.S.-based companies held in the Portfolio. These derivatives were not for speculative purposes or leverage, and these positions had a small negative impact on the Portfolio’s relative performance for the year.
Current Strategy and Outlook: During the year, the team reduced the Portfolio’s overweights relative to the Russell 1000® Value Index in financials and energy, and increased exposure to consumer staples, materials and consumer discretionary. At the end of the year, the Portfolio’s largest overweight exposures were in the information technology, health care and financials sectors, while the largest underweight exposures were in the real estate, utilities and communication services sectors.
| * | | Effective December 31, 2019, Thomas B. Bastian was removed as a portfolio manager to the Portfolio. |
The views expressed in this commentary are informed opinions. They should not be considered promises or advice. The views expressed reflect those of the portfolio managers, only through the end of the period as stated on the cover. The portfolio managers’ views are subject to change at any time based on market and other conditions.
Portfolio holdings and characteristics are subject to change and may not be representative of current holdings and characteristics. Portfolio holdings are subject to change daily. The outlook for this Portfolio may differ from that presented for other Voya mutual funds. This report contains statements that may be “forward-looking” statements. Actual results may differ materially from those projected in the “forward-looking” statements. The Portfolio’s performance returns shown reflect applicable fee waivers and/or expense limits in effect during this period. Absent such fee waivers/expense limitations, if any, performance would have been lower. Performance for the different classes of shares will vary based on differences in fees associated with each class. An index has no cash in its portfolio and imposes no sales charges. An investor cannot invest directly in an index.
8
| PORTFOLIO MANAGERS’ REPORT | VY® INVESCO GROWTH AND INCOME PORTFOLIO |
| | |
| Average Annual Total Returns for the Periods Ended December 31, 2019 |
|---|
| | 1 Year | | 5 Year | | 10 Year |
|---|
| Class ADV | | | 24.30 | % | | | 7.02 | % | | | 9.88 | % |
| Class I | | | 24.98 | % | | | 7.67 | % | | | 10.54 | % |
| Class S | | | 24.73 | % | | | 7.40 | % | | | 10.26 | % |
| Class S2 | | | 24.47 | % | | | 7.23 | % | | | 10.09 | % |
Russell 1000® Value Index | | | 26.54 | % | | | 8.29 | % | | | 11.80 | % |
Based on a $10,000 initial investment, the graph and table above illustrate the total return of VY® Invesco Growth and Income Portfolio against the index indicated. The index is unmanaged and has no cash in its portfolio and imposes no sales charges. An investor cannot invest directly in an index.
The Portfolio’s performance is shown without the imposition of any expenses or charges which are, or may be, imposed under your variable annuity contract or variable life insurance policy. Total returns would have been lower if such expenses or charges were included.
The performance graph and table do not reflect the deduction of taxes that a shareholder will pay on Portfolio distributions or the redemption of Portfolio shares.
The performance shown may include the effect of fee waivers and/or expense reimbursements by the Investment Adviser and/or other service
providers, which have the effect of increasing total return. Had all fees and expenses been considered, the total returns would have been lower.
The performance update illustrates performance for a variable investment option available through a variable annuity contract or a variable life insurance policy. The performance shown indicates past performance and is not a projection or prediction of future results. Actual investment returns and principal value will fluctuate so that shares and/or units, at redemption, may be worth more or less than their original cost. Please log on to www.voyainvestments.com or call (800) 366-0066 to get performance through the most recent month end.
Portfolio holdings are subject to change daily.
9
VY® JPMORGAN EMERGING
MARKETS EQUITY PORTFOLIO | PORTFOLIO MANAGERS’ REPORT |
| | |
Geographic Diversification
as of December 31, 2019
(as a percentage of net assets) |
| China | | 29.1 | % |
| India | | 19.9 | % |
| Hong Kong | | 7.8 | % |
| Taiwan | | 7.5 | % |
| Brazil | | 6.3 | % |
| South Korea | | 5.2 | % |
| South Africa | | 4.2 | % |
| Mexico | | 3.6 | % |
| Indonesia | | 2.5 | % |
| Russia | | 2.3 | % |
| Countries between 0.2%–2.0%ˆ | | 11.5 | % |
| Assets in Excess of Other Liabilities* | | 0.1 | % |
| Net Assets | | 100.0 | % |
* Includes short-term investments. |
ˆ Includes 11 countries, which each represents 0.2%–2.0% of net assets. |
Portfolio holdings are subject to change daily. |
VY® JPMorgan Emerging Markets Equity Portfolio (the “Portfolio”) seeks capital appreciation. The Portfolio is managed by Austin Forey, Managing Director, Leon Eidelman, CFA and Managing Director, and Amit Mehta, CFA and Executive Director; each a Portfolio Manager of J.P. Morgan Investment Management Inc. — the Sub-Adviser.
Performance: For the year ended December 31, 2019, the Portfolio’s Class S Shares provided a total return of 31.91% compared to the MSCI Emerging Markets IndexSM (“MSCI EM IndexSM”), which returned 18.42% for the same period.
Portfolio Specifics: The Portfolio outperformed MSCI EM IndexSM for the year ended December 31, 2019, as stock selection and country allocation contributed to results.
Stock selection in China was a significant contributor to returns during the year, specifically driven by the Portfolio’s exposure to New Oriental Education, a provider of private educational services with a presence in over 83 cities across China. The company has continued to benefit from industry consolidation as increased regulatory scrutiny has, in our view, weighed on the smaller players in the space.
Our exposure to MercadoLibre, which is based in Argentina and is Latin America’s leading e-commerce company, was a top contributor in the period. The stock rose 95.3% (in USD terms) during the year, and has continued to benefit from consistently strong quarterly results and growth in its payments platform, MercaoPago.
On the downside, the Portfolio’s lack of exposure to Gazprom, one of the largest producers of gas in the world and a state owned enterprise, was a leading detractor from relative returns during the period. For a number of years, the company has declined to increase its dividend to levels requested by the Russian Government citing CAPEX requirements. The stock price was boosted by the unexpected announcement that the company will raise the 2018 dividend by 60%. Despite what we consider to be appealing change in the company, it has 40 red flags in our checklist of risk factors, a high level, and so is not considered a suitable investment, in our view.
In South Africa, the Portfolio’s exposure to Mr. Price, a discount retail store, weighed on relative performance. The stock fell 20.7% (in USD terms) during the period, on the back of the weak consumer environment in South Africa.
Top Ten Holdings
as of December 31, 2019
(as a percentage of net assets) |
| |
| Alibaba Group Holding Ltd. ADR | | 5.6 | % |
| Housing Development Finance Corp. | | 4.8 | % |
| AIA Group Ltd. | | 4.6 | % |
| HDFC Bank Ltd. ADR | | 4.1 | % |
| Samsung Electronics Co., Ltd. | | 4.1 | % |
| Tencent Holdings Ltd. | | 4.0 | % |
| Taiwan Semiconductor Manufacturing Co., Ltd. ADR | | 3.5 | % |
| Ping An Insurance Group Co. of China Ltd. — H Shares | | 2.6 | % |
| Sberbank of Russia PJSC | | 2.3 | % |
| Techtronic Industries Co., Ltd. | | 2.1 | % |
Portfolio holdings are subject to change daily. |
Current Strategy and Outlook: In 2020, in our view, the biggest risks for emerging markets (“EM”) remain slowing global growth, trade tensions, and a stubbornly-strong U.S. dollar. However, over the past six months, key emerging & developed market central banks have cut interest rates a cumulative 41 times, a number comparable to the 2008 financial crisis. We believe this easing has already helped economic indicators improve since the middle of 2019 and could continue to support a recovery.
In an environment where earnings are challenged, we look for the opportunities in EM equities where earnings growth can compound over the long-run. We believe that month-end valuations of 1.70 times book value are no longer as compelling as they were 6 months ago, but remain below the long-term average.
The views expressed in this commentary are informed opinions. They should not be considered promises or advice. The views expressed reflect those of the portfolio managers, only through the end of the period as stated on the cover. The portfolio managers’ views are subject to change at any time based on market and other conditions.
Portfolio holdings and characteristics are subject to change and may not be representative of current holdings and characteristics. Portfolio holdings are subject to change daily. The outlook for this Portfolio may differ from that presented for other Voya mutual funds. This report contains statements that may be “forward-looking” statements. Actual results may differ materially from those projected in the “forward-looking” statements. The Portfolio’s performance returns shown reflect applicable fee waivers and/or expense limits in effect during this period. Absent such fee waivers/expense limitations, if any, performance would have been lower. Performance for the different classes of shares will vary based on differences in fees associated with each class. An index has no cash in its portfolio and imposes no sales charges. An investor cannot invest directly in an index.
10
| PORTFOLIO MANAGERS’ REPORT | VY® JPMORGAN EMERGING
MARKETS EQUITY PORTFOLIO |
| | |

| Average Annual Total Returns for the Periods Ended December 31, 2019 |
|---|
| | 1 Year | | 5 Year | | 10 Year |
|---|
| Class ADV | | | 31.47 | % | | | 7.98 | % | | | 4.85 | % |
| Class I | | | 32.23 | % | | | 8.64 | % | | | 5.48 | % |
| Class S | | | 31.91 | % | | | 8.36 | % | | | 5.22 | % |
| Class S2 | | | 31.64 | % | | | 8.19 | % | | | 5.06 | % |
MSCI EM IndexSM | | | 18.42 | % | | | 5.61 | % | | | 3.68 | % |
Based on a $10,000 initial investment, the graph and table above illustrate the total return of the VY® JPMorgan Emerging Markets Equity Portfolio against the index indicated. The index is unmanaged and has no cash in its portfolio and imposes no sales charges. An investor cannot invest directly in an index.
The Portfolio’s performance is shown without the imposition of any expenses or charges which are, or may be, imposed under your variable annuity contract or variable life insurance policy. Total returns would have been lower if such expenses or charges were included.
The performance graph and table do not reflect the deduction of taxes that a shareholder will pay on Portfolio distributions or the redemption of Portfolio shares.
The performance shown may include the effect of fee waivers and/or expense reimbursements by the Investment Adviser and/or other service
providers, which have the effect of increasing total return. Had all fees and expenses been considered, the total returns would have been lower.
The performance update illustrates performance for a variable investment option available through a variable annuity contract or a variable life insurance policy. The performance shown indicates past performance and is not a projection or prediction of future results. Actual investment returns and principal value will fluctuate so that shares and/or units, at redemption, may be worth more or less than their original cost. Please log on to www.voyainvestments.com or call (800) 366-0066 to get performance through the most recent month end.
Portfolio holdings are subject to change daily.
11
VY® MORGAN STANLEY GLOBAL
FRANCHISE PORTFOLIO | PORTFOLIO MANAGERS’ REPORT |
| | |
Geographic Diversification
as of December 31, 2019
(as a percentage of net assets) |
| United States | | 64.5 | % |
| United Kingdom | | 18.4 | % |
| France | | 5.7 | % |
| Germany | | 5.6 | % |
| Netherlands | | 3.3 | % |
| Italy | | 0.9 | % |
| Assets in Excess of Other Liabilities* | | 1.6 | % |
| Net Assets | | 100.0 | % |
* Includes short-term investments. |
Portfolio holdings are subject to change daily. |
VY® Morgan Stanley Global Franchise Portfolio (the “Portfolio”) seeks long-term capital appreciation. The Portfolio is managed by William D. Lock, Managing Director, Bruno Paulson, Managing Director, Nic Sochovsky, Managing Director, Vladimir A. Demine, Executive Director, Dirk Hoffmann-Becking, Executive Director, Marcus Watson, Executive Director, Alex Gabriele, Executive Director, Nathan Wong, Executive Director, and Richard Perrott, Vice President, Portfolio Managers* of Morgan Stanley Investment Management Inc. — the Sub-Adviser.
Performance: For the year ended December 31, 2019, the Portfolio’s Class S shares provided a total return of 29.34% compared to the MSCI World IndexSM (the “Index”), which returned 27.67% for the same period.
Portfolio Specifics: The strong fourth quarter of 2019 rounded off a very strong year, with the Index finishing up 28% in USD (27% local). In sector terms, there were two major outliers, with information technology up a massive 48%, while energy, by contrast, only gained 11%. The other sectors were relatively tightly bunched, although the more defensive sectors such as consumer staples, health care and utilities (all +23%) were a little behind the Index. The U.S. (+31%) once again outperformed the Index, along with Netherlands (+32% USD, +34% local) and Switzerland (+32%, +30%). At the other end of the spectrum, Hong Kong (+10% USD and local), Spain (+12%, +14%) and the UK (+21%, +16%) were affected by political uncertainties, while Singapore (+15%, +13%), Japan (+20%, +18%) and Germany (+21%, +23%) were hit by worries about trade and industrial production.
For the year, sector allocation and stock selection were both positive. The overweight in information technology and the lack of energy stocks were both helpful for sector allocation, more than making up for the overweight in consumer staples and the drag from the small cash allocation in the very strong year for the markets. The outperformance in the health care and financials sectors drove the positive stock selection, despite underperformance in communication services and consumer staples.
Over the year the largest absolute contributors were Microsoft (+3.91%), Philip Morris International (+2.25%) and Accenture (+2.17%). The largest absolute detractors were Fox Corporation (-0.08%) and Altria (-0.05%), while Disney was the smallest absolute contributor (+0.02%).
Top Ten Holdings
as of December 31, 2019
(as a percentage of net assets) |
| |
| Microsoft Corp. | | 8.3 | % |
| Philip Morris International, Inc. | | 7.9 | % |
| Reckitt Benckiser Group PLC | | 7.4 | % |
| SAP SE | | 5.6 | % |
| Visa, Inc. — Class A | | 5.4 | % |
| Accenture PLC | | 4.8 | % |
| Automatic Data Processing, Inc. | | 4.2 | % |
| Baxter International, Inc. | | 4.0 | % |
| Danaher Corp. | | 3.8 | % |
| Becton Dickinson & Co. | | 3.7 | % |
Portfolio holdings are subject to change daily. |
Current Strategy and Outlook: We advocate the case for quality by looking for companies with the intangible assets to give them both recurring revenue and pricing power, along with the ability to sustain high returns on capital. We believe one of the pluses such companies offer is resilience in tough times: the recurring revenue protects sales and the pricing power protects margins. In our view, in 2019, the Portfolio’s companies displayed this economic resilience, with the earnings continuing to compound steadily while the market as a whole failed to deliver any earnings growth. At a time of heightened multiples and high uncertainty, we would argue that it makes sense to go with the relative safety and durability of high-quality compounders.
| * | | Effective May 1, 2019, Nathan Wong was added as a portfolio manager to the Portfolio. |
The views expressed in this commentary are informed opinions. They should not be considered promises or advice. The views expressed reflect those of the portfolio managers, only through the end of the period as stated on the cover. The portfolio managers’ views are subject to change at any time based on market and other conditions.
Portfolio holdings and characteristics are subject to change and may not be representative of current holdings and characteristics. Portfolio holdings are subject to change daily. The outlook for this Portfolio may differ from that presented for other Voya mutual funds. This report contains statements that may be “forward-looking” statements. Actual results may differ materially from those projected in the “forward-looking” statements. The Portfolio’s performance returns shown reflect applicable fee waivers and/or expense limits in effect during this period. Absent such fee waivers/expense limitations, if any, performance would have been lower. Performance for the different classes of shares will vary based on differences in fees associated with each class. An index has no cash in its portfolio and imposes no sales charges. An investor cannot invest directly in an index.
12
| PORTFOLIO MANAGERS’ REPORT | VY® MORGAN STANLEY GLOBAL
FRANCHISE PORTFOLIO |
| | |
| Average Annual Total Returns for the Periods Ended December 31, 2019 |
|---|
| | 1 Year | | 5 Year | | 10 Year |
|---|
| Class ADV | | | 28.89 | % | | | 11.98 | % | | | 11.97 | % |
Class R6(1) | | | 29.74 | % | | | 12.59 | % | | | 12.47 | % |
| Class S | | | 29.34 | % | | | 12.37 | % | | | 12.36 | % |
| Class S2 | | | 29.15 | % | | | 12.20 | % | | | 12.20 | % |
MSCI World IndexSM | | | 27.67 | % | | | 8.74 | % | | | 9.47 | % |
Based on a $10,000 initial investment, the graph and table above illustrate the total return of VY® Morgan Stanley Global Franchise Portfolio against the index indicated. The index is unmanaged and has no cash in its portfolio and imposes no sales charges. An investor cannot invest directly in an index.
The Portfolio’s performance is shown without the imposition of any expenses or charges which are, or may be, imposed under your variable annuity contract or variable life insurance policy. Total returns would have been lower if such expenses or charges were included.
The performance graph and table do not reflect the deduction of taxes that a shareholder will pay on Portfolio distributions or the redemption of Portfolio shares.
The performance shown may include the effect of fee waivers and/or expense reimbursements by the Investment Adviser and/or other service providers, which have the effect of increasing total return. Had all fees and expenses been considered, the total returns would have been lower.
The performance update illustrates performance for a variable investment option available through a variable annuity contract or
a variable life insurance policy. The performance shown indicates past performance and is not a projection or prediction of future results. Actual investment returns and principal value will fluctuate so that shares and/or units, at redemption, may be worth more or less than their original cost. Please log on to www.voyainvestments.com or call (800) 366-0066 to get performance through the most recent month end.
Portfolio holdings are subject to change daily.
| (1) | | Class R6 incepted on May 3, 2016. The Class R6 shares performance shown for the period prior to their inception date is the performance of Class S shares without adjustment for any differences in the expenses between the two classes. If adjusted for such differences, returns would be different. |
13
VY® T. ROWE PRICE CAPITAL
APPRECIATION PORTFOLIO | PORTFOLIO MANAGERS’ REPORT |
| | |
Investment Type Allocation
as of December 31, 2019
(as a percentage of net assets) |
| Common Stock | | 63.3 | % |
| Corporate Bonds/Notes | | 16.4 | % |
| Preferred Stock | | 5.3 | % |
| Bank Loans | | 4.6 | % |
| Asset-Backed Securities | | 0.3 | % |
| Assets in Excess of Other Liabilities* | | 10.1 | % |
| Net Assets | | 100.0 | % |
* Includes short-term investments. |
Portfolio holdings are subject to change daily. |
VY® T. Rowe Price Capital Appreciation Portfolio (the “Portfolio”) seeks, over the long-term, a high total investment return, consistent with the preservation of capital and with prudent investment risk. The Portfolio is managed by David R. Giroux, CFA and Vice President of T. Rowe Price Associates, Inc. — the Sub-Adviser.
Performance: For the year ended December 31, 2019, the Portfolio’s Class S shares provided a total return of 24.36%. By comparison, the S&P 500® Index, the Bloomberg Barclays U.S. Government/Credit Index, and the 60% S&P 500® Index/40% Bloomberg Barclays U.S. Government/Credit Index returned 31.49%, 9.71% and 22.64% for the same period.
Portfolio Specifics: In 2019, the Portfolio posted a positive return but underperformed its all-equity benchmark, the S&P 500® Index. The Portfolio’s equity and fixed income allocations had positive returns and outperformed their benchmarks, the S&P 500® Index and the Bloomberg Barclays U.S. Government/Credit Index, respectively.
Our overall fixed income weight declined from the prior year, as we eliminated our position in U.S. Treasuries on strength. Our largest exposure in fixed income remains high yield, where we are focused on short duration and/or idiosyncratic issues.
Within equities, the information technology sector detracted from relative returns due to stock picks, such as Maxim Integrated Products, although the negative impact was partially offset by a beneficial overweight. Despite delivering a double-digit return, the analog semiconductor company trailed the broader information technology sector on soft demand in its industrial segment, including in China, and slower auto sales. No other sector detracted from relative results. Conversely, the financials sector drove relative gains due to strong security selection. S&P Global, which provides credit ratings, benchmarks, analytics, and data platforms related to the capital and commodities markets, outperformed during the year amid strong corporate debt issuance and a healthy equity market backdrop. Security choices in the health care sector, such as Danaher, also aided relative results, although a detrimental overweight position partially tempered the gains. Danaher outperformed on continued strong execution and news in February it will buy GE’s biopharma business, which sells supplies and equipment for developing and producing biologic drugs, for $21 billion.
Top Ten Holdings
as of December 31, 2019*
(as a percentage of net assets) |
| |
| Microsoft Corp. | | 4.2 | % |
| Visa, Inc. — Class A | | 3.6 | % |
| General Electric Co. | | 3.6 | % |
| PerkinElmer, Inc. | | 3.1 | % |
| Fiserv, Inc. | | 3.2 | % |
| Marsh & McLennan Cos., Inc. | | 3.0 | % |
| Danaher Corp. | | 2.6 | % |
| Becton Dickinson & Co. | | 2.5 | % |
| Alphabet, Inc. — Class C | | 2.3 | % |
| Thermo Fisher Scientific, Inc. | | 2.3 | % |
* Excludes short-term investments. |
Portfolio holdings are subject to change daily. |
During the reporting period, the covered call strategy represented, on average, 11.88% of the overall Portfolio and generated a return of approximately 20.85%. The covered call strategy’s estimated contribution to the Portfolio’s total return was 2.51%. The estimated return impact from employing options was –78 basis points (–0.78%) for the reporting period December 31, 2018, through December 31, 2019.
Current Strategy and Outlook: Risk assets persevered to deliver a strong rally from the marked downturn at the end of 2018, in our opinion, seeming to shrug off the myriad of risks that headlined 2019, from Brexit concerns and U.S.-China trade tensions to sluggish global growth and disappointing manufacturing data. While we believe that current valuations suggest markets expect headwinds to recede and growth to accelerate, modest earnings growth expectations, upcoming U.S. election uncertainty, and the muted impact from accommodative monetary policy have created a scenario where we believe risk is skewed to the downside. Given our position late in the cycle and the risks facing the global economy, we have a cautious view and continue to position the Portfolio conservatively.
The views expressed in this commentary are informed opinions. They should not be considered promises or advice. The views expressed reflect those of the portfolio managers, only through the end of the period as stated on the cover. The portfolio managers’ views are subject to change at any time based on market and other conditions.
Portfolio holdings and characteristics are subject to change and may not be representative of current holdings and characteristics. Portfolio holdings are subject to change daily. The outlook for this Portfolio may differ from that presented for other Voya mutual funds. This report contains statements that may be “forward-looking” statements. Actual results may differ materially from those projected in the “forward-looking” statements. The Portfolio’s performance returns shown reflect applicable fee waivers and/or expense limits in effect during this period. Absent such fee waivers/expense limitations, if any, performance would have been lower. Performance for the different classes of shares will vary based on differences in fees associated with each class. An index has no cash in its portfolio and imposes no sales charges. An investor cannot invest directly in an index.
14
| PORTFOLIO MANAGERS’ REPORT | VY® T. ROWE PRICE CAPITAL
APPRECIATION PORTFOLIO |
| | |
| Average Annual Total Returns for the Periods Ended December 31, 2019 |
|---|
| | 1 Year | | 5 Year | | 10 Year |
|---|
| Class ADV | | | 23.99 | % | | | 9.95 | % | | | 11.27 | % |
| Class I | | | 24.71 | % | | | 10.61 | % | | | 11.93 | % |
Class R6(1) | | | 24.74 | % | | | 10.62 | % | | | 11.94 | % |
| Class S | | | 24.36 | % | | | 10.33 | % | | | 11.65 | % |
| Class S2 | | | 24.19 | % | | | 10.17 | % | | | 11.49 | % |
S&P 500® Index | | | 31.49 | % | | | 11.70 | % | | | 13.56 | % |
| Bloomberg Barclays U.S. Government/Credit Index | | | 9.71 | % | | | 3.23 | % | | | 3.96 | % |
60% S&P 500® Index/40% Bloomberg Barclays U.S. Government/Credit Index | | | 22.64 | % | | | 8.45 | % | | | 9.87 | % |
Based on a $10,000 initial investment, the graph and table above illustrate the total return of VY® T. Rowe Price Capital Appreciation Portfolio against the indices indicated. An index is unmanaged and has no cash in its portfolio and imposes no sales charges. An investor cannot invest directly in an index.
The Portfolio’s performance is shown without the imposition of any expenses or charges which are, or may be, imposed under your variable annuity contract or variable life insurance policy. Total returns would have been lower if such expenses or charges were included.
The performance graph and table do not reflect the deduction of taxes that a shareholder will pay on Portfolio distributions or the redemption of Portfolio shares.
The performance shown may include the effect of fee waivers and/or expense reimbursements by the Investment Adviser and/or other service providers, which have the effect of increasing total return. Had all fees and expenses been considered, the total returns would have been lower.
The performance update illustrates performance for a variable investment option available through a variable annuity contract or a
variable life insurance policy. The performance shown indicates past performance and is not a projection or prediction of future results. Actual investment returns and principal value will fluctuate so that shares and/or units, at redemption, may be worth more or less than their original cost. Please log on to www.voyainvestments.com or call (800) 366-0066 to get performance through the most recent month end.
Portfolio holdings are subject to change daily.
| (1) | | Class R6 incepted on May 3, 2016. The Class R6 shares performance shown for the period prior to their inception date is the performance of Class I shares without adjustment for any differences in the expenses between the two classes. If adjusted for such differences, returns would be different. |
15
| VY® T. ROWE PRICE EQUITY INCOME PORTFOLIO | PORTFOLIO MANAGERS’ REPORT |
| | |
Sector Diversification
as of December 31, 2019
(as a percentage of net assets) |
| Financials | | 23.9 | % |
| Health Care | | 13.4 | % |
| Industrials | | 11.9 | % |
| Energy | | 8.7 | % |
| Utilities | | 8.4 | % |
| Information Technology | | 8.0 | % |
| Consumer Staples | | 7.9 | % |
| Communication Services | | 6.1 | % |
| Materials | | 4.5 | % |
| Real Estate | | 3.5 | % |
| Consumer Discretionary | | 2.4 | % |
| Assets in Excess of Other Liabilities* | | 1.3 | % |
| Net Assets | | 100.0 | % |
* Includes short-term investments. |
Portfolio holdings are subject to change daily. |
VY® T. Rowe Price Equity Income Portfolio (the “Portfolio”) seeks a high level of dividend income as well as long-term growth of capital primarily through investments in stocks. The Portfolio is managed by John Linehan, Head of U.S. Equity and Portfolio Manager of T. Rowe Price Associates, Inc. — the Sub-Adviser.
Performance: For the year ended December 31, 2019, the Portfolio’s Class S shares provided a total return of 26.42% compared to the Russell 1000® Value Index and the S&P 500® Index, which returned 26.54% and 31.49% respectively, for the same period.
Portfolio Specifics: Gross of fees and expenses, the Portfolio performed in line with the Russell 1000® Value Index for the reporting period. Stock selection in consumer staples was the leading contributor to relative returns for the reporting period, including Tyson Foods and Conagra Brands. Shares of Tyson Foods continued to benefit from the ongoing effects of African swine fever, causing global protein prices to rise in wake of the outbreak, and the reopening of the Chinese market to U.S. poultry sales later in the year.
Stock selection in information technology also boosted relative returns. Shares of Qualcomm finished higher as a result of the chip manufacturer reaching a multibillion-dollar settlement with Apple in the second quarter, followed by a strong revenue beat later in the year, as MSM shipments exceeded expectations.
The energy sector bolstered returns due to favorable stock selection, driven by TC Energy.
In contrast, stock selection in the communication services sector was the largest detractor from relative results. Shares of Telefonica underperformed during the year resulting from structural foreign exchange risk pertaining to Argentina and Great Britain and less than favorable performance of the broader Spanish telecommunications sector due to an increasingly competitive landscape.
Top Ten Holdings
as of December 31, 2019
(as a percentage of net assets) |
| |
| Wells Fargo & Co. | | 3.8 | % |
| JPMorgan Chase & Co. | | 3.4 | % |
| Qualcomm, Inc. | | 2.5 | % |
| Total S.A. ADR | | 2.4 | % |
| Southern Co. | | 2.4 | % |
| Johnson & Johnson | | 2.3 | % |
| Morgan Stanley | | 1.9 | % |
| Chubb Ltd. | | 1.9 | % |
| Tyson Foods, Inc. | | 1.8 | % |
| General Electric Co. | | 1.8 | % |
Portfolio holdings are subject to change daily. |
The materials sector also hindered relative returns due to stock selection, particularly an investment in DuPont de Nemours. Shares of the company traded lower as a result of falling commodity chemical input prices, slowing demand in end markets, and the announced merger of DuPont’s Nutrition & Biosciences segment with International Flavors & Fragrances via a Reverse Morris Trust.
Current Strategy and Outlook: We believe the current balance of risks in the marketplace suggests caution is warranted. While a strong consumer and what we believe to be a more accommodative monetary policy provide support, we believe regulatory and political risks will be elevated in 2020. Given neutral valuations, we expect positive but muted returns for the equity market in 2020 coupled with the potential for more extreme outcomes. Share price appreciation in recent periods has made pockets of what we believe to be attractive investment opportunities tougher to come by. Despite this challenging environment, we have identified, in our view, attractively valued investment opportunities through bottom-up, fundamental analysis and continue to maintain a disciplined, longer-term approach while also taking advantage of volatility to selectively add shares of what we believe are high-quality companies.
The views expressed in this commentary are informed opinions. They should not be considered promises or advice. The views expressed reflect those of the portfolio managers, only through the end of the period as stated on the cover. The portfolio managers’ views are subject to change at any time based on market and other conditions.
Portfolio holdings and characteristics are subject to change and may not be representative of current holdings and characteristics. Portfolio holdings are subject to change daily. The outlook for this Portfolio may differ from that presented for other Voya mutual funds. This report contains statements that may be “forward-looking” statements. Actual results may differ materially from those projected in the “forward-looking” statements. The Portfolio’s performance returns shown reflect applicable fee waivers and/or expense limits in effect during this period. Absent such fee waivers/expense limitations, if any, performance would have been lower. Performance for the different classes of shares will vary based on differences in fees associated with each class. An index has no cash in its portfolio and imposes no sales charges. An investor cannot invest directly in an index.
16
| PORTFOLIO MANAGERS’ REPORT | VY® T. ROWE PRICE EQUITY INCOME PORTFOLIO |
| | |
| Average Annual Total Returns for the Periods Ended December 31, 2019 |
|---|
| | 1 Year | | 5 Year | | 10 Year |
|---|
| Class ADV | | | 25.93 | % | | | 7.66 | % | | | 10.22 | % |
| Class I | | | 26.66 | % | | | 8.31 | % | | | 10.88 | % |
| Class S | | | 26.42 | % | | | 8.06 | % | | | 10.62 | % |
| Class S2 | | | 26.13 | % | | | 7.88 | % | | | 10.44 | % |
Russell 1000® Value Index | | | 26.54 | % | | | 8.29 | % | | | 11.80 | % |
S&P 500® Index | | | 31.49 | % | | | 11.70 | % | | | 13.56 | % |
Based on a $10,000 initial investment, the graph and table above illustrate the total return of VY® T. Rowe Price Equity Income Portfolio against the indices indicated. An index is unmanaged and has no cash in its portfolio and imposes no sales charges. An investor cannot invest directly in an index.
The Portfolio’s performance is shown without the imposition of any expenses or charges which are, or may be, imposed under your variable annuity contract or variable life insurance policy. Total returns would have been lower if such expenses or charges were included.
The performance graph and table do not reflect the deduction of taxes that a shareholder will pay on Portfolio distributions or the redemption of Portfolio shares.
The performance shown may include the effect of fee waivers and/or expense reimbursements by the Investment Adviser and/or other service providers, which have the effect of increasing total return. Had all fees and expenses been considered, the total returns would have been lower.
The performance update illustrates performance for a variable investment option available through a variable annuity contract or a variable life insurance policy. The performance shown indicates past performance and is not a projection or prediction of future results. Actual investment returns and principal value will fluctuate so that shares and/or units, at redemption, may be worth more or less than their original cost. Please log on to www.voyainvestments.com or call (800) 366-0066 to get performance through the most recent month end.
Portfolio holdings are subject to change daily.
Effective May 25, 2018, the Portfolio changed its benchmark from the S&P 500® Index to the Russell 1000® Value Index because the Russell 1000® Value Index is considered by the Sub-Adviser to be a more appropriate benchmark that better aligns with the Portfolio’s value-focused investment style.
17
VY® T. ROWE PRICE INTERNATIONAL
STOCK PORTFOLIO | PORTFOLIO MANAGERS’ REPORT |
| | |
Geographic Diversification
as of December 31, 2019
(as a percentage of net assets) |
| Japan | | 14.5 | % |
| Netherlands | | 8.3 | % |
| Switzerland | | 7.6 | % |
| France | | 7.1 | % |
| China | | 6.8 | % |
| United Kingdom | | 6.4 | % |
| India | | 5.0 | % |
| Germany | | 4.6 | % |
| South Korea | | 4.4 | % |
| Canada | | 4.1 | % |
| Countries between 0.2%–3.0%ˆ | | 29.3 | % |
| Assets in Excess of Other Liabilities* | | 1.9 | % |
| Net Assets | | 100.0 | % |
* Includes short-term investments. |
ˆ Includes 21 countries, which each represents 0.2%–3.0% of net assets. |
Portfolio holdings are subject to change daily. |
| |
VY® T. Rowe Price International Stock Portfolio (the “Portfolio”) seeks long-term growth of capital. The Portfolio is managed by Richard N. Clattenburg, CFA and Vice President, Portfolio Manager of T. Rowe Price Associates, Inc. — the Sub-Adviser.
Performance: For the year ended December 31, 2019, the Portfolio’s Class I shares provided a total return of 28.04% compared to the MSCI All Country World (ex-U.S.) IndexSM (“MSCI ACWI ex-U.S.”), which returned 21.51% for the same period.
Portfolio Specifics: The Portfolio outperformed its benchmark, the MSCI ACWI ex-U.S., for the period ended December 31, 2019. Broadly speaking, stock selection and sector allocation aided performance. On the sector level, information technology was the largest contributor due to stock selection and an overweight allocation. Financials and communication services also aided relative returns due to stock selection. In contrast, holdings within industrials and business services detracted. Utilities also hindered relative performance due to stock choices, although an underweight allocation partially offset the negative impact.
Regionally, the Portfolio found relative success in Pacific ex Japan — particularly China — due to favorable security selection. Holdings in Canada were the source of underperformance.
Within the information technology sector, NXP Semiconductors was one of the top relative contributors to the Portfolio in 2019. Strong earnings in April and July helped drive relative outperformance. Much of the strength came from NXP’s mobile division — where mobile payment design efforts paid off — and the communications infrastructure business, which is benefitting more and more from the 5G build-out. Both businesses rely on NXP-specific designs, which also points to ongoing design innovation investments, a major positive in our view. The company continued to deliver good results even amid a challenging environment for semiconductor makers in the latter half of the year. NXP also issued encouraging guidance for the fourth quarter that defied the gloomier expectations from competitors.
Top Ten Holdings
as of December 31, 2019
(as a percentage of net assets) |
| |
| Thales S.A. | | 2.6 | % |
| Taiwan Semiconductor Manufacturing Co., Ltd. | | 2.2 | % |
| Alibaba Group Holding Ltd. ADR | | 2.2 | % |
| Takeda Pharmaceutical Co., Ltd. | | 2.1 | % |
| Housing Development Finance Corp. | | 2.0 | % |
| NXP Semiconductor NV — NXPI — US | | 2.0 | % |
| Naspers Ltd. | | 2.0 | % |
| Essity AB | | 2.0 | % |
| Samsung Electronics Co., Ltd. | | 1.9 | % |
| NAVER Corp. | | 1.9 | % |
Portfolio holdings are subject to change daily. |
The Portfolio’s weakness in the industrials and business services sector was largely explained by Thales, a global aerospace and defense company that specializes in electrical systems. The stock was weak in the third quarter of 2019 as the market continued to worry about falling revenues within Thales’ space division, which builds systems for satellites. That division’s problems in part led the company to cut its guidance in early October on free cash flow conversion. Just a few weeks later it issued poor earnings showing that the headwinds in the space division were larger than anticipated, while execution problems in the defense & security segment in our view, spooked investors as well. The Portfolio held currency forwards and equity options generating gross exposure of approximately 0.6%.
Current Strategy and Outlook: Significant moves by global central banks to loosen monetary policy have eased financial conditions, which we believe is supportive of global economic activity. Indeed, the most recent global manufacturing purchasing managers’ surveys suggest that activity may have turned up recently, such as in Europe, where we have seen early signs of green shoots. While slowing Chinese demand and geopolitical tensions, including protests in Hong Kong and U.S. impeachment proceedings, continue to weigh on global activity, the fading risk of a no-deal Brexit and manageable trade tensions will likely support a rebound in global growth, in our view.
The views expressed in this commentary are informed opinions. They should not be considered promises or advice. The views expressed reflect those of the portfolio managers, only through the end of the period as stated on the cover. The portfolio managers’ views are subject to change at any time based on market and other conditions.
Portfolio holdings and characteristics are subject to change and may not be representative of current holdings and characteristics. Portfolio holdings are subject to change daily. The outlook for this Portfolio may differ from that presented for other Voya mutual funds. This report contains statements that may be “forward-looking” statements. Actual results may differ materially from those projected in the “forward-looking” statements. The Portfolio’s performance returns shown reflect applicable fee waivers and/or expense limits in effect during this period. Absent such fee waivers/expense limitations, if any, performance would have been lower. Performance for the different classes of shares will vary based on differences in fees associated with each class. An index has no cash in its portfolio and imposes no sales charges. An investor cannot invest directly in an index.
18
| PORTFOLIO MANAGERS’ REPORT | VY® T. ROWE PRICE INTERNATIONAL
STOCK PORTFOLIO |
| | |
| Average Annual Total Returns for the Periods Ended December 31, 2019 |
|---|
| | 1 Year | | 5 Year | | 10 Year |
|---|
| Class ADV | | | 27.20 | % | | | 6.80 | % | | | 6.22 | % |
| Class I | | | 28.04 | % | | | 7.46 | % | | | 6.86 | % |
| Class S | | | 27.64 | % | | | 7.19 | % | | | 6.60 | % |
| MSCI ACWI ex-U.S. | | | 21.51 | % | | | 5.51 | % | | | 4.97 | % |
Based on a $10,000 initial investment, the graph and table above illustrate the total return of VY® T. Rowe Price International Stock Portfolio against the index indicated. The index is unmanaged and has no cash in its portfolio and imposes no sales charges. An investor cannot invest directly in an index.
The Portfolio’s performance is shown without the imposition of any expenses or charges which are, or may be, imposed under your variable annuity contract or variable life insurance policy. Total returns would have been lower if such expenses or charges were included.
The performance graph and table do not reflect the deduction of taxes that a shareholder will pay on Portfolio distributions or the redemption of Portfolio shares.
The performance shown may include the effect of fee waivers and/or expense reimbursements by the Investment Adviser and/or other service
providers, which have the effect of increasing total return. Had all fees and expenses been considered, the total returns would have been lower.
The performance update illustrates performance for a variable investment option available through a variable annuity contract or a variable life insurance policy. The performance shown indicates past performance and is not a projection or prediction of future results. Actual investment returns and principal value will fluctuate so that shares and/or units, at redemption, may be worth more or less than their original cost. Please log on to www.voyainvestments.com or call (800) 366-0066 to get performance through the most recent month end.
Portfolio holdings are subject to change daily.
19
SHAREHOLDER EXPENSE EXAMPLES (UNAUDITED) As a shareholder of a Portfolio, you incur two types of costs: (1) transaction costs, including redemption fees and exchange fees; and (2) ongoing costs, including management fees, distribution and/or service (12b-1) fees, and other Portfolio expenses. These Examples are intended to help you understand your ongoing costs (in dollars) of investing in a Portfolio and to compare these costs with the ongoing costs of investing in other mutual funds.
The Examples are based on an investment of $1,000 invested at the beginning of the period and held for the entire period from July 1, 2019 to December 31, 2019. The Portfolios’ expenses are shown without the imposition of any charges which are, or may be, imposed under your variable annuity contract, variable life insurance policy, qualified pension, or retirement plan. Expenses would have been higher if such charges were included.
Actual Expenses
The left section of the table shown below, “Actual Portfolio Return,” provides information about actual account values and actual expenses. You may use the information in this section, together with the amount you invested, to estimate the expenses that you paid over the period. Simply divide your account value by $1,000 (for example, an $8,600 account value divided by $1,000 = 8.6), then multiply the result by the number in the first section under the heading entitled “Expenses Paid During the Period” to estimate the expenses you paid on your account during this period.
Hypothetical Example for Comparison Purposes
The right section of the table shown below, “Hypothetical (5% return before expenses),” provides information about hypothetical account values and hypothetical expenses based on a Portfolio’s actual expense ratio and an assumed rate of return of 5% per year before expenses, which is not a Portfolio’s actual return. The hypothetical account values and expenses may not be used to estimate the actual ending account balance or expenses you paid for the period. You may use this information to compare the ongoing costs of investing in a Portfolio and other mutual funds. To do so, compare this 5% hypothetical example with the 5% hypothetical examples that appear in the shareholder reports of the other mutual funds.
Please note that the expenses shown in the table are meant to highlight your ongoing costs only and do not reflect any transactional costs, such as redemption fees or exchange fees. Therefore, the hypothetical section of the table is useful in comparing ongoing costs only, and will not help you determine the relative total costs of owning different mutual funds. In addition, if these transactional costs were included, your costs would have been higher.
| | | | Actual Portfolio Return | | Hypothetical (5% return before expenses) | |
|---|
| | | | Beginning
Account
Value
July 1,
2019 | | Ending
Account
Value
December 31,
2019 | | Annualized
Expense
Ratio | | Expenses Paid
During the
Period Ended
December 31,
2019* | | Beginning
Account
Value
July 1,
2019 | | Ending
Account
Value
December 31,
2019 | | Annualized
Expense
Ratio | | Expenses Paid
During the
Period Ended
December 31,
2019* | |
|---|
| | Voya Government Liquid Assets Portfolio |
| | Class I | | $ | 1,000.00 | | | $ | 1,009.00 | | | | 0.29 | % | | $ | 1.47 | | | $ | 1,000.00 | | | $ | 1,023.74 | | | | 0.29 | % | | $ | 1.48 | | |
| | Class S | | | 1,000.00 | | | | 1,007.70 | | | | 0.54 | | | | 2.73 | | | | 1,000.00 | | | | 1,022.48 | | | | 0.54 | | | | 2.75 | | |
| | Class S2 | | | 1,000.00 | | | | 1,006.90 | | | | 0.69 | | | | 3.49 | | | | 1,000.00 | | | | 1,021.73 | | | | 0.69 | | | | 3.52 | | |
| | VY® Clarion Global Real Estate Portfolio |
| | Class ADV | | | 1,000.00 | | | | 1,068.40 | | | | 1.49 | % | | | 7.77 | | | | 1,000.00 | | | | 1,017.69 | | | | 1.49 | % | | | 7.58 | | |
| | Class I | | | 1,000.00 | | | | 1,071.90 | | | | 0.89 | | | | 4.65 | | | | 1,000.00 | | | | 1,020.72 | | | | 0.89 | | | | 4.53 | | |
| | Class S | | | 1,000.00 | | | | 1,069.50 | | | | 1.14 | | | | 5.95 | | | | 1,000.00 | | | | 1,019.46 | | | | 1.14 | | | | 5.80 | | |
| | Class S2 | | | 1,000.00 | | | | 1,069.90 | | | | 1.29 | | | | 6.73 | | | | 1,000.00 | | | | 1,018.70 | | | | 1.29 | | | | 6.56 | | |
| | VY® Invesco Growth and Income Portfolio |
| | Class ADV | | | 1,000.00 | | | | 1,072.60 | | | | 1.24 | % | | | 6.48 | | | | 1,000.00 | | | | 1,018.95 | | | | 1.24 | % | | | 6.31 | | |
| | Class I | | | 1,000.00 | | | | 1,075.90 | | | | 0.64 | | | | 3.35 | | | | 1,000.00 | | | | 1,021.98 | | | | 0.64 | | | | 3.26 | | |
| | Class S | | | 1,000.00 | | | | 1,074.50 | | | | 0.89 | | | | 4.65 | | | | 1,000.00 | | | | 1,020.72 | | | | 0.89 | | | | 4.53 | | |
| | Class S2 | | | 1,000.00 | | | | 1,073.50 | | | | 1.04 | | | | 5.44 | | | | 1,000.00 | | | | 1,019.96 | | | | 1.04 | | | | 5.30 | | |
20
SHAREHOLDER EXPENSE EXAMPLES (UNAUDITED) (CONTINUED)
| | | | Actual Portfolio Return | | Hypothetical (5% return before expenses) | |
|---|
| | | | Beginning
Account
Value
July 1,
2019 | | Ending
Account
Value
December 31,
2019 | | Annualized
Expense
Ratio | | Expenses Paid
During the
Period Ended
December 31,
2019* | | Beginning
Account
Value
July 1,
2019 | | Ending
Account
Value
December 31,
2019 | | Annualized
Expense
Ratio | | Expenses Paid
During the
Period Ended
December 31,
2019* | |
|---|
| | VY® JPMorgan Emerging Markets Equity Portfolio |
| | Class ADV | | $ | 1,000.00 | | | $ | 1,082.20 | | | | 1.86 | % | | $ | 9.76 | | | $ | 1,000.00 | | | $ | 1,015.83 | | | | 1.86 | % | | $ | 9.45 | | |
| | Class I | | | 1,000.00 | | | | 1,085.70 | | | | 1.26 | | | | 6.62 | | | | 1,000.00 | | | | 1,018.85 | | | | 1.26 | | | | 6.41 | | |
| | Class S | | | 1,000.00 | | | | 1,084.50 | | | | 1.51 | | | | 7.93 | | | | 1,000.00 | | | | 1,017.59 | | | | 1.51 | | | | 7.68 | | |
| | Class S2 | | | 1,000.00 | | | | 1,083.30 | | | | 1.66 | | | | 8.72 | | | | 1,000.00 | | | | 1,016.84 | | | | 1.66 | | | | 8.44 | | |
| | VY® Morgan Stanley Global Franchise Portfolio |
| | Class ADV | | | 1,000.00 | | | | 1,067.80 | | | | 1.54 | % | | | 8.03 | | | | 1,000.00 | | | | 1,017.44 | | | | 1.54 | % | | | 7.83 | | |
| | Class R6 | | | 1,000.00 | | | | 1,071.20 | | | | 0.94 | | | | 4.91 | | | | 1,000.00 | | | | 1,020.47 | | | | 0.94 | | | | 4.79 | | |
| | Class S | | | 1,000.00 | | | | 1,070.10 | | | | 1.19 | | | | 6.21 | | | | 1,000.00 | | | | 1,019.21 | | | | 1.19 | | | | 6.06 | | |
| | Class S2 | | | 1,000.00 | | | | 1,069.20 | | | | 1.34 | | | | 6.99 | | | | 1,000.00 | | | | 1,018.45 | | | | 1.34 | | | | 6.82 | | |
| | VY® T. Rowe Price Capital Appreciation Portfolio |
| | Class ADV | | | 1,000.00 | | | | 1,058.80 | | | | 1.24 | % | | | 6.43 | | | | 1,000.00 | | | | 1,018.95 | | | | 1.24 | % | | | 6.31 | | |
| | Class I | | | 1,000.00 | | | | 1,061.90 | | | | 0.64 | | | | 3.33 | | | | 1,000.00 | | | | 1,021.98 | | | | 0.64 | | | | 3.26 | | |
| | Class R6 | | | 1,000.00 | | | | 1,061.90 | | | | 0.64 | | | | 3.33 | | | | 1,000.00 | | | | 1,021.98 | | | | 0.64 | | | | 3.26 | | |
| | Class S | | | 1,000.00 | | | | 1,060.50 | | | | 0.89 | | | | 4.62 | | | | 1,000.00 | | | | 1,020.72 | | | | 0.89 | | | | 4.53 | | |
| | Class S2 | | | 1,000.00 | | | | 1,059.60 | | | | 1.04 | | | | 5.40 | | | | 1,000.00 | | | | 1,019.96 | | | | 1.04 | | | | 5.30 | | |
| | VY® T. Rowe Price Equity Income Portfolio |
| | Class ADV | | | 1,000.00 | | | | 1,089.80 | | | | 1.21 | % | | | 6.37 | | | | 1,000.00 | | | | 1,019.11 | | | | 1.21 | % | | | 6.16 | | |
| | Class I | | | 1,000.00 | | | | 1,093.20 | | | | 0.61 | | | | 3.22 | | | | 1,000.00 | | | | 1,022.13 | | | | 0.61 | | | | 3.11 | | |
| | Class S | | | 1,000.00 | | | | 1,093.30 | | | | 0.86 | | | | 4.54 | | | | 1,000.00 | | | | 1,020.87 | | | | 0.86 | | | | 4.38 | | |
| | Class S2 | | | 1,000.00 | | | | 1,090.90 | | | | 1.01 | | | | 5.32 | | | | 1,000.00 | | | | 1,020.11 | | | | 1.01 | | | | 5.14 | | |
| | VY® T. Rowe Price International Stock Portfolio |
| | Class ADV | | | 1,000.00 | | | | 1,093.10 | | | | 1.36 | % | | | 7.18 | | | | 1,000.00 | | | | 1,018.35 | | | | 1.36 | % | | | 6.92 | | |
| | Class I | | | 1,000.00 | | | | 1,096.90 | | | | 0.76 | | | | 4.02 | | | | 1,000.00 | | | | 1,021.37 | | | | 0.76 | | | | 3.87 | | |
| | Class S | | | 1,000.00 | | | | 1,095.00 | | | | 1.01 | | | | 5.33 | | | | 1,000.00 | | | | 1,020.11 | | | | 1.01 | | | | 5.14 | | |
| * | | Expenses are equal to each Portfolio’s respective annualized expense ratios multiplied by the average account value over the period, multiplied by 184/365 to reflect the most recent fiscal half-year. |
21
REPORT OF INDEPENDENT REGISTERED PUBLIC ACCOUNTING FIRM To the Shareholders of the Funds and Board of Trustees
Voya Investors Trust:
Opinion on the Financial Statements
We have audited the accompanying statements of assets and liabilities of Voya Government Liquid Assets Portfolio, VY® Clarion Global Real Estate Portfolio, VY® Invesco Growth and Income Portfolio, VY® JPMorgan Emerging Markets Equity Portfolio, VY® Morgan Stanley Global Franchise Portfolio, VY® T. Rowe Price Capital Appreciation Portfolio, VY® T. Rowe Price Equity Income Portfolio, and VY® T. Rowe Price International Stock Portfolio (the Funds), each a series of Voya Investors Trust, including the summary portfolios and portfolios of investments, as of December 31, 2019, the related statements of operations for the year then ended, the statements of changes in net assets for each of the years in the two-year period then ended, and the related notes (collectively, the financial statements) and the financial highlights for each of the years or periods in the five-year period then ended. In our opinion, the financial statements and financial highlights present fairly, in all material respects, the financial position of the Funds as of December 31, 2019, the results of their operations for the year then ended, the changes in their net assets for each of the years in the two-year period then ended, and the financial highlights for each of the years or periods in the five-year period then ended, in conformity with U.S. generally accepted accounting principles.
Basis for Opinion
These financial statements and financial highlights are the responsibility of the Funds’ management. Our responsibility is to express an opinion on these financial statements and financial highlights based on our audits. We are a public accounting firm registered with the Public Company Accounting Oversight Board (United States) (PCAOB) and are required to be independent with respect to the Funds in accordance with the U.S. federal securities laws and the applicable rules and regulations of the Securities and Exchange Commission and the PCAOB.
We conducted our audits in accordance with the standards of the PCAOB. Those standards require that we plan and perform the audit to obtain reasonable assurance about whether the financial statements and financial highlights are free of material misstatement, whether due to error or fraud. Our audits included performing procedures to assess the risks of material misstatement of the financial statements and financial highlights, whether due to error or fraud, and performing procedures that respond to those risks. Such procedures included examining, on a test basis, evidence regarding the amounts and disclosures in the financial statements and financial highlights. Such procedures also included confirmation of securities owned as of December 31, 2019, by correspondence with the custodian, transfer agent and brokers or by other appropriate auditing procedures when replies from brokers were not received. Our audits also included evaluating the accounting principles used and significant estimates made by management, as well as evaluating the overall presentation of the financial statements and financial highlights. We believe that our audits provide a reasonable basis for our opinion.

We have served as the auditor of one or more Voya investment companies since 1975.
Boston, Massachusetts
February 21, 2020
22
STATEMENTS OF ASSETS AND LIABILITIES AS OF DECEMBER 31, 2019 | | Voya
Government
Liquid Assets
Portfolio | | VY®
Clarion Global
Real Estate
Portfolio | | VY®
Invesco
Growth and Income
Portfolio | | VY®
JPMorgan Emerging
Markets Equity
Portfolio |
|---|
ASSETS: | | | | | | | | | | | | | | | | |
| Investments in securities at fair value+* | | $ | — | | | $ | 232,525,859 | | | $ | 428,207,839 | | | $ | 511,109,746 | |
| Short-term investments at fair value** | | | — | | | | 632,792 | | | | 18,754,732 | | | | 5,671,239 | |
| Repurchase agreements | | | 313,754,000 | | | | — | | | | — | | | | — | |
| Short-term investments at amortized cost | | | 410,608,687 | | | | — | | | | — | | | | — | |
| Cash | | | 8,639 | | | | 638,241 | | | | 27,479 | | | | — | |
| Foreign currencies at value*** | | | — | | | | — | | | | 244,833 | | | | 411 | |
| Receivables: | | | | | | | | | | | | | | | | |
| Investment securities and currencies sold | | | — | | | | 1,252,762 | | | | — | | | | — | |
| Fund shares sold | | | 2,698,980 | | | | 164,002 | | | | 12,576 | | | | 4,989 | |
| Dividends | | | 32,595 | | | | 953,347 | | | | 606,190 | | | | 516,815 | |
| Interest | | | 168,245 | | | | — | | | | — | | | | — | |
| Foreign tax reclaims | | | — | | | | 34,518 | | | | 162,060 | | | | 16,033 | |
| Unrealized appreciation on forward foreign currency contracts | | | — | | | | 65 | | | | 8,521 | | | | — | |
| Prepaid expenses | | | — | | | | 1,632 | | | | — | | | | — | |
| Reimbursement due from manager | | | — | | | | 16,612 | | | | — | | | | — | |
| Other assets | | | 32,927 | | | | 13,828 | | | | 26,297 | | | | 28,088 | |
| Total assets | | | 727,304,073 | | | | 236,233,658 | | | | 448,050,527 | | | | 517,347,321 | |
LIABILITIES: | | | | | | | | | | | | | | | | |
| Payable for investment securities and currencies purchased | | | — | | | | 760,509 | | | | — | | | | — | |
| Payable for fund shares redeemed | | | 299,089 | | | | 61,904 | | | | 291,950 | | | | 3,042,006 | |
| Payable upon receipt of securities loaned | | | — | | | | 632,792 | | | | 3,296,644 | | | | 1,342,970 | |
| Unrealized depreciation on forward foreign currency contracts | | | — | | | | — | | | | 711,215 | | | | — | |
| Payable for unified fees | | | 175,486 | | | | — | | | | 236,954 | | | | 535,334 | |
| Payable for investment management fees | | | — | | | | 175,087 | | | | — | | | | — | |
| Payable for distribution and shareholder service fees | | | 188,368 | | | | 29,317 | | | | 95,801 | | | | 106,935 | |
| Payable to trustees under the deferred compensation plan (Note 6) | | | 32,927 | | | | 13,828 | | | | 26,297 | | | | 28,088 | |
| Payable for trustee fees | | | 13,003 | | | | 1,163 | | | | — | | | | — | |
| Payable for Indian capital gains tax | | | — | | | | — | | | | — | | | | 387,445 | |
| Other accrued expenses and liabilities | | | — | | | | 184,726 | | | | — | | | | — | |
| Total liabilities | | | 708,873 | | | | 1,859,326 | | | | 4,658,861 | | | | 5,442,778 | |
NET ASSETS | | $ | 726,595,200 | | | $ | 234,374,332 | | | $ | 443,391,666 | | | $ | 511,904,543 | |
NET ASSETS WERE COMPRISED OF: | | | | | | | | | | | | | | | | |
| Paid-in capital | | $ | 726,616,758 | | | $ | 172,439,302 | | | $ | 330,484,890 | | | $ | 306,794,137 | |
| Total distributable earnings (loss) | | | (21,558 | ) | | | 61,935,030 | | | | 112,906,776 | | | | 205,110,406 | |
NET ASSETS | | $ | 726,595,200 | | | $ | 234,374,332 | | | $ | 443,391,666 | | | $ | 511,904,543 | |
| | | | | | | | | | | | | | | | | |
|
+ Including securities loaned at value | | $ | — | | | $ | 608,472 | | | $ | 3,219,502 | | | $ | 1,275,539 | |
* Cost of investments in securities | | $ | — | | | $ | 184,978,901 | | | $ | 352,519,931 | | | $ | 338,319,763 | |
** Cost of short-term investments | | $ | — | | | $ | 632,792 | | | $ | 18,754,732 | | | $ | 5,671,239 | |
*** Cost of foreign currencies | | $ | — | | | $ | — | | | $ | 241,576 | | | $ | 550 | |
See Accompanying Notes to Financial Statements
23
STATEMENTS OF ASSETS AND LIABILITIES AS OF DECEMBER 31, 2019 (CONTINUED)
| | Voya
Government
Liquid Assets
Portfolio | | VY®
Clarion Global
Real Estate
Portfolio | | VY®
Invesco
Growth and Income
Portfolio | | VY®
JPMorgan Emerging
Markets Equity
Portfolio |
|---|
Class ADV | | | | | | | | | | | | | | | | |
| Net assets | | | n/a | | | $ | 17,308,114 | | | $ | 18,400,643 | | | $ | 50,223,700 | |
| Shares authorized | | | n/a | | | | unlimited | | | | unlimited | | | | unlimited | |
| Par value | | | n/a | | | $ | 0.001 | | | $ | 0.001 | | | $ | 0.001 | |
| Shares outstanding | | | n/a | | | | 1,355,711 | | | | 809,619 | | | | 2,389,524 | |
| Net asset value and redemption price per share | | | n/a | | | $ | 12.77 | | | $ | 22.73 | | | $ | 21.02 | |
| |
Class I | | | | | | | | | | | | | | | | |
| Net assets | | $ | 52,514,863 | | | $ | 119,641,915 | | | $ | 29,773,353 | | | $ | 79,673,639 | |
| Shares authorized | | | unlimited | | | | unlimited | | | | unlimited | | | | unlimited | |
| Par value | | $ | 0.001 | | | $ | 0.001 | | | $ | 0.001 | | | $ | 0.001 | |
| Shares outstanding | | | 52,508,417 | | | | 9,127,430 | | | | 1,293,881 | | | | 3,582,968 | |
| Net asset value and redemption price per share | | $ | 1.00 | | | $ | 13.11 | | | $ | 23.01 | | | $ | 22.24 | |
| |
Class S | | | | | | | | | | | | | | | | |
| Net assets | | $ | 314,785,844 | | | $ | 96,518,652 | | | $ | 367,940,978 | | | $ | 370,440,699 | |
| Shares authorized | | | unlimited | | | | unlimited | | | | unlimited | | | | unlimited | |
| Par value | | $ | 0.001 | | | $ | 0.001 | | | $ | 0.001 | | | $ | 0.001 | |
| Shares outstanding | | | 314,747,299 | | | | 7,399,660 | | | | 15,827,445 | | | | 16,776,949 | |
| Net asset value and redemption price per share | | $ | 1.00 | | | $ | 13.04 | | | $ | 23.25 | | | $ | 22.08 | |
| |
Class S2 | | | | | | | | | | | | | | | | |
| Net assets | | $ | 359,294,493 | | | $ | 905,651 | | | $ | 27,276,692 | | | $ | 11,566,505 | |
| Shares authorized | | | unlimited | | | | unlimited | | | | unlimited | | | | unlimited | |
| Par value | | $ | 0.001 | | | $ | 0.001 | | | $ | 0.001 | | | $ | 0.001 | |
| Shares outstanding | | | 359,250,365 | | | | 68,893 | | | | 1,185,731 | | | | 530,485 | |
| Net asset value and redemption price per share | | $ | 1.00 | | | $ | 13.15 | | | $ | 23.00 | | | $ | 21.80 | |
See Accompanying Notes to Financial Statements
24
STATEMENTS OF ASSETS AND LIABILITIES AS OF DECEMBER 31, 2019
| | VY®
Morgan Stanley
Global Franchise
Portfolio | | VY®
T. Rowe Price
Capital Appreciation
Portfolio | | VY®
T. Rowe Price
Equity Income
Portfolio | | VY®
T. Rowe Price
International Stock
Portfolio |
|---|
ASSETS: | | | | | | | | | | | | | | | | |
| Investments in securities at fair value+* | | $ | 409,670,964 | | | $ | 6,697,883,287 | | | $ | 379,370,400 | | | $ | 211,982,919 | |
| Short-term investments at fair value** | | | 7,383,153 | | | | 1,070,559,121 | | | | 17,587,273 | | | | 5,292,397 | |
| Cash | | | 1,878 | | | | 11,054,216 | | | | 2,991,533 | | | | 996,313 | |
| Foreign currencies at value*** | | | — | | | | 350,995 | | | | 104,163 | | | | 864,251 | |
| Receivables: | | | | | | | | | | | | | | | | |
| Investment securities sold | | | 29,069 | | | | 16,681,697 | | | | — | | | | 333,789 | |
| Fund shares sold | | | — | | | | 329,484 | | | | 10,018 | | | | 31,420 | |
| Dividends | | | 846,369 | | | | 3,433,350 | | | | 1,020,714 | | | | 260,422 | |
| Interest | | | — | | | | 15,092,852 | | | | 43,149 | | | | 997 | |
| Foreign tax reclaims | | | 101,286 | | | | 2,098 | | | | 59,551 | | | | 203,319 | |
| Unrealized appreciation on forward foreign currency contracts | | | — | | | | 161 | | | | — | | | | 2,925 | |
| Prepaid expenses | | | — | | | | — | | | | — | | | | 1,479 | |
| Other assets | | | 17,266 | | | | 223,594 | | | | 49,610 | | | | 11,998 | |
| Total assets | | | 418,049,985 | | | | 7,815,610,855 | | | | 401,236,411 | | | | 219,982,229 | |
LIABILITIES: | | | | | | | | | | | | | | | | |
| Payable for investment securities purchased | | | — | | | | 32,597,173 | | | | 7,175 | | | | 163,648 | |
| Payable for fund shares redeemed | | | 1,330,318 | | | | 3,826,144 | | | | 3,141,158 | | | | 859,439 | |
| Payable upon receipt of securities loaned | | | — | | | | 252,644,249 | | | | 13,136,628 | | | | 2,344,711 | |
| Unrealized depreciation on forward foreign currency contracts | | | — | | | | — | | | | — | | | | 35 | |
| Payable for unified fees | | | 328,783 | | | | 3,988,970 | | | | 313,216 | | | | — | |
| Payable for investment management fees | | | — | | | | — | | | | — | | | | 124,993 | |
| Payable for distribution and shareholder service fees | | | 125,076 | | | | 1,586,291 | | | | 139,900 | | | | 43,480 | |
| Payable to trustees under the deferred compensation plan (Note 6) | | | 17,266 | | | | 223,594 | | | | 49,610 | | | | 11,998 | |
| Payable for trustee fees | | | — | | | | — | | | | — | | | | 1,039 | |
| Other accrued expenses and liabilities | | | — | | | | — | | | | — | | | | 221,680 | |
| Written options, at fair valueˆ | | | — | | | | 75,492,168 | | | | — | | | | 6,490 | |
| Total liabilities | | | 1,801,443 | | | | 370,358,589 | | | | 16,787,687 | | | | 3,777,513 | |
NET ASSETS | | $ | 416,248,542 | | | $ | 7,445,252,266 | | | $ | 384,448,724 | | | $ | 216,204,716 | |
NET ASSETS WERE COMPRISED OF: | | | | | | | | | | | | | | | | |
| Paid-in capital | | $ | 269,580,554 | | | $ | 5,726,740,816 | | | $ | 294,181,843 | | | $ | 168,908,581 | |
| Total distributable earnings | | | 146,667,988 | | | | 1,718,511,450 | | | | 90,266,881 | | | | 47,296,135 | |
NET ASSETS | | $ | 416,248,542 | | | $ | 7,445,252,266 | | | $ | 384,448,724 | | | $ | 216,204,716 | |
| | | | | | | | | | | | | | | | | |
|
+ Including securities loaned at value | | $ | — | | | $ | 246,886,369 | | | $ | 12,848,169 | | | $ | 2,228,726 | |
* Cost of investments in securities | | $ | 296,563,351 | | | $ | 5,510,785,316 | | | $ | 299,795,789 | | | $ | 170,686,360 | |
** Cost of short-term investments | | $ | 7,383,153 | | | $ | 1,070,559,121 | | | $ | 17,587,273 | | | $ | 5,292,397 | |
*** Cost of foreign currencies | | $ | — | | | $ | 350,995 | | | $ | 103,263 | | | $ | 870,708 | |
ˆ Premiums received on written options | | $ | — | | | $ | 35,855,815 | | | $ | — | | | $ | 4,232 | |
See Accompanying Notes to Financial Statements
25
STATEMENTS OF ASSETS AND LIABILITIES AS OF DECEMBER 31, 2019 (CONTINUED)
| | VY®
Morgan Stanley
Global Franchise
Portfolio | | VY®
T. Rowe Price
Capital Appreciation
Portfolio | | VY®
T. Rowe Price
Equity Income
Portfolio | | VY®
T. Rowe Price
International Stock
Portfolio |
|---|
Class ADV | | | | | | | | | | | | | | | | |
| Net assets | | $ | 110,092,725 | | | $ | 1,353,245,555 | | | $ | 51,292,969 | | | $ | 23,415,362 | |
| Shares authorized | | | unlimited | | | | unlimited | | | | unlimited | | | | unlimited | |
| Par value | | $ | 0.001 | | | $ | 0.001 | | | $ | 0.001 | | | $ | 0.001 | |
| Shares outstanding | | | 6,854,064 | | | | 48,365,680 | | | | 5,143,006 | | | | 1,439,941 | |
| Net asset value and redemption price per share | | $ | 16.06 | | | $ | 27.98 | | | $ | 9.97 | | | $ | 16.26 | |
| |
Class I | | | | | | | | | | | | | | | | |
| Net assets | | | n/a | | | $ | 1,673,641,857 | | | $ | 81,596,127 | | | $ | 41,352,437 | |
| Shares authorized | | | n/a | | | | unlimited | | | | unlimited | | | | unlimited | |
| Par value | | | n/a | | | $ | 0.001 | | | $ | 0.001 | | | $ | 0.001 | |
| Shares outstanding | | | n/a | | | | 56,903,678 | | | | 7,942,290 | | | | 2,529,939 | |
| Net asset value and redemption price per share | | | n/a | | | $ | 29.41 | | | $ | 10.27 | | | $ | 16.35 | |
| |
Class R6 | | | | | | | | | | | | | | | | |
| Net assets | | $ | 634,976 | | | $ | 181,834,684 | | | | n/a | | | | n/a | |
| Shares authorized | | | unlimited | | | | unlimited | | | | n/a | | | | n/a | |
| Par value | | $ | 0.001 | | | $ | 0.001 | | | | n/a | | | | n/a | |
| Shares outstanding | | | 36,641 | | | | 6,179,152 | | | | n/a | | | | n/a | |
| Net asset value and redemption price per share | | $ | 17.33 | | | $ | 29.43 | | | | n/a | | | | n/a | |
| |
Class S | | | | | | | | | | | | | | | | |
| Net assets | | $ | 266,632,784 | | | $ | 4,163,308,319 | | | $ | 161,387,842 | | | $ | 151,436,917 | |
| Shares authorized | | | unlimited | | | | unlimited | | | | unlimited | | | | unlimited | |
| Par value | | $ | 0.001 | | | $ | 0.001 | | | $ | 0.001 | | | $ | 0.001 | |
| Shares outstanding | | | 15,357,611 | | | | 141,491,336 | | | | 15,660,293 | | | | 9,304,140 | |
| Net asset value and redemption price per share | | $ | 17.36 | | | $ | 29.42 | | | $ | 10.31 | | | $ | 16.28 | |
| |
Class S2 | | | | | | | | | | | | | | | | |
| Net assets | | $ | 38,888,057 | | | $ | 73,221,851 | | | $ | 90,171,786 | | | | n/a | |
| Shares authorized | | | unlimited | | | | unlimited | | | | unlimited | | | | n/a | |
| Par value | | $ | 0.001 | | | $ | 0.001 | | | $ | 0.001 | | | | n/a | |
| Shares outstanding | | | 2,263,419 | | | | 2,508,248 | | | | 8,951,588 | | | | n/a | |
| Net asset value and redemption price per share | | $ | 17.18 | | | $ | 29.19 | | | $ | 10.07 | | | | n/a | |
See Accompanying Notes to Financial Statements
26
STATEMENTS OF OPERATIONS FOR THE YEAR ENDED DECEMBER 31, 2019
| | Voya
Government
Liquid Assets
Portfolio | | VY®
Clarion Global
Real Estate
Portfolio | | VY®
Invesco
Growth and Income
Portfolio | | VY®
JPMorgan Emerging
Markets Equity
Portfolio |
|---|
INVESTMENT INCOME: | | | | | | | | | | | | | | | | |
| Dividends, net of foreign taxes withheld* | | $ | 83,995 | | | $ | 6,739,867 | | | $ | 11,905,456 | | | $ | 9,068,180 | |
| Interest | | | 16,623,585 | | | | — | | | | — | | | | 172 | |
| Securities lending income, net | | | — | | | | 9,857 | | | | 14,514 | | | | 78,739 | |
| Total investment income | | | 16,707,580 | | | | 6,749,724 | | | | 11,919,970 | | | | 9,147,091 | |
EXPENSES: | | | | | | | | | | | | | | | | |
| Investment management fees | | | — | | | | 2,093,943 | | | | — | | | | — | |
| Unified fees | | | 2,144,215 | | | | — | | | | 2,842,832 | | | | 6,056,524 | |
| Distribution and shareholder service fees: | | | | | | | | | | | | | | | | |
| Class ADV | | | — | | | | 105,949 | | | | 107,785 | | | | 276,189 | |
| Class S | | | 839,603 | | | | 244,925 | | | | 927,759 | | | | 888,426 | |
| Class S2 | | | 1,447,416 | | | | 3,745 | | | | 111,643 | | | | 45,974 | |
| Transfer agent fees | | | — | | | | 558 | | | | — | | | | — | |
| Shareholder reporting expense | | | — | | | | 72,320 | | | | — | | | | — | |
| Professional fees | | | — | | | | 23,177 | | | | — | | | | — | |
| Custody and accounting expense | | | — | | | | 152,103 | | | | — | | | | — | |
| Trustee fees and expenses | | | 36,939 | | | | 9,306 | | | | 29,260 | | | | 29,934 | |
| Miscellaneous expense | | | — | | | | 19,462 | | | | — | | | | — | |
| Interest expense | | | — | | | | 360 | | | | 132 | | | | 3,027 | |
| Total expenses | | | 4,468,173 | | | | 2,725,848 | | | | 4,019,411 | | | | 7,300,074 | |
| Waived and reimbursed fees | | | — | | | | (299,336 | ) | | | — | | | | — | |
| Brokerage commission recapture | | | — | | | | (3,282 | ) | | | (1,613 | ) | | | (908 | ) |
| Net expenses | | | 4,468,173 | | | | 2,423,230 | | | | 4,017,798 | | | | 7,299,166 | |
| Net investment income | | | 12,239,407 | | | | 4,326,494 | | | | 7,902,172 | | | | 1,847,925 | |
REALIZED AND UNREALIZED GAIN (LOSS): | | | | | | | | | | | | | | | | |
| Net realized gain (loss) on: | | | | | | | | | | | | | | | | |
| Investments (net of Indian capital gains tax withheldˆ) | | | 539,733 | | | | 19,761,711 | | | | 32,270,670 | | | | 32,010,003 | |
| Forward foreign currency contracts | | | — | | | | (31,124 | ) | | | 309,376 | | | | — | |
| Foreign currency related transactions | | | — | | | | 15,219 | | | | 1,372 | | | | (118,102 | ) |
| Net realized gain | | | 539,733 | | | | 19,745,806 | | | | 32,581,418 | | | | 31,891,901 | |
| Net change in unrealized appreciation (depreciation) on: | | | | | | | | | | | | | | | | |
Investments (net of Indian capital gains tax accrued#) | | | — | | | | 25,796,071 | | | | 57,885,325 | | | | 98,283,309 | |
| Forward foreign currency contracts | | | — | | | | 12,954 | | | | (645,803 | ) | | | — | |
| Foreign currency related transactions | | | — | | | | (13,057 | ) | | | 11,869 | | | | 1,302 | |
| Net change in unrealized appreciation (depreciation) | | | — | | | | 25,795,968 | | | | 57,251,391 | | | | 98,284,611 | |
| Net realized and unrealized gain | | | 539,733 | | | | 45,541,774 | | | | 89,832,809 | | | | 130,176,512 | |
Increase in net assets resulting from operations | | $ | 12,779,140 | | | $ | 49,868,268 | | | $ | 97,734,981 | | | $ | 132,024,437 | |
| | | | | | | | | | | | | | | | |
|
| * | Foreign taxes withheld | | $ | — | | | $ | 269,550 | | | $ | 221,736 | | | $ | 841,141 | |
| ˆ | Foreign taxes on sale of Indian investments | | $ | — | | | $ | — | | | $ | — | | | $ | 130,694 | |
| # | Foreign taxes accrued on Indian investments | | $ | — | | | $ | — | | | $ | — | | | $ | 387,445 | |
See Accompanying Notes to Financial Statements
27
STATEMENTS OF OPERATIONS FOR THE YEAR ENDED DECEMBER 31, 2019
| | | | VY®
Morgan Stanley
Global Franchise
Portfolio | | VY®
T. Rowe Price
Capital Appreciation
Portfolio | | VY®
T. Rowe Price
Equity Income
Portfolio | | VY®
T. Rowe Price
International Stock
Portfolio |
|---|
INVESTMENT INCOME: | | | | | | | | | | | | | | | | | | |
| Dividends, net of foreign taxes withheld* | | | | $ | 8,027,439 | | | $ | 77,996,286 | | | $ | 23,420,765 | | | $ | 4,566,062 | |
| Interest | | | | | — | | | | 78,625,232 | | | | 290,513 | | | | 5,271 | |
| Securities lending income, net | | | | | 15,230 | | | | 499,521 | | | | 49,579 | | | | 30,590 | |
| Total investment income | | | | | 8,042,669 | | | | 157,121,039 | | | | 23,760,857 | | | | 4,601,923 | |
EXPENSES: | | | | | | | | | | | | | | | | | | |
| Investment management fees | | | | | — | | | | — | | | | — | | | | 1,330,589 | |
| Unified fees | | | | | 3,844,675 | | | | 44,215,071 | | | | 5,041,938 | | | | — | |
| Distribution and shareholder service fees: | | | | | | | | | | | | | | | | | | |
| Class ADV | | | | | 578,573 | | | | 7,156,822 | | | | 290,318 | | | | 127,542 | |
| Class S | | | | | 659,366 | | | | 10,064,849 | | | | 1,408,297 | | | | 367,619 | |
| Class S2 | | | | | 155,080 | | | | 295,287 | | | | 399,174 | | | | — | |
| Transfer agent fees | | | | | — | | | | — | | | | — | | | | 713 | |
| Shareholder reporting expense | | | | | — | | | | — | | | | — | | | | 39,054 | |
| Professional fees | | | | | — | | | | — | | | | — | | | | 43,300 | |
| Custody and accounting expense | | | | | — | | | | — | | | | — | | | | 236,809 | |
| Trustee fees and expenses | | | | | 24,729 | | | | 383,663 | | | | 50,080 | | | | 8,316 | |
| Miscellaneous expense | | | | | — | | | | — | | | | — | | | | 15,451 | |
| Interest expense | | | | | — | | | | 3,918 | | | | — | | | | — | |
| Total expenses | | | | | 5,262,423 | | | | 62,119,610 | | | | 7,189,807 | | | | 2,169,393 | |
| Waived and reimbursed fees | | | | | (112,402 | ) | | | — | | | | (246,216 | ) | | | (103,533 | ) |
| Net expenses | | | | | 5,150,021 | | | | 62,119,610 | | | | 6,943,591 | | | | 2,065,860 | |
| Net investment income | | | | | 2,892,648 | | | | 95,001,429 | | | | 16,817,266 | | | | 2,536,063 | |
REALIZED AND UNREALIZED GAIN (LOSS): | | | | | | | | | | | | | | | | | | |
| Net realized gain (loss) on: | | | | | | | | | | | | | | | | | | |
| Investments | | | | | 31,363,050 | | | | 537,935,234 | | | | 146,249,332 | | | | 4,789,667 | |
| Forward foreign currency contracts | | | | | — | | | | 59,360 | | | | — | | | | (26,155 | ) |
| Foreign currency related transactions | | | | | (44,702 | ) | | | (99,534 | ) | | | 4,748 | | | | (3,543 | ) |
| Futures | | | | | — | | | | — | | | | (645 | ) | | | — | |
| Written options | | | | | — | | | | 23,749,238 | | | | — | | | | 22,514 | |
| Net realized gain | | | | | 31,318,348 | | | | 561,644,298 | | | | 146,253,435 | | | | 4,782,483 | |
| Net change in unrealized appreciation (depreciation) on: | | | | | | | | | | | | | | | | | | |
| Investments | | | | | 66,316,347 | | | | 869,467,673 | | | | 16,618,668 | | | | 42,878,091 | |
| Forward foreign currency contracts | | | | | — | | | | 161 | | | | — | | | | 40,768 | |
| Foreign currency related transactions | | | | | 6,974 | | | | (3,154 | ) | | | 2,487 | | | | (7,556 | ) |
| Written options | | | | | — | | | | (55,394,858 | ) | | | — | | | | (2,258 | ) |
| Unfunded commitments | | | | | — | | | | 121,864 | | | | — | | | | — | |
| Net change in unrealized appreciation (depreciation) | | | | | 66,323,321 | | | | 814,191,686 | | | | 16,621,155 | | | | 42,909,045 | |
| Net realized and unrealized gain | | | | | 97,641,669 | | | | 1,375,835,984 | | | | 162,874,590 | | | | 47,691,528 | |
Increase in net assets resulting from operations | | | | $ | 100,534,317 | | | $ | 1,470,837,413 | | | $ | 179,691,856 | | | $ | 50,227,591 | |
| | | | | | | | | | | | | | | | | | | |
| * Foreign taxes withheld | | | | $ | 156,680 | | | $ | 166,809 | | | $ | 239,904 | | | $ | 362,570 | |
See Accompanying Notes to Financial Statements
28
STATEMENTS OF CHANGES IN NET ASSETS
| | Voya Government
Liquid Assets Portfolio | | VY® Clarion
Global Real Estate Portfolio |
|---|
| | Year Ended
December 31,
2019 | | Year Ended
December 31,
2018 | | Year Ended
December 31,
2019 | | Year Ended
December 31,
2018 |
|---|
FROM OPERATIONS: | | | | | | | | | | | | | | | | |
| Net investment income | | $ | 12,239,407 | | | $ | 9,751,274 | | | $ | 4,326,494 | | | $ | 5,490,218 | |
| Net realized gain | | | 539,733 | | | | 140,230 | | | | 19,745,806 | | | | 19,214,606 | |
| Net change in unrealized appreciation (depreciation) | | | — | | | | — | | | | 25,795,968 | | | | (47,591,249 | ) |
| Increase (decrease) in net assets resulting from operations | | | 12,779,140 | | | | 9,891,504 | | | | 49,868,268 | | | | (22,886,425 | ) |
| |
FROM DISTRIBUTIONS TO SHAREHOLDERS: |
| Total distributions (excluding return of capital): | | | | | | | | | | | | | | | | |
| Class ADV | | | — | | | | — | | | | (394,514 | ) | | | (965,808 | ) |
| Class I | | | (1,149,041 | ) | | | (898,299 | ) | | | (3,315,314 | ) | | | (9,056,924 | ) |
| Class S | | | (5,870,729 | ) | | | (4,772,366 | ) | | | (2,549,899 | ) | | | (5,350,931 | ) |
| Class S2 | | | (5,767,381 | ) | | | (4,204,653 | ) | | | (23,042 | ) | | | (47,888 | ) |
| Total distributions | | | (12,787,151 | ) | | | (9,875,318 | ) | | | (6,282,769 | ) | | | (15,421,551 | ) |
| |
| FROM CAPITAL SHARE TRANSACTIONS: |
| Net proceeds from sale of shares | | | 214,336,336 | | | | 302,336,752 | | | | 9,881,253 | | | | 14,446,149 | |
| Reinvestment of distributions | | | 12,787,151 | | | | 9,875,318 | | | | 6,282,769 | | | | 15,421,551 | |
| | | | 227,123,487 | | | | 312,212,070 | | | | 16,164,022 | | | | 29,867,700 | |
| Cost of shares redeemed | | | (303,425,500 | ) | | | (291,563,651 | ) | | | (36,020,088 | ) | | | (101,991,489 | ) |
| Net increase (decrease) in net assets resulting from capital share transactions | | | (76,302,013 | ) | | | 20,648,419 | | | | (19,856,066 | ) | | | (72,123,789 | ) |
| Net increase (decrease) in net assets | | | (76,310,024 | ) | | | 20,664,605 | | | | 23,729,433 | | | | (110,431,765 | ) |
| |
NET ASSETS: | | | | | | | | | | | | | | | | |
| Beginning of year or period | | | 802,905,224 | | | | 782,240,619 | | | | 210,644,899 | | | | 321,076,664 | |
| End of year or period | | $ | 726,595,200 | | | $ | 802,905,224 | | | $ | 234,374,332 | | | $ | 210,644,899 | |
See Accompanying Notes to Financial Statements
29
STATEMENTS OF CHANGES IN NET ASSETS
| | VY® Invesco
Growth and Income Portfolio | | VY® JPMorgan
Emerging Markets Equity Portfolio |
|---|
| | Year Ended
December 31,
2019 | | Year Ended
December 31,
2018 | | Year Ended
December 31,
2019 | | Year Ended
December 31,
2018 |
|---|
FROM OPERATIONS: | | | | | | | | | | | | | | | | |
| Net investment income | | $ | 7,902,172 | | | $ | 8,147,604 | | | $ | 1,847,925 | | | $ | 1,424,693 | |
| Net realized gain | | | 32,581,418 | | | | 56,358,652 | | | | 31,891,901 | | | | 33,757,755 | |
| Net change in unrealized appreciation (depreciation) | | | 57,251,391 | | | | (131,014,689 | ) | | | 98,284,611 | | | | (128,801,367 | ) |
| Increase (decrease) in net assets resulting from operations | | | 97,734,981 | | | | (66,508,433 | ) | | | 132,024,437 | | | | (93,618,919 | ) |
| |
FROM DISTRIBUTIONS TO SHAREHOLDERS: |
| Total distributions (excluding return of capital): |
| Class ADV | | | (2,498,575 | ) | | | (2,545,460 | ) | | | (2,713,856 | ) | | | (173,376 | ) |
| Class I | | | (4,251,471 | ) | | | (4,159,490 | ) | | | (4,082,963 | ) | | | (623,640 | ) |
| Class S | | | (51,840,265 | ) | | | (53,854,097 | ) | | | (20,116,064 | ) | | | (2,244,617 | ) |
| Class S2 | | | (3,938,465 | ) | | | (3,923,246 | ) | | | (656,400 | ) | | | (52,676 | ) |
| Total distributions | | | (62,528,776 | ) | | | (64,482,293 | ) | | | (27,569,283 | ) | | | (3,094,309 | ) |
| |
FROM CAPITAL SHARE TRANSACTIONS: | | | | | | | | | | | | | | | | |
| Net proceeds from sale of shares | | | 6,101,952 | | | | 14,555,116 | | | | 30,196,135 | | | | 43,086,889 | |
| Reinvestment of distributions | | | 62,528,776 | | | | 64,482,293 | | | | 27,569,283 | | | | 3,094,309 | |
| | | | 68,630,728 | | | | 79,037,409 | | | | 57,765,418 | | | | 46,181,198 | |
| Cost of shares redeemed | | | (82,036,184 | ) | | | (92,321,940 | ) | | | (83,129,759 | ) | | | (126,128,800 | ) |
| Net decrease in net assets resulting from capital share transactions | | | (13,405,456 | ) | | | (13,284,531 | ) | | | (25,364,341 | ) | | | (79,947,602 | ) |
| Net increase (decrease) in net assets | | | 21,800,749 | | | | (144,275,257 | ) | | | 79,090,813 | | | | (176,660,830 | ) |
| |
NET ASSETS: | | | | | | | | | | | | | | | | |
| Beginning of year or period | | | 421,590,917 | | | | 565,866,174 | | | | 432,813,730 | | | | 609,474,560 | |
| End of year or period | | $ | 443,391,666 | | | $ | 421,590,917 | | | $ | 511,904,543 | | | $ | 432,813,730 | |
See Accompanying Notes to Financial Statements
30
STATEMENTS OF CHANGES IN NET ASSETS
| | VY® Morgan
Stanley Global Franchise Portfolio | | VY® T. Rowe Price
Capital Appreciation Portfolio |
|---|
| | Year Ended
December 31,
2019 | | Year Ended
December 31,
2018 | | Year Ended
December 31,
2019 | | Year Ended
December 31,
2018 |
|---|
FROM OPERATIONS: | | | | | | | | | | | | | | | | |
| Net investment income | | $ | 2,892,648 | | | $ | 2,839,250 | | | $ | 95,001,429 | | | $ | 145,908,046 | |
| Net realized gain | | | 31,318,348 | | | | 41,896,516 | | | | 561,644,298 | | | | 369,902,205 | |
| Net change in unrealized appreciation (depreciation) | | | 66,323,321 | | | | (50,740,526 | ) | | | 814,191,686 | | | | (476,124,555 | ) |
| Increase (decrease) in net assets resulting from operations | | | 100,534,317 | | | | (6,004,760 | ) | | | 1,470,837,413 | | | | 39,685,696 | |
| |
FROM DISTRIBUTIONS TO SHAREHOLDERS: |
| Total distributions (excluding return of capital): |
| Class ADV | | | (11,237,040 | ) | | | (13,099,859 | ) | | | (79,837,274 | ) | | | (95,178,479 | ) |
| Class I | | | — | | | | — | | | | (105,346,487 | ) | | | (124,567,106 | ) |
| Class R6 | | | (75,422 | ) | | | (10,394 | ) | | | (10,487,555 | ) | | | (7,964,813 | ) |
| Class S | | | (29,140,576 | ) | | | (41,529,824 | ) | | | (265,075,287 | ) | | | (363,602,203 | ) |
| Class S2 | | | (4,241,616 | ) | | | (6,082,883 | ) | | | (4,744,849 | ) | | | (6,795,562 | ) |
| Total distributions | | | (44,694,654 | ) | | | (60,722,960 | ) | | | (465,491,452 | ) | | | (598,108,163 | ) |
| |
FROM CAPITAL SHARE TRANSACTIONS: |
| Net proceeds from sale of shares | | | 18,802,058 | | | | 12,634,552 | | | | 630,958,784 | | | | 378,731,621 | |
| Reinvestment of distributions | | | 44,694,654 | | | | 60,722,960 | | | | 465,491,452 | | | | 598,108,163 | |
| | | | 63,496,712 | | | | 73,357,512 | | | | 1,096,450,236 | | | | 976,839,784 | |
| Cost of shares redeemed | | | (60,226,756 | ) | | | (57,300,170 | ) | | | (696,028,997 | ) | | | (735,693,220 | ) |
| Net increase in net assets resulting from capital share transactions | | | 3,269,956 | | | | 16,057,342 | | | | 400,421,239 | | | | 241,146,564 | |
| Net increase (decrease) in net assets | | | 59,109,619 | | | | (50,670,378 | ) | | | 1,405,767,200 | | | | (317,275,903 | ) |
| |
NET ASSETS: | | | | | | | | | | | | | | | | |
| Beginning of year or period | | | 357,138,923 | | | | 407,809,301 | | | | 6,039,485,066 | | | | 6,356,760,969 | |
| End of year or period | | $ | 416,248,542 | | | $ | 357,138,923 | | | $ | 7,445,252,266 | | | $ | 6,039,485,066 | |
See Accompanying Notes to Financial Statements
31
STATEMENTS OF CHANGES IN NET ASSETS
| | VY® T. Rowe Price
Equity Income Portfolio | | VY® T. Rowe Price
International Stock Portfolio |
|---|
| | Year Ended
December 31,
2019 | | Year Ended
December 31,
2018 | | Year Ended
December 31,
2019 | | Year Ended
December 31,
2018 |
|---|
FROM OPERATIONS: | | | | | | | | | | | | | | | | |
| Net investment income | | $ | 16,817,266 | | | $ | 19,224,254 | | | $ | 2,536,063 | | | $ | 2,467,070 | |
| Net realized gain | | | 146,253,435 | | | | 78,408,295 | | | | 4,782,483 | | | | 13,238,548 | |
| Net change in unrealized appreciation (depreciation) | | | 16,621,155 | | | | (175,226,109 | ) | | | 42,909,045 | | | | (47,937,027 | ) |
| Increase (decrease) in net assets resulting from operations | | | 179,691,856 | | | | (77,593,560 | ) | | | 50,227,591 | | | | (32,231,409 | ) |
| |
FROM DISTRIBUTIONS TO SHAREHOLDERS: | | | | | | | | | | | |
| Total distributions (excluding return of capital): | | | | | | | | | | | | | | | | |
| Class ADV | | | (14,085,259 | ) | | | (8,544,546 | ) | | | (1,356,151 | ) | | | (293,947 | ) |
| Class I | | | (22,140,633 | ) | | | (16,430,325 | ) | | | (2,725,607 | ) | | | (800,891 | ) |
| Class S | | | (162,548,177 | ) | | | (110,181,926 | ) | | | (9,755,870 | ) | | | (2,820,796 | ) |
| Class S2 | | | (28,955,674 | ) | | | (18,499,686 | ) | | | — | | | | — | |
| Total distributions | | | (227,729,743 | ) | | | (153,656,483 | ) | | | (13,837,628 | ) | | | (3,915,634 | ) |
| |
FROM CAPITAL SHARE TRANSACTIONS: | | | | | | | | | | | |
| Net proceeds from sale of shares | | | 34,697,046 | | | | 23,487,241 | | | | 9,219,945 | | | | 14,802,681 | |
| Reinvestment of distributions | | | 227,729,743 | | | | 153,656,483 | | | | 13,837,628 | | | | 3,915,634 | |
| | | | 262,426,789 | | | | 177,143,724 | | | | 23,057,573 | | | | 18,718,315 | |
| Cost of shares redeemed | | | (589,365,595 | ) | | | (146,890,620 | ) | | | (34,974,404 | ) | | | (32,054,118 | ) |
| Net increase (decrease) in net assets resulting from capital share transactions | | | (326,938,806 | ) | | | 30,253,104 | | | | (11,916,831 | ) | | | (13,335,803 | ) |
| Net increase (decrease) in net assets | | | (374,976,693 | ) | | | (200,996,939 | ) | | | 24,473,132 | | | | (49,482,846 | ) |
| |
NET ASSETS: | | | | | | | | | | | | | | | | |
| Beginning of year or period | | | 759,425,417 | | | | 960,422,356 | | | | 191,731,584 | | | | 241,214,430 | |
| End of year or period | | $ | 384,448,724 | | | $ | 759,425,417 | | | $ | 216,204,716 | | | $ | 191,731,584 | |
See Accompanying Notes to Financial Statements
32
Selected data for a share of beneficial interest outstanding throughout each year or period.
| | | | | | Income (loss)
from investment
operations | | | | | | Less distributions | | | | | | | | | | | | | | | | | | Ratios to average
net assets | | Supplemental
data |
|---|
Year or
period | | Net asset
value,
beginning
of year
or period | | Net
investment
income (loss) | | Net
realized
and
unrealized
gain (loss) | | Total from
investment
operations | | From net
investment
income | | From net
realized
gains | | From return
of capital | | Total
distributions | | Payment
by affiliate | | Net
asset
value,
end of year
or period | | Total Return(1) | | Expenses
before
reductions/
additions(2)(3)(4) | | Expenses
net of
fee waivers
and/or
recoupments
if any(2)(3)(4) | | Expenses
net of all
reductions/
additions(2)(3)(4) | | Net
investment
income
(loss)(2)(3) | | Net
assets,
end of
year or
period | | Portfolio
turnover
rate |
|---|
| ended | | ($) | | ($) | | ($) | | ($) | | ($) | | ($) | | ($) | | ($) | | ($) | | ($) | | (%) | | (%) | | (%) | | (%) | | (%) | | ($000’s) | | (%) |
|---|
Voya Government Liquid Assets Portfolio | | | | | | | | | | | | | | | | | | | | | | | | | | | | | | | | | | | | | | | | | | | | | | | | |
Class I | | | | | | | | | | | | | | | | | | | | | | | | | | | | | | | | | | | | | | | | | | | | | | | | | | | | | | | | | | | | | | | | | | | | |
| 12-31-19 | | | 1.00 | | | | 0.02 | | | | 0.00 | * | | | 0.02 | | | | 0.02 | | | | 0.00 | * | | | — | | | | 0.02 | | | | — | | | | 1.00 | | | | 2.01 | | | | 0.29 | | | | 0.29 | | | | 0.29 | | | | 1.93 | | | | 52,515 | | | | — | |
| 12-31-18 | | | 1.00 | | | | 0.02 | | | | 0.00 | * | | | 0.02 | | | | 0.02 | | | | 0.00 | * | | | — | | | | 0.02 | | | | — | | | | 1.00 | | | | 1.61 | | | | 0.29 | | | | 0.29 | | | | 0.29 | | | | 1.61 | | | | 62,115 | | | | — | |
| 12-31-17 | | | 1.00 | | | | 0.01 | | | | 0.00 | * | | | 0.01 | | | | 0.01 | | | | 0.00 | * | | | — | | | | 0.01 | | | | — | | | | 1.00 | | | | 0.66 | | | | 0.29 | | | | 0.29 | | | | 0.29 | | | | 0.62 | | | | 50,773 | | | | — | |
| 12-31-16 | | | 1.00 | | | | 0.00 | * | | | 0.00 | * | | | 0.00 | * | | | 0.00 | * | | | 0.00 | * | | | — | | | | 0.00 | * | | | — | | | | 1.00 | | | | 0.23 | | | | 0.28 | | | | 0.28 | | | | 0.28 | | | | 0.13 | | | | 66,214 | | | | — | |
| 12-31-15 | | | 1.00 | | | | — | | | | 0.00 | * | | | 0.00 | | | | 0.00 | * | | | 0.00 | * | | | — | | | | 0.00 | * | | | — | | | | 1.00 | | | | 0.01 | | | | 0.28 | | | | 0.22 | | | | 0.22 | | | | 0.00 | * | | | 81,636 | | | | — | |
Class S | | | | | | | | | | | | | | | | | | | | | | | | | | | | | | | | | | | | | | | | | | | | | | | | | | | | | | | | | | | | | | | | | | | | |
| 12-31-19 | | | 1.00 | | | | 0.02 | | | | 0.00 | * | | | 0.02 | | | | 0.02 | | | | 0.00 | * | | | — | | | | 0.02 | | | | — | | | | 1.00 | | | | 1.75 | | | | 0.54 | | | | 0.54 | | | | 0.54 | | | | 1.68 | | | | 314,786 | | | | — | |
| 12-31-18 | | | 1.00 | | | | 0.01 | | | | 0.00 | * | | | 0.01 | | | | 0.01 | | | | 0.00 | * | | | — | | | | 0.01 | | | | — | | | | 1.00 | | | | 1.36 | | | | 0.54 | | | | 0.54 | | | | 0.54 | | | | 1.33 | | | | 354,423 | | | | — | |
| 12-31-17 | | | 1.00 | | | | 0.00 | * | | | 0.00 | * | | | 0.00 | * | | | 0.00 | * | | | 0.00 | * | | | — | | | | 0.00 | * | | | — | | | | 1.00 | | | | 0.41 | | | | 0.54 | | | | 0.54 | | | | 0.54 | | | | 0.37 | | | | 372,943 | | | | — | |
| 12-31-16 | | | 1.00 | | | | — | | | | 0.00 | * | | | 0.00 | | | | 0.00 | * | | | 0.00 | * | | | — | | | | 0.00 | * | | | — | | | | 1.00 | | | | 0.09 | | | | 0.53 | | | | 0.42 | | | | 0.42 | | | | 0.00 | * | | | 488,208 | | | | — | |
| 12-31-15 | | | 1.00 | | | | — | | | | 0.00 | * | | | 0.00 | | | | — | | | | 0.00 | * | | | — | | | | 0.00 | * | | | — | | | | 1.00 | | | | 0.01 | | | | 0.53 | | | | 0.22 | | | | 0.22 | | | | (0.00 | )* | | | 552,706 | | | | — | |
Class S2 | | | | | | | | | | | | | | | | | | | | | | | | | | | | | | | | | | | | | | | | | | | | | | | | | | | | | | | | | | | | | | | | | | | | |
| 12-31-19 | | | 1.00 | | | | 0.02 | | | | 0.00 | * | | | 0.02 | | | | 0.02 | | | | 0.00 | * | | | — | | | | 0.02 | | | | — | | | | 1.00 | | | | 1.60 | | | | 0.69 | | | | 0.69 | | | | 0.69 | | | | 1.52 | | | | 359,294 | | | | — | |
| 12-31-18 | | | 1.00 | | | | 0.01 | | | | 0.00 | * | | | 0.01 | | | | 0.01 | | | | 0.00 | * | | | — | | | | 0.01 | | | | — | | | | 1.00 | | | | 1.21 | | | | 0.69 | | | | 0.69 | | | | 0.69 | | | | 1.19 | | | | 386,368 | | | | — | |
| 12-31-17 | | | 1.00 | | | | 0.00 | * | | | 0.00 | * | | | 0.00 | * | | | 0.00 | * | | | 0.00 | * | | | — | | | | 0.00 | * | | | — | | | | 1.00 | | | | 0.28 | | | | 0.69 | | | | 0.67 | | | | 0.67 | | | | 0.25 | | | | 358,525 | | | | — | |
| 12-31-16 | | | 1.00 | | | | — | | | | 0.00 | * | | | 0.00 | | | | — | | | | 0.00 | * | | | — | | | | 0.00 | * | | | — | | | | 1.00 | | | | 0.09 | | | | 0.71 | | | | 0.42 | | | | 0.42 | | | | (0.00 | )* | | | 416,495 | | | | — | |
| 12-31-15 | | | 1.00 | | | | — | | | | 0.00 | * | | | 0.00 | | | | — | | | | 0.00 | * | | | — | | | | 0.00 | * | | | — | | | | 1.00 | | | | 0.01 | | | | 0.78 | | | | 0.22 | | | | 0.22 | | | | (0.00 | )* | | | 348,078 | | | | — | |
VY® Clarion Global Real Estate Portfolio | | | | | | | | | | | | | | | | | | | | | | | | | | | | | | | | | | | | | | | | | | | | | | | | |
Class ADV | | | | | | | | | | | | | | | | | | | | | | | | | | | | | | | | | | | | | | | | | | | | | | | | | | | | | | | | | | | | | | | | | | | | |
| 12-31-19 | | | 10.53 | | | | 0.17 | • | | | 2.34 | | | | 2.51 | | | | 0.27 | | | | — | | | | — | | | | 0.27 | | | | — | | | | 12.77 | | | | 23.99 | | | | 1.62 | | | | 1.49 | | | | 1.49 | | | | 1.40 | | | | 17,308 | | | | 77 | |
| 12-31-18 | | | 12.17 | | | | 0.18 | • | | | (1.24 | ) | | | (1.06 | ) | | | 0.58 | | | | — | | | | — | | | | 0.58 | | | | — | | | | 10.53 | | | | (9.10 | ) | | | 1.62 | | | | 1.49 | | | | 1.49 | | | | 1.54 | | | | 16,608 | | | | 107 | |
| 12-31-17 | | | 11.41 | | | | 0.19 | • | | | 0.95 | | | | 1.14 | | | | 0.38 | | | | — | | | | — | | | | 0.38 | | | | — | | | | 12.17 | | | | 10.20 | | | | 1.57 | | | | 1.49 | | | | 1.49 | | | | 1.63 | | | | 22,826 | | | | 90 | |
| 12-31-16 | | | 11.47 | | | | 0.16 | | | | (0.13 | ) | | | 0.03 | | | | 0.09 | | | | — | | | | — | | | | 0.09 | | | | — | | | | 11.41 | | | | 0.23 | | | | 1.61 | | | | 1.49 | | | | 1.49 | | | | 1.33 | | | | 25,983 | | | | 49 | |
| 12-31-15 | | | 12.04 | | | | 0.11 | • | | | (0.35 | ) | | | (0.24 | ) | | | 0.33 | | | | — | | | | — | | | | 0.33 | | | | — | | | | 11.47 | | | | (1.99 | ) | | | 1.72 | | | | 1.49 | | | | 1.49 | | | | 0.95 | | | | 27,513 | | | | 50 | |
Class I | | | | | | | | | | | | | | | | | | | | | | | | | | | | | | | | | | | | | | | | | | | | | | | | | | | | | | | | | | | | | | | | | | | | |
| 12-31-19 | | | 10.81 | | | | 0.25 | • | | | 2.41 | | | | 2.66 | | | | 0.36 | | | | — | | | | — | | | | 0.36 | | | | — | | | | 13.11 | | | | 24.74 | | | | 1.02 | | | | 0.89 | | | | 0.89 | | | | 2.02 | | | | 119,642 | | | | 77 | |
| 12-31-18 | | | 12.49 | | | | 0.25 | • | | | (1.27 | ) | | | (1.02 | ) | | | 0.66 | | | | — | | | | — | | | | 0.66 | | | | — | | | | 10.81 | | | | (8.52 | ) | | | 1.02 | | | | 0.89 | | | | 0.89 | | | | 2.14 | | | | 103,029 | | | | 107 | |
| 12-31-17 | | | 11.72 | | | | 0.27 | • | | | 0.96 | | | | 1.23 | | | | 0.46 | | | | — | | | | — | | | | 0.46 | | | | — | | | | 12.49 | | | | 10.77 | | | | 0.97 | | | | 0.89 | | | | 0.89 | | | | 2.28 | | | | 183,921 | | | | 90 | |
| 12-31-16 | | | 11.77 | | | | 0.22 | | | | (0.10 | ) | | | 0.12 | | | | 0.17 | | | | — | | | | — | | | | 0.17 | | | | — | | | | 11.72 | | | | 0.89 | | | | 0.96 | | | | 0.89 | | | | 0.89 | | | | 1.94 | | | | 183,084 | | | | 49 | |
| 12-31-15 | | | 12.34 | | | | 0.18 | | | | (0.35 | ) | | | (0.17 | ) | | | 0.40 | | | | — | | | | — | | | | 0.40 | | | | — | | | | 11.77 | | | | (1.42 | ) | | | 0.97 | | | | 0.89 | | | | 0.89 | | | | 1.55 | | | | 165,604 | | | | 50 | |
Class S | | | | | | | | | | | | | | | | | | | | | | | | | | | | | | | | | | | | | | | | | | | | | | | | | | | | | | | | | | | | | | | | | | | | |
| 12-31-19 | | | 10.76 | | | | 0.22 | • | | | 2.39 | | | | 2.61 | | | | 0.33 | | | | — | | | | — | | | | 0.33 | | | | — | | | | 13.04 | | | | 24.35 | | | | 1.27 | | | | 1.14 | | | | 1.14 | | | | 1.76 | | | | 96,519 | | | | 77 | |
| 12-31-18 | | | 12.43 | | | | 0.22 | • | | | (1.26 | ) | | | (1.04 | ) | | | 0.63 | | | | — | | | | — | | | | 0.63 | | | | — | | | | 10.76 | | | | (8.74 | ) | | | 1.27 | | | | 1.14 | | | | 1.14 | | | | 1.91 | | | | 90,159 | | | | 107 | |
| 12-31-17 | | | 11.66 | | | | 0.24 | • | | | 0.96 | | | | 1.20 | | | | 0.43 | | | | — | | | | — | | | | 0.43 | | | | — | | | | 12.43 | | | | 10.50 | | | | 1.22 | | | | 1.14 | | | | 1.14 | | | | 2.00 | | | | 113,281 | | | | 90 | |
| 12-31-16 | | | 11.71 | | | | 0.20 | • | | | (0.12 | ) | | | 0.08 | | | | 0.13 | | | | — | | | | — | | | | 0.13 | | | | — | | | | 11.66 | | | | 0.62 | | | | 1.21 | | | | 1.14 | | | | 1.14 | | | | 1.67 | | | | 123,103 | | | | 49 | |
| 12-31-15 | | | 12.28 | | | | 0.15 | • | | | (0.36 | ) | | | (0.21 | ) | | | 0.36 | | | | — | | | | — | | | | 0.36 | | | | — | | | | 11.71 | | | | (1.69 | ) | | | 1.22 | | | | 1.14 | | | | 1.14 | | | | 1.27 | | | | 141,067 | | | | 50 | |
Class S2 | | | | | | | | | | | | | | | | | | | | | | | | | | | | | | | | | | | | | | | | | | | | | | | | | | | | | | | | | | | | | | | | | | | | |
| 12-31-19 | | | 10.85 | | | | 0.20 | • | | | 2.41 | | | | 2.61 | | | | 0.31 | | | | — | | | | — | | | | 0.31 | | | | — | | | | 13.15 | | | | 24.15 | | | | 1.42 | | | | 1.29 | | | | 1.29 | | | | 1.61 | | | | 906 | | | | 77 | |
| 12-31-18 | | | 12.52 | | | | 0.21 | • | | | (1.27 | ) | | | (1.06 | ) | | | 0.61 | | | | — | | | | — | | | | 0.61 | | | | — | | | | 10.85 | | | | (8.84 | ) | | | 1.42 | | | | 1.29 | | | | 1.29 | | | | 1.76 | | | | 850 | | | | 107 | |
| 12-31-17 | | | 11.73 | | | | 0.22 | • | | | 0.98 | | | | 1.20 | | | | 0.41 | | | | — | | | | — | | | | 0.41 | | | | — | | | | 12.52 | | | | 10.42 | | | | 1.37 | | | | 1.29 | | | | 1.29 | | | | 1.87 | | | | 1,048 | | | | 90 | |
| 12-31-16 | | | 11.78 | | | | 0.18 | • | | | (0.12 | ) | | | 0.06 | | | | 0.11 | | | | — | | | | — | | | | 0.11 | | | | — | | | | 11.73 | | | | 0.44 | | | | 1.39 | | | | 1.29 | | | | 1.29 | | | | 1.52 | | | | 1,117 | | | | 49 | |
| 12-31-15 | | | 12.34 | | | | 0.14 | • | | | (0.36 | ) | | | (0.22 | ) | | | 0.34 | | | | — | | | | — | | | | 0.34 | | | | — | | | | 11.78 | | | | (1.84 | ) | | | 1.47 | | | | 1.29 | | | | 1.29 | | | | 1.11 | | | | 1,343 | | | | 50 | |
VY® Invesco Growth and Income Portfolio | | | | | | | | | | | | | | | | | | | | | | | | | | | | | | | | | | | | | | | | | | | | | | | | |
Class ADV | | | | | | | | | | | | | | | | | | | | | | | | | | | | | | | | | | | | | | | | | | | | | | | | | | | | | | | | | | | | | | | | | | | | |
| 12-31-19 | | | 21.15 | | | | 0.32 | • | | | 4.64 | | | | 4.96 | | | | 0.50 | | | | 2.88 | | | | — | | | | 3.38 | | | | — | | | | 22.73 | | | | 24.30 | | | | 1.24 | | | | 1.24 | | | | 1.24 | | | | 1.43 | | | | 18,401 | | | | 22 | |
| 12-31-18 | | | 27.94 | | | | 0.32 | • | | | (3.71 | ) | | | (3.39 | ) | | | 0.30 | | | | 3.10 | | | | — | | | | 3.40 | | | | — | | | | 21.15 | | | | (13.88 | ) | | | 1.24 | | | | 1.24 | | | | 1.24 | | | | 1.22 | | | | 16,868 | | | | 31 | |
| 12-31-17 | | | 26.55 | | | | 0.38 | • | | | 3.04 | | | | 3.42 | | | | 0.51 | | | | 1.52 | | | | — | | | | 2.03 | | | | — | | | | 27.94 | | | | 13.46 | | | | 1.24 | | | | 1.24 | | | | 1.24 | | | | 1.43 | | | | 22,246 | | | | 17 | |
| 12-31-16 | | | 25.48 | | | | 0.30 | • | | | 4.19 | | | | 4.49 | | | | 0.52 | | | | 2.90 | | | | — | | | | 3.42 | | | | — | | | | 26.55 | | | | 19.52 | | | | 1.29 | | | | 1.24 | | | | 1.24 | | | | 1.21 | | | | 18,641 | | | | 23 | |
| 12-31-15 | | | 31.49 | | | | 0.30 | • | | | (0.98 | ) | | | (0.68 | ) | | | 0.93 | | | | 4.40 | | | | — | | | | 5.33 | | | | — | | | | 25.48 | | | | (3.26 | ) | | | 1.39 | | | | 1.24 | | | | 1.24 | | | | 1.05 | | | | 15,551 | | | | 19 | |
See Accompanying Notes to Financial Statements
33
FINANCIAL HIGHLIGHTS (CONTINUED)
Selected data for a share of beneficial interest outstanding throughout each year or period.
| | | | | | Income (loss)
from investment
operations | | | | | | Less distributions | | | | | | | | | | | | | | | | | | Ratios to average
net assets | | Supplemental
data |
|---|
Year or
period | | Net asset
value,
beginning
of year
or period | | Net
investment
income (loss) | | Net
realized
and
unrealized
gain (loss) | | Total from
investment
operations | | From net
investment
income | | From net
realized
gains | | From return
of capital | | Total
distributions | | Payment
by affiliate | | Net
asset
value,
end of year
or period | | Total Return(1) | | Expenses
before
reductions/
additions(2)(3)(4) | | Expenses
net of
fee waivers
and/or
recoupments
if any(2)(3)(4) | | Expenses
net of all
reductions/
additions(2)(3)(4) | | Net
investment
income
(loss)(2)(3) | | Net
assets,
end of
year or
period | | Portfolio
turnover
rate |
|---|
| ended | | ($) | | ($) | | ($) | | ($) | | ($) | | ($) | | ($) | | ($) | | ($) | | ($) | | (%) | | (%) | | (%) | | (%) | | (%) | | ($000’s) | | (%) |
|---|
VY® Invesco Growth and Income Portfolio (continued) | | | | | | | | | | | | | | | | | | | | | | | | | | | | | | | | | | | | | | | | | | | | | | | | |
Class I | | | | | | | | | | | | | | | | | | | | | | | | | | | | | | | | | | | | | | | | | | | | | | | | | | | | | | | | | | | | | | | | | | | | |
| 12-31-19 | | | 21.41 | | | | 0.46 | • | | | 4.69 | | | | 5.15 | | | | 0.67 | | | | 2.88 | | | | — | | | | 3.55 | | | | — | | | | 23.01 | | | | 24.98 | | | | 0.64 | | | | 0.64 | | | | 0.64 | | | | 2.02 | | | | 29,773 | | | | 22 | |
| 12-31-18 | | | 28.23 | | | | 0.48 | • | | | (3.73 | ) | | | (3.25 | ) | | | 0.47 | | | | 3.10 | | | | — | | | | 3.57 | | | | — | | | | 21.41 | | | | (13.31 | ) | | | 0.64 | | | | 0.64 | | | | 0.64 | | | | 1.82 | | | | 27,943 | | | | 31 | |
| 12-31-17 | | | 26.77 | | | | 0.55 | • | | | 3.07 | | | | 3.62 | | | | 0.64 | | | | 1.52 | | | | — | | | | 2.16 | | | | — | | | | 28.23 | | | | 14.13 | | | | 0.64 | | | | 0.64 | | | | 0.64 | | | | 2.02 | | | | 33,894 | | | | 17 | |
| 12-31-16 | | | 25.68 | | | | 0.45 | • | | | 4.23 | | | | 4.68 | | | | 0.69 | | | | 2.90 | | | | — | | | | 3.59 | | | | — | | | | 26.77 | | | | 20.23 | | | | 0.64 | | | | 0.64 | | | | 0.64 | | | | 1.81 | | | | 28,117 | | | | 23 | |
| 12-31-15 | | | 31.71 | | | | 0.47 | • | | | (0.98 | ) | | | (0.51 | ) | | | 1.12 | | | | 4.40 | | | | — | | | | 5.52 | | | | — | | | | 25.68 | | | | (2.69 | ) | | | 0.64 | | | | 0.64 | | | | 0.64 | | | | 1.63 | | | | 23,008 | | | | 19 | |
Class S | | | | | | | | | | | | | | | | | | | | | | | | | | | | | | | | | | | | | | | | | | | | | | | | | | | | | | | | | | | | | | | | | | | | |
| 12-31-19 | | | 21.58 | | | | 0.41 | • | | | 4.73 | | | | 5.14 | | | | 0.59 | | | | 2.88 | | | | — | | | | 3.47 | | | | — | | | | 23.25 | | | | 24.73 | | | | 0.89 | | | | 0.89 | | | | 0.89 | | | | 1.78 | | | | 367,941 | | | | 22 | |
| 12-31-18 | | | 28.43 | | | | 0.42 | • | | | (3.78 | ) | | | (3.36 | ) | | | 0.39 | | | | 3.10 | | | | — | | | | 3.49 | | | | — | | | | 21.58 | | | | (13.58 | ) | | | 0.89 | | | | 0.89 | | | | 0.89 | | | | 1.56 | | | | 350,968 | | | | 31 | |
| 12-31-17 | | | 26.94 | | | | 0.48 | • | | | 3.10 | | | | 3.58 | | | | 0.57 | | | | 1.52 | | | | — | | | | 2.09 | | | | — | | | | 28.43 | | | | 13.89 | | | | 0.89 | | | | 0.89 | | | | 0.89 | | | | 1.76 | | | | 476,317 | | | | 17 | |
| 12-31-16 | | | 25.81 | | | | 0.41 | | | | 4.23 | | | | 4.64 | | | | 0.61 | | | | 2.90 | | | | — | | | | 3.51 | | | | — | | | | 26.94 | | | | 19.92 | | | | 0.89 | | | | 0.89 | | | | 0.89 | | | | 1.56 | | | | 507,524 | | | | 23 | |
| 12-31-15 | | | 31.83 | | | | 0.40 | • | | | (0.99 | ) | | | (0.59 | ) | | | 1.03 | | | | 4.40 | | | | — | | | | 5.43 | | | | — | | | | 25.81 | | | | (2.93 | ) | | | 0.89 | | | | 0.89 | | | | 0.89 | | | | 1.39 | | | | 451,452 | | | | 19 | |
Class S2 | | | | | | | | | | | | | | | | | | | | | | | | | | | | | | | | | | | | | | | | | | | | | | | | | | | | | | | | | | | | | | | | | | | | |
| 12-31-19 | | | 21.39 | | | | 0.37 | • | | | 4.67 | | | | 5.04 | | | | 0.55 | | | | 2.88 | | | | — | | | | 3.43 | | | | — | | | | 23.00 | | | | 24.47 | | | | 1.04 | | | | 1.04 | | | | 1.04 | | | | 1.63 | | | | 27,277 | | | | 22 | |
| 12-31-18 | | | 28.19 | | | | 0.37 | • | | | (3.73 | ) | | | (3.36 | ) | | | 0.34 | | | | 3.10 | | | | — | | | | 3.44 | | | | — | | | | 21.39 | | | | (13.67 | ) | | | 1.04 | | | | 1.04 | | | | 1.04 | | | | 1.41 | | | | 25,812 | | | | 31 | |
| 12-31-17 | | | 26.73 | | | | 0.44 | • | | | 3.06 | | | | 3.50 | | | | 0.52 | | | | 1.52 | | | | — | | | | 2.04 | | | | — | | | | 28.19 | | | | 13.67 | | | | 1.04 | | | | 1.04 | | | | 1.04 | | | | 1.62 | | | | 33,409 | | | | 17 | |
| 12-31-16 | | | 25.62 | | | | 0.35 | • | | | 4.23 | | | | 4.58 | | | | 0.57 | | | | 2.90 | | | | — | | | | 3.47 | | | | — | | | | 26.73 | | | | 19.80 | | | | 1.07 | | | | 1.04 | | | | 1.04 | | | | 1.41 | | | | 38,721 | | | | 23 | |
| 12-31-15 | | | 31.63 | | | | 0.36 | • | | | (0.99 | ) | | | (0.63 | ) | | | 0.98 | | | | 4.40 | | | | — | | | | 5.38 | | | | — | | | | 25.62 | | | | (3.10 | ) | | | 1.14 | | | | 1.04 | | | | 1.04 | | | | 1.24 | | | | 38,764 | | | | 19 | |
VY® JPMorgan Emerging Markets Equity Portfolio | | | | | | | | | | | | | | | | | | | | | | | | | | | | | | | | | | | | | | | | | | | |
Class ADV | | | | | | | | | | | | | | | | | | | | | | | | | | | | | | | | | | | | | | | | | | | | | | | | | | | | | | | | | | | | | | | | | | | | |
| 12-31-19 | | | 16.95 | | | | 0.01 | | | | 5.24 | | | | 5.25 | | | | — | | | | 1.18 | | | | — | | | | 1.18 | | | | — | | | | 21.02 | | | | 31.47 | | | | 1.86 | | | | 1.86 | | | | 1.86 | | | | 0.03 | | | | 50,224 | | | | 21 | |
| 12-31-18 | | | 20.52 | | | | (0.01 | ) | | | (3.49 | ) | | | (3.50 | ) | | | 0.07 | | | | — | | | | — | | | | 0.07 | | | | — | | | | 16.95 | | | | (17.12 | ) | | | 1.86 | | | | 1.86 | | | | 1.86 | | | | (0.07 | ) | | | 40,881 | | | | 21 | |
| 12-31-17 | | | 14.43 | | | | (0.05 | ) | | | 6.19 | | | | 6.14 | | | | 0.05 | | | | — | | | | — | | | | 0.05 | | | | — | | | | 20.52 | | | | 42.55 | | | | 1.86 | | | | 1.86 | | | | 1.86 | | | | (0.24 | ) | | | 57,093 | | | | 26 | |
| 12-31-16 | | | 12.92 | | | | 0.02 | • | | | 1.61 | | | | 1.63 | | | | 0.12 | | | | — | | | | — | | | | 0.12 | | | | — | | | | 14.43 | | | | 12.62 | | | | 1.90 | | | | 1.85 | | | | 1.85 | | | | 0.12 | | | | 35,873 | | | | 24 | |
| 12-31-15 | | | 16.63 | | | | 0.07 | | | | (2.56 | ) | | | (2.49 | ) | | | 0.14 | | | | 1.08 | | | | — | | | | 1.22 | | | | — | | | | 12.92 | | | | (16.07 | )(a) | | | 2.01 | | | | 1.86 | | | | 1.86 | | | | 0.45 | | | | 34,072 | | | | 15 | |
Class I | | | | | | | | | | | | | | | | | | | | | | | | | | | | | | | | | | | | | | | | | | | | | | | | | | | | | | | | | | | | | | | | | | | | |
| 12-31-19 | | | 17.80 | | | | 0.13 | | | | 5.52 | | | | 5.65 | | | | 0.03 | | | | 1.18 | | | | — | | | | 1.21 | | | | — | | | | 22.24 | | | | 32.23 | | | | 1.26 | | | | 1.26 | | | | 1.26 | | | | 0.62 | | | | 79,674 | | | | 21 | |
| 12-31-18 | | | 21.52 | | | | 0.12 | | | | (3.67 | ) | | | (3.55 | ) | | | 0.17 | | | | — | | | | — | | | | 0.17 | | | | — | | | | 17.80 | | | | (16.58 | ) | | | 1.26 | | | | 1.26 | | | | 1.26 | | | | 0.53 | | | | 61,663 | | | | 21 | |
| 12-31-17 | | | 15.10 | | | | 0.08 | | | | 6.47 | | | | 6.55 | | | | 0.13 | | | | — | | | | — | | | | 0.13 | | | | — | | | | 21.52 | | | | 43.45 | | | | 1.26 | | | | 1.26 | | | | 1.26 | | | | 0.34 | | | | 82,567 | | | | 26 | |
| 12-31-16 | | | 13.52 | | | | 0.10 | • | | | 1.70 | | | | 1.80 | | | | 0.22 | | | | — | | | | — | | | | 0.22 | | | | — | | | | 15.10 | | | | 13.27 | | | | 1.25 | | | | 1.25 | | | | 1.25 | | | | 0.71 | | | | 63,276 | | | | 24 | |
| 12-31-15 | | | 17.36 | | | | 0.17 | | | | (2.68 | ) | | | (2.51 | ) | | | 0.25 | | | | 1.08 | | | | — | | | | 1.33 | | | | — | | | | 13.52 | | | | (15.57 | )(a) | | | 1.26 | | | | 1.26 | | | | 1.26 | | | | 1.05 | | | | 58,250 | | | | 15 | |
Class S | | | | | | | | | | | | | | | | | | | | | | | | | | | | | | | | | | | | | | | | | | | | | | | | | | | | | | | | | | | | | | | | | | | | |
| 12-31-19 | | | 17.70 | | | | 0.08 | | | | 5.48 | | | | 5.56 | | | | 0.00 | * | | | 1.18 | | | | — | | | | 1.18 | | | | — | | | | 22.08 | | | | 31.91 | | | | 1.51 | | | | 1.51 | | | | 1.51 | | | | 0.38 | | | | 370,441 | | | | 21 | |
| 12-31-18 | | | 21.40 | | | | 0.05 | • | | | (3.63 | ) | | | (3.58 | ) | | | 0.12 | | | | — | | | | — | | | | 0.12 | | | | — | | | | 17.70 | | | | (16.81 | ) | | | 1.51 | | | | 1.51 | | | | 1.51 | | | | 0.27 | | | | 319,682 | | | | 21 | |
| 12-31-17 | | | 15.02 | | | | 0.03 | | | | 6.44 | | | | 6.47 | | | | 0.09 | | | | — | | | | — | | | | 0.09 | | | | — | | | | 21.40 | | | | 43.11 | | | | 1.51 | | | | 1.51 | | | | 1.51 | | | | 0.11 | | | | 454,764 | | | | 26 | |
| 12-31-16 | | | 13.45 | | | | 0.07 | • | | | 1.67 | | | | 1.74 | | | | 0.17 | | | | — | | | | — | | | | 0.17 | | | | — | | | | 15.02 | | | | 12.95 | | | | 1.50 | | | | 1.50 | | | | 1.50 | | | | 0.47 | | | | 362,865 | | | | 24 | |
| 12-31-15 | | | 17.26 | | | | 0.13 | • | | | (2.66 | ) | | | (2.53 | ) | | | 0.20 | | | | 1.08 | | | | — | | | | 1.28 | | | | — | | | | 13.45 | | | | (15.75 | )(a) | | | 1.51 | | | | 1.51 | | | | 1.51 | | | | 0.81 | | | | 367,861 | | | | 15 | |
Class S2 | | | | | | | | | | | | | | | | | | | | | | | | | | | | | | | | | | | | | | | | | | | | | | | | | | | | | | | | | | | | | | | | | | | | |
| 12-31-19 | | | 17.52 | | | | 0.05 | | | | 5.41 | | | | 5.46 | | | | — | | | | 1.18 | | | | — | | | | 1.18 | | | | — | | | | 21.80 | | | | 31.64 | | | | 1.66 | | | | 1.66 | | | | 1.66 | | | | 0.24 | | | | 11,567 | | | | 21 | |
| 12-31-18 | | | 21.17 | | | | 0.04 | | | | (3.61 | ) | | | (3.57 | ) | | | 0.08 | | | | — | | | | — | | | | 0.08 | | | | — | | | | 17.52 | | | | (16.92 | ) | | | 1.66 | | | | 1.66 | | | | 1.66 | | | | 0.12 | | | | 10,587 | | | | 21 | |
| 12-31-17 | | | 14.86 | | | | (0.01 | )• | | | 6.37 | | | | 6.36 | | | | 0.05 | | | | — | | | | — | | | | 0.05 | | | | — | | | | 21.17 | | | | 42.85 | | | | 1.66 | | | | 1.66 | | | | 1.66 | | | | (0.03 | ) | | | 15,050 | | | | 26 | |
| 12-31-16 | | | 13.30 | | | | 0.05 | • | | | 1.65 | | | | 1.70 | | | | 0.14 | | | | — | | | | — | | | | 0.14 | | | | — | | | | 14.86 | | | | 12.79 | | | | 1.68 | | | | 1.65 | | | | 1.65 | | | | 0.32 | | | | 14,570 | | | | 24 | |
| 12-31-15 | | | 17.08 | | | | 0.10 | • | | | (2.64 | ) | | | (2.54 | ) | | | 0.16 | | | | 1.08 | | | | — | | | | 1.24 | | | | — | | | | 13.30 | | | | (15.91 | )(a) | | | 1.76 | | | | 1.66 | | | | 1.66 | | | | 0.65 | | | | 16,530 | | | | 15 | |
VY® Morgan Stanley Global Franchise Portfolio | | | | | | | | | | | | | | | | | | | | | | | | | | | | | | | | | | | | | | | | | | | | | | | | |
Class ADV | | | | | | | | | | | | | | | | | | | | | | | | | | | | | | | | | | | | | | | | | | | | | | | | | | | | | | | | | | | | | | | | | | | | |
| 12-31-19 | | | 14.01 | | | | 0.06 | | | | 3.89 | | | | 3.95 | | | | 0.10 | | | | 1.80 | | | | — | | | | 1.90 | | | | — | | | | 16.06 | | | | 28.89 | | | | 1.57 | | | | 1.54 | | | | 1.54 | | | | 0.48 | | | | 110,093 | | | | 16 | |
| 12-31-18 | | | 16.98 | | | | 0.07 | | | | (0.23 | ) | | | (0.16 | ) | | | 0.14 | | | | 2.67 | | | | — | | | | 2.81 | | | | — | | | | 14.01 | | | | (2.07 | ) | | | 1.57 | | | | 1.54 | | | | 1.54 | | | | 0.47 | | | | 78,112 | | | | 27 | |
| 12-31-17 | | | 14.58 | | | | 0.10 | | | | 3.53 | | | | 3.63 | | | | 0.17 | | | | 1.06 | | | | — | | | | 1.23 | | | | — | | | | 16.98 | | | | 25.47 | | | | 1.57 | | | | 1.55 | | | | 1.55 | | | | 0.60 | | | | 83,492 | | | | 29 | |
| 12-31-16 | | | 15.29 | | | | 0.13 | • | | | 0.68 | | | | 0.81 | | | | 0.17 | | | | 1.35 | | | | — | | | | 1.52 | | | | — | | | | 14.58 | | | | 4.94 | | | | 1.61 | | | | 1.54 | | | | 1.54 | | | | 0.83 | | | | 68,606 | | | | 26 | |
| 12-31-15 | | | 16.56 | | | | 0.15 | | | | 0.87 | | | | 1.02 | | | | 0.28 | | | | 2.01 | | | | — | | | | 2.29 | | | | — | | | | 15.29 | | | | 5.95 | | | | 1.71 | | | | 1.55 | | | | 1.55 | | | | 0.90 | | | | 56,395 | | | | 27 | |
See Accompanying Notes to Financial Statements
34
FINANCIAL HIGHLIGHTS (CONTINUED)
Selected data for a share of beneficial interest outstanding throughout each year or period.
| | | | | | Income (loss)
from investment
operations | | | | | | Less distributions | | | | | | | | | | | | | | | | | | Ratios to average
net assets | | Supplemental
data |
|---|
Year or
period | | Net asset
value,
beginning
of year
or period | | Net
investment
income (loss) | | Net
realized
and
unrealized
gain (loss) | | Total from
investment
operations | | From net
investment
income | | From net
realized
gains | | From return
of capital | | Total
distributions | | Payment
by affiliate | | Net
asset
value,
end of year
or period | | Total Return(1) | | Expenses
before
reductions/
additions(2)(3)(4) | | Expenses
net of
fee waivers
and/or
recoupments
if any(2)(3)(4) | | Expenses
net of all
reductions/
additions(2)(3)(4) | | Net
investment
income
(loss)(2)(3) | | Net
assets,
end of
year or
period | | Portfolio
turnover
rate |
|---|
| ended | | ($) | | ($) | | ($) | | ($) | | ($) | | ($) | | ($) | | ($) | | ($) | | ($) | | (%) | | (%) | | (%) | | (%) | | (%) | | ($000’s) | | (%) |
|---|
VY® Morgan Stanley Global Franchise Portfolio (continued) | | | | | | | | | | | | | | | | | | | | | | | | | | | | | | | | | | | | | | | | | | | | | | | | |
Class R6 | | | | | | | | | | | | | | | | | | | | | | | | | | | | | | | | | | | | | | | | | | | | | | | | | | | | | | | | | | | | | | | | | | | | |
| 12-31-19 | | | 14.97 | | | | 0.18 | • | | | 4.17 | | | | 4.35 | | | | 0.19 | | | | 1.80 | | | | — | | | | 1.99 | | | | — | | | | 17.33 | | | | 29.74 | | | | 0.97 | | | | 0.94 | | | | 0.94 | | | | 1.07 | | | | 635 | | | | 16 | |
| 12-31-18 | | | 17.96 | | | | 0.19 | • | | | (0.27 | ) | | | (0.08 | ) | | | 0.24 | | | | 2.67 | | | | — | | | | 2.91 | | | | — | | | | 14.97 | | | | (1.51 | ) | | | 0.97 | | | | 0.94 | | | | 0.94 | | | | 1.14 | | | | 84 | | | | 27 | |
| 12-31-17 | | | 15.35 | | | | 0.21 | • | | | 3.71 | | | | 3.92 | | | | 0.25 | | | | 1.06 | | | | — | | | | 1.31 | | | | — | | | | 17.96 | | | | 26.16 | | | | 0.97 | | | | 0.95 | | | | 0.95 | | | | 1.21 | | | | 44 | | | | 29 | |
05-03-16(5)– 12-31-16 | | | 16.66 | | | | 0.22 | • | | | 0.07 | | | | 0.29 | | | | 0.25 | | | | 1.35 | | | | — | | | | 1.60 | | | | — | | | | 15.35 | | | | 1.46 | | | | 0.96 | | | | 0.94 | | | | 0.94 | | | | 1.48 | | | | 49 | | | | 26 | |
Class S | | | | | | | | | | | | | | | | | | | | | | | | | | | | | | | | | | | | | | | | | | | | | | | | | | | | | | | | | | | | | | | | | | | | |
| 12-31-19 | | | 15.00 | | | | 0.14 | • | | | 4.16 | | | | 4.30 | | | | 0.14 | | | | 1.80 | | | | — | | | | 1.94 | | | | — | | | | 17.36 | | | | 29.34 | | | | 1.22 | | | | 1.19 | | | | 1.19 | | | | 0.82 | | | | 266,633 | | | | 16 | |
| 12-31-18 | | | 17.97 | | | | 0.14 | • | | | (0.25 | ) | | | (0.11 | ) | | | 0.19 | | | | 2.67 | | | | — | | | | 2.86 | | | | — | | | | 15.00 | | | | (1.69 | ) | | | 1.22 | | | | 1.19 | | | | 1.19 | | | | 0.81 | | | | 243,512 | | | | 27 | |
| 12-31-17 | | | 15.36 | | | | 0.16 | • | | | 3.71 | | | | 3.87 | | | | 0.20 | | | | 1.06 | | | | — | | | | 1.26 | | | | — | | | | 17.97 | | | | 25.81 | | | | 1.22 | | | | 1.20 | | | | 1.20 | | | | 0.95 | | | | 282,442 | | | | 29 | |
| 12-31-16 | | | 16.02 | | | | 0.20 | | | | 0.70 | | | | 0.90 | | | | 0.21 | | | | 1.35 | | | | — | | | | 1.56 | | | | — | | | | 15.36 | | | | 5.30 | | | | 1.21 | | | | 1.19 | | | | 1.19 | | | | 1.20 | | | | 299,965 | | | | 26 | |
| 12-31-15 | | | 17.23 | | | | 0.21 | • | | | 0.92 | | | | 1.13 | | | | 0.33 | | | | 2.01 | | | | — | | | | 2.34 | | | | — | | | | 16.02 | | | | 6.36 | | | | 1.21 | | | | 1.20 | | | | 1.20 | | | | 1.26 | | | | 319,681 | | | | 27 | |
Class S2 | | | | | | | | | | | | | | | | | | | | | | | | | | | | | | | | | | | | | | | | | | | | | | | | | | | | | | | | | | | | | | | | | | | | |
| 12-31-19 | | | 14.86 | | | | 0.11 | • | | | 4.13 | | | | 4.24 | | | | 0.12 | | | | 1.80 | | | | — | | | | 1.92 | | | | — | | | | 17.18 | | | | 29.15 | | | | 1.37 | | | | 1.34 | | | | 1.34 | | | | 0.67 | | | | 38,888 | | | | 16 | |
| 12-31-18 | | | 17.83 | | | | 0.12 | | | | (0.26 | ) | | | (0.14 | ) | | | 0.16 | | | | 2.67 | | | | — | | | | 2.83 | | | | — | | | | 14.86 | | | | (1.89 | ) | | | 1.37 | | | | 1.34 | | | | 1.34 | | | | 0.66 | | | | 35,431 | | | | 27 | |
| 12-31-17 | | | 15.24 | | | | 0.14 | • | | | 3.69 | | | | 3.83 | | | | 0.18 | | | | 1.06 | | | | — | | | | 1.24 | | | | — | | | | 17.83 | | | | 25.69 | | | | 1.37 | | | | 1.35 | | | | 1.35 | | | | 0.80 | | | | 41,831 | | | | 29 | |
| 12-31-16 | | | 15.90 | | | | 0.17 | • | | | 0.70 | | | | 0.87 | | | | 0.18 | | | | 1.35 | | | | — | | | | 1.53 | | | | — | | | | 15.24 | | | | 5.16 | | | | 1.39 | | | | 1.34 | | | | 1.34 | | | | 1.05 | | | | 44,381 | | | | 26 | |
| 12-31-15 | | | 17.12 | | | | 0.19 | • | | | 0.90 | | | | 1.09 | | | | 0.30 | | | | 2.01 | | | | — | | | | 2.31 | | | | — | | | | 15.90 | | | | 6.17 | | | | 1.46 | | | | 1.35 | | | | 1.35 | | | | 1.11 | | | | 50,093 | | | | 27 | |
VY® T. Rowe Price Capital Appreciation Portfolio | | | | | | | | | | | | | | | | | | | | | | | | | | | | | | | | | | | | | | | | | | | | | | | | |
Class ADV | | | | | | | | | | | | | | | | | | | | | | | | | | | | | | | | | | | | | | | | | | | | | | | | | | | | | | | | | | | | | | | | | | | | |
| 12-31-19 | | | 24.10 | | | | 0.25 | | | | 5.46 | | | | 5.71 | | | | 0.34 | | | | 1.49 | | | | — | | | | 1.83 | | | | — | | | | 27.98 | | | | 23.99 | | | | 1.24 | | | | 1.24 | | | | 1.24 | | | | 1.02 | | | | 1,353,246 | | | | 53 | |
| 12-31-18 | | | 26.53 | | | | 0.48 | | | | (0.36 | ) | | | 0.12 | | | | 0.50 | | | | 2.05 | | | | — | | | | 2.55 | | | | — | | | | 24.10 | | | | 0.10 | | | | 1.24 | | | | 1.24 | | | | 1.24 | | | | 1.94 | | | | 990,787 | | | | 75 | |
| 12-31-17 | | | 24.54 | | | | 0.19 | | | | 3.36 | | | | 3.55 | | | | 0.25 | | | | 1.31 | | | | — | | | | 1.56 | | | | — | | | | 26.53 | | | | 14.72 | | | | 1.24 | | | | 1.24 | | | | 1.24 | | | | 0.78 | | | | 954,071 | | | | 61 | |
| 12-31-16 | | | 25.27 | | | | 0.24 | • | | | 1.68 | | | | 1.92 | | | | 0.28 | | | | 2.37 | | | | — | | | | 2.65 | | | | — | | | | 24.54 | | | | 7.65 | | | | 1.29 | | | | 1.24 | | | | 1.24 | | | | 0.97 | | | | 778,133 | | | | 69 | |
| 12-31-15 | | | 28.02 | | | | 0.24 | • | | | 1.14 | | | | 1.38 | | | | 0.28 | | | | 3.85 | | | | — | | | | 4.13 | | | | — | | | | 25.27 | | | | 4.85 | | | | 1.39 | | | | 1.24 | | | | 1.24 | | | | 0.89 | | | | 596,730 | | | | 67 | |
Class I | | | | | | | | | | | | | | | | | | | | | | | | | | | | | | | | | | | | | | | | | | | | | | | | | | | | | | | | | | | | | | | | | | | | |
| 12-31-19 | | | 25.23 | | | | 0.43 | | | | 5.73 | | | | 6.16 | | | | 0.49 | | | | 1.49 | | | | — | | | | 1.98 | | | | — | | | | 29.41 | | | | 24.71 | | | | 0.64 | | | | 0.64 | | | | 0.64 | | | | 1.62 | | | | 1,673,642 | | | | 53 | |
| 12-31-18 | | | 27.64 | | | | 0.67 | | | | (0.38 | ) | | | 0.29 | | | | 0.65 | | | | 2.05 | | | | — | | | | 2.70 | | | | — | | | | 25.23 | | | | 0.74 | | | | 0.64 | | | | 0.64 | | | | 0.64 | | | | 2.57 | | | | 1,245,366 | | | | 75 | |
| 12-31-17 | | | 25.49 | | | | 0.36 | | | | 3.50 | | | | 3.86 | | | | 0.40 | | | | 1.31 | | | | — | | | | 1.71 | | | | — | | | | 27.64 | | | | 15.39 | | | | 0.64 | | | | 0.64 | | | | 0.64 | | | | 1.38 | | | | 1,217,289 | | | | 61 | |
| 12-31-16 | | | 26.12 | | | | 0.40 | | | | 1.75 | | | | 2.15 | | | | 0.41 | | | | 2.37 | | | | — | | | | 2.78 | | | | — | | | | 25.49 | | | | 8.31 | | | | 0.64 | | | | 0.64 | | | | 0.64 | | | | 1.55 | | | | 1,084,776 | | | | 69 | |
| 12-31-15 | | | 28.80 | | | | 0.40 | | | | 1.18 | | | | 1.58 | | | | 0.41 | | | | 3.85 | | | | — | | | | 4.26 | | | | — | | | | 26.12 | | | | 5.47 | | | | 0.64 | | | | 0.64 | | | | 0.64 | | | | 1.48 | | | | 1,027,480 | | | | 67 | |
Class R6 | | | | | | | | | | | | | | | | | | | | | | | | | | | | | | | | | | | | | | | | | | | | | | | | | | | | | | | | | | | | | | | | | | | | |
| 12-31-19 | | | 25.24 | | | | 0.46 | • | | | 5.71 | | | | 6.17 | | | | 0.49 | | | | 1.49 | | | | — | | | | 1.98 | | | | — | | | | 29.43 | | | | 24.74 | | | | 0.64 | | | | 0.64 | | | | 0.64 | | | | 1.62 | | | | 181,835 | | | | 53 | |
| 12-31-18 | | | 27.66 | | | | 0.70 | • | | | (0.42 | ) | | | 0.28 | | | | 0.65 | | | | 2.05 | | | | — | | | | 2.70 | | | | — | | | | 25.24 | | | | 0.70 | | | | 0.64 | | | | 0.64 | | | | 0.64 | | | | 2.57 | | | | 94,159 | | | | 75 | |
| 12-31-17 | | | 25.49 | | | | 0.38 | • | | | 3.50 | | | | 3.88 | | | | 0.40 | | | | 1.31 | | | | — | | | | 1.71 | | | | — | | | | 27.66 | | | | 15.47 | | | | 0.64 | | | | 0.64 | | | | 0.64 | | | | 1.38 | | | | 59,752 | | | | 61 | |
05-03-16(5)– 12-31-16 | | | 27.00 | | | | 0.48 | • | | | 0.79 | | | | 1.27 | | | | 0.41 | | | | 2.37 | | | | — | | | | 2.78 | | | | — | | | | 25.49 | | | | 4.78 | | | | 0.64 | | | | 0.64 | | | | 0.64 | | | | 1.91 | | | | 8,696 | | | | 69 | |
Class S | | | | | | | | | | | | | | | | | | | | | | | | | | | | | | | | | | | | | | | | | | | | | | | | | | | | | | | | | | | | | | | | | | | | |
| 12-31-19 | | | 25.25 | | | | 0.39 | • | | | 5.69 | | | | 6.08 | | | | 0.42 | | | | 1.49 | | | | — | | | | 1.91 | | | | — | | | | 29.42 | | | | 24.36 | | | | 0.89 | | | | 0.89 | | | | 0.89 | | | | 1.37 | | | | 4,163,308 | | | | 53 | |
| 12-31-18 | | | 27.65 | | | | 0.63 | • | | | (0.40 | ) | | | 0.23 | | | | 0.58 | | | | 2.05 | | | | — | | | | 2.63 | | | | — | | | | 25.25 | | | | 0.51 | | | | 0.89 | | | | 0.89 | | | | 0.89 | | | | 2.29 | | | | 3,640,431 | | | | 75 | |
| 12-31-17 | | | 25.50 | | | | 0.31 | • | | | 3.48 | | | | 3.79 | | | | 0.33 | | | | 1.31 | | | | — | | | | 1.64 | | | | — | | | | 27.65 | | | | 15.10 | | | | 0.89 | | | | 0.89 | | | | 0.89 | | | | 1.13 | | | | 4,050,729 | | | | 61 | |
| 12-31-16 | | | 26.13 | | | | 0.34 | | | | 1.74 | | | | 2.08 | | | | 0.34 | | | | 2.37 | | | | — | | | | 2.71 | | | | — | | | | 25.50 | | | | 8.05 | | | | 0.89 | | | | 0.89 | | | | 0.89 | | | | 1.30 | | | | 4,074,922 | | | | 69 | |
| 12-31-15 | | | 28.82 | | | | 0.33 | | | | 1.18 | | | | 1.51 | | | | 0.35 | | | | 3.85 | | | | — | | | | 4.20 | | | | — | | | | 26.13 | | | | 5.18 | | | | 0.89 | | | | 0.89 | | | | 0.89 | | | | 1.23 | | | | 4,044,261 | | | | 67 | |
Class S2 | | | | | | | | | | | | | | | | | | | | | | | | | | | | | | | | | | | | | | | | | | | | | | | | | | | | | | | | | | | | | | | | | | | | |
| 12-31-19 | | | 25.06 | | | | 0.34 | • | | | 5.65 | | | | 5.99 | | | | 0.37 | | | | 1.49 | | | | — | | | | 1.86 | | | | — | | | | 29.19 | | | | 24.19 | | | | 1.04 | | | | 1.04 | | | | 1.04 | | | | 1.22 | | | | 73,222 | | | | 53 | |
| 12-31-18 | | | 27.47 | | | | 0.58 | • | | | (0.40 | ) | | | 0.18 | | | | 0.54 | | | | 2.05 | | | | — | | | | 2.59 | | | | — | | | | 25.06 | | | | 0.33 | | | | 1.04 | | | | 1.04 | | | | 1.04 | | | | 2.13 | | | | 68,741 | | | | 75 | |
| 12-31-17 | | | 25.33 | | | | 0.26 | • | | | 3.47 | | | | 3.73 | | | | 0.28 | | | | 1.31 | | | | — | | | | 1.59 | | | | — | | | | 27.47 | | | | 14.96 | | | | 1.04 | | | | 1.04 | | | | 1.04 | | | | 0.98 | | | | 74,919 | | | | 61 | |
| 12-31-16 | | | 25.98 | | | | 0.31 | | | | 1.71 | | | | 2.02 | | | | 0.30 | | | | 2.37 | | | | — | | | | 2.67 | | | | — | | | | 25.33 | | | | 7.86 | | | | 1.07 | | | | 1.04 | | | | 1.04 | | | | 1.15 | | | | 82,812 | | | | 69 | |
| 12-31-15 | | | 28.67 | | | | 0.30 | | | | 1.16 | | | | 1.46 | | | | 0.30 | | | | 3.85 | | | | — | | | | 4.15 | | | | — | | | | 25.98 | | | | 5.06 | | | | 1.14 | | | | 1.04 | | | | 1.04 | | | | 1.08 | | | | 87,130 | | | | 67 | |
See Accompanying Notes to Financial Statements
35
FINANCIAL HIGHLIGHTS (CONTINUED)
Selected data for a share of beneficial interest outstanding throughout each year or period.
| | | | | | Income (loss)
from investment
operations | | | | | | Less distributions | | | | | | | | | | | | | | | | | | Ratios to average
net assets | | Supplemental
data |
|---|
Year or
period | | Net asset
value,
beginning
of year
or period | | Net
investment
income (loss) | | Net
realized
and
unrealized
gain (loss) | | Total from
investment
operations | | From net
investment
income | | From net
realized
gains | | From return
of capital | | Total
distributions | | Payment
by affiliate | | Net
asset
value,
end of year
or period | | Total Return(1) | | Expenses
before
reductions/
additions(2)(3)(4) | | Expenses
net of
fee waivers
and/or
recoupments
if any(2)(3)(4) | | Expenses
net of all
reductions/
additions(2)(3)(4) | | Net
investment
income
(loss)(2)(3) | | Net
assets,
end of
year or
period | | Portfolio
turnover
rate |
|---|
| ended | | ($) | | ($) | | ($) | | ($) | | ($) | | ($) | | ($) | | ($) | | ($) | | ($) | | (%) | | (%) | | (%) | | (%) | | (%) | | ($000’s) | | (%) |
|---|
VY® T. Rowe Price Equity Income Portfolio | | | | | | | | | | | | | | | | | | | | | | | | | | | | | | | | | | | | | | | | | | | | | | | | |
Class ADV | | | | | | | | | | | | | | | | | | | | | | | | | | | | | | | | | | | | | | | | | | | | | | | | | | | | | | | | | | | | | | | | | | | | |
| 12-31-19 | | | 10.74 | | | | 0.21 | • | | | 2.42 | | | | 2.63 | | | | 0.26 | | | | 3.14 | | | | — | | | | 3.40 | | | | — | | | | 9.97 | | | | 25.93 | | | | 1.24 | | | | 1.21 | | | | 1.21 | | | | 1.82 | | | | 51,293 | | | | 17 | |
| 12-31-18 | | | 14.34 | | | | 0.23 | | | | (1.38 | ) | | | (1.15 | ) | | | 0.23 | | | | 2.22 | | | | — | | | | 2.45 | | | | — | | | | 10.74 | | | | (9.69 | )(b) | | | 1.24 | | | | 1.09 | (c) | | | 1.09 | | | | 1.80 | (d) | | | 43,287 | | | | 16 | |
| 12-31-17 | | | 13.63 | | | | 0.20 | | | | 1.86 | | | | 2.06 | | | | 0.25 | | | | 1.10 | | | | — | | | | 1.35 | | | | — | | | | 14.34 | | | | 15.89 | | | | 1.24 | | | | 1.24 | | | | 1.24 | | | | 1.38 | | | | 53,101 | | | | 19 | |
| 12-31-16 | | | 13.03 | | | | 0.23 | | | | 2.04 | | | | 2.27 | | | | 0.26 | | | | 1.41 | | | | — | | | | 1.67 | | | | — | | | | 13.63 | | | | 18.30 | | | | 1.29 | | | | 1.24 | | | | 1.24 | | | | 1.67 | | | | 50,794 | | | | 26 | |
| 12-31-15 | | | 16.29 | | | | 0.23 | | | | (1.27 | ) | | | (1.04 | ) | | | 0.26 | | | | 1.96 | | | | — | | | | 2.22 | | | | — | | | | 13.03 | | | | (7.24 | ) | | | 1.39 | | | | 1.24 | | | | 1.24 | | | | 1.52 | | | | 50,413 | | | | 27 | |
Class I | | | | | | | | | | | | | | | | | | | | | | | | | | | | | | | | | | | | | | | | | | | | | | | | | | | | | | | | | | | | | | | | | | | | |
| 12-31-19 | | | 10.97 | | | | 0.29 | • | | | 2.47 | | | | 2.76 | | | | 0.32 | | | | 3.14 | | | | — | | | | 3.46 | | | | — | | | | 10.27 | | | | 26.66 | | | | 0.64 | | | | 0.61 | | | | 0.61 | | | | 2.42 | | | | 81,596 | | | | 17 | |
| 12-31-18 | | | 14.59 | | | | 0.31 | | | | (1.41 | ) | | | (1.10 | ) | | | 0.30 | | | | 2.22 | | | | — | | | | 2.52 | | | | — | | | | 10.97 | | | | (9.09 | )(b) | | | 0.64 | | | | 0.49 | (c) | | | 0.49 | | | | 2.40 | (d) | | | 82,300 | | | | 16 | |
| 12-31-17 | | | 13.85 | | | | 0.28 | • | | | 1.90 | | | | 2.18 | | | | 0.34 | | | | 1.10 | | | | — | | | | 1.44 | | | | — | | | | 14.59 | | | | 16.48 | | | | 0.64 | | | | 0.64 | | | | 0.64 | | | | 1.94 | | | | 99,204 | | | | 19 | |
| 12-31-16 | | | 13.20 | | | | 0.31 | • | | | 2.09 | | | | 2.40 | | | | 0.34 | | | | 1.41 | | | | — | | | | 1.75 | | | | — | | | | 13.85 | | | | 19.07 | | | | 0.64 | | | | 0.64 | | | | 0.64 | | | | 2.32 | | | | 135,151 | | | | 26 | |
| 12-31-15 | | | 16.47 | | | | 0.32 | • | | | (1.28 | ) | | | (0.96 | ) | | | 0.35 | | | | 1.96 | | | | — | | | | 2.31 | | | | — | | | | 13.20 | | | | (6.65 | ) | | | 0.64 | | | | 0.64 | | | | 0.64 | | | | 2.09 | | | | 90,800 | | | | 27 | |
Class S | | | | | | | | | | | | | | | | | | | | | | | | | | | | | | | | | | | | | | | | | | | | | | | | | | | | | | | | | | | | | | | | | | | | |
| 12-31-19 | | | 11.00 | | | | 0.25 | • | | | 2.50 | | | | 2.75 | | | | 0.30 | | | | 3.14 | | | | — | | | | 3.44 | | | | — | | | | 10.31 | | | | 26.42 | | | | 0.89 | | | | 0.86 | | | | 0.86 | | | | 2.13 | | | | 161,388 | | | | 17 | |
| 12-31-18 | | | 14.62 | | | | 0.29 | | | | (1.42 | ) | | | (1.13 | ) | | | 0.27 | | | | 2.22 | | | | — | | | | 2.49 | | | | — | | | | 11.00 | | | | (9.32 | )(b) | | | 0.89 | | | | 0.74 | (c) | | | 0.74 | | | | 2.15 | (d) | | | 541,914 | | | | 16 | |
| 12-31-17 | | | 13.87 | | | | 0.25 | • | | | 1.90 | | | | 2.15 | | | | 0.30 | | | | 1.10 | | | | — | | | | 1.40 | | | | — | | | | 14.62 | | | | 16.23 | | | | 0.89 | | | | 0.89 | | | | 0.89 | | | | 1.73 | | | | 694,870 | | | | 19 | |
| 12-31-16 | | | 13.22 | | | | 0.28 | | | | 2.08 | | | | 2.36 | | | | 0.30 | | | | 1.41 | | | | — | | | | 1.71 | | | | — | | | | 13.87 | | | | 18.77 | | | | 0.89 | | | | 0.89 | | | | 0.89 | | | | 2.01 | | | | 772,218 | | | | 26 | |
| 12-31-15 | | | 16.49 | | | | 0.28 | • | | | (1.28 | ) | | | (1.00 | ) | | | 0.31 | | | | 1.96 | | | | — | | | | 2.27 | | | | — | | | | 13.22 | | | | (6.90 | ) | | | 0.89 | | | | 0.89 | | | | 0.89 | | | | 1.86 | | | | 758,358 | | | | 27 | |
Class S2 | | | | | | | | | | | | | | | | | | | | | | | | | | | | | | | | | | | | | | | | | | | | | | | | | | | | | | | | | | | | | | | | | | | | |
| 12-31-19 | | | 10.82 | | | | 0.23 | • | | | 2.44 | | | | 2.67 | | | | 0.28 | | | | 3.14 | | | | — | | | | 3.42 | | | | — | | | | 10.07 | | | | 26.13 | | | | 1.04 | | | | 1.01 | | | | 1.01 | | | | 2.01 | | | | 90,172 | | | | 17 | |
| 12-31-18 | | | 14.42 | | | | 0.26 | | | | (1.39 | ) | | | (1.13 | ) | | | 0.25 | | | | 2.22 | | | | — | | | | 2.47 | | | | — | | | | 10.82 | | | | (9.45 | )(b) | | | 1.04 | | | | 0.89 | (c) | | | 0.89 | | | | 2.00 | (d) | | | 91,924 | | | | 16 | |
| 12-31-17 | | | 13.70 | | | | 0.23 | | | | 1.87 | | | | 2.10 | | | | 0.28 | | | | 1.10 | | | | — | | | | 1.38 | | | | — | | | | 14.42 | | | | 16.07 | | | | 1.04 | | | | 1.04 | | | | 1.04 | | | | 1.58 | | | | 113,247 | | | | 19 | |
| 12-31-16 | | | 13.08 | | | | 0.25 | | | | 2.06 | | | | 2.31 | | | | 0.28 | | | | 1.41 | | | | — | | | | 1.69 | | | | — | | | | 13.70 | | | | 18.59 | | | | 1.07 | | | | 1.04 | | | | 1.04 | | | | 1.86 | | | | 113,380 | | | | 26 | |
| 12-31-15 | | | 16.35 | | | | 0.25 | | | | (1.27 | ) | | | (1.02 | ) | | | 0.29 | | | | 1.96 | | | | — | | | | 2.25 | | | | — | | | | 13.08 | | | | (7.08 | ) | | | 1.14 | | | | 1.04 | | | | 1.04 | | | | 1.72 | | | | 111,098 | | | | 27 | |
VY® T. Rowe Price International Stock Portfolio | | | | | | | | | | | | | | | | | | | | | | | | | | | | | | | | | | | | | | | | | | | | | | | | |
Class ADV | | | | | | | | | | | | | | | | | | | | | | | | | | | | | | | | | | | | | | | | | | | | | | | | | | | | | | | | | | | | | | | | | | | | |
| 12-31-19 | | | 13.63 | | | | 0.12 | | | | 3.49 | | | | 3.61 | | | | 0.06 | | | | 0.92 | | | | — | | | | 0.98 | | | | — | | | | 16.26 | | | | 27.20 | | | | 1.41 | | | | 1.36 | | | | 1.36 | | | | 0.87 | | | | 23,415 | | | | 30 | |
| 12-31-18 | | | 16.16 | | | | 0.10 | | | | (2.41 | ) | | | (2.31 | ) | | | 0.22 | | | | — | | | | — | | | | 0.22 | | | | — | | | | 13.63 | | | | (14.46 | ) | | | 1.45 | | | | 1.40 | | | | 1.40 | | | | 0.70 | | | | 18,465 | | | | 35 | |
| 12-31-17 | | | 12.79 | | | | 0.08 | | | | 3.42 | | | | 3.50 | | | | 0.13 | | | | — | | | | — | | | | 0.13 | | | | — | | | | 16.16 | | | | 27.42 | | | | 1.40 | | | | 1.40 | | | | 1.40 | | | | 0.64 | | | | 21,086 | | | | 37 | |
| 12-31-16 | | | 12.73 | | | | 0.11 | | | | 0.09 | | | | 0.20 | | | | 0.14 | | | | — | | | | — | | | | 0.14 | | | | — | | | | 12.79 | | | | 1.59 | | | | 1.43 | | | | 1.38 | | | | 1.38 | | | | 0.82 | | | | 15,001 | | | | 33 | |
| 12-31-15 | | | 12.98 | | | | 0.07 | • | | | (0.24 | ) | | | (0.17 | ) | | | 0.08 | | | | — | | | | — | | | | 0.08 | | | | — | | | | 12.73 | | | | (1.36 | )(e) | | | 1.50 | | | | 1.35 | | | | 1.35 | | | | 0.49 | | | | 15,149 | | | | 43 | |
Class I | | | | | | | | | | | | | | | | | | | | | | | | | | | | | | | | | | | | | | | | | | | | | | | | | | | | | | | | | | | | | | | | | | | | |
| 12-31-19 | | | 13.69 | | | | 0.23 | | | | 3.50 | | | | 3.73 | | | | 0.15 | | | | 0.92 | | | | — | | | | 1.07 | | | | — | | | | 16.35 | | | | 28.04 | | | | 0.81 | | | | 0.76 | | | | 0.76 | | | | 1.47 | | | | 41,352 | | | | 30 | |
| 12-31-18 | | | 16.22 | | | | 0.20 | • | | | (2.42 | ) | | | (2.22 | ) | | | 0.31 | | | | — | | | | — | | | | 0.31 | | | | — | | | | 13.69 | | | | (13.96 | ) | | | 0.85 | | | | 0.80 | | | | 0.80 | | | | 1.30 | | | | 35,717 | | | | 35 | |
| 12-31-17 | | | 12.82 | | | | 0.19 | • | | | 3.41 | | | | 3.60 | | | | 0.20 | | | | — | | | | — | | | | 0.20 | | | | — | | | | 16.22 | | | | 28.21 | | | | 0.80 | | | | 0.80 | | | | 0.80 | | | | 1.26 | | | | 44,832 | | | | 37 | |
| 12-31-16 | | | 12.76 | | | | 0.19 | | | | 0.09 | | | | 0.28 | | | | 0.22 | | | | — | | | | — | | | | 0.22 | | | | — | | | | 12.82 | | | | 2.18 | | | | 0.78 | | | | 0.78 | | | | 0.78 | | | | 1.41 | | | | 38,010 | | | | 33 | |
| 12-31-15 | | | 12.99 | | | | 0.16 | • | | | (0.24 | ) | | | (0.08 | ) | | | 0.15 | | | | — | | | | — | | | | 0.15 | | | | — | | | | 12.76 | | | | (0.73 | )(e) | | | 0.75 | | | | 0.75 | | | | 0.75 | | | | 1.15 | | | | 39,288 | | | | 43 | |
Class S | | | | | | | | | | | | | | | | | | | | | | | | | | | | | | | | | | | | | | | | | | | | | | | | | | | | | | | | | | | | | | | | | | | | |
| 12-31-19 | | | 13.64 | | | | 0.18 | • | | | 3.49 | | | | 3.67 | | | | 0.11 | | | | 0.92 | | | | — | | | | 1.03 | | | | — | | | | 16.28 | | | | 27.64 | | | | 1.06 | | | | 1.01 | | | | 1.01 | | | | 1.20 | | | | 151,437 | | | | 30 | |
| 12-31-18 | | | 16.15 | | | | 0.17 | • | | | (2.42 | ) | | | (2.25 | ) | | | 0.26 | | | | — | | | | — | | | | 0.26 | | | | — | | | | 13.64 | | | | (14.12 | ) | | | 1.10 | | | | 1.05 | | | | 1.05 | | | | 1.07 | | | | 137,550 | | | | 35 | |
| 12-31-17 | | | 12.77 | | | | 0.15 | • | | | 3.40 | | | | 3.55 | | | | 0.17 | | | | — | | | | — | | | | 0.17 | | | | — | | | | 16.15 | | | | 27.87 | | | | 1.05 | | | | 1.05 | | | | 1.05 | | | | 1.01 | | | | 175,297 | | | | 37 | |
| 12-31-16 | | | 12.71 | | | | 0.15 | • | | | 0.09 | | | | 0.24 | | | | 0.18 | | | | — | | | | — | | | | 0.18 | | | | — | | | | 12.77 | | | | 1.90 | | | | 1.03 | | | | 1.03 | | | | 1.03 | | | | 1.17 | | | | 154,225 | | | | 33 | |
| 12-31-15 | | | 12.94 | | | | 0.12 | | | | (0.23 | ) | | | (0.11 | ) | | | 0.12 | | | | — | | | | — | | | | 0.12 | | | | — | | | | 12.71 | | | | (0.94 | )(e) | | | 1.00 | | | | 1.00 | | | | 1.00 | | | | 0.88 | | | | 171,416 | | | | 43 | |
(1) | | Total return is calculated assuming reinvestment of all dividends, capital gain distributions and return of capital distributions, if any, at net asset value and does not reflect the effect of insurance contract charges. Total return for periods less than one year is not annualized. |
(2) | | Annualized for periods less than one year. |
(3) | | Ratios reflect operating expenses of a Portfolio. Expenses before reductions/additions do not reflect amounts reimbursed or recouped by the Investment Adviser and/or Distributor or reductions from brokerage service arrangements or other expense offset arrangements and do not represent the amount paid by a Portfolio during periods when reimbursements or reductions occur. Expenses net of fee waivers reflect expenses after reimbursement |
| | | by the Investment Adviser and/or Distributor or recoupment ofpreviously reimbursed fees by the Investment Adviser, but prior to reductions from brokerage service arrangements or other expense offset arrangements. Expenses net of all reductions/additions |
See Accompanying Notes to Financial Statements
36
FINANCIAL HIGHLIGHTS (CONTINUED)
| | represent the net expenses paid by a Portfolio. Net investment income (loss) is net of all such additions or reductions. |
(4) | | Ratios do not include fees and expenses charged under the variable annuity contract or variable life insurance policy. |
(5) | | Commencement of operations. |
(a) | | Excluding amounts related to a foreign currency settlement recorded in the fiscal year ended December 31, 2015, total return for VY® JPMorgan Emerging Markets Equity Portfolio would have been (16.33)%, (15.82)%, (16.00)% and (16.16)% for Classes ADV, I, S and S2, respectively. |
(b) | | Excluding amounts related to a securities lending settlement and a cumulative underpayment of prior years’ waivers of management fees recorded in the year ended December 31, 2018, total return for VY® T.Rowe Price Equity Income Portfolio would have been (9.84)%, (9.24)%, (9.47)% and (9.60)% for Classes ADV, I, S and S2, respectively. |
(c) | | Excluding amounts related to a cumulative underpayment of prior years’ waivers of management fees recorded in the year ended |
| | | December 31, 2018, VY® T.Rowe Price Equity Income Portfolio’s Net Expense Ratios would have been 1.23%, 0.63%, 0.88% and 1.03% for Class ADV, I, S and S2, respectively. |
(d) | | Excluding amounts related to a securities lending settlement and a cumulative underpayment of prior years’ waivers of management fees recorded in the year ended December 31, 2018, VY® T.Rowe Price Equity Income Portfolio’s Net Investment Income Ratios would have been 1.65%, 2.25%, 2.00% and 1.85% for Classes ADV, I, S and S2, respectively. |
(e) | | Excluding amounts related to a foreign currency settlement recorded in the fiscal year ended December 31, 2015, total return for VY® T.Rowe Price International Stock Portfolio would have been (1.44)%, (0.80)% and (1.10)% for Classes ADV, I and S, respectively. |
• | | Calculated using average number of shares outstanding throughout the year or period. |
| * | | Amount is less than $0.005 or 0.005% or more than $(0.005) or (0.005)%. |
See Accompanying Notes to Financial Statements
37
NOTES TO FINANCIAL STATEMENTS AS OF DECEMBER 31, 2019 NOTE 1 — ORGANIZATION
Voya Investors Trust (the “Trust”) is registered under the Investment Company Act of 1940, as amended (the “1940 Act” or the “Act”), as an open-end management investment company. The Trust was organized as a Massachusetts business trust on August 3, 1988. The Trust consists of twenty-two active separate investment series. The eight series (each a “Portfolio” and collectively, the “Portfolios”) included in this report are: Voya Government Liquid Assets Portfolio (“Government Liquid Assets”), VY® Clarion Global Real Estate Portfolio (“Clarion Global Real Estate”), VY® Invesco Growth and Income Portfolio (“Invesco Growth and Income”), VY® JPMorgan Emerging Markets Equity Portfolio (“JPMorgan Emerging Markets Equity”), VY® Morgan Stanley Global Franchise Portfolio (“Morgan Stanley Global Franchise”), VY® T. Rowe Price Capital Appreciation Portfolio (“T. Rowe Price Capital Appreciation”), VY® T. Rowe Price Equity Income Portfolio (“T. Rowe Price Equity Income”), and VY® T. Rowe Price International Stock Portfolio (“T. Rowe Price International Stock”). All of the Portfolios are diversified except for Morgan Stanley Global Franchise, which is a non-diversified Portfolio of the Trust. The investment objective of the Portfolios is described in the respective Portfolio’s Prospectus.
The classes of shares included in this report are: Adviser (“Class ADV”), Institutional (“Class I”), Class R6, Service (“Class S”) and Service 2 (“Class S2”); however, each Portfolio may not offer all share classes. With the exception of class specific matters, each class has equal voting rights as to voting privileges. For class specific proposals, only the applicable class would have voting privileges. The classes differ principally in the applicable distribution and shareholder service fees. Generally, shareholders of each class also bear certain expenses that pertain to that particular class. All shareholders are allocated the common expenses of a portfolio and earn income and realized gains/losses from a portfoliopro rata based on the daily ending net assets of each class, without distinction between share classes. Expenses that are specific to a portfolio or a class are charged directly to that portfolio or class. Other operating expenses shared by several portfolios are generally allocated among those portfolios based on average net assets. Distributions are determined separately for each class based on income and expenses allocated to each class. Realized gain distributions are allocated to each classpro rata based on the shares outstanding of each class on the date of distribution. Differences in per share dividend rates generally result from differences in separate class expenses, including distribution and shareholder service fees, if applicable.
Voya Investments, LLC (“Voya Investments” or the “Investment Adviser”), an Arizona limited liability company, serves as the Investment Adviser to the Portfolios. Voya Investment Management Co. LLC (“Voya IM”), a Delaware limited liability company, serves as the sub-adviser to Government Liquid Assets. Voya Investments Distributor, LLC (“VID” or the “Distributor”), a Delaware limited liability company, serves as the principal underwriter to the Portfolios.
NOTE 2 — SIGNIFICANT ACCOUNTING POLICIES
The following significant accounting policies are consistently followed by the Portfolios in the preparation of their financial statements. Each Portfolio is considered an investment company under U.S. generally accepted accounting principles (“GAAP”) and follows the accounting and reporting guidance applicable to investment companies.
A. Security Valuation. Each Portfolio is open for business every day the New York Stock Exchange (“NYSE”) opens for regular trading (each such day, a “Business Day”). The net asset value (“NAV”) per share for each class of each Portfolio, (except Government Liquid Assets), is determined each Business Day as of the close of the regular trading session (“Market Close”), as determined by the Consolidated Tape Association (“CTA”), the central distributor of transaction prices for exchange-traded securities (normally 4:00 p.m. Eastern time unless otherwise designated by the CTA). The data reflected on the consolidated tape provided by the CTA is generated by various market centers, including all securities exchanges, electronic communications networks, and third-market broker-dealers. The NAV per share of each class of each Portfolio is calculated by taking the value of the Portfolio’s assets attributable to that class, subtracting the Portfolio’s liabilities attributable to that class, and dividing by the number of shares of that class that are outstanding. On days when a Portfolio is closed for business, Portfolio shares will not be priced and a Portfolio does not transact purchase and redemption orders. To the extent a Portfolio’s assets are traded in other markets on days when a Portfolio does not price its shares, the value of a Portfolio’s assets will likely change and you will not be able to purchase or redeem shares of a Portfolio.
Assets for which market quotations are readily available are valued at market value. A security listed or traded on an exchange is valued at its last sales price or official closing price as of the close of the regular trading session on the exchange where the security is principally traded or, if such price is not available, at the last sale price as of the Market Close for such security provided by the CTA. Bank loans are valued at the average of the averages of the bid and ask
38
NOTES TO FINANCIAL STATEMENTS AS OF DECEMBER 31, 2019 (CONTINUED)
NOTE 2 — SIGNIFICANT ACCOUNTING POLICIES (continued)
prices provided to an independent loan pricing service by brokers. Futures contracts are valued at the final settlement price set by an exchange on which they are principally traded. Listed options are valued at the mean between the last bid and ask prices from the exchange on which they are principally traded. Investments in open-end registered investment companies that do not trade on an exchange are valued at the end of day NAV per share. Investments in registered investment companies that trade on an exchange are valued at the last sales price or official closing price as of the close of the regular trading session on the exchange where the security is principally traded.
When a market quotation is not readily available or is deemed unreliable, each Portfolio will determine a fair value for the relevant asset in accordance with procedures adopted by the Portfolios’ Board of Trustees (“Board”). Such procedures provide, for example, that: (a) Exchange-traded securities are valued at the mean of the closing bid and ask; (b) Debt obligations are valued using an evaluated price provided by an independent pricing service. Evaluated prices provided by the pricing service may be determined without exclusive reliance on quoted prices, and may reflect factors such as institution-size trading in similar groups of securities, developments related to specific securities, benchmark yield, quality, type of issue, coupon rate, maturity, individual trading characteristics and other market data; (c) Securities traded in the over-the-counter (“OTC”) market are valued based on prices provided by independent pricing services or market makers; (d) Options not listed on an exchange are valued by an independent source using an industry accepted model, such as Black-Scholes; (e) Centrally cleared swap agreements are valued using a price provided by the central counterparty clearinghouse; (f) OTC swap agreements are valued using a price provided by an independent pricing service; (g) Forward foreign currency exchange contracts are valued utilizing current and forward rates obtained from an independent pricing service. Such prices from the third party pricing service are for specific settlement periods and each Portfolio’s forward foreign currency exchange contracts are valued at an interpolated rate between the closest preceding and subsequent period reported by the independent pricing service; and (h) Securities for which market prices are not provided by any of the above methods may be valued based upon quotes furnished by brokers.
The prospectuses of the open-end registered investment companies in which each Portfolio may invest explain the circumstances under which they will use fair value pricing and the effects of using fair value pricing.
Foreign securities’ (including forward foreign currency exchange contracts) prices are converted into U.S. dollar amounts using the applicable exchange rates as of Market Close. If market quotations are available and believed to be reliable for foreign exchange-traded equity securities, the securities will be valued at the market quotations. Because trading hours for certain foreign securities end before Market Close, closing market quotations may become unreliable. An independent pricing service determines the degree of certainty, based on historical data, that the closing price in the principal market where a foreign security trades is not the current value as of Market Close. Foreign securities’ prices meeting the approved degree of certainty that the price is not reflective of current value will be valued by the independent pricing service using pricing models designed to estimate likely changes in the values of those securities between the times in which the trading in those securities is substantially completed and Market Close. Multiple factors may be considered by the independent pricing service in determining the value of such securities and may include information relating to sector indices, American Depositary Receipts and domestic and foreign index futures.
All other assets for which market quotations are not readily available or became unreliable (or if the above fair valuation methods are unavailable or determined to be unreliable) are valued at fair value as determined in good faith by or under the supervision of the Board following procedures approved by the Board. The Board has delegated to the Investment Adviser responsibility for overseeing the implementation of the Portfolios’ valuation procedures; a “Pricing Committee” comprised of employees of the Investment Adviser or its affiliates has responsibility for applying the fair valuation methods set forth in the procedures and, if a fair valuation cannot be determined pursuant to the fair valuation methods, determining the fair value of assets held by the Portfolios. Issuer specific events, transaction price, position size, nature and duration of restrictions on disposition of the security, market trends, bid/ask quotes of brokers and other market data may be reviewed in the course of making a good faith determination of a security’s fair value. Valuations change in response to many factors including the historical and prospective earnings of the issuer, the value of the issuer’s assets, general economic conditions, interest rates, investor perceptions and market liquidity. Because of the inherent uncertainties of fair valuation, the values used to determine each Portfolio’s NAV may materially differ from the value received upon actual sale of those investments. Thus, fair valuation may have an unintended dilutive or accretive effect on the value of shareholders’ investments in each Portfolio.
39
NOTES TO FINANCIAL STATEMENTS AS OF DECEMBER 31, 2019 (CONTINUED)
NOTE 2 — SIGNIFICANT ACCOUNTING POLICIES (continued)
Government Liquid Assets uses the amortized cost method to value its portfolio securities and seeks to maintain a constant NAV of $1.00 per share, although there may be circumstances under which this goal cannot be achieved. The amortized cost method involves valuing a security at its cost and amortizing any discount or premium over the period until maturity, regardless of the impact of fluctuating interest rates or the market value of the security. Although the Board has established procedures designed to stabilize, to the extent reasonably possible, the share price of Government Liquid Assets, there can be no assurance that the Portfolio’s NAV can be maintained at $1.00 per share.
Each investment asset or liability of the Portfolios is assigned a level at measurement date based on the significance and source of the inputs to its valuation. Quoted prices in active markets for identical securities are classified as “Level 1,” inputs other than quoted prices for an asset or liability that are observable are classified as “Level 2” and significant unobservable inputs, including the sub-advisers’ or Pricing Committee’s judgment about the assumptions that a market participant would use in pricing an asset or liability are classified as “Level 3.” The inputs used for valuing securities are not necessarily an indication of the risks associated with investing in those securities. Short-term securities of sufficient credit quality are generally considered to be Level 2 securities under applicable accounting rules. A table summarizing the Portfolios’ investments under these levels of classification is included within the Portfolio of Investments.
GAAP requires a reconciliation of the beginning to ending balances for reported fair values that presents changes attributable to total realized and unrealized gains or losses, purchases and sales, and transfers in or out of the Level 3 category during the period. A reconciliation of Level 3 investments within the Portfolio of Investments is presented only when a Portfolio has a significant amount of Level 3 investments.
B. Securities Transactions and Revenue Recognition. Securities transactions are accounted for on the trade date. Realized gains and losses are reported on the basis of identified cost of securities sold. Interest income is recorded on an accrual basis. Dividend income is recorded on the ex-dividend date, or for certain foreign securities, when the information becomes available to the Portfolios. Premium amortization and discount accretion are determined by the effective yield method. Clarion Global Real Estate estimates components of distributions from real estate investment trusts (“REITs”). Distributions received in excess of income are recorded as a reduction of cost of the related investments. If Clarion Global Real
Estate no longer owns the applicable securities, any distributions received in excess of income are recorded as realized gains.
C. Foreign Currency Translation. The books and records of the Portfolios are maintained in U.S. dollars. Any foreign currency amounts are translated into U.S. dollars on the following basis:
| (1) | | Market value of investment securities, other assets and liabilities — at the exchange rates prevailing at Market Close. |
| (2) | | Purchases and sales of investment securities, income and expenses — at the rates of exchange prevailing on the respective dates of such transactions. |
Although the net assets and the market values are presented at the foreign exchange rates at Market Close, the Portfolios do not isolate the portion of the results of operations resulting from changes in foreign exchange rates on investments from the fluctuations arising from changes in market prices of securities held. Such fluctuations are included with the net realized and unrealized gains or losses from investments. For securities which are subject to foreign withholding tax upon disposition, liabilities are recorded on the Statements of Assets and Liabilities for the estimated tax withholding based on the securities’ current market value. Upon disposition, realized gains or losses on such securities are recorded net of foreign withholding tax.
Reported net realized foreign exchange gains or losses arise from sales of foreign currencies, currency gains or losses realized between the trade and settlement dates on securities transactions, the difference between the amounts of dividends, interest, and foreign withholding tax reclaims recorded on the Portfolios’ books, and the U.S. dollar equivalent of the amounts actually received or paid. Net unrealized foreign exchange gains and losses arise from changes in the value of assets and liabilities other than investments in securities, resulting from changes in the exchange rate. Foreign security and currency transactions may involve certain considerations and risks not typically associated with investing in U.S. companies and U.S. government securities. These risks include, but are not limited to, revaluation of currencies and future adverse political and economic developments which could cause securities and their markets to be less liquid and prices more volatile than those of comparable U.S. companies and U.S. government securities. The foregoing risks are even greater with respect to securities of issuers in emerging markets.
D. Distributions to Shareholders. The Portfolios record distributions to their shareholders on the ex-dividend date.
40
NOTES TO FINANCIAL STATEMENTS AS OF DECEMBER 31, 2019 (CONTINUED)
NOTE 2 — SIGNIFICANT ACCOUNTING POLICIES (continued)
Dividends from net investment income, if any, are declared daily and paid monthly and net capital gains distributions, if any, are declared and paid annually by Government Liquid Assets. Dividends from net investment income, if any, are declared and paid semi-annually and net capital gains distributions, if any, are declared and paid annually by T. Rowe Price Capital Appreciation and T. Rowe Price Equity Income. For all other Portfolios, dividends from net investment income and net capital gain distributions, if any, are declared and paid annually. The Portfolios may make distributions on a more frequent basis to comply with the distribution requirements of the Internal Revenue Code. The characteristics of income and gains to be distributed are determined in accordance with income tax regulations, which may differ from GAAP for investment companies.
E. Federal Income Taxes. It is the policy of each Portfolio to comply with the requirements of subchapter M of the Internal Revenue Code that are applicable to regulated investment companies and to distribute substantially all of its net investment income and any net realized capital gains to its shareholders. Therefore, a federal income tax or excise tax provision is not required. Management has considered the sustainability of the Portfolios’ tax positions taken on federal income tax returns for all open tax years in making this determination. No capital gain distributions shall be made until the capital loss carryforwards have been fully utilized or expire.
The Portfolios may utilize equalization accounting for tax purposes, whereby a portion of redemption payments are treated as distributions of income or gain.
F. Use of Estimates. The preparation of financial statements in conformity with GAAP requires management to make estimates and assumptions that affect the reported amounts of assets and liabilities and disclosure of contingent assets and liabilities at the date of the financial statements and the reported amounts of increases and decreases in net assets from operations during the reporting period. Actual results could differ from those estimates.
G. Risk Exposures and the Use of Derivative Instruments. The Portfolios’ investment strategies permit the Portfolios to enter into various types of derivatives contracts, including, but not limited to, futures contracts, forward foreign currency exchange contracts, credit default swaps, interest rate swaps, total return swaps, and purchased and written options. In doing so, a Portfolio will employ strategies in differing combinations to permit it to increase or decrease the level of risk, or change the level or types of exposure to risk factors. This may allow a Portfolio to pursue its objectives more quickly, and
efficiently than if it were to make direct purchases or sales of securities capable of affecting a similar response to market or credit factors.
In pursuit of its investment objectives, a Portfolio may seek to increase or decrease its exposure to the following market or credit risk factors:
Credit Risk. The price of a bond or other debt instrument is likely to fall if the issuer’s actual or perceived financial health deteriorates, whether because of broad economic or issuer-specific reasons. In certain cases, the issuer could be late in paying interest or principal, or could fail to pay its financial obligations altogether.
Equity Risk. Stock prices may be volatile or have reduced liquidity in response to real or perceived impacts of factors including, but not limited to, economic conditions, changes in market interest rates, and political events. Stock markets tend to be cyclical, with periods when stock prices generally rise and periods when stock prices generally decline. Any given stock market segment may remain out of favor with investors for a short or long period of time, and stocks as an asset class may underperform bonds or other asset classes during some periods. Additionally, legislative, regulatory or tax policies or developments in these areas may adversely impact the investment techniques available to a manager, add to costs and impair the ability of a Portfolio to achieve its investment objectives.
Foreign Exchange Rate Risk. To the extent that a Portfolio invests directly in foreign (non-U.S.) currencies or in securities denominated in, or that trade in, foreign (non-U.S.) currencies, it is subject to the risk that those foreign (non-U.S.) currencies will decline in value relative to the U.S. dollar or, in the case of hedging positions, that the U.S. dollar will decline in value relative to the currency being hedged by a Portfolio through foreign currency exchange transactions.
Currency rates may fluctuate significantly over short periods of time. Currency rates may be affected by changes in market interest rates, intervention (or the failure to intervene) by U.S. or foreign governments, central banks or supranational entities such as the International Monetary Fund, by the imposition of currency controls, or other political or economic developments in the United States or abroad.
Interest Rate Risk. With bonds and other fixed rate debt instruments, a rise in market interest rates generally causes values to fall; conversely, values generally rise as market interest rates fall. The higher the credit quality of the instrument, and the longer its maturity or duration, the more sensitive it is likely to be to interest rate risk. In the case of inverse securities, the interest rate paid by the securities is a floating rate, which generally will decrease when the
41
NOTES TO FINANCIAL STATEMENTS AS OF DECEMBER 31, 2019 (CONTINUED)
NOTE 2 — SIGNIFICANT ACCOUNTING POLICIES (continued)
market rate of interest to which the inverse security is indexed increases and will increase when the market rate of interest to which the inverse security is indexed decreases. As of the date of this report, the United States experiences a low interest rate environment, which may increase a Portfolio’s exposure to risks associated with rising market interest rates. Rising market interest rates could have unpredictable effects on the markets and may expose fixed-income and related markets to heightened volatility. For a fund that invests in fixed-income securities, an increase in market interest rates may lead to increased redemptions and increased portfolio turnover, which could reduce liquidity for certain investments, adversely affect values, and increase costs. If dealer capacity in fixed-income markets is insufficient for market conditions, it may further inhibit liquidity and increase volatility in the fixed-income markets. Further, recent and potential changes in government policy may affect interest rates.
Risks of Investing in Derivatives. A Portfolio’s use of derivatives can result in losses due to unanticipated changes in the market or credit risk factors and the overall market. In instances where a Portfolio is using derivatives to decrease, or hedge, exposures to market or credit risk factors for securities held by a Portfolio, there are also risks that those derivatives may not perform as expected resulting in losses for the combined or hedged positions.
Derivative instruments are subject to a number of risks, including the risk of changes in the market price of the underlying securities, credit risk with respect to the counterparty, risk of loss due to changes in market interest rates and liquidity and volatility risk. The amounts required to purchase certain derivatives may be small relative to the magnitude of exposure assumed by a Portfolio. Therefore, the purchase of certain derivatives may have an economic leveraging effect on a Portfolio and exaggerate any increase or decrease in the NAV. Derivatives may not perform as expected, so a Portfolio may not realize the intended benefits. When used for hedging purposes, the change in value of a derivative may not correlate as expected with the currency, security or other risk being hedged. When used as an alternative or substitute for direct cash investments, the return provided by the derivative may not provide the same return as direct cash investment. In addition, given their complexity, derivatives expose a Portfolio to the risk of improper valuation.
Generally, derivatives are sophisticated financial instruments whose performance is derived, at least in part, from the performance of an underlying asset or assets. Derivatives include, among other things, swap agreements, options, forwards and futures. Investments in derivatives are generally negotiated OTC with a single counterparty and as a result are
subject to credit risks related to the counterparty’s ability or willingness to perform its obligations; any deterioration in the counterparty’s creditworthiness could adversely affect the value of the derivative. In addition, derivatives and their underlying securities may experience periods of illiquidity which could cause a Portfolio to hold a security it might otherwise sell, or to sell a security it otherwise might hold at inopportune times or at an unanticipated price. A manager might imperfectly judge the direction of the market. For instance, if a derivative is used as a hedge to offset investment risk in another security, the hedge might not correlate to the market’s movements and may have unexpected or undesired results such as a loss or a reduction in gains.
Counterparty Credit Risk and Credit Related Contingent Features. Certain derivative positions are subject to counterparty credit risk, which is the risk that the counterparty will not fulfill its obligation to a Portfolio. Each Portfolio’s derivative counterparties are financial institutions who are subject to market conditions that may weaken their financial position. A Portfolio intends to enter into financial transactions with counterparties that it believes to be creditworthy at the time of the transaction. To reduce this risk, a Portfolio enters into master netting arrangements, established within each Portfolio’s International Swap and Derivatives Association, Inc. (“ISDA”) Master Agreements (“Master Agreements”). These Master Agreements are with select counterparties and they govern transactions, including certain OTC derivative and forward foreign currency contracts, entered into by a Portfolio and the counterparty. The Master Agreements maintain provisions for general obligations, representations, agreements, collateral, and events of default or termination. The occurrence of a specified event of termination may give a counterparty the right to terminate all of its contracts and affect settlement of all outstanding transactions under the applicable Master Agreement.
A Portfolio may also enter into collateral agreements with certain counterparties to further mitigate counterparty credit risk on OTC derivative and forward foreign currency contracts. Subject to established minimum levels, collateral is generally determined based on the net aggregate unrealized gain or loss on contracts with a certain counterparty. Collateral pledged to or from a Portfolio is held in a segregated account by a third-party agent and can be in the form of cash or debt securities issued by the U.S. government or related agencies.
As of December 31, 2019, the maximum amount of loss that Invesco Growth and Income, T. Rowe Price Capital Appreciation and T. Rowe Price International Stock would incur if its counterparties failed to perform would be $8,521, $161 and $2,925, respectively, which represents the gross payments to be received on open forward foreign currency
42
NOTES TO FINANCIAL STATEMENTS AS OF DECEMBER 31, 2019 (CONTINUED)
NOTE 2 — SIGNIFICANT ACCOUNTING POLICIES (continued)
contracts were they to be unwound as of December 31, 2019. There was no collateral pledged by any counterparty at December 31, 2019 to any Portfolio.
Certain Portfolios have entered into derivative contracts that contain credit related contingent features that if triggered would allow its derivative counterparties to close out and demand payment or additional collateral to cover their exposure from a Portfolio. Credit related contingent features are established between each Portfolio and its derivatives counterparties to reduce the risk that a Portfolio will not fulfill its payment obligations to its counterparties. These triggering features include, but are not limited to, a percentage decrease in a Portfolio’s net assets and/or a percentage decrease in a Portfolio’s NAV, which could cause a Portfolio to accelerate payment of any net liability owed to the counterparty. The contingent features are established within each Portfolio’s Master Agreements.
As of December 31, 2019, Invesco Growth Income, T. Rowe Price Capital Appreciation and T. Rowe Price International Stock had a liability position of $711,215, $75,492,168 and $6,525, respectively, on open forward foreign currency contracts and open OTC written options. If a contingent feature would have been triggered as of December 31, 2019, the Portfolio’s could have been required to pay these amounts in cash to its counterparties. There was no collateral pledged by any Portfolio as of December 31, 2019.
At December 31, 2019, Clarion Global Real Estate had not entered into any Master Agreements.
H. Participatory Notes. JPMorgan Emerging Markets Equity may invest up to 10% of its assets in participatory notes (“P-Notes”). P-Notes are a type of promissory note and are designed to offer a return linked to the performance of a particular underlying equity security or market. P-Notes are issued by banks or broker-dealers and allow the Portfolio to gain exposure to common stocks in markets where direct investment is not allowed. Income received from P-Notes is recorded as dividend income in the Statements of Operations. P-Notes may contain various risks including the potential inability of the counterparty to fulfill their obligations under the terms of the contract. These securities may be more volatile and less liquid than other investments held by the Portfolio. There were no open P-Notes at December 31, 2019.
I. Forward Foreign Currency Transactions and Futures Contracts. Certain Portfolios may enter into forward foreign currency contracts primarily to hedge against foreign currency exchange rate risks on their non-U.S. dollar denominated investment securities. When entering into a forward currency contract, a Portfolio agrees to receive or deliver a fixed quantity of foreign currency for
an agreed-upon price on an agreed future date. These contracts are valued daily and a Portfolio’s net equity therein, representing unrealized gain or loss on the contracts as measured by the difference between the forward foreign exchange rates at the dates of entry into the contracts and the forward rates at the reporting date, is included in the Statements of Assets and Liabilities. Realized and unrealized gains and losses are included in the Statements of Operations. These instruments involve market and/or credit risk in excess of the amount recognized in the Statements of Assets and Liabilities. Risks arise from the possible inability of counterparties to meet the terms of their contracts and from movement in currency and securities values and interest rates. Open forward foreign currency contracts are presented following the respective Portfolio of Investments.
During the year ended December 31, 2019, the following Portfolios had average contract amounts on forward foreign currency contracts purchased and sold as disclosed below. The Portfolios use forward foreign currency contracts primarily to protect any non-U.S. dollar-denominated holdings from adverse currency movements. Please refer to the tables within each respective Portfolio of Investments for open forward currency contracts at December 31, 2019.
| | | | Purchased | | Sold |
|---|
| Clarion Global Real Estate | | | | $ | — | | | $ | 676,457 | |
| Invesco Growth and Income | | | | | 503,265 | | | | 33,698,810 | |
| T. Rowe Price Capital Appreciation | | | | | 1,553,571 | | | | — | |
| T. Rowe Price International Stock | | | | | 97,481 | | | | 1,142,444 | |
Each Portfolio may enter into futures contracts involving foreign currency, interest rates, securities and security indices. A futures contract is a commitment to buy or sell a specific amount of a financial instrument at a negotiated price on a stipulated future date. Each Portfolio may buy and sell futures contracts. Futures contracts traded on a commodities or futures exchange will be valued at the final settlement price or official closing price on the principal exchange as reported by such principal exchange at its trading session ending at, or most recently prior to, the time when the Portfolio’s assets are valued.
Upon entering into a futures contract, each Portfolio is required to deposit either cash or securities (initial margin) in an amount equal to a certain percentage of the contract value. Subsequent payments (variation margin) are made or received by the Portfolio each day. The variation margin payments are equal to the daily changes in the contract value and are recorded as unrealized gains and losses. Open futures contracts are reported on a table following each Portfolio of Investments. Securities held in collateralized accounts to cover initial margin requirements on open futures contracts are footnoted in the Portfolio of Investments, if any. Cash collateral held by the broker to
43
NOTES TO FINANCIAL STATEMENTS AS OF DECEMBER 31, 2019 (CONTINUED)
NOTE 2 — SIGNIFICANT ACCOUNTING POLICIES (continued)
cover initial margin requirements on open futures contracts are noted in each Portfolio’s Statement of Assets and Liabilities. The net change in unrealized appreciation and depreciation is reported in each Portfolio’s Statement of Operations. Realized gains (losses) are reported in each Portfolio’s Statement of Operations at the closing or expiration of futures contracts.
Futures contracts are exposed to the market risk factor of the underlying financial instrument. During the year ended December 31, 2019, certain Portfolios had purchased futures contracts on various equity indices to “equitize” cash. Futures contracts are purchased to provide immediate market exposure proportionate to the size of the Portfolio’s respective cash flows and residual cash balances in order to decrease potential tracking error if the cash remained uninvested in the market. Additional associated risks of entering into futures contracts include the possibility that there may be an illiquid market where the Portfolios are unable to liquidate the contract or enter into an offsetting position and, if used for hedging purposes, the risk that the price of the contract will correlate imperfectly with the prices of the Portfolios’ securities. With futures, there is minimal counterparty credit risk to the Portfolios since futures are exchange traded and the exchange’s clearinghouse, as counterparty to all exchange traded futures, guarantees the futures against default.
During the year ended December 31, 2019, T. Rowe Price Equity Income had an average notional value on futures contracts purchased of $1,330,893. There were no open futures contracts for T. Rowe Price Equity Income at December 31, 2019.
J. Options Contracts. Certain Portfolios may purchase put and call options and may write (sell) put options and covered call options. The Portfolios may engage in option transactions as a hedge against adverse movements in the value of portfolio holdings or to increase market exposure. Option contracts are valued daily and unrealized gains or losses are recorded based upon the last sales price on the principal exchange on which the options are traded. An amount equal to the proceeds of the premium received by the Portfolios upon the writing of a put or call option is included in the Statements of Assets and Liabilities as an asset and equivalent liability which is subsequently marked-to-market until it is exercised or closed, or it expires. The Portfolios will realize a gain or loss upon the expiration or closing of the option contract. When an option is exercised, the proceeds on sales of the underlying security for a written call option, the purchase cost of the security for a written put option, or the cost of the security for a purchased put or call option is adjusted by the amount of premium received or paid. Realized and unrealized gains or losses on option contracts
are reflected in the accompanying financial statements. The risk in writing a covered call option is that the Portfolios give up the opportunity for profit if the market price of the security increases and the option is exercised. The risk in writing a put option is that the Portfolios may incur a loss if the market price of the security decreases and the option is exercised. The risk in buying an option is that the Portfolios pay a premium whether or not the option is exercised. Risks may also arise from an illiquid secondary market or from the inability of counterparties to meet the terms of the contract.
During the year ended December 31, 2019, T. Rowe Price Capital Appreciation had purchased equity options with an average notional value of $11,123,300 to gain additional exposure to equity risk. There were no open purchased options at December 31, 2019.
During the year ended December 31, 2019, T. Rowe Price Capital Appreciation and T. Rowe Price International Stock had written equity options with an average notional value of $915,894,171 and $274,345, respectively, to generate income. Please refer to the tables within the Portfolio of Investments for T. Rowe Price Capital Appreciation and T. Rowe Price International Stock for open written equity options at December 31, 2019.
K. Repurchase Agreements. Each Portfolio may invest in repurchase agreements only with government securities dealers recognized by the Board of Governors of the Federal Reserve System. Under such agreements, the seller of the security agrees to repurchase it at a mutually agreed upon time and price. The resale price is in excess of the purchase price and reflects an agreed upon interest rate for the period of time the agreement is outstanding. The period of the repurchase agreements is usually short, from overnight to one week, while the underlying securities generally have longer maturities. Each Portfolio will receive as collateral securities acceptable to it whose market value is equal to at least 100% of the carrying amount of the repurchase agreement, plus accrued interest, being invested by a Portfolio. The underlying collateral is valued daily on a mark-to-market basis to assure that the value, including accrued interest, is at least equal to the repurchase price. If the seller defaults, a Portfolio might incur a loss or delay in the realization of proceeds if the value of the security collateralizing the repurchase agreement declines, and may incur disposition costs in liquidating the collateral.
Repurchase agreements are entered into by the Portfolios under Master Repurchase Agreements (“MRA”) which permit the Portfolios, under certain circumstances, including an event of default (such as bankruptcy or insolvency), to offset receivables or payables under the MRA with collateral held and/or pledged by the counterparty and create one single net payment due to or from the respective Portfolio. Please refer to the table
44
NOTES TO FINANCIAL STATEMENTS AS OF DECEMBER 31, 2019 (CONTINUED)
NOTE 2 — SIGNIFICANT ACCOUNTING POLICIES (continued)
following the Portfolio of Investments for Government Liquid Assets for open repurchase agreements subject to the MRA on a net basis at December 31, 2019.
L. Securities Lending. Each Portfolio may temporarily loan up to 33⅓% (except for JPMorgan Emerging Markets Equity which may temporarily loan up to 30%) of its total assets to brokers, dealers or other financial institutions in exchange for a negotiated lender’s fee. Securities lending involves two primary risks: “investment risk” and “borrower default risk.” When lending securities, the Portfolios will receive cash or U.S. government securities as collateral. Investment risk is the risk that the Portfolios will lose money from the investment of the cash collateral received from the borrower. Borrower default risk is the risk that the Portfolios will lose money due to the failure of a borrower to return a borrowed security. Loans are subject to termination at the option of the borrower or the Portfolios. Securities lending may result in leverage. The use of leverage may exaggerate any increase or decrease in the NAV, causing the Portfolios to be more volatile. The use of leverage may increase expenses and increase the impact of the Portfolios’ other risks.
M. Restricted Securities. The Portfolios may invest in restricted securities, which include those sold under Rule 144A of the Securities Act of 1933, as amended (“1933 Act”) or securities offered pursuant to Section 4(a)(2) of the 1933 Act, and/or are subject to legal or contractual restrictions on resale and may not be publicly sold without registration under the 1933 Act. Restricted securities are fair valued using market quotations when readily available. In the absence of market quotations, the securities are valued based upon their fair value determined in good faith under procedures approved by the Board.
Securities that are not registered for sale to the public under the 1933 Act are referred to as “restricted securities.” These securities may be sold in private placement transactions between issuers and their purchasers and may be neither listed on an exchange nor traded in other established markets. Many times these securities are subject to legal or contractual restrictions on resale. As a result of the absence of a public trading market, the prices of these securities may be more volatile, less liquid and more difficult to value than publicly traded securities. The price realized from the sale of these securities could be less than the amount originally paid or less than their fair value if they are resold in privately negotiated transactions. In addition, these securities may not be subject to disclosure and other investment protection requirements that are afforded to publicly traded securities. Certain investments may include investment in smaller, less seasoned issuers, which may involve greater risk.
N. Indemnifications. In the normal course of business, the Trust may enter into contracts that provide certain indemnifications. The Trust’s maximum exposure under these arrangements is dependent on future claims that may be made against the Portfolios and, therefore, cannot be estimated; however, based on experience, management considers the risk of loss from such claims remote.
NOTE 3 — INVESTMENT TRANSACTIONS
For the year ended December 31, 2019, the cost of purchases and the proceeds from the sales of securities, excluding U.S. government and short-term securities were as follows:
| | | | Purchases | | Sales |
|---|
| Clarion Global Real Estate | | | | $ | 177,449,921 | | | $ | 198,658,692 | |
| Invesco Growth and Income | | | | | 92,624,721 | | | | 164,196,293 | |
| JPMorgan Emerging Markets Equity | | | | | 100,403,136 | | | | 149,280,877 | |
| Morgan Stanley Global Franchise | | | | | 63,232,628 | | | | 103,250,765 | |
| T. Rowe Price Capital Appreciation | | | | | 3,191,634,265 | | | | 3,716,168,131 | |
| T. Rowe Price Equity Income | | | | | 127,316,834 | | | | 656,144,383 | |
| T. Rowe Price International Stock | | | | | 60,397,168 | | | | 81,700,974 | |
U.S. government securities not included above were as follows:
| | | | Purchases | | Sales |
|---|
| T. Rowe Price Capital Appreciation | | | | $ | 220,531,624 | | | $ | 364,375,046 | |
NOTE 4 — INVESTMENT MANAGEMENT FEES
Clarion Global Real Estate and T. Rowe Price International Stock have entered into investment management agreements (“Management Agreements”) with the Investment Adviser. The Investment Adviser has overall responsibility for the management of the Portfolios. The Investment Adviser oversees all investment management and portfolio management services for the Portfolios and assists in managing and supervising all aspects of the general day-to-day business activities and operations of the Portfolios, including custodial, transfer agency, dividend disbursing, accounting, auditing, compliance and related services. Each Management Agreement compensates the Investment Adviser with a management fee, computed daily and payable monthly, based on the average daily net assets of each Portfolio, at the following annual rates:
| Portfolio | | | Fee |
|---|
| Clarion Global Real Estate | | | 0.90% on the first $250 million;
0.875% on the next $250 million;
0.80% on the amount in excess of $500 million |
T. Rowe Price International Stock(1) | | | 0.64% on the first $4 billion;
0.63% on the amount in excess of $4 billion |
(1) | | The Investment Adviser is contractually obligated to waive 0.04% of the management fee for T. Rowe Price International Stock. This waiver is not eligible for recoupment. Termination or modification of this obligation requires approval by the Board. |
45
NOTES TO FINANCIAL STATEMENTS AS OF DECEMBER 31, 2019 (CONTINUED)
NOTE 4 — INVESTMENT MANAGEMENT FEES (continued)
With the exception of the Portfolios in the table above, the Investment Adviser provides the Portfolios with advisory and administrative services under a management agreement (the “Unified Agreement”). Under the Unified Agreement, the Investment Adviser has overall responsibility for engaging sub-advisers and for monitoring and evaluating the management of the assets of each Portfolio. Sub-advisers have full investment discretion and make all determinations with respect to the investment of a Portfolio’s assets and the purchase and sale of portfolio securities and other investments. Pursuant to this Unified Agreement, the Investment Adviser is also responsible for providing or procuring, at the Investment Adviser’s expense, the services reasonably necessary for the ordinary operation of each Portfolio, including, among other things, custodial, administrative, transfer agency, portfolio accounting, auditing and ordinary legal expenses. As compensation for its services under the Unified Agreement, the Trust pays the Investment Adviser a monthly fee (a “Unified Fee”) based on the following annual rates of the average daily net assets of the Portfolios:
| Portfolio | | | | Fee |
|---|
Government Liquid Assets(2) | | | | 0.35% on the first $200 million;
0.30% on the next $300 million;
0.25% on the amount in excess of $500 million |
| JPMorgan Emerging Markets Equity | | | | 1.25% |
| Morgan Stanley Global Franchise | | | | 1.00% on the first $250 million;
0.90% on the next $250 million;
0.75% on the amount in excess of $500 million |
Invesco Growth and Income,
T. Rowe Price Capital Appreciation, and
T. Rowe Price Equity Income(3) | | | | 0.75% first $750 million;
0.70% on the next $1.25 billion;
0.65% on the next $1.5 billion;
0.60% on the amount in excess of $3.5 billion |
(2) | | The assets of Government Liquid Assets are aggregated with those of Voya Limited Maturity Bond Portfolio, which is not included in this report, to determine the Unified Fee applicable to the Portfolio. |
(3) | | The assets of these Portfolios are aggregated with those of VY® Clarion Real Estate Portfolio, which is not included in this report, to determine the Unified Fee applicable to each respective Portfolio. |
Effective May 1, 2019, the Investment Adviser has contractually agreed to waive 0.010%, 0.026%, and 0.030% of the management fee for Clarion Global Real Estate, Morgan Stanley Global Franchise and T. Rowe Price Equity Income, respectively. Any fees waived or reimbursed are not eligible for recoupment. Termination or modification of these obligations requires approval by the Board. These waivers replace the management fee waivers in connection with the sub-advisory fee reductions.
Prior to May 1, 2019, the Investment Adviser had contractually agreed to waive a portion of the management
fee for Clarion Global Real Estate(4), Morgan Stanley Global Franchise and T. Rowe Price Equity Income. For Clarion Global Real Estate and Morgan Stanley Global Franchise, the waivers were effective in connection with a sub-advisory fee reduction that occurred on May 1, 2009 and July 1, 2015, respectively. The waivers were calculated as follows: Waiver = 50% x (former sub-advisory fee rate minus new sub-advisory fee rate) x average daily net assets as of the calculation date. The waiver for T. Rowe Price Equity Income was based on the total savings in excess of $500,000 as a result of the aggregated sub-advisory fee schedules of T. Rowe Price Equity Income and VY® T. Rowe Price Growth Equity Portfolio, which is not included in this report. The aggregated amount of savings is allocated to the two Portfolios pro rata based on each Portfolio’s contribution to the amount saved. For the period ended April 30, 2019, the Investment Adviser waived $12,502, $41,370 and $88,791 of management fees for Clarion Global Real Estate, Morgan Stanley Global Franchise and T. Rowe Price Equity Income, respectively, based on the sub-advisory fee reductions. Effective May 1, 2019, the Investment Adviser is no longer obligated to waive a portion of the management fee for these Portfolios based on the sub-advisory fee reductions. The termination of these obligations was approved by the Board and replaced with a management fee waiver.
(4) | | The waiver for Clarion Global Real Estate was limited to an annual 50% of the savings based on the Portfolio’s assets as of May 1, 2009. |
The Investment Adviser has entered into a sub-advisory agreement with each respective sub-adviser. These sub-advisers provide investment advice for certain Portfolios and are paid by the Investment Adviser based on the average daily net assets of the respective Portfolios. Subject to such policies as the Board or Investment Adviser may determine, the sub-advisers manage each respective Portfolio’s assets in accordance with the Portfolio’s investment objectives, policies, and limitations. The sub-advisers of the Portfolios are as follows (*denotes an affiliated sub-adviser):
| Portfolio | | Sub-Adviser |
|---|
| Government Liquid Assets | | Voya Investment Management Co. LLC* |
| Clarion Global Real Estate | | CBRE Clarion Securities LLC |
| Invesco Growth and Income | | Invesco Advisers, Inc. |
| JPMorgan Emerging Markets Equity | | J.P. Morgan Investment Management Inc. |
| Morgan Stanley Global Franchise | | Morgan Stanley Investment Management Inc. |
| T. Rowe Price Capital Appreciation | | T. Rowe Price Associates, Inc. |
| T. Rowe Price Equity Income | | T. Rowe Price Associates, Inc. |
| T. Rowe Price International Stock | | T. Rowe Price Associates, Inc. |
46
NOTES TO FINANCIAL STATEMENTS AS OF DECEMBER 31, 2019 (CONTINUED)
NOTE 5 — DISTRIBUTION AND SERVICE FEES
The Trust has entered into a shareholder service plan (the “Plan”) for each Portfolio that offers Class S and Class S2 shares. The Plan compensates the Distributor for the provision of shareholder services and/or account maintenance services to direct or indirect beneficial owners of Class S and Class S2 shares. Under the Plan, each Portfolio makes payments to the Distributor at an annual rate of 0.25% of the Portfolio’s average daily net assets attributable to Class S and Class S2 shares, respectively. Each Portfolio that offers Class S2 shares has entered into a distribution plan (the “Class S2 Plan”) with the Distributor on behalf of the Class S2 shares of the Portfolio. The Class S2 Plan provides that the Class S2 shares shall pay a distribution fee for distribution services, including payments to the Distributor at an annual rate of 0.15% of the average daily net assets attributable to Class S2 shares.
Each Portfolio that offers Class ADV shares has a shareholder service and distribution plan. Class ADV shares pay a service fee of 0.25% and a distribution fee of 0.35% of each Portfolio’s average daily net assets attributable to Class ADV shares.
The Distributor and the Investment Adviser have contractually agreed to waive a portion of their distribution and/or shareholder servicing fees and management fees, as applicable, and to reimburse certain expenses to the extent necessary to assist Government Liquid Assets in maintaining a yield of not less than zero. There is no guarantee that the Portfolio will maintain such a yield. Management fees waived or expenses reimbursed are subject to possible recoupment by the Investment Adviser, as applicable, within three years subject to certain restrictions. In no event will the amount of the recoupment on any day exceed 20% of the yield (net of all expenses) of the Portfolio on that day. Distribution and shareholder servicing fees waived are not subject to recoupment. For the year ended December 31, 2019, there were no waivers necessary to assist the Portfolio in maintaining a yield of not less than zero. Termination or modification of this obligation requires approval by the Board. Please note that these waivers or reimbursements are in addition to existing contractual expense limitations, if any. As of December 31, 2019, the Portfolio did not have any amounts of waived fees that are subject to possible recoupment by the Investment Adviser.
NOTE 6 — OTHER TRANSACTIONS WITH AFFILIATES AND RELATED PARTIES
At December 31, 2019, the following direct or indirect, wholly-owned subsidiaries of Voya Financial, Inc. owned more than 5% of the following Portfolios:
| Subsidiary | | Portfolio | | | Percentage |
|---|
| ReliaStar Life Insurance | | T. Rowe Price Equity Income | | | 6.28 | % |
| Company | | T. Rowe Price International Stock | | | 13.20 | |
| Security Life of Denver | | Government Liquid Assets | | | 6.07 | |
| Insurance Company | | Clarion Global Real Estate | | | 5.03 | |
| | | JPMorgan Emerging Markets Equity | | | 8.12 | |
| | | T. Rowe Price Equity Income | | | 7.97 | |
| | | T. Rowe Price International Stock | | | 5.30 | |
| Voya Institutional Trust | | Government Liquid Assets | | | 48.63 | |
| Company | | Clarion Global Real Estate | | | 11.61 | |
| | | Invesco Growth and Income | | | 5.09 | |
| | | JPMorgan Emerging Markets Equity | | | 9.88 | |
| | | Morgan Stanley Global Franchise | | | 27.83 | |
| | | T. Rowe Price Capital Appreciation | | | 28.41 | |
| | | T. Rowe Price Equity Income | | | 37.17 | |
| | | T. Rowe Price International Stock | | | 10.97 | |
| Voya Retirement | | Clarion Global Real Estate | | | 36.40 | |
| Insurance and Annuity | | Invesco Growth and Income | | | 17.39 | |
| Company | | JPMorgan Emerging Markets Equity | | | 14.83 | |
| | | T. Rowe Price Capital Appreciation | | | 29.41 | |
| | | T. Rowe Price Equity Income | | | 47.74 | |
| | | T. Rowe Price International Stock | | | 8.12 | |
Under the 1940 Act, the direct or indirect beneficial owner of more than 25% of the voting securities of a company (including a fund) is presumed to control such company. Companies under common control (e.g., companies with a common owner of greater than 25% of their respective voting securities) are affiliates under the 1940 Act.
The Investment Adviser may direct the Portfolios’ sub-advisers to use their best efforts (subject to obtaining best execution of each transaction) to allocate a Portfolio’s equity security transactions through certain designated broker-dealers. The designated broker-dealer, in turn, will reimburse a portion of the brokerage commissions to pay certain expenses of that Portfolio. Any amounts credited to the Portfolios are reflected as brokerage commission recapture on the accompanying Statements of Operations.
The Portfolios have adopted a deferred compensation plan (the “DC Plan”), which allows eligible independent trustees, as described in the DC Plan, to defer the receipt of all or a portion of the trustees’ fees that they are entitled to receive from the Portfolios. For purposes of determining the amount owed to the trustee under the DC Plan, the amounts deferred are invested in shares of the funds selected by the trustee (the “Notional Funds”). The Portfolios purchase shares of the Notional Funds, which are all advised by Voya Investments, in amounts equal to the trustees’ deferred fees, resulting in a Portfolio asset equal to the deferred compensation liability. Such assets,
47
NOTES TO FINANCIAL STATEMENTS AS OF DECEMBER 31, 2019 (CONTINUED)
NOTE 6 — OTHER TRANSACTIONS WITH AFFILIATES AND RELATED PARTIES (continued)
if applicable, are included as a component of “Other assets” on the accompanying Statements of Assets and Liabilities. Deferral of trustees’ fees under the DC Plan will not affect net assets of the Portfolios, and will not materially affect the Portfolios’ assets, liabilities or net investment income per share. Amounts will be deferred until distributed in accordance with the DC Plan.
NOTE 7 — OTHER ACCRUED EXPENSES AND LIABILITES
At December 31, 2019, the below Portfolio has the following payables included in their Other Accrued Expenses and Liabilities on the Statements of Assets and Liabilities that exceeded 5% of total liabilities:
| Portfolio | | | | Accrued Expense | | | Amount | |
|---|
| Clarion Global Real Estate | | | | Custody | | | $107,213 | |
NOTE 8 — EXPENSE LIMITATION AGREEMENTS
The Investment Adviser has entered into written expense limitation agreements (“Expense Limitation Agreements”) with the below Portfolios, whereby the Investment Adviser has agreed to limit expenses, excluding interest, taxes, investment-related costs, leverage expenses, extraordinary expenses, and acquired fund fees and expenses to the levels listed below:
| Portfolio | | | | Class ADV | | Class I | | Class S | | Class S2 |
|---|
| Clarion Global Real Estate | | | | | 1.50 | % | | | 0.90 | % | | | 1.15 | % | | | 1.30 | % |
| T. Rowe Price International Stock | | | | | 1.40 | % | | | 0.80 | % | | | 1.05 | % | | | N/A | |
With the exception of the non-recoupable management fee waivers for certain Portfolios, the Investment Adviser may, at a later date, recoup from a Portfolio for fees waived and/or other expenses reimbursed by the Investment Adviser during the previous 36 months, but only if, after such recoupment, a Portfolio’s expense ratio does not exceed the percentage described above. Waived and reimbursed fees net of any recoupment by the Investment Adviser of such waived and reimbursed fees are reflected on the accompanying Statements of Operations. Amounts payable by the Investment Adviser are reflected on the accompanying Statements of Assets and Liabilities.
As of December 31, 2019, the amounts of waived and/or reimbursed fees that are subject to possible recoupment by the Investment Adviser, and the related expiration dates are as follows:
| | | | December 31, | | |
|---|
| | | | 2020 | | 2021 | | 2022 | | Total |
|---|
| Clarion Global Real Estate | | | | $ | 221,339 | | | $ | 336,627 | | | $ | 271,097 | | | $ | 829,063 | |
| T. Rowe Price International Stock | | | | | — | | | | 100,434 | | | | 7,153 | | | | 107,587 | |
The Expense Limitation Agreements are contractual through May 1, 2020, and shall renew automatically for one-year terms. Termination or modification of these obligations requires approval by the Board.
NOTE 9 — LINE OF CREDIT
Effective May 17, 2019, each Portfolio, in addition to certain other funds managed by the Investment Adviser, has entered into a 364-day unsecured committed revolving line of credit agreement (the “Credit Agreement”) with The Bank of New York Mellon (“BNY”) for an aggregate amount of $400,000,000 through May 15, 2020. The proceeds may be used only to finance temporarily: (1) the purchase or sale of investment securities; or (2) the repurchase or redemption of shares of a Portfolio or certain other funds managed by the Investment Adviser. The funds to which the line of credit is available pay a commitment fee equal to 0.15% per annum on the daily unused portion of the committed line amount payable quarterly in arrears. Prior to May 17, 2019, the predecessor line of credit was for an aggregate amount of $400,000,000 and paid a commitment fee equal to 0.15% per annum on the daily unused portion of the committed line amount through May 17, 2019.
Borrowings under the Credit Agreement accrue interest at the federal funds rate plus a specified margin. Repayments generally must be made within 60 days after the date of a revolving credit advance.
The below Portfolios utilized the line of credit during the year ended December 31, 2019 as follows:
| Portfolio | | | | Days
Utilized | | Approximate
Average
Daily Balance
For Days
Utilized | | Approximate
Weighted
Average
Interest Rate
For Days
Utilized |
|---|
| Clarion Global Real Estate | | | | | 2 | | | $ | 640,000 | | | | 2.55 | % |
| Invesco Growth and Income | | | | | 7 | | | | 269,571 | | | | 2.55 | |
| JPMorgan Emerging Markets Equity | | | | | 17 | | | | 2,188,412 | | | | 2.97 | |
| T. Rowe Price Capital Appreciation | | | | | 1 | | | | 45,688,000 | | | | 3.13 | |
48
NOTES TO FINANCIAL STATEMENTS AS OF DECEMBER 31, 2019 (CONTINUED)
NOTE 10 — CAPITAL SHARES TRANSACTIONS
Transactions in capital shares and dollars were as follows:
| | | | | | | | | | | | | | | Net | | | | | | | | | | | | | | | | |
| | | | | | | | | | | | | | | increase | | | | | | | Proceeds | | | | | | | | | | |
| | | | | | | Shares | | | Reinvestment | | | | | | (decrease) | | | | | | | from shares | | | Reinvestment | | | | | | Net | |
| | | Shares | | | | issued in | | | of | | | Shares | | | in shares | | | Shares | | | | issued in | | | of | | | Shares | | | increase | |
| Year or | | sold | | | | merger | | | distributions | | | redeemed | | | outstanding | | | sold | | | | merger | | | distributions | | | redeemed | | | (decrease) | |
| period ended | | # | | | | # | | | # | | | # | | | # | | | ($) | | | | ($) | | | ($) | | | ($) | | | ($) | |
| Government Liquid Assets |
| Class I | | | | | | | | | | | | | | | | | | | | | | | | | | | | | | | | | | | | | | | | |
| 12/31/2019 | | | 27,338,984 | | | | — | | | | 1,149,040 | | | | (38,086,906 | ) | | | (9,598,882 | ) | | | 27,338,984 | | | | — | | | | 1,149,041 | | | | (38,086,906 | ) | | | (9,598,881 | ) |
| 12/31/2018 | | | 53,679,939 | | | | — | | | | 898,299 | | | | (43,238,147 | ) | | | 11,340,091 | | | | 53,679,939 | | | | — | | | | 898,299 | | | | (43,238,147 | ) | | | 11,340,091 | |
| Class S | | | | | | | | | | | | | | | | | | | | | | | | | | | | | | | | | | | | | | | | |
| 12/31/2019 | | | 105,890,206 | | | | — | | | | 5,870,727 | | | | (151,393,326 | ) | | | (39,632,393 | ) | | | 105,890,203 | | | | — | | | | 5,870,729 | | | | (151,393,326 | ) | | | (39,632,393 | ) |
| 12/31/2018 | | | 110,350,043 | | | | — | | | | 4,772,369 | | | | (133,647,164 | ) | | | (18,524,752 | ) | | | 110,350,043 | | | | — | | | | 4,772,366 | | | | (133,647,164 | ) | | | (18,524,755 | ) |
| Class S2 | | | | | | | | | | | | | | | | | | | | | | | | | | | | | | | | | | | | | | | | |
| 12/31/2019 | | | 81,107,149 | | | | — | | | | 5,767,380 | | | | (113,945,268 | ) | | | (27,070,739 | ) | | | 81,107,149 | | | | — | | | | 5,767,381 | | | | (113,945,268 | ) | | | (27,070,739 | ) |
| 12/31/2018 | | | 138,306,770 | | | | — | | | | 4,204,649 | | | | (114,678,340 | ) | | | 27,833,079 | | | | 138,306,770 | | | | — | | | | 4,204,653 | | | | (114,678,340 | ) | | | 27,833,083 | |
| Clarion Global Real Estate |
| Class ADV | | | | | | | | | | | | | | | | | | | | | | | | | | | | | | | | | | | | | | | | |
| 12/31/2019 | | | 70,100 | | | | — | | | | 32,152 | | | | (323,215 | ) | | | (220,963 | ) | | | 860,644 | | | | — | | | | 394,514 | | | | (3,916,605 | ) | | | (2,661,447 | ) |
| 12/31/2018 | | | 101,408 | | | | — | | | | 84,794 | | | | (485,242 | ) | | | (299,040 | ) | | | 1,169,305 | | | | — | | | | 965,808 | | | | (5,537,167 | ) | | | (3,402,054 | ) |
| Class I | | | | | | | | | | | | | | | | | | | | | | | | | | | | | | | | | | | | | | | | |
| 12/31/2019 | | | 526,561 | | | | — | | | | 263,954 | | | | (1,189,789 | ) | | | (399,274 | ) | | | 6,485,549 | | | | — | | | | 3,315,314 | | | | (14,748,857 | ) | | | (4,947,995 | ) |
| 12/31/2018 | | | 844,331 | | | | — | | | | 776,752 | | | | (6,816,857 | ) | | | (5,195,774 | ) | | | 10,117,636 | | | | — | | | | 9,056,924 | | | | (79,343,586 | ) | | | (60,169,026 | ) |
| Class S | | | | | | | | | | | | | | | | | | | | | | | | | | | | | | | | | | | | | | | | |
| 12/31/2019 | | | 202,999 | | | | — | | | | 203,825 | | | | (1,384,294 | ) | | | (977,470 | ) | | | 2,531,379 | | | | — | | | | 2,549,899 | | | | (17,208,225 | ) | | | (12,126,947 | ) |
| 12/31/2018 | | | 261,239 | | | | — | | | | 460,493 | | | | (1,455,833 | ) | | | (734,101 | ) | | | 3,150,172 | | | | — | | | | 5,350,931 | | | | (16,992,074 | ) | | | (8,490,971 | ) |
| Class S2 | | | | | | | | | | | | | | | | | | | | | | | | | | | | | | | | | | | | | | | | |
| 12/31/2019 | | | 284 | | | | — | | | | 1,826 | | | | (11,562 | ) | | | (9,452 | ) | | | 3,681 | | | | — | | | | 23,042 | | | | (146,401 | ) | | | (119,677 | ) |
| 12/31/2018 | | | 758 | | | | — | | | | 4,086 | | | | (10,201 | ) | | | (5,357 | ) | | | 9,036 | | | | — | | | | 47,888 | | | | (118,662 | ) | | | (61,738 | ) |
| Invesco Growth and Income |
| Class ADV | | | | | | | | | | | | | | | | | | | | | | | | | | | | | | | | | | | | | | | | |
| 12/31/2019 | | | 32,842 | | | | — | | | | 115,836 | | | | (136,407 | ) | | | 12,271 | | | | 752,319 | | | | — | | | | 2,498,575 | | | | (3,095,163 | ) | | | 155,732 | |
| 12/31/2018 | | | 144,067 | | | | — | | | | 102,972 | | | | (245,999 | ) | | | 1,040 | | | | 3,550,737 | | | | — | | | | 2,545,460 | | | | (5,986,189 | ) | | | 110,008 | |
| Class I | | | | | | | | | | | | | | | | | | | | | | | | | | | | | | | | | | | | | | | | |
| 12/31/2019 | | | 53,646 | | | | — | | | | 195,201 | | | | (260,360 | ) | | | (11,513 | ) | | | 1,206,116 | | | | — | | | | 4,251,471 | | | | (5,977,085 | ) | | | (519,498 | ) |
| 12/31/2018 | | | 124,873 | | | | — | | | | 166,780 | | | | (186,808 | ) | | | 104,845 | | | | 3,326,506 | | | | — | | | | 4,159,490 | | | | (4,935,536 | ) | | | 2,550,460 | |
| Class S | | | | | | | | | | | | | | | | | | | | | | | | | | | | | | | | | | | | | | | | |
| 12/31/2019 | | | 161,662 | | | | — | | | | 2,353,167 | | | | (2,948,227 | ) | | | (433,398 | ) | | | 3,651,615 | | | | — | | | | 51,840,265 | | | | (67,944,103 | ) | | | (12,452,224 | ) |
| 12/31/2018 | | | 267,475 | | | | — | | | | 2,138,765 | | | | (2,902,185 | ) | | | (495,945 | ) | | | 7,037,487 | | | | — | | | | 53,854,097 | | | | (77,272,478 | ) | | | (16,380,894 | ) |
| Class S2 | | | | | | | | | | | | | | | | | | | | | | | | | | | | | | | | | | | | | | | | |
| 12/31/2019 | | | 21,817 | | | | — | | | | 180,581 | | | | (223,561 | ) | | | (21,163 | ) | | | 491,902 | | | | — | | | | 3,938,465 | | | | (5,019,833 | ) | | | (589,466 | ) |
| 12/31/2018 | | | 25,054 | | | | — | | | | 157,118 | | | | (160,399 | ) | | | 21,773 | | | | 640,386 | | | | — | | | | 3,923,246 | | | | (4,127,737 | ) | | | 435,895 | |
| JPMorgan Emerging Markets Equity |
| Class ADV | | | | | | | | | | | | | | | | | | | | | | | | | | | | | | | | | | | | | | | | |
| 12/31/2019 | | | 281,136 | | | | — | | | | 138,039 | | | | (441,406 | ) | | | (22,231 | ) | | | 5,470,948 | | | | — | | | | 2,713,856 | | | | (8,522,028 | ) | | | (337,224 | ) |
| 12/31/2018 | | | 347,242 | | | | — | | | | 9,011 | | | | (727,322 | ) | | | (371,069 | ) | | | 6,813,378 | | | | — | | | | 173,376 | | | | (13,696,008 | ) | | | (6,709,254 | ) |
| Class I | | | | | | | | | | | | | | | | | | | | | | | | | | | | | | | | | | | | | | | | |
| 12/31/2019 | | | 467,321 | | | | — | | | | 196,864 | | | | (545,797 | ) | | | 118,388 | | | | 9,650,512 | | | | — | | | | 4,082,963 | | | | (11,218,091 | ) | | | 2,515,384 | |
| 12/31/2018 | | | 659,944 | | | | — | | | | 30,950 | | | | (1,062,946 | ) | | | (372,052 | ) | | | 13,482,036 | | | | — | | | | 623,640 | | | | (21,475,810 | ) | | | (7,370,134 | ) |
| Class S | | | | | | | | | | | | | | | | | | | | | | | | | | | | | | | | | | | | | | | | |
| 12/31/2019 | | | 723,015 | | | | — | | | | 975,561 | | | | (2,981,926 | ) | | | (1,283,350 | ) | | | 14,525,557 | | | | — | | | | 20,116,064 | | | | (60,692,033 | ) | | | (26,050,412 | ) |
| 12/31/2018 | | | 1,073,675 | | | | — | | | | 111,895 | | | | (4,376,095 | ) | | | (3,190,525 | ) | | | 22,142,279 | | | | — | | | | 2,244,617 | | | | (88,213,515 | ) | | | (63,826,619 | ) |
| Class S2 | | | | | | | | | | | | | | | | | | | | | | | | | | | | | | | | | | | | | | | | |
| 12/31/2019 | | | 27,135 | | | | — | | | | 32,208 | | | | (133,304 | ) | | | (73,961 | ) | | | 549,118 | | | | — | | | | 656,400 | | | | (2,697,607 | ) | | | (1,492,089 | ) |
| 12/31/2018 | | | 32,262 | | | | — | | | | 2,652 | | | | (141,406 | ) | | | (106,492 | ) | | | 649,196 | | | | — | | | | 52,676 | | | | (2,743,467 | ) | | | (2,041,595 | ) |
| Morgan Stanley Global Franchise |
| Class ADV | | | | | | | | | | | | | | | | | | | | | | | | | | | | | | | | | | | | | | | | |
| 12/31/2019 | | | 884,610 | | | | — | | | | 733,488 | | | | (339,344 | ) | | | 1,278,754 | | | | 13,740,896 | | | | — | | | | 11,237,040 | | | | (5,296,512 | ) | | | 19,681,424 | |
| 12/31/2018 | | | 396,736 | | | | — | | | | 870,423 | | | | (609,572 | ) | | | 657,587 | | | | 6,164,455 | | | | — | | | | 13,099,859 | | | | (9,863,794 | ) | | | 9,400,520 | |
| Class R6 | | | | | | | | | | | | | | | | | | | | | | | | | | | | | | | | | | | | | | | | |
| 12/31/2019 | | | 36,839 | | | | — | | | | 4,577 | | | | (10,413 | ) | | | 31,003 | | | | 624,916 | | | | — | | | | 75,422 | | | | (172,697 | ) | | | 527,641 | |
| 12/31/2018 | | | 4,443 | | | | — | | | | 648 | | | | (1,920 | ) | | | 3,171 | | | | 76,150 | | | | — | | | | 10,394 | | | | (35,281 | ) | | | 51,263 | |
| Class S | | | | | | | | | | | | | | | | | | | | | | | | | | | | | | | | | | | | | | | | |
| 12/31/2019 | | | 248,447 | | | | — | | | | 1,762,890 | | | | (2,887,863 | ) | | | (876,526 | ) | | | 4,196,048 | | | | — | | | | 29,140,576 | | | | (48,204,362 | ) | | | (14,867,738 | ) |
| 12/31/2018 | | | 345,570 | | | | — | | | | 2,581,095 | | | | (2,405,916 | ) | | | 520,749 | | | | 5,908,738 | | | | — | | | | 41,529,824 | | | | (41,096,073 | ) | | | 6,342,489 | |
| Class S2 | | | | | | | | | | | | | | | | | | | | | | | | | | | | | | | | | | | | | | | | |
| 12/31/2019 | | | 14,454 | | | | — | | | | 259,109 | | | | (394,495 | ) | | | (120,932 | ) | | | 240,198 | | | | — | | | | 4,241,616 | | | | (6,553,185 | ) | | | (2,071,371 | ) |
| 12/31/2018 | | | 29,074 | | | | — | | | | 381,372 | | | | (372,812 | ) | | | 37,634 | | | | 485,209 | | | | — | | | | 6,082,883 | | | | (6,305,022 | ) | | | 263,070 | |
49
NOTES TO FINANCIAL STATEMENTS AS OF DECEMBER 31, 2019 (CONTINUED)
NOTE 10 — CAPITAL SHARES TRANSACTIONS (continued)
| | | | | | | | | | | | | | Net | | | | | | | | | | | | | | | |
| | | | | | | | | | | | | | increase | | | | | | Proceeds | | | | | | | | | |
| | | | | | Shares | | Reinvestment | | | | | | (decrease) | | | | | | from shares | | Reinvestment | | | | | | Net | |
| | | Shares | | | issued in | | of | | | Shares | | | in shares | | | Shares | | | issued in | | of | | | Shares | | | increase | |
| Year or | | sold | | | merger | | distributions | | | redeemed | | | outstanding | | | sold | | | merger | | distributions | | | redeemed | | | (decrease) | |
| period ended | | # | | | # | | # | | | # | | | # | | | ($) | | | ($) | | ($) | | | ($) | | | ($) | |
| T. Rowe Price Capital Appreciation | | | | | | | | | | | | | | | | | | | | | | | |
| Class ADV | | | | | | | | | | | | | | | | | | | | | | | | | | | | | | | | | | | | |
| 12/31/2019 | | | 5,575,422 | | | — | | | 2,946,529 | | | | (1,260,108 | ) | | | 7,261,843 | | | | 150,351,658 | | | — | | | 79,837,274 | | | | (33,969,913 | ) | | | 196,219,019 | |
| 12/31/2018 | | | 3,115,179 | | | — | | | 3,760,244 | | | | (1,735,675 | ) | | | 5,139,748 | | | | 81,802,098 | | | — | | | 95,178,479 | | | | (44,879,687 | ) | | | 132,100,890 | |
| Class I | | | | | | | | | | | | | | | | | | | | | | | | | | | | | | | | | | | | |
| 12/31/2019 | | | 9,759,628 | | | — | | | 3,684,129 | | | | (5,896,777 | ) | | | 7,546,980 | | | | 277,225,757 | | | — | | | 105,346,487 | | | | (167,049,242 | ) | | | 215,523,002 | |
| 12/31/2018 | | | 6,659,889 | | | — | | | 4,706,697 | | | | (6,046,493 | ) | | | 5,320,093 | | | | 184,182,763 | | | — | | | 124,567,106 | | | | (166,070,288 | ) | | | 142,679,581 | |
| Class R6 | | | | | | | | | | | | | | | | | | | | | | | | | | | | | | | | | | | | |
| 12/31/2019 | | | 2,439,618 | | | — | | | 366,413 | | | | (356,708 | ) | | | 2,449,323 | | | | 68,813,224 | | | — | | | 10,487,555 | | | | (10,246,153 | ) | | | 69,054,625 | |
| 12/31/2018 | | | 1,577,953 | | | — | | | 301,696 | | | | (310,408 | ) | | | 1,569,241 | | | | 43,403,614 | | | — | | | 7,964,813 | | | | (8,501,758 | ) | | | 42,866,669 | |
| Class S | | | | | | | | | | | | | | | | | | | | | | | | | | | | | | | | | | | | |
| 12/31/2019 | | | 4,635,615 | | | — | | | 9,290,071 | | | | (16,631,924 | ) | | | (2,706,238 | ) | | | 130,238,436 | | | — | | | 265,075,287 | | | | (469,100,432 | ) | | | (73,786,709 | ) |
| 12/31/2018 | | | 2,355,404 | | | — | | | 13,722,558 | | | | (18,360,494 | ) | | | (2,282,532 | ) | | | 64,615,518 | | | — | | | 363,602,203 | | | | (504,979,291 | ) | | | (76,761,570 | ) |
| Class S2 | | | | | | | | | | | | | | | | | | | | | | | | | | | | | | | | | | | | |
| 12/31/2019 | | | 155,586 | | | — | | | 167,850 | | | | (558,499 | ) | | | (235,063 | ) | | | 4,329,709 | | | — | | | 4,744,849 | | | | (15,663,257 | ) | | | (6,588,698 | ) |
| 12/31/2018 | | | 172,954 | | | — | | | 258,341 | | | | (415,693 | ) | | | 15,602 | | | | 4,727,628 | | | — | | | 6,795,562 | | | | (11,262,196 | ) | | | 260,994 | |
| T. Rowe Price Equity Income |
| Class ADV | | | | | | | | | | | | | | | | | | | | | | | | | | | | | | | | | | | | |
| 12/31/2019 | | | 353,400 | | | — | | | 1,377,723 | | | | (617,449 | ) | | | 1,113,674 | | | | 4,050,765 | | | — | | | 14,085,259 | | | | (7,032,973 | ) | | | 11,103,050 | |
| 12/31/2018 | | | 250,918 | | | — | | | 707,295 | | | | (632,721 | ) | | | 325,492 | | | | 3,259,664 | | | — | | | 8,544,546 | | | | (8,482,699 | ) | | | 3,321,511 | |
| Class I | | | | | | | | | | | | | | | | | | | | | | | | | | | | | | | | | | | | |
| 12/31/2019 | | | 568,006 | | | — | | | 2,106,466 | | | | (2,233,897 | ) | | | 440,575 | | | | 6,692,225 | | | — | | | 22,140,633 | | | | (26,950,544 | ) | | | 1,882,314 | |
| 12/31/2018 | | | 537,040 | | | — | | | 1,333,165 | | | | (1,166,853 | ) | | | 703,352 | | | | 7,391,108 | | | — | | | 16,430,325 | | | | (16,046,569 | ) | | | 7,774,864 | |
| Class S | | | | | | | | | | | | | | | | | | | | | | | | | | | | | | | | | | | | |
| 12/31/2019 | | | 1,718,437 | | | — | | | 15,400,962 | | | | (50,726,943 | ) | | | (33,607,544 | ) | | | 19,394,246 | | | — | | | 162,548,177 | | | | (526,249,689 | ) | | | (344,307,265 | ) |
| 12/31/2018 | | | 823,928 | | | — | | | 8,908,634 | | | | (7,994,575 | ) | | | 1,737,987 | | | | 11,277,412 | | | — | | | 110,181,926 | | | | (109,083,800 | ) | | | 12,375,538 | |
| Class S2 | | | | | | | | | | | | | | | | | | | | | | | | | | | | | | | | | | | | |
| 12/31/2019 | | | 392,404 | | | — | | | 2,805,920 | | | | (2,743,533 | ) | | | 454,791 | | | | 4,559,810 | | | — | | | 28,955,674 | | | | (29,132,389 | ) | | | 4,383,095 | |
| 12/31/2018 | | | 122,058 | | | — | | | 1,520,959 | | | | (999,152 | ) | | | 643,865 | | | | 1,559,057 | | | — | | | 18,499,686 | | | | (13,277,552 | ) | | | 6,781,191 | |
| T. Rowe Price International Stock |
| Class ADV | | | | | | | | | | | | | | | | | | | | | | | | | | | | | | | | | | | | |
| 12/31/2019 | | | 140,915 | | | — | | | 90,834 | | | | (146,404 | ) | | | 85,345 | | | | 2,134,977 | | | — | | | 1,356,151 | | | | (2,216,933 | ) | | | 1,274,195 | |
| 12/31/2018 | | | 225,885 | | | — | | | 18,711 | | | | (194,894 | ) | | | 49,702 | | | | 3,502,776 | | | — | | | 293,947 | | | | (3,028,069 | ) | | | 768,654 | |
| Class I | | | | | | | | | | | | | | | | | | | | | | | | | | | | | | | | | | | | |
| 12/31/2019 | | | 155,424 | | | — | | | 182,071 | | | | (415,646 | ) | | | (78,151 | ) | | | 2,322,996 | | | — | | | 2,725,607 | | | | (6,317,799 | ) | | | (1,269,196 | ) |
| 12/31/2018 | | | 87,450 | | | — | | | 50,883 | | | | (294,169 | ) | | | (155,836 | ) | | | 1,336,303 | | | — | | | 800,891 | | | | (4,648,852 | ) | | | (2,511,658 | ) |
| Class S | | | | | | | | | | | | | | | | | | | | | | | | | | | | | | | | | | | | |
| 12/31/2019 | | | 312,719 | | | — | | | 653,879 | | | | (1,749,366 | ) | | | (782,768 | ) | | | 4,761,972 | | | — | | | 9,755,870 | | | | (26,439,672 | ) | | | (11,921,830 | ) |
| 12/31/2018 | | | 636,418 | | | — | | | 179,669 | | | | (1,582,543 | ) | | | (766,456 | ) | | | 9,963,602 | | | — | | | 2,820,796 | | | | (24,377,197 | ) | | | (11,592,799 | ) |
NOTE 11 — SECURITIES LENDING
Under a Master Securities Lending Agreement (the “Agreement”) with BNY, the Portfolios can lend their securities to approved brokers, dealers and other financial institutions. Loans are collateralized by cash and U.S. government securities. The collateral is equal to at least 105% of the market value of non-U.S. securities loaned and 102% of the market value of U.S. securities loaned. The market value of the loaned securities is determined at Market Close of the Portfolios at their last sale price or official closing price on the principal exchange or system on which they are traded and any additional collateral is delivered to the Portfolios on the next business day. The cash collateral received is invested in approved investments as defined in the Agreement with BNY. The Portfolios bear the risk of loss with
respect to the investment of collateral with the following exception: BNY provides the Portfolios indemnification from loss with respect to the investment of collateral to the extent the cash collateral is invested in overnight repurchase agreements.
Cash collateral received in connection with securities lending is invested in cash equivalents, money market funds, repurchase agreements with maturities of not more than 99 days that are collateralized with U.S. Government securities, or certain short-term investments that have a remaining maturity of 190 days or less (“Permitted Investments”). Short-term investments include: securities, units, shares or other participations in short-term investment funds, pools or trusts; commercial paper, notes, bonds or other debt obligations, certificates of deposit, time deposits and other bank obligations and asset-backed commercial paper backed by diversified receivables and repurchase-backed programs. Permitted Investments are subject to certain guidelines established by the Adviser regarding liquidity, diversification, credit quality and average credit life/duration requirements. The securities
50
NOTES TO FINANCIAL STATEMENTS AS OF DECEMBER 31, 2019 (CONTINUED)
NOTE 11 — SECURITIES LENDING (continued)
purchased with cash collateral received are reflected in the Portfolio of Investments under Short-Term Investments.
Generally, in the event of counterparty default, the Portfolios have the right to use the collateral to offset losses incurred. The Agreement contains certain guarantees by BNY in the event of counterparty default and/or a borrower’s failure to return a loaned security; however, there would be a potential loss to the Portfolios in the event the Portfolios are delayed or prevented from exercising its right to dispose of the collateral. Engaging in securities lending could have a leveraging effect, which may intensify the credit, market and other risks associated with investing in a Portfolio.
The following tables represent a summary of each respective Portfolio’s securities lending agreements by counterparty which are subject to offset under the Agreement as of December 31, 2019:
| Clarion Global Real Estate | | | | | | | | | | | | | | | | |
|---|
| Counterparty | | | Securities
Loaned at
Value | | Cash
Collateral
Received(1) | | Net
Amount |
|---|
| RBC Capital Markets, LLC | | | | $ | 608,472 | | | | $ | (608,472 | ) | | | $ | — | |
| Total | | | | $ | 608,472 | | | | $ | (608,472 | ) | | | $ | — | |
(1) | | Collateral with a fair value of $632,792 has been received in connection with the above securities lending transactions. Excess collateral received from the individual counterparty is not shown for financial reporting purposes. |
| Invesco Growth and Income | |
|---|
| Counterparty | | | Securities
Loaned at
Value | | Cash
Collateral
Received(1) | | Net
Amount |
|---|
| BofA Securities Inc | | | | $ | 3,219,502 | | | | $ | (3,219,502 | ) | | | $ | — | |
| Total | | | | $ | 3,219,502 | | | | $ | (3,219,502 | ) | | | $ | — | |
(1) | | Collateral with a fair value of $3,296,644 has been received in connection with the above securities lending transactions. Excess collateral received from the individual counterparty is not shown for financial reporting purposes. |
JPMorgan Emerging Markets Equity
| Counterparty | | | Securities
Loaned at
Value | | Cash
Collateral
Received(1) | | Net
Amount |
|---|
| Goldman Sachs & Co. LLC | | | | $ | 1,275,539 | | | | $ | (1,275,539 | ) | | | $ | — | |
| Total | | | | $ | 1,275,539 | | | | $ | (1,275,539 | ) | | | $ | — | |
(1) | | Collateral with a fair value of $1,342,970 has been received in connection with the above securities lending transactions. Excess collateral received from the individual counterparty is not shown for financial reporting purposes. |
T. Rowe Price Capital Appreciation
| |
|---|
| Counterparty | | | Securities
Loaned at
Value | | Cash
Collateral
Received(1) | | Net
Amount |
|---|
| Barclays Bank PLC | | | | $ | 3,032,503 | | | | $ | (3,032,503 | ) | | | $ | — | |
| BMO Capital Markets Corp | | | | | 1,946,690 | | | | | (1,946,690 | ) | | | | — | |
| BNP Paribas | | | | | 2,230,478 | | | | | (2,230,478 | ) | | | | — | |
| BofA Securities Inc | | | | | 52,312,296 | | | | | (52,312,296 | ) | | | | — | |
| Citadel Clearing LLC | | | | | 20,270,875 | | | | | (20,270,875 | ) | | | | — | |
| Citadel Securities LLC | | | | | 137,779 | | | | | (137,779 | ) | | | | — | |
| Citigroup Global Markets Inc | | | | | 55,604,866 | | | | | (55,604,866 | ) | | | | — | |
| Cowen Execution Services LLC | | | | | 514,045 | | | | | (514,045 | ) | | | | — | |
| Credit Suisse AG | | | | | 13,770,990 | | | | | (13,770,990 | ) | | | | — | |
| Deutsche Bank Securities Inc | | | | | 8,390,448 | | | | | (8,390,448 | ) | | | | — | |
| Goldman Sachs & Co. LLC | | | | | 5,395,988 | | | | | (5,395,988 | ) | | | | — | |
| J.P. Morgan Securities LLC | | | | | 29,383,643 | | | | | (29,383,643 | ) | | | | — | |
| Jefferies LLC | | | | | 1,976,156 | | | | | (1,976,156 | ) | | | | — | |
| Morgan Stanley & Co. LLC | | | | | 505,409 | | | | | (505,409 | ) | | | | — | |
| National Bank of Canada Financial Inc | | | | | 1,203,879 | | | | | (1,203,879 | ) | | | | — | |
| Nomura Securities International, Inc | | | | | 2,244,626 | | | | | (2,244,626 | ) | | | | — | |
| RBC Capital Markets, LLC | | | | | 4,275,949 | | | | | (4,275,949 | ) | | | | — | |
| RBC Dominion Securities Inc | | | | | 160,382 | | | | | (160,382 | ) | | | | — | |
| Scotia Capital (USA) Inc | | | | | 14,105,248 | | | | | (14,105,248 | ) | | | | — | |
| State Street Bank and Trust Company | | | | | 13,289,041 | | | | | (13,289,041 | ) | | | | — | |
| TD Prime Services LLC | | | | | 2,378,426 | | | | | (2,378,426 | ) | | | | — | |
| TD Securities (USA) Inc | | | | | 2,900,394 | | | | | (2,900,394 | ) | | | | — | |
| UBS AG | | | | | 1,036,143 | | | | | (1,036,143 | ) | | | | — | |
| Wells Fargo Bank NA | | | | | 3,929,354 | | | | | (3,929,354 | ) | | | | — | |
| Wells Fargo Securities LLC | | | | �� | 5,890,761 | | | | | (5,890,761 | ) | | | | — | |
| Total | | | | $ | 246,886,369 | | | | $ | (246,886,369 | ) | | | $ | — | |
(1) | | Collateral with a fair value of $252,644,249 has been received in connection with the above securities lending transactions. Excess collateral received from the individual counterparty is not shown for financial reporting purposes. |
T. Rowe Price Equity Income
| |
|---|
| Counterparty | | | Securities
Loaned at
Value | | Cash
Collateral
Received(1) | | Net
Amount |
|---|
| Barclays Bank PLC | | | | $ | 454,555 | | | | $ | (454,555 | ) | | | $ | — | |
| BMO Capital Markets Corp | | | | | 242,997 | | | | | (242,997 | ) | | | | — | |
| BofA Securities Inc | | | | | 134,554 | | | | | (134,554 | ) | | | | — | |
| Goldman Sachs & Co. LLC | | | | | 2,263,568 | | | | | (2,263,568 | ) | | | | — | |
| Morgan Stanley & Co. LLC | | | | | 631,362 | | | | | (631,362 | ) | | | | — | |
| National Financial Services LLC | | | | | 83,524 | | | | | (83,524 | ) | | | | — | |
| Scotia Capital (USA) Inc | | | | | 7,385,575 | | | | | (7,385,575 | ) | | | | — | |
| Wells Fargo Bank NA | | | | | 1,651,610 | | | | | (1,651,610 | ) | | | | — | |
| Wells Fargo Securities LLC | | | | | 424 | | | | | (424 | ) | | | | — | |
| Total | | | | $ | 12,848,169 | | | | $ | (12,848,169 | ) | | | $ | — | |
(1) | | Collateral with a fair value of $13,136,628 has been received in connection with the above securities lending transactions. Excess collateral received from the individual counterparty is not shown for financial reporting purposes. |
51
NOTES TO FINANCIAL STATEMENTS AS OF DECEMBER 31, 2019 (CONTINUED)
NOTE 11 — SECURITIES LENDING (continued)
T. Rowe Price International Stock
| |
|---|
| Counterparty | | | Securities
Loaned at
Value | | Cash
Collateral
Received(1) | | Net
Amount |
|---|
| Credit Suisse Securities (USA) LLC | | | | $ | 941,275 | | | | $ | (941,275 | ) | | | $ | — | |
| HSBC Bank Plc | | | | | 324,893 | | | | | (324,893 | ) | | | | — | |
| JP Morgan Securities, Plc | | | | | 305,989 | | | | | (305,989 | ) | | | | — | |
| Nomura Securities International, Inc | | | | | 656,569 | | | | | (656,569 | ) | | | | — | |
| Total | | | | $ | 2,228,726 | | | | $ | (2,228,726 | ) | | | $ | — | |
(1) | | Collateral with a fair value of $2,344,711 has been received in connection with the above securities lending transactions. Excess collateral received from the individual counterparty is not shown for financial reporting purposes. |
NOTE 12 — UNFUNDED LOAN COMMITMENTS
Certain Portfolios may enter in credit agreements, all or a portion of which may be unfunded. The Portfolios are obligated to fund these loan commitments at the borrower’s discretion. Funded portions of the credit agreements are presented in the Portfolio of Investments. There were no unfunded loan commitments at December 31, 2019.
NOTE 13 — FEDERAL INCOME TAXES
The amount of distributions from net investment income and net realized capital gains are determined in accordance with federal income tax regulations, which may differ from GAAP for investment companies. These book/tax differences may be either temporary or permanent. Permanent differences are reclassified within the capital accounts based on their federal tax-basis treatment; temporary differences are not reclassified. Key differences include the treatment of short-term capital gains, foreign currency transactions, income from passive foreign investment companies (PFICs) and wash sale deferrals. Distributions in excess of net investment income and/or net realized capital gains for tax purposes are reported as return of capital.
The following permanent tax differences have been reclassified as of December 31, 2019:
| | | | Paid-in
Capital | | Distributable
Earnings | |
|---|
| Clarion Global Real Estate | | | | $ | 16,235 | | | $ | (16,235 | ) | |
| T. Rowe Price Capital Appreciation | | | | | (824 | ) | | | 824 | | |
Dividends paid by the Portfolios from net investment income and distributions of net realized short-term capital gains are, for federal income tax purposes, taxable as ordinary income to shareholders.
The tax composition of dividends and distributions to shareholders was as follows:
| | | | Year Ended December 31, 2019 | | Year Ended December 31, 2018 |
|---|
| | | | Ordinary
Income | | Long-term
Capital Gains | | Ordinary
Income | | Long-term
Capital Gains |
|---|
| Government Liquid Assets | | | | $ | 12,787,150 | | | $ | — | | | $ | 9,875,318 | | | $ | — | |
| Clarion Global Real Estate | | | | | 6,282,769 | | | | — | | | | 15,421,551 | | | | — | |
| Invesco Growth and Income | | | | | 10,636,889 | | | | 51,891,887 | | | | 7,121,509 | | | | 57,360,784 | |
| JPMorgan Emerging Markets Equity | | | | | 1,435,190 | | | | 26,134,093 | | | | 3,094,309 | | | | — | |
| Morgan Stanley Global Franchise | | | | | 3,001,531 | | | | 41,693,123 | | | | 4,848,074 | | | | 55,874,886 | |
| T. Rowe Price Capital Appreciation | | | | | 104,681,934 | | | | 360,809,518 | | | | 255,040,429 | | | | 343,067,734 | |
| T. Rowe Price Equity Income | | | | | 22,961,755 | | | | 204,767,988 | | | | 21,746,801 | | | | 131,909,682 | |
| T. Rowe Price International Stock | | | | | 2,426,161 | | | | 11,411,467 | | | | 3,915,634 | | | | — | |
The tax-basis components of distributable earnings as of December 31, 2019 were:
| | | | Undistributed
Ordinary
Income | | Undistributed
Long-term
Capital Gains | | Unrealized
Appreciation/
(Depreciation) |
|---|
| Government Liquid Assets | | | | $ | 13,516 | | | $ | — | | | $ | — | |
| Clarion Global Real Estate | | | | | 12,255,192 | | | | 14,559,953 | | | | 35,132,775 | |
| Invesco Growth and Income | | | | | 7,564,552 | | | | 30,987,138 | | | | 74,375,324 | |
| JPMorgan Emerging Markets Equity | | | | | 1,707,646 | | | | 31,734,342 | | | | 171,696,185 | |
| Morgan Stanley Global Franchise | | | | | 3,587,077 | | | | 30,532,623 | | | | 112,560,884 | |
| T. Rowe Price Capital Appreciation | | | | | 117,314,807 | | | | 469,741,721 | | | | 1,131,610,742 | |
| T. Rowe Price Equity Income | | | | | 10,790,686 | | | | 1,198,631 | | | | 78,275,896 | |
| T. Rowe Price International Stock | | | | | 5,237,501 | | | | 4,237,539 | | | | 37,830,299 | |
52
NOTES TO FINANCIAL STATEMENTS AS OF DECEMBER 31, 2019 (CONTINUED)
NOTE 13 — FEDERAL INCOME TAXES (continued)
At December 31, 2019, the Portfolios did not have any capital loss carryovers for U.S. federal income tax purposes.
The Portfolios’ major tax jurisdictions are U.S. federal, Arizona state, and Massachusetts state.
As of December 31, 2019, no provision for income tax is required in the Portfolios’ financial statements as a result of tax positions taken on federal and state income tax returns for open tax years. The Portfolios’ federal and state income and federal excise tax returns for tax years for which the applicable statutes of limitations have not expired are subject to examination by the Internal Revenue Service and state department of revenue. Generally, the earliest tax year that remains subject to examination by these jurisdictions is 2015.
NOTE 14 — LITIGATION
On September 24, 2012, certain Voya mutual funds, including T. Rowe Price Equity Income (the “Subject Fund”), were officially served and included as shareholder defendants in the matter ofOfficial Committee of Unsecured Creditors of the Tribune Company v. FitzSimons, et al. (the “FitzSimons Action”). The FitzSimons Action arises from the Tribune Company (“Tribune”) Chapter 11 bankruptcy proceedings before the United States Bankruptcy Court for the District of Delaware (the “Bankruptcy Court”).
In the FitzSimons Action, the plaintiff (a litigation trustee appointed by the Bankruptcy Court, the “Trustee”) alleges that Tribune acted with actual intent to defraud its creditors when it redeemed its shares from shareholders as part of a leveraged buy-out (“LBO”) of Tribune through which it converted to a privately-held company in 2007, and that those share transfers must now be unwound. To succeed on this claim, the Trustee must prove that Tribune — not the Subject Fund — acted with actual fraudulent intent when Tribune redeemed its shares. With regard to the Subject Fund, the Trustee need only show that the Subject Fund tendered its shares as part of the LBO and not on the open market. The Subject Fund’s lack of fraudulent intent in tendering its shares is not a defense to the Trustee’s actual fraud claim.
In addition to the FitzSimons Action, various additional actions, which also included the Subject Fund as a defendant, stemming from the same facts and circumstances underlying the FitzSimons Action, were filed in multiple U.S. District Courts (collectively, the “State Law Constructive Fraudulent Transfer Cases”). The plaintiffs in the State Law Constructive Fraudulent Transfer Cases (former creditors of Tribune) allege that these same share redemptions that were part of the LBO were constructively, as opposed to actually, fraudulent. Specifically, those suits assert that the LBO rendered Tribune insolvent, that there was not reasonably equivalent value for the redemptions, and therefore the redemptions are voidable under constructive fraudulent transfer law.
Procedural History of the State Law Constructive Fraudulent Transfer Cases
A motion was filed with the Multidistrict Litigation (“MDL”) Panel to consolidate the State Law Constructive Fraudulent Transfer Cases for purposes of all pretrial proceedings. On December 19, 2011, the MDL Panel ordered the State Law Constructive Fraudulent Transfer Cases to be transferred to the Southern District of New York (the “District Court”).
On September 23, 2013, the District Court dismissed the claims against the shareholder defendants, holding that the plaintiffs lacked standing to pursue the claims so long as the Trustee in the FitzSimons Action maintained the actual fraudulent transfer claims in the FitzSimons case against the same shareholders.
On December 20, 2013, the plaintiffs appealed the decision to the Second Circuit Court of Appeals (the “Second Circuit”). The Second Circuit affirmed the dismissal on March 24, 2016. The Second Circuit held that Section 546(e) of the Bankruptcy Code barred the state-law fraudulent constructive transfer claims, finding that the claims were preempted because they conflict with the purpose of Section 546(e). On April 12, 2016, the plaintiffs moved for rehearingen banc in the Second Circuit; the motion was subsequently denied. The plaintiffs filed a petition for a writ of certiorari in the United States Supreme Court on September 9, 2016. The shareholder defendants filed their opposition on October 24, 2016, to which the plaintiffs filed a reply on November 4, 2016.
On February 27, 2018, the Supreme Court issued its decision inMerit Management Group v. FTI Consulting (“Merit Management”), a case that, like Tribune, deals with the appropriate scope of section 546(e) of the Bankruptcy Code. On April 3, 2018, the Supreme Court issued a “statement” from two justices announcing that consideration of plaintiffs’ certiorari petition would be deferred for an undetermined period of time to “allow” the Second Circuit or the District Court to consider, among other things, whether the Second Circuit’s March 2016 decision should be vacated in light ofMerit Management. On April 10, 2018, the plaintiffs asked the Second Circuit to vacate its prior decision and remand to the District Court for
53
NOTES TO FINANCIAL STATEMENTS AS OF DECEMBER 31, 2019 (CONTINUED)
NOTE 14 — LITIGATION (continued)
further proceedings. The shareholder defendants filed an opposition on April 20, 2018. On May 15, 2018, the Second Circuit entered an order recalling the mandate “in anticipation of further panel review.” The order does not provide any specific timing for, or guidance on, next steps, but it is possible that the Second Circuit may request additional proceedings on the merits. The Second Circuit has not yet issued further instructions.
Procedural History of the FitzSimons Action
Similar to the State Law Constructive Fraudulent Transfer Cases, the FitzSimons Action was transferred to the District Court for pre-trial purposes. On November 20, 2013, the District Court entered an order stating that the FitzSimons Action would remain with the District Court. On January 6, 2017, the District Court dismissed the actual fraudulent transfer claims against the shareholder defendants without leave to replead. Because the January 6, 2017 decision did not fully dispose of all claims asserted in the complaint, the Trustee could not automatically appeal the decision. On February 1, 2017, the Trustee sought leave to file a motion for certification of the Motion to Dismiss. On February 23, 2017, the District Court issued an order stating that it intended to delay certification of the Motion to Dismiss until certain other pending motions to dismiss (not involving the shareholder defendants) were resolved.
On July 18, 2017, the Trustee sought permission from the District Court to file a motion seeking leave to amend its complaint to include a constructive fraudulent transfer claim based on the anticipated ruling inMerit Management. On August 24, 2017, the District Court denied the request without prejudice, but noted that affirmance ofMerit Management would give the Trustee a strong argument that he should be allowed to amend his complaint. On March 8, 2018, the Trustee renewed his request to amend his complaint to add a constructive fraudulent transfer claim in light of theMerit Management decision. On March 13, 2018, counsel for a number of shareholder defendants (including counsel for the Subject Fund) filed an opposition.
On June 18, 2018, the District Court entered an order staying any decision on the Trustee’s request on the grounds that it would be preferable to hold off until the Second Circuit issued a further ruling in the State Law Constructive Fraudulent Transfer Cases. The District Court also instructed the parties to file a joint letter indicating their views on proceeding with efforts to seek to achieve a global resolution of the case. On July 9, 2018, the parties submitted a joint letter that voiced general support for a broad based mediation effort.
On November 30, 2018, Judge Sullivan granted motions to dismiss brought by certain Tribune directors and officers. This decision did not directly impact the shareholder
defendants, and because it did not resolve all of the pending motions to dismiss, it did not facilitate an appeal of the dismissal of claims against the shareholder defendants (which had been dismissed almost two years prior). On December 1, 2018, the FitzSimons Action (along with all other Tribune cases still pending in the District Court) were reassigned from Judge Sullivan to Judge Denise Cote. On December 17, 2018, the Trustee filed a motion for reconsideration of Judge Sullivan’s November 30, 2018 decision. On February 12, 2019, Judge Cote denied the Trustee’s motion for reconsideration in its entirety.
On March 27, 2019, Judge Cote lifted the stay previously imposed by Judge Sullivan and allowed the Trustee to move to amend the complaint to assert a constructive fraudulent transfer claim. The Trustee filed his motion on April 4, 2019. The shareholder defendants’ opposition was filed on April 12, 2019. On April 23, 2019, Judge Cote denied the Trustee’s motion. Significantly, Judge Cote held that Tribune qualifies as a “financial institution” under section 546(e) of the Bankruptcy Code.
In mid-July 2019, the Trustee filed a notice of appeal from, among other things, the District Court’s order dismissing the intentional fraudulent transfer claims against the shareholder defendants as well as the order denying the Trustee’s request to amend the complaint to include constructive fraudulent transfer claims against the shareholder defendants. The Trustee’s opening brief is due in January 2020. The Second Circuit has directed that this appeal be heard in tandem with the appeal of the separate suit pursued by the Trustee against financial advisors Citigroup and Merrill Lynch, which has been fully briefed to the Second Circuit and is awaiting oral argument.
Potential Exposure
For the Subject Fund, if the plaintiffs obtain further review of the dismissal of the FitzSimons Action or the State Law Constructive Fraudulent Transfer Cases, and the decision to dismiss these cases is ultimately overturned, the potential exposure of the Subject Fund is the value of all shares sold in conjunction with the LBO transaction (i.e., $18,125,400), plus any pre-judgement interest granted by the court. The Subject Fund believes the claims raised in these actions are without merit and intends to vigorously defend against them.
NOTE 15 — OTHER ACCOUNTING PRONOUNCEMENTS
The Portfolios have made a change in accounting principle and adopted the provisions of Financial Accounting Standards Board (“FASB”) Accounting Standards Update 2017-08 (“ASU 2017-08”), Premium Amortization on Purchased Callable Debt Securities. ASU 2017-08 shortens the amortization period for certain callable debt securities
54
NOTES TO FINANCIAL STATEMENTS AS OF DECEMBER 31, 2019 (CONTINUED)
NOTE 15 — OTHER ACCOUNTING PRONOUNCEMENTS (continued)
held at a premium; specifically, requiring the premium to be amortized to the earliest call date. Prior to ASU 2017-08, premiums on callable debt securities were generally amortized to maturity date. ASU 2017-08 is intended to more closely align the amortization period with the expectations incorporated into the market pricing on the underlying security. ASU 2017-08 does not require an accounting change for securities held at a discount; the discount continues to be amortized to maturity date. Upon evaluation, with the exception of T. Rowe Price Capital Appreciation, the Portfolios have concluded that the change in accounting principle does not materially impact the financial statement amounts. As a result of the adoption of ASU 2017-08 effective as of January 1, 2019, the amortized cost basis of investments for T. Rowe Price Capital Appreciation was reduced by $2,116,129 and unrealized appreciation of investments was increased by $2,116,129.
Also, in August 2018, the FASB issued Accounting Standards Update 2018-13, Fair Value Measurement (Topic 820): Disclosure Framework — Changes to the Disclosure Requirements for Fair Value Measurement (“ASU 2018-13”). The update provides guidance that eliminates, adds and modifies certain disclosure requirements for fair value measurements. ASU 2018-13 will be effective for annual periods beginning after December 15, 2019 and interim periods within those annual periods. At this time, the Portfolios have elected to early adopt the amendments that allow for removal of disclosure requirements related to transfers between Level 1 and Level 2 of the fair value hierarchy and the timing of transfers between levels of the fair value hierarchy. These changes did not have a material impact on the Portfolios’ financial statements. The Portfolios plan to adopt the amendments that require additional fair value measurement disclosures for annual periods beginning after December 15, 2019, and interim periods within those annual periods. The Portfolios are currently evaluating the impact of these changes on the financial statements.
NOTE 16 — AUDITOR CHANGE (UNAUDITED)
On September 12, 2019, KPMG LLP (“KPMG”) was dismissed as the independent registered public accounting firm to the Trust, on behalf of the Portfolios, upon completion of the audit for the fiscal year ended December 31, 2019. The decision to change independent registered public accounting firms was recommended by the Audit Committee of the Board and was approved by the Board.
KPMG’s reports on the Portfolios’ financial statements for the fiscal years ended December 31, 2019 and December 31, 2018 contained no adverse opinion or
disclaimer of opinion nor were they qualified or modified as to uncertainty, audit scope or accounting principle.
During the fiscal years ended December 31, 2019 and December 31, 2018: (i) there were no disagreements with KPMG on any matter of accounting principles or practices, financial statement disclosure or auditing scope or procedure, which disagreements, if not resolved to the satisfaction of KPMG, would have caused KPMG to make reference to the subject matter of the disagreements in connection with its reports on the Portfolios’ financial statements for such periods; and (ii) there were no “reportable events” of the kind described in Item 304(a)(1)(v) of Regulation S-K under the Securities Exchange Act of 1934, as amended.
On September 12, 2019, based on the recommendation of the Audit Committee of the Board, the Board approved the selection of Ernst & Young LLP (“EY”) as the Portfolios’ independent registered public accounting firm for the fiscal year ending December 31, 2020. During the Portfolios’ fiscal years ended December 31, 2019 and December 31, 2018, neither the Portfolios, nor anyone on their behalf, consulted with EY on items which: (i) concerned the application of accounting principles to a specified transaction, either completed or proposed, or the type of audit opinion that might be rendered on the Portfolios’ financial statements; or (ii) concerned the subject of a disagreement (as described in paragraph (a)(1)(iv) of Item 304 of Regulation S-K) or reportable events (as described in paragraph (a)(1)(v) of said Item 304).
NOTE 17 — SUBSEQUENT EVENTS
Dividends: Subsequent to December 31, 2019, the following Portfolio paid dividends and distributions of:
| | Type | | Per Share
Amount | | Payable
Date | | Record
Date |
|---|
Government Liquid Assets |
| Class I | | NII
| | $0.0011 | | February 3, 2020 | | Daily |
| Class S | | NII
| | $0.0009 | | February 3, 2020 | | Daily |
| Class S2 | | NII
| | $0.0008 | | February 3, 2020 | | Daily |
| All Classes | | STCG | | $0.0001 | | February 3, 2020 | | January 30, 2020 |
NII—Net investment income
STCG—Short-term capital gain
Management Fee Waiver: The Board approved an increase to the management fee waiver for Clarion Global Real Estate. Effective January 1, 2020, the Investment Adviser is contractually obligated to waive 0.033% of the management fee for the Portfolio. This waiver is not eligible for recoupment.
The Portfolios have evaluated events occurring after the Statements of Assets and Liabilities date (“subsequent events”) to determine whether any subsequent events necessitated adjustment to or disclosure in the financial statements. Other than above, no such subsequent events were identified.
55
VOYA GOVERNMENT LIQUID
ASSETS PORTFOLIO | PORTFOLIO OF INVESTMENTS
AS OF DECEMBER 31, 2019 |
Principal
Amount† | | | | | | Value | | | Percentage
of Net
Assets |
|---|
| | | | | | | | | | |
|---|
U.S. GOVERNMENT AGENCY DEBT: 34.6% |
| 2,100,000 | | | | Federal Farm Credit Banks Funding Corp., 1.764%, (US0001M + 0.000%), 06/19/2020 | | $ | 2,100,011 | | | | 0.3 | |
| 1,900,000 | | | | Federal Farm Credit Banks Funding Corp., 1.772%, (US0003M + (0.130)%), 02/03/2020 | | | 1,900,000 | | | | 0.3 | |
| 18,500,000 | | | | Federal Farm Credit Banks, 1.755%, (US0001M + (0.030)%), 04/22/2020 | | | 18,498,417 | | | | 2.5 | |
| 26,750,000 | | | | Federal Farm Credit Banks, 1.791%, (US0001M + 0.010%), 07/02/2020 | | | 26,750,000 | | | | 3.7 | |
| 7,750,000 | | | | Federal Farm Credit Banks, 1.835%, (US0001M + 0.050%), 02/21/2020 | | | 7,750,831 | | | | 1.1 | |
| 2,415,000 | | | | Federal Home Loan Bank Discount Notes, 0.330%, 04/24/2020 | | | 2,402,955 | | | | 0.3 | |
| 7,000,000 | | | | Federal Home Loan Bank Discount Notes, 0.970%, 02/28/2020 | | | 6,982,147 | | | | 1.0 | |
| 20,310,000 | | | | Federal Home Loan Bank Discount Notes, 2.810%, 01/03/2020 | | | 20,308,533 | | | | 2.8 | |
| 105,700,000 | | | | Federal Home Loan Bank Discount Notes, 14.600%, 01/07/2020 | | | 105,674,808 | | | | 14.5 | |
| 5,250,000 | | | | Federal Home Loan Banks, 1.605%, (SOFRRATE + 0.065%), 03/26/2020 | | | 5,250,000 | | | | 0.7 | |
| 26,000,000 | | | | Federal Home Loan Banks, 1.670%, (SOFRRATE + 0.130%), 10/16/2020 | | | 26,000,000 | | | | 3.6 | |
| 24,250,000 | | | | Federal Home Loan Banks, 1.782%, (US0001M + (0.010)%), 03/25/2020 | | | 24,250,000 | | | | 3.3 | |
| 3,500,000 | | | | Federal Home Loan Banks, 1.852%, (US0003M + (0.150)%), 01/17/2020 | | | 3,499,958 | | | | 0.5 | |
| |
| | | | | Total U.S. Government Agency Debt
(Cost $251,367,660) | | | 251,367,660 | | | | 34.6 | |
| |
U.S. TREASURY DEBT: 14.3% |
| 104,500,000 | | (1) | | United States Treasury Bill, 1.580%, 06/18/2020 | | | 103,741,027 | | | | 14.3 | |
| | | | | Total U.S. Treasury Debt
(Cost $103,741,027) | | | 103,741,027 | | | | 14.3 | |
| |
U.S. TREASURY REPURCHASE AGREEMENT: 43.2% |
| | | | | Repurchase Agreement: 43.2% |
| 101,000,000 | | | | Deutsche Bank Repurchase Agreement dated 12/31/2019, 1.50%, due 1/2/2020, $101,008,417 to be received upon repurchase (Collateralized by $150,941,745, TINT, 0.00%, Market Value plus accrued interest $104,030,000 due
2/15/2028–3/15/2037), 1.500% | | | 101,000,000 | | | | 13.9 | |
| |
U.S. TREASURY REPURCHASE AGREEMENT: (continued) |
| | | | | Repurchase Agreement: (continued) |
| 101,000,000 | | | | Deutsche Bank Repurchase Agreement dated 12/31/2019, 1.50%, due 1/2/2020, $101,008,697 to be received upon repurchase (Collateralized by $74,642,100, Bond, 4.500%, Market Value plus accrued interest $103,020,131 due 8/15/2039), 1.550% | | $ | 101,000,000 | | | | 13.9 | |
| 111,754,000 | | | | Deutsche Bank Repurchase Agreement dated 12/31/2019, 1.55%, due 1/2/2020, $111,763,623 to be received upon repurchase (Collateralized by $135,443,927, multiple securities, 0.00%, Market Value plus accrued interest $115,106,620 due 2/15/2028-2/15/2031), 1.550% | | | 111,754,000 | | | | 15.4 | |
| |
| | | | | Total U.S. Treasury Repurchase Agreement
(Cost $313,754,000) | | | 313,754,000 | | | | 43.2 | |
| Shares | | | | | | Value | | | Percentage
of Net
Assets |
|---|
| | | | | | | | | | |
|---|
INVESTMENT COMPANIES: 7.6% |
| 33,000,000 | | (2) | | BlackRock Liquidity Funds, FedFund, Institutional Class, 1.520%, 01/02/20 | | | 33,000,000 | | | | 4.5 | |
| 22,500,000 | | (2) | | Goldman Sachs Financial Square Government Fund — Institutional Shares, 1.550%, 01/02/20 | | | 22,500,000 | | | | 3.1 | |
| |
| | | | | Total Investment Companies
(Cost $55,500,000) | | | 55,500,000 | | | | 7.6 | |
| |
| | | | | Total Investments in Securities
(Cost $724,362,687) | | $ | 724,362,687 | | | | 99.7 | |
| | | | | Assets in Excess of Other Liabilities | | | 2,232,513 | | | | 0.3 | |
| | | | | Net Assets | | $ | 726,595,200 | | | | 100.0 | |
| † | | Unless otherwise indicated, principal amount is shown in USD. |
| (1) | | Represents a zero coupon bond. Rate shown reflects the effective yield as of December 31, 2019. |
| (2) | | Rate shown is the 7-day yield as of December 31, 2019. |
Reference Rate Abbreviations:
| SOFRRATE | | Secured Overnight Financing Rate |
| US0001M | | 1-month LIBOR |
| US0003M | | 3-month LIBOR |
At December 31, 2019, the aggregate cost of securities for federal income tax purposes is the same as for financial reporting purposes.
See Accompanying Notes to Financial Statements
56
VOYA GOVERNMENT LIQUID
ASSETS PORTFOLIO | PORTFOLIO OF INVESTMENTS
AS OF DECEMBER 31, 2019 (CONTINUED) |
Fair Value Measurementsˆ
The following is a summary of the fair valuations according to the inputs used as of December 31, 2019 in valuing the assets and liabilities:
| | | Quoted Prices
in Active Markets
for Identical
Investments
(Level 1) | | Significant
Other
Observable
Inputs
(Level 2) | | Significant
Unobservable
Inputs
(Level 3) | | Fair Value
at
December 31, 2019 |
|---|
Asset Table | | | | | | | | | | | | | | | | | | | | |
Investments, at fair value | | | | | | | | | | | | | | | | | | | | |
| Investment Companies | | | $ | 55,500,000 | | | | $ | — | | | | $ | — | | | | $ | 55,500,000 | |
| U.S. Government Agency Debt | | | | — | | | | | 251,367,660 | | | | | — | | | | | 251,367,660 | |
| U.S. Treasury Debt | | | | — | | | | | 103,741,027 | | | | | — | | | | | 103,741,027 | |
| U.S. Treasury Repurchase Agreement | | | | — | | | | | 313,754,000 | | | | | — | | | | | 313,754,000 | |
| Total Investments, at fair value | | | $ | 55,500,000 | | | | $ | 668,862,687 | | | | $ | — | | | | $ | 724,362,687 | |
| ˆ | | See Note 2, “Significant Accounting Policies” in the Notes to Financial Statements for additional information. |
The following table is a summary of the Portfolio’s repurchase agreements by counterparty which are subject to offset under a MRA as of December 31, 2019:
| Counterparty | | | Government Repurchase
Agreement, at fair value | | Fair Value of
Non-Cash Collateral
Received Including
Accrued Interest(1) | | Net
Amount |
|---|
| Deutsche Bank | | | | $ | 313,754,000 | | | | $ | (313,754,000 | ) | | | $ | — | |
| Totals | | | | $ | 313,754,000 | | | | $ | (313,754,000 | ) | | | $ | — | |
(1) | | Collateral with a fair value of $322,156,751 has been pledged in connection with the above government repurchase agreement. Excess collateral received from the individual counterparty is not shown for financial reporting purposes. |
See Accompanying Notes to Financial Statements
57
VY® CLARION GLOBAL
REAL ESTATE PORTFOLIO | SUMMARY PORTFOLIO OF INVESTMENTS
AS OF DECEMBER 31, 2019 |
| Shares | | | | | | Value | | | Percentage
of Net
Assets |
|---|
| | | | | | | | | | |
|---|
COMMON STOCK: 99.2% |
| | | | | |
| 183,870 | | | | Goodman Group | | $ | 1,727,860 | | | | 0.8 | |
| 1,899,616 | | | | Mirvac Group | | | 4,251,904 | | | | 1.8 | |
| 418,405 | | | | Other Securities | | | 2,106,662 | | | | 0.9 | |
| | | | | | | | 8,086,426 | | | | 3.5 | |
| |
| | | | | |
| 27,813 | | | | Other Securities | | | 1,827,040 | | | | 0.8 | |
| |
| | | | | |
| 91,315 | | | | Canadian Apartment Properties REIT | | | 3,727,702 | | | | 1.6 | |
| 93,200 | | | | Other Securities | | | 997,636 | | | | 0.4 | |
| | | | | | | | 4,725,338 | | | | 2.0 | |
| |
| | | | | |
| 49,666 | | | | Other Securities | | | 902,512 | | | | 0.4 | |
| |
| | | | | |
| 16,613 | | | | ICADE | | | 1,808,949 | | | | 0.8 | |
| 23,285 | | | | Unibail-Rodamco-Westfield | | | 3,673,623 | | | | 1.6 | |
| 20,737 | | | | Other Securities | | | 788,921 | | | | 0.3 | |
| | | | | | | | 6,271,493 | | | | 2.7 | |
| |
| | | | | |
| 60,486 | | | | Vonovia SE | | | 3,248,679 | | | | 1.4 | |
| 252,278 | | | | Other Securities | | | 6,616,877 | | | | 2.8 | |
| | | | | | | | 9,865,556 | | | | 4.2 | |
| |
| | | | | |
| 703,842 | | | | Link REIT | | | 7,456,487 | | | | 3.2 | |
| 1,974,000 | | | | Sino Land Co. | | | 2,865,278 | | | | 1.2 | |
| 1,894,500 | | | | Other Securities | | | 4,452,581 | | | | 1.9 | |
| | | | | | | | 14,774,346 | | | | 6.3 | |
| |
| | | | | |
| 556,353 | | | | Other Securities | | | 891,163 | | | | 0.4 | |
| |
| | | | | |
| 53,300 | | | | Aeon Mall Co., Ltd. | | | 945,410 | | | | 0.4 | |
| 1,048 | | | | AEON REIT Investment Corp. | | | 1,434,985 | | | | 0.6 | |
| 3,817 | | | | GLP J-Reit | | | 4,738,975 | | | | 2.0 | |
| 1,277 | | | | LaSalle Logiport REIT | | | 1,898,229 | | | | 0.8 | |
| 265,700 | | | | Mitsubishi Estate Co., Ltd. | | | 5,084,137 | | | | 2.2 | |
| 87,729 | | | | Mitsui Fudosan Co., Ltd. | | | 2,144,091 | | | | 0.9 | |
| 2,174 | | | | Orix JREIT, Inc. | | | 4,712,239 | | | | 2.0 | |
| 117,800 | | | | Tokyo Tatemono Co., Ltd. | | | 1,838,717 | | | | 0.8 | |
| 60,746 | | | | Other Securities | | | 5,107,611 | | | | 2.2 | |
| | | | | | | | 27,904,394 | | | | 11.9 | |
| |
| | | | | |
| 62,606 | | | | Other Securities | | | 1,502,616 | | | | 0.6 | |
| |
| | | | | |
| 111,708 | | (1) | | Entra ASA | | | 1,846,739 | | | | 0.8 | |
| |
| Shares | | | | | | Value | | | Percentage
of Net
Assets |
|---|
| | | | | | | | | | |
|---|
COMMON STOCK: (continued) |
| | | | | |
| 1,406,400 | | | | CapitaLand Ltd. | | $ | 3,924,584 | | | | 1.7 | |
| 1,515,099 | | | | Mapletree Logistics Trust | | | 1,959,796 | | | | 0.8 | |
| | | | | | | | 5,884,380 | | | | 2.5 | |
| |
| | | | | |
| 71,094 | | | | Other Securities | | | 1,021,864 | | | | 0.4 | |
| |
| | | | | |
| 119,581 | | | | Castellum AB | | | 2,808,759 | | | | 1.2 | |
| 133,467 | | | | Fabege AB | | | 2,217,043 | | | | 0.9 | |
| 102,578 | | | | Other Securities | | | 1,413,892 | | | | 0.6 | |
| | | | | | | | 6,439,694 | | | | 2.7 | |
| |
| | | | | |
| 36,607 | | | | Derwent London PLC | | | 1,944,447 | | | | 0.8 | |
| 304,792 | | | | Segro PLC | | | 3,629,326 | | | | 1.6 | |
| 601,898 | | (1) | | Tritax EuroBox PLC | | | 755,018 | | | | 0.3 | |
| 169,797 | | | | Unite Group PLC | | | 2,833,924 | | | | 1.2 | |
| 435,644 | | | | Other Securities | | | 4,871,832 | | | | 2.1 | |
| | | | | | | | 14,034,547 | | | | 6.0 | |
| |
| | | | | |
| 30,060 | | | | Alexandria Real Estate Equities, Inc. | | | 4,857,095 | | | | 2.1 | |
| 62,935 | | | | American Campus Communities, Inc. | | | 2,959,833 | | | | 1.3 | |
| 113,339 | | | | Brandywine Realty Trust | | | 1,785,089 | | | | 0.8 | |
| 181,709 | | | | Brixmor Property Group, Inc. | | | 3,926,731 | | | | 1.7 | |
| 36,047 | | | | Camden Property Trust | | | 3,824,587 | | | | 1.6 | |
| 76,684 | | | | Cousins Properties, Inc. | | | 3,159,381 | | | | 1.3 | |
| 28,934 | | | | Crown Castle International Corp. | | | 4,112,968 | | | | 1.8 | |
| 92,907 | | | | CubeSmart | | | 2,924,712 | | | | 1.2 | |
| 60,068 | | | | CyrusOne, Inc. | | | 3,930,249 | | | | 1.7 | |
| 73,631 | | | | Duke Realty Corp. | | | 2,552,787 | | | | 1.1 | |
| 3,994 | | | | Equinix, Inc. | | | 2,331,298 | | | | 1.0 | |
| 95,912 | | | | Equity Residential | | | 7,761,199 | | | | 3.3 | |
| 15,318 | | | | Essex Property Trust, Inc. | | | 4,608,573 | | | | 2.0 | |
| 112,020 | | | | Healthcare Trust of America, Inc. | | | 3,391,966 | | | | 1.4 | |
| 129,783 | | | | Healthpeak Properties, Inc. | | | 4,473,620 | | | | 1.9 | |
| 199,980 | | | | Host Hotels & Resorts, Inc. | | | 3,709,629 | | | | 1.6 | |
| 83,820 | | | | Hudson Pacific Properties, Inc. | | | 3,155,823 | | | | 1.3 | |
| 213,114 | | | | Invitation Homes, Inc. | | | 6,387,027 | | | | 2.7 | |
| 102,984 | | | | Medical Properties Trust, Inc. | | | 2,173,992 | | | | 0.9 | |
| 90,298 | | | | MGM Growth Properties LLC | | | 2,796,529 | | | | 1.2 | |
| 81,202 | | | | Piedmont Office Realty Trust, Inc. | | | 1,805,932 | | | | 0.8 | |
| 133,295 | | | | ProLogis, Inc. | | | 11,881,916 | | | | 5.1 | |
| 137,929 | | | | Retail Properties of America, Inc. | | | 1,848,249 | | | | 0.8 | |
| 49,331 | | | | Simon Property Group, Inc. | | | 7,348,346 | | | | 3.1 | |
| 116,627 | | | | STORE Capital Corp. | | | 4,343,189 | | | | 1.8 | |
See Accompanying Notes to Financial Statements
58
VY® CLARION GLOBAL
REAL ESTATE PORTFOLIO | SUMMARY PORTFOLIO OF INVESTMENTS
AS OF DECEMBER 31, 2019 (CONTINUED) |
| Shares | | | | | | Value | | | Percentage
of Net
Assets |
|---|
| | | | | | | | | | |
|---|
COMMON STOCK: (continued) |
| | | | | United States: (continued) |
| 623,100 | | | | VEREIT, Inc. | | $ | 5,757,444 | | | | 2.5 | |
| 167,270 | | | | VICI Properties, Inc. | | | 4,273,749 | | | | 1.8 | |
| 62,306 | | | | Welltower, Inc. | | | 5,095,385 | | | | 2.2 | |
| 399,583 | | (2) | | Other Securities | | | 9,370,453 | | | | 4.0 | |
| | | | | | | | 126,547,751 | | | | 54.0 | |
| |
| | | | | Total Common Stock
(Cost $184,978,901) | | | 232,525,859 | | | | 99.2 | |
Principal
Amount† | | | | | | Value | | | Percentage
of Net
Assets |
|---|
| | | | | | | | | | |
|---|
SHORT-TERM INVESTMENTS: 0.3% |
| | | | | Repurchase Agreements: 0.3% |
| 632,792 | | (3) | | RBC Dominion Securities Inc., Repurchase Agreement dated 12/31/19, 1.57%, due 01/02/20 (Repurchase Amount $632,846, collateralized by various U.S. Government/U.S. Government Agency Obligations, 0.000%–6.500%, Market Value plus accrued interest $645,448, due 06/30/21–12/01/49)
(Cost $632,792) | | | 632,792 | | | | 0.3 | |
| |
| | | | | Total Short-Term Investments
(Cost $632,792) | | | 632,792 | | | | 0.3 | |
| | | | | Total Investments in Securities
(Cost $185,611,693) | | $ | 233,158,651 | | | | 99.5 | |
| | | | | Assets in Excess of Other Liabilities | | | 1,215,681 | | | | 0.5 | |
| | | | | Net Assets | | $ | 234,374,332 | | | | 100.0 | |
“Other Securities” represents issues not identified as the top 50 holdings in terms of market value and issues or issuers not exceeding 1% of net assets individually or in aggregate respectively as of December 31, 2019.
The following footnotes apply to either the individual securities noted or one or more of the securities aggregated and listed as a single line item.
| † | | Unless otherwise indicated, principal amount is shown in USD. |
| (1) | | Securities with purchases pursuant to Rule 144A or section 4(a)(2), under the Securities Act of 1933 and may not be resold subject to that rule except to qualified institutional buyers. |
| (2) | | The grouping contains securities on loan. |
| (3) | | All or a portion of the security represents securities purchased with cash collateral received for securities on loan. |
| REIT Diversification | | | | Percentage
of Net Assets |
|---|
| Residential REITs | | | | | 14.1 | % |
| Industrial REITs | | | | | 13.2 | |
| Retail REITs | | | | | 12.9 | |
| Office REITs | | | | | 12.5 | |
| Specialized REITs | | | | | 9.2 | |
| Real Estate Operating Companies | | | | | 9.1 | |
| Diversified REITs | | | | | 8.7 | |
| Diversified Real Estate Activities | | | | | 7.8 | |
| Health Care REITs | | | | | 6.4 | |
| Hotel & Resort REITs | | | | | 3.4 | |
| Real Estate Development | | | | | 1.2 | |
| Health Care Facilities | | | | | 0.4 | |
| Hotels, Resorts & Cruise Lines | | | | | 0.3 | |
| Assets in Excess of Other Liabilities* | | | | | 0.8 | |
Net Assets | | | | | 100.0 | % |
| * | | Includes short-term investments. |
Fair Value Measurementsˆ
The following is a summary of the fair valuations according to the inputs used as of December 31, 2019 in valuing the assets and liabilities:
| | Quoted Prices
in Active Markets
for Identical
Investments
(Level 1) | | Significant
Other
Observable
Inputs#
(Level 2) | | Significant
Unobservable
Inputs
(Level 3) | | Fair Value
at
December 31, 2019 |
|---|
Asset Table | | | | | | | | | | | | | | | | | | | | |
Investments, at fair value | | | | | | | | | | | | | | | | | | | | |
| Common Stock | | | | | | | | | | | | | | | | | | | | |
| Australia | | | $ | 930,848 | | | | $ | 7,155,578 | | | | $ | — | | | | $ | 8,086,426 | |
| Belgium | | | | 857,723 | | | | | 969,317 | | | | | — | | | | | 1,827,040 | |
| Canada | | | | 4,725,338 | | | | | — | | | | | — | | | | | 4,725,338 | |
| Finland | | | | 902,512 | | | | | — | | | | | — | | | | | 902,512 | |
| France | | | | 3,673,623 | | | | | 2,597,870 | | | | | — | | | | | 6,271,493 | |
| Germany | | | | 4,290,162 | | | | | 5,575,394 | | | | | — | | | | | 9,865,556 | |
| Hong Kong | | | | — | | | | | 14,774,346 | | | | | — | | | | | 14,774,346 | |
| Ireland | | | | 891,163 | | | | | — | | | | | — | | | | | 891,163 | |
| Japan | | | | 5,767,055 | | | | | 22,137,339 | | | | | — | | | | | 27,904,394 | |
| Luxembourg | | | | — | | | | | 1,502,616 | | | | | — | | | | | 1,502,616 | |
See Accompanying Notes to Financial Statements
59
VY® CLARION GLOBAL
REAL ESTATE PORTFOLIO | SUMMARY PORTFOLIO OF INVESTMENTS
AS OF DECEMBER 31, 2019 (CONTINUED) |
| | Quoted Prices
in Active Markets
for Identical
Investments
(Level 1) | | Significant
Other
Observable
Inputs#
(Level 2) | | Significant
Unobservable
Inputs
(Level 3) | | Fair Value
at
December 31, 2019 |
|---|
| Common Stock (continued) | | | | | | | | | | | | | | | | | | | | |
| Norway | | | $ | — | | | | $ | 1,846,739 | | | | $ | — | | | | $ | 1,846,739 | |
| Singapore | | | | — | | | | | 5,884,380 | | | | | — | | | | | 5,884,380 | |
| Spain | | | | — | | | | | 1,021,864 | | | | | — | | | | | 1,021,864 | |
| Sweden | | | | 4,222,651 | | | | | 2,217,043 | | | | | — | | | | | 6,439,694 | |
| United Kingdom | | | | 7,132,884 | | | | | 6,901,663 | | | | | — | | | | | 14,034,547 | |
| United States | | | | 126,547,751 | | | | | — | | | | | — | | | | | 126,547,751 | |
| Total Common Stock | | | | 159,941,710 | | | | | 72,584,149 | | | | | — | | | | | 232,525,859 | |
| Short-Term Investments | | | | — | | | | | 632,792 | | | | | — | | | | | 632,792 | |
| Total Investments, at fair value | | | $ | 159,941,710 | | | | $ | 73,216,941 | | | | $ | — | | | | $ | 233,158,651 | |
Other Financial Instruments+ | | | | | | | | | | | | | | | | | | | | |
| Forward Foreign Currency Contracts | | | | — | | | | | 65 | | | | | — | | | | | 65 | |
| Total Assets | | | $ | 159,941,710 | | | | $ | 73,217,006 | | | | $ | — | | | | $ | 233,158,716 | |
| ˆ | | See Note 2, “Significant Accounting Policies” in the Notes to Financial Statements for additional information. |
| + | | Other Financial Instruments may include open forward foreign currency contracts, futures, centrally cleared swaps, OTC swaps and written options. Forward foreign currency contracts, futures and centrally cleared swaps are valued at the unrealized gain (loss) on the instrument. OTC swaps and written options are valued at the fair value of the instrument. |
| # | | The earlier close of the foreign markets gives rise to the possibility that significant events, including broad market moves, may have occurred in the interim and may materially affect the value of those securities. To account for this, the Portfolio may frequently value many of its foreign equity securities using fair value prices based on third party vendor modeling tools to the extent available. Accordingly, a portion of the Portfolio’s investments are categorized as Level 2 investments. |
A summary of derivative instruments by primary risk exposure is outlined in the following tables.
The fair value of derivative instruments as of December 31, 2019 was as follows:
Derivatives not accounted for as
hedging instruments
| | | | Location on Statement
of Assets and Liabilities | | Fair Value |
|---|
Asset Derivatives | | | | | | | | | |
| Foreign exchange contracts | | | | Unrealized appreciation on forward foreign currency contracts | | | $ | 65 | |
Total Asset Derivatives | | | | | | | $ | 65 | |
The effect of derivative instruments on the Portfolio’s Statement of Operations for the year ended December 31, 2019 was as follows:
| | | Amount of Realized Gain or (Loss) on
Derivatives Recognized in Income |
|---|
| | | | |
|---|
| Derivatives not accounted for as hedging instruments | | | Forward foreign
currency contracts |
|---|
| Foreign exchange contracts | | | | $ | (31,124 | ) |
Total | | | | $ | (31,124 | ) |
| | | Change in Unrealized Appreciation or (Depreciation)
on Derivatives Recognized in Income |
|---|
| | | | |
|---|
| Derivatives not accounted for as hedging instruments | | | Forward foreign
currency contracts |
|---|
| Foreign exchange contracts | | | | $ | 12,954 | |
Total | | | | $ | 12,954 | |
At December 31, 2019, the aggregate cost of securities and other investments and the composition of unrealized appreciation and depreciation of securities and other investments at year end were:
| | Cost for federal income tax purposes was $198,027,407. |
| Net unrealized appreciation consisted of: | | | | | | |
| Gross Unrealized Appreciation | | | | $ | 41,003,581 | |
| Gross Unrealized Depreciation | | | | | (5,870,806 | ) |
| Net Unrealized Appreciation | | | | $ | 35,132,775 | |
See Accompanying Notes to Financial Statements
60
VY® INVESCO GROWTH
AND INCOME PORTFOLIO | SUMMARY PORTFOLIO OF INVESTMENTS
AS OF DECEMBER 31, 2019 |
| Shares | | | | | | Value | | | Percentage
of Net
Assets |
|---|
| | | | | | | | | | |
|---|
COMMON STOCK: 96.6% |
| | | | | Communication Services: 4.0% |
| 13,886 | | (1) | | Charter Communications, Inc. | | $ | 6,735,821 | | | | 1.5 | |
| 117,538 | | | | Comcast Corp. — Class A | | | 5,285,684 | | | | 1.2 | |
| 2,829,045 | | | | Vodafone Group PLC | | | 5,492,272 | | | | 1.3 | |
| | | | | | | | 17,513,777 | | | | 4.0 | |
| |
| | | | | Consumer Discretionary: 8.6% |
| 216,734 | | (1) | | Capri Holdings Ltd. | | | 8,268,402 | | | | 1.9 | |
| 175,922 | | | | Carnival Corp. | | | 8,942,115 | | | | 2.0 | |
| 154,147 | | | | eBay, Inc. | | | 5,566,248 | | | | 1.3 | |
| 317,193 | | | | General Motors Co. | | | 11,609,264 | | | | 2.6 | |
| 1,306,532 | | | | Other Securities | | | 3,761,177 | | | | 0.8 | |
| | | | | | | | 38,147,206 | | | | 8.6 | |
| |
| | | | | |
| 67,231 | | | | Kellogg Co. | | | 4,649,696 | | | | 1.0 | |
| 153,226 | | | | Mondelez International, Inc. | | | 8,439,688 | | | | 1.9 | |
| 165,055 | | | | Philip Morris International, Inc. | | | 14,044,530 | | | | 3.2 | |
| 177,501 | | (1) | | US Foods Holding Corp. | | | 7,435,517 | | | | 1.7 | |
| | | | | | | | 34,569,431 | | | | 7.8 | |
| |
| | | | | |
| 1,124,908 | | | | BP PLC | | | 7,076,626 | | | | 1.6 | |
| 188,897 | | | | Canadian Natural Resources Ltd. | | | 6,109,641 | | | | 1.4 | |
| 55,200 | | | | Chevron Corp. | | | 6,652,152 | | | | 1.5 | |
| 244,570 | | | | Devon Energy Corp. | | | 6,351,483 | | | | 1.4 | |
| 423,607 | | | | Marathon Oil Corp. | | | 5,752,583 | | | | 1.3 | |
| 315,954 | | | | Royal Dutch Shell PLC — Class A | | | 9,356,794 | | | | 2.1 | |
| 260,814 | | | | TechnipFMC PLC | | | 5,591,852 | | | | 1.3 | |
| | | | | | | | 46,891,131 | | | | 10.6 | |
| |
| | | | | |
| 248,608 | | | | American International Group, Inc. | | | 12,761,049 | | | | 2.9 | |
| 430,454 | | | | Bank of America Corp. | | | 15,160,590 | | | | 3.4 | |
| 171,244 | | | | Citigroup, Inc. | | | 13,680,683 | | | | 3.1 | |
| 217,724 | | | | Citizens Financial Group, Inc. | | | 8,841,772 | | | | 2.0 | |
| 38,963 | | | | Goldman Sachs Group, Inc. | | | 8,958,763 | | | | 2.0 | |
| 53,688 | | | | JPMorgan Chase & Co. | | | 7,484,107 | | | | 1.7 | |
| 229,603 | | | | Morgan Stanley | | | 11,737,305 | | | | 2.6 | |
| 69,801 | | | | PNC Financial Services Group, Inc. | | | 11,142,334 | | | | 2.5 | |
| 141,208 | | | | Truist Financial Corp. | | | 7,952,834 | | | | 1.8 | |
| 95,074 | | | | Wells Fargo & Co. | | | 5,114,981 | | | | 1.1 | |
| 32,544 | | | | Willis Towers Watson PLC | | | 6,571,935 | | | | 1.5 | |
| 155,213 | | | | Other Securities | | | 3,846,178 | | | | 0.9 | |
| | | | | | | | 113,252,531 | | | | 25.5 | |
| |
| | | | | |
| 19,201 | | | | Anthem, Inc. | | | 5,799,278 | | | | 1.3 | |
| 136,415 | | | | Bristol-Myers Squibb Co. | | | 8,756,479 | | | | 2.0 | |
| 94,574 | | | | CVS Health Corp. | | | 7,025,902 | | | | 1.6 | |
| 110,062 | | | | Johnson & Johnson | | | 16,054,744 | | | | 3.6 | |
| 43,587 | | | | McKesson Corp. | | | 6,028,954 | | | | 1.3 | |
| 53,243 | | | | Medtronic PLC | | | 6,040,418 | | | | 1.4 | |
| 65,304 | | | | Sanofi | | | 6,558,344 | | | | 1.5 | |
| 39,589 | | | | Zimmer Biomet Holdings, Inc. | | | 5,925,682 | | | | 1.3 | |
| 301,661 | | (2) | | Other Securities | | | 10,613,404 | | | | 2.4 | |
| | | | | | | | 72,803,205 | | | | 16.4 | |
| |
| Shares | | | | | | Value | | | Percentage
of Net
Assets |
|---|
| | | | | | | | | | |
|---|
COMMON STOCK: (continued) |
| | | | | |
| 93,495 | | | | CSX Corp. | | $ | 6,765,298 | | | | 1.5 | |
| 54,452 | | | | General Dynamics Corp. | | | 9,602,610 | | | | 2.2 | |
| 51,218 | | | | Ingersoll-Rand PLC — Class A | | | 6,807,897 | | | | 1.5 | |
| 148,742 | | | | Johnson Controls International plc | | | 6,055,287 | | | | 1.4 | |
| | | | | | | | 29,231,092 | | | | 6.6 | |
| |
| | | | | Information Technology: 10.9% |
| 25,246 | | | | Apple, Inc. | | | 7,413,488 | | | | 1.7 | |
| 99,086 | | | | Cisco Systems, Inc. | | | 4,752,164 | | | | 1.1 | |
| 121,813 | | | | Cognizant Technology Solutions Corp. | | | 7,554,842 | | | | 1.7 | |
| 140,560 | | | | Intel Corp. | | | 8,412,516 | | | | 1.9 | |
| 37,137 | | | | NXP Semiconductor NV — NXPI — US | | | 4,726,055 | | | | 1.1 | |
| 159,015 | | | | Oracle Corp. | | | 8,424,615 | | | | 1.9 | |
| 78,138 | | | | Qualcomm, Inc. | | | 6,894,116 | | | | 1.5 | |
| | | | | | | | 48,177,796 | | | | 10.9 | |
| |
| | | | | |
| 239,699 | | | | Corteva, Inc. | | | 7,085,503 | | | | 1.6 | |
| 76,962 | | | | Dow, Inc. | | | 4,212,130 | | | | 0.9 | |
| 125,436 | | (3) | | Other Securities | | | 6,934,650 | | | | 1.6 | |
| | | | | | | | 18,232,283 | | | | 4.1 | |
| |
| | | | | |
| 174,389 | | | | Other Securities | | | 9,389,387 | | | | 2.1 | |
| |
| | | | | Total Common Stock
(Cost $352,519,931) | | | 428,207,839 | | | | 96.6 | |
Principal
Amount† | | | | | | Value | | | Percentage
of Net
Assets |
|---|
| | | | | | | | | | |
|---|
SHORT-TERM INVESTMENTS: 4.2% |
| | | | | Repurchase Agreements: 0.7% |
| 1,000,000 | | (4) | | Bank of Nova Scotia, Repurchase Agreement dated 12/31/19, 1.57%, due 01/02/20 (Repurchase Amount $1,000,086, collateralized by various U.S. Government Agency Obligations, 2.500%–6.500%, Market Value plus accrued interest $1,020,089, due 09/01/24–11/01/49) | | | 1,000,000 | | | | 0.2 | |
| 296,644 | | (4) | | Citadel Securities LLC, Repurchase Agreement dated 12/31/19, 1.60%, due 01/02/20 (Repurchase Amount $296,670, collateralized by various U.S. Government Securities, 0.000%–8.500%, Market Value plus accrued interest $302,604, due 01/15/20–11/15/48) | | | 296,644 | | | | 0.1 | |
See Accompanying Notes to Financial Statements
61
VY® INVESCO GROWTH
AND INCOME PORTFOLIO | SUMMARY PORTFOLIO OF INVESTMENTS
AS OF DECEMBER 31, 2019 (CONTINUED) |
Principal
Amount† | | | | | | Value | | | Percentage
of Net
Assets |
|---|
| | | | | | | | | | |
|---|
SHORT-TERM INVESTMENTS: (continued) |
| | | | | Repurchase Agreements: (continued) |
| 1,000,000 | | (4) | | Citigroup, Inc., Repurchase Agreement dated 12/31/19, 1.57%, due 01/02/20 (Repurchase Amount $1,000,086, collateralized by various U.S. Government/U.S. Government Agency Obligations, 0.000%–9.000%, Market Value plus accrued interest $1,020,000, due 02/13/20–09/20/69) | | $ | 1,000,000 | | | | 0.2 | |
| 1,000,000 | | (4) | | Daiwa Capital Markets, Repurchase Agreement dated 12/31/19, 1.58%, due 01/02/20 (Repurchase Amount $1,000,087, collateralized by various U.S. Government/U.S. Government Agency Obligations, 0.000%–6.030%, Market Value plus accrued interest $1,020,000, due 01/14/20–12/20/49) | | | 1,000,000 | | | | 0.2 | |
| |
| | | | | Total Repurchase Agreements
(Cost $3,296,644) | | | 3,296,644 | | | | 0.7 | |
| Shares | | | | | | Value | | | Percentage
of Net
Assets |
|---|
| | | | | | | | | | |
|---|
SHORT-TERM INVESTMENTS: (continued) |
| | | | | |
| 15,458,088 | | (5) | | BlackRock Liquidity Funds, FedFund, Institutional Class, 1.520%
(Cost $15,458,088) | | $ | 15,458,088 | | | | 3.5 | |
| | | | | Total Short-Term Investments | | | | | | | | |
| | | | | (Cost $18,754,732) | | | 18,754,732 | | | | 4.2 | |
| | | | | Total Investments
in Securities
(Cost $371,274,663) | | $ | 446,962,571 | | | | 100.8 | |
| | | | | Liabilities in Excess of Other Assets | | | (3,570,905 | ) | | | (0.8 | ) |
| | | | | Net Assets | | $ | 443,391,666 | | | | 100.0 | |
“Other Securities” represents issues not identified as the top 50 holdings in terms of market value and issues or issuers not exceeding 1% of net assets individually or in aggregate respectively as of December 31, 2019.
The following footnotes apply to either the individual securities noted or one or more of the securities aggregated and listed as a single line item.
| † | | Unless otherwise indicated, principal amount is shown in USD. |
| (1) | | Non-income producing security. |
| (2) | | The grouping contains non-income producing securities. |
| (3) | | The grouping contains securities on loan. |
| (4) | | All or a portion of the security represents securities purchased with cash collateral received for securities on loan. |
| (5) | | Rate shown is the 7-day yield as of December 31, 2019. |
Fair Value Measurementsˆ
The following is a summary of the fair valuations according to the inputs used as of December 31, 2019 in valuing the assets and liabilities:
| | Quoted Prices
in Active Markets
for Identical
Investments
(Level 1) | | Significant
Other
Observable
Inputs#
(Level 2) | | Significant
Unobservable
Inputs
(Level 3) | | Fair Value
at
December 31, 2019 |
|---|
Asset Table | | | | | | | | | | | | | | | | | | | | |
Investments, at fair value | | | | | | | | | | | | | | | | | | | | |
| Common Stock | | | | | | | | | | | | | | | | | | | | |
| Communication Services | | | $ | 12,021,505 | | | | $ | 5,492,272 | | | | $ | — | | | | $ | 17,513,777 | |
| Consumer Discretionary | | | | 34,386,029 | | | | | 3,761,177 | | | | | — | | | | | 38,147,206 | |
| Consumer Staples | | | | 34,569,431 | | | | | — | | | | | — | | | | | 34,569,431 | |
| Energy | | | | 30,457,711 | | | | | 16,433,420 | | | | | — | | | | | 46,891,131 | |
| Financials | | | | 113,252,531 | | | | | — | | | | | — | | | | | 113,252,531 | |
| Health Care | | | | 59,664,529 | | | | | 13,138,676 | | | | | — | | | | | 72,803,205 | |
| Industrials | | | | 29,231,092 | | | | | — | | | | | — | | | | | 29,231,092 | |
| Information Technology | | | | 48,177,796 | | | | | — | | | | | — | | | | | 48,177,796 | |
| Materials | | | | 18,232,283 | | | | | — | | | | | — | | | | | 18,232,283 | |
| Utilities | | | | 9,389,387 | | | | | — | | | | | — | | | | | 9,389,387 | |
| Total Common Stock | | | | 389,382,294 | | | | | 38,825,545 | | | | | — | | | | | 428,207,839 | |
| Short-Term Investments | | | | 15,458,088 | | | | | 3,296,644 | | | | | — | | | | | 18,754,732 | |
| Total Investments, at fair value | | | $ | 404,840,382 | | | | $ | 42,122,189 | | | | $ | — | | | | $ | 446,962,571 | |
Other Financial Instruments+ | | | | | | | | | | | | | | | | | | | | |
| Forward Foreign Currency Contracts | | | | — | | | | | 8,521 | | | | | — | | | | | 8,521 | |
| Total Assets | | | $ | 404,840,382 | | | | $ | 42,130,710 | | | | $ | — | | | | $ | 446,971,092 | |
Liabilities Table | | | | | | | | | | | | | | | | | | | | |
Other Financial Instruments+ | | | | | | | | | | | | | | | | | | | | |
| Forward Foreign Currency Contracts | | | $ | — | | | | $ | (711,215 | ) | | | $ | — | | | | $ | (711,215 | ) |
| Total Liabilities | | | $ | — | | | | $ | (711,215 | ) | | | $ | — | | | | $ | (711,215 | ) |
See Accompanying Notes to Financial Statements
62
VY® INVESCO GROWTH
AND INCOME PORTFOLIO | SUMMARY PORTFOLIO OF INVESTMENTS
AS OF DECEMBER 31, 2019 (CONTINUED) |
| ˆ | | See Note 2, “Significant Accounting Policies” in the Notes to Financial Statements for additional information. |
| + | | Other Financial Instruments may include open forward foreign currency contracts, futures, centrally cleared swaps, OTC swaps and written options. Forward foreign currency contracts, futures and centrally cleared swaps are valued at the unrealized gain (loss) on the instrument. OTC swaps and written options are valued at the fair value of the instrument. |
| # | | The earlier close of the foreign markets gives rise to the possibility that significant events, including broad market moves, may have occurred in the interim and may materially affect the value of those securities. To account for this, the Portfolio may frequently value many of its foreign equity securities using fair value prices based on third party vendor modeling tools to the extent available. Accordingly, a portion of the Portfolio’s investments are categorized as Level 2 investments. |
At December 31, 2019, the following forward foreign currency contracts were outstanding for VY® Invesco Growth and Income Portfolio:
| Currency Purchased | | | | Currency Sold | | Counterparty | | Settlement
Date | | Unrealized
Appreciation
(Depreciation) |
|---|
| USD 335,590 | | | | GBP 256,551 | | State Street Bank and Trust Co. | | | 01/17/20 | | | | $ | (4,381 | ) |
| USD 45,451 | | | | CHF 44,538 | | State Street Bank and Trust Co. | | | 01/17/20 | | | | | (617 | ) |
| USD 155,162 | | | | CAD 204,009 | | State Street Bank and Trust Co. | | | 01/17/20 | | | | | (1,955 | ) |
| USD 679,206 | | | | GBP 518,554 | | State Street Bank and Trust Co. | | | 01/17/20 | | | | | (7,959 | ) |
| USD 79,363 | | | | EUR 71,019 | | State Street Bank and Trust Co. | | | 01/17/20 | | | | | (370 | ) |
| USD 65,641 | | | | EUR 58,773 | | State Street Bank and Trust Co. | | | 01/17/20 | | | | | (344 | ) |
| USD 130,100 | | | | CAD 171,424 | | State Street Bank and Trust Co. | | | 01/17/20 | | | | | (1,922 | ) |
| USD 37,451 | | | | CHF 36,753 | | State Street Bank and Trust Co. | | | 01/17/20 | | | | | (564 | ) |
| USD 70,482 | | | | EUR 63,182 | | State Street Bank and Trust Co. | | | 01/17/20 | | | | | (453 | ) |
| CHF 42,375 | | | | USD 43,269 | | State Street Bank and Trust Co. | | | 01/17/20 | | | | | 561 | |
| USD 262,500 | | | | EUR 235,094 | | State Street Bank and Trust Co. | | | 01/17/20 | | | | | (1,442 | ) |
| EUR 99,426 | | | | USD 110,645 | | State Street Bank and Trust Co. | | | 01/17/20 | | | | | 981 | |
| USD 679,102 | | | | GBP 515,633 | | State Street Bank and Trust Co. | | | 01/17/20 | | | | | (4,194 | ) |
| USD 161,698 | | | | CAD 213,926 | | State Street Bank and Trust Co. | | | 01/17/20 | | | | | (3,056 | ) |
| USD 74,722 | | | | EUR 67,100 | | State Street Bank and Trust Co. | | | 01/17/20 | | | | | (612 | ) |
| USD 127,970 | | | | CAD 168,589 | | State Street Bank and Trust Co. | | | 01/17/20 | | | | | (1,869 | ) |
| CAD 127,505 | | | | USD 96,631 | | State Street Bank and Trust Co. | | | 01/17/20 | | | | | 1,566 | |
| GBP 311,824 | | | | USD 408,881 | | State Street Bank and Trust Co. | | | 01/17/20 | | | | | 4,336 | |
| EUR 97,466 | | | | USD 108,349 | | State Street Bank and Trust Co. | | | 01/17/20 | | | | | 1,077 | |
| USD 2,411,527 | | | | CHF 2,387,267 | | State Street Bank and Trust Co. | | | 01/17/20 | | | | | (57,719 | ) |
| USD 3,955,524 | | | | CAD 5,257,476 | | State Street Bank and Trust Co. | | | 01/17/20 | | | | | (93,510 | ) |
| USD 4,596,132 | | | | EUR 4,139,131 | | State Street Bank and Trust Co. | | | 01/17/20 | | | | | (50,915 | ) |
| USD 10,218,183 | | | | GBP 7,889,246 | | State Street Bank and Trust Co. | | | 01/17/20 | | | | | (236,312 | ) |
| CHF 56,645 | | | | USD 58,587 | | State Street Bank and Trust Co. | | | 01/17/20 | | | | | (234 | ) |
| GBP 226,083 | | | | USD 299,485 | | State Street Bank and Trust Co. | | | 01/17/20 | | | | | (2,351 | ) |
| USD 10,251,509 | | | | GBP 7,917,507 | | The Bank of New York Mellon | | | 01/17/20 | | | | | (240,436 | ) |
| | | | | | | | | | | | | | $ | (702,694 | ) |
| |
| Currency Abbreviations |
| CAD | | — Canadian Dollar |
| USD | | — United States Dollar |
See Accompanying Notes to Financial Statements
63
VY® INVESCO GROWTH
AND INCOME PORTFOLIO | SUMMARY PORTFOLIO OF INVESTMENTS
AS OF DECEMBER 31, 2019 (CONTINUED) |
A summary of derivative instruments by primary risk exposure is outlined in the following tables.
The fair value of derivative instruments as of December 31, 2019 was as follows:
Derivatives not accounted for as
hedging instruments | | | | Location on Statement
of Assets and Liabilities | | Fair Value |
|---|
Asset Derivatives | | | | | | | | | |
| Foreign exchange contracts | | | | Unrealized appreciation on forward foreign currency contracts | | | $ | 8,521 | |
Total Asset Derivatives | | | | | | | $ | 8,521 | |
Liability Derivatives | | | | | | | | | |
| Foreign exchange contracts | | | | Unrealized depreciation on forward foreign currency contracts | | | $ | 711,215 | |
Total Liability Derivatives | | | | | | | $ | 711,215 | |
The effect of derivative instruments on the Fund’s Statement of Operations for the year ended December 31, 2019 was as follows:
| | | Amount of Realized Gain or (Loss) on
Derivatives Recognized in Income |
|---|
| | | | |
|---|
Derivatives not accounted for as hedging instruments
| | | Forward foreign
currency contracts |
|---|
| Foreign exchange contracts | | | | $ | 309,376 | |
Total | | | | $ | 309,376 | |
| | | Change in Unrealized Appreciation or (Depreciation)
on Derivatives Recognized in Income |
|---|
| | | | |
|---|
| Derivatives not accounted for as hedging instruments | | | Forward foreign
currency contracts |
|---|
| Foreign exchange contracts | | | | $ | (645,803 | ) |
Total | | | | $ | (645,803 | ) |
The following is a summary by counterparty of the fair value of OTC derivative instruments subject to Master Netting Agreements and collateral pledged (received), if any, at December 31, 2019:
| | | State Street
Bank and Trust Co. | | The Bank
of New York Mellon | | Totals |
|---|
Assets: | | | | | | | | | | | | | | | | |
| Forward foreign currency contracts | | | | $ | 8,521 | | | | $ | — | | | | $ | 8,521 | |
Total Assets | | | | $ | 8,521 | | | | $ | — | | | | $ | 8,521 | |
Liabilities: | | | | | | | | | | | | | | | | |
| Forward foreign currency contracts | | | | $ | 470,779 | | | | $ | 240,436 | | | | $ | 711,215 | |
Total Liabilities | | | | $ | 470,779 | | | | $ | 240,436 | | | | $ | 711,215 | |
Net OTC derivative instruments by counterparty, at fair value | | | | $ | (462,258 | ) | | | $ | (240,436 | ) | | | | (702,694 | ) |
Total collateral pledged by the Portfolio/(Received from counterparty) | | | | $ | — | | | | $ | — | | | | $ | — | |
Net Exposure(1) | | | | $ | (462,258 | ) | | | $ | (240,436 | ) | | | $ | (702,694 | ) |
(1) | | Positive net exposure represents amounts due from each respective counterparty. Negative exposure represents amounts due from the Portfolio. Please refer to Note 2 for additional details regarding counterparty credit risk and credit related contingent features. |
At December 31, 2019, the aggregate cost of securities and other investments and the composition of unrealized appreciation and depreciation of securities and other investments at year end were:
| | Cost for federal income tax purposes was $372,137,549. |
| Net unrealized appreciation consisted of: | | | | | | |
| Gross Unrealized Appreciation | | | | $ | 89,123,566 | |
| Gross Unrealized Depreciation | | | | | (14,748,242 | ) |
| Net Unrealized Appreciation | | | | $ | 74,375,324 | |
See Accompanying Notes to Financial Statements
64
VY® JPMORGAN EMERGING
MARKETS EQUITY PORTFOLIO | SUMMARY PORTFOLIO OF INVESTMENTS
AS OF DECEMBER 31, 2019 |
| Shares | | | | | | Value | | | Percentage
of Net
Assets |
|---|
| | | | | | | | | | | | | |
|---|
COMMON STOCK: 98.7% |
| | | | | |
| 13,888 | | (1) | | MercadoLibre, Inc. | | $ | 7,943,103 | | | | 1.5 | |
| |
| | | | | |
| 161,935 | | | | Other Securities | | | 825,713 | | | | 0.2 | |
| |
| | | | | |
| 1,332,434 | | | | Ambev SA ADR | | | 6,209,142 | | | | 1.2 | |
| 601,970 | | | | B3 SA — Brasil Bolsa Balcao | | | 6,430,172 | | | | 1.2 | |
| 441,285 | | | | Lojas Renner SA | | | 6,163,971 | | | | 1.2 | |
| 228,461 | | (2) | | Other Securities | | | 7,552,031 | | | | 1.5 | |
| | | | | | | | 26,355,316 | | | | 5.1 | |
| |
| | | | | |
| 134,592 | | (1) | | Alibaba Group Holding Ltd. ADR | | | 28,546,963 | | | | 5.6 | |
| 2,631,300 | | (1),(3) | | Budweiser Brewing Co. APAC Ltd. | | | 8,880,971 | | | | 1.7 | |
| 366,876 | | | | Foshan Haitian Flavouring & Food Co. Ltd. — A Shares | | | 5,672,285 | | | | 1.1 | |
| 149,816 | | | | Huazhu Group Ltd. ADR | | | 6,003,127 | | | | 1.2 | |
| 34,600 | | | | Kweichow Moutai Co. Ltd. — A Shares | | | 5,888,136 | | | | 1.2 | |
| 555,577 | | (1) | | Meituan Dianping- Class B | | | 7,259,255 | | | | 1.4 | |
| 702,200 | | | | Midea Group Co. Ltd. — A Shares | | | 5,887,406 | | | | 1.1 | |
| 21,487 | | | | NetEase, Inc. ADR | | | 6,588,774 | | | | 1.3 | |
| 57,105 | | (1) | | New Oriental Education & Technology Group, Inc. ADR | | | 6,923,981 | | | | 1.4 | |
| 2,796,475 | | | | Ping An Bank Co. Ltd. — A Shares | | | 6,616,675 | | | | 1.3 | |
| 1,106,000 | | | | Ping An Insurance Group Co. of China Ltd. — H Shares | | | 13,087,815 | | | | 2.6 | |
| 366,400 | | | | Shenzhou International Group Holdings Ltd. | | | 5,354,964 | | | | 1.0 | |
| 420,000 | | | | Tencent Holdings Ltd. | | | 20,233,986 | | | | 4.0 | |
| 528,000 | | (1),(3) | | Wuxi Biologics Cayman, Inc. — H Shares | | | 6,687,357 | | | | 1.3 | |
| 131,536 | | | | Yum China Holdings, Inc. | | | 6,315,043 | | | | 1.2 | |
| 1,323,384 | | | | Other Securities | | | 8,863,501 | | | | 1.7 | |
| | | | | | | | 148,810,239 | | | | 29.1 | |
| |
| | | | | |
| 901,337 | | | | Other Securities | | | 4,596,819 | | | | 0.9 | |
| |
| | | | | |
| 2,226,600 | | | | AIA Group Ltd. | | | 23,419,304 | | | | 4.6 | |
| 177,900 | | | | Hong Kong Exchanges and Clearing Ltd. | | | 5,779,567 | | | | 1.1 | |
| 1,328,500 | | | | Techtronic Industries Co., Ltd. | | | 10,842,814 | | | | 2.1 | |
| | | | | | | | 40,041,685 | | | | 7.8 | |
| |
| | | | | |
| 105,128 | | | | OTP Bank Nyrt | | | 5,504,502 | | | | 1.1 | |
| |
| | | | | |
| 335,570 | | | | HDFC Bank Ltd. ADR | | | 21,265,071 | | | | 4.1 | |
| 32,053 | | | | HDFC Bank Ltd. | | | 571,939 | | | | 0.1 | |
| |
| Shares | | | | | | Value | | | Percentage
of Net
Assets |
|---|
| | | | | | | | | | | | | |
|---|
COMMON STOCK: (continued) |
| | | | | |
| 962,710 | | (3) | | HDFC Life Insurance Co., Ltd. | | $ | 8,447,273 | | | | 1.6 | |
| 215,530 | | | | Hindustan Unilever Ltd. | | | 5,808,322 | | | | 1.1 | |
| 724,345 | | | | Housing Development Finance Corp. | | | 24,491,882 | | | | 4.8 | |
| 303,548 | | | | IndusInd Bank Ltd. | | | 6,422,735 | | | | 1.3 | |
| 1,678,098 | | | | ITC Ltd. | | | 5,589,464 | | | | 1.1 | |
| 293,978 | | | | Kotak Mahindra Bank Ltd. | | | 6,938,530 | | | | 1.4 | |
| 64,790 | | | | Maruti Suzuki India Ltd. | | | 6,689,651 | | | | 1.3 | |
| 274,282 | | | | Tata Consultancy Services Ltd. | | | 8,306,679 | | | | 1.6 | |
| 247,390 | | | | Other Securities | | | 7,613,007 | | | | 1.5 | |
| | | | | | | | 102,144,553 | | | | 19.9 | |
| |
| | | | | |
| 2,969,800 | | | | Bank Central Asia Tbk PT | | | 7,142,388 | | | | 1.4 | |
| 18,697,200 | | | | Bank Rakyat Indonesia | | | 5,918,149 | | | | 1.1 | |
| | | | | | | | 13,060,537 | | | | 2.5 | |
| |
| | | | | |
| 1,111,600 | | | | Sands China Ltd. | | | 5,939,357 | | | | 1.2 | |
| |
| | | | | |
| 1,283,124 | | | | Grupo Financiero Banorte | | | 7,163,643 | | | | 1.4 | |
| 1,991,870 | | | | Wal-Mart de Mexico SAB de CV | | | 5,718,297 | | | | 1.1 | |
| 718,335 | | | | Other Securities | | | 5,592,162 | | | | 1.1 | |
| | | | | | | | 18,474,102 | | | | 3.6 | |
| |
| | | | | |
| 51,730 | | | | Copa Holdings S.A. — Class A | | | 5,590,978 | | | | 1.1 | |
| |
| | | | | |
| 20,772 | | | | Other Securities | | | 4,427,136 | | | | 0.9 | |
| |
| | | | | |
| 395,130 | | | | Jeronimo Martins SGPS SA | | | 6,511,492 | | | | 1.3 | |
| |
| | | | | |
| 2,826,059 | | | | Sberbank of Russia PJSC | | | 11,607,025 | | | | 2.3 | |
| |
| | | | | |
| 375,937 | | | | Bid Corp. Ltd. | | | 8,865,172 | | | | 1.7 | |
| 56,301 | | (4) | | Capitec Bank Holdings Ltd. | | | 5,813,322 | | | | 1.2 | |
| 825,987 | | | | Sanlam Ltd. | | | 4,666,727 | | | | 0.9 | |
| 152,435 | | | | Other Securities | | | 1,990,130 | | | | 0.4 | |
| | | | | | | | 21,335,351 | | | | 4.2 | |
| |
| | | | | |
| 12,390 | | | | NCSoft Corp. | | | 5,781,238 | | | | 1.1 | |
| 431,546 | | | | Samsung Electronics Co., Ltd. | | | 20,794,856 | | | | 4.1 | |
| | | | | | | | 26,576,094 | | | | 5.2 | |
| |
| | | | | |
| 283,126 | | | | Other Securities | | | 1,168,709 | | | | 0.2 | |
| |
| | | | | |
| 34,000 | | | | Largan Precision Co. Ltd. | | | 5,679,300 | | | | 1.1 | |
See Accompanying Notes to Financial Statements
65
VY® JPMORGAN EMERGING
MARKETS EQUITY PORTFOLIO | SUMMARY PORTFOLIO OF INVESTMENTS
AS OF DECEMBER 31, 2019 (CONTINUED) |
| Shares | | | | | | Value | | | Percentage
of Net
Assets |
|---|
| | | | | | | | | | | | | |
|---|
COMMON STOCK: (continued) |
| | | | | |
| 455,000 | | | | President Chain Store Corp. | | $ | 4,620,376 | | | | 0.9 | |
| 307,031 | | | | Taiwan Semiconductor Manufacturing Co., Ltd. ADR | | | 17,838,501 | | | | 3.5 | |
| 953,223 | | | | Taiwan Semiconductor Manufacturing Co., Ltd. | | | 10,550,110 | | | | 2.0 | |
| | | | | | | | 38,688,287 | | | | 7.5 | |
| |
| | | | | |
| 580,910 | | | | Other Securities | | | 5,424,562 | | | | 1.1 | |
| |
| | | | | |
| 47,630 | | (1) | | EPAM Systems, Inc. | | | 10,105,181 | | | | 2.0 | |
| |
| | | | | Total Common Stock (Cost $334,560,118) | | | 505,130,741 | | | | 98.7 | |
| |
PREFERRED STOCK: 1.2% |
| | | | | |
| 648,295 | | | | Itau Unibanco Holding S.A. | | | 5,979,005 | | | | 1.2 | |
| |
| | | | | Total Preferred Stock (Cost $3,759,645) | | | 5,979,005 | | | | 1.2 | |
| |
| | | | | Total Long-Term Investments
(Cost $338,319,763) | | | 511,109,746 | | | | 99.9 | |
Principal
Amount† | | | | | | Value | | | Percentage
of Net
Assets |
|---|
| | | | | | | | | | |
|---|
SHORT-TERM INVESTMENTS: 1.1% |
| | | | | Repurchase Agreements: 0.3% |
| 342,970 | | (5) | | Cantor Fitzgerald Securities, Repurchase Agreement dated 12/31/19, 1.58%, due 01/02/20 (Repurchase Amount $343,000, collateralized by various U.S. Government/U.S. Government Agency Obligations, 0.000%–8.500%, Market Value plus accrued interest $349,829, due 01/25/20–10/15/60) | | | 342,970 | | | | 0.1 | |
| |
Principal
Amount† | | | | | | Value | | | Percentage
of Net
Assets |
|---|
| |
SHORT-TERM INVESTMENTS: (continued) |
| | | | | Repurchase Agreements: (continued) |
| 1,000,000 | | (5) | | Millennium Fixed Income Ltd., Repurchase Agreement dated 12/31/19, 1.75%, due 01/02/20 (Repurchase Amount $1,000,096, collateralized by various U.S. Government Securities, 0.125%–2.250%, Market Value plus accrued interest $1,020,000, due 04/15/20–03/31/21) | | $ | 1,000,000 | | | | 0.2 | |
| |
| | | | | Total Repurchase Agreements
(Cost $1,342,970) | | | 1,342,970 | | | | 0.3 | |
| Shares | | | | | | Value | | | Percentage
of Net
Assets |
|---|
| | | | | | | | | | | | | |
|---|
| | | | | |
| 4,328,269 | | (6) | | BlackRock Liquidity Funds, FedFund, Institutional Class, 1.520%
(Cost $4,328,269) | | | 4,328,269 | | | | 0.8 | |
| |
| | | | | Total Short-Term Investments
(Cost $5,671,239) | | | 5,671,239 | | | | 1.1 | |
| |
| | | | | Total Investments in Securities
(Cost $343,991,002) | | $ | 516,780,985 | | | | 101.0 | |
| | | | | Liabilities in Excess of Other Assets | | | (4,876,442 | ) | | | (1.0 | ) |
| | | | | Net Assets | | $ | 511,904,543 | | | | 100.0 | |
“Other Securities” represents issues not identified as the top 50 holdings in terms of market value and issues or issuers not exceeding 1% of net assets individually or in aggregate respectively as of December 31, 2019.
The following footnotes apply to either the individual securities noted or one or more of the securities aggregated and listed as a single line item.
| † | | Unless otherwise indicated, principal amount is shown in USD. |
| ADR | | American Depositary Receipt |
| (1) | | Non-income producing security. |
| (2) | | The grouping contains non-income producing securities. |
| (3) | | Securities with purchases pursuant to Rule 144A or section 4(a)(2), under the Securities Act of 1933 and may not be resold subject to that rule except to qualified institutional buyers. |
| (4) | | Security, or a portion of the security, is on loan. |
| (5) | | All or a portion of the security represents securities purchased with cash collateral received for securities on loan. |
| (6) | | Rate shown is the 7-day yield as of December 31, 2019. |
See Accompanying Notes to Financial Statements
66
VY® JPMORGAN EMERGING
MARKETS EQUITY PORTFOLIO | SUMMARY PORTFOLIO OF INVESTMENTS
AS OF DECEMBER 31, 2019 (CONTINUED) |
| Sector Diversification | | | | Percentage
of Net Assets |
|---|
| Financials | | | | | 37.3 | % |
| Consumer Discretionary | | | | | 19.1 | |
| Consumer Staples | | | | | 15.7 | |
| Information Technology | | | | | 15.1 | |
| Communication Services | | | | | 6.4 | |
| Industrials | | | | | 3.4 | |
| Health Care | | | | | 1.3 | |
| Materials | | | | | 0.8 | |
| Utilities | | | | | 0.6 | % |
| Energy | | | | | 0.2 | |
| Short-Term Investments | | | | | 1.1 | |
| Liabilities in Excess of Other Assets | | | | | (1.0 | ) |
Net Assets | | | | | 100.0 | % |
Fair Value Measurementsˆ
The following is a summary of the fair valuations according to the inputs used as of December 31, 2019 in valuing the assets and liabilities:
| | Quoted Prices
in Active Markets
for Identical
Investments
(Level 1) | | Significant
Other
Observable
Inputs#
(Level 2) | | Significant
Unobservable
Inputs
(Level 3) | | Fair Value
at
December 31, 2019 |
|---|
Asset Table | | | | | | | | | | | | | | | | | | | | |
Investments, at fair value | | | | | | | | | | | | | | | | | | | | |
| Common Stock | | | | | | | | | | | | | | | | | | | | |
| Argentina | | | $ | 7,943,103 | | | | $ | — | | | | $ | — | | | | $ | 7,943,103 | |
| Australia | | | | — | | | | | 825,713 | | | | | — | | | | | 825,713 | |
| Brazil | | | | 26,355,316 | | | | | — | | | | | — | | | | | 26,355,316 | |
| China | | | | 63,258,859 | | | | | 85,551,380 | | | | | — | | | | | 148,810,239 | |
| Egypt | | | | 4,596,819 | | | | | — | | | | | — | | | | | 4,596,819 | |
| Hong Kong | | | | — | | | | | 40,041,685 | | | | | — | | | | | 40,041,685 | |
| Hungary | | | | — | | | | | 5,504,502 | | | | | — | | | | | 5,504,502 | |
| India | | | | 29,571,750 | | | | | 72,572,803 | | | | | — | | | | | 102,144,553 | |
| Indonesia | | | | — | | | | | 13,060,537 | | | | | — | | | | | 13,060,537 | |
| Macau | | | | — | | | | | 5,939,357 | | | | | — | | | | | 5,939,357 | |
| Mexico | | | | 18,474,102 | | | | | — | | | | | — | | | | | 18,474,102 | |
| Panama | | | | 5,590,978 | | | | | — | | | | | — | | | | | 5,590,978 | |
| Peru | | | | 4,427,136 | | | | | — | | | | | — | | | | | 4,427,136 | |
| Portugal | | | | — | | | | | 6,511,492 | | | | | — | | | | | 6,511,492 | |
| Russia | | | | — | | | | | 11,607,025 | | | | | — | | | | | 11,607,025 | |
| South Africa | | | | 5,813,322 | | | | | 15,522,029 | | | | | — | | | | | 21,335,351 | |
| South Korea | | | | — | | | | | 26,576,094 | | | | | — | | | | | 26,576,094 | |
| Spain | | | | 1,168,709 | | | | | — | | | | | — | | | | | 1,168,709 | |
| Taiwan | | | | 17,838,501 | | | | | 20,849,786 | | | | | — | | | | | 38,688,287 | |
| Turkey | | | | 2,880,073 | | | | | 2,544,489 | | | | | — | | | | | 5,424,562 | |
| United States | | | | 10,105,181 | | | | | — | | | | | — | | | | | 10,105,181 | |
| Total Common Stock | | | | 198,023,849 | | | | | 307,106,892 | | | | | — | | | | | 505,130,741 | |
| Preferred Stock | | | | 5,979,005 | | | | | — | | | | | — | | | | | 5,979,005 | |
| Short-Term Investments | | | | 4,328,269 | | | | | 1,342,970 | | | | | — | | | | | 5,671,239 | |
| Total Investments, at fair value | | | $ | 208,331,123 | | | | $ | 308,449,862 | | | | $ | — | | | | $ | 516,780,985 | |
| ˆ | | See Note 2, “Significant Accounting Policies” in the Notes to Financial Statements for additional information. |
| # | | The earlier close of the foreign markets gives rise to the possibility that significant events, including broad market moves, may have occurred in the interim and may materially affect the value of those securities. To account for this, the Portfolio may frequently value many of its foreign equity securities using fair value prices based on third party vendor modeling tools to the extent available. Accordingly, a portion of the Portfolio’s investments are categorized as Level 2 investments. |
At December 31, 2019, the aggregate cost of securities and other investments and the composition of unrealized appreciation and depreciation of securities and other investments at year end were:
| | Cost for federal income tax purposes was $345,086,450. |
| Net unrealized appreciation consisted of: | | | | | | |
| Gross Unrealized Appreciation | | | | $ | 176,159,301 | |
| Gross Unrealized Depreciation | | | | | (4,463,116 | ) |
| Net Unrealized Appreciation | | | | $ | 171,696,185 | |
See Accompanying Notes to Financial Statements
67
VY® MORGAN STANLEY GLOBAL
FRANCHISE PORTFOLIO | PORTFOLIO OF INVESTMENTS
AS OF DECEMBER 31, 2019 |
| Shares | | | | | | Value | | | Percentage
of Net
Assets |
|---|
| | | | | | | | | | | | | |
|---|
COMMON STOCK: 98.4% |
| | | | | |
| 42,146 | | | | L’Oreal S.A. | | $ | 12,462,941 | | | | 3.0 | |
| 62,551 | | | | Pernod Ricard SA | | | 11,192,782 | | | | 2.7 | |
| | | | | | | | 23,655,723 | | | | 5.7 | |
| |
| | | | | |
| 172,821 | | | | SAP SE | | | 23,261,509 | | | | 5.6 | |
| |
| | | | | |
| 402,042 | | | | Davide Campari-Milano SpA | | | 3,673,592 | | | | 0.9 | |
| |
| | | | | |
| 130,632 | | | | Heineken NV | | | 13,942,142 | | | | 3.3 | |
| |
| | | | | |
| 300,349 | | | | British American Tobacco PLC | | | 12,765,543 | | | | 3.1 | |
| 318,728 | | | | Experian PLC | | | 10,804,783 | | | | 2.6 | |
| 380,745 | | | | Reckitt Benckiser Group PLC | | | 30,927,543 | | | | 7.4 | |
| 158,748 | | | | Relx PLC (EUR Exchange) | | | 4,004,089 | | | | 0.9 | |
| 410,486 | | | | Relx PLC (GBP Exchange) | | | 10,362,110 | | | | 2.5 | |
| 137,362 | | | | Unilever PLC | | | 7,863,018 | | | | 1.9 | |
| | | | | | | | 76,727,086 | | | | 18.4 | |
| |
| | | | | |
| 153,042 | | | | Abbott Laboratories | | | 13,293,228 | | | | 3.2 | |
| 95,069 | | | | Accenture PLC | | | 20,018,679 | | | | 4.8 | |
| 103,382 | | | | Automatic Data Processing, Inc. | | | 17,626,631 | | | | 4.2 | |
| 197,100 | | | | Baxter International, Inc. | | | 16,481,502 | | | | 4.0 | |
| 55,908 | | | | Becton Dickinson & Co. | | | 15,205,299 | | | | 3.7 | |
| 67,571 | | | | Church & Dwight Co., Inc. | | | 4,752,944 | | | | 1.1 | |
| 263,502 | | | | Coca-Cola Co. | | | 14,584,836 | | | | 3.5 | |
| 102,682 | | | | Danaher Corp. | | | 15,759,634 | | | | 3.8 | |
| 18,883 | | | | Factset Research Systems, Inc. | | | 5,066,309 | | | | 1.2 | |
| 68,190 | | | | Fidelity National Information Services, Inc. | | | 9,484,547 | | | | 2.3 | |
| 89,104 | | | | Fox Corp. — Class A | | | 3,303,085 | | | | 0.8 | |
| 74,410 | | | | Fox Corp. — Class B | | | 2,708,524 | | | | 0.6 | |
| 220,216 | | | | Microsoft Corp. | | | 34,728,063 | | | | 8.3 | |
| 26,228 | | | | Moody’s Corp. | | | 6,226,790 | | | | 1.5 | |
| 85,855 | | | | Nike, Inc. | | | 8,697,970 | | | | 2.1 | |
| 384,516 | | | | Philip Morris International, Inc. | | | 32,718,467 | | | | 7.9 | |
| 45,675 | | | | Thermo Fisher Scientific, Inc. | | | 14,838,437 | | | | 3.6 | |
| 119,589 | | | | Visa, Inc. — Class A | | | 22,470,773 | | | | 5.4 | |
| 78,921 | | | | Zoetis, Inc. | | | 10,445,194 | | | | 2.5 | |
| | | | | | | | 268,410,912 | | | | 64.5 | |
| |
| | | | | Total Common Stock
(Cost $296,563,351) | | | 409,670,964 | | | | 98.4 | |
| |
| Shares | | | | | | Value | | | Percentage
of Net
Assets |
|---|
| | | | | | | | | | | | | |
|---|
SHORT-TERM INVESTMENTS: 1.8% |
| | | | | |
| 7,383,153 | | (1) | | BlackRock Liquidity Funds, FedFund, Institutional Class, 1.520%
(Cost $7,383,153) | | $ | 7,383,153 | | | | 1.8 | |
| |
| | | | | Total Short-Term Investments
(Cost $7,383,153) | | | 7,383,153 | | | | 1.8 | |
| | | | | Total Investments in Securities
(Cost $303,946,504) | | $ | 417,054,117 | | | | 100.2 | |
| | | | | Liabilities in Excess of Other Assets | | | (805,575 | ) | | | (0.2 | ) |
| | | | | Net Assets | | $ | 416,248,542 | | | | 100.0 | |
| (1) | | Rate shown is the 7-day yield as of December 31, 2019. |
| Sector Diversification | | | | Percentage
of Net Assets |
|---|
| Consumer Staples | | | | | 34.8 | % |
| Information Technology | | | | | 30.7 | |
| Health Care | | | | | 20.7 | |
| Industrials | | | | | 6.0 | |
| Financials | | | | | 2.7 | |
| Consumer Discretionary | | | | | 2.1 | |
| Communication Services | | | | | 1.4 | |
| Short-Term Investments | | | | | 1.8 | |
| Liabilities in Excess of Other Assets | | | | | (0.2 | ) |
Net Assets | | | | | 100.0 | % |
See Accompanying Notes to Financial Statements
68
VY® MORGAN STANLEY GLOBAL
AND INCOME PORTFOLIO | PORTFOLIO OF INVESTMENTS
AS OF DECEMBER 31, 2019 (CONTINUED) |
Fair Value Measurementsˆ
The following is a summary of the fair valuations according to the inputs used as of December 31, 2019 in valuing the assets and liabilities:
| | Quoted Prices
in Active Markets
for Identical
Investments
(Level 1) | | Significant
Other
Observable
Inputs#
(Level 2) | | Significant
Unobservable
Inputs
(Level 3) | | Fair Value
at
December 31, 2019 |
|---|
Asset Table | | | | | | | | | | | | | | | | | | | | |
Investments, at fair value | | | | | | | | | | | | | | | | | | | | |
| Common Stock | | | | | | | | | | | | | | | | | | | | |
| France | | | $ | — | | | | $ | 23,655,723 | | | | $ | — | | | | $ | 23,655,723 | |
| Germany | | | | — | | | | | 23,261,509 | | | | | — | | | | | 23,261,509 | |
| Italy | | | | — | | | | | 3,673,592 | | | | | — | | | | | 3,673,592 | |
| Netherlands | | | | — | | | | | 13,942,142 | | | | | — | | | | | 13,942,142 | |
| United Kingdom | | | | — | | | | | 76,727,086 | | | | | — | | | | | 76,727,086 | |
| United States | | | | 268,410,912 | | | | | — | | | | | — | | | | | 268,410,912 | |
| Total Common Stock | | | | 268,410,912 | | | | | 141,260,052 | | | | | — | | | | | 409,670,964 | |
| Short-Term Investments | | | | 7,383,153 | | | | | — | | | | | — | | | | | 7,383,153 | |
| Total Investments, at fair value | | | $ | 275,794,065 | | | | $ | 141,260,052 | | | | $ | — | | | | $ | 417,054,117 | |
| ˆ | | See Note 2, “Significant Accounting Policies” in the Notes to Financial Statements for additional information. |
| # | | The earlier close of the foreign markets gives rise to the possibility that significant events, including broad market moves, may have occurred in the interim and may materially affect the value of those securities. To account for this, the Portfolio may frequently value many of its foreign equity securities using fair value prices based on third party vendor modeling tools to the extent available. Accordingly, a portion of the Portfolio’s investments are categorized as Level 2 investments. |
At December 31, 2019, the aggregate cost of securities and other investments and the composition of unrealized appreciation and depreciation of securities and other investments at year end were:
| | Cost for federal income tax purposes was $304,496,350. |
| Net unrealized appreciation consisted of: | | | | | | |
| Gross Unrealized Appreciation | | | | $ | 120,960,671 | |
| Gross Unrealized Depreciation | | | | | (8,399,787 | ) |
| Net Unrealized Appreciation | | | | $ | 112,560,884 | |
See Accompanying Notes to Financial Statements
69
VY® T. ROWE PRICE
CAPITAL APPRECIATION PORTFOLIO | SUMMARY PORTFOLIO OF INVESTMENTS
AS OF DECEMBER 31, 2019 |
| Shares | | | | | | Value | | | Percentage
of Net
Assets |
|---|
| | | | | | | | | | | | | |
|---|
COMMON STOCK: 63.3% |
| | | | Communication Services: 3.9% |
| | | | | | | | | | | | | |
| 11,332 | | (1),(2) | | Alphabet, Inc. — Class A | | $ | 15,177,967 | | | | 0.2 | |
| 128,385 | | (2) | | Alphabet, Inc. — Class C | | | 171,653,313 | | | | 2.3 | |
| 507,900 | | (2) | | Facebook, Inc. — Class A | | | 104,246,475 | | | | 1.4 | |
| | | | | | | | 291,077,755 | | | | 3.9 | |
| |
| | | | Consumer Discretionary: 5.5% |
| 84,100 | | (2) | | Amazon.com, Inc. | | | 155,403,344 | | | | 2.1 | |
| 464,743 | | | | Aptiv PLC | | | 44,136,643 | | | | 0.6 | |
| 900,440 | | | | Hilton Worldwide Holdings, Inc. | | | 99,867,800 | | | | 1.3 | |
| 875,061 | | (1) | | Yum! Brands, Inc. | | | 88,144,895 | | | | 1.2 | |
| 115,300 | | | | Other Securities | | | 22,784,433 | | | | 0.3 | |
| | | | | | | | 410,337,115 | | | | 5.5 | |
| |
| | | | |
| 2,910,056 | | (3) | | Keurig Dr Pepper, Inc. | | | 84,246,121 | | | | 1.1 | |
| |
| | | | |
| 233,600 | | (4) | | Other Securities | | | 20,456,352 | | | | 0.3 | |
| |
| | | | |
| 879,037 | | | | Intercontinental Exchange, Inc. | | | 81,354,874 | | | | 1.1 | |
| 2,023,333 | | | | Marsh & McLennan Cos., Inc. | | | 225,419,530 | | | | 3.0 | |
| 381,144 | | | | S&P Global, Inc. | | | 104,071,369 | | | | 1.4 | |
| 126,900 | | | | Other Securities | | | 20,257,047 | | | | 0.3 | |
| | | | | | | | 431,102,820 | | | | 5.8 | |
| |
| | | | |
| 2,594,734 | | (2) | | Alcon, Inc. | | | 146,969,924 | | | | 2.0 | |
| 1,591,430 | | (2) | | Avantor, Inc. | | | 28,884,454 | | | | 0.4 | |
| 676,778 | | (1) | | Becton Dickinson & Co. | | | 184,063,313 | | | | 2.5 | |
| 1,262,599 | | | | Danaher Corp. | | | 193,783,695 | | | | 2.6 | |
| 1,566,765 | | (2) | | Envista Holdings Corp. | | | 46,438,915 | | | | 0.6 | |
| 2,431,580 | | (3) | | PerkinElmer, Inc. | | | 236,106,418 | | | | 3.1 | |
| 525,521 | | | | Thermo Fisher Scientific, Inc. | | | 170,726,007 | | | | 2.3 | |
| 248,100 | | (1) | | UnitedHealth Group, Inc. | | | 72,936,438 | | | | 1.0 | |
| | | | | | | | 1,079,909,164 | | | | 14.5 | |
| |
| | | | |
| 2,026,569 | | | | Fortive Corp. | | | 154,809,606 | | | | 2.1 | |
| 23,741,116 | | | | General Electric Co. | | | 264,950,854 | | | | 3.6 | |
| 453,216 | | | | Roper Technologies, Inc. | | | 160,542,704 | | | | 2.1 | |
| 810,662 | | | | Waste Connections, Inc. | | | 73,600,003 | | | | 1.0 | |
| | | | | | | | 653,903,167 | | | | 8.8 | |
| |
| | | | Information Technology: 16.9% |
| 2,036,793 | | (2) | | Fiserv, Inc. | | | 235,514,375 | | | | 3.2 | |
| 681,360 | | | | Global Payments, Inc. | | | 124,389,082 | | | | 1.7 | |
| 1,453,199 | | | | Maxim Integrated Products | | | 89,386,270 | | | | 1.2 | |
| 1,978,300 | | | | Microsoft Corp. | | | 311,977,910 | | | | 4.2 | |
| 729,324 | | | | NXP Semiconductor NV — NXPI — US | | | 92,813,772 | | | | 1.2 | |
| 457,998 | | | | TE Connectivity Ltd. | | | 43,894,528 | | | | 0.6 | |
| 705,400 | | (1) | | Texas Instruments, Inc. | | | 90,495,766 | | | | 1.2 | |
| 1,442,775 | | (1),(3) | | Visa, Inc. — Class A | | | 271,097,423 | | | | 3.6 | |
| | | | | | | | 1,259,569,126 | | | | 16.9 | |
| |
| Shares | | | | | | Value | | | Percentage
of Net
Assets |
|---|
| | | | | | | | | | | | | |
|---|
COMMON STOCK: (continued) |
| | | | |
| 32,100 | | | | Other Securities | | $ | 7,377,222 | | | | 0.1 | |
| |
| | | | |
| 1,489,743 | | | | American Electric Power Co., Inc. | | | 140,795,611 | | | | 1.9 | |
| 436,287 | | (3) | | American Water Works Co., Inc. | | | 53,597,858 | | | | 0.7 | |
| 392,101 | | (3) | | Eversource Energy | | | 33,356,032 | | | | 0.5 | |
| 188,311 | | | | NextEra Energy, Inc. | | | 45,601,392 | | | | 0.6 | |
| 3,122,729 | | | | NiSource, Inc. | | | 86,936,775 | | | | 1.2 | |
| 1,794,116 | | | | Xcel Energy, Inc. | | | 113,908,425 | | | | 1.5 | |
| | | | | | | | 474,196,093 | | | | 6.4 | |
| |
| | | | | Total Common Stock
(Cost $3,626,169,992) | | | 4,712,174,935 | | | | 63.3 | |
PREFERRED STOCK: 5.3% |
| | | | Consumer Discretionary: 0.1% |
| 576,340 | | (2),
(5),(6) | | Aurora Innovation, Inc., — Series B | | | 5,325,555 | | | | 0.1 | |
| |
| | | | |
| 62,289 | | (2) | | Wells Fargo & Co. | | | 90,319,050 | | | | 1.2 | |
| 1,239,000 | | (4),(7) | | Other Securities | | | 33,580,920 | | | | 0.4 | |
| | | | | | | | 123,899,970 | | | | 1.6 | |
| |
| | | | |
| 982,882 | | (2),(3) | | Avantor, Inc. | | | 61,921,566 | | | | 0.8 | |
| 951,470 | | (2) | | Becton Dickinson and Co. | | | 62,283,226 | | | | 0.9 | |
| | | | | | | | 124,204,792 | | | | 1.7 | |
| |
| | | | |
| 17,812 | | (2),(3) | | Fortive Corp. | | | 17,326,801 | | | | 0.2 | |
| |
| | | | |
| 1,850,000 | | (2),
(3),(8) | | CMS Energy Corp. | | | 50,091,500 | | | | 0.7 | |
| 2,613,523 | | (4),(7) | | Other Securities | | | 73,939,865 | | | | 1.0 | |
| | | | | | | | 124,031,365 | | | | 1.7 | |
| |
| | | | | Total Preferred Stock
(Cost $346,867,456) | | | 394,788,483 | | | | 5.3 | |
Principal
Amount† | | | | | | Value | | | Percentage
of Net
Assets |
|---|
| | | | | | | | | | |
|---|
CORPORATE BONDS/NOTES: 16.4% |
| | | | |
| 8,975,000 | | (3),(9) | | CCO Holdings LLC / CCO Holdings Capital Corp., 4.000%, 03/01/2023 | | | 9,120,754 | | | | 0.1 | |
| 12,375,000 | | (9) | | CCO Holdings LLC / CCO Holdings Capital Corp., 5.125%, 05/01/2023 | | | 12,656,098 | | | | 0.2 | |
| 28,235,000 | | (9) | | CCO Holdings LLC / CCO Holdings Capital Corp., 5.125%, 05/01/2027 | | | 29,840,160 | | | | 0.4 | |
| 38,178,000 | | (9) | | CCO Holdings LLC / CCO Holdings Capital Corp., 5.000%, 02/01/2028 | | | 40,131,568 | | | | 0.6 | |
| 9,901,000 | | (9) | | CCO Holdings LLC / CCO Holdings Capital Corp., 5.875%, 04/01/2024 | | | 10,255,802 | | | | 0.1 | |
See Accompanying Notes to Financial Statements
70
VY® T. ROWE PRICE
CAPITAL APPRECIATION PORTFOLIO | SUMMARY PORTFOLIO OF INVESTMENTS
AS OF DECEMBER 31, 2019 (CONTINUED) |
Principal
Amount† | | | | | | Value | | | Percentage
of Net
Assets |
|---|
| |
CORPORATE BONDS/NOTES: (continued) |
| Communications: (continued) |
| 21,424,000 | | (3) | | CCO Holdings LLC / CCO Holdings Capital Corp., 5.125%–5.750%,
09/30/2022–01/15/2024 | | $ | 21,765,843 | | | | 0.3 | |
| 5,540,000 | | | | Comcast Corp., 2.239%, (US0003M + 0.330%), 10/01/2020 | | | 5,550,258 | | | | 0.1 | |
| 4,375,000 | | | | Comcast Corp., 2.349%, (US0003M + 0.440%), 10/01/2021 | | | 4,397,661 | | | | 0.0 | |
| 48,465,000 | | | | Netflix, Inc., 4.875%,
04/15/2028 | | | 50,462,970 | | | | 0.7 | |
| 48,940,000 | | (3) | | Netflix, Inc., 5.875%,
11/15/2028 | | | 54,343,465 | | | | 0.7 | |
| 30,475,000 | | (3) | | Netflix, Inc., 6.375%,
05/15/2029 | | | 34,759,785 | | | | 0.5 | |
| 45,780,000 | | (3) | | Netflix, Inc., 4.375%–5.875%, 02/01/2021–11/15/2026 | | | 48,258,415 | | | | 0.6 | |
| 7,870,000 | | (9) | | Sirius XM Radio, Inc., 3.875%, 08/01/2022 | | | 8,056,858 | | | | 0.1 | |
| 6,510,000 | | (3),(9) | | Sirius XM Radio, Inc., 4.625%, 05/15/2023 | | | 6,621,223 | | | | 0.1 | |
| 7,275,000 | | (3) | | Verizon Communications, Inc., 2.894%, (US0003M + 1.000%), 03/16/2022 | | | 7,398,895 | | | | 0.1 | |
| 11,207,000 | | (9) | | Zayo Group LLC / Zayo Capital, Inc.,
5.750%, 01/15/2027 | | | 11,421,026 | | | | 0.2 | |
| 22,421,000 | | | | Other Securities | | | 22,953,915 | | | | 0.3 | |
| | | | | | | | 377,994,696 | | | | 5.1 | |
| |
| |
| 2,090,000 | | | | Dollar Tree, Inc., 2.702%, (US0003M + 0.700%), 04/17/2020 | | | 2,090,401 | | | | 0.0 | |
| 3,715,000 | | | | Home Depot, Inc./The, 2.217%, (US0003M + 0.310%), 03/01/2022 | | | 3,724,488 | | | | 0.0 | |
| 27,235,000 | | (3),(9) | | KFC Holding Co/Pizza Hut Holdings LLC/Taco Bell of America LLC, 4.750%, 06/01/2027 | | | 28,728,091 | | | | 0.4 | |
| 9,980,000 | | (9) | | KFC Holding Co/Pizza Hut Holdings LLC/Taco Bell of America LLC, 5.000%, 06/01/2024 | | | 10,362,583 | | | | 0.1 | |
| 18,800,000 | | (9) | | KFC Holding Co/Pizza Hut Holdings LLC/Taco Bell of America LLC, 5.250%, 06/01/2026 | | | 19,881,470 | | | | 0.3 | |
| 2,340,000 | | | | Marriott International, Inc./MD, 2.535%, (US0003M + 0.650%), 03/08/2021 | | | 2,349,168 | | | | 0.0 | |
| 2,895,000 | | (3),(9) | | Six Flags Entertainment Corp., 4.875%, 07/31/2024 | | | 3,005,980 | | | | 0.1 | |
| 1,050,000 | | (3),(9) | | Six Flags Entertainment Corp., 5.500%, 04/15/2027 | | | 1,121,505 | | | | 0.0 | |
| 61,505,000 | | (3) | | Yum! Brands, Inc., 3.750%-6.875%, 11/01/2020-11/01/2043 | | | 63,295,609 | | | | 0.9 | |
| 37,447,219 | | (4) | | Other Securities | | | 39,188,471 | | | | 0.5 | |
| | | | | | | | 173,747,766 | | | | 2.3 | |
| |
Principal
Amount† | | | | | | Value | | | Percentage
of Net
Assets |
|---|
| |
CORPORATE BONDS/NOTES: (continued) |
| Consumer, Non-cyclical: 4.0% |
| 15,900,000 | | (9) | | Avantor, Inc., 6.000%, 10/01/2024 | | $ | 16,986,208 | | | | 0.2 | |
| 65,084,000 | | (9) | | Avantor, Inc., 9.000%, 10/01/2025 | | | 72,869,023 | | | | 1.0 | |
| 6,185,000 | | (3) | | Becton Dickinson and Co., 2.917%, (US0003M + 1.030%), 06/06/2022 | | | 6,232,572 | | | | 0.1 | |
| 23,355,000 | | | | Becton Dickinson and Co., 2.894%–3.363%,
06/06/2022–06/06/2024 | | | 23,980,768 | | | | 0.3 | |
| 11,120,000 | | (9) | | Bristol-Myers Squibb Co., 2.104%, (US0003M + 0.200%), 11/16/2020 | | | 11,128,023 | | | | 0.2 | |
| 17,005,000 | | (3),(9) | | Bristol-Myers Squibb Co., 2.550%, 05/14/2021 | | | 17,173,732 | | | | 0.2 | |
| 2,790,000 | | | | Conagra Brands, Inc., 2.703%, (US0003M + 0.750%), 10/22/2020 | | | 2,790,287 | | | | 0.0 | |
| 1,297,000 | | (9) | | Fresenius Medical Care US Finance, Inc., 5.750%, 02/15/2021 | | | 1,345,475 | | | | 0.0 | |
| 7,545,000 | | (3),(9) | | Hologic, Inc., 4.375%, 10/15/2025 | | | 7,805,944 | | | | 0.1 | |
| 1,565,000 | | (9) | | Korn Ferry, 4.625%,
12/15/2027 | | | 1,576,738 | | | | 0.0 | |
| 23,365,000 | | (9) | | Nestle Holdings, Inc., 3.100%, 09/24/2021 | | | 23,888,728 | | | | 0.3 | |
| 3,890,000 | | | | Philip Morris International, Inc., 2.315%, (US0003M + 0.420%), 02/21/2020 | | | 3,891,955 | | | | 0.1 | |
| 11,975,000 | | (9) | | Reckitt Benckiser Treasury Services PLC,
2.375%, 06/24/2022 | | | 12,062,206 | | | | 0.2 | |
| 7,945,000 | | (9) | | Reckitt Benckiser Treasury Services PLC, 2.495%, (US0003M + 0.560%), 06/24/2022 | | | 7,965,456 | | | | 0.1 | |
| 9,125,000 | | (3),(9) | | Refinitiv US Holdings, Inc., 6.250%, 05/15/2026 | | | 9,974,537 | | | | 0.1 | |
| 11,970,000 | | (9) | | Refinitiv US Holdings, Inc., 8.250%, 11/15/2026 | | | 13,503,357 | | | | 0.2 | |
| 62,095,000 | | (4) | | Other Securities | | | 64,008,954 | | | | 0.9 | |
| | | | | | | | 297,183,963 | | | | 4.0 | |
| |
| |
| 10,335,000 | | | | Shell International Finance BV, 2.351%, (US0003M + 0.450%), 05/11/2020 | | | 10,352,037 | | | | 0.2 | |
| 9,415,000 | | | | Other Securities | | | 9,648,076 | | | | 0.1 | |
| | | | | | | | 20,000,113 | | | | 0.3 | |
| |
| |
| 33,232,000 | | | | Crown Castle International Corp., 4.875%–5.250%, 04/15/2022–01/15/2023 | | | 35,763,971 | | | | 0.5 | |
| 33,220,000 | | | | SBA Communications Corp., 4.000%–4.875%, 07/15/2022–09/01/2024 | | | 33,903,582 | | | | 0.4 | |
| 49,910,000 | | (4) | | Other Securities | | | 51,856,387 | | | | 0.7 | |
| | | | | | | | 121,523,940 | | | | 1.6 | |
See Accompanying Notes to Financial Statements
71
VY® T. ROWE PRICE
CAPITAL APPRECIATION PORTFOLIO | SUMMARY PORTFOLIO OF INVESTMENTS
AS OF DECEMBER 31, 2019 (CONTINUED) |
Principal
Amount† | | | | | | Value | | | Percentage
of Net
Assets |
|---|
| |
CORPORATE BONDS/NOTES: (continued) |
| |
| 275,000 | | (9) | | Moog, Inc., 5.250%,
12/01/2022 | | $ | 279,455 | | | | 0.0 | |
| 6,845,000 | | (9) | | Reynolds Group Issuer, Inc. / Reynolds Group Issuer LLC / Reynolds Group Issuer Lu, 5.125%, 07/15/2023 | | | 7,021,841 | | | | 0.1 | |
| 8,525,000 | | (3),(9) | | Reynolds Group Issuer, Inc. / Reynolds Group Issuer LLC / Reynolds Group Issuer Lu, 5.501%, (US0003M + 3.500%), 07/15/2021 | | | 8,554,837 | | | | 0.1 | |
| 25,899,403 | | | | Reynolds Group Issuer, Inc., 5.750%, 10/15/2020 | | | 25,964,151 | | | | 0.4 | |
| 4,220,000 | | (9) | | Sensata Technologies BV, 4.875%, 10/15/2023 | | | 4,504,808 | | | | 0.0 | |
| 5,100,000 | | (3),(9) | | Sensata Technologies BV, 5.000%, 10/01/2025 | | | 5,550,509 | | | | 0.1 | |
| 1,430,000 | | (9) | | Sensata Technologies BV, 5.625%, 11/01/2024 | | | 1,595,043 | | | | 0.0 | |
| 57,385,000 | | (4) | | Other Securities | | | 57,773,320 | | | | 0.8 | |
| | | | | | | | 111,243,964 | | | | 1.5 | |
| |
| |
| 2,840,000 | | (3),(9) | | Sensata Technologies UK Financing Co. PLC, 6.250%, 02/15/2026 | | | 3,065,354 | | | | 0.0 | |
| 47,166,000 | | (9) | | Solera LLC / Solera Finance, Inc., 10.500%, 03/01/2024 | | | 50,144,297 | | | | 0.7 | |
| 10,840,000 | | | | Other Securities | | | 11,082,270 | | | | 0.2 | |
| | | | | | | | 64,291,921 | | | | 0.9 | |
| |
| |
| 6,300,000 | | | | Eversource Energy, 2.750%–3.800%,
03/15/2022–12/01/2023 | | | 6,472,051 | | | | 0.1 | |
| 45,012,000 | | (4) | | Other Securities | | | 46,826,035 | | | | 0.6 | |
| | | | | | | | 53,298,086 | | | | 0.7 | |
| | | | | Total Corporate Bonds/Notes
(Cost $1,170,337,078) | | | 1,219,284,449 | | | | 16.4 | |
| |
BANK LOANS: 4.6% |
| |
| 3,160,354 | | | | H.B. Fuller Co. 1st Lien Term Loan B, 3.765%, (US0001M + 2.000%), 10/20/2024 | | | 3,173,191 | | | | 0.0 | |
| |
| |
| 3,949,239 | | | | Zayo Group LLC — TL B1 1L, 3.799%, (US0001M + 2.000%), 01/19/2021 | | | 3,962,287 | | | | 0.0 | |
| 6,850,000 | | | | Zayo Group LLC TL B2 1L, 4.049%, (US0001M + 2.250%), 01/19/2024 | | | 6,879,016 | | | | 0.1 | |
| | | | | | | | 10,841,303 | | | | 0.1 | |
| |
| |
| 6,850,000 | | | | Formula One TL B3 1L, 4.299%, (US0003M + 2.500%), 02/01/2024 | | | 6,893,881 | | | | 0.1 | |
| |
Principal
Amount† | | | | | | Value | | | Percentage
of Net
Assets |
|---|
| |
BANK LOANS: (continued) |
| Consumer, Non-cyclical: 1.8% |
| 1,377,740 | | | | Gartner, Inc. — TL A 1L, 3.935%, (US0003M + 2.000%), 03/20/2022 | | $ | 1,384,628 | | | | 0.0 | |
| 15,225,000 | | | | NVA Holdings Inc. — TL A-3 1L, 4.158%, (US0003M + 2.250%), 09/19/2022 | | | 15,244,031 | | | | 0.2 | |
| 7,781,177 | | | | NVA Holdings Inc. — TL B3 1L, 6.500%, (US0001M + 2.750%), 02/02/2025 | | | 7,784,219 | | | | 0.1 | |
| 398,211 | | | | Prestige Brands, Inc. Term Loan B4, 3.799%, (US0001M + 2.000%), 01/26/2024 | | | 401,509 | | | | 0.0 | |
| 83,188,644 | | | | Refinitiv — TL B 1L, 4.952%, (US0001M + 3.750%), 10/01/2025 | | | 84,007,553 | | | | 1.2 | |
| 23,860,000 | | | | Sunshine Luxembourg VII Sarl — TL B 1L, 6.349%, (US0003M + 4.250%), 07/17/2026 | | | 24,117,784 | | | | 0.3 | |
| | | | | | | | 132,939,724 | | | | 1.8 | |
| |
| |
| 2,060,000 | | | | AmWINS Group, Inc. — TL B 1L, 4.658%, (US0003M + 2.750%), 01/25/2024 | | | 2,078,798 | | | | 0.0 | |
| 16,130,000 | | | | HUB International Ltd. — TL B 1L, 5.785%, (US0001M + 4.000%), 04/25/2025 | | | 16,306,430 | | | | 0.2 | |
| 50,286,973 | | | | HUB International Ltd. TL B 1L, 4.690%, (US0001M + 3.000%), 04/25/2025 | | | 50,330,169 | | | | 0.7 | |
| 374,043 | | | | USI, Inc. — TL B 1L, 4.945%, (US0003M + 3.000%), 05/16/2024 | | | 374,464 | | | | 0.0 | |
| | | | | | | | 69,089,861 | | | | 0.9 | |
| |
| |
| 7,206,938 | | | | Emerald TopCo Inc Term Loan, 5.299%, (US0001M + 3.500%), 07/24/2026 | | | 7,260,089 | | | | 0.1 | |
| |
| |
| 32,843,510 | | | | Cypress Intermediate Holdings III Inc TL B 1L, 4.550%, (US0001M + 3.000%), 04/29/2024 | | | 33,048,782 | | | | 0.5 | |
| 80,131,996 | | | | Kronos Inc./MA — TL B 1L, 4.909%, (US0003M + 3.000%), 11/01/2023 | | | 80,632,821 | | | | 1.1 | |
| 2,867,813 | | | | Ultimate Software Group, Inc. — TL 1L, 5.549%, (US0003M + 3.750%), 05/04/2026 | | | 2,886,932 | | | | 0.0 | |
| | | | | | | | 116,568,535 | | | | 1.6 | |
| | | | | Total Bank Loans
(Cost $343,338,837) | | | 346,766,584 | | | | 4.6 | |
| |
ASSET-BACKED SECURITIES: 0.3% |
| Other Asset-Backed Securities: 0.3% |
| 8,009,540 | | (9) | | Domino’s Pizza Master Issuer LLC 2017-1A A23, 4.118%, 07/25/2047 | | | 8,308,959 | | | | 0.1 | |
See Accompanying Notes to Financial Statements
72
VY® T. ROWE PRICE
CAPITAL APPRECIATION PORTFOLIO | SUMMARY PORTFOLIO OF INVESTMENTS
AS OF DECEMBER 31, 2019 (CONTINUED) |
Principal
Amount† | | | | | | Value | | | Percentage
of Net
Assets |
|---|
| |
ASSET-BACKED SECURITIES: (continued) |
| Other Asset-Backed Securities: (continued) |
| 7,495,125 | | (9) | | Domino’s Pizza Master Issuer LLC 2018-1A A2I, 4.116%, 07/25/2048 | | $ | 7,721,704 | | | | 0.1 | |
| 3,710,000 | | (9) | | Domino’s Pizza Master Issuer LLC 2019-1A A2, 3.668%, 10/25/2049 | | | 3,715,268 | | | | 0.0 | |
| 5,063,660 | | (9) | | Wendys Funding LLC 2018-1A A2I, 3.573%, 03/15/2048 | | | 5,122,905 | | | | 0.1 | |
| | | | | Total Asset-Backed Securities
(Cost $24,071,953) | | | 24,868,836 | | | | 0.3 | |
| | | | | Total Long-Term Investments
(Cost $5,510,785,316) | | | 6,697,883,287 | | | | 89.9 | |
| |
SHORT-TERM INVESTMENTS: 14.4% |
| |
| 2,200,000 | | (10) | | Australia & New Zealand Banking, 1.830%,
03/13/2020 | | | 2,191,805 | | | | 0.1 | |
| 1,875,000 | | (10) | | Banco Santander S.A., 1.950%, 02/05/2020 | | | 1,871,629 | | | | 0.0 | |
| 950,000 | | (10) | | DBS Bank Ltd., 1.710%, 01/07/2020 | | | 949,701 | | | | 0.0 | |
| 2,775,000 | | (10) | | DBS Bank Ltd., 1.820%, 02/18/2020 | | | 2,768,246 | | | | 0.1 | |
| 1,525,000 | | (10) | | Le Mouvement Des Caisses Desjardins, 1.850%,
02/10/2020 | | | 1,522,010 | | | | 0.0 | |
| 975,000 | | (10) | | Matchpoint Finance PLC, 1.850%, 02/03/2020 | | | 973,347 | | | | 0.0 | |
| 1,875,000 | | (10) | | Nederlandse Waterschapsbank, 1.870%, 02/12/2020 | | | 1,871,134 | | | | 0.0 | |
| 2,122,000 | | (10) | | Societe Generale, 1.970%, 01/09/2020 | | | 2,121,045 | | | | 0.0 | |
| | | | | Total Commercial Paper
(Cost $14,268,917) | | | 14,268,917 | | | | 0.2 | |
| |
| Floating Rate Notes: 0.8% |
| 2,775,000 | | (10) | | Australia & New Zealand Banking Group Ltd., 1.940%, 05/20/2020 | | | 2,774,877 | | | | 0.0 | |
| 275,000 | | (10) | | BNP Paribas, 1.950%, 05/14/2020 | | | 275,020 | | | | 0.0 | |
| 2,375,000 | | (10) | | Canadian Imperial Bank of Commerce, 1.990%,
04/10/2020 | | | 2,377,417 | | | | 0.0 | |
| 2,150,000 | | (10) | | Commonwealth Bank of Australia, 1.920%,
01/24/2020 | | | 2,150,274 | | | | 0.1 | |
| 1,275,000 | | (10) | | Commonwealth Bank of Australia, 1.940%,
06/10/2020 | | | 1,274,997 | | | | 0.0 | |
| 1,700,000 | | (10) | | Coöperatieve Rabobank U.A., 1.980%, 04/20/2020 | | | 1,700,475 | | | | 0.0 | |
| |
Principal
Amount† | | | | | | Value | | | Percentage
of Net
Assets |
|---|
| |
SHORT-TERM INVESTMENTS: (continued) |
| Floating Rate Notes: (continued) |
| 2,400,000 | | (10) | | Credit Suisse Group AG, 1.890%, 04/17/2020 | | $ | 2,401,074 | | | | 0.0 | |
| 3,725,000 | | (10) | | HSBC Bank PLC, 1.970%, 06/03/2020 | | | 3,724,989 | | | | 0.1 | |
| 1,850,000 | | (10) | | Lloyds Bank PLC, 1.960%, 01/24/2020 | | | 1,850,270 | | | | 0.0 | |
| 1,825,000 | | (10) | | Mitsubishi UFJ Financial Group, Inc., 1.960%,
01/23/2020 | | | 1,825,265 | | | | 0.0 | |
| 2,700,000 | | (10) | | Mitsubishi UFJ Financial Group, Inc., 1.970%,
03/18/2020 | | | 2,700,514 | | | | 0.1 | |
| 1,425,000 | | (10) | | Mitsubishi UFJ Financial Group, Inc., 1.980%,
05/26/2020 | | | 1,425,109 | | | | 0.0 | |
| 3,000,000 | | (10) | | Mizuho Financial Group Inc., 2.010%, 05/22/2020 | | | 3,000,141 | | | | 0.1 | |
| 2,300,000 | | (10) | | Mizuho Financial Group Inc., 2.020%, 05/26/2020 | | | 2,300,198 | | | | 0.0 | |
| 1,000,000 | | (10) | | National Australia Bank Ltd., 1.890%, 02/10/2020 | | | 1,000,021 | | | | 0.0 | |
| 2,350,000 | | (10) | | Skandinaviska Enskilda Banken AB, 1.950%,
05/11/2020 | | | 2,350,075 | | | | 0.0 | |
| 2,950,000 | | (10) | | Skandinaviska Enskilda Banken AB, 2.010%,
05/26/2020 | | | 2,950,355 | | | | 0.1 | |
| 3,300,000 | | (10) | | Svenska Handelsbanken AB, 1.970%, 05/20/2020 | | | 3,300,111 | | | | 0.1 | |
| 2,450,000 | | (10) | | The Norinchukin Bank, 2.050%, 04/24/2020 | | | 2,450,881 | | | | 0.0 | |
| 1,225,000 | | (10) | | The Sumitomo Mitsui Financial Group, 1.930%, 06/05/2020 | | | 1,224,732 | | | | 0.0 | |
| 750,000 | | (10) | | The Sumitomo Mitsui Financial Group, 1.960%, 01/22/2020 | | | 750,053 | | | | 0.0 | |
| 750,000 | | (10) | | The Sumitomo Mitsui Financial Group, 1.970%, 05/12/2020 | | | 749,873 | | | | 0.0 | |
| 1,950,000 | | (10) | | The Sumitomo Mitsui Financial Group, 1.990%, 01/31/2020 | | | 1,950,162 | | | | 0.1 | |
| 3,025,000 | | (10) | | Toronto-Dominion Bank, 1.850%, 02/13/2020 | | | 3,025,087 | | | | 0.0 | |
| 1,025,000 | | (10) | | Toyota Motor Corp., 2.020%, 01/10/2020 | | | 1,025,051 | | | | 0.0 | |
| 716,000 | | (10) | | Wells Fargo & Co., 1.860%, 02/14/2020 | | | 716,085 | | | | 0.0 | |
| 704,000 | | (10) | | Wells Fargo Bank N.A., 1.830%, 03/06/2020 | | | 704,131 | | | | 0.0 | |
| 1,550,000 | | (10) | | Westpac Banking Corp, 1.830%, 02/10/2020 | | | 1,550,123 | | | | 0.0 | |
| 3,300,000 | | (10) | | Westpac Banking Corp, 1.970%, 06/03/2020 | | | 3,300,127 | | | | 0.1 | |
| | | | | Total Floating Rate Notes
(Cost $56,827,487) | | | 56,827,487 | | | | 0.8 | |
See Accompanying Notes to Financial Statements
73
VY® T. ROWE PRICE
CAPITAL APPRECIATION PORTFOLIO | SUMMARY PORTFOLIO OF INVESTMENTS
AS OF DECEMBER 31, 2019 (CONTINUED) |
Principal
Amount† | | | | | | Value | | | Percentage
of Net
Assets |
|---|
| |
SHORT-TERM INVESTMENTS: (continued) |
| Repurchase Agreements: 1.9% |
| 58,830,853 | | (10) | | Bank of Nova Scotia, Repurchase Agreement dated 12/31/19, 1.57%, due 01/02/20 (Repurchase Amount $58,835,914, collateralized by various U.S. Government Agency Obligations,
2.500%–6.500%, Market Value plus accrued interest $60,012,704, due
09/01/24–11/01/49) | | $ | 58,830,853 | | | | 0.8 | |
| 5,403,327 | | (10) | | Citadel Securities LLC, Repurchase Agreement dated 12/31/19, 1.60%, due 01/02/20 (Repurchase Amount $5,403,801, collateralized by various U.S. Government Securities, 0.000%–8.500%, Market Value plus accrued interest $5,511,884, due 01/15/20–11/15/48) | | | 5,403,327 | | | | 0.1 | |
| 58,830,853 | | (10) | | Citigroup, Inc., Repurchase Agreement dated 12/31/19, 1.57%, due 01/02/20 (Repurchase Amount $58,835,914, collateralized by various U.S. Government/U.S. Government Agency Obligations, 0.000%–9.000%, Market Value plus accrued interest $60,007,470, due 02/13/20–09/20/69) | | | 58,830,853 | | | | 0.8 | |
| 18,095,586 | | (10) | | State of Wisconsin Investment Board, Repurchase Agreement dated 12/31/19, 1.75%, due 01/02/20 (Repurchase Amount $18,097,321, collateralized by various U.S. Government Securities, 0.125%–3.875%, Market Value plus accrued interest $18,457,995, due 04/15/21–02/15/47) | | | 18,095,586 | | | | 0.2 | |
| | | | | Total Repurchase Agreements
(Cost $141,160,619) | | | 141,160,619 | | | | 1.9 | |
| |
| Certificates of Deposit: 0.2% |
| 2,125,000 | | (10) | | Deutscher Sparkassen- und Giroverband, 1.860%, 02/13/2020 | | | 2,125,601 | | | | 0.0 | |
| 2,850,000 | | (10) | | Deutscher Sparkassen- und Giroverband, 1.860%, 02/20/2020 | | | 2,850,909 | | | | 0.1 | |
| 2,350,000 | | (10) | | Dz Bank Ag Deutsche Zentral-Genossenschaftsbank, 1.830%, 02/13/2020 | | | 2,349,810 | | | | 0.0 | |
| |
Principal
Amount† | | | | | | Value | | | Percentage
of Net
Assets |
|---|
| |
SHORT-TERM INVESTMENTS: (continued) |
| Certificates of Deposit: (continued) |
| 2,600,000 | | (10) | | Dz Bank Ag Deutsche Zentral-Genossenschaftsbank, 1.850%, 02/27/2020 | | $ | 2,599,636 | | | | 0.1 | |
| 2,250,000 | | (10) | | Landesbank Baden-Wurttemberg, 1.830%, 01/14/2020 | | | 2,250,090 | | | | 0.0 | |
| 2,325,000 | | (10) | | Landesbank Baden-Wurttemberg, 1.830%, 01/16/2020 | | | 2,325,081 | | | | 0.0 | |
| 2,225,000 | | (10) | | The Norinchukin Bank, 1.870%, 03/05/2020 | | | 2,225,078 | | | | 0.0 | |
| 450,000 | | (10) | | The Norinchukin Bank, 1.890%, 03/13/2020 | | | 450,021 | | | | 0.0 | |
| | | | | Total Certificates of Deposit
(Cost $17,176,226) | | | 17,176,226 | | | | 0.2 | |
| Shares | | | | | | Value | | | Percentage
of Net
Assets |
|---|
| | |
| 4,581,000 | | (10),
(11) | | BlackRock Liquidity Funds, FedFund, Institutional Class,
1.520% | | | 4,581,000 | | | | 0.1 | |
| 9,060,000 | | (10) | | Fidelity Investments Money Market Government Portfolio — Institutional Class, 1.520% | | | 9,060,000 | | | | 0.1 | |
| 9,570,000 | | (10),
(11) | | Goldman Sachs Financial Square Government Fund — Institutional Shares, 1.500% | | | 9,570,000 | | | | 0.1 | |
| 817,914,872 | | (11) | | T. Rowe Price Government Reserve Fund, 1.590% | | | 817,914,872 | | | | 11.0 | |
| | | | | Total Mutual Funds
(Cost $841,125,872) | | | 841,125,872 | | | | 11.3 | |
| | | | | Total Short-Term Investments
(Cost $1,070,559,121) | | | 1,070,559,121 | | | | 14.4 | |
| | | | | Total Investments in Securities
(Cost $6,581,344,437) | | $ | 7,768,442,408 | | | | 104.3 | |
| | | | | Liabilities in Excess of Other Assets | | | (323,190,142 | ) | | | (4.3 | ) |
| | | | | Net Assets | | $ | 7,445,252,266 | | | | 100.0 | |
“Other Securities” represents issues not identified as the top 50 holdings in terms of market value and issues or issuers not exceeding 1% of net assets individually or in aggregate respectively as of December 31, 2019.
The following footnotes apply to either the individual securities noted or one or more of the securities aggregated and listed as a single line item.
| † | | Unless otherwise indicated, principal amount is shown in USD. |
| (1) | | All or a portion of this security is pledged to cover open written call options at December 31, 2019. |
| (2) | | Non-income producing security. |
| (3) | | Security, or a portion of the security, is on loan. |
| (4) | | The grouping contains securities on loan. |
See Accompanying Notes to Financial Statements
74
VY® T. ROWE PRICE
CAPITAL APPRECIATION PORTFOLIO | SUMMARY PORTFOLIO OF INVESTMENTS
AS OF DECEMBER 31, 2019 (CONTINUED) |
| (5) | | For fair value measurement disclosure purposes, security is categorized as Level 3, whose value was determined using significant unobservable inputs. |
| (6) | | Restricted security as to resale, excluding Rule 144A securities. As of December 31, 2019, the Portfolio held restricted securities with a fair value of $5,325,555 or 0.1% of net assets. Please refer to the table below for additional details. |
| (7) | | The grouping contains non-income producing securities. |
| (8) | | Preferred Stock may be called prior to convertible date. |
| (9) | | Securities with purchases pursuant to Rule 144A or section 4(a)(2), under the Securities Act of 1933 and may not be resold subject to that rule except to qualified institutional buyers. |
| (10) | | All or a portion of the security represents securities purchased with cash collateral received for securities on loan. |
| (11) | | Rate shown is the 7-day yield as of December 31, 2019. |
Reference Rate Abbreviations:
| US0001M | | 1-month LIBOR |
| US0003M | | 3-month LIBOR |
Fair Value Measurementsˆ
The following is a summary of the fair valuations according to the inputs used as of December 31, 2019 in valuing the assets and liabilities:
| | Quoted Prices
in Active Markets
for Identical
Investments
(Level 1) | | Significant
Other
Observable
Inputs#
(Level 2) | | | Significant
Unobservable
Inputs
(Level 3) | | Fair Value
at
December 31, 2019 |
|---|
Asset Table | | | | | | | | | | | | | | | | | | | |
Investments, at fair value | | | | | | | | | | | | | | | | | | | |
| Common Stock | | | | | | | | | | | | | | | | | | | |
| Communication Services | | | $ | 291,077,755 | | | $ | — | | | | $ | — | | | | $ | 291,077,755 | |
| Consumer Discretionary | | | | 410,337,115 | | | | — | | | | | — | | | | | 410,337,115 | |
| Consumer Staples | | | | 84,246,121 | | | | — | | | | | — | | | | | 84,246,121 | |
| Energy | | | | 20,456,352 | | | | — | | | | | — | | | | | 20,456,352 | |
| Financials | | | | 431,102,820 | | | | — | | | | | — | | | | | 431,102,820 | |
| Health Care | | | | 932,939,240 | | | | 146,969,924 | | | | | — | | | | | 1,079,909,164 | |
| Industrials | | | | 653,903,167 | | | | — | | | | | — | | | | | 653,903,167 | |
| Information Technology | | | | 1,259,569,126 | | | | — | | | | | — | | | | | 1,259,569,126 | |
| Real Estate | | | | 7,377,222 | | | | — | | | | | — | | | | | 7,377,222 | |
| Utilities | | | | 474,196,093 | | | | — | | | | | — | | | | | 474,196,093 | |
| Total Common Stock | | | | 4,565,205,011 | | | | 146,969,924 | | | | | — | | | | | 4,712,174,935 | |
| Preferred Stock | | | | 389,462,928 | | | | — | | | | | 5,325,555 | | | | | 394,788,483 | |
| Corporate Bonds/Notes | | | | — | | | | 1,219,284,449 | | | | | — | | | | | 1,219,284,449 | |
| Asset-Backed Securities | | | | — | | | | 24,868,836 | | | | | — | | | | | 24,868,836 | |
| Bank Loans | | | | — | | | | 346,766,584 | | | | | — | | | | | 346,766,584 | |
| Short-Term Investments | | | | 841,125,872 | | | | 229,433,249 | | | | | — | | | | | 1,070,559,121 | |
| Total Investments, at fair value | | | $ | 5,795,793,811 | | | $ | 1,967,323,042 | | | | $ | 5,325,555 | | | | $ | 7,768,442,408 | |
Other Financial Instruments+ | | | | | | | | | | | | | | | | | | | |
| Forward Foreign Currency Contracts | | | | — | | | | 161 | | | | | — | | | | | 161 | |
| Total Assets | | | $ | 5,795,793,811 | | | $ | 1,967,323,203 | | | | $ | 5,325,555 | | | | $ | 7,768,442,569 | |
Liabilities Table | | | | | | | | | | | | | | | | | | | |
Other Financial Instruments+ | | | | | | | | | | | | | | | | | | | |
| Written Options | | | $ | — | | | $ | (75,492,168 | ) | | | $ | — | | | | $ | (75,492,168 | ) |
| Total Liabilities | | | $ | — | | | $ | (75,492,168 | ) | | | $ | — | | | | $ | (75,492,168 | ) |
| ˆ | | See Note 2, “Significant Accounting Policies” in the Notes to Financial Statements for additional information. |
| + | | Other Financial Instruments may include open forward foreign currency contracts, futures, centrally cleared swaps, OTC swaps and written options. Forward foreign currency contracts, futures and centrally cleared swaps are valued at the unrealized gain (loss) on the instrument. OTC swaps and written options are valued at the fair value of the instrument. |
| # | | The earlier close of the foreign markets gives rise to the possibility that significant events, including broad market moves, may have occurred in the interim and may materially affect the value of those securities. To account for this, the Portfolio may frequently value many of its foreign equity securities using fair value prices based on third party vendor modeling tools to the extent available. Accordingly, a portion of the Portfolio’s investments are categorized as Level 2 investments. |
At December 31, 2019, VY® T. Rowe Price Capital Appreciation Portfolio held the following restricted securities:
| Security | | Acquisition
Date | | Acquisition
Cost | | Fair
Value |
|---|
| Aurora Innovation, Inc., — Series B | | | 3/1/2019 | | | | $ | 5,325,555 | | | | $ | 5,325,555 | |
| | | | | | | | $ | 5,325,555 | | | | $ | 5,325,555 | |
See Accompanying Notes to Financial Statements
75
VY® T. ROWE PRICE
CAPITAL APPRECIATION PORTFOLIO | SUMMARY PORTFOLIO OF INVESTMENTS
AS OF DECEMBER 31, 2019 (CONTINUED) |
At December 31, 2019, the following forward foreign currency contracts were outstanding for VY® T. Rowe Price Capital Appreciation Portfolio:
| Currency Purchased | | Currency Sold | | Counterparty | | Settlement
Date | | Unrealized
Appreciation
(Depreciation) |
|---|
| CHF 1,503,701 | | USD 1,553,571 | | UBS AG | | 01/03/20 | | | $ | 161 | |
| | | | | | | | | | $ | 161 | |
At December 31, 2019, the following OTC written equity options were outstanding for VY® T. Rowe Price Capital Appreciation Portfolio:
| Description | | Counterparty | | | Put/Call | | | | Expiration
Date | | | | Exercise
Price | | | | Number of
Contracts | | | Notional
Amount | | | | Premiums
Received | | | | Fair
Value | |
|---|
| Alphabet, Inc. — Class C | | Citigroup Global Markets | | | Call | | | | 01/15/21 | | | | USD 1,500.000 | | | | 49 | | | | USD 6,551,398 | | | $ | 325,850 | | | $ | (325,850 | ) |
| Microsoft Corp. | | Credit Suisse Securities (USA) LLC | | | Call | | | | 01/17/20 | | | | USD 125.000 | | | | 1,912 | | | | USD 30,152,240 | | | | 883,461 | | | | (6,268,909 | ) |
| Microsoft Corp. | | Credit Suisse Securities (USA) LLC | | | Call | | | | 01/17/20 | | | | USD 130.000 | | | | 442 | | | | USD 6,970,340 | | | | 146,214 | | | | (1,229,119 | ) |
| Microsoft Corp. | | RBC Capital Markets, LLC | | | Call | | | | 01/17/20 | | | | USD 130.000 | | | | 1,470 | | | | USD 23,181,900 | | | | 420,365 | | | | (4,087,795 | ) |
| Texas Instruments, Inc. | | Goldman Sachs & Co. | | | Call | | | | 01/17/20 | | | | USD 130.000 | | | | 134 | | | | USD 1,719,086 | | | | 97,245 | | | | (26,916 | ) |
| Visa, Inc. — Class A | | Credit Suisse Securities (USA) LLC | | | Call | | | | 01/17/20 | | | | USD 170.000 | | | | 752 | | | | USD 14,130,080 | | | | 394,123 | | | | (1,373,452 | ) |
| Visa, Inc. — Class A | | Credit Suisse Securities (USA) LLC | | | Call | | | | 01/17/20 | | | | USD 175.000 | | | | 751 | | | | USD 14,111,290 | | | | 270,135 | | | | (1,010,094 | ) |
| Alphabet, Inc. — Class A | | Goldman Sachs & Co. | | | Call | | | | 01/17/20 | | | | USD 1,270.000 | | | | 37 | | | | USD 4,955,743 | | | | 193,766 | | | | (273,042 | ) |
| Alphabet, Inc. — Class A | | Goldman Sachs & Co. | | | Call | | | | 01/17/20 | | | | USD 1,300.000 | | | | 38 | | | | USD 5,089,682 | | | | 160,966 | | | | (182,911 | ) |
| Alphabet, Inc. — Class A | | Goldman Sachs & Co. | | | Call | | | | 01/17/20 | | | | USD 1,350.000 | | | | 38 | | | | USD 5,089,682 | | | | 110,122 | | | | (61,025 | ) |
| Alphabet, Inc. — Class C | | Citigroup Global Markets | | | Call | | | | 01/17/20 | | | | USD 1,300.000 | | | | 319 | | | | USD 42,650,938 | | | | 1,539,076 | | | | (1,456,743 | ) |
| Alphabet, Inc. — Class C | | Citigroup Global Markets | | | Call | | | | 01/17/20 | | | | USD 1,340.000 | | | | 76 | | | | USD 10,161,352 | | | | 603,766 | | | | (141,725 | ) |
| Alphabet, Inc. — Class C | | Citigroup Global Markets | | | Call | | | | 01/17/20 | | | | USD 1,350.000 | | | | 98 | | | | USD 13,102,796 | | | | 372,106 | | | | (133,507 | ) |
| Alphabet, Inc. — Class C | | Citigroup Global Markets | | | Call | | | | 01/17/20 | | | | USD 1,400.000 | | | | 77 | | | | USD 10,295,054 | | | | 475,703 | | | | (13,651 | ) |
| Alphabet, Inc. — Class C | | Citigroup Global Markets | | | Call | | | | 01/17/20 | | | | USD 1,500.000 | | | | 77 | | | | USD 10,295,054 | | | | 310,803 | | | | (57 | ) |
| Amazon.com, Inc. | | Citigroup Global Markets | | | Call | | | | 01/17/20 | | | | USD 1,800.000 | | | | 59 | | | | USD 10,902,256 | | | | 1,105,424 | | | | (373,251 | ) |
| Amazon.com, Inc. | | Citigroup Global Markets | | | Call | | | | 01/17/20 | | | | USD 2,000.000 | | | | 20 | | | | USD 3,695,680 | | | | 232,160 | | | | (6,819 | ) |
| Amazon.com, Inc. | | Citigroup Global Markets | | | Call | | | | 01/17/20 | | | | USD 2,025.000 | | | | 20 | | | | USD 3,695,680 | | | | 218,160 | | | | (4,840 | ) |
| Amazon.com, Inc. | | Citigroup Global Markets | | | Call | | | | 01/17/20 | | | | USD 2,100.000 | | | | 20 | | | | USD 3,695,680 | | | | 179,160 | | | | (1,929 | ) |
| Amazon.com, Inc. | | Citigroup Global Markets | | | Call | | | | 01/17/20 | | | | USD 2,300.000 | | | | 92 | | | | USD 17,000,128 | | | | 982,555 | | | | (1,373 | ) |
| Amazon.com, Inc. | | Credit Suisse Securities (USA) LLC | | | Call | | | | 01/17/20 | | | | USD 2,500.000 | | | | 39 | | | | USD 7,206,576 | | | | 481,544 | | | | (145 | ) |
| Amazon.com, Inc. | | Credit Suisse Securities (USA) LLC | | | Call | | | | 01/17/20 | | | | USD 2,600.000 | | | | 39 | | | | USD 7,206,576 | | | | 400,532 | | | | (81 | ) |
| Amazon.com, Inc. | | Credit Suisse Securities (USA) LLC | | | Call | | | | 01/17/20 | | | | USD 2,700.000 | | | | 40 | | | | USD 7,391,360 | | | | 341,896 | | | | (50 | ) |
American Electric Power
Co., Inc. | | Citigroup Global Markets | | | Call | | | | 01/17/20 | | | | USD 85.000 | | | | 2,666 | | | | USD 25,196,366 | | | | 376,925 | | | | (2,563,747 | ) |
American Electric Power
Co., Inc. | | Citigroup Global Markets | | | Call | | | | 01/17/20 | | | | USD 95.000 | | | | 1,959 | | | | USD 18,514,509 | | | | 342,405 | | | | (139,588 | ) |
| American Tower Corp. | | Citigroup Global Markets | | | Call | | | | 01/17/20 | | | | USD 175.000 | | | | 321 | | | | USD 7,377,222 | | | | 242,095 | | | | (1,766,356 | ) |
| Danaher Corp. | | Citigroup Global Markets | | | Call | | | | 01/17/20 | | | | USD 150.000 | | | | 323 | | | | USD 4,957,404 | | | | 84,768 | | | | (157,003 | ) |
| Facebook, Inc. — Class A | | JPMorgan Chase Bank N.A. | | | Call | | | | 01/17/20 | | | | USD 200.000 | | | | 949 | | | | USD 19,478,225 | | | | 930,096 | | | | (719,087 | ) |
| Facebook, Inc. — Class A | | JPMorgan Chase Bank N.A. | | | Call | | | | 01/17/20 | | | | USD 220.000 | | | | 1,655 | | | | USD 33,968,875 | | | | 731,497 | | | | (55,321 | ) |
| McDonald’s Corp. | | Citigroup Global Markets | | | Call | | | | 01/17/20 | | | | USD 195.000 | | | | 422 | | | | USD 8,339,142 | | | | 424,005 | | | | (172,007 | ) |
| McDonald’s Corp. | | Citigroup Global Markets | | | Call | | | | 01/17/20 | | | | USD 200.000 | | | | 422 | | | | USD 8,339,142 | | | | 349,994 | | | | (51,217 | ) |
| McDonald’s Corp. | | Credit Suisse Securities (USA) LLC | | | Call | | | | 01/17/20 | | | | USD 195.000 | | | | 177 | | | | USD 3,497,697 | | | | 134,042 | | | | (72,145 | ) |
| McDonald’s Corp. | | Credit Suisse Securities (USA) LLC | | | Call | | | | 01/17/20 | | | | USD 200.000 | | | | 132 | | | | USD 2,608,452 | | | | 81,259 | | | | (16,020 | ) |
| Microsoft Corp. | | Citigroup Global Markets | | | Call | | | | 01/17/20 | | | | USD 120.000 | | | | 886 | | | | USD 13,972,220 | | | | 549,648 | | | | (3,342,103 | ) |
| Microsoft Corp. | | Citigroup Global Markets | | | Call | | | | 01/17/20 | | | | USD 125.000 | | | | 1,559 | | | | USD 24,585,430 | | | | 887,036 | | | | (5,111,522 | ) |
| Microsoft Corp. | | Citigroup Global Markets | | | Call | | | | 01/17/20 | | | | USD 130.000 | | | | 1,558 | | | | USD 24,569,660 | | | | 671,735 | | | | (4,332,507 | ) |
| Microsoft Corp. | | Citigroup Global Markets | | | Call | | | | 01/17/20 | | | | USD 135.000 | | | | 1,595 | | | | USD 25,153,150 | | | | 939,310 | | | | (3,643,277 | ) |
PNC Financial Services
Group, Inc. | | Credit Suisse Securities (USA) LLC | | | Call | | | | 01/17/20 | | | | USD 140.000 | | | | 1,269 | | | | USD 20,257,047 | | | | 663,053 | | | | (2,510,183 | ) |
| S&P Global, Inc. | | Citigroup Global Markets | | | Call | | | | 01/17/20 | | | | USD 220.000 | | | | 651 | | | | USD 17,775,555 | | | | 628,247 | | | | (3,464,638 | ) |
| S&P Global, Inc. | | Citigroup Global Markets | | | Call | | | | 01/17/20 | | | | USD 230.000 | | | | 652 | | | | USD 17,802,860 | | | | 375,546 | | | | (2,819,161 | ) |
| Texas Instruments, Inc. | | Goldman Sachs & Co. | | | Call | | | | 01/17/20 | | | | USD 135.000 | | | | 168 | | | | USD 2,155,272 | | | | 70,896 | | | | (9,160 | ) |
| Texas Instruments, Inc. | | Goldman Sachs & Co. | | | Call | | | | 01/17/20 | | | | USD 140.000 | | | | 168 | | | | USD 2,155,272 | | | | 44,016 | | | | (2,182 | ) |
| Texas Instruments, Inc. | | JPMorgan Chase Bank N.A. | | | Call | | | | 01/17/20 | | | | USD 120.000 | | | | 657 | | | | USD 8,428,653 | | | | 167,995 | | | | (596,703 | ) |
| Texas Instruments, Inc. | | JPMorgan Chase Bank N.A. | | | Call | | | | 01/17/20 | | | | USD 130.000 | | | | 1,462 | | | | USD 18,755,998 | | | | 564,837 | | | | (293,665 | ) |
| Texas Instruments, Inc. | | RBC Capital Markets, LLC | | | Call | | | | 01/17/20 | | | | USD 125.000 | | | | 3,049 | | | | USD 39,115,621 | | | | 1,004,591 | | | | (1,522,002 | ) |
| UnitedHealth Group, Inc. | | Citigroup Global Markets | | | Call | | | | 01/17/20 | | | | USD 270.000 | | | | 266 | | | | USD 7,819,868 | | | | 393,101 | | | | (652,617 | ) |
| UnitedHealth Group, Inc. | | Citigroup Global Markets | | | Call | | | | 01/17/20 | | | | USD 280.000 | | | | 265 | | | | USD 7,790,470 | | | | 290,027 | | | | (413,386 | ) |
| UnitedHealth Group, Inc. | | Citigroup Global Markets | | | Call | | | | 01/17/20 | | | | USD 290.000 | | | | 309 | | | | USD 9,083,982 | | | | 561,023 | | | | (252,736 | ) |
| UnitedHealth Group, Inc. | | Citigroup Global Markets | | | Call | | | | 01/17/20 | | | | USD 300.000 | | | | 456 | | | | USD 13,405,488 | | | | 669,522 | | | | (144,698 | ) |
| UnitedHealth Group, Inc. | | Goldman Sachs & Co. | | | Call | | | | 01/17/20 | | | | USD 290.000 | | | | 152 | | | | USD 4,468,496 | | | | 278,172 | | | | (124,323 | ) |
| UnitedHealth Group, Inc. | | Goldman Sachs & Co. | | | Call | | | | 01/17/20 | | | | USD 310.000 | | | | 33 | | | | USD 970,134 | | | | 27,333 | | | | (2,832 | ) |
| Visa, Inc. — Class A | | Credit Suisse Securities (USA) LLC | | | Call | | | | 01/17/20 | | | | USD 150.000 | | | | 549 | | | | USD 10,315,710 | | | | 508,594 | | | | (2,091,490 | ) |
See Accompanying Notes to Financial Statements
76
VY® T. ROWE PRICE
CAPITAL APPRECIATION PORTFOLIO | SUMMARY PORTFOLIO OF INVESTMENTS
AS OF DECEMBER 31, 2019 (CONTINUED) |
| Description | | Counterparty | | | Put/Call | | | | Expiration
Date | | | | Exercise
Price | | | | Number of
Contracts | | | Notional
Amount | | | | Premiums
Received | | | | Fair
Value | |
|---|
| Visa, Inc. — Class A | | Credit Suisse Securities (USA) LLC | | | Call | | | | 01/17/20 | | | | USD 155.000 | | | | 549 | | | | USD 10,315,710 | | | $ | 413,177 | | | $ | (1,818,307 | ) |
| Visa, Inc. — Class A | | Credit Suisse Securities (USA) LLC | | | Call | | | | 01/17/20 | | | | USD 160.000 | | | | 885 | | | | USD 16,629,150 | | | | 612,574 | | | | (2,491,871 | ) |
| Visa, Inc. — Class A | | Credit Suisse Securities (USA) LLC | | | Call | | | | 01/17/20 | | | | USD 165.000 | | | | 758 | | | | USD 14,242,820 | | | | 378,722 | | | | (1,759,719 | ) |
| Visa, Inc. — Class A | | Goldman Sachs & Co. | | | Call | | | | 01/17/20 | | | | USD 170.000 | | | | 760 | | | | USD 14,280,400 | | | | 442,401 | | | | (1,388,063 | ) |
| Visa, Inc. — Class A | | Goldman Sachs & Co. | | | Call | | | | 01/17/20 | | | | USD 175.000 | | | | 1,820 | | | | USD 34,197,800 | | | | 866,108 | | | | (2,447,897 | ) |
| Visa, Inc. — Class A | | Goldman Sachs & Co. | | | Call | | | | 01/17/20 | | | | USD 180.000 | | | | 624 | | | | USD 11,724,960 | | | | 412,339 | | | | (550,258 | ) |
| Yum! Brands, Inc. | | Citigroup Global Markets | | | Call | | | | 01/17/20 | | | | USD 100.000 | | | | 843 | | | | USD 8,491,539 | | | | 306,076 | | | | (187,849 | ) |
| Yum! Brands, Inc. | | Citigroup Global Markets | | | Call | | | | 01/17/20 | | | | USD 115.000 | | | | 470 | | | | USD 4,734,310 | | | | 167,790 | | | | (1,003 | ) |
| Yum! Brands, Inc. | | Citigroup Global Markets | | | Call | | | | 01/17/20 | | | | USD 115.000 | | | | 166 | | | | USD 1,672,118 | | | | 59,262 | | | | (354 | ) |
| Yum! Brands, Inc. | | Citigroup Global Markets | | | Call | | | | 01/17/20 | | | | USD 120.000 | | | | 166 | | | | USD 1,672,118 | | | | 30,723 | | | | (90 | ) |
| Yum! Brands, Inc. | | Citigroup Global Markets | | | Call | | | | 01/17/20 | | | | USD 120.000 | | | | 471 | | | | USD 4,744,383 | | | | 85,251 | | | | (255 | ) |
| Alphabet, Inc. — Class C | | Citigroup Global Markets | | | Call | | | | 01/15/21 | | | | USD 1,500.000 | | | | 75 | | | | USD 10,027,650 | | | | 566,025 | | | | (484,024 | ) |
| Alphabet, Inc. — Class C | | Citigroup Global Markets | | | Call | | | | 01/15/21 | | | | USD 1,500.000 | | | | 75 | | | | USD 10,027,650 | | | | 554,025 | | | | (484,024 | ) |
| Alphabet, Inc. — Class C | | Citigroup Global Markets | | | Call | | | | 01/15/21 | | | | USD 1,500.000 | | | | 75 | | | | USD 10,027,650 | | | | 600,525 | | | | (484,024 | ) |
| Amazon.com, Inc. | | Credit Suisse Securities (USA) LLC | | | Call | | | | 01/15/21 | | | | USD 2,200.000 | | | | 37 | | | | USD 6,837,008 | | | | 232,027 | | | | (315,343 | ) |
| Amazon.com, Inc. | | Credit Suisse Securities (USA) LLC | | | Call | | | | 01/15/21 | | | | USD 2,200.000 | | | | 62 | | | | USD 11,456,608 | | | | 401,617 | | | | (528,413 | ) |
| Amazon.com, Inc. | | Credit Suisse Securities (USA) LLC | | | Call | | | | 01/15/21 | | | | USD 2,200.000 | | | | 49 | | | | USD 9,054,416 | | | | 294,598 | | | | (417,617 | ) |
| Amazon.com, Inc. | | Credit Suisse Securities (USA) LLC | | | Call | | | | 01/15/21 | | | | USD 2,200.000 | | | | 62 | | | | USD 11,456,608 | | | | 395,417 | | | | (528,413 | ) |
| American Electric Power Co., Inc. | | Citigroup Global Markets | | | Call | | | | 01/15/21 | | | | USD 105.000 | | | | 1,000 | | | | USD 9,451,000 | | | | 157,000 | | | | (187,258 | ) |
| American Electric Power Co., Inc. | | Citigroup Global Markets | | | Call | | | | 01/15/21 | | | | USD 105.000 | | | | 988 | | | | USD 9,337,588 | | | | 155,116 | | | | (185,010 | ) |
| Becton Dickinson & Co. | | Goldman Sachs & Co. | | | Call | | | | 01/15/21 | | | | USD 300.000 | | | | 250 | | | | USD 6,799,250 | | | | 249,820 | | | | (311,522 | ) |
| Becton Dickinson & Co. | | Goldman Sachs & Co. | | | Call | | | | 01/15/21 | | | | USD 300.000 | | | | 212 | | | | USD 5,765,764 | | | | 257,181 | | | | (249,100 | ) |
| Becton Dickinson & Co. | | Goldman Sachs & Co. | | | Call | | | | 01/15/21 | | | | USD 300.000 | | | | 75 | | | | USD 2,039,775 | | | | 70,180 | | | | (93,457 | ) |
| Becton Dickinson & Co. | | Goldman Sachs & Co. | | | Call | | | | 01/15/21 | | | | USD 300.000 | | | | 175 | | | | USD 4,759,475 | | | | 159,917 | | | | (218,065 | ) |
| General Electric Co. | | JPMorgan Chase Bank N.A. | | | Call | | | | 01/15/21 | | | | USD 15.000 | | | | 6,248 | | | | USD 6,972,768 | | | | 353,137 | | | | (292,218 | ) |
| General Electric Co. | | JPMorgan Chase Bank N.A. | | | Call | | | | 01/15/21 | | | | USD 15.000 | | | | 6,247 | | | | USD 6,971,652 | | | | 324,844 | | | | (292,171 | ) |
| Microsoft Corp. | | Credit Suisse Securities (USA) LLC | | | Call | | | | 01/15/21 | | | | USD 165.000 | | | | 1,258 | | | | USD 19,838,660 | | | | 849,276 | | | | (1,456,225 | ) |
| Microsoft Corp. | | Credit Suisse Securities (USA) LLC | | | Call | | | | 01/15/21 | | | | USD 165.000 | | | | 1,200 | | | | USD 18,924,000 | | | | 830,400 | | | | (1,389,086 | ) |
| NXP Semiconductor NV — NXPI — US | | Credit Suisse Securities (USA) LLC | | | Call | | | | 01/15/21 | | | | USD 140.000 | | | | 409 | | | | USD 5,204,934 | | | | 302,987 | | | | (435,765 | ) |
| NXP Semiconductor NV — NXPI — US | | Credit Suisse Securities (USA) LLC | | | Call | | | | 01/15/21 | | | | USD 140.000 | | | | 174 | | | | USD 2,214,324 | | | | 121,835 | | | | (185,387 | ) |
| NXP Semiconductor NV — NXPI — US | | Credit Suisse Securities (USA) LLC | | | Call | | | | 01/15/21 | | | | USD 140.000 | | | | 973 | | | | USD 12,382,398 | | | | 737,145 | | | | (1,036,674 | ) |
| Texas Instruments, Inc. | | Goldman Sachs & Co. | | | Call | | | | 01/15/21 | | | | USD 135.000 | | | | 503 | | | | USD 6,452,987 | | | | 327,212 | | | | (455,022 | ) |
| Texas Instruments, Inc. | | Goldman Sachs & Co. | | | Call | | | | 01/15/21 | | | | USD 140.000 | | | | 503 | | | | USD 6,452,987 | | | | 254,402 | | | | (358,039 | ) |
| Thermo Fisher Scientific, Inc. | | RBC Capital Markets, LLC | | | Call | | | | 01/15/21 | | | | USD 400.000 | | | | 74 | | | | USD 2,404,038 | | | | 52,505 | | | | (56,979 | ) |
| Thermo Fisher Scientific, Inc. | | RBC Capital Markets, LLC | | | Call | | | | 01/15/21 | | | | USD 400.000 | | | | 327 | | | | USD 10,623,249 | | | | 231,284 | | | | (251,784 | ) |
| Thermo Fisher Scientific, Inc. | | RBC Capital Markets, LLC | | | Call | | | | 01/15/21 | | | | USD 400.000 | | | | 173 | | | | USD 5,620,251 | | | | 134,883 | | | | (133,207 | ) |
| Yum! Brands, Inc. | | Bank of America N.A. | | | Call | | | | 01/17/20 | | | | USD 115.000 | | | | 351 | | | | USD 3,535,623 | | | | 43,071 | | | | (749 | ) |
| Yum! Brands, Inc. | | Bank of America N.A. | | | Call | | | | 01/17/20 | | | | USD 120.000 | | | | 351 | | | | USD 3,535,623 | | | | 14,416 | | | | (190 | ) |
| Yum! Brands, Inc. | | Citigroup Global Markets | | | Call | | | | 01/17/20 | | | | USD 115.000 | | | | 347 | | | | USD 3,495,331 | | | | 63,619 | | | | (740 | ) |
| Yum! Brands, Inc. | | Citigroup Global Markets | | | Call | | | | 01/17/20 | | | | USD 115.000 | | | | 178 | | | | USD 1,792,994 | | | | 35,956 | | | | (380 | ) |
| Yum! Brands, Inc. | | Citigroup Global Markets | | | Call | | | | 01/17/20 | | | | USD 115.000 | | | | 139 | | | | USD 1,400,147 | | | | 28,078 | | | | (297 | ) |
| Yum! Brands, Inc. | | Citigroup Global Markets | | | Call | | | | 01/17/20 | | | | USD 120.000 | | | | 138 | | | | USD 1,390,074 | | | | 10,212 | | | | (75 | ) |
| Yum! Brands, Inc. | | Citigroup Global Markets | | | Call | | | | 01/17/20 | | | | USD 120.000 | | | | 348 | | | | USD 3,505,404 | | | | 22,610 | | | | (188 | ) |
| Yum! Brands, Inc. | | Citigroup Global Markets | | | Call | | | | 01/17/20 | | | | USD 120.000 | | | | 178 | | | | USD 1,792,994 | | | | 13,172 | | | | (96 | ) |
| | | | | | | | | | | | | | | | | | | | | | | | | $ | 35,855,815 | | | $ | (75,492,168 | ) |
Currency Abbreviations
| CHF | | — Swiss Franc |
| USD | | — United States Dollar |
See Accompanying Notes to Financial Statements
77
VY® T. ROWE PRICE
CAPITAL APPRECIATION PORTFOLIO | SUMMARY PORTFOLIO OF INVESTMENTS
AS OF DECEMBER 31, 2019 (CONTINUED) |
A summary of derivative instruments by primary risk exposure is outlined in the following tables.
The fair value of derivative instruments as of December 31, 2019 was as follows:
Derivatives not accounted for as
hedging instruments | | Location on Statement
of Assets and Liabilities | | Fair Value | |
|---|
Asset Derivatives | | | | | | |
| Foreign exchange contracts | | Unrealized appreciation on forward foreign currency contracts | | $ | 161 | |
Total Asset Derivatives | | | | $ | 161 | |
Liability Derivatives | | | | | | |
| Equity contracts | | Written options, at fair value | | $ | 75,492,168 | |
Total Liability Derivatives | | | | $ | 75,492,168 | |
| * | | Includes purchased options. |
The effect of derivative instruments on the Fund’s Statement of Operations for the year ended December 31, 2019 was as follows:
| | Amount of Realized Gain or (Loss)
on Derivatives Recognized in Income |
|---|
| | | |
|---|
Derivatives not accounted for as
hedging instruments | | Investments* | | Forward foreign
currency
contracts | | Written
options | | Totals |
|---|
| Equity contracts | | | $ | 1,430,983 | | | | $ | — | | | | $ | 23,749,238 | | | | $ | 25,180,221 | |
| Foreign exchange contracts | | | | — | | | | | 59,360 | | | | | — | | | | | 59,360 | |
Total | | | $ | 1,430,983 | | | | $ | 59,360 | | | | $ | 23,749,238 | | | | $ | 25,239,581 | |
| | Change in Unrealized Appreciation or (Depreciation)
on Derivatives Recognized in Income |
|---|
| | | |
|---|
Derivatives not accounted for as
hedging instruments | | Investments* | | Forward foreign
currency
contracts | | Written
options | | Totals |
|---|
| Equity contracts | | | $ | — | | | | $ | — | | | | $ | (55,394,858 | ) | | | $ | (55,394,858 | ) |
| Foreign exchange contracts | | | | — | | | | | 161 | | | | | — | | | | | 161 | |
Total | | | $ | — | | | | $ | 161 | | | | $ | (55,394,858 | ) | | | $ | (55,394,697 | ) |
| * | | Amounts recognized for purchased options are included in net realized gain (loss) on investments and net change in unrealized appreciation or depreciation on investments. |
The following is a summary by counterparty of the fair value of OTC derivative instruments subject to Master Netting Agreements and collateral pledged (received), if any, at December 31, 2019:
| | Bank of
America N.A. | | Citigroup Global
Markets | | | Credit Suisse
Securities
(USA) LLC | | | | Goldman
Sachs & Co. | | | | JPMorgan
Chase
Bank N.A. | | | | RBC Capital
Markets | | | UBS AG | | Totals | |
|---|
Assets: | | | | | | | | | | | | | | | | | | | | | | | | | | | | | | | | | | | |
| Forward foreign currency contracts | | | $ | — | | | | $ | — | | | $ | — | | | $ | — | | | $ | — | | | $ | — | | | | $ | 161 | | | $ | 161 | |
Total Assets | | | $ | — | | | | $ | — | | | $ | — | | | $ | — | | | $ | — | | | $ | — | | | | $ | 161 | | | $ | 161 | |
Liabilities: | | | | | | | | | | | | | | | | | | | | | | | | | | | | | | | | | |
| Written options | | | $ | 939 | | | | $ | 33,501,975 | | | $ | 26,934,508 | | | $ | 6,753,814 | | | $ | 2,249,165 | | | $ | 6,051,767 | | | | $ | — | | | $ | 75,492,168 | |
Total Liabilities | | | $ | 939 | | | | $ | 33,501,975 | | | $ | 26,934,508 | | | $ | 6,753,814 | | | $ | 2,249,165 | | | $ | 6,051,767 | | | | $ | — | | | $ | 75,492,168 | |
Net OTC derivative instruments by counterparty, at fair value | | | $ | (939 | ) | | | $ | (33,501,975 | ) | | $ | (26,934,508 | ) | | $ | (6,753,814 | ) | | $ | (2,249,165 | ) | | $ | (6,051,767 | ) | | | $ | 161 | | | $ | (75,492,007) | |
Total collateral pledged by the Portfolio/(Received from counterparty) | | | $ | — | | | | $ | — | | | $ | — | | | $ | — | | | $ | — | | | $ | — | | | | $ | — | | | $ | — | |
Net Exposure(1) | | | $ | (939 | ) | | | $ | (33,501,975 | ) | | $ | (26,934,508 | ) | | $ | (6,753,814 | ) | | $ | (2,249,165 | ) | | $ | (6,051,767 | ) | | | $ | 161 | | | $ | (75,492,007) | |
(1) | | Positive net exposure represents amounts due from each respective counterparty. Negative exposure represents amounts due from the Portfolio. Please refer to Note 2 for additional details regarding counterparty credit risk and credit related contingent features. |
See Accompanying Notes to Financial Statements
78
VY® T. ROWE PRICE
CAPITAL APPRECIATION PORTFOLIO | SUMMARY PORTFOLIO OF INVESTMENTS
AS OF DECEMBER 31, 2019 (CONTINUED) |
At December 31, 2019, the aggregate cost of securities and other investments and the composition of unrealized appreciation and depreciation of securities and other investments at year end were:
| Cost for federal income tax purposes was $6,561,687,655. |
| | | | | | | |
| Net unrealized appreciation consisted of: | | | | | | |
| Gross Unrealized Appreciation | | | | $ | 1,202,292,298 | |
| Gross Unrealized Depreciation | | | | | (70,681,556 | ) |
| Net Unrealized Appreciation | | | | $ | 1,131,610,742 | |
See Accompanying Notes to Financial Statements
79
VY® T. ROWE PRICE
EQUITY INCOME PORTFOLIO | SUMMARY PORTFOLIO OF INVESTMENTS
AS OF DECEMBER 31, 2019 |
| Shares | | | | | | Value | | | Percentage
of Net
Assets |
|---|
| |
|---|
| COMMON STOCK: 96.3% |
|---|
| | Communication Services: 6.1% |
| 97,183 | | | | Comcast Corp. — Class A | | $ | 4,370,319 | | | | 1.1 | |
| 118,360 | | | | Fox Corp. — Class B | | | 4,308,304 | | | | 1.1 | |
| 239,934 | | | | News Corp — Class A | | | 3,392,667 | | | | 0.9 | |
| 107,596 | | | | Verizon Communications, Inc. | | | 6,606,394 | | | | 1.7 | |
| 290,727 | | | | Other Securities | | | 4,787,039 | | | | 1.3 | |
| | | | | | | | 23,464,723 | | | | 6.1 | |
| |
| | Consumer Discretionary: 2.4% |
| 56,423 | | | | Las Vegas Sands Corp. | | | 3,895,444 | | | | 1.0 | |
| 246,696 | | (1),(2) | | Other Securities | | | 5,432,735 | | | | 1.4 | |
| | | | | | | | 9,328,179 | | | | 2.4 | |
| |
| | |
| 158,412 | | | | Conagra Brands, Inc. | | | 5,424,027 | | | | 1.4 | |
| 43,979 | | | | Kimberly-Clark Corp. | | | 6,049,311 | | | | 1.6 | |
| 78,028 | | | | Philip Morris International, Inc. | | | 6,639,403 | | | | 1.7 | |
| 78,317 | | | | Tyson Foods, Inc. | | | 7,129,980 | | | | 1.8 | |
| 65,436 | | | | Other Securities | | | 5,229,873 | | | | 1.4 | |
| | | | | | | | 30,472,594 | | | | 7.9 | |
| |
| | |
| 95,627 | | | | Exxon Mobil Corp. | | | 6,672,852 | | | | 1.7 | |
| 111,383 | | | | Occidental Petroleum Corp. | | | 4,590,093 | | | | 1.2 | |
| 129,742 | | (3) | | TC Energy Corp. | | | 6,916,546 | | | | 1.8 | |
| 164,698 | | (3) | | Total S.A. ADR | | | 9,107,799 | | | | 2.4 | |
| 99,405 | | | | Other Securities | | | 6,231,873 | | | | 1.6 | |
| | | | | | | | 33,519,163 | | | | 8.7 | |
| |
| | |
| 124,321 | | | | American International Group, Inc. | | | 6,381,397 | | | | 1.7 | |
| 47,175 | | | | Chubb Ltd. | | | 7,343,261 | | | | 1.9 | |
| 14,266 | | | | Citigroup, Inc. | | | 1,139,711 | | | | 0.3 | |
| 186,582 | | | | Fifth Third Bancorp | | | 5,735,531 | | | | 1.5 | |
| 92,912 | | | | JPMorgan Chase & Co. | | | 12,951,933 | | | | 3.4 | |
| 61,376 | | | | Loews Corp. | | | 3,221,626 | | | | 0.9 | |
| 104,126 | | | | Metlife, Inc. | | | 5,307,302 | | | | 1.4 | |
| 145,591 | | | | Morgan Stanley | | | 7,442,612 | | | | 1.9 | |
| 27,332 | | | | PNC Financial Services Group, Inc. | | | 4,363,007 | | | | 1.1 | |
| 77,816 | | | | State Street Corp. | | | 6,155,246 | | | | 1.6 | |
| 70,587 | | | | US Bancorp | | | 4,185,103 | | | | 1.1 | |
| 273,233 | | | | Wells Fargo & Co. | | | 14,699,935 | | | | 3.8 | |
| 242,548 | | | | Other Securities | | | 11,989,043 | | | | 3.1 | |
| | | | | | | | 90,915,707 | | | | 23.7 | |
| |
| | |
| 17,703 | | | | Allergan plc | | | 3,384,283 | | | | 0.9 | |
| 17,850 | | | | Anthem, Inc. | | | 5,391,236 | | | | 1.4 | |
| 84,351 | | | | CVS Health Corp. | | | 6,266,436 | | | | 1.6 | |
| 57,320 | | | | Gilead Sciences, Inc. | | | 3,724,654 | | | | 1.0 | |
| 59,474 | | | | Johnson & Johnson | | | 8,675,472 | | | | 2.3 | |
| 49,861 | | | | Medtronic PLC | | | 5,656,730 | | | | 1.5 | |
| 152,155 | | | | Pfizer, Inc. | | | 5,961,433 | | | | 1.5 | |
| 136,245 | | | | Other Securities | | | 8,875,624 | | | | 2.3 | |
| | | | | | | | 47,935,868 | | | | 12.5 | |
| |
| Shares | | | | | | Value | | | Percentage
of Net
Assets |
|---|
| |
|---|
COMMON STOCK: (continued) |
| | |
| 18,864 | | | | Boeing Co. | | $ | 6,145,137 | | | | 1.6 | |
| 627,060 | | | | General Electric Co. | | | 6,997,989 | | | | 1.8 | |
| 28,831 | | | | L3Harris Technologies, Inc. | | | 5,704,790 | | | | 1.5 | |
| 49,469 | | | | United Parcel Service, Inc. — Class B | | | 5,790,841 | | | | 1.5 | |
| 446,434 | | (1),(2) | | Other Securities | | | 20,988,753 | | | | 5.5 | |
| | | | | | | | 45,627,510 | | | | 11.9 | |
| |
| | Information Technology: 8.0% |
| 92,845 | | | | Cisco Systems, Inc. | | | 4,452,846 | | | | 1.2 | |
| 37,627 | | | | Microsoft Corp. | | | 5,933,778 | | | | 1.5 | |
| 110,029 | | | | Qualcomm, Inc. | | | 9,707,858 | | | | 2.5 | |
| 25,461 | | | | Texas Instruments, Inc. | | | 3,266,392 | | | | 0.9 | |
| 107,349 | | | | Other Securities | | | 7,408,176 | | | | 1.9 | |
| | | | | | | | 30,769,050 | | | | 8.0 | |
| |
| | |
| 78,743 | | | | CF Industries Holdings, Inc. | | | 3,759,191 | | | | 1.0 | |
| 55,942 | | | | Dow, Inc. | | | 3,061,705 | | | | 0.8 | |
| 57,621 | | | | DowDuPont, Inc. | | | 3,699,268 | | | | 0.9 | |
| 73,618 | | | | International Paper Co. | | | 3,390,109 | | | | 0.9 | |
| 73,373 | | | | Other Securities | | | 3,383,532 | | | | 0.9 | |
| | | | | | | | 17,293,805 | | | | 4.5 | |
| |
| | |
| 42,916 | | | | Equity Residential | | | 3,472,763 | | | | 0.9 | |
| 154,274 | | | | Weyerhaeuser Co. | | | 4,659,075 | | | | 1.2 | |
| 115,762 | | | | Other Securities | | | 5,323,689 | | | | 1.4 | |
| | | | | | | | 13,455,527 | | | | 3.5 | |
| |
| | |
| 66,485 | | | | Edison International | | | 5,013,634 | | | | 1.3 | |
| 16,095 | | | | NextEra Energy, Inc. | | | 3,897,565 | | | | 1.0 | |
| 197,880 | | | | NiSource, Inc. | | | 5,508,979 | | | | 1.4 | |
| 142,422 | | | | Southern Co. | | | 9,072,282 | | | | 2.4 | |
| 81,245 | | | | Other Securities | | | 3,903,105 | | | | 1.0 | |
| | | | | | | | 27,395,565 | | | | 7.1 | |
| | | | | Total Common Stock
(Cost $292,182,521) | | | 370,177,691 | | | | 96.3 | |
| |
PREFERRED STOCK: 2.2% |
| | |
| 50,016 | | | | Becton Dickinson and Co. | | | 3,274,048 | | | | 0.9 | |
| |
| | |
| 63,419 | | (1),(2) | | Other Securities | | | 5,027,098 | | | | 1.3 | |
| | | | | Total Preferred Stock
(Cost $6,841,268) | | | 8,301,146 | | | | 2.2 | |
See Accompanying Notes to Financial Statements
80
VY® T. ROWE PRICE
EQUITY INCOME PORTFOLIO | SUMMARY PORTFOLIO OF INVESTMENTS
AS OF DECEMBER 31, 2019 (CONTINUED) |
Principal
Amount† | | | | | | Value | | | Percentage
of Net
Assets |
|---|
| |
CONVERTIBLE BONDS/NOTES: 0.2% |
| | |
| 772,000 | | (4) | | AXA SA, 7.250%, 05/15/2021 | | $ | 891,563 | | | | 0.2 | |
| | | | | Total Convertible Bonds/Notes
(Cost $772,000) | | | 891,563 | | | | 0.2 | |
| | | | | Total Long-Term Investments
(Cost $299,795,789) | | | 379,370,400 | | | | 98.7 | |
| | | | | | | | | | | | | |
SHORT-TERM INVESTMENTS: 4.6% |
| | Repurchase Agreements: 3.4% |
| 3,057,659 | | (5) | | Cantor Fitzgerald Securities, Repurchase Agreement dated
12/31/19, 1.58%, due 01/02/20 (Repurchase Amount $3,057,924, collateralized by various U.S. Government/U.S. Government Agency Obligations, 0.000%–8.500%, Market Value plus accrued interest $3,118,812, due 01/25/20–10/15/60) | | | 3,057,659 | | | | 0.8 | |
| 905,992 | | (5) | | Citadel Securities LLC, Repurchase Agreement dated 12/31/19, 1.60%, due 01/02/20 (Repurchase Amount $906,071, collateralized by various U.S. Government Securities, 0.000%–8.500%, Market Value plus accrued interest $924,194, due 01/15/20-11/15/48) | | | 905,992 | | | | 0.2 | |
| 3,057,659 | | (5) | | Citigroup, Inc., Repurchase Agreement dated 12/31/19, 1.57%, due 01/02/20 (Repurchase Amount $3,057,922, collateralized by various U.S. Government/U.S. Government Agency Obligations, 0.000%–9.000%, Market Value plus accrued interest $3,118,812, due 02/13/20–09/20/69) | | | 3,057,659 | | | | 0.8 | |
| 3,057,659 | | (5) | | Jefferies LLC, Repurchase Agreement dated
12/31/19, 1.58%, due 01/02/20 (Repurchase Amount $3,057,924, collateralized by various U.S. Government Securities, 0.000%–2.875%, Market Value plus accrued interest $3,118,813, due 01/28/20–05/15/27) | | | 3,057,659 | | | | 0.8 | |
| |
Principal
Amount† | | | | | | Value | | | Percentage
of Net
Assets |
|---|
| |
SHORT-TERM INVESTMENTS: (continued) |
| | Repurchase Agreements: (continued) |
| 3,057,659 | | (5) | | RBC Dominion Securities Inc., Repurchase Agreement dated
12/31/19, 1.57%, due 01/02/20 (Repurchase Amount $3,057,922, collateralized by various U.S. Government/U.S. Government Agency Obligations, 0.000%–6.500%, Market Value plus accrued interest $3,118,812, due 06/30/21–12/01/49) | | $ | 3,057,659 | | | | 0.8 | |
| | | | | Total Repurchase Agreements
(Cost $13,136,628) | | | 13,136,628 | | | | 3.4 | |
| Shares | | | | | | Value | | Percentage
of Net Assets |
|---|
| | |
| 4,450,645 | | (6) | | T. Rowe Price Government Reserve Fund, 1.590%
(Cost $4,450,645) | | | 4,450,645 | | | | 1.2 | |
| | | | | Total Short-Term Investments
(Cost $17,587,273) | | | 17,587,273 | | | | 4.6 | |
| | | | | Total Investments in Securities
(Cost $317,383,062) | | $ | 396,957,673 | | | |
103.3 |
|
| | | | | Liabilities in Excess of Other Assets | | | (12,508,949 | ) | | | (3.3 | ) |
| | | | | Net Assets | | $ | 384,448,724 | | | | 100.0 | |
“Other Securities” represents issues not identified as the top 50 holdings in terms of market value and issues or issuers not exceeding 1% of net assets individually or in aggregate respectively as of December 31, 2019.
The following footnotes apply to either the individual securities noted or one or more of the securities aggregated and listed as a single line item.
| † | | Unless otherwise indicated, principal amount is shown in USD. |
| ADR | | American Depositary Receipt |
| (1) | | The grouping contains securities on loan. |
| (2) | | The grouping contains non-income producing securities. |
| (3) | | Security, or a portion of the security, is on loan. |
| (4) | | Securities with purchases pursuant to Rule 144A or section 4(a)(2), under the Securities Act of 1933 and may not be resold subject to that rule except to qualified institutional buyers. |
| (5) | | All or a portion of the security represents securities purchased with cash collateral received for securities on loan. |
| (6) | | Rate shown is the 7-day yield as of December 31, 2019. |
See Accompanying Notes to Financial Statements
81
VY® T. ROWE PRICE
EQUITY INCOME PORTFOLIO | SUMMARY PORTFOLIO OF INVESTMENTS
AS OF DECEMBER 31, 2019 (CONTINUED) |
Fair Value Measurementsˆ
The following is a summary of the fair valuations according to the inputs used as of December 31, 2019 in valuing the assets and liabilities:
| | Quoted Prices
in Active Markets
for Identical
Investments
(Level 1) | | Significant
Other
Observable
Inputs#
(Level 2) | | Significant
Unobservable
Inputs
(Level 3) | | Fair Value
at
December 31, 2019 |
|---|
Asset Table | | | | | | | | | | | | | | | | | | | | |
Investments, at fair value | | | | | | | | | | | | | | | | | | | | |
| Common Stock | | | | | | | | | | | | | | | | | | | | |
| Communication Services | | | $ | 21,944,065 | | | | $ | 1,520,658 | | | | $ | — | | | | $ | 23,464,723 | |
| Consumer Discretionary | | | | 9,328,179 | | | | | — | | | | | — | | | | | 9,328,179 | |
| Consumer Staples | | | | 30,472,594 | | | | | — | | | | | — | | | | | 30,472,594 | |
| Energy | | | | 33,519,163 | | | | | — | | | | | — | | | | | 33,519,163 | |
| Financials | | | | 90,915,707 | | | | | — | | | | | — | | | | | 90,915,707 | |
| Health Care | | | | 46,476,504 | | | | | 1,459,364 | | | | | — | | | | | 47,935,868 | |
| Industrials | | | | 45,627,510 | | | | | — | | | | | — | | | | | 45,627,510 | |
| Information Technology | | | | 30,769,050 | | | | | — | | | | | — | | | | | 30,769,050 | |
| Materials | | | | 16,669,110 | | | | | 624,695 | | | | | — | | | | | 17,293,805 | |
| Real Estate | | | | 13,455,527 | | | | | — | | | | | — | | | | | 13,455,527 | |
| Utilities | | | | 27,395,565 | | | | | — | | | | | — | | | | | 27,395,565 | |
| Total Common Stock | | | | 366,572,974 | | | | | 3,604,717 | | | | | — | | | | | 370,177,691 | |
| Preferred Stock | | | | 6,668,125 | | | | | 1,633,021 | | | | | — | | | | | 8,301,146 | |
| Convertible Bonds/Notes | | | | — | | | | | 891,563 | | | | | — | | | | | 891,563 | |
| Short-Term Investments | | | | 4,450,645 | | | | | 13,136,628 | | | | | — | | | | | 17,587,273 | |
| Total Investments, at fair value | | | $ | 377,691,744 | | | | $ | 19,265,929 | | | | $ | — | | | | $ | 396,957,673 | |
| ˆ | | See Note 2, “Significant Accounting Policies” in the Notes to Financial Statements for additional information. |
| # | | The earlier close of the foreign markets gives rise to the possibility that significant events, including broad market moves, may have occurred in the interim and may materially affect the value of those securities. To account for this, the Portfolio may frequently value many of its foreign equity securities using fair value prices based on third party vendor modeling tools to the extent available. Accordingly, a portion of the Portfolio’s investments are categorized as Level 2 investments. |
The effect of derivative instruments on the Fund’s Statement of Operations for the year ended December 31, 2019 was as follows:
| | Amount of Realized Gain or (Loss)
on Derivatives Recognized in Income |
|---|
| Derivatives not accounted for as hedging instruments | | Futures |
|---|
| Equity contracts | | | $ | (645 | ) |
Total | | | $ | (645 | ) |
At December 31, 2019, the aggregate cost of securities and other investments and the composition of unrealized appreciation and depreciation of securities and other investments at year end were:
| Cost for federal income tax purposes was $318,787,327. |
| | | | | |
| Net unrealized appreciation consisted of: | | | | |
| Gross Unrealized Appreciation | | $ | 88,217,532 | |
| Gross Unrealized Depreciation | | | (9,941,636) | |
| Net Unrealized Appreciation | | $ | 78,275,896 | |
See Accompanying Notes to Financial Statements
82
VY® T. ROWE PRICE INTERNATIONAL
STOCK PORTFOLIO | SUMMARY PORTFOLIO OF INVESTMENTS
AS OF DECEMBER 31, 2019 |
| Shares | | | | | | Value | | | Percentage
of Net
Assets |
|---|
| |
COMMON STOCK: 97.5% |
| | |
| 4,819 | | (1) | | Other Securities | | $ | 511,055 | | | | 0.2 | |
| |
| | |
| 280,893 | | | | Amcor PLC | | | 3,071,343 | | | | 1.4 | |
| 602,110 | | | | Other Securities | | | 1,136,853 | | | | 0.5 | |
| | | | | | | | 4,208,196 | | | | 1.9 | |
| |
| | |
| 74,868 | | | | Erste Group Bank AG | | | 2,812,217 | | | | 1.3 | |
| |
| | |
| 4,563 | | (1),(2) | | Other Securities | | | 950,238 | | | | 0.4 | |
| |
| | |
| 116,936 | | (1) | | Other Securities | | | 2,242,167 | | | | 1.0 | |
| |
| | |
| 174,917 | | (1) | | Other Securities | | | 2,441,959 | | | | 1.1 | |
| |
| | |
| 52,192 | | | | Magna International, Inc. | | | 2,862,209 | | | | 1.3 | |
| 23,456 | | | | Waste Connections, Inc. | | | 2,129,570 | | | | 1.0 | |
| 277,583 | | (1) | | Other Securities | | | 3,945,089 | | | | 1.8 | |
| | | | | | | | 8,936,868 | | | | 4.1 | |
| |
| | |
| 22,621 | | (3) | | Alibaba Group Holding Ltd. ADR | | | 4,797,914 | | | | 2.2 | |
| 195,300 | | | | Gree Electric Appliances, Inc. of Zhuhai — A Shares | | | 1,841,825 | | | | 0.9 | |
| 11,189 | | | | Kweichow Moutai Co. Ltd. — A Shares | | | 1,904,114 | | | | 0.9 | |
| 54,500 | | | | Tencent Holdings Ltd. | | | 2,625,601 | | | | 1.2 | |
| 513,562 | | (1) | | Other Securities | | | 3,068,708 | | | | 1.4 | |
| | | | | | | | 14,238,162 | | | | 6.6 | |
| |
| | |
| 12,713 | | | | Air Liquide SA | | | 1,802,341 | | | | 0.8 | |
| 1,768 | | | | Dassault Aviation SA | | | 2,320,314 | | | | 1.1 | |
| 18,932 | | | | EssilorLuxottica SA | | | 2,894,366 | | | | 1.3 | |
| 53,780 | | | | Thales S.A. | | | 5,596,097 | | | | 2.6 | |
| 34,206 | | (1) | | Other Securities | | | 2,695,768 | | | | 1.3 | |
| | | | | | | | 15,308,886 | | | | 7.1 | |
| |
| | |
| 33,896 | | | | Bayer AG | | | 2,755,643 | | | | 1.3 | |
| 17,504 | | | | SAP SE | | | 2,356,019 | | | | 1.1 | |
| 11,162 | | (3),(4) | | Zalando SE | | | 562,904 | | | | 0.2 | |
| 79,424 | | (1),(2) | | Other Securities | | | 3,929,810 | | | | 1.8 | |
| | | | | | | | 9,604,376 | | | | 4.4 | |
| |
| | |
| 354,200 | | | | AIA Group Ltd. | | | 3,725,464 | | | | 1.7 | |
| 146,140 | | | | Other Securities | | | 1,803,915 | | | | 0.9 | |
| | | | | | | | 5,529,379 | | | | 2.6 | |
| |
| | |
| 240,854 | | | | Axis Bank Ltd. | | | 2,546,042 | | | | 1.2 | |
| 130,454 | | | | Housing Development Finance Corp. | | | 4,410,970 | | | | 2.0 | |
| 1,516,934 | | | | NTPC Ltd. | | | 2,530,060 | | | | 1.2 | |
| 13,173 | | | | Other Securities | | | 1,360,129 | | | | 0.6 | |
| | | | | | | | 10,847,201 | | | | 5.0 | |
| |
| Shares | | | | | | Value | | | Percentage
of Net
Assets |
|---|
| |
COMMON STOCK: (continued) |
| | |
| 1,171,600 | | | | Bank Central Asia Tbk PT | | $ | 2,817,706 | | | | 1.3 | |
| 21,527,600 | | | | Other Securities | | | 1,248,314 | | | | 0.6 | |
| | | | | | | | 4,066,020 | | | | 1.9 | |
| |
| | |
| 141,009 | | | | Other Securities | | | 1,401,231 | | | | 0.7 | |
| |
| | |
| 77,900 | | | | Fujitsu General Ltd. | | | 1,748,151 | | | | 0.8 | |
| 39,600 | | | | Murata Manufacturing Co., Ltd. | | | 2,437,325 | | | | 1.1 | |
| 133,700 | | | | Nippon Telegraph & Telephone Corp. | | | 3,379,092 | | | | 1.6 | |
| 76,200 | | | | Seven & I Holdings Co., Ltd. | | | 2,793,144 | | | | 1.3 | |
| 114,660 | | | | Takeda Pharmaceutical Co., Ltd. | | | 4,535,058 | | | | 2.1 | |
| 514,600 | | | | Z Holdings Corp. | | | 2,172,700 | | | | 1.0 | |
| 495,300 | | (1),(2) | | Other Securities | | | 14,168,625 | | | | 6.6 | |
| | | | | | | | 31,234,095 | | | | 14.5 | |
| |
| | |
| 443 | | (3),(4) | | Adyen NV | | | 364,412 | | | | 0.2 | |
| 12,653 | | | | Airbus SE | | | 1,857,029 | | | | 0.9 | |
| 11,025 | | | | ASML Holding NV | | | 3,264,038 | | | | 1.5 | |
| 67,278 | | | | Koninklijke Philips NV | | | 3,288,813 | | | | 1.5 | |
| 34,005 | | | | NXP Semiconductor NV — NXPI — US | | | 4,327,476 | | | | 2.0 | |
| 40,634 | | (3) | | Prosus NV | | | 3,041,127 | | | | 1.4 | |
| 29,969 | | | | Unilever NV | | | 1,719,950 | | | | 0.8 | |
| | | | | | | | 17,862,845 | | | | 8.3 | |
| |
| | |
| 6,356 | | | | Other Securities | | | 1,354,654 | | | | 0.6 | |
| |
| | |
| 40,145 | | | | Other Securities | | | 826,111 | | | | 0.4 | |
| |
| | |
| 107,724 | | | | Other Securities | | | 1,137,721 | | | | 0.5 | |
| |
| | |
| 193,074 | | | | Galp Energia SGPS SA | | | 3,241,352 | | | | 1.5 | |
| 146,094 | | | | Jeronimo Martins SGPS SA | | | 2,407,536 | | | | 1.1 | |
| | | | | | | | 5,648,888 | | | | 2.6 | |
| |
| | |
| 47,562 | | | | Other Securities | | | 829,396 | | | | 0.4 | |
| |
| | |
| 26,063 | | | | Naspers Ltd. | | | 4,265,132 | | | | 2.0 | |
| 326,814 | | | | Other Securities | | | 1,466,410 | | | | 0.7 | |
| | | | | | | | 5,731,542 | | | | 2.7 | |
| |
| | |
| 25,359 | | | | NAVER Corp. | | | 4,080,135 | | | | 1.9 | |
| 86,997 | | | | Samsung Electronics Co., Ltd. | | | 4,192,114 | | | | 1.9 | |
| 1,173 | | | | Other Securities | | | 1,274,174 | | | | 0.6 | |
| | | | | | | | 9,546,423 | | | | 4.4 | |
See Accompanying Notes to Financial Statements
83
VY® T. ROWE PRICE INTERNATIONAL
STOCK PORTFOLIO | SUMMARY PORTFOLIO OF INVESTMENTS
AS OF DECEMBER 31, 2019 (CONTINUED) |
| Shares | | | | | | Value | | | Percentage
of Net
Assets |
|---|
| |
COMMON STOCK: (continued) |
| | |
| 32,676 | | | | Amadeus IT Group SA | | $ | 2,676,071 | | | | 1.2 | |
| |
| | |
| 130,772 | | | | Essity AB | | | 4,211,674 | | | | 2.0 | |
| 23,838 | | | | Other Securities | | | 1,336,151 | | | | 0.6 | |
| | | | | | | | 5,547,825 | | | | 2.6 | |
| |
| | |
| 42,195 | | | | Julius Baer Group Ltd. | | | 2,175,276 | | | | 1.0 | |
| 8,366 | | | | Lonza Group AG | | | 3,051,979 | | | | 1.4 | |
| 37,005 | | | | Nestle SA | | | 4,006,356 | | | | 1.9 | |
| 6,460 | | | | Roche Holding AG | | | 2,099,518 | | | | 1.0 | |
| 220,560 | | | | UBS Group AG | | | 2,783,332 | | | | 1.3 | |
| 23,324 | | (1) | | Other Securities | | | 2,258,063 | | | | 1.0 | |
| | | | | | | | 16,374,524 | | | | 7.6 | |
| |
| | |
| 434,000 | | | | Taiwan Semiconductor Manufacturing Co., Ltd. | | | 4,803,438 | | | | 2.2 | |
| |
| | |
| 546,000 | | | | Other Securities | | | 1,315,626 | | | | 0.6 | |
| |
| | United Arab Emirates: 1.4% |
| 198,302 | | (3),(4) | | Network International Holdings PLC | | | 1,678,693 | | | | 0.8 | |
| 298,583 | | | | Other Securities | | | 1,234,623 | | | | 0.6 | |
| | | | | | | | 2,913,316 | | | | 1.4 | |
| |
| | |
| 52,418 | | | | British American Tobacco PLC | | | 2,227,889 | | | | 1.0 | |
| 11,567 | | | | Linde PLC | | | 2,481,953 | | | | 1.2 | |
| 26,188 | | | | London Stock Exchange Group PLC | | | 2,691,413 | | | | 1.2 | |
| 673,501 | | (1) | | Other Securities | | | 6,016,802 | | | | 2.8 | |
| | | | | | | | 13,418,057 | | | | 6.2 | |
| |
| | |
| 1,049 | | (3) | | Booking Holdings, Inc. | | | 2,154,363 | | | | 1.0 | |
| 34,469 | | | | Philip Morris International, Inc. | | | 2,932,967 | | | | 1.4 | |
| 4,557 | | | | Other Securities | | | 1,360,675 | | | | 0.6 | |
| | | | | | | | 6,448,005 | | | | 3.0 | |
| |
| | | | | Total Common Stock
(Cost $169,810,217) | | | 210,766,492 | | | | 97.5 | |
| |
PREFERRED STOCK: 0.6% |
| | |
| 9,427 | | (3),(5),
(6) | | Xiaoju Kuaizhi, Inc., Series A-17 (DiDi Chuxing, Inc.) | | | 480,137 | | | | 0.2 | |
| |
| | |
| 1,509 | | | | Other Securities | | | 322,568 | | | | 0.2 | |
| |
| Shares | | | | | | Value | | | Percentage
of Net
Assets |
|---|
| |
PREFERRED STOCK: (continued) |
| | |
| 990 | | (3),(5),
(6) | | Roofoods Ltd. — Series G | | $ | 413,722 | | | | 0.2 | |
| |
| | | | | Total Preferred Stock
(Cost $876,143) | | | 1,216,427 | | | | 0.6 | |
| |
| | | | | Total Long-Term Investments
(Cost $170,686,360) | | | 211,982,919 | | | |
98.1 |
|
Principal
Amount† | | | | | | Value | | | Percentage
of Net
Assets |
|---|
| |
SHORT-TERM INVESTMENTS: 2.4% |
| | Repurchase Agreements: 1.1% |
| 344,711 | | (7) | | Citadel Securities LLC, Repurchase Agreement dated 12/31/19, 1.60%, due 01/02/20 (Repurchase Amount $344,741, collateralized by various U.S. Government Securities, 0.000%–8.500%, Market Value plus accrued interest $351,636, due 01/15/20–11/15/48) | | | 344,711 | | | | 0.1 | |
| 1,000,000 | | (7) | | Citigroup, Inc., Repurchase Agreement dated 12/31/19, 1.57%, due 01/02/20 (Repurchase Amount $1,000,086, collateralized by various U.S. Government/U.S. Government Agency Obligations, 0.000%–9.000%, Market Value plus accrued interest $1,020,000, due 02/13/20–09/20/69) | | | 1,000,000 | | | | 0.5 | |
| 1,000,000 | | (7) | | Daiwa Capital Markets, Repurchase Agreement dated 12/31/19, 1.58%, due 01/02/20 (Repurchase Amount $1,000,087, collateralized by various U.S. Government/U.S. Government Agency Obligations, 0.000%–6.030%, Market Value plus accrued interest $1,020,000, due 01/14/20–12/20/49) | | | 1,000,000 | | | | 0.5 | |
| |
| | | | | Total Repurchase Agreements
(Cost $2,344,711) | | | 2,344,711 | | | | 1.1 | |
See Accompanying Notes to Financial Statements
84
VY® T. ROWE PRICE INTERNATIONAL
STOCK PORTFOLIO | SUMMARY PORTFOLIO OF INVESTMENTS
AS OF DECEMBER 31, 2019 (CONTINUED) |
| Shares | | | | | | Value | | | Percentage
of Net
Assets |
|---|
| |
SHORT-TERM INVESTMENTS: (continued) |
| | |
| 2,947,686 | | (8) | | T. Rowe Price Government Reserve Fund, 1.590%
(Cost $2,947,686) | | $ | 2,947,686 | | | | 1.3 | |
|---|
| |
| | | | | Total Short-Term Investments
(Cost $5,292,397) | | | 5,292,397 | | | | 2.4 | |
| | | | | Total Investments in Securities
(Cost $175,978,757) | | $ | 217,275,316 | | | | 100.5 | |
| | | | | Liabilities in Excess of Other Assets | | | (1,070,600 | ) | | | (0.5 | ) |
| | | | | Net Assets | | $ | 216,204,716 | | | | 100.0 | |
“Other Securities” represents issues not identified as the top 50 holdings in terms of market value and issues or issuers not exceeding 1% of net assets individually or in aggregate respectively as of December 31, 2019.
The following footnotes apply to either the individual securities noted or one or more of the securities aggregated and listed as a single line item.
| † | | Unless otherwise indicated, principal amount is shown in USD. |
| ADR | | American Depositary Receipt |
| (1) | | The grouping contains non-income producing securities. |
| (2) | | The grouping contains securities on loan. |
| (3) | | Non-income producing security. |
| (4) | | Securities with purchases pursuant to Rule 144A or section 4(a)(2), under the Securities Act of 1933 and may not be resold subject to that rule except to qualified institutional buyers. |
| (5) | | For fair value measurement disclosure purposes, security is categorized as Level 3, whose value was determined using significant unobservable inputs. |
| (6) | | Restricted security as to resale, excluding Rule 144A securities. As of December 31, 2019, the Portfolio held restricted securities with a fair value of $893,859 or 0.4% of net assets. Please refer to the table below for additional details. |
| (7) | | All or a portion of the security represents securities purchased with cash collateral received for securities on loan. |
| (8) | | Rate shown is the 7-day yield as of December 31, 2019. |
| Sector Diversification | | Percentage
of Net Assets |
|---|
| Financials | | | 15.7 | % |
| Information Technology | | | 15.3 | |
| Consumer Discretionary | | | 15.0 | |
| Consumer Staples | | | 12.3 | |
| Health Care | | | 11.9 | |
| Industrials | | | 11.3 | |
| Communication Services | | | 8.5 | |
| Materials | | | 4.2 | |
| Energy | | | 2.7 | |
| Utilities | | | 1.2 | |
| Short-Term Investments | | | 2.4 | |
| Liabilities in Excess of Other Assets | | | (0.5 | ) |
Net Assets | | | 100.0 | % |
Fair Value Measurementsˆ
The following is a summary of the fair valuations according to the inputs used as of December 31, 2019 in valuing the assets and liabilities:
| | Quoted Prices
in Active Markets
for Identical
Investments
(Level 1) | | Significant
Other
Observable
Inputs#
(Level 2) | | Significant
Unobservable
Inputs
(Level 3) | | Fair Value
at
December 31, 2019 |
|---|
Asset Table | | | | | | | | | | | | | | | | | | | | |
Investments, at fair value | | | | | | | | | | | | | | | | | | | | |
| Common Stock | | | | | | | | | | | | | | | | | | | | |
| Argentina | | | $ | 511,055 | | | | $ | — | | | | $ | — | | | | $ | 511,055 | |
| Australia | | | | — | | | | | 4,208,196 | | | | | — | | | | | 4,208,196 | |
| Austria | | | | — | | | | | 2,812,217 | | | | | — | | | | | 2,812,217 | |
| Belgium | | | | — | | | | | 950,238 | | | | | — | | | | | 950,238 | |
| Bermuda | | | | 2,242,167 | | | | | — | | | | | — | | | | | 2,242,167 | |
| Brazil | | | | 2,441,959 | | | | | — | | | | | — | | | | | 2,441,959 | |
| Canada | | | | 8,936,868 | | | | | — | | | | | — | | | | | 8,936,868 | |
| China | | | | 6,109,473 | | | | | 8,128,689 | | | | | — | | | | | 14,238,162 | |
| France | | | | 2,320,314 | | | | | 12,988,572 | | | | | — | | | | | 15,308,886 | |
| Germany | | | | 2,250,588 | | | | | 7,353,788 | | | | | — | | | | | 9,604,376 | |
| Hong Kong | | | | — | | | | | 5,529,379 | | | | | — | | | | | 5,529,379 | |
| India | | | | 2,530,060 | | | | | 8,317,141 | | | | | — | | | | | 10,847,201 | |
| Indonesia | | | | 1,248,314 | | | | | 2,817,706 | | | | | — | | | | | 4,066,020 | |
| Italy | | | | — | | | | | 1,401,231 | | | | | — | | | | | 1,401,231 | |
| Japan | | | | — | | | | | 31,234,095 | | | | | — | | | | | 31,234,095 | |
| Netherlands | | | | 4,327,476 | | | | | 13,535,369 | | | | | — | | | | | 17,862,845 | |
| Peru | | | | 1,354,654 | | | | | — | | | | | — | | | | | 1,354,654 | |
| Philippines | | | | — | | | | | 826,111 | | | | | — | | | | | 826,111 | |
| Poland | | | | — | | | | | 1,137,721 | | | | | — | | | | | 1,137,721 | |
| Portugal | | | | — | | | | | 5,648,888 | | | | | — | | | | | 5,648,888 | |
| Saudi Arabia | | | | — | | | | | 829,396 | | | | | — | | | | | 829,396 | |
| South Africa | | | | — | | | | | 5,731,542 | | | | | — | | | | | 5,731,542 | |
| South Korea | | | | — | | | | | 9,546,423 | | | | | — | | | | | 9,546,423 | |
| Spain | | | | — | | | | | 2,676,071 | | | | | — | | | | | 2,676,071 | |
| Sweden | | | | — | | | | | 5,547,825 | | | | | — | | | | | 5,547,825 | |
| Switzerland | | | | 1,017,498 | | | | | 15,357,026 | | | | | — | | | | | 16,374,524 | |
See Accompanying Notes to Financial Statements
85
VY® T. ROWE PRICE INTERNATIONAL
STOCK PORTFOLIO | SUMMARY PORTFOLIO OF INVESTMENTS
AS OF DECEMBER 31, 2019 (CONTINUED) |
| | Quoted Prices
in Active Markets
for Identical
Investments
(Level 1) | | Significant
Other
Observable
Inputs#
(Level 2) | | Significant
Unobservable
Inputs
(Level 3) | | Fair Value
at
December 31, 2019 |
|---|
| Common Stock (continued) | | | | | | | | | | | | | | | | |
| Taiwan | | $ | — | | | $ | 4,803,438 | | | $ | — | | | $ | 4,803,438 | |
| Thailand | | | — | | | | 1,315,626 | | | | — | | | | 1,315,626 | |
| United Arab Emirates | | | — | | | | 2,913,316 | | | | — | | | | 2,913,316 | |
| United Kingdom | | | 2,872,977 | | | | 10,545,080 | | | | — | | | | 13,418,057 | |
| United States | | | 6,448,005 | | | | — | | | | — | | | | 6,448,005 | |
| Total Common Stock | | | 44,611,408 | | | | 166,155,084 | | | | — | | | | 210,766,492 | |
| Preferred Stock | | | — | | | | 322,568 | | | | 893,859 | | | | 1,216,427 | |
| Short-Term Investments | | | 2,947,686 | | | | 2,344,711 | | | | — | | | | 5,292,397 | |
| Total Investments, at fair value | | $ | 47,559,094 | | | $ | 168,822,363 | | | $ | 893,859 | | | $ | 217,275,316 | |
Other Financial Instruments+ | | | | | | | | | | | | | | | | |
| Forward Foreign Currency Contracts | | | — | | | | 2,925 | | | | — | | | | 2,925 | |
| Total Assets | | $ | 47,559,094 | | | $ | 168,825,288 | | | $ | 893,859 | | | $ | 217,278,241 | |
Liabilities Table | | | | | | | | | | | | | | | | |
Other Financial Instruments+ | | | | | | | | | | | | | | | | |
| Forward Foreign Currency Contracts | | $ | — | | | $ | (35 | ) | | $ | — | | | $ | (35 | ) |
| Written Options | | | — | | | | (6,490 | ) | | | — | | | | (6,490 | ) |
| Total Liabilities | | $ | — | | | $ | (6,525 | ) | | $ | — | | | $ | (6,525 | ) |
| ˆ | | See Note 2, “Significant Accounting Policies” in the Notes to Financial Statements for additional information. |
| + | | Other Financial Instruments may include open forward foreign currency contracts, futures, centrally cleared swaps, OTC swaps and written options. Forward foreign currency contracts, futures and centrally cleared swaps are valued at the unrealized gain (loss) on the instrument. OTC swaps and written options are valued at the fair value of the instrument. |
| # | | The earlier close of the foreign markets gives rise to the possibility that significant events, including broad market moves, may have occurred in the interim and may materially affect the value of those securities. To account for this, the Portfolio may frequently value many of its foreign equity securities using fair value prices based on third party vendor modeling tools to the extent available. Accordingly, a portion of the Portfolio’s investments are categorized as Level 2 investments. |
At December 31, 2019, VY®T. Rowe Price International Stock Portfolio held the following restricted securities:
| Security | | Acquisition
Date | | Acquisition
Cost | | Fair
Value |
|---|
| Roofoods Ltd. — Series G | | | 5/16/2019 | | | $ | 413,722 | | | $ | 413,722 | |
| Xiaoju Kuaizhi, Inc., Series A-17 (DiDi Chuxing, Inc.) | | | 10/19/2015 | | | | 258,547 | | | | 480,137 | |
| | | | | | | $ | 672,269 | | | $ | 893,859 | |
At December 31, 2019, the following forward foreign currency contracts were outstanding for VY® T. Rowe Price International Stock Portfolio:
| Currency Purchased | | Currency Sold | | | Counterparty | | Settlement
Date | | Unrealized
Appreciation
(Depreciation) |
|---|
| USD | 1,049,399 | | | JPY | 113,665,000 | | | | CIBC World Markets Corp. | | | 01/15/20 | | | | $ | 2,579 | |
| JPY | 4,312,009 | | | USD | 39,373 | | | | The Bank of New York Mellon | | | 01/06/20 | | | | | 312 | |
| JPY | 807,314 | | | USD | 7,397 | | | | The Bank of New York Mellon | | | 01/07/20 | | | | | 34 | |
| USD | 7,645 | | | JPY | 834,486 | | | | The Bank of New York Mellon | | | 01/07/20 | | | | | (35 | ) |
| | | | | | | | | | | | | | | | | $ | 2,890 | |
At December 31, 2019, the following OTC written equity options were outstanding for VY® T. Rowe Price International Stock Portfolio:
| Description | | Counterparty | | Put/Call | | Expiration
Date | | Exercise
Price | | Number of
Contracts | | Notional
Amount | | Premiums
Received | | Fair
Value |
|---|
| Erste Group Bank AG | | JPMorgan Chase & Co. | | Call | | 01/17/20 | | EUR | 35.000 | | | 29 | | EUR | 97,324 | | | | $ | 1,417 | | | | $ | (473 | ) |
| Hexagon AB — B Shares | | JPMorgan Chase & Co. | | Call | | 01/17/20 | | SEK | 570.000 | | | 1 | | SEK | 52,500 | | | | | 58 | | | | | (7 | ) |
| Ubisoft Entertainment | | JPMorgan Chase & Co. | | Call | | 01/17/20 | | EUR | 60.000 | | | 16 | | EUR | 98,528 | | | | | 2,160 | | | | | (4,579 | ) |
| Ubisoft Entertainment | | JPMorgan Chase & Co. | | Call | | 01/17/20 | | EUR | 60.000 | | | 5 | | EUR | 30,790 | | | | | 597 | | | | | (1,431 | ) |
| | | | | | | | | | | | | | | | | | | | $ | 4,232 | | | | $ | (6,490 | ) |
See Accompanying Notes to Financial Statements
86
VY® T. ROWE PRICE INTERNATIONAL
STOCK PORTFOLIO | SUMMARY PORTFOLIO OF INVESTMENTS
AS OF DECEMBER 31, 2019 (CONTINUED) |
Currency Abbreviations
| EUR | | — EU Euro |
| JPY | | — Japanese Yen |
| SEK | | — Swedish Krona |
| USD | | — United States Dollar |
A summary of derivative instruments by primary risk exposure is outlined in the following tables.
The fair value of derivative instruments as of December 31, 2019 was as follows:
Derivatives not accounted for as
hedging instruments | | Location on Statement
of Assets and Liabilities | | Fair Value |
|---|
Asset Derivatives | | | | | | | |
| Foreign exchange contracts | | Unrealized appreciation on forward foreign currency contracts | | | $ | 2,925 | |
Total Asset Derivatives | | | | | $ | 2,925 | |
Liability Derivatives | | | | | | | |
| Foreign exchange contracts | | Unrealized depreciation on forward foreign currency contracts | | | $ | 35 | |
| Equity contracts | | Written options, at fair value | | | | 6,490 | |
Total Liability Derivatives | | | | | $ | 6,525 | |
The effect of derivative instruments on the Fund’s Statement of Operations for the year ended December 31, 2019 was as follows:
| | Amount of Realized Gain or (Loss)
on Derivatives Recognized in Income |
|---|
| | | |
|---|
Derivatives not accounted for as
hedging instruments | | Forward foreign
currency contracts | | Written options | | Total |
|---|
| Equity contracts | | | $ | — | | | | $ | 22,514 | | | | $ | 22,514 | |
| Foreign exchange contracts | | | | (26,155 | ) | | | | — | | | | | (26,155 | ) |
Total | | | $ | (26,155 | ) | | | $ | 22,514 | | | | $ | (3,641 | ) |
| | Change in Unrealized Appreciation or (Depreciation)
on Derivatives Recognized in Income |
|---|
| | | |
|---|
Derivatives not accounted for as
hedging instruments | | Forward foreign
currency contracts | | Written options | | Total |
|---|
| Equity contracts | | | $ | — | | | | $ | (2,258 | ) | | | $ | (2,258 | ) |
| Foreign exchange contracts | | | | 40,768 | | | | | — | | | | | 40,768 | |
Total | | | $ | 40,768 | | | | $ | (2,258 | ) | | | $ | 38,510 | |
The following is a summary by counterparty of the fair value of OTC derivative instruments subject to Master Netting Agreements and collateral pledged (received), if any, at December 31, 2019:
| | CIBC World
Markets Corp. | | JPMorgan
Chase & Co. | | The Bank of
New York Mellon | | Totals |
|---|
Assets: | | | | | | | | | | | | | | | | | | | | |
| Forward foreign currency contracts | | | $ | 2,579 | | | | $ | — | | | | $ | 346 | | | | $ | 2,925 | |
Total Assets | | | $ | 2,579 | | | | $ | — | | | | $ | 346 | | | | $ | 2,925 | |
Liabilities: | | | | | | | | | | | | | | | | | | | | |
| Forward foreign currency contracts | | | $ | — | | | | $ | — | | | | $ | 35 | | | | $ | 35 | |
| Written options | | | | — | | | | | 6,490 | | | | | — | | | | | 6,490 | |
Total Liabilities | | | $ | — | | | | $ | 6,490 | | | | $ | 35 | | | | $ | 6,525 | |
Net OTC derivative instruments by counterparty, at fair value | | | $ | 2,579 | | | | $ | (6,490 | ) | | | $ | 311 | | | | | (3,600) | |
Total collateral pledged by the Portfolio/(Received from counterparty) | | | $ | — | | | | $ | — | | | | $ | — | | | | $ | — | |
Net Exposure(1) | | | $ | 2,579 | | | | $ | (6,490 | ) | | | $ | 311 | | | | $ | (3,600) | |
(1) | | Positive net exposure represents amounts due from each respective counterparty. Negative exposure represents amounts due from the Portfolio. Please refer to Note 2 for additional details regarding counterparty credit risk and credit related contingent features. |
See Accompanying Notes to Financial Statements
87
VY® T. ROWE PRICE INTERNATIONAL
STOCK PORTFOLIO | SUMMARY PORTFOLIO OF INVESTMENTS
AS OF DECEMBER 31, 2019 (CONTINUED) |
At December 31, 2019, the aggregate cost of securities and other investments and the composition of unrealized appreciation and depreciation of securities and other investments at year end were:
| | Cost for federal income tax purposes was $180,305,760. |
| Net unrealized appreciation consisted of: | | | | | |
| Gross Unrealized Appreciation | | | $ | 45,154,942 | |
| Gross Unrealized Depreciation | | | | (7,324,643 | ) |
| Net Unrealized Appreciation | | | $ | 37,830,299 | |
See Accompanying Notes to Financial Statements
88
TAX INFORMATION (UNAUDITED)
Dividends and distributions paid during the year ended December 31, 2019 were as follows:
| Portfolio Name | | Type | | Per Share Amount |
|---|
| Voya Government Liquid Assets Portfolio | | | | | | | | | |
| Class I | | NII | | | $ | 0.0192 | |
| Class S | | NII | | | $ | 0.0167 | |
| Class S2 | | NII | | | $ | 0.0152 | |
| All Classes | | STCG | | | $ | 0.0007 | |
VY®Clarion Global Real Estate Portfolio | | | | | | | | | |
| Class ADV | | NII | | | $ | 0.2748 | |
| Class I | | NII | | | $ | 0.3585 | |
| Class S | | NII | | | $ | 0.3258 | |
| Class S2 | | NII | | | $ | 0.3073 | |
VY®Invesco Growth and Income Portfolio | | | | | | | | | |
| Class ADV | | NII | | | $ | 0.4951 | |
| Class I | | NII | | | $ | 0.6657 | |
| Class S | | NII | | | $ | 0.5922 | |
| Class S2 | | NII | | | $ | 0.5544 | |
| All Classes | | LTCG | | | $ | 2.8817 | |
VY®JPMorgan Emerging Markets Equity Portfolio | | | | | | | | | |
| Class ADV | | NII | | | $ | — | |
| Class I | | NII | | | $ | 0.0286 | |
| Class S | | NII | | | $ | 0.0027 | |
| Class S2 | | NII | | | $ | — | |
| All Classes | | STCG | | | $ | 0.0557 | |
| All Classes | | LTCG | | | $ | 1.1260 | |
VY®Morgan Stanley Global Franchise Portfolio | | | | | | | | | |
| Class ADV | | NII | | | $ | 0.1033 | |
| Class R6 | | NII | | | $ | 0.1869 | |
| Class S | | NII | | | $ | 0.1421 | |
| Class S2 | | NII | | | $ | 0.1153 | |
| All Classes | | LTCG | | | $ | 1.8019 | |
| Portfolio Name | | Type | | Per Share Amount |
|---|
VY®T. Rowe Price Capital Appreciation Portfolio | | | | | | | | | |
| Class ADV | | NII | | | $ | 0.3389 | |
| Class I | | NII | | | $ | 0.4873 | |
| Class R6 | | NII | | | $ | 0.4873 | |
| Class S | | NII | | | $ | 0.4156 | |
| Class S2 | | NII | | | $ | 0.3685 | |
| All Classes | | LTCG | | | $ | 1.4876 | |
VY®T. Rowe Price Equity Income Portfolio | | | | | | | | | |
| Class ADV | | NII | | | $ | 0.2605 | |
| Class I | | NII | | | $ | 0.3244 | |
| Class S | | NII | | | $ | 0.2960 | |
| Class S2 | | NII | | | $ | 0.2812 | |
| All Classes | | STCG | | | $ | 0.0492 | |
| All Classes | | LTCG | | | $ | 3.0931 | |
VY®T. Rowe Price International Stock Portfolio | | | | | | | | | |
| Class ADV | | NII | | | $ | 0.0642 | |
| Class I | | NII | | | $ | 0.1547 | |
| Class S | | NII | | | $ | 0.1106 | |
| All Classes | | STCG | | | $ | 0.0680 | |
| All Classes | | LTCG | | | $ | 0.8569 | |
NII — Net investment income
STCG — Short-term capital gain
LTCG — Long-term capital gain
Of the ordinary distributions made during the year ended December 31, 2019, the following percentages qualify for the dividends received deduction (DRD) available to corporate shareholders:
VY®Invesco Growth and Income Portfolio | | 84.18% | |
VY®JPMorgan Emerging Markets Equity Portfolio | | 2.49% | |
VY®Morgan Stanley Global Franchise Portfolio | | 100.00% | |
VY®T. Rowe Price Capital Appreciation Portfolio | | 43.11% | |
VY®T. Rowe Price Equity Income Portfolio | | 73.42% | |
VY®T. Rowe Price International Stock Portfolio | | 2.36% | |
The Portfolios designate the following amounts of long-term capital gain distributions as 20% rate long-term capital gain dividends under Internal Revenue Code Section 852(b)(3)(C):
VY®Invesco Growth and Income Portfolio | $ | 51,891,887 | |
VY®JPMorgan Emerging Markets Equity Portfolio | $ | 26,134,093 | |
VY®Morgan Stanley Global Franchise Portfolio | $ | 41,693,123 | |
VY®T. Rowe Price Capital Appreciation Portfolio | $ | 360,809,518 | |
VY®T. Rowe Price Equity Income Portfolio | $ | 204,767,988 | |
VY®T. Rowe Price International Stock Portfolio | $ | 11,411,467 | |
89
TAX INFORMATION (UNAUDITED) (CONTINUED)
Pursuant to Section 853 of the Internal Revenue Code, the Portfolios designate the following amounts as foreign taxes paid for the year ended December 31, 2019. Foreign taxes paid for purposes of Section 853 may be less than actual foreign taxes paid for financial statement purposes.
| | Creditable
Foreign Taxes
Paid | | Per Share
Amount | | Portion of Ordinary Income
Distribution Derived from
Foreign Sourced Income* |
|---|
VY®JPMorgan Emerging Markets Equity Portfolio | | | $ | 738,923 | | | | $ | 0.0316 | | | | | 98.13 | % |
VY®T. Rowe Price International Stock Portfolio | | | $ | 266,812 | | | | $ | 0.0200 | | | | | 91.05 | % |
| * | | None of the Portfolios listed above derived any income from ineligible foreign sources as defined under Section 901(j) of the Internal Revenue Code. |
Foreign taxes paid or withheld must be included in taxable income with an offsetting deduction from gross income or as a credit for taxes paid to foreign governments. Shareholders are strongly advised to consult their own tax advisors regarding the appropriate treatment of foreign taxes paid.
Above figures may differ from those cited elsewhere in this report due to differences in the calculation of income and gains under U.S. generally accepted accounting principles (book) purposes and Internal Revenue Service (tax) purposes.
Shareholders are strongly advised to consult their own tax advisers with respect to the tax consequences of their investments in the Portfolios. In January, shareholders, excluding corporate shareholders, receive an IRS 1099-DIV regarding the federal tax status of the dividends and distributions they received in the calendar year.
90
TRUSTEE AND OFFICER INFORMATION (UNAUDITED)
The business and affairs of the Trust are managed under the direction of the Board. A Trustee, who is not an interested person of the Trust, as defined in the 1940 Act, is an independent trustee (“Independent Trustee”). The Trustees and Officers of the Trust are listed below. The Statement of Additional Information includes additional information about Trustees of the Trust and is available, without charge, upon request at (800) 366-0066.
| Name, Address and Age | | Position(s) Held with
the Trust | | Term of Office
and Length of
Time Served(1) | | Principal Occupation(s) —
During the Past 5 Years | | Number of
funds in
Fund Complex
Overseen by
Trustee(2) | | Other Board Positions
Held by Trustee |
|---|
| | | | | | | | | | | |
Independent Trustees*: | | | | | | | | | | |
| |
Colleen D. Baldwin
7337 East Doubletree Ranch Rd.
Suite 100
Scottsdale, Arizona 85258
Age: 59 | | Trustee
Chairperson | | November
2007–Present
January
2020–Present | | President, Glantuam Partners, LLC, a business consulting firm (January 2009–Present). | | 146 | | Dentaquest (February 2014–Present); RSR Partners, Inc. (2016–Present). |
| | | | | | | | | | | |
John V. Boyer
7337 East Doubletree Ranch Rd.
Suite 100
Scottsdale, Arizona 85258
Age: 66 | | Trustee | | January
2005–Present | | Retired. Formerly, President and Chief Executive Officer, Bechtler Arts Foundation, an arts and education foundation (January 2008–December 2019). | | 146 | | None. |
| | | | | | | | | | | |
Patricia W. Chadwick
7337 East Doubletree Ranch Rd.
Suite 100
Scottsdale, Arizona 85258
Age: 71 | | Trustee | | January
2006–Present | | Consultant and President, Ravengate Partners LLC, a consulting firm that provides advice regarding financial markets and the global economy (January 2000–Present). | | 146 | | Wisconsin Energy Corporation (June 2006–Present); The Royce Fund (22 funds) (December 2009–Present); and AMICA Mutual Insurance Company (1992–Present). |
| | | | | | | | | | | |
Martin J. Gavin
7337 East Doubletree Ranch Rd. Suite 100
Scottsdale, AZ 85258
Age: 69 | | Trustee | | August
2015–Present | | Retired. Formerly, President and Chief Executive Officer, Connecticut Children’s Medical Center (May 2006–November 2015). | | 146 | | None. |
| | | | | | | | | | | |
Joseph E. Obermeyer
7337 East Doubletree Ranch Rd.
Suite 100
Scottsdale, Arizona 85258
Age: 62 | | Trustee | | May
2013–Present | | President, Obermeyer & Associates, Inc., a provider of financial and economic consulting services (November 1999–Present). | | 146 | | None. |
| | | | | | | | | | | |
Sheryl K. Pressler
7337 East Doubletree Ranch Rd.
Suite 100
Scottsdale, Arizona 85258
Age: 69 | | Trustee | | January
2006–Present | | Consultant (May 2001–Present). | | 146 | | None. |
| | | | | | | | | | | |
Christopher P. Sullivan
7337 East Doubletree Ranch Rd.
Suite 100
Scottsdale, Arizona 85258
Age: 66 | | Trustee | | October
2015–Present | | Retired. | | 146 | | None. |
| | | | | | | | | | | |
Trustee who is an “interested person”: |
| | | | | | | | | | | |
Dina Santoro
230 Park Avenue
New York, New York 10169
Age: 46 | | Trustee | | July
2018–Present | | President, Voya Investments, LLC and Voya Capital, LLC (March 2018–Present); Senior Vice President, Voya Investments Distributor, LLC (April 2018–Present); Senior Managing Director, Head of Product and Marketing Strategy, Voya Investment Management (September 2017–Present). Formerly, Managing Director, Quantitative Management Associates, LLC (January 2004–August 2017). | | 146 | | Voya Investments, LLC, Voya Capital, LLC, and Voya Funds Services, LLC (March 2018–Present); Voya Investments Distributor, LLC (April 2018–Present). |
(1) | | Trustees serve until their successors are duly elected and qualified. The tenure of each Trustee who is not an “interested person” as defined in the 1940 Act, of each Portfolio (“Independent Trustee”) is subject to the Board’s retirement policy which states that each duly elected or appointed Independent Trustee shall retire from and cease to be a member of the Board of Trustees at the close of business on December 31 of the calendar year in which the Independent Trustee attains the age of 75. A majority vote of the Board’s other Independent Trustees may extend the retirement date of an Independent Trustee if the retirement would trigger a requirement to hold a meeting of shareholders of the Trust under applicable law, whether for the purposes of appointing a successor to the Independent Trustee or otherwise comply under applicable law, in which case the extension would apply until such time as the shareholder meeting can be held or is no longer required (as determined by a vote of a majority of the other Independent Trustees). |
91
TRUSTEE AND OFFICER INFORMATION (UNAUDITED) (CONTINUED)
(2) | | For the purposes of this table, “Fund Complex” means the Voya family of funds including the following investment companies: Voya Asia Pacific High Dividend Equity Income Fund; Voya Balanced Portfolio, Inc.; Voya Emerging Markets High Dividend Equity Fund; Voya Equity Trust; Voya Funds Trust; Voya Global Advantage and Premium Opportunity Fund; Voya Global Equity Dividend and Premium Opportunity Fund; Voya Government Money Market Portfolio; Voya Infrastructure, Industrials and Materials Fund; Voya Intermediate Bond Portfolio; Voya International High Dividend Equity Income Fund; Voya Investors Trust; Voya Mutual Funds; Voya Natural Resources Equity Income Fund; Voya Partners, Inc.; Voya Prime Rate Trust; Voya Senior Income Fund; Voya Separate Portfolios Trust; Voya Strategic Allocation Portfolios, Inc.; Voya Variable Funds; Voya Variable Insurance Trust; Voya Variable Portfolios, Inc.; and Voya Variable Products Trust. The number of funds in the Fund Complex is as of January 31, 2020. |
| * | | Effective December 31, 2019, Russell H. Jones and Roger B. Vincent each retired as a Trustee of the Board. |
92
TRUSTEE AND OFFICER INFORMATION (UNAUDITED) (CONTINUED)
| Name, Address and Age | | Position(s) Held
With the Trust | | Term of Office and Length
of Time Served(1) | | Principal Occupation(s) —
During the Past 5 Years |
|---|
| | | | | | | |
Michael Bell
One Orange Way Windsor, Connecticut 06095
Age: 51 | | Chief Executive Officer | | March 2018–Present | | Chief Executive Officer and Director, Voya Investments, LLC, Voya Capital, LLC, and Voya Funds Services, LLC (March 2018–Present); Senior Vice President and Chief Financial Officer, Voya Investments Distributor, LLC (September 2019–Present); Chief Financial Officer, Voya Investment Management (September 2014–Present). Formerly, Senior Vice President, Chief Financial Officer and Treasurer, Voya Investments, LLC (November 2015–March 2018). |
| | | | | | | |
Dina Santoro
230 Park Avenue
New York, New York 10169
Age: 46 | | President | | March 2018–Present | | President and Director, Voya Investments, LLC and Voya Capital, LLC (March 2018–Present); Director, Voya Funds Services, LLC (March 2018–Present); Director and Senior Vice President, Voya Investments Distributor, LLC (April 2018–Present); Senior Managing Director, Head of Product and Marketing Strategy, Voya Investment Management (September 2017–Present). Formerly, Managing Director, Quantitative Management Associates, LLC (January 2004–August 2017). |
| | | | | | | |
Stanley D. Vyner
230 Park Avenue
New York, New York 10169
Age: 69 | | Executive Vice President Chief Investment Risk Officer | | March 2003–Present
September 2009–Present | | Executive Vice President, Voya Investments, LLC (July 2000–Present) and Chief Investment Risk Officer, Voya Investments, LLC (January 2003–Present). |
| | | | | | | |
James M. Fink
5780 Powers Ferry Road NW
Atlanta, Georgia 30327
Age: 61 | | Executive Vice President | | March 2018–Present | | Managing Director, Voya Investments, LLC, Voya Capital, LLC, and Voya Funds Services, LLC (March 2018–Present); Senior Vice President, Voya Investments Distributor, LLC (April 2018–Present); Chief Administrative Officer, Voya Investment Management (September 2017–Present). Formerly, Managing Director, Operations, Voya Investment Management (March 1999–September 2017). |
| | | | | | | |
Kevin M. Gleason
7337 East Doubletree Ranch Rd.
Suite 100
Scottsdale, Arizona 85258
Age: 53 | | Chief Compliance Officer | | February 2012–Present | | Senior Vice President, Voya Investment Management and Chief Compliance Officer, Voya Family of Funds (February 2012–Present). |
| | | | | | | |
Todd Modic
7337 East Doubletree Ranch Rd.
Suite 100
Scottsdale, Arizona 85258
Age: 52 | | Senior Vice President, Chief/Principal Financial Officer and Assistant Secretary | | March 2005–Present | | President, Voya Funds Services, LLC (March 2018–Present) and Senior Vice President, Voya Investments, LLC (April 2005–Present). |
| | | | | | | |
Kimberly A. Anderson
7337 East Doubletree Ranch Rd.
Suite 100
Scottsdale, Arizona 85258
Age: 55 | | Senior Vice President | | November 2003–Present | | Senior Vice President, Voya Investments, LLC (September 2003–Present). |
| | | | | | | |
Robert Terris
5780 Powers Ferry Road NW
Atlanta, Georgia 30327
Age: 49 | | Senior Vice President | | May 2006–Present | | Senior Vice President, Voya Investments Distributor, LLC (April 2018–Present); Senior Vice President, Head of Division Operations, Voya Investments, LLC (October 2015–Present) and Voya Funds Services, LLC (March 2006–Present). |
| | | | | | | |
Fred Bedoya
7337 East Doubletree Ranch Rd.
Suite 100
Scottsdale, Arizona 85258
Age: 47 | | Vice President and Treasurer | | September 2012–Present | | Vice President, Voya Investments, LLC (October 2015–Present) and Voya Funds Services, LLC (July 2012–Present). |
| | | | | | | |
Maria M. Anderson
7337 East Doubletree Ranch Rd.
Suite 100
Scottsdale, Arizona 85258
Age: 61 | | Vice President | | September 2004–Present | | Vice President, Voya Investments, LLC (October 2015–Present) and Voya Funds Services, LLC (September 2004–Present). |
93
TRUSTEE AND OFFICER INFORMATION (UNAUDITED) (CONTINUED)
| Name, Address and Age | | Position(s) Held
With the Trust | | Term of Office and Length
of Time Served(1) | | Principal Occupation(s) —
During the Past 5 Years |
|---|
| | | | | | | |
Sara M. Donaldson
7337 East Doubletree Ranch Rd.
Suite 100
Scottsdale, Arizona 85258
Age: 60 | | Vice President | | September 2014–Present | | Vice President, Voya Investments, LLC (October 2015–Present). Formerly, Vice President, Voya Funds Services, LLC (April 2014–October 2015). |
| | | | | | | |
Micheline S. Faver
7337 East Doubletree Ranch Rd.
Suite 100
Scottsdale, Arizona 85258
Age: 42 | | Vice President | | September 2016–Present | | Vice President, Head of Fund Compliance and Chief Compliance Officer, Voya Investments, LLC (June 2016–Present). Formerly, Vice President, Mutual Fund Compliance (March 2014–June 2016). |
| | | | | | | |
Robyn L. Ichilov
7337 East Doubletree Ranch Rd.
Suite 100
Scottsdale, Arizona 85258
Age: 52 | | Vice President | | November 1999–Present | | Vice President, Voya Funds Services, LLC (November 1995–Present) and Voya Investments, LLC (August 1997–Present). |
| | | | | | | |
Jason Kadavy
7337 East Doubletree Ranch Rd.
Suite 100
Scottsdale, Arizona 85258
Age: 43 | | Vice President | | September 2012–Present | | Vice President, Voya Investments, LLC (October 2015–Present) and Voya Funds Services, LLC (July 2007–Present). |
| | | | | | | |
Andrew K. Schlueter
7337 East Doubletree Ranch Rd.
Suite 100
Scottsdale, Arizona 85258
Age: 43 | | Vice President | | March 2018–Present | | Vice President, Voya Investments Distributor, LLC (April 2018–Present); Vice President, Voya Investments, LLC and Voya Funds Services, LLC (March 2018–Present); Vice President, Head of Mutual Fund Operations, Voya Investment Management (February 2018–Present). Formerly, Vice President, Voya Investment Management (March 2014– February 2018). |
| | | | | | | |
Craig Wheeler
7337 East Doubletree Ranch Rd.
Suite 100
Scottsdale, Arizona 85258
Age: 50 | | Vice President | | May 2013–Present | | Vice President — Director of Tax, Voya Investments, LLC (October 2015–Present). Formerly, Vice President — Director of Tax, Voya Funds Services, LLC (March 2013–October 2015). |
| | | | | | | |
Monia Piacenti
One Orange Way
Windsor, Connecticut 06095
Age: 43 | | Anti-Money Laundering Officer | | June 2018–Present | | Anti-Money Laundering Officer, Voya Investments Distributor, LLC, Voya Investment Management and Voya Investment Management Trust Co. (June 2018–Present); Compliance Consultant, Voya Financial, Inc. (January 2019–Present). Formerly, Senior Compliance Officer, Voya Investment Management (December 2009–December 2018). |
| | | | | | | |
Theresa K. Kelety
7337 East Doubletree Ranch Rd.
Suite 100
Scottsdale, Arizona 85258
Age: 57 | | Secretary | | January 2020–Present | | Vice President and Senior Counsel, Voya Investment Management — Mutual Fund Legal Department (March 2010–Present). |
| | | | | | | |
Paul A. Caldarelli
7337 East Doubletree Ranch Rd.
Suite 100
Scottsdale, Arizona 85258
Age: 68 | | Assistant Secretary | | June 2010–Present | | Vice President and Senior Counsel, Voya Investment Management — Mutual Fund Legal Department (March 2010–Present). |
| | | | | | | |
Joanne F. Osberg
7337 East Doubletree Ranch Rd.
Suite 100
Scottsdale, Arizona 85258
Age: 38 | | Assistant Secretary | | January 2020–Present | | Vice President and Counsel, Voya Investment Management — Mutual Fund Legal Department (January 2013–Present). |
(1) | | The Officers hold office until the next annual meeting of the Board of Trustees and until their successors shall have been elected and qualified. |
94
ADVISORY AND SUB-ADVISORY CONTRACT APPROVAL DISCUSSION (UNAUDITED)
BOARD CONSIDERATION AND APPROVAL OF INVESTMENT MANAGEMENT CONTRACTS, SUB-ADVISORY CONTRACTS AND SUB-SUB-ADVISORY CONTRACTS
At a meeting held on November 21, 2019, the Board of Trustees (“Board”) of Voya Investors Trust (the “Trust”), including a majority of the Independent Trustees, considered and approved the renewal of the investment management contracts (the “Management Contracts”) between Voya Investments, LLC (the “Manager”) and the Trust, on behalf of Voya Government Liquid Assets Portfolio, VY® Clarion Global Real Estate Portfolio, VY®Invesco Growth and Income Portfolio, VY® JPMorgan Emerging Markets Equity Portfolio, VY® Morgan Stanley Global Franchise Portfolio, VY® T. Rowe Price Capital Appreciation Portfolio, VY® T. Rowe Price Equity Income Portfolio, and VY®T. Rowe Price International Stock Portfolio, each a series of the Trust (the “Portfolios”), the sub-advisory contracts (the “Sub-Advisory Contracts”) with the sub-adviser to each Portfolio (the “Sub-Advisers”), and the sub-sub-advisory contracts (the “Sub-Sub-Advisory Contracts,” and together with the Management Contracts and Sub-Advisory Contracts, the “Contracts”) with the sub-sub-adviser to VY®Morgan Stanley Global Franchise Portfolio and VY® T. Rowe Price International Stock Portfolio (the “Sub-Sub-Advisers”) for an additional one year period ending November 30, 2020. In determining to renew such contracts, the Board considered information furnished to it throughout the year at meetings of the Board and its committees, including information regarding performance, expenses, and other matters.
In addition to the Board meeting on November 21, 2019, the Independent Trustees also held meetings outside the presence of personnel representing the Manager, Sub-Advisers, or Sub-Sub-Advisers (collectively, such persons are referred to herein as “management”) on October 9, 2019, and November 19, 2019, specifically to review and consider materials related to the proposed continuance of the Contracts that they believed to be relevant to the renewal of the Contracts in light of their own business judgment and the legal advice furnished to them by K&L Gates LLP, their independent legal counsel. Subsequent references herein to factors considered and determinations made by the Independent Trustees and/or the Board include, as applicable, factors considered and determinations made at those meetings by the Independent Trustees. While the Board considered the renewal of the management contracts, sub-advisory contracts, and sub-sub-advisory contracts for all of the applicable investment companies in the Voya family of funds at the same meetings, the Board considered each Voya fund’s investment management, sub-advisory, and sub-sub-advisory relationships separately.
The Board follows a process pursuant to which it seeks and considers relevant information when it evaluates whether to renew existing investment management and sub-advisory contracts (including sub-sub-advisory contracts) for the Voya funds. The Board has established a Contracts Committee and Investment Review Committees (the “IRCs”), each of which includes only Independent Trustees as members. The Contracts Committee meets several times throughout the year to provide oversight with respect to the management, sub-advisory and sub-sub-advisory contracts approval and renewal process, among other functions, and each IRC meets several times throughout the year to provide oversight regarding the investment performance of the sub-advisers and sub-sub-advisers, as well as the Manager’s role in monitoring the sub-advisers and sub-sub-advisers, with respect to each Voya fund that is assigned to that IRC.
The Contracts Committee oversees, and annually recommends Board approval of updates to, a methodology guide for the Voya funds (“Methodology Guide”) related to the investment management, sub-advisory and sub-sub-advisory contract renewal process. The Methodology Guide sets out a framework pursuant to which the Independent Trustees request, and management provides, certain information that the Independent Trustees deem to be important or potentially relevant. The Independent Trustees retain the services of an independent consultant with experience in the mutual fund industry to assist the Contracts Committee in developing and recommending to the Board: (1) a selected peer group of investment companies for each Portfolio (“Selected Peer Group”) based on that Portfolio’s particular attributes, such as fund type and size, fund category (as determined by Morningstar, Inc., an independent provider of mutual fund data (“Morningstar”)), sales channels and structure and the Portfolio share class being compared to the Selected Peer Group; and (2) updates to the Methodology Guide with respect to the content and format of various data including, but not limited to, investment performance, fee structure, and expense information prepared in connection with the renewal process. In addition, the Independent Trustees periodically have retained, including most recently in 2018, an independent firm to test and verify the accuracy of certain information presented to the Board for a representative sample of the Voya funds.
Provided below is an overview of certain material factors that the Board considered at its meetings regarding the renewal of the Contracts and the compensation to be paid thereunder. The Board members did not identify any particular information or factor that was overarching, and each Board member may have accorded different weight to the various factors in reaching his or her conclusions with respect to each Portfolio’s investment management,
95
ADVISORY AND SUB-ADVISORY CONTRACT APPROVAL DISCUSSION (UNAUDITED) (CONTINUED)
sub-advisory and, as applicable, sub-sub-advisory arrangements.
Nature, Extent and Quality of Services
The Manager oversees, subject to the authority of the Board, and is responsible for the provision of all investment advisory and portfolio management services for the Portfolios, but may delegate certain of these responsibilities to one or more sub-advisers and their sub-sub-advisers, if any. In addition, the Manager provides administrative services reasonably necessary for the operation of the Portfolios as set forth in the Management Contracts, including oversight of the Portfolios’ operations and risk management and the oversight of their various other service providers.
The Board considered the “manager-of-managers” platform of the Voya funds that has been developed by the Manager pursuant to which the Manager selects, subject to the Board’s approval, sub-advisers and their sub-sub-advisers, if any, to provide day-to-day management services to all or a portion of each Voya fund. The Board recognized that the Manager is responsible for monitoring the investment program, performance, developments, ongoing operations, and compliance with applicable regulations and investment policies and restrictions of the Sub-Advisers and Sub-Sub-Advisers with respect to the Portfolios under this manager-of-managers arrangement. The Board also considered the techniques and resources that the Manager has developed to provide this ongoing oversight and due diligence with respect to the sub-advisers and sub-sub-advisers and to advocate or recommend, when it believes appropriate, changes in investment strategies or investment sub-advisers and sub-sub-advisers designed to assist in improving a Voya fund’s performance. The Board was advised that, in connection with the Manager’s performance of these duties, the Manager has developed an oversight process formulated by its Manager Research & Selection Group which reviews, among other matters, performance data, each Sub-Adviser’s and Sub-Sub-Adviser’s management team, portfolio data and attribution analysis related to each Sub-Adviser and Sub-Sub-Adviser through various means, including, but not limited to, in-person meetings, on-site visits, and telephonic meetings with the Sub-Adviser and Sub-Sub-Adviser.
Further, the Board considered periodic compliance reports it receives from the Trust’s Chief Compliance Officer evaluating whether the regulatory compliance systems and procedures of the Manager, Sub-Advisers, and Sub-Sub-Advisers are reasonably designed to ensure compliance with the federal securities laws and whether the investment policies and restrictions for each Portfolio are consistently complied with, and other periodic reports covering related matters.
The Board considered the portfolio management team assigned by the Sub-Advisers and Sub-Sub-Advisers to the Portfolios and the level of resources committed to the Portfolios (and other relevant funds in the Voya funds) by the Manager, Sub-Advisers, and Sub-Sub-Advisers, and whether those resources are sufficient to provide high-quality services to the Portfolios.
Based on their deliberations and the materials presented to them, the Board concluded that the nature, extent and quality of the overall services provided by the Manager and each Sub-Adviser and Sub-Sub-Adviser under the Contracts were appropriate.
Portfolio Performance
In assessing the investment management, sub-advisory, and sub-sub-advisory relationships, the Board placed emphasis on the investment returns of each Portfolio, including its investment performance over certain time periods compared to the Portfolio’s Morningstar category and primary benchmark, a broad-based securities market index that appears in the Portfolio’s prospectus. The Board also considered information from the Manager Research & Selection Group and received reports summarizing a separate analysis of each Portfolio’s performance and risk, including risk-adjusted investment return information, from the Trust’s Chief Investment Risk Officer.
Economies of Scale
When evaluating the reasonableness of the management fee schedules, the Board considered whether economies of scale have been or likely will be realized by the Manager, the Sub-Advisers, and the Sub-Sub-Advisers as a Portfolio grows larger and the extent to which any such economies are shared with the Portfolio. In this regard, the Board noted any breakpoints in management fee schedules that will result in a lower management fee rate when a Portfolio achieves sufficient asset levels to receive a breakpoint discount. The Board also considered that, while some of the Portfolios do not have management fee breakpoints, they may have fee waiver and expense reimbursement arrangements. The Board considered the extent to which economies of scale realized by the Manager, the Sub-Advisers, or the Sub-Sub-Advisers could be shared with each Portfolio through such fee waivers, expense reimbursements or other expense reductions. In evaluating these matters, the Independent Trustees also considered periodic management reports, Selected Peer Group comparisons, and industry information regarding economies of scale. In the case of sub-advisory and sub-sub-advisory fees, the Board considered that breakpoints, if any, would inure to the benefit of the Manager and the relevant Sub-Adviser, respectively.
96
ADVISORY AND SUB-ADVISORY CONTRACT APPROVAL DISCUSSION (UNAUDITED) (CONTINUED)
Information Regarding Services, Performance, and Fee Schedules Offered to Other Clients
The Board considered comparative information regarding the nature of services, performance, and fee schedules offered by the Manager, the Sub-Advisers, and the Sub-Sub-Advisers to other clients with similar investment objectives, if applicable, including other registered investment companies and relevant institutional accounts. When the fee schedules offered to or the performance of such other clients differed materially from a Portfolio, the Board took into account the underlying rationale provided by the Manager, the Sub-Advisers, or the Sub-Sub-Advisers, as applicable, for these differences. For the non-Voya-affiliated Sub-Advisers and Sub-Sub-Advisers, the Board viewed the information related to any material differences in the fee schedules as not being a key factor in its deliberations because of the arm’s-length nature of negotiations between the Manager and non-Voya-affiliated Sub-Advisers and their Sub-Sub-Advisers with respect to sub-advisory and sub-sub-advisory fee schedules, that the Manager is responsible for paying the fees of the Sub-Advisers and that the applicable Sub-Advisers are responsible for paying the fees of the Sub-Sub-Advisers.
Fee Schedules, Profitability, and Fall-out Benefits
The Board reviewed and considered the contractual management fee schedule and net management fee rate payable by each Portfolio to the Manager compared to the Portfolio’s Selected Peer Group and which additional services the Manager pays for on behalf of each applicable Portfolio under the “bundled fee” arrangement in return for a single management fee (“Unified Fee Structure”). The Board also considered the compensation payable by the Manager to each Sub-Adviser for sub-advisory services for each Portfolio, including the portion of the contractual and net management fee rates that are paid to each Sub-Adviser, as compared to the compensation paid to the Manager. In this regard, the Board considered that each Sub-Sub-Adviser is compensated by the relevant Sub-Adviser and not the Manager. In addition, the Board considered any fee waivers, expense limitations, and/or recoupment arrangements that apply to the fees payable by the Portfolios, including whether the Manager intends to propose any changes thereto. For each Portfolio, the Board separately determined that the fees payable to the Manager and the fee schedule payable to each Sub-Adviser and Sub-Sub-Adviser are reasonable for the services that each performs, which were considered in light of the nature, extent and quality of the services that each has performed and is expected to perform.
For each Portfolio, the Board considered information on revenues, costs and profits or losses realized by the Manager and the Voya-affiliated Sub-Adviser related to their services to the Portfolio. In analyzing the profitability of the Manager and its affiliated service providers in connection with services they render to a Portfolio, the Board took into account the sub-advisory fee rate payable by the Manager to each Sub-Adviser. The Board also considered the profitability
of the Manager and its affiliated Sub-Adviser attributable to servicing each Portfolio both with and without taking into account the profitability of the distributor of the Portfolios and any revenue sharing payments made by the Manager and both before and after giving effect to any expenses incurred by the Manager or the affiliated Sub-Adviser in making payments to affiliated insurance companies. The Board did not request profitability data from the Sub-Advisers and Sub-Sub-Advisers that are not affiliated with the Manager because the Board did not view this data as a key factor to its deliberations given the arm’s-length nature of the relationship between the Manager and these non-Voya-affiliated Sub-Advisers and Sub-Sub-Advisers with respect to the negotiation of sub-advisory and sub-sub-advisory fee schedules. In addition, the Board noted that non-Voya-affiliated sub-advisers and sub-sub-advisers may not account for their profits on an account-by-account basis and those that do typically employ different methodologies in connection with these calculations.
Although the Methodology Guide establishes a framework for profit calculation, the Board recognized that there is no uniform methodology within the asset management industry for determining profitability for this purpose. The Board also recognized that the use of different reasonable methodologies can give rise to dramatically different reported profit and loss results with respect to the Manager and the Voya-affiliated Sub-Adviser, as well as other industry participants with whom the profits of the Manager and its affiliated Sub-Adviser could be compared. In addition, the Board recognized that management’s calculations regarding its costs incurred in establishing the infrastructure necessary for the Portfolios’ operations may not be fully reflected in the expenses allocated to each Portfolio in determining profitability, and that the information presented may not portray all of the costs borne by the Manager or reflect all risks, including entrepreneurial, regulatory, legal and operational risks, associated with offering and managing a mutual fund complex in the current regulatory and market environment.
The Board also considered that the Manager is entitled to earn a reasonable level of profits for the services that it provides to the Portfolios. The Board also considered information regarding the potential fall-out benefits to the Manager, Sub-Advisers, and Sub-Sub-Advisers and their respective affiliates from their association with the Portfolios, including their ability to engage in soft-dollar transactions on behalf of the Portfolios. Following its reviews, the Board determined that the Manager’s and the Voya-affiliated Sub-Adviser’s profitability with respect to
97
ADVISORY AND SUB-ADVISORY CONTRACT APPROVAL DISCUSSION (UNAUDITED) (CONTINUED)
their services to the Portfolios and the Manager, Sub-Advisers, and Sub-Sub-Advisers’ potential fall-out benefits were not unreasonable.
Portfolio-by-Portfolio Analysis
Set forth below are certain of the specific factors that the Board considered at its October 9, 2019, November 19, 2019, and/or November 21, 2019 meetings in relation to approving each Portfolio’s Contracts and the conclusions reached by the Board. These specific factors are in addition to those considerations discussed above. In each case, the Portfolio’s performance was compared to its Morningstar category, as well as its primary benchmark. The performance data provided to the Board primarily was for various periods ended March 31, 2019. In addition, the Board also considered at its October 9, 2019, November 19, 2019, and November 21, 2019 meetings certain additional data regarding each Portfolio’s more recent performance, asset levels, and asset flows. Each Portfolio’s management fee rate and expense ratio were compared to the management fee rates and expense ratios of the funds in its Selected Peer Group. With respect to the quintile rankings noted below, the first quintile represents the range of funds with the highest performance or the lowest management fee rate or expense ratio, as applicable, and the fifth quintile represents the range of funds with the lowest performance or the highest management fee rate or expense ratio, as applicable.
Voya Government Liquid Assets Portfolio
In considering whether to approve the renewal of the Contracts for Voya Government Liquid Assets Portfolio, the Board considered that, based on performance data for the periods ended March 31, 2019: (1) the Portfolio outperformed its Morningstar category average for all periods presented; and (2) the Portfolio outperformed its primary benchmark for all periods presented.
In considering the fees payable under the Contracts for the Portfolio, the Board took into account the factors described above and also considered: (1) the economies of scale benefits to the Portfolio and its shareholders from breakpoint discounts applicable to the Portfolio’s management fee rate, which result in lower fees at higher asset levels; and (2) the pricing structure (including the net expense ratio to be borne by shareholders) of the Portfolio, as compared to its Selected Peer Group, including that: (a) the net management fee rate for the Portfolio is ranked in the second quintile of net management fee rates of the funds in its Selected Peer Group; (b) the contractual management fee rate for the Portfolio is ranked in the first quintile of contractual management fee rates of the funds in its Selected Peer Group; and (c) the net expense ratio for the Portfolio is ranked in the first quintile of net expense ratios of the funds in its Selected Peer Group. In analyzing
this fee data, the Board took into account the expense borne by the Manager for the provision of services, such as transfer agency, custody, accounting and legal services, to the Portfolio pursuant to the Portfolio’s Unified Fee Structure.
After its deliberation, the Board reached the following conclusions: (1) the Portfolio’s management fee rate is reasonable in the context of all factors considered by the Board; (2) the Portfolio’s net expense ratio is reasonable in the context of all factors considered by the Board; (3) the Portfolio’s performance is reasonable in the context of all factors considered by the Board; and (4) the sub-advisory fee rate payable by the Manager to the Sub-Adviser is reasonable in the context of all factors considered by the Board. Based on these conclusions and other factors, the Board voted to renew the Contracts for the Portfolio for the year ending November 30, 2020. During this renewal process, different Board members may have given different weight to different individual factors and related conclusions.
VY® Clarion Global Real Estate Portfolio
In considering whether to approve the renewal of the Contracts for VY® Clarion Global Real Estate Portfolio, the Board considered that, based on performance data for the periods ended March 31, 2019: (1) the Portfolio is ranked in the second quintile of its Morningstar category for the year-to-date period, the third quintile for the one-year period, the fourth quintile for the five-year and ten-year periods, and the fifth quintile for the three-year period; and (2) the Portfolio underperformed its primary benchmark for all periods presented, with the exception of the year-to-date period, during which it outperformed. In analyzing this performance data, the Board took into account management’s representations regarding: (1) the impact of security selection, sector allocation and geographic positioning on the Portfolio’s performance; (2) the competitiveness of the Portfolio’s performance during certain periods; (3) its confidence in the Sub-Adviser’s ability to achieve the Portfolio’s investment objective; and (4) ongoing periodic monitoring of the Portfolio’s performance by management and the Board or its Investment Review Committee.
In considering the fees payable under the Contracts for the Portfolio, the Board took into account the factors described above and also considered: (1) the economies of scale benefits to the Portfolio and its shareholders from breakpoint discounts applicable to the Portfolio’s management fee rate, which result in lower fees at higher asset levels; and (2) the pricing structure (including the net expense ratio to be borne by shareholders) of the Portfolio, as compared to its Selected Peer Group, including that: (a) the net management fee rate for the Portfolio is ranked in the second quintile of net management fee rates of the
98
ADVISORY AND SUB-ADVISORY CONTRACT APPROVAL DISCUSSION (UNAUDITED) (CONTINUED)
funds in its Selected Peer Group; (b) the contractual management fee rate for the Portfolio is ranked in the fourth quintile of contractual management fee rates of the funds in its Selected Peer Group; and (c) the net expense ratio for the Portfolio is ranked in the second quintile of net expense ratios of the funds in its Selected Peer Group.
After its deliberation, the Board reached the following conclusions: (1) the Portfolio’s management fee rate is reasonable in the context of all factors considered by the Board; (2) the Portfolio’s net expense ratio is reasonable in the context of all factors considered by the Board; (3) the Portfolio’s performance is reasonable in the context of all factors considered by the Board; and (4) the sub-advisory fee rate payable by the Manager to the Sub-Adviser is reasonable in the context of all factors considered by the Board. Based on these conclusions and other factors, the Board voted to renew the Contracts for the Portfolio for the year ending November 30, 2020. During this renewal process, different Board members may have given different weight to different individual factors and related conclusions.
VY® Invesco Growth and Income Portfolio
In considering whether to approve the renewal of the Contracts for VY® Invesco Growth and Income Portfolio, the Board considered that, based on performance data for the periods ended March 31, 2019: (1) the Portfolio is ranked in the first quintile of its Morningstar category for the year-to-date period, the second quintile for the three-year period, the third quintile for the five-year and ten-year periods, and the fifth quintile for the one-year period; and (2) the Portfolio underperformed its primary benchmark for the one-year, five-year and ten-year periods and outperformed for the year-to-date and three-year periods.
In considering the fees payable under the Contracts for the Portfolio, the Board took into account the factors described above and also considered: (1) the economies of scale benefits to the Portfolio and its shareholders from breakpoint discounts applicable to the Portfolio’s management fee rate, which result in lower fees at higher asset levels; and (2) the pricing structure (including the net expense ratio to be borne by shareholders) of the Portfolio, as compared to its Selected Peer Group, including that: (a) the net management fee rate for the Portfolio is ranked in the second quintile of net management fee rates of the funds in its Selected Peer Group; (b) the contractual management fee rate for the Portfolio is ranked in the second quintile of contractual management fee rates of the funds in its Selected Peer Group; and (c) the net expense ratio for the Portfolio is ranked in the first quintile of net expense ratios of the funds in its Selected Peer Group. In analyzing this fee data, the Board took into account management’s representations regarding the expense borne by the Manager for the provision of services to the
Portfolio, such as transfer agency, custody, accounting and legal services, pursuant to the Portfolio’s Unified Fee Structure.
After its deliberation, the Board reached the following conclusions: (1) the Portfolio’s management fee rate is reasonable in the context of all factors considered by the Board; (2) the Portfolio’s net expense ratio is reasonable in the context of all factors considered by the Board; (3) the Portfolio’s performance is reasonable in the context of all factors considered by the Board; and (4) the sub-advisory fee rate payable by the Manager to the Sub-Adviser is reasonable in the context of all factors considered by the Board. Based on these conclusions and other factors, the Board voted to renew the Contracts for the Portfolio for the year ending November 30, 2020. During this renewal process, different Board members may have given different weight to different individual factors and related conclusions.
VY® JPMorgan Emerging Markets Equity Portfolio
In considering whether to approve the renewal of the Contracts for VY® JPMorgan Emerging Markets Equity Portfolio, the Board considered that, based on performance data for the periods ended March 31, 2019: (1) the Portfolio is ranked in the first quintile of its Morningstar category for the year-to-date, one-year, three-year and five-year periods, and the second quintile for the ten-year period; and (2) the Portfolio outperformed its primary benchmark for all periods presented.
In considering the fees payable under the Contracts for the Portfolio, the Board took into account the factors described above and also considered: (1) the fairness of the compensation under a Management Contract with a level fee rate that does not include breakpoints; and (2) the pricing structure (including the net expense ratio to be borne by shareholders) of the Portfolio, as compared to its Selected Peer Group, including that: (a) the net management fee rate for the Portfolio is ranked in the fifth quintile of net management fee rates of the funds in its Selected Peer Group; (b) the contractual management fee rate for the Portfolio is ranked in the fifth quintile of contractual management fee rates of the funds in its Selected Peer Group; and (c) the net expense ratio for the Portfolio is ranked in the fourth quintile of net expense ratios of the funds in its Selected Peer Group. In analyzing this fee data, the Board took into account management’s representations regarding: (1) the expense borne by the Manager for the provision of services to the Portfolio, such as transfer agency, custody, accounting, and legal services, pursuant to the Portfolio’s Unified Fee Structure; and (2) its belief that the Portfolio’s pricing is competitive.
After its deliberation, the Board reached the following conclusions: (1) the Portfolio’s management fee rate is
99
ADVISORY AND SUB-ADVISORY CONTRACT APPROVAL DISCUSSION (UNAUDITED) (CONTINUED)
reasonable in the context of all factors considered by the Board; (2) the Portfolio’s net expense ratio is reasonable in the context of all factors considered by the Board; (3) the Portfolio’s performance is reasonable in the context of all factors considered by the Board; and (4) the sub-advisory fee rate payable by the Manager to the Sub-Adviser is reasonable in the context of all factors considered by the Board. Based on these conclusions and other factors, the Board voted to renew the Contracts for the Portfolio for the year ending November 30, 2020. During this renewal process, different Board members may have given different weight to different individual factors and related conclusions.
VY® Morgan Stanley Global Franchise Portfolio
In considering whether to approve the renewal of the Contracts for VY® Morgan Stanley Global Franchise Portfolio, the Board considered that, based on performance data for the periods ended March 31, 2019: (1) the Portfolio is ranked in the first quintile of its Morningstar category for all periods presented; and (2) the Portfolio outperformed its primary benchmark for all periods presented.
In considering the fees payable under the Contracts for the Portfolio, the Board took into account the factors described above and also considered: (1) the economies of scale benefits to the Portfolio and its shareholders from breakpoint discounts applicable to the Portfolio’s management fee rate, which result in lower fees at higher asset levels; and (2) the pricing structure (including the net expense ratio to be borne by shareholders) of the Portfolio, as compared to its Selected Peer Group, including that: (a) the net management fee rate for the Portfolio is ranked in the fifth quintile of net management fee rates of the funds in its Selected Peer Group; (b) the contractual management fee rate for the Portfolio is ranked in the fifth quintile of contractual management fee rates of the funds in its Selected Peer Group; and (c) the net expense ratio for the Portfolio is ranked in the fourth quintile of net expense ratios of the funds in its Selected Peer Group. In analyzing this fee data, the Board took into account management’s representations regarding: (1) the expense borne by the Manager for the provision of services to the Portfolio, such as transfer agency, custody, accounting, and legal services, pursuant to the Portfolio’s Unified Fee Structure; and (2) its belief that the Portfolio’s pricing is competitive.
After its deliberation, the Board reached the following conclusions: (1) the Portfolio’s management fee rate is reasonable in the context of all factors considered by the Board; (2) the Portfolio’s net expense ratio is reasonable in the context of all factors considered by the Board; (3) the Portfolio’s performance is reasonable in the context of all factors considered by the Board; and (4) the sub-advisory fee rate payable by the Manager to the Sub-Adviser and
the sub-sub-advisory fee rate payable by the Sub-Adviser to the Sub-Sub-Adviser are reasonable in the context of all factors considered by the Board. Based on these conclusions and other factors, the Board voted to renew the Contracts for the Portfolio for the year ending November 30, 2020. During this renewal process, different Board members may have given different weight to different individual factors and related conclusions.
VY® T. Rowe Price Capital Appreciation Portfolio
In considering whether to approve the renewal of the Contracts for VY® T. Rowe Price Capital Appreciation Portfolio, the Board considered that, based on performance data for the periods ended March 31, 2019: (1) the Portfolio is ranked in the first quintile of its Morningstar category for all periods presented; and (2) the Portfolio underperformed its primary benchmark for all periods presented, with the exception of the one-year period, during which it outperformed.
In considering the fees payable under the Contracts for the Portfolio, the Board took into account the factors described above and also considered: (1) the economies of scale benefits to the Portfolio and its shareholders from breakpoint discounts applicable to the Portfolio’s management fee rate, which result in lower fees at higher asset levels; and (2) the pricing structure (including the net expense ratio to be borne by shareholders) of the Portfolio, as compared to its Selected Peer Group, including that: (a) the net management fee rate for the Portfolio is ranked in the third quintile of net management fee rates of the funds in its Selected Peer Group; (b) the contractual management fee rate for the Portfolio is ranked in the third quintile of contractual management fee rates of the funds in its Selected Peer Group; and (c) the net expense ratio for the Portfolio is ranked in the second quintile of net expense ratios of the funds in its Selected Peer Group. In analyzing this fee data, the Board took into account that the expense borne by the Manager for the provision of services to the Portfolio, such as transfer agency, custody, accounting and legal services, pursuant to the Portfolio’s Unified Fee Structure.
After its deliberation, the Board reached the following conclusions: (1) the Portfolio’s management fee rate is reasonable in the context of all factors considered by the Board; (2) the Portfolio’s net expense ratio is reasonable in the context of all factors considered by the Board; (3) the Portfolio’s performance is reasonable in the context of all factors considered by the Board; and (4) the sub-advisory fee rate payable by the Manager to the Sub-Adviser is reasonable in the context of all factors considered by the Board. Based on these conclusions and other factors, the Board voted to renew the Contracts for the Portfolio for the year ending November 30, 2020. During this renewal process, different Board members may have given
100
ADVISORY AND SUB-ADVISORY CONTRACT APPROVAL DISCUSSION (UNAUDITED) (CONTINUED)
different weight to different individual factors and related conclusions.
VY® T. Rowe Price Equity Income Portfolio
In considering whether to approve the renewal of the Contracts for VY® T. Rowe Price Equity Income Portfolio, the Board considered that, based on performance data for the periods ended March 31, 2019: (1) the Portfolio is ranked in the second quintile of its Morningstar category for the three-year period, the third quintile for the year-to-date, one-year and ten-year periods, and the fourth quintile for the five-year period; and (2) the Portfolio underperformed its primary benchmark for all periods presented, with the exception of the three-year period, during which it outperformed.
In considering the fees payable under the Contracts for the Portfolio, the Board took into account the factors described above and also considered: (1) the economies of scale benefits to the Portfolio and its shareholders from breakpoint discounts applicable to the Portfolio’s management fee rate, which result in lower fees at higher asset levels; and (2) the pricing structure (including the net expense ratio to be borne by shareholders) of the Portfolio, as compared to its Selected Peer Group, including that: (a) the net management fee rate for the Portfolio is ranked in the second quintile of net management fee rates of the funds in its Selected Peer Group; (b) the contractual management fee rate for the Portfolio is ranked in the third quintile of contractual management fee rates of the funds in its Selected Peer Group; and (c) the net expense ratio for the Portfolio is ranked in the second quintile of net expense ratios of the funds in its Selected Peer Group. In analyzing this fee data, the Board took into account that the expense borne by the Manager for the provision of services to the Portfolio, such as transfer agency, custody, accounting and legal services, pursuant to the Portfolio’s Unified Fee Structure.
After its deliberation, the Board reached the following conclusions: (1) the Portfolio’s management fee rate is reasonable in the context of all factors considered by the Board; (2) the Portfolio’s net expense ratio is reasonable in the context of all factors considered by the Board; (3) the Portfolio’s performance is reasonable in the context of all factors considered by the Board; and (4) the sub-advisory fee rate payable by the Manager to the Sub-Adviser is reasonable in the context of all factors considered by the Board. Based on these conclusions and other factors, the Board voted to renew the Contracts for the Portfolio for the
year ending November 30, 2020. During this renewal process, different Board members may have given different weight to different individual factors and related conclusions.
VY® T. Rowe Price International Stock Portfolio
In considering whether to approve the renewal of the Contracts for VY® T. Rowe Price International Stock Portfolio, the Board considered that, based on performance data for the periods ended March 31, 2019: (1) the Portfolio is ranked in the second quintile of its Morningstar category for the five-year period, and the third quintile for the year-to-date, one-year, three-year and ten-year periods; and (2) the Portfolio outperformed its primary benchmark for all periods presented.
In considering the fees payable under the Contracts for the Portfolio, the Board took into account the factors described above and also considered: (1) the fairness of the compensation under a Management Contract with a breakpoint fee schedule where the asset level necessary to achieve a breakpoint discount had not been reached by the Portfolio; and (2) the pricing structure (including the net expense ratio to be borne by shareholders) of the Portfolio, as compared to its Selected Peer Group, including that: (a) the net management fee rate for the Portfolio is ranked in the first quintile of net management fee rates of the funds in its Selected Peer Group; (b) the contractual management fee rate for the Portfolio is ranked in the first quintile of contractual management fee rates of the funds in its Selected Peer Group; and (c) the net expense ratio for the Portfolio is ranked in the first quintile of net expense ratios of the funds in its Selected Peer Group.
After its deliberation, the Board reached the following conclusions: (1) the Portfolio’s management fee rate is reasonable in the context of all factors considered by the Board; (2) the Portfolio’s net expense ratio is reasonable in the context of all factors considered by the Board; (3) the Portfolio’s performance is reasonable in the context of all factors considered by the Board; and (4) the sub-advisory fee rate payable by the Manager to the Sub-Adviser and the sub-sub-advisory fee rate payable by the Sub-Adviser to the Sub-Sub-Adviser are reasonable in the context of all factors considered by the Board. Based on these conclusions and other factors, the Board voted to renew the Contracts for the Portfolio for the year ending November 30, 2020. During this renewal process, different Board members may have given different weight to different individual factors and related conclusions.
101
(THIS PAGE INTENTIONALLY LEFT BLANK)
(THIS PAGE INTENTIONALLY LEFT BLANK)
Investment Adviser
Voya Investments, LLC
7337 East Doubletree Ranch Road, Suite 100
Scottsdale, Arizona 85258
Distributor
Voya Investments Distributor, LLC
7337 East Doubletree Ranch Road, Suite 100
Scottsdale, Arizona 85258
Transfer Agent
BNY Mellon Investment Servicing (U.S.) Inc.
301 Bellevue Parkway
Wilmington, Delaware 19809
Independent Registered Public Accounting Firm
KPMG LLP
Two Financial Center
60 South Street
Boston, Massachusetts 02111
Custodian
The Bank of New York Mellon
225 Liberty Street
New York, New York 10286
Legal Counsel
Ropes & Gray LLP
Prudential Tower
800 Boylston Street
Boston, Massachusetts 02199
Before investing, carefully consider the investment objectives, risks, charges and expenses of the variable annuity contract or variable life insurance policy and the underlying variable investment options. This and other information is contained in the prospectus for the variable annuity contract or variable life insurance policy and the underlying variable investment options. Obtain these prospectuses from your agent/registered representative and read them carefully before investing.
| RETIREMENT | INVESTMENTS | INSURANCE |  |
| |
| voyainvestments.com | VPAR-VIT1AISS2 (1219-022020) |
Annual Report
December 31, 2019
Classes ADV, I, P2, R6, S and S2
Voya Investors Trust
| | ■
Voya Balanced Income Portfolio | | | ■
Voya Limited Maturity Bond Portfolio | |
| | ■
Voya High Yield Portfolio | | | ■
Voya U.S. Stock Index Portfolio | |
| | ■
Voya Large Cap Growth Portfolio | | | ■
VY® Clarion Real Estate Portfolio | |
| | ■
Voya Large Cap Value Portfolio | | | ■
VY® JPMorgan Small Cap Core Equity Portfolio | |
| | | Beginning on January 1, 2021, as permitted by regulations adopted by the U.S. Securities and Exchange Commission, paper copies of each Portfolio’s annual and semi-annual shareholder reports, like this annual report, will no longer be sent by mail, unless you specifically request paper copies of the reports. Instead, the reports will be made available on a website and you will be notified by mail each time a report is posted and provided with a website link to access the report. | | |
| | | If you already elected to receive shareholder reports electronically, you will not be affected by this change and you need not take any action. You may elect to receive shareholder reports and other communications from your insurance carrier electronically by contacting them directly. | | |
| | | You may elect to receive all future reports in paper free of charge. If you received this document in the mail, please follow the instructions provided to elect to continue receiving paper copies of your shareholder reports. You can inform us that you wish to continue receiving paper copies by calling 1-800-283-3427. Your election to receive reports in paper will apply to all the funds in which you invest. | | |
| | | This report is submitted for general information to shareholders of the Voya mutual funds. It is not authorized for distribution to prospective shareholders unless accompanied or preceded by a prospectus which includes details regarding the funds’ investment objectives, risks, charges, expenses and other information. This information should be read carefully. | | |
PROXY VOTING INFORMATION
A description of the policies and procedures that the Portfolios use to determine how to vote proxies related to portfolio securities is available: (1) without charge, upon request, by calling Shareholder Services toll-free at (800) 992-0180; (2) on the Portfolios’ website at www.voyainvestments.com; and (3) on the U.S. Securities and Exchange Commission’s (“SEC’s”) website at www.sec.gov. Information regarding how the Portfolios voted proxies related to portfolio securities during the most recent 12-month period ended June 30 is available without charge on the Portfolios’ website at www.voyainvestments.com and on the SEC’s website at www.sec.gov.
QUARTERLY PORTFOLIO HOLDINGS
The Portfolios file their complete schedule of portfolio holdings with the SEC for the first and third quarters of each fiscal year on Form N-Q or Form N-PORT, available for filings after March 31, 2019. This report contains a summary portfolio of investments for certain Portfolios. The Portfolios’ Form N-Q or Form N-PORT is available on the SEC’s website at www.sec.gov. The Portfolios’ complete schedule of portfolio holdings, as filed on Form N-Q or Form N-PORT, are available: on www.voyainvestments.com and without charge upon request from the Portfolio by calling Shareholder Services toll-free at (800) 992-0180.
New season, last year’s plot
Dear Shareholder,
The financial markets delivered strong performance in 2019, and at this juncture, in our view, the outlook for 2020 seems upbeat. Thanks to supportive central bank policies around the world, global economic growth is reaccelerating; manufacturing activity, a key metric for setting market expectations, appears to be strengthening. Recent progress in the trade negotiations between China and the U.S. also helps brighten the outlook as 2020 gets underway.
So expect smooth sailing, right? Maybe. Barely into the first week of the new year, the world faced the prospect of escalating conflict in the Middle East, though tensions appear to have eased since then. Markets initially pulled back in response to heightened uncertainty but regrouped quickly. Follow-on events, if they occur, may not impact markets that much: during 2019, investors generally did well by downplaying geopolitical concerns, and we could see the same behavior in 2020.
Still, we believe that turbulence seems to be the world’s modus operandi: economic and market uncertainty are still with us, trade issues remain unresolved and the upcoming U.S. presidential election adds another dimension of political uncertainty. Even though market participants have become more comfortable accepting risk, we have observed persistent preferences for higher-quality, lower-volatility assets. This tells us that investors perceive significant risks they wish to avoid, and points to the potential for volatile reactions to adverse news.
With potential surprises from anywhere, we believe investors should continue to diversify their portfolios as broadly as practicable, and not attempt to time the markets. At the start of 2019, in our opinion, many investors did not believe U.S. equities offered attractive return potential — acting on that belief would have resulted in missed opportunities. Remember that your portfolio is structured to meet your long-term objectives; changing it in response to short-term market conditions may put your long-term goals at risk. If your goals have changed, please discuss them thoroughly with your investment advisor before making any changes to your portfolio.
Voya seeks to remain a reliable partner committed to reliable investing, helping you and your investment advisor achieve your goals. We appreciate your continued confidence in us, and we look forward to serving your investment needs in the future.
Sincerely,
Dina Santoro
President
Voya Family of Funds
January 21, 2020
The views expressed in the President’s Letter reflect those of the President as of the date of the letter. Any such views are subject to change at any time based upon market or other conditions and the Voya mutual funds disclaim any responsibility to update such views. These views may not be relied on as investment advice and because investment decisions for a Voya mutual fund are based on numerous factors, may not be relied on as an indication of investment intent on behalf of any Voya mutual fund. Reference to specific company securities should not be construed as recommendations or investment advice.
International investing poses special risks including currency fluctuation, economic and political risks not found in investments that are solely domestic.
Market Perspective: Year Ended December 31, 2019
In our semi-annual report, we described how global equities, in the form of the MSCI World IndexSM (the “Index”) measured in local currencies, including net reinvested dividends, rose 16.69% for the half-year after a nervous start.
A trade war between the U.S. and China had been ongoing for more than a year, with U.S. tariffs on some $250 billion of Chinese goods in place together with Chinese tariffs on $110 billion of U.S. goods. The war was being waged against a backdrop of slowing global growth, in part the result of uncertainties caused by the trade war itself.
Fears on both fronts: the trade war and slowing global growth, would ebb and flow in the second half; yet the Index rose five months out of six, ending the year up 27.34%, just below the record set a few days earlier. (The Index returned 27.67% for the year ended December 31, 2019, measured in U.S. dollars.)
Entering May, trade talks had appeared to be going reasonably well and the path of least resistance for the Index still seemed upwards. This all changed when the President tweeted his intention to raise the existing 10% tariff on $200 billion of the $250 billion to 25% of Chinese goods. Trade negotiations had evidently broken down. Later he unexpectedly threatened tariffs on Mexican goods for reasons unrelated to trade.
On perceived slowing global growth, there was still plenty to worry about.
In Europe, manufacturing was in contraction. The euro zone’s annual growth in gross domestic product (“GDP”) in the second and third quarters of 2019 was just 1.2%. In the U.K., chronic disagreement about whether and how to leave the European Union (“Brexit”) culminated in a general election called for December.
Japan, with manufacturing also in contraction, managed GDP growth of 2.0% annualized in the second quarter, slipping to 1.8% in the third. Exports and imports were both falling and core inflation languished at 0.8%, with a demand-dampening sales tax increase effective on October 1.
China’s GDP grew at 6.0% in the third quarter, the smallest advance in 27 years. Industrial production was expanding near the slowest pace in 17 years, retail sales in 16 years.
In the U.S., manufacturing fell into contraction in September. Corporate profits were flat to falling year-over-year. While annualized first quarter growth had surprised to the upside at 3.1%, it fell to 2.0% and 2.1% in the second and third quarters, respectively. Growth was heavily dependent on consumer spending, supported by the lowest unemployment rate since 1969.
Back in the markets, after May’s slump, central banks came to the rescue in June. On June 19 the Federal Open Market Committee (“FOMC”) left rates unchanged, but markets heard Chairman Powell signal a cut in July. The European Central Bank announced its willingness to cut its already negative deposit rate and resume bond purchases. The Japanese government also promised increased stimulus. Plans for tariffs on Mexican imports were “indefinitely suspended”, and investors were finally left to cheer a truce in the U.S.-China trade conflict, agreed on June 29.
July was a comparatively quiet month. The FOMC duly cut the federal funds rate by 25 basis points (0.25%), but disappointed some, including the President, by referring to it as only a “mid-cycle adjustment”. And it was back to trade-war angst in August, as first the
President announced 10% tariffs on the approximately $300 billion of Chinese imports as yet unaffected, and then increased existing and planned tariffs by 5% when China retaliated.
The market rollercoaster lurched back up in September and October, when high-level trade talks between the U.S. and China resumed. Both sides expressed confidence that “Phase 1” of a deal was possible by year-end. The FOMC cut rates again in both months.
And as year-end approached, a more positive narrative was increasingly heard. Markets were rising despite trade tensions, sluggish global growth, declining profits and political uncertainties in the U.S. and elsewhere. Perhaps, some commentators ventured, this was a signal that the worst was over. The Phase 1 trade deal was announced, amid some skepticism on the details, as was agreement on USMCA, the replacement for NAFTA. The U.K. government’s emphatic election victory might offer more clarity on Brexit. Central banks were all supportive and some of the economic data were starting to improve.
In U.S. fixed income markets, the Treasury yield curve fell. For the year, the Bloomberg Barclays U.S. Aggregate Bond Index rose 8.72%. The Bloomberg Barclays Long-Term U.S. Treasury sub-index returned 14.83%, the 30-year yield briefly dipping below 2% in August. The 10-year yield on Japanese and some euro zone government bonds ended below zero.
U.S. equities, represented by the S&P 500® Index, including dividends, surged 31.49%. Technology was by far the top performer, up 50.29%, led by Apple and Microsoft. Energy, exposed to slowing global economic activity, was the weakest, but still rose 11.81%.
In currencies, the dollar rose 2.04% against the euro, but lost 3.80% against the pound and 0.97% against the yen. On a trade-weighted basis, according to Reuters, the dollar had the smallest annual move ever in 2019.
In international markets, the MSCI Japan® Index ended up 18.48% for the year, supported by the Bank of Japan’s purchases of exchange-traded funds, but pressured by Japan’s own vulnerability to a trade war. The MSCI Europe ex U.K.® Index advanced 26.43%, powered by capital goods and pharmaceuticals companies. The MSCI U.K.® Index rose 16.37%, dampened by Brexit concerns, but also affected by the company-specific fortunes of MSCI U.K.’s market heavyweights. Among the largest contributors were pharmaceuticals, AstraZeneca and GlaxoSmithKline; the biggest detractors were miner Glencore and HSBC.
All indices are unmanaged and investors cannot invest directly in an index. Past performance does not guarantee future results. The performance quoted represents past performance.
Investment return and principal value of an investment will fluctuate, and shares, when redeemed, may be worth more or less than their original cost. Each Portfolio’s performance is subject to change since the period’s end and may be lower or higher than the performance data shown. Please call (800) 366-0066 or log on to www.voyainvestments.com to obtain performance data current to the most recent month end.
Market Perspective reflects the views of Voya Investment Management’s Chief Investment Risk Officer only through the end of the period, and is subject to change based on market and other conditions.
| | | Index | | | | Description | | |
| | | Bloomberg Barclays High Yield Bond — 2% Issuer Constrained Composite Index | | | | An index that includes all fixed-income securities having a maximum quality rating of Ba1, a minimum amount outstanding of $150 million, and at least one year to maturity. | | |
| | | Bloomberg Barclays U.S. 1-3 Year Government/Credit Bond Index | | | | A widely recognized index of publicly issued fixed rate, investment grade debt securities, including Treasuries, Agencies and credit securities with a maturity of one to three years. | | |
| | | Bloomberg Barclays U.S. Aggregate Bond Index | | | | An index of publicly issued investment grade U.S. government, mortgage-backed, asset-backed and corporate debt securities. | | |
| | | Bloomberg Barclays Long-Term U.S. Treasury Index | | | | This index measures the performance of U.S. Treasury bills with long-term maturity. The credit level for this index is investment grade. The rebalance scheme is monthly. | | |
| | | MSCI Europe ex U.K.® Index | | | | A free float-adjusted market capitalization index that is designed to measure developed market equity performance in Europe, excluding the UK. | | |
| | | MSCI Japan® Index | | | | A free float-adjusted market capitalization index that is designed to measure developed market equity performance in Japan. | | |
| | | MSCI U.S. REIT® Index | | | | A free float-adjusted market capitalization weighted index that is comprised of equity real estate investment trusts that are included in the MSCI U.S. Investable Market 2500 Index (with the exception of specialty REITs that do not generate a majority of their revenue and income from real estate rental and leasing obligations). The index represents approximately 85% of the U.S. REIT market. | | |
| | | MSCI U.K.® Index | | | | A free float-adjusted market capitalization index that is designed to measure developed market equity performance in the UK. | | |
| | | MSCI World IndexSM | | | | An index that measures the performance of over 1,600 securities listed on exchanges in the U.S., Europe, Canada, Australia, New Zealand and the Far East. | | |
| | | Russell 1000® Growth Index | | | | Measures the performance of the 1,000 largest companies in the Russell 3000® Index with higher price-to-book ratios and higher forecasted growth. | | |
| | | Russell 1000® Value Index | | | | An index that measures the performance of those Russell 1000® securities with lower price-to-book ratios and lower forecasted growth values. | | |
| | | Russell 2000® Index | | | | An index that measures the performance of securities of small U.S. companies. | | |
| | | S&P 500® Index | | | | An index that measures the performance of securities of approximately 500 large-capitalization companies whose securities are traded on major U.S. stock markets. | | |
| Voya Balanced Income Portfolio | Portfolio Managers’ Report |
| | Investment Type Allocation
as of December 31, 2019
(as a percentage of net assets) | |
| | | | | | |
| | Common Stock | | | 39.4% | |
| | Collateralized Mortgage Obligations | | | 14.6% | |
| | Commercial Mortgage-Backed Securities | | | 11.8% | |
| | Mutual Funds | | | 8.5% | |
| | Asset-Backed Securities | | | 8.1% | |
| | Corporate Bonds/Notes | | | 6.6% | |
| | U.S. Government Agency Obligations | | | 2.4% | |
| | U.S. Treasury Obligations | | | 2.3% | |
| | Sovereign Bonds | | | 2.1% | |
| | Exchange-Traded Funds | | | 0.6% | |
| | Preferred Stock | | | 0.5% | |
| | Purchased Options* | | | 0.0% | |
| | Rights* | | | 0.0% | |
| | Assets in Excess of Other Liabilities** | | | 3.1% | |
| | Net Assets | | | 100.0% | |
| | *
Amount is less than 0.05% | |
| | **
Includes short-term investments and exchange-traded funds. | |
| | Portfolio holdings are subject to change daily. | |
Voya Balanced Income Portfolio (the “Portfolio”) seeks to maximize income while maintaining prospects for capital appreciation
. The Portfolio is managed by Paul Zemsky, CFA, Brian Timberlake, Ph.D., CFA, and Vincent Costa, CFA, Portfolio Managers of Voya Investment Management Co. LLC (“VIM”)* — the Sub-Adviser.
Performance: For the year ended December 31, 2019, the Portfolio’s Class S shares provided a total return of 18.40% compared to the 60% Bloomberg Barclays U.S. Aggregate Bond Index/ 30% Russell 1000® Index/10% MSCI EAFE® Index**, S&P 500® Index and the Bloomberg Barclays U.S. Aggregate Bond Index, which returned 16.72%, 31.49% and 8.72%, respectively, for the same period.
Portfolio Specifics — Franklin Advisors, Inc. (“Franklin”) January 1, 2019 — April 16, 2019: During the period, the Portfolio maintained an emphasis on select opportunities within corporate debt securities, particularly within non-investment grade where we prefer to emphasize company-specific factors rather than broad credit and interest-rate risk. (High yield bonds have what we consider to be the added advantage of being a fairly short duration asset class.)
The fixed income and equity sides of the Portfolio both contributed to performance.
All equity sectors helped results. In particular, the information technology (“IT”), energy and consumer discretionary sectors delivered strong performance. In IT, Apple, Microsoft and Texas Instruments led results. Energy sector performance was bolstered by The Williams Companies, Royal Dutch Shell and Exxon Mobil. Among consumer discretionary holdings, Target and Ford were major contributors.
| | Top Ten Holdings
as of December 31, 2019
(as a percentage of net assets) | |
| | | | | | |
| | Voya Floating Rate Fund - Class P | | | 8.5% | |
| | Microsoft Corp. | | | 1.4% | |
| | Uniform Mortgage-Backed Securities, 3.500%, 06/25/42 | | | 1.1% | |
| | Ginnie Mae, 3.000%, 01/20/50 | | | 1.1% | |
| | United States Treasury Note, 1.625%, 12/31/21 | | | 1.1% | |
| | Citigroup Commercial Mortgage Trust
2013-GC15 D, 5.214%, 09/10/46 | | | 0.6% | |
| | JPMorgan Chase & Co. | | | 0.6% | |
| | Johnson & Johnson | | | 0.6% | |
| | United States Treasury Bond, 2.250%, 08/15/49 | | | 0.6% | |
| | iShares Russell 1000 ETF | | | 0.6% | |
| | Portfolio holdings are subject to change daily. | |
In contrast, individual equity detractors included health care holdings Pfizer, Medtronic and Bristol Myers.
All fixed income sectors contributed to Portfolio performance, with standout results from the health care, energy and financials sectors. Tenet Healthcare and Community Health Systems were major health care contributors. Among the Portfolio’s energy positions, Chesapeake Energy delivered positive performance. Citigroup led results in the financial sector.
The only fixed income detractor was Belk, which had only a minor impact on results.
The Portfolio made moderate use of derivative instruments during the period, such as equity options and equity-linked notes. The goal of these instruments is to enhance Portfolio returns and yield and, in some cases, broaden the investment universe. These positions had a modest impact on performance.
Portfolio Specifics*** — VIM — May 1, 2019 — December 31, 2019: On May 1, 2019, the Portfolio underwent a restructuring that included changes to its benchmark and management team. As of May 1, 2019, the Portfolio’s primary benchmark became the 60% Bloomberg Barclays U.S. Aggregate Bond Index/ 30% Russell 1000® Index/10% MSCI EAFE® Index, and VIM assumed responsibility for managing the Portfolio. The Portfolio consists of three underlying investment strategies (“sleeves”) in weights matching the components of the benchmark: Voya Strategic Income Opportunities Fund (60%), Voya U.S. High Dividend Low Volatility Fund (30%) and International High Dividend Low Volatility Fund (10%).
| Portfolio Managers’ Report | Voya Balanced Income Portfolio |
Overall, the Portfolio underperformed it’s benchmark during the reporting period. The Voya U.S. High Dividend Low Volatility Fund and International Dividend Low Volatility Fund sleeves underperformed their respective benchmarks due to unfavorable stock selection in most sectors and detracted from the Portfolio’s relative results. The fixed-income sleeve also underperformed the Bloomberg Barclays U.S. Aggregate Bond Index and detracted from results during the period.
Current Strategy and Outlook: The Portfolio seeks to maintain a conservative, risk-adjusted return profile, with a strategic investment allocation split between 60% fixed income and 40% equities. The Portfolio sleeves emphasize income-producing securities and potential to generate above-average yield.
After several months of easing in monetary policy from global central banks, the effects are beginning to trickle through to the real economy: the manufacturing sector is showing signs of life, while consumer demand remains strong. We believe relaxed financial conditions and a robust labor market are likely to keep the marginal improvement trend in place. We view the likelihood of a U.S. recession over the next 12 months as low. We believe that central banks appear willing to provide sufficient liquidity to prolong the cycle, inflation is tame and there are no materially worrisome signs of financial excess.
What’s more, in our opinion, the probability of an exogenous shock has declined as U.S. and Chinese officials appear to be making progress on trade. Assuring us of this opinion are strong non-farm payrolls, contained high yield spreads and decent consumer confidence, which is corroborated by strong auto sales. Furthermore, although we have discounted the yield curve as a leading indicator of recession given the distortions arising from unconventional central bank asset buying and negative term premiums, it is our opinion that the areas of the curve most closely correlated with future recessions have reverted to a more normal shape.
As a result, we maintain a favorable view of stocks. Third quarter U.S. corporate earnings reports are coming in better than expected, as 75% of S&P 500® Index companies have reported positive earnings per share surprises and 60% have beaten revenue estimates. With profit margins for U.S. large cap companies well above their long-term average, we believe that further gains in S&P 500® Index stocks will most likely need to come from revenue growth or earnings multiple expansion. We are reticent to rely much on top-line growth, given the lackluster, albeit improving, economic backdrop; yet we see scope for further tightening of the equity risk premium and higher valuations.
That said, we believe that the relative advantage U.S. large caps have held over smaller cap and foreign stocks is lessening. Multiple financial indicators suggest economic activity is gaining momentum, such as a move-up in global PMIs, strong performance from global semiconductor stocks and high copper prices. Following a long bout of underperformance, non-U.S. stocks are under-owned and in our opinion, relatively cheap.
*
The Board of Trustees of the Portfolio approved the strategy change and sub-adviser replacement of Franklin with VIM effective May 1, 2019.
In conjunction with the strategy change and sub-adviser replacement, Effective May 1, 2019, Paul Zemsky, Brian Timberlake, and Vincent Costa were added as portfolio managers to the Portfolio and Brendan Circle, Edward D. Perks, and Matt Quinlan were removed as portfolio managers to the Portfolio.
In conjunction with the strategy change and sub-adviser replacement, the Portfolio’s name changed to VY® Balanced Income Portfolio.
**
Effective May 1, 2019, the sub-adviser changed the primary benchmark from the S&P 500® Index to the 60% Bloomberg Barclays U.S. Aggregate Bond Index/ 30% Russell 1000® Index/10% MSCI EAFE® Index because the 60% Bloomberg Barclays U.S. Aggregate Bond Index/30% Russell 1000® Index/ 10% MSCI EAFE® Index is considered by the sub-adviser to be a more appropriate benchmark reflecting the type of securities in which the Portfolio invests.
***
Beginning April 16, 2019, through the close of business on April 30, 2019, the Portfolio was in a transition period and may have held a large portion of the Portfolio’s assets in temporary investments.
The views expressed in this commentary are informed opinions. They should not be considered promises or advice. The views expressed reflect those of the portfolio managers, only through the end of the period as stated on the cover. The portfolio managers’ views are subject to change at any time based on market and other conditions.
Portfolio holdings and characteristics are subject to change and may not be representative of current holdings and characteristics. Portfolio holdings are subject to change daily. The outlook for this Portfolio may differ from that presented for other Voya mutual funds. This report contains statements that may be “forward-looking” statements. Actual results may differ materially from those projected in the “forward-looking” statements. The Portfolio’s performance returns shown reflect applicable fee waivers and/or expense limits in effect during this period. Absent such fee waivers/expense limitations, if any, performance would have been lower. Performance for the different classes of shares will vary based on differences in fees associated with each class. An index has no cash in its portfolio and imposes no sales charges. An investor cannot invest directly in an index.
| Voya Balanced Income Portfolio | Portfolio Managers’ Report |
| | | Average Annual Total Returns for the Periods Ended December 31, 2019 | | |
| | | | | | 1 Year | | | 5 Year | | | 10 Year | | |
| | | Class ADV | | | | | 17.93% | | | | | | 5.71% | | | | 7.36% | | |
| | | Class I | | | | | 18.73% | | | | | | 6.31% | | | | 7.99% | | |
| | | Class S | | | | | 18.40% | | | | | | 6.10% | | | | 7.75% | | |
| | | Class S2 | | | | | 18.15% | | | | | | 5.92% | | | | 7.58% | | |
| | | 60% Bloomberg Barclays U.S. Aggregate Bond Index/30% Russell 1000® Index/10% MSCI EAFE® Index | | | | | 16.72% | | | | | | 6.00% | | | | 7.04% | | |
| | | Bloomberg Barclays U.S. Aggregate Bond Index | | | | | 8.72% | | | | | | 3.05% | | | | 3.75% | | |
| | | Russell 1000® Index | | | | | 31.43% | | | | | | 11.48% | | | | 13.54% | | |
| | | MSCI EAFE® Index | | | | | 22.01% | | | | | | 5.67% | | | | 5.50% | | |
| | | S&P 500® Index | | | | | 31.49% | | | | | | 11.70% | | | | 13.56% | | |
| | | | | |
Based on a $10,000 initial investment, the graph and table above illustrate the total return of Voya Balanced Income Portfolio against the indices indicated. An index is unmanaged and has no cash in its portfolio and imposes no sales charges. An investor cannot invest directly in an index.
The Portfolio’s performance is shown without the imposition of any expenses or charges which are, or may be, imposed under your variable annuity contract or variable life insurance policy. Total returns would have been lower if such expenses or charges were included.
The performance graph and table do not reflect the deduction of taxes that a shareholder will pay on Portfolio distributions or the redemption of Portfolio shares.
The performance shown may include the effect of fee waivers and/or expense reimbursements by the Investment Adviser and/or other service providers, which have the effect of increasing total return. Had all fees and expenses been considered, the total returns would have been lower.
The performance update illustrates performance for a variable investment option available through a variable
annuity contract or a variable life insurance policy. The performance shown indicates past performance and is not a projection or prediction of future results. Actual investment returns and principal value will fluctuate so that shares and/or units, at redemption, may be worth more or less than their original cost. Please log on to www.voyainvestments.com or call (800) 366-0066 to get performance through the most recent month end.
Portfolio holdings are subject to change daily.
Prior to May 1, 2019, the Portfolio was managed by a different sub-adviser.
Effective May 1, 2019, the Adviser changed the primary benchmark from the S&P 500® Index to the 60% Bloomberg Barclays U.S. Aggregate Bond Index/30% Russell 1000® Index/10% MSCI EAFE® Index because the 60% Bloomberg Barclays U.S. Aggregate Bond Index/30% Russell 1000® Index/10% MSCI EAFE® Index is considered by the Sub-Adviser to be a more appropriate benchmark reflecting the type of securities in which the Portfolio invests.
| Portfolio Managers’ Report | Voya High Yield Portfolio |
| | Investment Type Allocation
as of December 31, 2019
(as a percentage of net assets) | |
| | | | | | |
| | Corporate Bonds/Notes | | | 95.4% | |
| | Bank Loans | | | 1.0% | |
| | Convertible Bonds/Notes | | | 0.2% | |
| | Common Stock | | | 0.1% | |
| | Warrants* | | | 0.0% | |
| | Preferred Stock* | | | 0.0% | |
| | Other* | | | 0.0% | |
| | Assets in Excess of Other Liabilities** | | | 3.3% | |
| | Net Assets | | | 100.0% | |
| | *
Amount is less than 0.05% | |
| | **
Includes short-term investments. | |
| | Portfolio holdings are subject to change daily. | |
Voya High Yield Portfolio (the “Portfolio”) seeks to provide investors with a high level of current income and total return. The Portfolio is managed by Rick Cumberledge, CFA, and Randall Parrish, CFA, Portfolio Managers of Voya Investment Management Co. LLC — the Sub-Adviser.
Performance: For the year ended December 31, 2019, the Portfolio’s Class S shares provided a total return of 15.22% compared to the Bloomberg Barclays High Yield Bond — 2% Issuer Constrained Composite Index (the “Index”), which returned 14.32% for the same period.
Portfolio Specifics: High yield posted a 14.32% total return for 2019, as spreads compressed 190 basis points (1.90%) to close the year at an option-adjusted spread of 336 basis points (3.36%). Quality outperformed, partially driven by a decline in interest rates, with BB-rated bonds modestly outperforming B-rated bonds, while CCC-rated bonds lagged materially all year before playing some catch-up in the fourth quarter of 2019.
The Portfolio outperformed the Index for the year. Outperformance was driven by security selection across a wide array of industries. Pharmaceuticals was the largest contributor, specifically the Portfolio’s holding in Bausch Health Companies. The Portfolio’s underweight in oil field services also added to outperformance, as the sector struggled with the volatility in oil prices throughout the year. Other notable contributors to outperformance included selection in wirelines, driven by holdings in Altice USA, and retailers, driven by holdings in PetSmart Inc. Cash was the largest detractor from relative performance. Selection in health care and paper industries also modestly detracted from results for the period.
Current Strategy and Outlook: Credit fundamentals are reasonable as mixed data are showing early signs of stabilization in
| | Top Ten Holdings
as of December 31, 2019*
(as a percentage of net assets) | |
| | | | | | |
| | HCA, Inc., 5.375%, 02/01/25 | | | 0.9% | |
| | Bausch Health Americas, Inc., 8.500%, 01/31/27 | | | 0.8% | |
| | Sprint Corp., 7.125%, 06/15/24 | | | 0.7% | |
| | 1011778 BC ULC / New Red Finance, Inc., 5.000%, 10/15/25 | | | 0.7% | |
| | CSC Holdings LLC, 5.250%, 06/01/24 | | | 0.7% | |
| | CommScope Tech Finance LLC, 6.000%, 06/15/25 | | | 0.6% | |
| | Standard Industries, Inc./NJ, 6.000%, 10/15/25 | | | 0.6% | |
| | Icahn Enterprises L.P. / Icahn Enterprises Finance Corp., 6.250%, 05/15/26 | | | 0.5% | |
| | CCO Holdings LLC / CCO Holdings Capital Corp., 5.750%, 02/15/26 | | | 0.6% | |
| | Post Holdings, Inc., 5.625%, 01/15/28 | | | 0.6% | |
| | *
Excludes short-term investments. | |
| | Portfolio holdings are subject to change daily. | |
manufacturing. Earnings growth has slowed but we expect a recovery in 2020. We believe that credit statistics remain stable outside the energy sector, given intentional leveraging; other typical late-cycle behavior has been limited. In our view, supply and demand remain well supported: a rebound of issuance in 2019 was well absorbed and flows into the asset class were robust. Valuations look high to us, but absent a recession in 2020, the next market-wide default cycle remains beyond the horizon.
We continue to prefer B-rated bonds, but see select opportunities among higher-quality CCC-rated issues. Given what we consider to be the continued strength of the U.S. consumer, we prefer domestically oriented sectors such as leisure, building materials and retailers, as well as media and entertainment, which we believe will benefit from the upcoming election cycle and the Olympics. We are maintaining an underweight to energy, given our bearish view on natural gas and belief that the recent oil rally was overdone.
The views expressed in this commentary are informed opinions. They should not be considered promises or advice. The views expressed reflect those of the portfolio managers, only through the end of the period as stated on the cover. The portfolio managers’ views are subject to change at any time based on market and other conditions.
Portfolio holdings and characteristics are subject to change and may not be representative of current holdings and characteristics. Portfolio holdings are subject to change daily. The outlook for this Portfolio may differ from that presented for other Voya mutual funds. This report contains statements that may be “forward-looking” statements. Actual results may differ materially from those projected in the “forward-looking” statements. The Portfolio’s performance returns shown reflect applicable fee waivers and/or expense limits in effect during this period. Absent such fee waivers/expense limitations, if any, performance would have been lower. Performance for the different classes of shares will vary based on differences in fees associated with each class. An index has no cash in its portfolio and imposes no sales charges. An investor cannot invest directly in an index.
| Voya High Yield Portfolio | Portfolio Managers’ Report |
| | | Average Annual Total Returns for the Periods Ended December 31, 2019 | | |
| | | | | | 1 Year | | | 5 Year | | | 10 Year | | |
| | | Class ADV | | | | | 14.82% | | | | | | 5.51% | | | | 6.45% | | |
| | | Class I | | | | | 15.37% | | | | | | 6.11% | | | | 7.08% | | |
| | | Class S | | | | | 15.22% | | | | | | 5.87% | | | | 6.82% | | |
| | | Class S2 | | | | | 14.91% | | | | | | 5.71% | | | | 6.62% | | |
| | | Bloomberg Barclays High Yield Bond - 2% Issuer Constrained Composite Index | | | | | 14.32% | | | | | | 6.14% | | | | 7.55% | | |
| | | | | |
Based on a $10,000 initial investment, the graph and table above illustrate the total return of Voya High Yield Portfolio against the index indicated. The index is unmanaged and has no cash in its portfolio and imposes no sales charges. An investor cannot invest directly in an index.
The Portfolio’s performance is shown without the imposition of any expenses or charges which are, or may be, imposed under your variable annuity contract or variable life insurance policy. Total returns would have been lower if such expenses or charges were included.
The performance graph and table do not reflect the deduction of taxes that a shareholder will pay on Portfolio distributions or the redemption of Portfolio shares.
The performance shown may include the effect of fee waivers and/or expense reimbursements by the Investment Adviser and/or other service providers, which have the
effect of increasing total return. Had all fees and expenses been considered, the total returns would have been lower.
The performance update illustrates performance for a variable investment option available through a variable annuity contract or a variable life insurance policy. The performance shown indicates past performance and is not a projection or prediction of future results. Actual investment returns and principal value will fluctuate so that shares and/or units, at redemption, may be worth more or less than their original cost. Please log on to www.voyainvestments.com or call (800) 366-0066 to get performance through the most recent month end.
Portfolio holdings are subject to change daily.
Prior to February 5, 2014, the Portfolio was managed by a different sub-adviser.
| Portfolio Managers’ Report | Voya Large Cap Growth Portfolio |
| | Sector Diversification
as of December 31, 2019
(as a percentage of net assets) | |
| | | | | | |
| | Information Technology | | | 37.9% | |
| | Health Care | | | 14.9% | |
| | Consumer Discretionary | | | 13.9% | |
| | Communication Services | | | 11.4% | |
| | Industrials | | | 9.8% | |
| | Consumer Staples | | | 4.7% | |
| | Financials | | | 3.0% | |
| | Real Estate | | | 2.4% | |
| | Materials | | | 1.4% | |
| | Assets in Excess of Other Liabilities* | | | 0.6% | |
| | Net Assets | | | 100.0% | |
| | *
Includes short-term investments. | |
| | Portfolio holdings are subject to change daily. | |
Voya Large Cap Growth Portfolio (the “Portfolio”) seeks long-term capital growth. The Portfolio is managed by Jeffrey Bianchi, CFA, Kristy Finnegan, CFA, and Michael Pytosh, Portfolio Managers* of Voya Investment Management Co. LLC — the Sub-Adviser.
Performance: For the year ended December 31, 2019, the Portfolio’s Class S shares, provided a total return of 32.41% compared to the Russell 1000® Growth Index, which returned 36.39% for the same period.
Portfolio Specifics: The Portfolio underperformed the Russell 1000® Growth Index during the reporting period, namely due to stock selection effects. Stock selection within the information technology and consumer staples sectors detracted the most from performance. An allocation to cash, while within the typical range, was also a headwind during the period. Conversely, stock selection within the financial sector and, to a lesser extent, the materials sector, contributed the most to performance.
The biggest detractors included Apple, Inc., United Health Group Inc. and Biogen, Inc.
An underweight allocation to Apple, Inc. was a headwind during the period. The stock price advanced throughout the year following its low expectation iPhone release in September, followed by third quarter earnings that exceeded expectations. The company also raised guidance, citing strong results across phones, services and wearables. A notable improvement within their China business was also well-received by investors.
Our positioning in UnitedHealth Group, Inc. detracted from results. An overweight earlier in the period was a headwind, as managed care and healthcare services stocks were under pressure due to several proposals that could change the economics for Medicare drug plans and Pharmacy Benefit Managers. In addition, proposed changes by several Democratic Presidential candidates to the U.S. healthcare system as part of their 2020 election platforms weighted on its shares. In the fourth quarter of 2019, not owning the stock had a negative impact. Sentiment for the managed care group improved following better than feared third quarter results, Elizabeth Warren’s decline in the election polls and the permanent repeal of the Health Insurer Fee tax. In addition to improved sentiment for the group, the company outperformed following its well-received earnings update, citing an inline medical loss ratio and that commercial medical cost trends that were tracking better than expected.
An overweight position in Biogen Inc., a biotech company focused on treatments for neurological diseases such as Multiple Sclerosis, Spinal Muscular Atrophy and Alzheimer’s disease, was a headwind during the period. Its shares traded off following the company’s announced discontinuation of its Phase 3 Alzheimer’s trials for its drug Aducanumab.
The top contributors during the year included Humana, Inc., Lam Research Corp. and Cisco Systems, Inc.
An overweight position in managed care company Humana, Inc., generated favorable results. Its shares advanced following its solid quarterly earnings report, headlined by a 10% earnings per share beat, which was primarily driven by better-than-expected individual Medicare Advantage medical cost
| | Top Ten Holdings
as of December 31, 2019
(as a percentage of net assets) | |
| | | | | | |
| | Amazon.com, Inc. | | | 6.5% | |
| | Microsoft Corp. | | | 6.3% | |
| | Apple, Inc. | | | 5.9% | |
| | Facebook, Inc. - Class A | | | 5.6% | |
| | Visa, Inc. - Class A | | | 4.4% | |
| | Merck & Co., Inc. | | | 3.0% | |
| | Intuit, Inc. | | | 2.9% | |
| | Alphabet, Inc. - Class A | | | 2.5% | |
| | American Tower Corp. | | | 2.4% | |
| | O’Reilly Automotive, Inc. | | | 2.4% | |
| | Portfolio holdings are subject to change daily. | |
trends driving upside. In addition, management raised calendar year 2019 guidance and provided an expected 2020 individual Medicare Advantage membership growth outlook that exceeded expectations.
An overweight position in semiconductor company Lam Research Corp. added value, following a solid earnings beat and raised guidance. Investors gained greater confidence in the stabilization in the memory market and expectations for the company to return to growth in 2020, while also gaining significant share.
Not owning benchmark security Cisco Systems, Inc. contributed to performance. Its shares traded off in response to disappointing earnings results and weaker-than-expected fiscal rear 2020 guidance. The company reported a deceleration across its business, product order growth declines, as well as broad-based softness in Asia-Pacific/China.
Current Strategy and Outlook: In our view, the U.S. economy is in the later stages of the economic cycle. While the health of U.S. corporations remains intact, as evidenced by significant amounts of free cash flow, active dividend increases and share buybacks, we believe corporate profit growth is poised to decelerate as record high incremental margins reach their peak. As a disciplined manager, we remain true to our investment process regardless of the unpredictable market environment, investing in companies with strong fundamentals and what we believe to be attractive relative valuations.
*
Effective August 1, 2019, Kristy Finnegan was added as a portfolio manager for the Portfolio.
The views expressed in this commentary are informed opinions. They should not be considered promises or advice. The views expressed reflect those of the portfolio managers, only through the end of the period as stated on the cover. The portfolio managers’ views are subject to change at any time based on market and other conditions.
Portfolio holdings and characteristics are subject to change and may not be representative of current holdings and characteristics. Portfolio holdings are subject to change daily. The outlook for this Portfolio may differ from that presented for other Voya mutual funds. This report contains statements that may be “forward-looking” statements. Actual results may differ materially from those projected in the “forward-looking” statements. The Portfolio’s performance returns shown reflect applicable fee waivers and/or expense limits in effect during this period. Absent such fee waivers/expense limitations, if any, performance would have been lower. Performance for the different classes of shares will vary based on differences in fees associated with each class. An index has no cash in its portfolio and imposes no sales charges. An investor cannot invest directly in an index.
| Voya Large Cap Growth Portfolio | Portfolio Managers’ Report |
| | | Average Annual Total Returns for the Periods Ended December 31, 2019 | | |
| | | | | | 1 Year | | | 5 Year | | | 10 Year | | |
| | | Class ADV | | | | | 31.90% | | | | | | 12.73% | | | | 13.84% | | |
| | | Class I | | | | | 32.77% | | | | | | 13.42% | | | | 14.50% | | |
| | | Class R6(1) | | | | | 32.82% | | | | | | 13.42% | | | | 14.50% | | |
| | | Class S | | | | | 32.41% | | | | | | 13.13% | | | | 14.21% | | |
| | | Class S2 | | | | | 32.16% | | | | | | 12.95% | | | | 14.04% | | |
| | | Russell 1000® Growth Index | | | | | 36.39% | | | | | | 14.63% | | | | 15.22% | | |
| | | | | |
Based on a $10,000 initial investment, the graph and table above illustrate the total return of Voya Large Cap Growth Portfolio against the index indicated. The index is unmanaged and has no cash in its portfolio and imposes no sales charges. An investor cannot invest directly in an index.
The Portfolio’s performance is shown without the imposition of any expenses or charges which are, or may be, imposed under your variable annuity contract or variable life insurance policy. Total returns would have been lower if such expenses or charges were included.
The performance graph and table do not reflect the deduction of taxes that a shareholder will pay on Portfolio distributions or the redemption of Portfolio shares.
The performance shown may include the effect of fee waivers and/or expense reimbursements by the Investment Adviser and/or other service providers, which have the effect of increasing total return. Had all fees and expenses been considered, the total returns would have been lower.
The performance update illustrates performance for a variable investment option available through a variable annuity contract or a variable life insurance policy. The performance shown indicates past performance and is not a projection or prediction of future results. Actual investment returns and principal value will fluctuate so that shares and/or units, at redemption, may be worth more or less than their original cost. Please log on to www.voyainvestments.com or call (800) 366-0066 to get performance through the most recent month end.
Portfolio holdings are subject to change daily.
Prior to June 11, 2010, the Portfolio was managed by a different sub-adviser.
(1)
Class R6 incepted on November 24, 2015. The Class R6 shares performance shown for the period prior to their inception date is the performance of Class I shares without adjustment for any differences in the expenses between the two classes. If adjusted for such differences, returns would be different.
| Portfolio Managers’ Report | Voya Large Cap Value Portfolio |
| | Sector Diversification
as of December 31, 2019
(as a percentage of net assets) | |
| | | | | | |
| | Financials | | | 23.6% | |
| | Health Care | | | 13.7% | |
| | Industrials | | | 9.5% | |
| | Consumer Staples | | | 8.9% | |
| | Energy | | | 8.5% | |
| | Communication Services | | | 8.2% | |
| | Information Technology | | | 6.3% | |
| | Utilities | | | 6.2% | |
| | Consumer Discretionary | | | 5.6% | |
| | Real Estate | | | 5.0% | |
| | Materials | | | 4.0% | |
| | Communications* | | | 0.0% | |
| | Assets in Excess of Other Liabilities** | | | 0.5% | |
| | Net Assets | | | 100.0% | |
| | *
Amount is less than 0.05% | |
| | **
Includes short-term investments. | |
| | Portfolio holdings are subject to change daily. | |
Voya Large Cap Value Portfolio (the “Portfolio”) seeks long-term growth of capital and current income. The Portfolio is managed by Vincent Costa, CFA, and James Dorment, CFA, Portfolio Managers* of Voya Investment Management Co. LLC — the Sub-Adviser.
Performance: For the year ended December 31, 2019, the Portfolio’s Class S shares provided a total return of 24.78% compared to the Russell 1000® Value Index (the “Index” or “Russell 1000® Value”), which returned 26.54% for the same period.
Portfolio Specifics: For the year ended December 31, 2019, the Portfolio underperformed the Index, due to weak security selection and asset allocation. On the sector level, stock selection within the health care and energy sectors had the largest negative impact on relative performance. Key detractors included underweights of Intel Corporation and Qualcomm Inc., and an overweight of Edison International. The Portfolio’s allocation to cash, although within the typical range, also detracted from relative performance.
By contrast, consumer staples and materials sectors had the largest positive impact on performance. At the individual stock level, key contributors included not owning benchmark holding Berkshire Hathaway Inc. Class B, and overweight positions in Air Products and Chemicals, Inc. and Discover Financial Services.
| | Top Ten Holdings
as of December 31, 2019
(as a percentage of net assets) | |
| | | | | | |
| | JPMorgan Chase & Co. | | | 3.8% | |
| | AT&T, Inc. | | | 3.8% | |
| | Bank of America Corp. | | | 3.7% | |
| | Johnson & Johnson | | | 3.7% | |
| | Walt Disney Co. | | | 2.8% | |
| | US Bancorp | | | 2.6% | |
| | Philip Morris International, Inc. | | | 2.4% | |
| | Procter & Gamble Co. | | | 2.4% | |
| | Goldman Sachs Group, Inc. | | | 2.3% | |
| | Chevron Corp. | | | 2.2% | |
| | Portfolio holdings are subject to change daily. | |
We continue to see what we believe are attractive valuations in companies in a variety of sectors. Going forward, we believe that dividends will continue to be in demand by investors, who are searching for income and for funds with good downside capture such as the Portfolio strategy has sought to provide.
*
Effective June 1, 2019 Christopher F. Corapi retired and was removed as a portfolio manager for the Portfolio. Effective August 1, 2019, Kristy Finnegan was removed as a portfolio manager for the Portfolio.
The views expressed in this commentary are informed opinions. They should not be considered promises or advice. The views expressed reflect those of the portfolio managers, only through the end of the period as stated on the cover. The portfolio managers’ views are subject to change at any time based on market and other conditions.
Portfolio holdings and characteristics are subject to change and may not be representative of current holdings and characteristics. Portfolio holdings are subject to change daily. The outlook for this Portfolio may differ from that presented for other Voya mutual funds. This report contains statements that may be “forward-looking” statements. Actual results may differ materially from those projected in the “forward-looking” statements. The Portfolio’s performance returns shown reflect applicable fee waivers and/or expense limits in effect during this period. Absent such fee waivers/expense limitations, if any, performance would have been lower. Performance for the different classes of shares will vary based on differences in fees associated with each class. An index has no cash in its portfolio and imposes no sales charges. An investor cannot invest directly in an index.
| Voya Large Cap Value Portfolio | Portfolio Managers’ Report |
| | | Average Annual Total Returns for the Periods Ended December 31, 2019 | | |
| | | | | | 1 Year | | | 5 Year | | | 10 Year | | | Since Inception
of Class S2
September 9, 2013 | | |
| | | Class ADV | | | | | 24.45% | | | | | | 6.71% | | | | | | 10.62% | | | | | | — | | | |
| | | Class I | | | | | 25.12% | | | | | | 7.34% | | | | | | 11.27% | | | | | | — | | | |
| | | Class R6(1) | | | | | 25.14% | | | | | | 7.33% | | | | | | 11.27% | | | | | | — | | | |
| | | Class S | | | | | 24.78% | | | | | | 7.08% | | | | | | 11.01% | | | | | | — | | | |
| | | Class S2 | | | | | 24.63% | | | | | | 6.93% | | | | | | — | | | | | | 8.49% | | | |
| | | Russell 1000® Value | | | | | 26.54% | | | | | | 8.29% | | | | | | 11.80% | | | | | | 10.35% | | | |
| | | | | |
Based on a $10,000 initial investment, the graph and table above illustrate the total return of Voya Large Cap Value Portfolio against the index indicated. The index is unmanaged and has no cash in its portfolio and imposes no sales charges. An investor cannot invest directly in an index.
The Portfolio’s performance is shown without the imposition of any expenses or charges which are, or may be, imposed under your variable annuity contract or variable life insurance policy. Total returns would have been lower if such expenses or charges were included.
The performance graph and table do not reflect the deduction of taxes that a shareholder will pay on Portfolio distributions or the redemption of Portfolio shares.
The performance shown may include the effect of fee waivers and/or expense reimbursements by the Investment Adviser and/or other service providers, which have the effect of increasing total return. Had all fees and expenses been considered, the total returns would have been lower.
The performance update illustrates performance for a variable investment option available through a variable annuity contract or a variable life insurance policy. The performance shown indicates past performance and is not a projection or prediction of future results. Actual investment returns and principal value will fluctuate so that shares and/or units, at redemption, may be worth more or less than their original cost. Please log on to www.voyainvestments.com or call (800) 366-0066 to get performance through the most recent month end.
Portfolio holdings are subject to change daily.
Prior to January 21, 2011, the Portfolio was managed by a different sub-adviser.
(1)
Class R6 incepted on November 24, 2015. The Class R6 shares performance shown for the period prior to their inception date is the performance of Class I shares without adjustment for any differences in the expenses between the two classes. If adjusted for such differences, returns would be different.
| Portfolio Managers’ Report | Voya Limited Maturity Bond Portfolio |
| | Investment Type Allocation
as of December 31, 2019
(as a percentage of net assets) | |
| | | | | | |
| | Corporate Bonds/Notes | | | 43.7% | |
| | U.S. Treasury Obligations | | | 20.2% | |
| | Asset-Backed Securities | | | 17.1% | |
| | Commercial Mortgage-Backed Securities | | | 11.1% | |
| | Collateralized Mortgage Obligations | | | 5.5% | |
| | Supranational Bonds | | | 0.1% | |
| | U.S. Government Agency Obligations* | | | 0.0% | |
| | Assets in Excess of Other Liabilities** | | | 2.3% | |
| | Net Assets | | | 100.0% | |
| | *
Amount is less than 0.05% | |
| | **
Includes short-term investments. | |
| | Portfolio holdings are subject to change daily. | |
Voya Limited Maturity Bond Portfolio (the “Portfolio”) seeks highest current income consistent with low risk to principal and liquidity. As a secondary objective, the Portfolio seeks to enhance its total return through capital appreciation when market factors, such as falling interest rates and rising bond prices, indicate that capital appreciation may be available without significant risk to principal. The Portfolio is managed by David Goodson, Randall Parrish, CFA, and Matthew Toms, CFA, Portfolio Managers of Voya Investment Management Co. LLC — the Sub-Adviser.
Performance: For the year ended December 31, 2019, the Portfolio’s Class S shares provided a total return of 4.06% compared to the Bloomberg Barclays U.S. 1-3 Year Government/Credit Bond Index, which returned 4.03% for the same period.
Portfolio Specifics: Sector allocation drove outperformance for the reporting period. Our decision to remain overweight investment-grade corporate bonds versus an underweight to U.S. Treasuries contributed to performance, as the former proved to be the most sensitive to the improved global backdrop. In commercial mortgage-backed securities (“CMBS”), we maintained our overweight based on the yield advantage versus other high-quality sectors. In addition, we maintained our overweight to high-quality asset-backed securities (“ABS”), as we thought the sector would continue to be well bid and offer solid returns. This allocation proved to be additive to performance, driven by the well-positioned consumer and supportive labor markets. Duration and yield curve positioning
| | Top Ten Holdings
as of December 31, 2019*
(as a percentage of net assets) | |
| | | | | | |
| | United States Treasury Note, 2.125%, 01/31/21 | | | 9.2% | |
| | United States Treasury Note, 1.625%, 12/15/22 | | | 7.8% | |
| | United States Treasury Note, 1.625%, 12/31/21 | | | 2.6% | |
| | Kreditanstalt fuer Wiederaufbau, 4.000%, 01/27/20 | | | 1.0% | |
| | JP Morgan Chase Commercial Mortgage Securities Trust 2011-C5 B, 5.418%, 08/15/46 | | | 1.0% | |
| | Ginnie Mae Series 2012-H31 FD, 2.114%, 12/20/62 | | | 0.9% | |
| | Fannie Mae REMICS 2011-68 F, 2.062%, 07/25/31 | | | 0.9% | |
| | Fannie Mae REMICS 2011-51 FM, 2.442%, 06/25/41 | | | 0.7% | |
| | BX Commercial Mortgage Trust 2019-XL D, 3.190%, 10/15/36 | | | 0.6% | |
| | Fannie Mae REMICS 2006-43-FJ, 2.202%, 06/25/36 | | | 0.6% | |
| | *
Excludes short-term investments. | |
| | Portfolio holdings are subject to change daily. | |
| | | | |
contributed to performance, while security selection to Treasuries detracted from performance.
Swaps, options and futures were used in conjunction with cash bonds for duration and yield curve management. These investment decisions in total (derivative instruments and cash securities) added to the Portfolio’s performance over the reporting period.
Current Strategy and Outlook: Entering 2020, we believe that there are signs of steadying economic growth, especially outside the United States. However, while we believe this positive outlook for growth will prove supportive to spread sectors, in our view, geopolitical and monetary policy uncertainty, coupled with what we believe to be somewhat rich valuations across many sectors, will limit potential upside.
We continue to believe corporate credit risk is idiosyncratic, not systemic. We believe the path to future investment success will be paved by security selection as this backdrop favors idiosyncratic opportunities over broad market risk taking. We believe that if volatility does strike, perceived “losers” will be excessively punished and avoiding these investments will be critical. As we have over the past year, we will continue to view episodes of volatility in credit markets as fertile ground for identifying oversold individual credits with strong fundamentals.
Based on current valuations, we continue to favor securitized credit over corporate credit on a relative basis. Fundamentally, we believe agency mortgage-backed securities are attractive relative to Treasuries and other high-grade assets. In addition, we see opportunities in non-agency residential mortgage-backed securities (“RMBS”), CMBS and ABS as an attractive source of durable yield to capture while we diligently surveil markets for new opportunities.
The views expressed in this commentary are informed opinions. They should not be considered promises or advice. The views expressed reflect those of the portfolio managers, only through the end of the period as stated on the cover. The portfolio managers’ views are subject to change at any time based on market and other conditions.
Portfolio holdings and characteristics are subject to change and may not be representative of current holdings and characteristics. Portfolio holdings are subject to change daily. The outlook for this Portfolio may differ from that presented for other Voya mutual funds. This report contains statements that may be “forward-looking” statements. Actual results may differ materially from those projected in the “forward-looking” statements. The Portfolio’s performance returns shown reflect applicable fee waivers and/or expense limits in effect during this period. Absent such fee waivers/expense limitations, if any, performance would have been lower. Performance for the different classes of shares will vary based on differences in fees associated with each class. An index has no cash in its portfolio and imposes no sales charges. An investor cannot invest directly in an index.
| Voya Limited Maturity Bond Portfolio | Portfolio Managers’ Report |
| | | Average Annual Total Returns for the Periods Ended December 31, 2019 | | |
| | | | | | 1 Year | | | 5 Year | | | 10 Year | | |
| | | Class ADV | | | | | 3.66% | | | | | | 1.26% | | | | | | 1.19% | | | |
| | | Class I | | | | | 4.33% | | | | | | 1.88% | | | | | | 1.79% | | | |
| | | Class S | | | | | 4.06% | | | | | | 1.63% | | | | | | 1.53% | | | |
| | | Bloomberg Barclays U.S. 1-3 Year Government/Credit Bond Index | | | | | 4.03% | | | | | | 1.67% | | | | | | 1.54% | | | |
| | | | | |
Based on a $10,000 initial investment, the graph and table above illustrate the total return of Voya Limited Maturity Bond Portfolio against the index indicated. The index is unmanaged and has no cash in its portfolio and imposes no sales charges. An investor cannot invest directly in an index.
The Portfolio’s performance is shown without the imposition of any expenses or charges which are, or may be, imposed under your variable annuity contract or variable life insurance policy. Total returns would have been lower if such expenses or charges were included.
The performance graph and table do not reflect the deduction of taxes that a shareholder will pay on Portfolio distributions or the redemption of Portfolio shares.
The performance shown may include the effect of fee waivers and/or expense reimbursements by the Investment
Adviser and/or other service providers, which have the effect of increasing total return. Had all fees and expenses been considered, the total returns would have been lower.
The performance update illustrates performance for a variable investment option available through a variable annuity contract or a variable life insurance policy. The performance shown indicates past performance and is not a projection or prediction of future results. Actual investment returns and principal value will fluctuate so that shares and/or units, at redemption, may be worth more or less than their original cost. Please log on to www.voyainvestments.com or call (800) 366-0066 to get performance through the most recent month end.
Portfolio holdings are subject to change daily.
| Portfolio Managers’ Report | Voya U.S. Stock Index Portfolio |
| | Sector Diversification
as of December 31, 2019
(as a percentage of net assets) | |
| | | | | | |
| | Information Technology | | | 22.9% | |
| | Health Care | | | 14.0% | |
| | Financials | | | 12.8% | |
| | Communication Services | | | 10.3% | |
| | Consumer Discretionary | | | 9.6% | |
| | Industrials | | | 8.9% | |
| | Consumer Staples | | | 7.1% | |
| | Energy | | | 4.3% | |
| | Utilities | | | 3.3% | |
| | Real Estate | | | 2.9% | |
| | Materials | | | 2.6% | |
| | Assets in Excess of Other Liabilities* | | | 1.3% | |
| | Net Assets | | | 100.0% | |
| | *
Includes short-term investments. | |
| | Portfolio holdings are subject to change daily. | |
Voya U.S. Stock Index Portfolio (the “Portfolio”) seeks total return. The Portfolio is managed by Steve Wetter and Kai Yee Wong, Portfolio Managers of Voya Investment Management Co. LLC — the Sub-Adviser.
Performance: For the year ended December 31, 2019, the Portfolio’s Class I shares provided a total return of 31.12% compared to the S&P 500® Index, which returned 31.49% for the same period.
Portfolio Specifics*: The Portfolio employs a “passive management” approach designed to track the performance of the S&P 500® Index. The Portfolio attempts to track the S&P 500® Index by principally investing in stocks that make up the S&P 500® Index. The Portfolio may not always hold all of the same securities as the S&P 500® Index.
While all sectors generated positive returns for the reporting period, absolute performance was strongest within information technology, communication services and financials. By contract, energy was the bottom-performing sector on an absolute basis for the reporting period.
Current Strategy and Outlook: The Portfolio currently invests principally in common stocks and employs a “passive
| | Top Ten Holdings
as of December 31, 2019*
(as a percentage of net assets) | |
| | | | | | |
| | Apple, Inc. | | | 4.5% | |
| | Microsoft Corp. | | | 4.4% | |
| | Amazon.com, Inc. | | | 2.8% | |
| | Facebook, Inc. - Class A | | | 1.8% | |
| | Berkshire Hathaway, Inc. – Class B | | | 1.6% | |
| | JPMorgan Chase & Co. | | | 1.6% | |
| | Alphabet, Inc. - Class A | | | 1.5% | |
| | Alphabet, Inc. - Class C | | | 1.5% | |
| | Johnson & Johnson | | | 1.4% | |
| | Visa, Inc. - Class A | | | 1.2% | |
| | *
Excludes short-term investments. | |
| | Portfolio holdings are subject to change daily. | |
management” approach designed to track the performance of the S&P 500
® Index.
*
Please note that this discussion refers to the Portfolio’s gross performance versus the benchmark. Returns presented in the preceding paragraph refer to the Portfolio’s performance net of expenses. The benchmark does not incur expenses. An investor cannot invest directly in the benchmark.
The views expressed in this commentary are informed opinions. They should not be considered promises or advice. The views expressed reflect those of the portfolio managers, only through the end of the period as stated on the cover. The portfolio managers’ views are subject to change at any time based on market and other conditions.
Portfolio holdings and characteristics are subject to change and may not be representative of current holdings and characteristics. Portfolio holdings are subject to change daily. The outlook for this Portfolio may differ from that presented for other Voya mutual funds. This report contains statements that may be “forward-looking” statements. Actual results may differ materially from those projected in the “forward-looking” statements. The Portfolio’s performance returns shown reflect applicable fee waivers and/or expense limits in effect during this period. Absent such fee waivers/expense limitations, if any, performance would have been lower. Performance for the different classes of shares will vary based on differences in fees associated with each class. An index has no cash in its portfolio and imposes no sales charges. An investor cannot invest directly in an index.
| Voya U.S. Stock Index Portfolio | Portfolio Managers’ Report |
| | | Average Annual Total Returns for the Periods Ended December 31, 2019 | | |
| | | | | | 1 Year | | | 5 Year | | | 10 Year | | |
| | | Class ADV | | | | | 30.43% | | | | | | 10.81% | | | | 12.66% | | |
| | | Class I | | | | | 31.12% | | | | | | 11.39% | | | | 13.25% | | |
| | | Class P2(1) | | | | | 31.27% | | | | | | 11.46% | | | | 13.29% | | |
| | | Class S | | | | | 30.77% | | | | | | 11.13% | | | | 12.99% | | |
| | | Class S2 | | | | | 30.60% | | | | | | 10.96% | | | | 12.80% | | |
| | | S&P 500® Index | | | | | 31.49% | | | | | | 11.70% | | | | 13.56% | | |
| | | | | |
Based on a $10,000 initial investment, the graph and table above illustrate the total return of Voya U.S. Stock Index Portfolio against the index indicated. The index is unmanaged and has no cash in its portfolio and imposes no sales charges. An investor cannot invest directly in an index.
The Portfolio’s performance is shown without the imposition of any expenses or charges which are, or may be, imposed under your variable annuity contract or variable life insurance policy. Total returns would have been lower if such expenses or charges were included.
The performance graph and table do not reflect the deduction of taxes that a shareholder will pay on Portfolio distributions or the redemption of Portfolio shares.
The performance shown may include the effect of fee waivers and/or expense reimbursements by the Investment Adviser and/or other service providers, which have the effect of increasing total return. Had all fees and expenses been considered, the total returns would have been lower.
The performance update illustrates performance for a variable investment option available through a variable annuity contract or a variable life insurance policy. The performance shown indicates past performance and is not a projection or prediction of future results. Actual investment returns and principal value will fluctuate so that shares and/or units, at redemption, may be worth more or less than their original cost. Please log on to www.voyainvestments.com or call (800) 366-0066 to get performance through the most recent month end.
Portfolio holdings are subject to change daily.
(1)
Class P2 incepted on May 3, 2017. The Class P2 shares performance shown for the period prior to their inception date is the performance of Class I shares without adjustment for any differences in the expenses between the two classes. If adjusted for such differences, returns would be different.
| Portfolio Managers’ Report | VY® Clarion Real Estate Portfolio |
| | REIT Diversification
as of December 31, 2019
(as a percentage of net assets) | |
| | | | | | |
| | Specialized REITs | | | 19.1% | |
| | Residential REITs | | | 18.4% | |
| | Office REITs | | | 14.7% | |
| | Industrial REITs | | | 12.1% | |
| | Retail REITs | | | 11.4% | |
| | Health Care REITs | | | 10.5% | |
| | Hotel & Resort REITs | | | 5.9% | |
| | Diversified REITs | | | 5.9% | |
| | IT Consulting & Other Services | | | 0.8% | |
| | Assets in Excess of Other Liabilities* | | | 1.2% | |
| | Net Assets | | | 100.0% | |
| | *
Includes short-term investments. | |
| | Portfolio holdings are subject to change daily. | |
VY
® Clarion Real Estate Portfolio (the “Portfolio”) seeks total return including capital appreciation and current income. The Portfolio is managed by T. Ritson Ferguson, CFA, Chief Executive Officer and Global Chief Investment Officer, and Joseph P. Smith, CFA, President, and Co-Chief Investment Officer, of CBRE Clarion Securities LLC (“CBRE”) — the Sub-Adviser.
Performance: For the year ended December 31, 2019, the Portfolio’s Class S shares provided a total return of 28.15% compared to the MSCI U.S. REIT® Index, which returned 25.84% for the same period.
Portfolio Specifics: Real estate stocks generated a strong total return in 2019. After several lackluster performance years, real estate stocks had an impressive bounce-back year in 2019. Performance was broad-based, led by the industrial and technology sectors with only the challenged mall sector finishing the year in the red. Overall, real estate stocks were driven by the stock specific attributes of attractive valuations, stable earnings, and well-covered dividends. The stocks also benefited from a favorable macro backdrop as exemplified by three 25 basis point (0.25%) cuts in policy rates by the Federal Open Market Committee (to a now 1.50 – 1.75% range), continued accommodative central bank policies around the world, a possible breakthrough in trade negotiations between the U.S. and China, and a U.K. election in December 2019 that appeared to have brought clarity to the direction of the Brexit process in 2020. Given that many of the real estate and macro characteristics that defined 2019 are expected to remain in place for the foreseeable future, 2020 may be another attractive total return year for real estate stocks.
We believe this moderate global economic environment is good for real estate stocks. We believe that the economic expansion should continue in 2020, but we acknowledge that this economic expansion is the longest in generations and could be derailed by geopolitical risks including Brexit, U.S. trade policy uncertainty, and a slowing/bottoming Chinese economy. As a result of these geopolitical risks at this juncture of the economic expansion, we believe that central banks around the world will remain accommodative and keep interest rate increases on-hold for 2020. Inflationary pressures appear tame at present. Despite a slowing pace of growth, we believe that labor markets remain tight at this stage of the economic cycle and the capital markets remain receptive to companies that need to raise or refinance attractively priced debt.
| | Top Ten Holdings
as of December 31, 2019
(as a percentage of net assets) | |
| | | | | | |
| | ProLogis, Inc. | | | 7.2% | |
| | Equity Residential | | | 5.4% | |
| | Equinix, Inc. | | | 5.4% | |
| | Healthpeak Properties, Inc. | | | 4.1% | |
| | Invitation Homes, Inc. | | | 3.8% | |
| | Simon Property Group, Inc. | | | 3.6% | |
| | VEREIT, Inc. | | | 3.6% | |
| | VICI Properties, Inc. | | | 3.2% | |
| | Healthcare Trust of America, Inc. | | | 3.2% | |
| | Alexandria Real Estate Equities, Inc. | | | 3.2% | |
| | Portfolio holdings are subject to change daily. | |
The Portfolio outperformed MSCI U.S. REIT
® Index during the period as the result of positive stock selection and sector allocation decisions. Stock selection accounted for the majority of relative outperformance for the year and was led by portfolio holdings in the net lease, technology real estate and healthcare sectors. Holdings in the office, storage, shopping center and hotel sectors also benefited performance. Malls and industrial were modest detractors from relative performance. Sector selection benefited from positioning in the mall, technology real estate and hotel sectors.
Current Strategy and Outlook: Real estate stocks have a stable earnings outlook and a mid-3% dividend yield that we believe should grow in line with earnings. We believe that real estate stocks are attractively priced versus the private real estate market as well as various forms of fixed income, and there is a significant amount of capital amassing in the private real estate market that could catalyze the real estate stocks with increased real estate M&A activity.
We are positive on property types and markets with valuations that we believe are attractive relative to their growth. In the U.S., we favor data centers, cell towers, West Coast office, grocery anchored shopping centers, medical office, life science, and gaming REITs. We are cautious and selective in markets and property types which screen expensive relative to the rate of earnings growth, in our view. This includes the U.S. skilled nursing, lodging and industrial sectors. This also includes Class B mall/shopping center companies.
The views expressed in this commentary are informed opinions. They should not be considered promises or advice. The views expressed reflect those of the portfolio managers, only through the end of the period as stated on the cover. The portfolio managers’ views are subject to change at any time based on market and other conditions.
Portfolio holdings and characteristics are subject to change and may not be representative of current holdings and characteristics. Portfolio holdings are subject to change daily. The outlook for this Portfolio may differ from that presented for other Voya mutual funds. This report contains statements that may be “forward-looking” statements. Actual results may differ materially from those projected in the “forward-looking” statements. The Portfolio’s performance returns shown reflect applicable fee waivers and/or expense limits in effect during this period. Absent such fee waivers/expense limitations, if any, performance would have been lower. Performance for the different classes of shares will vary based on differences in fees associated with each class. An index has no cash in its portfolio and imposes no sales charges. An investor cannot invest directly in an index.
| VY® Clarion Real Estate Portfolio | Portfolio Managers’ Report |
| | | Average Annual Total Returns for the Periods Ended December 31, 2019 | | |
| | | | | | 1 Year | | | 5 Year | | | 10 Year | | |
| | | Class ADV | | | | | 27.71% | | | | | | 5.59% | | | | 10.72% | | |
| | | Class I | | | | | 28.47% | | | | | | 6.23% | | | | 11.39% | | |
| | | Class S | | | | | 28.15% | | | | | | 5.96% | | | | 11.11% | | |
| | | Class S2 | | | | | 27.97% | | | | | | 5.80% | | | | 10.94% | | |
| | | MSCI U.S. REIT® Index | | | | | 25.84% | | | | | | 7.03% | | | | 11.93% | | |
| | | | | |
Based on a $10,000 initial investment, the graph and table above illustrate the total return of VY® Clarion Real Estate Portfolio against the index indicated. The index is unmanaged and has no cash in its portfolio and imposes no sales charges. An investor cannot invest directly in an index.
The Portfolio’s performance is shown without the imposition of any expenses or charges which are, or may be, imposed under your variable annuity contract or variable life insurance policy. Total returns would have been lower if such expenses or charges were included.
The performance graph and table do not reflect the deduction of taxes that a shareholder will pay on Portfolio distributions or the redemption of Portfolio shares.
The performance shown may include the effect of fee waivers and/or expense reimbursements by the Investment
Adviser and/or other service providers, which have the effect of increasing total return. Had all fees and expenses been considered, the total returns would have been lower.
The performance update illustrates performance for a variable investment option available through a variable annuity contract or a variable life insurance policy. The performance shown indicates past performance and is not a projection or prediction of future results. Actual investment returns and principal value will fluctuate so that shares and/or units, at redemption, may be worth more or less than their original cost. Please log on to www.voyainvestments.com or call (800) 366-0066 to get performance through the most recent month end.
Portfolio holdings are subject to change daily.
| Portfolio Managers’ Report | VY® JPMorgan Small Cap Core Equity Portfolio |
| | Sector Diversification
as of December 31, 2019
(as a percentage of net assets) | |
| | | | | | |
| | Industrials | | | 20.0% | |
| | Financials | | | 17.7% | |
| | Health Care | | | 14.3% | |
| | Information Technology | | | 12.2% | |
| | Consumer Discretionary | | | 9.6% | |
| | Real Estate | | | 6.8% | |
| | Materials | | | 5.4% | |
| | Consumer Staples | | | 3.3% | |
| | Utilities | | | 2.9% | |
| | Energy | | | 2.2% | |
| | Communication Services | | | 2.2% | |
| | Assets in Excess of Other Liabilities* | | | 3.4% | |
| | Net Assets | | | 100.0% | |
| | *
Includes short-term investments. | |
| | Portfolio holdings are subject to change daily. | |
VY
® JPMorgan Small Cap Core Equity Portfolio (the “Portfolio”) seeks capital growth over the long-term. The Portfolio is managed using two investment styles — quantitative and fundamental analysis. The Portfolio is managed in two sleeves — the quantitative sleeve managed by Wonseok Choi, Managing Director, Akash Gupta, CFA and Executive Director, Lindsey Houghton, Executive Director, Johnathon Tse, Executive Director and Phillip D. Hart, CFA, Managing Director, and the fundamental sleeve managed by Daniel J. Percella, CFA, Managing Director and Don San Jose, CFA, Managing Director, Portfolio Managers* of J.P. Morgan Investment Management Inc. — the Sub-Adviser.
Performance: For the year ended December 31, 2019, the Portfolio’s Class S shares provided a total return of 26.39% compared to the Russell 2000® Index, which returned 25.52% for the same period.
Portfolio Specifics: The quantitative sleeve underperformed the Russell 2000® Index during the year.
Stock selection in the consumer cyclical and media sectors detracted most from performance. At the individual stock level, an overweight in CommVault Systems and underweight in Array Biopharma were the top detractors. Within the software & services sector, CommVault Systems initially declined after the company reported weaker-than-expected fourth quarter earnings. The challenged quarterly report was a result of lower-than-expected revenues from large enterprise transactions. The company further tumbled after missing consensus estimates for the first quarter of 2020. Poor results were attributable to an overall slowdown in the Americas business with software & products revenue decreasing -15% year-over-year. Array Biopharma rallied after it was announced the company will be acquired by Pfizer for a premium. The addition of Array Biopharma is expected to strengthen Pfizer’s biopharmaceutical business and expand its cancer portfolio with targeted therapies.
| | Top Ten Holdings
as of December 31, 2019*
(as a percentage of net assets) | |
| | | | | | |
| | Performance Food Group Co. | | | 1.7% | |
| | Toro Co. | | | 1.4% | |
| | Pool Corp. | | | 1.4% | |
| | Aptargroup, Inc. | | | 1.2% | |
| | Molina Healthcare, Inc. | | | 1.0% | |
| | Portland General Electric Co. | | | 1.0% | |
| | EastGroup Properties, Inc. | | | 0.9% | |
| | First Horizon National Corp. | | | 0.9% | |
| | Catalent, Inc. | | | 0.9% | |
| | Encompass Health Corp. | | | 0.9% | |
| | *
Excludes short-term investments. | |
| | Portfolio holdings are subject to change daily. | |
Alternatively, stock selection in the health services & systems and retail sectors contributed most to performance. At the individual stock level, overweights in Tenet Healthcare and The Medicines were the top contributors. Within the health services & systems sector, Tenet Healthcare largely rallied in later half of the year. Shares rose in tandem with hospital and managed care peers as the landmark lawsuit Texas vs Azar found that an individual mandate of the Affordable Care Act was unconstitutional. Shares further increased after the company posted strong third quarter results and raised guidance, noting positive growth across all segments. Within the pharmaceutical sector, The Medicines contributed to performance. Shares rose on the news that the company would be acquired by Novartis. We believe this deal further helps Novartis build out its heart treatment portfolio.
The fundamental sleeve outperformed the Russell 2000® Index during the year. Stock selection in the producer durables and consumer discretionary sectors contributed the most to performance. Stock selection in the materials and processing sector was the top detractor from performance, followed by stock selection and an underweight allocation to the technology sector.
| VY® JPMorgan Small Cap Core Equity Portfolio | Portfolio Managers’ Report |
Catalent and Performance Food Group were top contributors during the year. Catalent outperformed after reporting solid results in the year as well as announcing the acquisition of Paragon, a gene therapy drug manufacturing business, which was well received by investors. Performance Food Group traded higher after posting consistent results and announcing the acquisition of Reinhart Foodservice during the year. The defensive characteristics of the business also helped the stock outperform during periods of macro uncertainty in the back half of the year. Catalent and Performance Food Group remain top holdings in the portfolio.
ICU Medical and Core Laboratories were top detractors. ICU Medical underperformed after reporting disappointing earnings results and guidance in the third quarter of the year. The lower guidance was caused by a build-up of excess industry supply for IV solutions, largely due to irrational competitor behavior, forcing the company to make adjustments. Core Laboratories underperformed after reporting mixed results throughout the year. Later in the year, shares traded lower after the company lowered guidance and cut their dividend. The portfolio continues to have positions in ICU Medical and Core Laboratories.
Current Strategy and Outlook: We continue to focus on the fundamentals of the economy and of company earnings. We believe that both trade and changes to employment rates will be integral to investor sentiment moving forward.
While we believe that a healthy consumer should continue to provide support to the equity market, we are monitoring the incremental risks that could represent headwinds for U.S. stocks. In particular, we continue to watch closely the state of trade relations and movements in employment growth, which have the potential to heighten volatility.
We seek to own high-quality businesses, run by management teams with a proven track record of creating shareholder value, at what we believe to be attractive valuations. From a positioning perspective, consumer discretionary, which started the year close to a market weight, is now the top overweight position followed by producer durables. Health care remains the top underweight exposure, as our relative weight widened throughout the year. The technology sector also remains a top underweight.
*
Effective November 1, 2019, Dennis Ruhl was removed as a portfolio manager to the Portfolio and Wonseok Choi, Akash Gupta, Lindsey Houghton, and Johnathon Tse have been added as portfolio managers to the Portfolio.
The views expressed in this commentary are informed opinions. They should not be considered promises or advice. The views expressed reflect those of the portfolio managers, only through the end of the period as stated on the cover. The portfolio managers’ views are subject to change at any time based on market and other conditions.
Portfolio holdings and characteristics are subject to change and may not be representative of current holdings and characteristics. Portfolio holdings are subject to change daily. The outlook for this Portfolio may differ from that presented for other Voya mutual funds. This report contains statements that may be “forward-looking” statements. Actual results may differ materially from those projected in the “forward-looking” statements. The Portfolio’s performance returns shown reflect applicable fee waivers and/or expense limits in effect during this period. Absent such fee waivers/expense limitations, if any, performance would have been lower. Performance for the different classes of shares will vary based on differences in fees associated with each class. An index has no cash in its portfolio and imposes no sales charges. An investor cannot invest directly in an index.
| Portfolio Managers’ Report | VY® JPMorgan Small Cap Core Equity Portfolio |
| | | Average Annual Total Returns for the Periods Ended December 31, 2019 | | |
| | | | | | 1 Year | | | 5 Year | | | 10 Year | | |
| | | Class ADV | | | | | 25.96% | | | | | | 8.51% | | | | 12.70% | | |
| | | Class I | | | | | 26.75% | | | | | | 9.16% | | | | 13.37% | | |
| | | Class R6(1) | | | | | 26.78% | | | | | | 9.15% | | | | 13.37% | | |
| | | Class S | | | | | 26.39% | | | | | | 8.88% | | | | 13.08% | | |
| | | Class S2 | | | | | 26.20% | | | | | | 8.72% | | | | 12.92% | | |
| | | Russell 2000® Index | | | | | 25.52% | | | | | | 8.23% | | | | 11.83% | | |
| | | | | |
Based on a $10,000 initial investment, the graph and table above illustrate the total return of VY® JPMorgan Small Cap Core Equity Portfolio against the index indicated. The index is unmanaged and has no cash in its portfolio and imposes no sales charges. An investor cannot invest directly in an index.
The Portfolio’s performance is shown without the imposition of any expenses or charges which are, or may be, imposed under your variable annuity contract or variable life insurance policy. Total returns would have been lower if such expenses or charges were included.
The performance graph and table do not reflect the deduction of taxes that a shareholder will pay on Portfolio distributions or the redemption of Portfolio shares.
The performance shown may include the effect of fee waivers and/or expense reimbursements by the Investment Adviser and/or other service providers, which have the effect of increasing total return. Had all fees and expenses been considered, the total returns would have been lower.
The performance update illustrates performance for a variable investment option available through a variable annuity contract or a variable life insurance policy. The performance shown indicates past performance and is not a projection or prediction of future results. Actual investment returns and principal value will fluctuate so that shares and/or units, at redemption, may be worth more or less than their original cost. Please log on to www.voyainvestments.com or call (800) 366-0066 to get performance through the most recent month end.
Portfolio holdings are subject to change daily.
(1)
Class R6 incepted on May 3, 2016. The Class R6 shares performance shown for the period prior to their inception date is the performance of Class I shares without adjustment for any differences in the expenses between the two classes. If adjusted for such differences, returns would be different.
SHAREHOLDER EXPENSE EXAMPLES (Unaudited)
As a shareholder of a Portfolio, you incur two types of costs: (1) transaction costs, including redemption fees and exchange fees; and (2) ongoing costs, including management fees, distribution and/or service (12b-1) fees, and other Portfolio expenses. These Examples are intended to help you understand your ongoing costs (in dollars) of investing in a Portfolio and to compare these costs with the ongoing costs of investing in other mutual funds.
The Examples are based on an investment of $1,000 invested at the beginning of the period and held for the entire period from July 1, 2019 to December 31, 2019. The Portfolios’ expenses are shown without the imposition of any charges which are, or may be, imposed under your variable annuity contract, variable life insurance policy, qualified pension, or retirement plan. Expenses would have been higher if such charges were included.
Actual Expenses
The left section of the table shown below, “Actual Portfolio Return,” provides information about actual account values and actual expenses. You may use the information in this section, together with the amount you invested, to estimate the expenses that you paid over the period. Simply divide your account value by $1,000 (for example, an $8,600 account value divided by $1,000 = 8.6), then multiply the result by the number in the first section under the heading entitled “Expenses Paid During the Period” to estimate the expenses you paid on your account during this period.
Hypothetical Example for Comparison Purposes
The right section of the table shown below, “Hypothetical (5% return before expenses),” provides information about hypothetical account values and hypothetical expenses based on a Portfolio’s actual expense ratio and an assumed rate of return of 5% per year before expenses, which is not a Portfolio’s actual return. The hypothetical account values and expenses may not be used to estimate the actual ending account balance or expenses you paid for the period. You may use this information to compare the ongoing costs of investing in a Portfolio and other mutual funds. To do so, compare this 5% hypothetical example with the 5% hypothetical examples that appear in the shareholder reports of the other mutual funds.
Please note that the expenses shown in the table are meant to highlight your ongoing costs only and do not reflect any transactional costs, such as redemption fees or exchange fees. Therefore, the hypothetical section of the table is useful in comparing ongoing costs only, and will not help you determine the relative total costs of owning different mutual funds. In addition, if these transactional costs were included, your costs would have been higher.
| | | | Actual Portfolio Return | | | Hypothetical (5% return before expenses) | |
| | | | Beginning
Account
Value
July 1,
2019 | | | Ending
Account
Value
December 31,
2019 | | | Annualized
Expense
Ratio | | | Expenses Paid
During the
Period Ended
December 31,
2019* | | | Beginning
Account
Value
July 1,
2019 | | | Ending
Account
Value
December 31,
2019 | | | Annualized
Expense
Ratio | | | Expenses Paid
During the
Period Ended
December 31,
2019* | |
| Voya Balanced Income Portfolio | |
| Class ADV | | | | $ | 1,000.00 | | | | | $ | 1,036.00 | | | | | | 1.22% | | | | | $ | 6.26 | | | | | $ | 1,000.00 | | | | | $ | 1,019.06 | | | | | | 1.22% | | | | | $ | 6.21 | | |
| Class I | | | | | 1,000.00 | | | | | | 1,038.90 | | | | | | 0.62 | | | | | | 3.19 | | | | | | 1,000.00 | | | | | | 1,022.08 | | | | | | 0.62 | | | | | | 3.16 | | |
| Class S | | | | | 1,000.00 | | | | | | 1,037.90 | | | | | | 0.87 | | | | | | 4.47 | | | | | | 1,000.00 | | | | | | 1,020.82 | | | | | | 0.87 | | | | | | 4.43 | | |
| Class S2 | | | | | 1,000.00 | | | | | | 1,036.40 | | | | | | 1.02 | | | | | | 5.24 | | | | | | 1,000.00 | | | | | | 1,020.06 | | | | | | 1.02 | | | | | | 5.19 | | |
| Voya High Yield Portfolio | |
| Class ADV | | | | $ | 1,000.00 | | | | | $ | 1,038.60 | | | | | | 1.08% | | | | | $ | 5.55 | | | | | $ | 1,000.00 | | | | | $ | 1,019.76 | | | | | | 1.08% | | | | | $ | 5.50 | | |
| Class I | | | | | 1,000.00 | | | | | | 1,040.70 | | | | | | 0.48 | | | | | | 2.47 | | | | | | 1,000.00 | | | | | | 1,022.79 | | | | | | 0.48 | | | | | | 2.45 | | |
| Class S | | | | | 1,000.00 | | | | | | 1,040.40 | | | | | | 0.73 | | | | | | 3.75 | | | | | | 1,000.00 | | | | | | 1,021.53 | | | | | | 0.73 | | | | | | 3.72 | | |
| Class S2 | | | | | 1,000.00 | | | | | | 1,039.60 | | | | | | 0.88 | | | | | | 4.52 | | | | | | 1,000.00 | | | | | | 1,020.77 | | | | | | 0.88 | | | | | | 4.48 | | |
| Voya Large Cap Growth Portfolio | |
| Class ADV | | | | $ | 1,000.00 | | | | | $ | 1,109.50 | | | | | | 1.27% | | | | | $ | 6.75 | | | | | $ | 1,000.00 | | | | | $ | 1,018.80 | | | | | | 1.27% | | | | | $ | 6.46 | | |
| Class I | | | | | 1,000.00 | | | | | | 1,112.90 | | | | | | 0.67 | | | | | | 3.57 | | | | | | 1,000.00 | | | | | | 1,021.83 | | | | | | 0.67 | | | | | | 3.41 | | |
| Class R6 | | | | | 1,000.00 | | | | | | 1,112.90 | | | | | | 0.67 | | | | | | 3.57 | | | | | | 1,000.00 | | | | | | 1,021.83 | | | | | | 0.67 | | | | | | 3.41 | | |
| Class S | | | | | 1,000.00 | | | | | | 1,111.00 | | | | | | 0.92 | | | | | | 4.90 | | | | | | 1,000.00 | | | | | | 1,020.57 | | | | | | 0.92 | | | | | | 4.69 | | |
| Class S2 | | | | | 1,000.00 | | | | | | 1,110.30 | | | | | | 1.07 | | | | | | 5.69 | | | | | | 1,000.00 | | | | | | 1,019.81 | | | | | | 1.07 | | | | | | 5.45 | | |
SHAREHOLDER EXPENSE EXAMPLES (Unaudited) (continued)
| | | | Actual Portfolio Return | | | Hypothetical (5% return before expenses) | |
| | | | Beginning
Account
Value
July 1,
2019 | | | Ending
Account
Value
December 31,
2019 | | | Annualized
Expense
Ratio | | | Expenses Paid
During the
Period Ended
December 31,
2019* | | | Beginning
Account
Value
July 1,
2019 | | | Ending
Account
Value
December 31,
2019 | | | Annualized
Expense
Ratio | | | Expenses Paid
During the
Period Ended
December 31,
2019* | |
| Voya Large Cap Value Portfolio | |
| Class ADV | | | | $ | 1,000.00 | | | | | $ | 1,077.90 | | | | | | 1.24% | | | | | $ | 6.49 | | | | | $ | 1,000.00 | | | | | $ | 1,018.95 | | | | | | 1.24% | | | | | $ | 6.31 | | |
| Class I | | | | | 1,000.00 | | | | | | 1,080.40 | | | | | | 0.64 | | | | | | 3.36 | | | | | | 1,000.00 | | | | | | 1,021.98 | | | | | | 0.64 | | | | | | 3.26 | | |
| Class R6 | | | | | 1,000.00 | | | | | | 1,080.40 | | | | | | 0.64 | | | | | | 3.36 | | | | | | 1,000.00 | | | | | | 1,021.98 | | | | | | 0.64 | | | | | | 3.26 | | |
| Class S | | | | | 1,000.00 | | | | | | 1,079.00 | | | | | | 0.89 | | | | | | 4.66 | | | | | | 1,000.00 | | | | | | 1,020.72 | | | | | | 0.89 | | | | | | 4.53 | | |
| Class S2 | | | | | 1,000.00 | | | | | | 1,077.90 | | | | | | 1.04 | | | | | | 5.45 | | | | | | 1,000.00 | | | | | | 1,019.96 | | | | | | 1.04 | | | | | | 5.30 | | |
| Voya Limited Maturity Bond Portfolio | |
| Class ADV | | | | $ | 1,000.00 | | | | | $ | 1,010.00 | | | | | | 0.89% | | | | | $ | 4.51 | | | | | $ | 1,000.00 | | | | | $ | 1,020.72 | | | | | | 0.89% | | | | | $ | 4.53 | | |
| Class I | | | | | 1,000.00 | | | | | | 1,013.00 | | | | | | 0.29 | | | | | | 1.47 | | | | | | 1,000.00 | | | | | | 1,023.74 | | | | | | 0.29 | | | | | | 1.48 | | |
| Class S | | | | | 1,000.00 | | | | | | 1,011.70 | | | | | | 0.54 | | | | | | 2.74 | | | | | | 1,000.00 | | | | | | 1,022.48 | | | | | | 0.54 | | | | | | 2.75 | | |
| Voya U.S. Stock Index Portfolio | |
| Class ADV | | | | $ | 1,000.00 | | | | | $ | 1,105.30 | | | | | | 0.80% | | | | | $ | 4.25 | | | | | $ | 1,000.00 | | | | | $ | 1,021.17 | | | | | | 0.80% | | | | | $ | 4.08 | | |
| Class I | | | | | 1,000.00 | | | | | | 1,108.00 | | | | | | 0.27 | | | | | | 1.43 | | | | | | 1,000.00 | | | | | | 1,023.84 | | | | | | 0.27 | | | | | | 1.38 | | |
| Class P2 | | | | | 1,000.00 | | | | | | 1,108.30 | | | | | | 0.15 | | | | | | 0.80 | | | | | | 1,000.00 | | | | | | 1,024.05 | | | | | | 0.15 | | | | | | 0.77 | | |
| Class S | | | | | 1,000.00 | | | | | | 1,106.50 | | | | | | 0.51 | | | | | | 2.71 | | | | | | 1,000.00 | | | | | | 1,022.63 | | | | | | 0.51 | | | | | | 2.60 | | |
| Class S2 | | | | | 1,000.00 | | | | | | 1,105.50 | | | | | | 0.67 | | | | | | 3.56 | | | | | | 1,000.00 | | | | | | 1,021.83 | | | | | | 0.67 | | | | | | 3.41 | | |
| VY® Clarion Real Estate Portfolio | |
| Class ADV | | | | $ | 1,000.00 | | | | | $ | 1,079.80 | | | | | | 1.31% | | | | | $ | 6.87 | | | | | $ | 1,000.00 | | | | | $ | 1,018.60 | | | | | | 1.31% | | | | | $ | 6.67 | | |
| Class I | | | | | 1,000.00 | | | | | | 1,082.80 | | | | | | 0.71 | | | | | | 3.73 | | | | | | 1,000.00 | | | | | | 1,021.63 | | | | | | 0.71 | | | | | | 3.62 | | |
| Class S | | | | | 1,000.00 | | | | | | 1,081.30 | | | | | | 0.96 | | | | | | 5.04 | | | | | | 1,000.00 | | | | | | 1,020.37 | | | | | | 0.96 | | | | | | 4.89 | | |
| Class S2 | | | | | 1,000.00 | | | | | | 1,080.70 | | | | | | 1.11 | | | | | | 5.82 | | | | | | 1,000.00 | | | | | | 1,019.61 | | | | | | 1.11 | | | | | | 5.65 | | |
| VY® JPMorgan Small Cap Core Equity Portfolio | |
| Class ADV | | | | $ | 1,000.00 | | | | | $ | 1,069.30 | | | | | | 1.45% | | | | | $ | 7.56 | | | | | $ | 1,000.00 | | | | | $ | 1,017.90 | | | | | | 1.45% | | | | | $ | 7.37 | | |
| Class I | | | | | 1,000.00 | | | | | | 1,072.00 | | | | | | 0.85 | | | | | | 4.44 | | | | | | 1,000.00 | | | | | | 1,020.92 | | | | | | 0.85 | | | | | | 4.33 | | |
| Class R6 | | | | | 1,000.00 | | | | | | 1,072.70 | | | | | | 0.85 | | | | | | 4.44 | | | | | | 1,000.00 | | | | | | 1,020.92 | | | | | | 0.85 | | | | | | 4.33 | | |
| Class S | | | | | 1,000.00 | | | | | | 1,070.90 | | | | | | 1.10 | | | | | | 5.74 | | | | | | 1,000.00 | | | | | | 1,019.66 | | | | | | 1.10 | | | | | | 5.60 | | |
| Class S2 | | | | | 1,000.00 | | | | | | 1,070.20 | | | | | | 1.25 | | | | | | 6.52 | | | | | | 1,000.00 | | | | | | 1,018.90 | | | | | | 1.25 | | | | | | 6.36 | | |
*
Expenses are equal to each Portfolio’s respective annualized expense ratios multiplied by the average account value over the period, multiplied by 184/365 to reflect the most recent fiscal half-year.
REPORT OF INDEPENDENT REGISTERED PUBLIC ACCOUNTING FIRM
To the Shareholders of the Funds and Board of Trustees
Voya Investors Trust:
Opinion on the Financial Statements
We have audited the accompanying statements of assets and liabilities of Voya Balanced Income Portfolio (formerly VY® Franklin Income Portfolio), Voya High Yield Portfolio, Voya Large Cap Growth Portfolio, Voya Large Cap Value Portfolio, Voya Limited Maturity Bond Portfolio, Voya U.S. Stock Index Portfolio, VY® Clarion Real Estate Portfolio and VY® JPMorgan Small Cap Core Equity Portfolio (the Funds), each a series of Voya Investors Trust, including the summary portfolios and portfolio of investments, as of December 31, 2019, the related statements of operations for the year then ended, the statements of changes in net assets for each of the years in the two-year period then ended, and the related notes (collectively, the financial statements) and the financial highlights for each of the years or periods in the five-year period then ended. In our opinion, the financial statements and financial highlights present fairly, in all material respects, the financial position of the Funds as of December 31, 2019, the results of their operations for the year then ended, the changes in their net assets for each of the years in the two-year period then ended, and the financial highlights for each of the years or periods in the five-year period then ended, in conformity with U.S. generally accepted accounting principles.
Basis for Opinion
These financial statements and financial highlights are the responsibility of the Funds’ management. Our responsibility is to express an opinion on these financial statements and financial highlights based on our audits. We are a public accounting firm registered with the Public Company Accounting Oversight Board (United States) (PCAOB) and are required to be independent with respect to the Funds in accordance with the U.S. federal securities laws and the applicable rules and regulations of the Securities and Exchange Commission and the PCAOB.
We conducted our audits in accordance with the standards of the PCAOB. Those standards require that we plan and perform the audit to obtain reasonable assurance about whether the financial statements and financial highlights are free of material misstatement, whether due to error or fraud. Our audits included performing procedures to assess the risks of material misstatement of the financial statements and financial highlights, whether due to error or fraud, and performing procedures that respond to those risks. Such procedures included examining, on a test basis, evidence regarding the amounts and disclosures in the financial statements and financial highlights. Such procedures also included confirmation of securities owned as of December 31, 2019, by correspondence with the custodian and brokers or by other appropriate auditing procedures when replies from brokers were not received. Our audits also included evaluating the accounting principles used and significant estimates made by management, as well as evaluating the overall presentation of the financial statements and financial highlights. We believe that our audits provide a reasonable basis for our opinion.
![[MISSING IMAGE: sg_kpmgllp.jpg]](https://capedge.com/proxy/N-CSR/0001104659-20-030747/sg_kpmgllp.jpg)
We have served as the auditor of one or more Voya investment companies since 1975.
Boston, Massachusetts
February 21, 2020
STATEMENTS OF ASSETS AND LIABILITIES as of December 31, 2019
| | | | Voya Balanced
Income Portfolio | | | Voya High Yield
Portfolio | | | Voya Large Cap
Growth Portfolio | | | Voya Large Cap
Value Portfolio | |
| ASSETS: | | | | | | | | | | | | | | | | | | | | | | | | | |
| Investments in securities at fair value+* | | | | $ | 343,708,755 | | | | | $ | 568,103,780 | | | | | $ | 5,818,110,098 | | | | | $ | 1,080,579,804 | | |
| Investments in affiliated underlying funds at fair value** | | | | | 33,156,275 | | | | | | — | | | | | | — | | | | | | — | | |
| Short-term investments at fair value*** | | | | | 2,178,222 | | | | | | 123,820,457 | | | | | | 87,532,651 | | | | | | 35,966,985 | | |
| Cash | | | | | 17,602,841 | | | | | | 489 | | | | | | 1,823,723 | | | | | | 224,715 | | |
| Cash collateral for futures | | | | | 400,337 | | | | | | — | | | | | | — | | | | | | — | | |
| Cash pledged for centrally cleared swaps (Note 2) | | | | | 400,000 | | | | | | — | | | | | | — | | | | | | — | | |
| Foreign currencies at value**** | | | | | 96,117 | | | | | | — | | | | | | — | | | | | | 133,609 | | |
| Receivables: | | | | | | | | | | | | | | | | | | | | | | | | | |
| Investment securities and currencies sold | | | | | 30,220 | | | | | | 7,681,033 | | | | | | — | | | | | | 1,094,716 | | |
| Fund shares sold | | | | | 1,614,600 | | | | | | 1,713,417 | | | | | | 414,421 | | | | | | 82,485 | | |
| Dividends | | | | | 227,116 | | | | | | — | | | | | | 5,123,926 | | | | | | 1,602,289 | | |
| Interest | | | | | 1,159,340 | | | | | | 8,792,328 | | | | | | 286 | | | | | | 107 | | |
| Foreign tax reclaims | | | | | 190,011 | | | | | | — | | | | | | — | | | | | | 113,998 | | |
| Unrealized appreciation on forward foreign currency contracts | | | | | 1,037,336 | | | | | | — | | | | | | — | | | | | | — | | |
| Prepaid expenses | | | | | 2,794 | | | | | | — | | | | | | 39,405 | | | | | | 7,656 | | |
| Reimbursement due from manager | | | | | — | | | | | | — | | | | | | — | | | | | | 88,285 | | |
| Other assets | | | | | 23,196 | | | | | | 33,353 | | | | | | 248,103 | | | | | | 72,101 | | |
| Total assets | | | | | 401,827,160 | | | | | | 710,144,857 | | | | | | 5,913,292,613 | | | | | | 1,119,966,750 | | |
| LIABILITIES: | | | | | | | | | | | | | | | | | | | | | | | | | |
| Payable for investment securities and currencies purchased | | | | | 311,630 | | | | | | 3,451,137 | | | | | | — | | | | | | — | | |
| Payable for investment securities purchased on a delayed-delivery or when-issued basis | | | | | 9,539,477 | | | | | | — | | | | | | — | | | | | | — | | |
| Payable for fund shares redeemed | | | | | 4,151 | | | | | | 311,709 | | | | | | 21,768,244 | | | | | | 1,252,233 | | |
| Payable upon receipt of securities loaned | | | | | 2,178,222 | | | | | | 118,699,752 | | | | | | 33,895,651 | | | | | | 31,192,985 | | |
| Unrealized depreciation on forward foreign currency contracts | | | | | 697,516 | | | | | | — | | | | | | — | | | | | | — | | |
| Unrealized depreciation on OTC swap agreements | | | | | 36,587 | | | | | | — | | | | | | — | | | | | | — | | |
| Variation margin payable on centrally cleared swaps | | | | | 2,651 | | | | | | — | | | | | | — | | | | | | — | | |
| Payable for unified fees | | | | | — | | | | | | 234,658 | | | | | | — | | | | | | — | | |
| Payable for investment management fees | | | | | 186,709 | | | | | | — | | | | | | 3,204,238 | | | | | | 656,078 | | |
| Payable for distribution and shareholder service fees | | | | | 104,020 | | | | | | 109,871 | | | | | | 1,374,208 | | | | | | 168,426 | | |
| Payable to trustees under the deferred compensation plan (Note 6) | | | | | 23,196 | | | | | | 33,353 | | | | | | 248,103 | | | | | | 72,101 | | |
| Payable for trustee fees | | | | | 1,951 | | | | | | — | | | | | | 28,262 | | | | | | 5,370 | | |
| Other accrued expenses and liabilities | | | | | 127,292 | | | | | | — | | | | | | 690,159 | | | | | | 173,034 | | |
| Written options, at fair value^ | | | | | 1,015 | | | | | | — | | | | | | — | | | | | | — | | |
| Total liabilities | | | | | 13,214,417 | | | | | | 122,840,480 | | | | | | 61,208,865 | | | | | | 33,520,227 | | |
| NET ASSETS | | | | $ | 388,612,743 | | | | | $ | 587,304,377 | | | | | $ | 5,852,083,748 | | | | | $ | 1,086,446,523 | | |
| NET ASSETS WERE COMPRISED OF: | | | | | | | | | | | | | | | | | | | | | | | | | |
| Paid-in capital | | | | $ | 334,565,649 | | | | | $ | 608,559,433 | | | | | $ | 3,967,194,125 | | | | | $ | 880,136,229 | | |
| Total distributable earnings (loss) | | | | | 54,047,094 | | | | | | (21,255,056) | | | | | | 1,884,889,623 | | | | | | 206,310,294 | | |
| NET ASSETS | | | | $ | 388,612,743 | | | | | $ | 587,304,377 | | | | | $ | 5,852,083,748 | | | | | $ | 1,086,446,523 | | |
+
Including securities loaned at value | | | | $ | 2,109,005 | | | | | $ | 115,799,622 | | | | | $ | 33,082,121 | | | | | $ | 30,471,864 | | |
*
Cost of investments in securities | | | | $ | 324,823,563 | | | | | $ | 551,003,567 | | | | | $ | 4,626,656,984 | | | | | $ | 961,661,927 | | |
**
Cost of investments in affiliated underlying funds | | | | $ | 33,771,324 | | | | | $ | — | | | | | $ | — | | | | | $ | — | | |
***
Cost of short-term investments | | | | $ | 2,178,222 | | | | | $ | 123,820,222 | | | | | $ | 87,532,651 | | | | | $ | 35,966,985 | | |
****
Cost of foreign currencies | | | | $ | 97,765 | | | | | $ | — | | | | | $ | — | | | | | $ | 131,202 | | |
^
Premiums received on written options | | | | $ | 28,704 | | | | | $ | — | | | | | $ | — | | | | | $ | — | | |
See Accompanying Notes to Financial Statements
STATEMENTS OF ASSETS AND LIABILITIES as of December 31, 2019 (continued)
| | | | Voya Balanced
Income Portfolio | | | Voya High Yield
Portfolio | | | Voya Large Cap
Growth Portfolio | | | Voya Large Cap
Value Portfolio | |
| Class ADV | | | | | | | | | | | | | | | | | | | | | | | | | |
| Net assets | | | | $ | 78,155,140 | | | | | $ | 87,539,716 | | | | | $ | 1,890,631,161 | | | | | $ | 53,097,525 | | |
| Shares authorized | | | | | unlimited | | | | | | unlimited | | | | | | unlimited | | | | | | unlimited | | |
| Par value | | | | $ | 0.001 | | | | | $ | 0.001 | | | | | $ | 0.001 | | | | | $ | 0.001 | | |
| Shares outstanding | | | | | 7,337,214 | | | | | | 8,811,037 | | | | | | 105,248,799 | | | | | | 4,440,872 | | |
| Net asset value and redemption price per share | | | | $ | 10.65 | | | | | $ | 9.94 | | | | | $ | 17.96 | | | | | $ | 11.96 | | |
| Class I | | | | | | | | | | | | | | | | | | | | | | | | | |
| Net assets | | | | $ | 8,836,068 | | | | | $ | 189,247,475 | | | | | $ | 2,000,466,393 | | | | | $ | 367,345,273 | | |
| Shares authorized | | | | | unlimited | | | | | | unlimited | | | | | | unlimited | | | | | | unlimited | | |
| Par value | | | | $ | 0.001 | | | | | $ | 0.001 | | | | | $ | 0.001 | | | | | $ | 0.001 | | |
| Shares outstanding | | | | | 789,728 | | | | | | 19,033,491 | | | | | | 100,904,765 | | | | | | 30,056,027 | | |
| Net asset value and redemption price per share | | | | $ | 11.19 | | | | | $ | 9.94 | | | | | $ | 19.83 | | | | | $ | 12.22 | | |
| Class R6 | | | | | | | | | | | | | | | | | | | | | | | | | |
| Net assets | | | | | n/a | | | | | | n/a | | | | | $ | 59,938,225 | | | | | $ | 306,238 | | |
| Shares authorized | | | | | n/a | | | | | | n/a | | | | | | unlimited | | | | | | unlimited | | |
| Par value | | | | | n/a | | | | | | n/a | | | | | $ | 0.001 | | | | | $ | 0.001 | | |
| Shares outstanding | | | | | n/a | | | | | | n/a | | | | | | 3,021,820 | | | | | | 25,075 | | |
| Net asset value and redemption price per share | | | | | n/a | | | | | | n/a | | | | | $ | 19.84 | | | | | $ | 12.21 | | |
| Class S | | | | | | | | | | | | | | | | | | | | | | | | | |
| Net assets | | | | $ | 295,942,214 | | | | | $ | 307,505,569 | | | | | $ | 1,839,828,783 | | | | | $ | 665,552,586 | | |
| Shares authorized | | | | | unlimited | | | | | | unlimited | | | | | | unlimited | | | | | | unlimited | | |
| Par value | | | | $ | 0.001 | | | | | $ | 0.001 | | | | | $ | 0.001 | | | | | $ | 0.001 | | |
| Shares outstanding | | | | | 26,600,053 | | | | | | 30,949,844 | | | | | | 95,755,327 | | | | | | 55,268,226 | | |
| Net asset value and redemption price per share | | | | $ | 11.13 | | | | | $ | 9.94 | | | | | $ | 19.21 | | | | | $ | 12.04 | | |
| Class S2 | | | | | | | | | | | | | | | | | | | | | | | | | |
| Net assets | | | | $ | 5,679,321 | | | | | $ | 3,011,617 | | | | | $ | 61,219,186 | | | | | $ | 144,901 | | |
| Shares authorized | | | | | unlimited | | | | | | unlimited | | | | | | unlimited | | | | | | unlimited | | |
| Par value | | | | $ | 0.001 | | | | | $ | 0.001 | | | | | $ | 0.001 | | | | | $ | 0.001 | | |
| Shares outstanding | | | | | 511,422 | | | | | | 302,695 | | | | | | 3,216,216 | | | | | | 12,014 | | |
| Net asset value and redemption price per share | | | | $ | 11.10 | | | | | $ | 9.95 | | | | | $ | 19.03 | | | | | $ | 12.06 | | |
See Accompanying Notes to Financial Statements
STATEMENTS OF ASSETS AND LIABILITIES as of December 31, 2019
| | | | Voya Limited
Maturity Bond
Portfolio | | | Voya U.S. Stock
Index Portfolio | | | VY® Clarion Real
Estate Portfolio | | | VY® JPMorgan
Small Cap Core
Equity Portfolio | |
| ASSETS: | | | | | | | | | | | | | | | | | | | | | | | | | |
| Investments in securities at fair value+* | | | | $ | 281,245,791 | | | | | $ | 6,905,394,427 | | | | | $ | 329,975,949 | | | | | $ | 529,478,595 | | |
| Short-term investments at fair value** | | | | | 5,224,075 | | | | | | 168,400,367 | | | | | | 7,263,409 | | | | | | 35,398,291 | | |
| Cash | | | | | 921,889 | | | | | | 1,255,974 | | | | | | — | | | | | | — | | |
| Cash collateral for futures | | | | | 222,327 | | | | | | 3,858,562 | | | | | | — | | | | | | 383,530 | | |
| Receivables: | | | | | | | | | | | | | | | | | | | | | | | | | |
| Investment securities sold | | | | | 7,917 | | | | | | — | | | | | | 3,621,427 | | | | | | 404,287 | | |
| Fund shares sold | | | | | 487,322 | | | | | | 1,733,143 | | | | | | 273,964 | | | | | | 1,254,919 | | |
| Dividends | | | | | 12,011 | | | | | | 7,008,017 | | | | | | 1,834,328 | | | | | | 652,610 | | |
| Interest | | | | | 1,566,315 | | | | | | — | | | | | | — | | | | | | — | | |
| Other | | | | | — | | | | | | — | | | | | | — | | | | | | 135,398 | | |
| Prepaid expenses | | | | | — | | | | | | — | | | | | | 2,483 | | | | | | — | | |
| Reimbursement due from manager | | | | | — | | | | | | 218,046 | | | | | | 30,142 | | | | | | — | | |
| Receivable due from manager | | | | | — | | | | | | — | | | | | | — | | | | | | 109,207 | | |
| Other assets | | | | | 14,146 | | | | | | 162,981 | | | | | | 26,762 | | | | | | 26,334 | | |
| Total assets | | | | | 289,701,793 | | | | | | 7,088,031,517 | | | | | | 343,028,464 | | | | | | 567,843,171 | | |
| LIABILITIES: | | | | | | | | | ��� | | | | | | | | | | | | | | | | |
| Payable for investment securities purchased | | | | | 1,500,703 | | | | | | — | | | | | | 2,942,863 | | | | | | 848,114 | | |
| Payable for fund shares redeemed | | | | | 260,297 | | | | | | 10,026,071 | | | | | | 151,608 | | | | | | 2,004,045 | | |
| Payable upon receipt of securities loaned | | | | | 5,075 | | | | | | 80,158,367 | | | | | | 5,500,430 | | | | | | 16,382,548 | | |
| Payable for unified fees | | | | | 69,949 | | | | | | 1,495,896 | | | | | | — | | | | | | 482,606 | | |
| Payable for investment management fees | | | | | — | | | | | | — | | | | | | 221,889 | | | | | | — | | |
| Payable for distribution and shareholder service fees | | | | | 23,817 | | | | | | 130,811 | | | | | | 86,194 | | | | | | 124,674 | | |
| Payable to trustees under the deferred compensation plan (Note 6) | | | | | 14,146 | | | | | | 162,981 | | | | | | 26,762 | | | | | | 26,334 | | |
| Payable for trustee fees | | | | | — | | | | | | — | | | | | | 1,721 | | | | | | — | | |
| Other accrued expenses and liabilities | | | | | — | | | | | | — | | | | | | 71,652 | | | | | | — | | |
| Total liabilities | | | | | 1,873,987 | | | | | | 91,974,126 | | | | | | 9,003,119 | | | | | | 19,868,321 | | |
| NET ASSETS | | | | $ | 287,827,806 | | | | | $ | 6,996,057,391 | | | | | $ | 334,025,345 | | | | | $ | 547,974,850 | | |
| NET ASSETS WERE COMPRISED OF: | | | | | | | | | | | | | | | | | | | | | | | | | |
| Paid-in capital | | | | $ | 286,155,400 | | | | | $ | 4,081,387,746 | | | | | $ | 268,965,356 | | | | | $ | 466,189,338 | | |
| Total distributable earnings | | | | | 1,672,406 | | | | | | 2,914,669,645 | | | | | | 65,059,989 | | | | | | 81,785,512 | | |
| NET ASSETS | | | | $ | 287,827,806 | | | | | $ | 6,996,057,391 | | | | | $ | 334,025,345 | | | | | $ | 547,974,850 | | |
+
Including securities loaned at value | | | | $ | 4,972 | | | | | $ | 78,310,394 | | | | | $ | 5,356,212 | | | | | $ | 15,940,332 | | |
*
Cost of investments in securities | | | | $ | 279,796,185 | | | | | $ | 4,268,478,242 | | | | | $ | 293,950,748 | | | | | $ | 444,089,002 | | |
**
Cost of short-term investments | | | | $ | 5,224,075 | | | | | $ | 168,400,367 | | | | | $ | 7,263,409 | | | | | $ | 35,398,291 | | |
See Accompanying Notes to Financial Statements
STATEMENTS OF ASSETS AND LIABILITIES as of December 31, 2019 (continued)
| | | | Voya Limited
Maturity Bond
Portfolio | | | Voya U.S. Stock
Index Portfolio | | | VY® Clarion Real
Estate Portfolio | | | VY® JPMorgan
Small Cap Core
Equity Portfolio | |
| Class ADV | | | | | | | | | | | | | | | | | | | | | | | | | |
| Net assets | | | | $ | 15,578,953 | | | | | $ | 102,812,951 | | | | | $ | 63,873,129 | | | | | $ | 130,058,360 | | |
| Shares authorized | | | | | unlimited | | | | | | unlimited | | | | | | unlimited | | | | | | unlimited | | |
| Par value | | | | $ | 0.001 | | | | | $ | 0.001 | | | | | $ | 0.001 | | | | | $ | 0.001 | | |
| Shares outstanding | | | | | 1,571,892 | | | | | | 6,278,275 | | | | | | 1,755,358 | | | | | | 8,728,997 | | |
| Net asset value and redemption price per share | | | | $ | 9.91 | | | | | $ | 16.38 | | | | | $ | 36.39 | | | | | $ | 14.90 | | |
| Class I | | | | | | | | | | | | | | | | | | | | | | | | | |
| Net assets | | | | $ | 197,182,414 | | | | | $ | 4,065,090,885 | | | | | $ | 24,411,801 | | | | | $ | 240,957,456 | | |
| Shares authorized | | | | | unlimited | | | | | | unlimited | | | | | | unlimited | | | | | | unlimited | | |
| Par value | | | | $ | 0.001 | | | | | $ | 0.001 | | | | | $ | 0.001 | | | | | $ | 0.001 | | |
| Shares outstanding | | | | | 19,498,018 | | | | | | 239,266,245 | | | | | | 636,052 | | | | | | 14,863,177 | | |
| Net asset value and redemption price per share | | | | $ | 10.11 | | | | | $ | 16.99 | | | | | $ | 38.38 | | | | | $ | 16.21 | | |
| Class P2 | | | | | | | | | | | | | | | | | | | | | | | | | |
| Net assets | | | | | n/a | | | | | $ | 2,395,088,708 | | | | | | n/a | | | | | | n/a | | |
| Shares authorized | | | | | n/a | | | | | | unlimited | | | | | | n/a | | | | | | n/a | | |
| Par value | | | | | n/a | | | | | $ | 0.001 | | | | | | n/a | | | | | | n/a | | |
| Shares outstanding | | | | | n/a | | | | | | 140,466,505 | | | | | | n/a | | | | | | n/a | | |
| Net asset value and redemption price per share | | | | | n/a | | | | | $ | 17.05 | | | | | | n/a | | | | | | n/a | | |
| Class R6 | | | | | | | | | | | | | | | | | | | | | | | | | |
| Net assets | | | | | n/a | | | | | | n/a | | | | | | n/a | | | | | $ | 38,160,727 | | |
| Shares authorized | | | | | n/a | | | | | | n/a | | | | | | n/a | | | | | | unlimited | | |
| Par value | | | | | n/a | | | | | | n/a | | | | | | n/a | | | | | $ | 0.001 | | |
| Shares outstanding | | | | | n/a | | | | | | n/a | | | | | | n/a | | | | | | 2,355,798 | | |
| Net asset value and redemption price per share | | | | | n/a | | | | | | n/a | | | | | | n/a | | | | | $ | 16.20 | | |
| Class S | | | | | | | | | | | | | | | | | | | | | | | | | |
| Net assets | | | | $ | 75,066,439 | | | | | $ | 283,767,561 | | | | | $ | 230,345,978 | | | | | $ | 129,784,126 | | |
| Shares authorized | | | | | unlimited | | | | | | unlimited | | | | | | unlimited | | | | | | unlimited | | |
| Par value | | | | $ | 0.001 | | | | | $ | 0.001 | | | | | $ | 0.001 | | | | | $ | 0.001 | | |
| Shares outstanding | | | | | 7,366,989 | | | | | | 16,867,301 | | | | | | 6,010,590 | | | | | | 8,134,473 | | |
| Net asset value and redemption price per share | | | | $ | 10.19 | | | | | $ | 16.82 | | | | | $ | 38.32 | | | | | $ | 15.95 | | |
| Class S2 | | | | | | | | | | | | | | | | | | | | | | | | | |
| Net assets | | | | | n/a | | | | | $ | 149,297,286 | | | | | $ | 15,394,437 | | | | | $ | 9,014,181 | | |
| Shares authorized | | | | | n/a | | | | | | unlimited | | | | | | unlimited | | | | | | unlimited | | |
| Par value | | | | | n/a | | | | | $ | 0.001 | | | | | $ | 0.001 | | | | | $ | 0.001 | | |
| Shares outstanding | | | | | n/a | | | | | | 8,983,402 | | | | | | 404,370 | | | | | | 572,712 | | |
| Net asset value and redemption price per share | | | | | n/a | | | | | $ | 16.62 | | | | | $ | 38.07 | | | | | $ | 15.74 | | |
See Accompanying Notes to Financial Statements
STATEMENTS OF OPERATIONS for the year ended December 31, 2019
| | | | Voya Balanced
Income Portfolio | | | Voya High Yield
Portfolio | | | Voya Large Cap
Growth Portfolio | | | Voya Large Cap
Value Portfolio | |
| INVESTMENT INCOME: | | | | | | | | | | | | | | | | | | | | | | | | | |
| Dividends, net of foreign taxes withheld* | | | | $ | 5,433,819 | | | | | $ | — | | | | | $ | 68,322,443 | | | | | $ | 28,268,572 | | |
| Dividends from affiliated underlying funds | | | | | 1,453,862 | | | | | | — | | | | | | — | | | | | | — | | |
| Interest, net of foreign taxes withheld* | | | | | 8,752,462 | | | | | | 32,597,213 | | | | | | 379 | | | | | | 4,653 | | |
| Securities lending income, net | | | | | 134,719 | | | | | | 482,302 | | | | | | 545,110 | | | | | | 80,020 | | |
| Total investment income | | | | | 15,774,862 | | | | | | 33,079,515 | | | | | | 68,867,932 | | | | | | 28,353,245 | | |
| EXPENSES: | | | | | | | | | | | | | | | | | | | | | | | | | |
| Investment management fees | | | | | 2,401,449 | | | | | | — | | | | | | 36,688,490 | | | | | | 7,768,154 | | |
| Unified fees | | | | | — | | | | | | 2,580,656 | | | | | | — | | | | | | — | | |
| Distribution and shareholder service fees: | | | | | | | | | | | | | | | | | | | | | | | | | |
| Class ADV | | | | | 458,824 | | | | | | 512,029 | | | | | | 11,143,673 | | | | ��� | | 312,911 | | |
| Class S | | | | | 749,854 | | | | | | 836,038 | | | | | | 4,561,204 | | | | | | 1,671,312 | | |
| Class S2 | | | | | 20,298 | | | | | | 15,587 | | | | | | 251,008 | | | | | | 631 | | |
| Transfer agent fees | | | | | 475 | | | | | | 31 | | | | | | 7,123 | | | | | | 1,687 | | |
| Shareholder reporting expense | | | | | 24,455 | | | | | | 2,523 | | | | | | 178,850 | | | | | | 70,796 | | |
| Professional fees | | | | | 21,763 | | | | | | — | | | | | | 217,720 | | | | | | 49,252 | | |
| Custody and accounting expense | | | | | 66,379 | | | | | | — | | | | | | 484,110 | | | | | | 95,472 | | |
| Trustee fees | | | | | 15,603 | | | | | | — | | | | | | 226,097 | | | | | | 42,961 | | |
| Trustee fees and expenses | | | | | — | | | | | | 31,189 | | | | | | — | | | | | | 35,715 | | |
| Shareholder notification costs (Note 6) | | | | | 26,100 | | | | | | — | | | | | | — | | | | | | — | | |
| Miscellaneous expense | | | | | 16,348 | | | | | | 289 | | | | | | 171,338 | | | | | | 633 | | |
| Interest expense | | | | | 7,210 | | | | | | — | | | | | | 4,795 | | | | | | 2,356 | | |
| Total expenses | | | | | 3,808,758 | | | | | | 3,978,342 | | | | | | 53,934,408 | | | | | | 10,051,880 | | |
| Waived and reimbursed fees | | | | | (151,980) | | | | | | (85,174) | | | | | | — | | | | | | (1,176,264) | | |
| Brokerage commission recapture | | | | | (180) | | | | | | — | | | | | | — | | | | | | — | | |
| Net expenses | | | | | 3,656,598 | | | | | | 3,893,168 | | | | | | 53,934,408 | | | | | | 8,875,616 | | |
| Net investment income | | | | | 12,118,264 | | | | | | 29,186,347 | | | | | | 14,933,524 | | | | | | 19,477,629 | | |
| REALIZED AND UNREALIZED GAIN (LOSS): | | | | | | | | | | | | | | | | | | | | | | | | | |
| Net realized gain (loss) on: | | | | | | | | | | | | | | | | | | | | | | | | | |
| Investments (net of Indian capital gains tax withheld^) | | | | | 22,043,590 | | | | | | (2,317,688) | | | | | | 682,759,477 | | | | | | 85,830,105 | | |
| Sale of affiliated underlying funds | | | | | (252,558) | | | | | | — | | | | | | — | | | | | | — | | |
| Forward foreign currency contracts | | | | | (151,882) | | | | | | — | | | | | | — | | | | | | — | | |
| Foreign currency related transactions | | | | | 73,678 | | | | | | 184 | | | | | | (11,264) | | | | | | 3,133 | | |
| Futures | | | | | 473,854 | | | | | | — | | | | | | — | | | | | | — | | |
| Swaps | | | | | 762,017 | | | | | | — | | | | | | — | | | | | | — | | |
| Written options | | | | | 98,591 | | | | | | — | | | | | | — | | | | | | — | | |
| Net realized gain (loss) | | | | | 23,047,290 | | | | | | (2,317,504) | | | | | | 682,748,213 | | | | | | 85,833,238 | | |
| Net change in unrealized appreciation (depreciation) on: | | | | | | | | | | | | | | | | | | | | | | | | | |
| Investments | | | | | 30,025,678 | | | | | | 45,325,720 | | | | | | 862,616,382 | | | | | | 131,843,488 | | |
| Affiliated underlying funds | | | | | (615,048) | | | | | | — | | | | | | — | | | | | | — | | |
| Forward foreign currency contracts | | | | | 339,820 | | | | | | — | | | | | | — | | | | | | — | | |
| Foreign currency related transactions | | | | | (2,306) | | | | | | — | | | | | | 10,137 | | | | | | (6,006) | | |
| Futures | | | | | 75,587 | | | | | | — | | | | | | — | | | | | | — | | |
| Swaps | | | | | 48,035 | | | | | | — | | | | | | — | | | | | | — | | |
| Written options | | | | | (2,340) | | | | | | — | | | | | | — | | | | | | — | | |
| Net change in unrealized appreciation (depreciation) | | | | | 29,869,426 | | | | | | 45,325,720 | | | | | | 862,626,519 | | | | | | 131,837,482 | | |
| Net realized and unrealized gain | | | | | 52,916,716 | | | | | | 43,008,216 | | | | | | 1,545,374,732 | | | | | | 217,670,720 | | |
| Increase in net assets resulting from operations | | | | $ | 65,034,980 | | | | | $ | 72,194,563 | | | | | $ | 1,560,308,256 | | | | | $ | 237,148,349 | | |
*
Foreign taxes withheld | | | | $ | 111,105 | | | | | $ | — | | | | | $ | 114,120 | | | | | $ | 125,132 | | |
^
Foreign taxes on sale of Indian investments | | | | $ | 197 | | | | | $ | — | | | | | $ | — | | | | | $ | — | | |
See Accompanying Notes to Financial Statements
STATEMENTS OF OPERATIONS for the year ended December 31, 2019
| | | | Voya Limited
Maturity Bond
Portfolio | | | Voya U.S. Stock
Index Portfolio | | | VY® Clarion Real
Estate Portfolio | | | VY® JPMorgan
Small Cap Core
Equity Portfolio | |
| INVESTMENT INCOME: | | | | | | | | | | | | | | | | | | | | | | | | | |
| Dividends, net of foreign taxes withheld* | | | | $ | 202,673 | | | | | $ | 119,195,578 | | | | | $ | 9,489,247 | | | | | $ | 10,752,442 | | |
| Interest | | | | | 7,326,405 | | | | | | 46,588 | | | | | | 33 | | | | | | 941 | | |
| Securities lending income, net | | | | | 20,743 | | | | | | 246,069 | | | | | | 3,879 | | | | | | 274,016 | | |
| Total investment income | | | | | 7,549,821 | | | | | | 119,488,235 | | | | | | 9,493,159 | | | | | | 11,027,399 | | |
| EXPENSES: | | | | | | | | | | | | | | | | | | | | | | | | | |
| Investment management fees | | | | | — | | | | | | — | | | | | | 2,852,451 | | | | | | — | | |
| Unified fees | | | | | 783,457 | | | | | | 15,418,906 | | | | | | — | | | | | | 6,285,657 | | |
| Distribution and shareholder service fees: | | | | | | | | | | | | | | | | | | | | | | | | | |
| Class ADV | | | | | 97,263 | | | | | | 524,043 | | | | | | 375,243 | | | | | | 758,345 | | |
| Class S | | | | | 188,483 | | | | | | 158,066 | | | | | | 588,633 | | | | | | 845,136 | | |
| Class S2 | | | | | — | | | | | | 603,775 | | | | | | 60,490 | | | | | | 115,900 | | |
| Transfer agent fees | | | | | — | | | | | | — | | | | | | 536 | | | | | | — | | |
| Shareholder reporting expense | | | | | — | | | | | | — | | | | | | 22,380 | | | | | | — | | |
| Professional fees | | | | | — | | | | | | — | | | | | | 14,973 | | | | | | — | | |
| Custody and accounting expense | | | | | — | | | | | | — | | | | | | 35,620 | | | | | | — | | |
| Trustee fees | | | | | — | | | | | | — | | | | | | 13,762 | | | | | | — | | |
| Trustee fees and expenses | | | | | 18,380 | | | | | | 314,506 | | | | | | — | | | | | | 45,447 | | |
| Miscellaneous expense | | | | | — | | | | | | — | | | | | | 13,340 | | | | | | — | | |
| Interest expense | | | | | — | | | | | | 19,321 | | | | | | 4,916 | | | | | | — | | |
| Total expenses | | | | | 1,087,583 | | | | | | 17,038,617 | | | | | | 3,982,344 | | | | | | 8,050,485 | | |
| Waived and reimbursed fees | | | | | — | | | | | | (2,294,200) | | | | | | (531,592) | | | | | | — | | |
| Brokerage commission recapture | | | | | — | | | | | | — | | | | | | — | | | | | | (51,259) | | |
| Net expenses | | | | | 1,087,583 | | | | | | 14,744,417 | | | | | | 3,450,752 | | | | | | 7,999,226 | | |
| Net investment income | | | | | 6,462,238 | | | | | | 104,743,818 | | | | | | 6,042,407 | | | | | | 3,028,173 | | |
| REALIZED AND UNREALIZED GAIN (LOSS): | | | | | | | | | | | | | | | | | | | | | | | | | |
| Net realized gain (loss) on: | | | | | | | | | | | | | | | | | | | | | | | | | |
| Investments | | | | | 1,526,516 | | | | | | 259,747,399 | | | | | | 27,661,531 | | | | | | 107,303,048 | | |
| Futures | | | | | 67,840 | | | | | | 13,816,430 | | | | | | — | | | | | | 971,535 | | |
| Swaps | | | | | (54,539) | | | | | | — | | | | | | — | | | | | | — | | |
| Net realized gain | | | | | 1,539,817 | | | | | | 273,563,829 | | | | | | 27,661,531 | | | | | | 108,274,583 | | |
| Net change in unrealized appreciation (depreciation) on: | | | | | | | | | | | | | | | | | | | | | | | | | |
| Investments | | | | | 3,458,126 | | | | | | 1,156,662,223 | | | | | | 51,173,622 | | | | | | 53,822,397 | | |
| Futures | | | | | (196,576) | | | | | | 4,136,798 | | | | | | — | | | | | | 480,781 | | |
| Net change in unrealized appreciation (depreciation) | | | | | 3,261,550 | | | | | | 1,160,799,021 | | | | | | 51,173,622 | | | | | | 54,303,178 | | |
| Net realized and unrealized gain | | | | | 4,801,367 | | | | | | 1,434,362,850 | | | | | | 78,835,153 | | | | | | 162,577,761 | | |
| Increase in net assets resulting from operations | | | | $ | 11,263,605 | | | | | $ | 1,539,106,668 | | | | | $ | 84,877,560 | | | | | $ | 165,605,934 | | |
*
Foreign taxes withheld | | | | $ | — | | | | | $ | — | | | | | $ | — | | | | | $ | 34,094 | | |
See Accompanying Notes to Financial Statements
STATEMENTS OF CHANGES IN NET ASSETS
| | | | Voya Balanced Income Portfolio | | | Voya High Yield Portfolio | |
| | | | Year Ended
December 31,
2019 | | | Year Ended
December 31,
2018 | | | Year Ended
December 31,
2019 | | | Year Ended
December 31,
2018 | |
| FROM OPERATIONS: | | | | | | | | | | | | | | | | | | | | | | | | | |
| Net investment income | | | | $ | 12,118,264 | | | | | $ | 17,718,908 | | | | | $ | 29,186,347 | | | | | $ | 28,161,541 | | |
| Net realized gain (loss) | | | | | 23,047,290 | | | | | | 22,262,236 | | | | | | (2,317,504) | | | | | | (6,645,975) | | |
| Net change in unrealized appreciation (depreciation) | | | | | 29,869,426 | | | | | | (59,819,558) | | | | | | 45,325,720 | | | | | | (37,284,503) | | |
| Increase (decrease) in net assets resulting from operations | | | | | 65,034,980 | | | | | | (19,838,414) | | | | | | 72,194,563 | | | | | | (15,768,937) | | |
| FROM DISTRIBUTIONS TO SHAREHOLDERS: | | | | | | | | | | | | | | | | | | | | | | | | | |
| Total distributions (excluding return of capital): | | | | | | | | | | | | | | | | | | | | | | | | | |
| Class ADV | | | | | (7,922,532) | | | | | | (3,926,322) | | | | | | (4,184,086) | | | | | | (4,784,764) | | |
| Class I | | | | | (894,071) | | | | | | (483,308) | | | | | | (5,691,493) | | | | | | (3,566,820) | | |
| Class S | | | ��� | | (30,519,786) | | | | | | (16,723,472) | | | | | | (17,552,628) | | | | | | (21,269,549) | | |
| Class S2 | | | | | (501,395) | | | | | | (254,904) | | | | | | (198,505) | | | | | | (285,512) | | |
| Total distributions | | | | | (39,837,784) | | | | | | (21,388,006) | | | | | | (27,626,712) | | | | | | (29,906,645) | | |
| FROM CAPITAL SHARE TRANSACTIONS: | | | | | | | | | | | | | | | | | | | | | | | | | |
| Net proceeds from sale of shares | | | | | 11,771,113 | | | | | | 6,585,736 | | | | | | 64,608,084 | | | | | | 30,736,899 | | |
| Proceeds from shares issued in merger (Note 13) | | | | | — | | | | | | — | | | | | | 98,023,284 | | | | | | — | | |
| Reinvestment of distributions | | | | | 39,837,784 | | | | | | 21,388,006 | | | | | | 27,626,712 | | | | | | 29,906,645 | | |
| | | | | | 51,608,897 | | | | | | 27,973,742 | | | | | | 190,258,080 | | | | | | 60,643,544 | | |
| Cost of shares redeemed | | | | | (56,146,969) | | | | | | (76,678,608) | | | | | | (121,673,150) | | | | | | (108,628,679) | | |
| Net increase (decrease) in net assets resulting from capital share transactions | | | | | (4,538,072) | | | | | | (48,704,866) | | | | | | 68,584,930 | | | | | | (47,985,135) | | |
| Net increase (decrease) in net assets | | | | | 20,659,124 | | | | | | (89,931,286) | | | | | | 113,152,781 | | | | | | (93,660,717) | | |
| NET ASSETS: | | | | | | | | | | | | | | | | | | | | | | | | | |
| Beginning of year or period | | | | | 367,953,619 | | | | | | 457,884,905 | | | | | | 474,151,596 | | | | | | 567,812,313 | | |
| End of year or period | | | | $ | 388,612,743 | | | | | $ | 367,953,619 | | | | | $ | 587,304,377 | | | | | $ | 474,151,596 | | |
See Accompanying Notes to Financial Statements
STATEMENTS OF CHANGES IN NET ASSETS
| | | | Voya Large Cap Growth Portfolio | | | Voya Large Cap Value Portfolio | |
| | | | Year Ended
December 31,
2019 | | | Year Ended
December 31,
2018 | | | Year Ended
December 31,
2019 | | | Year Ended
December 31,
2018 | |
| FROM OPERATIONS: | | | | | | | | | | | | | | | | | | | | | | | | | |
| Net investment income | | | | $ | 14,933,524 | | | | | $ | 21,901,527 | | | | | $ | 19,477,629 | | | | | $ | 21,734,108 | | |
| Net realized gain | | | | | 682,748,213 | | | | | | 941,533,006 | | | | | | 85,833,238 | | | | | | 76,571,425 | | |
| Net change in unrealized appreciation (depreciation) | | | | | 862,626,519 | | | | | | (976,787,864) | | | | | | 131,837,482 | | | | | | (185,618,451) | | |
| Increase (decrease) in net assets resulting from operations | | | | | 1,560,308,256 | | | | | | (13,353,331) | | | | | | 237,148,349 | | | | | | (87,312,918) | | |
| FROM DISTRIBUTIONS TO SHAREHOLDERS: | | | | | | | | | | | | | | | | | | | | | | | | | |
| Total distributions (excluding return of capital): | | | | | | | | | | | | | | | | | | | | | | | | | |
| Class ADV | | | | | (322,539,115) | | | | | | (276,524,927) | | | | | | (4,505,178) | | | | | | (7,149,519) | | |
| Class I | | | | | (308,037,331) | | | | | | (278,916,876) | | | | | | (31,729,269) | | | | | | (48,700,372) | | |
| Class R6 | | | | | (8,633,943) | | | | | | (6,367,270) | | | | | | (25,122) | | | | | | (126,099) | | |
| Class S | | | | | (304,557,434) | | | | | | (268,490,262) | | | | | | (59,337,191) | | | | | | (93,408,002) | | |
| Class S2 | | | | | (10,362,576) | | | | | | (8,678,633) | | | | | | (13,567) | | | | | | (19,541) | | |
| Total distributions | | | | | (954,130,399) | | | | | | (838,977,968) | | | | | | (95,610,327) | | | | | | (149,403,533) | | |
| FROM CAPITAL SHARE TRANSACTIONS: | | | | | | | | | | | | | | | | | | | | | | | | | |
| Net proceeds from sale of shares | | | | | 151,286,163 | | | | | | 223,873,923 | | | | | | 13,066,833 | | | | | | 13,566,103 | | |
| Reinvestment of distributions | | | | | 954,130,399 | | | | | | 838,977,968 | | | | | | 95,610,327 | | | | | | 149,403,149 | | |
| | | | | | 1,105,416,562 | | | | | | 1,062,851,891 | | | | | | 108,677,160 | | | | | | 162,969,252 | | |
| Cost of shares redeemed | | | | | (953,005,018) | | | | | | (1,396,896,531) | | | | | | (174,590,335) | | | | | | (206,228,690) | | |
Net increase (decrease) in net assets resulting from capital
share transactions | | | | | 152,411,544 | | | | | | (334,044,640) | | | | | | (65,913,175) | | | | | | (43,259,438) | | |
| Net increase (decrease) in net assets | | | | | 758,589,401 | | | | | | (1,186,375,939) | | | | | | 75,624,847 | | | | | | (279,975,889) | | |
| NET ASSETS: | | | | | | | | | | | | | | | | | | | | | | | | | |
| Beginning of year or period | | | | | 5,093,494,347 | | | | | | 6,279,870,286 | | | | | | 1,010,821,676 | | | | | | 1,290,797,565 | | |
| End of year or period | | | | $ | 5,852,083,748 | | | | | $ | 5,093,494,347 | | | | | $ | 1,086,446,523 | | | | | $ | 1,010,821,676 | | |
See Accompanying Notes to Financial Statements
STATEMENTS OF CHANGES IN NET ASSETS
| | | | Voya Limited Maturity Bond Portfolio | | | Voya U.S. Stock Index Portfolio | |
| | | | Year Ended
December 31,
2019 | | | Year Ended
December 31,
2018 | | | Year Ended
December 31,
2019 | | | Year Ended
December 31,
2018 | |
| FROM OPERATIONS: | | | | | | | | | | | | | | | | | | | | | | | | | |
| Net investment income | | | | $ | 6,462,238 | | | | | $ | 6,231,042 | | | | | $ | 104,743,818 | | | | | $ | 87,481,321 | | |
| Net realized gain (loss) | | | | | 1,539,817 | | | | | | (1,707,205) | | | | | | 273,563,829 | | | | | | 362,433,393 | | |
| Net change in unrealized appreciation (depreciation) | | | | | 3,261,550 | | | | | | (1,065,923) | | | | | | 1,160,799,021 | | | | | | (645,694,271) | | |
| Increase (decrease) in net assets resulting from operations | | | | | 11,263,605 | | | | | | 3,457,914 | | | | | | 1,539,106,668 | | | | | | (195,779,557) | | |
| FROM DISTRIBUTIONS TO SHAREHOLDERS: | | | | | | | | | | | | | | | | | | | | | | | | | |
| Total distributions (excluding return of capital): | | | | | | | | | | | | | | | | | | | | | | | | | |
| Class ADV | | | | | (201,180) | | | | | | (202,049) | | | | | | (6,766,870) | | | | | | (7,544,736) | | |
| Class I | | | | | (3,418,858) | | | | | | (3,241,396) | | | | | | (280,363,883) | | | | | | (241,875,952) | | |
| Class P2 | | | | | — | | | | | | — | | | | | | (148,647,312) | | | | | | (109,017,631) | | |
| Class S | | | | | (1,202,654) | | | | | | (1,158,960) | | | | | | (6,466,557) | | | | | | (3,983,988) | | |
| Class S2 | | | | | — | | | | | | — | | | | | | (10,110,281) | | | | | | (12,017,762) | | |
| Total distributions | | | | | (4,822,692) | | | | | | (4,602,405) | | | | | | (452,354,903) | | | | | | (374,440,069) | | |
| FROM CAPITAL SHARE TRANSACTIONS: | | | | | | | | | | | | | | | | | | | | | | | | | |
| Net proceeds from sale of shares | | | | | 83,942,429 | | | | | | 79,908,894 | | | | | | 1,995,915,747 | | | | | | 1,146,608,168 | | |
| Reinvestment of distributions | | | | | 4,808,922 | | | | | | 4,602,405 | | | | | | 452,354,903 | | | | | | 374,440,069 | | |
| | | | | | 88,751,351 | | | | | | 84,511,299 | | | | | | 2,448,270,650 | | | | | | 1,521,048,237 | | |
| Cost of shares redeemed | | | | | (94,912,870) | | | | | | (87,597,471) | | | | | | (1,238,299,796) | | | | | | (1,330,695,268) | | |
| Net increase (decrease) in net assets resulting from capital share transactions | | | | | (6,161,519) | | | | | | (3,086,172) | | | | | | 1,209,970,854 | | | | | | 190,352,969 | | |
| Net increase (decrease) in net assets | | | | | 279,394 | | | | | | (4,230,663) | | | | | | 2,296,722,619 | | | | | | (379,866,657) | | |
| NET ASSETS: | | | | | | | | | | | | | | | | | | | | | | | | | |
| Beginning of year or period | | | | | 287,548,412 | | | | | | 291,779,075 | | | | | | 4,699,334,772 | | | | | | 5,079,201,429 | | |
| End of year or period | | | | $ | 287,827,806 | | | | | $ | 287,548,412 | | | | | $ | 6,996,057,391 | | | | | $ | 4,699,334,772 | | |
See Accompanying Notes to Financial Statements
STATEMENTS OF CHANGES IN NET ASSETS
| | | | VY® Clarion Real Estate Portfolio | | | VY® JPMorgan Small
Cap Core Equity Portfolio | |
| | | | Year Ended
December 31,
2019 | | | Year Ended
December 31,
2018 | | | Year Ended
December 31,
2019 | | | Year Ended
December 31,
2018 | |
| FROM OPERATIONS: | | | | | | | | | | | | | | | | | | | | | | | | | |
| Net investment income | | | | $ | 6,042,407 | | | | | $ | 6,758,543 | | | | | $ | 3,028,173 | | | | | $ | 2,195,335 | | |
| Net realized gain | | | | | 27,661,531 | | | | | | 1,408,407 | | | | | | 108,274,583 | | | | | | 79,213,912 | | |
| Net change in unrealized appreciation (depreciation) | | | | | 51,173,622 | | | | | | (40,459,187) | | | | | | 54,303,178 | | | | | | (160,577,469) | | |
| Increase (decrease) in net assets resulting from operations | | | | | 84,877,560 | | | | | | (32,292,237) | | | | | | 165,605,934 | | | | | | (79,168,222) | | |
| FROM DISTRIBUTIONS TO SHAREHOLDERS: | | | | | | | | | | | | | | | | | | | | | | | | | |
| Total distributions (excluding return of capital): | | | | | | | | | | | | | | | | | | | | | | | | | |
| Class ADV | | | | | (1,436,002) | | | | | | (8,092,673) | | | | | | (33,003,163) | | | | | | (16,763,544) | | |
| Class I | | | | | (626,652) | | | | | | (5,278,443) | | | | | | (58,503,358) | | | | | | (24,223,499) | | |
| Class R6 | | | | | — | | | | | | — | | | | | | (8,660,615) | | | | | | (2,813,490) | | |
| Class S | | | | | (5,986,907) | | | | | | (30,337,693) | | | | | | (85,946,558) | | | | | | (47,325,409) | | |
| Class S2 | | | | | (359,516) | | | | | | (1,937,174) | | | | | | (7,278,863) | | | | | | (4,165,809) | | |
| Return of capital: | | | | | | | | | | | | | | | | | | | | | | | | | |
| Class ADV | | | | | — | | | | | | — | | | | | | (1,680,212) | | | | | | — | | |
| Class I | | | | | — | | | | | | — | | | | | | (2,858,137) | | | | | | — | | |
| Class R6 | | | | | — | | | | | | — | | | | | | (437,725) | | | | | | — | | |
| Class S | | | | | — | | | | | | — | | | | | | (4,217,107) | | | | | | — | | |
| Class S2 | | | | | — | | | | | | — | | | | | | (357,279) | | | | | | — | | |
| Total distributions | | | | | (8,409,077) | | | | | | (45,645,983) | | | | | | (202,943,017) | | | | | | (95,291,751) | | |
| FROM CAPITAL SHARE TRANSACTIONS: | | | | | | | | | | | | | | | | | | | | | | | | | |
| Net proceeds from sale of shares | | | | | 18,492,283 | | | | | | 14,223,944 | | | | | | 93,535,915 | | | | | | 92,399,835 | | |
| Reinvestment of distributions | | | | | 8,409,077 | | | | | | 45,645,983 | | | | | | 202,943,018 | | | | | | 95,291,751 | | |
| | | | | | 26,901,360 | | | | | | 59,869,927 | | | | | | 296,478,933 | | | | | | 187,691,586 | | |
| Cost of shares redeemed | | | | | (90,802,217) | | | | | | (145,124,853) | | | | | | (370,553,943) | | | | | | (111,630,222) | | |
Net increase (decrease) in net assets resulting from capital share
transactions | | | | | (63,900,857) | | | | | | (85,254,926) | | | | | | (74,075,010) | | | | | | 76,061,364 | | |
| Net increase (decrease) in net assets | | | | | 12,567,626 | | | | | | (163,193,146) | | | | | | (111,412,093) | | | | | | (98,398,609) | | |
| NET ASSETS: | | | | | | | | | | | | | | | | | | | | | | | | | |
| Beginning of year or period | | | | | 321,457,719 | | | | | | 484,650,865 | | | | | | 659,386,943 | | | | | | 757,785,552 | | |
| End of year or period | | | | $ | 334,025,345 | | | | | $ | 321,457,719 | | | | | $ | 547,974,850 | | | | | $ | 659,386,943 | | |
See Accompanying Notes to Financial Statements
Selected data for a share of beneficial interest outstanding throughout each year or period.
| | | | | | | | | | Income
(loss) from
investment
operations | | | | | | | | | Less
Distributions | | | | | | Ratios to average
net assets | | | Supplemental
Data | |
| | | | Net asset value, beginning of year
or period | | | Net investment income (loss) | | | Net realized and unrealized
gain (loss) | | | Total from investment operations | | | From net investment income | | | From net realized gains | | | From return of capital | | | Total distributions | | | Payment by affiliate | | | Net asset value, end of year
or period | | | Total Return(1) | | | Expenses before
reductions/additions(2)(3)(4) | | | Expenses net of fee waivers
and/or recoupments if any(2)(3)(4) | | | Expense net of all
reductions/additions(2)(3)(4) | | | Net investment income (loss)(2)(3) | | | Net assets, end of year or period | | | Portfolio turnover rate | |
Year or
period ended | | | ($) | | | ($) | | | ($) | | | ($) | | | ($) | | | ($) | | | ($) | | | ($) | | | ($) | | | ($) | | | (%) | | | (%) | | | (%) | | | (%) | | | (%) | | | ($000’s) | | | (%) | |
| Voya Balanced Income Portfolio | | | | | | | | | | | | | | | | | | | | | | | | | | | | | | | | | | | | | | | | | | | | | | | | | | | | | | | | | | | | | | | | | | | | | | | | | | | | | | | | | | | | | | | | | | | | | | | | | | | | | | | |
| Class ADV | | | | | | | | | | | | | | | | | | | | | | | | | | | | | | | | | | | | | | | | | | | | | | | | | | | | | | | | | | | | | | | | | | | | | | | | | | | | | | | | | | | | | | | | | | | | | | | | | | | | | | | |
| 12-31-19 | | | | | 10.05 | | | | | | 0.30 | | | | | | 1.47 | | | | | | 1.77 | | | | | | 0.50 | | | | | | 0.67 | | | | | | — | | | | | | 1.17 | | | | | | — | | | | | | 10.65 | | | | | | 17.93 | | | | | | 1.26 | | | | | | 1.22 | | | | | | 1.22 | | | | | | 2.79 | | | | | | 78,155 | | | | | | 231 | | |
| 12-31-18 | | | | | 11.18 | | | | | | 0.43• | | | | | | (1.00) | | | | | | (0.57) | | | | | | 0.56 | | | | | | — | | | | | | — | | | | | | 0.56 | | | | | | — | | | | | | 10.05 | | | | | | (5.39) | | | | | | 1.39 | | | | | | 1.26 | | | | | | 1.26 | | | | | | 3.91 | | | | | | 69,593 | | | | | | 45 | | |
| 12-31-17 | | | | | 10.62 | | | | | | 0.46• | | | | | | 0.58 | | | | | | 1.04 | | | | | | 0.48 | | | | | | — | | | | | | — | | | | | | 0.48 | | | | | | — | | | | | | 11.18 | | | | | | 10.03 | | | | | | 1.39 | | | | | | 1.26 | | | | | | 1.26 | | | | | | 4.16 | | | | | | 81,767 | | | | | | 22 | | |
| 12-31-16 | | | | | 9.82 | | | | | | 0.42• | | | | | | 1.05 | | | | | | 1.47 | | | | | | 0.67 | | | | | | — | | | | | | — | | | | | | 0.67 | | | | | | — | | | | | | 10.62 | | | | | | 15.26 | | | | | | 1.43 | | | | | | 1.36 | | | | | | 1.36 | | | | | | 4.14 | | | | | | 72,064 | | | | | | 42 | | |
| 12-31-15 | | | | | 11.03 | | | | | | 0.40• | | | | | | (1.11) | | | | | | (0.71) | | | | | | 0.50 | | | | | | — | | | | | | — | | | | | | 0.50 | | | | | | — | | | | | | 9.82 | | | | | | (6.72) | | | | | | 1.52 | | | | | | 1.37 | | | | | | 1.37 | | | | | | 3.80 | | | | | | 68,152 | | | | | | 18 | | |
| Class I | | | | | | | | | | | | | | | | | | | | | | | | | | | | | | | | | | | | | | | | | | | | | | | | | | | | | | | | | | | | | | | | | | | | | | | | | | | | | | | | | | | | | | | | | | | | | | | | | | | | | | | |
| 12-31-19 | | | | | 10.50 | | | | | | 0.38• | | | | | | 1.55 | | | | | | 1.93 | | | | | | 0.57 | | | | | | 0.67 | | | | | | — | | | | | | 1.24 | | | | | | — | | | | | | 11.19 | | | | | | 18.73 | | | | | | 0.66 | | | | | | 0.62 | | | | | | 0.62 | | | | | | 3.38 | | | | | | 8,836 | | | | | | 231 | | |
| 12-31-18 | | | | | 11.65 | | | | | | 0.51• | | | | | | (1.03) | | | | | | (0.52) | | | | | | 0.63 | | | | | | — | | | | | | — | | | | | | 0.63 | | | | | | — | | | | | | 10.50 | | | | | | (4.79) | | | | | | 0.79 | | | | | | 0.66 | | | | | | 0.66 | | | | | | 4.51 | | | | | | 7,921 | | | | | | 45 | | |
| 12-31-17 | | | | | 11.05 | | | | | | 0.54• | | | | | | 0.60 | | | | | | 1.14 | | | | | | 0.54 | | | | | | — | | | | | | — | | | | | | 0.54 | | | | | | — | | | | | | 11.65 | | | | | | 10.56 | | | | | | 0.79 | | | | | | 0.66 | | | | | | 0.66 | | | | | | 4.76 | | | | | | 9,393 | | | | | | 22 | | |
| 12-31-16 | | | | | 10.18 | | | | | | 0.50• | | | | | | 1.09 | | | | | | 1.59 | | | | | | 0.72 | | | | | | — | | | | | | — | | | | | | 0.72 | | | | | | — | | | | | | 11.05 | | | | | | 16.02 | | | | | | 0.78 | | | | | | 0.76 | | | | | | 0.76 | | | | | | 4.74 | | | | | | 9,478 | | | | | | 42 | | |
| 12-31-15 | | | | | 11.43 | | | | | | 0.47• | | | | | | (1.16) | | | | | | (0.69) | | | | | | 0.56 | | | | | | — | | | | | | — | | | | | | 0.56 | | | | | | — | | | | | | 10.18 | | | | | | (6.34) | | | | | | 0.77 | | | | | | 0.77 | | | | | | 0.77 | | | | | | 4.11 | | | | | | 9,222 | | | | | | 18 | | |
| Class S | | | | | | | | | | | | | | | | | | | | | | | | | | | | | | | | | | | | | | | | | | | | | | | | | | | | | | | | | | | | | | | | | | | | | | | | | | | | | | | | | | | | | | | | | | | | | | | | | | | | | | | |
| 12-31-19 | | | | | 10.45 | | | | | | 0.36• | | | | | | 1.52 | | | | | | 1.88 | | | | | | 0.53 | | | | | | 0.67 | | | | | | — | | | | | | 1.20 | | | | | | — | | | | | | 11.13 | | | | | | 18.40 | | | | | | 0.91 | | | | | | 0.87 | | | | | | 0.87 | | | | | | 3.18 | | | | | | 295,942 | | | | | | 231 | | |
| 12-31-18 | | | | | 11.59 | | | | | | 0.48• | | | | | | (1.02) | | | | | | (0.54) | | | | | | 0.60 | | | | | | — | | | | | | — | | | | | | 0.60 | | | | | | — | | | | | | 10.45 | | | | | | (5.01) | | | | | | 1.04 | | | | | | 0.91 | | | | | | 0.91 | | | | | | 4.26 | | | | | | 285,793 | | | | | | 45 | | |
| 12-31-17 | | | | | 10.99 | | | | | | 0.51• | | | | | | 0.60 | | | | | | 1.11 | | | | | | 0.51 | | | | | | — | | | | | | — | | | | | | 0.51 | | | | | | — | | | | | | 11.59 | | | | | | 10.33 | | | | | | 1.04 | | | | | | 0.91 | | | | | | 0.91 | | | | | | 4.52 | | | | | | 361,336 | | | | | | 22 | | |
| 12-31-16 | | | | | 10.14 | | | | | | 0.47• | | | | | | 1.09 | | | | | | 1.56 | | | | | | 0.71 | | | | | | — | | | | | | — | | | | | | 0.71 | | | | | | — | | | | | | 10.99 | | | | | | 15.68 | | | | | | 1.03 | | | | | | 1.01 | | | | | | 1.01 | | | | | | 4.49 | | | | | | 411,297 | | | | | | 42 | | |
| 12-31-15 | | | | | 11.35 | | | | | | 0.45• | | | | | | (1.13) | | | | | | (0.68) | | | | | | 0.53 | | | | | | — | | | | | | — | | | | | | 0.53 | | | | | | — | | | | | | 10.14 | | | | | | (6.31) | | | | | | 1.02 | | | | | | 1.02 | | | | | | 1.02 | | | | | | 4.14 | | | | | | 414,907 | | | | | | 18 | | |
| Class S2 | | | | | | | | | | | | | | | | | | | | | | | | | | | | | | | | | | | | | | | | | | | | | | | | | | | | | | | | | | | | | | | | | | | | | | | | | | | | | | | | | | | | | | | | | | | | | | | | | | | | | | | |
| 12-31-19 | | | | | 10.43 | | | | | | 0.32 | | | | | | 1.54 | | | | | | 1.86 | | | | | | 0.52 | | | | | | 0.67 | | | | | | — | | | | | | 1.19 | | | | | | — | | | | | | 11.10 | | | | | | 18.15 | | | | | | 1.06 | | | | | | 1.02 | | | | | | 1.02 | | | | | | 2.97 | | | | | | 5,679 | | | | | | 231 | | |
| 12-31-18 | | | | | 11.56 | | | | | | 0.46• | | | | | | (1.02) | | | | | | (0.56) | | | | | | 0.57 | | | | | | — | | | | | | — | | | | | | 0.57 | | | | | | — | | | | | | 10.43 | | | | | | (5.15) | | | | | | 1.19 | | | | | | 1.06 | | | | | | 1.06 | | | | | | 4.11 | | | | | | 4,647 | | | | | | 45 | | |
| 12-31-17 | | | | | 10.96 | | | | | | 0.50• | | | | | | 0.59 | | | | | | 1.09 | | | | | | 0.49 | | | | | | — | | | | | | — | | | | | | 0.49 | | | | | | — | | | | | | 11.56 | | | | | | 10.16 | | | | | | 1.19 | | | | | | 1.06 | | | | | | 1.06 | | | | | | 4.38 | | | | | | 5,389 | | | | | | 22 | | |
| 12-31-16 | | | | | 10.11 | | | | | | 0.45• | | | | | | 1.09 | | | | | | 1.54 | | | | | | 0.69 | | | | | | — | | | | | | — | | | | | | 0.69 | | | | | | — | | | | | | 10.96 | | | | | | 15.52 | | | | | | 1.21 | | | | | | 1.16 | | | | | | 1.16 | | | | | | 4.34 | | | | | | 7,701 | | | | | | 42 | | |
| 12-31-15 | | | | | 11.32 | | | | | | 0.44• | | | | | | (1.15) | | | | | | (0.71) | | | | | | 0.50 | | | | | | — | | | | | | — | | | | | | 0.50 | | | | | | — | | | | | | 10.11 | | | | | | (6.51) | | | | | | 1.27 | | | | | | 1.17 | | | | | | 1.17 | | | | | | 3.99 | | | | | | 7,770 | | | | | | 18 | | |
| Voya High Yield Portfolio | | | | | | | | | | | | | | | | | | | | | | | | | | | | | | | | | | | | | | | | | | | | | | | | | | | | | | | | | | | | | | | | | | | | | | | | | | | | | | | | | | | | | | | | | | | | | | | | | | | | | | | |
| Class ADV | | | | | | | | | | | | | | | | | | | | | | | | | | | | | | | | | | | | | | | | | | | | | | | | | | | | | | | | | | | | | | | | | | | | | | | | | | | | | | | | | | | | | | | | | | | | | | | | | | | | | | | |
| 12-31-19 | | | | | 9.09 | | | | | | 0.50 | | | | | | 0.83 | | | | | | 1.33 | | | | | | 0.48 | | | | | | — | | | | | | — | | | | | | 0.48 | | | | | | — | | | | | | 9.94 | | | | | | 14.82 | | | | | | 1.10 | | | | | | 1.08 | | | | | | 1.08 | | | | | | 5.20 | | | | | | 87,540 | | | | | | 59 | | |
| 12-31-18 | | | | | 9.94 | | | | | | 0.48 | | | | | | (0.81) | | | | | | (0.33) | | | | | | 0.52 | | | | | | — | | | | | | — | | | | | | 0.52 | | | | | | — | | | | | | 9.09 | | | | | | (3.53) | | | | | | 1.10 | | | | | | 1.08 | | | | | | 1.08 | | | | | | 5.02 | | | | | | 80,872 | | | | | | 35 | | |
| 12-31-17 | | | | | 10.01 | | | | | | 0.54 | | | | | | 0.03 | | | | | | 0.57 | | | | | | 0.62 | | | | | | — | | | | | | 0.02 | | | | | | 0.64 | | | | | | — | | | | | | 9.94 | | | | | | 5.83 | | | | | | 1.10 | | | | | | 1.08 | | | | | | 1.08 | | | | | | 5.36 | | | | | | 96,011 | | | | | | 37 | | |
| 12-31-16 | | | | | 9.33 | | | | | | 0.55 | | | | | | 0.74 | | | | | | 1.29 | | | | | | 0.61 | | | | | | — | | | | | | — | | | | | | 0.61 | | | | | | — | | | | | | 10.01 | | | | | | 14.21 | | | | | | 1.14 | | | | | | 1.08 | | | | | | 1.08 | | | | | | 5.56 | | | | | | 98,835 | | | | | | 31 | | |
| 12-31-15 | | | | | 10.10 | | | | | | 0.56• | | | | | | (0.78) | | | | | | (0.22) | | | | | | 0.55 | | | | | | — | | | | | | — | | | | | | 0.55 | | | | | | — | | | | | | 9.33 | | | | | | (2.35) | | | | | | 1.24 | | | | | | 1.08 | | | | | | 1.08 | | | | | | 5.57 | | | | | | 94,398 | | | | | | 33 | | |
| Class I | | | | | | | | | | | | | | | | | | | | | | | | | | | | | | | | | | | | | | | | | | | | | | | | | | | | | | | | | | | | | | | | | | | | | | | | | | | | | | | | | | | | | | | | | | | | | | | | | | | | | | | |
| 12-31-19 | | | | | 9.10 | | | | | | 0.57• | | | | | | 0.81 | | | | | | 1.38 | | | | | | 0.54 | | | | | | — | | | | | | — | | | | | | 0.54 | | | | | | — | | | | | | 9.94 | | | | | | 15.37 | | | | | | 0.50 | | | | | | 0.48 | | | | | | 0.48 | | | | | | 5.84 | | | | | | 189,247 | | | | | | 59 | | |
| 12-31-18 | | | | | 9.95 | | | | | | 0.54 | | | | | | (0.82) | | | | | | (0.28) | | | | | | 0.57 | | | | | | — | | | | | | — | | | | | | 0.57 | | | | | | — | | | | | | 9.10 | | | | | | (2.96) | | | | | | 0.50 | | | | | | 0.48 | | | | | | 0.48 | | | | | | 5.62 | | | | | | 56,385 | | | | | | 35 | | |
| 12-31-17 | | | | | 10.01 | | | | | | 0.60 | | | | | | 0.04 | | | | | | 0.64 | | | | | | 0.68 | | | | | | — | | | | | | 0.02 | | | | | | 0.70 | | | | | | — | | | | | | 9.95 | | | | | | 6.58 | | | | | | 0.50 | | | | | | 0.48 | | | | | | 0.48 | | | | | | 5.96 | | | | | | 62,380 | | | | | | 37 | | |
| 12-31-16 | | | | | 9.33 | | | | | | 0.60• | | | | | | 0.75 | | | | | | 1.35 | | | | | | 0.67 | | | | | | — | | | | | | — | | | | | | 0.67 | | | | | | — | | | | | | 10.01 | | | | | | 14.89 | | | | | | 0.49 | | | | | | 0.48 | | | | | | 0.48 | | | | | | 6.16 | | | | | | 57,828 | | | | | | 31 | | |
| 12-31-15 | | | | | 10.11 | | | | | | 0.60 | | | | | | (0.77) | | | | | | (0.17) | | | | | | 0.61 | | | | | | — | | | | | | — | | | | | | 0.61 | | | | | | — | | | | | | 9.33 | | | | | | (1.86) | | | | | | 0.49 | | | | | | 0.48 | | | | | | 0.48 | | | | | | 6.18 | | | | | | 63,622 | | | | | | 33 | | |
See Accompanying Notes to Financial Statements
Financial Highlights (continued)
| | | | | | | | | | Income
(loss) from
investment
operations | | | | | | | | | Less
Distributions | | | | | | Ratios to average
net assets | | | Supplemental
Data | |
| | | | Net asset value, beginning of year
or period | | | Net investment income (loss) | | | Net realized and unrealized
gain (loss) | | | Total from investment operations | | | From net investment income | | | From net realized gains | | | From return of capital | | | Total distributions | | | Payment by affiliate | | | Net asset value, end of year
or period | | | Total Return(1) | | | Expenses before
reductions/additions(2)(3)(4) | | | Expenses net of fee waivers
and/or recoupments if any(2)(3)(4) | | | Expense net of all
reductions/additions(2)(3)(4) | | | Net investment income (loss)(2)(3) | | | Net assets, end of year or period | | | Portfolio turnover rate | |
Year or
period ended | | | ($) | | | ($) | | | ($) | | | ($) | | | ($) | | | ($) | | | ($) | | | ($) | | | ($) | | | ($) | | | (%) | | | (%) | | | (%) | | | (%) | | | (%) | | | ($000’s) | | | (%) | |
| Voya High Yield Portfolio (continued) | | | | | | | | | | | | | | | | | | | | | | | | | | | | | | | | | | | | | | | | | | | | | | | | | | | | | | | | | | | | | | | | | | | | | | | | | | | | | | | | | | | | | | | | | | | | | | | | | | | | | | | |
| Class S | | | | | | | | | | | | | | | | | | | | | | | | | | | | | | | | | | | | | | | | | | | | | | | | | | | | | | | | | | | | | | | | | | | | | | | | | | | | | | | | | | | | | | | | | | | | | | | | | | | | | | | |
| 12-31-19 | | | | | 9.09 | | | | | | 0.54 | | | | | | 0.82 | | | | | | 1.36 | | | | | | 0.51 | | | | | | — | | | | | | — | | | | | | 0.51 | | | | | | — | | | | | | 9.94 | | | | | | 15.22 | | | | | | 0.75 | | | | | | 0.73 | | | | | | 0.73 | | | | | | 5.54 | | | | | | 307,506 | | | | | | 59 | | |
| 12-31-18 | | | | | 9.94 | | | | | | 0.51 | | | | | | (0.81) | | | | | | (0.30) | | | | | | 0.55 | | | | | | — | | | | | | — | | | | | | 0.55 | | | | | | — | | | | | | 9.09 | | | | | | (3.20) | | | | | | 0.75 | | | | | | 0.73 | | | | | | 0.73 | | | | | | 5.36 | | | | | | 332,669 | | | | | | 35 | | |
| 12-31-17 | | | | | 10.01 | | | | | | 0.58 | | | | | | 0.02 | | | | | | 0.60 | | | | | | 0.65 | | | | | | — | | | | | | 0.02 | | | | | | 0.67 | | | | | | — | | | | | | 9.94 | | | | | | 6.20 | | | | | | 0.75 | | | | | | 0.73 | | | | | | 0.73 | | | | | | 5.71 | | | | | | 403,630 | | | | | | 37 | | |
| 12-31-16 | | | | | 9.33 | | | | | | 0.58 | | | | | | 0.75 | | | | | | 1.33 | | | | | | 0.65 | | | | | | — | | | | | | — | | | | | | 0.65 | | | | | | — | | | | | | 10.01 | | | | | | 14.61 | | | | | | 0.74 | | | | | | 0.73 | | | | | | 0.73 | | | | | | 5.91 | | | | | | 484,963 | | | | | | 31 | | |
| 12-31-15 | | | | | 10.10 | | | | | | 0.59• | | | | | | (0.77) | | | | | | (0.18) | | | | | | 0.59 | | | | | | — | | | | | | — | | | | | | 0.59 | | | | | | — | | | | | | 9.33 | | | | | | (2.01) | | | | | | 0.74 | | | | | | 0.73 | | | | | | 0.73 | | | | | | 5.91 | | | | | | 472,161 | | | | | | 33 | | |
| Class S2 | | | | | | | | | | | | | | | | | | | | | | | | | | | | | | | | | | | | | | | | | | | | | | | | | | | | | | | | | | | | | | | | | | | | | | | | | | | | | | | | | | | | | | | | | | | | | | | | | | | | | | | |
| 12-31-19 | | | | | 9.11 | | | | | | 0.51 | | | | | | 0.83 | | | | | | 1.34 | | | | | | 0.50 | | | | | | — | | | | | | — | | | | | | 0.50 | | | | | | — | | | | | | 9.95 | | | | | | 14.91 | | | | | | 0.90 | | | | | | 0.88 | | | | | | 0.88 | | | | | | 5.37 | | | | | | 3,012 | | | | | | 59 | | |
| 12-31-18 | | | | | 9.95 | | | | | | 0.50 | | | | | | (0.80) | | | | | | (0.30) | | | | | | 0.54 | | | | | | — | | | | | | — | | | | | | 0.54 | | | | | | — | | | | | | 9.11 | | | | | | (3.23) | | | | | | 0.90 | | | | | | 0.88 | | | | | | 0.88 | | | | | | 5.20 | | | | | | 4,226 | | | | | | 35 | | |
| 12-31-17 | | | | | 10.02 | | | | | | 0.56 | | | | | | 0.03 | | | | | | 0.59 | | | | | | 0.64 | | | | | | — | | | | | | 0.02 | | | | | | 0.66 | | | | | | — | | | | | | 9.95 | | | | | | 6.04 | | | | | | 0.90 | | | | | | 0.88 | | | | | | 0.88 | | | | | | 5.56 | | | | | | 5,792 | | | | | | 37 | | |
| 12-31-16 | | | | | 9.34 | | | | | | 0.56 | | | | | | 0.75 | | | | | | 1.31 | | | | | | 0.63 | | | | | | — | | | | | | — | | | | | | 0.63 | | | | | | — | | | | | | 10.02 | | | | | | 14.43 | | | | | | 0.92 | | | | | | 0.88 | | | | | | 0.88 | | | | | | 5.76 | | | | | | 5,815 | | | | | | 31 | | |
| 12-31-15 | | | | | 10.11 | | | | | | 0.58• | | | | | | (0.77) | | | | | | (0.19) | | | | | | 0.58 | | | | | | — | | | | | | — | | | | | | 0.58 | | | | | | — | | | | | | 9.34 | | | | | | (2.15) | | | | | | 0.99 | | | | | | 0.88 | | | | | | 0.88 | | | | | | 5.76 | | | | | | 5,327 | | | | | | 33 | | |
| Voya Large Cap Growth Portfolio | | | | | | | | | | | | | | | | | | | | | | | | | | | | | | | | | | | | | | | | | | | | | | | | | | | | | | | | | | | | | | | | | | | | | | | | | | | | | | | | | | | | | | | | | | | | | | | | | | | | | | | |
| Class ADV | | | | | | | | | | | | | | | | | | | | | | | | | | | | | | | | | | | | | | | | | | | | | | | | | | | | | | | | | | | | | | | | | | | | | | | | | | | | | | | | | | | | | | | | | | | | | | | | | | | | | | | |
| 12-31-19 | | | | | 16.37 | | | | | | (0.01) | | | | | | 4.97 | | | | | | 4.96 | | | | | | 0.02 | | | | | | 3.35 | | | | | | — | | | | | | 3.37 | | | | | | — | | | | | | 17.96 | | | | | | 31.90 | | | | | | 1.27 | | | | | | 1.27 | | | | | | 1.27 | | | | | | (0.05) | | | | | | 1,890,631 | | | | | | 78 | | |
| 12-31-18 | | | | | 19.36 | | | | | | 0.01 | | | | | | (0.11) | | | | | | (0.10) | | | | | | 0.01 | | | | | | 2.88 | | | | | | — | | | | | | 2.89 | | | | | | — | | | | | | 16.37 | | | | | | (2.07) | | | | | | 1.27 | | | | | | 1.27 | | | | | | 1.27 | | | | | | 0.04 | | | | | | 1,686,805 | | | | | | 85 | | |
| 12-31-17 | | | | | 16.22 | | | | | | 0.02 | | | | | | 4.53 | | | | | | 4.55 | | | | | | 0.01 | | | | | | 1.40 | | | | | | — | | | | | | 1.41 | | | | | | — | | | | | | 19.36 | | | | | | 29.01 | | | | | | 1.27 | | | | | | 1.27 | | | | | | 1.27 | | | | | | 0.04 | | | | | | 2,015,843 | | | | | | 65 | | |
| 12-31-16 | | | | | 18.13 | | | | | | 0.01 | | | | | | 0.57 | | | | | | 0.58 | | | | | | — | | | | | | 2.49 | | | | | | — | | | | | | 2.49 | | | | | | — | | | | | | 16.22 | | | | | | 3.33 | | | | | | 1.32 | | | | | | 1.27 | | | | | | 1.27 | | | | | | 0.08 | | | | | | 1,986,387 | | | | | | 74 | | |
| 12-31-15 | | | | | 19.04 | | | | | | (0.01) | | | | | | 1.12 | | | | | | 1.11 | | | | | | 0.00* | | | | | | 2.02 | | | | | | — | | | | | | 2.02 | | | | | | — | | | | | | 18.13 | | | | | | 5.72 | | | | | | 1.42 | | | | | | 1.24 | | | | | | 1.24 | | | | | | (0.05) | | | | | | 2,244,745 | | | | | | 70 | | |
| Class I | | | | | | | | | | | | | | | | | | | | | | | | | | | | | | | | | | | | | | | | | | | | | | | | | | | | | | | | | ��� | | | | | | | | | | | | | | | | | | | | | | | | | | | | | | | | | | | | | | | | | | | | | | |
| 12-31-19 | | | | | 17.78 | | | | | | 0.11 | | | | | | 5.43 | | | | | | 5.54 | | | | | | 0.14 | | | | | | 3.35 | | | | | | — | | | | | | 3.49 | | | | | | — | | | | | | 19.83 | | | | | | 32.77 | | | | | | 0.67 | | | | | | 0.67 | | | | | | 0.67 | | | | | | 0.54 | | | | | | 2,000,466 | | | | | | 78 | | |
| 12-31-18 | | | | | 20.80 | | | | | | 0.13• | | | | | | (0.13) | | | | | | 0.00* | | | | | | 0.14 | | | | | | 2.88 | | | | | | — | | | | | | 3.02 | | | | | | — | | | | | | 17.78 | | | | | | (1.48) | | | | | | 0.67 | | | | | | 0.67 | | | | | | 0.67 | | | | | | 0.63 | | | | | | 1,623,952 | | | | | | 85 | | |
| 12-31-17 | | | | | 17.34 | | | | | | 0.12 | | | | | | 4.87 | | | | | | 4.99 | | | | | | 0.13 | | | | | | 1.40 | | | | | | — | | | | | | 1.53 | | | | | | — | | | | | | 20.80 | | | | | | 29.74 | | | | | | 0.67 | | | | | | 0.67 | | | | | | 0.67 | | | | | | 0.63 | | | | | | 2,124,109 | | | | | | 65 | | |
| 12-31-16 | | | | | 19.21 | | | | | | 0.13 | | | | | | 0.60 | | | | | | 0.73 | | | | | | 0.11 | | | | | | 2.49 | | | | | | — | | | | | | 2.60 | | | | | | — | | | | | | 17.34 | | | | | | 3.96 | | | | | | 0.67 | | | | | | 0.67 | | | | | | 0.67 | | | | | | 0.68 | | | | | | 1,769,295 | | | | | | 74 | | |
| 12-31-15 | | | | | 20.05 | | | | | | 0.11 | | | | | | 1.19 | | | | | | 1.30 | | | | | | 0.12 | | | | | | 2.02 | | | | | | — | | | | | | 2.14 | | | | | | — | | | | | | 19.21 | | | | | | 6.38 | | | | | | 0.67 | | | | | | 0.64 | | | | | | 0.64 | | | | | | 0.55 | | | | | | 1,876,362 | | | | | | 70 | | |
| Class R6 | | | | | | | | | | | | | | | | | | | | | | | | | | | | | | | | | | | | | | | | | | | | | | | | | | | | | | | | | | | | | | | | | | | | | | | | | | | | | | | | | | | | | | | | | | | | | | | | | | | | | | | |
| 12-31-19 | | | | | 17.78 | | | | | | 0.11 | | | | | | 5.44 | | | | | | 5.55 | | | | | | 0.14 | | | | | | 3.35 | | | | | | — | | | | | | 3.49 | | | | | | — | | | | | | 19.84 | | | | | | 32.82 | | | | | | 0.67 | | | | | | 0.67 | | | | | | 0.67 | | | | | | 0.54 | | | | | | 59,938 | | | | | | 78 | | |
| 12-31-18 | | | | | 20.81 | | | | | | 0.12 | | | | | | (0.13) | | | | | | (0.01) | | | | | | 0.14 | | | | | | 2.88 | | | | | | — | | | | | | 3.02 | | | | | | — | | | | | | 17.78 | | | | | | (1.53) | | | | | | 0.67 | | | | | | 0.67 | | | | | | 0.67 | | | | | | 0.68 | | | | | | 46,242 | | | | | | 85 | | |
| 12-31-17 | | | | | 17.34 | | | | | | 0.13• | | | | | | 4.87 | | | | | | 5.00 | | | | | | 0.13 | | | | | | 1.40 | | | | | | — | | | | | | 1.53 | | | | | | — | | | | | | 20.81 | | | | | | 29.80 | | | | | | 0.67 | | | | | | 0.67 | | | | | | 0.67 | | | | | | 0.65 | | | | | | 33,736 | | | | | | 65 | | |
| 12-31-16 | | | | | 19.21 | | | | | | 0.13• | | | | | | 0.60 | | | | | | 0.73 | | | | | | 0.11 | | | | | | 2.49 | | | | | | — | | | | | | 2.60 | | | | | | — | | | | | | 17.34 | | | | | | 3.95 | | | | | | 0.67 | | | | | | 0.67 | | | | | | 0.67 | | | | | | 0.77 | | | | | | 6,970 | | | | | | 74 | | |
11-24-15(5) -
12-31-15 | | | | | 19.47 | | | | | | 0.02• | | | | | | (0.28) | | | | | | (0.26) | | | | | | — | | | | | | — | | | | | | — | | | | | | — | | | | | | — | | | | | | 19.21 | | | | | | (1.34) | | | | | | 0.67 | | | | | | 0.67 | | | | | | 0.67 | | | | | | 1.02 | | | | | | 3 | | | | | | 70 | | |
| Class S | | | | | | | | | | | | | | | | | | | | | | | | | | | | | | | | | | | | | | | | | | | | | | | | | | | | | | | | | | | | | | | | | | | | | | | | | | | | | | | | | | | | | | | | | | | | | | | | | | | | | | | |
| 12-31-19 | | | | | 17.31 | | | | | | 0.06 | | | | | | 5.27 | | | | | | 5.33 | | | | | | 0.08 | | | | | | 3.35 | | | | | | — | | | | | | 3.43 | | | | | | — | | | | | | 19.21 | | | | | | 32.41 | | | | | | 0.92 | | | | | | 0.92 | | | | | | 0.92 | | | | | | 0.30 | | | | | | 1,839,829 | | | | | | 78 | | |
| 12-31-18 | | | | | 20.32 | | | | | | 0.08• | | | | | | (0.13) | | | | | | (0.05) | | | | | | 0.08 | | | | | | 2.88 | | | | | | — | | | | | | 2.96 | | | | | | — | | | | | | 17.31 | | | | | | (1.73) | | | | | | 0.92 | | | | | | 0.92 | | | | | | 0.92 | | | | | | 0.39 | | | | | | 1,677,848 | | | | | | 85 | | |
| 12-31-17 | | | | | 16.97 | | | | | | 0.07 | | | | | | 4.76 | | | | | | 4.83 | | | | | | 0.08 | | | | | | 1.40 | | | | | | — | | | | | | 1.48 | | | | | | — | | | | | | 20.32 | | | | | | 29.42 | | | | | | 0.92 | | | | | | 0.92 | | | | | | 0.92 | | | | | | 0.39 | | | | | | 2,040,159 | | | | | | 65 | | |
| 12-31-16 | | | | | 18.85 | | | | | | 0.08 | | | | | | 0.59 | | | | | | 0.67 | | | | | | 0.06 | | | | | | 2.49 | | | | | | — | | | | | | 2.55 | | | | | | — | | | | | | 16.97 | | | | | | 3.69 | | | | | | 0.92 | | | | | | 0.92 | | | | | | 0.92 | | | | | | 0.43 | | | | | | 2,014,562 | | | | | | 74 | | |
| 12-31-15 | | | | | 19.72 | | | | | | 0.06• | | | | | | 1.16 | | | | | | 1.22 | | | | | | 0.07 | | | | | | 2.02 | | | | | | — | | | | | | 2.09 | | | | | | — | | | | | | 18.85 | | | | | | 6.11 | | | | | | 0.92 | | | | | | 0.89 | | | | | | 0.89 | | | | | | 0.30 | | | | | | 2,077,008 | | | | | | 70 | | |
See Accompanying Notes to Financial Statements
Financial Highlights (continued)
| | | | | | | | | | Income
(loss) from
investment
operations | | | | | | | | | Less
Distributions | | | | | | Ratios to average
net assets | | | Supplemental
Data | |
| | | | Net asset value, beginning of year
or period | | | Net investment income (loss) | | | Net realized and unrealized
gain (loss) | | | Total from investment operations | | | From net investment income | | | From net realized gains | | | From return of capital | | | Total distributions | | | Payment by affiliate | | | Net asset value, end of year
or period | | | Total Return(1) | | | Expenses before
reductions/additions(2)(3)(4) | | | Expenses net of fee waivers
and/or recoupments if any(2)(3)(4) | | | Expense net of all
reductions/additions(2)(3)(4) | | | Net investment income (loss)(2)(3) | | | Net assets, end of year or period | | | Portfolio turnover rate | |
Year or
period ended | | | ($) | | | ($) | | | ($) | | | ($) | | | ($) | | | ($) | | | ($) | | | ($) | | | ($) | | | ($) | | | (%) | | | (%) | | | (%) | | | (%) | | | (%) | | | ($000’s) | | | (%) | |
| Voya Large Cap Growth Portfolio (continued) | | | | | | | | | | | | | | | | | | | | | | | | | | | | | | | | | | | | | | | | | | | | | | | | | | | | | | | | | | | | | | | | | | | | | | | | | | | | | | | | | | | | | | | | | | | | | | | | | | | | | | | |
| Class S2 | | | | | | | | | | | | | | | | | | | | | | | | | | | | | | | | | | | | | | | | | | | | | | | | | | | | | | | | | | | | | | | | | | | | | | | | | | | | | | | | | | | | | | | | | | | | | | | | | | | | | | | |
| 12-31-19 | | | | | 17.18 | | | | | | 0.04 | | | | | | 5.21 | | | | | | 5.25 | | | | | | 0.05 | | | | | | 3.35 | | | | | | — | | | | | | 3.40 | | | | | | — | | | | | | 19.03 | | | | | | 32.16 | | | | | | 1.07 | | | | | | 1.07 | | | | | | 1.07 | | | | | | 0.15 | | | | | | 61,219 | | | | | | 78 | | |
| 12-31-18 | | | | | 20.18 | | | | | | 0.05 | | | | | | (0.12) | | | | | | (0.07) | | | | | | 0.05 | | | | | | 2.88 | | | | | | — | | | | | | 2.93 | | | | | | — | | | | | | 17.18 | | | | | | (1.86) | | | | | | 1.07 | | | | | | 1.07 | | | | | | 1.07 | | | | | | 0.25 | | | | | | 58,647 | | | | | | 85 | | |
| 12-31-17 | | | | | 16.86 | | | | | | 0.04• | | | | | | 4.73 | | | | | | 4.77 | | | | | | 0.05 | | | | | | 1.40 | | | | | | — | | | | | | 1.45 | | | | | | — | | | | | | 20.18 | | | | | | 29.22 | | | | | | 1.07 | | | | | | 1.07 | | | | | | 1.07 | | | | | | 0.24 | | | | | | 66,024 | | | | | | 65 | | |
| 12-31-16 | | | | | 18.73 | | | | | | 0.05 | | | | | | 0.59 | | | | | | 0.64 | | | | | | 0.02 | | | | | | 2.49 | | | | | | — | | | | | | 2.51 | | | | | | — | | | | | | 16.86 | | | | | | 3.57 | | | | | | 1.10 | | | | | | 1.07 | | | | | | 1.07 | | | | | | 0.28 | | | | | | 66,897 | | | | | | 74 | | |
| 12-31-15 | | | | | 19.62 | | | | | | 0.03• | | | | | | 1.15 | | | | | | 1.18 | | | | | | 0.05 | | | | | | 2.02 | | | | | | — | | | | | | 2.07 | | | | | | — | | | | | | 18.73 | | | | | | 5.90 | | | | | | 1.17 | | | | | | 1.04 | | | | | | 1.04 | | | | | | 0.15 | | | | | | 78,138 | | | | | | 70 | | |
| Voya Large Cap Value Portfolio | | | | | | | | | | | | | | | | | | | | | | | | | | | | | | | | | | | | | | | | | | | | | | | | | | | | | | | | | | | | | | | | | | | | | | | | | | | | | | | | | | | | | | | | | | | | | | | | | | | | | | | |
| Class ADV | | | | | | | | | | | | | | | | | | | | | | | | | | | | | | | | | | | | | | | | | | | | | | | | | | | | | | | | | | | | | | | | | | | | | | | | | | | | | | | | | | | | | | | | | | | | | | | | | | | | | | | |
| 12-31-19 | | | | | 10.48 | | | | | | 0.17 | | | | | | 2.34 | | | | | | 2.51 | | | | | | 0.18 | | | | | | 0.85 | | | | | | — | | | | | | 1.03 | | | | | | — | | | | | | 11.96 | | | | | | 24.45 | | | | | | 1.35 | | | | | | 1.24 | | | | | | 1.24 | | | | | | 1.40 | | | | | | 53,098 | | | | | | 95 | | |
| 12-31-18 | | | | | 13.06 | | | | | | 0.18 | | | | | | (1.15) | | | | | | (0.97) | | | | | | 0.17 | | | | | | 1.44 | | | | | | — | | | | | | 1.61 | | | | | | — | | | | | | 10.48 | | | | | | (8.33)(a) | | | | | | 1.35 | | | | | | 1.24 | | | | | | 1.24 | | | | | | 1.41(b) | | | | | | 49,230 | | | | | | 97 | | |
| 12-31-17 | | | | | 11.79 | | | | | | 0.18• | | | | | | 1.33 | | | | | | 1.51 | | | | | | 0.24 | | | | | | — | | | | | | — | | | | | | 0.24 | | | | | | — | | | | | | 13.06 | | | | | | 12.84 | | | | | | 1.35 | | | | | | 1.24 | | | | | | 1.24 | | | | | | 1.44 | | | | | | 61,244 | | | | | | 79 | | |
| 12-31-16 | | | | | 10.94 | | | | | | 0.21 | | | | | | 1.21 | | | | | | 1.42 | | | | | | 0.22 | | | | | | 0.35 | | | | | | — | | | | | | 0.57 | | | | | | — | | | | | | 11.79 | | | | | | 13.20 | | | | | | 1.40 | | | | | | 1.24 | | | | | | 1.24 | | | | | | 1.79 | | | | | | 64,578 | | | | | | 118 | | |
| 12-31-15 | | | | | 12.32 | | | | | | 0.16 | | | | | | (0.74) | | | | | | (0.58) | | | | | | 0.16 | | | | | | 0.64 | | | | | | — | | | | | | 0.80 | | | | | | — | | | | | | 10.94 | | | | | | (5.06) | | | | | | 1.50 | | | | | | 1.24 | | | | | | 1.24 | | | | | | 1.50 | | | | | | 67,001 | | | | | | 83 | | |
| Class I | | | | | | | | | | | | | | | | | | | | | | | | | | | | | | | | | | | | | | | | | | | | | | | | | | | | | | | | | | | | | | | | | | | | | | | | | | | | | | | | | | | | | | | | | | | | | | | | | | | | | | | |
| 12-31-19 | | | | | 10.69 | | | | | | 0.24 | | | | | | 2.39 | | | | | | 2.63 | | | | | | 0.25 | | | | | | 0.85 | | | | | | — | | | | | | 1.10 | | | | | | — | | | | | | 12.22 | | | | | | 25.12 | | | | | | 0.75 | | | | | | 0.64 | | | | | | 0.64 | | | | | | 2.00 | | | | | | 367,345 | | | | | | 95 | | |
| 12-31-18 | | | | | 13.30 | | | | | | 0.25• | | | | | | (1.17) | | | | | | (0.92) | | | | | | 0.25 | | | | | | 1.44 | | | | | | — | | | | | | 1.69 | | | | | | — | | | | | | 10.69 | | | | | | (7.81)(a) | | | | | | 0.75 | | | | | | 0.64 | | | | | | 0.64 | | | | | | 2.01(b) | | | | | | 330,038 | | | | | | 97 | | |
| 12-31-17 | | | | | 12.00 | | | | | | 0.26• | | | | | | 1.36 | | | | | | 1.62 | | | | | | 0.32 | | | | | | — | | | | | | — | | | | | | 0.32 | | | | | | — | | | | | | 13.30 | | | | | | 13.55 | | | | | | 0.75 | | | | | | 0.64 | | | | | | 0.64 | | | | | | 2.06 | | | | | | 428,068 | | | | | | 79 | | |
| 12-31-16 | | | | | 11.12 | | | | | | 0.28 | | | | | | 1.23 | | | | | | 1.51 | | | | | | 0.28 | | | | | | 0.35 | | | | | | — | | | | | | 0.63 | | | | | | — | | | | | | 12.00 | | | | | | 13.89 | | | | | | 0.75 | | | | | | 0.64 | | | | | | 0.64 | | | | | | 2.39 | | | | | | 572,744 | | | | | | 118 | | |
| 12-31-15 | | | | | 12.50 | | | | | | 0.25• | | | | | | (0.76) | | | | | | (0.51) | | | | | | 0.23 | | | | | | 0.64 | | | | | | — | | | | | | 0.87 | | | | | | — | | | | | | 11.12 | | | | | | (4.46) | | | | | | 0.75 | | | | | | 0.64 | | | | | | 0.64 | | | | | | 2.09 | | | | | | 560,041 | | | | | | 83 | | |
| Class R6 | | | | | | | | | | | | | | | | | | | | | | | | | | | | | | | | | | | | | | | | | | | | | | | | | | | | | | | | | | | | | | | | | | | | | | | | | | | | | | | | | | | | | | | | | | | | | | | | | | | | | | | |
| 12-31-19 | | | | | 10.68 | | | | | | 0.25• | | | | | | 2.38 | | | | | | 2.63 | | | | | | 0.25 | | | | | | 0.85 | | | | | | — | | | | | | 1.10 | | | | | | — | | | | | | 12.21 | | | | | | 25.14 | | | | | | 0.75 | | | | | | 0.64 | | | | | | 0.64 | | | | | | 2.16 | | | | | | 306 | | | | �� | | 95 | | |
| 12-31-18 | | | | | 13.28 | | | | | | 0.25• | | | | | | (1.16) | | | | | | (0.91) | | | | | | 0.25 | | | | | | 1.44 | | | | | | — | | | | | | 1.69 | | | | | | — | | | | | | 10.68 | | | | | | (7.74)(a) | | | | | | 0.75 | | | | | | 0.64 | | | | | | 0.64 | | | | | | 2.03(b) | | | | | | 1,182 | | | | | | 97 | | |
| 12-31-17 | | | | | 11.99 | | | | | | 0.26• | | | | | | 1.35 | | | | | | 1.61 | | | | | | 0.32 | | | | | | — | | | | | | — | | | | | | 0.32 | | | | | | — | | | | | | 13.28 | | | | | | 13.47 | | | | | | 0.75 | | | | | | 0.64 | | | | | | 0.64 | | | | | | 2.06 | | | | | | 836 | | | | | | 79 | | |
| 12-31-16 | | | | | 11.12 | | | | | | 0.23• | | | | | | 1.27 | | | | | | 1.50 | | | | | | 0.28 | | | | | | 0.35 | | | | | | — | | | | | | 0.63 | | | | | | — | | | | | | 11.99 | | | | | | 13.80 | | | | | | 0.75 | | | | | | 0.64 | | | | | | 0.64 | | | | | | 2.01 | | | | | | 550 | | | | | | 118 | | |
11-24-15(5) -
12-31-15 | | | | | 11.59 | | | | | | 0.03• | | | | | | (0.30) | | | | | | (0.27) | | | | | | 0.20 | | | | | | — | | | | | | — | | | | | | 0.20 | | | | | | — | | | | | | 11.12 | | | | | | (2.37) | | | | | | 0.75 | | | | | | 0.64 | | | | | | 0.64 | | | | | | 2.71 | | | | | | 3 | | | | | | 83 | | |
| Class S | | | | | | | | | | | | | | | | | | | | | | | | | | | | | | | | | | | | | | | | | | | | | | | | | | | | | | | | | | | | | | | | | | | | | | | | | | | | | | | | | | | | | | | | | | | | | | | | | | | | | | | |
| 12-31-19 | | | | | 10.55 | | | | | | 0.20• | | | | | | 2.36 | | | | | | 2.56 | | | | | | 0.22 | | | | | | 0.85 | | | | | | — | | | | | | 1.07 | | | | | | — | | | | | | 12.04 | | | | | | 24.78 | | | | | | 1.00 | | | | | | 0.89 | | | | | | 0.89 | | | | | | 1.75 | | | | | | 665,553 | | | | | | 95 | | |
| 12-31-18 | | | | | 13.14 | | | | | | 0.22• | | | | | | (1.15) | | | | | | (0.93) | | | | | | 0.22 | | | | | | 1.44 | | | | | | — | | | | | | 1.66 | | | | | | — | | | | | | 10.55 | | | | | | (8.00)(a) | | | | | | 1.00 | | | | | | 0.89 | | | | | | 0.89 | | | | | | 1.76(b) | | | | | | 630,221 | | | | | | 97 | | |
| 12-31-17 | | | | | 11.86 | | | | | | 0.23• | | | | | | 1.34 | | | | | | 1.57 | | | | | | 0.29 | | | | | | — | | | | | | — | | | | | | 0.29 | | | | | | — | | | | | | 13.14 | | | | | | 13.23 | | | | | | 1.00 | | | | | | 0.89 | | | | | | 0.89 | | | | | | 1.80 | | | | | | 800,421 | | | | | | 79 | | |
| 12-31-16 | | | | | 11.00 | | | | | | 0.24• | | | | | | 1.22 | | | | | | 1.46 | | | | | | 0.25 | | | | | | 0.35 | | | | | | — | | | | | | 0.60 | | | | | | — | | | | | | 11.86 | | | | | | 13.58 | | | | | | 1.00 | | | | | | 0.89 | | | | | | 0.89 | | | | | | 2.14 | | | | | | 934,779 | | | | | | 118 | | |
| 12-31-15 | | | | | 12.37 | | | | | | 0.21 | | | | | | (0.74) | | | | | | (0.53) | | | | | | 0.20 | | | | | | 0.64 | | | | | | — | | | | | | 0.84 | | | | | | — | | | | | | 11.00 | | | | | | (4.66) | | | | | | 1.00 | | | | | | 0.89 | | | | | | 0.89 | | | | | | 1.84 | | | | | | 999,196 | | | | | | 83 | | |
| Class S2 | | | | | | | | | | | | | | | | | | | | | | | | | | | | | | | | | | | | | | | | | | | | | | | | | | | | | | | | | | | | | | | | | | | | | | | | | | | | | | | | | | | | | | | | | | | | | | | | | | | | | | | |
| 12-31-19 | | | | | 10.56 | | | | | | 0.19• | | | | | | 2.36 | | | | | | 2.55 | | | | | | 0.20 | | | | | | 0.85 | | | | | | — | | | | | | 1.05 | | | | | | — | | | | | | 12.06 | | | | | | 24.63 | | | | | | 1.15 | | | | | | 1.04 | | | | | | 1.04 | | | | | | 1.60 | | | | | | 145 | | | | | | 95 | | |
| 12-31-18 | | | | | 13.15 | | | | | | 0.20 | | | | | | (1.15) | | | | | | (0.95) | | | | | | 0.20 | | | | | | 1.44 | | | | | | — | | | | | | 1.64 | | | | | | — | | | | | | 10.56 | | | | | | (8.12)(a) | | | | | | 1.15 | | | | | | 1.04 | | | | | | 1.04 | | | | | | 1.60(b) | | | | | | 151 | | | | | | 97 | | |
| 12-31-17 | | | | | 11.86 | | | | | | 0.20• | | | | | | 1.35 | | | | | | 1.55 | | | | | | 0.26 | | | | | | — | | | | | | — | | | | | | 0.26 | | | | | | — | | | | | | 13.15 | | | | | | 13.10 | | | | | | 1.15 | | | | | | 1.04 | | | | | | 1.04 | | | | | | 1.64 | | | | | | 229 | | | | | | 79 | | |
| 12-31-16 | | | | | 11.00 | | | | | | 0.22• | | | | | | 1.22 | | | | | | 1.44 | | | | | | 0.23 | | | | | | 0.35 | | | | | | — | | | | | | 0.58 | | | | | | — | | | | | | 11.86 | | | | | | 13.40 | | | | | | 1.18 | | | | | | 1.04 | | | | | | 1.04 | | | | | | 2.00 | | | | | | 537 | | | | | | 118 | | |
| 12-31-15 | | | | | 12.36 | | | | | | 0.20• | | | | | | (0.75) | | | | | | (0.55) | | | | | | 0.17 | | | | | | 0.64 | | | | | | — | | | | | | 0.81 | | | | | | — | | | | | | 11.00 | | | | | | (4.82) | | | | | | 1.25 | | | | | | 1.04 | | | | | | 1.04 | | | | | | 1.68 | | | | | | 596 | | | | | | 83 | | |
See Accompanying Notes to Financial Statements
Financial Highlights (continued)
| | | | | | | | | | Income
(loss) from
investment
operations | | | | | | | | | Less
Distributions | | | | | | Ratios to average
net assets | | | Supplemental
Data | |
| | | | Net asset value, beginning of year
or period | | | Net investment income (loss) | | | Net realized and unrealized
gain (loss) | | | Total from investment operations | | | From net investment income | | | From net realized gains | | | From return of capital | | | Total distributions | | | Payment by affiliate | | | Net asset value, end of year
or period | | | Total Return(1) | | | Expenses before
reductions/additions(2)(3)(4) | | | Expenses net of fee waivers
and/or recoupments if any(2)(3)(4) | | | Expense net of all
reductions/additions(2)(3)(4) | | | Net investment income (loss)(2)(3) | | | Net assets, end of year or period | | | Portfolio turnover rate | |
Year or
period ended | | | ($) | | | ($) | | | ($) | | | ($) | | | ($) | | | ($) | | | ($) | | | ($) | | | ($) | | | ($) | | | (%) | | | (%) | | | (%) | | | (%) | | | (%) | | | ($000’s) | | | (%) | |
| Voya Limited Maturity Bond Portfolio | | | | | | | | | | | | | | | | | | | | | | | | | | | | | | | | | | | | | | | | | | | | | | | | | | | | | | | | | | | | | | | | | | | | | | | | | | | | | | | | | | | | | | | | | | | | | | | | | | | | | | | |
| Class ADV | | | | | | | | | | | | | | | | | | | | | | | | | | | | | | | | | | | | | | | | | | | | | | | | | | | | | | | | | | | | | | | | | | | | | | | | | | | | | | | | | | | | | | | | | | | | | | | | | | | | | | | |
| 12-31-19 | | | | | 9.68 | | | | | | 0.19 | | | | | | 0.16 | | | | | | 0.35 | | | | | | 0.12 | | | | | | — | | | | | | — | | | | | | 0.12 | | | | | | — | | | | | | 9.91 | | | | | | 3.66 | | | | | | 0.89 | | | | | | 0.89 | | | | | | 0.89 | | | | | | 1.85 | | | | | | 15,579 | | | | | | 330 | | |
| 12-31-18 | | | | | 9.72 | | | | | | 0.17 | | | | | | (0.10) | | | | | | 0.07 | | | | | | 0.11 | | | | | | — | | | | | | — | | | | | | 0.11 | | | | | | — | | | | | | 9.68 | | | | | | 0.71 | | | | | | 0.89 | | | | | | 0.89 | | | | | | 0.89 | | | | | | 1.67 | | | | | | 16,812 | | | | | | 281 | | |
| 12-31-17 | | | | | 9.76 | | | | | | 0.10 | | | | | | 0.00* | | | | | | 0.10 | | | | | | 0.13 | | | | | | — | | | | | | 0.01 | | | | | | 0.14 | | | | | | — | | | | | | 9.72 | | | | | | 0.94 | | | | | | 0.89 | | | | | | 0.89 | | | | | | 0.89 | | | | | | 1.03 | | | | | | 19,695 | | | | | | 305 | | |
| 12-31-16 | | | | | 9.83 | | | | | | 0.09• | | | | | | 0.00* | | | | | | 0.09 | | | | | | 0.16 | | | | | | — | | | | | | — | | | | | | 0.16 | | | | | | — | | | | | | 9.76 | | | | | | 0.91 | | | | | | 0.93 | | | | | | 0.88 | | | | | | 0.88 | | | | | | 0.87 | | | | | | 22,864 | | | | | | 174 | | |
| 12-31-15 | | | | | 9.87 | | | | | | 0.06• | | | | | | (0.05) | | | | | | 0.01 | | | | | | 0.05 | | | | | | — | | | | | | — | | | | | | 0.05 | | | | | | — | | | | | | 9.83 | | | | | | 0.15 | | | | | | 1.03 | | | | | | 0.88 | | | | | | 0.88 | | | | | | 0.59 | | | | | | 28,178 | | | | | | 325 | | |
| Class I | | | | | | | | | | | | | | | | | | | | | | | | | | | | | | | | | | | | | | | | | | | | | | | | | | | | | | | | | | | | | | | | | | | | | | | | | | | | | | | | | | | | | | | | | | | | | | | | | | | | | | | |
| 12-31-19 | | | | | 9.87 | | | | | | 0.24 | | | | | | 0.19 | | | | | | 0.43 | | | | | | 0.19 | | | | | | — | | | | | | — | | | | | | 0.19 | | | | | | — | | | | | | 10.11 | | | | | | 4.33 | | | | | | 0.29 | | | | | | 0.29 | | | | | | 0.29 | | | | | | 2.44 | | | | | | 197,182 | | | | | | 330 | | |
| 12-31-18 | | | | | 9.91 | | | | | | 0.22 | | | | | | (0.09) | | | | | | 0.13 | | | | | | 0.17 | | | | | | — | | | | | | — | | | | | | 0.17 | | | | | | — | | | | | | 9.87 | | | | | | 1.33 | | | | | | 0.29 | | | | | | 0.29 | | | | | | 0.29 | | | | | | 2.30 | | | | | | 195,851 | | | | | | 281 | | |
| 12-31-17 | | | | | 9.96 | | | | | | 0.16 | | | | | | (0.01) | | | | | | 0.15 | | | | | | 0.19 | | | | | | — | | | | | | 0.01 | | | | | | 0.20 | | | | | | — | | | | | | 9.91 | | | | | | 1.45 | | | | | | 0.29 | | | | | | 0.29 | | | | | | 0.29 | | | | | | 1.63 | | | | | | 188,672 | | | | | | 305 | | |
| 12-31-16 | | | | | 10.09 | | | | | | 0.15• | | | | | | 0.00* | | | | | | 0.15 | | | | | | 0.28 | | | | | | — | | | | ��� | | — | | | | | | 0.28 | | | | | | — | | | | | | 9.96 | | | | | | 1.53 | | | | | | 0.28 | | | | | | 0.28 | | | | | | 0.28 | | | | | | 1.46 | | | | | | 170,578 | | | | | | 174 | | |
| 12-31-15 | | | | | 10.13 | | | | | | 0.12• | | | | | | (0.04) | | | | | | 0.08 | | | | | | 0.12 | | | | | | — | | | | | | — | | | | | | 0.12 | | | | | | — | | | | | | 10.09 | | | | | | 0.82 | | | | | | 0.28 | | | | | | 0.28 | | | | | | 0.28 | | | | | | 1.20 | | | | | | 162,082 | | | | | | 325 | | |
| Class S | | | | | | | | | | | | | | | | | | | | | | | | | | | | | | | | | | | | | | | | | | | | | | | | | | | | | | | | | | | | | | | | | | | | | | | | | | | | | | | | | | | | | | | | | | | | | | | | | | | | | | | |
| 12-31-19 | | | | | 9.95 | | | | | | 0.22 | | | | | | 0.18 | | | | | | 0.40 | | | | | | 0.16 | | | | | | — | | | | | | — | | | | | | 0.16 | | | | | | — | | | | | | 10.19 | | | | | | 4.06 | | | | | | 0.54 | | | | | | 0.54 | | | | | | 0.54 | | | | | | 2.20 | | | | | | 75,066 | | | | | | 330 | | |
| 12-31-18 | | | | | 9.99 | | | | | | 0.20 | | | | | | (0.09) | | | | | | 0.11 | | | | | | 0.15 | | | | | | — | | | | | | — | | | | | | 0.15 | | | | | | — | | | | | | 9.95 | | | | | | 1.07 | | | | | | 0.54 | | | | | | 0.54 | | | | | | 0.54 | | | | | | 2.02 | | | | | | 74,885 | | | | | | 281 | | |
| 12-31-17 | | | | | 10.04 | | | | | | 0.14 | | | | | | (0.02) | | | | | | 0.12 | | | | | | 0.16 | | | | | | — | | | | | | 0.01 | | | | | | 0.17 | | | | | | — | | | | | | 9.99 | | | | | | 1.20 | | | | | | 0.54 | | | | | | 0.54 | | | | | | 0.54 | | | | | | 1.38 | | | | | | 83,412 | | | | | | 305 | | |
| 12-31-16 | | | | | 10.15 | | | | | | 0.13 | | | | | | 0.00* | | | | | | 0.13 | | | | | | 0.24 | | | | | | — | | | | | | — | | | | | | 0.24 | | | | | | — | | | | | | 10.04 | | | | | | 1.28 | | | | | | 0.53 | | | | | | 0.53 | | | | | | 0.53 | | | | | | 1.21 | | | | | | 99,063 | | | | | | 174 | | |
| 12-31-15 | | | | | 10.19 | | | | | | 0.10 | | | | | | (0.04) | | | | | | 0.06 | | | | | | 0.10 | | | | | | — | | | | | | — | | | | | | 0.10 | | | | | | — | | | | | | 10.15 | | | | | | 0.55 | | | | | | 0.53 | | | | | | 0.53 | | | | | | 0.53 | | | | | | 0.94 | | | | | | 99,356 | | | | | | 325 | | |
| Voya U.S. Stock Index Portfolio | | | | | | | | | | | | | | | | | | | | | | | | | | | | | | | | | | | | | | | | | | | | | | | | | | | | | | | | | | | | | | | | | | | | | | | | | | | | | | | | | | | | | | | | | | | | | | | | | | | | | | | |
| Class ADV | | | | | | | | | | | | | | | | | | | | | | | | | | | | | | | | | | | | | | | | | | | | | | | | | | | | | | | | | | | | | | | | | | | | | | | | | | | | | | | | | | | | | | | | | | | | | | | | | | | | | | | |
| 12-31-19 | | | | | 13.44 | | | | | | 0.19• | | | | | | 3.82 | | | | | | 4.01 | | | | | | 0.17 | | | | | | 0.90 | | | | | | — | | | | | | 1.07 | | | | | | — | | | | | | 16.38 | | | | | | 30.43 | | | | | | 0.80 | | | | | | 0.80 | | | | | | 0.80 | | | | | | 1.22 | | | | | | 102,813 | | | | | | 9 | | |
| 12-31-18 | | | | | 15.19 | | | | | | 0.17• | | | | | | (0.86) | | | | | | (0.69) | | | | | | 0.18 | | | | | | 0.88 | | | | | | — | | | | | | 1.06 | | | | | | — | | | | | | 13.44 | | | | | | (5.10) | | | | | | 0.80 | | | | | | 0.80 | | | | | | 0.80 | | | | | | 1.14 | | | | | | 92,071 | | | | | | 12 | | |
| 12-31-17 | | | | | 13.38 | | | | | | 0.18 | | | | | | 2.53 | | | | | | 2.71 | | | | | | 0.18 | | | | | | 0.72 | | | | | | — | | | | | | 0.90 | | | | | | — | | | | | | 15.19 | | | | | | 20.82 | | | | | | 0.80 | | | | | | 0.80 | | | | | | 0.80 | | | | | | 1.23 | | | | | | 116,091 | | | | | | 6 | | |
| 12-31-16 | | | | | 12.97 | | | | | | 0.19 | | | | | | 1.21 | | | | | | 1.40 | | | | | | 0.20 | | | | | | 0.79 | | | | | | — | | | | | | 0.99 | | | | | | — | | | | | | 13.38 | | | | | | 11.11 | | | | | | 0.87 | | | | | | 0.80 | | | | | | 0.80 | | | | | | 1.37 | | | | | | 116,242 | | | | | | 5 | | |
| 12-31-15 | | | | | 14.32 | | | | | | 0.18 | | | | | | (0.07) | | | | | | 0.11 | | | | | | 0.18 | | | | | | 1.28 | | | | | | — | | | | | | 1.46 | | | | | | — | | | | | | 12.97 | | | | | | 0.54 | | | | | | 1.01 | | | | | | 0.79 | | | | | | 0.79 | | | | | | 1.33 | | | | | | 119,692 | | | | | | 12 | | |
| Class I | | | | | | | | | | | | | | | | | | | | | | | | | | | | | | | | | | | | | | | | | | | | | | | | | | | | | | | | | | | | | | | | | | | | | | | | | | | | | | | | | | | | | | | | | | | | | | | | | | | | | | | |
| 12-31-19 | | | | | 13.90 | | | | | | 0.26 | | | | | | 3.99 | | | | | | 4.25 | | | | | | 0.26 | | | | | | 0.90 | | | | | | — | | | | | | 1.16 | | | | | | — | | | | | | 16.99 | | | | | | 31.12 | | | | | | 0.27 | | | | | | 0.27 | | | | | | 0.27 | | | | | | 1.75 | | | | | | 4,065,091 | | | | | | 9 | | |
| 12-31-18 | | | | | 15.69 | | | | | | 0.26• | | | | | | (0.90) | | | | | | (0.64) | | | | | | 0.27 | | | | | | 0.88 | | | | | | — | | | | | | 1.15 | | | | | | — | | | | | | 13.90 | | | | | | (4.62) | | | | | | 0.27 | | | | | | 0.27 | | | | | | 0.27 | | | | | | 1.67 | | | | | | 2,966,664 | | | | | | 12 | | |
| 12-31-17 | | | | | 13.79 | | | | | | 0.26• | | | | | | 2.63 | | | | | | 2.89 | | | | | | 0.27 | | | | | | 0.72 | | | | | | — | | | | | | 0.99 | | | | | | — | | | | | | 15.69 | | | | | | 21.46 | | | | | | 0.27 | | | | | | 0.27 | | | | | | 0.27 | | | | | | 1.75 | | | | | | 3,469,721 | | | | | | 6 | | |
| 12-31-16 | | | | | 13.34 | | | | | | 0.26 | | | | | | 1.25 | | | | | | 1.51 | | | | | | 0.27 | | | | | | 0.79 | | | | | | — | | | | | | 1.06 | | | | | | — | | | | | | 13.79 | | | | | | 11.65 | | | | | | 0.27 | | | | | | 0.27 | | | | | | 0.27 | | | | | | 1.90 | | | | | | 4,195,761 | | | | | | 5 | | |
| 12-31-15 | | | | | 14.68 | | | | | | 0.26• | | | | | | (0.06) | | | | | | 0.20 | | | | | | 0.26 | | | | | | 1.28 | | | | | | — | | | | | | 1.54 | | | | | | — | | | | | | 13.34 | | | | | | 1.11 | | | | | | 0.26 | | | | | | 0.26 | | | | | | 0.26 | | | | | | 1.86 | | | | | | 4,149,051 | | | | | | 12 | | |
| Class P2 | | | | | | | | | | | | | | | | | | | | | | | | | | | | | | | | | | | | | | | | | | | | | | | | | | | | | | | | | | | | | | | | | | | | | | | | | | | | | | | | | | | | | | | | | | | | | | | | | | | | | | | |
| 12-31-19 | | | | | 13.93 | | | | | | 0.30• | | | | | | 3.98 | | | | | | 4.28 | | | | | | 0.26 | | | | | | 0.90 | | | | | | — | | | | | | 1.16 | | | | | | — | | | | | | 17.05 | | | | | | 31.27 | | | | | | 0.27 | | | | | | 0.15 | | | | | | 0.15 | | | | | | 1.86 | | | | | | 2,395,089 | | | | | | 9 | | |
| 12-31-18 | | | | | 15.71 | | | | | | 0.26 | | | | | | (0.89) | | | | | | (0.63) | | | | | | 0.27 | | | | | | 0.88 | | | | | | — | | | | | | 1.15 | | | | | | — | | | | | | 13.93 | | | | | | (4.55) | | | | | | 0.27 | | | | | | 0.15 | | | | | | 0.15 | | | | | | 1.80 | | | | | | 1,442,733 | | | | | | 12 | | |
05-03-17(5) -
12-31-17 | | | | | 14.79 | | | | | | 0.19• | | | | | | 1.72 | | | | | | 1.91 | | | | | | 0.27 | | | | | | 0.72 | | | | | | — | | | | | | 0.99 | | | | | | — | | | | | | 15.71 | | | | | | 13.39 | | | | | | 0.27 | | | | | | 0.15 | | | | | | 0.15 | | | | | | 1.92 | | | | | | 1,225,483 | | | | | | 6 | | |
See Accompanying Notes to Financial Statements
Financial Highlights (continued)
| | | | | | | | | | Income
(loss) from
investment
operations | | | | | | | | | Less
Distributions | | | | | | Ratios to average
net assets | | | Supplemental
Data | |
| | | | Net asset value, beginning of year
or period | | | Net investment income (loss) | | | Net realized and unrealized
gain (loss) | | | Total from investment operations | | | From net investment income | | | From net realized gains | | | From return of capital | | | Total distributions | | | Payment by affiliate | | | Net asset value, end of year
or period | | | Total Return(1) | | | Expenses before
reductions/additions(2)(3)(4) | | | Expenses net of fee waivers
and/or recoupments if any(2)(3)(4) | | | Expense net of all
reductions/additions(2)(3)(4) | | | Net investment income (loss)(2)(3) | | | Net assets, end of year or period | | | Portfolio turnover rate | |
Year or
period ended | | | ($) | | | ($) | | | ($) | | | ($) | | | ($) | | | ($) | | | ($) | | | ($) | | | ($) | | | ($) | | | (%) | | | (%) | | | (%) | | | (%) | | | (%) | | | ($000’s) | | | (%) | |
| Voya U.S. Stock Index Portfolio (continued) | | | | | | | | | | | | | | | | | | | | | | | | | | | | | | | | | | | | | | | | | | | | | | | | | | | | | | | | | | | | | | | | | | | | | | | | | | | | | | | | | | | | | | | | | | | | | | | | | | | | | | | |
| Class S | | | | | | | | | | | | | | | | | | | | | | | | | | | | | | | | | | | | | | | | | | | | | | | | | | | | | | | | | | | | | | | | | | | | | | | | | | | | | | | | | | | | | | | | | | | | | | | | | | | | | | | |
| 12-31-19 | | | | | 13.80 | | | | | | 0.23• | | | | | | 3.94 | | | | | | 4.17 | | | | | | 0.25 | | | | | | 0.90 | | | | | | — | | | | | | 1.15 | | | | | | — | | | | | | 16.82 | | | | | | 30.77 | | | | | | 0.52 | | | | | | 0.51 | | | | | | 0.51 | | | | | | 1.46 | | | | | | 283,768 | | | | | | 9 | | |
| 12-31-18 | | | | | 15.57 | | | | | | 0.22• | | | | | | (0.88) | | | | | | (0.66) | | | | | | 0.23 | | | | | | 0.88 | | | | | | — | | | | | | 1.11 | | | | | | — | | | | | | 13.80 | | | | | | (4.84) | | | | | | 0.52 | | | | | | 0.51 | | | | | | 0.51 | | | | | | 1.42 | | | | | | 47,740 | | | | | | 12 | | |
| 12-31-17 | | | | | 13.69 | | | | | | 0.21 | | | | | | 2.62 | | | | | | 2.83 | | | | | | 0.23 | | | | | | 0.72 | | | | | | — | | | | | | 0.95 | | | | | | — | | | | | | 15.57 | | | | | | 21.22 | | | | | | 0.52 | | | | | | 0.51 | | | | | | 0.51 | | | | | | 1.52 | | | | | | 78,577 | | | | | | 6 | | |
| 12-31-16 | | | | | 13.26 | | | | | | 0.22• | | | | | | 1.25 | | | | | | 1.47 | | | | | | 0.25 | | | | | | 0.79 | | | | | | — | | | | | | 1.04 | | | | | | — | | | | | | 13.69 | | | | | | 11.35 | | | | | | 0.52 | | | | | | 0.51 | | | | | | 0.51 | | | | | | 1.66 | | | | | | 61,754 | | | | | | 5 | | |
| 12-31-15 | | | | | 14.59 | | | | | | 0.23• | | | | | | (0.07) | | | | | | 0.16 | | | | | | 0.21 | | | | | | 1.28 | | | | | | — | | | | | | 1.49 | | | | | | — | | | | | | 13.26 | | | | | | 0.89 | | | | | | 0.51 | | | | | | 0.50 | | | | | | 0.50 | | | | | | 1.62 | | | | | | 50,470 | | | | | | 12 | | |
| Class S2 | | | | | | | | | | | | | | | | | | | | | | | | | | | | | | | | | | | | | | | | | | | | | | | | | | | | | | | | | | | | | | | | | | | | | | | | | | | | | | | | | | | | | | | | | | | | | | | | | | | | | | | |
| 12-31-19 | | | | | 13.62 | | | | | | 0.21• | | | | | | 3.88 | | | | | | 4.09 | | | | | | 0.19 | | | | | | 0.90 | | | | | | — | | | | | | 1.09 | | | | | | — | | | | | | 16.62 | | | | | | 30.60 | | | | | | 0.67 | | | | | | 0.67 | | | | | | 0.67 | | | | | | 1.35 | | | | | | 149,297 | | | | | | 9 | | |
| 12-31-18 | | | | | 15.39 | | | | | | 0.20• | | | | | | (0.88) | | | | | | (0.68) | | | | | | 0.21 | | | | | | 0.88 | | | | | | — | | | | | | 1.09 | | | | | | — | | | | | | 13.62 | | | | | | (5.03) | | | | | | 0.67 | | | | | | 0.67 | | | | | | 0.67 | | | | | | 1.27 | | | | | | 150,127 | | | | | | 12 | | |
| 12-31-17 | | | | | 13.54 | | | | | | 0.21 | | | | | | 2.56 | | | | | | 2.77 | | | | | | 0.20 | | | | | | 0.72 | | | | | | — | | | | | | 0.92 | | | | | | — | | | | | | 15.39 | | | | | | 21.03 | | | | | | 0.67 | | | | | | 0.67 | | | | | | 0.67 | | | | | | 1.35 | | | | | | 189,330 | | | | | | 6 | | |
| 12-31-16 | | | | | 13.12 | | | | | | 0.21 | | | | | | 1.22 | | | | | | 1.43 | | | | | | 0.22 | | | | | | 0.79 | | | | | | — | | | | | | 1.01 | | | | | | — | | | | | | 13.54 | | | | | | 11.19 | | | | | | 0.70 | | | | | | 0.67 | | | | | | 0.67 | | | | | | 1.50 | | | | | | 175,340 | | | | | | 5 | | |
| 12-31-15 | | | | | 14.46 | | | | | | 0.20• | | | | | | (0.06) | | | | | | 0.14 | | | | | | 0.20 | | | | | | 1.28 | | | | | | — | | | | | | 1.48 | | | | | | — | | | | | | 13.12 | | | | | | 0.75 | | | | | | 0.76 | | | | | | 0.66 | | | | | | 0.66 | | | | | | 1.46 | | | | | | 182,682 | | | | | | 12 | | |
VY® Clarion Real Estate Portfolio | | | | | | | | | | | | | | | | | | | | | | | | | | | | | | | | | | | | | | | | | | | | | | | | | | | | | | | | | | | | | | | | | | | | | | | | | | | | | | | | | | | | | | | | | | | | | | | | | | | | | | | |
| Class ADV | | | | | | | | | | | | | | | | | | | | | | | | | | | | | | | | | | | | | | | | | | | | | | | | | | | | | | | | | | | | | | | | | | | | | | | | | | | | | | | | | | | | | | | | | | | | | | | | | | | | | | | |
| 12-31-19 | | | | | 29.16 | | | | | | 0.51• | | | | | | 7.53 | | | | | | 8.04 | | | | | | 0.63 | | | | | | 0.18 | | | | | | — | | | | | | 0.81 | | | | | | — | | | | | | 36.39 | | | | | | 27.71 | | | | | | 1.46 | | | | | | 1.31 | | | | | | 1.31 | | | | | | 1.49 | | | | | | 63,873 | | | | | | 69 | | |
| 12-31-18 | | | | | 36.01 | | | | | | 0.49• | | | | | | (3.01) | | | | | | (2.52) | | | | | | 0.83 | | | | | | 3.50 | | | | | | — | | | | | | 4.33 | | | | | | — | | | | | | 29.16 | | | | | | (7.97) | | | | | | 1.47 | | | | | | 1.31 | | | | | | 1.31 | | | | | | 1.50 | | | | | | 56,062 | | | | | | 103 | | |
| 12-31-17 | | | | | 35.00 | | | | | | 0.53• | | | | | | 1.14 | | | | | | 1.67 | | | | | | 0.66 | | | | | | — | | | | | | — | | | | | | 0.66 | | | | | | — | | | | | | 36.01 | | | | | | 4.82 | | | | | | 1.45 | | | | | | 1.31 | | | | | | 1.31 | | | | | | 1.50 | | | | | | 75,575 | | | | | | 82 | | |
| 12-31-16 | | | | | 34.11 | | | | | | 0.47• | | | | | | 0.88 | | | | | | 1.35 | | | | | | 0.46 | | | | | | — | | | | | | — | | | | | | 0.46 | | | | | | — | | | | | | 35.00 | | | | | | 3.86 | | | | | | 1.49 | | | | | | 1.31 | | | | | | 1.31 | | | | | | 1.33 | | | | | | 90,084 | | | | | | 43 | | |
| 12-31-15 | | | | | 33.65 | | | | | | 0.36• | | | | | | 0.49 | | | | | | 0.85 | | | | | | 0.39 | | | | | | — | | | | | | — | | | | | | 0.39 | | | | | | — | | | | | | 34.11 | | | | | | 2.58 | | | | | | 1.59 | | | | | | 1.31 | | | | | | 1.31 | | | | | | 1.08 | | | | | | 90,056 | | | | | | 41 | | |
| Class I | | | | | | | | | | | | | | | | | | | | | | | | | | | | | | | | | | | | | | | | | | | | | | | | | | | | | | | | | | | | | | | | | | | | | | | | | | | | | | | | | | | | | | | | | | | | | | | | | | | | | | | |
| 12-31-19 | | | | | 30.72 | | | | | | 0.68• | | | | | | 8.01 | | | | | | 8.69 | | | | | | 0.85 | | | | | | 0.18 | | | | | | — | | | | | | 1.03 | | | | | | — | | | | | | 38.38 | | | | | | 28.47 | | | | | | 0.86 | | | | | | 0.71 | | | | | | 0.71 | | | | | | 1.88 | | | | | | 24,412 | | | | | | 69 | | |
| 12-31-18 | | | | | 37.76 | | | | | | 0.71• | | | | | | (3.15) | | | | | | (2.44) | | | | | | 1.10 | | | | | | 3.50 | | | | | | — | | | | | | 4.60 | | | | | | — | | | | | | 30.72 | | | | | | (7.42) | | | | | | 0.87 | | | | | | 0.71 | | | | | | 0.71 | | | | | | 2.05 | | | | | | 38,978 | | | | | | 103 | | |
| 12-31-17 | | | | | 36.68 | | | | | | 0.79• | | | | | | 1.19 | | | | | | 1.98 | | | | | | 0.90 | | | | | | — | | | | | | — | | | | | | 0.90 | | | | | | — | | | | | | 37.76 | | | | | | 5.47 | | | | | | 0.85 | | | | | | 0.71 | | | | | | 0.71 | | | | | | 2.14 | | | | | | 100,423 | | | | | | 82 | | |
| 12-31-16 | | | | | 35.71 | | | | | | 0.72• | | | | | | 0.92 | | | | | | 1.64 | | | | | | 0.67 | | | | | | — | | | | | | — | | | | | | 0.67 | | | | | | — | | | | | | 36.68 | | | | | | 4.47 | | | | | | 0.84 | | | | | | 0.71 | | | | | | 0.71 | | | | | | 1.96 | | | | | | 105,754 | | | | | | 43 | | |
| 12-31-15 | | | | | 35.17 | | | | | | 0.58• | | | | | | 0.52 | | | | | | 1.10 | | | | | | 0.56 | | | | | | — | | | | | | — | | | | | | 0.56 | | | | | | — | | | | | | 35.71 | | | | | | 3.20 | | | | | | 0.84 | | | | | | 0.71 | | | | | | 0.71 | | | | | | 1.65 | | | | | | 128,447 | | | | | | 41 | | |
| Class S | | | | | | | | | | | | | | | | | | | | | | | | | | | | | | | | | | | | | | | | | | | | | | | | | | | | | | | | | | | | | | | | | | | | | | | | | | | | | | | | | | | | | | | | | | | | | | | | | | | | | | | |
| 12-31-19 | | | | | 30.67 | | | | | | 0.66• | | | | | | 7.93 | | | | | | 8.59 | | | | | | 0.76 | | | | | | 0.18 | | | | | | — | | | | | | 0.94 | | | | | | — | | | | | | 38.32 | | | | | | 28.15 | | | | | | 1.11 | | | | | | 0.96 | | | | | | 0.96 | | | | | | 1.82 | | | | | | 230,346 | | | | | | 69 | | |
| 12-31-18 | | | | | 37.67 | | | | | | 0.63• | | | | | | (3.16) | | | | | | (2.53) | | | | | | 0.97 | | | | | | 3.50 | | | | | | — | | | | | | 4.47 | | | | | | — | | | | | | 30.67 | | | | | | (7.65) | | | | | | 1.12 | | | | | | 0.96 | | | | | | 0.96 | | | | | | 1.85 | | | | | | 212,673 | | | | | | 103 | | |
| 12-31-17 | | | | | 36.58 | | | | | | 0.68• | | | | | | 1.19 | | | | | | 1.87 | | | | | | 0.78 | | | | | | — | | | | | | — | | | | | | 0.78 | | | | | | — | | | | | | 37.67 | | | | | | 5.18 | | | | | | 1.10 | | | | | | 0.96 | | | | | | 0.96 | | | | | | 1.83 | | | | | | 290,716 | | | | | | 82 | | |
| 12-31-16 | | | | | 35.60 | | | | | | 0.61• | | | | | | 0.94 | | | | | | 1.55 | | | | | | 0.57 | | | | | | — | | | | | | — | | | | | | 0.57 | | | | | | — | | | | | | 36.58 | | | | | | 4.24 | | | | | | 1.09 | | | | | | 0.96 | | | | | | 0.96 | | | | | | 1.66 | | | | | | 375,761 | | | | | | 43 | | |
| 12-31-15 | | | | | 35.06 | | | | | | 0.48• | | | | | | 0.53 | | | | | | 1.01 | | | | | | 0.47 | | | | | | — | | | | | | — | | | | | | 0.47 | | | | | | — | | | | | | 35.60 | | | | | | 2.95 | | | | | | 1.09 | | | | | | 0.96 | | | | | | 0.96 | | | | | | 1.38 | | | | | | 430,712 | | | | | | 41 | | |
| Class S2 | | | | | | | | | | | | | | | | | | | | | | | | | | | | | | | | | | | | | | | | | | | | | | | | | | | | | | | | | | | | | ��� | | | | | | | | | | | | | | | | | | | | | | | | | | | | | | | | | | | | | | | | | | |
| 12-31-19 | | | | | 30.47 | | | | | | 0.60• | | | | | | 7.88 | | | | | | 8.48 | | | | | | 0.70 | | | | | | 0.18 | | | | | | — | | | | | | 0.88 | | | | | | — | | | | | | 38.07 | | | | | | 27.97 | | | | | | 1.26 | | | | | | 1.11 | | | | | | 1.11 | | | | | | 1.67 | | | | | | 15,394 | | | | | | 69 | | |
| 12-31-18 | | | | | 37.44 | | | | | | 0.58• | | | | | | (3.14) | | | | | | (2.56) | | | | | | 0.91 | | | | | | 3.50 | | | | | | — | | | | | | 4.41 | | | | | | — | | | | | | 30.47 | | | | | | (7.78) | | | | | | 1.27 | | | | | | 1.11 | | | | | | 1.11 | | | | | | 1.71 | | | | | | 13,745 | | | | | | 103 | | |
| 12-31-17 | | | | | 36.35 | | | | | | 0.62• | | | | | | 1.18 | | | | | | 1.80 | | | | | | 0.71 | | | | | | — | | | | | | — | | | | | | 0.71 | | | | | | — | | | | | | 37.44 | | | | | | 5.02 | | | | | | 1.25 | | | | | | 1.11 | | | | | | 1.11 | | | | | | 1.68 | | | | | | 17,937 | | | | | | 82 | | |
| 12-31-16 | | | | | 35.39 | | | | | | 0.55• | | | | | | 0.93 | | | | | | 1.48 | | | | | | 0.52 | | | | | | — | | | | | | — | | | | | | 0.52 | | | | | | — | | | | | | 36.35 | | | | | | 4.07 | | | | | | 1.27 | | | | | | 1.11 | | | | | | 1.11 | | | | | | 1.52 | | | | | | 22,911 | | | | | | 43 | | |
| 12-31-15 | | | | | 34.85 | | | | | | 0.44• | | | | | | 0.51 | | | | | | 0.95 | | | | | | 0.41 | | | | | | — | | | | | | — | | | | | | 0.41 | | | | | | — | | | | | | 35.39 | | | | | | 2.79 | | | | | | 1.34 | | | | | | 1.11 | | | | | | 1.11 | | | | | | 1.26 | | | | | | 26,084 | | | | | | 41 | | |
See Accompanying Notes to Financial Statements
Financial Highlights (continued)
| | | | | | | | | | Income
(loss) from
investment
operations | | | | | | | | | Less
Distributions | | | | | | Ratios to average
net assets | | | Supplemental
Data | |
| | | | Net asset value, beginning of year
or period | | | Net investment income (loss) | | | Net realized and unrealized
gain (loss) | | | Total from investment operations | | | From net investment income | | | From net realized gains | | | From return of capital | | | Total distributions | | | Payment by affiliate | | | Net asset value, end of year
or period | | | Total Return(1) | | | Expenses before
reductions/additions(2)(3)(4) | | | Expenses net of fee waivers
and/or recoupments if any(2)(3)(4) | | | Expense net of all
reductions/additions(2)(3)(4) | | | Net investment income (loss)(2)(3) | | | Net assets, end of year or period | | | Portfolio turnover rate | |
Year or
period ended | | | ($) | | | ($) | | | ($) | | | ($) | | | ($) | | | ($) | | | ($) | | | ($) | | | ($) | | | ($) | | | (%) | | | (%) | | | (%) | | | (%) | | | (%) | | | ($000’s) | | | (%) | |
VY® JPMorgan Small Cap Core Equity Portfolio | | | | | | | | | | | | | | | | | | | | | | | | | | | | | | | | | | | | | | | | | | | | | | | | | | | | | | | | | | | | | | | | | | | | | | | | | | | | | | | | | | | | | | | | | | | | | | | | | | | | | | | |
| Class ADV | | | | | | | | | | | | | | | | | | | | | | | | | | | | | | | | | | | | | | | | | | | | | | | | | | | | | | | | | | | | | | | | | | | | | | | | | | | | | | | | | | | | | | | | | | | | | | | | | | | | | | | |
| 12-31-19 | | | | | 15.79 | | | | | | 0.00* | | | | | | 3.92 | | | | | | 3.92 | | | | | | 0.03 | | | | | | 4.55 | | | | | | 0.23 | | | | | | 4.81 | | | | | | — | | | | | | 14.90 | | | | | | 25.96 | | | | | | 1.45 | | | | | | 1.45 | | | | | | 1.44 | | | | | | 0.05 | | | | | | 130,058 | | | | | | 50 | | |
| 12-31-18 | | | | | 20.12 | | | | | | (0.02) | | | | | | (1.67) | | | | | | (1.69) | | | | | | 0.02 | | | | | | 2.62 | | | | | | — | | | | | | 2.64 | | | | | | — | | | | | | 15.79 | | | | | | (10.82) | | | | | | 1.45 | | | | | | 1.45 | | | | | | 1.45 | | | | | | (0.07) | | | | | | 114,664 | | | | | | 43 | | |
| 12-31-17 | | | | | 18.54 | | | | | | 0.01 | | | | | | 2.71 | | | | | | 2.72 | | | | | | 0.04 | | | | | | 1.10 | | | | | | — | | | | | | 1.14 | | | | | | — | | | | | | 20.12 | | | | | | 15.17 | | | | | | 1.45 | | | | | | 1.45 | | | | | | 1.45 | | | | | | 0.03 | | | | | | 131,488 | | | | | | 36 | | |
| 12-31-16 | | | | | 16.82 | | | | | | 0.03 | | | | | | 3.33 | | | | | | 3.36 | | | | | | 0.04 | | | | | | 1.60 | | | | | | — | | | | | | 1.64 | | | | | | — | | | | | | 18.54 | | | | | | 21.17 | | | | | | 1.50 | | | | | | 1.45 | | | | | | 1.45 | | | | | | 0.17 | | | | | | 120,442 | | | | | | 40 | | |
| 12-31-15 | | | | | 19.83 | | | | | | 0.01 | | | | | | (0.58) | | | | | | (0.57) | | | | | | — | | | | | | 2.44 | | | | | | — | | | | | | 2.44 | | | | | | — | | | | | | 16.82 | | | | | | (4.02) | | | | | | 1.60 | | | | | | 1.45 | | | | | | 1.45 | | | | | | 0.12 | | | | | | 105,259 | | | | | | 38 | | |
| Class I | | | | | | | | | | | | | | | | | | | | | | | | | | | | | | | | | | | | | | | | | | | | | | | | | | | | | | | | | | | | | | | | | | | | | | | | | | | | | | | | | | | | | | | | | | | | | | | | | | | | | | | |
| 12-31-19 | | | | | 16.89 | | | | | | 0.12 | | | | | | 4.20 | | | | | | 4.32 | | | | | | 0.22 | | | | | | 4.55 | | | | | | 0.23 | | | | | | 5.00 | | | | | | — | | | | | | 16.21 | | | | | | 26.75 | | | | | | 0.85 | | | | | | 0.85 | | | | | | 0.84 | | | | | | 0.66 | | | | | | 240,957 | | | | | | 50 | | |
| 12-31-18 | | | | | 21.35 | | | | | | 0.11 | | | | | | (1.81) | | | | | | (1.70) | | | | | | 0.14 | | | | | | 2.62 | | | | | | — | | | | | | 2.76 | | | | | | — | | | | | | 16.89 | | | | | | (10.34) | | | | | | 0.85 | | | | | | 0.85 | | | | | | 0.85 | | | | | | 0.53 | | | | | | 165,568 | | | | | | 43 | | |
| 12-31-17 | | | | | 19.59 | | | | | | 0.13 | | | | | | 2.88 | | | | | | 3.01 | | | | | | 0.15 | | | | | | 1.10 | | | | | | — | | | | | | 1.25 | | | | | | — | | | | | | 21.35 | | | | | | 15.86 | | | | | | 0.85 | | | | | | 0.85 | | | | | | 0.85 | | | | | | 0.62 | | | | | | 188,213 | | | | | | 36 | | |
| 12-31-16 | | | | | 17.68 | | | | | | 0.14 | | | | | | 3.52 | | | | | | 3.66 | | | | | | 0.15 | | | | | | 1.60 | | | | | | — | | | | | | 1.75 | | | | | | — | | | | | | 19.59 | | | | | | 21.92 | | | | | | 0.85 | | | | | | 0.85 | | | | | | 0.85 | | | | | | 0.77 | | | | | | 178,586 | | | | | | 40 | | |
| 12-31-15 | | | | | 20.70 | | | | | | 0.14 | | | | | | (0.62) | | | | | | (0.48) | | | | | | 0.10 | | | | | | 2.44 | | | | | | — | | | | | | 2.54 | | | | | | — | | | | | | 17.68 | | | | | | (3.45) | | | | | | 0.85 | | | | | | 0.85 | | | | | | 0.85 | | | | | | 0.72 | | | | | | 159,243 | | | | | | 38 | | |
| Class R6 | | | | | | | | | | | | | | | | | | | | | | | | | | | | | | | | | | | | | | | | | | | | | | | | | | | | | | | | | | | | | | | | | | | | | | | | | | | | | | | | | | | | | | | | | | | | | | | | | | | | | | | |
| 12-31-19 | | | | | 16.88 | | | | | | 0.12 | | | | | | 4.20 | | | | | | 4.32 | | | | | | 0.22 | | | | | | 4.55 | | | | | | 0.23 | | | | | | 5.00 | | | | | | — | | | | | | 16.20 | | | | | | 26.78 | | | | | | 0.85 | | | | | | 0.85 | | | | | | 0.84 | | | | | | 0.66 | | | | | | 38,161 | | | | | | 50 | | |
| 12-31-18 | | | | | 21.34 | | | | | | 0.09 | | | | | | (1.79) | | | | | | (1.70) | | | | | | 0.14 | | | | | | 2.62 | | | | | | — | | | | | | 2.76 | | | | | | — | | | | | | 16.88 | | | | | | (10.34) | | | | | | 0.85 | | | | | | 0.85 | | | | | | 0.85 | | | | | | 0.55 | | | | | | 23,951 | | | | | | 43 | | |
| 12-31-17 | | | | | 19.58 | | | | | | 0.15• | | | | | | 2.86 | | | | �� | | 3.01 | | | | | | 0.15 | | | | | | 1.10 | | | | | | — | | | | | | 1.25 | | | | | | — | | | | | | 21.34 | | | | | | 15.87 | | | | | | 0.85 | | | | | | 0.85 | | | | | | 0.85 | | | | | | 0.73 | | | | | | 17,009 | | | | | | 36 | | |
05-03-16(5) -
12-31-16 | | | | | 17.80 | | | | | | 0.15 | | | | | | 3.38 | | | | | | 3.53 | | | | | | 0.15 | | | | | | 1.60 | | | | | | — | | | | | | 1.75 | | | | | | — | | | | | | 19.58 | | | | | | 21.04 | | | | | | 0.85 | | | | | | 0.85 | | | | | | 0.85 | | | | | | 1.22 | | | | | | 30 | | | | | | 40 | | |
| Class S | | | | | | | | | | | | | | | | | | | | | | | | | | | | | | | | | | | | | | | | | | | | | | | | | | | | | | | | | | | | | | | | | | | | | | | | | | | | | | | | | | | | | | | | | | | | | | | | | | | | | | | |
| 12-31-19 | | | | | 16.65 | | | | | | 0.07 | | | | | | 4.14 | | | | | | 4.21 | | | | | | 0.13 | | | | | | 4.55 | | | | | | 0.23 | | | | | | 4.91 | | | | | | — | | | | | | 15.95 | | | | | | 26.39 | | | | | | 1.10 | | | | | | 1.10 | | | | | | 1.09 | | | | | | 0.37 | | | | | | 129,784 | | | | | | 50 | | |
| 12-31-18 | | | | | 21.07 | | | | | | 0.06 | | | | | | (1.78) | | | | | | (1.72) | | | | | | 0.08 | | | | | | 2.62 | | | | | | — | | | | | | 2.70 | | | | | | — | | | | | | 16.65 | | | | | | (10.52) | | | | | | 1.10 | | | | | | 1.10 | | | | | | 1.10 | | | | | | 0.28 | | | | | | 327,752 | | | | | | 43 | | |
| 12-31-17 | | | | | 19.35 | | | | | | 0.07• | | | | | | 2.85 | | | | | | 2.92 | | | | | | 0.10 | | | | | | 1.10 | | | | | | — | | | | | | 1.20 | | | | | | — | | | | | | 21.07 | | | | | | 15.56 | | | | | | 1.10 | | | | | | 1.10 | | | | | | 1.10 | | | | | | 0.37 | | | | | | 385,636 | | | | | | 36 | | |
| 12-31-16 | | | | | 17.48 | | | | | | 0.10 | | | | | | 3.46 | | | | | | 3.56 | | | | | | 0.09 | | | | | | 1.60 | | | | | | — | | | | | | 1.69 | | | | | | — | | | | | | 19.35 | | | | | | 21.59 | | | | | | 1.10 | | | | | | 1.10 | | | | | | 1.10 | | | | | | 0.52 | | | | | | 436,518 | | | | | | 40 | | |
| 12-31-15 | | | | | 20.49 | | | | | | 0.09 | | | | | | (0.62) | | | | | | (0.53) | | | | | | 0.04 | | | | | | 2.44 | | | | | | — | | | | | | 2.48 | | | | | | — | | | | | | 17.48 | | | | | | (3.68) | | | | | | 1.10 | | | | | | 1.10 | | | | | | 1.10 | | | | | | 0.47 | | | | | | 404,369 | | | | | | 38 | | |
| Class S2 | | | | | | | | | | | | | | | | | | | | | | | | | | | | | | | | | | | | | | | | | | | | | | | | | | | | | | | | | | | | | | | | | | | | | | | | | | | | | | | | | | | | | | | | | | | | | | | | | | | | | | | |
| 12-31-19 | | | | | 16.46 | | | | | | 0.04• | | | | | | 4.09 | | | | | | 4.13 | | | | | | 0.07 | | | | | | 4.55 | | | | | | 0.23 | | | | | | 4.85 | | | | | | — | | | | | | 15.74 | | | | | | 26.20 | | | | | | 1.25 | | | | | | 1.25 | | | | | | 1.24 | | | | | | 0.22 | | | | | | 9,014 | | | | | | 50 | | |
| 12-31-18 | | | | | 20.85 | | | | | | 0.03 | | | | | | (1.76) | | | | | | (1.73) | | | | | | 0.04 | | | | | | 2.62 | | | | | | — | | | | | | 2.66 | | | | | | — | | | | | | 16.46 | | | | | | (10.64) | | | | | | 1.25 | | | | | | 1.25 | | | | | | 1.25 | | | | | | 0.13 | | | | | | 27,453 | | | | | | 43 | | |
| 12-31-17 | | | | | 19.15 | | | | | | 0.04• | | | | | | 2.82 | | | | | | 2.86 | | | | | | 0.06 | | | | | | 1.10 | | | | | | — | | | | | | 1.16 | | | | | | — | | | | | | 20.85 | | | | | | 15.42 | | | | | | 1.25 | | | | | | 1.25 | | | | | | 1.25 | | | | | | 0.22 | | | | | | 35,440 | | | | | | 36 | | |
| 12-31-16 | | | | | 17.31 | | | | | | 0.06• | | | | | | 3.44 | | | | | | 3.50 | | | | | | 0.06 | | | | | | 1.60 | | | | | | — | | | | | | 1.66 | | | | | | — | | | | | | 19.15 | | | | | | 21.39 | | | | | | 1.28 | | | | | | 1.25 | | | | | | 1.25 | | | | | | 0.37 | | | | | | 39,721 | | | | | | 40 | | |
| 12-31-15 | | | | | 20.32 | | | | | | 0.06 | | | | | | (0.62) | | | | | | (0.56) | | | | | | 0.01 | | | | | | 2.44 | | | | | | — | | | | | | 2.45 | | | | | | — | | | | | | 17.31 | | | | | | (3.87) | | | | | | 1.35 | | | | | | 1.25 | | | | | | 1.25 | | | | | | 0.33 | | | | | | 40,756 | | | | | | 38 | | |
(1)
Total return is calculated assuming reinvestment of all dividends, capital gain distributions and return of capital distributions, if any, at net asset value and does not reflect the effect of insurance contract charges. Total return for periods less than one year is not annualized.
(2)
Annualized for periods less than one year.
(3)
Ratios reflect operating expenses of a Portfolio. Expenses before reductions/additions do not reflect amounts reimbursed or recouped by the Investment Adviser and/or Distributor or reductions from brokerage service arrangements or other expense offset arrangements and do not represent the amount paid by a Portfolio during periods when reimbursements or reductions occur. Expenses net of fee waivers reflect expenses after reimbursement by the Investment Adviser and/or Distributor or recoupment of previously reimbursed fees by the Investment Adviser, but prior to reductions from brokerage service arrangements or other expense offset arrangements. Expenses net of all reductions/additions represent the net expenses paid by a Portfolio. Net investment income (loss) is net of all such additions or reductions.
(4)
Ratios do not include fees and expenses charged under the variable annuity contract or variable life insurance policy.
See Accompanying Notes to Financial Statements
Financial Highlights (continued)
(5)
Commencement of operations.
(a)
Excluding amounts related to a securities lending settlement recorded in the year ended December 31, 2018, total return for Voya Large Cap Value Portfolio would have been (8.34)%, (7.82)%, (7.75)%, (8.01)% and (8.13)% for Classes ADV, I, R6, S and S2, respectively.
(b)
Excluding amounts related to a securities lending settlement recorded in the year ended December 31, 2018, Voya Large Cap Value Portfolio’s Net Investment Income Ratios would have been 1.40%, 2.00%, 2.02%, 1.75% and 1.59% for Classes ADV, I, R6, S and S2, respectively.
•
Calculated using average number of shares outstanding throughout the year or period.
*
Amount is less than $0.005 or 0.005% or more than $(0.005) or (0.005)%.
See Accompanying Notes to Financial Statements
NOTES TO FINANCIAL STATEMENTS as of December 31, 2019
NOTE 1 — ORGANIZATION
Voya Investors Trust (the “Trust”) is registered under the Investment Company Act of 1940, as amended (the “1940 Act” or the “Act”), as an open-end management investment company. The Trust was organized as a Massachusetts business trust on August 3, 1988. The Trust consists of twenty-two active separate investment series. The eight series (each a “Portfolio” and collectively the “Portfolios”) included in this report are: Voya Balanced Income Portfolio (“Balanced Income”), Voya High Yield Portfolio (“High Yield”), Voya Large Cap Growth Portfolio (“Large Cap Growth”), Voya Large Cap Value Portfolio (“Large Cap Value”), Voya Limited Maturity Bond Portfolio (“Limited Maturity Bond”), Voya U.S. Stock Index Portfolio (“U.S. Stock Index”), VY® Clarion Real Estate Portfolio (“Clarion Real Estate”), and VY® JPMorgan Small Cap Core Equity Portfolio (“JPMorgan Small Cap Core Equity”), each a diversified series of the Trust. The investment objective of the Portfolios is described in the respective Portfolio’s Prospectus. Prior to May 1, 2019, Balanced Income was known as VY® Franklin Income Portfolio.
The classes of shares included in this report are: Adviser (“Class ADV”), Institutional (“Class I”), Class P2, Class R6, Service (“Class S”) and Service 2 (“Class S2”); however, each Portfolio may not offer all share classes. With the exception of class specific matters, each class has equal voting rights as to voting privileges. For class specific proposals, only the applicable class would have voting privileges. The classes differ principally in the applicable distribution and shareholder service fees. Generally, shareholders of each class also bear certain expenses that pertain to that particular class. All shareholders are allocated the common expenses of a portfolio and earn income and realized gains/losses from a portfolio pro rata based on the daily ending net assets of each class, without distinction between share classes. Expenses that are specific to a portfolio or a class are charged directly to that portfolio or class. Other operating expenses shared by several portfolios are generally allocated among those portfolios based on average net assets. Distributions are determined separately for each class based on income and expenses allocated to each class. Realized gain distributions are allocated to each class pro rata based on the shares outstanding of each class on the date of distribution. Differences in per share dividend rates generally result from differences in separate class expenses, including distribution and shareholder service fees, if applicable.
Voya Investments, LLC (“Voya Investments” or the “Investment Adviser”), an Arizona limited liability company, serves as the Investment Adviser to the Portfolios. Voya Investment Management Co. LLC (“Voya IM”), a Delaware
limited liability company, serves as the sub-adviser to Balanced Income (as of May 1, 2019), High Yield, Large Cap Growth, Large Cap Value, Limited Maturity Bond, and U.S. Stock Index. Voya Investments Distributor, LLC (“VID” or the “Distributor”), a Delaware limited liability company, serves as the principal underwriter to the Portfolios.
NOTE 2 — SIGNIFICANT ACCOUNTING POLICIES
The following significant accounting policies are consistently followed by the Portfolios in the preparation of their financial statements. Each Portfolio is considered an investment company under U.S. generally accepted accounting principles (“GAAP”) and follows the accounting and reporting guidance applicable to investment companies.
A. Security Valuation. Each Portfolio is open for business every day the New York Stock Exchange (“NYSE”) opens for regular trading (each such day, a “Business Day”). The net asset value (“NAV”) per share for each class of each Portfolio is determined each Business Day as of the close of the regular trading session (“Market Close”), as determined by the Consolidated Tape Association (“CTA”), the central distributor of transaction prices for exchange-traded securities (normally 4:00 p.m. Eastern time unless otherwise designated by the CTA). The data reflected on the consolidated tape provided by the CTA is generated by various market centers, including all securities exchanges, electronic communications networks, and third-market broker-dealers. The NAV per share of each class of each Portfolio is calculated by taking the value of the Portfolio’s assets attributable to that class, subtracting the Portfolio’s liabilities attributable to that class, and dividing by the number of shares of that class that are outstanding. On days when a Portfolio is closed for business, Portfolio shares will not be priced and a Portfolio does not transact purchase and redemption orders. To the extent a Portfolio’s assets are traded in other markets on days when a Portfolio does not price its shares, the value of a Portfolio’s assets will likely change and you will not be able to purchase or redeem shares of a Portfolio.
Assets for which market quotations are readily available are valued at market value. A security listed or traded on an exchange is valued at its last sales price or official closing price as of the close of the regular trading session on the exchange where the security is principally traded or, if such price is not available, at the last sale price as of the Market Close for such security provided by the CTA. Bank loans are valued at the average of the averages of the bid and ask prices provided to an independent loan pricing service by brokers. Futures contracts are valued at the final settlement price set by an exchange on which they are
NOTES TO FINANCIAL STATEMENTS as of December 31, 2019 (continued)
NOTE 2 — SIGNIFICANT ACCOUNTING POLICIES (continued)
principally traded. Listed options are valued at the mean between the last bid and ask prices from the exchange on which they are principally traded. Investments in open-end registered investment companies that do not trade on an exchange are valued at the end of day NAV per share. Investments in registered investment companies that trade on an exchange are valued at the last sales price or official closing price as of the close of the regular trading session on the exchange where the security is principally traded.
When a market quotation is not readily available or is deemed unreliable, each Portfolio will determine a fair value for the relevant asset in accordance with procedures adopted by the Portfolios’ Board of Trustees (“Board”). Such procedures provide, for example, that: (a) Exchange-traded securities are valued at the mean of the closing bid and ask; (b) Debt obligations are valued using an evaluated price provided by an independent pricing service. Evaluated prices provided by the pricing service may be determined without exclusive reliance on quoted prices, and may reflect factors such as institution-size trading in similar groups of securities, developments related to specific securities, benchmark yield, quality, type of issue, coupon rate, maturity, individual trading characteristics and other market data; (c) Securities traded in the over-the-counter (“OTC”) market are valued based on prices provided by independent pricing services or market makers; (d) Options not listed on an exchange are valued by an independent source using an industry accepted model, such as Black-Scholes; (e) Centrally cleared swap agreements are valued using a price provided by the central counterparty clearinghouse; (f) OTC swap agreements are valued using a price provided by an independent pricing service; (g) Forward foreign currency exchange contracts are valued utilizing current and forward rates obtained from an independent pricing service. Such prices from the third party pricing service are for specific settlement periods and each Portfolio’s forward foreign currency exchange contracts are valued at an interpolated rate between the closest preceding and subsequent period reported by the independent pricing service; and (h) Securities for which market prices are not provided by any of the above methods may be valued based upon quotes furnished by brokers.
The prospectuses of the open-end registered investment companies in which each Portfolio may invest explain the circumstances under which they will use fair value pricing and the effects of using fair value pricing.
Foreign securities’ (including forward foreign currency exchange contracts) prices are converted into U.S. dollar
amounts using the applicable exchange rates as of Market Close. If market quotations are available and believed to be reliable for foreign exchange-traded equity securities, the securities will be valued at the market quotations. Because trading hours for certain foreign securities end before Market Close, closing market quotations may become unreliable. An independent pricing service determines the degree of certainty, based on historical data, that the closing price in the principal market where a foreign security trades is not the current value as of Market Close. Foreign securities’ prices meeting the approved degree of certainty that the price is not reflective of current value will be valued by the independent pricing service using pricing models designed to estimate likely changes in the values of those securities between the times in which the trading in those securities is substantially completed and Market Close. Multiple factors may be considered by the independent pricing service in determining the value of such securities and may include information relating to sector indices, American Depositary Receipts and domestic and foreign index futures.
All other assets for which market quotations are not readily available or became unreliable (or if the above fair valuation methods are unavailable or determined to be unreliable) are valued at fair value as determined in good faith by or under the supervision of the Board following procedures approved by the Board. The Board has delegated to the Investment Adviser responsibility for overseeing the implementation of the Portfolios’ valuation procedures; a “Pricing Committee” comprised of employees of the Investment Adviser or its affiliates has responsibility for applying the fair valuation methods set forth in the procedures and, if a fair valuation cannot be determined pursuant to the fair valuation methods, determining the fair value of assets held by the Portfolios. Issuer specific events, transaction price, position size, nature and duration of restrictions on disposition of the security, market trends, bid/ask quotes of brokers and other market data may be reviewed in the course of making a good faith determination of a security’s fair value. Valuations change in response to many factors including the historical and prospective earnings of the issuer, the value of the issuer’s assets, general economic conditions, interest rates, investor perceptions and market liquidity. Because of the inherent uncertainties of fair valuation, the values used to determine each Portfolio’s NAV may materially differ from the value received upon actual sale of those investments. Thus, fair valuation may have an unintended dilutive or accretive effect on the value of shareholders’ investments in each Portfolio.
Each investment asset or liability of the Portfolios is assigned a level at measurement date based on the significance and source of the inputs to its valuation.
NOTES TO FINANCIAL STATEMENTS as of December 31, 2019 (continued)
NOTE 2 — SIGNIFICANT ACCOUNTING POLICIES (continued)
Quoted prices in active markets for identical securities are classified as “Level 1,” inputs other than quoted prices for an asset or liability that are observable are classified as “Level 2” and significant unobservable inputs, including the sub-advisers’ or Pricing Committee’s judgment about the assumptions that a market participant would use in pricing an asset or liability are classified as “Level 3.” The inputs used for valuing securities are not necessarily an indication of the risks associated with investing in those securities. Short-term securities of sufficient credit quality are generally considered to be Level 2 securities under applicable accounting rules. A table summarizing the Portfolios’ investments under these levels of classification is included within the Portfolio of Investments.
GAAP requires a reconciliation of the beginning to ending balances for reported fair values that presents changes attributable to total realized and unrealized gains or losses, purchases and sales, and transfers in or out of the Level 3 category during the period. A reconciliation of Level 3 investments within the Portfolio of Investments is presented only when a Portfolio has a significant amount of Level 3 investments.
B. Securities Transactions and Revenue Recognition. Securities transactions are accounted for on the trade date. Realized gains and losses are reported on the basis of identified cost of securities sold. Interest income is recorded on an accrual basis. Dividend income is recorded on the ex-dividend date, or for certain foreign securities, when the information becomes available to the Portfolios. Premium amortization and discount accretion are determined by the effective yield method. Clarion Real Estate estimates components of distributions from real estate investment trusts (“REITs”). Distributions received in excess of income are recorded as a reduction of cost of the related investments. If Clarion Real Estate no longer owns the applicable securities, any distributions received in excess of income are recorded as realized gains.
C. Foreign Currency Translation. The books and records of the Portfolios are maintained in U.S. dollars. Any foreign currency amounts are translated into U.S. dollars on the following basis:
(1)
Market value of investment securities, other assets and liabilities — at the exchange rates prevailing at Market Close.
(2)
Purchases and sales of investment securities, income and expenses — at the rates of exchange prevailing on the respective dates of such transactions.
Although the net assets and the market values are presented at the foreign exchange rates at Market Close,
the Portfolios do not isolate the portion of the results of operations resulting from changes in foreign exchange rates on investments from the fluctuations arising from changes in market prices of securities held. Such fluctuations are included with the net realized and unrealized gains or losses from investments. For securities, which are subject to foreign withholding tax upon disposition, liabilities are recorded on the Statements of Assets and Liabilities for the estimated tax withholding based on the securities’ current market value. Upon disposition, realized gains or losses on such securities are recorded net of foreign withholding tax.
Reported net realized foreign exchange gains or losses arise from sales of foreign currencies, currency gains or losses realized between the trade and settlement dates on securities transactions, the difference between the amounts of dividends, interest, and foreign withholding tax reclaims recorded on the Portfolios’ books, and the U.S. dollar equivalent of the amounts actually received or paid. Net unrealized foreign exchange gains and losses arise from changes in the value of assets and liabilities other than investments in securities, resulting from changes in the exchange rate. Foreign security and currency transactions may involve certain considerations and risks not typically associated with investing in U.S. companies and U.S. government securities. These risks include, but are not limited to, revaluation of currencies and future adverse political and economic developments which could cause securities and their markets to be less liquid and prices more volatile than those of comparable U.S. companies and U.S. government securities. The foregoing risks are even greater with respect to securities of issuers in emerging markets.
D. Distributions to Shareholders. The Portfolios record distributions to their shareholders on the ex-dividend date. Dividends from net investment income, if any, are declared daily and paid monthly and net capital gains distributions, if any, are declared and paid annually by High Yield and Limited Maturity Bond. Dividends from net investment income, if any, are declared and paid semi-annually and net capital gains distributions, if any, are declared and paid annually by Large Cap Value and U.S. Stock Index. For all other Portfolios, dividends from net investment income and net capital gain distributions, if any, are declared and paid annually. The Portfolios may make distributions on a more frequent basis to comply with the distribution requirements of the Internal Revenue Code. The characteristics of income and gains to be distributed are determined in accordance with income tax regulations, which may differ from GAAP for investment companies.
E. Federal Income Taxes. It is the policy of each Portfolio to comply with the requirements of subchapter M of the
NOTES TO FINANCIAL STATEMENTS as of December 31, 2019 (continued)
NOTE 2 — SIGNIFICANT ACCOUNTING POLICIES (continued)
Internal Revenue Code that are applicable to regulated investment companies and to distribute substantially all of its net investment income and any net realized capital gains to its shareholders. Therefore, a federal income tax or excise tax provision is not required. Management has considered the sustainability of the Portfolios’ tax positions taken on federal income tax returns for all open tax years in making this determination. No capital gain distributions shall be made until the capital loss carryforwards have been fully utilized or expire.
The Portfolios may utilize equalization accounting for tax purposes, whereby a portion of redemption payments are treated as distributions of income or gain.
F. Use of Estimates. The preparation of financial statements in conformity with GAAP requires management to make estimates and assumptions that affect the reported amounts of assets and liabilities and disclosure of contingent assets and liabilities at the date of the financial statements and the reported amounts of increases and decreases in net assets from operations during the reporting period. Actual results could differ from those estimates.
G. Risk Exposures and the Use of Derivative Instruments. The Portfolios’ investment strategies permit the Portfolios to enter into various types of derivatives contracts, including, but not limited to, futures contracts, forward foreign currency exchange contracts, credit default swaps, interest rate swaps, total return swaps, and purchased and written options. In doing so, a Portfolio will employ strategies in differing combinations to permit it to increase or decrease the level of risk, or change the level or types of exposure to risk factors. This may allow a Portfolio to pursue its objectives more quickly, and efficiently than if it were to make direct purchases or sales of securities capable of affecting a similar response to market or credit factors.
In pursuit of its investment objectives, a Portfolio may seek to increase or decrease its exposure to the following market or credit risk factors:
Credit Risk. The price of a bond or other debt instrument is likely to fall if the issuer’s actual or perceived financial health deteriorates, whether because of broad economic or issuer-specific reasons. In certain cases, the issuer could be late in paying interest or principal, or could fail to pay its financial obligations altogether.
Equity Risk. Stock prices may be volatile or have reduced liquidity in response to real or perceived impacts of factors including, but not limited to, economic conditions, changes in market interest rates, and political events. Stock markets
tend to be cyclical, with periods when stock prices generally rise and periods when stock prices generally decline. Any given stock market segment may remain out of favor with investors for a short or long period of time, and stocks as an asset class may underperform bonds or other asset classes during some periods. Additionally, legislative, regulatory or tax policies or developments in these areas may adversely impact the investment techniques available to a manager, add to costs and impair the ability of a Portfolio to achieve its investment objectives.
Foreign Exchange Rate Risk. To the extent that a Portfolio invests directly in foreign (non-U.S.) currencies or in securities denominated in, or that trade in, foreign (non-U.S.) currencies, it is subject to the risk that those foreign (non-U.S.) currencies will decline in value relative to the U.S. dollar or, in the case of hedging positions, that the U.S. dollar will decline in value relative to the currency being hedged by a Portfolio through foreign currency exchange transactions.
Currency rates may fluctuate significantly over short periods of time. Currency rates may be affected by changes in market interest rates, intervention (or the failure to intervene) by U.S. or foreign governments, central banks or supranational entities such as the International Monetary Fund, by the imposition of currency controls, or other political or economic developments in the United States or abroad.
Interest Rate Risk. With bonds and other fixed rate debt instruments, a rise in market interest rates generally causes values to fall; conversely, values generally rise as market interest rates fall. The higher the credit quality of the instrument, and the longer its maturity or duration, the more sensitive it is likely to be to interest rate risk. In the case of inverse securities, the interest rate paid by the securities is a floating rate, which generally will decrease when the market rate of interest to which the inverse security is indexed increases and will increase when the market rate of interest to which the inverse security is indexed decreases. As of the date of this report, the United States experiences a low interest rate environment, which may increase a Portfolio’s exposure to risks associated with rising market interest rates. Rising market interest rates could have unpredictable effects on the markets and may expose fixed-income and related markets to heightened volatility. For a fund that invests in fixed-income securities, an increase in market interest rates may lead to increased redemptions and increased portfolio turnover, which could reduce liquidity for certain investments, adversely affect values, and increase costs. If dealer capacity in fixed-income markets is insufficient for market conditions, it may further inhibit liquidity and
NOTES TO FINANCIAL STATEMENTS as of December 31, 2019 (continued)
NOTE 2 — SIGNIFICANT ACCOUNTING POLICIES (continued)
increase volatility in the fixed-income markets. Further, recent and potential changes in government policy may affect interest rates.
Risks of Investing in Derivatives. A Portfolio’s use of derivatives can result in losses due to unanticipated changes in the market or credit risk factors and the overall market. In instances where a Portfolio is using derivatives to decrease, or hedge, exposures to market or credit risk factors for securities held by a Portfolio, there are also risks that those derivatives may not perform as expected resulting in losses for the combined or hedged positions.
Derivative instruments are subject to a number of risks, including the risk of changes in the market price of the underlying securities, credit risk with respect to the counterparty, risk of loss due to changes in market interest rates and liquidity and volatility risk. The amounts required to purchase certain derivatives may be small relative to the magnitude of exposure assumed by a Portfolio. Therefore, the purchase of certain derivatives may have an economic leveraging effect on a Portfolio and exaggerate any increase or decrease in the NAV. Derivatives may not perform as expected, so a Portfolio may not realize the intended benefits. When used for hedging purposes, the change in value of a derivative may not correlate as expected with the currency, security or other risk being hedged. When used as an alternative or substitute for direct cash investments, the return provided by the derivative may not provide the same return as direct cash investment. In addition, given their complexity, derivatives expose a Portfolio to the risk of improper valuation.
Generally, derivatives are sophisticated financial instruments whose performance is derived, at least in part, from the performance of an underlying asset or assets. Derivatives include, among other things, swap agreements, options, forwards and futures. Investments in derivatives are generally negotiated OTC with a single counterparty and as a result are subject to credit risks related to the counterparty’s ability or willingness to perform its obligations; any deterioration in the counterparty’s creditworthiness could adversely affect the value of the derivative. In addition, derivatives and their underlying securities may experience periods of illiquidity which could cause a Portfolio to hold a security it might otherwise sell, or to sell a security it otherwise might hold at inopportune times or at an unanticipated price. A manager might imperfectly judge the direction of the market. For instance, if a derivative is used as a hedge to offset investment risk in another security, the hedge might not
correlate to the market’s movements and may have unexpected or undesired results such as a loss or a reduction in gains.
Counterparty Credit Risk and Credit Related Contingent Features. Certain derivative positions are subject to counterparty credit risk, which is the risk that the counterparty will not fulfill its obligation to a Portfolio. Each Portfolio’s derivative counterparties are financial institutions who are subject to market conditions that may weaken their financial position. A Portfolio intends to enter into financial transactions with counterparties that it believes to be creditworthy at the time of the transaction. To reduce this risk, a Portfolio has entered into master netting arrangements, established within each Portfolio’s International Swap and Derivatives Association, Inc. (“ISDA”) Master Agreements (“Master Agreements”). These Master Agreements are with select counterparties and they govern transactions, including certain OTC derivative and forward foreign currency contracts, entered into by a Portfolio and the counterparty. The Master Agreements maintain provisions for general obligations, representations, agreements, collateral, and events of default or termination. The occurrence of a specified event of termination may give a counterparty the right to terminate all of its contracts and affect settlement of all outstanding transactions under the applicable Master Agreement.
A Portfolio may also enter into collateral agreements with certain counterparties to further mitigate counterparty credit risk on OTC derivative and forward foreign currency contracts. Subject to established minimum levels, collateral is generally determined based on the net aggregate unrealized gain or loss on contracts with a certain counterparty. Collateral pledged to or from a Portfolio is held in a segregated account by a third-party agent and can be in the form of cash or debt securities issued by the U.S. government or related agencies.
As of December 31, 2019, the maximum amount of loss that Balanced Income would incur if its counterparties failed to perform would be $1,056,283 which represents the gross payments to be received on open forward foreign currency contracts and OTC purchased options were they to be unwound as of December 31, 2019. At December 31, 2019, there was no collateral pledged by any counterparty to Balanced Income.
Certain Portfolios have entered into derivative contracts that contain credit related contingent features that if triggered would allow its derivative counterparties to close out and demand payment or additional collateral to cover their exposure from a Portfolio. Credit related contingent
NOTES TO FINANCIAL STATEMENTS as of December 31, 2019 (continued)
NOTE 2 — SIGNIFICANT ACCOUNTING POLICIES (continued)
features are established between each Portfolio and its derivatives counterparties to reduce the risk that a Portfolio will not fulfill its payment obligations to its counterparties. These triggering features include, but are not limited to, a percentage decrease in a Portfolio’s net assets and/or a percentage decrease in a Portfolio’s NAV, which could cause a Portfolio to accelerate payment of any net liability owed to the counterparty. The contingent features are established within each Portfolio’s Master Agreements.
As of December 31, 2019, Balanced Income had a liability position of $735,118 on open forward foreign currency contracts, volatility swaps and OTC written options. If a contingent feature would have been triggered as of December 31, 2019, the Portfolio could have been required to pay these amounts in cash to its counterparties. There was no collateral pledged by the Portfolio as of December 31, 2019.
H. Forward Foreign Currency Contracts. Certain Portfolios may enter into forward foreign currency contracts primarily to hedge against foreign currency exchange rate risks on their non-U.S. dollar denominated investment securities. When entering into a forward currency contract, a Portfolio agrees to receive or deliver a fixed quantity of foreign currency for an agreed-upon price on an agreed future date. These contracts are valued daily and a Portfolio’s net equity therein, representing unrealized gain or loss on the contracts as measured by the difference between the forward foreign exchange rates at the dates of entry into the contracts and the forward rates at the reporting date, is included in the Statements of Assets and Liabilities. Realized and unrealized gains and losses are included in the Statements of Operations. These instruments involve market and/or credit risk in excess of the amount recognized in the Statements of Assets and Liabilities. Risks arise from the possible inability of counterparties to meet the terms of their contracts and from movement in currency and securities values and interest rates. Open forward foreign currency contracts are presented following the respective Portfolio of Investments.
During the year ended December 31, 2019, Balanced Income had average contract amounts on forward foreign currency contracts purchased and sold of $54,973,451 and $55,423,957, respectively. The Portfolio used forward foreign currency contracts primarily to protect any non-U.S. dollar-denominated holdings from adverse currency movements. Please refer to the tables within the Portfolio of Investments for open forward foreign currency contracts at December 31, 2019.
I. Futures Contracts. Each Portfolio may enter into futures contracts involving foreign currency, interest rates,
securities and security indices. A futures contract is a commitment to buy or sell a specific amount of a financial instrument at a negotiated price on a stipulated future date. Each Portfolio may buy and sell futures contracts. Futures contracts traded on a commodities or futures exchange will be valued at the final settlement price or official closing price on the principal exchange as reported by such principal exchange at its trading session ending at, or most recently prior to, the time when the Portfolio’s assets are valued.
Upon entering into a futures contract, each Portfolio is required to deposit either cash or securities (initial margin) in an amount equal to a certain percentage of the contract value. Subsequent payments (variation margin) are made or received by the Portfolio each day. The variation margin payments are equal to the daily changes in the contract value and are recorded as unrealized gains and losses. Open futures contracts are reported on a table following each Portfolio’s Portfolio of Investments. Securities held in collateralized accounts to cover initial margin requirements on open futures contracts are footnoted in the Portfolio of Investments. Cash collateral held by the broker to cover initial margin requirements on open futures contracts are noted in each Portfolio’s Statement of Assets and Liabilities. The net change in unrealized appreciation and depreciation is reported in each Portfolio’s Statement of Operations. Realized gains (losses) are reported in each Portfolio’s Statement of Operations at the closing or expiration of futures contracts.
Futures contracts are exposed to the market risk factor of the underlying financial instrument. During the year ended December 31, 2019, U.S. Stock Index and JPMorgan Small Cap Core Equity have purchased futures contracts on various equity indexes to “equitize” cash. Futures contracts are purchased to provide immediate market exposure proportionate to the size of the Portfolio’s respective cash flows and residual cash balances in order to decrease potential tracking error if the cash remained uninvested in the market. In addition, Balanced Income and Limited Maturity Bond had purchased and sold futures contracts on treasury futures to manage the duration and yield curve of the Portfolios. Additional associated risks of entering into futures contracts include the possibility that there may be an illiquid market where each Portfolio is unable to liquidate the contract or enter into an offsetting position and, if used for hedging purposes, the risk that the price of the contract will correlate imperfectly with the prices of each Portfolio’s securities. With futures, there is minimal counterparty credit risk to the Portfolios since futures are exchange traded and the exchange’s clearinghouse, as counterparty to all exchange traded futures, guarantees the futures against counterparty default.
NOTES TO FINANCIAL STATEMENTS as of December 31, 2019 (continued)
NOTE 2 — SIGNIFICANT ACCOUNTING POLICIES (continued)
During the year ended December 31, 2019, the following Portfolios had average notional values on futures contracts purchased and sold as disclosed below. Please refer to the tables within each respective Portfolio of Investments for open futures contracts at December 31, 2019.
| | | | Purchased | | | Sold | |
| Balanced Income | | | | $ | 138,857,630 | | | | | $ | 18,554,026 | | |
| Limited Maturity Bond | | | | | 73,413,522 | | | | | | 15,741,640 | | |
| U.S. Stock Index | | | | | 69,770,121 | | | | | | — | | |
| JPMorgan Small Cap Core Equity | | | | | 10,566,634 | | | | | | — | | |
J. Repurchase Agreements. Each Portfolio may invest in repurchase agreements only with government securities dealers recognized by the Board of Governors of the Federal Reserve System. Under such agreements, the seller of the security agrees to repurchase it at a mutually agreed upon time and price. The resale price is in excess of the purchase price and reflects an agreed upon interest rate for the period of time the agreement is outstanding. The period of the repurchase agreements is usually short, from overnight to one week, while the underlying securities generally have longer maturities. Each Portfolio will receive as collateral securities acceptable to it whose market value is equal to at least 100% of the carrying amount of the repurchase agreement, plus accrued interest, being invested by a Portfolio. The underlying collateral is valued daily on a mark-to-market basis to assure that the value, including accrued interest, is at least equal to the repurchase price. If the seller defaults, a Portfolio might incur a loss or delay in the realization of proceeds if the value of the security collateralizing the repurchase agreement declines, and may incur disposition costs in liquidating the collateral.
Repurchase agreements are entered into by the Portfolios under Master Repurchase Agreements (“MRA”) which permit the Portfolios, under certain circumstances, including an event of default (such as bankruptcy or insolvency), to offset receivables or payables under the MRA with collateral held and/or pledged by the counterparty and create one single net payment due to or from the respective Portfolio. There were no open repurchase agreements for any Portfolio at December 31, 2019.
K. Securities Lending. Each Portfolio may loan up to 331∕3% of its total assets to brokers, dealers or other financial institutions in exchange for a negotiated lender’s fee. Securities lending involves two primary risks: “investment risk” and “borrower default risk.” When lending securities, the Portfolios will receive cash or U.S. government securities as collateral. Investment risk is
the risk that the Portfolios will lose money from the investment of the cash collateral received from the borrower. Borrower default risk is the risk that the Portfolios will lose money due to the failure of a borrower to return a borrowed security. Loans are subject to termination at the option of the borrower or the Portfolios. Securities lending may result in leverage. The use of leverage may exaggerate any increase or decrease in the NAV, causing the Portfolios to be more volatile. The use of leverage may increase expenses and increase the impact of the Portfolios’ other risks.
L. Restricted Securities. The Portfolios may invest in restricted securities, which include those sold under Rule 144A of the Securities Act of 1933, as amended (“1933 Act”) or securities offered pursuant to Section 4(a)(2) of the 1933 Act, and/or are subject to legal or contractual restrictions on resale and may not be publicly sold without registration under the 1933 Act. Restricted securities are fair valued using market quotations when readily available. In the absence of market quotations, the securities are valued based upon their fair value determined in good faith under procedures approved by the Board.
Securities that are not registered for sale to the public under the 1933 Act are referred to as “restricted securities.” These securities may be sold in private placement transactions between issuers and their purchasers and may be neither listed on an exchange nor traded in other established markets. Many times these securities are subject to legal or contractual restrictions on resale. As a result of the absence of a public trading market, the prices of these securities may be more volatile, less liquid and more difficult to value than publicly traded securities. The price realized from the sale of these securities could be less than the amount originally paid or less than their fair value if they are resold in privately negotiated transactions. In addition, these securities may not be subject to disclosure and other investment protection requirements that are afforded to publicly traded securities. Certain investments may include investment in smaller, less seasoned issuers, which may involve greater risk.
M. Delayed-Delivery Transactions. Each Portfolio may purchase or sell securities on a when-issued or forward commitment basis. The price of the underlying securities and date when the securities will be delivered and paid for are fixed at the time the transaction is negotiated. The fair value of such securities is identified in each Portfolio’s Portfolio of Investments. Losses may arise due to changes in the fair value of the securities or from the inability of counterparties to meet the terms of the contract. In connection with such purchases, the Portfolios are required to identify liquid assets sufficient to cover the purchase price.
NOTES TO FINANCIAL STATEMENTS as of December 31, 2019 (continued)
NOTE 2 — SIGNIFICANT ACCOUNTING POLICIES (continued)
N. Options Contracts. Certain Portfolios may purchase put and call options and may write (sell) put options and covered call options on futures, swaps (“swaptions”), securities, commodities or foreign currencies it owns or in which it may invest. The Portfolios may engage in option transactions as a hedge against adverse movements in the value of portfolio holdings or to increase market exposure. Option contracts are valued daily and unrealized gains or losses are recorded based upon the last sales price on the principal exchange on which the options are traded. An amount equal to the proceeds of the premium received by the Portfolios upon the writing of a put or call option is included in the Statements of Assets and Liabilities as an asset and equivalent liability which is subsequently marked-to-market until it is exercised or closed, or it expires. The Portfolios will realize a gain or loss upon the expiration or closing of the option contract. When an option is exercised, the proceeds on sales of the underlying security for a written call option, the purchase cost of the security for a written put option, or the cost of the security for a purchased put or call option is adjusted by the amount of premium received or paid. Realized and unrealized gains or losses on option contracts are reflected in the accompanying financial statements. The risk in writing a covered call option is that the Portfolios give up the opportunity for profit if the market price of the security increases and the option is exercised. The risk in writing a put option is that the Portfolios may incur a loss if the market price of the security decreases and the option is exercised. The risk in buying an option is that the Portfolios pay a premium whether or not the option is exercised. Risks may also arise from an illiquid secondary market or from the inability of counterparties to meet the terms of the contract.
During the year ended December 31, 2019, Balanced Income had written exchange-traded options with a notional value of $1,735,140 on equity securities in an attempt to generate income from option premiums. There were no open written exchange-traded options at December 31, 2019.
During the year ended December 31, 2019, Balanced Income had purchased and written interest rate swaptions with a notional value of $184,959,290 and $5,340,774, respectively, to gain exposure to interest rates and to generate income. There were no open purchased or written interest rate swaptions at December 31, 2019.
During the year ended December 31, 2019, Balanced Income had purchased and written foreign currency options with a notional value of $5,850,000 and $3,510,000, respectively, to gain exposure to foreign
currencies and to generate income. Please refer to the tables within the Portfolio of Investments for open purchased and written foreign currency options at December 31, 2019.
O. Swap Agreements. Certain Portfolios may enter into swap agreements. A swap is an agreement between two parties pursuant to which each party agrees to make one or more payments to the other at specified future intervals based on the return of an asset (such as a stock, bond or currency) or non-asset reference (such as an interest rate or index). Swap agreements are privately negotiated in the OTC market and may be executed in a multilateral or other trade facility platform, such as a registered commodities exchange (“centrally cleared swaps”).
The swap agreement will specify the “notional” amount of the asset or non-asset reference to which the contract relates. Subsequent changes in fair value, if any, are calculated based upon changes in the performance of the asset or non-asset reference multiplied by the notional value of the contract. A Portfolio may enter into credit default, interest rate, total return and currency swaps to manage its exposure to credit, currency and interest rate risk. All outstanding swap agreements are reported following each Portfolio’s Summary Portfolio of Investments.
Swaps are marked to market daily using quotations primarily from third party pricing services, registered commodities exchange(s), counterparties or brokers. The fair value of an OTC swap contract is recorded on each Portfolio’s Statements of Assets and Liabilities. Daily changes in the value of centrally cleared swaps, if any, are recorded as variation margin receivable or payable on the Statement of Assets and Liabilities. During the term of the swap, changes in the value of the swap, if any, are recorded as unrealized gains or losses on the Statements of Operations. Upfront payments paid or received on OTC swaps by a Portfolio when entering into the agreements are reported on the Statements of Assets and Liabilities and as a component of the changes in unrealized gains or losses on the Statements of Operations. These upfront payments represent the amounts paid or received when initially entering into the swap agreement to compensate for differences between the stated terms of the swap agreement and the prevailing market conditions. The upfront payments are included as a component in the realized gains or losses on each Portfolio’s Statement of Operations upon termination or maturity of the swap. A Portfolio also records net periodic payments paid or received on the swap contract as a realized gain or loss on the Statements of Operations.
In a centrally cleared swap, immediately following execution of the swap agreement, the swap agreement is
NOTES TO FINANCIAL STATEMENTS as of December 31, 2019 (continued)
NOTE 2 — SIGNIFICANT ACCOUNTING POLICIES (continued)
novated to a central counterparty (the “CCP”) and the Portfolio’s counterparty on the swap agreement becomes the CCP. The Portfolios are required to interface with the CCP through a broker. Upon entering into a centrally cleared swap, the Portfolios are required to deposit initial margin with the broker in the form of cash or securities in an amount that varies depending on the size and risk profile of the particular swap. Securities deposited as initial margin are footnoted as pledged on the Portfolio of Investments and cash deposited is recorded on the Statements of Assets and Liabilities as cash pledged for centrally cleared swaps. The daily change in valuation of centrally cleared swaps is recorded as a receivable or payable for variation margin in the Statements of Assets and Liabilities. Payments received from (paid to) the counterparty, including at termination, are recorded as realized gain (loss) on the Statements of Operations.
Entering into swap agreements involves the risk that the maximum potential loss of an investment exceeds the current value of the investment as reported on each Portfolio’s Statements of Assets and Liabilities. Other risks involve the possibility that the counterparty to the agreements may default on its obligation to perform, that there will be no liquid market for these investments and that unfavorable changes in the market will have a negative impact on the value of the index or securities underlying the respective swap agreement.
Credit Default Swap Contracts. A credit default swap is a bilateral agreement between counterparties in which the buyer of the protection agrees to make a stream of periodic payments to the seller of protection in exchange for the right to receive a specified return in the event of a default or other credit event for a referenced entity, obligation or index. As a seller of protection on credit default swaps, a Portfolio will generally receive from the buyer a fixed payment stream based on the notional amount of the swap contract. This fixed payment stream will continue until the swap contract expires or a defined credit event occurs.
A Portfolio is subject to credit risk in the normal course of pursuing its investment objectives. As a seller of protection in a credit default swap, a Portfolio may execute these contracts to manage its exposure to the market or certain sectors of the market. Certain Portfolios may also enter into credit default swaps to speculate on changes in an issuer’s credit quality, to take advantage of perceived spread advantages, or to offset an existing short equivalent (i.e. buying protection on an equivalent reference entity).
Certain Portfolios may sell credit default swaps which expose these Portfolios to the risk of loss from credit risk-related events specified in the contract. Although contract specific, credit events are generally defined as bankruptcy, failure to pay, restructuring, obligation acceleration, obligation default or repudiation/moratorium. If a Portfolio is a seller of protection, and a credit event occurs, as defined under the terms of that particular swap agreement, a Portfolio will generally either (i) pay to the buyer an amount equal to the notional amount of the swap and take delivery of the referenced obligation, other deliverable obligations, or underlying securities comprising a referenced index or (ii) pay a net settlement amount in the form of cash or securities equal to the notional amount of the swap less the recovery value of the referenced obligation or underlying securities comprising a referenced index. If a Portfolio is a buyer of protection and a credit event occurs, as defined under the terms of that particular swap agreement, a Portfolio will either (i) receive from the seller of protection an amount equal to the notional amount of the swap and deliver the referenced obligation, other deliverable obligations or underlying securities comprising the referenced index or (ii) receive a net settlement amount in the form of cash or securities equal to the notional amount of the swap less the recovery value of the referenced obligation or underlying securities comprising the referenced index. Recovery values are assumed by market makers considering either industry standard recovery rates or entity specific factors and considerations until a credit event occurs. If a credit event has occurred, the recovery value is determined by a facilitated auction whereby a minimum number of allowable broker bids, together with a specified valuation method, are used to calculate the settlement value.
Implied credit spreads, represented in absolute terms, utilized in determining the fair value of credit default swap agreements on corporate issues or sovereign issues are disclosed in each Portfolio’s Portfolio of Investments and serve as an indicator of the current status of the payment/performance risk and represent the likelihood or risk of default for the credit derivative. The implied credit spread of a particular referenced entity reflects the cost of buying/selling protection and may include upfront payments required to be made to enter into the agreement. For credit default swaps on asset-backed securities or credit indices, the quoted market prices and resulting fair values serve as the indicator of the current status of the payment/performance risk. Wider credit spreads and increasing fair values, in absolute terms when compared to the notional amount of the swap, represent a deterioration of the referenced entity’s credit soundness and a greater likelihood or risk of default or other credit event occurring as defined under the terms of the agreement.
NOTES TO FINANCIAL STATEMENTS as of December 31, 2019 (continued)
NOTE 2 — SIGNIFICANT ACCOUNTING POLICIES (continued)
The maximum amount of future payments (undiscounted) that a Portfolio as seller of protection could be required to make under a credit default swap agreement would be an amount equal to the notional amount of the agreement. These potential amounts would be partially offset by any recovery values of the respective referenced obligations, upfront payments received upon entering into the agreements, or net amounts received from the settlement of buy protection credit default swap agreements entered into by a Portfolio for the same referenced entity or entities.
For the year ended December 31, 2019, Balanced Income and Limited Maturity Bond had bought and sold credit protection on various credit default swap indices (“CDX”) to hedge the credit risk associated with the market or certain sectors of the markets. A CDX is a basket of credit instruments or exposures designed to be representative of some part of the credit market as a whole. At December 31, 2019, Balanced Income and Limited Maturity had an average notional amount on credit default swaps to buy and sell protection as disclosed below. Please refer to the tables within the Portfolio of Investments for open credit default swaps to buy protection for Balanced Income at December 31, 2019. There were no open credit default swaps for Limited Maturity Bond at December 31, 2019.
| | | | Buy | | | Sell | |
| Balanced Income | | | | $ | 14,482,431 | | | | | $ | 11,329,315 | | |
| Limited Maturity | | | | | 7,945,000 | | | | | | — | | |
At December 31, 2019, Balanced Income had pledged $400,000 in cash collateral for open centrally cleared credit default swaps.
Volatility Swap Contracts. Certain Portfolios may enter into volatility swaps. Volatility swaps are agreements in which the counterparties agree to make payments in connection with changes in the volatility (i.e., the magnitude of change over a specified period of time) of an underlying referenced instrument, such as a currency, rate, index, security or other financial instrument. Volatility swaps permit the parties to attempt to hedge volatility risk and/or take positions on the projected future volatility of an underlying referenced instrument. As a receiver of the realized price volatility, a Portfolio would receive the payoff amount when the realized price volatility of the referenced instrument is greater than the strike and would owe the payoff amount when the volatility is less than the strike. As a payer of the realized price volatility, a Portfolio would owe the payoff amount when the realized price volatility of the referenced instrument is greater than the strike and would receive the payoff amount when the volatility is less than the strike.
During the year ended December 31, 2019, Balanced Income had an average notional amount of $69,000 on foreign currency volatility swaps (receiver). Please refer to the tables within the Portfolio of Investments for open volatility swaps at December 31, 2019.
P. Indemnifications. In the normal course of business, the Trust may enter into contracts that provide certain indemnifications. The Trust’s maximum exposure under these arrangements is dependent on future claims that may be made against the Portfolios and, therefore, cannot be estimated; however, based on experience, management considers the risk of loss from such claims remote.
NOTE 3 — INVESTMENT TRANSACTIONS
For the year ended December 31, 2019, the cost of purchases and the proceeds from the sales of securities, excluding U.S. government and short-term securities were as follows:
| | | | Purchases | | | Sales | |
| Balanced Income | | | | $ | 463,811,507 | | | | | $ | 503,360,583 | | |
| High Yield | | | | | 299,782,384 | | | | | | 331,523,264 | | |
| Large Cap Growth | | | | | 4,326,981,573 | | | | | | 5,073,473,323 | | |
| Large Cap Value | | | | | 993,712,267 | | | | | | 1,110,807,416 | | |
| Limited Maturity Bond | | | | | 105,477,633 | | | | | | 111,205,874 | | |
| U.S. Stock Index | | | | | 1,351,858,898 | | | | | | 518,985,677 | | |
| Clarion Real Estate | | | | | 235,978,092 | | | | | | 300,519,743 | | |
| JPMorgan Small Cap Core Equity | | | | | 354,204,886 | | | | | | 618,977,760 | | |
U.S. government securities not included above were as follows:
| | | | Purchases | | | Sales | |
| Balanced Income | | | | $ | 430,695,747 | | | | | $ | 426,291,718 | | |
| Limited Maturity Bond | | | | | 786,702,642 | | | | | | 788,296,051 | | |
NOTE 4 — INVESTMENT MANAGEMENT FEES
Balanced Income, Large Cap Growth, Large Cap Value and Clarion Real Estate have entered into an investment management agreement (“Management Agreement”) with the Investment Adviser. The Investment Adviser has overall responsibility for the management of the Portfolios. The Investment Adviser oversees all investment management and portfolio management services for the Portfolios and assists in managing and supervising all aspects of the general day-to-day business activities and operations of the Portfolios, including custodial, transfer agency, dividend disbursing, accounting, auditing, compliance and related services. This Management Agreement compensates the Investment Adviser with a management fee, computed daily and payable monthly, based on the
NOTES TO FINANCIAL STATEMENTS as of December 31, 2019 (continued)
NOTE 4 — INVESTMENT MANAGEMENT FEES (continued)
average daily net assets of each Portfolio, at the following annual rates:
| Portfolio | | | Fee | |
Balanced Income(1) | | | 0.55% on all assets | |
| Large Cap Growth | | | 0.65% on the first $5.5 billion;
0.62% on the next $1.5 billion;
0.60% on the next $3 billion; and
0.59% on the amount in excess of $10 billion | |
| Large Cap Value | | | 0.75% on the first $500 million;
0.70% on the next $1.5 billion; and
0.65% on the amount in excess of $2 billion | |
| Clarion Real Estate | | | 0.85% on the first $200 million;
0.80% on the next $550 million; and
0.75% on the amount in excess of $750 million | |
(1)
Prior to May 1, 2019, the management fee for Balanced Income was 0.75% on the first $500 million; and 0.70% on the amount in excess of $500 million.
With the exception of the Portfolios in the table above, the Investment Adviser provides the below Portfolios with advisory and administrative services under a management agreement (the “Unified Agreement”). Under the Unified Agreement, the Investment Adviser has overall responsibility for engaging sub-advisers and for monitoring and evaluating the management of the assets of each Portfolio. Sub-advisers have full investment discretion and make all determinations with respect to the investment of a Portfolio’s assets and the purchase and sale of portfolio securities and other investments. Pursuant to the Unified Agreement, the Investment Adviser also is responsible for providing or procuring, at the Investment Adviser’s expense, the services reasonably necessary for the ordinary operation of a Portfolio, including, among other things, custodial, administrative, transfer agency, portfolio accounting, auditing and ordinary legal expenses. As compensation for its services under the Unified Agreement, the Trust pays the Investment Adviser a monthly fee (a “Unified Fee”) based on the following annual rates of the average daily net assets of each Portfolio:
| Portfolio | | | Fee | |
| High Yield | | | 0.490% on the first $1 billion;
0.480% on the next $1 billion;
0.470% on the amount in excess of $2 billion | |
Limited Maturity Bond(1) | | | 0.350% on the first $200 million;
0.300% on the next $300 million;
0.250% on the amount in excess of $500 million | |
| U.S. Stock Index | | | 0.260% | |
| Portfolio | | | Fee | |
| JPMorgan Small Cap Core Equity | | | 0.900% on the first $200 million;
0.850% on the next $300 million;
0.800% on the next $250 million;
0.750% on the amount in excess of $750 million | |
(1)
The assets of Limited Maturity Bond are aggregated with those of Voya Government Liquid Assets Portfolio, which is not included in this report, to determine the Unified Fee applicable to the Portfolio.
Effective May 1, 2019, the Investment Adviser has contractually agreed to waive 0.015%, 0.010%, and 0.044%, of the management fee for High Yield, Large Cap Value, and Clarion Real Estate, respectively. Any fees waived or reimbursed are not eligible for recoupment. Termination or modification of these obligations requires approval by the Board. These waivers replace the management fee waivers in connection with the sub-advisory fee reductions.
Prior to May 1, 2019, the Investment Adviser had contractually agreed to waive a portion of the management fee for Balanced Income, High Yield, Large Cap Value, and Clarion Real Estate in connection with sub-advisory fee reductions for these Portfolios. The waiver was calculated as follows: Waiver = 50% x (former sub-advisory fee rate minus new sub-advisory fee rate) x average daily net assets as of the calculation date. For the period ended April 30, 2019, the Investment Adviser waived $27,067, $30,527, $42,791, and $64,714 for Balanced Income, High Yield, Large Cap Value, and Clarion Real Estate, respectively, based on the sub-advisory fee reductions. Effective May 1, 2019, the Investment Adviser is no longer obligated to waive a portion of the management fee for these Portfolios based on the sub-advisory fee reductions. The termination of these obligations was approved by the Board and, for all but Balanced Income, replaced with a management fee waiver.
The Investment Adviser has entered into a sub-advisory agreement with each respective sub-adviser. These sub-advisers provide investment advice for certain Portfolios and are paid by the Investment Adviser based on the average daily net assets of the respective Portfolios. Subject to such policies as the Board or the Investment Adviser may determine, the sub-advisers manage each respective Portfolio’s assets in accordance with the Portfolio’s investment objectives, policies, and limitations. The sub-advisers of the Portfolios are as follows (*denotes an affiliated sub-adviser):
| Portfolio | | | Sub-Adviser | |
Balanced Income(1) | | | Voya Investment Management Co. LLC* | |
| High Yield | | | Voya Investment Management Co. LLC* | |
| Large Cap Growth | | | Voya Investment Management Co. LLC* | |
NOTES TO FINANCIAL STATEMENTS as of December 31, 2019 (continued)
NOTE 4 — INVESTMENT MANAGEMENT FEES (continued)
| Portfolio | | | Sub-Adviser | |
| Large Cap Value | | | Voya Investment Management Co. LLC* | |
| Limited Maturity Bond | | | Voya Investment Management Co. LLC* | |
| U.S. Stock Index | | | Voya Investment Management Co. LLC* | |
| Clarion Real Estate | | | CBRE Clarion Securities LLC | |
| JPMorgan Small Cap Core Equity | | | J.P. Morgan Investment Management Inc. | |
(1)
Effective May 1, 2019, Franklin Advisers, Inc. was removed as a sub-adviser and Voya Investment Management Co. LLC was added as a sub-adviser to the Portfolio.
NOTE 5 — DISTRIBUTION AND SERVICE FEES
The Trust has entered into a shareholder service plan (the “Plan”) for each Portfolio that offers Class S and Class S2 shares. The Plan compensates the Distributor for the provision of shareholder services and/or account maintenance services to direct or indirect beneficial owners of Class S and Class S2 shares. Under the Plan, each Portfolio makes payments to the Distributor at an annual rate of 0.25% of the Portfolio’s average daily net assets attributable to Class S and Class S2 shares, respectively. Each Portfolio that offers Class S2 shares has entered into a distribution plan (the “Class S2 Plan”) with the Distributor on behalf of the Class S2 shares of the Portfolio. The Class S2 Plan provides that the Class S2 shares shall pay a distribution fee for distribution services including payments to the Distributor at an annual rate of 0.15% of the average daily net assets. The Distributor has contractually agreed to waive 0.01% of the shareholder service fee for Class S shares of U.S. Stock Index. Termination or modification of this obligation requires approval by the Board.
Class ADV shares of the Portfolios have a shareholder service and distribution plan. The respective Portfolios pay the Distributor a service fee of 0.25% and a distribution fee of 0.35% of each Portfolio’s average daily net assets attributable to Class ADV shares, except for U.S. Stock Index, which pays a distribution fee of 0.28%.
NOTE 6 — OTHER TRANSACTIONS WITH AFFILIATES AND RELATED PARTIES
For the year ended December 31, 2019, Balanced Income incurred $26,100 of shareholder notification costs associated with changes to the Portfolio’s name, sub-adviser and expense structure. The Investment Adviser reimbursed the Portfolio for these costs.
At December 31, 2019, the following direct or indirect, wholly-owned subsidiaries of Voya Financial, Inc. or
affiliated investment companies owned more than 5% of the following Portfolios:
Subsidiary/Affiliated Investment
Company | | | Portfolio | | | Percentage | |
| ReliaStar Life Insurance Company | | | Limited Maturity Bond | | | | | 6.44% | | |
| | | | JPMorgan Small Cap
Core Equity | | | | | 10.30 | | |
Security Life of Denver Insurance
Company | | | Limited Maturity Bond | | | | | 9.84 | | |
| | | | JPMorgan Small Cap
Core Equity | | | | | 6.45 | | |
| Voya Index Solution 2025 Portfolio | | | U.S. Stock Index | | | | | 5.80 | | |
| Voya Index Solution 2035 Portfolio | | | U.S. Stock Index | | | | | 7.13 | | |
| Voya Index Solution 2045 Portfolio | | | U.S. Stock Index | | | | | 5.46 | | |
| Voya Institutional Trust Company | | | Balanced Income | | | | | 20.30 | | |
| | | | High Yield | | | | | 14.44 | | |
| | | | Large Cap Growth | | | | | 19.25 | | |
| | | | Large Cap Value | | | | | 5.10 | | |
| | | | Limited Maturity Bond | | | | | 5.58 | | |
| | | | Clarion Real Estate | | | | | 21.99 | | |
| | | | JPMorgan Small Cap
Core Equity | | | | | 34.63 | | |
| Voya Retirement Growth Portfolio | | | U.S. Stock Index | | | | | 16.12 | | |
Voya Retirement Insurance and
Annuity Company | | | High Yield | | | | | 32.52 | | |
| | | | Large Cap Growth | | | | | 26.63 | | |
| | | | Large Cap Value | | | | | 30.09 | | |
| | | | U.S. Stock Index | | | | | 10.92 | | |
| | | | Clarion Real Estate | | | | | 38.19 | | |
| | | | JPMorgan Small Cap
Core Equity | | | | | 39.59 | | |
Voya Retirement Moderate Growth
Portfolio | | | U.S. Stock Index | | | | | 11.12 | | |
Under the 1940 Act, the direct or indirect beneficial owner of more than 25% of the voting securities of a company (including a fund) is presumed to control such company. Companies under common control (e.g., companies with a common owner of greater than 25% of their respective voting securities) are affiliates under the 1940 Act.
The Investment Adviser may direct the Portfolios’ sub-advisers to use their best efforts (subject to obtaining best execution of each transaction) to allocate a Portfolio’s equity security transactions through certain designated broker-dealers. The designated broker-dealer, in turn, will reimburse a portion of the brokerage commissions to pay certain expenses of that Portfolio. Any amounts credited to the Portfolios are reflected as brokerage commission recapture on the accompanying Statements of Operations.
The Portfolios have adopted a deferred compensation plan (the “DC Plan”), which allows eligible independent trustees, as described in the DC Plan, to defer the receipt of all or a portion of the trustees’ fees that they are entitled to receive from the Portfolios. For purposes of determining the amount owed to the trustee under the DC Plan, the amounts deferred are invested in shares of the funds
NOTES TO FINANCIAL STATEMENTS as of December 31, 2019 (continued)
NOTE 6 — OTHER TRANSACTIONS WITH AFFILIATES AND RELATED PARTIES (continued)
selected by the trustee (the “Notional Funds”). The Portfolios purchase shares of the Notional Funds, which are all advised by Voya Investments, in amounts equal to the trustees’ deferred fees, resulting in a Portfolio asset equal to the deferred compensation liability. Such assets, if applicable, are included as a component of “Other assets” on the accompanying Statements of Assets and Liabilities. Deferral of trustees’ fees under the DC Plan will not affect net assets of the Portfolios, and will not materially affect the Portfolios’ assets, liabilities or net investment income per share. Amounts will be deferred until distributed in accordance with the DC Plan.
NOTE 7 — EXPENSE LIMITATION AGREEMENTS
The Investment Adviser has entered into written expense limitation agreements (“Expense Limitation Agreements”) with the following Portfolios, whereby the Investment Adviser has agreed to limit expenses, excluding interest, taxes, investment-related costs, leverage expenses, extraordinary expenses, and acquired fund fees and expenses to the levels listed below:
| Portfolio | | | Class
ADV | | | Class
I | | | Class
P2 | | | Class
R6 | | | Class
S | | | Class
S2 | |
| Balanced Income(1) | | | | | 1.20% | | | | | | 0.60% | | | | | | N/A | | | | | | N/A | | | | | | 0.85% | | | | | | 1.00% | | |
| Large Cap Growth(2) | | | | | 1.27% | | | | | | 0.67% | | | | | | N/A | | | | | | 0.67% | | | | | | 0.92% | | | | | | 1.07% | | |
| Large Cap Value(3) | | | | | 1.29% | | | | | | 0.69% | | | | | | N/A | | | | | | 0.69% | | | | | | 0.94% | | | | | | 1.09% | | |
| U.S. Stock Index | | | | | N/A | | | | | | N/A | | | | | | 0.15% | | | | | | N/A | | | | | | N/A | | | | | | N/A | | |
| Clarion Real Estate | | | | | 1.35% | | | | | | 0.75% | | | | | | N/A | | | | | | N/A | | | | | | 1.00% | | | | | | 1.15% | | |
(1)
Prior to May 1, 2019, the expense limits for Balanced Income were 1.28%, 0.68%, 0.93%, and 1.08% for Class ADV, Class I, Class S, and Class S2, respectively.
(2)
Any fees waived pursuant to the Expense Limitation Agreement shall not be eligible for recoupment.
(3)
Pursuant to a side letter agreement, through May 1, 2020, the Investment Adviser has further lowered the expense limits for Large Cap Value to 1.25%, 0.65%, 0.65%, 0.90%, and 1.05% for Class ADV, Class I, Class R6, Class S, and Class S2, respectively. Termination or modification of this obligation requires approval by the Board. Any fees waived pursuant to the side letter agreement shall not be eligible for recoupment.
Unless otherwise specified above and with the exception of the non-recoupable management fee waivers for certain Portfolios, the Investment Adviser may, at a later date, recoup from a Portfolio for fees waived and/or other expenses reimbursed by the Investment Adviser during the previous 36 months, but only if, after such recoupment, a Portfolio’s expense ratio does not exceed the percentage described above. Waived and reimbursed fees net of any recoupment by the Investment Adviser of such waived and reimbursed fees are reflected on the accompanying
Statements of Operations. Amounts payable by the Investment Adviser are reflected on the accompanying Statements of Assets and Liabilities.
As of December 31, 2019, the amounts of waived and/or reimbursed fees that are subject to possible recoupment by the Investment Adviser, and the related expiration dates are as follows:
| | | | December 31, | | |
| | | | 2020 | | | 2021 | | | 2022 | | | Total | |
| Balanced Income | | | | $ | 496,880 | | | | | $ | 448,434 | | | | | $ | 98,813 | | | | | $ | 1,044,127 | | |
| U.S. Stock Index | | | | | 837,720 | | | | | | 1,667,050 | | | | | | 2,287,877 | | | | | | 4,792,647 | | |
| Clarion Real Estate | | | | | 549,763 | | | | | | 452,664 | | | | | | 365,899 | | | | | | 1,368,326 | | |
The Expense Limitation Agreements are contractual through May 1, 2020 and shall renew automatically for one-year terms. Termination or modification of this obligation requires approval by the Board.
NOTE 8 — LINE OF CREDIT
Effective May 17, 2019, each Portfolio, in addition to certain other funds managed by the Investment Adviser, has entered into a 364-day unsecured committed revolving line of credit agreement (the “Credit Agreement”) with The Bank of New York Mellon (“BNY”) for an aggregate amount of $400,000,000 through May 15, 2020. The proceeds may be used only to finance temporarily: (1) the purchase or sale of investment securities; or (2) the repurchase or redemption of shares of a Portfolio or certain other funds managed by the Investment Adviser. The funds to which the line of credit is available pay a commitment fee equal to 0.15% per annum on the daily unused portion of the committed line amount payable quarterly in arrears. Prior to May 17, 2019, the predecessor line of credit was for an aggregate amount of $400,000,000 and paid a commitment fee equal to 0.15% per annum on the daily unused portion of the committed line amount through May 17, 2019.
Borrowings under the Credit Agreement accrue interest at the federal funds rate plus a specified margin. Repayments generally must be made within 60 days after the date of a revolving credit advance.
The below Portfolios utilized the line of credit during the year ended December 31, 2019 as follows:
| Portfolio | | | Days
Utilized | | | Approximate
Average Daily
Balance
For Days
Utilized | | | Approximate
Weighted
Average
Interest Rate
For Days
Utilized | |
| Balanced Income | | | | | 33 | | | | | $ | 2,389,636 | | | | | | 3.15% | | |
| U.S. Stock Index | | | | | 6 | | | | | | 39,978,667 | | | | | | 2.94 | | |
| Clarion Real Estate | | | | | 7 | | | | | | 7,350,571 | | | | | | 3.37 | | |
NOTES TO FINANCIAL STATEMENTS as of December 31, 2019 (continued)
NOTE 9 — CAPITAL SHARES
Transactions in capital shares and dollars were as follows:
| | | | Shares
sold | | | Shares
issued
in merger | | | Reinvestment
of
distributions | | | Shares
redeemed | | | Net increase
(decrease)
in shares
outstanding | | | Shares
sold | | | Proceeds
from shares
issued in
merger | | | Reinvestment
of
distributions | | | Shares
redeemed | | | Net increase
(decrease) | |
Year or
period ended | | | # | | | # | | | # | | | # | | | # | | | ($) | | | ($) | | | ($) | | | ($) | | | ($) | |
| Balanced Income | |
| Class ADV | | | | | | | | | | | |
| 12/31/2019 | | | | | 483,953 | | | | | | — | | | | | | 765,462 | | | | | | (839,081) | | | | | | 410,334 | | | | | | 5,164,269 | | | | | | — | | | | | | 7,922,532 | | | | | | (8,959,080) | | | | | | 4,127,721 | | |
| 12/31/2018 | | | | | 343,500 | | | | | | — | | | | | | 365,920 | | | | | | (1,098,907) | | | | | | (389,487) | | | | | | 3,765,288 | | | | | | — | | | | | | 3,926,322 | | | | | | (12,008,384) | | | | | | (4,316,774) | | |
| Class I | | | | | | | | | | | | | | | | | | | | | | | | | | | | | | | | | | | | | | | | | | | | | | | | | | | | | | | | | | | | | |
| 12/31/2019 | | | | | 23,412 | | | | | | — | | | | | | 82,479 | | | | | | (70,383) | | | | | | 35,508 | | | | | | 262,125 | | | | | | — | | | | | | 894,071 | | | | | | (784,282) | | | | | | 371,914 | | |
| 12/31/2018 | | | | | 13,833 | | | | | | — | | | | | | 43,191 | | | | | | (108,802) | | | | | | (51,778) | | | | | | 157,449 | | | | | | — | | | | | | 483,308 | | | | | | (1,231,681) | | | | | | (590,924) | | |
| Class S | | | | | | | | | | | | | | | | | | | | | | | | | | | | | | | | | | | | | | | | | | | | | | | | | | | | | | | | | | | | | |
| 12/31/2019 | | | | | 461,969 | | | | | | — | | | | | | 2,828,525 | | | | | | (4,051,474) | | | | | | (760,980) | | | | | | 5,118,548 | | | | | | — | | | | | | 30,519,786 | | | | | | (45,382,273) | | | | | | (9,743,939) | | |
| 12/31/2018 | | | | | 209,670 | | | | | | — | | | | | | 1,501,209 | | | | | | (5,528,181) | | | | | | (3,817,302) | | | | | | 2,402,543 | | | | | | — | | | | | | 16,723,472 | | | | | | (62,687,213) | | | | | | (43,561,198) | | |
| Class S2 | | | | | | | | | | | | | | | | | | | | | | | | | | | | | | | | | | | | | | | | | | | | | | | | | | | | | | | | | | | | | |
| 12/31/2019 | | | | | 112,288 | | | | | | — | | | | | | 46,512 | | | | | | (93,027) | | | | | | 65,773 | | | | | | 1,226,171 | | | | | | — | | | | | | 501,395 | | | | | | (1,021,334) | | | | | | 706,232 | | |
| 12/31/2018 | | | | | 22,911 | | | | | | — | | | | | | 22,902 | | | | | | (66,257) | | | | | | (20,444) | | | | | | 260,456 | | | | | | — | | | | | | 254,904 | | | | | | (751,330) | | | | | | (235,970) | | |
| High Yield | |
| Class ADV | | | | | | | | | | | | | | | | | | | | | | | | | | | | | | | | | | | | | | | | | | | | | | | | | | | | | | | | | | | | | |
| 12/31/2019 | | | | | 634,371 | | | | | | — | | | | | | 429,020 | | | | | | (1,145,593) | | | | | | (82,202) | | | | | | 6,187,500 | | | | | | — | | | | | | 4,184,086 | | | | | | (11,117,739) | | | | | | (746,153) | | |
| 12/31/2018 | | | | | 468,091 | | | | | | — | | | | | | 496,778 | | | | | | (1,731,374) | | | | | | (766,505) | | | | | | 4,535,058 | | | | | | — | | | | | | 4,784,764 | | | | | | (16,724,655) | | | | | | (7,404,833) | | |
| Class I | | | | | | | | | | | | | | | | | | | | | | | | | | | | | | | | | | | | | | | | | | | | | | | | | | | | | | | | | | | | | |
| 12/31/2019 | | | | | 4,042,390 | | | | | | 9,811,076 | | | | | | 581,119 | | | | | | (1,596,538) | | | | | | 12,838,047 | | | | | | 39,614,104 | | | | | | 96,181,491 | | | | | | 5,691,493 | | | | | | (15,569,611) | | | | | | 125,917,477 | | |
| 12/31/2018 | | | | | 1,099,810 | | | | | | — | | | | | | 370,227 | | | | | | (1,547,007) | | | | | | (76,970) | | | | | | 10,708,127 | | | | | | — | | | | | | 3,566,820 | | | | | | (15,025,441) | | | | | | (750,494) | | |
| Class S | | | | | | | | | | | | | | | | | | | | | | | | | | | | | | | | | | | | | | | | | | | | | | | | | | | | | | | | | | | | | |
| 12/31/2019 | | | | | 1,874,367 | | | | | | 188,038 | | | | | | 1,800,210 | | | | | | (9,495,599) | | | | | | (5,632,984) | | | | | | 18,111,582 | | | | | | 1,841,793 | | | | | | 17,552,628 | | | | | | (92,507,126) | | | | | | (55,001,123) | | |
| 12/31/2018 | | | | | 1,541,065 | | | | | | — | | | | | | 2,209,002 | | | | | | (7,781,306) | | | | | | (4,031,239) | | | | | | 14,969,371 | | | | | | — | | | | | | 21,269,549 | | | | | | (74,934,147) | | | | | | (38,695,227) | | |
| Class S2 | | | | | | | | | | | | | | | | | | | | | | | | | | | | | | | | | | | | | | | | | | | | | | | | | | | | | | | | | | | | | |
| 12/31/2019 | | | | | 71,454 | | | | | | — | | | | | | 20,355 | | | | | | (253,238) | | | | | | (161,429) | | | | | | 694,898 | | | | | | — | | | | | | 198,505 | | | | | | (2,478,674) | | | | | | (1,585,271) | | |
| 12/31/2018 | | | | | 53,890 | | | | | | — | | | | | | 29,579 | | | | | | (201,318) | | | | | | (117,849) | | | | | | 524,343 | | | | | | — | | | | | | 285,512 | | | | | | (1,944,436) | | | | | | (1,134,581) | | |
| Large Cap Growth | |
| Class ADV | | | | | | | | | | | | | | | | | | | | | | | | | | | | | | | | | | | | | | | | | | | | | | | | | | | | | | | | | | | | | |
| 12/31/2019 | | | | | 1,035,445 | | | | | | — | | | | | | 19,360,091 | | | | | | (18,219,100) | | | | | | 2,176,436 | | | | | | 18,555,068 | | | | | | — | | | | | | 322,539,115 | | | | | | (322,447,976) | | | | | | 18,646,207 | | |
| 12/31/2018 | | | | | 918,683 | | | | | | — | | | | | | 15,118,914 | | | | | | (17,104,293) | | | | | | (1,066,696) | | | | | | 17,424,747 | | | | | | — | | | | | | 276,524,927 | | | | | | (326,912,484) | | | | | | (32,962,810) | | |
| Class I | | | | | | | | | | | | | | | | | | | | | | | | | | | | | | | | | | | | | | | | | | | | | | | | | | | | | | | | | | | | | |
| 12/31/2019 | | | | | 4,994,678 | | | | | | — | | | | | | 16,795,929 | | | | | | (12,234,448) | | | | | | 9,556,159 | | | | | | 97,655,872 | | | | | | — | | | | | | 308,037,331 | | | | | | (235,572,055) | | | | | | 170,121,148 | | |
| 12/31/2018 | | | | | 7,417,403 | | | | | | — | | | | | | 14,079,600 | | | | | | (32,272,260) | | | | | | (10,775,257) | | | | | | 155,902,826 | | | | | | — | | | | | | 278,916,876 | | | | | | (675,708,149) | | | | | | (240,888,447) | | |
| Class R6 | | | | | | | | | | | | | | | | | | | | | | | | | | | | | | | | | | | | | | | | | | | | | | | | | | | | | | | | | | | | | |
| 12/31/2019 | | | | | 486,351 | | | | | | — | | | | | | 470,515 | | | | | | (535,128) | | | | | | 421,738 | | | | | | 9,358,324 | | | | | | — | | | | | | 8,633,943 | | | | | | (10,360,682) | | | | | | 7,631,585 | | |
| 12/31/2018 | | | | | 1,023,337 | | | | | | — | | | | | | 321,255 | | | | | | (365,872) | | | | | | 978,720 | | | | | | 21,158,162 | | | | | | — | | | | | | 6,367,270 | | | | | | (7,357,087) | | | | | | 20,168,345 | | |
| Class S | | | | | | | | | | | | | | | | | | | | | | | | | | | | | | | | | | | | | | | | | | | | | | | | | | | | | | | | | | | | | |
| 12/31/2019 | | | | | 1,219,268 | | | | | | — | | | | | | 17,119,586 | | | | | | (19,498,439) | | | | | | (1,159,585) | | | | | | 23,058,635 | | | | | | — | | | | | | 304,557,434 | | | | | | (367,320,864) | | | | | | (39,704,795) | | |
| 12/31/2018 | | | | | 1,131,475 | | | | | | — | | | | | | 13,904,209 | | | | | | (18,503,810) | | | | | | (3,468,126) | | | | | | 22,894,103 | | | | | | — | | | | | | 268,490,262 | | | | | | (374,074,067) | | | | | | (82,689,702) | | |
| Class S2 | | | | | | | | | | | | | | | | | | | | | | | | | | | | | | | | | | | | | | | | | | | | | | | | | | | | | | | | | | | | | |
| 12/31/2019 | | | | | 143,587 | | | | | | — | | | | | | 587,448 | | | | | | (929,352) | | | | | | (198,317) | | | | | | 2,658,264 | | | | | | — | | | | | | 10,362,576 | | | | | | (17,303,441) | | | | | | (4,282,601) | | |
| 12/31/2018 | | | | | 325,126 | | | | | | — | | | | | | 452,720 | | | | | | (635,056) | | | | | | 142,790 | | | | | | 6,494,085 | | | | | | — | | | | | | 8,678,633 | | | | | | (12,844,744) | | | | | | 2,327,974 | | |
| Large Cap Value | |
| Class ADV | | | | | | | | | | | | | | | | | | | | | | | | | | | | | | | | | | | | | | | | | | | | | | | | | | | | | | | | | | | | | |
| 12/31/2019 | | | | | 112,168 | | | | | | — | | | | | | 391,693 | | | | | | (759,527) | | | | | | (255,666) | | | | | | 1,285,654 | | | | | | — | | | | | | 4,505,178 | | | | | | (8,725,259) | | | | | | (2,934,427) | | |
| 12/31/2018 | | | | | 132,555 | | | | | | — | | | | | | 622,235 | | | | | | (746,247) | | | | | | 8,543 | | | | | | 1,613,261 | | | | | | — | | | | | | 7,149,519 | | | | | | (9,153,440) | | | | | | (390,660) | | |
| Class I | | | | | | | | | | | | | | | | | | | | | | | | | | | | | | | | | | | | | | | | | | | | | | | | | | | | | | | | | | | | | |
| 12/31/2019 | | | | | 577,141 | | | | | | — | | | | | | 2,685,229 | | | | | | (4,077,981) | | | | | | (815,611) | | | | | | 6,825,780 | | | | | | — | | | | | | 31,729,269 | | | | | | (48,240,843) | | | | | | (9,685,794) | | |
| 12/31/2018 | | | | | 589,887 | | | | | | — | | | | | | 4,162,204 | | | | | | (6,070,579) | | | | | | (1,318,488) | | | | | | 7,303,720 | | | | | | — | | | | | | 48,700,372 | | | | | | (77,402,054) | | | | | | (21,397,962) | | |
| Class R6 | | | | | | | | | | | | | | | | | | | | | | | | | | | | | | | | | | | | | | | | | | | | | | | | | | | | | | | | | | | | | |
| 12/31/2019 | | | | | 14,817 | | | | | | — | | | | | | 2,126 | | | | | | (102,570) | | | | | | (85,627) | | | | | | 176,027 | | | | | | — | | | | | | 25,122 | | | | | | (1,219,884) | | | | | | (1,018,735) | | |
| 12/31/2018 | | | | | 70,339 | | | | | | — | | | | | | 10,828 | | | | | | (33,405) | | | | | | 47,762 | | | | | | 883,122 | | | | | | — | | | | | | 125,715 | | | | | | (439,756) | | | | | | 569,081 | | |
| Class S | | | | | | | | | | | | | | | | | | | | | | | | | | | | | | | | | | | | | | | | | | | | | | | | | | | | | | | | | | | | | |
| 12/31/2019 | | | | | 406,811 | | | | | | — | | | | | | 5,109,077 | | | | | | (9,995,327) | | | | | | (4,479,439) | | | | | | 4,776,267 | | | | | | — | | | | | | 59,337,191 | | | | | | (116,360,700) | | | | | | (52,247,242) | | |
| 12/31/2018 | | | | | 298,273 | | | | | | — | | | | | | 8,086,285 | | | | | | (9,550,944) | | | | | | (1,166,386) | | | | | | 3,740,165 | | | | | | — | | | | | | 93,408,002 | | | | | | (119,140,322) | | | | | | (21,992,155) | | |
NOTES TO FINANCIAL STATEMENTS as of December 31, 2019 (continued)
NOTE 9 — CAPITAL SHARES (continued)
| | | | Shares
sold | | | Shares
issued
in merger | | | Reinvestment
of
distributions | | | Shares
redeemed | | | Net increase
(decrease)
in shares
outstanding | | | Shares
sold | | | Proceeds
from shares
issued in
merger | | | Reinvestment
of
distributions | | | Shares
redeemed | | | Net increase
(decrease) | |
Year or
period ended | | | # | | | # | | | # | | | # | | | # | | | ($) | | | ($) | | | ($) | | | ($) | | | ($) | |
| Large Cap Value (continued) | |
| Class S2 | | | | | | | | | | | | | | | | | | | | | | | | | | | | | | | | | | | | | | | | | | | | | | | | | | | | | | | | | | | | | |
| 12/31/2019 | | | | | 278 | | | | | | — | | | | | | 1,168 | | | | | | (3,730) | | | | | | (2,284) | | | | | | 3,105 | | | | | | — | | | | | | 13,567 | | | | | | (43,649) | | | | | | (26,977) | | |
| 12/31/2018 | | | | | 2,023 | | | | | | — | | | | | | 1,692 | | | | | | (6,815) | | | | | | (3,100) | | | | | | 25,835 | | | | | | — | | | | | | 19,541 | | | | | | (93,118) | | | | | | (47,742) | | |
| Limited Maturity Bond | |
| Class ADV | | | | | | | | | | | | | | | | | | | | | | | | | | | | | | | | | | | | | | | | | | | | | | | | | | | | | | | | | | | | | |
| 12/31/2019 | | | | | 42,085 | | | | | | — | | | | | | 20,414 | | | | | | (228,289) | | | | | | (165,790) | | | | | | 412,070 | | | | | | — | | | | | | 201,180 | | | | | | (2,241,012) | | | | | | (1,627,762) | | |
| 12/31/2018 | | | | | 106,531 | | | | | | — | | | | | | 20,943 | | | | | | (416,823) | | | | | | (289,349) | | | | | | 1,029,191 | | | | | | — | | | | | | 202,049 | | | | | | (4,023,906) | | | | | | (2,792,666) | | |
| Class I | | | | | | | | | | | | | | | | | | | | | | | | | | | | | | | | | | | | | | | | | | | | | | | | | | | | | | | | | | | | | |
| 12/31/2019 | | | | | 7,089,807 | | | | | | — | | | | | | 338,544 | | | | | | (7,771,113) | | | | | | (342,762) | | | | | | 71,343,640 | | | | | | — | | | | | | 3,405,088 | | | | | | (77,660,342) | | | | | | (2,911,614) | | |
| 12/31/2018 | | | | | 7,255,841 | | | | | | — | | | | | | 329,270 | | | | | | (6,778,612) | | | | | | 806,499 | | | | | | 71,412,856 | | | | | | — | | | | | | 3,241,396 | | | | | | (66,800,849) | | | | | | 7,853,403 | | |
| Class S | | | | | | | | | | | | | | | | | | | | | | | | | | | | | | | | | | | | | | | | | | | | | | | | | | | | | | | | | | | | | |
| 12/31/2019 | | | | | 1,202,703 | | | | | | — | | | | | | 118,672 | | | | | | (1,482,759) | | | | | | (161,384) | | | | | | 12,186,719 | | | | | | — | | | | | | 1,202,654 | | | | | | (15,011,516) | | | | | | (1,622,143) | | |
| 12/31/2018 | | | | | 752,352 | | | | | | — | | | | | | 116,839 | | | | | | (1,691,082) | | | | | | (821,891) | | | | | | 7,466,847 | | | | | | — | | | | | | 1,158,960 | | | | | | (16,772,716) | | | | | | (8,146,909) | | |
| U.S. Stock Index | |
| Class ADV | | | | | | | | | | | | | | | | | | | | | | | | | | | | | | | | | | | | | | | | | | | | | | | | | | | | | | | | | | | | | |
| 12/31/2019 | | | | | 555,076 | | | | | | — | | | | | | 438,702 | | | | | | (1,568,533) | | | | | | (574,755) | | | | | | 8,469,406 | | | | | | — | | | | | | 6,766,870 | | | | | | (23,904,340) | | | | | | (8,668,064) | | |
| 12/31/2018 | | | | | 481,218 | | | | | | — | | | | | | 508,638 | | | | | | (1,778,054) | | | | | | (788,198) | | | | | | 7,229,694 | | | | | | — | | | | | | 7,544,736 | | | | | | (27,144,431) | | | | | | (12,370,001) | | |
| Class I | | | | | | | | | | | | | | | | | | | | | | | | | | | | | | | | | | | | | | | | | | | | | | | | | | | | | | | | | | | | | |
| 12/31/2019 | | | | | 60,694,599 | | | | | | — | | | | | | 17,421,336 | | | | | | (52,302,066) | | | | | | 25,813,869 | | | | | | 983,475,304 | | | | | | — | | | | | | 280,363,883 | | | | | | (822,981,841) | | | | | | 440,857,346 | | |
| 12/31/2018 | | | | | 32,350,213 | | | | | | — | | | | | | 15,849,349 | | | | | | (55,847,056) | | | | | | (7,647,494) | | | | | | 497,912,308 | | | | | | — | | | | | | 241,875,952 | | | | | | (883,699,636) | | | | | | (143,911,376) | | |
| Class P2 | | | | | | | | | | | | | | | | | | | | | | | | | | | | | | | | | | | | | | | | | | | | | | | | | | | | | | | | | | | | | |
| 12/31/2019 | | | | | 47,769,380 | | | | | | — | | | | | | 9,196,809 | | | | | | (20,074,473) | | | | | | 36,891,716 | | | | | | 754,993,771 | | | | | | — | | | | | | 148,647,312 | | | | | | (318,047,628) | | | | | | 585,593,455 | | |
| 12/31/2018 | | | | | 39,278,304 | | | | | | — | | | | | | 7,144,924 | | | | | | (20,865,797) | | | | | | 25,557,431 | | | | | | 612,519,550 | | | | | | — | | | | | | 109,017,631 | | | | | | (329,420,625) | | | | | | 392,116,556 | | |
| Class S | | | | | | | | | | | | | | | | | | | | | | | | | | | | | | | | | | | | | | | | | | | | | | | | | | | | | | | | | | | | | |
| 12/31/2019 | | | | | 14,345,061 | | | | | | — | | | | | | 396,914 | | | | | | (1,334,663) | | | | | | 13,407,312 | | | | | | 238,856,166 | | | | | | — | | | | | | 6,466,557 | | | | | | (21,719,201) | | | | | | 223,603,522 | | |
| 12/31/2018 | | | | | 917,512 | | | | | | — | | | | | | 262,206 | | | | | | (2,765,324) | | | | | | (1,585,606) | | | | | | 14,441,478 | | | | | | — | | | | | | 3,983,988 | | | | | | (43,522,881) | | | | | | (25,097,415) | | |
| Class S2 | | | | | | | | | | | | | | | | | | | | | | | | | | | | | | | | | | | | | | | | | | | | | | | | | | | | | | | | | | | | | |
| 12/31/2019 | | | | | 654,067 | | | | | | — | | | | | | 645,397 | | | | | | (3,340,876) | | | | | | (2,041,412) | | | | | | 10,121,100 | | | | | | — | | | | | | 10,110,281 | | | | | | (51,646,786) | | | | | | (31,415,405) | | |
| 12/31/2018 | | | | | 939,572 | | | | | | — | | | | | | 800,753 | | | | | | (3,019,732) | | | | | | (1,279,407) | | | | | | 14,505,138 | | | | | | — | | | | | | 12,017,762 | | | | | | (46,907,695) | | | | | | (20,384,795) | | |
| Clarion Real Estate | |
| Class ADV | | | | | | | | | | | | | | | | | | | | | | | | | | | | | | | | | | | | | | | | | | | | | | | | | | | | | | | | | | | | | |
| 12/31/2019 | | | | | 122,043 | | | | | | — | | | | | | 41,563 | | | | | | (330,899) | | | | | | (167,293) | | | | | | 4,297,969 | | | | | | — | | | | | | 1,436,002 | | | | | | (11,385,004) | | | | | | (5,651,033) | | |
| 12/31/2018 | | | | | 99,786 | | | | | | — | | | | | | 255,048 | | | | | | (530,837) | | | | | | (176,003) | | | | | | 3,327,982 | | | | | | — | | | | | | 8,092,673 | | | | | | (17,297,135) | | | | | | (5,876,480) | | |
| Class I | | | | | | | | | | | | | | | | | | | | | | | | | | | | | | | | | | | | | | | | | | | | | | | | | | | | | | | | | | | | | |
| 12/31/2019 | | | | | 152,211 | | | | | | — | | | | | | 17,244 | | | | | | (802,224) | | | | | | (632,769) | | | | | | 5,565,892 | | | | | | — | | | | | | 626,652 | | | | | | (29,242,868) | | | | | | (23,050,324) | | |
| 12/31/2018 | | | | | 141,774 | | | | | | — | | | | | | 158,369 | | | | | | (1,691,012) | | | | | | (1,390,869) | | | | | | 4,863,797 | | | | | | — | | | | | | 5,278,443 | | | | | | (60,809,529) | | | | | | (50,667,289) | | |
| Class S | | | | | | | | | | | | | | | | | | | | | | | | | | | | | | | | | | | | | | | | | | | | | | | | | | | | | | | | | | | | | |
| 12/31/2019 | | | | | 186,835 | | | | | | — | | | | | | 164,792 | | | | | | (1,274,973) | | | | | | (923,346) | | | | | | 6,777,048 | | | | | | — | | | | | | 5,986,907 | | | | | | (46,338,103) | | | | | | (33,574,148) | | |
| 12/31/2018 | | | | | 148,358 | | | | | | — | | | | | | 910,495 | | | | | | (1,841,822) | | | | | | (782,969) | | | | | | 5,218,210 | | | | | | — | | | | | | 30,337,693 | | | | | | (63,290,411) | | | | | | (27,734,508) | | |
| Class S2 | | | | | | | | | | | | | | | | | | | | | | | | | | | | | | | | | | | | | | | | | | | | | | | | | | | | | | | | | | | | | |
| 12/31/2019 | | | | | 49,904 | | | | | | — | | | | | | 9,953 | | | | | | (106,580) | | | | | | (46,723) | | | | | | 1,851,374 | | | | | | — | | | | | | 359,516 | | | | | | (3,836,242) | | | | | | (1,625,352) | | |
| 12/31/2018 | | | | | 23,688 | | | | | | — | | | | | | 58,490 | | | | | | (110,129) | | | | | | (27,951) | | | | | | 813,955 | | | | | | — | | | | | | 1,937,174 | | | | | | (3,727,778) | | | | | | (976,649) | | |
| JPMorgan Small Cap Core Equity | |
| Class ADV | | | | | | | | | | | | | | | | | | | | | | | | | | | | | | | | | | | | | | | | | | | | | | | | | | | | | | | | | | | | | |
| 12/31/2019 | | | | | 401,726 | | | | | | — | | | | | | 2,259,407 | | | | | | (1,195,069) | | | | | | 1,466,064 | | | | | | 6,885,294 | | | | | | — | | | | | | 34,683,375 | | | | | | (20,300,223) | | | | | | 21,268,446 | | |
| 12/31/2018 | | | | | 697,387 | | | | | | — | | | | | | 865,438 | | | | | | (834,426) | | | | | | 728,399 | | | | | | 13,057,873 | | | | | | — | | | | | | 16,763,544 | | | | | | (16,260,829) | | | | | | 13,560,588 | | |
| Class I | | | | | | | | | | | | | | | | | | | | | | | | | | | | | | | | | | | | | | | | | | | | | | | | | | | | | | | | | | | | | |
| 12/31/2019 | | | | | 3,148,820 | | | | | | — | | | | | | 3,686,325 | | | | | | (1,772,364) | | | | | | 5,062,781 | | | | | | 61,273,417 | | | | | | — | | | | | | 61,361,495 | | | | | | (32,081,291) | | | | | | 90,553,621 | | |
| 12/31/2018 | | | | | 1,069,628 | | | | | | — | | | | | | 1,171,916 | | | | | | (1,257,213) | | | | | | 984,331 | | | | | | 22,820,403 | | | | | | — | | | | | | 24,223,499 | | | | | | (26,094,331) | | | | | | 20,949,571 | | |
| Class R6 | | | | | | | | | | | | | | | | | | | | | | | | | | | | | | | | | | | | | | | | | | | | | | | | | | | | | | | | | | | | | |
| 12/31/2019 | | | | | 659,970 | | | | | | — | | | | | | 548,604 | | | | | | (271,262) | | | | | | 937,312 | | | | | | 12,104,470 | | | | | | — | | | | | | 9,098,340 | | | | | | (4,926,046) | | | | | | 16,276,764 | | |
| 12/31/2018 | | | | | 625,694 | | | | | | — | | | ��� | | | 136,181 | | | | | | (140,544) | | | | | | 621,331 | | | | | | 13,183,474 | | | | | | — | | | | | | 2,813,490 | | | | | | (2,961,018) | | | | | | 13,035,946 | | |
| Class S | | | | | | | | | | | | | | | | | | | | | | | | | | | | | | | | | | | | | | | | | | | | | | | | | | | | | | | | | | | | | |
| 12/31/2019 | | | | | 658,703 | | | | | | — | | | | | | 5,496,427 | | | | | | (17,703,790) | | | | | | (11,548,660) | | | | | | 12,062,734 | | | | | | — | | | | | | 90,163,666 | | | | | | (287,137,394) | | | | | | (184,910,994) | | |
| 12/31/2018 | | | | | 2,024,662 | | | | | | — | | | | | | 2,319,873 | | | | | | (2,960,199) | | | | | | 1,384,336 | | | | | | 42,016,660 | | | | | | — | | | | | | 47,325,409 | | | | | | (60,041,906) | | | | | | 29,300,163 | | |
NOTES TO FINANCIAL STATEMENTS as of December 31, 2019 (continued)
NOTE 9 — CAPITAL SHARES (continued)
| | | | Shares
sold | | | Shares
issued
in merger | | | Reinvestment
of
distributions | | | Shares
redeemed | | | Net increase
(decrease)
in shares
outstanding | | | Shares
sold | | | Proceeds
from shares
issued in
merger | | | Reinvestment
of
distributions | | | Shares
redeemed | | | Net increase
(decrease) | |
Year or
period ended | | | # | | | # | | | # | | | # | | | # | | | ($) | | | ($) | | | ($) | | | ($) | | | ($) | |
| JPMorgan Small Cap Core Equity (continued) | |
| Class S2 | | | | | | | | | | | | | | | | | | | | | | | | | | | | | | | | | | | | | | | | | | | | | | | | | | | | | | | | | | | | | |
| 12/31/2019 | | | | | 66,390 | | | | | | — | | | | | | 471,344 | | | | | | (1,633,302) | | | | | | (1,095,568) | | | | | | 1,210,000 | | | | | | — | | | | | | 7,636,142 | | | | | | (26,108,989) | | | | | | (17,262,847) | | |
| 12/31/2018 | | | | | 66,344 | | | | | | — | | | | | | 206,535 | | | | | | (304,232) | | | | | | (31,353) | | | | | | 1,321,425 | | | | | | — | | | | | | 4,165,809 | | | | | | (6,272,138) | | | | | | (784,904) | | |
NOTE 10 — SECURITIES LENDING
Under a Master Securities Lending Agreement (the “Agreement”) with BNY, the Portfolios can lend their securities to approved brokers, dealers and other financial institutions. Loans are collateralized by cash and U.S. government securities. The collateral is equal to at least 105% of the market value of non-U.S. securities loaned and 102% of the market value of U.S. securities loaned. The market value of the loaned securities is determined at Market Close of the Portfolios at their last sale price or official closing price on the principal exchange or system on which they are traded and any additional collateral is delivered to the Portfolios on the next business day. The cash collateral received is invested in approved investments as defined in the Agreement with BNY. The Portfolios bear the risk of loss with respect to the investment of collateral with the following exception: BNY provides the Portfolios indemnification from loss with respect to the investment of collateral to the extent the cash collateral is invested in overnight repurchase agreements.
Cash collateral received in connection with securities lending is invested in cash equivalents, money market funds, repurchase agreements with maturities of not more than 99 days that are collateralized with U.S. Government securities, or certain short-term investments that have a remaining maturity of 190 days or less (“Permitted Investments”). Short-term investments include: securities, units, shares or other participations in short-term investment funds, pools or trusts; commercial paper, notes, bonds or other debt obligations, certificates of deposit, time deposits and other bank obligations and asset-backed commercial paper backed by diversified receivables and repurchase-backed programs. Permitted Investments are subject to certain guidelines established by the Adviser regarding liquidity, diversification, credit quality and average credit life/duration requirements. The securities purchased with cash collateral received are reflected in the Portfolio of Investments under Short-Term Investments.
Generally, in the event of counterparty default, the Portfolios have the right to use the collateral to offset losses incurred. The Agreement contains certain guarantees by BNY in the event of counterparty default and/or a borrower’s failure to return a loaned security; however, there would be a potential loss to the Portfolios in the event the Portfolios are delayed or prevented from exercising its right to dispose of the collateral. Engaging in securities lending could have a leveraging effect, which may intensify the credit, market and other risks associated with investing in a Portfolio.
The following tables represent a summary of each respective Portfolio’s securities lending agreements by counterparty which are subject to offset under the Agreement as of December 31, 2019:
Balanced Income
| Counterparty | | | Securities
Loaned at
Value | | | Cash
Collateral
Received(1) | | | Net
Amount | |
| Barclays Bank PLC | | | | $ | 90,035 | | | | | $ | (90,035) | | | | | $ | — | | |
| Citigroup Global Markets Inc | | | | | 419,743 | | | | | | (419,743) | | | | | | — | | |
| Citigroup Global Markets Limited | | | | | 131,542 | | | | | | (131,542) | | | | | | — | | |
| Cowen Execution Services LLC | | | | | 103,927 | | | | | | (103,927) | | | | | | — | | |
| Goldman Sachs & Co. LLC | | | | | 627,247 | | | | | | (627,247) | | | | | | — | | |
| J.P. Morgan Securities LLC | | | | | 128,936 | | | | | | (128,936) | | | | | | — | | |
| Janney Montgomery Scott LLC | | | | | 20,133 | | | | | | (20,133) | | | | | | — | | |
| Morgan Stanley & Co. LLC | | | | | 186,262 | | | | | | (186,262) | | | | | | — | | |
| RBC Dominion Securities Inc | | | | | 107,106 | | | | | | (107,106) | | | | | | — | | |
| TD Securities (USA) Inc | | | | | 199,973 | | | | | | (199,973) | | | | | | — | | |
| UBS Securities LLC | | | | | 89,843 | | | | | | (89,843) | | | | | | — | | |
| Wells Fargo Securities LLC | | | | | 4,258 | | | | | | (4,258) | | | | | | — | | |
| Total | | | | $ | 2,109,005 | | | | | $ | (2,109,005) | | | | | $ | — | | |
(1)
Collateral with a fair value of $2,178,222 has been received in connection with the above securities lending transactions. Excess collateral received from the individual counterparty is not shown for financial reporting purposes.
NOTES TO FINANCIAL STATEMENTS as of December 31, 2019 (continued)
NOTE 10 — SECURITIES LENDING (continued)
High Yield
| Counterparty | | | Securities
Loaned at
Value | | | Cash
Collateral
Received(1) | | | Net
Amount | |
| Barclays Bank PLC | | | | $ | 8,427 | | | | | $ | (8,427) | | | | | $ | — | | |
| Barclays Capital Inc | | | | | 9,518,628 | | | | | | (9,518,628) | | | | | | — | | |
| BNP Paribas | | | | | 4,752,867 | | | | | | (4,752,867) | | | | | | — | | |
| BNP Paribas Prime Brokerage Intl Ltd | | | | | 4,702,882 | | | | | | (4,702,882) | | | | | | — | | |
| BofA Securities Inc | | | | | 13,725,491 | | | | | | (13,725,491) | | | | | | — | | |
| Citadel Clearing LLC | | | | | 3,816,350 | | | | | | (3,816,350) | | | | | | — | | |
| Citigroup Global Markets Inc | | | | | 6,068,717 | | | | | | (6,068,717) | | | | | | — | | |
| Cowen Execution Services LLC | | | | | 1,856,985 | | | | | | (1,856,985) | | | | | | — | | |
| Credit Suisse Securities (USA) LLC | | | | | 505,064 | | | | | | (505,064) | | | | | | — | | |
| Deutsche Bank Securities Inc | | | | | 4,585,342 | | | | | | (4,585,342) | | | | | | — | | |
| Goldman Sachs & Co. LLC | | | | | 13,847,769 | | | | | | (13,847,769) | | | | | | — | | |
| J.P. Morgan Securities LLC | | | | | 23,742,157 | | | | | | (23,742,157) | | | | | | — | | |
| Morgan Stanley & Co. LLC | | | | | 4,930,818 | | | | | | (4,930,818) | | | | | | — | | |
Nomura Securities International,
Inc | | | | | 1,071,430 | | | | | | (1,071,430) | | | | | | — | | |
| RBC Capital Markets, LLC | | | | | 2,704,662 | | | | | | (2,704,662) | | | | | | — | | |
| RBC Dominion Securities Inc | | | | | 5,252,815 | | | | | | (5,252,815) | | | | | | — | | |
| Scotia Capital (USA) Inc | | | | | 394,841 | | | | | | (394,841) | | | | | | — | | |
| State Street Bank and Trust Company | | | | | 125,530 | | | | | | (125,530) | | | | | | — | | |
| SunTrust Robinson Humphrey, Inc | | | | | 1,112,580 | | | | | | (1,112,580) | | | | | | — | | |
| TD Securities (USA) Inc | | | | | 807,666 | | | | | | (807,666) | | | | | | — | | |
| Wells Fargo Securities LLC | | | | | 12,268,601 | | | | | | (12,268,601) | | | | | | — | | |
| Total | | | | $ | 115,799,622 | | | | | $ | (115,799,622) | | | | | $ | — | | |
(1)
Collateral with a fair value of $118,699,752 has been received in connection with the above securities lending transactions. Excess collateral received from the individual counterparty is not shown for financial reporting purposes.
Large Cap Growth
| Counterparty | | | Securities
Loaned at
Value | | | Cash
Collateral
Received(1) | | | Net
Amount | |
| BofA Securities Inc | | | | $ | 14,613,174 | | | | | $ | (14,613,174) | | | | | $ | — | | |
| Citigroup Global Markets Inc | | | | | 5,837,390 | | | | | | (5,837,390) | | | | | | — | | |
| J.P. Morgan Securities LLC | | | | | 12,280,566 | | | | | | (12,280,566) | | | | | | — | | |
| Wells Fargo Securities LLC | | | | | 350,991 | | | | | | (350,991) | | | | | | — | | |
| Total | | | | $ | 33,082,121 | | | | | $ | (33,082,121) | | | | | $ | — | | |
(1)
Collateral with a fair value of $33,895,651 has been received in connection with the above securities lending transactions. Excess collateral received from the individual counterparty is not shown for financial reporting purposes.
Large Cap Value
| Counterparty | | | Securities
Loaned at
Value | | | Cash
Collateral
Received(1) | | | Net
Amount | |
| Barclays Capital Inc | | | | $ | 98,496 | | | | | $ | (98,496) | | | | | $ | — | | |
| BofA Securities Inc | | | | | 9,132,022 | | | | | | (9,132,022) | | | | | | — | | |
| Citigroup Global Markets Inc | | | | | 3,642,113 | | | | | | (3,642,113) | | | | | | — | | |
| J.P. Morgan Securities LLC | | | | | 10,363,121 | | | | | | (10,363,121) | | | | | | — | | |
| Janney Montgomery Scott LLC | | | | | 2,356,380 | | | | | | (2,356,380) | | | | | | — | | |
National Bank of Canada Financial
Inc | | | | | 109,706 | | | ��� | | | (109,706) | | | | | | — | | |
| Scotia Capital (USA) Inc | | | | | 2,693,051 | | | | | | (2,693,051) | | | | | | — | | |
| TD Prime Services LLC | | | | | 1,379,206 | | | | | | (1,379,206) | | | | | | — | | |
| UBS AG | | | | | 102,874 | | | | | | (102,874) | | | | | | — | | |
| Wells Fargo Bank NA | | | | | 594,895 | | | | | | (594,895) | | | | | | — | | |
| Total | | | | $ | 30,471,864 | | | | | $ | (30,471,864) | | | | | $ | — | | |
(1)
Collateral with a fair value of $31,192,985 has been received in connection with the above securities lending transactions. Excess collateral received from the individual counterparty is not shown for financial reporting purposes.
Limited Maturity Bond
| Counterparty | | | Securities
Loaned at
Value | | | Cash
Collateral
Received(1) | | | Net
Amount | |
| Barclays Capital Inc | | | | $ | 4,972 | | | | | $ | (4,972) | | | | | $ | — | | |
| Total | | | | $ | 4,972 | | | | | $ | (4,972) | | | | | $ | — | | |
(1)
Collateral with a fair value of $3,127 has been received in connection with the above securities lending transactions. Excess collateral received from the individual counterparty is not shown for financial reporting purposes.
U.S. Stock Index
| Counterparty | | | Securities
Loaned at
Value | | | Cash
Collateral
Received(1) | | | Net
Amount | |
| BMO Capital Markets Corp | | | | $ | 577,824 | | | | | $ | (577,824) | | | | | $ | — | | |
BNP Paribas Prime Brokerage Intl
Ltd | | | | | 1,407,613 | | | | | | (1,407,613) | | | | | | — | | |
| BofA Securities Inc | | | | | 2,764,103 | | | | | | (2,764,103) | | | | | | — | | |
| Citadel Clearing LLC | | | | | 3,975,845 | | | | | | (3,975,845) | | | | | | — | | |
| Citadel Securities LLC | | | | | 5,145,194 | | | | | | (5,145,194) | | | | | | — | | |
| Citigroup Global Markets Inc | | | | | 8,134,851 | | | | | | (8,134,851) | | | | | | — | | |
| Credit Suisse AG | | | | | 917,280 | | | | | | (917,280) | | | | | | — | | |
| Goldman Sachs & Co. LLC | | | | | 5,753,236 | | | | | | (5,753,236) | | | | | | — | | |
| J.P. Morgan Securities LLC | | | | | 9,893,287 | | | | | | (9,893,287) | | | | | | — | | |
| Jefferies LLC | | | | | 132,883 | | | | | | (132,883) | | | | | | — | | |
| Morgan Stanley & Co. LLC | | | | | 11,679,720 | | | | | | (11,679,720) | | | | | | — | | |
National Bank of Canada Financial
Inc | | | | | 416,798 | | | | | | (416,798) | | | | | | — | | |
NOTES TO FINANCIAL STATEMENTS as of December 31, 2019 (continued)
NOTE 10 — SECURITIES LENDING (continued)
U.S. Stock Index (continued)
| Counterparty | | | Securities
Loaned at
Value | | | Cash
Collateral
Received(1) | | | Net
Amount | |
| National Financial Services LLC | | | | | 1,941,539 | | | | | | (1,941,539) | | | | | | — | | |
| RBC Capital Markets, LLC | | | | | 145,543 | | | | | | (145,543) | | | | | | — | | |
| Scotia Capital (USA) Inc | | | | | 830,529 | | | | | | (830,529) | | | | | | — | | |
| State Street Bank and Trust Company | | | | | 11,868,597 | | | | | | (11,868,597) | | | | | | — | | |
| TD Prime Services LLC | | | | | 1,795,790 | | | | | | (1,795,790) | | | | | | — | | |
| UBS Securities LLC | | | | | 4,679,821 | | | | | | (4,679,821) | | | | | | — | | |
| Wells Fargo Bank NA | | | | | 3,145,321 | | | | | | (3,145,321) | | | | | | — | | |
| Wells Fargo Securities LLC | | | | | 3,104,620 | | | | | | (3,104,620) | | | | | | — | | |
| Total | | | | $ | 78,310,394 | | | | | $ | (78,310,394) | | | | | $ | — | | |
| |
(1)
Collateral with a fair value of $80,158,367 has been received in connection with the above securities lending transactions. Excess collateral received from the individual counterparty is not shown for financial reporting purposes.
Clarion Real Estate
| Counterparty | | | Securities
Loaned at
Value | | | Cash
Collateral
Received(1) | | | Net
Amount | |
| National Bank of Canada Financial Inc | | | | $ | 5,356,212 | | | | | $ | (5,356,212) | | | | | $ | — | | |
| Total | | | | $ | 5,356,212 | | | | | $ | (5,356,212) | | | | | $ | — | | |
(1)
Collateral with a fair value of $5,500,430 has been received in connection with the above securities lending transactions. Excess collateral received from the individual counterparty is not shown for financial reporting purposes.
JPMorgan Small Cap Core Equity
| Counterparty | | | Securities
Loaned at
Value | | | Cash
Collateral
Received(1) | | | Net
Amount | |
| Barclays Capital Inc | | | | $ | 452,930 | | | | | $ | (452,930) | | | | | $ | — | | |
| BMO Capital Markets Corp | | | | | 7,617 | | | | | | (7,617) | | | | | | — | | |
| BofA Securities Inc | | | | | 304,634 | | | | | | (304,634) | | | | | | — | | |
| Citadel Clearing LLC | | | | | 4,468,544 | | | | | | (4,468,544) | | | | | | — | | |
| Citadel Securities LLC | | | | | 36,575 | | | | | | (36,575) | | | | | | — | | |
| Citigroup Global Markets Inc | | | | | 479,697 | | | | | | (479,697) | | | | | | — | | |
| Credit Suisse AG | | | | | 803,820 | | | | | | (803,820) | | | | | | — | | |
| Counterparty | | | Securities
Loaned at
Value | | | Cash
Collateral
Received(1) | | | Net
Amount | |
| Credit Suisse Securities (USA) LLC | | | | | 44,746 | | | | | | (44,746) | | | | | | — | | |
| Daiwa Capital Markets America Inc | | | | | 203,422 | | | | | | (203,422) | | | | | | — | | |
| Goldman Sachs &Co. LLC | | | | | 423,173 | | | | | | (423,173) | | | | | | — | | |
| HSBC Bank PLC | | | | | 6,768 | | | | | | (6,768) | | | | | | — | | |
| Industrial And Commercial Bank Of China | | | | | 257,507 | | | | | | (257,507) | | | | | | — | | |
| Jefferies LLC | | | | | 23,723 | | | | | | (23,723) | | | | | | — | | |
| Morgan Stanley & Co. LLC | | | | | 1,682,077 | | | | | | (1,682,077) | | | | | | — | | |
National Bank of Canada Financial
Inc | | | | | 951,395 | | | | | | (951,395) | | | | | | — | | |
| National Financial Services LLC | | | | | 3,857,651 | | | | | | (3,857,651) | | | | | | — | | |
| Scotia Capital (USA) Inc | | | | | 1,486,428 | | | | | | (1,486,428) | | | | | | — | | |
| SG Americas Securities, LLC | | | | | 186 | | | | | | (186) | | | | | | — | | |
| State Street Bank and Trust Company | | | | | 150,736 | | | | | | (150,736) | | | | | | — | | |
| Wells Fargo Securities LLC | | | | | 298,703 | | | | | | (298,703) | | | | | | — | | |
| Total | | | | $ | 15,940,332 | | | | | $ | (15,940,332) | | | | | $ | — | | |
| |
(1)
Collateral with a fair value of $16,382,548 has been received in connection with the above securities lending transactions. Excess collateral received from the individual counterparty is not shown for financial reporting purposes.
NOTE 11 — FEDERAL INCOME TAXES
The amount of distributions from net investment income and net realized capital gains are determined in accordance with federal income tax regulations, which may differ from GAAP for investment companies. These book/tax differences may be either temporary or permanent. Permanent differences are reclassified within the capital accounts based on their federal tax-basis treatment; temporary differences are not reclassified. Key differences include the treatment of short-term capital gains, foreign currency transactions, paydowns, and wash sale deferrals. Distributions in excess of net investment income and/or net realized capital gains for tax purposes are reported as return of capital.
Dividends paid by the Portfolios from net investment income and distributions of net realized short-term capital gains are, for federal income tax purposes, taxable as ordinary income to shareholders.
NOTES TO FINANCIAL STATEMENTS as of December 31, 2019 (continued)
NOTE 11 — FEDERAL INCOME TAXES (continued)
The tax composition of dividends and distributions to shareholders was as follows:
| | | | Year Ended
December 31, 2019 | | | Year Ended
December 31, 2018 | |
| | | | Ordinary
Income | | | Long-term
Capital Gains | | | Return of Capital | | | Ordinary
Income | | | Long-term
Capital Gains | |
| Balanced Income | | | | $ | 17,507,119 | | | | | $ | 22,330,665 | | | | | $ | — | | | | | $ | 21,388,006 | | | | | $ | — | | |
| High Yield | | | | | 27,626,712 | | | | | | — | | | | | | — | | | | | | 29,906,645 | | | | | | — | | |
| Large Cap Growth | | | | | 92,570,069 | | | | | | 861,560,330 | | | | | | — | | | | | | 100,614,276 | | | | | | 738,363,692 | | |
| Large Cap Value | | | | | 20,135,479 | | | | | | 75,474,848 | | | | | | — | | | | | | 36,185,341 | | | | | | 113,218,192 | | |
| Limited Maturity Bond | | | | | 4,822,692 | | | | | | — | | | | | | — | | | | | | 4,602,405 | | | | | | — | | |
| U.S. Stock Index | | | | | 102,304,549 | | | | | | 350,050,354 | | | | | | — | | | | | | 90,048,735 | | | | | | 284,391,334 | | |
| Clarion Real Estate | | | | | 6,789,635 | | | | | | 1,619,442 | | | | | | — | | | | | | 9,797,840 | | | | | | 35,848,143 | | |
| JPMorgan Small Cap Core Equity | | | | | 17,498,317 | | | | | | 175,897,372 | | | | | | 9,547,328 | | | | | | 16,561,211 | | | | | | 78,730,540 | | |
The tax-basis components of distributable earnings and the capital loss carryforwards which may be used to offset future realized capital gains for federal income tax purposes as of December 31, 2019 were:
| | | | Undistributed
Ordinary Income | | | Undistributed
Long-term
Capital Gains | | | Unrealized
Appreciation/
(Depreciation) | | | Capital Loss Carryforwards | |
| | | | Amount | | | Character | | | Expiration | |
| Balanced Income | | | | $ | 21,831,849 | | | | | $ | 14,167,103 | | | | | $ | 18,069,843 | | | | | | — | | | | — | | | | | — | | |
| High Yield | | | | | 173,288 | | | | | | — | | | | | | 16,758,916 | | | | | $ | (1,630,216) | | | | Short-term | | | | | None | | |
| | | | | | | | | | | | | | | | | | | | | | | | (36,518,131) | | | | Long-term | | | | | None | | |
| | | | | | | | | | | | | | | | | | | | | | | $ | (38,148,347) | | | | | | | | | | | |
| Large Cap Growth | | | | | 31,894,555 | | | | | | 669,794,412 | | | | | | 1,183,390,589 | | | | | | — | | | | — | | | | | — | | |
| Large Cap Value | | | | | 3,944,962 | | | | | | 85,409,561 | | | | | | 117,012,757 | | | | | | — | | | | — | | | | | — | | |
| Limited Maturity Bond | | | | | 3,427,298 | | | | | | — | | | | | | 1,447,797 | | | | | $ | (826,824) | | | | Short-term | | | | | None | | |
| | | | | | | | | | | | | | | | | | | | | | | | (2,362,268) | | | | Long-term | | | | | None | | |
| | | | | | | | | | | | | | | | | | | | | | | $ | (3,189,092) | | | | | | | | | | | |
| U.S. Stock Index | | | | | 26,966,468 | | | | | | 271,466,903 | | | | | | 2,616,351,356 | | | | | | — | | | | — | | | | | — | | |
| Clarion Real Estate | | | | | 14,812,854 | | | | | | 18,855,671 | | | | | | 31,412,215 | | | | | | — | | | | — | | | | | — | | |
| JPMorgan Small Cap Core Equity | | | | | — | | | | | | — | | | | | | 81,696,538 | | | | | | — | | | | — | | | | | — | | |
The Portfolios’ major tax jurisdictions are U.S. federal, Arizona state, and Massachusetts state.
As of December 31, 2019, no provision for income tax is required in the Portfolios’ financial statements as a result of tax positions taken on federal and state income tax returns for open tax years. The Portfolios’ federal and state income and federal excise tax returns for tax years for which the applicable statutes of limitations have not expired are subject to examination by the Internal Revenue Service and state department of revenue. Generally, the earliest tax year that remains subject to examination by these jurisdictions is 2015.
NOTE 12 — OTHER ACCOUNTING PRONOUNCEMENTS
The Portfolios have made a change in accounting principle and adopted the provisions of Financial Accounting Standards Board (“FASB”) Accounting Standards Update 2017-08 (“ASU 2017-08”), Premium Amortization on Purchased Callable Debt Securities. ASU 2017-08 shortens the amortization period for certain callable debt securities held at a premium; specifically, requiring the premium to be amortized to the earliest call date. Prior to ASU 2017-08, premiums on callable debt securities were generally amortized to maturity date. ASU 2017-08 is intended to more closely align the amortization period with
the expectations incorporated into the market pricing on the underlying security. ASU 2017-08 does not require an accounting change for securities held at a discount; the discount continues to be amortized to maturity date. Upon evaluation, with the exception of High Yield, the Portfolios have concluded that the change in accounting principle does not materially impact the financial statement amounts. As a result of the adoption of ASU 2017-08 effective as of January 1, 2019, the amortized cost basis of investments for High Yield was reduced by $170,023 and unrealized appreciation of investments was increased by $170,023.
NOTES TO FINANCIAL STATEMENTS as of December 31, 2019 (continued)
NOTE 12 — OTHER ACCOUNTING PRONOUNCEMENTS (continued)
Also, in August 2018, the FASB issued Accounting Standards Update 2018-13, Fair Value Measurement (Topic 820): Disclosure Framework — Changes to the Disclosure Requirements for Fair Value Measurement (“ASU 2018-13”). The update provides guidance that eliminates, adds and modifies certain disclosure requirements for fair value measurements. ASU 2018-13 will be effective for annual periods beginning after December 15, 2019 and interim periods within those annual periods. At this time, the Portfolios have elected to early adopt the amendments that allow for removal of disclosure requirements related to transfers between Level 1 and Level 2 of the fair value hierarchy and the timing of transfers between levels of the fair value hierarchy. These changes did not have a material impact on the Portfolios’ financial statements. The Portfolios plan to adopt the amendments that require additional fair value measurement disclosures for annual periods beginning after December 15, 2019, and interim periods within those annual periods. The Portfolios are currently evaluating the impact of these changes on the financial statements.
NOTE 13 — REORGANIZATION
On August 23, 2019, High Yield (“Acquiring Portfolio”) acquired all of the net assets and assumed all liabilities of VY® Pioneer High Yield Portfolio (“Acquired Portfolio”), an open-end investment company that is not included in this report, in a tax-free reorganization in exchange for shares of the Acquiring Portfolio, pursuant to a plan of reorganization approved by the shareholders of the Acquired Portfolio on July 30, 2019. For financial reporting purposes, assets received and shares issued by the Acquiring Portfolio were recorded at fair value; however, the cost basis of the investments received from the Acquired Portfolio were carried forward to align ongoing reporting of the Acquiring Portfolio’s realized and unrealized gains and losses with amounts distributable to shareholders for tax purposes.
Assuming the acquisition had been completed on January 1, 2019, the beginning of the annual reporting period of the Acquiring Portfolio, the Acquiring Portfolio’s pro forma results of operations for the year ended December 31, 2019, are as follows (Unaudited):
| | Net investment income | | | | $ | 32,344,944 | | |
| | Net realized and unrealized loss on investments | | | | $ | 49,001,240 | | |
| | Net decrease in net assets resulting from operations | | | | $ | 81,346,184 | | |
Because the combined investment portfolios have been managed as a single integrated portfolio since the acquisition was completed, it is not practicable to separate
the amounts of revenue and earnings of the Acquired Portfolio that have been included in the Acquiring Portfolio’s statement of operations since August 23, 2019. Net assets and unrealized appreciation or depreciation as of the reorganization date were as follows:
| | Total Net
Assets of
Acquired
Portfolio
(000s) | | | Total Net
Assets of
Acquiring
Portfolio
(000s) | | | Acquired
Portfolio’s
Capital Loss
Carryforwards
(000s) | | | Acquired
Portfolio’s
Unrealized
Depreciation
(000s) | | | Portfolios’
Conversion
Ratio | |
| | $98,023 | | | | $ | 492,447 | | | | | $ | 3,146 | | | | | $ | 911 | | | | | | 1.1651 | | |
The net assets of the Acquiring Portfolio after the acquisition of Acquired Portfolio were $590,470,175.
NOTE 14 — AUDITOR CHANGE (Unaudited)
On September 12, 2019, KPMG LLP (“KPMG”) was dismissed as the independent registered public accounting firm to the Trust, on behalf of the Portfolios, upon completion of the audit for the fiscal year ended December 31, 2019. The decision to change independent registered public accounting firms was recommended by the Audit Committee of the Board and was approved by the Board.
KPMG’s reports on the Portfolios’ financial statements for the fiscal years ended December 31, 2019 and December 31, 2018 contained no adverse opinion or disclaimer of opinion nor were they qualified or modified as to uncertainty, audit scope or accounting principle.
During the fiscal years ended December 31, 2019 and December 31, 2018: (i) there were no disagreements with KPMG on any matter of accounting principles or practices, financial statement disclosure or auditing scope or procedure, which disagreements, if not resolved to the satisfaction of KPMG, would have caused KPMG to make reference to the subject matter of the disagreements in connection with its reports on the Portfolios’ financial statements for such periods; and (ii) there were no “reportable events” of the kind described in Item 304(a)(1)(v) of Regulation S-K under the Securities Exchange Act of 1934, as amended.
On September 12, 2019, based on the recommendation of the Audit Committee of the Board, the Board approved the selection of Ernst & Young LLP (“EY”) as the Portfolios’ independent registered public accounting firm for the fiscal year ending December 31, 2020. During the Portfolios’ fiscal years ended December 31, 2019 and December 31, 2018, neither the Portfolios, nor anyone on their behalf, consulted with EY on items which: (i) concerned the application of accounting principles to a specified transaction, either completed or proposed, or the type of audit opinion that might be rendered on the Portfolios’ financial statements; or (ii) concerned the subject of a
NOTES TO FINANCIAL STATEMENTS as of December 31, 2019 (continued)
NOTE 14 — AUDITOR CHANGE (Unaudited) (continued)
disagreement (as described in paragraph (a)(1)(iv) of Item 304 of Regulation S-K) or reportable events (as described in paragraph (a)(1)(v) of said Item 304).
NOTE 15 — SUBSEQUENT EVENTS
Dividends: Subsequent to December 31, 2019, the following Portfolios paid dividends from net investment income of:
| | | | Per Share
Amount | | | Payable
Date | | | Record
Date | |
| High Yield | | | | | | | | | | | | | | | | |
| Class ADV | | | | $ | 0.0415 | | | | February 3, 2020 | | | | | Daily | | |
| Class I | | | | $ | 0.0466 | | | | February 3, 2020 | | | | | Daily | | |
| Class S | | | | $ | 0.0445 | | | | February 3, 2020 | | | | | Daily | | |
| Class S2 | | | | $ | 0.0433 | | | | February 3, 2020 | | | | | Daily | | |
| | | | Per Share
Amount | | | Payable
Date | | | Record
Date | |
| Limited Maturity Bond | | | | | | | | | | | | | | | | |
| Class ADV | | | | $ | 0.0136 | | | | February 3, 2020 | | | | | Daily | | |
| Class I | | | | $ | 0.0191 | | | | February 3, 2020 | | | | | Daily | | |
| Class S | | | | $ | 0.0171 | | | | February 3, 2020 | | | | | Daily | | |
Management Fee Waiver: The Board approved an increase to the management fee waiver for Clarion Real Estate. Effective January 1, 2020, the Investment Adviser is contractually obligated to waive 0.067% of the management fee for the Portfolio. This waiver is not eligible for recoupment.
The Portfolios have evaluated events occurring after the Statements of Assets and Liabilities date (“subsequent events”) to determine whether any subsequent events necessitated adjustment to or disclosure in the financial statements. Other than above, no such subsequent events were identified.
SUMMARY PORTFOLIO OF INVESTMENTS
| Voya Balanced Income Portfolio | as of December 31, 2019 |
| Shares | | | Value | | | Percentage
of Net
Assets | |
| COMMON STOCK: 39.4% | |
| | | | Communication Services: 2.5% | |
| 50,031 | | | AT&T, Inc. | | | | $ | 1,955,211 | | | | | | 0.5 | | |
| 24,462 (1) | | | Auto Trader Group PLC | | | | | 193,181 | | | | | | 0.1 | | |
| 27,609 | | | Verizon Communications,
Inc. | | | | | 1,695,193 | | | | | | 0.4 | | |
| 521,090 (2) | | | Other Securities | | | | | 5,683,813 | | | | | | 1.5 | | |
| | | | | | | | | 9,527,398 | | | | | | 2.5 | | |
| | | | Consumer Discretionary: 3.4% | |
| 442,195 (3) | | | Other Securities | | | | | 13,202,828 | | | | | | 3.4 | | |
| | | | | |
| | | | Consumer Staples: 3.3% | |
| 10,732 | | | PepsiCo, Inc. | | | | | 1,466,742 | | | | | | 0.4 | | |
| 15,590 | | | Philip Morris International,
Inc. | | | | | 1,326,553 | | | | | | 0.3 | | |
| 15,784 | | | Procter & Gamble Co. | | | | | 1,971,422 | | | | | | 0.5 | | |
| 229,958 | | | Other Securities | | | | | 8,153,001 | | | | | | 2.1 | | |
| | | | | | | | | 12,917,718 | | | | | | 3.3 | | |
| | | | Energy: 1.6% | |
| 12,916 | | | Chevron Corp. | | | | | 1,556,507 | | | | | | 0.4 | | |
| 203,010 (3) | | | Other Securities | | | | | 4,762,078 | | | | | | 1.2 | | |
| | | | | | | | | 6,318,585 | | | | | | 1.6 | | |
| | | | Financials: 5.4% | |
| 10,296 (1) | | | ABN AMRO Bank NV | | | | | 187,659 | | | | | | 0.1 | | |
| 17,068 | | | JPMorgan Chase & Co. | | | | | 2,379,279 | | | | | | 0.6 | | |
| 24,698 | | | Wells Fargo & Co. | | | | | 1,328,753 | | | | | | 0.3 | | |
| 827,815 (3) | | | Other Securities | | | | | 17,172,908 | | | | | | 4.4 | | |
| | | | | | | | | 21,068,599 | | | | | | 5.4 | | |
| | | | Health Care: 5.2% | |
| 14,846 | | | AbbVie, Inc. | | | | | 1,314,465 | | | | | | 0.3 | | |
| 20,730 | | | Bristol-Myers Squibb Co. | | | | | 1,330,659 | | | | | | 0.4 | | |
| 16,102 | | | Johnson & Johnson | | | | | 2,348,799 | | | | | | 0.6 | | |
| 17,766 | | | Merck & Co., Inc. | | | | | 1,615,818 | | | | | | 0.4 | | |
| 41,014 | | | Pfizer, Inc. | | | | | 1,606,928 | | | | | | 0.4 | | |
| 131,888 | | | Other Securities | | | | | 12,067,379 | | | | | | 3.1 | | |
| | | | | | | | | 20,284,048 | | | | | | 5.2 | | |
| | | | Industrials: 4.0% | |
| 1,055 (1) | | | Aena SME SA | | | | | 202,263 | | | | | | 0.0 | | |
| 453,649 | | | Other Securities | | | | | 15,463,067 | | | | | | 4.0 | | |
| | | | | | | | | 15,665,330 | | | | | | 4.0 | | |
| | | | Information Technology: 9.5% | |
| 30,608 | | | Cisco Systems, Inc. | | | | | 1,467,960 | | | | | | 0.4 | | |
| 30,634 | | | Intel Corp. | | | | | 1,833,445 | | | | | | 0.5 | | |
| 35,478 | | | Microsoft Corp. | | | | | 5,594,880 | | | | | | 1.4 | | |
| 474,734 (2)(3) | | | Other Securities | | | | | 27,776,068 | | | | | | 7.2 | | |
| | | | | | | | | 36,672,353 | | | | | | 9.5 | | |
| Shares | | | Value | | | Percentage
of Net
Assets | |
| COMMON STOCK: (continued) | |
| | | | Materials: 1.1% | |
| 221,945 | | | Other Securities | | | | $ | 4,119,138 | | | | | | 1.1 | | |
| | | | | |
| | | | Real Estate: 1.7% | |
| 352,937 | | | Other Securities | | | | | 6,651,292 | | | | | | 1.7 | | |
| | | | Utilities: 1.7% | |
| 251,497 | | | Other Securities | | | | | 6,620,451 | | | | | | 1.7 | | |
| | | | Total Common Stock
(Cost $134,651,115) | | | | | 153,047,740 | | | | | | 39.4 | | |
| EXCHANGE-TRADED FUNDS: 0.6% | |
| 12,760 | | | iShares Russell 1000 ETF | | | | | 2,276,639 | | | | | | 0.6 | | |
| 1,034 | | | Other Securities | | | | | 71,801 | | | | | | 0.0 | | |
| | | | Total Exchange-Traded
Funds
(Cost $2,273,955) | | | | | 2,348,440 | | | | | | 0.6 | | |
| MUTUAL FUNDS: 8.5% | |
| | | | Affiliated Investment Companies: 8.5% | |
| 3,493,812 | | | Voya Floating Rate Fund -
Class P | | | | | 33,156,275 | | | | | | 8.5 | | |
| | | | Total Mutual Funds
(Cost $33,771,324) | | | | | 33,156,275 | | | | | | 8.5 | | |
| PREFERRED STOCK: 0.5% | |
| | | | Financials: 0.5% | |
| 50 (4)(5) | | | Fannie Mae | | | | | 2,012,442 | | | | | | 0.5 | | |
| | | | Total Preferred Stock
(Cost $4,100,000) | | | | | 2,012,442 | | | | | | 0.5 | | |
| RIGHTS: 0.0% | |
| | | | Energy: 0.0% | |
| 1,886 (2) | | | Other Securities | | | | | 895 | | | | | | 0.0 | | |
| | | | Total Rights
(Cost $892) | | | | | 895 | | | | | | 0.0 | | |
| |
Principal
Amount† | | | Value | | | Percentage
of Net
Assets | |
| CORPORATE BONDS/NOTES: 6.6% | |
| | | | Basic Materials: 0.5% | |
| 200,000 (1) | | | Celulosa Arauco y
Constitucion SA, 4.250%,
04/30/2029 | | | | | 203,569 | | | | | | 0.0 | | |
| 100,000 (1) | | | Compass Minerals
International, Inc., 6.750%,
12/01/2027 | | | | | 106,435 | | | | | | 0.0 | | |
| 250,000 (1) | | | Evraz PLC, 5.250%,
04/02/2024 | | | | | 271,606 | | | | | | 0.1 | | |
| 200,000 (1) | | | Gold Fields Orogen
Holdings BVI Ltd., 5.125%,
05/15/2024 | | | | | 214,017 | | | | | | 0.1 | | |
| 225,000 (1) | | | MMK International Capital
DAC, 4.375%, 06/13/2024 | | | | | 238,004 | | | | | | 0.1 | | |
See Accompanying Notes to Financial Statements
SUMMARY PORTFOLIO OF INVESTMENTS
| Voya Balanced Income Portfolio | as of December 31, 2019 (continued) |
Principal
Amount† | | | Value | | | Percentage
of Net
Assets | |
| CORPORATE BONDS/NOTES: (continued) | |
| | | | Basic Materials (continued) | |
| 100,000 (1) | | | Novelis Corp., 5.875%,
09/30/2026 | | | | $ | 106,643 | | | | | | 0.0 | | |
| 100,000 (1) | | | Schweitzer-Mauduit
International, Inc., 6.875%,
10/01/2026 | | | | | 108,035 | | | | | | 0.0 | | |
| 100,000 (1) | | | Tronox, Inc., 6.500%,
04/15/2026 | | | | | 103,272 | | | | | | 0.0 | | |
| 100,000 (1) | | | Univar Solutions USA, Inc.,
5.125%, 12/01/2027 | | | | | 104,563 | | | | | | 0.0 | | |
| 600,000 (3) | | | Other Securities | | | | | 639,493 | | | | | | 0.2 | | |
| | | | | | | | | 2,095,637 | | | | | | 0.5 | | |
| | | | Communications: 0.9% | |
| 100,000 (1) | | | Block Communications,
Inc., 6.875%, 02/15/2025 | | | | | 103,999 | | | | | | 0.0 | | |
| 100,000 (1) | | | CCO Holdings LLC / CCO
Holdings Capital Corp.,
5.750%, 02/15/2026 | | | | | 105,687 | | | | | | 0.1 | | |
| 86,000 (1) | | | Clear Channel Worldwide
Holdings, Inc., 9.250%,
02/15/2024 | | | | | 95,424 | | | | | | 0.0 | | |
| 100,000 (1) | | | CommScope, Inc., 5.500%,
06/15/2024 | | | | | 101,501 | | | | | | 0.0 | | |
| 100,000 (1) | | | Cumulus Media New
Holdings, Inc., 6.750%,
07/01/2026 | | | | | 107,312 | | | | | | 0.1 | | |
| 50,000 (1) | | | Diamond Sports Group
LLC / Diamond Sports
Finance Co., 5.375%,
08/15/2026 | | | | | 50,671 | | | | | | 0.0 | | |
| 50,000 (1)(6) | | | Diamond Sports Group
LLC / Diamond Sports
Finance Co., 6.625%,
08/15/2027 | | | | | 48,718 | | | | | | 0.0 | | |
| 100,000 (1)(6) | | | Entercom Media Corp.,
7.250%, 11/01/2024 | | | | | 105,541 | | | | | | 0.1 | | |
| 25,000 (1) | | | Frontier Communications
Corp., 8.000%, 04/01/2027 | | | | | 26,171 | | | | | | 0.0 | | |
| 100,000 (1) | | | Gray Television, Inc.,
7.000%, 05/15/2027 | | | | | 111,310 | | | | | | 0.1 | | |
| 25,000 (1) | | | Intelsat Jackson Holdings
SA, 8.500%, 10/15/2024 | | | | | 22,823 | | | | | | 0.0 | | |
| 100,000 (1) | | | MDC Partners, Inc.,
6.500%, 05/01/2024 | | | | | 90,750 | | | | | | 0.0 | | |
| 90,000 (1) | | | Midcontinent
Communications /
Midcontinent Finance
Corp., 5.375%, 08/15/2027 | | | | | 95,431 | | | | | | 0.0 | | |
| 100,000 (1) | | | Nexstar Broadcasting, Inc.,
5.625%, 08/01/2024 | | | | | 104,459 | | | | | | 0.0 | | |
| 100,000 (1) | | | Plantronics, Inc., 5.500%,
05/31/2023 | | | | | 97,999 | | | | | | 0.0 | | |
| 100,000 (1) | | | Sinclair Television Group,
Inc., 5.125%, 02/15/2027 | | | | | 103,035 | | | | | | 0.0 | | |
| 35,000 (1) | | | Sirius XM Radio, Inc.,
4.625%, 07/15/2024 | | | | | 36,823 | | | | | | 0.0 | | |
Principal
Amount† | | | Value | | | Percentage
of Net
Assets | |
| CORPORATE BONDS/NOTES: (continued) | |
| | | | Communications (continued) | |
| 50,000 (1) | | | Sirius XM Radio, Inc.,
5.000%, 08/01/2027 | | | | $ | 52,842 | | | | | | 0.0 | | |
| 100,000 (1) | | | TEGNA, Inc., 5.000%,
09/15/2029 | | | | | 101,875 | | | | | | 0.0 | | |
| 100,000 (1) | | | Telesat Canada / Telesat
LLC, 6.500%, 10/15/2027 | | | | | 104,435 | | | | | | 0.0 | | |
| 100,000 (1) | | | Terrier Media Buyer, Inc.,
8.875%, 12/15/2027 | | | | | 106,000 | | | | | | 0.1 | | |
| 40,000 (1) | | | Townsquare Media, Inc.,
6.500%, 04/01/2023 | | | | | 40,717 | | | | | | 0.0 | | |
| 100,000 (1) | | | ViaSat, Inc., 5.625%,
09/15/2025 | | | | | 103,209 | | | | | | 0.0 | | |
| 200,000 (1) | | | Virgin Media Secured
Finance PLC, 5.500%,
05/15/2029 | | | | | 212,120 | | | | | | 0.1 | | |
| 1,124,000 (3) | | | Other Securities | | | | | 1,194,041 | | | | | | 0.3 | | |
| | | | | | | | | 3,322,893 | | | | | | 0.9 | | |
| | | | Consumer, Cyclical: 1.1% | |
| 100,000 (1) | | | 1011778 BC ULC / New
Red Finance, Inc., 5.000%,
10/15/2025 | | | | | 103,459 | | | | | | 0.0 | | |
| 100,000 (1) | | | Allison Transmission, Inc.,
5.875%, 06/01/2029 | | | | | 109,732 | | | | | | 0.1 | | |
| 100,000 (1) | | | Ashton Woods USA LLC /
Ashton Woods Finance
Co., 6.750%, 08/01/2025 | | | | | 102,541 | | | | | | 0.0 | | |
| 100,000 (1) | | | Caesars Resort Collection
LLC / CRC Finco, Inc.,
5.250%, 10/15/2025 | | | | | 103,625 | | | | | | 0.0 | | |
| 100,000 (1) | | | Cedar Fair L.P., 5.250%,
07/15/2029 | | | | | 107,935 | | | | | | 0.1 | | |
| 100,000 (1) | | | Core & Main L.P., 6.125%,
08/15/2025 | | | | | 103,999 | | | | | | 0.0 | | |
| 100,000 (1) | | | Golden Entertainment, Inc.,
7.625%, 04/15/2026 | | | | | 107,987 | | | | | | 0.1 | | |
| 100,000 (1) | | | Golden Nugget, Inc.,
6.750%, 10/15/2024 | | | | | 103,749 | | | | | | 0.0 | | |
| 100,000 (1) | | | IAA, Inc., 5.500%,
06/15/2027 | | | | | 106,435 | | | | | | 0.0 | | |
| 100,000 (1) | | | Installed Building Products,
Inc., 5.750%, 02/01/2028 | | | | | 107,160 | | | | | | 0.1 | | |
| 100,000 (1) | | | Lions Gate Capital
Holdings LLC, 5.875%,
11/01/2024 | | | | | 101,791 | | | | | | 0.0 | | |
| 100,000 (1) | | | Live Nation Entertainment,
Inc., 4.750%, 10/15/2027 | | | | | 103,685 | | | | | | 0.0 | | |
| 100,000 (1) | | | Mattel, Inc., 5.875%,
12/15/2027 | | | | | 105,560 | | | | | | 0.0 | | |
| 100,000 (1)(6) | | | Michaels Stores, Inc.,
8.000%, 07/15/2027 | | | | | 95,685 | | | | | | 0.0 | | |
| 100,000 (1) | | | Navistar International
Corp., 6.625%, 11/01/2025 | | | | | 102,084 | | | | | | 0.0 | | |
See Accompanying Notes to Financial Statements
SUMMARY PORTFOLIO OF INVESTMENTS
| Voya Balanced Income Portfolio | as of December 31, 2019 (continued) |
Principal
Amount† | | | Value | | | Percentage
of Net
Assets | |
| CORPORATE BONDS/NOTES: (continued) | |
| | | | Consumer, Cyclical (continued) | |
| 100,000 (1) | | | Penn National Gaming,
Inc., 5.625%, 01/15/2027 | | | | $ | 105,965 | | | | | | 0.0 | | |
| 100,000 (1) | | | Performance Food Group,
Inc., 5.500%, 10/15/2027 | | | | | 107,128 | | | | | | 0.0 | | |
| 50,000 (1) | | | PetSmart, Inc., 5.875%,
06/01/2025 | | | | | 51,062 | | | | | | 0.0 | | |
| 50,000 (1) | | | PetSmart, Inc., 7.125%,
03/15/2023 | | | | | 49,125 | | | | | | 0.0 | | |
| 100,000 (1) | | | Resideo Funding, Inc.,
6.125%, 11/01/2026 | | | | | 101,003 | | | | | | 0.0 | | |
| 50,000 (1) | | | Scientific Games
International, Inc., 5.000%,
10/15/2025 | | | | | 52,500 | | | | | | 0.0 | | |
| 50,000 (1) | | | Scientific Games
International, Inc., 8.250%,
03/15/2026 | | | | | 55,219 | | | | | | 0.1 | | |
| 100,000 (1) | | | Six Flags Entertainment
Corp., 5.500%, 04/15/2027 | | | | | 106,810 | | | | | | 0.0 | | |
| 100,000 (1) | | | Speedway Motorsports
LLC / Speedway Funding
II, Inc., 4.875%, 11/01/2027 | | | | | 101,625 | | | | | | 0.0 | | |
| 100,000 (1) | | | Staples, Inc., 7.500%,
04/15/2026 | | | | | 103,937 | | | | | | 0.0 | | |
| 100,000 (1) | | | Station Casinos LLC,
5.000%, 10/01/2025 | | | | | 102,000 | | | | | | 0.0 | | |
| 100,000 (1) | | | Taylor Morrison
Communities, Inc., 5.750%,
01/15/2028 | | | | | 109,285 | | | | | | 0.1 | | |
| 100,000 (1) | | | Viking Cruises Ltd.,
5.875%, 09/15/2027 | | | | | 107,060 | | | | | | 0.0 | | |
| 100,000 (1) | | | William Carter Co/The,
5.625%, 03/15/2027 | | | | | 107,732 | | | | | | 0.1 | | |
| 100,000 (1) | | | Wolverine World Wide, Inc.,
5.000%, 09/01/2026 | | | | | 101,750 | | | | | | 0.0 | | |
| 1,400,000 (3) | | | Other Securities | | | | | 1,456,028 | | | | | | 0.4 | | |
| | | | | | | | | 4,383,656 | | | | | | 1.1 | | |
| | | | Consumer, Non-cyclical: 1.0% | |
| 200,000 (1) | | | Adani Ports & Special
Economic Zone Ltd.,
4.375%, 07/03/2029 | | | | | 207,443 | | | | | | 0.1 | | |
| 100,000 (1) | | | Albertsons Cos, Inc. /
Safeway, Inc. / New
Albertsons L.P. / Albertsons
LLC, 5.875%, 02/15/2028 | | | | | 106,435 | | | | | | 0.0 | | |
| 100,000 (1) | | | AMN Healthcare, Inc.,
4.625%, 10/01/2027 | | | | | 100,535 | | | | | | 0.0 | | |
| 50,000 (1) | | | Bausch Health Cos, Inc.,
5.500%,11/01/2025 | | | | | 52,354 | | | | | | 0.0 | | |
| 50,000 (1) | | | Bausch Health Cos, Inc.,
6.125%, 04/15/2025 | | | | | 51,766 | | | | | | 0.0 | | |
| 100,000 (1) | | | Cardtronics, Inc. /
Cardtronics USA, Inc.,
5.500%, 05/01/2025 | | | | | 104,041 | | | | | | 0.0 | | |
Principal
Amount† | | | Value | | | Percentage
of Net
Assets | |
| CORPORATE BONDS/NOTES: (continued) | |
| | | | Consumer, Non-cyclical (continued) | |
| 55,000 (1) | | | Catalent Pharma Solutions,
Inc., 5.000%, 07/15/2027 | | | | $ | 57,714 | | | | | | 0.0 | | |
| 100,000 (1) | | | Chobani LLC / Chobani
Finance Corp., Inc.,
7.500%, 04/15/2025 | | | | | 100,749 | | | | | | 0.0 | | |
| 100,000 (1) | | | Cott Holdings, Inc.,
5.500%, 04/01/2025 | | | | | 104,708 | | | | | | 0.0 | | |
| 225,000 (1) | | | DP World Crescent Ltd.,
3.750%, 01/30/2030 | | | | | 228,050 | | | | | | 0.1 | | |
| 100,000 (1)(7) | | | Eagle Holding CO II LLC,
7.625% (PIK Rate 8.375%,
Cash Rate 7.625%),
05/15/2022 | | | | | 101,823 | | | | | | 0.0 | | |
| 100,000 (1) | | | Garda World Security
Corp., 8.750%, 05/15/2025 | | | | | 104,249 | | | | | | 0.0 | | |
| 100,000 (1) | | | Graham Holdings Co.,
5.750%, 06/01/2026 | | | | | 107,035 | | | | | | 0.1 | | |
| 100,000 (1) | | | Hertz Corp./The, 7.125%,
08/01/2026 | | | | | 108,487 | | | | | | 0.1 | | |
| 100,000 (1) | | | JBS USA LUX SA / JBS
USA Finance, Inc.,
6.750%,
02/15/2028 | | | | | 110,686 | | | | | | 0.1 | | |
| 100,000 (1) | | | KeHE Distributors
LLC / KeHE Finance Corp.,
8.625%, 10/15/2026 | | | | | 104,938 | | | | | | 0.0 | | |
| 50,000 (1) | | | MPH Acquisition Holdings
LLC, 7.125%, 06/01/2024 | | | | | 48,500 | | | | | | 0.0 | | |
| 100,000 (1)(6) | | | Par Pharmaceutical, Inc.,
7.500%,04/01/2027 | | | | | 99,753 | | | | | | 0.0 | | |
| 100,000 (1) | | | Pilgrim’s Pride Corp.,
5.750%, 03/15/2025 | | | | | 103,572 | | | | | | 0.0 | | |
| 50,000 (1)(6)(7) | | | Polaris Intermediate Corp.,
8.500% (PIK Rate 9.250%,
Cash Rate 8.500%),
12/01/2022 | | | | | 46,687 | | | | | | 0.0 | | |
| 100,000 (1) | | | Post Holdings, Inc.,
5.000%, 08/15/2026 | | | | | 105,810 | | | | | | 0.0 | | |
| 100,000 (1) | | | Select Medical Corp.,
6.250%, 08/15/2026 | | | | | 108,436 | | | | | | 0.1 | | |
| 100,000 (1) | | | Simmons Foods, Inc.,
5.750%, 11/01/2024 | | | | | 100,709 | | | | | | 0.0 | | |
| 100,000 (1) | | | West Street Merger Sub,
Inc., 6.375%, 09/01/2025 | | | | | 99,999 | | | | | | 0.0 | | |
| 1,345,000 | | | Other Securities | | | | | 1,445,433 | | | | | | 0.4 | | |
| | | | | | | | | 3,909,912 | | | | | | 1.0 | | |
| | | | Energy: 1.0% | |
| 50,000 (1) | | | Archrock Partners L.P. /
Archrock Partners Finance
Corp., 6.250%, 04/01/2028 | | | | | 51,625 | | | | | | 0.0 | | |
| 100,000 (1) | | | Enviva Partners L.P. /
Enviva Partners Finance
Corp., 6.500%, 01/15/2026 | | | | | 107,313 | | | | | | 0.0 | | |
See Accompanying Notes to Financial Statements
SUMMARY PORTFOLIO OF INVESTMENTS
| Voya Balanced Income Portfolio | as of December 31, 2019 (continued) |
Principal
Amount† | | | Value | | | Percentage
of Net
Assets | |
| CORPORATE BONDS/NOTES: (continued) | |
| | | | Energy (continued) | |
| 100,000 (1) | | | Tallgrass Energy Partners
L.P. / Tallgrass Energy
Finance Corp., 5.500%,
01/15/2028 | | | | $ | 98,233 | | | | | | 0.0 | | |
| 100,000 (1) | | | Targa Resources Partners
L.P. / Targa Resources
Partners Finance Corp.,
6.875%, 01/15/2029 | | | | | 111,185 | | | | | | 0.1 | | |
| 3,175,000 (3) | | | Other Securities | | | | | 3,402,241 | | | | | | 0.9 | | |
| | | | | | | | | 3,770,597 | | | | | | 1.0 | | |
| | | | Financial: 0.4% | |
| 50,000 (1) | | | Allied Universal Holdco
LLC / Allied Universal
Finance Corp., 6.625%,
07/15/2026 | | | | | 53,829 | | | | | | 0.0 | | |
| 50,000 (1) | | | Allied Universal Holdco
LLC / Allied Universal
Finance Corp., 9.750%,
07/15/2027 | | | | | 53,529 | | | | | | 0.0 | | |
| 100,000 (1) | | | ESH Hospitality, Inc.,
5.250%, 05/01/2025 | | | | | 103,584 | | | | | | 0.0 | | |
| 200,000 (1)(8) | | | Kookmin Bank,
4.350%, 12/31/2199 | | | | | 203,925 | | | | | | 0.1 | | |
| 105,000 (1) | | | LPL Holdings, Inc.,
4.625%, 11/15/2027 | | | | | 107,363 | | | | | | 0.1 | | |
| 100,000 (1) | | | Quicken Loans, Inc.,
5.250%, 01/15/2028 | | | | | 103,732 | | | | | | 0.0 | | |
| 100,000 (1) | | | Realogy Group LLC /
Realogy Co-Issuer Corp.,
5.250%, 12/01/2021 | | | | | 101,225 | | | | | | 0.0 | | |
| 800,000 | | | Other Securities | | | | | 879,374 | | | | | | 0.2 | | |
| | | | | | | | | 1,606,561 | | | | | | 0.4 | | |
| | | | Industrial: 0.7% | |
| 100,000 (1) | | | Amsted Industries, Inc.,
5.625%, 07/01/2027 | | | | | 106,285 | | | | | | 0.0 | | |
| 100,000 (1) | | | Berry Global, Inc.,
5.625%, 07/15/2027 | | | | | 107,502 | | | | | | 0.0 | | |
| 100,000 (1) | | | BMC East LLC,
5.500%, 10/01/2024 | | | | | 104,291 | | | | | | 0.0 | | |
| 100,000 (1) | | | Builders FirstSource, Inc.,
6.750%, 06/01/2027 | | | | | 109,910 | | | | | | 0.1 | | |
| 100,000 (1) | | | Cascades, Inc./Cascades
USA, Inc., 5.375%,
01/15/2028 | | | | | 103,000 | | | | | | 0.0 | | |
| 100,000 (1) | | | Clean Harbors, Inc.,
5.125%, 07/15/2029 | | | | | 107,545 | | | | | | 0.0 | | |
| 100,000 (1) | | | FXI Holdings, Inc.,
7.875%, 11/01/2024 | | | | | 96,249 | | | | | | 0.0 | | |
| 100,000 (1) | | | GFL Environmental, Inc.,
8.500%, 05/01/2027 | | | | | 110,185 | | | | | | 0.1 | | |
| 100,000 (1) | | | Granite Holdings US
Acquisition Co., 11.000%,
10/01/2027 | | | | | 101,535 | | | | | | 0.0 | | |
| 200,000 (1) | | | Klabin Austria GmbH,
5.750%, 04/03/2029 | | | | | 213,372 | | | | | | 0.1 | | |
Principal
Amount† | | | Value | | | Percentage
of Net
Assets | |
| CORPORATE BONDS/NOTES: (continued) | |
| | | | Industrial (continued) | |
| 100,000 (1) | | | Masonite International
Corp., 5.750%, 09/15/2026 | | | | $ | 106,535 | | | | | | 0.0 | | |
| 100,000 (1) | | | Mauser Packaging
Solutions Holding Co.,
7.250%,
04/15/2025 | | | | | 98,999 | | | | | | 0.0 | | |
| 100,000 (1) | | | Norbord, Inc., 5.750%,
07/15/2027 | | | | | 104,035 | | | | | | 0.0 | | |
| 100,000 (1) | | | Owens-Brockway Glass
Container, Inc., 5.375%,
01/15/2025 | | | | | 103,291 | | | | | | 0.0 | | |
| 100,000 (1) | | | PGT Escrow Issuer, Inc.,
6.750%, 08/01/2026 | | | | | 107,410 | | | | | | 0.0 | | |
| 100,000 (1) | | | Reynolds Group Issuer, Inc.
/ Reynolds Group Issuer
LLC / Reynolds Group
Issuer Lu, 5.125%,
07/15/2023 | | | | | 102,583 | | | | | | 0.0 | | |
| 100,000 (1) | | | Sealed Air Corp.,
5.500%, 09/15/2025 | | | | | 110,292 | | | | | | 0.1 | | |
| 100,000 (1)(6) | | | SSL Robotics LLC,
9.750%, 12/31/2023 | | | | | 109,000 | | | | | | 0.1 | | |
| 100,000 (1) | | | Standard Industries,
Inc./NJ, 5.000%, 02/15/
2027 | | | | | 104,482 | | | | | | 0.0 | | |
| 100,000 (1) | | | Stevens Holding Co., Inc.,
6.125%, 10/01/2026 | | | | | 109,535 | | | | | | 0.1 | | |
| 100,000 (1) | | | TransDigm, Inc.,
6.250%, 03/15/2026 | | | | | 108,448 | | | | | | 0.0 | | |
| 376,000 | | | Other Securities | | | | | 420,417 | | | | | | 0.1 | | |
| | | | | | | | | 2,744,901 | | | | | | 0.7 | | |
| | | | Technology: 0.3% | |
| 100,000 (1) | | | Ascend Learning LLC,
6.875%, 08/01/2025 | | | | | 105,291 | | | | | | 0.0 | | |
| 100,000 (1) | | | Change Healthcare
Holdings LLC / Change
Healthcare Finance, Inc.,
5.750%, 03/01/2025 | | | | | 102,999 | | | | | | 0.0 | | |
| 100,000 (1) | | | Dell International LLC /
EMC Corp., 7.125%,
06/15/2024 | | | | | 105,625 | | | | | | 0.1 | | |
| 100,000 (1) | | | MTS Systems Corp.,
5.750%, 08/15/2027 | | | | | 104,785 | | | | | | 0.0 | | |
| 100,000 (1) | | | Open Text Corp., 5.875%,
06/01/2026 | | | | | 107,185 | | | | | | 0.1 | | |
| 100,000 (1) | | | RP Crown Parent LLC,
7.375%, 10/15/2024 | | | | | 104,167 | | | | | | 0.0 | | |
| 100,000 (1) | | | Tempo Acquisition LLC /
Tempo Acquisition Finance
Corp., 6.750%, 06/01/2025 | | | | | 103,499 | | | | | | 0.0 | | |
| 200,000 | | | Other Securities | | | | | 207,250 | | | | | | 0.1 | | |
| | | | | | | | | 940,801 | | | | | | 0.3 | | |
| | | | Utilities: 0.7% | |
| 100,000 (1) | | | Vistra Operations Co. LLC,
5.625%, 02/15/2027 | | | | | 105,560 | | | | | | 0.0 | | |
See Accompanying Notes to Financial Statements
SUMMARY PORTFOLIO OF INVESTMENTS
| Voya Balanced Income Portfolio | as of December 31, 2019 (continued) |
Principal
Amount† | | | Value | | | Percentage
of Net
Assets | |
| CORPORATE BONDS/NOTES: (continued) | |
| | | | Utilities (continued) | |
| 2,550,000 | | | Other Securities | | | | $ | 2,723,382 | | | | | | 0.7 | | |
| | | | | | | | | 2,828,942 | | | | | | 0.7 | | |
| | | | Total Corporate
Bonds/Notes
(Cost $24,596,370) | | | | | 25,603,900 | | | | | | 6.6 | | |
| | | | | |
| COLLATERALIZED MORTGAGE OBLIGATIONS: 14.6% | |
| 887,703 (1)(8) | | | Agate Bay Mortgage Trust
2015-1 B4, 3.807%,
01/25/2045 | | | | | 855,912 | | | | | | 0.2 | | |
| 554,530 (1)(8) | | | Chase Mortgage Finance
Corp. 2016-SH1 M2,
3.750%, 04/25/2045 | | | | | 568,469 | | | | | | 0.1 | | |
| 1,578,154 (1)(8) | | | CIM Trust 2019-INV2 A3,
4.000%, 05/25/2049 | | | | | 1,617,290 | | | | | | 0.4 | | |
| 688,583 (1)(8) | | | CIM Trust 2019-J2 A13,
3.500%, 10/25/2049 | | | | | 698,098 | | | | | | 0.2 | | |
| 6,878,482 (9) | | | Fannie Mae Interest Strip
Series 367 2, 5.500%,
01/01/2036 | | | | | 1,461,219 | | | | | | 0.4 | | |
| 5,489,389 (9) | | | Fannie Mae REMICS
2012-144 SC, 4.308%,
(-1.000*US0001M +
6.100%), 01/25/2043 | | | | | 1,132,812 | | | | | | 0.3 | | |
| 2,704,669 (9) | | | Fannie Mae REMICS
2012-151 WS, 4.408%,
(-1.000*US0001M +
6.200%), 03/25/2042 | | | | | 377,203 | | | | | | 0.1 | | |
| 6,801,703 (9) | | | Fannie Mae REMICS
2012-35 LS, 4.808%,
(-1.000*US0001M +
6.600%), 04/25/2041 | | | | | 891,242 | | | | | | 0.2 | | |
| 4,988,838 (9) | | | Fannie Mae REMICS
2013-20 SK, 4.408%,
(-1.000*US0001M +
6.200%), 05/25/2041 | | | | | 551,045 | | | | | | 0.1 | | |
| 1,510,767 (9) | | | Fannie Mae REMICS
2018-86 DS, 4.308%,
(-1.000*US0001M +
6.100%), 12/25/2048 | | | | | 191,122 | | | | | | 0.1 | | |
| 7,017,910 (9) | | | Freddie Mac REMICS
4517 KI, 0.450%,
(-0.357*US0001M +
1.071%), 04/15/2043 | | | | | 151,247 | | | | | | 0.0 | | |
| 9,519,553 (9) | | | Freddie Mac REMICS
4596 DI, 3.500%,
06/15/2046 | | | | | 1,431,131 | | | | | | 0.4 | | |
| 4,043,938 (9) | | | Freddie Mac REMICS
4619 KS, 2.559%,
(-1.000*US0001M +
4.250%), 06/15/2039 | | | | | 506,713 | | | | | | 0.1 | | |
| 1,594,713 (9) | | | Ginnie Mae Series
2013-148 DS, 3.940%,
(-1.000*US0001M +
5.680%), 10/16/2043 | | | | | 267,221 | | | | | | 0.1 | | |
Principal
Amount† | | | Value | | | Percentage
of Net
Assets | |
| COLLATERALIZED MORTGAGE OBLIGATIONS: (continued) | |
| 13,031,128 (9) | | | Ginnie Mae Series
2015-20 CI, 3.500%,
02/20/2030 | | | | $ | 1,292,960 | | | | | | 0.3 | | |
| 1,263,693 (9) | | | Ginnie Mae Series
2015-42 IY, 5.500%,
08/20/2039 | | | | | 152,503 | | | | | | 0.0 | | |
| 9,748,223 (9) | | | Ginnie Mae Series
2019-23 MT, 0.600%,
(-1.000*US0001M +
6.700%), 03/20/2042 | | | | | 197,673 | | | | | | 0.1 | | |
| 1,364,957 (1)(8) | | | PSMC 2019-1 A1 Trust,
4.000%, 07/25/2049 | | | | | 1,391,855 | | | | | | 0.4 | | |
| 1,351,641 (1)(8) | | | Starwood Mortgage
Residential Trust 2019-1
A3, 3.299%, 06/25/2049 | | | | | 1,355,415 | | | | | | 0.3 | | |
| 1,000,000 (1)(8) | | | Deephaven Residential
Mortgage Trust 2018-1A
M1, 3.939%, 12/25/2057 | | | | | 1,007,663 | | | | | | 0.3 | | |
| 1,000,009 | | | Fannie Mae Connecticut
Avenue Securities
2016-C05 2M2, 6.242%,
(US0001M + 4.450%),
01/25/2029 | | | | | 1,057,300 | | | | | | 0.3 | | |
| 922,609 | | | Fannie Mae Connecticut
Avenue Securities
2016-C07 2M2, 6.142%,
(US0001M + 4.350%),
05/25/2029 | | | | | 973,675 | | | | | | 0.3 | | |
| 400,000 | | | Fannie Mae Connecticut
Avenue Securities
2017-C06 1M2, 4.442%,
(US0001M + 2.650%),
02/25/2030 | | | | $ | 410,831 | | | | | | 0.1 | | |
| 501,262 | | | Fannie Mae Connecticut
Avenue Securities
2017-CO6 2M2, 4.592%,
(US0001M + 2.800%),
02/25/2030 | | | | | 515,233 | | | | | | 0.1 | | |
| 1,100,000 | | | Fannie Mae Connecticut
Avenue Securities
2018-C03 1M2, 3.942%,
(US0001M + 2.150%),
10/25/2030 | | | | | 1,109,482 | | | | | | 0.3 | | |
| 1,200,000 | | | Fannie Mae Connecticut
Avenue Securities
2018-C04 2M2, 4.342%,
(US0001M + 2.550%),
12/25/2030 | | | | | 1,222,386 | | | | | | 0.3 | | |
| 1,000,000 | | | Fannie Mae Connecticut
Avenue Securities
2018-C05 1M2, 4.142%,
(US0001M + 2.350%),
01/25/2031 | | | | | 1,015,208 | | | | | | 0.3 | | |
| 1,138,850 | | | Fannie Mae Connecticut
Avenue Securities
2018-C06 1M2, 3.792%,
(US0001M + 2.000%),
03/25/2031 | | | | | 1,144,537 | | | | | | 0.3 | | |
See Accompanying Notes to Financial Statements
SUMMARY PORTFOLIO OF INVESTMENTS
| Voya Balanced Income Portfolio | as of December 31, 2019 (continued) |
Principal
Amount† | | | Value | | | Percentage
of Net
Assets | |
| COLLATERALIZED MORTGAGE OBLIGATIONS: (continued) | |
| 300,000 | | | Fannie Mae Connecticut
Avenue Securities
2018-CO1 1M2, 4.042%,
(US0001M + 2.250%),
07/25/2030 | | | | $ | 304,243 | | | | | | 0.1 | | |
| 1,200,000 (1) | | | Fannie Mae Connecticut
Avenue Securities
2019-R02 1M2, 4.092%,
(US0001M + 2.300%),
08/25/2031 | | | | | 1,212,129 | | | | | | 0.3 | | |
| 941,671 (1) | | | Fannie Mae Connecticut
Avenue Securities Trust
2018-R07 1M2, 4.192%,
(US0001M + 2.400%),
04/25/2031 | | | | | 953,372 | | | | | | 0.2 | | |
| 2,652,122 (9) | | | Fannie Mae REMICS
2008-36 YI, 5.408%,
(-1.000*US0001M +
7.200%), 07/25/2036 | | | | | 403,036 | | | | | | 0.1 | | |
| 1,164,413 (9) | | | Fannie Mae REMICS
2010-59 NS, 3.978%,
(-1.000*US0001M +
5.770%), 06/25/2040 | | | | | 176,660 | | | | | | 0.0 | | |
| 5,902,874 (9) | | | Fannie Mae REMICS
2012-121 ID, 3.000%,
11/25/2027 | | | | | 402,564 | | | | | | 0.1 | | |
| 7,144,445 (9) | | | Fannie Mae REMICS
2013-71 AI, 3.000%,
07/25/2028 | | | | | 541,731 | | | | | | 0.1 | | |
| 500,000 (1)(8) | | | Flagstar Mortgage Trust
2017-1 1A7, 3.500%,
03/25/2047 | | | | | 512,770 | | | | | | 0.1 | | |
| 931,866 (1)(8) | | | Flagstar Mortgage Trust
2017-1 B3, 3.684%,
03/25/2047 | | | | | 938,386 | | | | | | 0.3 | | |
| 1,985,165 (1)(8) | | | Flagstar Mortgage Trust
2018-3INV A3, 4.000%,
05/25/2048 | | | | | 2,029,898 | | | | | | 0.5 | | |
| 700,000 | | | Freddie Mac Structured
Agency Credit Risk Debt
Notes 2015-DNA2 M3,
5.692%, (US0001M +
3.900%), 12/25/2027 | | | | | 724,426 | | | | | | 0.2 | | |
| 540,183 | | | Freddie Mac Structured
Agency Credit Risk Debt
Notes 2015-HQ1 M3,
5.592%, (US0001M +
3.800%), 03/25/2025 | | | | | 554,343 | | | | | | 0.1 | | |
| 700,000 | | | Freddie Mac Structured
Agency Credit Risk Debt
Notes 2016-DNA1 M3,
7.342%, (US0001M +
5.550%), 07/25/2028 | | | | | 772,912 | | | | | | 0.2 | | |
| 600,000 | | | Freddie Mac Structured
Agency Credit Risk Debt
Notes 2017-DNA2 M2,
5.242%, (US0001M +
3.450%), 10/25/2029 | | | | | 639,736 | | | | | | 0.2 | | |
| 1,300,000 (1) | | | Freddie Mac Structured
Agency Credit Risk Debt
Notes 2019-DNA1 M2,
4.442%, (US0001M +
2.650%), 01/25/2049 | | | | | 1,325,259 | | | | | | 0.3 | | |
Principal
Amount† | | | Value | | | Percentage
of Net
Assets | |
| COLLATERALIZED MORTGAGE OBLIGATIONS: (continued) | |
| 1,158,902 (9) | | | Freddie Mac REMICS
3318 KS, 4.670%,
(-1.000*US0001M +
6.410%), 05/15/2037 | | | | $ | 146,601 | | | | | | 0.0 | | |
| 1,397,579 (9) | | | Freddie Mac REMICS
3879 SL, 4.860%,
(-1.000*US0001M +
6.600%), 01/15/2041 | | | | | 186,539 | | | | | | 0.1 | | |
| 5,715,989 (9) | | | Freddie Mac REMICS
4120 JS, 4.460%,
(-1.000*US0001M +
6.200%), 10/15/2032 | | | | | 878,737 | | | | | | 0.2 | | |
| 4,281,440 (9) | | | Freddie Mac REMICS
4141 EI, 3.000%,
09/15/2027 | | | | | 253,665 | | | | | | 0.1 | | |
| 5,286,311 (9) | | | Freddie Mac REMICS
4153 IB, 2.500%,
01/15/2028 | | | | | 314,209 | | | | | | 0.1 | | |
| 733,471 (1)(8) | | | GS Mortgage-Backed
Securities Corp. Trust
2019-PJ2 A1, 4.000%,
11/25/2049 | | | | | 744,831 | | | | | | 0.2 | | |
| 754,083 (1)(8) | | | J.P. Morgan Mortgage Trust
2019-2 A15, 4.000%,
08/25/2049 | | | | | 766,610 | | | | | | 0.2 | | |
| 1,775,106 (1)(8) | | | J.P. Morgan Mortgage Trust
2019-LTV1 A3, 4.000%,
06/25/2049 | | | | | 1,802,598 | | | | | | 0.5 | | |
| 637,695 (1)(8) | | | JP Morgan Mortgage Trust
2016-4 A13, 3.500%,
10/25/2046 | | | | | 640,620 | | | | | | 0.2 | | |
| 877,772 (1)(8) | | | JP Morgan Mortgage Trust
2017-5 B2, 3.155%,
10/26/2048 | | | | | 868,480 | | | | | | 0.2 | | |
| 1,156,482 (1)(8) | | | JP Morgan Mortgage Trust
2018-3 B2, 3.762%,
09/25/2048 | | | | | 1,174,585 | | | | | | 0.3 | | |
| 749,896 (1)(8) | | | JP Morgan Mortgage Trust
2018-4 B2, 3.779%,
10/25/2048 | | | | | 762,420 | | | | | | 0.2 | | |
| 971,172 (1)(8) | | | JP MORGAN MORTGAGE
TRUST 2018-5 A13,
3.500%, 10/25/2048 | | | | | 997,205 | | | | | | 0.2 | | |
| 756,896 (1)(8) | | | JP Morgan Mortgage Trust
2019-1 A3, 4.000%,
05/25/2049 | | | | | 768,619 | | | | | | 0.2 | | |
| 792,837 (1)(8) | | | JP Morgan Mortgage Trust
2019-5 A3, 4.000%,
11/25/2049 | | | | | 805,116 | | | | | | 0.2 | | |
| 990,795 (1)(8) | | | JP Morgan Mortgage Trust
2019-INV1 B2, 5.151%,
10/25/2049 | | | | | 1,074,003 | | | | | | 0.3 | | |
| 1,288,827 (1)(8) | | | JP Morgan Mortgage Trust
2019-LTV2 A18, 4.000%,
12/25/2049 | | | | | 1,322,860 | | | | | | 0.3 | | |
| 595,654 (1)(8) | | | JP Morgan Mortgage Trust
2019-LTV2 B3, 4.830%,
12/25/2049 | | | | | 629,836 | | | | | | 0.2 | | |
See Accompanying Notes to Financial Statements
SUMMARY PORTFOLIO OF INVESTMENTS
| Voya Balanced Income Portfolio | as of December 31, 2019 (continued) |
Principal
Amount† | | | Value | | | Percentage
of Net
Assets | |
| COLLATERALIZED MORTGAGE OBLIGATIONS: (continued) | |
| 1,080,805 (1)(8) | | | New Residential Mortgage
Loan Trust 2019-NQM3 A3,
3.086%, 07/25/2049 | | | | $ | 1,082,051 | | | | | | 0.3 | | |
| 972,731 (1)(8) | | | OBX 2019-INV2 A25 Trust,
4.000%, 05/27/2049 | | | | | 988,248 | | | | | | 0.3 | | |
| 1,182,632 (1)(8) | | | Sequoia Mortgage Trust
2019-2 B2, 4.244%,
06/25/2049 | | | | | 1,228,332 | | | | | | 0.3 | | |
| 1,182,632 (1)(8) | | | Sequoia Mortgage Trust
2019-2 B3, 4.244%,
06/25/2049 | | | | | 1,205,176 | | | | | | 0.3 | | |
| 263,168 (1)(8) | | | Sequoia Mortgage Trust
2019-3 A2, 3.500%,
09/25/2049 | | | | | 266,602 | | | | | | 0.1 | | |
| 589,867 (1)(8) | | | Sequoia Mortgage Trust
2019-4 A19, 3.500%,
11/25/2049 | | | | | 598,448 | | | | | | 0.1 | | |
| 761,404 (1)(8) | | | Sequoia Mortgage Trust
2019-CH2 A1, 4.500%,
08/25/2049 | | | | | 774,406 | | | | | | 0.2 | | |
| 295,300 (1)(8) | | | Verus Securitization Trust
2018-INV1 A1, 3.626%,
03/25/2058 | | | | | 298,026 | | | | | | 0.1 | | |
| 639,415 (1)(8) | | | Verus Securitization Trust
2019-INV2 A2, 3.117%,
07/25/2059 | | | | | 641,214 | | | | | | 0.1 | | |
| 581,825 (1)(8) | | | Wells Fargo Mortgage
Backed Securities 2018-1
B3, 3.697%, 07/25/2047 | | | | | 583,768 | | | | | | 0.2 | | |
| | | | Total Collateralized
Mortgage Obligations
(Cost $56,630,240) | | | | | 56,842,715 | | | | | | 14.6 | | |
| | | | | |
| U.S. GOVERNMENT AGENCY OBLIGATIONS: 2.4% | |
| | | | Government National Mortgage
Association: 1.1% | |
| 4,099,000 (10) | | | 3.000%,01/20/2050 | | | | | 4,208,020 | | | | | | 1.1 | | |
| | | | | |
| | | | Uniform Mortgage-Backed Securities: 1.3% | |
| 813,000 (10) | | | 3.000%,01/25/2035 | | | | | 833,014 | | | | | | 0.2 | | |
| 4,380,000 (10) | | | 3.500%,06/25/2042 | | | | | 4,503,641 | | | | | | 1.1 | | |
| | | | | | | | | 5,336,655 | | | | | | 1.3 | | |
| | | | Total U.S. Government
Agency Obligations
(Cost $9,539,477) | | | | | 9,544,675 | | | | | | 2.4 | | |
| | | | | |
| U.S. TREASURY OBLIGATIONS: 2.3% | |
| | | | U.S. Treasury Bonds: 0.7% | |
| 2,416,000 | | | 2.250%,08/15/2049 | | | | | 2,341,676 | | | | | | 0.6 | | |
| 180,000 | | | 3.500%,02/15/2039 | | | | | 215,568 | | | | | | 0.1 | | |
| | | | | | | | | 2,557,244 | | | | | | 0.7 | | |
| | | | | |
| | | | U.S. Treasury Notes: 1.6% | |
| 4,079,200 | | | 1.625%,12/31/2021 | | | | | 4,083,316 | | | | | | 1.1 | | |
Principal
Amount† | | | Value | | | Percentage
of Net
Assets | |
| U.S. TREASURY OBLIGATIONS: (continued) | |
| | | | U.S. Treasury Notes (continued) | |
| 2,152,000 | | | 1.750%-2.125%,
01/31/2021-11/15/2029 | | | | $ | 2,131,336 | | | | | | 0.5 | | |
| | | | | | | | | 6,214,652 | | | | | | 1.6 | | |
| | | | Total U.S. Treasury
Obligations
(Cost $8,793,697) | | | | | 8,771,896 | | | | | | 2.3 | | |
| | | | | |
COMMERCIAL MORTGAGE-BACKED SECURITIES: 11.8%
| |
| 330,000 (1)(8) | | | BAMLL Re-REMIC Trust
2016-FRR16 B, 1.003%,
05/27/2021 | | | | | 317,261 | | | | | | 0.1 | | |
| 410,000 (1)(8) | | | Jackson Park Trust
2019-LIC F, 3.242%,
10/14/2039 | | | | | 353,977 | | | | | | 0.1 | | |
| 370,000 (1)(8) | | | JPMCC Re-REMIC Trust
2015-FRR2 AK36, 2.205%,
12/27/2046 | | | | | 352,355 | | | | | | 0.1 | | |
| 17,717,664 (8)(9) | | | Morgan Stanley Capital I
Trust 2019-L3 XA, 0.645%,
11/15/2029 | | | | | 948,134 | | | | | | 0.2 | | |
| 200,000 (1) | | | MRCD 2019-PARK E
Mortgage Trust, 2.718%,
12/15/2036 | | | | | 189,307 | | | | | | 0.1 | | |
| 370,000 (1) | | | MRCD 2019-PARK F
Mortgage Trust, 2.718%,
12/15/2036 | | | | | 344,271 | | | | | | 0.1 | | |
| 650,000 (1) | | | BANK 2017-BNK4 D,
3.357%, 05/15/2050 | | | | | 596,356 | | | | | | 0.1 | | |
| 2,000,000 (1)(8) | | | BANK 2017-BNK5 D,
3.078%, 06/15/2060 | | | | | 1,813,995 | | | | | | 0.5 | | |
| 1,170,000 (1) | | | BANK 2017-BNK8 D,
2.600%, 11/15/2050 | | | | | 1,032,867 | | | | | | 0.3 | | |
| 1,460,000 (1) | | | BANK 2019-BNK17 D,
3.000%, 04/15/2052 | | | | | 1,330,964 | | | | | | 0.3 | | |
| 1,000,000 (1)(8) | | | Benchmark 2018-B3 D
Mortgage Trust, 3.057%,
04/10/2051 | | | | | 911,912 | | | | | | 0.2 | | |
| 12,422,039 (8)(9) | | | BENCHMARK 2019-B10
XA Mortgage Trust,
1.232%,
03/15/2062 | | | | | 1,113,000 | | | | | | 0.3 | | |
| 800,000 (1) | | | BX Commercial Mortgage
Trust 2019-XL J, 4.390%,
(US0001M + 2.650%),
10/15/2036 | | | | | 803,027 | | | | | | 0.2 | | |
| 310,000 (1) | | | BX Trust 2019-OC11 E,
4.076%, 12/09/2041 | | | | | 301,051 | | | | | | 0.1 | | |
| 2,000,000 (1)(8) | | | CALI Mortgage Trust
2019-101C E, 4.324%,
03/10/2039 | | | | | 2,079,441 | | | | | | 0.5 | | |
| 16,260,000 (8)(9) | | | Citigroup Commercial
Mortgage Trust 2019-C7
XA, 1.009%, 12/15/2072 | | | | | 1,144,888 | | | | | | 0.3 | | |
| 2,350,000 (1)(8) | | | Citigroup Commercial
Mortgage Trust 2013-GC15
D, 5.214%, 09/10/2046 | | | | | 2,469,755 | | | | | | 0.6 | | |
See Accompanying Notes to Financial Statements
SUMMARY PORTFOLIO OF INVESTMENTS
| Voya Balanced Income Portfolio | as of December 31, 2019 (continued) |
Principal
Amount† | | | Value | | | Percentage
of Net
Assets | |
COMMERCIAL MORTGAGE-BACKED SECURITIES: (continued)
| |
| 2,000,000 (8) | | | Commercial Mortgage
Pass Through Certificates
2016-CR28 D, 3.896%,
02/10/2049 | | | | $ | 2,025,473 | | | | | | 0.5 | | |
| 650,000 (1)(8) | | | COMM 2014-LC15 D
Mortgage Trust, 4.984%,
04/10/2047 | | | | | 660,937 | | | | | | 0.2 | | |
| 2,000,000 (8) | | | COMM 2015-CCRE26 D
Mortgage Trust, 3.484%,
10/10/2048 | | | | | 1,891,285 | | | | | | 0.5 | | |
| 520,000 (1) | | | Credit Suisse Mortgage
Capital Certificates
2019-ICE4 F, 4.390%,
(US0001M + 2.650%),
05/15/2036 | | | | | 522,308 | | | | | | 0.1 | | |
| 2,000,000 (8) | | | CSAIL 2015-C2 C
Commercial Mortgage
Trust, 4.192%,
06/15/2057 | | | | | 1,942,466 | | | | | | 0.5 | | |
| 190,000 (1)(8) | | | DBUBS 2017-BRBK E
Mortgage Trust, 3.530%,
10/10/2034 | | | | | 189,188 | | | | | | 0.1 | | |
| 205,000 (1)(8) | | | GRACE 2014-GRCE F
Mortgage Trust, 3.590%,
06/10/2028 | | | | | 205,761 | | | | | | 0.1 | | |
| 13,790,457 (8)(9) | | | GS Mortgage Securities
Trust 2019-GC39 XA,
1.143%, 05/10/2052 | | | | | 1,105,155 | | | | | | 0.3 | | |
| 2,000,000 (1) | | | Hawaii Hotel Trust
2019-MAUI F, 4.490%,
(US0001M + 3.000%),
05/15/2038 | | | | | 2,005,939 | | | | | | 0.5 | | |
| 931,460 (1) | | | HPLY Trust 2019-HIT E,
4.090%, (US0001M +
2.350%), 11/15/2036 | | | | | 934,289 | | | | | | 0.2 | | |
| 200,000 (1)(8) | | | JPMBB Commercial
Mortgage Securities Trust
2013-C17 F, 3.867%,
01/15/2047 | | | | | 176,281 | | | | | | 0.0 | | |
| 27,618,815 (8)(9) | | | JPMDB Commercial
Mortgage Securities Trust
2018-C8 XA, 0.649%,
06/15/2051 | | | | | 1,089,897 | | | | | | 0.3 | | |
| 2,000,000 (1) | | | KNDL 2019-KNSQ E
Mortgage Trust, 3.540%,
(US0001M + 1.800%),
05/15/2036 | | | | | 2,001,216 | | | | | | 0.5 | | |
| 560,000 (1) | | | Morgan Stanley Bank of
America Merrill Lynch Trust
2013-C13 F, 3.707%,
11/15/2046 | | | | | 528,809 | | | | | | 0.2 | | |
| 530,000 (1) | | | Morgan Stanley Capital I
Trust 2011-C1 M, 4.193%,
09/15/2047 | | | | | 515,384 | | | | | | 0.1 | | |
| 1,955,000 (1)(8) | | | Morgan Stanley Capital I
Trust 2016-BNK2 D,
3.000%, 11/15/2049 | | | | | 1,787,477 | | | | | | 0.5 | | |
Principal
Amount† | | | Value | | | Percentage
of Net
Assets | |
COMMERCIAL MORTGAGE-BACKED SECURITIES: (continued)
| |
| 2,000,000 (1) | | | Morgan Stanley Capital I
Trust 2019-PLND E,
3.890%, (US0001M +
2.150%), 05/15/2036 | | | | $ | 2,004,001 | | | | | | 0.5 | | |
| 2,000,000 (1) | | | UBS Commercial
Mortgage Trust
2018-NYCH C,
3.240%, (US0001M +
1.500%), 02/15/2032 | | | | | 1,998,809 | | | | | | 0.5 | | |
| 2,240,000 (1) | | | Wells Fargo Commercial
Mortgage Trust 2019-
C49 D, 3.000%,
03/15/2052 | | | | | 1,966,853 | | | | | | 0.5 | | |
| 2,000,000 (1)(8) | | | WFRBS Commercial
Mortgage Trust 2011-
C5 E, 5.671%, 11/15/2044 | | | | | 2,051,310 | | | | | | 0.6 | | |
| 2,210,000 (1) | | | WFRBS Commercial
Mortgage Trust 2013-
C12 E, 3.500%,
03/15/2048 | | | | | 2,030,917 | | | | | | 0.5 | | |
| 1,920,000 (8) | | | WFRBS Commercial
Mortgage Trust 2014-
C19 C, 4.646%,
03/15/2047 | | | | | 2,016,987 | | | | | | 0.5 | | |
| | | | Total Commercial
Mortgage-Backed
Securities | | | | | | | | | | | | | |
| | | | (Cost $44,715,508) | | | | | 45,753,303 | | | | | | 11.8 | | |
| | | | | |
| ASSET-BACKED SECURITIES: 8.1% | |
| | | | Automobile Asset-Backed Securities: 1.5% | |
| 550,000 (1) | | | Oscar US Funding XI LLC
2019-2A A4, 2.680%,
09/10/2026 | | | | | 554,587 | | | | | | 0.2 | | |
| 550,000 | | | Santander Drive Auto
Receivables Trust 2019-1
D, 3.650%, 04/15/2025 | | | | | 563,478 | | | | | | 0.1 | | |
| 1,000,000 | | | Santander Drive Auto
Receivables Trust 2019-2
D, 3.220%, 07/15/2025 | | | | | 1,020,239 | | | | | | 0.3 | | |
| 150,000 | | | Santander Drive Auto
Receivables Trust 2019-3
C, 2.490%, 10/15/2025 | | | | | 150,622 | | | | | | 0.0 | | |
| 350,000 | | | Santander Drive Auto
Receivables Trust 2019-3
D, 2.680%, 10/15/2025 | | | | | 348,797 | | | | | | 0.1 | | |
| 600,000 (1) | | | Santander Retail Auto
Lease Trust 2019-B C,
2.770%, 08/21/2023 | | | | | 602,843 | | | | | | 0.2 | | |
| 2,450,000 | | | Other Securities | | | | | 2,472,566 | | | | | | 0.6 | | |
| | | | | | | | | 5,713,132 | | | | | | 1.5 | | |
| | | | | |
See Accompanying Notes to Financial Statements
SUMMARY PORTFOLIO OF INVESTMENTS
| Voya Balanced Income Portfolio | as of December 31, 2019 (continued) |
Principal
Amount† | | | Value | | | Percentage
of Net
Assets | |
| ASSET-BACKED SECURITIES: (continued) | |
| | | | Home Equity Asset-Backed
Securities: 0.2% | |
| 629,928 (1)(8) | | | ACE Securities Corp.
Mortgage Loan Trust
Series 2007-D1 A2,
6.336%, 02/25/2038 | | | | $ | 602,511 | | | | | | 0.2 | | |
| | | | | |
| | | | Other Asset-Backed Securities: 6.3% | |
| 150,000 (1) | | | Applebee’s Funding LLC /
IHOP Funding LLC
2019-1A A2II, 4.723%,
06/07/2049 | | | | | 154,011 | | | | | | 0.0 | | |
| 400,000 (1) | | | Applebee’s Funding LLC /
IHOP Funding LLC
2019-1A A2I, 4.194%,
06/07/2049 | | | | | 406,004 | | | | | | 0.1 | | |
| 300,000 (1) | | | Babson CLO Ltd. 2018-3A
C, 3.866%, (US0003M +
1.900%), 07/20/2029 | | | | | 291,578 | | | | | | 0.1 | | |
| 750,000 (1) | | | Benefit Street Partners
CLO II Ltd. 2013-IIA BR,
4.551%, (US0003M +
2.550%), 07/15/2029 | | | | | 730,719 | | | | | | 0.2 | | |
| 750,000 (1) | | | Benefit Street Partners
CLO X Ltd. 2016-10A BR,
4.401%, (US0003M +
2.400%), 01/15/2029 | | | | | 738,977 | | | | | | 0.2 | | |
| 700,000 (1) | | | Dryden 43 Senior Loan
Fund 2016-43A CR,
4.366%, (US0003M +
2.400%), 07/20/2029 | | | | | 694,071 | | | | | | 0.2 | | |
| 453,197 (1) | | | J.G. Wentworth XXXVIII
LLC 2017-1A A, 3.990%,
08/16/2060 | | | | | 484,030 | | | | | | 0.1 | | |
| 750,000 (1) | | | LCM XV L.P. 15A CR,
4.366%, (US0003M +
2.400%), 07/20/2030 | | | | | 740,380 | | | | | | 0.2 | | |
| 750,000 (1) | | | Neuberger Berman CLO
XVII Ltd. 2014-17A CR,
4.603%, (US0003M +
2.650%), 04/22/2029 | | | | | 738,502 | | | | | | 0.2 | | |
| 1,000,000 (1) | | | Neuberger Berman Loan
Advisers CLO 25 Ltd.
2017-25A C, 4.153%,
(US0003M + 2.150%),
10/18/2029 | | | | | 988,584 | | | | | | 0.3 | | |
| 750,000 (1) | | | Neuberger Berman Loan
Advisers CLO 33 Ltd.
2019-33A C, 4.590%,
(US0003M + 2.450%),
10/16/2032 | | | | | 750,392 | | | | | | 0.2 | | |
| 800,000 (1) | | | Palmer Square Loan
Funding 2019-2A B Ltd.,
4.216%, (US0003M +
2.250%), 04/20/2027 | | | | | 799,983 | | | | | | 0.2 | | |
| 500,000 (1) | | | Shackleton CLO Ltd.
2019-15A C, 4.703%,
(US0003M + 2.800%),
01/15/2030 | | | | | 499,980 | | | | | | 0.1 | | |
Principal
Amount† | | | Value | | | Percentage
of Net
Assets | |
| ASSET-BACKED SECURITIES: (continued) | |
| | | | Other Asset-Backed Securities (continued) | |
| 500,000 (1) | | | Silver Creek CLO Ltd.
2014-1A CR, 4.266%,
(US0003M + 2.300%),
07/20/2030 | | | | $ | 495,808 | | | | | | 0.1 | | |
| 500,000 (1) | | | BlueMountain CLO XXV
Ltd. 2019-25A C, 4.736%,
(US0003M + 2.450%),
07/15/2032 | | | | | 500,127 | | | | | | 0.1 | | |
| 392,000 (1) | | | Domino’s Pizza Master
Issuer LLC 2017-1A A2II,
3.082%,
07/25/2047 | | | | | 393,222 | | | | | | 0.1 | | |
| 609,288 (1) | | | Domino’s Pizza Master
Issuer LLC 2018-1A A2I,
4.116%,
07/25/2048 | | | | | 627,707 | | | | | | 0.2 | | |
| 500,000 (1) | | | Dryden 75 CLO Ltd.
2019-75A CR, 4.401%,
(US0003M + 2.400%),
07/15/2030 | | | | | 496,768 | | | | | | 0.1 | | |
| 750,000 (1) | | | LCM XXII Ltd. 22A BR,
3.966%, (US0003M +
2.000%), 10/20/2028 | | | | | 723,904 | | | | | | 0.2 | | |
| 700,000 (1) | | | LCM XXIV Ltd. 24A C,
4.216%, (US0003M +
2.250%), 03/20/2030 | | | | | 675,937 | | | | | | 0.2 | | |
| 500,000 (1) | | | Madison Park Funding XXI
Ltd. 2016-21A BR, 4.790%,
(US0003M + 2.850%),
10/15/2032 | | | | | 500,341 | | | | | | 0.1 | | |
| 650,000 (1) | | | Marlette Funding Trust
2019-3A B, 3.070%,
09/17/2029 | | | | | 652,411 | | | | | | 0.2 | | |
| 567,373 (1) | | | Mill City Solar Loan
2019-2GS A Ltd., 3.690%,
07/20/2043 | | | | | 573,820 | | | | | | 0.1 | | |
| 935,521 (1) | | | Mosaic Solar Loans
2017-2A A LLC,
3.820%, 06/22/2043 | | | | | 953,201 | | | | | | 0.2 | | |
| 750,000 (1) | | | OCP Clo 2019-17A C1
Ltd., 4.847%, (US0003M +
2.550%), 07/20/2032 | | | | | 750,522 | | | | | | 0.2 | | |
| 250,000 (1) | | | Octagon Loan Funding Ltd.
2014-1A CRR, 4.104%,
(US0003M + 2.200%),
11/18/2031 | | | | | 238,584 | | | | | | 0.1 | | |
| 750,000 (1) | | | OHA Credit Funding 3 Ltd.
2019-3A C, 5.075%,
(US0003M + 2.450%),
07/20/2032 | | | | | 750,751 | | | | | | 0.2 | | |
| 1,000,000 (1) | | | Palmer Square CLO
2015-1A BR2 Ltd., 4.145%,
(US0003M + 2.250%),
05/21/2029 | | | | | 986,045 | | | | | | 0.2 | | |
| 150,000 (1) | | | Sofi Consumer Loan
Program 2018-2 B Trust,
3.790%, 04/26/2027 | | | | | 152,827 | | | | | | 0.0 | | |
See Accompanying Notes to Financial Statements
SUMMARY PORTFOLIO OF INVESTMENTS
| Voya Balanced Income Portfolio | as of December 31, 2019 (continued) |
Principal
Amount† | | | Value | | | Percentage
of Net
Assets | |
| ASSET-BACKED SECURITIES: (continued) | |
| | | | Other Asset-Backed Securities (continued) | |
| 150,000 (1) | | | SoFi Consumer Loan
Program 2018-4 B Trust,
3.960%, 11/26/2027 | | | | $ | 153,320 | | | | | | 0.0 | | |
| 1,000,000 (1) | | | SoFi Consumer Loan
Program 2019-3 D Trust,
3.890%, 05/25/2028 | | | | | 1,018,205 | | | | | | 0.3 | | |
| 200,000 (1) | | | SoFi Consumer Loan
Program 2019-4 C Trust,
2.840%, 08/25/2028 | | | | | 199,539 | | | | | | 0.1 | | |
| 100,000 (1) | | | SoFi Consumer Loan
Program 2019-4 D Trust,
3.480%, 08/25/2028 | | | | | 99,747 | | | | | | 0.0 | | |
| 384,079 (1) | | | Sunrun Xanadu Issuer
2019-1A A LLC, 3.980%,
06/30/2054 | | | | | 389,366 | | | | | | 0.1 | | |
| 750,000 (1) | | | THL Credit Wind River
2016-1A CR CLO Ltd.,
4.086%, (US0003M +
2.100%), 07/15/2028 | | | | | 734,431 | | | | | | 0.2 | | |
| 2,000,000 (1)(8) | | | Towd Point Mortgage Trust
2015-4 M2, 3.750%,
04/25/2055 | | | | | 2,090,053 | | | | | | 0.5 | | |
| 180,000 (1)(8) | | | Towd Point Mortgage Trust
2015-6 M2, 3.750%,
04/25/2055 | | | | | 191,099 | | | | | | 0.1 | | |
| 1,176,000 (1) | | | Wendy’s Funding LLC
2018-1A A2II, 3.884%,
03/15/2048 | | | | | 1,197,321 | | | | | | 0.3 | | |
| 248,750 (1) | | | Wendy’s Funding LLC
2019-1A A2I, 3.783%,
06/15/2049 | | | | | 254,018 | | | | | | 0.1 | | |
| 780,000 (1) | | | Westcott Park CLO Ltd.
2016-1A CR, 4.216%,
(US0003M + 2.250%),
07/20/2028 | | | | | 775,287 | | | | | | 0.2 | | |
| | | | | | | | | 24,591,572 | | | | | | 6.3 | | |
| | | | Student Loan Asset-Backed
Securities: 0.1% | |
| 600,000 (1) | | | Sofi Professional Loan
Program 2019-C BFX LLC,
3.050%, 11/16/2048 | | | | | 579,001 | | | | | | 0.1 | | |
| | | | Total Asset-Backed
Securities
(Cost $31,431,731) | | | | | 31,486,216 | | | | | | 8.1 | | |
| SOVEREIGN BONDS: 2.1% | |
BRL5,000,000 | | | Brazil Notas do Tesouro
Nacional Serie F,
10.000%, 01/01/2027 | | | | | 1,461,399 | | | | | | 0.4 | | |
| 200,000 (1) | | | Kenya Government
International Bond,
7.000%, 05/22/2027 | | | | | 213,388 | | | | | | 0.0 | | |
PEN1,303,000 (1) | | | Peru Government Bond,
6.150%, 08/12/2032 | | | | | 446,060 | | | | | | 0.1 | | |
Principal
Amount† | | | Value | | | Percentage
of Net
Assets | |
| SOVEREIGN BONDS: (continued) | |
RUB12,298,392,000 | | | Other Securities | | | | $ | 6,156,739 | | | | | | 1.6 | | |
| �� | | | Total Sovereign Bonds
(Cost $8,058,364) | | | | | 8,277,586 | | | | | | 2.1 | | |
| |
| | | | Value | | | Percentage
of Net
Assets | |
| PURCHASED OPTIONS(11): 0.0% | |
| | | | Total Purchased Options
(Cost $32,214) | | | | | 18,947 | | | | | | 0.0 | | |
| | | | Total Long-Term
Investments
(Cost $358,594,887) | | | | | 376,865,030 | | | | | | 96.9 | | |
| |
Principal
Amount† | | | | | | Value | | | Percentage
of Net
Assets | |
| SHORT-TERM INVESTMENTS: 0.6% | |
| | | | Repurchase Agreements: 0.6% | |
| 1,000,000 (12) | | | Bank of Nova Scotia,
Repurchase Agreement
dated 12/31/19, 1.57%,
due 01/02/20
(Repurchase Amount
$1,000,086,
collateralized by various
U.S. Government Agency
Obligations,
2.500%-6.500%, Market
Value plus accrued
interest $1,020,089, due
09/01/24-11/01/49) | | | | | 1,000,000 | | | | | | 0.3 | | |
| 178,222 (12) | | | Citadel Securities LLC,
Repurchase Agreement
dated 12/31/19, 1.60%,
due 01/02/20
(Repurchase Amount
$178,238, collateralized
by various U.S.
Government Securities,
0.000%-8.500%, Market
Value plus accrued
interest $181,803, due
01/15/20-11/15/48) | | | | | 178,222 | | | | | | 0.0 | | |
| 1,000,000 (12) | | | RBC Dominion Securities
Inc., Repurchase
Agreement dated
12/31/19, 1.57%, due
01/02/20 (Repurchase
Amount $1,000,086,
collateralized by various
U.S. Government/U.S.
Government Agency
Obligations,
0.000%-6.500%, Market
Value plus accrued
interest $1,020,000, due
06/30/21-12/01/49) | | | | | 1,000,000 | | | | | | 0.3 | | |
See Accompanying Notes to Financial Statements
SUMMARY PORTFOLIO OF INVESTMENTS
| Voya Balanced Income Portfolio | as of December 31, 2019 (continued) |
Principal
Amount† | | | | | | Value | | | Percentage
of Net
Assets | |
| SHORT-TERM INVESTMENTS: (continued) | |
| | | | Repurchase Agreements (continued) | |
| | | | Total Repurchase
Agreements | | | | | | | | | | | | | |
| | | | Total Short-Term
Investments
(Cost $2,178,222) | | | | $ | 2,178,222 | | | | | | 0.6 | | |
| | | | Total Investments in
Securities
(Cost $360,773,109) | | | | $ | 379,043,252 | | | | | | 97.5 | | |
| | | | Assets in Excess of
Other Liabilities | | | | | 9,569,491 | | | | | | 2.5 | | |
| | | | Net Assets | | | | $ | 388,612,743 | | | | | | 100.0 | | |
| |
“Other Securities” represents issues not identified as the top 50 holdings in terms of market value and issues or issuers not exceeding 1% of net assets individually or in aggregate respectively as of December 31, 2019.
The following footnotes apply to either the individual securities noted or one or more of the securities aggregated and listed as a single line item.
†
Unless otherwise indicated, principal amount is shown in USD.
(1)
Securities with purchases pursuant to Rule 144A or section 4(a)(2), under the Securities Act of 1933 and may not be resold subject to that rule except to qualified institutional buyers.
(2)
The grouping contains non-income producing securities.
(3)
The grouping contains securities on loan.
(4)
Preferred Stock may be called prior to convertible date.
(5)
Non-income producing security.
(6)
Security, or a portion of the security, is on loan.
(7)
All or a portion of this security is payment-in-kind (“PIK”) which may pay interest or additional principal at the issuer’s discretion. Rates shown are the current rate and possible payment rates.
(8)
Variable rate security. Rate shown is the rate in effect as of December 31, 2019.
(9)
Interest only securities represent the right to receive the monthly interest payments on an underlying pool of mortgage loans. Principal amount shown represents the notional amount on which current interest is calculated. Payments of principal on the pool reduce the value of the interest only security.
(10)
Settlement is on a when-issued or delayed-delivery basis.
(11)
The tables within the Portfolio of Investments detail open purchased options which are non-income producing securities.
(12)
All or a portion of the security represents securities purchased with cash collateral received for securities on loan.
Currency Abbreviations:
BRL Brazilian Real
EUR EU Euro
IDR Indonesian Rupiah
PEN Peruvian Nuevo Sol
RUB Russian Ruble
Reference Rate Abbreviations:
US0001M 1-month LIBOR
US0003M 3-month LIBOR
Fair Value Measurements^
The following is a summary of the fair valuations according to the inputs used as of December 31, 2019 in valuing the assets and liabilities:
| | | | Quoted Prices
in Active Markets
for Identical
Investments
(Level 1) | | | Significant
Other
Observable
Inputs#
(Level 2) | | | Significant
Unobservable
Inputs
(Level 3) | | | Fair Value
at
December 31, 2019 | |
| Asset Table | | | | | | | | | | | | | | | | | | | | | | | | | |
| Investments, at fair value | | | | | | | | | | | | | | | | | | | | | | | | | |
| Common Stock | | | | | | | | | | | | | | | | | | | | | | | | | |
| Communication Services | | | | $ | 7,640,988 | | | | | $ | 1,886,410 | | | | | $ | — | | | | | $ | 9,527,398 | | |
| Consumer Discretionary | | | | | 11,237,512 | | | | | | 1,965,316 | | | | | | — | | | | | | 13,202,828 | | |
| Consumer Staples | | | | | 9,735,624 | | | | | | 3,182,094 | | | | | | — | | | | | | 12,917,718 | | |
| Energy | | | | | 4,810,730 | | | | | | 1,507,855 | | | | | | — | | | | | | 6,318,585 | | |
| Financials | | | | | 15,786,539 | | | | | | 5,282,060 | | | | | | — | | | | | | 21,068,599 | | |
| Health Care | | | | | 16,883,809 | | | | | | 3,400,239 | | | | | | — | | | | | | 20,284,048 | | |
| Industrials | | | | | 10,326,044 | | | | | | 5,339,286 | | | | | | — | | | | | | 15,665,330 | | |
| Information Technology | | | | | 34,974,137 | | | | | | 1,698,216 | | | | | | — | | | | | | 36,672,353 | | |
| Materials | | | | | 2,066,600 | | | | | | 2,052,538 | | | | | | — | | | | | | 4,119,138 | | |
| Real Estate | | | | | 5,255,549 | | | | | | 1,395,743 | | | | | | — | | | | | | 6,651,292 | | |
| Utilities | | | | | 5,320,393 | | | | | | 1,300,058 | | | | | | — | | | | | | 6,620,451 | | |
| Total Common Stock | | | | | 124,037,925 | | | | | | 29,009,815 | | | | | | — | | | | | | 153,047,740 | | |
| Exchange-Traded Funds | | | | | 2,348,440 | | | | | | — | | | | | | — | | | | | | 2,348,440 | | |
| Mutual Funds | | | | | 33,156,275 | | | | | | — | | | | | | — | | | | | | 33,156,275 | | |
See Accompanying Notes to Financial Statements
SUMMARY PORTFOLIO OF INVESTMENTS
| Voya Balanced Income Portfolio | as of December 31, 2019 (continued) |
| | | | Quoted Prices
in Active Markets
for Identical
Investments
(Level 1) | | | Significant
Other
Observable
Inputs#
(Level 2) | | | Significant
Unobservable
Inputs
(Level 3) | | | Fair Value
at
December 31, 2019 | |
| Preferred Stock | | | | | — | | | | | | 2,012,442 | | | | | | — | | | | | | 2,012,442 | | |
| Rights | | | | | 895 | | | | | | — | | | | | | — | | | | | | 895 | | |
| Purchased Options | | | | | — | | | | | | 18,947 | | | | | | — | | | | | | 18,947 | | |
| Corporate Bonds/Notes | | | | | — | | | | | | 25,603,900 | | | | | | — | | | | | | 25,603,900 | | |
| Collateralized Mortgage Obligations | | | | | — | | | | | | 56,842,715 | | | | | | — | | | | | | 56,842,715 | | |
| Asset-Backed Securities | | | | | — | | | | | | 31,486,216 | | | | | | — | | | | | | 31,486,216 | | |
| U.S. Government Agency Obligations | | | | | — | | | | | | 9,544,675 | | | | | | — | | | | | | 9,544,675 | | |
| Commercial Mortgage-Backed Securities | | | | | — | | | | | | 45,753,303 | | | | | | — | | | | | | 45,753,303 | | |
| Sovereign Bonds | | | | | — | | | | | | 8,277,586 | | | | | | — | | | | | | 8,277,586 | | |
| U.S. Treasury Obligations | | | | | — | | | | | | 8,771,896 | | | | | | — | | | | | | 8,771,896 | | |
| Short-Term Investments | | | | | — | | | | | | 2,178,222 | | | | | | — | | | | | | 2,178,222 | | |
| Total Investments, at fair value | | | | $ | 159,543,535 | | | | | $ | 219,499,717 | | | | | $ | — | | | | | $ | 379,043,252 | | |
| Other Financial Instruments+ | | | | | | | | | | | | | | | | | | | | | | | | | |
| Centrally Cleared Swaps | | | | | — | | | | | | 115,231 | | | | | | — | | | | | | 115,231 | | |
| Forward Foreign Currency Contracts | | | | | — | | | | | | 1,037,336 | | | | | | — | | | | | | 1,037,336 | | |
| Futures | | | | | 394,930 | | | | | | — | | | | | | — | | | | | | 394,930 | | |
| Total Assets | | | | $ | 159,938,465 | | | | | $ | 220,652,284 | | | | | $ | — | | | | | $ | 380,590,749 | | |
| Liabilities Table | | | | | | | | | | | | | | | | | | | | | | | | | |
| Other Financial Instruments+ | | | | | | | | | | | | | | | | | | | | | | | | | |
| Centrally Cleared Swaps | | | | $ | — | | | | | $ | (30,609) | | | | | $ | — | | | | | $ | (30,609) | | |
| Forward Foreign Currency Contracts | | | | | — | | | | | | (697,516) | | | | | | — | | | | | | (697,516) | | |
| Futures | | | | | (319,343) | | | | | | — | | | | | | — | | | | | | (319,343) | | |
| Volatility Swaps | | | | | — | | | | | | (36,587) | | | | | | — | | | | | | (36,587) | | |
| Written Options | | | | | — | | | | | | (1,015) | | | | | | — | | | | | | (1,015) | | |
| Total Liabilities | | | | $ | (319,343) | | | | | $ | (765,727) | | | | | $ | — | | | | | $ | (1,085,070) | | |
^
See Note 2, “Significant Accounting Policies” in the Notes to Financial Statements for additional information.
+
Other Financial Instruments may include open forward foreign currency contracts, futures, centrally cleared swaps, OTC swaps and written options. Forward foreign currency contracts, futures and centrally cleared swaps are valued at the unrealized gain (loss) on the instrument. OTC swaps and written options are valued at the fair value of the instrument.
#
The earlier close of the foreign markets gives rise to the possibility that significant events, including broad market moves, may have occurred in the interim and may materially affect the value of those securities. To account for this, the Portfolio may frequently value many of its foreign equity securities using fair value prices based on third party vendor modeling tools to the extent available. Accordingly, a portion of the Portfolio’s investments are categorized as Level 2 investments.
Transactions with Affiliates
An investment of at least 5% of the voting securities of an issuer, or a company which is under common control results in that issuer becoming an affiliated person as defined by the 1940 Act. The following table provides transactions during the period ended December 31, 2019, where the following issuers were considered an affiliate:
| Issuer | | | Beginning
Fair Value
at 12/31/18 | | | Purchases
at Cost | | | Sales
at Cost | | | Change in
Unrealized
Appreciation/
(Depreciation) | | | Ending Fair
Value at
12/31/2019 | | | Investment
Income | | | Realized
Gains/
(Losses) | | | Net
Capital Gain
Distributions | |
| Voya Floating Rate Fund – Class P | | | | | | | | | | $ | 43,978,877 | | | | | $ | (10,207,554) | | | | | $ | (615,048) | | | | | $ | 33,156,275 | | | | | $ | 1,453,862 | | | | | $ | (252,558) | | | | | $ | — | | |
| | | | | $ | — | | | | | $ | 43,978,877 | | | | | $ | (10,207,554) | | | | | $ | (615,048) | | | | | $ | 33,156,275 | | | | | $ | 1,453,862 | | | | | $ | (252,558) | | | | | $ | — | | |
The financial statements for the above mutual fund[s] can be found at www.sec.gov.
See Accompanying Notes to Financial Statements
SUMMARY PORTFOLIO OF INVESTMENTS
| Voya Balanced Income Portfolio | as of December 31, 2019 (continued) |
At December 31, 2019, the following forward foreign currency contracts were outstanding for Voya Balanced Income Portfolio:
| Currency Purchased | | | Currency Sold | | | Counterparty | | | Settlement
Date | | | Unrealized
Appreciation
(Depreciation) | |
| USD 2,394,000 | | | GBP 1,827,314 | | | Bank of America N.A. | | | | | 01/17/20 | | | | | $ | (27,479) | | |
| USD 539,000 | | | NZD 800,771 | | | Bank of America N.A. | | | | | 01/17/20 | | | | | | (195) | | |
| NZD 2,023,030 | | | USD 1,325,784 | | | Bank of America N.A. | | | | | 01/17/20 | | | | | | 36,413 | | |
| GBP 1,644,744 | | | USD 2,158,000 | | | Bank of America N.A. | | | | | 01/17/20 | | | | | | 21,545 | | |
| COP 12,994,599 | | | USD 3,898 | | | Bank of America N.A. | | | | | 02/07/20 | | | | | | 50 | | |
| NOK 33,452,479 | | | USD 3,659,545 | | | BNP Paribas | | | | | 01/17/20 | | | | | | 151,085 | | |
| SEK 71,366,076 | | | USD 7,511,881 | | | BNP Paribas | | | | | 01/17/20 | | | | | | 112,873 | | |
| USD 2,458,366 | | | GBP 1,865,536 | | | BNP Paribas | | | | | 01/17/20 | | | | | | (13,763) | | |
| USD 7,955,661 | | | EUR 7,166,134 | | | BNP Paribas | | | | | 01/17/20 | | | | | | (89,837) | | |
| RUB 2,710,816 | | | USD 42,283 | | | BNP Paribas | | | | | 02/07/20 | | | | | | 1,200 | | |
| USD 46,000 | | | RUB 2,951,566 | | | BNP Paribas | | | | | 02/07/20 | | | | | | (1,345) | | |
| USD 920,321 | | | PEN 3,078,380 | | | BNP Paribas | | | | | 02/07/20 | | | | | | (7,723) | | |
| USD 1,187,000 | | | CHF 1,163,395 | | | Brown Brothers Harriman & Co. | | | | | 01/17/20 | | | | | | (16,346) | | |
| USD 3,545,000 | | | CHF 3,471,264 | | | Brown Brothers Harriman & Co. | | | | | 01/17/20 | | | | | | (45,467) | | |
| EUR 742,980 | | | USD 825,000 | | | Brown Brothers Harriman & Co. | | | | | 01/17/20 | | | | | | 9,152 | | |
| USD 2,713,000 | | | NOK 23,916,302 | | | Brown Brothers Harriman & Co. | | | | | 01/17/20 | | | | | | (11,348) | | |
| USD 3,090,000 | | | CAD 4,032,849 | | | Brown Brothers Harriman & Co. | | | | | 01/17/20 | | | | | | (15,890) | | |
| USD 3,504,000 | | | SEK 32,720,447 | | | Brown Brothers Harriman & Co. | | | | | 01/17/20 | | | | | | 8,147 | | |
| EUR 897,016 | | | USD 997,000 | | | Brown Brothers Harriman & Co. | | | | | 01/17/20 | | | | | | 10,089 | | |
| SEK 11,161,983 | | | USD 1,185,000 | | | Brown Brothers Harriman & Co. | | | | | 01/17/20 | | | | | | 7,546 | | |
| EUR 7,952,909 | | | USD 8,890,000 | | | Brown Brothers Harriman & Co. | | | | | 01/17/20 | | | | | | 38,818 | | |
| USD 1,921,000 | | | AUD 2,743,549 | | | Brown Brothers Harriman & Co. | | | | | 01/17/20 | | | | | | (4,991) | | |
| EUR 1,494,884 | | | USD 1,676,000 | | | Brown Brothers Harriman & Co. | | | | | 01/17/20 | | | | | | 2,323 | | |
| USD 954,000 | | | SEK 8,905,899 | | | Brown Brothers Harriman & Co. | | | | | 01/17/20 | | | | | | 2,494 | | |
| USD 829,000 | | | GBP 636,403 | | | Brown Brothers Harriman & Co. | | | | | 01/17/20 | | | | | | (14,335) | | |
| USD 1,178,000 | | | SEK 11,075,597 | | | Brown Brothers Harriman & Co. | | | | | 01/17/20 | | | | | | (5,317) | | |
| USD 1,230,000 | | | CHF 1,202,999 | | | Brown Brothers Harriman & Co. | | | | | 01/17/20 | | | | | | (14,310) | | |
| USD 1,016,000 | | | CAD 1,331,204 | | | Brown Brothers Harriman & Co. | | | | | 01/17/20 | | | | | | (9,224) | | |
| CHF 1,176,316 | | | USD 1,203,000 | | | Brown Brothers Harriman & Co. | | | | | 01/17/20 | | | | | | 13,711 | | |
| JPY 196,659,234 | | | USD 1,808,000 | | | Brown Brothers Harriman & Co. | | | | | 01/17/20 | | | | | | 3,376 | | |
| AUD 2,162,931 | | | USD 1,487,000 | | | Brown Brothers Harriman & Co. | | | | | 01/17/20 | | | | | | 31,393 | | |
| USD 1,001,000 | | | CAD 1,317,384 | | | Brown Brothers Harriman & Co. | | | | | 01/17/20 | | | | | | (13,581) | | |
| USD 675,000 | | | CHF 663,725 | | | Brown Brothers Harriman & Co. | | | | | 01/17/20 | | | | | | (11,517) | | |
| NOK 27,105,341 | | | USD 2,980,000 | | | Brown Brothers Harriman & Co. | | | | | 01/17/20 | | | | | | 107,617 | | |
| USD 8,742,000 | | | EUR 7,824,695 | | | Brown Brothers Harriman & Co. | | | | | 01/17/20 | | | | | | (42,871) | | |
| CHF 1,222,021 | | | USD 1,245,000 | | | Brown Brothers Harriman & Co. | | | | | 01/17/20 | | | | | | 18,985 | | |
| NZD 1,466,728 | | | USD 966,000 | | | Brown Brothers Harriman & Co. | | | | | 01/17/20 | | | | | | 21,614 | | |
| USD 2,305,000 | | | CAD 3,037,826 | | | Brown Brothers Harriman & Co. | | | | | 01/17/20 | | | | | | (34,575) | | |
| USD 1,444,000 | | | JPY 157,425,602 | | | Brown Brothers Harriman & Co. | | | | | 01/17/20 | | | | | | (6,005) | | |
| USD 1,734,000 | | | SEK 16,258,019 | | | Brown Brothers Harriman & Co. | | | | | 01/17/20 | | | | | | (3,007) | | |
| CHF 909,864 | | | USD 941,000 | | | Brown Brothers Harriman & Co. | | | | | 01/17/20 | | | | | | 109 | | |
| EUR 8,836,446 | | | USD 9,805,000 | | | Brown Brothers Harriman & Co. | | | | | 01/17/20 | | | | | | 115,775 | | |
| USD 471,000 | | | JPY 51,323,080 | | | Brown Brothers Harriman & Co. | | | | | 01/17/20 | | | | | | (1,723) | | |
| USD 2,106,000 | | | CAD 2,776,534 | | | Brown Brothers Harriman & Co. | | | | | 01/17/20 | | | | | | (32,341) | | |
| AUD 1,387,068 | | | USD 946,000 | | | Brown Brothers Harriman & Co. | | | | | 01/17/20 | | | | | | 27,732 | | |
| SEK 11,468,291 | | | USD 1,228,000 | | | Brown Brothers Harriman & Co. | | | | | 01/17/20 | | | | | | (2,728) | | |
| GBP 2,485,235 | | | USD 3,273,000 | | | Brown Brothers Harriman & Co. | | | | | 01/17/20 | | | | | | 20,328 | | |
See Accompanying Notes to Financial Statements
SUMMARY PORTFOLIO OF INVESTMENTS
| Voya Balanced Income Portfolio | as of December 31, 2019 (continued) |
| Currency Purchased | | | Currency Sold | | | Counterparty | | | Settlement
Date | | | Unrealized
Appreciation
(Depreciation) | |
| USD 2,276,436 | | | AUD 3,333,713 | | | Brown Brothers Harriman & Co. | | | | | 01/17/20 | | | | | | (63,854) | | |
| USD 580,000 | | | CAD 767,023 | | | Brown Brothers Harriman & Co. | | | | | 01/17/20 | | | | | | (10,721) | | |
| USD 1,361,000 | | | AUD 1,990,575 | | | Brown Brothers Harriman & Co. | | | | | 01/17/20 | | | | | | (36,398) | | |
| NZD 2,421,507 | | | USD 1,615,000 | | | Brown Brothers Harriman & Co. | | | | | 01/17/20 | | | | | | 15,510 | | |
| USD 1,231,000 | | | SEK 11,507,107 | | | Brown Brothers Harriman & Co. | | | | | 01/17/20 | | | | | | 1,580 | | |
| USD 964,000 | | | JPY 104,491,845 | | | Citibank N.A. | | | | | 01/17/20 | | | | | | 1,553 | | |
| GBP 460,821 | | | USD 609,000 | | | Citibank N.A. | | | | | 01/17/20 | | | | | | 1,661 | | |
| USD 838,000 | | | GBP 647,178 | | | Citibank N.A. | | | | | 01/17/20 | | | | | | (19,612) | | |
| AUD 1,675,231 | | | USD 1,151,000 | | | Citibank N.A. | | | | | 01/17/20 | | | | | | 25,024 | | |
| USD 577,000 | | | CAD 762,947 | | | Citibank N.A. | | | | | 01/17/20 | | | | | | (10,582) | | |
| USD 1,198,000 | | | CHF 1,173,777 | | | Citibank N.A. | | | | | 01/17/20 | | | | | | (16,084) | | |
| AUD 815,013 | | | USD 562,000 | | | Citibank N.A. | | | | | 01/17/20 | | | | | | 10,145 | | |
| PLN 42,850 | | | USD 11,169 | | | Citibank N.A. | | | | | 02/07/20 | | | | | | 126 | | |
| USD 954,748 | | | IDR 13,403,326,575 | | | Citibank N.A. | | | | | 02/07/20 | | | | | | (11,350) | | |
| USD 1,520,624 | | | BRL 6,124,466 | | | Citibank N.A. | | | | | 02/07/20 | | | | | | (180) | | |
| CAD 3,948,427 | | | USD 2,979,547 | | | Morgan Stanley Capital Services LLC | | | | | 01/17/20 | | | | | | 61,326 | | |
| USD 1,518,000 | | | CAD 1,994,100 | | | Morgan Stanley Capital Services LLC | | | | | 01/17/20 | | | | | | (17,752) | | |
| SEK 11,285,714 | | | USD 1,202,000 | | | Morgan Stanley Capital Services LLC | | | | | 01/17/20 | | | | | | 3,766 | | |
| EUR 676,338 | | | USD 750,000 | | | Morgan Stanley Capital Services LLC | | | | | 01/17/20 | | | | | | 9,332 | | |
| CHF 1,165,039 | | | USD 1,188,000 | | | Morgan Stanley Capital Services LLC | | | | | 01/17/20 | | | | | | 17,047 | | |
| CHF 2,427,007 | | | USD 2,508,000 | | | Morgan Stanley Capital Services LLC | | | | | 01/17/20 | | | | | | 2,351 | | |
| USD 858,000 | | | GBP 661,777 | | | Morgan Stanley Capital Services LLC | | | | | 01/17/20 | | | | | | (18,958) | | |
| AUD 2,635,537 | | | USD 1,830,000 | | | Morgan Stanley Capital Services LLC | | | | | 01/17/20 | | | | | | 20,166 | | |
| EUR 1,472,702 | | | USD 1,638,000 | | | Morgan Stanley Capital Services LLC | | | | | 01/17/20 | | | | | | 15,418 | | |
| JPY 284,593,178 | | | USD 2,630,376 | | | Morgan Stanley Capital Services LLC | | | | | 01/17/20 | | | | | | (9,064) | | |
| SEK 4,075,830 | | | USD 434,000 | | | Morgan Stanley Capital Services LLC | | | | | 01/17/20 | | | | | | 1,462 | | |
| USD 1,223,000 | | | GBP 939,207 | | | Morgan Stanley Capital Services LLC | | | | | 01/17/20 | | | | | | (21,598) | | |
| CHF 4,052,611 | | | USD 4,105,941 | | | Morgan Stanley Capital Services LLC | | | | | 01/17/20 | | | | | | 85,835 | | |
| USD 1,169,000 | | | JPY 126,680,590 | | | Morgan Stanley Capital Services LLC | | | | | 01/17/20 | | | | | | 2,179 | | |
| IDR 464,138,381 | | | USD 32,975 | | | Morgan Stanley Capital Services LLC | | | | | 02/07/20 | | | | | | 480 | | |
| USD 1,239,145 | | | RUB 79,459,930 | | | Morgan Stanley Capital Services LLC | | | | | 02/07/20 | | | | | | (35,445) | | |
| | | | | | | | | | | | | | | | | $ | 339,820 | | |
| |
At December 31, 2019, the following futures contracts were outstanding for Voya Balanced Income Portfolio:
| Description | | | Number
of Contracts | | | Expiration
Date | | | Notional
Value | | | Unrealized
Appreciation/
(Depreciation) | |
| Long Contracts: | | | | | | | | | | | | | | | | | | | | | | | | | |
| U.S. Treasury 2-Year Note | | | | | 239 | | | | | | 03/31/20 | | | | | $ | 51,504,500 | | | | | $ | (20,420) | | |
| U.S. Treasury 5-Year Note | | | | | 794 | | | | | | 03/31/20 | | | | | | 94,175,844 | | | | | | (298,923) | | |
| | | | | | | | | | | | | | | | | $ | 145,680,344 | | | | | $ | (319,343) | | |
| Short Contracts: | | | | | | | | | | | | | | | | | | | | | | | | | |
| U.S. Treasury 10-Year Note | | | | | (76) | | | | | | 03/20/20 | | | | | | (9,760,062) | | | | | | 47,244 | | |
| U.S. Treasury Long Bond | | | | | (26) | | | | | | 03/20/20 | | | | | | (4,053,562) | | | | | | 58,875 | | |
| U.S. Treasury Ultra 10-Year Note | | | | | (37) | | | | | | 03/20/20 | | | | | | (5,206,016) | | | | | | 135,314 | | |
| U.S. Treasury Ultra Long Bond | | | | | (23) | | | | | | 03/20/20 | | | | | | (4,178,094) | | | | | | 153,497 | | |
| | | | | | | | | | | | | | | | | $ | (23,197,734) | | | | | $ | 394,930 | | |
See Accompanying Notes to Financial Statements
SUMMARY PORTFOLIO OF INVESTMENTS
| Voya Balanced Income Portfolio | as of December 31, 2019 (continued) |
At December 31, 2019, the following centrally cleared credit default swaps were outstanding for Voya Balanced Income Portfolio:
Centrally Cleared Credit Default Swaps on Credit Indices — Buy Protection(1)
Reference
Entity/Obligation | | | Buy/Sell
Protection | | | (Pay)/
Receive
Financing
Rate (%)(2) | | | Termination
Date | | | Notional Amount(3) | | | Fair
Value(4) | | | Unrealized
Appreciation/
(Depreciation) | |
| iTraxx Cross-over Index, Series 32, Version 1 | | | | | Buy | | | | | | (5.000) | | | | | | 12/20/24 | | | | | | EUR 9,488,000 | | | | | $ | (1,450,190) | | | | | $ | (30,609) | | |
| | | | | | | | | | | | | | | | | | | | | | | | | | | | | $ | (1,450,190) | | | | | $ | (30,609) | | |
Centrally Cleared Credit Default Swaps on Credit Indices — Sell Protection(5)
Reference
Entity/Obligation | | | Buy/Sell
Protection | | | (Pay)/
Receive
Financing
Rate (%)(6) | | | Termination
Date | | | Notional Amount(3) | | | Fair
Value(4) | | | Unrealized
Appreciation/
(Depreciation) | |
| CDX North American High Yield Index, Series 33, Version 2 | | | | | Sell | | | | | | 5.000 | | | | | | 12/20/24 | | | | | | USD 3,798,630 | | | | | $ | 365,941 | | | | | $ | 115,231 | | |
| | | | | | | | | | | | | | | | | | | | | | | | | | | | | $ | 365,941 | | | | | $ | 115,231 | | |
(1)
If a Portfolio is a buyer of protection and a credit event occurs, as defined under the terms of that particular swap agreement, a Portfolio will either i) receive from the seller of protection an amount equal to the notional amount of the swap and deliver the referenced obligation, other deliverable obligations or underlying securities comprising the referenced index or ii) receive a net settlement amount in the form of cash or securities equal to the notional amount of the swap less the recovery value of the referenced obligation or underlying securities comprising the referenced index.
(2)
Payments made quarterly.
(3)
The maximum amount of future payments (undiscounted) that a Portfolio as seller of protection could be required to make or receive as a buyer of credit protection under a credit default swap agreement would be an amount equal to the notional amount of the agreement.
(4)
The fair values for credit default swap agreements serve as an indicator of the current status of the payment/performance risk and represent the likelihood or risk of default for the credit derivative. Increasing fair values, in absolute terms, when compared to the notional amount of the agreement, represent a deterioration of the referenced obligation’s credit soundness and a greater likelihood or risk of default or other credit event occurring.
(5)
If the Portfolio is a seller of protection and a credit event occurs, as defined under the terms of that particular swap agreement, the Portfolio will generally either i) Pay to the buyer an amount equal to the notional amount of the swap and take delivery of the referenced obligation, other deliverable obligations, or underlying securities comprising a referenced index or ii) Pay a net settlement amount in the form of cash or securities equal to the notional amount of the swap less the recovery value of the referenced obligation or underlying securities comprising a referenced index.
(6)
Payments received quarterly.
At December 31, 2019, the following over-the-counter volatility swaps were outstanding for Voya Balanced Income Portfolio:
Pay/Receive
Volatility(1) | | | Reference Entity | | | Volatility
Strike Rate | | | Counterparty | | | Maturity
Date | | | Currency | | | Notional
Amount | | | Fair Value | | | Unrealized
Appreciation
(Depreciation) | |
| Receive | | | USD vs. JPY
Spot Exchange Rate | | | | | 5.800% | | | | Citibank N.A. | | | | | 01/27/20 | | | | | | USD | | | | | | 23,000 | | | | | $ | (26,346) | | | | | $ | (26,346) | | |
| Receive | | | USD vs. CAD Spot Exchange Rate | | | | | 4.050% | | | | Citibank N.A. | | | | | 01/09/20 | | | | | | USD | | | | | | 23,000 | | | | | | (3,503) | | | | | | (3,503) | | |
| Receive | | | USD vs. CAD Spot Exchange Rate | | | | | 4.100% | | | | Morgan Stanley
Capital Services LLC | | | | | 01/08/20 | | | | | | USD | | | | | | 23,000 | | | | | | (6,738) | | | | | | (6,738) | | |
| | | | | | | | | | | | | | | | | | | | | | | | | | | | | | | | | | | $ | (36,587) | | | | | $ | (36,587) | | |
At December 31, 2019, the following over-the-counter purchased foreign currency options were outstanding for Voya Balanced Income Portfolio:
| Description | | | Counterparty | | | Expiration
Date | | | Exercise
Price | | | Notional
Amount | | | Cost | | | Fair Value | |
| Call USD vs. Put JPY | | | | | BNP Paribas | | | | | | 02/26/20 | | | | | | 108.500 USD | | | | | | 2,340,000 | | | | | $ | 15,717 | | | | | $ | 18,550 | | |
| Put USD vs. Call JPY | | | | | BNP Paribas | | | | | | 02/26/20 | | | | | | 97.000 USD | | | | | | 3,510,000 | | | | | | 16,497 | | | | | | 397 | | |
| | | | | | | | | | | | | | | | | | | | | | | | | | | | | $ | 32,214 | | | | | $ | 18,947 | | |
See Accompanying Notes to Financial Statements
SUMMARY PORTFOLIO OF INVESTMENTS
| Voya Balanced Income Portfolio | as of December 31, 2019 (continued) |
At December 31, 2019, the following OTC written foreign currency options were outstanding for Voya Balanced Income Portfolio:
| Description | | | Counterparty | | | Expiration
Date | | | Exercise
Price | | | Notional
Amount | | | Premiums
Received | | | Fair Value | |
| Put USD vs. Call JPY | | | | | BNP Paribas | | | | | | 02/26/20 | | | | | | 100.000 USD | | | | | | 3,510,000 | | | | | $ | 28,704 | | | | | $ | (1,015) | | |
| | | | | | | | | | | | | | | | | | | | | | | | | | | | | $ | 28,704 | | | | | $ | (1,015) | | |
(1)
Payments made at maturity date.
Currency Abbreviations
| | AUD | | | – | | | Australian Dollar | |
| | BRL | | | – | | | Brazilian Real | |
| | CAD | | | – | | | Canadian Dollar | |
| | CHF | | | – | | | Swiss Franc | |
| | COP | | | – | | | Colombian Peso | |
| | EUR | | | – | | | EU Euro | |
| | GBP | | | – | | | British Pound | |
| | IDR | | | – | | | Indonesian Rupiah | |
| | JPY | | | – | | | Japanese Yen | |
| | NOK | | | – | | | Norwegian Krone | |
| | NZD | | | – | | | New Zealand Dollar | |
| | PEN | | | – | | | Peruvian Nuevo Sol | |
| | PLN | | | – | | | Polish Zloty | |
| | RUB | | | – | | | Russian Ruble | |
| | SEK | | | – | | | Swedish Krona | |
| | USD | | | – | | | United States Dollar | |
A summary of derivative instruments by primary risk exposure is outlined in the following tables.
The fair value of derivative instruments as of December 31, 2019 was as follows:
| Derivatives not accounted for as hedging instruments | | | Location on Statement
of Assets and Liabilities | | | Fair Value | |
| Asset Derivatives | | | | | | | | | | |
| Foreign exchange contracts | | | Investments in securities at value* | | | | $ | 18,947 | | |
| Foreign exchange contracts | | | Unrealized appreciation on forward foreign currency contracts | | | | | 1,037,336 | | |
| Interest rate contracts | | | Net Assets — Unrealized appreciation** | | | | | 394,930 | | |
| Credit contracts | | | Net Assets — Unrealized appreciation*** | | | | | 115,231 | | |
| Total Asset Derivatives | | | | | | | $ | 1,566,444 | | |
| Liability Derivatives | | | | | | | | | | |
| Foreign exchange contracts | | | Unrealized depreciation on forward foreign currency contracts | | | | $ | 697,516 | | |
| Interest rate contracts | | | Net Assets — Unrealized depreciation** | | | | | 319,343 | | |
| Credit contracts | | | Net Assets — Unrealized depreciation*** | | | | | 30,609 | | |
| Foreign exchange contracts | | | Unrealized depreciation on OTC swap agreements | | | | | 36,587 | | |
| Foreign exchange contracts | | | Written options, at fair value | | | | | 1,015 | | |
| Total Liability Derivatives | | | | | | | $ | 1,085,070 | | |
*
Includes purchased options.
**
Includes cumulative appreciation/depreciation of futures contracts as reported in the table within the Portfolio of Investments.
***
Includes cumulative appreciation/depreciation of centrally cleared swaps as reported in the table within the Portfolio of Investments. Only current day’s variation margin receivable/payable is shown on the Statement of Assets and Liabilities.
See Accompanying Notes to Financial Statements
SUMMARY PORTFOLIO OF INVESTMENTS
| Voya Balanced Income Portfolio | as of December 31, 2019 (continued) |
The effect of derivative instruments on the Portfolio’s Statement of Operations for the year ended December 31, 2019 was as follows:
Amount of Realized Gain or (Loss) on Derivatives Recognized in Income
| Derivatives not accounted for as hedging instruments | | | Investments* | | | Forward foreign
currency contracts | | | Futures | | | Swaps | | | Written
options | | | Total | |
| Credit contracts | | | | $ | — | | | | | $ | — | | | | | $ | — | | | | | $ | 745,403 | | | | | $ | — | | | | | $ | 745,403 | | |
| Equity contracts | | | | | 35,420 | | | | | | — | | | | | | — | | | | | | — | | | | | | — | | | | | | 35,420 | | |
| Foreign exchange contracts | | | | | — | | | | | | (151,882) | | | | | | — | | | | | | (14,289) | | | | | | — | | | | | | (166,171) | | |
| Interest rate contracts | | | | | (63,183) | | | | | | — | | | | | | 473,854 | | | | | | 30,903 | | | | | | 98,591 | | | | | | 540,165 | | |
| Total | | | | $ | (27,763) | | | | | $ | (151,882) | | | | | $ | 473,854 | | | | | $ | 762,017 | | | | | $ | 98,591 | | | | | $ | 1,154,817 | | |
Change in Unrealized Appreciation or (Depreciation) on Derivatives Recognized in Income
| Derivatives not accounted for as hedging instruments | | | Investments* | | | Forward foreign
currency contracts | | | Futures | | | Swaps | | | Written
options | | | Total | |
| Credit contracts | | | | $ | — | | | | | $ | — | | | | | $ | — | | | | | $ | 84,622 | | | | | $ | — | | | | | $ | 84,622 | | |
| Equity contracts | | | | | — | | | | | | — | | | | | | — | | | | | | — | | | | | | (30,029) | | | | | | (30,029) | | |
| Foreign exchange contracts | | | | | (13,267) | | | | | | 339,820 | | | | | | — | | | | | | (36,587) | | | | | | 27,689 | | | | | | 317,655 | | |
| Interest rate contracts | | | | | — | | | | | | — | | | | | | 75,587 | | | | | | — | | | | | | — | | | | | | 75,587 | | |
| Total | | | | $ | (13,267) | | | | | $ | 339,820 | | | | | $ | 75,587 | | | | | $ | 48,035 | | | | | $ | (2,340) | | | | | $ | 447,835 | | |
*
Amounts recognized for purchased options are included in net realized gain (loss) on investments and in net change in unrealized appreciation (depreciation) on investments.
The following is a summary by counterparty of the fair value of OTC derivative instruments subject to Master Netting Agreements and collateral pledged (received), if any, at December 31, 2019:
| | | | Bank of
America N.A. | | | BNP
Paribas | | | Brown Brothers
Harriman | | | Citibank N.A. | | | Morgan Stanley
Capital
Services LLC | | | Totals | |
| Assets: | | | | | | | | | | | | | | | | | | | | | | | | | | | | | | | | | | | | | |
| Purchased options | | | | $ | — | | | | | $ | 18,947 | | | | | $ | — | | | | | $ | — | | | | | $ | — | | | | | $ | 18,947 | | |
| Forward foreign currency contracts | | | | | 58,008 | | | | | | 265,158 | | | | | | 456,299 | | | | | | 38,509 | | | | | | 219,362 | | | | | | 1,037,336 | | |
| Total Assets | | | | $ | 58,008 | | | | | $ | 284,105 | | | | | $ | 456,299 | | | | | $ | 38,509 | | | | | $ | 219,362 | | | | | $ | 1,056,283 | | |
| Liabilities: | | | | | | | | | | | | | | | | | | | | | | | | | | | | | | | | | | | | | |
| Forward foreign currency contracts | | | | $ | 27,674 | | | | | $ | 112,668 | | | | | $ | 396,549 | | | | | $ | 57,808 | | | | | $ | 102,817 | | | | | $ | 697,516 | | |
| Volatility swaps | | | | | — | | | | | | — | | | | | | — | | | | | | 29,849 | | | | | | 6,738 | | | | | | 36,587 | | |
| Written options | | | | | — | | | | | | 1,015 | | | | | | — | | | | | | — | | | | | | — | | | | | | 1,015 | | |
| Total Liabilities | | | | $ | 27,674 | | | | | $ | 113,683 | | | | | $ | 396,549 | | | | | $ | 87,657 | | | | | $ | 109,555 | | | | | $ | 735,118 | | |
| Net OTC derivative instruments by counterparty, at fair value | | | | $ | 30,334 | | | | | $ | 170,422 | | | | | $ | 59,750 | | | | | $ | (49,148) | | | | | $ | 109,807 | | | | | | 321,165 | | |
| Total collateral pledged by the Portfolio/(Received from counterparty) | | | | $ | — | | | | | $ | — | | | | | $ | — | | | | | $ | — | | | | | $ | — | | | | | $ | — | | |
Net Exposure(1) | | | | $ | 30,334 | | | | | $ | 170,422 | | | | | $ | 59,750 | | | | | $ | (49,148) | | | | | $ | 109,807 | | | | | $ | 321,165 | | |
(1)
Positive net exposure represents amounts due from each respective counterparty. Negative exposure represents amounts due from the Portfolio. Please refer to Note 2 for additional details regarding counterparty credit risk and credit related contingent features.
See Accompanying Notes to Financial Statements
SUMMARY PORTFOLIO OF INVESTMENTS
| Voya Balanced Income Portfolio | as of December 31, 2019 (continued) |
December 31, 2019, the aggregate cost of securities and other investments and the composition of unrealized appreciation and depreciation of securities and other investments at year end were:
| | Cost for federal income tax purposes was $360,387,346. | | | | | | | |
| | Net unrealized appreciation consisted of: | | | | | | | |
| | Gross Unrealized Appreciation | | | | $ | 25,321,256 | | |
| | Gross Unrealized Depreciation | | | | | (7,251,413) | | |
| | Net Unrealized Appreciation | | | | $ | 18,069,843 | | |
See Accompanying Notes to Financial Statements
SUMMARY PORTFOLIO OF INVESTMENTS
| Voya High Yield Portfolio | as of December 31, 2019 |
Principal
Amount† | | | Value | | | Percentage
of Net
Assets | |
| CORPORATE BONDS/NOTES: 95.4% | |
| | | | Basic Materials: 4.4% | |
| 2,200,000 (1) | | | Aruba Investments, Inc.,
8.750%, 02/15/2023 | | | | $ | 2,195,413 | | | | | | 0.4 | | |
| 1,450,000 (1) | | | Compass Minerals
International, Inc.,
6.750%, 12/01/2027 | | | | | 1,543,307 | | | | | | 0.2 | | |
| 1,330,000 (1) | | | Constellium SE, 5.750%,
05/15/2024 | | | | | 1,370,452 | | | | | | 0.2 | | |
| 250,000 (1)(2) | | | Constellium SE, 5.875%,
02/15/2026 | | | | | 265,006 | | | | | | 0.1 | | |
| 1,100,000 (1)(2) | | | Constellium SE, 6.625%,
03/01/2025 | | | | | 1,144,099 | | | | | | 0.2 | | |
| 1,740,000 (1) | | | First Quantum Minerals
Ltd., 6.500%, 03/01/2024 | | | | | 1,747,978 | | | | | | 0.3 | | |
| 2,275,000 (1) | | | Novelis Corp., 5.875%,
09/30/2026 | | | | | 2,426,123 | | | | | | 0.4 | | |
| 400,000 (1) | | | Novelis Corp., 6.250%,
08/15/2024 | | | | | 420,496 | | | | | | 0.1 | | |
| 1,250,000 (1) | | | OCI NV, 5.250%,
11/01/2024 | | | | | 1,303,125 | | | | | | 0.2 | | |
| 2,500,000 (1) | | | OCI NV, 6.625%,
04/15/2023 | | | | | 2,615,000 | | | | | | 0.4 | | |
| 2,000,000 (1) | | | Schweitzer-Mauduit
International, Inc.,
6.875%, 10/01/2026 | | | | | 2,160,695 | | | | | | 0.4 | | |
| 1,015,000 (1) | | | SPCM SA, 4.875%,
09/15/2025 | | | | | 1,058,127 | | | | | | 0.2 | | |
| 1,625,000 (1)(2) | | | Tronox, Inc., 6.500%,
04/15/2026 | | | | | 1,678,178 | | | | | | 0.3 | | |
| 1,450,000 (1) | | | Univar Solutions USA,
Inc., 5.125%, 12/01/2027 | | | | | 1,516,164 | | | | | | 0.2 | | |
| 4,425,000 (3) | | | Other Securities | | | | | 4,565,172 | | | | | | 0.8 | | |
| | | | | | | | | 26,009,335 | | | | | | 4.4 | | |
| | | | Communications: 21.9% | |
| 1,000,000 (1) | | | Altice France SA/France,
8.125%, 02/01/2027 | | | | | 1,128,100 | | | | | | 0.2 | | |
| 950,000 (1) | | | Altice Luxembourg SA,
7.625%, 02/15/2025 | | | | | 990,375 | | | | | | 0.1 | | |
| 2,438,000 (1) | | | Altice Luxembourg SA,
10.500%, 05/15/2027 | | | | | 2,783,952 | | | | | | 0.5 | | |
| 1,625,000 (1) | | | Altice Finco SA, 7.625%,
02/15/2025 | | | | | 1,686,612 | | | | | | 0.3 | | |
| 2,000,000 (2) | | | AMC Networks, Inc.,
4.750%, 08/01/2025 | | | | | 2,011,670 | | | | | | 0.3 | | |
| 2,100,000 (1) | | | Block Communications,
Inc., 6.875%, 02/15/2025 | | | | | 2,183,979 | | | | | | 0.4 | | |
| 2,300,000 (1) | | | C&W Senior Financing
DAC, 7.500%, 10/15/2026 | | | | | 2,495,920 | | | | | | 0.4 | | |
| 2,775,000 (1) | | | CCO Holdings LLC / CCO
Holdings Capital Corp.,
5.125%, 05/01/2027 | | | | | 2,932,759 | | | | | | 0.5 | | |
| 1,290,000 (1) | | | CCO Holdings LLC / CCO
Holdings Capital Corp.,
5.000%, 02/01/2028 | | | | | 1,356,009 | | | | | | 0.2 | | |
| 1,635,000 (1) | | | CCO Holdings LLC / CCO
Holdings Capital Corp.,
5.500%, 05/01/2026 | | | | | 1,726,679 | | | | | | 0.3 | | |
Principal
Amount† | | | Value | | | Percentage
of Net
Assets | |
| CORPORATE BONDS/NOTES: (continued) | |
| | | | Communications (continued) | |
| 3,000,000 (1) | | | CCO Holdings LLC / CCO
Holdings Capital Corp.,
5.750%, 02/15/2026 | | | | $ | 3,170,610 | | | | | | 0.6 | | |
| 940,000 (1) | | | CCO Holdings LLC / CCO
Holdings Capital Corp.,
4.750%, 03/01/2030 | | | | | 960,567 | | | | | | 0.2 | | |
| 2,025,000 (1)(2) | | | Clear Channel Worldwide
Holdings, Inc., 9.250%,
02/15/2024 | | | | | 2,246,910 | | | | | | 0.4 | | |
| 3,800,000 (1) | | | CommScope Tech
Finance LLC, 6.000%,
06/15/2025 | | | | | 3,813,794 | | | | | | 0.6 | | |
| 375,000 (1) | | | CommScope
Technologies LLC,
5.000%, 03/15/2027 | | | | | 353,447 | | | | | | 0.1 | | |
| 2,150,000 (1) | | | Connect Finco SARL /
Connect US Finco LLC,
6.750%, 10/01/2026 | | | | | 2,292,437 | | | | | | 0.4 | | |
| 3,550,000 (2) | | | CSC Holdings LLC,
5.250%, 06/01/2024 | | | | | 3,832,527 | | | | | | 0.7 | | |
| 2,350,000 (1) | | | CSC Holdings LLC,
5.500%, 05/15/2026 | | | | | 2,493,497 | | | | | | 0.4 | | |
| 1,125,000 (1) | | | CSC Holdings LLC,
5.750%, 01/15/2030 | | | | | 1,202,344 | | | | | | 0.2 | | |
| 850,000 (1) | | | CSC Holdings LLC,
7.500%, 04/01/2028 | | | | | 962,474 | | | | | | 0.2 | | |
| 1,725,000 (1)(2) | | | Cumulus Media New
Holdings, Inc., 6.750%,
07/01/2026 | | | | | 1,851,139 | | | | | | 0.3 | | |
| 1,193,000 (1) | | | Diamond Sports Group
LLC / Diamond Sports
Finance Co., 5.375%,
08/15/2026 | | | | | 1,209,017 | | | | | | 0.2 | | |
| 2,599,000 (1)(2) | | | Diamond Sports Group
LLC / Diamond Sports
Finance Co., 6.625%,
08/15/2027 | | | | | 2,532,336 | | | | | | 0.4 | | |
| 2,375,000 (2) | | | DISH DBS Corp., 5.875%,
11/15/2024 | | | | | 2,431,905 | | | | | | 0.4 | | |
| 2,175,000 (2) | | | DISH DBS Corp.,
5.000%-5.875%,
07/15/2022-03/15/2023 | | | | | 2,283,455 | | | | | | 0.4 | | |
| 1,650,000 (1)(2) | | | Entercom Media Corp.,
7.250%, 11/01/2024 | | | | | 1,741,435 | | | | | | 0.3 | | |
| 1,200,000 (1) | | | Frontier Communications
Corp., 8.000%,
04/01/2027 | | | | | 1,256,220 | | | | | | 0.2 | | |
| 900,000 (1) | | | GCI LLC, 6.625%,
06/15/2024 | | | | | 976,873 | | | | | | 0.2 | | |
| 2,125,000 (1)(2) | | | Gray Television, Inc.,
5.125%, 10/15/2024 | | | | | 2,209,118 | | | | | | 0.4 | | |
| 1,275,000 (1) | | | Gray Television, Inc.,
7.000%, 05/15/2027 | | | | | 1,419,203 | | | | | | 0.2 | | |
| 650,000 (1) | | | iHeartCommunications,
Inc., 5.250%, 08/15/2027 | | | | | 681,298 | | | | | | 0.1 | | |
| 2,125,000 (2) | | | iHeartCommunications,
Inc., 8.375%, 05/01/2027 | | | | | 2,352,056 | | | | | | 0.4 | | |
See Accompanying Notes to Financial Statements
SUMMARY PORTFOLIO OF INVESTMENTS
| Voya High Yield Portfolio | as of December 31, 2019 (continued) |
Principal
Amount† | | | Value | | | Percentage
of Net
Assets | |
| CORPORATE BONDS/NOTES: (continued) | |
| | | | Communications (continued) | |
| 775,000 (1)(2) | | | Intelsat Connect Finance
SA, 9.500%, 02/15/2023 | | | | $ | 544,205 | | | | | | 0.1 | | |
| 1,650,000 (1) | | | Intelsat Jackson Holdings
SA, 8.500%, 10/15/2024 | | | | | 1,506,310 | | | | | | 0.3 | | |
| 2,250,000 (2) | | | Intelsat Luxembourg SA,
8.125%, 06/01/2023 | | | | | 1,335,915 | | | | | | 0.2 | | |
| 2,150,000 (1)(2) | | | LCPR Senior Secured
Financing DAC, 6.750%,
10/15/2027 | | | | | 2,282,977 | | | | | | 0.4 | | |
| 2,025,000 (1) | | | MDC Partners, Inc.,
6.500%, 05/01/2024 | | | | | 1,837,687 | | | | | | 0.3 | | |
| 1,200,000 (1) | | | Midcontinent
Communications /
Midcontinent Finance
Corp., 5.375%,
08/15/2027 | | | | | 1,272,417 | | | | | | 0.2 | | |
| 450,000 (1)(2) | | | Netflix, Inc., 4.875%,
06/15/2030 | | | | | 457,864 | | | | | | 0.1 | | |
| 2,450,000 | | | Netflix, Inc., 5.875%,
11/15/2028 | | | | | 2,720,504 | | | | | | 0.4 | | |
| 2,100,000 (1)(2) | | | Nexstar Broadcasting,
Inc., 5.625%, 08/01/2024 | | | | | 2,193,628 | | | | | | 0.4 | | |
| 1,875,000 (1) | | | Nexstar Broadcasting,
Inc., 5.625%, 07/15/2027 | | | | | 1,979,344 | | | | | | 0.3 | | |
| 1,025,000 (1) | | | Altice France SA/France,
7.375%, 05/01/2026 | | | | | 1,102,377 | | | | | | 0.2 | | |
| 1,875,000 (1)(2) | | | Plantronics, Inc., 5.500%,
05/31/2023 | | | | | 1,837,481 | | | | | | 0.3 | | |
| 1,150,000 (1)(2) | | | Sinclair Television Group,
Inc., 5.125%, 02/15/2027 | | | | | 1,184,900 | | | | | | 0.2 | �� | |
| 1,002,000 (1) | | | Sirius XM Radio, Inc.,
4.625%, 07/15/2024 | | | | | 1,054,189 | | | | | | 0.2 | | |
| 2,625,000 (1) | | | Sirius XM Radio, Inc.,
5.000%, 08/01/2027 | | | | | 2,774,231 | | | | | | 0.5 | | |
| 2,300,000 | | | Sprint Communications,
Inc., 6.000%, 11/15/2022 | | | | | 2,416,219 | | | | | | 0.4 | | |
| 4,055,000 | | | Sprint Corp., 7.125%,
06/15/2024 | | | | | 4,382,786 | | | | | | 0.7 | | |
| 1,900,000 | | | Sprint Corp., 7.625%,
03/01/2026 | | | | | 2,098,835 | | | | | | 0.4 | | |
| 1,625,000 (1) | | | TEGNA, Inc., 5.000%,
09/15/2029 | | | | | 1,655,469 | | | | | | 0.3 | | |
| 2,850,000 (2) | | | Telecom Italia Capital SA,
6.000%-6.375%,
11/15/2033-09/30/2034 | | | | | 3,119,711 | | | | | | 0.5 | | |
| 1,525,000 (1) | | | Telesat Canada / Telesat
LLC, 6.500%, 10/15/2027 | | | | | 1,592,634 | | | | | | 0.3 | | |
| 2,150,000 (1) | | | Terrier Media Buyer, Inc.,
8.875%, 12/15/2027 | | | | | 2,279,000 | | | | | | 0.4 | | |
| 700,000 | | | T-Mobile USA, Inc.,
5.125%, 04/15/2025 | | | | | 725,872 | | | | | | 0.1 | | |
| 2,650,000 | | | T-Mobile USA, Inc.,
6.500%, 01/15/2026 | | | | | 2,846,259 | | | | | | 0.5 | | |
| 670,000 (1) | | | Townsquare Media, Inc.,
6.500%, 04/01/2023 | | | | | 682,003 | | | | | | 0.1 | | |
| 1,725,000 (1) | | | ViaSat, Inc., 5.625%,
09/15/2025 | | | | | 1,780,347 | | | | | | 0.3 | | |
Principal
Amount† | | | Value | | | Percentage
of Net
Assets | |
| CORPORATE BONDS/NOTES: (continued) | |
| | | | Communications (continued) | |
| 500,000 (1)(2) | | | ViaSat, Inc., 5.625%,
04/15/2027 | | | | $ | 535,925 | | | | | | 0.1 | | |
| 2,550,000 (1)(2) | | | Virgin Media Secured
Finance PLC, 5.500%,
05/15/2029 | | | | | 2,704,530 | | | | | | 0.5 | | |
| 725,000 (1)(2) | | | Ziggo BV, 4.875%,
01/15/2030 | | | | | 750,109 | | | | | | 0.1 | | |
| 15,430,000 (3) | | | Other Securities | | | | | 15,246,325 | | | | | | 2.6 | | |
| | | | | | | | | 128,468,770 | | | | | | 21.9 | | |
| | | | Consumer, Cyclical: 19.4% | |
| 3,725,000 (1) | | | 1011778 BC ULC / New
Red Finance, Inc.,
5.000%, 10/15/2025 | | | | | 3,853,829 | | | | | | 0.7 | | |
| 2,025,000 (1)(2) | | | Adient Global Holdings
Ltd., 4.875%, 08/15/2026 | | | | | 1,812,426 | | | | | | 0.3 | | |
| 1,575,000 (1) | | | Allison Transmission, Inc.,
5.875%, 06/01/2029 | | | | | 1,728,283 | | | | | | 0.3 | | |
| 2,725,000 (2) | | | AMC Entertainment
Holdings, Inc., 5.875%,
11/15/2026 | | | | | 2,462,235 | | | | | | 0.4 | | |
| 960,000 (1) | | | American Builders &
Contractors Supply Co.,
Inc., 4.000%, 01/15/2028 | | | | | 976,176 | | | | | | 0.2 | | |
| 1,250,000 (1) | | | Ashton Woods USA LLC /
Ashton Woods Finance
Co., 6.750%, 08/01/2025 | | | | | 1,281,769 | | | | | | 0.2 | | |
| 2,540,000 (1)(2) | | | Caesars Resort Collection
LLC / CRC Finco, Inc.,
5.250%, 10/15/2025 | | | | | 2,632,075 | | | | | | 0.4 | | |
| 1,880,000 (1)(2) | | | CCM Merger, Inc.,
6.000%, 03/15/2022 | | | | | 1,922,300 | | | | | | 0.3 | | |
| 1,600,000 | | | Cedar Fair L.P. / Canada’s
Wonderland Co. /
Magnum Management
Corp., 5.375%,
06/01/2024 | | | | | 1,648,664 | | | | | | 0.3 | | |
| 1,750,000 (1) | | | Cedar Fair L.P., 5.250%,
07/15/2029 | | | | | 1,888,862 | | | | | | 0.3 | | |
| 2,300,000 | | | Century Communities,
Inc., 5.875%, 07/15/2025 | | | | | 2,401,579 | | | | | | 0.4 | | |
| 480,000 (1)(2)(4) | | | Core & Main Holdings
L.P., 8.625% (PIK Rate
9.375%, Cash Rate
8.625%), 09/15/2024 | | | | | 500,599 | | | | | | 0.1 | | |
| 1,925,000 (1)(2) | | | Core & Main L.P., 6.125%,
08/15/2025 | | | | | 2,001,981 | | | | | | 0.3 | | |
| 2,900,000 | | | Dana, Inc., 5.500%,
12/15/2024 | | | | | 2,989,421 | | | | | | 0.5 | | |
| 1,525,000 (1) | | | Golden Entertainment,
Inc., 7.625%, 04/15/2026 | | | | | 1,646,806 | | | | | | 0.3 | | |
| 2,900,000 (1) | | | Golden Nugget, Inc.,
6.750%, 10/15/2024 | | | | | 3,008,721 | | | | | | 0.5 | | |
| 2,675,000 | | | H&E Equipment Services,
Inc., 5.625%, 09/01/2025 | | | | | 2,809,860 | | | | | | 0.5 | | |
| 1,450,000 (1) | | | IAA, Inc., 5.500%,
06/15/2027 | | | | | 1,543,307 | | | | | | 0.3 | | |
See Accompanying Notes to Financial Statements
SUMMARY PORTFOLIO OF INVESTMENTS
| Voya High Yield Portfolio | as of December 31, 2019 (continued) |
Principal
Amount† | | | Value | | | Percentage
of Net
Assets | |
| CORPORATE BONDS/NOTES: (continued) | |
| | | | Consumer, Cyclical (continued) | |
| 1,525,000 (1) | | | Installed Building
Products, Inc., 5.750%,
02/01/2028 | | | | $ | 1,634,186 | | | | | | 0.3 | | |
| 1,200,000 (1) | | | International Game
Technology PLC, 6.250%,
02/15/2022 | | | | | 1,268,136 | | | | | | 0.2 | | |
| 1,850,000 (1) | | | International Game
Technology PLC, 6.500%,
02/15/2025 | | | | | 2,081,231 | | | | | | 0.4 | | |
| 2,925,000 | | | L Brands, Inc., 6.750%,
07/01/2036 | | | | | 2,574,292 | | | | | | 0.4 | | |
| 3,225,000 | | | Lennar Corp.,
5.250%-5.375%,
10/01/2022-06/01/2026 | | | | | 3,506,827 | | | | | | 0.6 | | |
| 1,825,000 (1)(2) | | | Lions Gate Capital
Holdings LLC, 5.875%,
11/01/2024 | | | | | 1,857,695 | | | | | | 0.3 | | |
| 1,700,000 (1) | | | Live Nation
Entertainment, Inc.,
4.750%, 10/15/2027 | | | | | 1,762,645 | | | | | | 0.3 | | |
| 2,575,000 (1) | | | Mattel, Inc., 5.875%,
12/15/2027 | | | | | 2,718,170 | | | | | | 0.5 | | |
| 3,650,000 (2) | | | MGM Resorts
International,
5.500%-6.000%,
03/15/2023-04/15/2027 | | | | | 4,054,588 | | | | | | 0.7 | | |
| 1,675,000 (1)(2) | | | Michaels Stores, Inc.,
8.000%, 07/15/2027 | | | | | 1,602,724 | | | | | | 0.3 | | |
| 1,600,000 (1)(2) | | | Motion Bondco DAC,
6.625%, 11/15/2027 | | | | | 1,698,000 | | | | | | 0.3 | | |
| 2,225,000 | | | Murphy Oil USA, Inc.,
4.750%-5.625%,
05/01/2027-09/15/2029 | | | | | 2,363,457 | | | | | | 0.4 | | |
| 1,850,000 (1) | | | Navistar International
Corp., 6.625%,
11/01/2025 | | | | | 1,888,545 | | | | | | 0.3 | | |
| 1,875,000 (1)(2) | | | Penn National Gaming,
Inc., 5.625%, 01/15/2027 | | | | | 1,986,848 | | | | | | 0.3 | | |
| 1,515,000 (1) | | | Performance Food Group,
Inc., 5.500%, 10/15/2027 | | | | | 1,622,982 | | | | | | 0.3 | | |
| 1,125,000 (1) | | | PetSmart, Inc., 5.875%,
06/01/2025 | | | | | 1,148,906 | | | | | | 0.2 | | |
| 2,150,000 (1) | | | PetSmart, Inc., 7.125%,
03/15/2023 | | | | | 2,112,375 | | | | | | 0.4 | | |
| 2,100,000 (1)(2) | | | Resideo Funding, Inc.,
6.125%, 11/01/2026 | | | | | 2,121,053 | | | | | | 0.4 | | |
| 1,450,000 (1)(2) | | | Scientific Games
International, Inc.,
5.000%, 10/15/2025 | | | | | 1,522,500 | | | | | | 0.2 | | |
| 950,000 (1) | | | Scientific Games
International, Inc.,
7.000%, 05/15/2028 | | | | | 1,018,257 | | | | | | 0.2 | | |
| 1,000,000 (1) | | | Scientific Games
International, Inc.,
8.250%, 03/15/2026 | | | | | 1,104,374 | | | | | | 0.2 | | |
| 1,010,000 | | | Scientific Games
International, Inc.,
6.625%, 05/15/2021 | | | | | 1,026,817 | | | | | | 0.2 | | |
Principal
Amount† | | | Value | | | Percentage
of Net
Assets | |
| CORPORATE BONDS/NOTES: (continued) | |
| | | | Consumer, Cyclical (continued) | |
| 1,925,000 (1) | | | Silversea Cruise Finance
Ltd., 7.250%, 02/01/2025 | | | | $ | 2,041,299 | | | | | | 0.3 | | |
| 1,800,000 (1)(2) | | | Six Flags Entertainment
Corp., 5.500%,
04/15/2027 | | | | | 1,922,580 | | | | | | 0.3 | | |
| 1,210,000 (1) | | | Speedway Motorsports
LLC / Speedway Funding
II, Inc., 4.875%,
11/01/2027 | | | | | 1,229,663 | | | | | | 0.2 | | |
| 900,000 (1) | | | Staples, Inc., 7.500%,
04/15/2026 | | | | | 935,437 | | | | | | 0.1 | | |
| 1,625,000 (1)(2) | | | Staples, Inc., 10.750%,
04/15/2027 | | | | | 1,652,381 | | | | | | 0.3 | | |
| 2,300,000 (1)(2) | | | Station Casinos LLC,
5.000%, 10/01/2025 | | | | | 2,346,000 | | | | | | 0.4 | | |
| 1,150,000 (1)(2) | | | Taylor Morrison
Communities, Inc.,
5.750%, 01/15/2028 | | | | | 1,256,775 | | | | | | 0.2 | | |
| 2,500,000 (1) | | | Viking Cruises Ltd.,
5.875%, 09/15/2027 | | | | | 2,676,500 | | | | | | 0.5 | | |
| 1,425,000 (1) | | | William Carter Co/The,
5.625%, 03/15/2027 | | | | | 1,535,185 | | | | | | 0.3 | | |
| 645,000 (1) | | | WMG Acquisition Corp.,
5.000%, 08/01/2023 | | | | | 661,393 | | | | | | 0.1 | | |
| 2,150,000 (1) | | | Wolverine World Wide,
Inc., 5.000%, 09/01/2026 | | | | | 2,187,625 | | | | | | 0.4 | | |
| 14,784,000 (3) | | | Other Securities | | | | | 15,363,144 | | | | | | 2.6 | | |
| | | | | | | | | 113,591,483 | | | | | | 19.4 | | |
| | | | Consumer, Non-cyclical: 17.5% | |
| 1,363,000 (1)(2) | | | Albertsons Cos, Inc. /
Safeway, Inc. / New
Albertsons L.P. /
Albertsons LLC, 5.875%,
02/15/2028 | | | | | 1,450,709 | | | | | | 0.3 | | |
| 2,345,000 (2) | | | Albertsons Cos, Inc. /
Safeway, Inc. / New
Albertsons L.P. /
Albertsons LLC, 6.625%,
06/15/2024 | | | | | 2,460,257 | | | | | | 0.4 | | |
| 1,425,000 (1) | | | AMN Healthcare, Inc.,
4.625%, 10/01/2027 | | | | | 1,432,620 | | | | | | 0.2 | | |
| 4,275,000 (1) | | | Bausch Health Americas,
Inc., 8.500%, 01/31/2027 | | | | | 4,876,279 | | | | | | 0.8 | | |
| 1,650,000 (1) | | | Bausch Health Cos, Inc.,
5.000%, 01/30/2028 | | | | | 1,697,669 | | | | | | 0.3 | | |
| 1,650,000 (1) | | | Bausch Health Cos, Inc.,
5.250%, 01/30/2030 | | | | | 1,715,175 | | | | | | 0.3 | | |
| 875,000 (1) | | | Bausch Health Cos, Inc.,
5.500%, 11/01/2025 | | | | | 916,199 | | | | | | 0.2 | | |
| 1,125,000 (1)(2) | | | Bausch Health Cos, Inc.,
6.125%, 04/15/2025 | | | | | 1,164,729 | | | | | | 0.2 | | |
| 1,225,000 (1) | | | Bausch Health Cos, Inc.,
7.000%, 01/15/2028 | | | | | 1,349,766 | | | | | | 0.2 | | |
| 1,600,000 (1)(2) | | | Cardtronics, Inc. /
Cardtronics USA, Inc.,
5.500%, 05/01/2025 | | | | | 1,664,664 | | | | | | 0.3 | | |
See Accompanying Notes to Financial Statements
SUMMARY PORTFOLIO OF INVESTMENTS
| Voya High Yield Portfolio | as of December 31, 2019 (continued) |
Principal
Amount† | | | Value | | | Percentage
of Net
Assets | |
| CORPORATE BONDS/NOTES: (continued) | |
| | | | Consumer, Non-cyclical (continued) | |
| 845,000 (1) | | | Catalent Pharma
Solutions, Inc., 5.000%,
07/15/2027 | | | | $ | 886,701 | | | | | | 0.1 | | |
| 1,060,000 (1) | | | Centene Corp., 4.250%,
12/15/2027 | | | | | 1,092,436 | | | | | | 0.2 | | |
| 1,415,000 (1) | | | Centene Corp., 4.625%,
12/15/2029 | | | | | 1,493,815 | | | | | | 0.2 | | |
| 945,000 (1) | | | Centene Corp., 4.750%,
01/15/2025 | | | | | 983,570 | | | | | | 0.2 | | |
| 875,000 (1) | | | Centene Corp., 5.375%,
06/01/2026 | | | | | 930,213 | | | | | | 0.2 | | |
| 2,000,000 | | | Centene Corp.,
4.750%-6.125%,
02/15/2024-01/15/2025 | | | | | 2,080,030 | | | | | | 0.3 | | |
| 1,375,000 (1) | | | Chobani LLC / Chobani
Finance Corp., Inc.,
7.500%, 04/15/2025 | | | | | 1,385,299 | | | | | | 0.2 | | |
| 1,975,000 (1) | | | Cott Holdings, Inc.,
5.500%, 04/01/2025 | | | | | 2,067,993 | | | | | | 0.3 | | |
| 1,450,000 (1)(4) | | | Eagle Holding CO II LLC,
7.625% (PIK Rate
8.375%, Cash Rate
7.625%), 05/15/2022 | | | | | 1,476,438 | | | | | | 0.2 | | |
| 1,675,000 (1)(4) | | | Eagle Holding Co. II LLC,
7.750% (PIK Rate
8.500%, Cash Rate
7.750%), 05/15/2022 | | | | | 1,703,743 | | | | | | 0.3 | | |
| 950,000 (1)(2) | | | Endo Ltd. / Endo Finance
LLC / Endo Finco, Inc.,
6.000%, 02/01/2025 | | | | | 643,330 | | | | | | 0.1 | | |
| 2,075,000 (1) | | | Garda World Security
Corp., 8.750%,
05/15/2025 | | | | | 2,163,167 | | | | | | 0.4 | | |
| 2,250,000 (1) | | | Graham Holdings Co.,
5.750%, 06/01/2026 | | | | | 2,408,282 | | | | | | 0.4 | | |
| 2,000,000 | | | HCA Healthcare, Inc.,
6.250%, 02/15/2021 | | | | | 2,089,500 | | | | | | 0.4 | | |
| 5,050,000 | | | HCA, Inc., 5.375%,
02/01/2025 | | | | | 5,594,971 | | | | | | 0.9 | | |
| 2,264,000 | | | HCA, Inc.,
5.625%-7.500%,
02/15/2022-09/01/2028 | | | | | 2,518,751 | | | | | | 0.4 | | |
| 940,000 (1) | | | Hertz Corp./The, 6.000%,
01/15/2028 | | | | | 941,739 | | | | | | 0.1 | | |
| 1,006,000 (1)(2) | | | Hertz Corp./The, 7.125%,
08/01/2026 | | | | | 1,091,384 | | | | | | 0.2 | | |
| 158,000 (1) | | | Hertz Corp./The, 7.625%,
06/01/2022 | | | | | 164,715 | | | | | | 0.0 | | |
| 1,600,000 (1)(2) | | | Hertz Corp., 5.500%,
10/15/2024 | | | | | 1,643,336 | | | | | | 0.3 | | |
| 925,000 (1) | | | Hill-Rom Holdings, Inc.,
4.375%, 09/15/2027 | | | | | 954,228 | | | | | | 0.2 | | |
| 1,900,000 (1) | | | JBS USA LUX SA / JBS
USA Finance, Inc.,
5.875%, 07/15/2024 | | | | | 1,957,475 | | | | | | 0.3 | | |
| 1,290,000 (1) | | | JBS USA LUX SA / JBS
USA Finance, Inc.,
6.750%, 02/15/2028 | | | | | 1,427,850 | | | | | | 0.3 | | |
Principal
Amount† | | | Value | | | Percentage
of Net
Assets | |
| CORPORATE BONDS/NOTES: (continued) | |
| | | | Consumer, Non-cyclical (continued) | |
| 1,575,000 (1) | | | JBS USA LUX SA / JBS
USA Food Co. / JBS USA
Finance, Inc., 5.500%,
01/15/2030 | | | | $ | 1,694,621 | | | | | | 0.3 | | |
| 1,425,000 (1) | | | KeHE Distributors LLC /
KeHE Finance Corp.,
8.625%, 10/15/2026 | | | | | 1,495,359 | | | | | | 0.3 | | |
| 2,675,000 (1) | | | MPH Acquisition Holdings
LLC, 7.125%, 06/01/2024 | | | | | 2,594,723 | | | | | | 0.4 | | |
| 1,575,000 (1)(2) | | | Par Pharmaceutical, Inc.,
7.500%, 04/01/2027 | | | | | 1,571,102 | | | | | | 0.3 | | |
| 1,050,000 (1) | | | Pilgrim’s Pride Corp.,
5.750%, 03/15/2025 | | | | | 1,087,501 | | | | | | 0.2 | | |
| 1,150,000 (1) | | | Pilgrim’s Pride Corp.,
5.875%, 09/30/2027 | | | | | 1,245,565 | | | | | | 0.2 | | |
| 800,000 (1)(2)(4) | | | Polaris Intermediate
Corp., 8.500% (PIK Rate
9.250%, Cash Rate
8.500%), 12/01/2022 | | | | | 746,995 | | | | | | 0.1 | | |
| 2,900,000 (1)(2) | | | Post Holdings, Inc.,
5.625%, 01/15/2028 | | | | | 3,130,115 | | | | | | 0.6 | | |
| 1,250,000 (1) | | | Post Holdings, Inc.,
8.000%, 07/15/2025 | | | | | 1,342,394 | | | | | | 0.2 | | |
| 2,225,000 (1) | | | Select Medical Corp.,
6.250%, 08/15/2026 | | | | | 2,412,690 | | | | | | 0.4 | | |
| 1,600,000 (1)(2) | | | Simmons Foods, Inc.,
5.750%, 11/01/2024 | | | | | 1,611,336 | | | | | | 0.3 | | |
| 2,750,000 (2) | | | Tenet Healthcare Corp.,
6.750%, 06/15/2023 | | | | | 3,027,186 | | | | | | 0.5 | | |
| 2,090,000 (2) | | | Tenet Healthcare Corp.,
5.125%-8.125%,
04/01/2022-05/01/2025 | | | | | 2,218,349 | | | | | | 0.4 | | |
| 5,897,000 | | | United Rentals North
America, Inc.,
4.625%-6.500%,
07/15/2025-01/15/2030 | | | | | 6,259,072 | | | | | | 1.1 | | |
| 1,000,000 (1) | | | Vizient, Inc., 6.250%,
05/15/2027 | | | | | 1,072,847 | | | | | | 0.2 | | |
| 1,675,000 (1) | | | West Street Merger Sub,
Inc., 6.375%, 09/01/2025 | | | | | 1,674,983 | | | | | | 0.3 | | |
| 12,902,000 (3) | | | Other Securities | | | | | 13,249,517 | | | | | | 2.3 | | |
| | | | | | | | | 102,861,388 | | | | | | 17.5 | | |
| | | | Energy: 8.3% | |
| 920,000 (1)(2) | | | Archrock Partners L.P. /
Archrock Partners
Finance Corp., 6.250%,
04/01/2028 | | | | | 949,900 | | | | | | 0.2 | | |
| 550,000 (1)(2) | | | Archrock Partners L.P. /
Archrock Partners
Finance Corp., 6.875%,
04/01/2027 | | | | | 582,902 | | | | | | 0.1 | | |
| 1,730,000 (1) | | | Calfrac Holdings L.P.,
8.500%, 06/15/2026 | | | | | 713,668 | | | | | | 0.1 | | |
| 3,950,000 (1)(2) | | | California Resources
Corp., 8.000%,
12/15/2022 | | | | | 1,708,375 | | | | | | 0.3 | | |
See Accompanying Notes to Financial Statements
SUMMARY PORTFOLIO OF INVESTMENTS
| Voya High Yield Portfolio | as of December 31, 2019 (continued) |
Principal
Amount† | | | Value | | | Percentage
of Net
Assets | |
| CORPORATE BONDS/NOTES: (continued) | |
| | | | Energy (continued) | |
| 857,000 (1) | | | Chesapeake Energy
Corp., 11.500%,
01/01/2025 | | | | $ | 809,865 | | | | | | 0.1 | | |
| 3,105,000 (2) | | | Crestwood Midstream
Partners L.P. / Crestwood
Midstream Finance Corp.,
5.750%-6.250%,
04/01/2023-04/01/2025 | | | | | 3,179,616 | | | | | | 0.5 | | |
| 800,000 (1) | | | Endeavor Energy
Resources L.P. / EER
Finance, Inc., 5.500%,
01/30/2026 | | | | | 827,858 | | | | | | 0.2 | | |
| 625,000 (1) | | | Endeavor Energy
Resources L.P. / EER
Finance, Inc., 5.750%,
01/30/2028 | | | | | 658,188 | | | | | | 0.1 | | |
| 2,160,000 (1) | | | Enviva Partners L.P. /
Enviva Partners Finance
Corp., 6.500%,
01/15/2026 | | | | | 2,317,961 | | | | | | 0.4 | | |
| 1,400,000 (1) | | | Hess Midstream
Operations L.P., 5.125%,
06/15/2028 | | | | | 1,419,250 | | | | | | 0.2 | | |
| 2,205,000 (1) | | | Hess Midstream
Operations L.P., 5.625%,
02/15/2026 | | | | | 2,293,200 | | | | | | 0.4 | | |
| 1,800,000 (1) | | | Indigo Natural Resources
LLC, 6.875%, 02/15/2026 | | | | | 1,696,545 | | | | | | 0.3 | | |
| 2,075,000 (1) | | | Magnolia Oil & Gas
Operating LLC / Magnolia
Oil & Gas Finance Corp.,
6.000%, 08/01/2026 | | | | | 2,132,784 | | | | | | 0.4 | | |
| 1,795,000 (1) | | | Moss Creek Resources
Holdings, Inc., 7.500%,
01/15/2026 | | | | | 1,369,311 | | | | | | 0.2 | | |
| 1,350,000 | | | Murphy Oil Corp.,
5.750%, 08/15/2025 | | | | | 1,414,847 | | | | | | 0.2 | | |
| 770,000 (1) | | | Noble Holding
International Ltd.,
7.875%, 02/01/2026 | | | | | 560,443 | | | | | | 0.1 | | |
| 2,800,000 | | | PBF Logistics L.P. / PBF
Logistics Finance Corp.,
6.875%, 05/15/2023 | | | | | 2,890,972 | | | | | | 0.5 | | |
| 2,400,000 (1)(2) | | | Tallgrass Energy Partners
L.P. / Tallgrass Energy
Finance Corp., 5.500%,
01/15/2028 | | | | | 2,357,574 | | | | | | 0.4 | | |
| 800,000 (1)(2) | | | Targa Resources Partners
L.P. / Targa Resources
Partners Finance Corp.,
6.500%, 07/15/2027 | | | | | 877,480 | | | | | | 0.1 | | |
| 1,500,000 (1)(2) | | | Targa Resources Partners
L.P. / Targa Resources
Partners Finance Corp.,
6.875%, 01/15/2029 | | | | | 1,667,775 | | | | | | 0.3 | | |
| 475,000 (1) | | | Targa Resources Partners
L.P. / Targa Resources
Partners Finance Corp.,
5.500%, 03/01/2030 | | | | | 488,656 | | | | | | 0.1 | | |
Principal
Amount† | | | Value | | | Percentage
of Net
Assets | |
| CORPORATE BONDS/NOTES: (continued) | |
| | | | Energy (continued) | |
| 2,240,000 (1) | | | Vermilion Energy, Inc.,
5.625%, 03/15/2025 | | | | $ | 2,120,530 | | | | | | 0.4 | | |
| 1,000,000 (1) | | | Viper Energy Partners
L.P., 5.375%, 11/01/2027 | | | | | 1,041,850 | | | | | | 0.2 | | |
| 17,150,000 (3) | | | Other Securities | | | | | 14,715,664 | | | | | | 2.5 | | |
| | | | | | | | | 48,795,214 | | | | | | 8.3 | | |
| | | | Financial: 5.7% | |
| 550,000 (1) | | | Alliance Data Systems
Corp., 4.750%,
12/15/2024 | | | | | 550,000 | | | | | | 0.1 | | |
| 625,000 (1) | | | Allied Universal Holdco
LLC / Allied Universal
Finance Corp., 6.625%,
07/15/2026 | | | | | 672,859 | | | | | | 0.1 | | |
| 1,475,000 (1) | | | Allied Universal Holdco
LLC / Allied Universal
Finance Corp., 9.750%,
07/15/2027 | | | | | 1,579,124 | | | | | | 0.3 | | |
| 2,550,000 (1) | | | ESH Hospitality, Inc.,
5.250%, 05/01/2025 | | | | | 2,641,379 | | | | | | 0.5 | | |
| 3,025,000 | | | Icahn Enterprises L.P. /
Icahn Enterprises Finance
Corp., 6.250%,
05/15/2026 | | | | | 3,227,294 | | | | | | 0.5 | | |
| 1,545,000 (1) | | | LPL Holdings, Inc.,
4.625%, 11/15/2027 | | | | | 1,579,763 | | | | | | 0.3 | | |
| 2,425,000 | | | MGM Growth Properties
Operating Partnership L.P.
/ MGP Finance Co-Issuer,
Inc., 5.625%, 05/01/2024 | | | | | 2,648,306 | | | | | | 0.5 | | |
| 3,625,000 | | | MPT Operating
Partnership L.P. / MPT
Finance Corp.,
5.000%-5.500%,
05/01/2024-10/15/2027 | | | | | 3,798,240 | | | | | | 0.6 | | |
| 2,300,000 (2) | | | Navient Corp., 7.250%,
09/25/2023 | | | | | 2,604,796 | | | | | | 0.4 | | |
| 1,900,000 (1) | | | Quicken Loans, Inc.,
5.250%, 01/15/2028 | | | | | 1,970,913 | | | | | | 0.3 | | |
| 1,525,000 (1)(2) | | | Realogy Group LLC /
Realogy Co-Issuer Corp.,
5.250%, 12/01/2021 | | | | | 1,543,681 | | | | | | 0.3 | | |
| 2,350,000 | | | Springleaf Finance Corp.,
7.125%, 03/15/2026 | | | | | 2,721,476 | | | | | | 0.4 | | |
| 2,615,000 (2) | | | Springleaf Finance Corp.,
5.375%-6.125%,
05/15/2022-11/15/2029 | | | | | 2,822,719 | | | | | | 0.5 | | |
| 4,620,000 (3) | | | Other Securities | | | | | 5,142,200 | | | | | | 0.9 | | |
| | | | | | | | | 33,502,750 | | | | | | 5.7 | | |
| | | | Industrial: 11.9% | |
| 2,125,000 (1) | | | Advanced Disposal
Services, Inc., 5.625%,
11/15/2024 | | | | | 2,216,194 | | | | | | 0.4 | | |
| 2,325,000 | | | AECOM, 5.875%,
10/15/2024 | | | | | 2,577,902 | | | | | | 0.4 | | |
| 1,425,000 (1) | | | Amsted Industries, Inc.,
5.625%, 07/01/2027 | | | | | 1,514,558 | | | | | | 0.3 | | |
See Accompanying Notes to Financial Statements
SUMMARY PORTFOLIO OF INVESTMENTS
| Voya High Yield Portfolio | as of December 31, 2019 (continued) |
Principal
Amount† | | | Value | | | Percentage
of Net
Assets | |
| CORPORATE BONDS/NOTES: (continued) | |
| | | | Industrial (continued) | |
| 2,750,000 (1)(4) | | | ARD Finance SA, 6.500%
(PIK Rate 7.250%, Cash
Rate 6.500%),
06/30/2027 | | | | $ | 2,848,450 | | | | | | 0.5 | | |
| 1,150,000 (1)(2) | | | Ardagh Packaging
Finance PLC / Ardagh
Holdings USA, Inc.,
5.250%, 08/15/2027 | | | | | 1,212,526 | | | | | | 0.2 | | |
| 1,850,000 (1) | | | ATS Automation Tooling
Systems, Inc., 6.500%,
06/15/2023 | | | | | 1,910,893 | | | | | | 0.3 | | |
| 1,400,000 (1)(2) | | | Berry Global, Inc.,
5.625%, 07/15/2027 | | | | | 1,505,035 | | | | | | 0.3 | | |
| 2,425,000 (1) | | | BMC East LLC, 5.500%,
10/01/2024 | | | | | 2,529,069 | | | | | | 0.4 | | |
| 925,000 (1) | | | Bombardier, Inc., 6.000%,
10/15/2022 | | | | | 927,035 | | | | | | 0.1 | | |
| 2,000,000 (1) | | | Bombardier, Inc., 8.750%,
12/01/2021 | | | | | 2,195,750 | | | | | | 0.4 | | |
| 1,900,000 (1) | | | Builders FirstSource, Inc.,
6.750%, 06/01/2027 | | | | | 2,088,285 | | | | | | 0.4 | | |
| 1,700,000 (1) | | | Cascades, Inc./Cascades
USA, Inc., 5.375%,
01/15/2028 | | | | | 1,751,000 | | | | | | 0.3 | | |
| 1,260,000 (1) | | | Clean Harbors, Inc.,
4.875%, 07/15/2027 | | | | | 1,328,481 | | | | | | 0.2 | | |
| 585,000 (1) | | | Clean Harbors, Inc.,
5.125%, 07/15/2029 | | | | | 629,137 | | | | | | 0.1 | | |
| 1,600,000 (1) | | | F-Brasile SpA / F-Brasile
US LLC, 7.375%,
08/15/2026 | | | | | 1,696,000 | | | | | | 0.3 | | |
| 2,145,000 (1) | | | FXI Holdings, Inc.,
7.875%, 11/01/2024 | | | | | 2,064,541 | | | | | | 0.4 | | |
| 1,700,000 (1) | | | GFL Environmental, Inc.,
8.500%, 05/01/2027 | | | | | 1,873,145 | | | | | | 0.3 | | |
| 465,000 (1) | | | GFL Environmental, Inc.,
7.000%, 06/01/2026 | | | | | 492,550 | | | | | | 0.1 | | |
| 1,275,000 (1) | | | Granite Holdings US
Acquisition Co., 11.000%,
10/01/2027 | | | | | 1,294,568 | | | | | | 0.2 | | |
| 2,325,000 (1)(2) | | | Itron, Inc., 5.000%,
01/15/2026 | | | | | 2,415,902 | | | | | | 0.4 | | |
| 2,425,000 (1)(2) | | | James Hardie
International Finance
DAC, 4.750%, 01/15/2025 | | | | | 2,523,006 | | | | | | 0.4 | | |
| 1,900,000 (1) | | | Koppers, Inc., 6.000%,
02/15/2025 | | | | | 1,994,981 | | | | | | 0.3 | | |
| 1,070,000 (1) | | | Masonite International
Corp., 5.375%,
02/01/2028 | | | | | 1,132,167 | | | | | | 0.2 | | |
| 1,050,000 (1) | | | Masonite International
Corp., 5.750%,
09/15/2026 | | | | | 1,118,615 | | | | | | 0.2 | | |
| 2,300,000 (1)(2) | | | Mauser Packaging
Solutions Holding Co.,
7.250%, 04/15/2025 | | | | | 2,276,977 | | | | | | 0.4 | | |
Principal
Amount† | | | Value | | | Percentage
of Net
Assets | |
| CORPORATE BONDS/NOTES: (continued) | |
| | | | Industrial (continued) | |
| 1,850,000 (1) | | | Norbord, Inc., 5.750%,
07/15/2027 | | | | $ | 1,924,643 | | | | | | 0.3 | | |
| 650,000 (1)(2) | | | Owens-Brockway Glass
Container, Inc., 5.875%,
08/15/2023 | | | | | 695,230 | | | | | | 0.1 | | |
| 1,800,000 (1)(2) | | | Owens-Brockway Glass
Container, Inc., 6.375%,
08/15/2025 | | | | | 1,971,000 | | | | | | 0.4 | | |
| 1,775,000 (1) | | | PGT Escrow Issuer, Inc.,
6.750%, 08/01/2026 | | | | | 1,906,523 | | | | | | 0.3 | | |
| 1,370,000 (1) | | | Reynolds Group
Issuer, Inc. / Reynolds
Group Issuer LLC /
Reynolds Group Issuer
Lu, 5.125%, 07/15/2023 | | | | | 1,405,394 | | | | | | 0.2 | | |
| 487,000 (1) | | | Reynolds Group
Issuer, Inc. / Reynolds
Group Issuer LLC /
Reynolds Group Issuer
Lu, 7.000%, 07/15/2024 | | | | | 504,349 | | | | | | 0.1 | | |
| 1,375,000 (1) | | | Sealed Air Corp., 5.500%,
09/15/2025 | | | | | 1,516,508 | | | | | | 0.3 | | |
| 2,050,000 (1) | | | SSL Robotics LLC,
9.750%, 12/31/2023 | | | | | 2,234,500 | | | | | | 0.4 | | |
| 3,275,000 (1) | | | Standard Industries,
Inc./NJ, 6.000%,
10/15/2025 | | | | | 3,450,999 | | | | | | 0.6 | | |
| 1,825,000 (1)(2) | | | Stevens Holding Co., Inc.,
6.125%, 10/01/2026 | | | | | 1,999,009 | | | | | | 0.3 | | |
| 750,000 (1) | | | Summit Materials LLC /
Summit Materials Finance
Corp., 5.125%,
06/01/2025 | | | | | 772,811 | | | | | | 0.1 | | |
| 1,475,000 (1) | | | Summit Materials LLC /
Summit Materials Finance
Corp., 6.500%,
03/15/2027 | | | | | 1,589,825 | | | | | | 0.3 | | |
| 200,000 (1)(5) | | | syncreon Group BV /
syncreon Global Finance
US, Inc., 8.625%,
11/01/2021 | | | | | 22,000 | | | | | | 0.0 | | |
| 1,575,000 (1) | | | TransDigm, Inc., 5.500%,
11/15/2027 | | | | | 1,595,601 | | | | | | 0.3 | | |
| 3,550,000 (2) | | | TransDigm, Inc.,
6.375%-6.500%,
05/15/2025-06/15/2026 | | | | | 3,729,455 | | | | | | 0.6 | | |
| 506,000 (1)(2) | | | Zekelman Industries, Inc.,
9.875%, 06/15/2023 | | | | | 532,249 | | | | | | 0.1 | | |
| 96,911 | | | Other Securities | | | | | 97,153 | | | | | | 0.0 | | |
| | | | | | | | | 70,064,016 | | | | | | 11.9 | | |
| | | | Technology: 4.0% | |
| 2,400,000 (1) | | | Ascend Learning LLC,
6.875%, 08/01/2025 | | | | | 2,526,996 | | | | | | 0.4 | | |
| 2,950,000 (2) | | | CDW LLC / CDW Finance
Corp., 5.000%-5.500%,
12/01/2024-09/01/2025 | | | | | 3,225,401 | | | | | | 0.6 | | |
See Accompanying Notes to Financial Statements
SUMMARY PORTFOLIO OF INVESTMENTS
| Voya High Yield Portfolio | as of December 31, 2019 (continued) |
Principal
Amount† | | | Value | | | Percentage
of Net
Assets | |
| CORPORATE BONDS/NOTES: (continued) | |
| | | | Technology (continued) | |
| 2,775,000 (1)(2) | | | Change Healthcare
Holdings LLC / Change
Healthcare Finance, Inc.,
5.750%, 03/01/2025 | | | | $ | 2,858,222 | | | | | | 0.5 | | |
| 430,000 (1) | | | Dell International LLC /
EMC Corp., 5.875%,
06/15/2021 | | | | | 437,258 | | | | | | 0.1 | | |
| 650,000 (1)(2) | | | Dell International LLC /
EMC Corp., 7.125%,
06/15/2024 | | | | | 686,563 | | | | | | 0.1 | | |
| 340,000 (1) | | | MSCI, Inc., 5.250%,
11/15/2024 | | | | | 350,018 | | | | | | 0.1 | | |
| 865,000 (1) | | | MSCI, Inc., 5.750%,
08/15/2025 | | | | | 909,323 | | | | | | 0.1 | | |
| 1,350,000 (1) | | | MTS Systems Corp.,
5.750%, 08/15/2027 | | | | | 1,414,594 | | | | | | 0.2 | | |
| 1,780,000 (1) | | | Open Text Corp., 5.625%,
01/15/2023 | | | | | 1,814,861 | | | | | | 0.3 | | |
| 535,000 (1) | | | Open Text Corp., 5.875%,
06/01/2026 | | | | | 573,440 | | | | | | 0.1 | | |
| 1,630,000 (1) | | | RP Crown Parent LLC,
7.375%, 10/15/2024 | | | | | 1,697,914 | | | | | | 0.3 | | |
| 2,525,000 (1) | | | Tempo Acquisition LLC /
Tempo Acquisition
Finance Corp., 6.750%,
06/01/2025 | | | | | 2,613,350 | | | | | | 0.5 | | |
| 2,500,000 (1)(2) | | | Veritas US, Inc. / Veritas
Bermuda Ltd.., 10.500%,
02/01/2024 | | | | | 2,319,787 | | | | | | 0.4 | | |
| 1,950,000 | | | Other Securities | | | | | 1,999,559 | | | | | | 0.3 | | |
| | | | | | | | | 23,427,286 | | | | | | 4.0 | | |
| | | | Utilities: 2.3% | |
| 960,000 (1) | | | Clearway Energy
Operating LLC, 4.750%,
03/15/2028 | | | | | 974,400 | | | | | | 0.2 | | |
| 1,975,000 (1) | | | Drax Finco PLC, 6.625%,
11/01/2025 | | | | | 2,102,555 | | | | | | 0.4 | | |
| 1,950,000 (1)(2) | | | LBC Tank Terminals
Holding Netherlands BV,
6.875%, 05/15/2023 | | | | | 1,977,622 | | | | | | 0.3 | | |
| 2,790,000 (2) | | | NRG Energy, Inc.,
5.750%-6.625%,
01/15/2027-01/15/2028 | | | | | 3,032,312 | | | | | | 0.5 | | |
| 1,350,000 (1) | | | Vistra Operations Co.
LLC, 5.500%, 09/01/2026 | | | | | 1,434,135 | | | | | | 0.2 | | |
| 1,675,000 (1) | | | Vistra Operations Co.
LLC, 5.625%, 02/15/2027 | | | | | 1,768,130 | | | | | | 0.3 | | |
| 2,300,000 (3) | | | Other Securities | | | | | 2,366,125 | | | | | | 0.4 | | |
| | | | | | | | | 13,655,279 | | | | | | 2.3 | | |
| | | | Total Corporate
Bonds/Notes
(Cost $543,012,244) | | | | | 560,375,521 | | | | | | 95.4 | | |
| BANK LOANS: 1.0% | |
| | | | Consumer, Non-cyclical: 0.2% | |
| 1,475,000 | | | Bellring Brands LLC - TL
B 1L, 6.780%, (US0001M
+ 5.000%), 10/10/2024 | | | | | 1,496,203 | | | | | | 0.2 | | |
Principal
Amount† | | | Value | | | Percentage
of Net
Assets | |
| BANK LOANS: (continued) | |
| | | | Containers & Glass Products: 0.2% | |
| 1,066,773 | | | Reynolds Group Holdings
Inc. USD 2017 Term
Loan, 4.549%, (US0001M
+ 2.750%), 02/05/2023 | | | | $ | 1,071,607 | | | | | | 0.2 | | |
| | | | | |
| | | | Electronics/Electrical: 0.3% | |
| 1,575,000 | | | Rackspace Hosting, Inc.
2017 Incremental 1st Lien
Term Loan, 4.902%,
(US0003M + 3.000%),
11/03/2023 | | | | | 1,543,500 | | | | | | 0.3 | | |
| | | | | |
| | | | Health Care: 0.3% | |
| 826,427 | | | Bausch Health
Companies, Inc. 2018
Term Loan B, 4.740%,
(US0001M + 3.000%),
06/02/2025 | | | | | 832,497 | | | | | | 0.1 | | |
| 1,300,000 | | | Envision Healthcare
Corporation 2018 1st Lien
Term Loan, 5.549%,
(US0001M + 3.750%),
10/10/2025 | | | | | 1,113,667 | | | | | | 0.2 | | |
| | | | | | | | | 1,946,164 | | | | | | 0.3 | | |
| | | | Total Bank Loans
(Cost $5,912,413) | | | | | 6,057,474 | | | | | | 1.0 | | |
| CONVERTIBLE BONDS/NOTES: 0.2% | |
| | | | Communications: 0.2% | |
| 875,000 | | | Other Securities | | | | | 843,850 | | | | | | 0.2 | | |
| | | | | |
| | | | Financial: 0.0% | |
| 499,200 (1)(5) | | | Lehman Brothers
Holdings, Inc., 8.160%,
05/30/2009 | | | | | 1,647 | | | | | | 0.0 | | |
| | | | Total Convertible
Bonds/Notes
(Cost $1,310,044) | | | | | 845,497 | | | | | | 0.2 | | |
| |
| Shares | | | Value | | | Percentage
of Net
Assets | |
| COMMON STOCK: 0.1% | |
| | | | Consumer Discretionary: —% | |
| 1,476 (1)(6)(7) | | | Perseus Holding Corp. | | | | | — | | | | | | — | | |
| | | | | |
| | | | Consumer Staples: 0.1% | |
| 24,842 (8)(9) | | | Other Securities | | | | | 819,786 | | | | | | 0.1 | | |
| | | | | |
| | | | Energy: 0.0% | |
| 424,443 (8)(9) | | | Other Securities | | | | | 5,107 | | | | | | 0.0 | | |
| | | | | |
| | | | Health Care: 0.0% | |
| 106 (3)(8) | | | Other Securities | | | | | 395 | | | | | | 0.0 | | |
| | | | Total Common Stock
(Cost $768,541) | | | | | 825,288 | | | | | | 0.1 | | |
| |
See Accompanying Notes to Financial Statements
SUMMARY PORTFOLIO OF INVESTMENTS
| Voya High Yield Portfolio | as of December 31, 2019 (continued) |
| Shares | | | Value | | | Percentage
of Net
Assets | |
| PREFERRED STOCK: —% | |
| | | | Consumer Discretionary: —% | |
| 775 (1)(6)(7) | | | Perseus Holding Corp. | | | | $ | — | | | | | | — | | |
| | | | Total Preferred Stock
(Cost $—) | | | | | — | | | | | | — | | |
| WARRANTS: —% | |
| | | | Energy: —% | |
| 674 (8)(9) | | | Other Securities | | | | | — | | | | | | — | | |
| | | | | |
| | | | Health Care: —% | |
| 252 (8)(9) | | | Other Securities | | | | | — | | | | | | — | | |
| | | | Total Warrants
(Cost $325) | | | | | — | | | | | | — | | |
| OTHER(10): —% | |
| | | | Communications: —% | |
| 1,445,000 (6)(11) | | | Millicom International
Cellular S.A. (Escrow) | | | | | — | | | | | | — | | |
| | | | | |
| | | | Energy: —% | |
| 2,000 (6)(11) | | | Green Field Energy
Services, Inc. (Escrow) | | | | | — | | | | | | — | | |
| | | | Total Other
(Cost $—) | | | | | — | | | | | | — | | |
| | | | Total Long-Term
Investments
(Cost $551,003,567) | | | | | 568,103,780 | | | | | | 96.7 | | |
| |
Principal
Amount† | | | Value | | | Percentage
of Net
Assets | |
| SHORT-TERM INVESTMENTS: 21.1% | |
| | | | Commercial Paper: 2.5% | |
| 297,000 | | | American Express
Company, 2.100%,
04/06/2020 | | | | | 295,356 | | | | | | 0.1 | | |
| 400,000 (12) | | | Australia & New Zealand
Banking, 1.830%,
03/13/2020 | | | | | 398,510 | | | | | | 0.1 | | |
| 1,350,000 (12) | | | Banco Santander S.A.,
1.950%, 02/05/2020 | | | | | 1,347,573 | | | | | | 0.2 | | |
| 600,000 (12) | | | Banco Santander S.A.,
1.950%, 02/06/2020 | | | | | 598,891 | | | | | | 0.1 | | |
| 625,000 (12) | | | DBS Bank Ltd., 1.860%,
02/28/2020 | | | | | 623,148 | | | | | | 0.1 | | |
| 950,000 (12) | | | Flex Co. LLC, 1.910%,
01/31/2020 | | | | | 948,528 | | | | | | 0.2 | | |
| 1,205,000 | | | General Electric Co.,
1.780%, 01/02/2020 | | | | | 1,204,883 | | | | | | 0.2 | | |
| 1,749,000 | | | General Electric Co.,
2.130%, 02/12/2020 | | | | | 1,744,629 | | | | | | 0.3 | | |
| 300,000 (12) | | | Le Mouvement Des
Caisses Desjardins,
1.850%, 02/10/2020 | | | | | 299,412 | | | | | | 0.1 | | |
| 1,325,000 (12) | | | Nederlandse
Waterschapsbank, 1.870%,
02/12/2020 | | | | | 1,322,268 | | | | | | 0.2 | | |
| 1,353,000 (12) | | | Societe Generale, 1.970%,
01/09/2020 | | | | | 1,352,391 | | | | | | 0.2 | | |
Principal
Amount† | | | Value | | | Percentage
of Net
Assets | |
| SHORT-TERM INVESTMENTS: (continued) | |
| | | | Commercial Paper (continued) | |
| 1,175,000 (12) | | | Starbird Funding Corp.,
1.910%, 02/20/2020 | | | | $ | 1,171,920 | | | | | | 0.2 | | |
| 1,878,000 | | | Tyson Foods Inc., 2.000%,
01/21/2020 | | | | | 1,875,837 | | | | | | 0.3 | | |
| 1,075,000 (12) | | | United Overseas Bnk
Group, 1.900%, 01/24/2020 | | | | | 1,073,842 | | | | | | 0.2 | | |
| | | | Total Commercial Paper
(Cost $14,256,953) | | | | | 14,257,188 | | | | | | 2.5 | | |
| | | | | |
| | | | Floating Rate Notes: 4.7% | |
| 1,275,000 (12) | | | Australia & New Zealand
Banking Group Ltd.,
1.920%, 04/09/2020 | | | | | 1,275,369 | | | | | | 0.2 | | |
| 1,275,000 (12) | | | Bank of America Corp.,
1.910%, 05/07/2020 | | | | | 1,275,000 | | | | | | 0.2 | | |
| 900,000 (12) | | | Bank of Nova Scotia,
1.940%, 05/08/2020 | | | | | 899,933 | | | | | | 0.2 | | |
| 1,275,000 (12) | | | Bedford Row Funding,
1.960%, 05/18/2020 | | | | | 1,275,215 | | | | | | 0.2 | | |
| 325,000 (12) | | | BNP Paribas, 1.950%,
05/14/2020 | | | | | 325,024 | | | | | | 0.1 | | |
| 1,300,000 (12) | | | Commonwealth Bank of
Australia, 1.920%,
03/16/2020 | | | | | 1,300,017 | | | | | | 0.2 | | |
| 1,200,000 (12) | | | Coöperatieve Rabobank
U.A., 1.980%, 04/20/2020 | | | | | 1,200,336 | | | | | | 0.2 | | |
| 2,125,000 (12) | | | Crédit Industriel et
Commercial, 1.990%,
04/24/2020 | | | | | 2,125,162 | | | | | | 0.4 | | |
| 1,275,000 (12) | | | Credit Suisse Group AG,
1.890%, 04/17/2020 | | | | | 1,275,571 | | | | | | 0.2 | | |
| 1,375,000 (12) | | | DNB ASA, 1.930%,
02/14/2020 | | | | | 1,375,197 | | | | | | 0.2 | | |
| 1,125,000 (12) | | | Mitsubishi UFJ Financial
Group, Inc., 1.930%,
01/16/2020 | | | | | 1,125,133 | | | | | | 0.2 | | |
| 1,175,000 (12) | | | Mitsubishi UFJ Financial
Group, Inc., 1.970%,
03/18/2020 | | | | | 1,175,224 | | | | | | 0.2 | | |
| 450,000 (12) | | | Mitsubishi UFJ Financial
Group, Inc., 1.980%,
03/12/2020 | | | | | 450,115 | | | | | | 0.1 | | |
| 1,250,000 (12) | | | Mizuho Financial Group
Inc., 1.960%, 05/05/2020 | | | | | 1,250,052 | | | | | | 0.2 | | |
| 1,025,000 (12) | | | Mizuho Financial Group
Inc., 1.970%, 05/06/2020 | | | | | 1,025,051 | | | | | | 0.2 | | |
| 450,000 (12) | | | Royal Bank Of Canada,
1.860%, 04/29/2020 | | | | | 450,028 | | | | | | 0.1 | | |
| 325,000 (12) | | | Skandinaviska Enskilda
Banken AB, 1.890%,
03/09/2020 | | | | | 325,072 | | | | | | 0.1 | | |
| 1,375,000 (12) | | | Skandinaviska Enskilda
Banken AB, 1.950%,
05/11/2020 | | | | | 1,375,044 | | | | | | 0.2 | | |
| 325,000 (12) | | | Sumitomo Mitsui Trust
Holdings, Inc., 1.750%,
03/11/2020 | | | | | 325,095 | | | | | | 0.0 | | |
See Accompanying Notes to Financial Statements
SUMMARY PORTFOLIO OF INVESTMENTS
| Voya High Yield Portfolio | as of December 31, 2019 (continued) |
Principal
Amount† | | | Value | | | Percentage
of Net
Assets | |
| SHORT-TERM INVESTMENTS: (continued) | |
| | | | Floating Rate Notes (continued) | |
| 1,125,000 (12) | | | Sumitomo Mitsui Trust
Holdings, Inc., 1.920%,
02/12/2020 | | | | $ | 1,125,187 | | | | | | 0.2 | | |
| 675,000 (12) | | | Svenska Handelsbanken
AB, 1.930%, 01/23/2020 | | | | | 675,081 | | | | | | 0.1 | | |
| 1,300,000 (12) | | | The Norinchukin Bank,
2.050%, 04/24/2020 | | | | | 1,300,467 | | | | | | 0.2 | | |
| 350,000 (12) | | | The Sumitomo Mitsui
Financial Group, 1.880%,
02/03/2020 | | | | | 350,013 | | | | | | 0.1 | | |
| 1,350,000 (12) | | | The Sumitomo Mitsui
Financial Group, 1.970%,
05/12/2020 | | | | | 1,349,772 | | | | | | 0.2 | | |
| 325,000 (12) | | | The Sumitomo Mitsui
Financial Group, 2.010%,
05/01/2020 | | | | | 325,394 | | | | | | 0.0 | | |
| 1,500,000 (12) | | | Toronto-Dominion Bank,
1.850%, 02/13/2020 | | | | | 1,500,043 | | | | | | 0.3 | | |
| 900,000 (12) | | | Westpac Banking Corp,
1.830%, 02/10/2020 | | | | | 900,071 | | | | | | 0.2 | | |
| | | | Total Floating Rate Notes
(Cost $27,353,666) | | | | | 27,353,666 | | | | | | 4.7 | | |
| | | | | |
| | | | Repurchase Agreements: 11.2% | |
| 27,639,621 (12) | | | Bank of Nova Scotia,
Repurchase Agreement
dated 12/31/19, 1.57%, due
01/02/20 (Repurchase
Amount $27,641,999,
collateralized by various
U.S. Government Agency
Obligations, 2.500%-
6.500%, Market Value plus
accrued interest
$28,194,872, due
09/01/24-11/01/49) | | | | | 27,639,621 | | | | | | 4.7 | | |
| 2,180,404 (12) | | | Citadel Securities LLC,
Repurchase Agreement
dated 12/31/19, 1.60%, due
01/02/20 (Repurchase
Amount $2,180,595,
collateralized by various
U.S. Government
Securities, 0.000%-8.500%,
Market Value plus accrued
interest $2,224,210, due
01/15/20-11/15/48) | | | | | 2,180,404 | | | | | | 0.4 | | |
| 27,639,621 (12) | | | RBC Dominion Securities
Inc., Repurchase
Agreement dated 12/31/19,
1.57%, due 01/02/20
(Repurchase Amount
$27,641,999, collateralized
by various U.S. Government/
U.S. Government Agency
Obligations, 0.000%-
6.500%, Market Value plus
accrued interest
$28,192,415, due
06/30/21-12/01/49) | | | | | 27,639,621 | | | | | | 4.7 | | |
Principal
Amount† | | | Value | | | Percentage
of Net
Assets | |
| SHORT-TERM INVESTMENTS: (continued) | |
| | | | Repurchase Agreements (continued) | |
| 8,447,747 (12) | | | State of Wisconsin
Investment Board,
Repurchase Agreement
dated 12/31/19, 1.75%, due
01/02/20 (Repurchase
Amount $8,448,557,
collateralized by various
U.S. Government
Securities, 0.125%-3.875%,
Market Value plus accrued
interest $8,616,934, due
04/15/21-02/15/47) | | | | $ | 8,447,747 | | | | | | 1.4 | | |
| | | | Total Repurchase
Agreements
(Cost $65,907,393) | | | | | 65,907,393 | | | | | | 11.2 | | |
| | | | | |
| | | | Certificates of Deposit: 1.0% | |
| 400,000 (12) | | | Deutscher Sparkassen-und
Giroverband, 1.860%,
02/13/2020 | | | | | 400,113 | | | | | | 0.1 | | |
| 1,350,000 (12) | | | Dz Bank Ag Deutsche
Zentral-
Genossenschaftsbank,
1.830%, 02/13/2020 | | | | | 1,349,891 | | | | | | 0.2 | | |
| 325,000 (12) | | | Dz Bank Ag Deutsche
Zentral-
Genossenschaftsbank,
1.870%, 03/12/2020 | | | | | 324,972 | | | | | | 0.1 | | |
| 1,075,000 (12) | | | Landesbank
Baden-Wurttemberg,
1.830%, 01/14/2020 | | | | | 1,075,043 | | | | | | 0.2 | | |
| 1,325,000 (12) | | | Landesbank
Baden-Wurttemberg,
1.830%, 01/16/2020 | | | | | 1,325,046 | | | | | | 0.2 | | |
| 300,000 (12) | | | Landesbank
Baden-Wurttemberg,
2.180%, 01/09/2020 | | | | | 300,038 | | | | | | 0.0 | | |
| 1,275,000 (12) | | | The Norinchukin Bank,
1.900%, 03/05/2020 | | | | | 1,275,107 | | | | | | 0.2 | | |
| | | | Total Certificates of Deposit
(Cost $6,050,210) | | | | | 6,050,210 | | | | | | 1.0 | | |
| |
| Shares | | | Value | | | Percentage
of Net
Assets | |
| SHORT-TERM INVESTMENTS: (continued) | |
| | | | Mutual Funds(12): 1.7% | |
| 3,490,000 (12) | | | Fidelity Investments Money
Market Government
Portfolio - Institutional
Class, 1.520% | | | | | 3,490,000 | | | | | | 0.6 | | |
| 3,754,000 (12)(13) | | | Goldman Sachs Financial
Square Government Fund -
Institutional Shares,
1.500% | | | | | 3,754,000 | | | | | | 0.6 | | |
See Accompanying Notes to Financial Statements
SUMMARY PORTFOLIO OF INVESTMENTS
| Voya High Yield Portfolio | as of December 31, 2019 (continued) |
| Shares | | | Value | | | Percentage
of Net
Assets | |
| SHORT-TERM INVESTMENTS: (continued) | |
| | | | Mutual Funds(12) (continued) | |
| 3,008,000 (12)(13) | | | Morgan Stanley
Institutional Liquidity
Funds - Government
Portfolio (Institutional
Share Class), 1.510% | | | | $ | 3,008,000 | | | | | | 0.5 | | |
| | | | Total Mutual Funds
(Cost $10,252,000) | | | | | 10,252,000 | | | | | | 1.7 | | |
| | | | Total Short-Term
Investments
(Cost $123,820,222) | | | | | 123,820,457 | | | | | | 21.1 | | |
| | | | Total Investments in
Securities
(Cost $674,823,789) | | | | $ | 691,924,237 | | | | | | 117.8 | | |
| | | | Liabilities in Excess
of Other Assets | | | | | (104,619,860) | | | | | | (17.8) | | |
| | | | Net Assets | | | | $ | 587,304,377 | | | | | | 100.0 | | |
| |
“Other Securities” represents issues not identified as the top 50 holdings in terms of market value and issues or issuers not exceeding 1% of net assets individually or in aggregate respectively as of December 31, 2019.
The following footnotes apply to either the individual securities noted or one or more of the securities aggregated and listed as a single line item.
†
Unless otherwise indicated, principal amount is shown in USD.
(1)
Securities with purchases pursuant to Rule 144A or section 4(a)(2),
under the Securities Act of 1933 and may not be resold subject to that rule except to qualified institutional buyers.
(2)
Security, or a portion of the security, is on loan.
(3)
The grouping contains securities on loan.
(4)
All or a portion of this security is payment-in-kind (“PIK”) which may pay interest or additional principal at the issuer’s discretion. Rates shown are the current rate and possible payment rates.
(5)
Defaulted security
(6)
For fair value measurement disclosure purposes, security is categorized as Level 3, whose value was determined using significant unobservable inputs.
(7)
Non-income producing security.
(8)
The grouping contains non-income producing securities.
(9)
The grouping contains Level 3 securities.
(10)
Represents an escrow position for future entitlements, if any, on the defaulted bond. The escrow position was received in exchange for the defaulted bond as part of the bankruptcy reorganization of the bond issuer. These holdings are non-income producing.
(11)
Restricted security as to resale, excluding Rule 144A securities. As of December 31, 2019, the Portfolio held restricted securities with a fair value of $— or 0.0% of net assets. Please refer to the table below for additional details.
(12)
All or a portion of the security represents securities purchased with cash collateral received for securities on loan.
(13)
Rate shown is the 7-day yield as of December 31, 2019.
Reference Rate Abbreviations:
US0001M 1-month LIBOR
US0003M 3-month LIBOR
Fair Value Measurements^
The following is a summary of the fair valuations according to the inputs used as of December 31, 2019 in valuing the assets and liabilities:
| | | | Quoted Prices
in Active Markets
for Identical
Investments
(Level 1) | | | Significant
Other
Observable
Inputs
(Level 2) | | | Significant
Unobservable
Inputs
(Level 3) | | | Fair Value
at
December 31, 2019 | |
| Asset Table | | | | | | | | | | | | | | | | | | | | | | | | | |
| Investments, at fair value | | | | | | | | | | | | | | | | | | | | | | | | | |
| Common Stock | | | | | | | | | | | | | | | | | | | | | | | | | |
| Consumer Discretionary | | | | $ | — | | | | | $ | — | | | | | $ | — | | | | | $ | — | | |
| Consumer Staples | | | | | — | | | | | | — | | | | | | 819,786 | | | | | | 819,786 | | |
| Energy | | | | | 13 | | | | | | — | | | | | | 5,094 | | | | | | 5,107 | | |
| Health Care | | | | | 395 | | | | | | — | | | | | | — | | | | | | 395 | | |
| Total Common Stock | | | | | 408 | | | | | | — | | | | | | 824,880 | | | | | | 825,288 | | |
| Preferred Stock | | | | | — | | | | | | — | | | | | | — | | | | | | — | | |
| Warrants | | | | | — | | | | | | — | | | | | | — | | | | | | — | | |
| Corporate Bonds/Notes | | | | | — | | | | | | 560,375,521 | | | | | | — | | | | | | 560,375,521 | | |
| Bank Loans | | | | | — | | | | | | 6,057,474 | | | | | | — | | | | | | 6,057,474 | | |
| Convertible Bonds/Notes | | | | | — | | | | | | 845,497 | | | | | | — | | | | | | 845,497 | | |
| Other | | | | | — | | | | | | — | | | | | | — | | | | | | — | | |
| Short-Term Investments | | | | | 10,252,000 | | | | | | 113,568,457 | | | | | | — | | | | | | 123,820,457 | | |
| Total Investments, at fair value | | | | $ | 10,252,408 | | | | | $ | 680,846,949 | | | | | $ | 824,880 | | | | | $ | 691,924,237 | | |
^
See Note 2, “Significant Accounting Policies” in the Notes to Financial Statements for additional information.
See Accompanying Notes to Financial Statements
SUMMARY PORTFOLIO OF INVESTMENTS
| Voya High Yield Portfolio | as of December 31, 2019 (continued) |
At December 31, 2019, Voya High Yield Portfolio held the following restricted securities:
| Security | | | Acquisition Date | | | Acquisition Cost | | | Fair Value | |
| Green Field Energy Services, Inc. (Escrow) | | | | | 8/25/2019 | | | | | $ | — | | | | | $ | — | | |
| Millicom International Cellular S.A. (Escrow) | | | | | 8/9/2017 | | | | | | — | | | | | | — | | |
| | | | | | | | | | | $ | — | | | | | $ | — | | |
At December 31, 2019, the aggregate cost of securities and other investments and the composition of unrealized appreciation and depreciation of securities and other investments at year end were:
| | Cost for federal income tax purposes was $675,165,321. | | |
| | Net unrealized appreciation consisted of: | | |
| | Gross Unrealized Appreciation | | | | $ | 24,752,186 | | |
| | Gross Unrealized Depreciation | | | | | (7,993,270) | | |
| | Net Unrealized Appreciation | | | | $ | 16,758,916 | | |
See Accompanying Notes to Financial Statements
SUMMARY PORTFOLIO OF INVESTMENTS
| Voya Large Cap Growth Portfolio | as of December 31, 2019 |
| Shares | | | Value | | | Percentage
of Net
Assets | |
| COMMON STOCK: 99.4% | |
| | | | Communication Services: 11.4% | |
| 109,400 (1) | | | Alphabet, Inc. -
Class A | | | | $ | 146,529,266 | | | | | | 2.5 | | |
2,801,672 (1)(2) | | | Altice USA, Inc. | | | | | 76,597,712 | | | | | | 1.3 | | |
| 2,678,702 | | | Comcast Corp. –
Class A | | | | | 120,461,229 | | | | | | 2.0 | | |
| 1,589,372 (1) | | | Facebook, Inc. -
Class A | | | | | 326,218,603 | | | | | | 5.6 | | |
| | | | | | | | | 669,806,810 | | | | | | 11.4 | | |
| | | | Consumer Discretionary: 13.9% | |
| 206,842 (1) | | | Amazon.com, Inc. | | | | | 382,210,921 | | | | | | 6.5 | | |
| 327,833 (1) | | | Burlington Stores, Inc. | | | | | 74,755,759 | | | | | | 1.3 | | |
| 194,183 | | | Domino’s Pizza, Inc. | | | | | 57,047,082 | | | | | | 1.0 | | |
| 857,088 | | | Hilton Worldwide
Holdings, Inc. | | | | | 95,059,630 | | | | | | 1.6 | | |
| 318,622 (1) | | | O’Reilly Automotive, Inc. | | | | | 139,639,278 | | | | | | 2.4 | | |
| 538,358 | | | Ross Stores, Inc. | | | | | 62,675,638 | | | | | | 1.1 | | |
| | | | | | | | | 811,388,308 | | | | | | 13.9 | | |
| | | | Consumer Staples: 4.7% | |
| 565,106 | | | Church & Dwight Co.,
Inc. | | | | | 39,749,556 | | | | | | 0.7 | | |
| 374,380 | | | Constellation Brands,
Inc. | | | | | 71,038,605 | | | | | | 1.2 | | |
| 1,090,965 | | | Mondelez International,
Inc. | | | | | 60,090,352 | | | | | | 1.0 | | |
| 1,235,170 | | | Philip Morris
International, Inc. | | | | | 105,100,616 | | | | | | 1.8 | | |
| | | | | | | | | 275,979,129 | | | | | | 4.7 | | |
| | | | Financials: 3.0% | |
| 663,134 | | | Intercontinental
Exchange, Inc. | | | | | 61,373,052 | | | | | | 1.0 | | |
| 710,001 | | | Progressive Corp. | | | | | 51,396,972 | | | | | | 0.9 | | |
| 233,593 | | | S&P Global, Inc. | | | | | 63,782,569 | | | | | | 1.1 | | |
| | | | | | | | | 176,552,593 | | | | | | 3.0 | | |
| | | | Health Care: 14.9% | |
| 1,029,066 | | | AbbVie, Inc. | | | | | 91,113,504 | | | | | | 1.6 | | |
| 1,218,215 | | | Baxter International, Inc. | | | | | 101,867,138 | | | | | | 1.7 | | |
| 2,475,252 (1) | | | Boston Scientific Corp. | | | | | 111,930,895 | | | | | | 1.9 | | |
| 354,261 (1) | | | DexCom, Inc. | | | | | 77,491,051 | | | | | | 1.3 | | |
| 688,266 | | | Eli Lilly & Co. | | | | | 90,458,800 | | | | | | 1.6 | | |
| 357,063 | | | Humana, Inc. | | | | | 130,870,731 | | | | | | 2.2 | | |
| 1,896,047 | | | Merck & Co., Inc. | | | | | 172,445,475 | | | | | | 3.0 | | |
| 428,281 (1) | | | Vertex
Pharmaceuticals, Inc. | | | | | 93,772,125 | | | | | | 1.6 | | |
| | | | | | | | | 869,949,719 | | | | | | 14.9 | | |
| | | | Industrials: 9.8% | |
| 913,958 | | | Ametek, Inc. | | | | | 91,158,171 | | | | | | 1.6 | | |
| 346,781 | | | Boeing Co. | | | | | 112,967,379 | | | | | | 1.9 | | |
| 1,535,846 | | | CSX Corp. | | | | | 111,133,817 | | | | | | 1.9 | | |
| 925,754 | | | Delta Air Lines, Inc. | | | | | 54,138,094 | | | | | | 0.9 | | |
| 621,020 | | | Ingersoll-Rand PLC -
Class A | | | | | 82,545,978 | | | | | | 1.4 | | |
| Shares | | | Value | | | Percentage
of Net
Assets | |
| COMMON STOCK: (continued) | |
| | | | Industrials (continued) | |
| 327,173 | | | L3Harris Technologies,
Inc. | | | | $ | 64,737,721 | | | | | | 1.1 | | |
| 163,083 | | | Roper Technologies,
Inc. | | | | | 57,768,891 | | | | | | 1.0 | | |
| | | | | | | | | 574,450,051 | | | | | | 9.8 | | |
| | | | Information Technology: 37.9% | |
| 1,769,554 (1) | | | Advanced Micro
Devices, Inc. | | | | | 81,151,746 | | | | | | 1.4 | | |
| 1,175,625 | | | Apple, Inc. | | | | | 345,222,281 | | | | | | 5.9 | | |
| 357,876 | | | Broadcom, Inc. | | | | | 113,095,974 | | | | | | 1.9 | | |
| 464,789 | | | CDW Corp. | | | | | 66,390,461 | | | | | | 1.1 | | |
| 653,095 | | | Fidelity National
Information Services,
Inc. | | | | | 90,838,984 | | | | | | 1.6 | | |
| 1,196,928 (1) | | | Fiserv, Inc. | | | | | 138,400,785 | | | | | | 2.4 | | |
| 1,036,765 (1) | | | GoDaddy, Inc. | | | | | 70,417,079 | | | | | | 1.2 | | |
| 653,993 | | | Intuit, Inc. | | | | | 171,300,386 | | | | | | 2.9 | | |
| 404,312 (2) | | | Lam Research Corp. | | | | | 118,220,829 | | | | | | 2.0 | | |
| 2,331,313 | | | Microsoft Corp. | | | | | 367,648,060 | | | | | | 6.3 | | |
| 604,519 | | | Motorola Solutions, Inc. | | | | | 97,412,192 | | | | | | 1.7 | | |
| 744,771 | | | NXP Semiconductor
NV - NXPI - US | | | | | 94,779,557 | | | | | | 1.6 | | |
| 832,697 (1) | | | Salesforce.com, Inc. | | | | | 135,429,840 | | | | | | 2.3 | | |
| 504,641 (1) | | | Synopsys, Inc. | | | | | 70,246,027 | | | | | | 1.2 | | |
| 1,381,651 (1) | | | Visa, Inc. - Class A | | | | | 259,612,223 | | | | | | 4.4 | | |
| | | | | | | | | 2,220,166,424 | | | | | | 37.9 | | |
| | | | Materials: 1.4% | |
| 501,674 (1)(2) | | | Berry Global Group,
Inc. | | | | | 23,824,498 | | | | | | 0.4 | | |
| 318,834 (1) | | | Crown Holdings, Inc. | | | | | 23,128,218 | | | | | | 0.4 | | |
| 282,767 | | | Other Securities | | | | | 32,500,864 | | | | | | 0.6 | | |
| | | | | | | | | 79,453,580 | | | | | | 1.4 | | |
| | | | Real Estate: 2.4% | |
| 610,754 | | | American Tower Corp. | | | | | 140,363,484 | | | | | | 2.4 | | |
| | | | Total Common Stock | | | |
| | | | (Cost $4,626,656,984) | | | | | 5,818,110,098 | | | | | | 99.4 | | |
| |
Principal
Amount† | | | Value | | | Percentage
of Net
Assets | |
| SHORT-TERM INVESTMENTS: 1.5% | |
| | | | Commercial Paper: 0.1% | |
| 325,000 (3) | | | Australia & New Zealand
Banking, 1.830%,
03/13/2020 | | | | | 323,789 | | | | | | 0.0 | | |
| 525,000 (3) | | | Banco Santander S.A.,
1.950%, 02/05/2020 | | | | | 524,056 | | | | | | 0.0 | | |
| 450,000 (3) | | | Banco Santander S.A.,
2.110%, 01/09/2020 | | | | | 449,822 | | | | | | 0.0 | | |
See Accompanying Notes to Financial Statements
SUMMARY PORTFOLIO OF INVESTMENTS
| Voya Large Cap Growth Portfolio | as of December 31, 2019 (continued) |
Principal
Amount† | | | Value | | | Percentage
of Net
Assets | |
| SHORT-TERM INVESTMENTS: (continued) | |
| | | | Commercial Paper (continued) | |
| 650,000 (3) | | | DBS Bank Ltd., 1.820%,
02/18/2020 | | | | $ | 648,418 | | | | | | 0.0 | | |
| 475,000 (3) | | | Flex Co. LLC, 1.910%,
01/31/2020 | | | | | 474,264 | | | | | | 0.0 | | |
| 350,000 (3) | | | Le Mouvement Des
Caisses Desjardins,
1.850%,
02/10/2020 | | | | | 349,314 | | | | | | 0.0 | | |
| 325,000 (3) | | | Le Mouvement Des
Caisses Desjardins,
1.860%,
02/14/2020 | | | | | 324,297 | | | | | | 0.0 | | |
| 675,000 (3) | | | Nederlandse
Waterschapsbank,
1.870%, 02/12/2020 | | | | | 673,608 | | | | | | 0.0 | | |
| 550,000 (3) | | | United Overseas Bnk
Group, 1.900%,
01/24/2020 | | | | | 549,408 | | | | | | 0.1 | | |
| 500,000 (3) | | | United Overseas Bnk
Group, 2.080%,
01/16/2020 | | | | | 499,650 | | | | | | 0.0 | | |
| | | | Total Commercial Paper
(Cost $4,816,626) | | | | | 4,816,626 | | | | | | 0.1 | | |
| | | | | |
| | | | Floating Rate Notes: 0.2% | |
| 625,000 (3) | | | Australia & New Zealand
Banking Group Ltd.,
1.920%, 04/09/2020 | | | | | 625,181 | | | | | | 0.0 | | |
| 575,000 (3) | | | Commonwealth Bank of
Australia, 1.920%,
01/24/2020 | | | | | 575,073 | | | | | | 0.0 | | |
| 600,000 (3) | | | Coöperatieve Rabobank
U.A., 1.980%, 04/20/2020 | | | | | 600,168 | | | | | | 0.0 | | |
| 650,000 (3) | | | Crédit Industriel et
Commercial, 1.950%,
04/09/2020 | | | | | 650,109 | | | | | | 0.0 | | |
| 925,000 (3) | | | Credit Suisse Group AG,
1.720%, 01/16/2020 | | | | | 925,069 | | | | | | 0.1 | | |
| 475,000 (3) | | | DNB ASA, 1.930%,
02/14/2020 | | | | | 475,068 | | | | | | 0.0 | | |
| 875,000 (3) | | | Mitsubishi UFJ Financial
Group, Inc., 1.930%,
01/16/2020 | | | | | 875,103 | | | | | | 0.0 | | |
| 625,000 (3) | | | Mizuho Financial Group
Inc., 1.960%, 05/05/2020 | | | | | 625,026 | | | | | | 0.0 | | |
| 800,000 (3) | | | Natixis S.A., 2.030%,
01/24/2020 | | | | | 800,048 | | | | | | 0.0 | | |
Principal
Amount† | | | Value | | | Percentage
of Net
Assets | |
| SHORT-TERM INVESTMENTS: (continued) | |
| | | | Floating Rate Notes (continued) | |
| 750,000 (3) | | | Skandinaviska Enskilda
Banken AB, 1.950%,
05/11/2020 | | | | $ | 750,024 | | | | | | 0.0 | | |
| 675,000 (3) | | | Sumitomo Mitsui Trust
Holdings, Inc., 2.040%,
04/24/2020 | | | | | 674,996 | | | | | | 0.0 | | |
| 625,000 (3) | | | The Sumitomo Mitsui
Financial Group, 1.840%,
01/10/2020 | | | | | 625,045 | | | | | | 0.0 | | |
| 550,000 (3) | | | Toronto-Dominion Bank,
1.850%, 02/13/2020 | | | | | 550,016 | | | | | | 0.0 | | |
| 925,000 (3) | | | Toyota Motor Corp.,
1.980%, 03/13/2020 | | | | | 925,328 | | | | | | 0.1 | | |
| | | | Total Floating Rate Notes
(Cost $9,676,254) | | | | | 9,676,254 | | | | | | 0.2 | | |
| | | | | |
| | | | Repurchase Agreements: 0.3% | |
| 7,892,807 (3) | | | Cantor Fitzgerald
Securities, Repurchase
Agreement dated
12/31/19, 1.58%, due
01/02/20 (Repurchase
Amount $7,893,490,
collateralized by various
U.S. Government/U.S.
Government Agency
Obligations,
0.000%-8.500%, Market
Value plus accrued
interest $8,050,663, due
01/25/20-10/15/60) | | | | | 7,892,807 | | | | | | 0.1 | | |
| 7,892,807 (3) | | | Millennium Fixed Income
Ltd., Repurchase
Agreement dated
12/31/19, 1.75%, due
01/02/20 (Repurchase
Amount $7,893,564,
collateralized by various
U.S. Government
Securities,
0.125%-2.250%, Market
Value plus accrued
interest $8,050,664, due
04/15/20-03/31/21) | | | | | 7,892,807 | | | | | | 0.1 | | |
See Accompanying Notes to Financial Statements
SUMMARY PORTFOLIO OF INVESTMENTS
| Voya Large Cap Growth Portfolio | as of December 31, 2019 (continued) |
Principal
Amount† | | | Value | | | Percentage
of Net
Assets | |
| SHORT-TERM INVESTMENTS: (continued) | |
| | | | Repurchase Agreements (continued) | |
| 693,994 (3) | | | RBC Dominion Securities
Inc., Repurchase
Agreement dated
12/31/19, 1.57%, due
01/02/20 (Repurchase
Amount $694,054,
collateralized by various
U.S. Government/U.S.
Government Agency
Obligations,
0.000%-6.500%, Market
Value plus accrued
interest $707,874, due
06/30/21-12/01/49) | | | | $ | 693,994 | | | | | | 0.0 | | |
| 2,423,022 (3) | | | State of Wisconsin
Investment Board,
Repurchase Agreement
dated 12/31/19, 1.75%,
due 01/02/20
(Repurchase Amount
$2,423,254, collateralized
by various U.S.
Government Securities,
0.125%-3.875%, Market
Value plus accrued
interest $2,471,549, due
04/15/21-02/15/47) | | | | | 2,423,022 | | | | | | 0.1 | | |
| | | | Total Repurchase
Agreements
(Cost $18,902,630) | | | | | 18,902,630 | | | | | | 0.3 | | |
| | | | | |
| | | | Certificates of Deposit: 0.0% | |
| 500,000 (3) | | | Deutscher
Sparkassen-und
Giroverband, 1.860%,
02/13/2020
(Cost $500,141) | | | | | 500,141 | | | | | | 0.0 | | |
| Shares | | | Value | | | Percentage
of Net
Assets | |
| SHORT-TERM INVESTMENTS: (continued) | |
| | | | Mutual Funds: 0.9% | |
| 53,637,000 (4) | | | Goldman Sachs Financial
Square Government
Fund - Institutional
Shares, 1.500%
(Cost $53,637,000) | | | | $ | 53,637,000 | | | | | | 0.9 | | |
| | | | Total Short-Term
Investments
(Cost $87,532,651) | | | | | 87,532,651 | | | | | | 1.5 | | |
| | | | Total Investments in
Securities
(Cost $4,714,189,635) | | | | $ | 5,905,642,749 | | | | | | 100.9 | | |
| | | | Liabilities in Excess of
Other Assets | | | | | (53,559,001) | | | | | | (0.9) | | |
| | | | Net Assets | | | | $ | 5,852,083,748 | | | | | | 100.0 | | |
“Other Securities” represents issues not identified as the top 50 holdings in terms of market value and issues or issuers not exceeding 1% of net assets individually or in aggregate respectively as of December 31, 2019.
The following footnotes apply to either the individual securities noted or one or more of the securities aggregated and listed as a single line item.
†
Unless otherwise indicated, principal amount is shown in USD.
(1)
Non-income producing security.
(2)
Security, or a portion of the security, is on loan.
(3)
All or a portion of the security represents securities purchased with cash collateral received for securities on loan.
(4)
Rate shown is the 7-day yield as of December 31, 2019.
See Accompanying Notes to Financial Statements
SUMMARY PORTFOLIO OF INVESTMENTS
| Voya Large Cap Growth Portfolio | as of December 31, 2019 (continued) |
Fair Value Measurements^
The following is a summary of the fair valuations according to the inputs used as of December 31, 2019 in valuing the assets and liabilities:
| | | | Quoted Prices
in Active Markets
for Identical
Investments
(Level 1) | | | Significant
Other
Observable
Inputs
(Level 2) | | | Significant
Unobservable
Inputs
(Level 3) | | | Fair Value
at
December 31, 2019 | |
| Asset Table | | | | | | | | | | | | | | | | | | | | | | | | | |
| Investments, at fair value | | | | | | | | | | | | | | | | | | | | | | | | | |
| Common Stock* | | | | $ | 5,818,110,098 | | | | | $ | — | | | | | $ | — | | | | | $ | 5,818,110,098 | | |
| Short-Term Investments | | | | | 53,637,000 | | | | | | 33,895,651 | | | | | | — | | | | | | 87,532,651 | | |
| Total Investments, at fair value | | | | $ | 5,871,747,098 | | | | | $ | 33,895,651 | | | | | $ | — | | | | | $ | 5,905,642,749 | | |
^
See Note 2, “Significant Accounting Policies” in the Notes to Financial Statements for additional information.
*
For further breakdown of Common Stock by sector, please refer to the Portfolio of Investments.
At December 31, 2019, the aggregate cost of securities and other investments and the composition of unrealized appreciation and depreciation of securities and other investments at year end were:
| | Cost for federal income tax purposes was $4,722,252,160. | | | | | | | |
| | Net unrealized appreciation consisted of: | | | | | | | |
| | Gross Unrealized Appreciation | | | | $ | 1,216,409,294 | | |
| | Gross Unrealized Depreciation | | | | | (33,018,705) | | |
| | Net Unrealized Appreciation | | | | $ | 1,183,390,589 | | |
See Accompanying Notes to Financial Statements
SUMMARY PORTFOLIO OF INVESTMENTS
| Voya Large Cap Value Portfolio | as of December 31, 2019 |
| Shares | | | Value | | | Percentage
of Net
Assets | |
| COMMON STOCK: 99.5% | |
| | | | Communication Services: 8.2% | |
| 1,048,120 | | | AT&T, Inc. | | | | $ | 40,960,530 | | | | | | 3.8 | | |
| 380,167 | | | Comcast Corp. – Class A | | | | | 17,096,110 | | | | | | 1.6 | | |
| 215,342 | | | Walt Disney Co. | | | | | 31,144,913 | | | | | | 2.8 | | |
| | | | | | | | | 89,201,553 | | | | | | 8.2 | | |
| | | | Consumer Discretionary: 5.6% | |
| 141,401 | | | Hasbro, Inc. | | | | | 14,933,360 | | | | | | 1.4 | | |
| 438,681 | | | MGM Resorts International | | | | | 14,594,917 | | | | | | 1.3 | | |
| 129,151 | | | Ralph Lauren Corp. | | | | | 15,139,080 | | | | | | 1.4 | | |
| 263,437 | | | TJX Cos., Inc. | | | | | 16,085,463 | | | | | | 1.5 | | |
| | | | | | | | | 60,752,820 | | | | | | 5.6 | | |
| | | | Consumer Staples: 8.9% | |
| 65,776 | | | Constellation Brands, Inc. | | | | | 12,480,996 | | | | | | 1.1 | | |
| 228,522 | | | Kellogg Co. | | | | | 15,804,581 | | | | | | 1.5 | | |
| 379,415 (1) | | | Keurig Dr Pepper, Inc. | | | | | 10,984,064 | | | | | | 1.0 | | |
| 310,063 | | | Philip Morris International,
Inc. | | | | | 26,383,261 | | | | | | 2.4 | | |
| 206,732 | | | Procter & Gamble Co. | | | | | 25,820,827 | | | | | | 2.4 | | |
| 93,422 | | | Other Securities | | | | | 5,170,908 | | | | | | 0.5 | | |
| | | | | | | | | 96,644,637 | | | | | | 8.9 | | |
| | | | Energy: 8.5% | |
| 365,976 | | | BP PLC ADR | | | | | 13,811,934 | | | | | | 1.3 | | |
| 192,541 | | | Chevron Corp. | | | | | 23,203,116 | | | | | | 2.2 | | |
| 269,839 | | | ConocoPhillips | | | | | 17,547,630 | | | | | | 1.6 | | |
| 157,595 | | | EOG Resources, Inc. | | | | | 13,200,157 | | | | | | 1.2 | | |
| 414,392 | | | Other Securities | | | | | 24,279,989 | | | | | | 2.2 | | |
| | | | | | | | | 92,042,826 | | | | | | 8.5 | | |
| | | | Financials: 23.6% | |
| 360,721 | | | American International
Group, Inc. | | | | | 18,515,809 | | | | | | 1.7 | | |
| 243,684 (1) | | | Apollo Global Management,
Inc. | | | | | 11,626,164 | | | | | | 1.1 | | |
| 1,147,381 | | | Bank of America Corp. | | | | | 40,410,759 | | | | | | 3.7 | | |
| 133,436 | | | Discover Financial Services | | | | | 11,318,041 | | | | | | 1.1 | | |
| 109,624 | | | Goldman Sachs Group, Inc. | | | | | 25,205,846 | | | | | | 2.3 | | |
| 300,839 | | | Hartford Financial Services
Group, Inc. | | | | | 18,281,986 | | | | | | 1.7 | | |
| 241,616 | | | Intercontinental Exchange,
Inc. | | | | | 22,361,561 | | | | | | 2.1 | | |
| 295,763 | | | JPMorgan Chase & Co. | | | | | 41,229,362 | | | | | | 3.8 | | |
| 262,384 | | | Morgan Stanley | | | | | 13,413,070 | | | | | | 1.2 | | |
| 106,062 | | | Northern Trust Corp. | | | | | 11,268,027 | | | | | | 1.0 | | |
| 255,828 | | | Truist Financial Corp. | | | | | 14,408,233 | | | | | | 1.3 | | |
| 475,899 | | | US Bancorp | | | | | 28,216,052 | | | | | | 2.6 | | |
| | | | | | | | | 256,254,910 | | | | | | 23.6 | | |
| | | | Health Care: 13.7% | |
| 74,043 | | | Becton Dickinson & Co. | | | | | 20,137,475 | | | | | | 1.9 | | |
| 219,062 | | | Bristol-Myers Squibb Co. | | | | | 14,061,590 | | | | | | 1.3 | | |
| 165,545 | | | Gilead Sciences, Inc. | | | | | 10,757,114 | | | | | | 1.0 | | |
| Shares | | | Value | | | Percentage
of Net
Assets | |
| COMMON STOCK: (continued) | |
| | | | Health Care (continued) | |
| 273,063 | | | Johnson & Johnson | | | | $ | 39,831,700 | | | | | | 3.7 | | |
| 203,245 | | | Medtronic PLC | | | | | 23,058,145 | | | | | | 2.1 | | |
| 164,919 | | | Novartis AG ADR | | | | | 15,616,180 | | | | | | 1.4 | | |
| 118,201 | | | Zimmer Biomet Holdings,
Inc. | | | | | 17,692,325 | | | | | | 1.6 | | |
| 135,333 (2) | | | Other Securities | | | | | 7,655,788 | | | | | | 0.7 | | |
| | | | | | | | | 148,810,317 | | | | | | 13.7 | | |
| | | | Industrials: 9.5% | |
| 87,359 | | | Cummins, Inc. | | | | | 15,633,766 | | | | | | 1.4 | | |
| 36,928 | | | Lockheed Martin Corp. | | | | | 14,379,025 | | | | | | 1.3 | | |
| 98,129 | | | Norfolk Southern Corp. | | | | | 19,049,783 | | | | | | 1.7 | | |
| 60,873 | | | Old Dominion Freight Line | | | | | 11,552,478 | | | | | | 1.1 | | |
| 57,245 | | | Roper Technologies, Inc. | | | | | 20,277,896 | | | | | | 1.9 | | |
| 223,754 | | | Timken Co. | | | | | 12,599,588 | | | | | | 1.2 | | |
| 98,114 | | | Other Securities | | | | | 9,286,490 | | | | | | 0.9 | | |
| | | | | | | | | 102,779,026 | | | | | | 9.5 | | |
| | | | Information Technology: 6.3% | |
| 33,379 (3) | | | Adobe, Inc. | | | | | 11,008,728 | | | | | | 1.0 | | |
| 134,039 | | | Analog Devices, Inc. | | | | | 15,929,195 | | | | | | 1.5 | | |
| 217,979 (3) | | | Micron Technology, Inc. | | | | | 11,722,911 | | | | | | 1.1 | | |
| 85,122 | | | Motorola Solutions, Inc. | | | | | 13,716,559 | | | | | | 1.3 | | |
| 118,527 | | | Other Securities | | | | | 15,660,245 | | | | | | 1.4 | | |
| | | | | | | | | 68,037,638 | | | | | | 6.3 | | |
| | | | Materials: 4.0% | |
| 80,442 | | | Air Products & Chemicals,
Inc. | | | | | 18,903,065 | | | | | | 1.7 | | |
| 101,806 | | | Celanese Corp. - Series A | | | | | 12,534,355 | | | | | | 1.1 | | |
| 229,532 (4) | | | Other Securities | | | | | 12,559,630 | | | | | | 1.2 | | |
| | | | | | | | | 43,997,050 | | | | | | 4.0 | | |
| | | | Real Estate: 5.0% | |
| 86,594 | | | Crown Castle International
Corp. | | | | | 12,309,337 | | | | | | 1.1 | | |
| 291,622 | | | Highwoods Properties, Inc. | | | | | 14,263,232 | | | | | | 1.3 | | |
| 95,252 | | | Mid-America Apartment
Communities, Inc. | | | | | 12,559,929 | | | | | | 1.2 | | |
| 549,961 (4) | | | Other Securities | | | | | 15,644,762 | | | | | | 1.4 | | |
| | | | | | | | | 54,777,260 | | | | | | 5.0 | | |
| | | | Utilities: 6.2% | |
| 131,584 | | | American Electric Power
Co., Inc. | | | | | 12,436,004 | | | | | | 1.2 | | |
| 103,147 | | | Entergy Corp. | | | | | 12,357,011 | | | | | | 1.1 | | |
| 301,851 | | | Exelon Corp. | | | | | 13,761,387 | | | | | | 1.3 | | |
| 77,116 | | | NextEra Energy, Inc. | | | | | 18,674,410 | | | | | | 1.7 | | |
| 595,269 (2)(5) | | | Other Securities | | | | | 10,052,955 | | | | | | 0.9 | | |
| | | | | | | | | 67,281,767 | | | | | | 6.2 | | |
| | | | Total Common Stock
(Cost $960,843,177) | | | | | 1,080,579,804 | | | | | | 99.5 | | |
| |
See Accompanying Notes to Financial Statements
SUMMARY PORTFOLIO OF INVESTMENTS
| Voya Large Cap Value Portfolio | as of December 31, 2019 (continued) |
| Shares | | | Value | | | Percentage
of Net
Assets | |
| OTHER(6): —% | |
| | | | Communications: —% | |
| 32,517 (7)(8) | | | Tribune Co. (Escrow) | | | | $ | — | | | | | | — | | |
| | | | Energy: —% | |
| 1,685,000 (7)(8) | | | Samson Investment
Co. (Escrow) | | | | | — | | | | | | — | | |
| | | | Total Other
(Cost $30,842) | | | | | — | | | | | | — | | |
| |
Principal
Amount† | | | Value | | | Percentage
of Net
Assets | |
| CORPORATE BONDS/NOTES: —% | |
| | | | Financial: —% | |
| 1,216,000 (5)(9) | | | Other Securities | | | | | — | | | | | | — | | |
| | | | Total Corporate
Bonds/Notes
(Cost $787,908) | | | | | — | | | | | | — | | |
| | | | Total Long-Term
Investments
(Cost $961,661,927) | | | | | 1,080,579,804 | | | | | | 99.5 | | |
| | | | | |
| SHORT-TERM INVESTMENTS: 3.3% | |
| | | | Commercial Paper: 0.2% | |
| 300,000 (10) | | | DBS Bank Ltd., 1.710%,
01/07/2020 | | | | | 299,905 | | | | | | 0.1 | | |
| 300,000 (10) | | | DBS Bank Ltd., 1.820%,
02/18/2020 | | | | | 299,270 | | | | | | 0.0 | | |
| 275,000 (10) | | | Le Mouvement Des Caisses
Desjardins, 1.860%,
02/14/2020 | | | | | 274,405 | | | | | | 0.0 | | |
| 275,000 (10) | | | LMA Americas LLC,
1.800%, 01/27/2020 | | | | | 274,597 | | | | | | 0.0 | | |
| 325,000 (10) | | | Matchpoint Finance PLC,
1.850%, 02/03/2020 | | | | | 324,449 | | | | | | 0.1 | | |
| 200,000 (10) | | | Mitsubishi UFJ Trust and
Banking Corp., 1.910%,
02/04/2020 | | | | | 199,631 | | | | | | 0.0 | | |
| | | | Total Commercial Paper
(Cost $1,672,257) | | | | | 1,672,257 | | | | | | 0.2 | | |
| | | | | |
| | | | Floating Rate Notes: 0.7% | |
| 300,000 (10) | | | Australia & New Zealand
Banking Group Ltd.,
1.920%, 04/09/2020 | | | | | 300,087 | | | | | | 0.1 | | |
| 300,000 (10) | | | Australia & New Zealand
Banking Group Ltd.,
1.940%, 05/20/2020 | | | | | 299,987 | | | | | | 0.0 | | |
| 300,000 (10) | | | Bank of America Corp.,
1.910%, 05/07/2020 | | | | | 300,000 | | | | | | 0.0 | | |
| 900,000 (10) | | | Bank of Nova Scotia,
1.940%, 05/08/2020 | | | | | 899,933 | | | | | | 0.1 | | |
Principal
Amount† | | | Value | | | Percentage
of Net
Assets | |
| SHORT-TERM INVESTMENTS: (continued) | |
| | | | Floating Rate Notes (continued) | |
| 325,000 (10) | | | Commonwealth Bank of
Australia, 1.940%,
06/10/2020 | | | | $ | 324,999 | | | | | | 0.0 | | |
| 250,000 (10) | | | Crédit Industriel et
Commercial, 1.950%,
04/09/2020 | | | | | 250,042 | | | | | | 0.0 | | |
| 300,000 (10) | | | Credit Suisse Group AG,
1.720%, 01/16/2020 | | | | | 300,022 | | | | | | 0.0 | | |
| 325,000 (10) | | | Credit Suisse Group AG,
1.750%, 01/30/2020 | | | | | 325,035 | | | | | | 0.1 | | |
| 300,000 (10) | | | HSBC Holdings PLC,
1.890%, 02/05/2020 | | | | | 300,050 | | | | | | 0.0 | | |
| 325,000 (10) | | | Lloyds Bank PLC, 1.900%,
02/07/2020 | | | | | 325,054 | | | | | | 0.1 | | |
| 300,000 (10) | | | Lloyds Bank PLC, 1.960%,
01/24/2020 | | | | | 300,044 | | | | | | 0.0 | | |
| 300,000 (10) | | | Mitsubishi UFJ Financial
Group, Inc., 1.960%,
01/23/2020 | | | | | 300,044 | | | | | | 0.0 | | |
| 250,000 (10) | | | Mizuho Financial Group
Inc., 1.850%, 01/06/2020 | | | | | 250,013 | | | | | | 0.0 | | |
| 300,000 (10) | | | Mizuho Financial Group
Inc., 1.890%, 02/05/2020 | | | | | 300,050 | | | | | | 0.0 | | |
| 325,000 (10) | | | Mizuho Financial Group
Inc., 1.980%, 02/27/2020 | | | | | 325,059 | | | | | | 0.1 | | |
| 250,000 (10) | | | Natixis S.A., 2.030%,
01/24/2020 | | | | | 250,015 | | | | | | 0.0 | | |
| 600,000 (10) | | | Skandinaviska Enskilda
Banken AB, 1.950%,
05/11/2020 | | | | | 600,020 | | | | | | 0.1 | | |
| 300,000 (10) | | | Starbird Funding Corp.,
2.070%, 04/24/2020 | | | | | 300,120 | | | | | | 0.0 | | |
| 250,000 (10) | | | Sumitomo Mitsui Trust
Holdings, Inc., 1.980%,
05/07/2020 | | | | | 249,997 | | | | | | 0.0 | | |
| 300,000 (10) | | | Svenska Handelsbanken
AB, 1.930%, 01/23/2020 | | | | | 300,036 | | | | | | 0.0 | | |
| 250,000 (10) | | | The Sumitomo Mitsui
Financial Group, 1.840%,
01/10/2020 | | | | | 250,018 | | | | | | 0.0 | | |
| 300,000 (10) | | | The Sumitomo Mitsui
Financial Group, 1.880%,
02/03/2020 | | | | | 300,011 | | | | | | 0.1 | | |
| 275,000 (10) | | | The Sumitomo Mitsui
Financial Group, 1.960%,
01/22/2020 | | | | | 275,019 | | | | | | 0.0 | | |
| 325,000 (10) | | | Toronto-Dominion Bank,
1.850%, 02/13/2020 | | | | | 325,009 | | | | | | 0.0 | | |
| | | | Total Floating Rate Notes
(Cost $7,950,664) | | | | | 7,950,664 | | | | | | 0.7 | | |
| |
See Accompanying Notes to Financial Statements
SUMMARY PORTFOLIO OF INVESTMENTS
| Voya Large Cap Value Portfolio | as of December 31, 2019 (continued) |
Principal
Amount† | | | Value | | | Percentage
of Net
Assets | |
| SHORT-TERM INVESTMENTS: (continued) | |
| | | | Repurchase Agreements: 1.9% | |
7,263,147 (10) | | | Cantor Fitzgerald
Securities, Repurchase
Agreement dated 12/31/19,
1.58%, due 01/02/20
(Repurchase Amount
$7,263,776, collateralized
by various U.S.
Government/U.S.
Government Agency
Obligations,
0.000%-8.500%, Market
Value plus accrued interest
$7,408,410, due
01/25/20-10/15/60) | | | | $ | 7,263,147 | | | | | | 0.7 | | |
7,263,147 (10) | | | Millennium Fixed Income
Ltd., Repurchase
Agreement dated 12/31/19,
1.75%, due 01/02/20
(Repurchase Amount
$7,263,843, collateralized
by various U.S. Government
Securities, 0.125%-2.250%,
Market Value plus accrued
interest $7,408,411, due
04/15/20-03/31/21) | | | | | 7,263,147 | | | | | | 0.7 | | |
2,951,909 (10) | �� | | RBC Dominion Securities
Inc., Repurchase
Agreement dated 12/31/19,
1.57%, due 01/02/20
(Repurchase Amount
$2,952,163, collateralized
by various U.S.
Government/U.S.
Government Agency
Obligations,
0.000%-6.500%, Market
Value plus accrued interest
$3,010,947, due
06/30/21-12/01/49) | | | | | 2,951,909 | | | | | | 0.3 | | |
2,576,916 (10) | | | State of Wisconsin
Investment Board,
Repurchase Agreement
dated 12/31/19, 1.75%, due
01/02/20 (Repurchase
Amount $2,577,163,
collateralized by various
U.S. Government Securities,
0.125%-3.875%, Market
Value plus accrued interest
$2,628,525, due
04/15/21-02/15/47) | | | | | 2,576,916 | | | | | | 0.2 | | |
| | | | Total Repurchase
Agreements
(Cost $20,055,119) | | | | | 20,055,119 | | | | | | 1.9 | | |
| |
Principal
Amount† | | | Value | | | Percentage
of Net
Assets | |
| SHORT-TERM INVESTMENTS: (continued) | |
| | | | Certificates of Deposit: 0.1% | |
| 990,000 (10) | | | Dz Bank Ag Deutsche
Zentral-
Genossenschaftsbank,
1.870%, 03/12/2020 | | | | $ | 989,914 | | | | | | 0.1 | | |
| 275,000 (10) | | | Landesbank
Baden-Wurttemberg,
1.830%, 01/16/2020 | | | | | 275,010 | | | | | | 0.0 | | |
| 250,000 (10) | | | The Norinchukin Bank,
1.900%, 03/05/2020 | | | | | 250,021 | | | | | | 0.0 | | |
| | | | Total Certificates of
Deposit
(Cost $1,514,945) | | | | | 1,514,945 | | | | | | 0.1 | | |
| |
| Shares | | | Value | | | Percentage
of Net
Assets | |
| | | | Mutual Funds: 0.4% | |
4,774,000 (11) | | | Goldman Sachs
Financial Square
Government Fund -
Institutional Shares,
1.500%
(Cost $4,774,000) | | | | | 4,774,000 | | | | | | 0.4 | | |
| | | | Total Short-Term
Investments
(Cost $35,966,985) | | | | | 35,966,985 | | | | | | 3.3 | | |
| | | | Total Investments in
Securities
(Cost $997,628,912) | | | | $ | 1,116,546,789 | | | | | | 102.8 | | |
| | | | Liabilities in Excess
of Other Assets | | | | | (30,100,266) | | | | | | (2.8) | | |
| | | | Net Assets | | | | $ | 1,086,446,523 | | | | | | 100.0 | | |
“Other Securities” represents issues not identified as the top 50 holdings in terms of market value and issues or issuers not exceeding 1% of net assets individually or in aggregate respectively as of December 31, 2019.
The following footnotes apply to either the individual securities noted or one or more of the securities aggregated and listed as a single line item.
†
Unless otherwise indicated, principal amount is shown in USD.
ADR
American Depositary Receipt
(1)
Security, or a portion of the security, is on loan.
(2)
The grouping contains non-income producing securities.
(3)
Non-income producing security.
(4)
The grouping contains securities on loan.
(5)
The grouping contains Level 3 securities.
(6)
Represents an escrow position for future entitlements, if any, on the defaulted bond. The escrow position was received in exchange for the defaulted bond as part of the bankruptcy reorganization of the bond issuer. These holdings are non-income producing.
See Accompanying Notes to Financial Statements
SUMMARY PORTFOLIO OF INVESTMENTS
| Voya Large Cap Value Portfolio | as of December 31, 2019 (continued) |
(7)
For fair value measurement disclosure purposes, security is categorized as Level 3, whose value was determined using significant unobservable inputs.
(8)
Restricted security as to resale, excluding Rule 144A securities. As of December 31, 2019, the Portfolio held restricted securities with a fair value of $— or 0.0% of net assets. Please refer to the table below for additional details.
(9)
The grouping contains securities in default.
(10)
All or a portion of the security represents securities purchased with cash collateral received for securities on loan.
(11)
Rate shown is the 7-day yield as of December 31, 2019.
Fair Value Measurements^
The following is a summary of the fair valuations according to the inputs used as of December 31, 2019 in valuing the assets and liabilities:
| | | | Quoted Prices
in Active Markets
for Identical
Investments
(Level 1) | | | Significant
Other
Observable
Inputs
(Level 2) | | | Significant
Unobservable
Inputs
(Level 3) | | | Fair Value
at
December 31, 2019 | |
| Asset Table | | | | | | | | | | | | | | | | | | | | | | | | | |
| Investments, at fair value | | | | | | | | | | | | | | | | | | | | | | | | | |
| Common Stock | | | | | | | | | | | | | | | | | | | | | | | | | |
| Communication Services | | | | $ | 89,201,553 | | | | | $ | — | | | | | $ | — | | | | | $ | 89,201,553 | | |
| Consumer Discretionary | | | | | 60,752,820 | | | | | | — | | | | | | — | | | | | | 60,752,820 | | |
| Consumer Staples | | | | | 96,644,637 | | | | | | — | | | | | | — | | | | | | 96,644,637 | | |
| Energy | | | | | 92,042,826 | | | | | | — | | | | | | — | | | | | | 92,042,826 | | |
| Financials | | | | | 256,254,910 | | | | | | — | | | | | | — | | | | | | 256,254,910 | | |
| Health Care | | | | | 148,810,317 | | | | | | — | | | | | | — | | | | | | 148,810,317 | | |
| Industrials | | | | | 102,779,026 | | | | | | — | | | | | | — | | | | | | 102,779,026 | | |
| Information Technology | | | | | 68,037,638 | | | | | | — | | | | | | — | | | | | | 68,037,638 | | |
| Materials | | | | | 43,997,050 | | | | | | — | | | | | | — | | | | | | 43,997,050 | | |
| Real Estate | | | | | 54,777,260 | | | | | | — | | | | | | — | | | | | | 54,777,260 | | |
| Utilities | | | | | 67,281,767 | | | | | | — | | | | | | — | | | | | | 67,281,767 | | |
| Total Common Stock | | | | | 1,080,579,804 | | | | | | — | | | | | | — | | | | | | 1,080,579,804 | | |
| Corporate Bonds/Notes | | | | | — | | | | | | — | | | | | | — | | | | | | — | | |
| Other | | | | | — | | | | | | — | | | | | | — | | | | | | — | | |
| Short-Term Investments | | | | | 4,774,000 | | | | | | 31,192,985 | | | | | | — | | | | | | 35,966,985 | | |
| Total Investments, at fair value | | | | $ | 1,085,353,804 | | | | | $ | 31,192,985 | | | | | $ | — | | | | | $ | 1,116,546,789 | | |
^
See Note 2, “Significant Accounting Policies” in the Notes to Financial Statements for additional information.
At December 31, 2019, Voya Large Cap Value Portfolio held the following restricted securities:
| Security | | | Acquisition Date | | | Acquisition Cost | | | Fair Value | |
| Samson Investment Co. (Escrow) | | | | | 6/28/2017 | | | | | $ | 30,842 | | | | | $ | — | | |
| Tribune Co. (Escrow) | | | | | 8/16/2015 | | | | | | — | | | | | | — | | |
| | | | | | | | | | | $ | 30,842 | | | | | $ | — | | |
At December 31, 2019, the aggregate cost of securities and other investments and the composition of unrealized appreciation and depreciation of securities and other investments at year end were:
| | Cost for federal income tax purposes was $999,662,570. | | | | | | | |
| | Net unrealized appreciation consisted of: | | |
| | Gross Unrealized Appreciation | | | | $ | 124,487,531 | | |
| | Gross Unrealized Depreciation | | | | | (7,474,774) | | |
| | Net Unrealized Appreciation | | | | $ | 117,012,757 | | |
See Accompanying Notes to Financial Statements
SUMMARY PORTFOLIO OF INVESTMENTS
| Voya Limited Maturity Bond Portfolio | as of December 31, 2019 |
Principal
Amount† | | | Value | | | Percentage
of Net
Assets | |
| CORPORATE BONDS/NOTES: 43.7% | |
| | | | Basic Materials: 0.8% | |
| 600,000 (1) | | | Anglo American Capital
PLC, 4.125%, 04/15/2021 | | | | $ | 612,062 | | | | | | 0.2 | | |
| 350,000 (1) | | | Georgia-Pacific LLC,
5.400%, 11/01/2020 | | | | | 359,744 | | | | | | 0.1 | | |
| 1,272,000 | | | Other Securities | | | | | 1,307,108 | | | | | | 0.5 | | |
| | | | | | | | | 2,278,914 | | | | | | 0.8 | | |
| | | | Communications: 3.1% | |
| 1,560,000 | | | AT&T, Inc., 2.800%,
02/17/2021 | | | | | 1,574,125 | | | | | | 0.6 | | |
| 896,000 | | | AT&T, Inc.,
3.600%-4.050%,
02/17/2023-12/15/2023 | | | | | 944,608 | | | | | | 0.3 | | |
| 1,053,000 | | | Comcast Corp.,
1.625%-3.450%,
10/01/2021-01/15/2022 | | | | | 1,073,128 | | | | | | 0.4 | | |
| 360,000 (1) | | | Fox Corp., 4.030%,
01/25/2024 | | | | | 383,790 | | | | | | 0.1 | | |
| 185,000 (1) | | | Sky Ltd., 3.125%,
11/26/2022 | | | | | 190,157 | | | | | | 0.0 | | |
| 4,798,000 | | | Other Securities | | | | | 4,891,648 | | | | | | 1.7 | | |
| | | | | | | | | 9,057,456 | | | | | | 3.1 | | |
| | | | Consumer, Cyclical: 2.5% | |
| 400,000 (1) | | | BMW US Capital LLC,
3.400%, 08/13/2021 | | | | | 409,117 | | | | | | 0.1 | | |
| 540,000 (1) | | | Daimler Finance North
America LLC, 2.300%,
01/06/2020 | | | | | 539,991 | | | | | | 0.2 | | |
| 460,000 (1) | | | Daimler Finance North
America LLC, 3.400%,
02/22/2022 | | | | | 471,294 | | | | | | 0.2 | | |
| 530,000 (1) | | | Nissan Motor Acceptance
Corp., 2.150%, 09/28/2020 | | | | | 529,000 | | | | | | 0.2 | | |
| 330,000 (1) | | | Toyota Industries Corp.,
3.110%, 03/12/2022 | | | | | 336,022 | | | | | | 0.1 | | |
| 4,874,937 | | | Other Securities | | | | | 4,979,454 | | | | | | 1.7 | | |
| | | | | | | | | 7,264,878 | | | | | | 2.5 | | |
| | | | Consumer, Non-cyclical: 6.8% | |
| 680,000 (1) | | | AbbVie, Inc., 2.150%,
11/19/2021 | | | | | 681,563 | | | | | | 0.2 | | |
| 340,000 (1) | | | AbbVie, Inc., 2.300%,
11/21/2022 | | | | | 341,850 | | | | | | 0.1 | | |
| 248,000 | | | AbbVie, Inc.,
2.900%-3.375%,
11/14/2021-11/06/2022 | | | | | 253,567 | | | | | | 0.1 | | |
| 1,030,000 | | | Anthem, Inc., 2.500%,
11/21/2020 | | | | | 1,034,744 | | | | | | 0.4 | | |
| 990,000 | | | Becton Dickinson and Co.,
2.404%, 06/05/2020 | | | | | 991,128 | | | | | | 0.3 | | |
Principal
Amount† | | | Value | | | Percentage
of Net
Assets | |
| CORPORATE BONDS/NOTES: (continued) | |
| | | | Consumer, Non-cyclical (continued) | |
| 405,000 (1) | | | Bristol-Myers Squibb Co.,
2.250%, 08/15/2021 | | | | $ | 407,499 | | | | | | 0.2 | | |
| 355,000 (1) | | | Bristol-Myers Squibb Co.,
2.600%, 05/16/2022 | | | | | 360,862 | | | | | | 0.1 | | |
| 1,047,000 | | | CVS Health Corp.,
3.350%, 03/09/2021 | | | | | 1,064,413 | | | | | | 0.4 | | |
| 350,000 | | | CVS Health Corp.,
3.700%, 03/09/2023 | | | | | 364,572 | | | | | | 0.1 | | |
| 900,000 | | | General Mills, Inc.,
3.150%, 12/15/2021 | | | | | 920,178 | | | | | | 0.3 | | |
| 560,000 (1) | | | Imperial Brands Finance
PLC, 2.950%, 07/21/2020 | | | | | 561,632 | | | | | | 0.2 | | |
| 993,000 | | | Keurig Dr Pepper, Inc.,
3.551%-4.057%,
05/25/2021-05/25/2023 | | | | | 1,023,549 | | | | | | 0.4 | | |
| 440,000 (1) | | | Mondelez International
Holdings Netherlands BV,
2.125%, 09/19/2022 | | | | | 440,150 | | | | | | 0.2 | | |
| 150,000 (1) | | | Mylan, Inc., 3.125%,
01/15/2023 | | | | | 152,220 | | | | | | 0.1 | | |
| 882,000 | | | Shire Acquisitions
Investments Ireland DAC,
2.400%, 09/23/2021 | | | | | 887,012 | | | | | | 0.3 | | |
| 334,000 (1) | | | Takeda Pharmaceutical
Co. Ltd., 2.450%,
01/18/2022 | | | | | 335,896 | | | | | | 0.1 | | |
| 9,479,000 | | | Other Securities | | | | | 9,638,248 | | | | | | 3.3 | | |
| | | | | | | | | 19,459,083 | | | | | | 6.8 | | |
| | | | Energy: 3.4% | |
| 210,000 (1) | | | BG Energy Capital PLC,
4.000%, 10/15/2021 | | | | | 216,919 | | | | | | 0.1 | | |
| 1,129,000 | | | BP Capital Markets
America, Inc.,
3.216%-4.742%,
03/11/2021-11/28/2023 | | | | | 1,171,503 | | | | | | 0.4 | | |
| 880,000 | | | Energy Transfer Partners
L.P. / Regency Energy
Finance Corp., 5.875%,
03/01/2022 | | | | | 933,903 | | | | | | 0.3 | | |
| 1,320,000 | | | Enterprise Products
Operating LLC,
2.800%-5.200%,
09/01/2020-04/15/2021 | | | | | 1,337,762 | | | | | | 0.5 | | |
| 470,000 (1) | | | Schlumberger Finance
Canada Ltd., 2.200%,
11/20/2020 | | | | | 470,778 | | | | | | 0.1 | | |
| 1,186,000 | | | Shell International Finance
BV, 1.750%, 09/12/2021 | | | | | 1,185,178 | | | | | | 0.4 | | |
See Accompanying Notes to Financial Statements
SUMMARY PORTFOLIO OF INVESTMENTS
| Voya Limited Maturity Bond Portfolio | as of December 31, 2019 (continued) |
Principal
Amount† | | | Value | | | Percentage
of Net
Assets | |
| CORPORATE BONDS/NOTES: (continued) | |
| | | | Energy (continued) | |
| 4,480,000 | | | Other Securities | | | | $ | 4,589,037 | | | | | | 1.6 | | |
| | | | | | | | | 9,905,080 | | | | | | 3.4 | | |
| | | | Financial: 17.5% | |
| 340,000 (1) | | | ABN AMRO Bank NV,
2.450%, 06/04/2020 | | | | | 340,628 | | | | | | 0.1 | | |
| 390,000 (1) | | | ABN AMRO Bank NV,
3.400%, 08/27/2021 | | | | | 398,870 | | | | | | 0.2 | | |
| 1,000,000 | | | American Express Co.,
3.375%, 05/17/2021 | | | | | 1,019,144 | | | | | | 0.4 | | |
| 1,000,000 | | | American International
Group, Inc., 3.300%,
03/01/2021 | | | | | 1,014,599 | | | | | | 0.3 | | |
| 420,000 (1) | | | ANZ New Zealand Int’l
Ltd./London, 2.200%,
07/17/2020 | | | | | 420,642 | | | | | | 0.1 | | |
| 620,000 (1) | | | Athene Global Funding,
2.750%, 04/20/2020 | | | | | 621,324 | | | | | | 0.2 | | |
| 593,000 (2) | | | Bank of America Corp.,
2.369%, 07/21/2021 | | | | | 594,344 | | | | | | 0.2 | | |
| 916,000 (2) | | | Bank of America Corp.,
3.004%, 12/20/2023 | | | | | 938,526 | | | | | | 0.3 | | |
| 355,000 (1) | | | Banque Federative du
Credit Mutuel SA, 2.125%,
11/21/2022 | | | | | 355,445 | | | | | | 0.1 | | |
| 450,000 (1) | | | Banque Federative du
Credit Mutuel SA, 2.200%,
07/20/2020 | | | | | 450,444 | | | | | | 0.2 | | |
| 250,000 (1) | | | BPCE SA, 2.750%,
01/11/2023 | | | | | 254,077 | | | | | | 0.1 | | |
| 1,000,000 | | | Citibank NA, 3.400%,
07/23/2021 | | | | | 1,021,570 | | | | | | 0.4 | | |
| 1,262,000 (2) | | | Citigroup, Inc.,
2.312%-2.900%,
12/08/2021-11/04/2022 | | | | | 1,273,762 | | | | | | 0.4 | | |
| 460,000 (1) | | | Commonwealth Bank of
Australia, 2.250%,
03/10/2020 | | | | | 460,272 | | | | | | 0.2 | | |
| 950,000 | | | Credit Suisse Group
Funding Guernsey Ltd.,
3.125%, 12/10/2020 | | | | | 958,622 | | | | | | 0.3 | | |
| 355,000 (1) | | | Danske Bank A/S, 2.000%,
09/08/2021 | | | | | 353,519 | | | | | | 0.1 | | |
| 425,000 (1) | | | Danske Bank A/S, 2.800%,
03/10/2021 | | | | | 428,049 | | | | | | 0.1 | | |
| 455,000 (1)(2) | | | Danske Bank A/S,
3.001%, 09/20/2022 | | | | | 458,624 | | | | | | 0.2 | | |
| 355,000 (1) | | | DNB Bank ASA, 2.150%,
12/02/2022 | | | | | 356,589 | | | | | | 0.1 | | |
Principal
Amount† | | | Value | | | Percentage
of Net
Assets | |
| CORPORATE BONDS/NOTES: (continued) | |
| | | | Financial (continued) | |
| 260,000 (1) | | | Federation des Caisses
Desjardins du Quebec,
2.250%, 10/30/2020 | | | | $ | 260,641 | | | | | | 0.1 | | |
| 445,000 (1) | | | HSBC Bank PLC, 4.125%,
08/12/2020 | | | | | 450,746 | | | | | | 0.2 | | |
| 727,000 | | | HSBC Holdings PLC,
3.400%, 03/08/2021 | | | | | 738,547 | | | | | | 0.3 | | |
| 134,000 | | | HSBC USA, Inc., 5.000%,
09/27/2020 | | | | | 136,820 | | | | | | 0.0 | | |
| 1,480,000 (2) | | | JPMorgan Chase Bank
NA, 2.604%, 02/01/2021 | | | | | 1,480,788 | | | | | | 0.5 | | |
| 1,211,000 | | | JPMorgan Chase & Co.,
2.550%-4.500%,
03/01/2021-01/25/2023 | | | | | 1,245,007 | | | | | | 0.4 | | |
| 2,853,000 | | | Kreditanstalt fuer
Wiederaufbau, 4.000%,
01/27/2020 | | | | | 2,856,966 | | | | | | 1.0 | | |
| 465,000 (1) | | | Lloyds Bank PLC, 6.500%,
09/14/2020 | | | | | 477,838 | | | | | | 0.2 | | |
| 1,040,000 | | | Mitsubishi UFJ Financial
Group, Inc.,
2.190%-2.623%,
09/13/2021-07/18/2022 | | | | | 1,045,196 | | | | | | 0.4 | | |
| 320,000 (1) | | | Mizuho Financial Group,
Inc., 2.632%, 04/12/2021 | | | | | 322,701 | | | | | | 0.1 | | |
| 860,000 | | | Morgan Stanley, 2.750%,
05/19/2022 | | | | | 875,757 | | | | | | 0.3 | | |
| 1,566,000 | | | Morgan Stanley, 5.500%,
07/28/2021 | | | | | 1,650,016 | | | | | | 0.6 | | |
| 330,000 (1) | | | Nationwide Building
Society, 2.350%,
01/21/2020 | | | | | 330,040 | | | | | | 0.1 | | |
| 380,000 (1) | | | Nationwide Financial
Services, Inc., 5.375%,
03/25/2021 | | | | | 394,731 | | | | | | 0.1 | | |
| 345,000 (1) | | | Nordea Bank ABP,
4.875%, 05/13/2021 | | | | | 357,735 | | | | | | 0.1 | | |
| 540,000 (1) | | | Protective Life Global
Funding, 2.161%,
09/25/2020 | | | | | 540,854 | | | | | | 0.2 | | |
| 225,000 | | | Royal Bank of Canada,
2.703%, (US0003M +
0.660%), 10/05/2023 | | | | | 226,836 | | | | | | 0.1 | | |
| 1,305,000 | | | Skandinaviska Enskilda
Banken AB,
1.875%-2.300%,
03/11/2020-09/13/2021 | | | | | 1,303,779 | | | | | | 0.4 | | |
See Accompanying Notes to Financial Statements
SUMMARY PORTFOLIO OF INVESTMENTS
| Voya Limited Maturity Bond Portfolio | as of December 31, 2019 (continued) |
Principal
Amount† | | | Value | | | Percentage
of Net
Assets | |
| CORPORATE BONDS/NOTES: (continued) | |
| | | | Financial (continued) | |
| 730,000 | | | Sumitomo Mitsui Banking
Corp., 2.514%, 01/17/2020 | | | | $ | 730,135 | | | | | | 0.3 | | |
| 594,000 | | | Sumitomo Mitsui Financial
Group, Inc., 2.934%,
03/09/2021 | | | | | 600,935 | | | | | | 0.2 | | |
| 525,000 (1) | | | Swiss Re Treasury US
Corp., 2.875%, 12/06/2022 | | | | | 533,760 | | | | | | 0.2 | | |
| 1,063,000 (1) | | | UBS AG/London, 2.200%,
06/08/2020 | | | | | 1,064,434 | | | | | | 0.4 | | |
| 860,000 (1) | | | UBS Group AG, 2.950%,
09/24/2020 | | | | | 866,104 | | | | | | 0.3 | | |
| 340,000 | | | US Bank NA/Cincinnati
OH, 2.185%, (US0003M +
0.290%), 05/21/2021 | | | | | 340,308 | | | | | | 0.1 | | |
| 205,000 (2) | | | Wells Fargo & Co.,
2.406%, 10/30/2025 | | | | | 205,139 | | | | | | 0.1 | | |
| 1,410,000 (2) | | | Wells Fargo Bank NA,
3.325%, 07/23/2021 | | | | | 1,421,178 | | | | | | 0.5 | | |
| 880,000 | | | Wells Fargo Bank NA,
3.625%, 10/22/2021 | | | | | 905,875 | | | | | | 0.3 | | |
| 16,729,000 | | | Other Securities | | | | | 17,155,524 | | | | | | 6.0 | | |
| | | | | | | | | 50,237,440 | | | | | | 17.5 | | |
| | | | Industrial: 2.6% | |
| 1,640,000 | | | Caterpillar Financial
Services Corp.,
2.650%-3.650%,
05/17/2021-05/17/2024 | | | | | 1,692,083 | | | | | | 0.6 | | |
| 348,000 (1) | | | Penske Truck Leasing Co.
Lp / PTL Finance Corp.,
3.650%, 07/29/2021 | | | | | 356,036 | | | | | | 0.1 | | |
| 523,000 (1) | | | Rolls-Royce PLC, 2.375%,
10/14/2020 | | | | | 525,038 | | | | | | 0.2 | | |
| 300,000 (1) | | | Siemens
Financieringsmaatschappij
NV, 2.200%, 03/16/2020 | | | | | 300,118 | | | | | | 0.1 | | |
| 410,000 (1) | | | SMBC Aviation Capital
Finance DAC, 4.125%,
07/15/2023 | | | | | 431,402 | | | | | | 0.1 | | |
| 950,000 | | | United Parcel Service,
Inc., 2.050%, 04/01/2021 | | | | | 952,581 | | | | | | 0.3 | | |
| 3,265,000 | | | Other Securities | | | | | 3,336,566 | | | | | | 1.2 | | |
| | | | | | | | | 7,593,824 | | | | | | 2.6 | | |
| | | | Technology: 2.6% | |
| 1,000,000 | | | Apple, Inc., 1.800%,
09/11/2024 | | | | | 993,569 | | | | | | 0.4 | | |
| 352,000 (1) | | | Dell International LLC /
EMC Corp., 4.420%,
06/15/2021 | | | | | 362,253 | | | | | | 0.1 | | |
Principal
Amount† | | | Value | | | Percentage
of Net
Assets | |
| CORPORATE BONDS/NOTES: (continued) | |
| | | | Technology (continued) | |
| 875,000 | | | salesforce.com, Inc.,
3.250%, 04/11/2023 | | | | $ | 910,148 | | | | | | 0.3 | | |
| 5,127,000 | | | Other Securities | | | | | 5,179,052 | | | | | | 1.8 | | |
| | | | | | | | | 7,445,022 | | | | | | 2.6 | | |
| | | | Utilities: 4.4% | |
| 1,245,000 (2) | | | Dominion Energy, Inc.,
2.579%-2.715%,
07/01/2020-08/15/2021 | | | | | 1,250,625 | | | | | | 0.4 | | |
| 1,125,000 | | | Duke Energy Corp.,
1.800%, 09/01/2021 | | | | | 1,123,983 | | | | | | 0.4 | | |
| 385,000 | | | Duke Energy Ohio, Inc.,
3.800%, 09/01/2023 | | | | | 407,024 | | | | | | 0.2 | | |
| 290,000 | | | Duke Energy Progress
LLC, 3.375%, 09/01/2023 | | | | | 303,009 | | | | | | 0.1 | | |
| 268,000 (1) | | | Electricite de France SA,
2.350%, 10/13/2020 | | | | | 268,542 | | | | | | 0.1 | | |
| 325,000 (1) | | | Niagara Mohawk Power
Corp., 2.721%, 11/28/2022 | | | | | 330,386 | | | | | | 0.1 | | |
| 8,859,000 | | | Other Securities | | | | | 9,005,360 | | | | | | 3.1 | | |
| | | | | | | | | 12,688,929 | | | | | | 4.4 | | |
| | | | Total Corporate
Bonds/Notes
(Cost $124,481,582) | | | | | 125,930,626 | | | | | | 43.7 | | |
| COLLATERALIZED MORTGAGE OBLIGATIONS: 5.5% | |
| 1,793,295 | | | Fannie Mae REMICS
2006-43-FJ, 2.202%,
(US0001M + 0.410%),
06/25/2036 | | | | | 1,791,010 | | | | | | 0.6 | | |
| 1,250,621 | | | Fannie Mae REMICS
2007-14 PF, 1.982%,
(US0001M + 0.190%),
03/25/2037 | | | | | 1,237,525 | | | | | | 0.4 | | |
| 501,207 | | | Fannie Mae REMICS
2010-123 FL, 2.222%,
(US0001M + 0.430%),
11/25/2040 | | | | | 499,630 | | | | | | 0.2 | | |
| 2,018,458 | | | Fannie Mae REMICS
2011-51 FM, 2.442%,
(US0001M + 0.650%),
06/25/2041 | | | | | 2,025,410 | | | | | | 0.7 | | |
| 184,974 | | | Fannie Mae REMICS
2011-96 FN, 2.292%,
(US0001M + 0.500%),
10/25/2041 | | | | | 185,450 | | | | | | 0.1 | | |
| 1,541,057 | | | Fannie Mae REMICS
2010-136 FG, 2.292%,
(US0001M + 0.500%),
12/25/2030 | | | | | 1,543,759 | | | | | | 0.5 | | |
See Accompanying Notes to Financial Statements
SUMMARY PORTFOLIO OF INVESTMENTS
| Voya Limited Maturity Bond Portfolio | as of December 31, 2019 (continued) |
Principal
Amount† | | | Value | | | Percentage
of Net
Assets | |
| COLLATERALIZED MORTGAGE OBLIGATIONS: (continued) | |
| 2,577,160 | | | Fannie Mae REMICS
2011-68 F, 2.062%,
(US0001M + 0.270%),
07/25/2031 | | | | $ | 2,575,523 | | | | | | 0.9 | | |
| 197,130 (1)(2) | | | Flagstar Mortgage Trust
2017-2 A3, 3.500%,
10/25/2047 | | | | | 199,394 | | | | | | 0.1 | | |
| 2,727,540 | | | Ginnie Mae Series
2012-H31 FD, 2.114%,
(US0001M + 0.340%),
12/20/2062 | | | | | 2,713,831 | | | | | | 0.9 | | |
| 749,217 | | | Ginnie Mae Series
2016-H08 FT, 2.494%,
(US0001M + 0.720%),
02/20/2066 | | | | | 751,427 | | | | | | 0.3 | | |
| 286,566 (1)(2) | | | GS Mortgage-Backed
Securities Corp. Trust
2019-PJ3 A1, 3.500%,
03/25/2050 | | | | | 290,921 | | | | | | 0.1 | | |
| 417,964 (1)(2) | | | Sequoia Mortgage Trust
2014-3 B3, 3.936%,
10/25/2044 | | | | | 431,421 | | | | | | 0.1 | | |
| 437,037 (1)(2) | | | Sequoia Mortgage Trust
2014-4 B3, 3.864%,
11/25/2044 | | | | | 448,981 | | | | | | 0.2 | | |
| 531,181 (1)(2) | | | Sequoia Mortgage Trust
2018-CH1 A19, 4.000%,
02/25/2048 | | | | | 539,046 | | | | | | 0.2 | | |
| 765,323 | | | Other Securities | | | | | 770,232 | | | | | | 0.2 | | |
| | | | Total Collateralized
Mortgage Obligations
(Cost $15,985,138) | | | | | 16,003,560 | | | | | | 5.5 | | |
| U.S. TREASURY OBLIGATIONS: 20.2% | |
| | | | U.S. Treasury Notes: 20.2% | |
| 7,540,800 | | | 1.625%,12/31/2021 | | | | | 7,548,409 | | | | | | 2.6 | | |
| 22,431,000 | | | 1.625%,12/15/2022 | | | | | 22,441,651 | | | | | | 7.8 | | |
| 26,276,000 | | | 2.125%,01/31/2021 | | | | | 26,413,646 | | | | | | 9.2 | | |
| 1,653,900 (3) | | | 1.500%-1.750%,
10/31/2024-12/31/2026 | | | | | 1,651,017 | | | | | | 0.6 | | |
| | | | Total U.S. Treasury
Obligations
(Cost $58,026,787) | | | | | 58,054,723 | | | | | | 20.2 | | |
| COMMERCIAL MORTGAGE-BACKED SECURITIES: 11.1% | |
| 350,000 (1) | | | Austin Fairmont Hotel
Trust 2019-FAIR C,
3.190%, (US0001M +
1.450%), 09/15/2032 | | | | | 350,644 | | | | | | 0.1 | | |
| 830,000 (1) | | | BFLD 2019-DPLO A,
2.830%, (US0001M +
1.090%), 10/15/2034 | | | | | 829,448 | | | | | | 0.3 | | |
Principal
Amount† | | | Value | | | Percentage
of Net
Assets | |
COMMERCIAL MORTGAGE-BACKED
SECURITIES: (continued) | |
| 1,840,000 (1) | | | BX Commercial Mortgage
Trust 2019-XL D, 3.190%,
(US0001M + 1.450%),
10/15/2036 | | | | $ | 1,844,640 | | | | | | 0.6 | | |
| 200,000 (2) | | | Citigroup Commercial
Mortgage Trust
2013-GC17 C, 5.110%,
11/10/2046 | | | | | 213,853 | | | | | | 0.1 | | |
| 521,000 (1)(2) | | | Citigroup Commercial
Mortgage Trust
2014-GC19, 5.092%,
03/10/2047 | | | | | 558,793 | | | | | | 0.2 | | |
| 360,000 | | | Citigroup Commercial
Mortgage Trust
2015-GC27 AAB, 2.944%,
02/10/2048 | | | | | 366,181 | | | | | | 0.1 | | |
| 672,131 | | | Citigroup/Deutsche Bank
Commercial Mortgage
Trust 2006-CD3 AM,
5.648%, 10/15/2048 | | | | | 688,738 | | | | | | 0.2 | | |
| 710,000 (1) | | | CLNY Trust 2019-IKPR A,
2.869%, (US0001M +
1.227%), 11/15/2038 | | | | | 703,766 | | | | | | 0.2 | | |
| 1,690,000 (1) | | | Credit Suisse Mortgage
Capital Certificates
2019-ICE4 B, 2.970%,
(US0001M + 1.230%),
05/15/2036 | | | | | 1,692,894 | | | | | | 0.6 | | |
| 320,000 (1) | | | CSWF 2018-TOP C,
3.190%, (US0001M +
1.450%), 08/15/2035 | | | | | 320,135 | | | | | | 0.1 | | |
| 1,490,000 (1)(2) | | | DBRR 2011-LC2 A4B
Trust, 4.537%, 07/12/2044 | | | | | 1,521,111 | | | | | | 0.5 | | |
| 780,000 (1)(2) | | | DBUBS 2011-LC1A E,
5.702%, 11/10/2046 | | | | | 796,532 | | | | | | 0.3 | | |
| 730,000 (1)(2) | | | DBUBS 2011-LC2A D,
5.530%, 07/10/2044 | | | | | 750,567 | | | | | | 0.3 | | |
| 102,897 (2) | | | Ginnie Mae 2011-53 B,
3.934%, 05/16/2051 | | | | | 104,895 | | | | | | 0.0 | | |
| 713,926 | | | Ginnie Mae 2014-168 DA,
2.400%, 06/16/2046 | | | | | 711,743 | | | | | | 0.2 | | |
| 180,379 | | | Ginnie Mae 2014-54 AC,
2.874%, 02/16/2049 | | | | | 181,231 | | | | | | 0.1 | | |
| 629,801 | | | Ginnie Mae 2015-183 AC,
2.350%, 07/16/2056 | | | | | 627,760 | | | | | | 0.2 | | |
| 142,762 (2) | | | Ginnie Mae 2015-21 AF,
2.077%, 07/16/2048 | | | | | 141,640 | | | | | | 0.1 | | |
| 362,579 | | | Ginnie Mae 2015-81 AC,
2.400%, 01/16/2056 | | | | | 361,584 | | | | | | 0.1 | | |
See Accompanying Notes to Financial Statements
SUMMARY PORTFOLIO OF INVESTMENTS
| Voya Limited Maturity Bond Portfolio | as of December 31, 2019 (continued) |
Principal
Amount† | | | Value | | | Percentage
of Net
Assets | |
COMMERCIAL MORTGAGE-BACKED
SECURITIES: (continued) | |
| 439,245 | | | Ginnie Mae 2016-110 AB,
2.000%, 05/16/2049 | | | | $ | 433,131 | | | | | | 0.2 | | |
| 179,906 | | | Ginnie Mae 2016-86 AB,
2.500%, 09/16/2056 | | | | | 179,834 | | | | | | 0.1 | | |
| 600,777 | | | Ginnie Mae 2017-51 AB,
2.350%, 04/16/2057 | | | | | 598,049 | | | | | | 0.2 | | |
| 243,514 | | | Ginnie Mae 2017-69 AB,
2.350%, 05/16/2053 | | | | | 242,382 | | | | | | 0.1 | | |
| 370,365 | | | Ginnie Mae 2017-70 A,
2.500%, 10/16/2057 | | | | | 369,637 | | | | | | 0.1 | | |
| 878,753 | | | Ginnie Mae 2017-86 AB,
2.300%, 11/16/2051 | | | | | 874,667 | | | | | | 0.3 | | |
| 858,015 | | | Ginnie Mae 2017-89 A,
2.500%, 08/16/2057 | | | | | 856,324 | | | | | | 0.3 | | |
| 1,000,000 (1) | | | Great Wolf Trust
2019-WOLF A, 2.756%,
(US0001M + 1.034%),
12/15/2029 | | | | | 997,186 | | | | | | 0.4 | | |
| 530,000 (1) | | | GS Mortgage Securities
Corp. Trust 2017-GPTX B,
3.104%, 05/10/2034 | | | | | 527,387 | | | | | | 0.2 | | |
| 1,420,000 (1) | | | GS Mortgage Securities
Corp. Trust 2019-70P C,
3.240%, (US0001M +
1.500%), 10/15/2036 | | | | | 1,421,974 | | | | | | 0.5 | | |
| 1,320,000 (1)(2) | | | GS Mortgage Securities
Trust 2011-GC3 D,
5.636%, 03/10/2044 | | | | | 1,363,977 | | | | | | 0.4 | | |
| 760,000 (1)(2) | | | GS Mortgage Securities
Trust 2012-GC6 C,
5.651%, 01/10/2045 | | | | | 796,874 | | | | | | 0.3 | | |
| 977,000 (1)(2) | | | JP Morgan Chase
Commercial Mortgage
Securities Trust
2010-C2 C, 5.600%,
11/15/2043 | | | | | 989,306 | | | | | | 0.3 | | |
| 2,710,000 (1)(2) | | | JP Morgan Chase
Commercial Mortgage
Securities Trust
2011-C5 B, 5.418%,
08/15/2046 | | | | | 2,820,305 | | | | | | 1.0 | | |
| 700,000 (2) | | | JP Morgan Chase
Commercial Mortgage
Securities Trust
2013-C10 B, 3.674%,
12/15/2047 | | | | | 721,432 | | | | | | 0.3 | | |
| 4,526 | | | JPMBB Commercial
Mortgage Securities Trust
2 2014-C19 A2, 3.046%,
04/15/2047 | | | | | 4,547 | | | | | | 0.0 | | |
Principal
Amount† | | | Value | | | Percentage
of Net
Assets | |
COMMERCIAL MORTGAGE-BACKED
SECURITIES: (continued) | |
| 455,281 | | | Morgan Stanley Bank of
America Merrill Lynch
Trust 2014-C14 A3,
3.669%, 02/15/2047 | | | | $ | 459,610 | | | | | | 0.2 | | |
| 1,210,000 (1)(2) | | | Morgan Stanley Capital I
Trust 2011-C1 D, 5.375%,
09/15/2047 | | | | | 1,240,281 | | | | | | 0.4 | | |
| 1,220,000 | | | Morgan Stanley Capital I
Trust 2019-H6 A2,
3.228%, 06/15/2052 | | | | | 1,263,762 | | | | | | 0.5 | | |
| 620,000 (1) | | | Morgan Stanley Capital I,
Inc. 2019-BPR A, 3.140%,
(US0001M + 1.400%),
05/15/2036 | | | | | 619,541 | | | | | | 0.2 | | |
| 490,000 (1)(2) | | | Wells Fargo Commercial
Mortgage Trust 2010-C1
B, 5.276%, 11/15/2043 | | | | | 497,433 | | | | | | 0.2 | | |
| 1,780,175 | | | Other Securities | | | | | 1,810,565 | | | | | | 0.6 | | |
| | | | Total Commercial
Mortgage-Backed
Securities
(Cost $32,027,670) | | | | | 31,854,359 | | | | | | 11.1 | | |
| ASSET-BACKED SECURITIES: 17.1% | |
| | | | Automobile Asset-Backed Securities: 7.6% | |
| 750,000 | | | CarMax Auto Owner Trust
2017-1 A4, 2.270%,
09/15/2022 | | | | | 752,120 | | | | | | 0.3 | | |
| 750,000 | | | CarMax Auto Owner Trust
2017-3 A4, 2.220%,
11/15/2022 | | | | | 751,792 | | | | | | 0.3 | | |
| 150,000 | | | Carmax Auto Owner Trust
2019-3 A4, 2.300%,
04/15/2025 | | | | | 150,542 | | | | | | 0.0 | | |
| 800,000 | | | Carmax Auto Owner Trust
2019-4 A4, 2.130%,
07/15/2025 | | | | | 801,475 | | | | | | 0.3 | | |
| 300,000 | | | GM Financial Automobile
Leasing Trust 2018-1 A4,
2.680%, 12/20/2021 | | | | | 300,847 | | | | | | 0.1 | | |
| 650,000 | | | GM Financial Automobile
Leasing Trust 2018-1 B,
2.870%, 12/20/2021 | | | | | 652,066 | | | | | | 0.2 | | |
| 400,000 | | | GM Financial Automobile
Leasing Trust 2018-3 A4,
3.300%, 07/20/2022 | | | | | 405,204 | | | | | | 0.1 | | |
| 450,000 | | | GM Financial Automobile
Leasing Trust 2019-4 A4,
1.760%, 01/16/2025 | | | | | 445,862 | | | | | | 0.2 | | |
See Accompanying Notes to Financial Statements
SUMMARY PORTFOLIO OF INVESTMENTS
| Voya Limited Maturity Bond Portfolio | as of December 31, 2019 (continued) |
Principal
Amount† | | | Value | | | Percentage
of Net
Assets | |
| ASSET-BACKED SECURITIES: (continued) | |
| | | | Automobile Asset-Backed
Securities (continued) | |
| 500,000 | | | GM Financial Consumer
Automobile Receivables
Trust 2019-3 A3, 2.180%,
04/16/2024 | | | | $ | 502,365 | | | | | | 0.2 | | |
| 650,000 | | | Honda Auto Receivables
2018-4 A4 Owner Trust,
3.300%, 07/15/2025 | | | | | 669,253 | | | | | | 0.2 | | |
| 550,000 | | | Honda Auto Receivables
2019-3 A3 Owner Trust,
1.780%, 08/15/2023 | | | | | 548,816 | | | | | | 0.2 | | |
| 250,000 (1) | | | Hyundai Auto Lease
Securitization Trust 2019-B
A4, 2.030%, 06/15/2023 | | | | | 249,645 | | | | | | 0.1 | | |
| 950,000 | | | Hyundai Auto Receivables
Trust 2017-B A4, 1.960%,
02/15/2023 | | | | | 949,727 | | | | | | 0.3 | | |
| 646,260 | | | Mercedes-Benz Auto
Lease Trust 2019-A A2,
3.010%, 02/16/2021 | | | | | 647,513 | | | | | | 0.2 | | |
| 400,000 | | | Mercedes-Benz Auto
Lease Trust 2019-A A4,
3.250%, 10/15/2024 | | | | | 406,358 | | | | | | 0.1 | | |
| 450,000 | | | Mercedes-Benz Auto
Receivables Trust 2018-1
A4, 3.150%, 10/15/2024 | | | | | 460,850 | | | | | | 0.2 | | |
| 650,000 | | | Nissan Auto Receivables
2017-C A4 Owner Trust,
2.280%, 02/15/2024 | | | | | 651,962 | | | | | | 0.2 | | |
| 500,000 | | | Nissan Auto Receivables
2018-C A4 Owner Trust,
3.270%, 06/16/2025 | | | | | 516,282 | | | | | | 0.2 | | |
| 1,149,009 (1) | | | OSCAR US Funding Trust
VII LLC 2017-2A A3,
2.450%, 12/10/2021 | | | | | 1,150,557 | | | | | | 0.4 | | |
| 850,000 | | | Santander Drive Auto
Receivables Trust 2019-2
B, 2.790%, 01/16/2024 | | | | | 858,081 | | | | | | 0.3 | | |
| 1,100,000 | | | Santander Drive Auto
Receivables Trust 2019-3
A3, 2.160%, 11/15/2022 | | | | | 1,101,749 | | | | | | 0.4 | | |
| 650,000 (1) | | | Santander Retail Auto
Lease Trust 2017-A A4,
2.370%, 01/20/2022 | | | | | 650,803 | | | | | | 0.2 | | |
| 91,077 (1) | | | Santander Retail Auto
Lease Trust 2019-A A2,
2.720%, 01/20/2022 | | | | | 91,683 | | | | | | 0.0 | | |
| 500,000 (1) | | | Santander Retail Auto
Lease Trust 2019-B A3,
2.300%, 01/20/2023 | | | | | 501,787 | | | | | | 0.2 | | |
Principal
Amount† | | | Value | | | Percentage
of Net
Assets | |
| ASSET-BACKED SECURITIES: (continued) | |
| | | | Automobile Asset-Backed
Securities (continued) | |
| 500,000 (1) | | | Santander Retail Auto
Lease Trust 2019-B A4,
2.380%, 08/21/2023 | | | | $ | 502,222 | | | | | | 0.2 | | |
| 1,300,000 (1) | | | Santander Retail Auto
Lease Trust 2019-C A4,
1.930%, 11/20/2023 | | | | | 1,291,971 | | | | | | 0.5 | | |
| 865,850 (1) | | | Tesla Auto Lease Trust
2018-B A, 3.710%,
08/20/2021 | | | | | 877,253 | | | | | | 0.3 | | |
| 650,000 | | | Toyota Auto Receivables
2017-C A4 Owner Trust,
1.980%, 12/15/2022 | | | | | 650,535 | | | | | | 0.2 | | |
| 950,000 | | | Toyota Auto Receivables
2019-C A4 Owner Trust,
1.880%, 11/15/2024 | | | | | 947,622 | | | | | | 0.4 | | |
| 3,200,000 | | | Other Securities | | | | | 3,243,085 | | | | | | 1.1 | | |
| | | | | | | | | 21,730,027 | | | | | | 7.6 | | |
| | | | Credit Card Asset-Backed Securities: 0.9% | |
| 1,000,000 | | | BA Credit Card Trust
2019-A1 A1, 1.740%,
01/15/2025 | | | | | 997,067 | | | | | | 0.4 | | |
| 1,550,000 (1) | | | Evergreen Credit Card
Trust Series 2018-1 A,
2.950%, 03/15/2023 | | | | | 1,569,238 | | | | | | 0.5 | | |
| | | | | | | | | 2,566,305 | | | | | | 0.9 | | |
| | | | Other Asset-Backed Securities: 8.3% | |
| 500,000 (1) | | | Allegany Park CLO Ltd.
2019-1A A, 3.238%,
(US0003M + 1.330%),
01/20/2033 | | | | | 500,000 | | | | | | 0.2 | | |
| 840,000 (1) | | | Apidos Clo XXV 2016-25A
A1R, 3.136%,
(US0003M + 1.170%),
10/20/2031 | | | | | 836,718 | | | | | | 0.3 | | |
| 560,000 (1) | | | Arbor Realty Commercial
Real Estate Notes
2019-FL2 A Ltd., 2.971%,
(US0001M + 1.200%),
06/15/2034 | | | | | 559,824 | | | | | | 0.2 | | |
| 700,000 (1) | | | ARES XLVI CLO Ltd.
2017-46A A2, 3.231%,
(US0003M + 1.230%),
01/15/2030 | | | | | 685,368 | | | | | | 0.2 | | |
| 250,000 (1) | | | Babson CLO Ltd. 2017-1A
A2, 3.353%, (US0003M +
1.350%), 07/18/2029 | | | | | 247,087 | | | | | | 0.1 | | |
See Accompanying Notes to Financial Statements
SUMMARY PORTFOLIO OF INVESTMENTS
| Voya Limited Maturity Bond Portfolio | as of December 31, 2019 (continued) |
Principal
Amount† | | | Value | | | Percentage
of Net
Assets | |
| ASSET-BACKED SECURITIES: (continued) | |
| | | | Other Asset-Backed Securities (continued) | |
| 250,000 (1) | | | Bain Capital Credit CLO
2017-1A A2, 3.316%,
(US0003M + 1.350%),
07/20/2030 | | | | $ | 248,324 | | | | | | 0.1 | | |
| 580,000 (1) | | | Benefit Street Partners
CLO II Ltd. 2013-IIA A1R,
3.251%, (US0003M +
1.250%), 07/15/2029 | | | | | 579,980 | | | | | | 0.2 | | |
| 250,000 (1) | | | Carbone CLO Ltd.
2017-1A A1, 3.106%,
(US0003M + 1.140%),
01/20/2031 | | | | | 249,352 | | | | | | 0.1 | | |
| 500,000 (1) | | | Carlyle Global Market
Strategies CLO 2014-2RA
A1 Ltd., 2.960%, (US0003M +
1.050%), 05/15/2031 | | | | | 497,720 | | | | | | 0.2 | | |
| 620,000 (1) | | | Cedar Funding VIII Clo
Ltd. 2017-8A A1, 3.252%,
(US0003M + 1.250%),
10/17/2030 | | | | | 620,002 | | | | | | 0.2 | | |
| 750,000 (1) | | | CIFC Funding 2013-2A
A1LR, 3.213%, (US0003M +
1.210%), 10/18/2030 | | | | | 749,999 | | | | | | 0.3 | | |
| 600,000 (1) | | | CIFC Funding 2017-4 A1,
3.186%, (US0003M +
1.250%), 10/24/2030 | | | | | 601,892 | | | | | | 0.2 | | |
| 600,000 (1) | | | CIFC Funding 2018-4A A1
Ltd., 3.152%, (US0003M +
1.150%), 10/17/2031 | | | | | 596,206 | | | | | | 0.2 | | |
| 600,000 (1) | | | Clear Creek CLO Ltd.
2015-1A AR, 3.166%,
(US0003M + 1.200%),
10/20/2030 | | | | | 598,535 | | | | | | 0.2 | | |
| 250,000 (1) | | | Deer Creek Clo Ltd.
2017-1A A, 3.146%,
(US0003M + 1.180%),
10/20/2030 | | | | | 249,794 | | | | | | 0.1 | | |
| 680,000 (1) | | | Dewolf Park Clo Ltd.
2017-1A A, 3.211%,
(US0003M + 1.210%),
10/15/2030 | | | | | 679,997 | | | | | | 0.2 | | |
| 250,000 (1) | | | Dryden 55 CLO Ltd.
2018-55A A1, 3.021%,
(US0003M + 1.020%),
04/15/2031 | | | | | 248,689 | | | | | | 0.1 | | |
| 1,120,000 (1) | | | Dryden Senior Loan Fund
2017-47A A2, 3.351%,
(US0003M + 1.350%),
04/15/2028 | | | | | 1,110,719 | | | | | | 0.4 | | |
Principal
Amount† | | | Value | | | Percentage
of Net
Assets | |
| ASSET-BACKED SECURITIES: (continued) | |
| | | | Other Asset-Backed Securities (continued) | |
| 480,000 (1) | | | Dryden XXVIII Senior
Loan Fund 2013-28A
A1LR, 3.110%, (US0003M
+ 1.200%), 08/15/2030 | | | | $ | 480,005 | | | | | | 0.1 | | |
| 300,000 (1) | | | Eaton Vance Clo 2015-1A
A2R Ltd., 3.216%,
(US0003M + 1.250%),
01/20/2030 | | | | | 300,002 | | | | | | 0.1 | | |
| 750,000 (1) | | | Galaxy XIX CLO Ltd.
2015-19A A1R, 3.156%,
(US0003M + 1.220%),
07/24/2030 | | | | | 748,826 | | | | | | 0.2 | | |
| 500,000 (1) | | | Galaxy XV CLO Ltd.
2013-15A AR, 3.201%,
(US0003M + 1.200%),
10/15/2030 | | | | | 499,205 | | | | | | 0.2 | | |
| 300,000 (1) | | | Goldentree Loan
Management US Clo 2
Ltd. 2017-2A A, 3.116%,
(US0003M + 1.150%),
11/28/2030 | | | | | 299,689 | | | | | | 0.1 | | |
| 431,651 (1) | | | JGWPT XXXIII LLC
2014-3A A, 3.500%,
06/15/2077 | | | | | 444,161 | | | | | | 0.2 | | |
| 600,000 (1) | | | LCM 26A A2 Ltd., 3.216%,
(US0003M + 1.250%),
01/20/2031 | | | | | 589,938 | | | | | | 0.2 | | |
| 250,000 (1) | | | LCM XXIV Ltd. 24A A,
3.276%, (US0003M +
1.310%), 03/20/2030 | | | | | 250,019 | | | | | | 0.1 | | |
| 480,000 (1) | | | LoanCore 2019-CRE2 A
Issuer Ltd., 2.870%,
(US0001M + 1.130%),
05/09/2036 | | | | | 479,999 | | | | | | 0.2 | | |
| 400,000 (1) | | | Octagon Investment
Partners 33 Ltd. 2017-1A
A1, 3.156%, (US0003M +
1.190%), 01/20/2031 | | | | | 398,770 | | | | | | 0.1 | | |
| 500,000 (1) | | | Octagon Investment
Partners Ltd. 2017-1A A2,
3.351%, (US0003M +
1.350%), 07/15/2029 | | | | | 494,738 | | | | | | 0.2 | | |
| 500,000 (1) | | | Octagon Investment
Partners XIV Ltd. 2012-1A
A1BR, 3.376%,
(US0003M + 1.375%),
07/15/2029 | | | | | 491,812 | | | | | | 0.2 | | |
See Accompanying Notes to Financial Statements
SUMMARY PORTFOLIO OF INVESTMENTS
| Voya Limited Maturity Bond Portfolio | as of December 31, 2019 (continued) |
Principal
Amount† | | | Value | | | Percentage
of Net
Assets | |
| ASSET-BACKED SECURITIES: (continued) | |
| | | | Other Asset-Backed Securities (continued) | |
| 400,000 (1) | | | Octagon Investment
Partners XV Ltd. 2013-1A
A2R, 3.316%, (US0003M
+ 1.350%), 07/19/2030 | | | | $ | 393,304 | | | | | | 0.1 | | |
| 500,000 (1) | | | Palmer Square CLO
2013-2A AARR Ltd.,
3.202%, (US0003M +
1.200%), 10/17/2031 | | | | | 497,122 | | | | | | 0.2 | | |
| 700,000 (1) | | | Palmer Square CLO
2015-2A A1AR Ltd.,
3.236%, (US0003M +
1.270%), 07/20/2030 | | | | | 700,209 | | | | | | 0.2 | | |
| 275,000 (1) | | | Palmer Square CLO
2015-2A A1BR Ltd.,
3.316%, (US0003M +
1.350%), 07/20/2030 | | | | | 274,998 | | | | | | 0.1 | | |
| 537,789 (1) | | | SoFi Consumer Loan
Program 2019-2 A Trust,
3.010%, 04/25/2028 | | | | | 541,895 | | | | | | 0.2 | | |
| 471,867 (1) | | | SoFi Consumer Loan
Program 2019-3 A Trust,
2.900%, 05/25/2028 | | | | | 474,891 | | | | | | 0.1 | | |
| 400,000 (1) | | | TCI-Flatiron Clo 2017-1A
A Ltd., 3.104%, (US0003M
+ 1.200%), 11/18/2030 | | | | | 399,012 | | | | | | 0.1 | | |
| 500,000 (1) | | | TCI-Symphony CLO
2017-1A A Ltd., 3.231%,
(US0003M + 1.230%),
07/15/2030 | | | | | 499,417 | | | | | | 0.2 | | |
| 600,000 (1) | | | THL Credit Wind River
2013-2A AR CLO Ltd.,
3.233%, (US0003M +
1.230%), 10/18/2030 | | | | | 597,770 | | | | | | 0.2 | | |
| 570,000 (1) | | | THL Credit Wind River
2017-2A A CLO Ltd.,
3.196%, (US0003M +
1.230%), 07/20/2030 | | | | | 570,122 | | | | | | 0.2 | | |
| 600,000 (1) | | | THL Credit Wind River
2018-2 A A2Clo Ltd.,
3.451%, (US0003M +
1.450%), 07/15/2030 | | | | | 595,117 | | | | | | 0.2 | | |
| 600,000 (1) | | | THL Credit Wind River
2019-2A A2 Clo Ltd.,
3.501%, (US0003M +
1.650%), 01/15/2033 | | | | | 599,966 | | | | | | 0.2 | | |
Principal
Amount† | | | Value | | | Percentage
of Net
Assets | |
| ASSET-BACKED SECURITIES: (continued) | |
| | | | Other Asset-Backed Securities (continued) | |
| 800,000 (1) | | | Trafigura Securitisation
Finance PLC 2018-1A A2,
3.730%, 03/15/2022 | | | | $ | 816,476 | | | | | | 0.3 | | |
| 250,000 (1) | | | Venture 34 CLO Ltd.
2018-34A A, 3.231%,
(US0003M + 1.230%),
10/15/2031 | | | | | 247,799 | | | | | | 0.1 | | |
| 450,000 (1) | | | Volvo Financial Equipment
LLC Series 2017-1A A4,
2.210%, 11/15/2021 | | | | | 450,538 | | | | | | 0.2 | | |
| 1,000,000 | | | Other Securities | | | | | 1,010,966 | | | | | | 0.3 | | |
| | | | | | | | | 24,006,972 | | | | | | 8.3 | | |
| | | | Student Loan Asset-Backed
Securities: 0.3% | |
| 850,000 (1) | | | Navient Private Education
Refi Loan Trust 2019-FA
A2, 2.600%, 08/15/2068 | | | | | 849,113 | | | | | | 0.3 | | |
| | | | Total Asset-Backed
Securities
(Cost $49,030,182) | | | | | 49,152,417 | | | | | | 17.1 | | |
| SUPRANATIONAL BONDS: 0.1% | |
| 179,000 | | | Other Securities | | | | | 179,024 | | | | | | 0.1 | | |
| | | | Total Supranational Bonds
(Cost $178,474) | | | | | 179,024 | | | | | | 0.1 | | |
| U.S. GOVERNMENT AGENCY OBLIGATIONS: 0.0% | |
| | | | Federal Home Loan Mortgage
Corporation: 0.0% | |
| 3 | | | 4.625%, (H15T1Y +
1.997)%, 07/01/2024 | | | | | 3 | | | | | | 0.0 | | |
| | | | | |
| | | | Uniform Mortgage-Backed Securities : 0.0% | |
| 65,211 | | | Other Securities | | | | | 71,079 | | | | | | 0.0 | | |
| | | | Total U.S. Government
Agency Obligations
(Cost $66,352) | | | | | 71,082 | | | | | | 0.0 | | |
| | | | Total Long-Term
Investments
(Cost $279,796,185) | | | | | 281,245,791 | | | | | | 97.7 | | |
| |
See Accompanying Notes to Financial Statements
SUMMARY PORTFOLIO OF INVESTMENTS
| Voya Limited Maturity Bond Portfolio | as of December 31, 2019 (continued) |
Principal
Amount† | | | Value | | | Percentage
of Net
Assets | |
| SHORT-TERM INVESTMENTS: 1.8% | |
| | | | Repurchase Agreements: 0.0% | |
| 3,127 (4) | | | Millennium Fixed Income
Ltd., Repurchase
Agreement dated
12/31/19, 1.75%, due
01/02/20 (Repurchase
Amount $3,127,
collateralized by various
U.S. Government
Securities,
0.125%-2.250%, Market
Value plus accrued
interest $3,190, due
04/15/20-03/31/21)
(Cost $5,075) | | | | $ | 5,075 | | | | | | 0.0 | | |
| | | | | |
| | | | Mutual Funds: 1.8% | |
| 5,219,000 (5) | | | Goldman Sachs Financial
Square Government
Fund - Institutional Shares,
1.500%
(Cost $5,219,000) | | | | | 5,219,000 | | | | | | 1.8 | | |
| | | | Total Short-Term
Investments
(Cost $5,224,075) | | | | | 5,224,075 | | | | | | 1.8 | | |
| | | | Total Investments in
Securities
(Cost $285,020,260) | | | | $ | 286,469,866 | | | | | | 99.5 | | |
| | | | Assets in Excess of
Other Liabilities | | | | | 1,357,940 | | | | | | 0.5 | | |
| | | | Net Assets | | | | $ | 287,827,806 | | | | | | 100.0 | | |
| |
“Other Securities” represents issues not identified as the top 50 holdings in terms of market value and issues or issuers not exceeding 1% of net assets individually or in aggregate respectively as of December 31, 2019.
The following footnotes apply to either the individual securities noted or one or more of the securities aggregated and listed as a single line item.
†
Unless otherwise indicated, principal amount is shown in USD.
(1)
Securities with purchases pursuant to Rule 144A or section 4(a)(2), under the Securities Act of 1933 and may not be resold subject to that rule except to qualified institutional buyers.
(2)
Variable rate security. Rate shown is the rate in effect as of December 31, 2019.
(3)
Security, or a portion of the security, is on loan.
(4)
All or a portion of the security represents securities purchased with cash collateral received for securities on loan.
(5)
Rate shown is the 7-day yield as of December 31, 2019.
Reference Rate Abbreviations:
H15T1Y
U.S. Treasury 1-Year Constant Maturity
US0001M
1-month LIBOR
US0003M
3-month LIBOR
Fair Value Measurements^
The following is a summary of the fair valuations according to the inputs used as of December 31, 2019 in valuing the assets and liabilities:
| | | | Quoted Prices
in Active Markets
for Identical
Investments
(Level 1) | | | Significant
Other
Observable
Inputs
(Level 2) | | | Significant
Unobservable
Inputs
(Level 3) | | | Fair Value
at
December 31, 2019 | |
| Asset Table | | | | | | | | | | | | | | | | | | | | | | | | | |
| Investments, at fair value | | | | | | | | | | | | | | | | | | | | | | | | | |
| Corporate Bonds/Notes | | | | $ | — | | | | | $ | 125,930,626 | | | | | $ | — | | | | | $ | 125,930,626 | | |
| Collateralized Mortgage Obligations | | | | | — | | | | | | 16,003,560 | | | | | | — | | | | | | 16,003,560 | | |
| Asset-Backed Securities | | | | | — | | | | | | 49,152,417 | | | | | | — | | | | | | 49,152,417 | | |
| Commercial Mortgage-Backed Securities | | | | | — | | | | | | 31,854,359 | | | | | | — | | | | | | 31,854,359 | | |
| Supranational Bonds | | | | | — | | | | | | 179,024 | | | | | | — | | | | | | 179,024 | | |
| U.S. Government Agency Obligations | | | | | — | | | | | | 71,082 | | | | | | — | | | | | | 71,082 | | |
| U.S. Treasury Obligations | | | | | — | | | | | | 58,054,723 | | | | | | — | | | | | | 58,054,723 | | |
| Short-Term Investments | | | | | 5,219,000 | | | | | | 5,075 | | | | | | — | | | | | | 5,224,075 | | |
| Total Investments, at fair value | | | | $ | 5,219,000 | | | | | $ | 281,250,866 | | | | | $ | — | | | | | $ | 286,469,866 | | |
See Accompanying Notes to Financial Statements
SUMMARY PORTFOLIO OF INVESTMENTS
| Voya Limited Maturity Bond Portfolio | as of December 31, 2019 (continued) |
| | | | Quoted Prices
in Active Markets
for Identical
Investments
(Level 1) | | | Significant
Other
Observable
Inputs
(Level 2) | | | Significant
Unobservable
Inputs
(Level 3) | | | Fair Value
at
December 31, 2019 | |
| Other Financial Instruments+ | | | | | | | | | | | | | | | | | | | | | | | | | |
| Futures | | | | | 42,572 | | | | | | — | | | | | | — | | | | | | 42,572 | | |
| Total Assets | | | | $ | 5,261,572 | | | | | $ | 281,250,866 | | | | | $ | — | | | | | $ | 286,512,438 | | |
| Liabilities Table | | | | | | | | | | | | | | | | | | | | | | | | | |
| Other Financial Instruments+ | | | | | | | | | | | | | | | | | | | | | | | | | |
| Futures | | | | $ | (37,777) | | | | | $ | — | | | | | $ | — | | | | | $ | (37,777) | | |
| Total Liabilities | | | | $ | (37,777) | | | | | $ | — | | | | | $ | — | | | | | $ | (37,777) | | |
^
See Note 2, “Significant Accounting Policies” in the Notes to Financial Statements for additional information.
+
Other Financial Instruments may include open forward foreign currency contracts, futures, centrally cleared swaps, OTC swaps and written options. Forward foreign currency contracts, futures and centrally cleared swaps are valued at the unrealized gain (loss) on the instrument. OTC swaps and written options are valued at the fair value of the instrument.
At December 31, 2019, the following futures contracts were outstanding for Voya Limited Maturity Bond Portfolio:
| Description | | | Number
of Contracts | | | Expiration
Date | | | Notional
Value | | | Unrealized
Appreciation/
(Depreciation) | |
| Long Contracts: | | | | | | | | | | | | | | | | | | | | | | | | | |
| U.S. Treasury 2-Year Note | | | | | 409 | | | | | | 03/31/20 | | | | | $ | 88,139,500 | | | | | $ | (37,777) | | |
| | | | | | | | | | | | | | | | | $ | 88,139,500 | | | | | $ | (37,777) | | |
| Short Contracts: | | | | | | | | | | | | | | | | | | | | | | | | | |
| U.S. Treasury 10-Year Note | | | | | (10) | | | | | | 03/20/20 | | | | | | (1,284,219) | | | | | | 6,404 | | |
| U.S. Treasury 5-Year Note | | | | | (124) | | | | | | 03/31/20 | | | | | | (14,707,562) | | | | | | 36,168 | | |
| | | | | | | | | | | | | | | | | $ | (15,991,781) | | | | | $ | 42,572 | | |
A summary of derivative instruments by primary risk exposure is outlined in the following tables.
The fair value of derivative instruments as of December 31, 2019 was as follows:
| Derivatives not accounted for as hedging instruments | | | Location on Statement
of Assets and Liabilities | | | Fair Value | |
| Asset Derivatives | | | | | | | | | | |
| Interest rate contracts | | | Net Assets — Unrealized appreciation* | | | | $ | 42,572 | | |
| Total Asset Derivatives | | | | | | | $ | 42,572 | | |
| Liability Derivatives | | | | | | | | | | |
| Interest rate contracts | | | Net Assets — Unrealized depreciation* | | | | $ | 37,777 | | |
| Total Liability Derivatives | | | | | | | $ | 37,777 | | |
*
Includes cumulative appreciation/depreciation of futures contracts as reported in the table within the Portfolio of Investments.
The effect of derivative instruments on the Portfolio’s Statement of Operations for the year ended December 31, 2019 was as follows:
Amount of Realized Gain or (Loss) on Derivatives Recognized in Income | |
| Derivatives not accounted for as hedging instruments | | | Investments* | | | Futures | | | Swaps | | | Total | |
| Credit contracts | | | | $ | — | | | | | $ | — | | | | | $ | (108) | | | | | $ | (108) | | |
| Interest rate contracts | | | | | (6,738) | | | | | | 67,840 | | | | | | (54,431) | | | | | | 6,671 | | |
| Total | | | | $ | (6,738) | | | | | $ | 67,840 | | | | | $ | (54,539) | | | | | $ | 6,563 | | |
See Accompanying Notes to Financial Statements
SUMMARY PORTFOLIO OF INVESTMENTS
| Voya Limited Maturity Bond Portfolio | as of December 31, 2019 (continued) |
| Change in Unrealized Appreciation or (Depreciation) on Derivatives Recognized in Income | |
| Derivatives not accounted for as hedging instruments | | | Investments* | | | Futures | | | Swaps | | | Total | |
| Credit contracts | | | | $ | — | | | | | $ | — | | | | | $ | — | | | | | $ | — | | |
| Interest rate contracts | | | | | — | | | | | | (196,576) | | | | | | — | | | | | | (196,576) | | |
| Total | | | | $ | — | | | | | $ | (196,576) | | | | | $ | — | | | | | $ | (196,576) | | |
*
Amounts recognized for purchased options are included in net realized gain (loss) on investments and in net change in unrealized apppreciation (depreciation) on investments.
At December 31, 2019, the aggregate cost of securities and other investments and the composition of unrealized appreciation and depreciation of securities and other investments at year end were:
| | Cost for federal income tax purposes was $285,026,864. | | |
| | Net unrealized appreciation consisted of: | | |
| | Gross Unrealized Appreciation | | | | $ | 1,832,323 | | |
| | Gross Unrealized Depreciation | | | | | (384,526) | | |
| | Net Unrealized Appreciation | | | | $ | 1,447,797 | | |
See Accompanying Notes to Financial Statements
SUMMARY PORTFOLIO OF INVESTMENTS
| Voya U.S. Stock Index Portfolio | as of December 31, 2019 |
| Shares | | | Value | | | Percentage
of Net
Assets | |
| COMMON STOCK: 98.7% | |
| | | | Communication Services: 10.3% | |
| 77,320 (1) | | | Alphabet, Inc. - Class A | | | | $ | 103,561,635 | | | | | | 1.5 | | |
| 77,129 (1) | | | Alphabet, Inc. - Class C | | | | | 103,123,016 | | | | | | 1.5 | | |
| 1,885,071 | | | AT&T, Inc. | | | | | 73,668,575 | | | | | | 1.1 | | |
| 1,171,507 | | | Comcast Corp. – Class A | | | | | 52,682,670 | | | | | | 0.8 | | |
| 620,994 (1) | | | Facebook, Inc. - Class A | | | | | 127,459,018 | | | | | | 1.8 | | |
| 113,092 (1) | | | Netflix, Inc. | | | | | 36,593,178 | | | | | | 0.5 | | |
| 1,067,248 | | | Verizon Communications,
Inc. | | | | | 65,529,027 | | | | | | 0.9 | | |
| 465,113 | | | Walt Disney Co. | | | | | 67,269,293 | | | | | | 1.0 | | |
| 1,664,693 (2)(3) | | | Other Securities | | | | | 87,560,748 | | | | | | 1.2 | | |
| | | | | | | | | 717,447,160 | | | | | | 10.3 | | |
| | | | Consumer Discretionary: 9.6% | |
| 107,471 (1) | | | Amazon.com, Inc. | | | | | 198,589,213 | | | | | | 2.8 | | |
| 281,493 | | | Home Depot, Inc. | | | | | 61,472,441 | | | | | | 0.9 | | |
| 194,337 | | | McDonald’s Corp. | | | | | 38,402,934 | | | | | | 0.5 | | |
| 321,773 | | | Nike, Inc. | | | | | 32,598,823 | | | | | | 0.5 | | |
| 5,140,113 (2)(3) | | | Other Securities | | | | | 342,945,655 | | | | | | 4.9 | | |
| | | | | | | | | 674,009,066 | | | | | | 9.6 | | |
| | | | Consumer Staples: 7.1% | |
| 995,060 | | | Coca-Cola Co. | | | | | 55,076,571 | | | | | | 0.8 | | |
| 114,003 | | | Costco Wholesale Corp. | | | | | 33,507,762 | | | | | | 0.5 | | |
| 359,837 | | | PepsiCo, Inc. | | | | | 49,178,923 | | | | | | 0.7 | | |
| 401,497 | | | Philip Morris International,
Inc. | | | | | 34,163,379 | | | | | | 0.5 | | |
| 643,265 | | | Procter & Gamble Co. | | | | | 80,343,798 | | | | | | 1.1 | | |
| 366,070 | | | Walmart, Inc. | | | | | 43,503,759 | | | | | | 0.6 | | |
| 3,137,622 (2)(3) | | | Other Securities | | | | | 201,438,637 | | | | | | 2.9 | | |
| | | | | | | | | 497,212,829 | | | | | | 7.1 | | |
| | | | Energy: 4.3% | |
| 487,961 | | | Chevron Corp. | | | | | 58,804,180 | | | | | | 0.8 | | |
| 1,091,846 | | | Exxon Mobil Corp. | | | | | 76,189,014 | | | | | | 1.1 | | |
| 3,858,412 (2) | | | Other Securities | | | | | 165,099,916 | | | | | | 2.4 | | |
| | | | | | | | | 300,093,110 | | | | | | 4.3 | | |
| | | | Financials: 12.8% | |
| 2,089,087 | | | Bank of America Corp. | | | | | 73,577,644 | | | | | | 1.1 | | |
| 504,760 (1) | | | Berkshire Hathaway, Inc. –
Class B | | | | | 114,328,140 | | | | | | 1.6 | | |
| 563,378 | | | Citigroup, Inc. | | | | | 45,008,269 | | | | | | 0.6 | | |
| 809,377 | | | JPMorgan Chase & Co. | | | | | 112,827,154 | | | | | | 1.6 | | |
| 993,170 | | | Wells Fargo & Co. | | | | | 53,432,546 | | | | | | 0.8 | | |
| 6,451,623 (2)(3) | | | Other Securities | | | | | 495,416,509 | | | | | | 7.1 | | |
| | | | | | | | | 894,590,262 | | | | | | 12.8 | | |
| Shares | | | Value | | | Percentage
of Net
Assets | |
| COMMON STOCK: (continued) | |
| | | | Health Care: 14.0% | |
| 456,081 | | | Abbott Laboratories | | | | $ | 39,615,196 | | | | | | 0.6 | | |
| 381,613 | | | AbbVie, Inc. | | | | | 33,788,015 | | | | | | 0.5 | | |
| 153,331 | | | Amgen, Inc. | | | | | 36,963,504 | | | | | | 0.5 | | |
| 604,922 | | | Bristol-Myers Squibb Co. | | | | | 38,829,943 | | | | | | 0.6 | | |
| 679,160 | | | Johnson & Johnson | | | | | 99,069,069 | | | | | | 1.4 | | |
| 345,888 | | | Medtronic PLC | | | | | 39,240,994 | | | | | | 0.6 | | |
| 656,997 | | | Merck & Co., Inc. | | | | | 59,753,877 | | | | | | 0.8 | | |
| 1,428,092 | | | Pfizer, Inc. | | | | | 55,952,645 | | | | | | 0.8 | | |
| 103,477 | | | Thermo Fisher Scientific,
Inc. | | | | | 33,616,573 | | | | | | 0.5 | | |
| 244,483 | | | UnitedHealth Group, Inc. | | | | | 71,873,112 | | | | | | 1.0 | | |
| 3,709,699 (2)(3) | | | Other Securities | | | | | 472,202,027 | | | | | | 6.7 | | |
| | | | | | | | | 980,904,955 | | | | | | 14.0 | | |
| | | | Industrials: 8.9% | |
| 137,968 | | | Boeing Co. | | | | | 44,944,456 | | | | | | 0.6 | | |
| 184,387 | | | Honeywell International, Inc. | | | | | 32,636,499 | | | | | | 0.5 | | |
| 179,140 | | | Union Pacific Corp. | | | | | 32,386,721 | | | | | | 0.5 | | |
| 209,361 | | | United Technologies Corp. | | | | | 31,353,903 | | | | | | 0.4 | | |
| 6,433,984 (2)(3) | | | Other Securities | | | | | 483,709,657 | | | | | | 6.9 | | |
| | | | | | | | | 625,031,236 | | | | | | 8.9 | | |
| | | | Information Technology: 22.9% | |
| 163,768 | | | Accenture PLC | | | | | 34,484,628 | | | | | | 0.5 | | |
| 124,918 (1) | | | Adobe, Inc. | | | | | 41,199,206 | | | | | | 0.6 | | |
| 1,077,799 | | | Apple, Inc. | | | | | 316,495,676 | | | | | | 4.5 | | |
| 102,319 | | | Broadcom, Inc. | | | | | 32,334,850 | | | | | | 0.5 | | |
| 1,094,725 | | | Cisco Systems, Inc. | | | | | 52,503,011 | | | | | | 0.7 | | |
| 1,122,527 | | | Intel Corp. | | | | | 67,183,241 | | | | | | 1.0 | | |
| 229,081 | | | Mastercard, Inc. - Class A | | | | | 68,401,296 | | | | | | 1.0 | | |
| 1,968,630 | | | Microsoft Corp. | | | | | 310,452,951 | | | | | | 4.4 | | |
| 157,928 | | | Nvidia Corp. | | | | | 37,160,458 | | | | | | 0.5 | | |
| 303,003 (1) | | | PayPal Holdings, Inc. | | | | | 32,775,834 | | | | | | 0.5 | | |
| 228,892 (1) | | | Salesforce.com, Inc. | | | | | 37,226,995 | | | | | | 0.5 | | |
| 441,744 | | | Visa, Inc. - Class A | | | | | 83,003,698 | | | | | | 1.2 | | |
| 5,834,466 (2)(3) | | | Other Securities | | | | | 488,850,639 | | | | | | 7.0 | | |
| | | | | | | | | 1,602,072,483 | | | | | | 22.9 | | |
| | | | Materials: 2.6% | |
| 2,752,971 (2) | | | Other Securities | | | | | 183,214,481 | | | | | | 2.6 | | |
| | | | Real Estate: 2.9% | |
| 2,269,971 (2)(3) | | | Other Securities | | | | | 201,791,053 | | | | | | 2.9 | | |
| | | | Utilities: 3.3% | |
| 3,103,653 (2) | | | Other Securities | | | | | 229,027,792 | | | | | | 3.3 | | |
| | | | Total Common Stock
(Cost $4,268,478,242) | | | | | 6,905,394,427 | | | | | | 98.7 | | |
| |
See Accompanying Notes to Financial Statements
SUMMARY PORTFOLIO OF INVESTMENTS
| Voya U.S. Stock Index Portfolio | as of December 31, 2019 (continued) |
Principal
Amount† | | | Value | | | Percentage
of Net
Assets | |
| SHORT-TERM INVESTMENTS: 2.4% | |
| | | | Commercial Paper: 0.1% | |
| 825,000 (4) | | | Banco Santander S.A.,
1.950%, 02/05/2020 | | | | $ | 823,517 | | | | | | 0.0 | | |
| 950,000 (4) | | | DBS Bank Ltd., 1.710%,
01/07/2020 | | | | | 949,701 | | | | | | 0.1 | | |
| 950,000 (4) | | | DBS Bank Ltd., 1.820%,
02/18/2020 | | | | | 947,688 | | | | | | 0.0 | | |
| 800,000 (4) | | | LMA Americas LLC, 1.810%,
01/23/2020 | | | | | 798,962 | | | | | | 0.0 | | |
| 900,000 (4) | | | LMA Americas LLC, 2.000%,
01/31/2020 | | | | | 898,529 | | | | | | 0.0 | | |
| 975,000 (4) | | | Matchpoint Finance PLC,
1.850%, 02/03/2020 | | | | | 973,347 | | | | | | 0.0 | | |
| 675,000 (4) | | | Nederlandse
Waterschapsbank, 1.870%,
02/12/2020 | | | | | 673,608 | | | | | | 0.0 | | |
| 200,000 (4) | | | Oversea-Chinese Banking
Corp., Ltd., 1.900%,
02/11/2020 | | | | | 199,569 | | | | | | 0.0 | | |
| 250,000 (4) | | | Sheffield Receivables
Company LLC, 2.000%,
03/16/2020 | | | | | 249,021 | | | | | | 0.0 | | |
| 1,276,000 (4) | | | Societe Generale, 1.970%,
01/09/2020 | | | | | 1,275,426 | | | | | | 0.0 | | |
| | | | Total Commercial Paper
(Cost $7,789,368) | | | | | 7,789,368 | | | | | | 0.1 | | |
| | | | | |
| | | | Floating Rate Notes: 0.2% | |
| 950,000 (4) | | | Australia & New Zealand
Banking Group Ltd., 1.940%,
05/20/2020 | | | | | 949,958 | | | | | | 0.0 | | |
| 825,000 (4) | | | Bank of America Corp.,
1.910%, 05/07/2020 | | | | | 825,000 | | | | | | 0.0 | | |
| 675,000 (4) | | | Bedford Row Funding,
1.960%, 05/18/2020 | | | | | 675,114 | | | | | | 0.0 | | |
| 950,000 (4) | | | BNP Paribas, 1.950%,
05/14/2020 | | | | | 950,071 | | | | | | 0.0 | | |
| 1,175,000 (4) | | | Commonwealth Bank of
Australia, 1.920%,
01/24/2020 | | | | | 1,175,150 | | | | | | 0.1 | | |
| 850,000 (4) | | | Commonwealth Bank of
Australia, 1.940%,
06/10/2020 | | | | | 849,998 | | | | | | 0.0 | | |
| 600,000 (4) | | | Coöperatieve Rabobank
U.A., 1.980%, 04/20/2020 | | | | | 600,168 | | | | | | 0.0 | | |
| 1,150,000 (4) | | | Credit Suisse Group AG,
1.890%, 04/17/2020 | | | | | 1,150,515 | | | | | | 0.0 | | |
| 850,000 (4) | | | Mitsubishi UFJ Financial
Group, Inc., 1.970%,
03/18/2020 | | | | | 850,162 | | | | | | 0.0 | | |
Principal
Amount† | | | Value | | | Percentage
of Net
Assets | |
| SHORT-TERM INVESTMENTS: (continued) | |
| | | | Floating Rate Notes (continued) | |
| 900,000 (4) | | | Mitsubishi UFJ Financial
Group, Inc., 1.980%,
05/26/2020 | | | | $ | 900,069 | | | | | | 0.0 | | |
| 500,000 (4) | | | Mizuho Financial Group Inc.,
1.970%, 05/06/2020 | | | | | 500,025 | | | | | | 0.0 | | |
| 1,275,000 (4) | | | Mizuho Financial Group Inc.,
2.010%, 05/22/2020 | | | | | 1,275,060 | | | | | | 0.1 | | |
| 925,000 (4) | | | National Bank Of Canada,
1.990%, 05/01/2020 | | | | | 925,119 | | | | | | 0.0 | | |
| 275,000 (4) | | | Royal Bank Of Canada,
1.860%, 04/29/2020 | | | | | 275,017 | | | | | | 0.0 | | |
| 925,000 (4) | | | Skandinaviska Enskilda
Banken AB, 1.950%,
05/11/2020 | | | | | 925,030 | | | | | | 0.0 | | |
| 1,375,000 (4) | | | The Sumitomo Mitsui
Financial Group, 1.960%,
01/22/2020 | | | | | 1,375,097 | | | | | | 0.0 | | |
| 400,000 (4) | | | The Sumitomo Mitsui
Financial Group, 1.970%,
05/12/2020 | | | | | 399,933 | | | | | | 0.0 | | |
| 350,000 (4) | | | Toronto-Dominion Bank,
1.850%, 02/13/2020 | | | | | 350,010 | | | | | | 0.0 | | |
| 500,000 (4) | | | Toyota Motor Corp., 2.020%,
01/10/2020 | | | | | 500,025 | ��� | | | | | 0.0 | | |
| 600,000 (4) | | | Westpac Banking Corp,
1.830%, 02/10/2020 | | | | | 600,048 | | | | | | 0.0 | | |
| | | | Total Floating Rate Notes
(Cost $16,051,569) | | | | | 16,051,569 | | | | | | 0.2 | | |
| | | | | |
| | | | Repurchase Agreements: 0.7% | |
| 18,664,895 (4) | | | Bank of Nova Scotia,
Repurchase Agreement
dated 12/31/19, 1.57%, due
01/02/20 (Repurchase
Amount $18,666,501,
collateralized by various U.S.
Government Agency
Obligations, 2.500%-6.500%,
Market Value plus accrued
interest $19,039,853, due
09/01/24-11/01/49) | | | | | 18,664,895 | | | | | | 0.3 | | |
See Accompanying Notes to Financial Statements
SUMMARY PORTFOLIO OF INVESTMENTS
| Voya U.S. Stock Index Portfolio | as of December 31, 2019 (continued) |
Principal
Amount† | | | Value | | | Percentage
of Net
Assets | |
| SHORT-TERM INVESTMENTS: (continued) | |
| | | | Repurchase Agreements (continued) | |
| 3,093,978 (4) | | | Citadel Securities LLC,
Repurchase Agreement
dated 12/31/19, 1.60%, due
01/02/20 (Repurchase
Amount $3,094,249,
collateralized by various U.S.
Government Securities,
0.000%-8.500%, Market
Value plus accrued interest
$3,156,138, due
01/15/20-11/15/48) | | | | $ | 3,093,978 | | | | | | 0.0 | | |
| 18,664,895 (4) | | | Citigroup, Inc., Repurchase
Agreement dated 12/31/19,
1.57%, due 01/02/20
(Repurchase Amount
$18,666,501, collateralized
by various U.S. Government/
U.S. Government Agency
Obligations, 0.000%-9.000%,
Market Value plus accrued
interest $19,038,193, due
02/13/20-09/20/69) | | | | | 18,664,895 | | | | | | 0.3 | | |
| 5,948,105 (4) | | | State of Wisconsin
Investment Board,
Repurchase Agreement
dated 12/31/19, 1.75%, due
01/02/20 (Repurchase
Amount $5,948,675,
collateralized by various U.S.
Government Securities,
0.125%-3.875%, Market
Value plus accrued interest
$6,067,231, due
04/15/21-02/15/47) | | | | | 5,948,105 | | | | | | 0.1 | | |
| | | | Total Repurchase
Agreements
(Cost $46,371,873) | | | | | 46,371,873 | | | | | | 0.7 | | |
| | | | | |
| | | | Certificates of Deposit: 0.1% | |
| 1,025,000 (4) | | | Deutscher Sparkassen- und
Giroverband, 1.860%,
02/20/2020 | | | | | 1,025,327 | | | | | | 0.0 | | |
| 400,000 (4) | | | Dz Bank Ag Deutsche
Zentral-
Genossenschaftsbank,
1.830%, 02/13/2020 | | | | | 399,968 | | | | | | 0.0 | | |
| 400,000 (4) | | | Landesbank
Baden-Wurttemberg,
1.830%, 01/14/2020 | | | | | 400,016 | | | | | | 0.0 | | |
Principal
Amount† | | | Value | | | Percentage
of Net
Assets | |
| SHORT-TERM INVESTMENTS: (continued) | |
| | | | Certificates of Deposit (continued) | |
| 900,000 (4) | | | Landesbank
Baden-Wurttemberg,
1.830%, 01/16/2020 | | | | $ | 900,032 | | | | | | 0.1 | | |
| 975,000 (4) | | | The Norinchukin Bank,
1.900%, 03/05/2020 | | | | | 975,082 | | | | | | 0.0 | | |
| 875,000 (4) | | | Toronto-Dominion Bank,
1.850%, 03/18/2020 | | | | | 875,132 | | | | | | 0.0 | | |
| | | | Total Certificates of Deposit
(Cost $4,575,557) | | | | | 4,575,557 | | | | | | 0.1 | | |
| |
| Shares | | | Value | | | Percentage
of Net
Assets | |
| | | | Mutual Funds (4): 1.3% | |
| 1,940,000 (4) | | | Fidelity Investments Money
Market Government
Portfolio - Institutional
Class, 1.520% | | | | | 1,940,000 | | | | | | 0.0 | | |
| 89,372,000 (4)(5) | | | Goldman Sachs Financial
Square Government Fund -
Institutional Shares, 1.500% | | | | | 89,372,000 | | | | | | 1.3 | | |
| 2,300,000 (4)(5) | | | Invesco Short-Term
Investments Trust
Government & Agency
Portfolio - Institutional
Class, 1.510% | | | | | 2,300,000 | | | | | | 0.0 | | |
| | | | Total Mutual Funds
(Cost $93,612,000) | | | | | 93,612,000 | | | | | | 1.3 | | |
| | | | Total Short-Term
Investments
(Cost $168,400,367) | | | | | 168,400,367 | | | | | | 2.4 | | |
| | | | Total Investments in
Securities
(Cost $4,436,878,609) | | | | $ | 7,073,794,794 | | | | | | 101.1 | | |
| | | | Liabilities in Excess of
Other Assets | | | | | (77,737,403) | | | | | | (1.1) | | |
| | | | Net Assets | | | | $ | 6,996,057,391 | | | | | | 100.0 | | |
“Other Securities” represents issues not identified as the top 50 holdings in terms of market value and issues or issuers not exceeding 1% of net assets individually or in aggregate respectively as of December 31, 2019.
The following footnotes apply to either the individual securities noted or one or more of the securities aggregated and listed as a single line item.
†
Unless otherwise indicated, principal amount is shown in USD.
(1)
Non-income producing security.
(2)
The grouping contains securities on loan.
See Accompanying Notes to Financial Statements
SUMMARY PORTFOLIO OF INVESTMENTS
| Voya U.S. Stock Index Portfolio | as of December 31, 2019 (continued) |
(3)
The grouping contains non-income producing securities.
(4)
All or a portion of the security represents securities purchased with cash collateral received for securities on loan.
(5)
Rate shown is the 7-day yield as of December 31, 2019.
Fair Value Measurements^
The following is a summary of the fair valuations according to the inputs used as of December 31, 2019 in valuing the assets and liabilities:
| | | | Quoted Prices
in Active Markets
for Identical
Investments
(Level 1) | | | Significant
Other
Observable
Inputs
(Level 2) | | | Significant
Unobservable
Inputs
(Level 3) | | | Fair Value
at
December 31, 2019 | |
| Asset Table | | | | | | | | | | | | | | | | | | | | | | | | | |
| Investments, at fair value | | | | | | | | | | | | | | | | | | | | | | | | | |
| Common Stock* | | | | $ | 6,905,394,427 | | | | | $ | — | | | | | $ | — | | | | | $ | 6,905,394,427 | | |
| Short-Term Investments | | | | | 93,612,000 | | | | | | 74,788,367 | | | | | | — | | | | | | 168,400,367 | | |
| Total Investments, at fair value | | | | $ | 6,999,006,427 | | | | | $ | 74,788,367 | | | | | $ | — | | | | | $ | 7,073,794,794 | | |
| Other Financial Instruments+ | | | | | | | | | | | | | | | | | | | | | | | | | |
| Futures | | | | | 1,587,850 | | | | | | — | | | | | | — | | | | | | 1,587,850 | | |
| Total Assets | | | | $ | 7,000,594,277 | | | | | $ | 74,788,367 | | | | | $ | — | | | | | $ | 7,075,382,644 | | |
^
See Note 2, “Significant Accounting Policies” in the Notes to Financial Statements for additional information.
+
Other Financial Instruments may include open forward foreign currency contracts, futures, centrally cleared swaps, OTC swaps and written options. Forward foreign currency contracts, futures and centrally cleared swaps are valued at the unrealized gain (loss) on the instrument. OTC swaps and written options are valued at the fair value of the instrument.
*
For further breakdown of Common Stock by sector, please refer to the Portfolio of Investments.
At December 31, 2019, the following futures contracts were outstanding for Voya U.S. Stock Index Portfolio:
| Description | | | Number
of Contracts | | | Expiration
Date | | | Notional
Value | | | Unrealized
Appreciation/
(Depreciation) | |
| Long Contracts: | | | | | | | | | | | | | | | | | | | | | | | | | |
| S&P 500® E-Mini | | | | | 617 | | | | | | 03/20/20 | | | | | $ | 99,679,435 | | | | | $ | 1,587,850 | | |
| | | | | | | | | | | | | | | | | $ | 99,679,435 | | | | | $ | 1,587,850 | | |
A summary of derivative instruments by primary risk exposure is outlined in the following tables.
The fair value of derivative instruments as of December 31, 2019 was as follows:
| Derivatives not accounted for as hedging instruments | | | Location on Statement
of Assets and Liabilities | | | Fair Value | |
| Asset Derivatives | | | | | | | | | | |
| Equity contracts | | | Net Assets — Unrealized appreciation* | | | | $ | 1,587,850 | | |
| Total Asset Derivatives | | | | | | | $ | 1,587,850 | | |
*
Includes cumulative appreciation/depreciation of futures contracts as reported in the table within the Portfolio of Investments.
The effect of derivative instruments on the Portfolio’s Statement of Operations for the year ended December 31, 2019 was as follows:
| | | | Amount of Realized Gain or (Loss)
on Derivatives Recognized in Income | |
| Derivatives not accounted for as hedging instruments | | | Futures | |
| Equity contracts | | | | $ | 13,816,430 | | |
| Total | | | | $ | 13,816,430 | | |
| |
See Accompanying Notes to Financial Statements
SUMMARY PORTFOLIO OF INVESTMENTS
| Voya U.S. Stock Index Portfolio | as of December 31, 2019 (continued) |
| | | | Change in Unrealized Appreciation or (Depreciation)
on Derivatives Recognized in Income | |
| Derivatives not accounted for as hedging instruments | | | Futures | |
| Equity contracts | | | | $ | 4,136,798 | | |
| Total | | | | $ | 4,136,798 | | |
At December 31, 2019, the aggregate cost of securities and other investments and the composition of unrealized appreciation and depreciation of securities and other investments at year end were:
| | Cost for federal income tax purposes was $4,459,031,288. | | |
| | Net unrealized appreciation consisted of: | | |
| | Gross Unrealized Appreciation | | | | $ | 2,770,425,217 | | |
| | Gross Unrealized Depreciation | | | | | (154,073,861) | | |
| | Net Unrealized Appreciation | | | | $ | 2,616,351,356 | | |
See Accompanying Notes to Financial Statements
PORTFOLIO OF INVESTMENTS
| VY® Clarion Real Estate Portfolio | as of December 31, 2019 |
| Shares | | | Value | | | Percentage
of Net
Assets | |
| COMMON STOCK: 98.8% | |
| | | | Diversified REITs: 5.9% | |
| 204,920 | | | STORE Capital Corp. | | | | $ | 7,631,221 | | | | | | 2.3 | | |
| 1,295,226 | | | VEREIT, Inc. | | | | | 11,967,888 | | | | | | 3.6 | | |
| | | | | | | | | 19,599,109 | | | | | | 5.9 | | |
| | | | | |
| | | | Health Care REITs: 10.5% | |
| 356,989 (1) | | | Healthcare Trust of
America, Inc. | | | | | 10,809,627 | | | | | | 3.2 | | |
| 400,303 | | | Healthpeak Properties, Inc. | | | | | 13,798,444 | | | | | | 4.1 | | |
| 252,097 | | | Medical Properties Trust,
Inc. | | | | | 5,321,768 | | | | | | 1.6 | | |
| 64,574 | | | Welltower, Inc. | | | | | 5,280,862 | | | | | | 1.6 | | |
| | | | | | | | | 35,210,701 | | | | | | 10.5 | | |
| | | | | |
| | | | Hotel & Resort REITs: 5.9% | |
| 429,034 | | | Host Hotels & Resorts, Inc. | | | | | 7,958,581 | | | | | | 2.4 | | |
| 191,663 | | | MGM Growth Properties
LLC | | | | | 5,935,803 | | | | | | 1.8 | | |
| 25,596 | | | Ryman Hospitality
Properties | | | | | 2,218,149 | | | | | | 0.6 | | |
| 258,783 | | | Sunstone Hotel Investors,
Inc. | | | | | 3,602,259 | | | | | | 1.1 | | |
| | | | | | | | | 19,714,792 | | | | | | 5.9 | | |
| | | | | |
| | | | Industrial REITs: 12.1% | |
| 60,554 | | | Americold Realty Trust | | | | | 2,123,023 | | | | | | 0.6 | | |
| 273,685 | | | Duke Realty Corp. | | | | | 9,488,659 | | | | | | 2.9 | | |
| 271,020 | | | ProLogis, Inc. | | | | | 24,158,723 | | | | | | 7.2 | | |
| 148,187 | | | STAG Industrial, Inc. | | | | | 4,678,264 | | | | | | 1.4 | | |
| | | | | | | | | 40,448,669 | | | | | | 12.1 | | |
| | | | | |
| | | | IT Consulting & Other Services: 0.8% | |
| 30,157 (2) | | | InterXion Holding NV | | | | | 2,527,458 | | | | | | 0.8 | | |
| | | | | |
| | | | Office REITs: 14.7% | |
| 65,527 | | | Alexandria Real Estate
Equities, Inc. | | | | | 10,587,853 | | | | | | 3.2 | | |
| 280,275 | | | Brandywine Realty Trust | | | | | 4,414,331 | | | | | | 1.3 | | |
| 217,644 | | | Columbia Property Trust,
Inc. | | | | | 4,550,936 | | | | | | 1.3 | | |
| 188,244 | | | Cousins Properties, Inc. | | | | | 7,755,653 | | | | | | 2.3 | | |
| 263,396 | | | Hudson Pacific Properties,
Inc. | | | | | 9,916,859 | | | | | | 3.0 | | |
| 252,028 | | | Piedmont Office Realty
Trust, Inc. | | | | | 5,605,103 | | | | | | 1.7 | | |
| 96,460 | | | Vornado Realty Trust | | | | | 6,414,590 | | | | | | 1.9 | | |
| | | | | | | | | 49,245,325 | | | | | | 14.7 | | |
| Shares | | | Value | | | Percentage
of Net
Assets | |
| COMMON STOCK: (continued) | |
| | | | Residential REITs: 18.4% | |
| 142,308 | | | American Campus
Communities, Inc. | | | | $ | 6,692,745 | | | | | | 2.0 | | |
| 89,269 | | | Camden Property Trust | | | | | 9,471,441 | | | | | | 2.8 | | |
| 224,591 | | | Equity Residential | | | | | 18,173,904 | | | | | | 5.4 | | |
| 177,910 | | | Front Yard Residential
Corp. | | | | | 2,195,409 | | | | | | 0.7 | | |
| 420,451 | | | Invitation Homes, Inc. | | | | | 12,600,916 | | | | | | 3.8 | | |
| 51,985 | | | Mid-America Apartment
Communities, Inc. | | | | | 6,854,742 | | | | | | 2.1 | | |
| 35,696 | | | Sun Communities, Inc. | | | | | 5,357,970 | | | | | | 1.6 | | |
| | | | | | | | | 61,347,127 | | | | | | 18.4 | | |
| | | | | |
| | | | Retail REITs: 11.4% | |
| 389,068 | | | Brixmor Property Group,
Inc. | | | | | 8,407,760 | | | | | | 2.5 | | |
| 40,011 | | | Regency Centers Corp. | | | | | 2,524,294 | | | | | | 0.8 | | |
| 330,871 | | | Retail Properties of
America, Inc. | | | | | 4,433,671 | | | | | | 1.3 | | |
| 80,583 | | | Simon Property Group, Inc. | | | | | 12,003,644 | | | | | | 3.6 | | |
| 62,628 | | | Spirit Realty Capital, Inc. | | | | | 3,080,045 | | | | | | 0.9 | | |
| 117,715 | | | Taubman Centers, Inc. | | | | | 3,659,759 | | | | | | 1.1 | | |
| 214,000 | | | Urban Edge Properties | | | | | 4,104,520 | | | | | | 1.2 | | |
| | | | | | | | | 38,213,693 | | | | | | 11.4 | | |
| | | | | |
| | | | Specialized REITs: 19.1% | |
| 42,046 | | | Crown Castle International
Corp. | | | | | 5,976,839 | | | | | | 1.8 | | |
| 323,239 | | | CubeSmart | | | | | 10,175,564 | | | | | | 3.1 | | |
| 90,538 | | | CyrusOne, Inc. | | | | | 5,923,901 | | | | | | 1.8 | | |
| 30,771 | | | Equinix, Inc. | | | | | 17,961,033 | | | | | | 5.4 | | |
| 25,566 | | | Extra Space Storage, Inc. | | | | | 2,700,281 | | | | | | 0.8 | | |
| 46,300 | | | Life Storage, Inc. | | | | | 5,013,364 | | | | | | 1.5 | | |
| 94,022 | | | QTS Realty Trust, Inc. | | | | | 5,102,574 | | | | | | 1.5 | | |
| 423,308 | | | VICI Properties, Inc. | | | | | 10,815,519 | | | | | | 3.2 | | |
| | | | | | | | | 63,669,075 | | | | | | 19.1 | | |
| | | | Total Common Stock
(Cost $293,950,748) | | | | | 329,975,949 | | | | | | 98.8 | | |
| |
See Accompanying Notes to Financial Statements
PORTFOLIO OF INVESTMENTS
| VY® Clarion Real Estate Portfolio | as of December 31, 2019 (continued) |
Principal
Amount† | | | Value | | | Percentage
of Net
Assets | |
| SHORT-TERM INVESTMENTS: 2.2% | |
| | | | Repurchase Agreements: 1.7% | |
| 1,280,279 (3) | | | Bank of Montreal,
Repurchase Agreement
dated 12/31/19, 1.57%,
due 01/02/20 (Repurchase
Amount $1,280,389,
collateralized by various
U.S. Government Agency
Obligations,
2.500%-5.000%,
Market Value plus accrued
interest $1,305,885, due
04/20/49-12/01/49) | | | | $ | 1,280,279 | | | | | | 0.4 | | |
| 379,314 (3) | | | Citadel Securities LLC,
Repurchase Agreement
dated 12/31/19, 1.60%,
due 01/02/20 (Repurchase
Amount $379,347,
collateralized by various
U.S. Government
Securities,
0.000%-8.500%, Market
Value plus accrued interest
$386,935, due
01/15/20-11/15/48) | | | | | 379,314 | | | | | | 0.1 | | |
| 1,280,279 (3) | | | Citigroup, Inc., Repurchase
Agreement dated 12/31/19,
1.57%, due 01/02/20
(Repurchase Amount
$1,280,389, collateralized
by various U.S.
Government/U.S.
Government Agency
Obligations,
0.000%-9.000%, Market
Value plus accrued interest
$1,305,885, due
02/13/20-09/20/69) | | | | | 1,280,279 | | | | | | 0.4 | | |
| 1,280,279 (3) | | | HSBC Securities USA,
Repurchase Agreement
dated 12/31/19, 1.57%,
due 01/02/20 (Repurchase
Amount $1,280,389,
collateralized by various
U.S. Government Agency
Obligations,
3.000%-4.000%, Market
Value plus accrued interest
$1,305,885, due
07/20/47-06/20/48) | | | | | 1,280,279 | | | | | | 0.4 | | |
Principal
Amount† | | | Value | | | Percentage
of Net
Assets | |
| SHORT-TERM INVESTMENTS: (continued) | |
| | | | Repurchase Agreements | |
| 1,280,279 (3) | | | Jefferies LLC, Repurchase
Agreement dated 12/31/19,
1.58%, due 01/02/20
(Repurchase Amount
$1,280,390, collateralized
by various U.S.
Government Securities,
0.000%-2.875%, Market
Value plus accrued interest
$1,305,885, due
01/28/20-05/15/27) | | | | $ | 1,280,279 | | | | | | 0.4 | | |
| | | | Total Repurchase
Agreements
(Cost $5,500,430) | | | | | 5,500,430 | | | | | | 1.7 | | |
| |
| Shares | | | Value | | | Percentage
of Net
Assets | |
| | | | Mutual Funds: 0.5% | |
| 1,762,979 (4) | | | BlackRock Liquidity Funds,
FedFund, Institutional
Class, 1.520%
(Cost $1,762,979) | | | | | 1,762,979 | | | | | | 0.5 | | |
| | | | Total Short-Term
Investments
(Cost $7,263,409) | | | | | 7,263,409 | | | | | | 2.2 | | |
| | | | Total Investments in
Securities
(Cost $301,214,157) | | | | $ | 337,239,358 | | | | | | 101.0 | | |
| | | | Liabilities in Excess of
Other Assets | | | | | (3,214,013) | | | | | | (1.0) | | |
| | | | Net Assets | | | | $ | 334,025,345 | | | | | | 100.0 | | |
†
Unless otherwise indicated, principal amount is shown in USD.
(1)
Security, or a portion of the security, is on loan.
(2)
Non-income producing security.
(3)
All or a portion of the security represents securities purchased with cash collateral received for securities on loan.
(4)
Rate shown is the 7-day yield as of December 31, 2019.
See Accompanying Notes to Financial Statements
PORTFOLIO OF INVESTMENTS
| VY® Clarion Real Estate Portfolio | as of December 31, 2019 (continued) |
Fair Value Measurements^
The following is a summary of the fair valuations according to the inputs used as of December 31, 2019 in valuing the assets and liabilities:
| | | | Quoted Prices
in Active Markets
for Identical
Investments
(Level 1) | | | Significant
Other
Observable
Inputs
(Level 2) | | | Significant
Unobservable
Inputs
(Level 3) | | | Fair Value
at
December 31, 2019 | |
| Asset Table | | | | | | | | | | | | | | | | | | | | | | | | | |
| Investments, at fair value | | | | | | | | | | | | | | | | | | | | | | | | | |
| Common Stock* | | | | $ | 329,975,949 | | | | | $ | — | | | | | $ | — | | | | | $ | 329,975,949 | | |
| Short-Term Investments | | | | | 1,762,979 | | | | | | 5,500,430 | | | | | | — | | | | | | 7,263,409 | | |
| Total Investments, at fair value | | | | $ | 331,738,928 | | | | | $ | 5,500,430 | | | | | $ | — | | | | | $ | 337,239,358 | | |
^
See Note 2, “Significant Accounting Policies” in the Notes to Financial Statements for additional information.
*
For further breakdown of Common Stock by sector, please refer to the Portfolio of Investments.
At December 31, 2019, the aggregate cost of securities and other investments and the composition of unrealized appreciation and depreciation of securities and other investments at year end were:
| | Cost for federal income tax purposes was $305,827,143. | | | | | | | |
| | Net unrealized appreciation consisted of: | | |
| | Gross Unrealized Appreciation | | | | $ | 40,842,678 | | |
| | Gross Unrealized Depreciation | | | | | (9,430,463) | | |
| | Net Unrealized Appreciation | | | | $ | 31,412,215 | | |
See Accompanying Notes to Financial Statements
| VY® JPMorgan Small Cap | SUMMARY PORTFOLIO OF INVESTMENTS |
| Core Equity Portfolio | as of December 31, 2019 |
| Shares | | | Value | | | Percentage
of Net
Assets | |
| COMMON STOCK: 96.6% | |
| | | | Communication Services: 2.2% | |
| 101,970 | | | Cinemark Holdings, Inc. | | | | $ | 3,451,685 | | | | | | 0.7 | | |
| 467,342 (1) | | | Other Securities | | | | | 8,367,338 | | | | | | 1.5 | | |
| | | | | | | | | 11,819,023 | | | | | | 2.2 | | |
| | | | Consumer Discretionary: 9.6% | |
| 76,137 | | | Brunswick Corp. | | | | | 4,566,697 | | | | | | 0.8 | | |
| 17,650 (2) | | | Deckers Outdoor Corp. | | | | | 2,980,379 | | | | | | 0.5 | | |
| 36,913 | | | LCI Industries | | | | | 3,954,490 | | | | | | 0.7 | | |
| 34,918 | | | Pool Corp. | | | | | 7,415,885 | | | | | | 1.4 | | |
| 95,600 | | | Rent-A-Center, Inc. | | | | | 2,757,104 | | | | | | 0.5 | | |
| 1,249,243 (1)(3) | | | Other Securities | | | | | 31,157,734 | | | | | | 5.7 | | |
| | | | | | | | | 52,832,289 | | | | | | 9.6 | | |
| | | | Consumer Staples: 3.3% | |
| 178,961 (2) | | | Performance Food Group
Co. | | | | | 9,212,912 | | | | | | 1.7 | | |
| 341,870 (1) | | | Other Securities | | | | | 8,993,035 | | | | | | 1.6 | | |
| | | | | | | | | 18,205,947 | | | | | | 3.3 | | |
| | | | Energy: 2.2% | |
| 1,557,898 (1)(3) | | | Other Securities | | | | | 12,281,539 | | | | | | 2.2 | | |
| | | | | |
| | | | Financials: 17.7% | |
| 80,009 | | | BankUnited, Inc. | | | | | 2,925,129 | | | | | | 0.5 | | |
| 51,520 (4) | | | Commerce Bancshares,
Inc. | | | | | 3,500,269 | | | | | | 0.6 | | |
| 52,900 | | | Essent Group Ltd. | | | | | 2,750,271 | | | | | | 0.5 | | |
| 122,706 | | | First Hawaiian, Inc. | | | | | 3,540,068 | | | | | | 0.7 | | |
| 306,204 | | | First Horizon National
Corp. | | | | | 5,070,738 | | | | | | 0.9 | | |
| 108,113 (2) | | | Focus Financial Partners,
Inc. | | | | | 3,186,090 | | | | | | 0.6 | | |
| 52,007 | | | Iberiabank Corp. | | | | | 3,891,684 | | | | | | 0.7 | | |
| 35,103 | | | Kinsale Capital Group, Inc. | | | | | 3,568,571 | | | | | | 0.7 | | |
| 72,262 | | | Lazard Ltd. | | | | | 2,887,589 | | | | | | 0.5 | | |
| 37,544 | | | RLI Corp. | | | | | 3,379,711 | | | | | | 0.6 | | |
| 64,068 | | | Western Alliance Bancorp. | | | | | 3,651,876 | | | | | | 0.7 | | |
| 63,842 | | | Wintrust Financial Corp. | | | | | 4,526,398 | | | | | | 0.8 | | |
| 1,965,066 (1)(3) | | | Other Securities | | | | | 53,920,308 | | | | | | 9.9 | | |
| | | | | | | | | 96,798,702 | | | | | | 17.7 | | |
| | | | Health Care: 14.3% | |
| 89,934 (2) | | | Catalent, Inc. | | | | | 5,063,284 | | | | | | 0.9 | | |
| 72,116 | | | Encompass Health Corp. | | | | | 4,995,475 | | | | | | 0.9 | | |
| 40,533 (2) | | | Molina Healthcare, Inc. | | | | | 5,499,923 | | | | | | 1.0 | | |
| 72,800 (2) | | | Tenet Healthcare Corp. | | | | | 2,768,584 | | | | | | 0.5 | | |
| 28,996 | | | West Pharmaceutical
Services, Inc. | | | | | 4,358,969 | | | | | | 0.8 | | |
| 2,821,945 (1)(3) | | | Other Securities | | | | | 55,983,676 | | | | | | 10.2 | | |
| | | | | | | | | 78,669,911 | | | | | | 14.3 | | |
| | | | Industrials: 20.0% | |
| 76,295 | | | Altra Industrial Motion
Corp. | | | | | 2,762,642 | | | | | | 0.5 | | |
| 52,663 | | | Applied Industrial
Technologies, Inc. | | | | | 3,512,096 | | | | | | 0.6 | | |
| Shares | | | Value | | | Percentage
of Net
Assets | |
| COMMON STOCK: (continued) | |
| | | | Industrials (continued) | |
| 66,497 | | | Brady Corp. | | | | $ | 3,807,618 | | | | | | 0.7 | | |
| 32,800 | | | EMCOR Group, Inc. | | | | | 2,830,640 | | | | | | 0.5 | | |
| 47,510 | | | Fortune Brands Home &
Security, Inc. | | | | | 3,104,303 | | | | | | 0.6 | | |
| 35,399 (2) | | | Generac Holdings, Inc. | | | | | 3,560,785 | | | | | | 0.6 | | |
| 69,712 (2) | | | IAA, Inc. | | | | | 3,280,647 | | | | | | 0.6 | | |
| 78,577 | | | Knight-Swift Transportation
Holdings, Inc. | | | | | 2,816,200 | | | | | | 0.5 | | |
| 45,618 | | | Lincoln Electric Holdings,
Inc. | | | | | 4,412,629 | | | | | | 0.8 | | |
| 34,194 | | | MSA Safety, Inc. | | | | | 4,320,754 | | | | | | 0.8 | | |
| 24,545 (2) | | | RBC Bearings, Inc. | | | | | 3,886,455 | | | | | | 0.7 | | |
| 95,723 | | | Toro Co. | | | | | 7,626,251 | | | | | | 1.4 | | |
| 192,946 (2) | | | Willscot Corp. | | | | | 3,567,572 | | | | | | 0.7 | | |
| 32,645 | | | Woodward, Inc. | | | | | 3,866,474 | | | | | | 0.7 | | |
| 2,103,931 (1)(3) | | | Other Securities | | | | | 56,186,253 | | | | | | 10.3 | | |
| | | | | | | | | 109,541,319 | | | | | | 20.0 | | |
| | | | Information Technology: 12.2% | |
| 23,058 (2) | | | Aspen Technology, Inc. | | | | | 2,788,404 | | | | | | 0.5 | | |
| 26,726 | | | Cabot Microelectronics
Corp. | | | | | 3,857,096 | | | | | | 0.7 | | |
| 64,859 (2) | | | Cornerstone OnDemand,
Inc. | | | | | 3,797,494 | | | | | | 0.7 | | |
| 41,912 (2) | | | Q2 Holdings, Inc. | | | | | 3,398,225 | | | | | | 0.6 | | |
| 1,996,276 (1)(3) | | | Other Securities | | | | | 52,912,674 | | | | | | 9.7 | | |
| | | | | | | | | 66,753,893 | | | | | | 12.2 | | |
| | | | Materials: 5.4% | |
| 57,533 | | | Aptargroup, Inc. | | | | | 6,651,965 | | | | | | 1.2 | | |
| 20,029 | | | Quaker Chemical Corp. | | | | | 3,295,171 | | | | | | 0.6 | | |
| 731,887 (1) | | | Other Securities | | | | | 19,695,863 | | | | | | 3.6 | | |
| | | | | | | | | 29,642,999 | | | | | | 5.4 | | |
| | | | Real Estate: 6.8% | |
| 95,131 | | | CubeSmart | | | | | 2,994,724 | | | | | | 0.6 | | |
| 154,611 (2) | | | Cushman & Wakefield PLC | | | | | 3,160,249 | | | | | | 0.6 | | |
| 38,478 | | | EastGroup Properties, Inc. | | | | | 5,104,876 | | | | | | 0.9 | | |
| 71,003 | | | National Retail Properties,
Inc. | | | | | 3,807,181 | | | | | | 0.7 | | |
| 1,027,302 (3) | | | Other Securities | | | | | 21,976,787 | | | | | | 4.0 | | |
| | | | | | | | | 37,043,817 | | | | | | 6.8 | | |
| | | | Utilities: 2.9% | |
| 53,512 | | | NorthWestern Corp. | | | | | 3,835,205 | | | | | | 0.7 | | |
| 96,991 | | | Portland General Electric
Co. | | | | | 5,411,128 | | | | | | 1.0 | | |
| 316,544 (1) | | | Other Securities | | | | | 6,642,823 | | | | | | 1.2 | | |
| | | | | | | | | 15,889,156 | | | | | | 2.9 | | |
| | | | Total Common Stock
(Cost $444,089,002) | | | | | 529,478,595 | | | | | | 96.6 | | |
| |
See Accompanying Notes to Financial Statements
| VY® JPMorgan Small Cap | SUMMARY PORTFOLIO OF INVESTMENTS |
| Core Equity Portfolio | as of December 31, 2019 (continued) |
Principal
Amount† | | | Value | | | Percentage
of Net
Assets | |
| SHORT-TERM INVESTMENTS: 6.5% | |
| | | | Repurchase Agreements: 2.8% | |
| 3,813,206 (5) | | | Cantor Fitzgerald
Securities, Repurchase
Agreement dated 12/31/19,
1.58%, due 01/02/20
(Repurchase Amount
$3,813,536, collateralized
by various U.S.
Government/U.S.
Government Agency
Obligations,
0.000%-8.500%, Market
Value plus accrued interest
$3,889,470, due
01/25/20-10/15/60) | | | | $ | 3,813,206 | | | | | | 0.7 | | |
| 3,552,930 (5) | | | Citadel Securities LLC,
Repurchase Agreement
dated 12/31/19, 1.60%,
due 01/02/20 (Repurchase
Amount $3,553,241,
collateralized by various
U.S. Government
Securities,
0.000%-8.500%, Market
Value plus accrued interest
$3,624,311, due
01/15/20-11/15/48) | | | | | 3,552,930 | | | | | | 0.7 | | |
| 3,813,206 (5) | | | Citigroup, Inc., Repurchase
Agreement dated 12/31/19,
1.57%, due 01/02/20
(Repurchase Amount
$3,813,534, collateralized
by various U.S.
Government/U.S.
Government Agency
Obligations,
0.000%-9.000%, Market
Value plus accrued interest
$3,889,470, due
02/13/20-09/20/69) | | | | | 3,813,206 | | | | | | 0.7 | | |
| 3,813,206 (5) | | | RBC Dominion Securities
Inc., Repurchase
Agreement dated 12/31/19,
1.57%, due 01/02/20
(Repurchase Amount
$3,813,534, collateralized
by various U.S.
Government/U.S.
Government Agency
Obligations,
0.000%-6.500%, Market
Value plus accrued interest
$3,889,470, due
06/30/21-12/01/49) | | | | | 3,813,206 | | | | | | 0.7 | | |
Principal
Amount† | | | Value | | | Percentage
of Net
Assets | |
| SHORT-TERM INVESTMENTS: (continued) | |
| | | | Repurchase Agreements (continued) | |
| | | | Total Repurchase
Agreements
(Cost $14,992,548) | | | | $ | 14,992,548 | | | | | | 2.8 | | |
| |
| Shares | | | Value | | | Percentage
of Net
Assets | |
| | | | Mutual Funds: 3.7% | |
| 19,015,743 (6) | | | BlackRock Liquidity Funds,
FedFund, Institutional
Class, 1.520% | | | | | 19,015,743 | | | | | | 3.5 | | |
| 130,000 (5)(6) | | | Goldman Sachs Financial
Square Government Fund -
Institutional Shares,
1.500% | | | | | 130,000 | | | | | | 0.0 | | |
| 640,000 (5)(6) | | | Invesco Short-Term
Investments Trust
Government & Agency
Portfolio - Institutional
Class, 1.510% | | | | | 640,000 | | | | | | 0.1 | | |
| 620,000 (5)(6) | | | Morgan Stanley
Institutional Liquidity
Funds - Government
Portfolio (Institutional
Share Class), 1.510% | | | | | 620,000 | | | | | | 0.1 | | |
| | | | Total Mutual Funds
(Cost $20,405,743) | | | | | 20,405,743 | | | | | | 3.7 | | |
| | | | Total Short-Term
Investments
(Cost $35,398,291) | | | | | 35,398,291 | | | | | | 6.5 | | |
| | | | Total Investments in
Securities
(Cost $479,487,293) | | | | $ | 564,876,886 | | | | | | 103.1 | | |
| | | | Liabilities in Excess of
Other Assets | | | | | (16,902,036) | | | | | | (3.1) | | |
| | | | Net Assets | | | | $ | 547,974,850 | | | | | | 100.0 | | |
“Other Securities” represents issues not identified as the top 50 holdings in terms of market value and issues or issuers not exceeding 1% of net assets individually or in aggregate respectively as of December 31, 2019.
The following footnotes apply to either the individual securities noted or one or more of the securities aggregated and listed as a single line item.
†
Unless otherwise indicated, principal amount is shown in USD.
(1)
The grouping contains non-income producing securities.
(2)
Non-income producing security.
(3)
The grouping contains securities on loan.
(4)
Security, or a portion of the security, is on loan.
(5)
All or a portion of the security represents securities purchased with cash collateral received for securities on loan.
(6)
Rate shown is the 7-day yield as of December 31, 2019.
See Accompanying Notes to Financial Statements
| VY® JPMorgan Small Cap | SUMMARY PORTFOLIO OF INVESTMENTS |
| Core Equity Portfolio | as of December 31, 2019 (continued) |
Fair Value Measurements^
The following is a summary of the fair valuations according to the inputs used as of December 31, 2019 in valuing the assets and liabilities:
| | | | Quoted Prices
in Active Markets
for Identical
Investments
(Level 1) | | | Significant
Other
Observable
Inputs
(Level 2) | | | Significant
Unobservable
Inputs
(Level 3) | | | Fair Value
at
December 31, 2019 | |
| Asset Table | | | | | | | | | | | | | | | | | | | | | | | | | |
| Investments, at fair value | | | | | | | | | | | | | | | | | | | | | | | | | |
| Common Stock* | | | | $ | 529,478,595 | | | | | $ | — | | | | | $ | — | | | | | $ | 529,478,595 | | |
| Short-Term Investments | | | | | 20,405,743 | | | | | | 14,992,548 | | | | | | — | | | | | | 35,398,291 | | |
| Total Investments, at fair value | | | | $ | 549,884,338 | | | | | $ | 14,992,548 | | | | | $ | — | | | | | $ | 564,876,886 | | |
| Other Financial Instruments+ | | | | | | | | | | | | | | | | | | | | | | | | | |
| Futures | | | | | 92,816 | | | | | | — | | | | | | — | | | | | | 92,816 | | |
| Total Assets | | | | $ | 549,977,154 | | | | | $ | 14,992,548 | | | | | $ | — | | | | | $ | 564,969,702 | | |
^
See Note 2, “Significant Accounting Policies” in the Notes to Financial Statements for additional information.
+
Other Financial Instruments may include open forward foreign currency contracts, futures, centrally cleared swaps, OTC swaps and written options. Forward foreign currency contracts, futures and centrally cleared swaps are valued at the unrealized gain (loss) on the instrument. OTC swaps and written options are valued at the fair value of the instrument.
*
For further breakdown of Common Stock by sector, please refer to the Portfolio of Investments.
At December 31, 2019, the following futures contracts were outstanding for VY® JPMorgan Small Cap Core Equity Portfolio:
| Description | | | Number
of Contracts | | | Expiration
Date | | | Notional
Value | | | Unrealized
Appreciation/
(Depreciation) | |
| Long Contracts: | | | | | | | | | | | | | | | | | | | | | | | | | |
| E-mini Russell 2000® Index | | | | | 123 | | | | | | 03/20/20 | | | | | $ | 10,274,190 | | | | | $ | 92,816 | | |
| | | | | | | | | | | | | | | | | $ | 10,274,190 | | | | | $ | 92,816 | | |
A summary of derivative instruments by primary risk exposure is outlined in the following tables.
The fair value of derivative instruments as of December 31, 2019 was as follows:
| Derivatives not accounted for as hedging instruments | | | Location on Statement
of Assets and Liabilities | | | Fair Value | |
| Asset Derivatives | | | | | | | | | | |
| Equity contracts | | | Net Assets — Unrealized appreciation* | | | | $ | 92,816 | | |
| Total Asset Derivatives | | | | | | | $ | 92,816 | | |
*
Includes cumulative appreciation/depreciation of futures contracts as reported in the table within the Portfolio of Investments.
The effect of derivative instruments on the Portfolio’s Statement of Operations for the year ended December 31, 2019 was as follows:
| | | | Amount of Realized Gain or (Loss)
on Derivatives Recognized in Income | |
| Derivatives not accounted for as hedging instruments | | | Futures | |
| Equity contracts | | | | $ | 971,535 | | |
| Total | | | | $ | 971,535 | | |
| |
| | | | Change in Unrealized Appreciation or (Depreciation)
on Derivatives Recognized in Income | |
| Derivatives not accounted for as hedging instruments | | | Futures | |
| Equity contracts | | | | $ | 480,781 | | |
| Total | | | | $ | 480,781 | | |
See Accompanying Notes to Financial Statements
| VY® JPMorgan Small Cap | SUMMARY PORTFOLIO OF INVESTMENTS |
| Core Equity Portfolio | as of December 31, 2019 (continued) |
At December 31, 2019, the aggregate cost of securities and other investments and the composition of unrealized appreciation and depreciation of securities and other investments at year end were:
| | Cost for federal income tax purposes was $483,273,163. | |
| | Net unrealized appreciation consisted of: | |
| | Gross Unrealized Appreciation | | | | $ | 109,207,385 | | |
| | Gross Unrealized Depreciation | | | | | (27,510,847) | | |
| | Net Unrealized Appreciation | | | | $ | 81,696,538 | | |
See Accompanying Notes to Financial Statements
TAX INFORMATION (Unaudited)
Dividends and distributions paid during the year ended December 31, 2019 were as follows:
| Portfolio Name | | | Type | | | Per Share
Amount | |
| Voya Balanced Income Portfolio | |
| Class ADV | | | NII | | | | $ | 0.4969 | | |
| Class I | | | NII | | | | $ | 0.5656 | | |
| Class S | | | NII | | | | $ | 0.5331 | | |
| Class S2 | | | NII | | | | $ | 0.5166 | | |
| All Classes | | | LTCG | | | | $ | 0.6712 | | |
| Voya High Yield Portfolio | |
| Class ADV | | | NII | | | | $ | 0.4766 | | |
| Class I | | | NII | | | | $ | 0.5351 | | |
| Class S | | | NII | | | | $ | 0.5106 | | |
| Class S2 | | | NII | | | | $ | 0.4967 | | |
| Voya Large Cap Growth Portfolio | |
| Class ADV | | | NII | | | | $ | 0.0167 | | |
| Class I | | | NII | | | | $ | 0.1398 | | |
| Class R6 | | | NII | | | | $ | 0.1400 | | |
| Class S | | | NII | | | | $ | 0.0845 | | |
| Class S2 | | | NII | | | | $ | 0.0544 | | |
| All Classes | | | STCG | | | | $ | 0.2540 | | |
| All Classes | | | LTCG | | | | $ | 3.0980 | | |
| Voya Large Cap Value Portfolio | |
| Class ADV | | | NII | | | | $ | 0.1786 | | |
| Class I | | | NII | | | | $ | 0.2497 | | |
| Class R6 | | | NII | | | | $ | 0.2489 | | |
| Class S | | | NII | | | | $ | 0.2191 | | |
| Class S2 | | | NII | | | | $ | 0.1972 | | |
| All Classes | | | LTCG | | | | $ | 0.8519 | | |
| Portfolio Name | | | Type | | | Per Share
Amount | |
| Voya Limited Maturity Bond Portfolio | |
| Class ADV | | | NII | | | | $ | 0.1225 | | |
| Class I | | | NII | | | | $ | 0.1852 | | |
| Class S | | | NII | | | | $ | 0.1614 | | |
| Voya U.S. Stock Index Portfolio | |
| Class ADV | | | NII | | | | $ | 0.1732 | | |
| Class I | | | NII | | | | $ | 0.2566 | | |
| Class P2 | | | NII | | | | $ | 0.2566 | | |
| Class S | | | NII | | | | $ | 0.2489 | | |
| Class S2 | | | NII | | | | $ | 0.1894 | | |
| All Classes | | | LTCG | | | | $ | 0.9024 | | |
| VY® Clarion Real Estate Portfolio | |
| Class ADV | | | NII | | | | $ | 0.6325 | | |
| Class I | | | NII | | | | $ | 0.8540 | | |
| Class S | | | NII | | | | $ | 0.7574 | | |
| Class S2 | | | NII | | | | $ | 0.6983 | | |
| All Classes | | | LTCG | | | | $ | 0.1758 | | |
| VY® JPMorgan Small Cap Core Equity Portfolio | |
| Class ADV | | | NII | | | | $ | 0.0271 | | |
| Class I | | | NII | | | | $ | 0.2222 | | |
| Class R6 | | | NII | | | | $ | 0.2222 | | |
| Class S | | | NII | | | | $ | 0.1264 | | |
| Class S2 | | | NII | | | | $ | 0.0671 | | |
| All Classes | | | STCG | | | | $ | 0.2842 | | |
| All Classes | | | LTCG | | | | $ | 4.2653 | | |
| All Classes | | | ROC | | | | $ | 0.2253 | | |
NII – Net investment income
STCG – Short-term capital gain
LTCG – Long-term capital gain
ROC – Return of capital
Of the ordinary distributions made during the year ended December 31, 2019, the following percentages qualify for the dividends received deduction (DRD) available to corporate shareholders:
| | Voya Balanced Income Portfolio | | | | | 25.36% | | |
| | Voya Large Cap Growth Portfolio | | | | | 78.58% | | |
| | Voya Large Cap Value Portfolio | | | | | 100.00% | | |
| | Voya U.S. Stock Index Portfolio | | | | | 93.84% | | |
| | VY® JPMorgan Small Cap Core Equity Portfolio | | | | | 83.08% | | |
TAX INFORMATION (Unaudited) (continued)
The Portfolios designate the following amounts of long-term capital gain distributions as 20% rate long-term capital gain dividends under Internal Revenue Code Section 852(b)(3)(C):
| | Voya Balanced Income Portfolio | | | | $ | 22,330,665 | | |
| | Voya Large Cap Growth Portfolio | | | | $ | 861,560,330 | | |
| | Voya Large Cap Value Portfolio | | | | $ | 75,474,848 | | |
| | Voya U.S. Stock Index Portfolio | | | | $ | 350,050,354 | | |
| | VY® Clarion Real Estate Portfolio | | | | $ | 1,619,442 | | |
| | VY® JPMorgan Small Cap Core Equity Portfolio | | | | $ | 175,897,372 | | |
Above figures may differ from those cited elsewhere in this report due to differences in the calculation of income and gains under U.S. generally accepted accounting principles (book) purposes and Internal Revenue Service (tax) purposes.
Shareholders are strongly advised to consult their own tax advisers with respect to the tax consequences of their investments in the Portfolios. In January, shareholders, excluding corporate shareholders, receive an IRS 1099-DIV regarding the federal tax status of the dividends and distributions they received in the calendar year.
TRUSTEE AND OFFICER INFORMATION (Unaudited)
The business and affairs of the Trust are managed under the direction of the Board. A Trustee, who is not an interested person of the Trust, as defined in the 1940 Act, is an independent trustee (“Independent Trustee”). The Trustees and Officers of the Trust are listed below. The Statement of Additional Information includes additional information about Trustees of the Trust and is available, without charge, upon request at (800) 366-0066.
| | Name, Address and Age | | | Position(s)
Held with the
Trust | | | Term of Office and
Length of Time
Served(1) | | | Principal
Occupation(s) –
During the Past 5 Years | | | Number of
Funds in
Fund
Complex
Overseen by
Trustee(2) | | | Other Board Positions
Held by Trustee | |
| | Independent Trustees*: | | | | | | | | | | | | | | | | |
| | Colleen D. Baldwin
7337 East Doubletree Ranch Rd.
Suite 100
Scottsdale, Arizona 85258
Age: 59 | | | Trustee
Chairperson | | | November 2007 –
Present January 2020 –
Present | | | President, Glantuam Partners, LLC, a business consulting firm (January 2009 – Present). | | | 146 | | | Dentaquest (February 2014 – Present); RSR Partners, Inc. (2016 – Present). | |
| | John V. Boyer
7337 East Doubletree Ranch Rd.
Suite 100
Scottsdale, Arizona 85258
Age: 66 | | | Trustee | | | January 2005 –
Present | | | Retired. Formerly, President and Chief Executive Officer, Bechtler Arts Foundation, an arts and education foundation (January 2008 – December 2019). | | | 146 | | | None. | |
| | Patricia W. Chadwick
7337 East Doubletree Ranch Rd.
Suite 100
Scottsdale, Arizona 85258
Age: 71 | | | Trustee | | | January 2006 –
Present | | | Consultant and President, Ravengate Partners LLC, a consulting firm that provides advice regarding financial markets and the global economy (January 2000 – Present). | | | 146 | | | Wisconsin Energy Corporation (June 2006 – Present); The Royce Fund (22 funds) (December 2009 – Present); and AMICA Mutual Insurance Company (1992 – Present). | |
| | Martin J. Gavin
7337 East Doubletree Ranch Rd. Suite 100
Scottsdale, AZ 85258
Age: 69 | | | Trustee | | | August 2015 –
Present | | | Retired. Formerly, President and Chief Executive Officer, Connecticut Children’s Medical Center (May 2006 – November 2015). | | | 146 | | | None. | |
| | Joseph E. Obermeyer
7337 East Doubletree Ranch Rd.
Suite 100
Scottsdale, Arizona 85258
Age: 62 | | | Trustee | | | May 2013 –
Present | | | President, Obermeyer & Associates, Inc., a provider of financial and economic consulting services (November 1999 – Present). | | | 146 | | | None. | |
| | Sheryl K. Pressler
7337 East Doubletree Ranch Rd.
Suite 100
Scottsdale, Arizona 85258
Age: 69 | | | Trustee | | | January 2006 –
Present | | | Consultant (May 2001 – Present). | | | 146 | | | None. | |
| | Christopher P. Sullivan
7337 East Doubletree Ranch Rd.
Suite 100
Scottsdale, Arizona 85258
Age: 66 | | | Trustee | | | October 2015 –
Present | | | Retired. | | | 146 | | | None. | |
TRUSTEE AND OFFICER INFORMATION (Unaudited) (continued)
| | Name, Address and Age | | | Position(s)
Held with the
Trust | | | Term of Office and
Length of Time
Served(1) | | | Principal
Occupation(s) –
During the Past 5 Years | | | Number of
Funds in
Fund
Complex
Overseen by
Trustee(2) | | | Other Board Positions
Held by Trustee | |
| | Trustee who is an “interested person”: | |
| | Dina Santoro
230 Park Avenue
New York, New York 10169
Age: 46 | | | Trustee | | | July 2018 – Present | | | President, Voya Investments, LLC and Voya Capital, LLC (March 2018 – Present); Senior Vice President, Voya Investments Distributor, LLC (April 2018 – Present); Senior Managing Director, Head of Product and Marketing Strategy, Voya Investment Management (September 2017 – Present). Formerly, Managing Director, Quantitative Management Associates, LLC (January 2004 – August 2017). | | | 146 | | | Voya Investments, LLC, Voya Capital, LLC, and Voya Funds Services, LLC (March 2018 – Present); Voya Investments Distributor, LLC (April 2018 – Present). | |
(1)
Trustees serve until their successors are duly elected and qualified. The tenure of each Trustee who is not an “interested person” as defined in the 1940 Act, of each Portfolio (“Independent Trustee”) is subject to the Board’s retirement policy which states that each duly elected or appointed Independent Trustee shall retire from and cease to be a member of the Board of Trustees at the close of business on December 31 of the calendar year in which the Independent Trustee attains the age of 75. A majority vote of the Board’s other Independent Trustees may extend the retirement date of an Independent Trustee if the retirement would trigger a requirement to hold a meeting of shareholders of the Trust under applicable law, whether for the purposes of appointing a successor to the Independent Trustee or otherwise comply under applicable law, in which case the extension would apply until such time as the shareholder meeting can be held or is no longer required (as determined by a vote of a majority of the other Independent Trustees).
(2)
For the purposes of this table, “Fund Complex” means the Voya family of funds including the following investment companies: Voya Asia Pacific High Dividend Equity Income Fund; Voya Balanced Portfolio, Inc.; Voya Emerging Markets High Dividend Equity Fund; Voya Equity Trust; Voya Funds Trust; Voya Global Advantage and Premium Opportunity Fund; Voya Global Equity Dividend and Premium Opportunity Fund; Voya Government Money Market Portfolio; Voya Infrastructure, Industrials and Materials Fund; Voya Intermediate Bond Portfolio; Voya International High Dividend Equity Income Fund; Voya Investors Trust; Voya Mutual Funds; Voya Natural Resources Equity Income Fund; Voya Partners, Inc.; Voya Prime Rate Trust; Voya Senior Income Fund; Voya Separate Portfolios Trust; Voya Strategic Allocation Portfolios, Inc.; Voya Variable Funds; Voya Variable Insurance Trust; Voya Variable Portfolios, Inc.; and Voya Variable Products Trust. The number of funds in the Fund Complex is as of January 31, 2020.
*
Effective December 31, 2019, Russell H. Jones and Roger B. Vincent each retired as a Trustee of the Board.
TRUSTEE AND OFFICER INFORMATION (Unaudited) (continued)
| Name, Address and Age | | | Position(s) Held
With the Trust | | | Term of Office and
Length of Time
Served(1) | | | Principal Occupation(s) – During the Past 5 Years | |
Michael Bell
One Orange Way
Windsor, Connecticut 06095
Age: 51 | | | Chief Executive Officer | | | March 2018 – Present | | | Chief Executive Officer and Director, Voya Investments, LLC, Voya Capital, LLC, and Voya Funds Services, LLC (March 2018 – Present); Senior Vice President and Chief Financial Officer, Voya Investments Distributor, LLC (September 2019 – Present); Chief Financial Officer, Voya Investment Management (September 2014 – Present). Formerly, Senior Vice President, Chief Financial Officer and Treasurer, Voya Investments, LLC (November 2015 – March 2018). | |
Dina Santoro
230 Park Avenue
New York, New York 10169
Age: 46 | | | President | | | March 2018 – Present | | | President and Director, Voya Investments, LLC and Voya Capital, LLC (March 2018 – Present); Director, Voya Funds Services, LLC (March 2018 – Present); Director and Senior Vice President, Voya Investments Distributor, LLC (April 2018 – Present); Senior Managing Director, Head of Product and Marketing Strategy, Voya Investment Management (September 2017 – Present). Formerly, Managing Director, Quantitative Management Associates, LLC (January 2004 – August 2017). | |
Stanley D. Vyner
230 Park Avenue
New York, New York 10169
Age: 69 | | | Executive Vice President Chief Investment Risk Officer | | | March 2003 – Present
September 2009 – Present | | | Executive Vice President, Voya Investments, LLC (July 2000 – Present) and Chief Investment Risk Officer, Voya Investments, LLC (January 2003 – Present). | |
James M. Fink
5780 Powers Ferry Road NW
Atlanta, Georgia 30327
Age: 61 | | | Executive Vice President | | | March 2018 – Present | | | Managing Director, Voya Investments, LLC, Voya Capital, LLC, and Voya Funds Services, LLC (March 2018 – Present); Senior Vice President, Voya Investments Distributor, LLC (April 2018 – Present); Chief Administrative Officer, Voya Investment Management (September 2017 – Present). Formerly, Managing Director, Operations, Voya Investment Management (March 1999 – September 2017). | |
Kevin M. Gleason
7337 East Doubletree Ranch Rd.
Suite 100
Scottsdale, Arizona 85258
Age: 53 | | | Chief Compliance Officer | | | February 2012 – Present | | | Senior Vice President, Voya Investment Management and Chief Compliance Officer, Voya Family of Funds (February 2012 – Present). | |
Todd Modic
7337 East Doubletree Ranch Rd.
Suite 100
Scottsdale, Arizona 85258
Age: 52 | | | Senior Vice President, Chief/Principal Financial Officer and Assistant Secretary | | | March 2005 – Present | | | President, Voya Funds Services, LLC (March 2018 – Present) and Senior Vice President, Voya Investments, LLC (April 2005 – Present). | |
Kimberly A. Anderson
7337 East Doubletree Ranch Rd.
Suite 100
Scottsdale, Arizona 85258
Age: 55 | | | Senior Vice President | | | November 2003 – Present | | | Senior Vice President, Voya Investments, LLC (September 2003 – Present). | |
Robert Terris
5780 Powers Ferry Road NW
Atlanta, Georgia 30327
Age: 49 | | | Senior Vice President | | | May 2006 – Present | | | Senior Vice President, Voya Investments Distributor, LLC (April 2018 – Present); Senior Vice President, Head of Division Operations, Voya Investments, LLC (October 2015 – Present) and Voya Funds Services, LLC (March 2006 – Present). | |
Fred Bedoya
7337 East Doubletree Ranch Rd.
Suite 100
Scottsdale, Arizona 85258
Age: 47 | | | Vice President and Treasurer | | | September 2012 – Present | | | Vice President, Voya Investments, LLC (October 2015 – Present) and Voya Funds Services, LLC (July 2012 – Present). | |
TRUSTEE AND OFFICER INFORMATION (Unaudited) (continued)
| Name, Address and Age | | | Position(s) Held
With the Trust | | | Term of Office and
Length of Time
Served(1) | | | Principal Occupation(s) – During the Past 5 Years | |
Maria M. Anderson
7337 East Doubletree Ranch Rd.
Suite 100
Scottsdale, Arizona 85258
Age: 61 | | | Vice President | | | September 2004 – Present | | | Vice President, Voya Investments, LLC (October 2015 – Present) and Voya Funds Services, LLC (September 2004 – Present). | |
Sara M. Donaldson
7337 East Doubletree Ranch Rd.
Suite 100
Scottsdale, Arizona 85258
Age: 60 | | | Vice President | | | September 2014 – Present | | | Vice President, Voya Investments, LLC (October 2015 – Present). Formerly, Vice President, Voya Funds Services, LLC (April 2014 – October 2015). | |
Micheline S. Faver
7337 East Doubletree Ranch Rd.
Suite 100
Scottsdale, Arizona 85258
Age: 42 | | | Vice President | | | September 2016 – Present | | | Vice President, Head of Fund Compliance and Chief Compliance Officer, Voya Investments, LLC (June 2016 – Present). Formerly, Vice President, Mutual Fund Compliance (March 2014 – June 2016). | |
Robyn L. Ichilov
7337 East Doubletree Ranch Rd.
Suite 100
Scottsdale, Arizona 85258
Age: 52 | | | Vice President | | | November 1999 – Present | | | Vice President, Voya Funds Services, LLC (November 1995 – Present) and Voya Investments, LLC (August 1997 – Present). | |
Jason Kadavy
7337 East Doubletree Ranch Rd.
Suite 100
Scottsdale, Arizona 85258
Age: 43 | | | Vice President | | | September 2012 – Present | | | Vice President, Voya Investments, LLC (October 2015 – Present) and Voya Funds Services, LLC (July 2007 – Present). | |
Andrew K. Schlueter
7337 East Doubletree Ranch Rd.
Suite 100
Scottsdale, Arizona 85258
Age: 43 | | | Vice President | | | March 2018 – Present | | | Vice President, Voya Investments Distributor, LLC (April 2018 – Present); Vice President, Voya Investments, LLC and Voya Funds Services, LLC (March 2018 – Present); Vice President, Head of Mutual Fund Operations, Voya Investment Management (February 2018 – Present). Formerly, Vice President, Voya Investment Management (March 2014 – February 2018). | |
Craig Wheeler
7337 East Doubletree Ranch Rd.
Suite 100
Scottsdale, Arizona 85258
Age: 50 | | | Vice President | | | May 2013 – Present | | | Vice President – Director of Tax, Voya Investments, LLC (October 2015 – Present). Formerly, Vice President – Director of Tax, Voya Funds Services, LLC (March 2013 – October 2015). | |
Monia Piacenti
One Orange Way
Windsor, Connecticut 06095
Age: 43 | | | Anti-Money Laundering Officer | | | June 2018 – Present | | | Anti-Money Laundering Officer, Voya Investments Distributor, LLC, Voya Investment Management and Voya Investment Management Trust Co. (June 2018 – Present); Compliance Consultant, Voya Financial, Inc. (January 2019 – Present). Formerly, Senior Compliance Officer, Voya Investment Management (December 2009 – December 2018). | |
Theresa K. Kelety
7337 East Doubletree Ranch Rd.
Suite 100
Scottsdale, Arizona 85258
Age: 57 | | | Secretary | | | January 2020 – Present | | | Vice President and Senior Counsel, Voya Investment Management – Mutual Fund Legal Department (March 2010 – Present). | |
Paul A. Caldarelli
7337 East Doubletree Ranch Rd.
Suite 100
Scottsdale, Arizona 85258
Age: 68 | | | Assistant Secretary | | | June 2010 – Present | | | Vice President and Senior Counsel, Voya Investment Management – Mutual Fund Legal Department (March 2010 – Present). | |
TRUSTEE AND OFFICER INFORMATION (Unaudited) (continued)
| Name, Address and Age | | | Position(s) Held
With the Trust | | | Term of Office and
Length of Time
Served(1) | | | Principal Occupation(s) – During the Past 5 Years | |
Joanne F. Osberg
7337 East Doubletree Ranch Rd.
Suite 100
Scottsdale, Arizona 85258
Age: 38 | | | Assistant Secretary | | | January 2020 – Present | | | Vice President and Counsel, Voya Investment Management – Mutual Fund Legal Department (January 2013 – Present). | |
(1)
The Officers hold office until the next annual meeting of the Board of Trustees and until their successors shall have been elected and qualified.
ADVISORY AND SUB-ADVISORY CONTRACT APPROVAL DISCUSSION (Unaudited)
BOARD CONSIDERATION AND APPROVAL OF INVESTMENT MANAGEMENT CONTRACTS AND SUB-ADVISORY CONTRACTS
At a meeting held on November 21, 2019, the Board of Trustees (“Board”) of Voya Investors Trust (the “Trust”), including a majority of the Independent Trustees, considered and approved the renewal of the investment management contracts (the “Management Contracts”) between Voya Investments, LLC (the “Manager”) and the Trust, on behalf of Voya Balanced Income Portfolio, Voya High Yield Portfolio, Voya Large Cap Growth Portfolio, Voya Large Cap Value Portfolio, Voya Limited Maturity Bond Portfolio, Voya U.S. Stock Index Portfolio, VY® Clarion Real Estate Portfolio, and VY® JPMorgan Small Cap Core Equity Portfolio, each a series of the Trust (the “Portfolios”), and the sub-advisory contracts (the “Sub-Advisory Contracts,” and together with the Management Contracts, the “Contracts”) with the sub-adviser to each Portfolio (the “Sub-Advisers”) for an additional one year period ending November 30, 2020. In determining to renew such contracts, the Board considered information furnished to it throughout the year at meetings of the Board and its committees, including information regarding performance, expenses, and other matters.
In addition to the Board meeting on November 21, 2019, the Independent Trustees also held meetings outside the presence of personnel representing the Manager or Sub-Advisers (collectively, such persons are referred to herein as “management”) on October 9, 2019, and November 19, 2019, specifically to review and consider materials related to the proposed continuance of the Contracts that they believed to be relevant to the renewal of the Contracts in light of their own business judgment and the legal advice furnished to them by K&L Gates LLP, their independent legal counsel. Subsequent references herein to factors considered and determinations made by the Independent Trustees and/or the Board include, as applicable, factors considered and determinations made at those meetings by the Independent Trustees. While the Board considered the renewal of the management contracts and sub-advisory contracts for all of the applicable investment companies in the Voya family of funds at the same meetings, the Board considered each Voya fund’s investment management and sub-advisory relationships separately.
The Board follows a process pursuant to which it seeks and considers relevant information when it evaluates whether to renew existing investment management and sub-advisory contracts for the Voya funds. The Board has established a Contracts Committee and Investment Review Committees (the “IRCs”), each of which includes only Independent Trustees as members. The Contracts Committee meets several times throughout the year to
provide oversight with respect to the management and sub-advisory contracts approval and renewal process, among other functions, and each IRC meets several times throughout the year to provide oversight regarding the investment performance of the sub-advisers, as well as the Manager’s role in monitoring the sub-advisers, with respect to each Voya fund that is assigned to that IRC.
The Contracts Committee oversees, and annually recommends Board approval of updates to, a methodology guide for the Voya funds (“Methodology Guide”) related to the investment management and sub-advisory contract renewal process. The Methodology Guide sets out a framework pursuant to which the Independent Trustees request, and management provides, certain information that the Independent Trustees deem to be important or potentially relevant. The Independent Trustees retain the services of an independent consultant with experience in the mutual fund industry to assist the Contracts Committee in developing and recommending to the Board: (1) a selected peer group of investment companies for each Portfolio (“Selected Peer Group”) based on that Portfolio’s particular attributes, such as fund type and size, fund category (as determined by Morningstar, Inc., an independent provider of mutual fund data (“Morningstar”)), sales channels and structure and the Portfolio share class being compared to the Selected Peer Group; and (2) updates to the Methodology Guide with respect to the content and format of various data including, but not limited to, investment performance, fee structure, and expense information prepared in connection with the renewal process. In addition, the Independent Trustees periodically have retained, including most recently in 2018, an independent firm to test and verify the accuracy of certain information presented to the Board for a representative sample of the Voya funds.
Provided below is an overview of certain material factors that the Board considered at its meetings regarding the renewal of the Contracts and the compensation to be paid thereunder. The Board members did not identify any particular information or factor that was overarching, and each Board member may have accorded different weight to the various factors in reaching his or her conclusions with respect to each Portfolio’s investment management and sub-advisory arrangements.
Nature, Extent and Quality of Services
The Manager oversees, subject to the authority of the Board, and is responsible for the provision of all investment advisory and portfolio management services for the Portfolios, but may delegate certain of these responsibilities to one or more sub-advisers. In addition, the Manager provides administrative services reasonably
ADVISORY AND SUB-ADVISORY CONTRACT APPROVAL DISCUSSION (Unaudited) (continued)
necessary for the operation of the Portfolios as set forth in the Management Contracts, including oversight of the Portfolios’ operations and risk management and the oversight of their various other service providers.
The Board considered the “manager-of-managers” platform of the Voya funds that has been developed by the Manager pursuant to which the Manager selects, subject to the Board’s approval, sub-advisers to provide day-to-day management services to all or a portion of each Voya fund. The Board recognized that the Manager is responsible for monitoring the investment program, performance, developments, ongoing operations, and compliance with applicable regulations and investment policies and restrictions of the Sub-Advisers with respect to the Portfolios under this manager-of-managers arrangement. The Board also considered the techniques and resources that the Manager has developed to provide this ongoing oversight and due diligence with respect to the sub-advisers and to advocate or recommend, when it believes appropriate, changes in investment strategies or investment sub-advisers designed to assist in improving a Voya fund’s performance. The Board was advised that, in connection with the Manager’s performance of these duties, the Manager has developed an oversight process formulated by its Manager Research & Selection Group which reviews, among other matters, performance data, each Sub-Adviser’s management team, portfolio data and attribution analysis related to each Sub-Adviser through various means, including, but not limited to, in-person meetings, on-site visits, and telephonic meetings with the Sub-Adviser.
Further, the Board considered periodic compliance reports it receives from the Trust’s Chief Compliance Officer evaluating whether the regulatory compliance systems and procedures of the Manager and the Sub-Advisers are reasonably designed to ensure compliance with the federal securities laws and whether the investment policies and restrictions for each Portfolio are consistently complied with, and other periodic reports covering related matters.
The Board considered the portfolio management team assigned by the Sub-Advisers to the Portfolios and the level of resources committed to the Portfolios (and other relevant funds in the Voya funds) by the Manager and the Sub-Advisers, and whether those resources are sufficient to provide high-quality services to the Portfolios.
Based on their deliberations and the materials presented to them, the Board concluded that the nature, extent and quality of the overall services provided by the Manager and each Sub-Adviser under the Contracts were appropriate.
Portfolio Performance
With respect to Voya Balanced Income Portfolio, Voya High Yield Portfolio, Voya Large Cap Growth Portfolio, Voya Large Cap Value Portfolio, Voya Limited Maturity Bond Portfolio, VY® Clarion Real Estate Portfolio, and VY® JPMorgan Small Cap Core Equity Portfolio, in assessing the investment management and sub-advisory relationships, the Board placed emphasis on the investment returns of each Portfolio, including its investment performance over certain time periods compared to the Portfolio’s Morningstar category and primary benchmark, a broad-based securities market index that appears in the Portfolio’s prospectus. In addition, the Board considered Voya Limited Maturity Bond Portfolio’s investment performance compared to an additional performance peer group that is approved by the Portfolio’s IRC due to the unique investment structure or strategy of the Portfolio. The Board also considered information from the Manager Research & Selection Group and received reports summarizing a separate analysis of each Portfolio’s performance and risk, including risk-adjusted investment return information, from the Trust’s Chief Investment Risk Officer.
With respect to Voya U.S. Stock Index Portfolio, which seeks investment results corresponding to the performance of an index (commonly referred to an as an “index fund”), in assessing the investment management and sub-advisory relationships, the Board focused on the reasonableness of the differences between the Portfolio’s net performance and the total return of such index during these time periods.
Economies of Scale
When evaluating the reasonableness of the management fee schedules, the Board considered whether economies of scale have been or likely will be realized by the Manager and the Sub-Advisers as a Portfolio grows larger and the extent to which any such economies are shared with the Portfolio. In this regard, the Board noted any breakpoints in management fee schedules that will result in a lower management fee rate when a Portfolio achieves sufficient asset levels to receive a breakpoint discount. The Board also considered that, while some of the Portfolios do not have management fee breakpoints, they may have fee waiver and expense reimbursement arrangements. The Board considered the extent to which economies of scale realized by the Manager or the Sub-Advisers could be shared with each Portfolio through such fee waivers, expense reimbursements or other expense reductions. In evaluating these matters, the Independent Trustees also considered periodic management reports, Selected Peer
ADVISORY AND SUB-ADVISORY CONTRACT APPROVAL DISCUSSION (Unaudited) (continued)
Group comparisons, and industry information regarding economies of scale. In the case of sub-advisory fees, the Board considered that breakpoints, if any, would inure to the benefit of the Manager.
Information Regarding Services, Performance, and Fee Schedules Offered to Other Clients
The Board considered comparative information regarding the nature of services, performance, and fee schedules offered by the Manager and the Sub-Advisers to other clients with similar investment objectives, if applicable, including other registered investment companies and relevant institutional accounts. When the fee schedules offered to or the performance of such other clients differed materially from a Portfolio, the Board took into account the underlying rationale provided by the Manager or the Sub-Advisers, as applicable, for these differences. For the non-Voya-affiliated Sub-Advisers, the Board viewed the information related to any material differences in the fee schedules as not being a key factor in its deliberations because of the arm’s-length nature of negotiations between the Manager and non-Voya-affiliated Sub-Advisers with respect to sub-advisory fee schedules and that the Manager is responsible for paying the fees of the Sub-Adviser.
Fee Schedules, Profitability, and Fall-out Benefits
The Board reviewed and considered the contractual management fee schedule and net management fee rate payable by each Portfolio to the Manager compared to the Portfolio’s Selected Peer Group and which additional services the Manager pays for on behalf of each applicable Portfolio under the “bundled fee” arrangement in return for a single management fee (“Unified Fee Structure”). The Board also considered the compensation payable by the Manager to each Sub-Adviser for sub-advisory services for each Portfolio, including the portion of the contractual and net management fee rates that are paid to each Sub-Adviser, as compared to the compensation paid to the Manager. In addition, the Board considered any fee waivers, expense limitations, and/or recoupment arrangements that apply to the fees payable by the Portfolios, including whether the Manager intends to propose any changes thereto. For each Portfolio, the Board separately determined that the fees payable to the Manager and the fee schedule payable to each Sub-Adviser are reasonable for the services that each performs, which were considered in light of the nature, extent and quality of the services that each has performed and is expected to perform.
For each Portfolio, the Board considered information on revenues, costs and profits or losses realized by the Manager and the Voya-affiliated Sub-Adviser related to
their services to the Portfolio. In analyzing the profitability of the Manager and its affiliated service providers in connection with services they render to a Portfolio, the Board took into account the sub-advisory fee rate payable by the Manager to each Sub-Adviser. The Board also considered the profitability of the Manager and its affiliated Sub-Adviser attributable to servicing each Portfolio both with and without taking into account the profitability of the distributor of the Portfolios and any revenue sharing payments made by the Manager and both before and after giving effect to any expenses incurred by the Manager or the affiliated Sub-Adviser in making payments to affiliated insurance companies. The Board did not request profitability data from the Sub-Advisers that are not affiliated with the Manager because the Board did not view this data as a key factor to its deliberations given the arm’s-length nature of the relationship between the Manager and these non-Voya-affiliated Sub-Advisers with respect to the negotiation of sub-advisory fee schedules. In addition, the Board noted that non-Voya-affiliated sub-advisers may not account for their profits on an account-by-account basis and those that do typically employ different methodologies in connection with these calculations.
Although the Methodology Guide establishes a framework for profit calculation, the Board recognized that there is no uniform methodology within the asset management industry for determining profitability for this purpose. The Board also recognized that the use of different reasonable methodologies can give rise to dramatically different reported profit and loss results with respect to the Manager and the Voya-affiliated Sub-Adviser, as well as other industry participants with whom the profits of the Manager and its affiliated Sub-Adviser could be compared. In addition, the Board recognized that management’s calculations regarding its costs incurred in establishing the infrastructure necessary for the Portfolios’ operations may not be fully reflected in the expenses allocated to each Portfolio in determining profitability, and that the information presented may not portray all of the costs borne by the Manager or reflect all risks, including entrepreneurial, regulatory, legal and operational risks, associated with offering and managing a mutual fund complex in the current regulatory and market environment.
The Board also considered that the Manager is entitled to earn a reasonable level of profits for the services that it provides to the Portfolios. The Board also considered information regarding the potential fall-out benefits to the Manager and Sub-Advisers and their respective affiliates from their association with the Portfolios, including their ability to engage in soft-dollar transactions on behalf of the Portfolios. Following its reviews, the Board determined that the Manager’s and the Voya-affiliated Sub-Adviser’s
ADVISORY AND SUB-ADVISORY CONTRACT APPROVAL DISCUSSION (Unaudited) (continued)
profitability with respect to their services to the Portfolios and the Manager and Sub-Advisers’ potential fall-out benefits were not unreasonable.
Portfolio-by-Portfolio Analysis
Set forth below are certain of the specific factors that the Board considered at its October 9, 2019, November 19, 2019, and/or November 21, 2019 meetings in relation to approving each Portfolio’s Contracts and the conclusions reached by the Board. These specific factors are in addition to those considerations discussed above. In each case, the Portfolio’s performance was compared to its Morningstar category, as well as its primary benchmark and, as applicable, a performance peer group. The performance data provided to the Board primarily was for various periods ended March 31, 2019. In addition, the Board also considered at its October 9, 2019, November 19, 2019, and November 21, 2019 meetings certain additional data regarding each Portfolio’s more recent performance, asset levels, and asset flows. Each Portfolio’s management fee rate and expense ratio were compared to the management fee rates and expense ratios of the funds in its Selected Peer Group. With respect to the quintile rankings noted below, the first quintile represents the range of funds with the highest performance or the lowest management fee rate or expense ratio, as applicable, and the fifth quintile represents the range of funds with the lowest performance or the highest management fee rate or expense ratio, as applicable.
Voya Balanced Income Portfolio
In considering whether to approve the renewal of the Management Contract for Voya Balanced Income Portfolio (formerly, VY® Franklin Income Portfolio), the Board considered that, based on performance data for the periods ended March 31, 2019: (1) the Portfolio is ranked in the first quintile of its Morningstar category for the one-year and three-year periods, the second quintile for the year-to-date and ten-year periods, and the fourth quintile for the five-year period; and (2) the Portfolio outperformed its primary benchmark for all periods presented, with the exception of the five-year period, during which it underperformed. In analyzing this performance data, the Board considered that the Portfolio’s current Sub-Adviser was hired on May 2, 2019, and that the Portfolio’s performance prior to May 1, 2019 reflects returns achieved by a different sub-adviser and pursuant to different principal investment strategies.
In considering the fees payable under the Management Contract for the Portfolio, the Board took into account the factors described above and also considered: (1) the fairness of the compensation under a Management
Contract with a level fee rate that does not include breakpoints; and (2) the pricing structure (including the net expense ratio to be borne by shareholders) of the Portfolio, as compared to its Selected Peer Group, including that: (a) the net management fee rate for the Portfolio is ranked in the third quintile of net management fee rates of the funds in its Selected Peer Group; (b) the contractual management fee rate for the Portfolio is ranked in the second quintile of contractual management fee rates of the funds in its Selected Peer Group; and (c) the net expense ratio for the Portfolio is ranked in the second quintile of net expense ratios of the funds in its Selected Peer Group.
After its deliberation, the Board reached the following conclusions: (1) the Portfolio’s management fee rate is reasonable in the context of all factors considered by the Board; (2) the Portfolio’s net expense ratio is reasonable in the context of all factors considered by the Board; and (3) the Portfolio’s performance is reasonable in the context of all factors considered by the Board. Based on these conclusions and other factors, the Board voted to renew the Management Contract for the Portfolio for the year ending November 30, 2020. During this renewal process, different Board members may have given different weight to different individual factors and related conclusions.
Voya High Yield Portfolio
In considering whether to approve the renewal of the Contracts for Voya High Yield Portfolio, the Board considered that, based on performance data for the periods ended March 31, 2019: (1) the Portfolio is ranked in the first quintile of its Morningstar category for the year-to-date, one-year, five-year and ten-year periods, and the third quintile for the three-year period; and (2) the Portfolio underperformed its primary benchmark for all periods presented, with the exception of the year-to-date period, during which it outperformed.
In considering the fees payable under the Contracts for the Portfolio, the Board took into account the factors described above and also considered: (1) the fairness of the compensation under a Management Contract with a breakpoint fee schedule where the asset level necessary to achieve a breakpoint discount had not been reached by the Portfolio; and (2) the pricing structure (including the net expense ratio to be borne by shareholders) of the Portfolio, as compared to its Selected Peer Group, including that: (a) the net management fee rate for the Portfolio is ranked in the first quintile of net management fee rates of the funds in its Selected Peer Group; (b) the contractual management fee rate for the Portfolio is ranked in the first quintile of contractual management fee rates of the funds in its Selected Peer Group; and (c) the net expense ratio
ADVISORY AND SUB-ADVISORY CONTRACT APPROVAL DISCUSSION (Unaudited) (continued)
for the Portfolio is ranked in the first quintile of net expense ratios of the funds in its Selected Peer Group. In analyzing this fee data, the Board took into account management’s representations regarding the expense borne by the Manager for the provision of services to the Portfolio, such as transfer agency, custody, accounting and legal services, pursuant to the Portfolio’s Unified Fee Structure.
After its deliberation, the Board reached the following conclusions: (1) the Portfolio’s management fee rate is reasonable in the context of all factors considered by the Board; (2) the Portfolio’s net expense ratio is reasonable in the context of all factors considered by the Board; (3) the Portfolio’s performance is reasonable in the context of all factors considered by the Board; and (4) the sub-advisory fee rate payable by the Manager to the Sub-Adviser is reasonable in the context of all factors considered by the Board. Based on these conclusions and other factors, the Board voted to renew the Contracts for the Portfolio for the year ending November 30, 2020. During this renewal process, different Board members may have given different weight to different individual factors and related conclusions.
Voya Large Cap Growth Portfolio
In considering whether to approve the renewal of the Contracts for Voya Large Cap Growth Portfolio, the Board considered that, based on performance data for the periods ended March 31, 2019: (1) the Portfolio is ranked in the second quintile of its Morningstar category for the five-year and ten-year periods, the third quintile for the one-year and three-year periods, and the fourth quintile for the year-to-date period; and (2) the Portfolio underperformed its primary benchmark for all periods presented.
In considering the fees payable under the Contracts for the Portfolio, the Board took into account the factors described above and also considered: (1) the economies of scale benefits to the Portfolio and its shareholders from breakpoint discounts applicable to the Portfolio’s management fee rate, which result in lower fees at higher asset levels; and (2) the pricing structure (including the net expense ratio to be borne by shareholders) of the Portfolio, as compared to its Selected Peer Group, including that: (a) the net management fee rate for the Portfolio is ranked in the third quintile of net management fee rates of the funds in its Selected Peer Group; (b) the contractual management fee rate for the Portfolio is ranked in the third quintile of contractual management fee rates of the funds in its Selected Peer Group; and (c) the net expense ratio for the Portfolio is ranked in the third quintile of net expense ratios of the funds in its Selected Peer Group.
After its deliberation, the Board reached the following conclusions: (1) the Portfolio’s management fee rate is reasonable in the context of all factors considered by the Board; (2) the Portfolio’s net expense ratio is reasonable in the context of all factors considered by the Board; (3) the Portfolio’s performance is reasonable in the context of all factors considered by the Board; and (4) the sub-advisory fee rate payable by the Manager to the Sub-Adviser is reasonable in the context of all factors considered by the Board. Based on these conclusions and other factors, the Board voted to renew the Contracts for the Portfolio for the year ending November 30, 2020. During this renewal process, different Board members may have given different weight to different individual factors and related conclusions.
Voya Large Cap Value Portfolio
In considering whether to approve the renewal of the Contracts for Voya Large Cap Value Portfolio, the Board considered that, based on performance data for the periods ended March 31, 2019: (1) the Portfolio is ranked in the third quintile of its Morningstar category for the one-year and three-year periods, and the fourth quintile for the year-to-date, five-year and ten-year periods; and (2) the Portfolio underperformed its primary benchmark for all periods presented.
In considering the fees payable under the Contracts for the Portfolio, the Board took into account the factors described above and also considered: (1) the economies of scale benefits to the Portfolio and its shareholders from breakpoint discounts applicable to the Portfolio’s management fee rate, which result in lower fees at higher asset levels; and (2) the pricing structure (including the net expense ratio to be borne by shareholders) of the Portfolio, as compared to its Selected Peer Group, including that: (a) the net management fee rate for the Portfolio is ranked in the second quintile of net management fee rates of the funds in its Selected Peer Group; (b) the contractual management fee rate for the Portfolio is ranked in the fifth quintile of contractual management fee rates of the funds in its Selected Peer Group; and (c) the net expense ratio for the Portfolio is ranked in the second quintile of net expense ratios of the funds in its Selected Peer Group.
After its deliberation, the Board reached the following conclusions: (1) the Portfolio’s management fee rate is reasonable in the context of all factors considered by the Board; (2) the Portfolio’s net expense ratio is reasonable in the context of all factors considered by the Board; (3) the Portfolio’s performance is reasonable in the context of all factors considered by the Board; and (4) the sub-advisory fee rate payable by the Manager to the Sub-Adviser is reasonable in the context of all factors considered by the
ADVISORY AND SUB-ADVISORY CONTRACT APPROVAL DISCUSSION (Unaudited) (continued)
Board. Based on these conclusions and other factors, the Board voted to renew the Contracts for the Portfolio for the year ending November 30, 2020. During this renewal process, different Board members may have given different weight to different individual factors and related conclusions.
Voya Limited Maturity Bond Portfolio
In considering whether to approve the renewal of the Contracts for Voya Limited Maturity Bond Portfolio, the Board considered that, based on performance data for the periods ended March 31, 2019: (1) the Portfolio is ranked in the second quintile of its Morningstar category for the one-year period, the third quintile for the year-to-date and five-year periods, and the fourth quintile for the three-year and ten-year periods; and (2) the Portfolio outperformed its primary benchmark for all periods presented. In analyzing this performance data, the Board took into account management’s representations regarding: (1) the competitiveness of the Portfolio’s performance during certain periods; (2) the Portfolio’s performance compared to an additional performance peer group that was approved by the Portfolio’s IRC due to the unique investment strategy of the Portfolio; and (3) the effect that the Portfolio’s portfolio positioning in 2009 had on its relative performance during the ten-year period.
In considering the fees payable under the Contracts for the Portfolio, the Board took into account the factors described above and also considered: (1) the economies of scale benefits to the Portfolio and its shareholders from breakpoint discounts applicable to the Portfolio’s management fee rate, which result in lower fees at higher asset levels; and (2) the pricing structure (including the net expense ratio to be borne by shareholders) of the Portfolio, as compared to its Selected Peer Group, including that: (a) the net management fee rate for the Portfolio is ranked in the first quintile of net management fee rates of the funds in its Selected Peer Group; (b) the contractual management fee rate for the Portfolio is ranked in the first quintile of contractual management fee rates of the funds in its Selected Peer Group; and (c) the net expense ratio for the Portfolio is ranked in the first quintile of net expense ratios of the funds in its Selected Peer Group. In analyzing this fee data, the Board took into account management’s representations regarding the expense borne by the Manager for the provision of services to the Portfolio, such as transfer agency, custody, accounting, and legal services, pursuant to the Portfolio’s Unified Fee Structure.
After its deliberation, the Board reached the following conclusions: (1) the Portfolio’s management fee rate is reasonable in the context of all factors considered by the Board; (2) the Portfolio’s net expense ratio is reasonable in
the context of all factors considered by the Board; (3) the Portfolio’s performance is reasonable in the context of all factors considered by the Board; and (4) the sub-advisory fee rate payable by the Manager to the Sub-Adviser is reasonable in the context of all factors considered by the Board. Based on these conclusions and other factors, the Board voted to renew the Contracts for the Portfolio for the year ending November 30, 2020. During this renewal process, different Board members may have given different weight to different individual factors and related conclusions.
Voya U.S. Stock Index Portfolio
In considering whether to approve the renewal of the Contracts for Voya U.S. Stock Index Portfolio, the Board considered the difference between the Portfolio’s performance and the performance of its index, and Management’s representations that such difference was reasonable and within expectations.
In considering the fees payable under the Contracts for the Portfolio, the Board took into account the factors described above and also considered: (1) the fairness of the compensation under a Management Contract with a level fee rate that does not include breakpoints; and (2) the pricing structure (including the net expense ratio to be borne by shareholders) of the Portfolio, as compared to its Selected Peer Group, including that: (a) the net management fee rate for the Portfolio is ranked in the fourth quintile of net management fee rates of the funds in its Selected Peer Group; (b) the contractual management fee rate for the Portfolio is ranked in the third quintile of contractual management fee rates of the funds in its Selected Peer Group; and (c) the net expense ratio for the Portfolio is ranked in the third quintile of net expense ratios of the funds in its Selected Peer. In analyzing this fee data, the Board took into account management’s representations regarding: (1) the expense borne by the Manager for the provision of services to the Portfolio, such as transfer agency, custody, accounting, and legal services, pursuant to the Portfolio’s Unified Fee Structure; and (2) its belief that the Portfolio’s pricing is competitive.
After its deliberation, the Board reached the following conclusions: (1) the Portfolio’s management fee rate is reasonable in the context of all factors considered by the Board; (2) the Portfolio’s net expense ratio is reasonable in the context of all factors considered by the Board; (3) the Portfolio’s performance is reasonable in the context of all factors considered by the Board; and (4) the sub-advisory fee rate payable by the Manager to the Sub-Adviser is reasonable in the context of all factors considered by the Board. Based on these conclusions and other factors, the Board voted to renew the Contracts for the Portfolio for the
ADVISORY AND SUB-ADVISORY CONTRACT APPROVAL DISCUSSION (Unaudited) (continued)
year ending November 30, 2020. During this renewal process, different Board members may have given different weight to different individual factors and related conclusions.
VY® Clarion Real Estate Portfolio
In considering whether to approve the renewal of the Contracts for VY® Clarion Real Estate Portfolio, the Board considered that, based on performance data for the periods ended March 31, 2019: (1) the Portfolio is ranked in the second quintile of its Morningstar category for the year-to-date and ten-year periods, the third quintile for the one-year period, the fourth quintile for the five-year period, and the fifth quintile for the three-year period; and (2) the Portfolio underperformed its primary benchmark for all periods presented, with the exception of the year-to-date period, during which it outperformed. In analyzing this performance data, the Board took into account management’s representations regarding: (1) the impact of security selection and sector allocation on the Portfolio’s performance; (2) management’s confidence in the ability of the Sub-Adviser to achieve the Portfolio’s investment objective; and (3) ongoing periodic monitoring of the Portfolio’s performance by management and the Board or its Investment Review Committee.
In considering the fees payable under the Contracts for the Portfolio, the Board took into account the factors described above and also considered: (1) the economies of scale benefits to the Portfolio and its shareholders from breakpoint discounts applicable to the Portfolio’s management fee rate, which result in lower fees at higher asset levels; and (2) the pricing structure (including the net expense ratio to be borne by shareholders) of the Portfolio, as compared to its Selected Peer Group, including that: (a) the net management fee rate for the Portfolio is ranked in the first quintile of net management fee rates of the funds in its Selected Peer Group; (b) the contractual management fee rate for the Portfolio is ranked in the fourth quintile of contractual management fee rates of the funds in its Selected Peer Group; and (c) the net expense ratio for the Portfolio is ranked in the first quintile of net expense ratios of the funds in its Selected Peer Group.
After its deliberation, the Board reached the following conclusions: (1) the Portfolio’s management fee rate is reasonable in the context of all factors considered by the Board; (2) the Portfolio’s net expense ratio is reasonable in the context of all factors considered by the Board; (3) the Portfolio’s performance is reasonable in the context of all factors considered by the Board; and (4) the sub-advisory fee rate payable by the Manager to the Sub-Adviser is reasonable in the context of all factors considered by the Board. Based on these conclusions and other factors, the Board voted to renew the Contracts for the Portfolio for the
year ending November 30, 2020. During this renewal process, different Board members may have given different weight to different individual factors and related conclusions.
VY® JPMorgan Small Cap Core Equity Portfolio
In considering whether to approve the renewal of the Contracts for VY® JPMorgan Small Cap Core Equity Portfolio, the Board considered that, based on performance data for the periods ended March 31, 2019: (1) the Portfolio is ranked in the first quintile of its Morningstar category for the three-year, five-year and ten-year periods, and the second quintile for the year-to-date and one-year periods; and (2) the Portfolio outperformed its primary benchmark for the three-year, five-year and ten-year periods, and underperformed for the year-to-date and one-year periods.
In considering the fees payable under the Contracts for the Portfolio, the Board took into account the factors described above and also considered: (1) the economies of scale benefits to the Portfolio and its shareholders from breakpoint discounts applicable to the Portfolio’s management fee rate, which result in lower fees at higher asset levels; and (2) the pricing structure (including the net expense ratio to be borne by shareholders) of the Portfolio, as compared to its Selected Peer Group, including that: (a) the net management fee rate for the Portfolio is ranked in the third quintile of net management fee rates of the funds in its Selected Peer Group; (b) the contractual management fee rate for the Portfolio is ranked in the third quintile of contractual management fee rates of the funds in its Selected Peer Group; and (c) the net expense ratio for the Portfolio is ranked in the second quintile of net expense ratios of the funds in its Selected Peer Group. In analyzing this fee data, the Board took into account the expense borne by the Manager for the provision of services to the Portfolio, such as transfer agency, custody, accounting and legal services, pursuant to the Portfolio’s Unified Fee Structure.
After its deliberation, the Board reached the following conclusions: (1) the Portfolio’s management fee rate is reasonable in the context of all factors considered by the Board; (2) the Portfolio’s net expense ratio is reasonable in the context of all factors considered by the Board; (3) the Portfolio’s performance is reasonable in the context of all factors considered by the Board; and (4) the sub-advisory fee rate payable by the Manager to the Sub-Adviser is reasonable in the context of all factors considered by the Board. Based on these conclusions and other factors, the Board voted to renew the Contracts for the Portfolio for the year ending November 30, 2020. During this renewal process, different Board members may have given different weight to different individual factors and related conclusions.
Investment Adviser
Voya Investments, LLC
7337 East Doubletree Ranch Road, Suite 100
Scottsdale, Arizona 85258
Distributor
Voya Investments Distributor, LLC
7337 East Doubletree Ranch Road, Suite 100
Scottsdale, Arizona 85258
Transfer Agent
BNY Mellon Investment Servicing (U.S.) Inc.
301 Bellevue Parkway
Wilmington, Delaware 19809
Independent Registered Public Accounting Firm
KPMG LLP
Two Financial Center
60 South Street
Boston, Massachusetts 02111
Custodian
The Bank of New York Mellon
225 Liberty Street
New York, New York 10286
Legal Counsel
Ropes & Gray LLP
Prudential Tower
800 Boylston Street
Boston, Massachusetts 02199
Before investing, carefully consider the investment objectives, risks, charges and expenses of the variable annuity contract or variable life insurance policy and the underlying variable investment options. This and other information is contained in the prospectus for the variable annuity contract or variable life insurance policy and the underlying variable investment options. Obtain these prospectuses from your agent/registered representative and read them carefully before investing.
RETIREMENT | INVESTMENTS | INSURANCE
voyainvestments.com
VPAR-VIT2AISS2 (1219-022020)


Annual Report
December 31, 2019
| n VY® | | BlackRock Inflation Protected Bond Portfolio
Classes ADV, I and S |
| Voya Variable Insurance Trust |
| n VY® | | BrandywineGLOBAL — Bond Portfolio
(formerly known as VY® Goldman Sachs
Bond Portfolio) |
Beginning on January 1, 2021, as permitted by regulations adopted by the U.S. Securities and Exchange Commission, paper copies of each Portfolio’s annual and semi-annual shareholder reports, like this annual report, will no longer be sent by mail, unless you specifically request paper copies of the reports. Instead, the reports will be made available on a website and you will be notified by mail each time a report is posted and provided with a website link to access the report.
If you already elected to receive shareholder reports electronically, you will not be affected by this change and you need not take any action. You may elect to receive shareholder reports and other communications from your insurance carrier electronically by contacting them directly.
You may elect to receive all future reports in paper free of charge. If you received this document in the mail, please follow the instructions provided to elect to continue receiving paper copies of your shareholder reports. You can inform us that you wish to continue receiving paper copies by calling 1-800-283-3427. Your election to receive reports in paper will apply to all the funds in which you invest. |
This report is submitted for general information to shareholders of the Voya mutual funds. It is not authorized for distribution to prospective shareholders unless accompanied or preceded by a prospectus which includes details regarding the funds’ investment objectives, risks, charges, expenses and other information. This information should be read carefully. |
| | |
| | |
| INVESTMENT MANAGEMENT voyainvestments.com | |
TABLE OF CONTENTS
| | | | | 1 | |
| | | | | 2 | |
| | | | | 4 | |
| | | | | 10 | |
| | | | | 11 | |
| | | | | 12 | |
| | | | | 14 | |
| | | | | 15 | |
| | | | | 16 | |
| | | | | 17 | |
| | | | | 32 | |
| | | | | 50 | |
| | | | | 51 | |
| | | | | 55 | |
PROXY VOTING INFORMATION
A description of the policies and procedures that the Portfolios use to determine how to vote proxies related to portfolio securities is available: (1) without charge, upon request, by calling Shareholder Services toll-free at (800) 992-0180; (2) on the Portfolios’ website at www.voyainvestments.com; and (3) on the U.S. Securities and Exchange Commission’s (“SEC’s”) website at www.sec.gov. Information regarding how the Portfolios voted proxies related to portfolio securities during the most recent 12-month period ended June 30 is available without charge on the Portfolios’ website at www.voyainvestments.com and on the SEC’s website at www.sec.gov.
QUARTERLY PORTFOLIO HOLDINGS
The Portfolios file their complete schedule of portfolio holdings with the SEC for the first and third quarters of each fiscal year on Form N-Q or Form N-PORT, available for filings after March 31, 2019. This report contains a summary portfolio of investments for one of the Portfolios. The Portfolios’ Form N-Q or Form N-PORT is available on the SEC’s website at www.sec.gov. The Portfolios’ complete schedule of portfolio holdings, as filed on Form N-Q or Form N-PORT, are available: on www.voyainvestments.com and without charge upon request from the Portfolio by calling Shareholder Services toll-free at (800) 992-0180.
(THIS PAGE INTENTIONALLY LEFT BLANK)
New season, last year’s plot
Dear Shareholder,
The financial markets delivered strong performance in 2019, and at this juncture, in our view, the outlook for 2020 seems upbeat. Thanks to supportive central bank policies around the world, global economic growth is reaccelerating; manufacturing activity, a key metric for setting market expectations, appears to be strengthening. Recent progress in the trade negotiations between China and the U.S. also helps brighten the outlook as 2020 gets underway.
So expect smooth sailing, right? Maybe. Barely into the first week of the new year, the world faced the prospect of escalating conflict in the Middle East, though tensions appear to have eased since then. Markets initially pulled back in response to heightened uncertainty but regrouped quickly. Follow-on events, if they occur, may not impact markets that much: during 2019, investors generally did well by downplaying geopolitical concerns, and we could see the same behavior in 2020.
Still, we believe that turbulence seems to be the world’s modus operandi: economic and market uncertainty are still with us, trade issues remain unresolved and the upcoming U.S. presidential election adds another dimension of political uncertainty. Even though market participants have become more comfortable accepting risk, we have observed persistent preferences for higher-quality, lower-volatility assets. This tells us that investors perceive significant risks they wish to avoid, and points to the potential for volatile reactions to adverse news.
With potential surprises from anywhere, we believe investors should continue to diversify their portfolios as broadly as practicable, and not attempt to time the markets. At the start of 2019, in our opinion, many investors did not believe U.S. equities offered attractive return potential — acting on that belief would have resulted in missed opportunities. Remember that your portfolio is structured to meet your long-term objectives; changing it in response to short-term market conditions may put your long-term goals at risk. If your goals have changed, please discuss them thoroughly with your investment advisor before making any changes to your portfolio.
Voya seeks to remain a reliable partner committed to reliable investing, helping you and your investment advisor achieve your goals. We appreciate your continued confidence in us, and we look forward to serving your investment needs in the future.
Sincerely,

Dina Santoro
President
Voya Family of Funds
January 21, 2020
The views expressed in the President’s Letter reflect those of the President as of the date of the letter. Any such views are subject to change at any time based upon market or other conditions and the Voya mutual funds disclaim any responsibility to update such views. These views may not be relied on as investment advice and because investment decisions for a Voya mutual fund are based on numerous factors, may not be relied on as an indication of investment intent on behalf of any Voya mutual fund. Reference to specific company securities should not be construed as recommendations or investment advice. International investing poses special risks including currency fluctuation, economic and political risks not found in investments that are solely domestic.
1
MARKET PERSPECTIVE: YEAR ENDED DECEMBER 31, 2019
In our semi-annual report, we described how global equities, in the form of the MSCI World IndexSM (the “Index”) measured in local currencies, including net reinvested dividends, rose 16.69% for the half-year after a nervous start.
A trade war between the U.S. and China had been ongoing for more than a year, with U.S. tariffs on some $250 billion of Chinese goods in place together with Chinese tariffs on $110 billion of U.S. goods. The war was being waged against a backdrop of slowing global growth, in part the result of uncertainties caused by the trade war itself.
Fears on both fronts: the trade war and slowing global growth, would ebb and flow in the second half; yet the Index rose five months out of six, ending the year up 27.34%, just below the record set a few days earlier. (The Index returned 27.67% for the year ended December 31, 2019, measured in U.S. dollars.)
Entering May, trade talks had appeared to be going reasonably well and the path of least resistance for the Index still seemed upwards. This all changed when the President tweeted his intention to raise the existing 10% tariff on $200 billion of the $250 billion to 25% of Chinese goods. Trade negotiations had evidently broken down. Later he unexpectedly threatened tariffs on Mexican goods for reasons unrelated to trade.
On perceived slowing global growth, there was still plenty to worry about.
In Europe, manufacturing was in contraction. The euro zone’s annual growth in gross domestic product (“GDP”) in the second and third quarters of 2019 was just 1.2%. In the U.K., chronic disagreement about whether and how to leave the European Union (“Brexit”) culminated in a general election called for December.
Japan, with manufacturing also in contraction, managed GDP growth of 2.0% annualized in the second quarter, slipping to 1.8% in the third. Exports and imports were both falling and core inflation languished at 0.8%, with a demand-dampening sales tax increase effective on October 1.
China’s GDP grew at 6.0% in the third quarter, the smallest advance in 27 years. Industrial production was expanding near the slowest pace in 17 years, retail sales in 16 years.
In the U.S., manufacturing fell into contraction in September. Corporate profits were flat to falling year-over-year. While annualized first quarter growth had surprised to the upside at 3.1%, it fell to 2.0% and 2.1% in the second and third quarters, respectively. Growth was heavily dependent on consumer spending, supported by the lowest unemployment rate since 1969.
Back in the markets, after May’s slump, central banks came to the rescue in June. On June 19 the Federal Open Market Committee (“FOMC”) left rates unchanged, but markets heard Chairman Powell signal a cut in July. The European Central Bank announced its willingness to cut its already negative deposit rate and resume bond purchases. The Japanese government also promised increased stimulus. Plans for tariffs on Mexican imports were “indefinitely suspended”, and investors were finally left to cheer a truce in the U.S.-China trade conflict, agreed on June 29.
July was a comparatively quiet month. The FOMC duly cut the federal funds rate by 25 basis points (0.25%), but disappointed some, including the President, by referring to it as only a “mid-cycle adjustment”. And it was back to trade-war angst in August, as first the
President announced 10% tariffs on the approximately $300 billion of Chinese imports as yet unaffected, and then increased existing and planned tariffs by 5% when China retaliated.
The market rollercoaster lurched back up in September and October, when high-level trade talks between the U.S. and China resumed. Both sides expressed confidence that “Phase 1” of a deal was possible by year-end. The FOMC cut rates again in both months.
And as year-end approached, a more positive narrative was increasingly heard. Markets were rising despite trade tensions, sluggish global growth, declining profits and political uncertainties in the U.S. and elsewhere. Perhaps, some commentators ventured, this was a signal that the worst was over. The Phase 1 trade deal was announced, amid some skepticism on the details, as was agreement on USMCA, the replacement for NAFTA. The U.K. government’s emphatic election victory might offer more clarity on Brexit. Central banks were all supportive and some of the economic data were starting to improve.
In U.S. fixed income markets, the Treasury yield curve fell. For the year, the Bloomberg Barclays U.S. Aggregate Bond Index rose 8.72%. The Bloomberg Barclays Long-Term U.S. Treasury sub-index returned 14.83%, the 30-year yield briefly dipping below 2% in August. The 10-year yield on Japanese and some euro zone government bonds ended below zero.
U.S. equities, represented by the S&P 500® Index, including dividends, surged 31.49%. Technology was by far the top performer, up 50.29%, led by Apple and Microsoft. Energy, exposed to slowing global economic activity, was the weakest, but still rose 11.81%.
In currencies, the dollar rose 2.04% against the euro, but lost 3.80% against the pound and 0.97% against the yen. On a trade-weighted basis, according to Reuters, the dollar had the smallest annual move ever in 2019.
In international markets, the MSCI Japan® Index ended up 18.48% for the year, supported by the Bank of Japan’s purchases of exchange-traded funds, but pressured by Japan’s own vulnerability to a trade war. The MSCI Europe ex U.K.® Index advanced 26.43%, powered by capital goods and pharmaceuticals companies. The MSCI U.K.® Index rose 16.37%, dampened by Brexit concerns, but also affected by the company-specific fortunes of MSCI U.K.’s market heavyweights. Among the largest contributors were pharmaceuticals, AstraZeneca and GlaxoSmithKline; the biggest detractors were miner Glencore and HSBC.
All indices are unmanaged and investors cannot invest directly in an index. Past performance does not guarantee future results. The performance quoted represents past performance.
Investment return and principal value of an investment will fluctuate, and shares, when redeemed, may be worth more or less than their original cost. Each Portfolio’s performance is subject to change since the period’s end and may be lower or higher than the performance data shown. Please call (800) 992-0180 or log on to www.voyainvestments.com to obtain performance data current to the most recent month end.
Market Perspective reflects the views of Voya Investment Management’s Chief Investment Risk Officer only through the end of the period, and is subject to change based on market and other conditions.
2
BENCHMARK DESCRIPTIONS
| Index | Description |
|---|
| Bloomberg Barclays U.S. Aggregate Bond Index | An index of publicly issued investment grade U.S. government, mortgage-backed, asset-backed and corporate debt securities. |
Bloomberg Barclays Long-Term U.S. Treasury
Index | This index measures the performance of U.S. Treasury bills with long-term maturity. The credit level for this index is investment grade. The rebalance scheme is monthly. |
| Bloomberg Barclays U.S. Treasury Inflation Protected Securities Index | A market index comprised of all U.S. Treasury Inflation Linked Securities. |
MSCI Europe ex U.K.® Index | A free float-adjusted market capitalization index that is designed to measure developed market equity performance in Europe, excluding the UK. |
MSCI Japan® Index | A free float-adjusted market capitalization index that is designed to measure developed market equity performance in Japan. |
MSCI U.K.® Index | A free float-adjusted market capitalization index that is designed to measure developed market equity performance in the UK. |
MSCI World IndexSM | An index that measures the performance of over 1,600 securities listed on exchanges in the U.S., Europe, Canada, Australia, New Zealand and the Far East. |
S&P 500® Index | An index that measures the performance of securities of approximately 500 large-capitalization companies whose securities are traded on major U.S. stock markets. |
3
VY® BLACKROCK INFLATION PROTECTED
BOND PORTFOLIO | PORTFOLIO MANAGERS’ REPORT |
| | |
Investment Type Allocation
as of December 31, 2019
(as a percentage of net assets) |
| U.S. Treasury Obligations | | 50.3 | % |
| Corporate Bonds/Notes | | 25.7 | % |
| U.S. Government Agency Obligations | | 8.8 | % |
| Sovereign Bonds | | 7.2 | % |
| Commercial Mortgage-Backed Securities | | 1.9 | % |
| Asset-Backed Securities | | 1.4 | % |
| Purchased Options | | 0.5 | % |
| Assets in Excess of Other Liabilities* | | 4.2 | % |
| Net Assets | | 100.0 | % |
| | | | |
* Includes short-term investments.Portfolio holdings are subject to change daily. |
| |
VY® BlackRock Inflation Protected Bond Portfolio (the “Portfolio”) seeks to maximize real return, consistent with preservation of real capital and prudent investment management. The Portfolio is managed by Chris Allen, Managing Director and Akiva Dickstein, Managing Director, Portfolio Managers of BlackRock Financial Management, Inc. — the Sub-Adviser.
Performance: For the year ended December 31, 2019, the Portfolio’s Class I shares provided a total return of 8.21% compared to the Bloomberg Barclays U.S. Treasury Inflation Protected Securities (“TIPS”) Index, which returned 8.43% for the same period.
Portfolio Specifics: In the wake of a difficult end to the 2018 year, financial markets rebounded on a dramatic shift in policy stance from the U.S. Federal Reserve Board (“Fed”). The Fed embraced a new philosophy of “patience” and “flexibility”, indicating a pause from its hiking cycle to observe the lagged effects of prior tightening on the economy. This shift supported a “risk-on” tone in the market that was supportive of overall positioning in the first quarter, particularly in spread assets and U.S. breakevens. As geopolitical risks rose in the second quarter around U.S.-China trade negotiations and as the Fed joined central banks globally in a bout of synchronous easing in the third quarter, the Portfolio’s overweight in U.S. real rates also contributed to positive performance. Though the Portfolio’s UK breakevens short detracted from performance throughout most of the year, the eventual breakthrough in Brexit negotiations and Prime Minister Boris Johnson’s election victory helped drive positive performance via the Portfolio’s relative value positioning in U.S. vs. UK breakevens, particularly in the fourth quarter. Detracting from performance was the Portfolio’s U.S. and German nominal rates positioning. Though the team tactically traded rates throughout the year, the Portfolio was broadly biased to be underweight U.S. nominal rates though the second and third quarters. Disappointing manufacturing PMIs in Europe, deteriorating growth conditions abroad, and the inversion of the 3-month/10-year U.S. nominal yield curve in March led rates to rally at the end of the first quarter and that rally persisted through August, adversely affecting the Portfolio’s performance.
Top Ten Holdings
as of December 31, 2019
(as a percentage of net assets) | |
| United States Treasury Inflation Indexed Bonds, 0.875%, 01/15/29 | | 4.9 | % |
| United States Treasury Inflation Indexed Bonds, 0.375%, 01/15/27 | | 4.2 | % |
| United States Treasury Inflation Indexed Bonds, 0.375%, 07/15/27 | | 3.9 | % |
| United States Treasury Inflation Indexed Bonds, 0.500%, 01/15/28 | | 3.2 | % |
| United States Treasury Inflation Indexed Bonds, 0.750%, 07/15/28 | | 3.1 | % |
| United States Treasury Inflation Indexed Bonds, 0.625%, 01/15/26 | | 3.0 | % |
| Fannie Mae, 2.625%, 09/06/24 | | 2.7 | % |
| United States Treasury Inflation Indexed Bonds, 0.125%, 07/15/26 | | 2.6 | % |
| Italy Buoni Poliennali Del Tesoro, 1.300%, 05/15/28 | | 2.4 | % |
| United States Treasury Inflation Indexed Bonds, 0.750%, 02/15/45 | | 2.2 | % |
| | | | |
Portfolio holdings are subject to change daily. |
Market Overview: The global markets in 2019 were influenced by growth concerns and geopolitical uncertainty. The year started with a broad risk-on tone but turned cautionary into the second quarter with a sustained rally in global rates. The flight-to-safety was triggered by rising recession fears, escalating U.S.-China tension, and tightening financial conditions. The trend continued through the third quarter of 2019 when the recession fears swelled to their peak after a slew of negative data surprises around the world. As the year progressed, sentiment turned upbeat when U.S.-China tensions eased, with the two sides striking an unexpected “Phase 1” trade deal in December. The Fed smoothed policy concerns by cutting interest rates three times throughout the year. The Fed also signaled the beginning of the “pause” phase by once again becoming data-dependent and emphasized that any future upward adjustment in rates would need to be warranted by a sharp reversal in data. The European Central Bank (“ECB”) saw a change in leadership, with former Managing Director of the International Monetary Fund Christine Lagarde taking the helm. The ECB restarted its quantitative easing program in November and lowered the deposit rate to –0.5%, reiterating its stance on keeping rates steady or lower unless inflation across the regions shows a meaningful pick-up. In the UK, Brexit made significant progress as Boris Johnson became prime minister in May. In December, Prime Minister Johnson’s Conservative Party notched a crucial landslide win in the UK general election, securing a majority victory that will allow him to proceed with his Brexit plan.
Current Strategy and Outlook: U.S.: We expect growth to remain supported even as the economy continues along into the late-cycle stages of economic expansion. Though we believe that growth has moderated and U.S. exceptionalism is no longer the case, we believe the U.S. consumer has shown signs of continued resilience. With household spending healthy, an unemployment rate at multi-decade lows, and financial conditions accommodative, a recession seems unlikely to occur in the near-term, in our view. Over the course of 2019, the Fed signaled its willingness to take action
4
| PORTFOLIO MANAGERS’ REPORT | VY® BLACKROCK INFLATION PROTECTED
BOND PORTFOLIO |
| | |
in order to “sustain” the current economic expansion, which gave way to more dovish global central banks and helped form the basis of our latest theme around central bank accommodation. From here, we believe the bar for further easing is high, and would necessitate a material growth slowdown (which is unlikely in our view). Around inflation, U.S. core Consumer Price Index (“CPI”) is now running at 2.3% year-over-year — what we believe to be a healthy trend that is partly being supported by tariffs implemented this year. Looking ahead, with the cancellation of future tariffs announced in the “Phase One” deal, we expect only modest new tariff pass-through in coming months. We believe core CPI inflation could peak around 2.4% in early 2020, before gradually easing back to around 2.2% by year-end. With this backdrop in mind, as risk appetite is maintained and global geopolitical risks ease, we believe U.S. breakevens remain attractive. With that said, the U.S. presidential election remains on the horizon and as clarity on the candidates emerges, this may begin to put pressure on risk assets broadly, in our opinion. Though not our base case, we continue to monitor the election events closely going into the new year.
Europe (incl. UK) — Despite the change in leadership at the ECB, a continuation in easy monetary policy is largely expected, in our opinion. Like the Fed, the ECB has similarly resumed growth in its balance sheet, helping to return some liquidity to the market. Policymakers have also become increasingly vocal about the need for fiscal policy, as the efficacy of monetary policy pushes against its limits. Tepid inflation in the region could further support the need for supportive policy, which could in turn create broad-based support for reflationary pressures even as economic data in the region stabilizes. Recent comments on the future path of inflation suggest a central bank willing to wait to see inflation data “robustly converg[ing] to a level sufficiently close to, but below, 2% within its projection horizon”. With this context, we expect core Harmonized Index of Consumer Prices to remain around ˜1.30% into 2020, maintained in part by an accommodative ECB and the weakness found in the currency over the past year. With core European breakeven levels at their lows, we find valuations to be what we believe to be attractive and maintain our long expressions in the region. In the UK, the recent developments around the general elections and Brexit more broadly suggest a retracement in elevated political risks found in the area. With the probability of a “no-deal” Brexit diminished, any Brexit-related pass-through effects to inflation is likely to be tempered and fade over time. We thus favor short breakeven expressions in the UK.
In Japan— Monetary policy is expected to remain easy in Japan, with rates below equilibrium levels. Given the persistent inflation undershoots, the Bank of Japan (“BoJ”) is expected to deliver further monetary policy and/or enact fiscal stimulus. In spite of this environment, we remain cognizant of the BoJ’s limited policy space to lower rates further, however, and the side effects of negative rates — particularly on banks’ profitability and their ability to lend — could increasingly undermine their policy efforts. Around inflation, we continue to monitor the path of inflation in Japan closely. The highly anticipated upward inflationary pressures from the VAT hike in October produced more anemic results than expected (especially when compared to the impact seen in 2014), removing a key tailwind to our position. Despite this, we remain constructive in our positioning, with broad-based upticks in rental prices across the region providing support to the inflation regime in Japan. With this in mind, in conjunction with sustained accommodative policy from the BoJ, we thus continue to prefer overweight expressions in Japanese real rates and breakevens.
The views expressed in this commentary are informed opinions. They should not be considered promises or advice. The views expressed reflect those of the portfolio managers, only through the end of the period as stated on the cover. The portfolio managers’ views are subject to change at any time based on market and other conditions.
Portfolio holdings and characteristics are subject to change and may not be representative of current holdings and characteristics. Portfolio holdings are subject to change daily. The outlook for this Portfolio may differ from that presented for other Voya mutual funds. This report contains statements that may be “forward-looking” statements. Actual results may differ materially from those projected in the “forward-looking” statements. The Portfolio’s performance returns shown reflect applicable fee waivers and/or expense limits in effect during this period. Absent such fee waivers/expense limitations, if any, performance would have been lower. Performance for the different classes of shares will vary based on differences in fees associated with each class. An index has no cash in its portfolio and imposes no sales charges. An investor cannot invest directly in an index.
5
VY® BLACKROCK INFLATION PROTECTED
BOND PORTFOLIO | PORTFOLIO MANAGERS’ REPORT |
| | |
| | Average Annual Total Returns for the Periods Ended December 31, 2019 | |
|---|
| | | | 1 Year | | 5 Year | | 10 Year | |
|---|
| | Class ADV | | | 7.53 | % | | | 1.46 | % | | | 2.18 | % | |
| | Class I | | | 8.21 | % | | | 2.07 | % | | | 2.81 | % | |
| | Class S | | | 8.01 | % | | | 1.81 | % | | | 2.56 | % | |
| | TIPS Index | | | 8.43 | % | | | 2.62 | % | | | 3.36 | % | |
Based on a $10,000 initial investment, the graph and table above illustrate the total return of VY® BlackRock Inflation Protected Bond Portfolio against the index indicated. The index is unmanaged and has no cash in its portfolio and imposes no sales charges. An investor cannot invest directly in an index.
The Portfolio’s performance is shown without the imposition of any expenses or charges which are, or may be, imposed under your variable annuity contract or variable life insurance policy. Total returns would have been lower if such expenses or charges were included.
The performance graph and table do not reflect the deduction of taxes that a shareholder will pay on Portfolio distributions or the redemption of Portfolio shares.
The performance shown may include the effect of fee waivers and/or expense reimbursements by the Investment Adviser and/or other service
providers, which have the effect of increasing total return. Had all fees and expenses been considered, the total returns would have been lower.
The performance update illustrates performance for a variable investment option available through a variable annuity contract or a variable life insurance policy. The performance shown indicates past performance and is not a projection or prediction of future results. Actual investment returns and principal value will fluctuate so that shares and/or units, at redemption, may be worth more or less than their original cost. Please log on to www.voyainvestments.com or call (800) 366-0066 to get performance through the most recent month end.
Portfolio holdings are subject to change daily.
6
| PORTFOLIO MANAGERS’ REPORT | VY® BRANDYWINEGLOBAL —
BOND PORTFOLIO
|
| | |
Investment Type Allocation
as of December 31, 2019
(as a percentage of net assets) |
| U.S. Treasury Obligations | | 48.9 | % |
| Corporate Bonds/Notes | | 32.8 | % |
| U.S. Government Agency Obligations | | 16.9 | % |
| Municipal Bonds | | 0.0 | % |
| Assets in Excess of Other Liabilities* | | 1.4 | % |
| Net Assets | | 100.0 | % |
| | | | |
* Includes short-term investments.Portfolio holdings are subject to change daily. |
| |
VY® BrandywineGLOBAL — Bond Portfolio* (the “Portfolio”) seeks total return consisting of capital appreciation and income. The Portfolio is managed by David F. Hoffman, CFA, John P. McIntyre, CFA, Anujeet Sareen, CFA, and Stephen S. Smith, Portfolio Managers of Brandywine Global Investment Management, LLC (“Brandywine”). — the Sub-Adviser.
Performance: For the year-ended December 31, 2019, the Portfolio’s shares provided a total return of 10.12% compared to the Bloomberg Barclays U.S. Aggregate Bond Index, which returned 8.72% for the same period.
Portfolio Specifics** — Goldman Sachs Asset Management, L.P. (“Goldman Sachs”) — January 1, 2019 — July 26, 2019: From the period beginning January 1, 2019, through July 26, 2019, the Portfolio outperformed the Bloomberg Barclays U.S. Aggregate Bond Index by approximately 120 basis points (1.20%). Markets experienced a broad-based rally year-to-date in 2019, driven by a dovish tilt in global monetary policy, alongside renewed confidence in modest economic growth. At the June U.S. Federal Reserve Board (“Fed”) meeting, the median projected hiking path in the U.S. declined, with eight Federal Open Market Committee participants projecting rate cuts this year. Similarly, a dovish speech by outgoing European Central Bank President Mario Draghi signaled forthcoming easing in the euro zone. Spread sectors tightened alongside a rally in rates. The Portfolio outperformed the Bloomberg Barclays U.S. Aggregate Bond Index over the period, largely due to sector positioning, relative value country positioning and corporate credit selection. Within our sector strategy, gains were primarily driven by our overweight to corporate credit, both investment-grade and high-yield, paired with a long U.S. rate hedge. Within our country strategy, gains were primarily driven by the Portfolio’s long European interest rate positions versus a number of other developed markets, such as Sweden and Japan. The Portfolio also benefited from a long U.S. inflation versus short UK inflation position. Within our corporate selection strategy, an overweight to shorter-maturity corporates, as well as selection of individual industrial corporate bonds, were additive for returns. There were no material detractors from performance over the reporting period. The Portfolio employed a number of derivative instruments, including currency forwards, Treasury futures, interest rate swaps and credit default swaps, all of which contributed to returns.
Top Ten Holdings
as of December 31, 2019
(as a percentage of net assets) | |
|---|
United States Treasury Floating Rate Note,
1.746%, 07/31/21 | | 27.7 | % |
United States Treasury Floating Rate Note,
1.665%, 04/30/21 | | 13.5 | % |
| Fannie Mae, 1.500%, 07/30/20 | | 11.5 | % |
| Federal Home Loan Banks, 1.875%, 07/07/21 | | 5.4 | % |
Hewlett Packard Enterprise Co.,
6.350%, 10/15/45 | | 4.9 | % |
Anheuser-Busch InBev Worldwide, Inc.,
5.450%, 01/23/39 | | 4.6 | % |
United States Treasury Bond,
2.875%, 05/15/49 | | 3.9 | % |
United States Treasury Floating Rate Note,
1.826%, 10/31/21 | | 3.8 | % |
| Micron Technology, Inc., 5.327%, 02/06/29 | | 3.4 | % |
Dell International LLC / EMC Corp.,
5.300%, 10/01/29 | | 3.3 | % |
| | | | |
Portfolio holdings are subject to change daily. |
Portfolio Specifics** — Brandywine — August 9, 2019 — December 31, 2019: From the period beginning August 9, 2019 through December 31, 2019, the Portfolio outperformed the Bloomberg Barclays U.S. Aggregate Bond Index by approximately 24 basis points (0.24%). In early August, we transitioned the Portfolio and actively increased our U.S. Treasury duration. The rationale for this increase was slowing economic data in the U.S., new rounds of tariffs by the Trump Administration, and a hawkish rate cut by the Fed in July. We were concerned that a deteriorating trade situation and overly hawkish Fed could cause rates to fall further and possibly push the U.S. economy closer to a recession. This increase in treasury duration contributed to performance in August as yields fell.
By mid-September the trade situation with China began to improve as both countries agreed to further trade talks and additional exemptions. Also, in mid-September the Fed cut rates for a second time in 2019 and provided dovish comments with a commitment to sustaining the current expansion. With both developments supportive of growth stabilization and with valuations looking expensive in our view, we elected to reduce our U.S. Treasury duration significantly, taking an underweight position versus the Bloomberg Barclays U.S. Aggregate Bond Index. We became more convinced that rates in the U.S. had likely bottomed for the time being. This underweight position contributed to relative returns in the latter part of the year.
As the remainder of the year progressed, we saw, in our view, an improving trade situation, large scale of stimulus in the U.S. and globally as well as what we believed to be diminished recession risks. During this time, we continued to further reduce our U.S. Treasury duration position and overall duration exposure in the Portfolio. In addition to our U.S. Treasury exposure, we maintained exposure throughout the period to a number of high-quality investment grade corporate positions that offered what we believed to be a compelling yield and attractive valuation. These positions contributed to performance during the period.
7
VY® BRANDYWINEGLOBAL —
BOND PORTFOLIO | PORTFOLIO MANAGERS’ REPORT |
| | |
Current Strategy and Outlook: Our outlook for 2020 calls for growth stabilization and improvement both in the U.S. and globally. We believe the large scale of global stimulus combined with an improved trade backdrop should pave the way for a growth impulse later in the year along with possibly higher interest rates in the US. As such, we are biased to potentially reduce our U.S. Treasury duration further in 2020 along with select corporate credit positions. Corporate spreads have narrowed and valuations, in our view, look less attractive in some cases. In our opinion, potential risks for the year include: U.S. elections, geopolitical tensions in the Middle East and trade negotiations.
| * | | Effective August 9, 2019, Goldman Sachs was removed as the sub-adviser of the Portfolio and replaced with Brandywine. In conjunction with the sub-adviser change, David F. Hoffman, John P. McIntyre, Anujeet Sareen, and Stephen S. Smith were added as portfolio managers to the Portfolio and Michael Swell and Ashish Shad were removed as portfolio managers to the Portfolio. Effective August 9, 2019, the Portfolio’s name changed to “VY® BrandywineGLOBAL — Bond Portfolio. |
| ** | | Beginning July 26, 2019, through the close of business on August 23, 2019, the Portfolio was in a transition period and may have held a large portion of the Portfolio’s assets in temporary investments. |
The views expressed in this commentary are informed opinions. They should not be considered promises or advice. The views expressed reflect those of the portfolio managers, only through the end of the period as stated on the cover. The portfolio managers’ views are subject to change at any time based on market and other conditions.
Portfolio holdings and characteristics are subject to change and may not be representative of current holdings and characteristics. Portfolio holdings are subject to change daily. The outlook for this Portfolio may differ from that presented for other Voya mutual funds. This report contains statements that may be ”forward-looking“ statements. Actual results may differ materially from those projected in the ”forward-looking“ statements. The Portfolio’s performance returns shown reflect applicable fee waivers and/or expense limits in effect during this period. Absent such fee waivers/expense limitations, if any, performance would have been lower. Performance for the different classes of shares will vary based on differences in fees associated with each class. An index has no cash in its portfolio and imposes no sales charges. An investor cannot invest directly in an index.
8
| PORTFOLIO MANAGERS’ REPORT | VY® BRANDYWINEGLOBAL —
BOND PORTFOLIO |
| | |

| | Average Annual Total Returns for the Periods Ended December 31, 2019 | |
|---|
| | | | | 1 Year | | Since Inception
February 20, 2015 | |
|---|
| | VY® BrandywineGLOBAL — Bond Portfolio | | | | 10.12 | % | | | 2.87 | % | |
| | Bloomberg Barclays U.S. Aggregate Bond Index | | | | 8.72 | % | | | 3.04 | % | |
Based on a $10,000 initial investment, the graph and table above illustrate the total return of VY® BrandywineGLOBAL — Bond Portfolio against the index indicated. The index is unmanaged and has no cash in its portfolio and imposes no sales charges. An investor cannot invest directly in an index.
The Portfolio’s performance is shown without the imposition of any expenses or charges which are, or may be, imposed under your variable annuity contract and/or variable life insurance policy. Total returns would have been lower if such expenses or charges were included.
The performance graph and table do not reflect the deduction of taxes that a shareholder will pay on Portfolio distributions or the redemption of Portfolio shares.
The performance shown may include the effect of fee waivers and/or expense reimbursements by the Investment Adviser and/or other service
providers, which have the effect of increasing total return. Had all fees and expenses been considered, the total returns would have been lower.
The performance update illustrates performance for a variable investment option available through a variable annuity contract and/or a variable life insurance policy. The performance shown indicates past performance and is not a projection or prediction of future results. Actual investment returns and principal value will fluctuate so that shares and/or units, at redemption, may be worth more or less than their original cost. Please log on to www.voyainvestments.com or call (800) 992-0180 to get performance through the most recent month end.
Portfolio holdings are subject to change daily.
Prior to August 9, 2019, the Portfolio was managed by a different sub-adviser.
9
SHAREHOLDER EXPENSE EXAMPLES (UNAUDITED)
As a shareholder of a Portfolio, you incur two types of costs: (1) transaction costs, including redemption fees and exchange fees; and (2) ongoing costs, including management fees, distribution and/or service (12b-1) fees and other Portfolio expenses. These Examples are intended to help you understand your ongoing costs (in dollars) of investing in a Portfolio and to compare these costs with the ongoing costs of investing in other mutual funds.
The Examples are based on an investment of $1,000 invested at the beginning of the period and held for the entire period from July 1, 2019 to December 31, 2019. The Portfolios’ expenses are shown without the imposition of any charges which are, or may be, imposed under your variable annuity contract, variable life insurance policy, qualified pension, or retirement plan. Expenses would have been higher if such charges were included.
Actual Expenses
The left section of the table shown below, “Actual Portfolio Return,” provides information about actual account values and actual expenses. You may use the information in this section, together with the amount you invested, to estimate the expenses that you paid over the period. Simply divide your account value by $1,000 (for example, an $8,600 account value divided by $1,000 = 8.6), then multiply the result by the number in the first section under the heading entitled “Expenses Paid During the Period” to estimate the expenses you paid on your account during this period.
Hypothetical Example for Comparison Purposes
The right section of the table shown below, “Hypothetical (5% return before expenses),” provides information about hypothetical account values and hypothetical expenses based on a Portfolio’s actual expense ratio and an assumed rate of return of 5% per year before expenses, which is not a Portfolio’s actual return. The hypothetical account values and expenses may not be used to estimate the actual ending account balance or expenses you paid for the period. You may use this information to compare the ongoing costs of investing in a Portfolio and other mutual funds. To do so, compare this 5% hypothetical example with the 5% hypothetical examples that appear in the shareholder reports of the other mutual funds.
Please note that the expenses shown in the table are meant to highlight your ongoing costs only and do not reflect any transactional costs, such as redemption fees or exchange fees. Therefore, the hypothetical section of the table is useful in comparing ongoing costs only, and will not help you determine the relative total costs of owning different mutual funds. In addition, if these transactional costs were included, your costs would have been higher.
| | | | Actual Portfolio Return | | Hypothetical (5% return before expenses) | |
|---|
| | | | Beginning
Account
Value
July 1,
2019 | | Ending
Account
Value
December 31,
2019 | | Annualized
Expense
Ratio | | Expenses Paid
During the
Period Ended
December 31,
2019* | | Beginning
Account
Value
July 1,
2019 | | Ending
Account
Value
December 31,
2019 | | Annualized
Expense
Ratio | | Expenses Paid
During the
Period Ended
December 31,
2019* | |
|---|
| | VY® BlackRock Inflation Protected Bond Portfolio | |
| | Class ADV | | $ | 1,000.00 | | | $ | 1,018.30 | | | | 1.16 | % | | $ | 5.90 | | | $ | 1,000.00 | | | $ | 1,019.36 | | | | 1.16 | % | | $ | 5.90 | | |
| | Class I | | | 1,000.00 | | | | 1,021.70 | | | | 0.56 | | | | 2.85 | | | | 1,000.00 | | | | 1,022.38 | | | | 0.56 | | | | 2.85 | | |
| | Class S | | | 1,000.00 | | | | 1,020.60 | | | | 0.81 | | | | 4.13 | | | | 1,000.00 | | | | 1,021.12 | | | | 0.81 | | | | 4.13 | | |
| | | | | | | | | | | | | | | | | | | | | | | | | | | | | | | | | | | |
| | VY® BrandywineGLOBAL — Bond Portfolio | |
| | | | $ | 1,000.00 | | | $ | 1,026.30 | | | | 0.58 | % | | $ | 2.96 | | | $ | 1,000.00 | | | $ | 1,022.28 | | | | 0.58 | % | | $ | 2.96 | | |
| * | | Expenses are equal to each Portfolio’s respective annualized expense ratios multiplied by the average account value over the period, multiplied by 184/365 to reflect the most recent fiscal half-year. |
10
REPORT OF INDEPENDENT REGISTERED PUBLIC ACCOUNTING FIRM
To the Shareholders of the Funds and Boards of Trustees
Voya Investors Trust and Voya Variable Insurance Trust:
Opinion on the Financial Statements
We have audited the accompanying statements of assets and liabilities of VY® BlackRock Inflation Protected Bond Portfolio and VY® BrandywineGLOBAL — Bond Portfolio (formerly VY® Goldman Sachs Bond Portfolio) (the Funds), each a series of Voya Investors Trust and Voya Variable Insurance Trust, respectively, including the summary portfolios of investments, as of December 31, 2019, the related statements of operations for the year then ended, the statements of changes in net assets for each of the years in the two-year period then ended, and the related notes (collectively, the financial statements) and the financial highlights for each of the years or periods in the five-year period then ended. In our opinion, the financial statements and financial highlights present fairly, in all material respects, the financial position of the Funds as of December 31, 2019, the results of their operations for the year then ended, the changes in their net assets for each of the years in the two-year period then ended, and the financial highlights for each of the years or periods in the five-year period then ended, in conformity with U.S. generally accepted accounting principles.
Basis for Opinion
These financial statements and financial highlights are the responsibility of the Funds’ management. Our responsibility is to express an opinion on these financial statements and financial highlights based on our audits. We are a public accounting firm registered with the Public Company Accounting Oversight Board (United States) (PCAOB) and are required to be independent with respect to the Funds in accordance with the U.S. federal securities laws and the applicable rules and regulations of the Securities and Exchange Commission and the PCAOB.
We conducted our audits in accordance with the standards of the PCAOB. Those standards require that we plan and perform the audit to obtain reasonable assurance about whether the financial statements and financial highlights are free of material misstatement, whether due to error or fraud. Our audits included performing procedures to assess the risks of material misstatement of the financial statements and financial highlights, whether due to error or fraud, and performing procedures that respond to those risks. Such procedures included examining, on a test basis, evidence regarding the amounts and disclosures in the financial statements and financial highlights. Such procedures also included confirmation of securities owned as of December 31, 2019, by correspondence with the custodian and brokers or by other appropriate auditing procedures when replies from brokers were not received. Our audits also included evaluating the accounting principles used and significant estimates made by management, as well as evaluating the overall presentation of the financial statements and financial highlights. We believe that our audits provide a reasonable basis for our opinion.
We have served as the auditor of one or more Voya investment companies since 1975.
Boston, Massachusetts
February 21, 2020
11
STATEMENTS OF ASSETS AND LIABILITIES AS OF DECEMBER 31, 2019 | | VY®
BlackRock
Inflation
Protected
Bond
Portfolio | | VY®
BrandywineGLOBAL —
Bond
Portfolio |
|---|
ASSETS: | | | | | | | | |
| Investments in securities at fair value* | | $ | 266,333,739 | | | $ | 180,212,402 | |
| Short-term investments at fair value** | | | 1,677,355 | | | | 2,050,563 | |
| Cash | | | 574,997 | | | | — | |
| Cash collateral for futures | | | 5,375 | | | | — | |
| Cash pledged for centrally cleared swaps (Note 2) | | | 3,143,490 | | | | — | |
| Cash pledged as collateral for OTC derivatives (Note 2) | | | 160,000 | | | | — | |
| Foreign currencies at value*** | | | 5,067,700 | | | | — | |
| Receivables: | | | | | | | | |
| Investment securities sold | | | 605,341 | | | | — | |
| Fund shares sold | | | 1,193,429 | | | | 39,456 | |
| Dividends | | | 5,140 | | | | 3,733 | |
| Interest | | | 1,231,719 | | | | 1,192,566 | |
| Unrealized appreciation on forward foreign currency contracts | | | 61,470 | | | | — | |
| Unrealized appreciation on OTC swap agreements | | | 1,366,271 | | | | — | |
| Variation margin receivable on centrally cleared swaps | | | 50,729 | | | | — | |
| Prepaid expenses | | | 1,885 | | | | 1,328 | |
| Other assets | | | 19,679 | | | | 5,045 | |
| Total assets | | | 281,498,319 | | | | 183,505,093 | |
| | | | | | | | | |
LIABILITIES: | | | | | | | | |
| Payable for investment securities purchased | | | 4,142 | | | | — | |
| Payable for fund shares redeemed | | | 147,242 | | | | 274,761 | |
| Payable for foreign cash collateral for futures**** | | | 33,682 | | | | — | |
| Unrealized depreciation on forward foreign currency contracts | | | 318,897 | | | | — | |
| Cash received as collateral for OTC derivatives (Note 2) | | | 1,350,000 | | | | — | |
| Payable for investment management fees | | | 117,070 | | | | 238,283 | |
| Payable for distribution and shareholder service fees | | | 53,311 | | | | — | |
| Payable to trustees under the deferred compensation plan (Note 6) | | | 19,679 | | | | 5,045 | |
| Payable for trustee fees | | | 1,386 | | | | 900 | |
| Other accrued expenses and liabilities | | | 50,988 | | | | 94,095 | |
| Written options, at fair valueˆ | | | 1,444,151 | | | | — | |
| Total liabilities | | | 3,540,548 | | | | 613,084 | |
NET ASSETS | | $ | 277,957,771 | | | $ | 182,892,009 | |
| | | | | | | | | |
NET ASSETS WERE COMPRISED OF: | | | | | | | | |
| Paid-in capital | | $ | 348,848,416 | | | $ | 174,641,243 | |
| Total distributable earnings (loss) | | | (70,890,645 | ) | | | 8,250,766 | |
NET ASSETS | | $ | 277,957,771 | | | $ | 182,892,009 | |
| | | | | | | | |
| * | | Cost of investments in securities | | $ | 257,431,946 | | | $ | 179,710,919 | |
| ** | | Cost of short-term investments | | $ | 1,677,355 | | | $ | 2,049,245 | |
| *** | | Cost of foreign currencies | | $ | 5,009,476 | | | $ | — | |
| **** | | Cost of payable for foreign cash collateral for futures | | $ | 33,682 | | | $ | — | |
| ˆ | | Premiums received on written options | | $ | 1,910,301 | | | $ | — | |
See Accompanying Notes to Financial Statements
12
STATEMENTS OF ASSETS AND LIABILITIES AS OF DECEMBER 31, 2019 (CONTINUED)
| | VY®
BlackRock
Inflation
Protected
Bond
Portfolio | | VY®
BrandywineGLOBAL —
Bond
Portfolio |
|---|
Class ADV | | | | | | | | |
| Net assets | | $ | 44,884,972 | | | | n/a | |
| Shares authorized | | | unlimited | | | | n/a | |
| Par value | | $ | 0.001 | | | | n/a | |
| Shares outstanding | | | 4,763,300 | | | | n/a | |
| Net asset value and redemption price per share | | $ | 9.42 | | | | n/a | |
| | | | | | | | | |
Class I | | | | | | | | |
| Net assets | | $ | 88,759,302 | | | | n/a | |
| Shares authorized | | | unlimited | | | | n/a | |
| Par value | | $ | 0.001 | | | | n/a | |
| Shares outstanding | | | 9,078,058 | | | | n/a | |
| Net asset value and redemption price per share | | $ | 9.78 | | | | n/a | |
| | | | | | | | | |
Class S | | | | | | | | |
| Net assets | | $ | 144,313,497 | | | | n/a | |
| Shares authorized | | | unlimited | | | | n/a | |
| Par value | | $ | 0.001 | | | | n/a | |
| Shares outstanding | | | 14,880,941 | | | | n/a | |
| Net asset value and redemption price per share | | $ | 9.70 | | | | n/a | |
| | | | | | | | | |
Portfolio(1) | | | | | | | | |
| Net assets | | | n/a | | | $ | 182,892,009 | |
| Shares authorized | | | n/a | | | | unlimited | |
| Par value | | | n/a | | | $ | 0.001 | |
| Shares outstanding | | | n/a | | | | 17,396,207 | |
| Net asset value and redemption price per share | | | n/a | | | $ | 10.51 | |
| | | | | | | | | |
(1) Portfolio does not have a share class designation. |
See Accompanying Notes to Financial Statements
13
STATEMENTS OF OPERATIONS FOR THE YEAR ENDED DECEMBER 31, 2019 | | VY®
BlackRock
Inflation
Protected
Bond
Portfolio | | VY®
BrandywineGLOBAL —
Bond
Portfolio |
|---|
| | | | | | | | |
|---|
INVESTMENT INCOME: | | | | | | | | |
| Dividends | | $ | 47,282 | | | $ | 288,161 | |
| Interest, net of foreign taxes withheld* | | | 6,689,138 | | | | 5,216,824 | |
| Securities lending income, net | | | — | | | | 1,516 | |
| Total investment income | | | 6,736,420 | | | | 5,506,501 | |
| | | | | | | | | |
EXPENSES: | | | | | | | | |
| Investment management fees | | | 1,485,779 | | | | 899,399 | |
| Distribution and shareholder service fees: | | | | | | | | |
| Class ADV | | | 268,408 | | | | — | |
| Class S | | | 378,086 | | | | — | |
| Transfer agent fees | | | 423 | | | | 990 | |
| Shareholder reporting expense | | | 14,600 | | | | 11,690 | |
| Professional fees | | | 56,830 | | | | 76,290 | |
| Custody and accounting expense | | | 82,017 | | | | 87,110 | |
| Trustee fees | | | 11,086 | | | | 7,195 | |
| Miscellaneous expense | | | 11,480 | | | | 12,210 | |
| Interest expense | | | 248 | | | | 1,859 | |
| Total expenses | | | 2,308,957 | | | | 1,096,743 | |
| Waived and reimbursed fees | | | (110,863 | ) | | | (46,992 | ) |
| Net expenses | | | 2,198,094 | | | | 1,049,751 | |
| Net investment income | | | 4,538,326 | | | | 4,456,750 | |
| | | | | | | | | |
REALIZED AND UNREALIZED GAIN (LOSS): | | | | | | | | |
| Net realized gain (loss) on: | | | | | | | | |
| Investments | | | 4,054,114 | | | | 6,500,893 | |
| Forward foreign currency contracts | | | 1,085,534 | | | | 302,357 | |
| Foreign currency related transactions | | | 201,323 | | | | 348 | |
| Futures | | | (709,522 | ) | | | 2,916,088 | |
| Swaps | | | (1,652,067 | ) | | | 675,838 | |
| Written options | | | (3,731 | ) | | | — | |
| Net realized gain | | | 2,975,651 | | | | 10,395,524 | |
| Net change in unrealized appreciation (depreciation) on: | | | | | | | | |
| Investments | | | 12,790,292 | | | | 3,252,455 | |
| Forward foreign currency contracts | | | (259,851 | ) | | | 80,065 | |
| Foreign currency related transactions | | | 57,810 | | | | 9,146 | |
| Futures | | | (452,826 | ) | | | (587,337 | ) |
| Swaps | | | 788,552 | | | | (102,887 | ) |
| Written options | | | 522,522 | | | | — | |
| Sales commitments | | | — | | | | 63,263 | |
| Net change in unrealized appreciation (depreciation) | | | 13,446,499 | | | | 2,714,705 | |
| Net realized and unrealized gain | | | 16,422,150 | | | | 13,110,229 | |
Increase in net assets resulting from operations | | $ | 20,960,476 | | | $ | 17,566,979 | |
| | | | | | | | |
| * | | Foreign taxes withheld | | $ | 263 | | | $ | 148 | |
See Accompanying Notes to Financial Statements
14
STATEMENTS OF CHANGES IN NET ASSETS | | VY® BlackRock Inflation
Protected Bond Portfolio | | VY® BrandywineGLOBAL —
Bond Portfolio |
|---|
| | Year Ended
December 31,
2019 | | Year Ended
December 31,
2018 | | Year Ended
December 31,
2019 | | Year Ended
December 31,
2018 |
|---|
FROM OPERATIONS: | | | | | | | | | | | | | | | | |
| Net investment income | | $ | 4,538,326 | | | $ | 7,281,137 | | | $ | 4,456,750 | | | $ | 5,521,745 | |
| Net realized gain (loss) | | | 2,975,651 | | | | (2,607,768 | ) | | | 10,395,524 | | | | (7,273,128 | ) |
| Net change in unrealized appreciation (depreciation) | | | 13,446,499 | | | | (12,801,084 | ) | | | 2,714,705 | | | | (1,982,360 | ) |
| Increase (decrease) in net assets resulting from operations | | | 20,960,476 | | | | (8,127,715 | ) | | | 17,566,979 | | | | (3,733,743 | ) |
| | | | | | | | | | | | | | | | | |
FROM DISTRIBUTIONS TO SHAREHOLDERS: | | | | | | | | | | | | | | | | |
| Total distributions (excluding return of capital): | | | | | | | | | | | (3,417,729 | ) | | | (4,674,679 | ) |
| Class ADV | | | (858,621 | ) | | | (773,589 | ) | | | — | | | | — | |
| Class I | | | (1,810,500 | ) | | | (4,466,157 | ) | | | — | | | | — | |
| Class S | | | (3,314,035 | ) | | | (3,312,376 | ) | | | — | | | | — | |
| Total distributions | | | (5,983,156 | ) | | | (8,552,122 | ) | | | (3,417,729 | ) | | | (4,674,679 | ) |
| | | | | | | | | | | | | | | | | |
FROM CAPITAL SHARE TRANSACTIONS: | | | | | | | | | | | | | | | | |
| Net proceeds from sale of shares | | | 68,026,433 | | | | 58,568,404 | | | | 43,513,332 | | | | 48,161,227 | |
| Reinvestment of distributions | | | 5,983,156 | | | | 8,552,121 | | | | 3,417,729 | | | | 4,674,679 | |
| | | | 74,009,589 | | | | 67,120,525 | | | | 46,931,061 | | | | 52,835,906 | |
| Cost of shares redeemed | | | (49,588,217 | ) | | | (246,003,242 | ) | | | (72,346,903 | ) | | | (65,220,660 | ) |
| Net increase (decrease) in net assets resulting from capital share transactions | | | 24,421,372 | | | | (178,882,717 | ) | | | (25,415,842 | ) | | | (12,384,754 | ) |
| Net increase (decrease) in net assets | | | 39,398,692 | | | | (195,562,554 | ) | | | (11,266,592 | ) | | | (20,793,176 | ) |
| | | | | | | | | | | | | | | | | |
NET ASSETS: | | | | | | | | | | | | | | | | |
| Beginning of year or period | | | 238,559,079 | | | | 434,121,633 | | | | 194,158,601 | | | | 214,951,777 | |
| End of year or period | | $ | 277,957,771 | | | $ | 238,559,079 | | | $ | 182,892,009 | | | $ | 194,158,601 | |
See Accompanying Notes to Financial Statements
15
Selected data for a share of beneficial interest outstanding throughout each year or period.
| | | | | | | Income (loss)
from
investment
operations | | | | | | | Less distributions | | | | | | | | | | | | | | | | | | Ratios to average
net assets | | Supplemental
data |
|---|
| | | Net asset value, beginning
of year or period | | Net investment income (loss) | | Net realized and unrealized
gain (loss) | | Total from investment
operations | | From net investment income | | From net realized gains | | From return of capital | | Total distributions | | Payment by affiliate | | Net asset value,
end of year or period | | Total Return(1) | | Expenses before reductions/
additions(2)(3)(4) | | Expenses net of fee waivers
and/or recoupments
if any(2)(3)(4) | | Expense
net of all
reductions/
additions(2)(3)(4) | | Net investment income
(loss)(2)(3) | | Net assets, end of year or
period | | Portfolio turnover rate |
|---|
| Year or period ended | | | ($) | | | | ($) | | | | ($) | | | | ($) | | | | ($) | | | | ($) | | | | ($) | | | | ($) | | | | ($) | | | | ($) | | | | (%) | | | | (%) | | | | (%) | | | | (%) | | | | (%) | | | | ($000’s) | | | | (%) | |
|---|
VY® BlackRock Inflation Protected Bond Portfolio |
| Class ADV | | | | | | | | | | | | | | | | | | | | | | | | | | | | | | | | | | | | | | | | | | | | | | | | | | | | | | | | | | | | | | | | | | | | |
| 12-31-19 | | | 8.93 | | | | 0.11 | | | | 0.56 | | | | 0.67 | | | | 0.18 | | | | — | | | | — | | | | 0.18 | | | | — | | | | 9.42 | | | | 7.53 | | | | 1.20 | | | | 1.16 | | | | 1.16 | | | | 1.23 | | | | 44,885 | | | | 72 | |
| 12-31-18 | | | 9.30 | | | | 0.14 | | | | (0.36 | ) | | | (0.22 | ) | | | 0.15 | | | | — | | | | — | | | | 0.15 | | | | — | | | | 8.93 | | | | (2.39 | ) | | | 1.18 | | | | 1.14 | | | | 1.14 | | | | 1.47 | | | | 44,035 | | | | 63 | |
| 12-31-17 | | | 9.17 | | | | 0.09 | | | | 0.11 | | | | 0.20 | | | | 0.07 | | | | — | | | | — | | | | 0.07 | | | | — | | | | 9.30 | | | | 2.16 | | | | 1.17 | | | | 1.13 | | | | 1.13 | | | | 0.94 | | | | 49,769 | | | | 101 | |
| 12-31-16 | | | 8.88 | | | | 0.05 | | | | 0.24 | | | | 0.29 | | | | — | | | | — | | | | — | | | | — | | | | — | | | | 9.17 | | | | 3.27 | | | | 1.21 | | | | 1.12 | | | | 1.12 | | | | 0.53 | | | | 52,110 | | | | 73 | |
| 12-31-15 | | | 9.24 | | | | (0.05 | ) | | | (0.22 | ) | | | (0.27 | ) | | | 0.09 | | | | — | | | | 0.00 | * | | | 0.09 | | | | — | | | | 8.88 | | | | (2.89 | ) | | | 1.30 | | | | 1.11 | | | | 1.11 | | | | (0.52 | ) | | | 54,750 | | | | 470 | |
Class I | | | | | | | | | | | | | | | | | | | | | | | | | | | | | | | | | | | | | | | | | | | | | | | | | | | | | | | | | | | | | | | | | | | | |
| 12-31-19 | | | 9.26 | | | | 0.18 | | | | 0.57 | | | | 0.75 | | | | 0.23 | | | | — | | | | — | | | | 0.23 | | | | — | | | | 9.78 | | | | 8.21 | | | | 0.60 | | | | 0.56 | | | | 0.56 | | | | 1.98 | | | | 88,759 | | | | 72 | |
| 12-31-18 | | | 9.66 | | | | 0.20 | • | | | (0.37 | ) | | | (0.17 | ) | | | 0.23 | | | | — | | | | — | | | | 0.23 | | | | — | | | | 9.26 | | | | (1.75 | ) | | | 0.58 | | | | 0.54 | | | | 0.54 | | | | 2.14 | | | | 40,731 | | | | 63 | |
| 12-31-17 | | | 9.55 | | | | 0.15 | | | | 0.11 | | | | 0.26 | | | | 0.15 | | | | — | | | | — | | | | 0.15 | | | | — | | | | 9.66 | | | | 2.72 | | | | 0.57 | | | | 0.53 | | | | 0.53 | | | | 1.55 | | | | 223,463 | | | | 101 | |
| 12-31-16 | | | 9.19 | | | | 0.11 | | | | 0.25 | | | | 0.36 | | | | — | | | | — | | | | — | | | | — | | | | — | | | | 9.55 | | | | 3.92 | | | | 0.56 | | | | 0.52 | | | | 0.52 | | | | 1.15 | | | | 311,949 | | | | 73 | |
| 12-31-15 | | | 9.54 | | | | 0.01 | • | | | (0.23 | ) | | | (0.22 | ) | | | 0.08 | | | | — | | | | 0.05 | | | | 0.13 | | | | — | | | | 9.19 | | | | (2.35 | ) | | | 0.55 | | | | 0.51 | | | | 0.51 | | | | 0.16 | | | | 311,110 | | | | 470 | |
Class S | | | | | | | | | | | | | | | | | | | | | | | | | | | | | | | | | | | | | | | | | | | | | | | | | | | | | | | | | | | | | | | | | | | | |
| 12-31-19 | | | 9.18 | | | | 0.15 | | | | 0.58 | | | | 0.73 | | | | 0.21 | | | | — | | | | — | | | | 0.21 | | | | — | | | | 9.70 | | | | 8.01 | | | | 0.85 | | | | 0.81 | | | | 0.81 | | | | 1.57 | | | | 144,313 | | | | 72 | |
| 12-31-18 | | | 9.57 | | | | 0.17 | | | | (0.36 | ) | | | (0.19 | ) | | | 0.20 | | | | — | | | | — | | | | 0.20 | | | | — | | | | 9.18 | | | | (2.04 | ) | | | 0.83 | | | | 0.79 | | | | 0.79 | | | | 1.83 | | | | 153,793 | | | | 63 | |
| 12-31-17 | | | 9.45 | | | | 0.13 | | | | 0.10 | | | | 0.23 | | | | 0.11 | | | | — | | | | — | | | | 0.11 | | | | — | | | | 9.57 | | | | 2.48 | | | | 0.82 | | | | 0.78 | | | | 0.78 | | | | 1.29 | | | | 160,890 | | | | 101 | |
| 12-31-16 | | | 9.12 | | | | 0.09 | | | | 0.24 | | | | 0.33 | | | | — | | | | — | | | | — | | | | — | | | | — | | | | 9.45 | | | | 3.62 | | | | 0.81 | | | | 0.77 | | | | 0.77 | | | | 0.89 | | | | 190,284 | | | | 73 | |
| 12-31-15 | | | 9.48 | | | | (0.02 | ) | | | (0.22 | ) | | | (0.24 | ) | | | 0.09 | | | | — | | | | 0.03 | | | | 0.12 | | | | — | | | | 9.12 | | | | (2.61 | ) | | | 0.80 | | | | 0.76 | | | | 0.76 | | | | (0.19 | ) | | | 202,274 | | | | 470 | |
VY® BrandywineGLOBAL- Bond Portfolio |
| 12-31-19 | | | 9.73 | | | | 0.25 | • | | | 0.73 | | | | 0.98 | | | | 0.20 | | | | — | | | | — | | | | 0.20 | | | | — | | | | 10.51 | | | | 10.12 | | | | 0.61 | | | | 0.58 | | | | 0.58 | | | | 2.48 | | | | 182,892 | | | | 449 | |
| 12-31-18 | | | 10.12 | | | | 0.26 | • | | | (0.43 | ) | | | (0.17 | ) | | | 0.22 | | | | — | | | | — | | | | 0.22 | | | | — | | | | 9.73 | | | | (1.65 | ) | | | 0.71 | | | | 0.58 | | | | 0.58 | | | | 2.61 | | | | 194,159 | | | | 457 | |
| 12-31-17 | | | 10.06 | | | | 0.22 | • | | | 0.07 | | | | 0.29 | | | | 0.23 | | | | — | | | | — | | | | 0.23 | | | | — | | | | 10.12 | | | | 2.93 | | | | 0.69 | | | | 0.58 | | | | 0.58 | | | | 2.16 | | | | 214,952 | | | | 345 | |
| 12-31-16 | | | 10.02 | | | | 0.20 | • | | | 0.08 | | | | 0.28 | | | | 0.24 | | | | — | | | | — | | | | 0.24 | | | | — | | | | 10.06 | | | | 2.70 | | | | 0.66 | | | | 0.58 | | | | 0.58 | | | | 2.00 | | | | 226,846 | | | | 490 | |
02-20-15(5)–
12-31-15 | | | 10.00 | | | | 0.15 | • | | | (0.13 | ) | | | 0.02 | | | | — | | | | — | | | | — | | | | — | | | | — | | | | 10.02 | | | | 0.20 | | | | 0.61 | | | | 0.58 | | | | 0.58 | | | | 1.77 | �� | | | 187,767 | | | | 507 | |
(1) | | Total return is calculated assuming reinvestment of all dividends, capital gain distributions and return of capital distributions, if any, at net asset value and does not reflect the effect of insurance contract charges. Total return for periods less than one year is not annualized. |
(2) | | Annualized for periods less than one year. |
(3) | | Ratios reflect operating expenses of a Portfolio. Expenses before reductions/additions do not reflect amounts reimbursed or recouped by the Investment Adviser and/or Distributor or reductions from brokerage service arrangements or other expense offset arrangements and do not represent the amount paid by a Portfolio during periods when reimbursements or reductions occur. Expenses net of fee waivers reflect expenses after reimbursement by the Investment Adviser and/or Distributor or recoupment of |
| | | previously reimbursed fees by the Investment Adviser, but prior to reductions from brokerage service arrangements or other expense offset arrangements. Expenses net of all reductions/additions represent the net expenses paid by a Portfolio. Net investment income (loss) is net of all such additions or reductions. |
(4) | | Ratios do not include fees and expenses charged under the variable annuity contract or variable life insurance policy. |
(5) | | Commencement of operations. |
• | | Calculated using average number of shares outstanding throughout the year or period. |
| * | | Amount is less than $0.005 or 0.005% or more than $(0.005) or (0.005)%. |
See Accompanying Notes to Financial Statements
16
NOTES TO FINANCIAL STATEMENTS AS OF DECEMBER 31, 2019 NOTE 1 — ORGANIZATION
Voya Investors Trust is registered under the Investment Company Act of 1940, as amended (the “1940 Act”), as an open-end management investment company and was organized as a Massachusetts business trust on August 3, 1988. Voya Investors Trust currently consists of twenty-two active separate investment series. The one series included in this report is: VY® BlackRock Inflation Protected Bond Portfolio (“BlackRock Inflation Protected Bond”), a diversified series of Voya Investors Trust.
Voya Variable Insurance Trust is registered under the 1940 Act as an open-end management investment company and was organized as a Delaware statutory trust on July 15, 1999. Voya Variable Insurance Trust consists of one active investment series which is included in this report: VY® BrandywineGLOBAL — Bond Portfolio (“Bond Portfolio”), a diversified series of Voya Variable Insurance Trust. Prior to August 9, 2019, Bond Portfolio was known as VY® Goldman Sachs Bond Portfolio.
Voya Investors Trust and Voya Variable Insurance Trust are collectively referred to as the “Trusts.” BlackRock Inflation Protected Bond and Bond Portfolio are each, a “Portfolio” and together, the “Portfolios.” The investment objective of the Portfolios is described in each Portfolio’s Prospectus.
The classes of shares included in this report for BlackRock Inflation Protected Bond are: Adviser (“Class ADV”), Institutional (“Class I”), and Service (“Class S”). With the exception of class specific matters, each class has equal voting rights as to voting privileges. For class specific proposals, only the applicable class would have voting privileges. The classes differ principally in the applicable distribution and shareholder service fees. Generally, shareholders of each class also bear certain expenses that pertain to that particular class. All shareholders are allocated the common expenses of a portfolio and earn income and realized gains/losses from a portfoliopro rata based on the daily ending net assets of each class, without distinction between share classes. Expenses that are specific to a portfolio or a class are charged directly to that portfolio or class. Other operating expenses shared by several portfolios are generally allocated among those portfolios based on average net assets. Distributions are determined separately for each class based on income and expenses allocated to each class. Realized gain distributions are allocated to each classpro rata based on the shares outstanding of each class on the date of distribution. Differences in per share dividend rates generally result from differences in separate class expenses, including distribution and shareholder service fees, if applicable. Bond Portfolio does not have a share class designation.
Voya Investments, LLC (“Voya Investments” or the “Investment Adviser”), an Arizona limited liability company, serves as the Investment Adviser to the Portfolios. Voya Investments Distributor, LLC (“VID” or the “Distributor”), a Delaware limited liability company, serves as the principal underwriter to the Portfolios.
NOTE 2 — SIGNIFICANT ACCOUNTING POLICIES
The following significant accounting policies are consistently followed by the Portfolios in the preparation of their financial statements. Each Portfolio is considered an investment company under U.S. generally accepted accounting principles (“GAAP”) and follows the accounting and reporting guidance applicable to investment companies.
A. Security Valuation.Each Portfolio is open for business every day the New York Stock Exchange (“NYSE”) opens for regular trading (each such day, a “Business Day”). The net asset value (“NAV”) per share for each class, if applicable, of each Portfolio is determined each Business Day as of the close of the regular trading session (“Market Close”), as determined by the Consolidated Tape Association (“CTA”), the central distributor of transaction prices for exchange-traded securities (normally 4:00 p.m. Eastern time unless otherwise designated by the CTA). The data reflected on the consolidated tape provided by the CTA is generated by various market centers, including all securities exchanges, electronic communications networks, and third-market broker-dealers. The NAV per share of each class of each Portfolio is calculated by taking the value of the Portfolio’s assets attributable to that class, subtracting the Portfolio’s liabilities attributable to that class, and dividing by the number of shares of that class that are outstanding. On days when a Portfolio is closed for business, Portfolio shares will not be priced and a Portfolio does not transact purchase and redemption orders. To the extent a Portfolio’s assets are traded in other markets on days when a Portfolio does not price its shares, the value of a Portfolio’s assets will likely change and you will not be able to purchase or redeem shares of a Portfolio.
Assets for which market quotations are readily available are valued at market value. A security listed or traded on an exchange is valued at its last sales price or official closing price as of the close of the regular trading session on the exchange where the security is principally traded or, if such price is not available, at the last sale price as of the Market Close for such security provided by the CTA. Bank loans are valued at the average of the averages of the bid and ask prices provided to an independent loan pricing service by brokers. Futures contracts are valued at the final settlement price set by an exchange on which they are principally traded. Listed options are valued at the mean
17
NOTES TO FINANCIAL STATEMENTS AS OF DECEMBER 31, 2019 (CONTINUED)
NOTE 2 — SIGNIFICANT ACCOUNTING POLICIES (continued)
between the last bid and ask prices from the exchange on which they are principally traded. Investments in open-end registered investment companies that do not trade on an exchange are valued at the end of day NAV per share. Investments in registered investment companies that trade on an exchange are valued at the last sales price or official closing price as of the close of the regular trading session on the exchange where the security is principally traded.
When a market quotation is not readily available or is deemed unreliable, each Portfolio will determine a fair value for the relevant asset in accordance with procedures adopted by the Portfolios’ Boards of Trustees (“Board”). Such procedures provide, for example, that: (a) Exchange-traded securities are valued at the mean of the closing bid and ask; (b) Debt obligations are valued using an evaluated price provided by an independent pricing service. Evaluated prices provided by the pricing service may be determined without exclusive reliance on quoted prices, and may reflect factors such as institution-size trading in similar groups of securities, developments related to specific securities, benchmark yield, quality, type of issue, coupon rate, maturity, individual trading characteristics and other market data; (c) Securities traded in the over-the-counter (“OTC”) market are valued based on prices provided by independent pricing services or market makers; (d) Options not listed on an exchange are valued by an independent source using an industry accepted model, such as Black-Scholes; (e) Centrally cleared swap agreements are valued using a price provided by the central counterparty clearinghouse; (f) OTC swap agreements are valued using a price provided by an independent pricing service; (g) Forward foreign currency exchange contracts are valued utilizing current and forward rates obtained from an independent pricing service. Such prices from the third party pricing service are for specific settlement periods and each Portfolio’s forward foreign currency exchange contracts are valued at an interpolated rate between the closest preceding and subsequent period reported by the independent pricing service; and (h) Securities for which market prices are not provided by any of the above methods may be valued based upon quotes furnished by brokers.
The prospectuses of the open-end registered investment companies in which each Portfolio may invest explain the circumstances under which they will use fair value pricing and the effects of using fair value pricing.
Foreign securities’ (including forward foreign currency exchange contracts) prices are converted into U.S. dollar amounts using the applicable exchange rates as of Market Close. If market quotations are available and believed to be reliable for foreign exchange-traded equity securities, the
securities will be valued at the market quotations. Because trading hours for certain foreign securities end before Market Close, closing market quotations may become unreliable. An independent pricing service determines the degree of certainty, based on historical data, that the closing price in the principal market where a foreign security trades is not the current value as of Market Close. Foreign securities’ prices meeting the approved degree of certainty that the price is not reflective of current value will be valued by the independent pricing service using pricing models designed to estimate likely changes in the values of those securities between the times in which the trading in those securities is substantially completed and Market Close. Multiple factors may be considered by the independent pricing service in determining the value of such securities and may include information relating to sector indices, American Depositary Receipts and domestic and foreign index futures.
All other assets for which market quotations are not readily available or became unreliable (or if the above fair valuation methods are unavailable or determined to be unreliable) are valued at fair value as determined in good faith by or under the supervision of the Board following procedures approved by the Board. The Board has delegated to the Investment Adviser responsibility for overseeing the implementation of the Portfolios’ valuation procedures; a “Pricing Committee” comprised of employees of the Investment Adviser or its affiliates has responsibility for applying the fair valuation methods set forth in the procedures and, if a fair valuation cannot be determined pursuant to the fair valuation methods, determining the fair value of assets held by the Portfolios. Issuer specific events, transaction price, position size, nature and duration of restrictions on disposition of the security, market trends, bid/ask quotes of brokers and other market data may be reviewed in the course of making a good faith determination of a security’s fair value. Valuations change in response to many factors including the historical and prospective earnings of the issuer, the value of the issuer’s assets, general economic conditions, interest rates, investor perceptions and market liquidity. Because of the inherent uncertainties of fair valuation, the values used to determine each Portfolio’s NAV may materially differ from the value received upon actual sale of those investments. Thus, fair valuation may have an unintended dilutive or accretive effect on the value of shareholders’ investments in each Portfolio.
Each investment asset or liability of the Portfolios is assigned a level at measurement date based on the significance and source of the inputs to its valuation. Quoted prices in active markets for identical securities are classified as “Level 1,” inputs other than quoted prices for an asset or liability that are observable are classified as
18
NOTES TO FINANCIAL STATEMENTS AS OF DECEMBER 31, 2019 (CONTINUED)
NOTE 2 — SIGNIFICANT ACCOUNTING POLICIES (continued)
“Level 2” and significant unobservable inputs, including the sub-advisers’ or Pricing Committee’s judgment about the assumptions that a market participant would use in pricing an asset or liability are classified as “Level 3.” The inputs used for valuing securities are not necessarily an indication of the risks associated with investing in those securities. Short-term securities of sufficient credit quality are generally considered to be Level 2 securities under applicable accounting rules. A table summarizing the Portfolios’ investments under these levels of classification is included within the Portfolio of Investments.
GAAP requires a reconciliation of the beginning to ending balances for reported fair values that presents changes attributable to total realized and unrealized gains or losses, purchases and sales, and transfers in or out of the Level 3 category during the period. A reconciliation of Level 3 investments within the Portfolio of Investments is presented only when a Portfolio has a significant amount of Level 3 investments.
B. Securities Transactions and Revenue Recognition. Securities transactions are accounted for on the trade date. Realized gains and losses are reported on the basis of identified cost of securities sold. Interest income is recorded on an accrual basis. Dividend income is recorded on the ex-dividend date, or for certain foreign securities, when the information becomes available to the Portfolios. Premium amortization and discount accretion are determined by the effective yield method.
C. Foreign Currency Translation. The books and records of the Portfolios are maintained in U.S. dollars. Any foreign currency amounts are translated into U.S. dollars on the following basis:
| (1) | | Market value of investment securities, other assets and liabilities — at the exchange rates prevailing at Market Close. |
| (2) | | Purchases and sales of investment securities, income and expenses — at the rates of exchange prevailing on the respective dates of such transactions. |
Although the net assets and the market values are presented at the foreign exchange rates at Market Close, the Portfolios do not isolate the portion of their results of operations resulting from changes in foreign exchange rates on investments from the fluctuations arising from changes in market prices of securities held. Such fluctuations are included with the net realized and unrealized gains or losses from investments. For securities, which are subject to foreign withholding tax upon disposition, liabilities are recorded on the Statement
of Assets and Liabilities for the estimated tax withholding based on the securities’ current market value. Upon disposition, realized gains or losses on such securities are recorded net of foreign withholding tax.
Reported net realized foreign exchange gains or losses arise from sales of foreign currencies, currency gains or losses realized between the trade and settlement dates on securities transactions, the difference between the amounts of dividends, interest, and foreign withholding tax reclaims recorded on the Portfolios’ books, and the U.S. dollar equivalent of the amounts actually received or paid. Net unrealized foreign exchange gains and losses arise from changes in the value of assets and liabilities other than investments in securities, resulting from changes in the exchange rate. Foreign security and currency transactions may involve certain considerations and risks not typically associated with investing in U.S. companies and U.S. government securities. These risks include, but are not limited to, revaluation of currencies and future adverse political and economic developments which could cause securities and their markets to be less liquid and prices more volatile than those of comparable U.S. companies and U.S. government securities. The foregoing risks are even greater with respect to securities of issuers in emerging markets.
D. Distributions to Shareholders. Net investment income dividends and net capital gain distributions, if any, for Bond Portfolio are declared and paid annually. For BlackRock Inflation Protected Bond, dividends from net investment income, if any, are declared and paid monthly and distributions of net capital gains, if any, are declared and paid annually. The Portfolios may make distributions on a more frequent basis to comply with the distribution requirements of the Internal Revenue Code. The characteristics of income and gains to be distributed are determined in accordance with income tax regulations, which may differ from GAAP for investment companies.
E. Federal Income Taxes. It is the policy of each Portfolio to comply with the requirements of subchapter M of the Internal Revenue Code that are applicable to regulated investment companies and to distribute substantially all of its net investment income and any net realized capital gains to its shareholders. Therefore, a federal income tax or excise tax provision is not required. Management has considered the sustainability of the Portfolios’ tax positions taken on federal income tax returns for all open tax years in making this determination. No capital gain distributions shall be made until the capital loss carryforwards have been fully utilized or expire.
The Portfolios may utilize equalization accounting for tax purposes, whereby a portion of redemption payments are treated as distributions of income or gain.
19
NOTES TO FINANCIAL STATEMENTS AS OF DECEMBER 31, 2019 (CONTINUED)
NOTE 2 — SIGNIFICANT ACCOUNTING POLICIES (continued)
F. Use of Estimates. The preparation of financial statements in conformity with GAAP requires management to make estimates and assumptions that affect the reported amounts of assets and liabilities and disclosure of contingent assets and liabilities at the date of the financial statements and the reported amounts of increases and decreases in net assets from operations during the reporting period. Actual results could differ from those estimates.
G. Risk Exposures and the Use of Derivative Instruments. The Portfolios’ investment strategies permit the Portfolios to enter into various types of derivatives contracts, including, but not limited to, futures contracts, forward foreign currency exchange contracts, credit default swaps, interest rate swaps, total return swaps, and purchased and written options. In doing so, a Portfolio will employ strategies in differing combinations to permit it to increase or decrease the level of risk, or change the level or types of exposure to risk factors. This may allow a Portfolio to pursue its objectives more quickly, and efficiently than if it were to make direct purchases or sales of securities capable of affecting a similar response to market or credit factors.
In pursuit of its investment objectives, a Portfolio may seek to increase or decrease its exposure to the following market or credit risk factors:
Credit Risk. The price of a bond or other debt instrument is likely to fall if the issuer’s actual or perceived financial health deteriorates, whether because of broad economic or issuer-specific reasons. In certain cases, the issuer could be late in paying interest or principal, or could fail to pay its financial obligations altogether.
Equity Risk. Stock prices may be volatile or have reduced liquidity in response to real or perceived impacts of factors including, but not limited to, economic conditions, changes in market interest rates, and political events. Stock markets tend to be cyclical, with periods when stock prices generally rise and periods when stock prices generally decline. Any given stock market segment may remain out of favor with investors for a short or long period of time, and stocks as an asset class may underperform bonds or other asset classes during some periods. Additionally, legislative, regulatory or tax policies or developments in these areas may adversely impact the investment techniques available to a manager, add to costs and impair the ability of a Portfolio to achieve its investment objectives.
Foreign Exchange Rate Risk. To the extent that a Portfolio invests directly in foreign (non-U.S.) currencies or in securities denominated in, or that trade in, foreign (non-U.S.) currencies, it is subject to the risk that those foreign
(non-U.S.) currencies will decline in value relative to the U.S. dollar or, in the case of hedging positions, that the U.S. dollar will decline in value relative to the currency being hedged by a Portfolio through foreign currency exchange transactions.
Currency rates may fluctuate significantly over short periods of time. Currency rates may be affected by changes in market interest rates, intervention (or the failure to intervene) by U.S. or foreign governments, central banks or supranational entities such as the International Monetary Fund, by the imposition of currency controls, or other political or economic developments in the United States or abroad.
Interest Rate Risk. With bonds and other fixed rate debt instruments, a rise in market interest rates generally causes values to fall; conversely, values generally rise as market interest rates fall. The higher the credit quality of the instrument, and the longer its maturity or duration, the more sensitive it is likely to be to interest rate risk. In the case of inverse securities, the interest rate paid by the securities is a floating rate, which generally will decrease when the market rate of interest to which the inverse security is indexed increases and will increase when the market rate of interest to which the inverse security is indexed decreases. As of the date of this report, the United States experiences a low interest rate environment, which may increase a Portfolio’s exposure to risks associated with rising market interest rates. Rising market interest rates could have unpredictable effects on the markets and may expose fixed-income and related markets to heightened volatility. For a fund that invests in fixed-income securities, an increase in market interest rates may lead to increased redemptions and increased portfolio turnover, which could reduce liquidity for certain investments, adversely affect values, and increase costs. If dealer capacity in fixed-income markets is insufficient for market conditions, it may further inhibit liquidity and increase volatility in the fixed-income markets. Further, recent and potential changes in government policy may affect interest rates.
Risks of Investing in Derivatives. A Portfolio’s use of derivatives can result in losses due to unanticipated changes in the market or credit risk factors and the overall market. In instances where a Portfolio is using derivatives to decrease, or hedge, exposures to market or credit risk factors for securities held by a Portfolio, there are also risks that those derivatives may not perform as expected resulting in losses for the combined or hedged positions.
Derivative instruments are subject to a number of risks, including the risk of changes in the market price of the underlying securities, credit risk with respect to the counterparty, risk of loss due to changes in market interest rates and liquidity and volatility risk. The amounts required
20
NOTES TO FINANCIAL STATEMENTS AS OF DECEMBER 31, 2019 (CONTINUED)
NOTE 2 — SIGNIFICANT ACCOUNTING POLICIES (continued)
to purchase certain derivatives may be small relative to the magnitude of exposure assumed by a Portfolio. Therefore, the purchase of certain derivatives may have an economic leveraging effect on a Portfolio and exaggerate any increase or decrease in the NAV. Derivatives may not perform as expected, so a Portfolio may not realize the intended benefits. When used for hedging purposes, the change in value of a derivative may not correlate as expected with the currency, security or other risk being hedged. When used as an alternative or substitute for direct cash investments, the return provided by the derivative may not provide the same return as direct cash investment. In addition, given their complexity, derivatives expose a Portfolio to the risk of improper valuation.
Generally, derivatives are sophisticated financial instruments whose performance is derived, at least in part, from the performance of an underlying asset or assets. Derivatives include, among other things, swap agreements, options, forwards and futures. Investments in derivatives are generally negotiated OTC with a single counterparty and as a result are subject to credit risks related to the counterparty’s ability or willingness to perform its obligations; any deterioration in the counterparty’s creditworthiness could adversely affect the value of the derivative. In addition, derivatives and their underlying securities may experience periods of illiquidity which could cause a Portfolio to hold a security it might otherwise sell, or to sell a security it otherwise might hold at inopportune times or at an unanticipated price. A manager might imperfectly judge the direction of the market. For instance, if a derivative is used as a hedge to offset investment risk in another security, the hedge might not correlate to the market’s movements and may have unexpected or undesired results such as a loss or a reduction in gains.
Counterparty Credit Risk and Credit Related Contingent Features. Certain derivative positions are subject to counterparty credit risk, which is the risk that the counterparty will not fulfill its obligation to a Portfolio. Each Portfolio’s derivative counterparties are financial institutions who are subject to market conditions that may weaken their financial position. A Portfolio intends to enter into financial transactions with counterparties that it believes to be creditworthy at the time of the transaction. To reduce this risk, a Portfolio has entered into master netting arrangements, established within each Portfolio’s International Swap and Derivatives Association, Inc. (“ISDA”) Master Agreements (“Master Agreements”). These Master Agreements are with select counterparties and they govern transactions, including certain OTC derivative and forward foreign currency contracts, entered
into by a Portfolio and the counterparty. The Master Agreements maintain provisions for general obligations, representations, agreements, collateral, and events of default or termination. The occurrence of a specified event of termination may give a counterparty the right to terminate all of its contracts and affect settlement of all outstanding transactions under the applicable Master Agreement.
A Portfolio may also enter into collateral agreements with certain counterparties to further mitigate counterparty credit risk on OTC derivative and forward foreign currency contracts. Subject to established minimum levels, collateral is generally determined based on the net aggregate unrealized gain or loss on contracts with a certain counterparty. Collateral pledged to or from a Portfolio is held in a segregated account by a third-party agent and can be in the form of cash or debt securities issued by the U.S. government or related agencies.
At December 31, 2019, the maximum amount of loss that BlackRock Inflation Protected Bond would incur if the counterparties to their derivative transactions failed to perform would be $2,622,163 which represents the gross payments to be received by the Portfolio on OTC purchased options, forward foreign currency contracts, and OTC inflation-linked swaps were they to be unwound as of December 31, 2019. At December 31, 2019, BlackRock Inflation Protected Bond had received $1,350,000 in cash collateral from certain counterparties.
Each Portfolio has credit related contingent features that if triggered would allow its derivative counterparties to close out and demand payment or additional collateral to cover their exposure from a Portfolio. Credit related contingent features are established between a Portfolio and its derivatives counterparties to reduce the risk that a Portfolio will not fulfill its payment obligations to its counterparties. These triggering features include, but are not limited to, a percentage decrease in a Portfolio’s net assets and/or a percentage decrease in a Portfolio’s NAV, which could cause a Portfolio to accelerate payment of any net liability owed to the counterparty. The contingent features are established within each Portfolio’s Master Agreements.
At December 31, 2019, BlackRock Inflation Protected Bond had a liability position of $1,670,679 on forward foreign currency contracts and OTC written options with credit related contingent features. If a contingent feature would have been triggered as of December 31, 2019, the Portfolios could have been required to pay this amount in cash to its counterparties. At December 31, 2019, BlackRock Inflation Protected Bond had pledged $160,000 in cash collateral for their open OTC derivative transactions.
21
NOTES TO FINANCIAL STATEMENTS AS OF DECEMBER 31, 2019 (CONTINUED)
NOTE 2 — SIGNIFICANT ACCOUNTING POLICIES (continued)
H. Forward Foreign Currency Contracts. A Portfolio may enter into forward foreign currency contracts primarily to hedge against foreign currency exchange rate risk on its non-U.S. dollar denominated investment securities. When entering into a forward foreign currency contract, a Portfolio agrees to receive or deliver a fixed quantity of foreign currency for an agreed-upon price on an agreed future date. These contracts are valued daily and a Portfolio’s net equity therein, representing unrealized gain or loss on the contracts as measured by the difference between the forward foreign exchange rates at the dates of entry into the contracts and the forward rates at the reporting date, is included in the Statements of Assets and Liabilities. Realized and unrealized gains and losses are included in the Statements of Operations. These instruments involve market and/or credit risk in excess of the amount recognized in the Statements of Assets and Liabilities. Risks arise from the possible inability of counterparties to meet the terms of their contracts and from movement in currency and securities values and interest rates. Open forward foreign currency contracts are presented within the Portfolio of Investments.
For the year ended December 31, 2019, BlackRock Inflation Protected Bond and Bond Portfolio had entered into forward foreign currency contracts with the obligation to buy and sell specified foreign currencies in the future at a currently negotiated forward rate in order to increase or decrease exposure to foreign exchange rate risk. The Portfolios use forward foreign currency contracts primarily to protect any non-U.S. dollar-denominated holdings from adverse currency movements and to gain exposure to currencies for the purposes of risk management or enhanced return.
During the year ended December 31, 2019, BlackRock Inflation Protected Bond and Bond Portfolio had average contract amounts on forward foreign currency contracts purchased and sold as disclosed below. Please refer to the tables within the Portfolio of Investments for BlackRock Inflation Protected Bond for open forward foreign currency contracts at December 31, 2019. There were no open forward foreign currency contracts for Bond Portfolio at December 31, 2019.
| | Purchased | | Sold |
|---|
| BlackRock Inflation Protected Bond | | | 61,032,104 | | | $ | 31,684,256 | |
| Bond Portfolio | | | 117,300,788 | | | | 40,297,585 | |
I. Futures Contracts. Each Portfolio may enter into futures contracts involving foreign currency, interest rates, securities and security indices. A futures contract is a commitment to buy or sell a specific amount of a financial instrument at a negotiated price on a stipulated future date. Each Portfolio may buy and sell futures contracts. Futures
contracts traded on a commodities or futures exchange will be valued at the final settlement price or official closing price on the principal exchange as reported by such principal exchange at its trading session ending at, or most recently prior to, the time when a Portfolio’s assets are valued.
Upon entering into a futures contract, a Portfolio is required to deposit either cash or securities (initial margin) in an amount equal to a certain percentage of the contract value. Subsequent payments (variation margin) are made or received by a Portfolio each day. The variation margin payments are equal to the daily changes in the contract value and are recorded as unrealized gains and losses. Open futures contracts are reported on a table within the Portfolio of Investments. Securities held in collateralized accounts to cover initial margin requirements on open futures contracts are footnoted in the Portfolio of Investments. Cash collateral held by the broker to cover initial margin requirements on open futures contracts are noted in the Statements of Assets and Liabilities. The net change in unrealized appreciation and depreciation is reported in the Statements of Operations. Realized gains (losses) are reported in the Statements of Operations at the closing or expiration of futures contracts.
At December 31, 2019, BlackRock Inflation Protected Bond had pledged U.S. Treasury Inflation Indexed Protected Securities with an original par value of $484,000 with the broker as collateral for open futures contracts. The securities have been footnoted as pledged within the Portfolio of Investments.
Futures contracts are exposed to the market risk factor of the underlying financial instrument. Additional associated risks of entering into futures contracts include the possibility that there may be an illiquid market where a Portfolio is unable to liquidate the contract or enter into an offsetting position and, if used for hedging purposes, the risk that the price of the contract will correlate imperfectly with the prices of a Portfolio’s securities. With futures, there is minimal counterparty credit risk to a Portfolio since futures are exchange traded and the exchange’s clearinghouse, as counterparty to all exchange traded futures, guarantees the futures against default. During the year ended December 31, 2019, BlackRock Inflation Protected Bond and Bond Portfolio had purchased and sold futures contracts on various bonds and notes as part of their duration strategy.
During the year ended December 31, 2019, BlackRock Inflation Protected Bond and Bond Portfolio had average notional values on futures contracts purchased and sold as disclosed below. Please refer to the tables within the Portfolio of Investments for BlackRock Inflation Protected Bond for open futures contracts at December 31, 2019.
22
NOTES TO FINANCIAL STATEMENTS AS OF DECEMBER 31, 2019 (CONTINUED)
NOTE 2 — SIGNIFICANT ACCOUNTING POLICIES (continued)
There were no open futures contracts for Bond Portfolio at December 31, 2019.
| | Purchased | | Sold |
|---|
| BlackRock Inflation Protected Bond | | $ | 75,267,578 | | | $ | 39,706,211 | |
| Bond Portfolio | | | 74,691,587 | | | | 78,533,544 | |
J. Options Contracts. The Portfolios may purchase put and call options and may write (sell) put options and covered call options. The Portfolios may engage in option transactions as a hedge against adverse movements in the value of portfolio holdings or to increase market exposure. Option contracts are valued daily and unrealized gains or losses are recorded based upon the last sales price on the principal exchange on which the options are traded. An amount equal to the premium received by the Portfolios upon the writing of a put or call option is included in the Statements of Assets and Liabilities as a liability which is subsequently marked-to-market until it is exercised or closed, or it expires. The Portfolios will realize a gain or loss upon the expiration or closing of the option contract. When an option is exercised, the proceeds on sales of the underlying security for a written call option, the purchase cost of the security for a written put option, or the cost of the security for a purchased put or call option is adjusted by the amount of premium received or paid. Realized and unrealized gains or losses on option contracts are reflected in the accompanying financial statements. The risk in writing a covered call option is that a Portfolio gives up the opportunity for profit if the market price of the security increases and the option is exercised. The risk in writing a put option is that a Portfolio may incur a loss if the market price of the security decreases and the option is exercised. The risk in buying an option is that a Portfolio pays a premium whether or not the option is exercised. Risks may also arise from an illiquid secondary market or from the inability of counterparties to meet the terms of the contract.
During the year ended December 31, 2019, BlackRock Inflation Protected Bond had average notional values of $47,027,459 and $37,174,121 on purchased and written exchange-traded futures contracts, respectively, to manage its duration strategy and to generate income. Please refer to the tables within the Portfolio of Investments for open purchased and written options on exchange-traded futures contracts at December 31, 2019.
During the year ended December 31, 2019, BlackRock Inflation Protected Bond had average notional values of $107,030,872 and $308,244,992 on purchased and written interest rate swap options (“swaptions”), respectively, to manage its duration strategy and to generate income. Please refer to the tables within the Portfolio of Investments for open purchased and written interest rate swaptions at December 31, 2019.
During the year ended December 31, 2019, BlackRock Inflation Protected Bond had average notional valued of $2,126,388 and $2,841,285 on purchased and written foreign currency options, respectively, to manage its foreign exchange exposure and to generate income. Please refer to the tables within the Portfolio of Investments for open purchased and written foreign currency options at December 31, 2019.
During the year ended December 31, 2019, BlackRock Inflation Protected Bond had purchased and written inflation rate caps and floors to gain exposure to interest rates and generate income as disclosed below. Please refer to the tables within the Portfolio of Investments for open purchased and written inflation rate caps and floors at December 31, 2019.
| | Purchased | | Written |
|---|
| Inflation rate Caps | | $ | 17,213,000 | | | $ | 13,289,000 | |
| Inflation rate Floors | | | 7,743,333 | | | | 15,480,000 | |
K. Swap Agreements. The Portfolios may enter into swap agreements. A swap is an agreement between two parties pursuant to which each party agrees to make one or more payments to the other at specified future intervals based on the return of an asset (such as a stock, bond or currency) or non-asset reference (such as an interest rate or index). Swap agreements are privately negotiated in the OTC market and may be executed in a multilateral or other trade facility platform, such as a registered commodities exchange (“centrally cleared swaps”).
The swap agreement will specify the “notional” amount of the asset or non-asset reference to which the contract relates. Subsequent changes in market value, if any, are calculated based upon changes in the performance of the asset or non-asset reference multiplied by the notional value of the contract. The Portfolios may enter into credit default, interest rate, total return and currency swaps to manage its exposure to credit, currency and interest rate risk. All outstanding swap agreements are reported within the Portfolio of Investments.
Swaps are marked to market daily using quotations primarily from third party pricing services, counterparties or brokers. The value of the swap contract is recorded on the Statements of Assets and Liabilities. During the term of the swap, changes in the value of the swap, if any, are recorded as unrealized gains or losses on the Statements of Operations. Upfront payments paid or received by a Portfolio when entering into the agreements are reported on the Statements of Assets and Liabilities and as a component of the changes in unrealized gains or losses on the Statements of Operations. These upfront payments represent the amounts paid or received when initially entering into the swap agreement to compensate for differences between the stated terms of the swap
23
NOTES TO FINANCIAL STATEMENTS AS OF DECEMBER 31, 2019 (CONTINUED)
NOTE 2 — SIGNIFICANT ACCOUNTING POLICIES (continued)
agreement and the prevailing market conditions. The upfront payments are included as a component in the realized gains or losses on the Statements of Operations upon termination or maturity of the swap. A Portfolio also records net periodic payments paid or received on the swap contract as a realized gain or loss on the Statements of Operations.
In a centrally cleared swap, immediately following execution of the swap agreement, the swap agreement is novated to a central counterparty (the “CCP”) and a Portfolio’s counterparty on the swap agreement becomes the CCP. A Portfolio is required to interface with the CCP through a broker. Upon entering into a centrally cleared swap, a Portfolio is required to deposit initial margin with the broker in the form of cash or securities in an amount that varies depending on the size and risk profile of the particular swap. Securities deposited as initial margin are footnoted as pledged on the Portfolio of Investments and cash deposited is recorded on the Statements of Assets and Liabilities as cash pledged for centrally cleared swaps. The daily change in valuation of centrally cleared swaps is recorded as a receivable or payable for variation margin in the Statements of Assets and Liabilities. Payments received from (paid to) the counterparty, including at termination, are recorded as realized gain (loss) on the Statements of Operations.
Entering into swap agreements involves the risk that the maximum potential loss of an investment exceeds the current value of the investment as reported on the Statements of Assets and Liabilities. Other risks involve the possibility that the counterparty to the agreements may default on its obligation to perform, that there will be no liquid market for these investments and that unfavorable changes in the market will have a negative impact on the value of the index or securities underlying the respective swap agreement.
Credit Default Swap Contracts. A credit default swap is a bilateral agreement between counterparties in which the buyer of the protection agrees to make a stream of periodic payments to the seller of protection in exchange for the right to receive a specified return in the event of a default or other credit event for a referenced entity, obligation or index. As a seller of protection on credit default swaps, a Portfolio will generally receive from the buyer a fixed payment stream based on the notional amount of the swap contract. This fixed payment stream will continue until the swap contract expires or a defined credit event occurs.
A Portfolio is subject to credit risk in the normal course of pursuing its investment objectives. As a seller of protection in a credit default swap, a Portfolio may execute these
contracts to manage its exposure to the market or certain sectors of the market. Certain Portfolios may also enter into credit default swaps to speculate on changes in an issuer’s credit quality, to take advantage of perceived spread advantages, or to offset an existing short equivalent (i.e. buying protection on an equivalent reference entity).
A Portfolio may sell credit default swaps which expose these Portfolios to the risk of loss from credit risk related events specified in the contract. Although contract specific, credit events are generally defined as bankruptcy, failure to pay, restructuring, obligation acceleration, obligation default or repudiation/ moratorium. If a Portfolio is a seller of protection, and a credit event occurs, as defined under the terms of that particular swap agreement, a Portfolio will generally either (i) pay to the buyer an amount equal to the notional amount of the swap and take delivery of the referenced obligation, other deliverable obligations, or underlying securities comprising a referenced index or (ii) pay a net settlement amount in the form of cash or securities equal to the notional amount of the swap less the recovery value of the referenced obligation or underlying securities comprising a referenced index. If a Portfolio is a buyer of protection and a credit event occurs, as defined under the terms of that particular swap agreement, a Portfolio will either (i) receive from the seller of protection an amount equal to the notional amount of the swap and deliver the referenced obligation, other deliverable obligations or underlying securities comprising the referenced index or (ii) receive a net settlement amount in the form of cash or securities equal to the notional amount of the swap less the recovery value of the referenced obligation or underlying securities comprising the referenced index. Recovery values are assumed by market makers considering either industry standard recovery rates or entity specific factors and considerations until a credit event occurs. If a credit event has occurred, the recovery value is determined by a facilitated auction whereby a minimum number of allowable broker bids, together with a specified valuation method, are used to calculate the settlement value.
Implied credit spreads, represented in absolute terms, utilized in determining the fair value of credit default swap agreements on corporate issues or sovereign issues are disclosed within the Portfolio of Investments and serve as an indicator of the current status of the payment/performance risk and represent the likelihood or risk of default for the credit derivative. The implied credit spread of a particular referenced entity reflects the cost of buying/selling protection and may include upfront payments required to be made to enter into the agreement. For credit default swaps on asset-backed securities or credit indices, the quoted market prices and resulting fair values serve as the indicator of the current status of the payment/
24
NOTES TO FINANCIAL STATEMENTS AS OF DECEMBER 31, 2019 (CONTINUED)
NOTE 2 — SIGNIFICANT ACCOUNTING POLICIES (continued)
performance risk. Wider credit spreads and increasing fair values, in absolute terms when compared to the notional amount of the swap, represent a deterioration of the referenced entity’s credit soundness and a greater likelihood or risk of default or other credit event occurring as defined under the terms of the agreement.
The maximum amount of future payments (undiscounted) that a Portfolio as seller of protection could be required to make under a credit default swap agreement would be an amount equal to the notional amount of the agreement. Notional amounts of all credit default swap agreements outstanding as of December 31, 2019, for which a Portfolio is seller of protection, are disclosed within the Portfolio of Investments for Bond Portfolio. These potential amounts would be partially offset by any recovery values of the respective referenced obligations, upfront payments received upon entering into the agreements, or net amounts received from the settlement of buy protection credit default swap agreements entered into by a Portfolio for the same referenced entity or entities.
For the year ended December 31, 2019, Bond Portfolio had bought and sold credit protection on credit default swap indices (“CDX”) and single name issuers (Corporate or Sovereign). A CDX is a basket of credit instruments or exposures designed to be representative of some part of the credit market as a whole. Bond Portfolio used CDX swaps to gain additional exposure within various sectors and to hedge the credit risk associated with various sectors within the credit and commercial mortgage-backed securities market. In addition, Bond Portfolio bought and sold credit protection on single name issuers to reduce or gain its risk exposure to defaults of corporate and/or sovereign issuers.
For the year ended December 31, 2019, Bond Portfolio had an average notional amount of $10,947,598 on credit default swaps to buy protection and an average notional amount of $7,834,176 on credit default swaps to sell protection. There were no open credit default swaps to buy and sell protection at December 31, 2019.
Interest Rate Swap Contracts. An interest rate swap involves the agreement between counterparties to exchange periodic payments based on interest rates. One payment will be based on a floating rate of a specified interest rate while the other will be a fixed rate. Risks involve the future fluctuations of interest rates in which a Portfolio may make payments that are greater than what a Portfolio received from the counterparty. Other risks include credit, liquidity and market risk.
For the year ended December 31, 2019, BlackRock Inflation Protected Bond and Bond Portfolio had entered
into interest rate swaps in which they pay a floating interest rate and receive a fixed interest rate (“Long interest rate swap”) in order to increase exposure to interest rate risk. Average notional amounts on long interest rate swaps for BlackRock Inflation Protected Bond and Bond Portfolio were $101,426,663 and $101,957,559, respectively.
For the year ended December 31, 2019, BlackRock Inflation Protected Bond and Bond Portfolio had entered into interest rate swaps in which they pay a fixed interest rate and receives a floating interest rate (“Short interest rate swap”) in order to decrease exposure to interest rate risk. Average notional amounts on short interest rate swaps for BlackRock Inflation Protected Bond and Bond Portfolio were $114,096,482 and $102,365,866, respectively.
The Portfolios enter into interest rate swaps to adjust interest rate and yield curve exposures and to substitute for physical fixed-income securities. Please refer to the tables within the Portfolio of Investments for BlackRock Inflation Protected Bond for open interest rate swaps at December 31, 2019. There were no open interest rate swaps for Bond Portfolio at December 31, 2019.
At December 31, 2019, BlackRock Inflation Protected Bond had pledged $3,143,490 in cash collateral for open centrally cleared swaps.
Inflation-linked Swap Contracts. In an inflation-linked swap, one party pays a fixed interest rate on a notional amount while the other party pays a floating rate linked to an inflation index on that same notional amount. The party paying the floating rate pays the inflation adjusted rate multiplied by the notional amount.
For the year ended December 31, 2019, BlackRock Inflation Protected Bond had entered into inflation-linked swaps in which they pay a floating rate linked to an inflation index and receive a fixed interest rate (“Long inflation-linked swap”). Average notional amounts on long inflation-linked swaps for BlackRock Inflation Protected Bond were $35,526,413.
For the year ended December 31, 2019, BlackRock Inflation Protected Bond had entered into inflation-linked swaps in which it pays a fixed interest rate and receives a floating rate linked to an inflation index (“Short inflation-linked swap”). Average notional amount on short inflation linked-bonds was $153,958,896.
BlackRock Inflation Protected Bond used inflation-linked swaps as part of their inflation strategy. Please refer to the tables within the Portfolio of Investments for BlackRock Inflation Protected Bond for open inflation-linked swaps at December 31, 2019.
L. Inflation-Indexed Bonds. Inflation-indexed bonds are fixed income securities whose principal value is
25
NOTES TO FINANCIAL STATEMENTS AS OF DECEMBER 31, 2019 (CONTINUED)
NOTE 2 — SIGNIFICANT ACCOUNTING POLICIES (continued)
periodically adjusted according to the rate of inflation. If the index measuring inflation rises or falls, the principal value of inflation-indexed bonds will be adjusted upward or downward, and consequently the interest payable on these securities (calculated with respect to a larger or smaller principal amount) will be increased or reduced, respectively. Any upward or downward adjustment in the principal amount of an inflation-indexed bond will be included in interest income in the Statement of Operations, even though investors do not receive their principal until maturity. Repayment of the original bond principal upon maturity (as adjusted for inflation) is guaranteed in the case of US Treasury inflation-indexed bonds. For bonds that do not provide a similar guarantee, the adjusted principal value of the bond repaid at maturity may be less than the original principal.
M. Securities Lending. Each Portfolio may temporarily loan up to 33 1/3% of its total assets to brokers, dealers or other financial institutions in exchange for a negotiated lender’s fee. Securities lending involves two primary risks: “investment risk” and “borrower default risk.” When lending securities, the Portfolios will receive cash or U.S. government securities as collateral. Investment risk is the risk that the Portfolios will lose money from the investment of the cash collateral received from the borrower. Borrower default risk is the risk that the Portfolios will lose money due to the failure of a borrower to return a borrowed security. Loans are subject to termination at the option of the borrower or the Portfolios. Securities lending may result in leverage. The use of leverage may exaggerate any increase or decrease in the NAV, causing the Portfolios to be more volatile. The use of leverage may increase expenses and increase the impact of the Portfolios’ other risks.
N. Sales Commitments. Sales commitments involve commitments to sell fixed income securities where the unit price and the estimated principal amount are established upon entering into the contract, with the actual principal amount being within a specified range of the estimate. A Portfolio will enter into sale commitments to hedge its portfolio positions or to sell mortgage-backed securities it owns under delayed delivery arrangements. Proceeds of sale commitments are not received until the contractual settlement date. During the time a sale commitment is outstanding, except for delayed delivery transactions, the Portfolio will maintain, in a segregated account, cash or marketable securities in an amount sufficient to meet the purchase price. Unsettled sale commitments are valued at current market value of the underlying securities. If the sale commitment is closed through the acquisition of an offsetting purchase commitment, the Portfolio realizes a gain or loss on the commitment without regard to any
unrealized gain or loss on the underlying security. If the Portfolio delivers securities under the commitment, the Portfolio realizes a gain or loss from the sale of the securities, based upon the unit price established at the date the commitment was entered into. There were no open sales commitments held by Bond Portfolio at December 31, 2019.
O. Structured Products. Bond Portfolio invests in structured products whose principal payments or interest payments are linked to the performance of underlying foreign currencies, interest rate spreads, stock market indices, prices of individual securities, commodities or other financial instruments or the occurrence of other specific events. The terms and conditions of these products may be ‘structured’ by the purchaser (a Portfolio) and the borrower issuing the note. The market value of these products will increase or decrease based on the performance of the underlying asset or reference. A Portfolio records the net change in the market value of the structured product on the accompanying Statements of Operations as a change in unrealized appreciation or depreciation on investments. A Portfolio records a realized gain or loss on the Statements of Operations upon the sale or maturity of the structured product. There were no open structured products held by Bond Portfolio at December 31, 2019.
P. When-Issued and Delayed-Delivery Transactions. Bond Portfolio may purchase or sell securities on a when-issued or forward commitment basis. The price of the underlying securities and date when the securities will be delivered and paid for are fixed at the time the transaction is negotiated. The fair value of such is identified in the Portfolio of Investments. Losses may arise due to changes in the fair value of the securities or from the inability of counterparties to meet the terms of the contract. In connection with such purchases, the Portfolio is required to hold liquid assets as collateral with the Portfolio’s custodian sufficient to cover the purchase price.
To mitigate counterparty risk, a Portfolio may enter into Master Securities Forward Transaction Agreements (“MSFTA”) with its respective counterparties that provide for collateral and the right to offset amounts due to or from those counterparties under specified conditions. Subject to minimum transfer amounts, collateral requirements are determined and transfers made based on the net aggregate unrealized gain or loss on all the when-issued or delayed-delivery transactions with a particular counterparty. Cash collateral, if any, is presented on the Statement of Assets and Liabilities as an asset (Cash pledged as collateral for delayed-delivery or when-issued securities) and a liability (Cash received as collateral for delayed-delivery or when-issued securities). At
26
NOTES TO FINANCIAL STATEMENTS AS OF DECEMBER 31, 2019 (CONTINUED)
NOTE 2 — SIGNIFICANT ACCOUNTING POLICIES (continued)
December 31, 2019, there was no cash collateral pledged or received by the Portfolio for open when-issued or delayed-delivery transactions.
Q. Indemnifications. In the normal course of business, the Trusts may enter into contracts that provide certain indemnifications. The Trusts’ maximum exposure under these arrangements is dependent on future claims that may be made against the Portfolios and, therefore, cannot be estimated; however, based on experience, management considers the risk of loss from such claims remote.
NOTE 3 — INVESTMENT TRANSACTIONS
For the year ended December 31, 2019, the cost of purchases and the proceeds from the sales of securities, excluding U.S. government and short-term securities were as follows:
| | Purchases | | Sales |
|---|
| BlackRock Inflation Protected Bond | | $ | 91,173,079 | | | $ | 73,746,666 | |
| Bond Portfolio | | | 89,955,856 | | | | 156,043,505 | |
U.S. government securities not included above were as follows:
| | Purchases | | Sales |
|---|
| BlackRock Inflation Protected Bond | | $ | 114,114,068 | | | $ | 119,799,464 | |
| Bond Portfolio | | | 696,278,128 | | | | 684,534,183 | |
NOTE 4 — INVESTMENT MANAGEMENT FEES
The Portfolios have entered into investment management agreements (“Management Agreements”) with the Investment Adviser. The Investment Adviser has overall responsibility for the management of the Portfolios. The Investment Adviser oversees all investment management and portfolio management services for the Portfolios and assists in managing and supervising all aspects of the general day-to-day business activities and operations of the Portfolios, including custodial, transfer agency, dividend disbursing, accounting, auditing, compliance and related services. Each Management Agreement compensates the Investment Adviser with a management fee, computed daily and payable monthly, based on the average daily net assets of each Portfolio, at the following annual rates:
| Portfolio | | Fee |
|---|
BlackRock Inflation Protected Bond(1) | | 0.55% on the first $200 million;
0.50% on the next $800 million; and
0.40% thereafter |
| Bond Portfolio | | 0.50% on the first $750 million; and 0.48% thereafter |
(1) | | The Investment Adviser has contractually agreed to waive 0.04% of the management fee. Any fees waived or reimbursed are not eligible for recoupment. Termination or modification of this obligation requires approval by the Board. |
The Investment Adviser has entered into sub-advisory agreements with each sub-adviser. These sub-advisers provide investment advice for the Portfolios and are paid by the Investment Adviser based on the average daily net assets of each Portfolio. Subject to such policies as the Board or the Investment Adviser may determine, the sub-advisers manage each Portfolio’s assets in accordance with that Portfolio’s investment objectives, policies, and limitations.
| Portfolio | | Sub-Adviser |
|---|
| BlackRock Inflation Protected Bond | | BlackRock Financial Management, Inc. |
Bond Portfolio(1) | | Brandywine Global Investment Management, LLC |
(1) | | Effective August 9, 2019, Goldman Sachs Asset Management, L.P. was removed as sub-adviser and Brandywine Global Investment Management, LLC was added as sub-adviser to Bond Portfolio. |
NOTE 5 — DISTRIBUTION AND SERVICE FEE
Voya Investors Trust has entered into a shareholder service plan (the “Plan”) for the Class S shares of BlackRock Inflation Protected Bond. The Plan compensates the Distributor for the provision of shareholder services and/or account maintenance services to direct or indirect beneficial owners of Class S shares. Under the Plan, the Portfolio makes payments to the Distributor at an annual rate of 0.25% of the Portfolio’s average daily net assets attributable to Class S shares.
Class ADV shares of BlackRock Inflation Protected Bond have a shareholder service and distribution plan. The Portfolio pays the Distributor a shareholder service fee of 0.25% and a distribution fee of 0.35% of the Portfolio’s average daily net assets attributable to Class ADV shares.
NOTE 6 — OTHER TRANSACTIONS WITH AFFILIATES AND RELATED PARTIES
At December 31, 2019, the following direct or indirect, wholly-owned subsidiary of Voya Financial, Inc. or affiliated investment companies owned more than 5% of the following Portfolios:
Subsidiary/Affiliated
Investment Company | | Portfolio | | Percentage |
|---|
| Voya Institutional Trust Company | | BlackRock Inflation Protected Bond | | | 17.57 | % |
| Voya Solution 2025 Portfolio | | Bond Portfolio | | | 26.76 | |
| Voya Solution Income Portfolio | | Bond Portfolio | | | 18.74 | |
Under the 1940 Act, the direct or indirect beneficial owner of more than 25% of the voting securities of a company (including a fund) is presumed to control such company. Companies under common control (e.g., companies with a
27
NOTES TO FINANCIAL STATEMENTS AS OF DECEMBER 31, 2019 (CONTINUED)
NOTE 6 — OTHER TRANSACTIONS WITH AFFILIATES AND RELATED PARTIES (continued)
common owner of greater than 25% of their respective voting securities) are affiliates under the 1940 Act.
The Portfolios have adopted a deferred compensation plan (the “DC Plan”), which allows eligible independent trustees, as described in the DC Plan, to defer the receipt of all or a portion of the trustees’ fees that they are entitled to receive from the Portfolios. For purposes of determining the amount owed to the trustee under the DC Plan, the amounts deferred are invested in shares of the funds selected by the trustee (the “Notional Funds”). The Portfolios purchase shares of the Notional Funds, which are all advised by Voya Investments, in amounts equal to the trustees’ deferred fees, resulting in a Portfolio asset equal to the deferred compensation liability. Such assets, if applicable, are included as a component of “Other assets” on the accompanying Statements of Assets and Liabilities. Deferral of trustees’ fees under the DC Plan will not affect net assets of a Portfolio, and will not materially affect a Portfolio’s assets, liabilities or net investment income per share. Amounts will be deferred until distributed in accordance with the DC Plan.
NOTE 7 — EXPENSE LIMITATION AGREEMENTS
The Investment Adviser has entered into written expense limitation agreements (“Expense Limitation Agreements”) with the below Portfolios, whereby the Investment Adviser has agreed to limit expenses, excluding interest, taxes, investment-related costs, leverage expenses, extraordinary expenses, and acquired fund fees and expenses to the levels listed below:
| Portfolio | | Maximum Operating Expense Limit
(as a percentage of net assets) |
|---|
| BlackRock Inflation Protected Bond | | Class ADV: 1.23%
Class I: 0.63%
Class S: 0.88% |
| Bond Portfolio | | 0.58% |
With the exception of the non-recoupable management fee waiver for BlackRock Inflation Protected Bond, the Investment Adviser may, at a later date, recoup from a Portfolio for fees waived and/or other expenses reimbursed by the Investment Adviser during the previous 36 months, but only if, after such recoupment, a Portfolio’s expense ratio does not exceed the percentage described above. Waived and reimbursed fees net of any recoupment by the Investment Adviser of such waived and reimbursed fees are reflected on the accompanying Statements of Operations. Amounts payable by the Investment Adviser are reflected on the accompanying Statements of Assets and Liabilities.
As of December 31, 2019, the amounts of waived and/or reimbursed fees that are subject to possible recoupment by the Investment Adviser, and the related expiration dates, are as follows:
| | December 31, | | |
|---|
| Portfolio | | 2020 | | 2021 | | 2022 | | Total |
|---|
| Bond Portfolio | | $ | 237,612 | | | $ | 271,640 | | | $ | 46,992 | | | $ | 556,244 | |
The Expense Limitation Agreements are contractual through May 1, 2020 and shall renew automatically for one-year terms. Termination or modification of these obligations requires approval by the Board.
NOTE 8 — LINE OF CREDIT
Effective May 17, 2019, each Portfolio, in addition to certain other funds managed by the Investment Adviser, has entered into a 364-day unsecured committed revolving line of credit agreement (the “Credit Agreement”) with The Bank of New York Mellon (“BNY”) for an aggregate amount of $400,000,000 through May 15, 2020. The proceeds may be used only to finance temporarily: (1) the purchase or sale of investment securities; or (2) the repurchase or redemption of shares of a Portfolio or certain other funds managed by the Investment Adviser. The funds to which the line of credit is available pay a commitment fee equal to 0.15% per annum on the daily unused portion of the committed line amount payable quarterly in arrears. Prior to May 17, 2019, the predecessor line of credit was for an aggregate amount of $400,000,000 and paid a commitment fee equal to 0.15% per annum on the daily unused portion of the committed line amount through May 17, 2019.
Borrowings under the Credit Agreement accrue interest at the federal funds rate plus a specified margin. Repayments generally must be made within 60 days after the date of a revolving credit advance.
The following Portfolios utilized the line of credit during the year ended December 31, 2019:
| Portfolio | | Days
Utilized | | Approximate
Average
Daily
Balance For
Days Utilized | | Approximate
Weighted
Average
Interest Rate
For Days
Utilized |
|---|
| BlackRock Inflation Protected Bond | | | 3 | | | $ | 869,000 | | | | 3.21 | % |
| Bond Portfolio | | | 3 | | | | 6,672,333 | | | | 3.39 | |
28
NOTES TO FINANCIAL STATEMENTS AS OF DECEMBER 31, 2019 (CONTINUED)
NOTE 9 — CAPITAL SHARES
Transactions in capital shares and dollars were as follows:
| | | | Shares
sold | | Shares
issued in
merger | | Reinvestment
of
distributions | | Shares
redeemed | | Net increase
(decrease)
in shares
outstanding | | Shares
sold | | Proceeds
from shares
issued in
merger | | Reinvestment
of
distributions | | Shares
redeemed | | Net increase
(decrease) |
|---|
| Year or period ended | | | | # | | # | | # | | # | | # | | ($) | | ($) | | ($) | | ($) | | ($) |
|---|
BlackRock Inflation Protected Bond |
| Class ADV | | | | | | | | | | | | | | | | | | | | | | | | | | | | | | | | | | | | | | | | | | |
| 12/31/2019 | | | | | 318,553 | | | | — | | | | 93,232 | | | | (580,639 | ) | | | (168,854 | ) | | | 2,939,064 | | | | — | | | | 858,621 | | | | (5,353,509 | ) | | | (1,555,824 | ) |
| 12/31/2018 | | | | | 399,640 | | | | — | | | | 84,970 | | | | (905,095 | ) | | | (420,485 | ) | | | 3,658,118 | | | | — | | | | 773,589 | | | | (8,190,985 | ) | | | (3,759,278 | ) |
Class I |
| 12/31/2019 | | | | | 6,137,405 | | | | — | | | | 188,348 | | | | (1,647,916 | ) | | | 4,677,837 | | | | 57,920,215 | | | | — | | | | 1,810,500 | | | | (15,943,201 | ) | | | 43,787,514 | |
| 12/31/2018 | | | | | 3,938,283 | | | | — | | | | 472,040 | | | | (23,139,542 | ) | | | (18,729,219 | ) | | | 37,370,077 | | | | — | | | | 4,466,156 | | | | (216,557,877 | ) | | | (174,721,644 | ) |
Class S | | | | | | | | | | | | | | | | | | | | | | | | | | | | | | | | | | | | | | | | | | |
| 12/31/2019 | | | | | 761,622 | | | | — | | | | 349,295 | | | | (2,978,878 | ) | | | (1,867,961 | ) | | | 7,167,154 | | | | — | | | | 3,314,035 | | | | (28,291,507 | ) | | | (17,810,318 | ) |
| 12/31/2018 | | | | | 1,863,249 | | | | — | | | | 354,034 | | | | (2,274,717 | ) | | | (57,434 | ) | | | 17,540,209 | | | | — | | | | 3,312,376 | | | | (21,254,380 | ) | | | (401,795 | ) |
Bond Portfolio | | | | | | | | | | | | | | | | | | | | | | | | | | | | | | | | | | | | | | | | | | |
| 12/31/2019 | | | | | 4,249,162 | | | | — | | | | 335,400 | | | | (7,133,760 | ) | | | (2,549,198 | ) | | | 43,513,332 | | | | — | | | | 3,417,729 | | | | (72,346,903 | ) | | | (25,415,842 | ) |
| 12/31/2018 | | | | | 4,887,669 | | | | — | | | | 479,946 | | | | (6,668,313 | ) | | | (1,300,698 | ) | | | 48,161,227 | | | | — | | | | 4,674,679 | | | | (65,220,660 | ) | | | (12,384,754 | ) |
NOTE 10 — SECURITIES LENDING
Under an agreement with BNY, the Portfolios can lend its securities to approved brokers, dealers and other financial institutions. Loans are collateralized by cash and U.S. government securities. The collateral must be equal to at least 105% of the market value of non-U.S. securities loaned and 102% of the market value of U.S. securities loaned. The market value of the loaned securities is determined at Market Close of a Portfolio at their last sale price or official closing price on the principal exchange or system on which they are traded and any additional collateral is delivered to a Portfolio on the next business day. The cash collateral received is invested in approved investments as defined in the Securities Lending Agreement with BNY (the “Agreement”). The Portfolios bear the risk of loss with respect to the investment of collateral with the following exception: BNY provides the Portfolios indemnification from loss with respect to the investment of collateral to the extent the cash collateral is invested in overnight repurchase agreements.
Cash collateral received in connection with securities lending is invested in cash equivalents, money market funds, repurchase agreements with maturities of not more than 99 days that are collateralized with U.S. Government securities, or certain short-term investments that have a
remaining maturity of 190 days or less (“Permitted Investments”). Short-term investments include: securities, units, shares or other participations in short-term investment funds, pools or trusts; commercial paper, notes, bonds or other debt obligations, certificates of deposit, time deposits and other bank obligations and asset-backed commercial paper backed by diversified receivables and repurchase-backed programs. Permitted Investments are subject to certain guidelines established by the Adviser regarding liquidity, diversification, credit quality and average credit life/duration requirements. The securities purchased with cash collateral received are reflected in the Portfolio of Investments under Short-Term Investments.
Generally, in the event of counterparty default, a Portfolio has the right to use the collateral to offset losses incurred. The Agreement contains certain guarantees by BNY in the event of counterparty default and/or a borrower’s failure to return a loaned security; however, there would be a potential loss to a Portfolio in the event a Portfolio is delayed or prevented from exercising its right to dispose of the collateral. Engaging in securities lending could have a leveraging effect, which may intensify the credit, market and other risks associated with investing in a Portfolio.
At December 31, 2019, the Portfolios did not have any outstanding securities on loan.
NOTE 11 — FEDERAL INCOME TAXES
The amount of distributions from net investment income and net realized capital gains are determined in accordance with federal income tax regulations, which may differ from GAAP for investment companies. These book/tax differences may be either temporary or permanent. Permanent differences are reclassified within the capital accounts based on their federal tax-basis treatment; temporary differences are not reclassified. Key differences include the treatment of short-term capital gains, foreign currency transactions, and wash sale deferrals. Distributions in excess of net investment income and/or net realized capital gains for tax purposes are reported as return of capital.
Dividends paid by the Portfolios from net investment income and distributions of net realized short-term capital gains are, for federal income tax purposes, taxable as ordinary income to shareholders.
29
NOTES TO FINANCIAL STATEMENTS AS OF DECEMBER 31, 2019 (CONTINUED)
NOTE 11 — FEDERAL INCOME TAXES (continued)
The tax composition of dividends and distributions to shareholders was as follows:
| | Year Ended
December 31, 2019 | | Year Ended
December 31, 2018 |
|---|
| | Ordinary
Income | | Ordinary
Income |
|---|
| BlackRock Inflation Protected Bond | | $ | 5,983,156 | | | $ | 8,552,122 | |
| Bond Portfolio | | | 3,417,729 | | | | 4,674,679 | |
The tax-basis components of distributable earnings as of December 31, 2019 were:
| | | | Undistributed
Ordinary | | Unrealized
Appreciation/ | | Capital Loss Carryforwards |
|---|
| | | | Income | | (Depreciation) | | Amount | | Character | | Expiration |
|---|
| BlackRock Inflation Protected Bond | | | | $ | 134,792 | | | $ | 9,043,513 | | | $ | (10,120,169 | ) | | | Short-term | | | | None | |
| | | | | | | | | | | | | | (69,934,908 | ) | | | Long-term | | | | None | |
| | | | | | | | | | | | | $ | (80,055,077 | ) | | | | | | | | |
| Bond Portfolio | | | | | 7,773,325 | | | | 480,552 | | | $ | — | | | | — | | | | — | |
The Portfolios’ major tax jurisdictions are U.S. federal, Arizona state, and Massachusetts state (BlackRock Inflation Protected Bond).
As of December 31, 2019, no provision for income tax is required in the Portfolios’ financial statements as a result of tax positions taken on federal and state income tax returns for open tax years. The Portfolios’ federal and state income and federal excise tax returns for tax years for which the applicable statutes of limitations have not expired are subject to examination by the Internal Revenue Service and state department of revenue. Generally, the earliest tax year that remains subject to examination by these jurisdictions is 2015.
NOTE 12 — OTHER ACCOUNTING PRONOUNCEMENTS
The Portfolios have made a change in accounting principle and adopted the provisions of Financial Accounting Standards Board (“FASB”) Accounting Standards Update 2017-08 (“ASU 2017-08”), Premium Amortization on Purchased Callable Debt Securities. ASU 2017-08 shortens the amortization period for certain callable debt securities held at a premium; specifically, requiring the premium to be amortized to the earliest call date. Prior to ASU 2017-08, premiums on callable debt securities were generally amortized to maturity date. ASU 2017-08 is intended to more closely align the amortization period with the expectations incorporated into the market pricing on the underlying security. ASU 2017-08 does not require an accounting change for securities held at a discount; the discount continues to be amortized to maturity date. Upon evaluation, the Portfolios have concluded that the change in accounting principle does not materially impact the financial statement amounts.
Also, in August 2018, the FASB issued Accounting Standards Update 2018-13, Fair Value Measurement (Topic 820): Disclosure Framework — Changes to the Disclosure Requirements for Fair Value Measurement (“ASU 2018-13”). The update provides guidance that eliminates, adds and modifies certain disclosure requirements for fair value measurements. ASU 2018-13 will be effective for annual periods beginning after
December 15, 2019 and interim periods within those annual periods. At this time, the Portfolios have elected to early adopt the amendments that allow for removal of disclosure requirements related to transfers between Level 1 and Level 2 of the fair value hierarchy and the timing of transfers between levels of the fair value hierarchy. These changes did not have a material impact on the Portfolios’ financial statements. The Portfolios plan to adopt the amendments that require additional fair value measurement disclosures for annual periods beginning after December 15, 2019, and interim periods within those annual periods. The Portfolios are currently evaluating the impact of these changes on the financial statements.
NOTE 13 — AUDITOR CHANGE (UNAUDITED)
On September 12, 2019, KPMG LLP (“KPMG”) was dismissed as the independent registered public accounting firm to the Trusts, on behalf of the Portfolios upon completion of the audit for the fiscal year ended December 31, 2019. The decision to change independent registered public accounting firms was recommended by the Audit Committee of the Board and was approved by the Board.
KPMG’s reports on the Portfolios’ financial statements for the fiscal years ended December 31, 2019 and December 31, 2018 contained no adverse opinion or disclaimer of opinion nor were they qualified or modified as to uncertainty, audit scope or accounting principle.
30
NOTES TO FINANCIAL STATEMENTS AS OF DECEMBER 31, 2019 (CONTINUED)
NOTE 13 — AUDITOR CHANGE (UNAUDITED) (continued)
During the fiscal years ended December 31, 2019 and December 31, 2018: (i) there were no disagreements with KPMG on any matter of accounting principles or practices, financial statement disclosure or auditing scope or procedure, which disagreements, if not resolved to the satisfaction of KPMG, would have caused KPMG to make reference to the subject matter of the disagreements in connection with its reports on the Portfolios’ financial statements for such periods; and (ii) there were no “reportable events” of the kind described in Item 304(a)(1)(v) of Regulation S-K under the Securities Exchange Act of 1934, as amended.
On September 12, 2019, based on the recommendation of the Audit Committee of the Board, the Board approved the selection of Ernst & Young LLP (“EY”) as the Portfolios’ independent registered public accounting firm for the fiscal year ending December 31, 2020. During the Portfolios’ fiscal years ended December 31, 2019 and December 31, 2018, neither the Portfolios, nor anyone on their behalf, consulted with EY on items which: (i) concerned the application of accounting principles to a specified
transaction, either completed or proposed, or the type of audit opinion that might be rendered on the Portfolios’ financial statements; or (ii) concerned the subject of a disagreement (as described in paragraph (a)(1)(iv) of Item 304 of Regulation S-K) or reportable events (as described in paragraph (a)(1)(v) of said Item 304).
NOTE 14 — SUBSEQUENT EVENTS
Dividends. Subsequent to December 31, 2019, the following Portfolio paid dividends from net investment income of:
| | Per Share
Amount | | Payable
Date | | Record
Date |
|---|
BlackRock Inflation Protected Bond |
| Class ADV | | $ | 0.0077 | | | February 3, 2020 | | January 30, 2020 |
| Class I | | $ | 0.0123 | | | February 3, 2020 | | January 30, 2020 |
| Class S | | $ | 0.0103 | | | February 3, 2020 | | January 30, 2020 |
The Portfolios have evaluated events occurring after the Statements of Assets and Liabilities date (“subsequent events”) to determine whether any subsequent events necessitated adjustment to or disclosure in the financial statements. Other than above, no such subsequent events were identified.
31
VY® BLACKROCK INFLATION
PROTECTED BOND PORTFOLIO | SUMMARY PORTFOLIO OF INVESTMENTS
AS OF DECEMBER 31, 2019 |
Principal
Amount† | | | | | | | | Value | | | Percentage
of Net
Assets |
|---|
| | | | | | | | | | | | |
|---|
CORPORATE BONDS/NOTES: 25.7% |
| | | | | | |
| | | | | | | | | | | | | | | |
| 200,000 | | | | | | Other Securities | | $ | 226,977 | | | | 0.1 | |
| |
| | | | | | |
| 1,000,000 | | | | | | Alibaba Group Holding Ltd., 3.125%, 11/28/2021 | | | 1,020,054 | | | | 0.4 | |
| 2,600,000 | | | | | | NBCUniversal Media LLC, 4.375%, 04/01/2021 | | | 2,681,633 | | | | 0.9 | |
| | | | | | | | | | 3,701,687 | | | | 1.3 | |
| | | | | | | | | | | | | | | |
| | | | | | |
| 200,000 | | | | (1) | | BMW US Capital LLC, 3.450%, 04/12/2023 | | | 207,515 | | | | 0.1 | |
| 700,000 | | | | (1) | | Daimler Finance North America LLC, 3.100%, 05/04/2020 | | | 702,350 | | | | 0.2 | |
| | | | | | | | | | 909,865 | | | | 0.3 | |
| |
| Consumer, Non-cyclical: 0.4% |
| 1,000,000 | | | | | | UnitedHealth Group, Inc., 2.875%, 12/15/2021 | | | 1,020,001 | | | | 0.4 | |
| | | | | | | | | | | | | | | |
| |
| 1,550,000 | | | | | | BP Capital Markets PLC, 3.561%, 11/01/2021 | | | 1,598,355 | | | | 0.6 | |
| 995,000 | | | | (1) | | Schlumberger Finance Canada Ltd., 2.200%, 11/20/2020 | | | 996,646 | | | | 0.3 | |
| 1,000,000 | | | | (1) | | Schlumberger Finance Canada Ltd., 2.650%, 11/20/2022 | | | 1,016,859 | | | | 0.4 | |
| | | | | | | | | | 3,611,860 | | | | 1.3 | |
| | | | | | | | | | | | | | | |
| |
| 1,885,000 | | | | (1) | | AIA Group Ltd., 2.428%, (US0003M + 0.520%), 09/20/2021 | | | 1,886,616 | | | | 0.7 | |
| 1,750,000 | | | | | | American Express Co., 3.700%, 11/05/2021 | | | 1,803,359 | | | | 0.6 | |
| 585,000 | | | | (1) | | ANZ New Zealand Int’l Ltd./London, 2.200%, 07/17/2020 | | | 585,894 | | | | 0.2 | |
| 2,000,000 | | | | (2) | | Bank of America Corp., 2.738%, 01/23/2022 | | | 2,015,242 | | | | 0.7 | |
| 2,000,000 | | | | (2) | | Bank of America Corp., 2.816%, 07/21/2023 | | | 2,033,101 | | | | 0.7 | |
| 1,250,000 | | | | (2) | | Bank of New York Mellon Corp./The, 2.661%, 05/16/2023 | | | 1,269,246 | | | | 0.5 | |
| 1,500,000 | | | | | | Bank of Nova Scotia/The, 3.125%, 04/20/2021 | | | 1,523,811 | | | | 0.5 | |
| 760,000 | | | | (1) | | Banque Federative du Credit Mutuel SA, 2.125%, 11/21/2022 | | | 760,954 | | | | 0.3 | |
| 1,500,000 | | | | | | Truist Financial Corp., 2.150%, 02/01/2021 | | | 1,504,322 | | | | 0.5 | |
| 1,665,000 | | | | | | BNP Paribas SA, 5.000%, 01/15/2021 | | | 1,717,908 | | | | 0.6 | |
| 1,335,000 | | | | | | Cooperatieve Rabobank UA/NY, 3.125%, 04/26/2021 | | | 1,356,059 | | | | 0.5 | |
| 2,465,000 | | | | | | Credit Suisse AG/New York NY, 2.100%–3.000%, 10/29/2021–11/12/2021 | | | 2,491,884 | | | | 0.9 | |
Principal
Amount† | | | | | | | | Value | | | Percentage
of Net
Assets |
|---|
| | | | | | | | | | | | |
|---|
CORPORATE BONDS/NOTES: (continued) |
| |
| 1,000,000 | | | | (1) | | DNB Bank ASA, 2.375%, 06/02/2021 | | $ | 1,006,694 | | | | 0.4 | |
| 1,880,000 | | | | | | Fifth Third Bank/Cincinnati OH, 2.875%–3.350%,
07/26/2021–10/01/2021 | | | 1,917,843 | | | | 0.7 | |
| 1,100,000 | | | | | | Goldman Sachs Group, Inc./The, 2.625%, 04/25/2021 | | | 1,109,636 | | | | 0.4 | |
| 2,610,000 | | | | | | HSBC Holdings PLC, 2.950%, 05/25/2021 | | | 2,643,215 | | | | 1.0 | |
| 1,000,000 | | | | (2) | | JPMorgan Chase Bank NA, 2.604%, 02/01/2021 | | | 1,000,532 | | | | 0.4 | |
| 2,500,000 | | | | | | JPMorgan Chase & Co., 2.400%–4.500%,
06/07/2021–09/23/2022 | | | 2,587,736 | | | | 0.9 | |
| 800,000 | | | | | | KeyBank NA/Cleveland OH, 3.350%, 06/15/2021 | | | 817,345 | | | | 0.3 | |
| 1,250,000 | | | | | | Lloyds Bank PLC, 3.300%, 05/07/2021 | | | 1,270,377 | | | | 0.5 | |
| 1,000,000 | | | | (1) | | Metropolitan Life Global Funding I, 3.375%, 01/11/2022 | | | 1,028,043 | | | | 0.4 | |
| 2,000,000 | | | | | | Mitsubishi UFJ Financial Group, Inc., 3.218%, 03/07/2022 | | | 2,048,972 | | | | 0.7 | |
| 1,015,000 | | | | | | Mitsubishi UFJ Financial Group, Inc., 2.190%–3.535%, 07/26/2021–09/13/2021 | | | 1,022,397 | | | | 0.4 | |
| 4,000,000 | | | | | | Morgan Stanley, 2.500%, 04/21/2021 | | | 4,031,258 | | | | 1.5 | |
| 1,500,000 | | | | | | National Australia Bank Ltd./New York, 2.500%, 01/12/2021 | | | 1,509,622 | | | | 0.5 | |
| 1,130,000 | | | | | | Santander UK PLC, 2.125%, 11/03/2020 | | | 1,131,444 | | | | 0.4 | |
| 1,520,000 | | | | (1) | | Skandinaviska Enskilda Banken AB, 2.200%, 12/12/2022 | | | 1,524,005 | | | | 0.5 | |
| 1,800,000 | | | | | | Sumitomo Mitsui Financial Group, Inc., 2.846%–2.934%, 03/09/2021–01/11/2022 | | | 1,824,126 | | | | 0.7 | |
| 1,485,000 | | | | | | Svenska Handelsbanken AB, 2.450%–3.350%, 03/30/2021–05/24/2021 | | | 1,498,322 | | | | 0.5 | |
| 295,000 | | | | (1) | | UBS AG/London, 2.200%, 06/08/2020 | | | 295,398 | | | | 0.1 | |
| 2,100,000 | | | | | | Wells Fargo & Co., 3.500%, 03/08/2022 | | | 2,169,117 | | | | 0.8 | |
| 1,740,000 | | | | | | Wells Fargo Bank NA, 2.600%, 01/15/2021 | | | 1,752,571 | | | | 0.6 | |
| 700,000 | | | | | | Wells Fargo Bank NA, 3.625%, 10/22/2021 | | | 720,582 | | | | 0.3 | |
| 1,995,000 | | | | | | Other Securities | | | 2,026,469 | | | | 0.7 | |
| | | | | | | | | | 53,884,100 | | | | 19.4 | |
| | | | | | | | | | | | | | | |
| |
| 1,000,000 | | | | | | Boeing Co/The, 2.700%, 05/01/2022 | | | 1,015,547 | | | | 0.4 | |
| 1,500,000 | | | | | | Caterpillar Financial Services Corp., 1.900%, 09/06/2022 | | | 1,502,840 | | | | 0.5 | |
| | | | | | | | | | 2,518,387 | | | | 0.9 | |
See Accompanying Notes to Financial Statements
32
VY® BLACKROCK INFLATION
PROTECTED BOND PORTFOLIO | SUMMARY PORTFOLIO OF INVESTMENTS
AS OF DECEMBER 31, 2019 (CONTINUED) |
Principal
Amount† | | | | | | | Value | | | Percentage
of Net
Assets |
|---|
| | | | | | | | | | | |
|---|
CORPORATE BONDS/NOTES: (continued) |
| |
| 1,000,000 | | | | | International Business Machines Corp., 1.875%, 08/01/2022 | | $ | 999,465 | | | | 0.4 | |
| 2,275,000 | | | | | International Business Machines Corp., 2.850%, 05/13/2022 | | | 2,324,920 | | | | 0.8 | |
| 1,000,000 | | | | | Oracle Corp., 2.500%, 05/15/2022 | | | 1,012,996 | | | | 0.3 | |
| 460,000 | | | | | Other Securities | | | 465,569 | | | | 0.2 | |
| | | | | | | | | 4,802,950 | | | | 1.7 | |
| | | | | | | | | | | | | | |
| |
| 785,000 | | | | | Wisconsin Public Service Corp., 3.350%, 11/21/2021 | | | 806,757 | | | | 0.3 | |
| | | | | | Total Corporate Bonds/Notes | | | | | | | | |
| | | | | | (Cost $70,637,579) | | | 71,482,584 | | | | 25.7 | |
| | | | | | | | | | | | | | |
U.S. TREASURY OBLIGATIONS: 50.3% |
| Treasury Inflation Indexed Protected Securities: 50.3% |
| 7,048,250 | | | | | 0.125%,07/15/2026 | | | 7,072,205 | | | | 2.6 | |
| 5,789,933 | | | | | 0.250%,07/15/2029 | | | 5,848,237 | | | | 2.1 | |
| 11,435,147 | | | | | 0.375%,01/15/2027 | | | 11,611,673 | | | | 4.2 | |
| 10,709,665 | | | | | 0.375%,07/15/2027 | | | 10,927,254 | | | | 3.9 | |
| 8,573,109 | | | (3) | | 0.500%,01/15/2028 | | | 8,797,250 | | | | 3.2 | |
| 3,314,275 | | | | | 0.625%,01/15/2024 | | | 3,384,925 | | | | 1.2 | |
| 8,025,942 | | | | | 0.625%,01/15/2026 | | | 8,273,713 | | | | 3.0 | |
| 4,925,052 | | | | | 0.625%,02/15/2043 | | | 4,984,740 | | | | 1.8 | |
| 8,227,391 | | | | | 0.750%,07/15/2028 | | | 8,658,083 | | | | 3.1 | |
| 4,629,287 | | | | | 0.750%,02/15/2042 | | | 4,811,726 | | | | 1.7 | |
| 5,983,354 | | | (3) | | 0.750%,02/15/2045 | | | 6,210,393 | | | | 2.2 | |
| 12,828,317 | | | | | 0.875%,01/15/2029 | | | 13,626,843 | | | | 4.9 | |
| 1,743,057 | | | | | 0.875%,02/15/2047 | | | 1,869,538 | | | | 0.7 | |
| 4,653,939 | | | | | 1.000%,02/15/2046 | | | 5,122,442 | | | | 1.8 | |
| 4,163,924 | | | | | 1.000%,02/15/2048 | | | 4,611,749 | | | | 1.7 | |
| 3,185,679 | | | | | 1.000%,02/15/2049 | | | 3,543,308 | | | | 1.3 | |
| 3,008,972 | | | | | 1.375%,02/15/2044 | | | 3,551,186 | | | | 1.3 | |
| 2,756,530 | | | | | 1.750%,01/15/2028 | | | 3,097,495 | | | | 1.1 | |
| 3,850,902 | | | | | 2.000%,01/15/2026 | | | 4,281,370 | | | | 1.5 | |
| 1,870,868 | | | | | 2.125%,02/15/2040 | | | 2,446,834 | | | | 0.9 | |
| 2,767,455 | | | | | 2.125%,02/15/2041 | | | 3,647,514 | | | | 1.3 | |
| 4,405,132 | | | | | 2.375%,01/15/2027 | | | 5,085,839 | | | | 1.8 | |
| 2,121,575 | | | | | 2.500%,01/15/2029 | | | 2,557,627 | | | | 0.9 | |
| 1,841,297 | | | | | 3.375%,04/15/2032 | | | 2,528,918 | | | | 0.9 | |
| 2,768,958 | | | | | 0.250%–3.875%, 04/15/2023–04/15/2029 | | | 3,320,157 | | | | 1.2 | |
| | | | | | Total U.S. Treasury Obligations | | | | | | | | |
| | | | | | (Cost $133,896,640) | | | 139,871,019 | | | | 50.3 | |
| | | | | | | | | | | | | | |
U.S. GOVERNMENT AGENCY OBLIGATIONS(4): 8.8% |
| Federal Home Loan Bank: 2.6% |
| 5,255,000 | | | | | 2.875%, 09/13/2024 | | | 5,527,594 | | | | 2.0 | |
| 1,515,000 | | | | | 3.250%, 11/16/2028 | | | 1,655,816 | | | | 0.6 | |
| | | | | | | | | 7,183,410 | | | | 2.6 | |
| |
| Federal Home Loan Mortgage Corporation: 1.0% |
| 2,805,000 | | | | | 2.375%, 01/13/2022 | | | 2,847,664 | | | | 1.0 | |
| | | | | | | | | | | | | | | |
Principal
Amount† | | | | | | | Value | | | Percentage
of Net
Assets |
|---|
| | | | | | | | | | | |
|---|
U.S. GOVERNMENT AGENCY OBLIGATIONS(4): (continued) |
| Federal National Mortgage Association: 4.4%(4) |
| 4,830,000 | | | | | 1.875%, 09/24/2026 | | $ | 4,818,982 | | | | 1.7 | |
| 7,120,000 | | | | | 2.625%, 09/06/2024 | | | 7,408,881 | | | | 2.7 | |
| | | | | | | | | 12,227,863 | | | | 4.4 | |
| | | | | | | | | | | | | | |
| Other U.S. Agency Obligations: 0.8% |
| 2,190,000 | | | | | 2.875%, 12/21/2023 | | | 2,292,582 | | | | 0.8 | |
| | | | | | Total U.S. Government Agency Obligations | | | | | | | | |
| | | | | | (Cost $23,578,052) | | | 24,551,519 | | | | 8.8 | |
| | | | | | | | | | | | | | |
SOVEREIGN BONDS: 7.2% |
| 2,500,000 | | | | | Israel Government AID Bond, 5.500%, 04/26/2024 | | | 2,879,968 | | | | 1.0 | |
| EUR | 5,505,719 | | | (1) | | Italy Buoni Poliennali Del Tesoro, 1.300%, 05/15/2028 | | | 6,629,219 | | | | 2.4 | |
| | | | | | | | | | | | | | | |
| JPY | 351,821,040 | | | | | Japanese Government CPI Linked Bond, 0.100%, 03/10/2028 | | | 3,331,866 | | | | 1.2 | |
| JPY | 569,970,800 | | | | | Japanese Government CPI Linked Bond, 0.100%, 03/10/2029 | | | 5,397,818 | | | | 1.9 | |
| NZD | 2,055,000 | | | | | New Zealand Government Inflation Linked Bond, 2.500%, 09/20/2035 | | | 1,846,836 | | | | 0.7 | |
| EUR | 605,900 | | | | | Other Securities | | | 2,558 | | | | 0.0 | |
| | | | | | Total Sovereign Bonds | | | | | | | | |
| | | | | | (Cost $19,255,460) | | | 20,088,265 | | | | 7.2 | |
| | | | | | | | | | | | | | |
COMMERCIAL MORTGAGE-BACKED SECURITIES: 1.9% |
| 1,000,000 | | | | | BENCHMARK 2018-B3 A5 Mortgage Trust, 4.025%, 04/10/2051 | | | 1,104,556 | | | | 0.4 | |
| 375,000 | | | | | Freddie Mac Multifamily Structured Pass Through Certificates K071 A2, 3.286%, 11/25/2027 | | | 399,135 | | | | 0.2 | |
| 700,000 | | | (1) | | GS Mortgage Securities Corp. Trust 2016-RENT A, 3.203%, 02/10/2029 | | | 704,037 | | | | 0.2 | |
| 1,000,000 | | | | | GS Mortgage Securities Trust 2017-GS7 A4, 3.430%, 08/10/2050 | | | 1,059,804 | | | | 0.4 | |
| 1,916,000 | | | | | Other Securities | | | 2,006,371 | | | | 0.7 | |
| | | | | | Total Commercial Mortgage-Backed Securities | | | | | | | | |
| | | | | | (Cost $5,037,494) | | | 5,273,903 | | | | 1.9 | |
| | | | | | | | | | | | | | |
ASSET-BACKED SECURITIES: 1.4% |
| Auto Floor Plan Asset-Backed Securities: 0.6% |
| 850,000 | | | | | Ford Credit Floorplan Master Owner Trust 2017-1 A1, 2.070%, 05/15/2022 | | | 850,189 | | | | 0.3 | |
| 750,000 | | | | | Ford Credit Floorplan Master Owner Trust A 2018-1 A1, 2.950%, 05/15/2023 | | | 757,948 | | | | 0.3 | |
| | | | | | | | | 1,608,137 | | | | 0.6 | |
See Accompanying Notes to Financial Statements
33
VY® BLACKROCK INFLATION
PROTECTED BOND PORTFOLIO | SUMMARY PORTFOLIO OF INVESTMENTS
AS OF DECEMBER 31, 2019 (CONTINUED) |
Principal
Amount† | | | | | | | | Value | | | Percentage
of Net
Assets |
|---|
| | | | | | | | | | | | |
|---|
ASSET-BACKED SECURITIES: (continued) |
| Credit Card Asset-Backed Securities: 0.2% |
| 625,000 | | | | | | Other Securities | | $ | 623,750 | | | | 0.2 | |
| | | | | | | | | | | | | | | |
| Student Loan Asset-Backed Securities: 0.6% |
| 260,000 | | | | (1) | | Navient Student Loan Trust 2019-BA A2A, 3.390%, 12/15/2059 | | | 267,152 | | | | 0.1 | |
| 421,836 | | | | (1) | | SoFi Professional Loan Program 2015-B A1 LLC, 2.842%, (US0001M + 1.050%), 04/25/2035 | | | 423,808 | | | | 0.2 | |
| 800,000 | | | | (1) | | Sofi Professional Loan Program 2018-C A2FX Trust, 3.590%, 01/25/2048 | | | 819,137 | | | | 0.3 | |
| | | | | | | | | | 1,510,097 | | | | 0.6 | |
| | | | | | | Total Asset-Backed Securities | | | | | | | | |
| | | | | | | (Cost $3,704,450) | | | 3,741,984 | | | | 1.4 | |
| | | | | | | | | | | | | | | |
| | | | | | | | Value | | | Percentage
of Net
Assets |
|---|
| | | | | | | | | | | | |
|---|
PURCHASED OPTIONS(5): 0.5% |
| | | | | | | Total Purchased Options | | | | | | | | |
| | | | | | | (Cost $1,322,271) | | | 1,324,465 | | | | 0.5 | |
| | | | | | | Total Long-Term Investments | | | | | | | | |
| | | | | | | (Cost $257,431,946) | | | 266,333,739 | | | | 95.8 | |
| | | | | | | | | | | | | | | |
|---|
| Shares | | | | | | | | Value | | | Percentage
of Net
Assets |
|---|
| | | | | | | | | | | | | | | |
|---|
SHORT-TERM INVESTMENTS: 0.6% |
| |
| 1,677,355 | | | | (6) | | BlackRock Liquidity Funds, FedFund, Institutional Class, 1.520%
(Cost $1,677,355) | | | 1,677,355 | | | | 0.6 | |
| | | | | | | Total Short-Term Investments | | | | | | | | |
| | | | | | | (Cost $1,677,355) | | | 1,677,355 | | | | 0.6 | |
| | | | | | | Total Investments in Securities
(Cost $259,109,301) | | $ | 268,011,094 | | | | 96.4 | |
| | | | | | | Assets in Excess of Other Liabilities | | | 9,946,677 | | | | 3.6 | |
| | | | | | | Net Assets | | $ | 277,957,771 | | | | 100.0 | |
| | “Other Securities” represents issues not identified as the top 50 holdings in terms of market value and issues or issuers not exceeding 1% of net assets individually or in aggregate respectively as of December 31, 2019.
The following footnotes apply to either the individual securities noted or one or more of the securities aggregated and listed as a single line item. |
| † | | Unless otherwise indicated, principal amount is shown in USD. |
| (1) | | Securities with purchases pursuant to Rule 144A or section 4(a)(2), under the Securities Act of 1933 and may not be resold subject to that rule except to qualified institutional buyers. |
| (2) | | Variable rate security. Rate shown is the rate in effect as of December 31, 2019. |
| (3) | | All or a portion of this security has been pledged as collateral in connection with open futures contracts. Please refer to Note 2 for additional details. |
| (4) | | The Federal Housing Finance Agency (“FHFA”) placed the Federal Home Loan Mortgage Corporation and Federal National Mortgage Association into conservatorship with FHFA as the conservator. As such, the FHFA oversees the continuing affairs of these companies. |
| (5) | | The tables within the Portfolio of Investments detail open purchased options which are non-income producing securities. |
| (6) | | Rate shown is the 7-day yield as of December 31, 2019. |
Currency Abbreviations:
| EUR | | EU Euro |
| JPY | | Japanese Yen |
| NZD | | New Zealand Dollar |
Reference Rate Abbreviations:
| US0001M | | 1-month LIBOR |
| US0003M | | 3-month LIBOR |
See Accompanying Notes to Financial Statements
34
VY® BLACKROCK INFLATION
PROTECTED BOND PORTFOLIO | SUMMARY PORTFOLIO OF INVESTMENTS
AS OF DECEMBER 31, 2019 (CONTINUED) |
Fair Value Measurementsˆ
The following is a summary of the fair valuations according to the inputs used as of December 31, 2019 in valuing the assets and liabilities:
| | Quoted Prices
in Active Markets
for Identical
Investments
(Level 1) | | Significant
Other
Observable
Inputs
(Level 2) | | Significant
Unobservable
Inputs
(Level 3) | | Fair Value
at
December 31, 2019 |
|---|
Asset Table | | | | | | | | | | | | | | | | | | | | |
Investments, at fair value | | | | | | | | | | | | | | | | | | | | |
| Purchased Options | | | $ | 130,043 | | | | $ | 1,194,422 | | | | $ | — | | | | $ | 1,324,465 | |
| Corporate Bonds/Notes | | | | — | | | | | 71,482,584 | | | | | — | | | | | 71,482,584 | |
| Commercial Mortgage-Backed Securities | | | | — | | | | | 5,273,903 | | | | | — | | | | | 5,273,903 | |
| Asset-Backed Securities | | | | — | | | | | 3,741,984 | | | | | — | | | | | 3,741,984 | |
| U.S. Government Agency Obligations | | | | — | | | | | 24,551,519 | | | | | — | | | | | 24,551,519 | |
| Sovereign Bonds | | | | — | | | | | 20,088,265 | | | | | — | | | | | 20,088,265 | |
| U.S. Treasury Obligations | | | | — | | | | | 139,871,019 | | | | | — | | | | | 139,871,019 | |
| Short-Term Investments | | | | 1,677,355 | | | | | — | | | | | — | | | | | 1,677,355 | |
| Total Investments, at fair value | | | $ | 1,807,398 | | | | $ | 266,203,696 | | | | $ | — | | | | $ | 268,011,094 | |
Other Financial Instruments+ | | | | | | | | | | | | | | | | | | | | |
| Centrally Cleared Swaps | | | | — | | | | | 1,414,166 | | | | | — | | | | | 1,414,166 | |
| Forward Foreign Currency Contracts | | | | — | | | | | 61,470 | | | | | — | | | | | 61,470 | |
| Futures | | | | 223,642 | | | | | — | | | | | — | | | | | 223,642 | |
| OTC Swaps | | | | — | | | | | 1,366,271 | | | | | — | | | | | 1,366,271 | |
| Total Assets | | | $ | 2,031,040 | | | | $ | 269,045,603 | | | | $ | — | | | | $ | 271,076,643 | |
Liabilities Table | | | | | | | | | | | | | | | | | | | | |
Other Financial Instruments+ | | | | | | | | | | | | | | | | | �� | | | |
| Centrally Cleared Swaps | | | $ | — | | | | $ | (2,373,007 | ) | | | $ | — | | | | $ | (2,373,007 | ) |
| Forward Foreign Currency Contracts | | | | — | | | | | (318,897 | ) | | | | — | | | | | (318,897 | ) |
| Futures | | | | (384,644 | ) | | | | — | | | | | — | | | | | (384,644 | ) |
| Written Options | | | | (92,369 | ) | | | | (1,351,782 | ) | | | | — | | | | | (1,444,151 | ) |
| Total Liabilities | | | $ | (477,013 | ) | | | $ | (4,043,686 | ) | | | $ | — | | | | $ | (4,520,699 | ) |
| ˆ | | See Note 2, “Significant Accounting Policies” in the Notes to Financial Statements for additional information. |
| | | |
| + | | Other Financial Instruments may include open forward foreign currency contracts, futures, centrally cleared swaps, OTC swaps and written options. Forward foreign currency contracts, futures and centrally cleared swaps are valued at the unrealized gain (loss) on the instrument. OTC swaps and written options are valued at the fair value of the instrument. |
At December 31, 2019, the following forward foreign currency contracts were outstanding for VY® BlackRock Inflation Protected Bond Portfolio:
| Currency Purchased | | Currency Sold | | Counterparty | | Settlement Date | | Unrealized
Appreciation
(Depreciation) |
|---|
| USD | 40,044 | | GBP | 30,000 | | Bank of America N.A. | | 02/05/20 | | | $ | 267 | |
| USD | 415,000 | | CAD | 546,440 | | Bank of America N.A. | | 03/18/20 | | | | (5,920 | ) |
| USD | 8,217,435 | | JPY | 895,898,000 | | Barclays Bank PLC | | 02/05/20 | | | | (43,315 | ) |
| USD | 464,230 | | GBP | 358,245 | | Citibank N.A. | | 02/05/20 | | | | (10,763 | ) |
| GBP | 285,642 | | USD | 370,357 | | Deutsche Bank AG | | 02/05/20 | | | | 8,372 | |
| USD | 422,098 | | EUR | 381,074 | | Deutsche Bank AG | | 02/05/20 | | | | (6,254 | ) |
| USD | 88,982 | | JPY | 9,654,572 | | JPMorgan Chase Bank N.A. | | 02/05/20 | | | | (39 | ) |
| USD | 167,161 | | EUR | 148,612 | | JPMorgan Chase Bank N.A. | | 02/05/20 | | | | 112 | |
| USD | 2,786,485 | | JPY | 302,315,000 | | Morgan Stanley & Co. International PLC | | 01/06/20 | | | | 3,674 | |
| CAD | 372,393 | | AUD | 410,000 | | Morgan Stanley & Co. International PLC | | 03/18/20 | | | | (1,403 | ) |
| CAD | 3,883,424 | | USD | 2,950,000 | | Morgan Stanley & Co. International PLC | | 03/18/20 | | | | 41,380 | |
| EUR | 260,000 | | USD | 291,572 | | Morgan Stanley & Co. International PLC | | 03/18/20 | | | | 1,448 | |
| EUR | 379,122 | | USD | 420,134 | | NatWest Markets PLC | | 02/05/20 | | | | 6,024 | |
| USD | 7,911,562 | | EUR | 7,157,000 | | NatWest Markets PLC | | 02/05/20 | | | | (133,366 | ) |
| GBP | 33,997 | | USD | 44,884 | | The Bank of Montreal | | 02/05/20 | | | | 193 | |
| USD | 54,838 | | CAD | 73,000 | | UBS AG | | 02/05/20 | | | | (1,388 | ) |
| USD | 2,550,087 | | NZD | 3,959,000 | | Westpac Banking Corp. | | 02/05/20 | | | | (116,449 | ) |
| | | | | | | | | | | | $ | (257,427 | ) |
See Accompanying Notes to Financial Statements
35
VY® BLACKROCK INFLATION
PROTECTED BOND PORTFOLIO | SUMMARY PORTFOLIO OF INVESTMENTS
AS OF DECEMBER 31, 2019 (CONTINUED) |
At December 31, 2019, the following futures contracts were outstanding for VY® BlackRock Inflation Protected Bond Portfolio:
| Description | | | Number
of Contracts | | Expiration
Date | | Notional
Value | | Unrealized
Appreciation/
(Depreciation) |
|---|
Long Contracts: | | | | | | | | | | | | | | | | | | | |
| Canada 10-Year Bond | | | | 68 | | | | 03/20/20 | | | | $ | 7,199,292 | | | | $ | (120,771 | ) |
| Euro-Schatz | | | | 106 | | | | 03/06/20 | | | | | 13,305,586 | | | | | (9,019 | ) |
| U.S. Treasury 10-Year Note | | | | 30 | | | | 03/20/20 | | | | | 3,852,656 | | | | | (1,137 | ) |
| U.S. Treasury 2-Year Note | | | | 126 | | | | 03/31/20 | | | | | 27,153,000 | | | | | (726 | ) |
| U.S. Treasury 5-Year Note | | | | 412 | | | | 03/31/20 | | | | | 48,867,063 | | | | | (214,090 | ) |
| U.S. Treasury Ultra Long Bond | | | | 8 | | | | 03/20/20 | | | | | 1,453,250 | | | | | (20,699 | ) |
| | | | | | | | | | | | | $ | 101,830,847 | | | | $ | (366,442 | ) |
| | | | | | | | | | | | | | | | |
Short Contracts: | | | | | | | | | | | | | | | | | | | |
| Euro-Bund | | | | (27 | ) | | | 03/06/20 | | | | | (5,163,466 | ) | | | | 58,530 | |
| Japan 10-Year Bond (TSE) | | | | (3 | ) | | | 03/13/20 | | | | | (4,201,739 | ) | | | | (5,593 | ) |
| Long-Term Euro-BTP | | | | (41 | ) | | | 03/06/20 | | | | | (6,551,722 | ) | | | | (12,609 | ) |
| U.S. Treasury Ultra 10-Year Note | | | | (126 | ) | | | 03/20/20 | | | | | (17,728,594 | ) | | | | 165,112 | |
| | | | | | | | | | | | | $ | (33,645,521 | ) | | | $ | 205,440 | |
At December 31, 2019, the following centrally cleared interest rate swaps were outstanding for VY® BlackRock Inflation Protected Bond Portfolio:
Pay/Receive
Floating Rate | | Floating Rate Index | | Floating Rate
Index Payment
Frequency | | Fixed
Rate | | Fixed Rate
Payment
Frequency | | Maturity
Date | | Notional Amount | | Fair
Value | | Unrealized
Appreciation/
(Depreciation) |
|---|
| Pay | | 3-month CAD-CDOR | | Semi-Annual | | 1.926 | % | Semi-Annual | | 10/18/21 | | CAD | 9,350,000 | | $ | (9,850 | ) | | $ | (9,972 | ) |
| Pay | | 6-month EUR-EURIBOR | | Semi-Annual | | (0.436 | ) | Annual | | 10/06/23 | | EUR | 310,000 | | | (2,287 | ) | | | (2,267 | ) |
| Pay | | 3-month NZD-BBR-FRA | | Quarterly | | 1.273 | | Semi-Annual | | 08/15/29 | | NZD | 1,885,000 | | | (55,966 | ) | | | (54,177 | ) |
| Pay | | 3-month USD-LIBOR | | Quarterly | | 3.289 | | Semi-Annual | | 10/08/20 | | USD | 2,590,000 | | | 29,527 | | | | 29,487 | |
| Pay | | 3-month USD-LIBOR | | Quarterly | | 1.528 | | Semi-Annual | | 11/22/20 | | USD | 2,760,000 | | | (5,997 | ) | | | (6,040 | ) |
| Pay | | 3-month USD-LIBOR | | Quarterly | | 2.526 | | Semi-Annual | | 02/07/22 | | USD | 20,030,000 | | | 335,774 | | | | 351,156 | |
| Pay | | 3-month USD-LIBOR | | Quarterly | | 2.033 | | Semi-Annual | | 03/30/22 | | USD | 660,000 | | | 5,002 | | | | 4,991 | |
| Pay | | 3-month USD-LIBOR | | Quarterly | | 2.250 | | Semi-Annual | | 04/27/22 | | USD | 5,370,000 | | | 64,074 | | | | 63,985 | |
| Pay | | 3-month USD-LIBOR | | Quarterly | | 1.713 | | Semi-Annual | | 07/13/22 | | USD | 9,250,000 | | | 7,172 | | | | 7,027 | |
| Pay | | 3-month USD-LIBOR | | Quarterly | | 3.208 | | Semi-Annual | | 10/29/24 | | USD | 1,030,000 | | | 71,287 | | | | 71,287 | |
| Pay | | 3-month USD-LIBOR | | Quarterly | | 3.090 | | Semi-Annual | | 11/29/24 | | USD | 4,210,000 | | | 272,302 | | | | 272,226 | |
| Pay | | 3-month USD-LIBOR | | Quarterly | | 1.846 | | Semi-Annual | | 08/15/29 | | USD | 970,000 | | | (3,026 | ) | | | (3,046 | ) |
| Pay | | 3-month USD-LIBOR | | Quarterly | | 1.857 | | Semi-Annual | | 08/15/29 | | USD | 970,000 | | | (2,138 | ) | | | (2,158 | ) |
| Pay | | 3-month USD-LIBOR | | Quarterly | | 2.447 | | Semi-Annual | | 05/18/31 | | USD | 210,000 | | | 9,047 | | | | 9,043 | |
| Pay | | 3-month USD-LIBOR | | Quarterly | | 2.102 | | Semi-Annual | | 06/22/31 | | USD | 100,000 | | | 1,139 | | | | 1,137 | |
| Pay | | 3-month USD-LIBOR | | Quarterly | | 1.929 | | Semi-Annual | | 12/01/56 | | USD | 25,000 | | | (1,222 | ) | | | (1,223 | ) |
| Receive | | 6-month EUR-EURIBOR | | Semi-Annual | | (0.450 | ) | Annual | | 12/16/21 | | EUR | 1,200,000 | | | 4,054 | | | | 3,997 | |
| Receive | | 6-month EUR-EURIBOR | | Semi-Annual | | (0.290 | ) | Annual | | 07/26/23 | | EUR | 1,640,000 | | | 5,759 | | | | 5,603 | |
| Receive | | 6-month EUR-EURIBOR | | Semi-Annual | | (0.300 | ) | Annual | | 07/27/23 | | EUR | 3,100,000 | | | 11,561 | | | | 11,262 | |
| Receive | | 6-month EUR-EURIBOR | | Semi-Annual | | (0.167 | ) | Annual | | 12/13/23 | | EUR | 1,170,000 | | | 2,162 | | | | 2,129 | |
| Receive | | 6-month EUR-EURIBOR | | Semi-Annual | | (0.110 | ) | Annual | | 12/27/23 | | EUR | 300,000 | | | 207 | | | | 201 | |
| Receive | | 6-month EUR-EURIBOR | | Semi-Annual | | (0.056 | ) | Annual | | 01/03/24 | | EUR | 615,000 | | | (291 | ) | | | (304 | ) |
| Receive | | 6-month EUR-EURIBOR | | Semi-Annual | | (0.050 | ) | Annual | | 01/03/24 | | EUR | 615,000 | | | (382 | ) | | | (395 | ) |
| Receive | | 6-month EUR-EURIBOR | | Semi-Annual | | (0.173 | ) | Annual | | 11/11/24 | | EUR | 260,000 | | | 744 | | | | 744 | |
| Receive | | 6-month EUR-EURIBOR | | Semi-Annual | | (0.175 | ) | Annual | | 03/18/25 | | EUR | 60,000 | | | 301 | | | | 298 | |
| Receive | | 6-month JPY-LIBOR | | Semi-Annual | | 0.336 | | Semi-Annual | | 02/08/34 | | JPY | 860,000 | | | (116 | ) | | | (121 | ) |
| Receive | | 6-month JPY-LIBOR | | Semi-Annual | | 0.295 | | Semi-Annual | | 06/17/39 | | JPY | 5,440,000 | | | 457 | | | | 394 | |
| Receive | | 6-month JPY-LIBOR | | Semi-Annual | | 0.167 | | Semi-Annual | | 08/08/39 | | JPY | 3,930,000 | | | 1,250 | | | | 1,222 | |
| Receive | | 6-month JPY-LIBOR | | Semi-Annual | | 0.715 | | Semi-Annual | | 03/21/44 | | JPY | 3,980,000 | | | (1,648 | ) | | | (1,705 | ) |
| Receive | | 6-month JPY-LIBOR | | Semi-Annual | | 0.201 | | Semi-Annual | | 08/28/44 | | JPY | 1,960,000 | | | 1,044 | | | | 1,036 | |
| Receive | | 3-month NZD-BBR-FRA | | Quarterly | | 2.545 | | Semi-Annual | | 03/20/29 | | NZD | 2,100,000 | | | (99,092 | ) | | | (98,156 | ) |
| Receive | | 3-month NZD-BBR-FRA | | Quarterly | | 2.576 | | Semi-Annual | | 03/20/29 | | NZD | 472,700 | | | (23,161 | ) | | | (22,977 | ) |
| Receive | | 3-month NZD-BBR-FRA | | Quarterly | | 2.588 | | Semi-Annual | | 03/20/29 | | NZD | 252,300 | | | (12,539 | ) | | | (12,445 | ) |
| Receive | | 3-month NZD-BBR-FRA | | Quarterly | | 2.800 | | Semi-Annual | | 03/20/29 | | NZD | 1,401,160 | | | (86,981 | ) | | | (85,978 | ) |
| Receive | | 3-month USD-LIBOR | | Quarterly | | 1.560 | | Semi-Annual | | 03/27/21 | | USD | 5,280,000 | | | 6,592 | | | | 6,509 | |
| Receive | | 3-month USD-LIBOR | | Quarterly | | 1.560 | | Semi-Annual | | 03/30/21 | | USD | 1,340,000 | | | 1,638 | | | | 1,617 | |
| Receive | | 3-month USD-LIBOR | | Quarterly | | 1.770 | | Semi-Annual | | 06/15/21 | | USD | 5,780,000 | | | (6,823 | ) | | | (6,823 | ) |
| Receive | | 3-month USD-LIBOR | | Quarterly | | 2.561 | | Semi-Annual | | 08/02/21 | | USD | 4,240,000 | | | (56,784 | ) | | | (56,855 | ) |
| Receive | | 3-month USD-LIBOR | | Quarterly | | 2.000 | | Semi-Annual | | 09/25/21 | | USD | 1,000,000 | | | (5,190 | ) | | | (5,207 | ) |
See Accompanying Notes to Financial Statements
36
VY® BLACKROCK INFLATION
PROTECTED BOND PORTFOLIO | SUMMARY PORTFOLIO OF INVESTMENTS
AS OF DECEMBER 31, 2019 (CONTINUED) |
Pay/Receive
Floating Rate | | Floating Rate Index | | Floating Rate
Index Payment
Frequency | | Fixed
Rate | | Fixed Rate
Payment
Frequency | | Maturity
Date | | Notional Amount | | Fair
Value | | Unrealized
Appreciation/
(Depreciation) |
|---|
| Receive | | 3-month USD-LIBOR | | Quarterly | | 1.670 | % | Semi-Annual | | 09/30/21 | | USD | 1,450,000 | | $ | 711 | | | $ | 686 | |
| Receive | | 3-month USD-LIBOR | | Quarterly | | 1.624 | | Semi-Annual | | 10/22/21 | | USD | 7,105,000 | | | 8,534 | | | | 8,412 | |
| Receive | | 3-month USD-LIBOR | | Quarterly | | 3.295 | | Semi-Annual | | 11/12/21 | | USD | 2,540,000 | | | (74,695 | ) | | | (74,738 | ) |
| Receive | | 1-day Overnight Fed
Funds Effective Rate
| | Annual | | 1.305 | | Annual | | 12/15/21 | | USD | 15,330,000 | | | 29,733 | | | | 30,407 | |
| Receive | | 1-day Overnight Fed
Funds Effective Rate
| | Annual | | 1.411 | | Annual | | 12/15/21 | | USD | 6,780,000 | | | 977 | | | | 864 | |
| Receive | | 3-month USD-LIBOR | | Quarterly | | 1.870 | | Semi-Annual | | 06/03/22 | | USD | 5,710,000 | | | (13,743 | ) | | | (13,833 | ) |
| Receive | | 3-month USD-LIBOR | | Quarterly | | 1.741 | | Semi-Annual | | 07/14/22 | | USD | 4,410,000 | | | (9,008 | ) | | | (9,082 | ) |
| Receive | | 3-month USD-LIBOR | | Quarterly | | 1.455 | | Semi-Annual | | 12/01/22 | | USD | 1,180,000 | | | 4,119 | | | | 4,099 | |
| Receive | | 3-month USD-LIBOR | | Quarterly | | 1.619 | | Semi-Annual | | 12/21/22 | | USD | 900,000 | | | 305 | | | | 290 | |
| Receive | | 3-month USD-LIBOR | | Quarterly | | 1.653 | | Semi-Annual | | 12/22/22 | | USD | 675,000 | | | (208 | ) | | | (220 | ) |
| Receive | | 3-month USD-LIBOR | | Quarterly | | 1.658 | | Semi-Annual | | 12/22/22 | | USD | 675,000 | | | (274 | ) | | | (285 | ) |
| Receive | | 3-month USD-LIBOR | | Quarterly | | 2.521 | | Semi-Annual | | 02/09/23 | | USD | 10,050,000 | | | (171,012 | ) | | | (171,539 | ) |
| Receive | | 3-month USD-LIBOR | | Quarterly | | 2.430 | | Semi-Annual | | 03/15/23 | | USD | 3,200,000 | | | (48,552 | ) | | | (48,529 | ) |
| Receive | | 3-month USD-LIBOR | | Quarterly | | 1.771 | | Semi-Annual | | 07/12/23 | | USD | 9,400,000 | | | (5,923 | ) | | | (6,071 | ) |
| Receive | | 3-month USD-LIBOR | | Quarterly | | 1.546 | | Semi-Annual | | 10/26/23 | | USD | 750,000 | | | 2,090 | | | | 2,078 | |
| Receive | | 3-month USD-LIBOR | | Quarterly | | 1.587 | | Semi-Annual | | 11/01/23 | | USD | 730,000 | | | 1,479 | | | | 1,467 | |
| Receive | | 3-month USD-LIBOR | | Quarterly | | 1.605 | | Semi-Annual | | 11/01/23 | | USD | 720,000 | | | 1,218 | | | | 1,206 | |
| Receive | | 3-month USD-LIBOR | | Quarterly | | 2.572 | | Semi-Annual | | 02/07/25 | | USD | 2,610,000 | | | (106,149 | ) | | | (109,199 | ) |
| Receive | | 3-month USD-LIBOR | | Quarterly | | 2.161 | | Semi-Annual | | 03/31/25 | | USD | 190,000 | | | (4,002 | ) | | | (4,006 | ) |
| Receive | | 3-month USD-LIBOR | | Quarterly | | 2.312 | | Semi-Annual | | 04/03/25 | | USD | 800,000 | | | (22,606 | ) | | | (22,621 | ) |
| Receive | | 3-month USD-LIBOR | | Quarterly | | 2.350 | | Semi-Annual | | 04/27/25 | | USD | 1,440,000 | | | (43,224 | ) | | | (43,250 | ) |
| Receive | | 3-month USD-LIBOR | | Quarterly | | 1.755 | | Semi-Annual | | 11/15/26 | | USD | 1,250,000 | | | 2,207 | | | | 2,183 | |
| Receive | | 3-month USD-LIBOR | | Quarterly | | 1.832 | | Semi-Annual | | 05/15/29 | | USD | 260,000 | | | 987 | | | | 982 | |
| Receive | | 3-month USD-LIBOR | | Quarterly | | 1.670 | | Semi-Annual | | 08/15/29 | | USD | 2,860,000 | | | 52,544 | | | | 51,710 | |
| Receive | | 3-month USD-LIBOR | | Quarterly | | 1.765 | | Semi-Annual | | 08/15/29 | | USD | 970,000 | | | 9,881 | | | | 9,861 | |
| Receive | | 3-month USD-LIBOR | | Quarterly | | 2.300 | | Semi-Annual | | 11/05/29 | | USD | 400,000 | | | (14,813 | ) | | | (14,822 | ) |
| Receive | | 3-month USD-LIBOR | | Quarterly | | 1.893 | | Semi-Annual | | 12/23/29 | | USD | 330,000 | | | 99 | | | | 92 | |
| Receive | | 3-month USD-LIBOR | | Quarterly | | 1.904 | | Semi-Annual | | 12/30/29 | | USD | 110,000 | | | (64 | ) | | | (66 | ) |
| Receive | | 3-month USD-LIBOR | | Quarterly | | 2.357 | | Semi-Annual | | 03/29/30 | | USD | 1,020,000 | | | (42,496 | ) | | | (42,517 | ) |
| Receive | | 3-month USD-LIBOR | | Quarterly | | 2.554 | | Semi-Annual | | 05/06/30 | | USD | 200,000 | | | (11,849 | ) | | | (11,853 | ) |
| Receive | | 3-month USD-LIBOR | | Quarterly | | 2.325 | | Semi-Annual | | 06/24/34 | | USD | 70,000 | | | (1,023 | ) | | | (1,024 | ) |
| Receive | | 3-month USD-LIBOR | | Quarterly | | 1.645 | | Semi-Annual | | 08/22/34 | | USD | 300,000 | | | 13,106 | | | | 13,100 | |
| Receive | | 3-month USD-LIBOR | | Quarterly | | 1.907 | | Semi-Annual | | 10/21/34 | | USD | 320,000 | | | 7,052 | | | | 7,046 | |
| Receive | | 3-month USD-LIBOR | | Quarterly | | 1.921 | | Semi-Annual | | 10/22/34 | | USD | 300,000 | | | 6,257 | | | | 6,251 | |
| Receive | | 3-month USD-LIBOR | | Quarterly | | 1.976 | | Semi-Annual | | 10/23/34 | | USD | 145,000 | | | 2,351 | | | | 2,348 | |
| Receive | | 3-month USD-LIBOR | | Quarterly | | 1.982 | | Semi-Annual | | 10/23/34 | | USD | 145,000 | | | 2,284 | | | | 2,281 | |
| Receive | | 3-month USD-LIBOR | | Quarterly | | 1.998 | | Semi-Annual | | 11/07/34 | | USD | 320,000 | | | 4,638 | | | | 4,631 | |
| Receive | | 3-month USD-LIBOR | | Quarterly | | 2.111 | | Semi-Annual | | 11/12/34 | | USD | 330,000 | | | 1,667 | | | | 1,660 | |
| Receive | | 3-month USD-LIBOR | | Quarterly | | 2.098 | | Semi-Annual | | 10/23/39 | | USD | 180,000 | | | 2,454 | | | | 2,450 | |
| Receive | | 3-month USD-LIBOR | | Quarterly | | 2.110 | | Semi-Annual | | 11/15/44 | | USD | 390,000 | | | 3,600 | | | | 3,592 | |
| Receive | | 3-month USD-LIBOR | | Quarterly | | 2.378 | | Semi-Annual | | 07/05/49 | | USD | 140,000 | | | (1,835 | ) | | | (1,838 | ) |
| Receive | | 3-month USD-LIBOR | | Quarterly | | 1.709 | | Semi-Annual | | 08/16/49 | | USD | 130,000 | | | 3,739 | | | | 3,736 | |
| Receive | | 3-month USD-LIBOR | | Quarterly | | 1.667 | | Semi-Annual | | 08/17/49 | | USD | 100,000 | | | 3,142 | | | | 3,140 | |
| Receive | | 3-month USD-LIBOR | | Quarterly | | 2.370 | | Semi-Annual | | 06/15/50 | | USD | 370,000 | | | (23,037 | ) | | | (23,047 | ) |
| | | | | | | | | | | | | | | $ | 28,261 | | | $ | 41,534 | |
At December 31, 2019, the following centrally cleared inflation-linked swaps were outstanding for VY® BlackRock Inflation Protected Bond Portfolio:
Pay/Receive
Floating Rate | | Floating Rate
Index | | Floating Rate
Index Payment Frequency | | Fixed
Rate | | Fixed Rate
Payment
Frequency | | Maturity
Date | | Notional Amount | | Fair
Value | | Unrealized
Appreciation/
(Depreciation) |
|---|
| Pay | | Eurostat Eurozone
HICP ex Tobacco
NSA (CPTFEMU) | | At Termination Date | | 1.390 | % | At Termination Date | | 06/15/49 | | EUR | 235,000 | | $ | (14,593 | ) | | $ | (13,687 | ) |
| Pay | | Eurostat Eurozone
HICP ex Tobacco
NSA (CPTFEMU) | | At Termination Date | | 1.395 | | At Termination Date | | 08/15/49 | | EUR | 285,000 | | | (16,050 | ) | | | (16,104 | ) |
| Pay | | Eurostat Eurozone
HICP ex Tobacco
NSA (CPTFEMU) | | At Termination Date | | 1.427 | | At Termination Date | | 11/15/49 | | EUR | 305,000 | | | (14,201 | ) | | | (15,658 | ) |
| Pay | | U.K. RPI All Items
Monthly | | At Termination Date | | 3.385 | | At Termination Date | | 08/15/28 | | GBP | 465,000 | | | 4,683 | | | | 5,512 | |
See Accompanying Notes to Financial Statements
37
VY® BLACKROCK INFLATION
PROTECTED BOND PORTFOLIO | SUMMARY PORTFOLIO OF INVESTMENTS
AS OF DECEMBER 31, 2019 (CONTINUED) |
Pay/Receive
Floating Rate | | Floating Rate
Index | | Floating Rate
Index Payment Frequency | | Fixed
Rate | | Fixed Rate
Payment
Frequency | | Maturity
Date | | Notional Amount | | Fair
Value | | Unrealized
Appreciation/
(Depreciation) |
|---|
| Pay | | U.K. RPI All Items Monthly | | At Termination Date | | 3.400 | % | At Termination Date | | 08/15/28 | | GBP | 3,160,000 | | $ | 39,771 | | | $ | 45,368 | |
| Pay | | U.K. RPI All Items Monthly | | At Termination Date | | 3.505 | | At Termination Date | | 10/15/28 | | GBP | 1,470,000 | | | 52,462 | | | | 54,272 | |
| Pay | | U.K. RPI All Items Monthly | | At Termination Date | | 3.490 | | At Termination Date | | 03/15/29 | | GBP | 1,590,000 | | | 28,298 | | | | 29,567 | |
| Pay | | U.K. RPI All Items Monthly | | At Termination Date | | 3.360 | | At Termination Date | | 10/15/39 | | GBP | 2,025,000 | | | 35,808 | | | | 40,401 | |
| Pay | | U.K. RPI All Items Monthly | | At Termination Date | | 3.270 | | At Termination Date | | 10/15/44 | | GBP | 1,560,000 | | | 20,053 | | | | 17,218 | |
| Pay | | U.S. CPI Urban Consumers NSA (CPURNSA) | | At Termination Date | | 1.750 | | At Termination Date | | 08/22/29 | | USD | 1,350,000 | | | (29,928 | ) | | | (29,983 | ) |
| Pay | | U.S. CPI Urban Consumers NSA (CPURNSA) | | At Termination Date | | 1.857 | | At Termination Date | | 11/25/29 | | USD | 1,330,000 | | | (18,527 | ) | | | (18,581 | ) |
| Receive | | Eurostat Eurozone HICP ex Tobacco NSA (CPTFEMU) | | At Termination Date | | 1.296 | | At Termination Date | | 01/15/29 | | EUR | 975,000 | | | (18,628 | ) | | | (18,706 | ) |
| Receive | | Eurostat Eurozone HICP ex Tobacco NSA (CPTFEMU) | | At Termination Date | | 1.290 | | At Termination Date | | 03/15/29 | | EUR | 2,230,000 | | | (34,646 | ) | | | (34,758 | ) |
| Receive | | Eurostat Eurozone HICP ex Tobacco NSA (CPTFEMU) | | At Termination Date | | 1.053 | | At Termination Date | | 08/15/29 | | EUR | 1,110,000 | | | 16,824 | | | | 16,775 | |
| Receive | | Eurostat Eurozone HICP ex Tobacco NSA (CPTFEMU) | | At Termination Date | | 1.088 | | At Termination Date | | 11/15/29 | | EUR | 1,115,000 | | | 14,811 | | | | 15,436 | |
| Receive | | U.K. RPI All Items Monthly | | At Termination Date | | 3.456 | | At Termination Date | | 11/15/29 | | GBP | 415,000 | | | (3,346 | ) | | | (3,543 | ) |
| Receive | | U.K. RPI All Items Monthly | | At Termination Date | | 3.458 | | At Termination Date | | 12/15/29 | | GBP | 815,000 | | | (2,405 | ) | | | (2,408 | ) |
| Receive | | U.K. RPI All Items Monthly | | At Termination Date | | 3.420 | | At Termination Date | | 10/15/34 | | GBP | 2,025,000 | | | (41,530 | ) | | | (48,495 | ) |
| Receive | | U.K. RPI All Items Monthly | | At Termination Date | | 3.160 | | At Termination Date | | 10/15/49 | | GBP | 1,560,000 | | | (14,904 | ) | | | 1,533 | |
| Receive | | U.S. CPI Urban Consumers NSA (CPURNSA) | | At Termination Date | | 2.299 | | At Termination Date | | 09/28/21 | | USD | 7,100,000 | | | (113,620 | ) | | | (113,857 | ) |
| Receive | | U.S. CPI Urban Consumers NSA (CPURNSA) | | At Termination Date | | 2.205 | | At Termination Date | | 03/21/22 | | USD | 5,100,000 | | | (73,149 | ) | | | (73,333 | ) |
| Receive | | U.S. CPI Urban Consumers NSA (CPURNSA) | | At Termination Date | | 1.890 | | At Termination Date | | 06/29/22 | | USD | 6,700,000 | | | 23,792 | | | | 23,550 | |
| Receive | | U.S. CPI Urban Consumers NSA (CPURNSA) | | At Termination Date | | 2.260 | | At Termination Date | | 05/03/23 | | USD | 9,000,000 | | | (208,677 | ) | | | (209,001 | ) |
| Receive | | U.S. CPI Urban Consumers NSA (CPURNSA) | | At Termination Date | | 2.211 | | At Termination Date | | 10/26/23 | | USD | 2,500,000 | | | (49,687 | ) | | | (49,777 | ) |
| Receive | | U.S. CPI Urban Consumers NSA (CPURNSA) | | At Termination Date | | 1.957 | | At Termination Date | | 02/06/24 | | USD | 12,000,000 | | | (67,852 | ) | | | (68,285 | ) |
| Receive | | U.S. CPI Urban Consumers NSA (CPURNSA) | | At Termination Date | | 1.991 | | At Termination Date | | 03/04/24 | | USD | 3,000,000 | | | (16,075 | ) | | | (16,183 | ) |
| Receive | | U.S. CPI Urban Consumers NSA (CPURNSA) | | At Termination Date | | 2.248 | | At Termination Date | | 03/21/24 | | USD | 4,900,000 | | | (118,025 | ) | | | (118,212 | ) |
| Receive | | U.S. CPI Urban Consumers NSA (CPURNSA) | | At Termination Date | | 2.023 | | At Termination Date | | 05/02/24 | | USD | 3,500,000 | | | (22,768 | ) | | | (22,895 | ) |
| Receive | | U.S. CPI Urban Consumers NSA (CPURNSA) | | At Termination Date | | 1.829 | | At Termination Date | | 07/31/24 | | USD | 2,700,000 | | | 335 | | | | 237 | |
See Accompanying Notes to Financial Statements
38
VY® BLACKROCK INFLATION
PROTECTED BOND PORTFOLIO | SUMMARY PORTFOLIO OF INVESTMENTS
AS OF DECEMBER 31, 2019 (CONTINUED) |
Pay/Receive
Floating Rate | | Floating Rate
Index | | Floating Rate
Index Payment Frequency | | Fixed
Rate | | Fixed Rate
Payment
Frequency | | Maturity
Date | | Notional Amount | | Fair
Value | | | Unrealized
Appreciation/
(Depreciation) |
|---|
| Receive | | U.S. CPI Urban Consumers NSA (CPURNSA) | | At Termination Date | | 1.706 | % | At Termination Date | | 08/12/24 | | USD | 1,300,000 | | $ | 8,841 | | | $ | 8,794 | |
| Receive | | U.S. CPI Urban Consumers NSA (CPURNSA) | | At Termination Date | | 2.351 | | At Termination Date | | 09/28/24 | | USD | 7,400,000 | | | (236,058 | ) | | | (236,340 | ) |
| Receive | | U.S. CPI Urban Consumers NSA (CPURNSA) | | At Termination Date | | 1.908 | | At Termination Date | | 05/24/25 | | USD | 4,500,000 | | | (3,655 | ) | | | (3,827 | ) |
| Receive | | U.S. CPI Urban Consumers NSA (CPURNSA) | | At Termination Date | | 2.361 | | At Termination Date | | 09/28/25 | | USD | 6,150,000 | | | (224,982 | ) | | | (225,216 | ) |
| Receive | | U.S. CPI Urban Consumers NSA (CPURNSA) | | At Termination Date | | 2.098 | | At Termination Date | | 11/29/25 | | USD | 1,600,000 | | | (25,856 | ) | | | (25,917 | ) |
| Receive | | U.S. CPI Urban Consumers NSA (CPURNSA) | | At Termination Date | | 1.853 | | At Termination Date | | 06/28/26 | | USD | 450,000 | | | 770 | | | | 753 | |
| Receive | | U.S. CPI Urban Consumers NSA (CPURNSA) | | At Termination Date | | 2.249 | | At Termination Date | | 10/30/28 | | USD | 1,195,000 | | | (39,803 | ) | | | (39,852 | ) |
| Receive | | U.S. CPI Urban Consumers NSA (CPURNSA) | | At Termination Date | | 1.746 | | At Termination Date | | 09/06/29 | | USD | 4,100,000 | | | 94,341 | | | | 94,174 | |
| Receive | | U.S. CPI Urban Consumers NSA (CPURNSA) | | At Termination Date | | 1.786 | | At Termination Date | | 08/22/49 | | USD | 430,000 | | | 28,807 | | | | 28,783 | |
| Receive | | U.S. CPI Urban Consumers NSA (CPURNSA) | | At Termination Date | | 1.948 | | At Termination Date | | 11/25/49 | | USD | 425,000 | | | 8,949 | | | | 8,925 | |
| Receive | | U.S. CPI Urban Consumers NSA (CPURNSA) | | At Termination Date | | 1.960 | | At Termination Date | | 12/12/49 | | USD | 775,000 | | | 12,989 | | | | 12,945 | |
| | | | | | | | | | | | | | | $ | (1,017,431 | ) | | $ | (1,000,375 | ) |
At December 31, 2019, the following over-the-counter inflation-linked swaps were outstanding for VY® BlackRock Inflation Protected Bond Portfolio:
| Counterparty | | Pay/Receive
Floating
Rate | | Floating
Rate Index | | Floating Rate
Index Payment
Frequency | | Fixed
Rate | | Fixed Rate
Payment
Frequency | | Maturity
Date | | Notional Amount | | Fair
Value | | Upfront
Payments
Paid/
(Received) | | | Unrealized
Appreciation/
(Depreciation) |
|---|
| Barclays Bank PLC | | Receive | | U.S. CPI Urban
Consumers NSA
(CPURNSA) | | At Termination Date | | 1.437% | | At Termination Date | | 01/15/21 | | USD | 22,000,000 | | $ | 588,091 | | $ | — | | | $ | 588,091 | |
| Citibank N.A. | | Receive | | U.S. CPI Urban
Consumers NSA
(CPURNSA) | | At Termination Date | | 1.515 | | At Termination Date | | 01/15/22 | | USD | 16,000,000 | | | 400,515 | | | — | | | | 400,515 | |
| Citibank N.A. | | Receive | | U.S. CPI Urban
Consumers NSA (CPURNSA) | | At Termination Date | | 1.560 | | At Termination Date | | 01/15/23 | | USD | 10,250,000 | | | 258,105 | | | — | | | | 258,105 | |
| Citibank N.A. | | Receive | | U.S. CPI Urban Consumers NSA (CPURNSA) | | At Termination Date | | 1.660 | | At Termination Date | | 09/22/23 | | USD | 5,500,000 | | | 119,560 | | | — | | | | 119,560 | |
| | | | | | | | | | | | | | | | | $ | 1,366,271 | | $ | — | | | $ | 1,366,271 | |
At December 31, 2019, the following purchased exchange-traded options were outstanding for VY® BlackRock Inflation Protected Bond Portfolio:
| Description | | Put/Call | | Expiration
Date | | Exercise
Price | | Number of
Contracts | | Notional Amount | | Cost | | | Fair
Value | |
|---|
| 90-Day Eurodollar | | Call | | 03/16/20 | | 97.75 | USD | | 85 | | | 20,881,313 | | | $ | 15,450 | | | $ | 109,437 | |
| 90-Day Eurodollar | | Call | | 01/10/20 | | 99.00 | USD | | 35 | | | 8,591,013 | | | | 5,726 | | | | 219 | |
| 90-Day Eurodollar | | Call | | 12/13/21 | | 99.75 | USD | | 106 | | | 26,074,675 | | | | 18,723 | | | | 6,625 | |
| Euro-Bund | | Put | | 02/21/20 | | 171.00 | EUR | | 8 | | | 1,363,920 | | | | 6,740 | | | | 13,012 | |
| U.S. Treasury 10-Year Note | | Put | | 01/24/20 | | 127.50 | USD | | 4 | | | 513,688 | | | | 1,256 | | | | 750 | |
| | | | | | | | | | | | | | | | $ | 47,895 | | | $ | 130,043 | |
See Accompanying Notes to Financial Statements
39
VY® BLACKROCK INFLATION
PROTECTED BOND PORTFOLIO | SUMMARY PORTFOLIO OF INVESTMENTS
AS OF DECEMBER 31, 2019 (CONTINUED) |
At December 31, 2019, the following exchange-traded written options were outstanding for VY® BlackRock Inflation Protected Bond Portfolio:
| Description | | Put/Call | | Expiration
Date | | Exercise
Price | | Number of
Contracts | | Notional Amount | | | Premiums
Received | | | Fair
Value | |
|---|
| 90-Day Eurodollar | | Call | | 03/16/20 | | 97.88 | USD | | 85 | | USD | 20,881,313 | | | $ | 12,306 | | | $ | (82,875 | ) |
| 90-Day Eurodollar | | Call | | 01/10/20 | | 99.38 | USD | | 35 | | USD | 8,591,013 | | | | 1,681 | | | | (219 | ) |
| 90-Day Eurodollar | | Call | | 12/13/21 | | 99.38 | USD | | 53 | | USD | 13,037,337 | | | | 23,101 | | | | (9,275 | ) |
| | | | | | | | | | | | | | | | $ | 37,088 | | | $ | (92,369 | ) |
At December 31, 2019, the following over-the-counter purchased foreign currency options were outstanding for VY® BlackRock Inflation Protected Bond Portfolio:
| Description | | Counterparty | | Expiration
Date | | Exercise
Price | | Notional Amount | | Cost | | Fair
Value |
|---|
| Call GBP vs. Put USD | | Citibank N.A. | | 05/01/20 | | 1.350 | GBP | | 2,145,000 | | $47,424 | | $ | 31,078 | |
| | | | | | | | | | | | $47,424 | | $ | 31,078 | |
At December 31, 2019, the following OTC written foreign currency options were outstanding for VY® BlackRock Inflation Protected Bond Portfolio:
| Description | | Counterparty | | Expiration
Date | | Exercise
Price | | Notional Amount | | Premiums
Received | | Fair
Value |
|---|
| Call GBP vs. Put USD | | Deutsche Bank AG | | 05/01/20 | | 1.350 | GBP | | 2,145,000 | | $ | 27,379 | | $ | (31,078 | ) |
| | | | | | | | | | | | $ | 27,379 | | $ | (31,078 | ) |
At December 31, 2019, the following over-the-counter purchased interest rate swaptions were outstanding for VY® BlackRock Inflation Protected Bond Portfolio:
| Description | | Counterparty | | Pay/
Receive
Exercise
Rate | | Exercise
Rate | Floating Rate
Index | | Expiration
Date | | Notional Amount | | Cost | | | Fair
Value |
|---|
Call on 10-Year Interest Rate Swap(1) | | Barclays Bank PLC | | Receive | | 2.950 | % | 3-month USD-LIBOR | | 03/12/24 | | USD | 870,000 | | $ | 39,215 | | | $ | 76,532 | |
Call on 10-Year Interest Rate Swap(1) | | Barclays Bank PLC | | Receive | | 2.978 | % | 3-month USD-LIBOR | | 03/07/24 | | USD | 874,500 | | | 40,205 | | | | 78,504 | |
Call on 10-Year Interest Rate Swap(1) | | Barclays Bank PLC | | Receive | | 3.052 | % | 3-month USD-LIBOR | | 01/10/29 | | USD | 220,000 | | | 12,430 | | | | 20,237 | |
Call on 10-Year Interest Rate Swap(1) | | Barclays Bank PLC | | Receive | | 3.083 | % | 3-month USD-LIBOR | | 01/29/29 | | USD | 220,000 | | | 12,496 | | | | 20,611 | |
Call on 10-Year Interest Rate Swap(1) | | Barclays Bank PLC | | Receive | | 3.088 | % | 3-month USD-LIBOR | | 12/06/38 | | USD | 570,000 | | | 26,505 | | | | 53,192 | |
Call on 10-Year Interest Rate Swap(1) | | Citibank N.A. | | Receive | | 1.460 | % | 3-month USD-LIBOR | | 08/16/21 | | USD | 980,000 | | | 35,072 | | | | 12,305 | |
Call on 10-Year Interest Rate Swap(1) | | Citibank N.A. | | Receive | | 1.724 | % | 3-month USD-LIBOR | | 05/19/20 | | USD | 1,180,000 | | | 20,031 | | | | 9,417 | |
Call on 10-Year Interest Rate Swap(1) | | Citibank N.A. | | Receive | | 2.824 | % | 3-month USD-LIBOR | | 01/31/39 | | USD | 120,000 | | | 6,149 | | | | 9,871 | |
Call on 10-Year Interest Rate Swap(1) | | Citibank N.A. | | Receive | | 2.978 | % | 3-month USD-LIBOR | | 01/31/29 | | USD | 100,000 | | | 5,780 | | | | 8,807 | |
Call on 10-Year Interest Rate Swap(1) | | Citibank N.A. | | Receive | | 2.985 | % | 3-month USD-LIBOR | | 04/27/38 | | USD | 10,000 | | | 493 | | | | 891 | |
Call on 10-Year Interest Rate Swap(1) | | JPMorgan Chase Bank N.A. | | Receive | | 2.860 | % | 3-month USD-LIBOR | | 02/22/39 | | USD | 232,500 | | | 11,503 | | | | 19,461 | |
Call on 10-Year Interest Rate Swap(1) | | JPMorgan Chase Bank N.A. | | Receive | | 2.985 | % | 3-month USD-LIBOR | | 04/27/38 | | USD | 200,000 | | | 9,400 | | | | 17,822 | |
Call on 10-Year Interest Rate Swap(1) | | Morgan Stanley & Co. International PLC | | Receive | | 3.037 | % | 3-month USD-LIBOR | | 01/11/29 | | USD | 220,000 | | | 12,523 | | | | 20,057 | |
Call on 1-Year Interest Rate Swap(1) | | JPMorgan Chase Bank N.A. | | Receive | | 1.772 | % | 3-month USD-LIBOR | | 11/05/24 | | USD | 5,250,000 | | | 28,403 | | | | 24,537 | |
Call on 1-Year Interest Rate Swap(1) | | JPMorgan Chase Bank N.A. | | Receive | | 2.100 | % | 3-month USD-LIBOR | | 05/13/20 | | USD | 10,355,000 | | | 25,111 | | | | 44,575 | |
Call on 20-Year interest Rate Swap(2) | | JPMorgan Chase Bank N.A. | | Receive | | 0.780 | % | 6-month JPY-LIBOR | | 04/16/21 | | JPY | 18,900,000 | | | 5,916 | | | | 14,549 | |
Call on 20-Year Interest Rate Swap(2) | | Goldman Sachs International | | Receive | | 0.780 | % | 6-month JPY-LIBOR | | 04/16/21 | | JPY | 1,670,000 | | | 500 | | | | 1,310 | |
Call on 2-Year Interest Rate Swap(1) | | Barclays Bank PLC | | Receive | | 1.200 | % | 3-month USD-LIBOR | | 09/23/20 | | USD | 9,490,000 | | | 29,894 | | | | 11,722 | |
Call on 2-Year Interest Rate Swap(1) | | Barclays Bank PLC | | Receive | | 1.500 | % | 3-month USD-LIBOR | | 06/01/20 | | USD | 6,990,000 | | | 21,001 | | | | 11,180 | |
Call on 2-Year Interest Rate Swap(1) | | JPMorgan Chase Bank N.A. | | Receive | | 1.250 | % | 3-month USD-LIBOR | | 08/10/20 | | USD | 9,640,000 | | | 45,983 | | | | 10,639 | |
Call on 2-Year Interest Rate Swap(1) | | JPMorgan Chase Bank N.A. | | Receive | | 2.476 | % | 3-month USD-LIBOR | | 01/31/20 | | USD | 10,500,000 | | | 49,792 | | | | 165,916 | |
See Accompanying Notes to Financial Statements
40
VY® BLACKROCK INFLATION
PROTECTED BOND PORTFOLIO | SUMMARY PORTFOLIO OF INVESTMENTS
AS OF DECEMBER 31, 2019 (CONTINUED) |
| Description | | Counterparty | | Pay/
Receive
Exercise
Rate | | Exercise
Rate | | Floating Rate
Index | | Expiration
Date | | Notional Amount | | Cost | | | Fair
Value |
|---|
Call on 30-Year Interest Rate Swap(1) | | Barclays Bank PLC | | Receive | | 1.600% | | 3-month USD-LIBOR | | 06/11/20 | | USD | 775,000 | | $ | 33,302 | | | $ | 5,621 | |
Call on 5-Year Interest Rate Swap(1) | | Barclays Bank PLC | | Receive | | 2.520% | | 3-month USD-LIBOR | | 01/31/20 | | USD | 1,350,000 | | | 15,357 | | | | 51,074 | |
Call on 5-Year Interest Rate Swap(1) | | Citibank N.A. | | Receive | | 2.521% | | 3-month USD-LIBOR | | 02/26/20 | | USD | 2,390,000 | | | 26,290 | | | | 90,562 | |
Put on 10-Year Interest Rate Swap(3) | | Barclays Bank PLC | | Pay | | 1.100% | | 6-month JPY-LIBOR | | 06/29/22 | | JPY | 692,890,000 | | | 94,254 | | | | 4,834 | |
Put on 10-Year Interest Rate Swap(4) | | Barclays Bank PLC | | Pay | | 2.250% | | 3-month USD-LIBOR | | 08/08/22 | | USD | 960,000 | | | 22,728 | | | | 26,599 | |
Put on 10-Year Interest Rate Swap(4) | | Barclays Bank PLC | | Pay | | 2.950% | | 3-month USD-LIBOR | | 03/12/24 | | USD | 870,000 | | | 39,215 | | | | 15,807 | |
Put on 10-Year Interest Rate Swap(4) | | Barclays Bank PLC | | Pay | | 2.978% | | 3-month USD-LIBOR | | 03/07/24 | | USD | 874,500 | | | 40,205 | | | | 15,344 | |
Put on 10-Year Interest Rate Swap(4) | | Barclays Bank PLC | | Pay | | 3.052% | | 3-month USD-LIBOR | | 01/10/29 | | USD | 220,000 | | | 12,430 | | | | 6,794 | |
Put on 10-Year Interest Rate Swap(4) | | Barclays Bank PLC | | Pay | | 3.083% | | 3-month USD-LIBOR | | 01/29/29 | | USD | 220,000 | | | 12,496 | | | | 6,654 | |
Put on 10-Year Interest Rate Swap(4) | | Barclays Bank PLC | | Pay | | 3.088% | | 3-month USD-LIBOR | | 12/06/38 | | USD | 570,000 | | | 26,505 | | | | 20,286 | |
Put on 10-Year Interest Rate Swap(4) | | Citibank N.A. | | Pay | | 1.460% | | 3-month USD-LIBOR | | 08/16/21 | | USD | 980,000 | | | 35,072 | | | | 58,214 | |
Put on 10-Year Interest Rate Swap(4) | | Citibank N.A. | | Pay | | 1.724% | | 3-month USD-LIBOR | | 05/19/20 | | USD | 1,180,000 | | | 20,031 | | | | 29,227 | |
Put on 10-Year Interest Rate Swap(4) | | Citibank N.A. | | Pay | | 2.350% | | 3-month USD-LIBOR | | 07/13/20 | | USD | 2,900,000 | | | 10,856 | | | | 12,511 | |
Put on 10-Year Interest Rate Swap(4) | | Citibank N.A. | | Pay | | 2.824% | | 3-month USD-LIBOR | | 01/31/39 | | USD | 120,000 | | | 6,025 | | | | 4,948 | |
Put on 10-Year Interest Rate Swap(4) | | Citibank N.A. | | Pay | | 2.978% | | 3-month USD-LIBOR | | 01/31/29 | | USD | 100,000 | | | 5,778 | | | | 3,282 | |
Put on 10-Year Interest Rate Swap(4) | | Citibank N.A. | | Pay | | 2.985% | | 3-month USD-LIBOR | | 04/27/38 | | USD | 10,000 | | | 461 | | | | 379 | |
Put on 10-Year Interest Rate Swap(4) | | JPMorgan Chase Bank N.A. | | Pay | | 2.250% | | 3-month USD-LIBOR | | 08/02/22 | | USD | 950,000 | | | 25,650 | | | | 26,194 | |
Put on 10-Year Interest Rate Swap(4) | | JPMorgan Chase Bank N.A. | | Pay | | 2.860% | | 3-month USD-LIBOR | | 02/22/39 | | USD | 232,500 | | | 11,503 | | | | 9,392 | |
Put on 10-Year Interest Rate Swap(4) | | JPMorgan Chase Bank N.A. | | Pay | | 2.985% | | 3-month USD-LIBOR | | 04/27/38 | | USD | 200,000 | | | 9,400 | | | | 7,577 | |
Put on 10-Year Interest Rate Swap(4) | | Morgan Stanley & Co. International PLC | | Pay | | 2.500% | | 3-month USD-LIBOR | | 06/13/24 | | USD | 930,000 | | | 41,811 | | | | 29,280 | |
Put on 10-Year Interest Rate Swap(4) | | Morgan Stanley & Co. International PLC | | Pay | | 2.500% | | 3-month USD-LIBOR | | 06/20/24 | | USD | 930,000 | | | 37,600 | | | | 29,374 | |
Put on 10-Year Interest Rate Swap(4) | | Morgan Stanley & Co. International PLC | | Pay | | 3.037% | | 3-month USD-LIBOR | | 01/11/29 | | USD | 220,000 | | | 12,523 | | | | 6,878 | |
Put on 1-Year Interest Rate Swap(4) | | JPMorgan Chase Bank N.A. | | Pay | | 1.772% | | 3-month USD-LIBOR | | 11/05/24 | | USD | 5,250,000 | | | 28,403 | | | | 31,071 | |
Put on 1-Year Interest Rate Swap(4) | | JPMorgan Chase Bank N.A. | | Pay | | 2.100% | | 3-month USD-LIBOR | | 05/13/20 | | USD | 10,355,000 | | | 25,111 | | | | 162 | |
Put on 20-Year interest Rate Swap(3) | | JPMorgan Chase Bank N.A. | | Pay | | 0.780% | | 6-month JPY-LIBOR | | 04/16/21 | | JPY | 18,900,000 | | | 5,916 | | | | 653 | |
Put on 20-Year interest Rate Swap(3) | | JPMorgan Chase Bank N.A. | | Pay | | 0.780% | | 6-month JPY-LIBOR | | 04/16/21 | | JPY | 3,300,000 | | | 521 | | | | 75 | |
Put on 20-Year interest Rate Swap(3) | | JPMorgan Chase Bank N.A. | | Pay | | 0.780% | | 6-month JPY-LIBOR | | 04/16/21 | | JPY | 3,300,000 | | | 521 | | | | 75 | |
Put on 20-Year Interest Rate Swap(3) | | Goldman Sachs International | | Pay | | 0.780% | | 6-month JPY-LIBOR | | 04/16/21 | | JPY | 1,670,000 | | | 500 | | | | 56 | |
Put on 2-Year interest Rate Swap(4) | | JPMorgan Chase Bank N.A. | | Pay | | 2.476% | | 3-month USD-LIBOR | | 01/31/20 | | USD | 7,000,000 | | �� | 33,936 | | | | — | |
Put on 30-Year Interest Rate Swap(4) | | Barclays Bank PLC | | Pay | | 2.850% | | 3-month USD-LIBOR | | 05/09/22 | | USD | 1,170,000 | | | 67,934 | | | | 27,986 | |
Put on 30-Year Interest Rate Swap(4) | | Barclays Bank PLC | | Pay | | 3.800% | | 3-month USD-LIBOR | | 06/07/21 | | USD | 830,000 | | | 32,380 | | | | 1,946 | |
Put on 5-Year interest Rate Swap(4) | | Barclays Bank PLC | | Pay | | 2.520% | | 3-month USD-LIBOR | | 01/31/20 | | USD | 1,350,000 | | | 16,770 | | | | — | |
Put on 5-Year interest Rate Swap(4) | | Citibank N.A. | | Pay | | 2.521% | | 3-month USD-LIBOR | | 02/26/20 | | USD | 2,390,000 | | | 26,290 | | | | 26 | |
| | | | | | | | | | | | | | | $ | 1,216,176 | | | $ | 1,155,016 | |
See Accompanying Notes to Financial Statements
41
VY® BLACKROCK INFLATION
PROTECTED BOND PORTFOLIO | SUMMARY PORTFOLIO OF INVESTMENTS
AS OF DECEMBER 31, 2019 (CONTINUED) |
At December 31, 2019, the following over-the-counter written interest rate swaptions were outstanding for VY® BlackRock Inflation Protected Bond Portfolio:
| Description | | Counterparty | | Pay/
Receive
Exercise
Rate | | Exercise
Rate | | Floating Rate
Index | | Expiration
Date | | Notional Amount | | Premiums
Received | | | Fair
Value |
|---|
Call on 10-Year interest Rate Swap(4) | | Barclays Bank PLC | | Pay | | 2.788% | | 3-month USD-LIBOR | | 03/08/21 | | USD | 1,312,000 | | $ | 39,114 | | | $ | (105,151 | ) |
Call on 10-Year interest Rate Swap(4) | | Barclays Bank PLC | | Pay | | 3.050% | | 3-month USD-LIBOR | | 03/12/29 | | USD | 700,000 | | | 37,135 | | | | (64,305 | ) |
Call on 10-Year Interest Rate Swap(4) | | Barclays Bank PLC | | Pay | | 1.250% | | 3-month USD-LIBOR | | 08/19/20 | | USD | 1,230,000 | | | 21,341 | | | | (3,957 | ) |
Call on 10-Year Interest Rate Swap(4) | | Barclays Bank PLC | | Pay | | 1.605% | | 3-month USD-LIBOR | | 08/13/20 | | USD | 980,000 | | | 24,071 | | | | (7,919 | ) |
Call on 10-Year Interest Rate Swap(4) | | Barclays Bank PLC | | Pay | | 1.612% | | 3-month USD-LIBOR | | 09/14/20 | | USD | 590,000 | | | 14,676 | | | | (5,448 | ) |
Call on 10-Year Interest Rate Swap(4) | | Barclays Bank PLC | | Pay | | 1.624% | | 3-month USD-LIBOR | | 11/02/20 | | USD | 600,000 | | | 14,640 | | | | (6,542 | ) |
Call on 10-Year Interest Rate Swap(4) | | Barclays Bank PLC | | Pay | | 1.637% | | 3-month USD-LIBOR | | 11/02/20 | | USD | 590,000 | | | 14,219 | | | | (6,623 | ) |
Call on 10-Year Interest Rate Swap(4) | | Barclays Bank PLC | | Pay | | 1.763% | | 3-month USD-LIBOR | | 09/16/20 | | USD | 1,180,000 | | | 29,677 | | | | (15,858 | ) |
Call on 10-Year Interest Rate Swap(4) | | Barclays Bank PLC | | Pay | | 2.200% | | 3-month USD-LIBOR | | 06/11/20 | | USD | 1,230,000 | | | 26,829 | | | | (40,090 | ) |
Call on 10-Year Interest Rate Swap(4) | | Citibank N.A. | | Pay | | 1.420% | | 3-month USD-LIBOR | | 08/17/20 | | USD | 980,000 | | | 25,480 | | | | (4,894 | ) |
Call on 10-Year Interest Rate Swap(4) | | JPMorgan Chase Bank N.A. | | Pay | | 1.200% | | 3-month USD-LIBOR | | 08/17/20 | | USD | 1,230,000 | | | 22,878 | | | | (3,425 | ) |
Call on 10-Year Interest Rate Swap(4) | | Morgan Stanley & Co. International PLC | | Pay | | 2.007% | | 3-month USD-LIBOR | | 07/06/20 | | USD | 615,000 | | | 13,422 | | | | (13,053 | ) |
Call on 1-Year Interest Rate Swap(4) | | Barclays Bank PLC | | Pay | | 1.760% | | 3-month USD-LIBOR | | 06/10/20 | | USD | 11,440,000 | | | 32,747 | | | | (18,274 | ) |
Call on 1-Year Interest Rate Swap(4) | | JPMorgan Chase Bank N.A. | | Pay | | 1.325% | | 3-month USD-LIBOR | | 08/05/20 | | USD | 950,000 | | | 2,855 | | | | (439 | ) |
Call on 1-Year Interest Rate Swap(4) | | JPMorgan Chase Bank N.A. | | Pay | | 1.582% | | 3-month USD-LIBOR | | 11/05/20 | | USD | 5,250,000 | | | 12,416 | | | | (8,749 | ) |
Call on 2-Year interest Rate Swap(4) | | Citibank N.A. | | Pay | | 2.460% | | 3-month USD-LIBOR | | 02/26/20 | | USD | 5,780,000 | | | 25,475 | | | | (90,566 | ) |
Call on 2-Year interest Rate Swap(4) | | Deutsche Bank AG | | Pay | | 2.400% | | 3-month USD-LIBOR | | 02/24/20 | | USD | 2,590,000 | | | 6,128 | | | | (37,605 | ) |
Call on 2-Year interest Rate Swap(4) | | Deutsche Bank AG | | Pay | | 2.878% | | 3-month USD-LIBOR | | 04/14/20 | | USD | 260,000 | | | 1,420 | | | | (6,298 | ) |
Call on 2-Year interest Rate Swap(4) | | Deutsche Bank AG | | Pay | | 2.888% | | 3-month USD-LIBOR | | 04/14/20 | | USD | 270,000 | | | 1,496 | | | | (6,593 | ) |
Call on 2-Year interest Rate Swap(4) | | Deutsche Bank AG | | Pay | | 2.938% | | 3-month USD-LIBOR | | 04/17/20 | | USD | 260,000 | | | 1,543 | | | | (6,587 | ) |
Call on 2-Year interest Rate Swap(4) | | JPMorgan Chase Bank N.A. | | Pay | | 2.436% | | 3-month USD-LIBOR | | 02/01/21 | | USD | 3,300,000 | | | 24,629 | | | | (52,663 | ) |
Call on 2-Year Interest Rate Swap(4) | | Barclays Bank PLC | | Pay | | 0.700% | | 3-month USD-LIBOR | | 09/23/20 | | USD | 18,970,000 | | | 20,867 | | | | (6,838 | ) |
Call on 2-Year Interest Rate Swap(4) | | Barclays Bank PLC | | Pay | | 1.000% | | 3-month USD-LIBOR | | 06/01/20 | | USD | 13,980,000 | | | 19,149 | | | | (3,525 | ) |
Call on 2-Year Interest Rate Swap(4) | | Citibank N.A. | | Pay | | 1.530% | | 3-month USD-LIBOR | | 12/14/20 | | USD | 2,815,000 | | | 13,512 | | | | (9,845 | ) |
Call on 2-Year Interest Rate Swap(4) | | Goldman Sachs International | | Pay | | 1.535% | | 3-month USD-LIBOR | | 12/11/20 | | USD | 2,815,000 | | | 13,442 | | | | (9,882 | ) |
Call on 2-Year Interest Rate Swap(4) | | JPMorgan Chase Bank N.A. | | Pay | | 0.750% | | 3-month USD-LIBOR | | 08/10/20 | | USD | 19,270,000 | | | 36,618 | | | | (5,127 | ) |
Call on 30-Year Interest Rate Swap(4) | | Barclays Bank PLC | | Pay | | 1.910% | | 3-month USD-LIBOR | | 11/27/26 | | USD | 190,000 | | | 24,653 | | | | (17,154 | ) |
| Call on 5-Year Interest Rate Swap | | Barclays Bank PLC | | Pay | | -0.035% | | 6-month EUR-EURIBOR | | 09/13/22 | | EUR | 600,000 | | | 9,338 | | | | (5,784 | ) |
| Call on 5-Year Interest Rate Swap | | Barclays Bank PLC | | Pay | | -0.138% | | 6-month EUR-EURIBOR | | 09/12/22 | | EUR | 600,000 | | | 9,029 | | | | (4,599 | ) |
Put on 10-Year interest Rate Swap(1) | | Barclays Bank PLC | | Receive | | 1.624% | | 3-month USD-LIBOR | | 11/02/20 | | USD | 600,000 | | | 14,640 | | | | (23,319 | ) |
Put on 10-Year interest Rate Swap(1) | | Barclays Bank PLC | | Receive | | 1.637% | | 3-month USD-LIBOR | | 11/02/20 | | USD | 590,000 | | | 14,219 | | | | (22,423 | ) |
Put on 10-Year interest Rate Swap(1) | | Barclays Bank PLC | | Receive | | 2.788% | | 3-month USD-LIBOR | | 03/08/21 | | USD | 1,312,000 | | | 39,114 | | | | (6,301 | ) |
Put on 10-Year interest Rate Swap(1) | | Barclays Bank PLC | | Receive | | 3.050% | | 3-month USD-LIBOR | | 03/12/29 | | USD | 700,000 | | | 37,135 | | | | (21,869 | ) |
Put on 10-Year interest Rate Swap(1) | | Barclays Bank PLC | | Receive | | 3.870% | | 3-month USD-LIBOR | | 06/07/21 | | USD | 1,770,000 | | | 34,676 | | | | (1,645 | ) |
See Accompanying Notes to Financial Statements
42
VY® BLACKROCK INFLATION
PROTECTED BOND PORTFOLIO | SUMMARY PORTFOLIO OF INVESTMENTS
AS OF DECEMBER 31, 2019 (CONTINUED) |
| Description | | Counterparty | | Pay/
Receive
Exercise
Rate | | Exercise
Rate | | Floating Rate
Index | | Expiration
Date | | Notional Amount | | Premiums
Received | | | Fair
Value |
|---|
Put on 10-Year Interest Rate Swap(1) | | Barclays Bank PLC | | Receive | | 1.605% | | 3-month USD-LIBOR | | 08/13/20 | | USD | 980,000 | | $ | 24,071 | | | $ | (36,067 | ) |
Put on 10-Year Interest Rate Swap(1) | | Barclays Bank PLC | | Receive | | 1.612% | | 3-month USD-LIBOR | | 09/14/20 | | USD | 590,000 | | | 14,676 | | | | (22,206 | ) |
Put on 10-Year Interest Rate Swap(1) | | Barclays Bank PLC | | Receive | | 1.650% | | 3-month USD-LIBOR | | 08/19/20 | | USD | 1,230,000 | | | 21,341 | | | | (41,778 | ) |
Put on 10-Year Interest Rate Swap(1) | | Barclays Bank PLC | | Receive | | 1.750% | | 3-month USD-LIBOR | | 08/07/20 | | USD | 460,000 | | | 7,671 | | | | (12,469 | ) |
Put on 10-Year Interest Rate Swap(1) | | Barclays Bank PLC | | Receive | | 1.763% | | 3-month USD-LIBOR | | 09/16/20 | | USD | 1,180,000 | | | 29,677 | | | | (33,239 | ) |
Put on 10-Year Interest Rate Swap(1) | | Barclays Bank PLC | | Receive | | 2.000% | | 3-month USD-LIBOR | | 08/03/20 | | USD | 510,000 | | | 7,599 | | | | (7,324 | ) |
Put on 10-Year Interest Rate Swap(1) | | Barclays Bank PLC | | Receive | | 2.200% | | 3-month USD-LIBOR | | 06/11/20 | | USD | 1,230,000 | | | 26,829 | | | | (7,231 | ) |
Put on 10-Year Interest Rate Swap(1) | | Barclays Bank PLC | | Receive | | 2.350% | | 3-month USD-LIBOR | | 07/10/20 | | USD | 670,000 | | | 7,102 | | | | (2,829 | ) |
Put on 10-Year Interest Rate Swap(1) | | Barclays Bank PLC | | Receive | | 2.750% | | 3-month USD-LIBOR | | 05/09/22 | | USD | 2,550,000 | | | 73,975 | | | | (30,472 | ) |
Put on 10-Year Interest Rate Swap(1) | | Barclays Bank PLC | | Receive | | 2.750% | | 3-month USD-LIBOR | | 08/08/22 | | USD | 960,000 | | | 11,568 | | | | (13,027 | ) |
Put on 10-Year Interest Rate Swap(1) | | Barclays Bank PLC | | Receive | | 3.250% | | 3-month USD-LIBOR | | 08/08/22 | | USD | 960,000 | | | 5,712 | | | | (5,924 | ) |
Put on 10-Year Interest Rate Swap(1) | | Citibank N.A. | | Receive | | 1.420% | | 3-month USD-LIBOR | | 08/17/20 | | USD | 980,000 | | | 25,480 | | | | (49,564 | ) |
Put on 10-Year Interest Rate Swap(1) | | Citibank N.A. | | Receive | | 1.950% | | 3-month USD-LIBOR | | 07/13/20 | | USD | 970,000 | | | 10,406 | | | | (14,965 | ) |
Put on 10-Year Interest Rate Swap(1) | | Citibank N.A. | | Receive | | 2.300% | | 3-month USD-LIBOR | | 06/15/20 | | USD | 930,000 | | | 14,155 | | | | (3,930 | ) |
Put on 10-Year Interest Rate Swap(1) | | Goldman Sachs International | | Receive | | 2.300% | | 3-month USD-LIBOR | | 07/27/20 | | USD | 940,000 | | | 11,515 | | | | (5,252 | ) |
Put on 10-Year Interest Rate Swap(1) | | Goldman Sachs International | | Receive | | 2.350% | | 3-month USD-LIBOR | | 07/10/20 | | USD | 670,000 | | | 6,767 | | | | (2,829 | ) |
Put on 10-Year Interest Rate Swap(1) | | JPMorgan Chase Bank N.A. | | Receive | | 1.600% | | 3-month USD-LIBOR | | 08/17/20 | | USD | 1,230,000 | | | 22,878 | | | | (45,852 | ) |
Put on 10-Year Interest Rate Swap(1) | | JPMorgan Chase Bank N.A. | | Receive | | 2.750% | | 3-month USD-LIBOR | | 08/02/22 | | USD | 950,000 | | | 13,015 | | | | (12,792 | ) |
Put on 10-Year Interest Rate Swap(1) | | JPMorgan Chase Bank N.A. | | Receive | | 3.250% | | 3-month USD-LIBOR | | 08/02/22 | | USD | 950,000 | | | 6,222 | | | | (5,798 | ) |
Put on 10-Year Interest Rate Swap(1) | | Morgan Stanley & Co. International PLC | | Receive | | 2.007% | | 3-month USD-LIBOR | | 07/06/20 | | USD | 615,000 | | | 13,422 | | | | (7,835 | ) |
Put on 10-Year Interest Rate Swap(1) | | Morgan Stanley & Co. International PLC | | Receive | | 2.250% | | 3-month USD-LIBOR | | 08/20/24 | | USD | 980,000 | | | 29,054 | | | | (40,636 | ) |
Put on 10-Year Interest Rate Swap(1) | | Morgan Stanley & Co. International PLC | | Receive | | 3.000% | | 3-month USD-LIBOR | | 06/13/24 | | USD | 930,000 | | | 25,539 | | | | (16,980 | ) |
Put on 10-Year Interest Rate Swap(1) | | Morgan Stanley & Co. International PLC | | Receive | | 3.000% | | 3-month USD-LIBOR | | 06/20/24 | | USD | 930,000 | | | 22,714 | | | | (17,056 | ) |
Put on 10-Year Interest Rate Swap(1) | | Morgan Stanley & Co. International PLC | | Receive | | 3.500% | | 3-month USD-LIBOR | | 06/13/24 | | USD | 930,000 | | | 15,565 | | | | (9,454 | ) |
Put on 10-Year Interest Rate Swap(1) | | Morgan Stanley & Co. International PLC | | Receive | | 3.500% | | 3-month USD-LIBOR | | 06/20/24 | | USD | 930,000 | | | 13,630 | | | | (9,509 | ) |
Put on 1-Year Interest Rate Swap(1) | | Barclays Bank PLC | | Receive | | 1.760% | | 3-month USD-LIBOR | | 06/10/20 | | USD | 11,440,000 | | | 32,747 | | | | (6,724 | ) |
Put on 1-Year Interest Rate Swap(1) | | Barclays Bank PLC | | Receive | | 2.150% | | 3-month USD-LIBOR | | 05/28/21 | | USD | 14,860,000 | | | 41,682 | | | | (11,271 | ) |
Put on 1-Year Interest Rate Swap(1) | | Citibank N.A. | | Receive | | 2.350% | | 3-month USD-LIBOR | | 05/17/21 | | USD | 10,930,000 | | | 21,669 | | | | (4,664 | ) |
Put on 1-Year Interest Rate Swap(1) | | Goldman Sachs International | | Receive | | 2.320% | | 3-month USD-LIBOR | | 04/06/20 | | USD | 11,505,000 | | | 24,448 | | | | (2 | ) |
Put on 1-Year Interest Rate Swap(1) | | Goldman Sachs International | | Receive | | 2.350% | | 3-month USD-LIBOR | | 04/06/20 | | USD | 11,505,000 | | | 24,506 | | | | (1 | ) |
Put on 1-Year Interest Rate Swap(1) | | JPMorgan Chase Bank N.A. | | Receive | | 1.325% | | 3-month USD-LIBOR | | 08/05/20 | | USD | 950,000 | | | 2,855 | | | | (3,346 | ) |
Put on 1-Year Interest Rate Swap(1) | | JPMorgan Chase Bank N.A. | | Receive | | 1.582% | | 3-month USD-LIBOR | | 11/05/20 | | USD | 5,250,000 | | | 12,416 | | | | (10,220 | ) |
Put on 1-Year Interest Rate Swap(1) | | Morgan Stanley & Co. International PLC | | Receive | | 2.400% | | 3-month USD-LIBOR | | 06/01/21 | | USD | 18,400,000 | | | 33,304 | | | | (7,410 | ) |
Put on 2-Year interest Rate Swap(5) | | Barclays Bank PLC | | Receive | | 0.000% | | 6-month EUR-EURIBOR | | 06/14/21 | | EUR | 1,040,000 | | | 2,873 | | | | (1,569 | ) |
Put on 2-Year interest Rate Swap(5) | | Barclays Bank PLC | | Receive | | 0.000% | | 6-month EUR-EURIBOR | | 06/14/21 | | EUR | 1,010,000 | | | 2,747 | | | | (1,219 | ) |
See Accompanying Notes to Financial Statements
43
VY® BLACKROCK INFLATION
PROTECTED BOND PORTFOLIO | SUMMARY PORTFOLIO OF INVESTMENTS
AS OF DECEMBER 31, 2019 (CONTINUED) |
| Description | | Counterparty | | Pay/
Receive
Exercise
Rate | | Exercise
Rate | | Floating Rate
Index | | Expiration
Date | | Notional Amount | | Premiums
Received | | | Fair
Value |
|---|
Put on 2-Year interest Rate Swap(5) | | Barclays Bank PLC | | Receive | | 0.000% | | 6-month EUR-EURIBOR | | 06/25/21 | | EUR | 1,140,000 | | $ | 2,605 | | | $ | (1,808 | ) |
Put on 2-Year interest Rate Swap(5) | | Barclays Bank PLC | | Receive | | 0.050% | | 6-month EUR-EURIBOR | | 06/10/21 | | EUR | 2,310,000 | | | 5,817 | | | | (2,752 | ) |
Put on 2-Year interest Rate Swap(5) | | Barclays Bank PLC | | Receive | | 0.100% | | 6-month EUR-EURIBOR | | 03/29/21 | | EUR | 4,470,000 | | | 15,550 | | | | (2,744 | ) |
Put on 2-Year interest Rate Swap(5) | | Barclays Bank PLC | | Receive | | 0.110% | | 6-month EUR-EURIBOR | | 05/17/21 | | EUR | 2,262,400 | | | 7,485 | | | | (1,797 | ) |
Put on 2-Year interest Rate Swap(5) | | Barclays Bank PLC | | Receive | | 0.120% | | 6-month EUR-EURIBOR | | 04/08/21 | | EUR | 6,960,000 | | | 26,460 | | | | (3,196 | ) |
Put on 2-Year interest Rate Swap(5) | | Barclays Bank PLC | | Receive | | 0.200% | | 6-month EUR-EURIBOR | | 01/23/20 | | EUR | 2,210,000 | | | 2,591 | | | | — | |
Put on 2-Year interest Rate Swap(5) | | Barclays Bank PLC | | Receive | | 0.200% | | 6-month EUR-EURIBOR | | 01/31/20 | | EUR | 1,200,000 | | | 1,075 | | | | — | |
Put on 2-Year interest Rate Swap(5) | | Barclays Bank PLC | | Receive | | 0.550% | | 6-month EUR-EURIBOR | | 12/21/20 | | EUR | 1,790,000 | | | 6,492 | | | | (34 | ) |
Put on 2-Year interest Rate Swap(5) | | Citibank N.A. | | Receive | | 0.000% | | 6-month EUR-EURIBOR | | 06/21/21 | | EUR | 1,220,000 | | | 2,973 | | | | (1,522 | ) |
Put on 2-Year interest Rate Swap(5) | | Citibank N.A. | | Receive | | 0.100% | | 6-month EUR-EURIBOR | | 04/12/21 | | EUR | 3,490,000 | | | 11,641 | | | | (2,342 | ) |
Put on 2-Year interest Rate Swap(5) | | Goldman Sachs International | | Receive | | 0.000% | | 6-month EUR-EURIBOR | | 06/18/21 | | EUR | 1,040,000 | | | 2,410 | | | | (1,601 | ) |
Put on 2-Year interest Rate Swap(5) | | Goldman Sachs International | | Receive | | 0.160% | | 6-month EUR-EURIBOR | | 04/12/21 | | EUR | 3,490,000 | | | 11,750 | | | | (1,736 | ) |
Put on 2-Year interest Rate Swap(5) | | JPMorgan Chase Bank N.A. | | Receive | | 0.600% | | 6-month EUR-EURIBOR | | 12/14/20 | | EUR | 3,790,000 | | | 14,342 | | | | (51 | ) |
Put on 2-Year interest Rate Swap(5) | | Morgan Stanley & Co. International PLC | | Receive | | 0.080% | | 6-month EUR-EURIBOR | | 05/31/21 | | EUR | 1,490,000 | | | 4,347 | | | | (1,165 | ) |
Put on 2-Year interest Rate Swap(5) | | Morgan Stanley & Co. International PLC | | Receive | | 0.150% | | 6-month EUR-EURIBOR | | 04/19/21 | | EUR | 3,460,000 | | | 12,434 | | | | (1,899 | ) |
Put on 2-Year interest Rate Swap(1) | | Barclays Bank PLC | | Receive | | 2.000% | | 3-month USD-LIBOR | | 11/27/20 | | USD | 5,720,000 | | | 7,751 | | | | (8,642 | ) |
Put on 2-Year interest Rate Swap(1) | | Citibank N.A. | | Receive | | 1.530% | | 3-month USD-LIBOR | | 12/14/20 | | USD | 2,815,000 | | | 13,512 | | | | (15,688 | ) |
Put on 2-Year interest Rate Swap(1) | | Citibank N.A. | | Receive | | 2.460% | | 3-month USD-LIBOR | | 02/26/20 | | USD | 5,780,000 | | | 25,475 | | | | — | |
Put on 2-Year interest Rate Swap(1) | | Citibank N.A. | | Receive | | 3.250% | | 3-month USD-LIBOR | | 12/29/20 | | USD | 3,130,000 | | | 11,424 | | | | (195 | ) |
Put on 2-Year interest Rate Swap(1) | | Deutsche Bank AG | | Receive | | 2.878% | | 3-month USD-LIBOR | | 04/14/20 | | USD | 6,260,000 | | | 45,307 | | | | (1 | ) |
Put on 2-Year interest Rate Swap(1) | | Deutsche Bank AG | | Receive | | 2.888% | | 3-month USD-LIBOR | | 04/14/20 | | USD | 270,000 | | | 2,205 | | | | — | |
Put on 2-Year interest Rate Swap(1) | | Deutsche Bank AG | | Receive | | 2.900% | | 3-month USD-LIBOR | | 05/29/20 | | USD | 3,410,000 | | | 25,063 | | | | (2 | ) |
Put on 2-Year interest Rate Swap(1) | | Deutsche Bank AG | | Receive | | 2.938% | | 3-month USD-LIBOR | | 04/17/20 | | USD | 260,000 | | | 1,985 | | | | — | |
Put on 2-Year interest Rate Swap(1) | | Deutsche Bank AG | | Receive | | 3.400% | | 3-month USD-LIBOR | | 02/24/20 | | USD | 2,590,000 | | | 9,454 | | | | — | |
Put on 2-Year interest Rate Swap(1) | | Goldman Sachs International | | Receive | | 2.800% | | 3-month USD-LIBOR | | 01/03/20 | | USD | 1,910,000 | | | 4,450 | | | | — | |
Put on 2-Year interest Rate Swap(1) | | Goldman Sachs International | | Receive | | 2.878% | | 3-month USD-LIBOR | | 04/14/20 | | USD | 260,000 | | | 2,150 | | | | — | |
Put on 2-Year interest Rate Swap(1) | | Goldman Sachs International | | Receive | | 2.888% | | 3-month USD-LIBOR | | 04/14/20 | | USD | 6,270,000 | | | 45,301 | | | | — | |
Put on 2-Year interest Rate Swap(1) | | Goldman Sachs International | | Receive | | 3.150% | | 3-month USD-LIBOR | | 05/05/20 | | USD | 2,100,000 | | | 11,602 | | | | — | |
Put on 2-Year interest Rate Swap(1) | | Goldman Sachs International | | Receive | | 3.350% | | 3-month USD-LIBOR | | 05/29/20 | | USD | 2,890,000 | | | 10,512 | | | | — | |
Put on 2-Year interest Rate Swap(1) | | Goldman Sachs International | | Receive | | 3.450% | | 3-month USD-LIBOR | | 06/08/20 | | USD | 2,870,000 | | | 11,882 | | | | — | |
Put on 2-Year interest Rate Swap(1) | | Goldman Sachs International | | Receive | | 3.500% | | 3-month USD-LIBOR | | 06/15/20 | | USD | 1,820,000 | | | 6,779 | | | | — | |
Put on 2-Year interest Rate Swap(1) | | JPMorgan Chase Bank N.A. | | Receive | | 2.436% | | 3-month USD-LIBOR | | 02/01/21 | | USD | 3,300,000 | | | 26,341 | | | | (2,020 | ) |
Put on 2-Year Interest Rate Swap(5) | | Barclays Bank PLC | | Receive | | 0.000% | | 6-month EUR-EURIBOR | | 07/01/21 | | EUR | 1,210,000 | | | 2,499 | | | | (1,967 | ) |
Put on 2-Year Interest Rate Swap(5) | | Barclays Bank PLC | | Receive | | 0.000% | | 6-month EUR-EURIBOR | | 07/19/21 | | EUR | 1,240,000 | | | 2,269 | | | | (2,163 | ) |
Put on 2-Year Interest Rate Swap(5) | | Barclays Bank PLC | | Receive | | -0.050% | | 6-month EUR-EURIBOR | | 07/02/21 | | EUR | 1,180,000 | | | 2,489 | | | | (2,375 | ) |
See Accompanying Notes to Financial Statements
44
VY® BLACKROCK INFLATION
PROTECTED BOND PORTFOLIO | SUMMARY PORTFOLIO OF INVESTMENTS
AS OF DECEMBER 31, 2019 (CONTINUED) |
| Description | | Counterparty | | Pay/
Receive
Exercise
Rate | | Exercise
Rate | | Floating Rate
Index | | Expiration
Date | | Notional Amount | | Premiums
Received | | | Fair
Value |
|---|
Put on 2-Year Interest Rate Swap(5) | | Barclays Bank PLC | | Receive | | –0.150% | | 6-month EUR-EURIBOR | | 08/09/21 | | EUR | 1,570,000 | | $ | 2,128 | | | $ | (5,192 | ) |
Put on 2-Year Interest Rate Swap(5) | | Barclays Bank PLC | | Receive | | –0.150% | | 6-month EUR-EURIBOR | | 08/09/21 | | EUR | 2,780,000 | | | 3,847 | | | | (9,193 | ) |
Put on 2-Year Interest Rate Swap(5) | | Barclays Bank PLC | | Receive | | –0.250% | | 6-month EUR-EURIBOR | | 09/03/21 | | EUR | 5,030,000 | | | 8,276 | | | | (20,919 | ) |
Put on 2-Year Interest Rate Swap(1) | | Barclays Bank PLC | | Receive | | 3.500% | | 3-month USD-LIBOR | | 08/24/20 | | USD | 3,560,000 | | | 12,015 | | | | (4 | ) |
Put on 2-Year Interest Rate Swap(1) | | Goldman Sachs International | | Receive | | 1.535% | | 3-month USD-LIBOR | | 12/11/20 | | USD | 2,815,000 | | | 13,442 | | | | (15,449 | ) |
Put on 30-Year Interest Rate Swap(1) | | Barclays Bank PLC | | Receive | | 1.910% | | 3-month USD-LIBOR | | 11/27/26 | | USD | 190,000 | | | 24,653 | | | | (26,899 | ) |
Put on 30-Year Interest Rate Swap(1) | | Barclays Bank PLC | | Receive | | 2.850% | | 3-month USD-LIBOR | | 06/11/20 | | USD | 930,000 | | | 12,490 | | | | (1,997 | ) |
Put on 5-Year Interest Rate Swap(5) | | Barclays Bank PLC | | Receive | | 0.000% | | 6-month EUR-EURIBOR | | 07/27/20 | | EUR | 1,740,000 | | | 4,896 | | | | (5,590 | ) |
Put on 5-Year Interest Rate Swap(5) | | Barclays Bank PLC | | Receive | | -0.035% | | 6-month EUR-EURIBOR | | 09/13/22 | | EUR | 600,000 | | | 9,338 | | | | (12,946 | ) |
Put on 5-Year Interest Rate Swap(5) | | Barclays Bank PLC | | Receive | | -0.138% | | 6-month EUR-EURIBOR | | 09/12/22 | | EUR | 600,000 | | | 9,029 | | | | (15,154 | ) |
| | | | | | | | | | | | | | | $ | 1,834,949 | | | $ | (1,313,837 | ) |
At December 31, 2019, the following over-the-counter purchased interest rate floors were outstanding for VY® BlackRock Inflation Protected Bond Portfolio:
| Description | | Counterparty | | Exercise Rate | | Pay/Receive
Exercise
Rate | | Expiration
Date | | Notional
Amount | | Cost | | | Fair Value |
|---|
| Put Option-Max [0, Exercise Rate)- 5-Year Constant Maturity Swap] | | Goldman Sachs International | | 0.350% | | Receive | | 07/08/20 | | USD | 4,670,000 | | $ | 3,853 | | | $ | 2,951 | |
| Put Option-Max [0, Exercise Rate)- 5-Year Constant Maturity Swap] | | Goldman Sachs International | | 0.400% | | Receive | | 06/29/20 | | USD | 4,630,000 | | | 3,704 | | | | 4,001 | |
| | | | | | | | | | | | | $ | 7,557 | | | $ | 6,952 | |
At December 31, 2019, the following over-the-counter purchased interest rate caps were outstanding for VY® BlackRock Inflation Protected Bond Portfolio:
| Description | | Counterparty | | Exercise Rate | | Pay/Receive
Exercise
Rate | | Expiration
Date | | Notional
Amount | | Cost | | | Fair Value |
|---|
| Call Option-Max [0, 5-Year Constant Maturity Swap)-Exercise Rate] | | Morgan Stanley & Co. International PLC | | 0.370% | | Pay | | 02/12/20 | | USD | 4,410,000 | | $ | 3,219 | | | $ | 1,376 | |
| | | | | | | | | | | | | | $ | 3,219 | | | $ | 1,376 | |
At December 31, 2019, the following over-the-counter written interest rate caps were outstanding for VY® BlackRock Inflation Protected Bond Portfolio:
| Description | | Counterparty | | Exercise Rate | | Pay/Receive
Exercise
Rate | | Expiration
Date | | Notional
Amount | | Premiums
Received | | | Fair Value |
|---|
| Call Option-Max [0, 5-Year Constant Maturity Swap)-Exercise Rate] | | Morgan Stanley & Co. International PLC | | 0.470% | | Pay | | 02/12/20 | | USD | 4,410,000 | | $ | 1,590 | | | $ | (212 | ) |
| | | | | | | | | | | | | | $ | 1,590 | | | $ | (212 | ) |
See Accompanying Notes to Financial Statements
45
| VY® BLACKROCK INFLATION | SUMMARY PORTFOLIO OF INVESTMENTS |
| PROTECTED BOND PORTFOLIO | AS OF DECEMBER 31, 2019 (CONTINUED) |
At December 31, 2019, the following over-the-counter written interest rate floors were outstanding for VY® BlackRock Inflation Protected Bond Portfolio:
| Description | | Counterparty | | Exercise Rate | | Pay/Receive
Exercise
Rate | | Expiration
Date | | Notional
Amount | | Premiums
Received | | | Fair Value | |
|---|
| Put Option-Max [0, Exercise Rate)- 5-Year Constant Maturity Swap] | | Goldman Sachs International | | 0.250% | | Receive | | 07/08/20 | | USD 9,330,000 | | $ | 4,665 | | | $ | (2,715 | ) |
| Put Option-Max [0, Exercise Rate)- 5-Year Constant Maturity Swap] | | Goldman Sachs International | | 0.300% | | Receive | | 06/29/20 | | USD 9,260,000 | | | 4,630 | | | | (3,940 | ) |
| | | | | | | | | | | | | $ | 9,295 | | | $ | (6,655 | ) |
(1) | | Portfolio receives the exercise rate semi-annually and pays the floating rate index quarterly. |
(2) | | Portfolio receives the exercise rate semi-annually and pays the floating rate index semi-annually. |
(3) | | Portfolio pays the exercise rate semi-annually and receives the floating rate index semi-annually. |
(4) | | Portfolio pays the exercise rate semi-annually and receives the floating rate index quarterly. |
(5) | | Portfolio receives the exercise rate annually and pays the floating rate index semi-annually. |
Currency Abbreviations
AUD — Australian Dollar
CAD — Canadian Dollar
EUR — EU Euro
GBP — British Pound
JPY — Japanese Yen
NZD — New Zealand Dollar
USD — United States Dollar
A summary of derivative instruments by primary risk exposure is outlined in the following tables.
The fair value of derivative instruments as of December 31, 2019 was as follows:
Derivatives not accounted for as
hedging instruments
| | | Location on Statement
of Assets and Liabilities | | Fair Value | |
|---|
Asset Derivatives | | | | | | | | | |
| Foreign exchange contracts | | | Investments in securities at value* | | $ | 31,078 | |
| Interest rate contracts | | | Investments in securities at value* | | | 1,293,387 | |
| Foreign exchange contracts | | | Unrealized appreciation on forward foreign currency contracts | | | 61,470 | |
| Interest rate contracts | | | Net Assets — Unrealized appreciation** | | | 223,642 | |
| Interest rate contracts | | | Net Assets — Unrealized appreciation*** | | | 1,414,166 | |
| Interest rate contracts | | | Unrealized appreciation on OTC swap agreements | | | 1,366,271 | |
Total Asset Derivatives | | | | | $ | 4,390,014 | |
Liability Derivatives | | | | | | | |
| Foreign exchange contracts | | | Unrealized depreciation on forward foreign currency contracts | | $ | 318,897 | |
| Interest rate contracts | | | Net Assets — Unrealized depreciation** | | | 384,644 | |
| Interest rate contracts | | | Net Assets — Unrealized depreciation*** | | | 2,373,007 | |
| Foreign exchange contracts | | | Written options, at fair value | | | 31,078 | |
| Interest rate contracts | | | Written options, at fair value | | | 1,413,073 | |
Total Liability Derivatives | | | | | $ | 4,520,699 | |
| * | | Includes purchased options. |
| ** | | Includes cumulative appreciation/depreciation of futures contracts as reported in the table within the Portfolio of Investments. |
| *** | | Includes cumulative appreciation/depreciation of centrally cleared swaps as reported in the table within the Portfolio of Investments. Only current day’s variation margin receivable/payable is shown on the Statement of Assets and Liabiliites. |
See Accompanying Notes to Financial Statements
46
| VY® BLACKROCK INFLATION | SUMMARY PORTFOLIO OF INVESTMENTS |
| PROTECTED BOND PORTFOLIO | AS OF DECEMBER 31, 2019 (CONTINUED) |
The effect of derivative instruments on the Portfolio’s Statement of Operations for the year ended December 31, 2019 was as follows:
| | Amount of Realized Gain or (Loss) on Derivatives Recognized in Income | |
|---|
Derivatives not accounted for as
hedging instruments | | Investments* | | | Forward foreign
currency contracts | | | Futures | | | Swaps | | Written
options | | | Total | |
|---|
| Foreign exchange contracts | | $ | (16,487 | ) | | $ | 1,085,534 | | | $ | — | | | $ | — | | $ | — | | $ | 1,069,047 | |
| Interest rate contracts | | | 51,972 | | | | — | | | | (709,522 | ) | | | (1,652,067 | ) | | (3,731 | ) | | (2,313,348 | ) |
Total | | $ | 35,485 | | | $ | 1,085,534 | | | $ | (709,522 | ) | | $ | (1,652,067 | ) | $ | (3,731 | ) | $ | (1,244,301 | ) |
| | Change in Unrealized Appreciation or (Depreciation) on Derivatives Recognized in Income | |
|---|
Derivatives not accounted for
as hedging instruments | | Investments* | | | Forward foreign
currency contracts | | | Futures | | | Swaps | | Written
options | | Total | |
|---|
| Foreign exchange contracts | | $ | (16,346 | ) | | $ | (259,851 | ) | | $ | — | | | $ | — | | $ | (3,699 | ) | $ | (279,896 | ) |
| Interest rate contracts | | | (117,826 | ) | | | — | | | | (452,826 | ) | | | 788,552 | | | 526,221 | | | 744,121 | |
Total | | $ | (134,172 | ) | | $ | (259,851 | ) | | $ | (452,826 | ) | | $ | 788,552 | | $ | 522,522 | | $ | 464,225 | |
| * | | Amounts recognized for purchased options are included in net realized gain (loss) on investments and net change in unrealized appreciation or depreciation on investments. |
The following is a summary by counterparty of the fair value of OTC derivative instruments subject to Master Netting Agreements and collateral pledged (received), if any, at December 31, 2019:
| | Bank of
America
N.A. | | | Barclays
Bank
PLC | | | Citibank
N.A. | | | Deutsche
Bank AG | | | Goldman
Sachs
International | | | JPMorgan
Chase
Bank N.A. | | | Morgan Stanley
& Co.
International PLC | | | NatWest
Markets | | | The Bank of
Montreal | | UBS
AG | | Westpac
Banking
Corp. | | Totals | |
|---|
Assets: | | | | | | | | | | | | | | | | | | | | | | | | | | | | | | | | | | | | | | | | | | | | | |
| Purchased options | | $ | — | | | $ | 454,923 | | | $ | 271,518 | | | $ | — | | | $ | 8,318 | | | $ | 372,698 | | | $ | 86,965 | | | $ | — | | | $ | — | | $ | — | | $ | — | | $ | 1,194,422 | |
| Forward foreign currency contracts | | | 267 | | | | — | | | | — | | | | 8,372 | | | | — | | | | 112 | | | | 46,502 | | | | 6,024 | | | | 193 | | | — | | | — | | | 61,470 | |
| OTC Inflation-linked swaps | | | — | | | | 588,091 | | | | 778,180 | | | | — | | | | — | | | | — | | | | — | | | | — | | | | — | | | — | | | — | | | 1,366,271 | |
Total Assets | | $ | 267 | | | $ | 1,043,014 | | | $ | 1,049,698 | | | $ | 8,372 | | | $ | 8,318 | | | $ | 372,810 | | | $ | 133,467 | | | $ | 6,024 | | | $ | 193 | | $ | — | | $ | — | | $ | 2,622,163 | |
Liabilities: | | | | | | | | | | | | | | | | | | | | | | | | | | | | | | | | | | | | | | | | | | |
| Forward foreign currency contracts | | $ | 5,920 | | | $ | 43,315 | | | $ | 10,763 | | | $ | 6,254 | | | $ | — | | | $ | 39 | | | $ | 1,403 | | | $ | 133,366 | | | $ | — | | $ | 1,388 | | $ | 116,449 | | | 318,897 | |
| Written options | | | — | | | | 746,345 | | | | 198,175 | | | | 88,164 | | | | 43,407 | | | | 150,482 | | | | 125,209 | | | | — | | | | — | | | — | | | — | | | 1,351,782 | |
Total Liabilities | | $ | 5,920 | | | $ | 789,660 | | | $ | 208,938 | | | $ | 94,418 | | | $ | 43,407 | | | $ | 150,521 | | | $ | 126,612 | | | $ | 133,366 | | | $ | — | | $ | 1,388 | | $ | 116,449 | | $ | 1,670,679 | |
Net OTC derivative instruments by counterparty, at fair value | | $ | (5,653 | ) | | $ | 253,354 | | | $ | 840,760 | | | $ | (86,046 | ) | | $ | (35,089 | ) | | $ | 222,289 | | | $ | 6,855 | | | $ | (127,342 | ) | | $ | 193 | | $ | (1,388 | ) | $ | (116,449 | ) | | 951,484 | |
Total collateral pledged by the Portfolio/(Received from counterparty) | | $ | — | | | $ | (253,354 | ) | | $ | (820,000 | ) | | $ | 80,000 | | | $ | 35,089 | | | $ | (222,289 | ) | | $ | — | | | $ | — | | | $ | — | | $ | — | | $ | — | | $ | (1,180,554 | ) |
Net Exposure(1)(2) | | $ | (5,653 | ) | | $ | — | | | $ | 20,760 | | | $ | (6,046 | ) | | $ | — | | | $ | — | | | $ | 6,855 | | | $ | (127,342 | ) | | $ | 193 | | $ | (1,388 | ) | $ | (116,449 | ) | $ | (229,070 | ) |
(1) | | Positive net exposure represents amounts due from each respective counterparty. Negative exposure represents amounts due from the Portfolio. Please refer to Note 2 for additional details regarding counterparty credit risk and credit related contingent features. |
(2) | | At December 31, 2019, the Portfolio had pledged $40,000 and $40,000, respectively, in cash collateral to Goldman Sachs International and Morgan Stanley & Co. International PLC, respectively. In addition, the Portfolio had received $300,000 and $230,000 in cash collateral from Barclays Bank PLC and JPMorgan Chase Bank N.A., respectively. Excess cash collateral is not shown for financial reporting purposes. |
At December 31, 2019, the aggregate cost of securities and other investments and the composition of unrealized appreciation and depreciation of securities and other investments at year end were:
| Cost for federal income tax purposes was $262,528,332. | | | | | | |
| Net unrealized appreciation consisted of: | | | | | | |
| Gross Unrealized Appreciation | | | | $ | 13,286,783 | |
| Gross Unrealized Depreciation | | | | | (4,243,270 | ) |
| Net Unrealized Appreciation | | | | $ | 9,043,513 | |
See Accompanying Notes to Financial Statements
47
| VY® BRANDYWINEGLOBAL — | PORTFOLIO OF INVESTMENTS |
| BOND PORTFOLIO | AS OF DECEMBER 31, 2019 |
Principal
Amount† | | | | | | | | | Value | | | Percentage
of Net
Assets |
|---|
| | | | | | | | | | | | | | | |
CORPORATE BONDS/NOTES: 32.8% |
| |
| 1,940,000 | | | | | | Steel Dynamics, Inc., 3.450%, 04/15/2030 | | $ | 1,964,235 | | | | 1.1 | |
| | | | | | | | | | | | | | | |
| |
| 3,740,000 | | | | (1) | | NBCUniversal Enterprise, Inc., 2.309%, (US0003M + 0.400%), 04/01/2021 | | | 3,750,249 | | | | 2.1 | |
| | | | | | | | | | | | | | | |
| Consumer, Non-cyclical: 6.4% |
| 6,715,000 | | | | | | Anheuser-Busch InBev Worldwide, Inc., 5.450%, 01/23/2039 | | | 8,444,775 | | | | 4.6 | |
| 2,510,000 | | | | (1) | | Bristol-Myers Squibb Co., 3.400%, 07/26/2029 | | | 2,684,558 | | | | 1.4 | |
| 460,000 | | | | (1) | | Bristol-Myers Squibb Co., 3.875%, 08/15/2025 | | | 497,629 | | | | 0.3 | |
| 150,000 | | | | (1) | | Bristol-Myers Squibb Co., 3.900%, 02/20/2028 | | | 165,312 | | | | 0.1 | |
| | | | | | | | | | 11,792,274 | | | | 6.4 | |
| | | | | | | | | | | | | | | |
| |
| 510,000 | | | | | | Petroleos Mexicanos, 6.750%, 09/21/2047 | | | 512,711 | | | | 0.3 | |
| 2,835,000 | | | | (1) | | Petroleos Mexicanos, 7.690%, 01/23/2050 | | | 3,103,687 | | | | 1.7 | |
| 4,610,000 | | | | (1) | | Saudi Arabian Oil Co., 4.375%, 04/16/2049 | | | 5,033,478 | | | | 2.7 | |
| | | | | | | | | | 8,649,876 | | | | 4.7 | |
| | | | | | | | | | | | | | | |
| |
| 2,890,000 | | | | | | Canadian Imperial Bank of Commerce, 2.341%, (SOFRRATE + 0.800%), 03/17/2023 | | | 2,900,777 | | | | 1.6 | |
| 4,815,000 | | | | | | Wells Fargo & Co., 2.961%, (US0003M + 1.025%), 07/26/2021 | | | 4,872,275 | | | | 2.6 | |
| | | | | | | | | | 7,773,052 | | | | 4.2 | |
| | | | | | | | | | | | | | | |
| |
| 5,295,000 | | | | (1) | | Dell International LLC / EMC Corp., 5.300%, 10/01/2029 | | | 5,967,500 | | | | 3.3 | |
| 7,390,000 | | | | | | Hewlett Packard Enterprise Co., 6.350%, 10/15/2045 | | | 8,889,060 | | | | 4.9 | |
| 4,365,000 | | | | | | International Business Machines Corp., 4.250%, 05/15/2049 | | | 4,988,539 | | | | 2.7 | |
| 5,430,000 | | | | | | Micron Technology, Inc., 5.327%, 02/06/2029 | | | 6,230,056 | | | | 3.4 | |
| | | | | | | | | | 26,075,155 | | | | 14.3 | |
| | | | | | | Total Corporate Bonds/Notes
(Cost $59,048,013) | | | 60,004,841 | | | | 32.8 | |
| | | | | | | | | | | | | | | |
MUNICIPAL BONDS: 0.0% |
| | | | | | Minnesota: 0.0% |
| 63,472 | | | | | | Northstar Education Finance, Inc., 2.036%, (US0003M + 0.100%), 04/28/2030 | | | 63,348 | | | | 0.0 |
|
| | | | | | | Total Municipal Bonds
(Cost $62,517) | | | 63,348 | | | | 0.0 | |
| | | | | | | | | | | | | | | |
Principal
Amount† | | | | | | | | | Value | | | Percentage
of Net
Assets |
|---|
| | | | | | | | | | | | | | | |
U.S. TREASURY OBLIGATIONS: 48.9% |
| U.S. Treasury Bonds: 3.9% |
| 6,410,000 | | | | | | 2.875%, 05/15/2049 | | $ | 7,059,312 | | | | 3.9 | |
| | | | | | | | | | | | | | | |
| U.S. Treasury Floating Rate Notes: 45.0% |
| 24,700,000 | | | | | | 1.665%, (USBMMY3M + 0.139%), 04/30/2021 | | | 24,689,723 | | | | 13.5 | |
| 50,700,000 | | | | | | 1.746%, (USBMMY3M + 0.220%), 07/31/2021 | | | 50,729,686 | | | | 27.7 | |
| 6,830,000 | | | | | | 1.826%, (USBMMY3M + 0.300%), 10/31/2021 | | | 6,842,721 | | | | 3.8 | |
| | | | | | | | | | 82,262,130 | | | | 45.0 | |
| | | | | | | Total U.S. Treasury Obligations
(Cost $89,806,201) | | | 89,321,442 | | | | 48.9 | |
| | | | | | | | | | | | | | | |
U.S. GOVERNMENT AGENCY OBLIGATIONS: 16.9% |
| Federal Home Loan Bank: 5.4% |
| 9,800,000 | | | | | | 1.875%,07/07/2021 | | | 9,841,144 | | | | 5.4 | |
| | | | | | | | | | | | | | | |
| Federal National Mortgage Association: 11.5%(2) |
| 21,000,000 | | | | | | 1.500%,07/30/2020 | | | 20,981,627 | | | | 11.5 | |
| | | | | | | Total U.S. Government Agency Obligations
(Cost $30,794,188) | | | 30,822,771 | | | | 16.9 | |
| | | | | | | Total Long-Term Investments
(Cost $179,710,919) | | | 180,212,402 | | | | 98.6 | |
| | | | | | | | | | | | | | | |
SHORT-TERM INVESTMENTS: 1.1% |
| |
| 1,300,000 | | | | | | VW Credit, Inc., 2.200%, 03/30/2020
(Cost $1,291,694) | | | 1,293,012 | | | | 0.7 | |
| | | | | | | | | | | | | | | |
|---|
| Shares | | | | | | | | | Value | | | | Percentage
of Net
Assets | |
|---|
| |
| 757,551 | | | | (3) | | BlackRock Liquidity Funds, FedFund, Institutional Class, 1.520%
(Cost $757,551) | | | 757,551 | | | | 0.4 | |
| | | | | | | Total Short-Term Investments
(Cost $2,049,245) | | | 2,050,563 | | | | 1.1 | |
| | | | | | | Total Investments in Securities
(Cost $181,760,164) | | $ | 182,262,965 | | | | 99.7 | |
| | | | | | | Assets in Excess of Other Liabilities | | | 629,044 | | | | 0.3 | |
| | | | | | | Net Assets | | $ | 182,892,009 | | | | 100.0 | |
| † | | Unless otherwise indicated, principal amount is shown in USD. |
| (1) | | Securities with purchases pursuant to Rule 144A or section 4(a)(2), under the Securities Act of 1933 and may not be resold subject to that rule except to qualified institutional buyers. |
| (2) | | The Federal Housing Finance Agency (“FHFA”) placed the Federal Home Loan Mortgage Corporation and Federal National Mortgage Association into conservatorship with FHFA as the conservator. As such, the FHFA oversees the continuing affairs of these companies. |
| (3) | | Rate shown is the 7-day yield as of December 31, 2019. |
See Accompanying Notes to Financial Statements
48
| VY® BRANDYWINEGLOBAL — | PORTFOLIO OF INVESTMENTS |
| BOND PORTFOLIO | AS OF DECEMBER 31, 2019 (CONTINUED) |
Reference Rate Abbreviations:
| SOFRRATE | Secured Overnight Financing Rate |
| USBMMY3M | U.S. Treasury 3-month Bill Money Market Yield |
Fair Value Measurementsˆ
The following is a summary of the fair valuations according to the inputs used as of December 31, 2019 in valuing the assets and liabilities:
| | | Quoted Prices
in Active Markets
for Identical
Investments
(Level 1) | | Significant
Other
Observable
Inputs
(Level 2) | | Significant
Unobservable
Inputs
(Level 3) | | Fair Value
at
December 31, 2019 |
|---|
Asset Table | | | | | | | | | | | | | | | | | | | | | |
Investments, at fair value | | | | | | | | | | | | | | | | | | | | | |
| Corporate Bonds/Notes | | | | $ | — | | | | $ | 60,004,841 | | | | $ | — | | | | $ | 60,004,841 | |
| Municipal Bonds | | | | | — | | | | | 63,348 | | | | | — | | | | | 63,348 | |
| U.S. Government Agency Obligations | | | | | — | | | | | 30,822,771 | | | | | — | | | | | 30,822,771 | |
| U.S. Treasury Obligations | | | | | — | | | | | 89,321,442 | | | | | — | | | | | 89,321,442 | |
| Short-Term Investments | | | | | 757,551 | | | | | 1,293,012 | | | | | — | | | | | 2,050,563 | |
| Total Investments, at fair value | | | | $ | 757,551 | | | | $ | 181,505,414 | | | | $ | — | | | | $ | 182,262,965 | |
| ˆ | | See Note 2, “Significant Accounting Policies” in the Notes to Financial Statements for additional information. |
The effect of derivative instruments on the Portfolio’s Statement of Operations for the year ended December 31, 2019 was as follows:
| | | Amount of Realized Gain or (Loss) on Derivatives Recognized in Income | �� |
|---|
Derivatives not accounted for as
hedging instruments | | | Forward
foreign currency
contracts | | Futures | | | Swaps | | | Total | |
|---|
| Credit contracts | | | | $ | — | | | $ | — | | | $ | (150,634 | ) | | $ | (150,634 | ) |
| Foreign exchange contracts | | | | | 302,357 | | | | — | | | | — | | | | 302,357 | |
| Interest rate contracts | | | | | — | | | | 2,916,088 | | | | 826,472 | | | | 3,742,560 | |
Total | | | | $ | 302,357 | | | $ | 2,916,088 | | | $ | 675,838 | | | $ | 3,894,283 | |
| | | Change in Unrealized Appreciation or (Depreciation)
on Derivatives Recognized in Income | |
|---|
Derivatives not accounted for
as hedging instruments | | | Forward
foreign currency
contracts | | Futures | | | Swaps | | | Total | |
|---|
| Credit contracts | | | | $ | — | | | $ | — | | | $ | 215,702 | | | $ | 215,702 | |
|---|
| Foreign exchange contracts | | | | | 80,065 | | | | — | | | | — | | | | 80,065 | |
| Interest rate contracts | | | | | — | | | | (587,337 | ) | | | (318,589 | ) | | | (905,926 | ) |
Total | | | | $ | 80,065 | | | $ | (587,337 | ) | | $ | (102,887 | ) | | $ | (610,159 | ) |
At December 31, 2019, the aggregate cost of securities and other investments and the composition of unrealized appreciation and depreciation of securities and other investments at year end were:
| Cost for federal income tax purposes was $181,782,413. | | | | | | |
| Net unrealized appreciation consisted of: | | | | | | |
| Gross Unrealized Appreciation | | | | $ | 1,342,341 | |
| Gross Unrealized Depreciation | | | | | (861,789 | ) |
| Net Unrealized Appreciation | | | | $ | 480,552 | |
See Accompanying Notes to Financial Statements
49
TAX INFORMATION (UNAUDITED) Dividends paid during the year ended December 31, 2019 were as follows:
| Portfolio Name | | | | Type | | Per Share Amount |
|---|
| VY® BlackRock Inflation Protected Bond Portfolio | | | | | | | | | | |
| Class ADV | | | | NII | | | $0.1768 | |
| Class I | | | | NII | | | $0.2326 | |
| Class S | | | | NII | | | $0.2085 | |
| VY® BrandywineGLOBAL — Bond Portfolio | | | | NII | | | $0.1984 | |
NII — Net investment income
Above figures may differ from those cited elsewhere in this report due to differences in the calculation of income and gains under U.S. generally accepted accounting principles (book) purposes and Internal Revenue Service (tax) purposes.
Shareholders are strongly advised to consult their own tax advisers with respect to the tax consequences of their investments in the Portfolios. In January, shareholders, excluding corporate shareholders, receive an IRS 1099-DIV regarding the federal tax status of the dividends and distributions they received in the calendar year.
50
TRUSTEE AND OFFICER INFORMATION (UNAUDITED) The business and affairs of each Trust are managed under the direction of the Board. A Trustee, who is not an interested person of a Trust, as defined in the 1940 Act, is an independent trustee (“Independent Trustee”). The Trustees and Officers of each Trust are listed below. The Statement of Additional Information includes additional information about trustees of the Trust and is available, without charge, upon request at (800) 992-0180 for Voya Variable Insurance Trust (“VVIT”) and (800) 366-0066 for Voya Investors Trust (“VIT”).
| Name, Address and Age | | Position(s)
Held with
the Trust | | Term of Office
and Length of
Time Served(1) | | Principal
Occupation(s) —
During the Past 5 Years | | Number of
funds in
Fund
Complex
Overseen
by
Trustee(2) | | Other Board
Positions
Held by
Trustee |
|---|
| | | | | | | | | | | |
|---|
Independent Trustees*: | | | | | |
| | | | | | | | | | | |
Colleen D. Baldwin
7337 East Doubletree Ranch Rd.
Suite 100
Scottsdale, Arizona 85258
Age: 59 | | Trustee
Chairperson | | November 2007–Present
January 2020–Present | | President, Glantuam Partners, LLC, a business consulting firm (January 2009–Present). | | 146 | | Dentaquest (February 2014–Present); RSR Partners, Inc. (2016–Present). |
| | | | | | | | | | | |
John V. Boyer
7337 East Doubletree Ranch Rd.
Suite 100
Scottsdale, Arizona 85258
Age: 66 | | Trustee | | January 2005–Present | | Retired. Formerly, President and Chief Executive Officer, Bechtler Arts Foundation, an arts and education foundation (January 2008–December 2019). | | 146 | | None. |
| | | | | | | | | | | |
Patricia W. Chadwick
7337 East Doubletree Ranch Rd.
Suite 100
Scottsdale, Arizona 85258
Age: 71 | | Trustee | | January 2006–Present | | Consultant and President, Ravengate Partners LLC, a consulting firm that provides advice regarding financial markets and the global economy (January 2000–Present). | | 146 | | Wisconsin Energy Corporation (June 2006–Present); The Royce Fund (22 funds) (December 2009–Present); and AMICA Mutual Insurance Company (1992–Present). |
| | | | | | | | | | | |
Martin J. Gavin
7337 East Doubletree Ranch Rd.
Suite 100
Scottsdale, AZ 85258
Age: 69 | | Trustee | | August 2015–Present | | Retired. Formerly, President and Chief Executive Officer, Connecticut Children’s Medical Center (May 2006–November 2015). | | 146 | | None. |
| | | | | | | | | | | |
Joseph E. Obermeyer
7337 East Doubletree Ranch Rd.
Suite 100
Scottsdale, Arizona 85258
Age: 62 | | Trustee | | May 2013–Present | | President, Obermeyer & Associates, Inc., a provider of financial and economic consulting services (November 1999–Present). | | 146 | | None. |
| | | | | | | | | | | |
Sheryl K. Pressler
7337 East Doubletree Ranch Rd.
Suite 100
Scottsdale, Arizona 85258
Age: 69 | | Trustee | | January 2006–Present | | Consultant (May 2001–Present). | | 146 | | None. |
| | | | | | | | | | | |
Christopher P. Sullivan
7337 East Doubletree Ranch Rd.
Suite 100
Scottsdale, Arizona 85258
Age: 66 | | Trustee | | October 2015–Present | | Retired. | | 146 | | None. |
51
TRUSTEE AND OFFICER INFORMATION (UNAUDITED) (CONTINUED)
| Name, Address and Age | | Position(s)
Held with
the Trust | | Term of Office
and Length of
Time Served(1) | | Principal
Occupation(s) —
During the Past 5 Years | | Number of
funds in
Fund
Complex
Overseen
by
Trustee(2) | | Other Board
Positions
Held by
Trustee |
|---|
| | | | | | | | | | | |
|---|
Trustee who is an “interested person”: | | | | | |
| | | | | | | | | | | |
Dina Santoro
230 Park Avenue
New York, New York 10169
Age: 46 | | Trustee | | July 2018–Present | | President, Voya Investments, LLC and Voya Capital, LLC (March 2018–Present); Senior Vice President, Voya Investments Distributor, LLC (April 2018–Present); Senior Managing Director, Head of Product and Marketing Strategy, Voya Investment Management (September 2017–Present). Formerly, Managing Director, Quantitative Management Associates, LLC (January 2004–August 2017). | | 146 | | Voya Investments, LLC, Voya Capital, LLC, and Voya Funds Services, LLC (March 2018–Present); Voya Investments Distributor, LLC (April 2018–Present). |
(1) | | Trustees serve until their successors are duly elected and qualified. The tenure of each Trustee who is not an “interested person” as defined in the 1940 Act, of each Portfolio (“Independent Trustee”) is subject to the Board’s retirement policy which states that each duly elected or appointed Independent Trustee shall retire from and cease to be a member of the Board of Trustees at the close of business on December 31 of the calendar year in which the Independent Trustee attains the age of 75. A majority vote of the Board’s other Independent Trustees may extend the retirement date of an Independent Trustee if the retirement would trigger a requirement to hold a meeting of shareholders of the Trust under applicable law, whether for the purposes of appointing a successor to the Independent Trustee or otherwise comply under applicable law, in which case the extension would apply until such time as the shareholder meeting can be held or is no longer required (as determined by a vote of a majority of the other Independent Trustees). |
(2) | | For the purposes of this table, “Fund Complex” means the Voya family of funds including the following investment companies: Voya Asia Pacific High Dividend Equity Income Fund; Voya Balanced Portfolio, Inc.; Voya Emerging Markets High Dividend Equity Fund; Voya Equity Trust; Voya Funds Trust; Voya Global Advantage and Premium Opportunity Fund; Voya Global Equity Dividend and Premium Opportunity Fund; Voya Government Money Market Portfolio; Voya Infrastructure, Industrials and Materials Fund; Voya Intermediate Bond Portfolio; Voya International High Dividend Equity Income Fund; Voya Investors Trust; Voya Mutual Funds; Voya Natural Resources Equity Income Fund; Voya Partners, Inc.; Voya Prime Rate Trust; Voya Senior Income Fund; Voya Separate Portfolios Trust; Voya Strategic Allocation Portfolios, Inc.; Voya Variable Funds; Voya Variable Insurance Trust; Voya Variable Portfolios, Inc.; and Voya Variable Products Trust. The number of funds in the Fund Complex is as of January 31, 2020. |
| * | | Effective December 31, 2019, Russell H. Jones and Roger B. Vincent each retired as a Trustee of the Board. |
52
TRUSTEE AND OFFICER INFORMATION (UNAUDITED) (CONTINUED)
| Name, Address and Age | | Position(s) Held
With the Trust | | Term of Office
and Length of
Time Served(1) | | Principal Occupation(s) —
During the Past 5 Years |
|---|
| | | | | | | |
|---|
Michael Bell
One Orange Way
Windsor, Connecticut 06095
Age: 51 | | Chief Executive Officer | | March 2018–Present | | Chief Executive Officer and Director, Voya Investments, LLC, Voya Capital, LLC, and Voya Funds Services, LLC (March 2018–Present); Senior Vice President and Chief Financial Officer, Voya Investments Distributor, LLC (September 2019–Present); Chief Financial Officer, Voya Investment Management (September 2014–Present). Formerly, Senior Vice President, Chief Financial Officer and Treasurer, Voya Investments, LLC (November 2015–March 2018). |
| | | | | | | |
|---|
Dina Santoro
230 Park Avenue
New York, New York 10169
Age: 46 | | President | | March 2018–Present | | President and Director, Voya Investments, LLC and Voya Capital, LLC (March 2018–Present); Director, Voya Funds Services, LLC (March 2018–Present); Director and Senior Vice President, Voya Investments Distributor, LLC (April 2018–Present); Senior Managing Director, Head of Product and Marketing Strategy, Voya Investment Management (September 2017–Present). Formerly, Managing Director, Quantitative Management Associates, LLC (January 2004–August 2017). |
| | | | | | | |
|---|
Stanley D. Vyner
230 Park Avenue
New York, New York 10169
Age: 69 | | Executive Vice President
Chief Investment Risk Officer | | VIT: March 2003–Present
VVIT: October 2000–Present
September 2009–Present | | Executive Vice President, Voya Investments, LLC (July 2000–Present) and Chief Investment Risk Officer, Voya Investments, LLC (January 2003–Present). |
| | | | | | | |
|---|
James M. Fink
5780 Powers Ferry Road NW
Atlanta, Georgia 30327
Age: 61 | | Executive Vice President | | March 2018–Present | | Managing Director, Voya Investments, LLC, Voya Capital, LLC, and Voya Funds Services, LLC (March 2018–Present); Senior Vice President, Voya Investments Distributor, LLC (April 2018–Present); Chief Administrative Officer, Voya Investment Management (September 2017–Present). Formerly, Managing Director, Operations, Voya Investment Management (March 1999–September 2017). |
| | | | | | | |
|---|
Kevin M. Gleason
7337 East Doubletree Ranch Rd.
Suite 100
Scottsdale, Arizona 85258
Age: 53 | | Chief Compliance Officer | | February 2012–Present | | Senior Vice President, Voya Investment Management and Chief Compliance Officer, Voya Family of Funds (February 2012–Present). |
| | | | | | | |
|---|
Todd Modic
7337 East Doubletree Ranch Rd.
Suite 100
Scottsdale, Arizona 85258
Age: 52 | | Senior Vice President, Chief/Principal Financial Officer and Assistant Secretary | | March 2005–Present | | President, Voya Funds Services, LLC (March 2018–Present) and Senior Vice President, Voya Investments, LLC (April 2005–Present). |
| | | | | | | |
|---|
Kimberly A. Anderson
7337 East Doubletree Ranch Rd.
Suite 100
Scottsdale, Arizona 85258
Age: 55 | | Senior Vice President | | November 2003–Present | | Senior Vice President, Voya Investments, LLC (September 2003–Present). |
| | | | | | | |
|---|
Robert Terris
5780 Powers Ferry Road NW
Atlanta, Georgia 30327
Age: 49 | | Senior Vice President | | May 2006–Present | | Senior Vice President, Voya Investments Distributor, LLC (April 2018–Present); Senior Vice President, Head of Division Operations, Voya Investments, LLC (October 2015–Present) and Voya Funds Services, LLC (March 2006–Present). |
| | | | | | | |
|---|
Fred Bedoya
7337 East Doubletree Ranch Rd.
Suite 100
Scottsdale, Arizona 85258
Age: 47 | | Vice President and Treasurer | | September 2012–Present | | Vice President, Voya Investments, LLC (October 2015–Present) and Voya Funds Services, LLC (July 2012–Present). |
| | | | | | | |
|---|
Maria M. Anderson
7337 East Doubletree Ranch Rd.
Suite 100
Scottsdale, Arizona 85258
Age: 61 | | Vice President | | September 2004–Present | | Vice President, Voya Investments, LLC (October 2015–Present) and Voya Funds Services, LLC (September 2004–Present). |
53
TRUSTEE AND OFFICER INFORMATION (UNAUDITED) (CONTINUED)
| Name, Address and Age | | Position(s) Held
With the Trust | | Term of Office
and Length of
Time Served(1) | | Principal Occupation(s) —
During the Past 5 Years |
|---|
| | | | | | | |
|---|
Sara M. Donaldson
7337 East Doubletree Ranch Rd.
Suite 100
Scottsdale, Arizona 85258
Age: 60 | | Vice President | | September 2014–Present | | Vice President, Voya Investments, LLC (October 2015–Present). Formerly, Vice President, Voya Funds Services, LLC (April 2014–October 2015). |
| | | | | | | |
|---|
Micheline S. Faver
7337 East Doubletree Ranch Rd.
Suite 100
Scottsdale, Arizona 85258
Age: 42 | | Vice President | | September 2016–Present | | Vice President, Head of Fund Compliance and Chief Compliance Officer, Voya Investments, LLC (June 2016–Present). Formerly, Vice President, Mutual Fund Compliance (March 2014–June 2016). |
| | | | | | | |
|---|
Robyn L. Ichilov
7337 East Doubletree Ranch Rd.
Suite 100
Scottsdale, Arizona 85258
Age: 52 | | Vice President | | VIT: November 1999–Present
VVIT: October 2000–Present | | Vice President, Voya Funds Services, LLC (November 1995–Present) and Voya Investments, LLC (August 1997–Present). |
| | | | | | | |
|---|
Jason Kadavy
7337 East Doubletree Ranch Rd.
Suite 100
Scottsdale, Arizona 85258
Age: 43 | | Vice President | | September 2012–Present | | Vice President, Voya Investments, LLC (October 2015–Present) and Voya Funds Services, LLC (July 2007–Present). |
| | | | | | | |
|---|
Andrew K. Schlueter
7337 East Doubletree Ranch Rd.
Suite 100
Scottsdale, Arizona 85258
Age: 43 | | Vice President | | March 2018–Present | | Vice President, Voya Investments Distributor, LLC (April 2018–Present); Vice President, Voya Investments, LLC and Voya Funds Services, LLC (March 2018–Present); Vice President, Head of Mutual Fund Operations, Voya Investment Management (February 2018–Present). Formerly, Vice President, Voya Investment Management (March 2014–February 2018). |
| | | | | | | |
|---|
Craig Wheeler
7337 East Doubletree Ranch Rd.
Suite 100
Scottsdale, Arizona 85258
Age: 50 | | Vice President | | May 2013–Present | | Vice President — Director of Tax, Voya Investments, LLC (October 2015–Present). Formerly, Vice President — Director of Tax, Voya Funds Services, LLC (March 2013–October 2015). |
| | | | | | | |
|---|
Monia Piacenti
One Orange Way
Windsor, Connecticut 06095
Age: 43 | | Anti-Money Laundering Officer | | June 2018–Present | | Anti-Money Laundering Officer, Voya Investments Distributor, LLC, Voya Investment Management and Voya Investment Management Trust Co. (June 2018–Present); Compliance Consultant, Voya Financial, Inc. (January 2019–Present). Formerly, Senior Compliance Officer, Voya Investment Management (December 2009–December 2018). |
| | | | | | | |
|---|
Theresa K. Kelety
7337 East Doubletree Ranch Rd.
Suite 100
Scottsdale, Arizona 85258
Age: 57 | | Secretary | | January 2020–Present | | Vice President and Senior Counsel, Voya Investment Management — Mutual Fund Legal Department (March 2010–Present). |
| | | | | | | |
|---|
Paul A. Caldarelli
7337 East Doubletree Ranch Rd.
Suite 100
Scottsdale, Arizona 85258
Age: 68 | | Assistant Secretary | | June 2010–Present | | Vice President and Senior Counsel, Voya Investment Management — Mutual Fund Legal Department (March 2010–Present). |
| | | | | | | |
|---|
Joanne F. Osberg
7337 East Doubletree Ranch Rd.
Suite 100
Scottsdale, Arizona 85258
Age: 38 | | Assistant Secretary | | January 2020–Present | | Vice President and Counsel, Voya Investment Management — Mutual Fund Legal Department (January 2013–Present). |
(1) | | The Officers hold office until the next annual meeting of the Board of Trustees and until their successors shall have been elected and qualified. |
54
ADVISORY AND SUB-ADVISORY CONTRACT APPROVAL DISCUSSION (UNAUDITED) BOARD CONSIDERATION AND APPROVAL OF INVESTMENT MANAGEMENT CONTRACTS, SUB-ADVISORY CONTRACTS, AND SUB-SUB-ADVISORY CONTRACT
At a meeting held on November 21, 2019, the Boards of Trustees (“Board”) of Voya Investors Trust (“VIT”) and Voya Variable Insurance Trust (“VVIT”) (together, the “Trusts”), including a majority of the Independent Trustees, considered and approved the renewal of the investment management contracts (the “Management Contracts”) between Voya Investments, LLC (the “Manager”) and the Trusts, on behalf of VY® BlackRock Inflation Protected Bond Portfolio, a series of VIT, and VY® BrandywineGLOBAL — Bond Portfolio, a series of VVIT (together, the “Portfolios”), the sub-advisory contracts (the “Sub-Advisory Contracts”) with the sub-advisers to each Portfolio (the “Sub-Advisers”), and the sub-sub-advisory contract (the “Sub- Sub-Advisory Contract,” and together with the Management Contracts and the Sub-Advisory Contracts, the “Contracts”) with the sub-sub-adviser to VY® BlackRock Inflation Protected Bond Portfolio (the “Sub-Sub-Adviser”) for an additional one year period ending November 30, 2020. In determining to renew such contracts, the Board considered information furnished to it throughout the year at meetings of the Board and its committees, including information regarding performance, expenses, and other matters.
In addition to the Board meeting on November 21, 2019, the Independent Trustees also held meetings outside the presence of personnel representing the Manager, Sub-Advisers or the Sub-Sub-Adviser (collectively, such persons are referred to herein as “management”) on October 9, 2019, and November 19, 2019, specifically to review and consider materials related to the proposed continuance of the Contracts that they believed to be relevant to the renewal of the Contracts in light of their own business judgment and the legal advice furnished to them by K&L Gates LLP, their independent legal counsel. Subsequent references herein to factors considered and determinations made by the Independent Trustees and/or the Board include, as applicable, factors considered and determinations made at those meetings by the Independent Trustees. While the Board considered the renewal of the management contracts and sub-advisory contracts for all of the applicable investment companies in the Voya family of funds at the same meetings, the Board considered each Voya fund’s investment management and sub-advisory relationships separately.
The Board follows a process pursuant to which it seeks and considers relevant information when it evaluates whether to renew existing investment management and sub-advisory contracts (including sub-sub-advisory contracts) for the Voya funds. The Board has established a Contracts
Committee and Investment Review Committees (the “IRCs”), each of which includes only Independent Trustees as members. The Contracts Committee meets several times throughout the year to provide oversight with respect to the management, sub-advisory and sub-sub-advisory contracts approval and renewal process, among other functions, and each IRC meets several times throughout the year to provide oversight regarding the investment performance of the sub-advisers, as well as the Manager’s role in monitoring the sub-advisers, with respect to each Voya fund that is assigned to that IRC.
The Contracts Committee oversees, and annually recommends Board approval of updates to, a methodology guide for the Voya funds (“Methodology Guide”) related to the investment management, sub-advisory and sub-sub-advisory contract renewal process. The Methodology Guide sets out a framework pursuant to which the Independent Trustees request, and management provides, certain information that the Independent Trustees deem to be important or potentially relevant. The Independent Trustees retain the services of an independent consultant with experience in the mutual fund industry to assist the Contracts Committee in developing and recommending to the Board: (1) a selected peer group of investment companies for each Portfolio (“Selected Peer Group”) based on that Portfolio’s particular attributes, such as fund type and size, fund category (as determined by Morningstar, Inc., an independent provider of mutual fund data (“Morningstar”)), sales channels and structure, and the Portfolio share class being compared to the Selected Peer Group; and (2) updates to the Methodology Guide with respect to the content and format of various data including, but not limited to, investment performance, fee structure, and expense information prepared in connection with the renewal process. In addition, the Independent Trustees periodically have retained, including most recently in 2018, an independent firm to test and verify the accuracy of certain information presented to the Board for a representative sample of the Voya funds.
Provided below is an overview of certain material factors that the Board considered at its meetings regarding the renewal of the Contracts and the compensation to be paid thereunder. The Board members did not identify any particular information or factor that was overarching, and each Board member may have accorded different weight to the various factors in reaching his or her conclusions with respect to each Portfolio’s investment management, sub-advisory, and sub-advisory arrangements, as applicable.
Nature, Extent and Quality of Services
The Manager oversees, subject to the authority of the Board, and is responsible for the provision of all investment advisory and portfolio management services for the Portfolios, but may delegate certain of these
55
ADVISORY AND SUB-ADVISORY CONTRACT APPROVAL DISCUSSION (UNAUDITED) (CONTINUED)
responsibilities to one or more sub-advisers or sub-sub-adviser. In addition, the Manager provides administrative services reasonably necessary for the operation of the Portfolios as set forth in the Management Contracts, including oversight of the Portfolios’ operations and risk management and the oversight of their various other service providers.
The Board considered the “manager-of-managers” platform of the Voya funds that has been developed by the Manager pursuant to which the Manager selects, subject to the Board’s approval, sub-advisers or sub-sub-advisers to provide day-to-day management services to all or a portion of each Voya fund. The Board recognized that the Manager is responsible for monitoring the investment program, performance, developments, ongoing operations, and compliance with applicable regulations and investment policies and restrictions of the Sub-Advisers and Sub-Sub-Adviser with respect to the Portfolios under this manager-of-managers arrangement. The Board also considered the techniques and resources that the Manager has developed to provide this ongoing oversight and due diligence with respect to the sub-advisers and to advocate or recommend, when it believes appropriate, changes in investment strategies or investment sub-advisers designed to assist in improving a Voya fund’s performance. The Board was advised that, in connection with the Manager’s performance of these duties, the Manager has developed an oversight process formulated by its Manager Research & Selection Group which reviews, among other matters, performance data, each Sub-Adviser’s and Sub-Sub-Adviser’s management team, portfolio data and attribution analysis related to each Sub-Adviser and Sub-Sub-Adviser through various means, including, but not limited to, in-person meetings, on-site visits, and telephonic meetings with the Sub-Adviser or Sub-Sub-Adviser.
Further, the Board considered periodic compliance reports it receives from the Trusts’ Chief Compliance Officer evaluating whether the regulatory compliance systems and procedures of the Manager and the Sub-Advisers and Sub-Sub-Adviser are reasonably designed to ensure compliance with the federal securities laws and whether the investment policies and restrictions for each Portfolio are consistently complied with, and other periodic reports covering related matters.
The Board considered the portfolio management team assigned by the Sub-Advisers and Sub-Sub-Adviser to the Portfolios and the level of resources committed to the Portfolios (and other relevant funds in the Voya funds) by the Manager, the Sub-Advisers and the Sub-Sub-Adviser, and whether those resources are sufficient to provide high-quality services to the Portfolios.
Based on their deliberations and the materials presented to them, the Board concluded that the nature, extent and
quality of the overall services provided by the Manager, each Sub-Adviser and Sub-Sub-Adviser under the Contracts were appropriate.
Portfolio Performance
In assessing the investment management, sub-advisory, and sub-sub-advisory relationships, the Board placed emphasis on the investment returns of each Portfolio, including its investment performance over certain time periods compared to the Portfolio’s Morningstar category and primary benchmark, a broad-based securities market index that appears in the Portfolio’s prospectus. The Board also considered information from the Manager Research & Selection Group and received reports summarizing a separate analysis of each Portfolio’s performance and risk, including risk-adjusted investment return information, from the Trusts’ Chief Investment Risk Officer.
Economies of Scale
When evaluating the reasonableness of the management fee schedules, the Board considered whether economies of scale have been or likely will be realized by the Manager and the Sub-Advisers as a Portfolio grows larger and the extent to which any such economies are shared with the Portfolio. In this regard, the Board noted the breakpoints in management fee schedules that will result in a lower management fee rate when a Portfolio achieves sufficient asset levels to receive a breakpoint discount. The Board also considered that, in addition to the management fee breakpoints, the Portfolios have fee waiver and expense reimbursement arrangements. The Board considered the extent to which economies of scale realized by the Manager or the Sub-Advisers and Sub-Sub-Adviser could be shared with each Portfolio through such fee waivers, expense reimbursements or other expense reductions. In evaluating these matters, the Independent Trustees also considered periodic management reports, Selected Peer Group comparisons, and industry information regarding economies of scale. In the case of sub-advisory fees and sub-sub-advisory fees, the Board considered that breakpoints, if any, would inure to the benefit of the Manager and the relevant Sub-Adviser, respectively.
Information Regarding Services, Performance, and Fee Schedules Offered to Other Clients
The Board considered comparative information regarding the nature of services, performance, and fee schedules offered by the Manager, the Sub-Advisers, and the Sub-Sub-Adviser to other clients with similar investment objectives, if applicable, including other registered investment companies and relevant institutional accounts. When the fee schedules offered to or the performance of such other clients differed materially from a Portfolio, the Board took into account the underlying rationale provided by the Manager, the Sub-Advisers or the Sub-Sub-Adviser,
56
ADVISORY AND SUB-ADVISORY CONTRACT APPROVAL DISCUSSION (UNAUDITED) (CONTINUED)
as applicable, for these differences. For the non-Voya-affiliated Sub-Advisers, the Board viewed the information related to any material differences in the fee schedules as not being a key factor in its deliberations because of the arm’s-length nature of negotiations between the Manager and non-Voya-affiliated Sub-Advisers with respect to sub-advisory fee schedules, and that the Manager is responsible for paying the fees of the Sub-Advisers and that the applicable Sub-Adviser is responsible for paying the fees of the Sub-Sub-Adviser.
Fee Schedules, Profitability, and Fall-out Benefits
The Board reviewed and considered the contractual management fee schedule and net management fee rate payable by each Portfolio to the Manager compared to the Portfolio’s Selected Peer Group. The Board also considered the compensation payable by the Manager to each Sub-Adviser for sub-advisory services for each Portfolio, including the portion of the contractual and net management fee rates that are paid to each Sub-Adviser, as compared to the compensation paid to the Manager and the contractual sub-sub-advisory fee schedule payable to the Sub-Sub-Adviser by the applicable Sub-Adviser. In this regard, the Board considered that the Sub-Sub-Adviser is compensated by the relevant Sub-Adviser and not the Manager. In addition, the Board considered the fee waivers, expense limitations, and recoupment arrangements that apply to the fees payable by the Portfolios, including whether the Manager intends to propose any changes thereto. For each Portfolio, the Board separately determined that the fees payable to the Manager and the fee schedule payable to each Sub-Adviser and Sub-Sub-Adviser are reasonable for the services that each performs, which were considered in light of the nature, extent and quality of the services that each has performed and is expected to perform.
For each Portfolio, the Board considered information on revenues, costs and profits or losses realized by the Manager related to their services to the Portfolio. In analyzing the profitability of the Manager and its affiliated service providers in connection with services they render to a Portfolio, the Board took into account the sub-advisory fee rate payable by the Manager to each Sub-Adviser. The Board also considered the profitability of the Manager attributable to servicing each Portfolio both with and without taking into account the profitability of the distributor of the Portfolios and any revenue sharing payments made by the Manager and both before and after giving effect to any expenses incurred by the Manager in making payments to affiliated insurance companies. The Board did not request profitability data from the Sub-Advisers or the Sub-Sub-Adviser, which are not affiliated with the Manager because the Board did not view this data as a key factor to its deliberations given the arm’s-length nature of the
relationship between the Manager and these non-Voya-affiliated Sub-Advisers and Sub-Sub-Adviser with respect to the negotiation of sub-advisory and sub-sub-advisory fee schedules. In addition, the Board noted that non-Voya-affiliated sub-advisers and sub-sub-advisers may not account for their profits on an account-by-account basis and those that do typically employ different methodologies in connection with these calculations.
Although the Methodology Guide establishes a framework for profit calculation, the Board recognized that there is no uniform methodology within the asset management industry for determining profitability for this purpose. The Board also recognized that the use of different reasonable methodologies can give rise to dramatically different reported profit and loss results with respect to the Manager, as well as other industry participants with whom the profits of the Manager could be compared. In addition, the Board recognized that management’s calculations regarding its costs incurred in establishing the infrastructure necessary for the Portfolios’ operations may not be fully reflected in the expenses allocated to each Portfolio in determining profitability, and that the information presented may not portray all of the costs borne by the Manager or reflect all risks, including entrepreneurial, regulatory, legal and operational risks, associated with offering and managing a mutual fund complex in the current regulatory and market environment.
The Board also considered that the Manager is entitled to earn a reasonable level of profits for the services that it provides to the Portfolios. The Board also considered information regarding the potential fall-out benefits to the Manager, Sub-Advisers and Sub-Sub-Adviser and their respective affiliates from their association with the Portfolios, including their ability to engage in soft-dollar transactions on behalf of the Portfolios. Following its reviews, the Board determined that the Manager’s profitability with respect to its services to the Portfolios and the Manager’s, Sub-Advisers’, and Sub-Sub-Adviser’s potential fall-out benefits were not unreasonable.
Portfolio-by-Portfolio Analysis
Set forth below are certain of the specific factors that the Board considered at its October 9, 2019, November 19, 2019, and/or November 21, 2019 meetings in relation to approving each Portfolio’s Contracts and the conclusions reached by the Board. These specific factors are in addition to those considerations discussed above. In each case, the Portfolio’s performance was compared to its Morningstar category, as well as its primary benchmark. The performance data provided to the Board primarily was for various periods ended March 31, 2019. In addition, the Board also considered at its October 9, 2019, November 19, 2019, and November 21, 2019 meetings certain additional data regarding each Portfolio’s more
57
ADVISORY AND SUB-ADVISORY CONTRACT APPROVAL DISCUSSION (UNAUDITED) (CONTINUED)
recent performance, asset levels and asset flows. Each Portfolio’s management fee rate and expense ratio were compared to the management fee rates and expense ratios of the funds in its Selected Peer Group. With respect to the quintile rankings noted below, the first quintile represents the range of funds with the highest performance or the lowest management fee rate or expense ratio, as applicable, and the fifth quintile represents the range of funds with the lowest performance or the highest management fee rate or expense ratio, as applicable.
VY® BlackRock Inflation Protected Bond Portfolio
In considering whether to approve the renewal of the Contracts for VY® BlackRock Inflation Protected Bond Portfolio, the Board considered that, based on performance data for the periods ended March 31, 2019: (1) the Portfolio is ranked in the second quintile of its Morningstar category for the year-to-date and one-year periods, and the third quintile for the three-year, five-year and ten-year periods; and (2) the Portfolio underperformed its primary benchmark for all periods presented, with the exception of the year-to-date period, during which it outperformed.
In considering the fees payable under the Contracts for the Portfolio, the Board took into account the factors described above and also considered: (1) the economies of scale benefits to the Portfolio and its shareholders from breakpoint discounts applicable to the Portfolio’s management fee rate, which result in lower fees at higher asset levels; and (2) the pricing structure (including the net expense ratio to be borne by shareholders) of the Portfolio, as compared to its Selected Peer Group, including that: (a) the net management fee rate for the Portfolio is ranked in the second quintile of net management fee rates of the funds in its Selected Peer Group; (b) the contractual management fee rate for the Portfolio is ranked in the second quintile of contractual management fee rates of the funds in its Selected Peer Group; and (c) the net expense ratio for the Portfolio is ranked in the second quintile of net expense ratios of the funds in its Selected Peer Group.
After its deliberation, the Board reached the following conclusions: (1) the Portfolio’s management fee rate is reasonable in the context of all factors considered by the Board; (2) the Portfolio’s net expense ratio is reasonable in the context of all factors considered by the Board; (3) the Portfolio’s performance is reasonable in the context of all factors considered by the Board; and (4) the sub-advisory fee rate payable by the Manager to the Sub-Adviser and the sub-sub-advisory fee rate payable by the Sub-Adviser to the Sub-Sub-Adviser are reasonable in the context of all factors considered by the Board. Based on these conclusions and other factors, the Board voted to renew the Contracts for the Portfolio for the year ending November 30, 2020. During this renewal process, different
Board members may have given different weight to different individual factors and related conclusions.
VY® BrandywineGLOBAL — Bond Portfolio
In considering whether to approve the renewal of the Management Contract for VY® BrandywineGLOBAL — Bond Portfolio (formerly, VY® Goldman Sachs Bond Portfolio), the Board considered that, based on performance data for the periods ended March 31, 2019: (1) the Portfolio is ranked in the first quintile of its Morningstar category for the year-to-date period, and the fourth quintile for the one-year and three-year periods; and (2) the Portfolio outperformed its primary benchmark for the year-to-date period and underperformed for the one-year and three-year periods. In analyzing this performance data, the Board took into account management’s representations regarding the recent changes to the Portfolio, including a change to the Sub-Adviser managing the Portfolio, effective August 9, 2019, which means that performance prior to August 9, 2019 reflects the performance of a different sub-adviser.
In considering the fees payable under the Management Contract for the Portfolio, the Board took into account the factors described above and also considered: (1) the fairness of the compensation under a Management Contract with a breakpoint fee schedule where the asset level necessary to achieve a breakpoint discount had not been reached by the Portfolio; and (2) the pricing structure (including the net expense ratio to be borne by shareholders) of the Portfolio, as compared to its Selected Peer Group, including that: (a) the net management fee rate for the Portfolio is ranked in the fourth quintile of net management fee rates of the funds in its Selected Peer Group; (b) the contractual management fee rate for the Portfolio is ranked in the third quintile of contractual management fee rates of the funds in its Selected Peer Group; and (c) the net expense ratio for the Portfolio is ranked in the second quintile of net expense ratios of the funds in its Selected Peer Group. In analyzing this fee data, the Board took into account Management’s representations regarding its belief that the Portfolio’s pricing is competitive.
After its deliberation, the Board reached the following conclusions: (1) the Portfolio’s management fee rate is reasonable in the context of all factors considered by the Board; (2) the Portfolio’s net expense ratio is reasonable in the context of all factors considered by the Board; and (3) the Portfolio’s performance is reasonable in the context of all factors considered by the Board. Based on these conclusions and other factors, the Board voted to renew the Management Contract for the Portfolio for the year ending November 30, 2020. During this renewal process, different Board members may have given different weight to different individual factors and related conclusions.
58
(THIS PAGE INTENTIONALLY LEFT BLANK)
Investment Adviser
Voya Investments, LLC
7337 East Doubletree Ranch Road, Suite 100
Scottsdale, Arizona 85258
Distributor
Voya Investments Distributor, LLC
7337 East Doubletree Ranch Road, Suite 100
Scottsdale, Arizona 85258
Transfer Agent
BNY Mellon Investment Servicing (U.S.) Inc.
301 Bellevue Parkway
Wilmington, Delaware 19809
Independent Registered Public Accounting Firm
KPMG LLP
Two Financial Center
60 South Street
Boston, Massachusetts 02111
Custodian
The Bank of New York Mellon
225 Liberty Street
New York, New York 10286
Legal Counsel
Ropes & Gray LLP
Prudential Tower
800 Boylston Street
Boston, Massachusetts 02199
Before investing, carefully consider the investment objectives, risks, charges and expenses of the variable annuity contract or variable life insurance policy and the underlying variable investment options. This and other information is contained in the prospectus for the variable annuity contract or variable life insurance policy and the underlying variable investment options. Obtain these prospectuses from your agent/registered representative and read them carefully before investing.
| RETIREMENT | INVESTMENTS | INSURANCE | |
| |
| voyainvestments.com | VPAR-VIT3AIS (1219-022020) |
Annual Report
December 31, 2019
Classes ADV, I and S
Voya Investors Trust
| n | | Voya Global Perspectives® Portfolio |
Beginning on January 1, 2021, as permitted by regulations adopted by the U.S. Securities and Exchange Commission, paper copies of each Portfolio’s annual and semi-annual shareholder reports, like this annual report, will no longer be sent by mail, unless you specifically request paper copies of the reports. Instead, the reports will be made available on a website and you will be notified by mail each time a report is posted and provided with a website link to access the report.
If you already elected to receive shareholder reports electronically, you will not be affected by this change and you need not take any action. You may elect to receive shareholder reports and other communications from your insurance carrier electronically by contacting them directly.
You may elect to receive all future reports in paper free of charge. If you received this document in the mail, please follow the instructions provided to elect to continue receiving paper copies of your shareholder reports. You can inform us that you wish to continue receiving paper copies by calling 1-800-283-3427. Your election to receive reports in paper will apply to all the funds in which you invest. |
This report is submitted for general information to shareholders of the Voya mutual funds. It is not authorized for distribution to prospective shareholders unless accompanied or preceded by a prospectus which includes details regarding the fund’s investment objectives, risks, charges, expenses and other information. This information should be read carefully. |
| | |
| | |
| INVESTMENT MANAGEMENT voyainvestments.com | |
TABLE OF CONTENTS
| | | | | 1 | |
| | | | | 2 | |
| | | | | 4 | |
| | | | | 6 | |
| | | | | 7 | |
| | | | | 8 | |
| | | | | 9 | |
| | | | | 10 | |
| | | | | 11 | |
| | | | | 12 | |
| | | | | 19 | |
| | | | | 21 | |
| | | | | 22 | |
| | | | | 26 | |
PROXY VOTING INFORMATION
A description of the policies and procedures that the Portfolio uses to determine how to vote proxies related to portfolio securities is available: (1) without charge, upon request, by calling Shareholder Services toll-free at (800) 992-0180; (2) on the Portfolio’s website at www.voyainvestments.com; and (3) on the U.S. Securities and Exchange Commission’s (“SEC’s”) website at www.sec.gov. Information regarding how the Portfolio voted proxies related to portfolio securities during the most recent 12-month period ended June 30 is available without charge on the Portfolio’s website at www.voyainvestments.com and on the SEC’s website at www.sec.gov.
QUARTERLY PORTFOLIO HOLDINGS
The Portfolio files its complete schedule of portfolio holdings with the SEC for the first and third quarters of each fiscal year on Form N-Q or Form N-PORT, available for filings after March 31, 2019. The Portfolio’s Form N-Q or Form N-PORT is available on the SEC’s website at www.sec.gov. The Portfolio’s complete schedule of portfolio holdings, as filed on Form N-Q or Form N-PORT, are available: on www.voyainvestments.com and without charge upon request from the Portfolio by calling Shareholder Services toll-free at (800) 992-0180.
(THIS PAGE INTENTIONALLY LEFT BLANK)
New season, last year’s plot
Dear Shareholder,
The financial markets delivered strong performance in 2019, and at this juncture, in our view, the outlook for 2020 seems upbeat. Thanks to supportive central bank policies around the world, global economic growth is reaccelerating; manufacturing activity, a key metric for setting market expectations, appears to be strengthening. Recent progress in the trade negotiations between China and the U.S. also helps brighten the outlook as 2020 gets underway.
So expect smooth sailing, right? Maybe. Barely into the first week of the new year, the world faced the prospect of escalating conflict in the Middle East, though tensions appear to have eased since then. Markets initially pulled back in response to heightened uncertainty but regrouped quickly. Follow-on events, if they occur, may not impact markets that much: during 2019, investors generally did well by downplaying geopolitical concerns, and we could see the same behavior in 2020.
Still, we believe that turbulence seems to be the world’s modus operandi: economic and market uncertainty are still with us, trade issues remain unresolved and the upcoming U.S. presidential election adds another dimension of political uncertainty. Even though market participants have become more comfortable accepting risk, we have observed persistent preferences for higher-quality, lower-volatility assets. This tells us that investors perceive significant risks they wish to avoid, and points to the potential for volatile reactions to adverse news.
With potential surprises from anywhere, we believe investors should continue to diversify their portfolios as broadly as practicable, and not attempt to time the markets. At the start of 2019, in our opinion, many investors did not believe U.S. equities offered attractive return potential — acting on that belief would have resulted in missed opportunities. Remember that your portfolio is structured to meet your long-term objectives; changing it in response to short-term market conditions may put your long-term goals at risk. If your goals have changed, please discuss them thoroughly with your investment advisor before making any changes to your portfolio.
Voya seeks to remain a reliable partner committed to reliable investing, helping you and your investment advisor achieve your goals. We appreciate your continued confidence in us, and we look forward to serving your investment needs in the future.
Sincerely,

Dina Santoro
President
Voya Family of Funds
January 21, 2020
The views expressed in the President’s Letter reflect those of the President as of the date of the letter. Any such views are subject to change at any time based upon market or other conditions and the Voya mutual funds disclaim any responsibility to update such views. These views may not be relied on as investment advice and because investment decisions for a Voya mutual fund are based on numerous factors, may not be relied on as an indication of investment intent on behalf of any Voya mutual fund. Reference to specific company securities should not be construed as recommendations or investment advice.
1
MARKET PERSPECTIVE: YEAR ENDED DECEMBER 31, 2019
In our semi-annual report, we described how global equities, in the form of the MSCI World IndexSM (the “Index”) measured in local currencies, including net reinvested dividends, rose 16.69% for the half-year after a nervous start.
A trade war between the U.S. and China had been ongoing for more than a year, with U.S. tariffs on some $250 billion of Chinese goods in place together with Chinese tariffs on $110 billion of U.S. goods. The war was being waged against a backdrop of slowing global growth, in part the result of uncertainties caused by the trade war itself.
Fears on both fronts: the trade war and slowing global growth, would ebb and flow in the second half; yet the Index rose five months out of six, ending the year up 27.34%, just below the record set a few days earlier. (The Index returned 27.67% for the year ended December 31, 2019, measured in U.S. dollars.)
Entering May, trade talks had appeared to be going reasonably well and the path of least resistance for the Index still seemed upwards. This all changed when the President tweeted his intention to raise the existing 10% tariff on $200 billion of the $250 billion to 25% of Chinese goods. Trade negotiations had evidently broken down. Later he unexpectedly threatened tariffs on Mexican goods for reasons unrelated to trade.
On perceived slowing global growth, there was still plenty to worry about.
In Europe, manufacturing was in contraction. The euro zone’s annual growth in gross domestic product (“GDP”) in the second and third quarters of 2019 was just 1.2%. In the U.K., chronic disagreement about whether and how to leave the European Union (“Brexit”) culminated in a general election called for December.
Japan, with manufacturing also in contraction, managed GDP growth of 2.0% annualized in the second quarter, slipping to 1.8% in the third. Exports and imports were both falling and core inflation languished at 0.8%, with a demand-dampening sales tax increase effective on October 1.
China’s GDP grew at 6.0% in the third quarter, the smallest advance in 27 years. Industrial production was expanding near the slowest pace in 17 years, retail sales in 16 years.
In the U.S., manufacturing fell into contraction in September. Corporate profits were flat to falling year-over-year. While annualized first quarter growth had surprised to the upside at 3.1%, it fell to 2.0% and 2.1% in the second and third quarters, respectively. Growth was heavily dependent on consumer spending, supported by the lowest unemployment rate since 1969.
Back in the markets, after May’s slump, central banks came to the rescue in June. On June 19 the Federal Open Market Committee (“FOMC”) left rates unchanged, but markets heard Chairman Powell signal a cut in July. The European Central Bank announced its willingness to cut its already negative deposit rate and resume bond purchases. The Japanese government also promised increased stimulus. Plans for tariffs on Mexican imports were “indefinitely suspended”, and investors were finally left to cheer a truce in the U.S.-China trade conflict, agreed on June 29.
July was a comparatively quiet month. The FOMC duly cut the federal funds rate by 25 basis points (0.25%), but disappointed some, including the President, by referring to it as only a “mid-cycle adjustment”. And it was back to trade-war angst in August, as first the President announced 10% tariffs on the approximately $300 billion of Chinese imports as yet unaffected, and then
increased existing and planned tariffs by 5% when China retaliated.
The market rollercoaster lurched back up in September and October, when high-level trade talks between the U.S. and China resumed. Both sides expressed confidence that “Phase 1” of a deal was possible by year-end. The FOMC cut rates again in both months.
And as year-end approached, a more positive narrative was increasingly heard. Markets were rising despite trade tensions, sluggish global growth, declining profits and political uncertainties in the U.S. and elsewhere. Perhaps, some commentators ventured, this was a signal that the worst was over. The Phase 1 trade deal was announced, amid some skepticism on the details, as was agreement on USMCA, the replacement for NAFTA. The U.K. government’s emphatic election victory might offer more clarity on Brexit. Central banks were all supportive and some of the economic data were starting to improve.
In U.S. fixed income markets, the Treasury yield curve fell. For the year, the Bloomberg Barclays U.S. Aggregate Bond Index rose 8.72%. The Bloomberg Barclays Long-Term U.S. Treasury sub-index returned 14.83%, the 30-year yield briefly dipping below 2% in August. The 10-year yield on Japanese and some euro zone government bonds ended below zero.
U.S. equities, represented by the S&P 500® Index, including dividends, surged 31.49%. Technology was by far the top performer, up 50.29%, led by Apple and Microsoft. Energy, exposed to slowing global economic activity, was the weakest, but still rose 11.81%.
In currencies, the dollar rose 2.04% against the euro, but lost 3.80% against the pound and 0.97% against the yen. On a trade-weighted basis, according to Reuters, the dollar had the smallest annual move ever in 2019.
In international markets, the MSCI Japan® Index ended up 18.48% for the year, supported by the Bank of Japan’s purchases of exchange-traded funds, but pressured by Japan’s own vulnerability to a trade war. The MSCI Europe ex U.K.® Index advanced 26.43%, powered by capital goods and pharmaceuticals companies. The MSCI U.K.® Index rose 16.37%, dampened by Brexit concerns, but also affected by the company-specific fortunes of MSCI U.K.’s market heavyweights. Among the largest contributors were pharmaceuticals, AstraZeneca and GlaxoSmithKline; the biggest detractors were miner Glencore and HSBC.
All indices are unmanaged and investors cannot invest directly in an index. Past performance does not guarantee future results. The performance quoted represents past performance.
Investment return and principal value of an investment will fluctuate, and shares, when redeemed, may be worth more or less than their original cost. The Portfolio’s performance is subject to change since the period’s end and may be lower or higher than the performance data shown. Please call (800) 992-0180 or log on to www.voyainvestments.com to obtain performance data current to the most recent month end.
Market Perspective reflects the views of Voya Investment Management’s Chief Investment Risk Officer only through the end of the period, and is subject to change based on market and other conditions.
2
BENCHMARK DESCRIPTIONS
| Index | | Description |
|---|
| Bloomberg Barclays High Yield Bond — 2% Issuer Constrained Composite Index | | An index that includes all fixed-income securities having a maximum quality rating of Ba1, a minimum amount outstanding of $150 million, and at least one year to maturity. |
| Bloomberg Barclays U.S. 20+ Year Treasury Bond Index | | Measures the performance of public obligations of the U.S. Treasury that have a remaining maturity of 20 or more years. The index includes all publicly-issued U.S. Treasury securities that have a remaining maturity of greater than or equal to 20 years, are rated investment grade and have $250 million or more of outstanding face value. |
| Bloomberg Barclays U.S. Aggregate Bond Index | | An index of publicly issued investment grade U.S. government, mortgage-backed, asset-backed and corporate debt securities. |
| Bloomberg Barclays U.S. Corporate Investment Grade Bond Index | | An index consisting of publicly issued, fixed rate, nonconvertible,
investment grade debt securities. |
| Bloomberg Barclays Global Aggregate Index | | Provides a broad-based measure of the global investment-grade fixed-rate debt
markets. |
| Bloomberg Barclays Long-Term U.S. Treasury Index | | This index measures the performance of U.S. Treasury bills with long-term maturity. The credit level for this index is investment grade. The rebalance scheme is monthly. |
| FTSE ERPA Nareit Developed Index | | The index is designed to track the performance of listed real estate companies and real-estate investment trusts (REITs) worldwide. Relevant activities are defined as the ownership, disposal and development of income-producing real estate. Constituents are classified into distinct property sectors based on gross invested book assets, as disclosed in the latest published financial statement. Index constituents are free-float adjusted, liquidity, size and revenue screened. |
MSCI Europe, Australasia and Far East® (“MSCI EAFE”) Index | | An index that measures the performance of securities listed on exchanges in Europe, Australasia and the Far East. It includes the reinvestment of dividends net of withholding taxes, but does not reflect fees, brokerage commissions or other expenses of investing. |
MSCI Emerging Markets IndexSM | | An index that measures the performance of securities listed on exchanges in developing nations throughout the world. It includes the reinvestment of dividends and distributions net of withholding taxes, but does not reflect fees, brokerage commissions or other expenses of investing. |
MSCI Europe ex UK® Index | | A free float-adjusted market capitalization index that is designed to measure developed market equity performance in Europe, excluding the UK. |
MSCI Japan® Index | | A free float-adjusted market capitalization index that is designed to measure developed market equity performance in Japan. |
MSCI U.K.® Index | | A free float-adjusted market capitalization index that is designed to measure developed market equity performance in the UK. |
MSCI World IndexSM | | An index that measures the performance of over 1,600 securities listed on exchanges in the U.S., Europe, Canada, Australia, New Zealand and the Far East. |
S&P 500® Index | | An index that measures the performance of securities of approximately 500 large-capitalization companies whose securities are traded on major U.S. stock markets. |
S&P MidCap 400® Index | | An index that measures the performance of the mid-size company segment of the U.S. market. |
S&P SmallCap 600® Index | | An index used to measure stock market performance composed of companies with a weighted average market value of approximately $630 million. |
S&P Target Risk® Growth Index* | | Seeks to measure the performance of an asset allocation strategy targeted to a growth focused risk profile. |
| * | Total return and gross index returns are presented. Index returns include the reinvestment of dividends and distributions. Gross index returns reflect the addition of an amount estimated by the index sponsor to approximate the fees incurred by index components. |
3
| VOYA GLOBAL PERSPECTIVES® PORTFOLIO | PORTFOLIO MANAGERS’ REPORT |
| | |
Target Allocations
as of December 31, 2019
(percent of net assets) |
| | | | |
| U.S. Large Cap Equities | | 10 | % |
| U.S. Mid Cap Equities | | 10 | % |
| U.S. Small Cap Equities | | 10 | % |
| Global Real Estate | | 10 | % |
| International Equities | | 10 | % |
| Emerging Market Equities | | 10 | % |
| U.S. Investment Grade Bonds | | 10 | % |
| U.S. Government Bonds | | 10 | % |
| Global Bonds | | 10 | % |
| U.S. High Yield Bonds | | 10 | % |
| Cash | | 0 | % |
| | | | |
Portfolio holdings are subject to change daily. |
Voya Global Perspectives® Portfolio (the “Portfolio”) seeks total return. Under normal conditions, the sub-adviser invests the assets of the Portfolio in a combination of underlying funds (“Underlying Funds”) that in turn, invest directly in securities such as stocks and bonds. The Portfolio is managed by Douglas Coté, CFA Portfolio Manager* of Voya Investment Management Co. LLC — the Sub-Adviser.
Under normal market conditions, approximately 60% of the Portfolio’s net assets are allocated to Underlying Funds that invest predominantly in equity securities, and approximately 40% of the Portfolio’s net assets are allocated to Underlying Funds that invest predominantly in debt instruments. These approximate weights are referred to as target allocations (“Target Allocations”). Depending upon the rules-based investment strategy, the equity target allocation may drop to approximately 30% and the debt target allocation may rise to approximately 70% — such weightings are called “defensive allocations.” No adjustments to the Target Allocations or defensive allocations will be made between quarterly allocation dates.**
Performance: For the year ended December 31, 2019, the Portfolio’s Class S shares provided a total return of 18.08%, compared to the S&P Target Risk® Growth Index Total Return and the Portfolio’s composite index (“Composite Index”)(1), which returned 19.20% and 19.72%, respectively, for the same period.
Portfolio Specifics: The Portfolio underperformed the S&P Target Risk® Growth Index Total Return. 2019 was an exceptionally strong year for global diversification — all asset classes, across equity and fixed income, both domestic and international, posted positive performance for the year. The fourth quarter capped the best year in a decade across global markets. The S&P 500® Index, the best performer of 2019, was even stronger than in 2009, which was considered a post-crash bounce in the markets.
The catalyst for these strong returns was corporate earnings that exceeded the 2018 surge in earnings driven tax cut in followed by a surprisingly accommodative U.S. Federal Reserve Board, which both cut the fed funds rate three times during the year; and flooded the market with liquidity in the fourth quarter, in response to troubles in the bank overnight lending market.
Our tactical signal, based on fundamentals, continued to indicate a positive outlook throughout the year and accordingly its allocation was at its “Base” position. Performance of the Portfolio was strong for the year across all asset classes. Notwithstanding the strong overall performance, the Portfolio underperformed its Composite Index. The main source of underperformance was in fixed income, where the Composite has allocations to US corporate bonds and to long-term Treasuries. Both of these components returned about 15%. The closest corresponding underlying funds in the Portfolio are respectively, the more broadly-based Voya U.S. Bond Index Portfolio and the mortgage-focused Voya GNMA Income Fund, each of which returned between 5% and 10%.
The performance of other underlying funds was mixed with a positive bias. The Portfolio’s equity allocation had strong absolute performance but negative benchmark relative performance in the Voya Index Plus LargeCap Portfolio and Voya International Index Portfolio. This was more than offset by outperformance in the Voya Small Company Portfolio. Other significant relative contributors included the Portfolio’s allocations to the Voya MidCap Opportunities Portfolio and VY® Clarion Global Real Estate Portfolio. In fixed income, other than the underlying funds referred to above, both positive absolute and relative performance benefited from the Voya High Yield Portfolio and the Voya Global Bond Fund.
Current Strategy and Outlook: While warnings of recession, bear markets and trade wars going into and throughout 2019 were rampant, calendar year equity returns were the best since 2009. What we believe the market missed was that the fundamentals were still intact. Our 2020 outlook is not so rosy. After three years of positive fundamentals we see an inflection point, from good to bad. In our opinion, the primary fundamental of equity prices is corporate earnings growth; it was weak all year in 2019 and faltered in the third quarter, with a –0.4% growth rate. Another important fundamental, the ISM manufacturing index, just registered its fifth consecutive month of contraction. In our view, there is a message here: prices measure current sentiment; fundamentals drive investor measures of future value.
For the first quarter of 2020 our tactical signal indicates a negative outlook, and accordingly, the Portfolio is positioned at its “Defensive” allocation. This positioning is consistent with the Portfolio’s investment philosophy, and reflects the negative corporate earnings growth reported for the third quarter of 2019.
| * | Effective October 31, 2019, Karyn Cavanugh, CFA, was removed as a portfolio manager for the Portfolio |
| ** | Effective January 7, 2020, the Fund moved to defensive allocations. |
| (1) | The Composite Index is composed of several indices that we believe provide an internal reference benchmark against which the actual performance of the Portfolio can be compared. As of December 31, 2019, the index allocation is approximately: 10% of the Bloomberg Barclays Global Aggregate Index, 10% of the Bloomberg Barclays High Yield Bond — 2% Issuer Constrained Composite Index, 10% of the Bloomberg Barclays U.S. Corporate Investment Grade Bond Index, 10% of the Bloomberg Barclays U.S. 20+ Year Treasury Bond Index, 10% of the FTSE ERPA Nareit Developed Index, 10% of the MSCI EAFE® Index, 10% of the MSCI Emerging Markets Index, 10% of the S&P 500® Index, 10% of the S&P MidCap 400®Index, 10% of the S&P SmallCap 600® Index. |
The views expressed in this commentary are informed opinions. They should not be considered promises or advice. The views expressed reflect those of the portfolio managers, only through the end of the period as stated on the cover. The portfolio managers’ views are subject to change at any time based on market and other conditions.
Portfolio holdings and characteristics are subject to change and may not be representative of current holdings and characteristics. Portfolio holdings are subject to change daily. The outlook for this Portfolio may differ from that presented for other Voya mutual funds. This report contains statements that may be “forward-looking” statements. Actual results may differ materially from those projected in the “forward-looking” statements. The Portfolio’s performance returns shown reflect applicable fee waivers and/or expense limits in effect during this period. Absent such fee waivers/expense limitations, if any, performance would have been lower. Performance for the different classes of shares will vary based on differences in fees associated with each class. An index has no cash in its portfolio and imposes no sales charges. An investor cannot invest directly in an index.
4
| PORTFOLIO MANAGERS’ REPORT | VOYA GLOBAL PERSPECTIVES® PORTFOLIO |
| | |
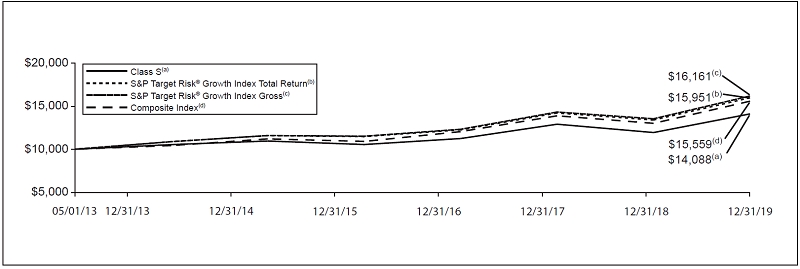
| Average Annual Total Returns for the Periods Ended December 31, 2019 |
|---|
| | | 1 Year | | | 5 Year | | | Since Inception
of Classes ADV, I and S
May 1, 2013 | |
|---|
| Class ADV | | | 17.97 | % | | | 5.11 | % | | | 5.18 | % | |
| Class I | | | 18.33 | % | | | 5.44 | % | | | 5.55 | % | |
| Class S | | | 18.08 | % | | | 5.16 | % | | | 5.27 | % | |
S&P Target Risk® Growth Index Total Return | | | 19.20 | % | | | 6.63 | % | | | 7.26 | % | |
S&P Target Risk® Growth Index Gross | | | 19.50 | % | | | 6.90 | % | | | 7.53 | % | |
| Composite Index | | | 19.72 | % | | | 6.80 | % | | | 6.86 | % | |
Based on a $10,000 initial investment, the graph and table above illustrate the total return of the Voya Global Perspectives® Portfolio against the indices indicated. An index is unmanaged and has no cash in its portfolio and imposes no sales charges. An investor cannot invest directly in an index.
The Portfolio’s performance is shown without the imposition of any expenses or charges which are, or may be, imposed under your variable annuity contract or variable life insurance policy. Total returns would have been lower if such expenses or charges were included.
The performance graph and table do not reflect the deduction of taxes that a shareholder will pay on Portfolio distributions or the redemption of Portfolio shares.
The performance shown may include the effect of fee waivers and/or expense reimbursements by the Investment Adviser and/or other service providers, which have the effect of increasing total return. Had all fees and expenses been considered, the total returns would have been lower.
The performance update illustrates performance for a variable investment option available through a
variable annuity contract or a variable life insurance policy. The performance shown indicates past performance and is not a projection or prediction of future results. Actual investment returns and principal value will fluctuate so that shares and/or units, at redemption, may be worth more or less than their original cost. Please log on to www.voyainvestments.com or call (800) 366-0066 to get performance through the most recent month end.
Portfolio holdings are subject to change daily.
Effective May 1, 2019, the Adviser changed the primary benchmark from the S&P Target Risk® Growth Index Gross (“Gross Index”) to the S&P Target Risk® Growth Index Total Return as the Adviser believes it more accurately reflects the investment experience of an investor in the benchmark’s components. Index returns include the reinvestment of dividends and distributions. Gross Index returns reflect the addition of an amount estimated by the index sponsor to approximate the fees incurred by index components.
5
SHAREHOLDER EXPENSE EXAMPLE (UNAUDITED)
As a shareholder of the Portfolio, you incur two types of costs: (1) transaction costs, including redemption fees and exchange fees; and (2) ongoing costs, including management fees, distribution and/or service (12b-1) fees, and other Portfolio expenses. These Examples are intended to help you understand your ongoing costs (in dollars) of investing in the Portfolio and to compare these costs with the ongoing costs of investing in other mutual funds.
The Examples are based on an investment of $1,000 invested at the beginning of the period and held for the entire period from July 1, 2019 to December 31, 2019. The Portfolio’s expenses are shown without the imposition of any charges which are, or may be, imposed under your variable annuity contract, variable life insurance policy, qualified pension, or retirement plan. Expenses would have been higher if such charges were included.
Actual Expenses
The left section of the table shown below, “Actual Portfolio Return,” provides information about actual account values and actual expenses. You may use the information in this section, together with the amount you invested, to estimate the expenses that you paid over the period. Simply divide your account value by $1,000 (for example, an $8,600 account value divided by $1,000 = 8.6), then multiply the result by the number in the first section under the heading entitled “Expenses Paid During the Period” to estimate the expenses you paid on your account during this period.
Hypothetical Example for Comparison Purposes
The right section of the table shown below, “Hypothetical (5% return before expenses)” provides information about hypothetical account values and hypothetical expenses based on the Portfolio’s actual expense ratio and an assumed rate of return of 5% per year before expenses, which is not the Portfolio’s actual return. The hypothetical account values and expenses may not be used to estimate the actual ending account balance or expenses you paid for the period. You may use this information to compare the ongoing costs of investing in the Portfolio and other mutual funds. To do so, compare this 5% hypothetical example with the 5% hypothetical examples that appear in the shareholder reports of the other mutual funds.
Please note that the expenses shown in the table are meant to highlight your ongoing costs only and do not reflect any transactional costs, such as redemption fees or exchange fees. Therefore, the hypothetical section of the table is useful in comparing ongoing costs only, and will not help you determine the relative total costs of owning different mutual funds. In addition, if these transactional costs were included, your costs would have been higher.
| | Actual Portfolio Return | | Hypothetical (5% return before expenses) |
|---|
| | Beginning
Account
Value
July 1,
2019 | | Ending
Account
Value
December 31,
2019 | | Annualized
Expense
Ratio* | | Expenses Paid
During the
Period Ended
December 31,
2019** | | Beginning
Account
Value
July 1,
2019 | | Ending
Account
Value
December 31,
2019 | | Annualized
Expense
Ratio* | | Expenses Paid
During the
Period Ended
December 31,
2019** |
|---|
| Class ADV | | | $1,000.00 | | | | $1,051.00 | | | | 0.48 | % | | | $2.48 | | | | $1,000.00 | | | | $1,022.79 | | | | 0.48 | % | | | $2.45 | |
| Class I | | | 1,000.00 | | | | 1,052.40 | | | | 0.18 | | | | 0.93 | | | | 1,000.00 | | | | 1,024.30 | | | | 0.18 | | | | 0.92 | |
| Class S | | | 1,000.00 | | | | 1,051.20 | | | | 0.43 | | | | 2.22 | | | | 1,000.00 | | | | 1,023.04 | | | | 0.43 | | | | 2.19 | |
| * | | The annualized expense ratios do not include expenses of underlying funds. |
| | | |
| ** | | Expenses are equal to the Portfolio’s respective annualized expense ratios multiplied by the average account value over the period, multiplied by 184/365 to reflect the most recent fiscal half-year. |
6
REPORT OF INDEPENDENT REGISTERED PUBLIC ACCOUNTING FIRM To the Shareholders of the Fund and Board of Trustees
Voya Investors Trust:
Opinion on the Financial Statements
We have audited the accompanying statement of assets and liabilities of Voya Global Perspectives® Portfolio (the Fund), a series of Voya Investors Trust, including the portfolio of investments, as of December 31, 2019, the related statement of operations for the year then ended, the statements of changes in net assets for each of the years in the two-year period then ended, and the related notes (collectively, the financial statements) and the financial highlights for each of the years in the five-year period then ended. In our opinion, the financial statements and financial highlights present fairly, in all material respects, the financial position of the Fund as of December 31, 2019, the results of its operations for the year then ended, the changes in its net assets for each of the years in the two-year period then ended, and the financial highlights for each of the years in the five-year period then ended, in conformity with U.S. generally accepted accounting principles.
Basis for Opinion
These financial statements and financial highlights are the responsibility of the Fund’s management. Our responsibility is to express an opinion on these financial statements and financial highlights based on our audits. We are a public accounting firm registered with the Public Company Accounting Oversight Board (United States) (PCAOB) and are required to be independent with respect to the Fund in accordance with the U.S. federal securities laws and the applicable rules and regulations of the Securities and Exchange Commission and the PCAOB.
We conducted our audits in accordance with the standards of the PCAOB. Those standards require that we plan and perform the audit to obtain reasonable assurance about whether the financial statements and financial highlights are free of material misstatement, whether due to error or fraud. Our audits included performing procedures to assess the risks of material misstatement of the financial statements and financial highlights, whether due to error or fraud, and performing procedures that respond to those risks. Such procedures included examining, on a test basis, evidence regarding the amounts and disclosures in the financial statements and financial highlights. Such procedures also included confirmation of securities owned as of December 31, 2019, by correspondence with the custodian and transfer agent. Our audits also included evaluating the accounting principles used and significant estimates made by management, as well as evaluating the overall presentation of the financial statements and financial highlights. We believe that our audits provide a reasonable basis for our opinion.
We have served as the auditor of one or more Voya investment companies since 1975.
Boston, Massachusetts
February 26, 2020
7
STATEMENT OF ASSETS AND LIABILITIES AS OF DECEMBER 31, 2019 ASSETS: | | | | | | |
| Investments in affiliated underlying funds at fair value* | | | | $ | 103,633,960 | |
| Cash | | | | | 32,330 | |
| Receivables: | | | | | | |
| Fund shares sold | | | | | 90,104 | |
| Prepaid expenses | | | | | 774 | |
| Reimbursement due from manager | | | | | 7,877 | |
| Other assets | | | | | 5,251 | |
| Total assets | | | | | 103,770,296 | |
| |
LIABILITIES: | | | | | | |
| Payable for investments in affiliated underlying funds purchased | | | | | 90,017 | |
| Payable for fund shares redeemed | | | | | 69 | |
| Payable for investment management fees | | | | | 17,519 | |
| Payable for distribution and shareholder service fees | | | | | 24,205 | |
| Payable to trustees under the deferred compensation plan (Note 6) | | | | | 5,251 | |
| Payable for trustee fees | | | | | 527 | |
| Other accrued expenses and liabilities | | | | | 32,429 | |
| Total liabilities | | | | | 170,017 | |
NET ASSETS | | | | $ | 103,600,279 | |
| |
NET ASSETS WERE COMPRISED OF: | | | | | | |
| Paid-in capital | | | | $ | 94,031,728 | |
| Total distributable earnings | | | | | 9,568,551 | |
NET ASSETS | | | | $ | 103,600,279 | |
| |
|
* Cost of investments in affiliated underlying funds | | | | $ | 97,992,341 | |
| |
Class ADV | | | | | | |
| Net assets | | | | $ | 95,445,908 | |
| Shares authorized | | | | | unlimited | |
| Par value | | | | $ | 0.001 | |
| Shares outstanding | | | | | 8,542,295 | |
| Net asset value and redemption price per share | | | | $ | 11.17 | |
| |
Class I | | | | | | |
| Net assets | | | | $ | 8,089,794 | |
| Shares authorized | | | | | unlimited | |
| Par value | | | | $ | 0.001 | |
| Shares outstanding | | | | | 718,244 | |
| Net asset value and redemption price per share | | | | $ | 11.26 | |
| |
Class S | | | | | | |
| Net assets | | | | $ | 64,577 | |
| Shares authorized | | | | | unlimited | |
| Par value | | | | $ | 0.001 | |
| Shares outstanding | | | | | 5,776 | |
| Net asset value and redemption price per share | | | | $ | 11.18 | |
See Accompanying Notes to Financial Statements
8
STATEMENT OF OPERATIONS FOR THE YEAR ENDED DECEMBER 31, 2019
INVESTMENT INCOME: | | | | | | |
| Dividends from affiliated underlying funds | | | | $ | 2,687,580 | |
| Total investment income | | | | | 2,687,580 | |
| |
EXPENSES: | | | | | | |
| Investment management fees | | | | | 210,802 | |
| Distribution and shareholder service fees: | | | | | | |
| Class ADV | | | | | 584,598 | |
| Class S | | | | | 152 | |
| Transfer agent fees | | | | | 390 | |
| Shareholder reporting expense | | | | | 15,243 | |
| Professional fees | | | | | 32,096 | |
| Custody and accounting expense | | | | | 16,202 | |
| Trustee fees | | | | | 4,216 | |
| Miscellaneous expense | | | | | 10,411 | |
| Total expenses | | | | | 874,110 | |
| Waived and reimbursed fees | | | | | (389,380 | ) |
| Net expenses | | | | | 484,730 | |
| Net investment income | | | | | 2,202,850 | |
| |
REALIZED AND UNREALIZED GAIN (LOSS): | | | | | | |
| Net realized gain (loss) on: | | | | | | |
| Investments | | | | | 1,412 | |
| Sale of affiliated underlying funds | | | | | 472,195 | |
| Capital gain distributions from affiliated underlying funds | | | | | 3,566,386 | |
| Net realized gain | | | | | 4,039,993 | |
| Net change in unrealized appreciation (depreciation) on: | | | | | | |
| Affiliated underlying funds | | | | | 11,208,477 | |
| Net change in unrealized appreciation (depreciation) | | | | | 11,208,477 | |
| Net realized and unrealized gain | | | | | 15,248,470 | |
Increase in net assets resulting from operations | | | | $ | 17,451,320 | |
See Accompanying Notes to Financial Statements
9
STATEMENTS OF CHANGES IN NET ASSETS | | | Year Ended
December 31,
2019 | | Year Ended
December 31,
2018 |
|---|
FROM OPERATIONS: | | | | | | | | | | | |
| Net investment income | | | | $ | 2,202,850 | | | | $ | 2,563,902 | |
| Net realized gain | | | | | 4,039,993 | | | | | 6,202,424 | |
| Net change in unrealized appreciation (depreciation) | | | | | 11,208,477 | | | | | (17,233,979 | ) |
| Increase (decrease) in net assets resulting from operations | | | | | 17,451,320 | | | | | (8,467,653 | ) |
| | | | | | | | |
FROM DISTRIBUTIONS TO SHAREHOLDERS: | | | | | | | | | | | |
| Total distributions (excluding return of capital): | | | | | | | | | | | |
| Class ADV | | | | | (7,252,542 | ) | | | | (4,138,503 | ) |
| Class I | | | | | (593,230 | ) | | | | (396,139 | ) |
| Class S | | | | | (4,546 | ) | | | | (2,218 | ) |
| Total distributions | | | | | (7,850,318 | ) | | | | (4,536,860 | ) |
| | | | | | | | |
FROM CAPITAL SHARE TRANSACTIONS: | | | | | | | | | | | |
| Net proceeds from sale of shares | | | | | 3,178,856 | | | | | 4,539,484 | |
| Reinvestment of distributions | | | | | 7,850,318 | | | | | 4,536,860 | |
| | | | | | 11,029,174 | | | | | 9,076,344 | |
| Cost of shares redeemed | | | | | (19,820,159 | ) | | | | (24,352,660 | ) |
| Net decrease in net assets resulting from capital share transactions | | | | | (8,790,985 | ) | | | | (15,276,316 | ) |
| Net increase (decrease) in net assets | | | | | 810,017 | | | | | (28,280,829 | ) |
NET ASSETS: | | | | | | | | | | | |
| Beginning of year or period | | | | | 102,790,262 | | | | | 131,071,091 | |
| End of year or period | | | | $ | 103,600,279 | | | | $ | 102,790,262 | |
See Accompanying Notes to Financial Statements
10
FINANCIAL HIGHLIGHTS
Selected data for a share of beneficial interest outstanding throughout each year or period.
| | | | Income (loss)
from investment
operations | | | | Less distributions | | | | | | | | | | Ratios to average
net assets | | Supplemental
Data |
|---|
| | | | | | | | | | | | | | | | | | | | | |
|---|
| | Net asset
value,
beginning
of year
or period | | Net
investment
income
(loss) | | Net
realized
and
unrealized
gain (loss) | | Total from
investment
operations | | From net
investment
income | | From net
realized
gains | | From return
of capital | | Total
distributions | | Payment
by
affiliate | | Net
asset
value,
end of
year or
period | | Total
Return(1) | | Expenses
before
reductions/
additions(2)(3)(4) | | Expenses
net of
fee waivers
and/or
recoupments
if any(2)(3)(4) | | Expenses
net of
all
reductions/
additions(2)(3)(4) | | Net
investment
income
(loss)(2)(3) | | Net
assets,
end of
year or
period | | Portfolio
turnover
rate |
|---|
| Year or period ended | | ($) | | ($) | | ($) | | ($) | | ($) | | ($) | | ($) | | ($) | | ($) | | ($) | | (%) | | (%) | | (%) | | (%) | | (%) | | ($000’s) | | (%) |
|---|
Class ADV | | | | | | | | | | | | | | | | | | | | | | | | | | | | | | | | | | | | | | | | | | | | | | | | | | | | | | | | | | | | | | | | | | | | |
| 12-31-19 | | | 10.21 | | | | 0.23 | • | | | 1.57 | | | | 1.80 | | | | 0.37 | | | | 0.47 | | | | — | | | | 0.84 | | | | — | | | | 11.17 | | | | 17.97 | | | | 0.87 | | | | 0.48 | | | | 0.48 | | | | 2.07 | | | | 95,446 | | | | 13 | |
| 12-31-18 | | | 11.46 | | | | 0.23 | • | | | (1.06 | ) | | | (0.83 | ) | | | 0.29 | | | | 0.13 | | | | — | | | | 0.42 | | | | — | | | | 10.21 | | | | (7.50 | ) | | | 0.87 | | | | 0.48 | | | | 0.48 | | | | 2.10 | | | | 94,684 | | | | 16 | |
| 12-31-17 | | | 10.26 | | | | 0.23 | • | | | 1.25 | | | | 1.48 | | | | 0.28 | | | | — | | | | — | | | | 0.28 | | | | — | | | | 11.46 | | | | 14.60 | | | | 0.86 | | | | 0.48 | | | | 0.48 | | | | 2.11 | | | | 122,258 | | | | 13 | |
| 12-31-16 | | | 9.87 | | | | 0.23 | • | | | 0.41 | | | | 0.64 | | | | 0.25 | | | | — | | | | — | | | | 0.25 | | | | — | | | | 10.26 | | | | 6.49 | | | | 0.89 | | | | 0.52 | | | | 0.52 | | | | 2.25 | | | | 139,474 | | | | 52 | |
| 12-31-15 | | | 10.91 | | | | 0.21 | • | | | (0.57 | ) | | | (0.36 | ) | | | 0.26 | | | | 0.42 | | | | — | | | | 0.68 | | | | — | | | | 9.87 | | | | (3.68 | ) | | | 0.98 | | | | 0.48 | | | | 0.48 | | | | 1.99 | | | | 154,227 | | | | 42 | |
Class I | | | | | | | | | | | | | | | | | | | | | | | | | | | | | | | | | | | | | | | | | | | | | | | | | | | | | | | | | | | | | | | | | | | | |
| 12-31-19 | | | 10.29 | | | | 0.26 | • | | | 1.59 | | | | 1.85 | | | | 0.41 | | | | 0.47 | | | | — | | | | 0.88 | | | | — | | | | 11.26 | | | | 18.33 | | | | 0.27 | | | | 0.18 | | | | 0.18 | | | | 2.33 | | | | 8,090 | | | | 13 | |
| 12-31-18 | | | 11.55 | | | | 0.28 | • | | | (1.08 | ) | | | (0.80 | ) | | | 0.33 | | | | 0.13 | | | | — | | | | 0.46 | | | | — | | | | 10.29 | | | | (7.21 | ) | | | 0.27 | | | | 0.18 | | | | 0.18 | | | | 2.48 | | | | 8,051 | | | | 16 | |
| 12-31-17 | | | 10.34 | | | | 0.25 | • | | | 1.28 | | | | 1.53 | | | | 0.32 | | | | — | | | | — | | | | 0.32 | | | | — | | | | 11.55 | | | | 14.98 | | | | 0.26 | | | | 0.18 | | | | 0.18 | | | | 2.29 | | | | 8,755 | | | | 13 | |
| 12-31-16 | | | 9.95 | | | | 0.25 | • | | | 0.43 | | | | 0.68 | | | | 0.29 | | | | — | | | | — | | | | 0.29 | | | | — | | | | 10.34 | | | | 6.81 | | | | 0.24 | | | | 0.22 | | | | 0.22 | | | | 2.41 | | | | 14,747 | | | | 52 | |
| 12-31-15 | | | 10.99 | | | | 0.25 | • | | | (0.57 | ) | | | (0.32 | ) | | | 0.30 | | | | 0.42 | | | | — | | | | 0.72 | | | | — | | | | 9.95 | | | | (3.35 | ) | | | 0.23 | | | | 0.18 | | | | 0.18 | | | | 2.36 | | | | 2,994 | | | | 42 | |
Class S | | | | | | | | | | | | | | | | | | | | | | | | | | | | | | | | | | | | | | | | | | | | | | | | | | | | | | | | | | | | | | | | | | | | |
| 12-31-19 | | | 10.22 | | | | 0.23 | | | | 1.58 | | | | 1.81 | | | | 0.38 | | | | 0.47 | | | | — | | | | 0.85 | | | | — | | | | 11.18 | | | | 18.08 | | | | 0.52 | | | | 0.43 | | | | 0.43 | | | | 2.10 | | | | 65 | | | | 13 | |
| 12-31-18 | | | 11.48 | | | | 0.23 | | | | (1.06 | ) | | | (0.83 | ) | | | 0.30 | | | | 0.13 | | | | — | | | | 0.43 | | | | — | | | | 10.22 | | | | (7.47 | ) | | | 0.52 | | | | 0.43 | | | | 0.43 | | | | 2.13 | | | | 55 | | | | 16 | |
| 12-31-17 | | | 10.28 | | | | 0.23 | | | | 1.27 | | | | 1.50 | | | | 0.30 | | | | — | | | | — | | | | 0.30 | | | | — | | | | 11.48 | | | | 14.71 | | | | 0.51 | | | | 0.43 | | | | 0.43 | | | | 2.14 | | | | 58 | | | | 13 | |
| 12-31-16 | | | 9.90 | | | | 0.23 | | | | 0.42 | | | | 0.65 | | | | 0.27 | | | | — | | | | — | | | | 0.27 | | | | — | | | | 10.28 | | | | 6.55 | | | | 0.49 | | | | 0.47 | | | | 0.47 | | | | 2.28 | | | | 50 | | | | 52 | |
| 12-31-15 | | | 10.95 | | | | 0.22 | • | | | (0.58 | ) | | | (0.36 | ) | | | 0.27 | | | | 0.42 | | | | — | | | | 0.69 | | | | — | | | | 9.90 | | | | (3.70 | ) | | | 0.48 | | | | 0.43 | | | | 0.43 | | | | 2.03 | | | | 47 | | | | 42 | |
(1) | | Total return is calculated assuming reinvestment of all dividends, capital gain distributions and return of capital distributions, if any, at net asset value and does not reflect the effect of insurance contract charges. Total return for periods less than one year is not annualized. |
(2) | | Annualized for periods less than one year. |
(3) | | Ratios reflect operating expenses of a Portfolio. Expenses before reductions/additions do not reflect amounts reimbursed or recouped by the Investment Adviser and/or Distributor or reductions from brokerage service arrangements or other expense offset arrangements and do not represent the amount paid by a Portfolio during periods when reimbursements or reductions occur. |
| | | Expenses net of fee waivers reflect expenses after reimbursement by the Investment Adviser and/or Distributor or recoupment of previously reimbursed fees by the Investment Adviser, but prior to reductions from brokerage service arrangements or other expense offset arrangements. Expenses net of all reductions/additions represent the net expenses paid by a Portfolio. Net investment income (loss) is net of all such additions or reductions. |
(4) | | Ratios do not include expenses of underlying funds and do not include fees and expenses charged under the variable annuity contract or variable life insurance policy. |
• | | Calculated using average number of shares outstanding throughout the year or period. |
See Accompanying Notes to Financial Statements
11
NOTES TO FINANCIAL STATEMENTS AS OF DECEMBER 31, 2019
NOTE 1 — ORGANIZATION
Voya Investors Trust (the “Trust”) is registered under the Investment Company Act of 1940, as amended (“1940 Act”), as an open-end management investment company. The Trust was organized as a Massachusetts business trust on August 3, 1988. The Trust consists of twenty-two active separate investment series. The series included in this report is Voya Global Perspectives® Portfolio (“Global Perspectives” or the “Portfolio”), a diversified series of the Trust. The investment objective of the Portfolio is described in the Portfolio’s Prospectus.
The classes of shares included in this report are: Adviser (“Class ADV”), Institutional (“Class I”) and Service (“Class S”). With the exception of class specific matters, each class has equal voting rights as to voting privileges. For class specific proposals, only the applicable class would have voting privileges. The classes differ principally in the applicable distribution and shareholder service fees. Generally, shareholders of each class also bear certain expenses that pertain to that particular class. All shareholders are allocated the common expenses of a portfolio and earn income and realized gains/losses from a portfolio pro rata based on the daily ending net assets of each class, without distinction between share classes. Expenses that are specific to a portfolio or a class are charged directly to that portfolio or class. Other operating expenses shared by several portfolios are generally allocated among those portfolios based on average net assets. Distributions are determined separately for each class based on income and expenses allocated to each class. Realized gain distributions are allocated to each classpro rata based on the shares outstanding of each class on the date of distribution. Differences in per share dividend rates generally result from differences in separate class expenses, including distribution and shareholder service fees, if applicable.
Voya Investments, LLC (“Voya Investments” or the “Investment Adviser”), an Arizona limited liability company, serves as the Investment Adviser to the Portfolio. Voya Investment Management Co. LLC (“Voya IM” or the “Sub-Adviser”), a Delaware limited liability company, serves as the Sub-Adviser to the Portfolio. Voya Investments Distributor, LLC (“VID” or the “Distributor”), a Delaware limited liability company, serves as the principal underwriter to the Portfolio.
The Portfolio seeks to achieve its investment objective by investing in affiliated investment companies that, in turn, invest directly in a wide range of portfolio securities (i.e., stocks and bonds). The investment companies in which the Portfolio invests are collectively referred to as the “Underlying Funds.”
NOTE 2 — SIGNIFICANT ACCOUNTING POLICIES
The following significant accounting policies are consistently followed by the Portfolio in the preparation of its financial statements. The Portfolio is considered an investment company under U.S. generally accepted accounting principles (“GAAP”) and follows the accounting and reporting guidance applicable to investment companies.
A. Security Valuation. The Portfolio is open for business every day the New York Stock Exchange (“NYSE”) opens for regular trading (each such day, a “Business Day”). The net asset value (“NAV”) per share for each class of the Portfolio is determined each Business Day as of the close of the regular trading session (“Market Close”), as determined by the Consolidated Tape Association (“CTA”), the central distributor of transaction prices for exchange-traded securities (normally 4:00 p.m. Eastern time unless otherwise designated by the CTA). The data reflected on the consolidated tape provided by the CTA is generated by various market centers, including all securities exchanges, electronic communications networks, and third-market broker-dealers. The NAV per share of each class of the Portfolio is calculated by taking the value of the Portfolio’s assets attributable to that class, subtracting the Portfolio’s liabilities attributable to that class, and dividing by the number of shares of that class that are outstanding. On days when the Portfolio is closed for business, Portfolio shares will not be priced and the Portfolio does not transact purchase and redemption orders. To the extent the Portfolio’s assets are traded in other markets on days when the Portfolio does not price its shares, the value of the Portfolio’s assets will likely change and you will not be able to purchase or redeem shares of the Portfolio.
Assets for which market quotations are readily available are valued at market value. A security listed or traded on an exchange is valued at its last sales price or official closing price as of the close of the regular trading session on the exchange where the security is principally traded or, if such price is not available, at the last sale price as of the Market Close for such security provided by the CTA. Bank loans are valued at the average of the averages of the bid and ask prices provided to an independent loan pricing service by brokers. Futures contracts are valued at the final settlement price set by an exchange on which they are principally traded. Listed options are valued at the mean between the last bid and ask prices from the exchange on which they are principally traded. Investments in open-end registered investment companies that do not trade on an exchange are valued at the end of day NAV per share. Investments in registered investment companies that trade on an exchange are valued at the last sales price or official
12
NOTES TO FINANCIAL STATEMENTS AS OF DECEMBER 31, 2019 (CONTINUED)
NOTE 2 — SIGNIFICANT ACCOUNTING POLICIES (continued)
closing price as of the close of the regular trading session on the exchange where the security is principally traded.
When a market quotation is not readily available or is deemed unreliable, the Portfolio will determine a fair value for the relevant asset in accordance with procedures adopted by the Portfolio’s Board of Trustees (“Board”). Such procedures provide, for example, that: (a) Exchange-traded securities are valued at the mean of the closing bid and ask; (b) Debt obligations are valued using an evaluated price provided by an independent pricing service. Evaluated prices provided by the pricing service may be determined without exclusive reliance on quoted prices, and may reflect factors such as institution-size trading in similar groups of securities, developments related to specific securities, benchmark yield, quality, type of issue, coupon rate, maturity, individual trading characteristics and other market data; (c) Securities traded in the over-the-counter (“OTC”) market are valued based on prices provided by independent pricing services or market makers; (d) Options not listed on an exchange are valued by an independent source using an industry accepted model, such as Black-Scholes; (e) Centrally cleared swap agreements are valued using a price provided by the central counterparty clearinghouse; (f) OTC swap agreements are valued using a price provided by an independent pricing service; (g) Forward foreign currency exchange contracts are valued utilizing current and forward rates obtained from an independent pricing service. Such prices from the third party pricing service are for specific settlement periods and the Portfolio’s forward foreign currency exchange contracts are valued at an interpolated rate between the closest preceding and subsequent period reported by the independent pricing service; and (h) Securities for which market prices are not provided by any of the above methods may be valued based upon quotes furnished by brokers.
The prospectuses of the open-end registered investment companies in which the Portfolio may invest explain the circumstances under which they will use fair value pricing and the effects of using fair value pricing.
Foreign securities’ (including forward foreign currency exchange contracts) prices are converted into U.S. dollar amounts using the applicable exchange rates as of Market Close. If market quotations are available and believed to be reliable for foreign exchange-traded equity securities, the securities will be valued at the market quotations. Because trading hours for certain foreign securities end before Market Close, closing market quotations may become unreliable. An independent pricing service determines the degree of certainty, based on historical data, that the closing price in the principal market where a foreign
security trades is not the current value as of Market Close. Foreign securities’ prices meeting the approved degree of certainty that the price is not reflective of current value will be valued by the independent pricing service using pricing models designed to estimate likely changes in the values of those securities between the times in which the trading in those securities is substantially completed and Market Close. Multiple factors may be considered by the independent pricing service in determining the value of such securities and may include information relating to sector indices, American Depositary Receipts and domestic and foreign index futures.
All other assets for which market quotations are not readily available or became unreliable (or if the above fair valuation methods are unavailable or determined to be unreliable) are valued at fair value as determined in good faith by or under the supervision of the Board following procedures approved by the Board. The Board has delegated to the Investment Adviser responsibility for overseeing the implementation of the Portfolio’s valuation procedures; a “Pricing Committee” comprised of employees of the Investment Adviser or its affiliates has responsibility for applying the fair valuation methods set forth in the procedures and, if a fair valuation cannot be determined pursuant to the fair valuation methods, determining the fair value of assets held by the Portfolio. Issuer specific events, transaction price, position size, nature and duration of restrictions on disposition of the security, market trends, bid/ask quotes of brokers and other market data may be reviewed in the course of making a good faith determination of a security’s fair value. Valuations change in response to many factors including the historical and prospective earnings of the issuer, the value of the issuer’s assets, general economic conditions, interest rates, investor perceptions and market liquidity. Because of the inherent uncertainties of fair valuation, the values used to determine the Portfolio’s NAV may materially differ from the value received upon actual sale of those investments. Thus, fair valuation may have an unintended dilutive or accretive effect on the value of shareholders’ investments in the Portfolio.
Each investment asset or liability of the Portfolio is assigned a level at measurement date based on the significance and source of the inputs to its valuation. Quoted prices in active markets for identical securities are classified as “Level 1,” inputs other than quoted prices for an asset or liability that are observable are classified as “Level 2” and significant unobservable inputs, including the Sub-Adviser’s or Pricing Committee’s judgment about the assumptions that a market participant would use in pricing an asset or liability are classified as “Level 3.” The inputs used for valuing securities are not necessarily an indication of the risks associated with investing in those securities.
13
NOTES TO FINANCIAL STATEMENTS AS OF DECEMBER 31, 2019 (CONTINUED)
NOTE 2 — SIGNIFICANT ACCOUNTING POLICIES (continued)
Short-term securities of sufficient credit quality are generally considered to be Level 2 securities under applicable accounting rules. The Portfolio classifies each of its investments in the Underlying Funds as Level 1, without consideration as to the classification level of the specific investments held by the Underlying Funds. A table summarizing the Portfolio’s investments under these levels of classification is included within the Portfolio of Investments.
GAAP requires a reconciliation of the beginning to ending balances for reported fair values that presents changes attributable to total realized and unrealized gains or losses, purchases and sales, and transfers in or out of the Level 3 category during the period. A reconciliation of Level 3 investments within the Portfolio of Investments is presented only when the Portfolio has a significant amount of Level 3 investments.
B. Securities Transactions and Revenue Recognition. Securities transactions are accounted for on the trade date. Dividend income received from the Underlying Funds is recognized on the ex-dividend date and is recorded as income distributions in the Statement of Operations. Capital gain distributions received from the Underlying Funds are recognized on the ex-dividend date and are recorded on the Statement of Operations as such. Realized gains and losses are reported on the basis of identified cost of securities sold.
C. Foreign Currency Translation. The books and records of the Portfolio are maintained in U.S. dollars. Any foreign currency amounts are translated into U.S. dollars on the following basis:
| (1) | | Market value of investment securities, other assets and liabilities — at the exchange rates prevailing at Market Close. |
| (2) | | Purchases and sales of investment securities, income and expenses — at the rates of exchange prevailing on the respective dates of such transactions. |
Although the net assets and the market values are presented at the foreign exchange rates at Market Close, the Portfolio does not isolate the portion of the results of operations resulting from changes in foreign exchange rates on investments from the fluctuations arising from changes in market prices of securities held. Such fluctuations are included with the net realized and unrealized gains or losses from investments. For securities which are subject to foreign withholding tax upon disposition, liabilities are recorded on the Statement of Assets and Liabilities for the estimated tax withholding
based on the securities’ current market value. Upon disposition, realized gains or losses on such securities are recorded net of foreign withholding tax.
Reported net realized foreign exchange gains or losses arise from sales of foreign currencies, currency gains or losses realized between the trade and settlement dates on securities transactions, the difference between the amounts of dividends, interest, and foreign withholding tax reclaims recorded on the Portfolio’s books, and the U.S. dollar equivalent of the amounts actually received or paid. Net unrealized foreign exchange gains and losses arise from changes in the value of assets and liabilities other than investments in securities, resulting from changes in the exchange rate. Foreign security and currency transactions may involve certain considerations and risks not typically associated with investing in U.S. companies and U.S. government securities. These risks include, but are not limited to, revaluation of currencies and future adverse political and economic developments which could cause securities and their markets to be less liquid and prices more volatile than those of comparable U.S. companies and U.S. government securities. The foregoing risks are even greater with respect to securities of issuers in emerging markets.
D. Distributions to Shareholders. The Portfolio records distributions to its shareholders on the ex-dividend date. The Portfolio declares and pays dividends and capital gain distributions, if any, annually. The Portfolio may make distributions on a more frequent basis to comply with the distribution requirements of the Internal Revenue Code. The characteristics of income and gains to be distributed are determined in accordance with income tax regulations, which may differ from GAAP for investment companies.
E. Federal Income Taxes. It is the policy of the Portfolio to comply with the requirements of subchapter M of the Internal Revenue Code and related excise tax provisions applicable to regulated investment companies and to distribute substantially all of its net investment income and any net realized capital gains to its shareholders. Therefore, no federal income tax provision is required. Management has considered the sustainability of the Portfolio’s tax positions taken on federal income tax returns for all open tax years in making this determination. No capital gain distributions shall be made until any capital loss carryforwards have been fully utilized or expire.
The Portfolio may utilize equalization accounting for tax purposes, whereby a portion of redemption payments are treated as distributions of income or gain.
F. Use of Estimates. The preparation of financial statements in conformity with GAAP requires management to make estimates and assumptions that affect the reported
14
NOTES TO FINANCIAL STATEMENTS AS OF DECEMBER 31, 2019 (CONTINUED)
NOTE 2 — SIGNIFICANT ACCOUNTING POLICIES (continued)
amounts of assets and liabilities and disclosure of contingent assets and liabilities at the date of the financial statements and the reported amounts of increases and decreases in net assets from operations during the reporting period. Actual results could differ from those estimates.
G. Indemnifications. In the normal course of business, the Trust may enter into contracts that provide certain indemnifications. The Trust’s maximum exposure under these arrangements is dependent on future claims that may be made against the Portfolio and, therefore, cannot be estimated; however, based on experience, management considers the risk of loss from such claims remote.
NOTE 3 — INVESTMENTS IN UNDERLYING FUNDS
For the year ended December 31, 2019, the cost of purchases and the proceeds from the sales of the Underlying Funds were as follows:
| Purchases | | Sales |
|---|
| $13,153,674 | | $27,595,503 |
NOTE 4 — INVESTMENT MANAGEMENT FEES
The Portfolio has entered into an investment management agreement (“Management Agreement”) with the Investment Adviser. The Investment Adviser has overall responsibility for the management of the Portfolio. The Investment Adviser oversees all investment management and portfolio management services for the Portfolio and assists in managing and supervising all aspects of the general day-to-day business activities and operations of the Portfolio, including custodial, transfer agency, dividend disbursing, accounting, auditing, compliance and related services. This Management Agreement compensates the Investment Adviser with a management fee, computed daily and payable monthly, based on: 0.20% of average daily net assets invested in affiliated Underlying Funds and 0.40% of the average daily net assets invested in unaffiliated Underlying Funds and/or other direct investments.
The Investment Adviser has entered into a sub-advisory agreement with Voya IM. Voya IM provides investment advice for the Portfolio and is paid by the Investment Adviser based on the average daily net assets of the Portfolio. Subject to such policies as the Board or the Investment Adviser may determine, Voya IM manages the Portfolio’s assets in accordance with the Portfolio’s investment objectives, policies, and limitations.
NOTE 5 — DISTRIBUTION AND SERVICE FEES
The Trust has entered into a shareholder service plan (the “Agreement”) for the Class S shares of the Portfolio. The Agreement compensates the Distributor for the provision of shareholder services and/or account maintenance services to direct or indirect beneficial owners of Class S. Under the Agreement, the Portfolio makes payments to the Distributor at an annual rate of 0.25% of the Portfolio’s average daily net assets attributable to Class S shares.
Class ADV shares have a shareholder service and distribution plan. Class ADV shares pay a shareholder service fee of 0.25% and a distribution fee of 0.35% of the Portfolio’s average daily net assets attributable to Class ADV shares. The Distributor has contractually agreed to waive 0.30% of the distribution fee for Class ADV shares of the Portfolio, so the actual fee paid by Class ADV shares is an annual rate of 0.05%. Termination or modification of this obligation requires approval by the Board.
NOTE 6 — OTHER TRANSACTIONS WITH AFFILIATES AND RELATED PARTIES
At December 31, 2019, there were no direct or indirect, wholly-owned subsidiaries of Voya Financial, Inc. or affiliated investment companies that owned more than 5% of the Portfolio.
Under the 1940 Act, the direct or indirect beneficial owner of more than 25% of the voting securities of a company (including a fund) is presumed to control such company. Companies under common control (e.g., companies with a common owner of greater than 25% of their respective voting securities) are affiliates under the 1940 Act.
The Portfolio has adopted a deferred compensation plan (the “DC Plan”), which allows eligible independent trustees, as described in the DC Plan, to defer the receipt of all or a portion of the trustees’ fees that they are entitled to receive from the Portfolio. For purposes of determining the amount owed to the trustee under the DC Plan, the amounts deferred are invested in shares of the funds selected by the trustee (the “Notional Funds”). The Portfolio purchases shares of the Notional Funds, which are all advised by Voya Investments, in amounts equal to the trustees’ deferred fees, resulting in a Portfolio asset equal to the deferred compensation liability. Such assets, if applicable, are included as a component of “Other assets” on the accompanying Statement of Assets and Liabilities. Deferral of trustees’ fees under the DC Plan will not affect net assets of the Portfolio, and will not materially affect the Portfolio’s assets, liabilities or net investment income per share. Amounts will be deferred until distributed in accordance with the DC Plan.
15
NOTES TO FINANCIAL STATEMENTS AS OF DECEMBER 31, 2019 (CONTINUED)
NOTE 7 — EXPENSE LIMITATION AGREEMENTS
The Investment Adviser has entered into a written expense limitation agreement (“Expense Limitation Agreement”) with the Portfolio whereby the Investment Adviser has agreed to limit expenses, excluding interest, taxes, investment-related costs, leverage expenses, and extraordinary expenses to the levels listed below:
| Class ADV(1,2) | | Class I(1,2) | | Class S(1,2) |
|---|
| | 1.55% | | | | 0.95% | | | | 1.20% | |
(1) | | The operating expense limits shown take into account the operating expenses incurred at the Underlying Fund level. The amount of fees and expenses of an Underlying Fund borne by the Portfolio will vary based on the Portfolio’s allocation of assets to, and the net expenses of, a particular Underlying Fund. |
(2) | | Pursuant to a side letter through May 1, 2020, the total expense limits including the operating expenses incurred at the Underlying Fund level are 1.09%, 0.83% and 1.08% for Class ADV, Class I, and Class S shares respectively. Termination or modification of this obligation requires approval by the Board. |
The Investment Adviser may at a later date recoup from the Portfolio for fees waived and/or other expenses reimbursed by the Investment Adviser during the previous 36 months, but only if, after such recoupment, the Portfolio’s expense ratio does not exceed the percentage described above. Waived and reimbursed fees net of any recoupment by the Investment Adviser of such waived and reimbursed fees are reflected on the accompanying Statement of Operations. Amounts payable by the Investment Adviser are reflected on the accompanying Statement of Assets and Liabilities.
As of December 31, 2019, the amounts of waived and/or reimbursed fees that are subject to possible recoupment by the Investment Adviser and the related expiration dates are as follows:
| December 31, | | | |
|---|
| 2020 | | | | 2021 | | 2022 | | Total |
|---|
| $108,606 | | | | $ | 102,272 | | | $ | 97,079 | | | $ | 307,957 | |
The Expense Limitation Agreement is contractual through May 1, 2020 and shall renew automatically for one-year terms. Termination or modification of this obligation requires approval by the Board.
NOTE 8 — LINE OF CREDIT
Effective May 17, 2019, the Portfolio, in addition to certain other funds managed by the Investment Adviser, has entered into a 364-day unsecured committed revolving line of credit agreement (the “Credit Agreement”) with The Bank of New York Mellon (“BNY”) for an aggregate amount of $400,000,000 through May 15, 2020. The proceeds may be used only to finance temporarily: (1) the purchase or sale of investment securities; or (2) the repurchase or redemption of shares of the Portfolio or certain other funds managed by the Investment Adviser. The funds to which the line of credit is available pay a commitment fee equal to 0.15% per annum on the daily unused portion of the committed line amount payable quarterly in arrears. Prior to May 17, 2019, the predecessor line of credit was for an aggregate amount of $400,000,000 and paid a commitment fee equal to 0.15% per annum on the daily unused portion of the committed line amount through May 17, 2019.
Borrowings under the Credit Agreement accrue interest at the federal funds rate plus a specified margin. Repayments generally must be made within 60 days after the date of a revolving credit advance.
The Portfolio did not utilize the line of credit during the year ended December 31, 2019.
NOTE 9 — CAPITAL SHARES
Transactions in capital shares and dollars were as follows:
| | Shares
sold | | | Shares
issued in
merger | | | Reinvestment
of
distributions | | | Shares
redeemed | | | Net increase
(decrease)
in shares
outstanding | | | Shares
sold | | | Proceeds
from shares
issued in
merger | | | Reinvestment
of
distributions | | | Shares
redeemed | | | Net increase
(decrease) | |
|---|
Year or
period ended | | # | | | # | | | # | | | # | | | # | | | ($) | | | ($) | | | ($) | | | ($) | | | ($) | |
|---|
Class ADV | | | | | | | | | | | | | | | | | | | | | | | | | | | | | | |
| 12/31/2019 | | 197,096 | | | — | | | 676,543 | | | (1,604,598 | ) | | (730,959 | ) | | 2,170,458 | | | — | | | 7,252,542 | | | (17,490,257 | ) | | (8,067,257 | ) |
| 12/31/2018 | | 148,056 | | | — | | | 374,186 | | | (1,920,791 | ) | | (1,398,549 | ) | | 1,678,572 | | | — | | | 4,138,503 | | | (21,406,712 | ) | | (15,589,637 | ) |
Class I | | | | | | | | | | | | | | | | | | | | | | | | | | | | | | |
| 12/31/2019 | | 92,317 | | | — | | | 54,979 | | | (211,343 | ) | | (64,047 | ) | | 1,008,165 | | | — | | | 593,230 | | | (2,329,337 | ) | | (727,942 | ) |
| 12/31/2018 | | 250,754 | | | — | | | 35,592 | | | (262,050 | ) | | 24,296 | | | 2,859,543 | | | — | | | 396,139 | | | (2,945,690 | ) | | 309,992 | |
Class S | | | | | | | | | | | | | | | | | | | | | | | | | | | | | | |
| 12/31/2019 | | 21 | | | — | | | 424 | | | (51 | ) | | 394 | | | 233 | | | — | | | 4,546 | | | (565 | ) | | 4,214 | |
| 12/31/2018 | | 125 | | | — | | | 200 | | | (23 | ) | | 302 | | | 1,369 | | | — | | | 2,218 | | | (258 | ) | | 3,329 | |
16
NOTES TO FINANCIAL STATEMENTS AS OF DECEMBER 31, 2019 (CONTINUED)
NOTE 10 — FEDERAL INCOME TAXES
The amount of distributions from net investment income and net realized capital gains are determined in accordance with federal income tax regulations, which may differ from GAAP for investment companies. These book/tax differences may be either temporary or permanent. Permanent differences are reclassified within the capital accounts based on their federal tax-basis treatment; temporary differences are not reclassified. Key differences include the treatment of short-term capital gains, foreign currency transactions, and wash sale deferrals. Distributions in excess of net investment income and/or net realized capital gains for tax purposes are reported as return of capital.
Dividends paid by the Portfolio from net investment income and distributions of net realized short-term capital gains are, for federal income tax purposes, taxable as ordinary income to shareholders.
The tax composition of dividends and distributions to shareholders was as follows:
Year Ended
December 31,
2019 | | Year Ended
December 31,
2018 |
|---|
Ordinary
Income | | | | Long-term
Capital Gains | | Ordinary
Income | | Long-term
Capital Gains |
|---|
| $3,458,637 | | | | $4,391,681 | | $3,212,809 | | $1,324,051 |
The tax-basis components of distributable earnings as of December 31, 2019 were:
Undistributed
Ordinary
Income | | Undistributed
Long-term
Capital Gains | | Unrealized
Appreciation/
(Depreciation) |
|---|
| $ 3,099,291 | | $3,228,921 | | $3,245,320 |
At December 31, 2019, the Portfolio did not have any capital loss carryovers for U.S. federal income tax purposes.
The Portfolio’s major tax jurisdictions are U.S. federal, Arizona state, and Massachusetts state.
As of December 31, 2019, no provision for income tax is required in the Portfolio’s financial statements as a result of tax positions taken on federal and state income tax returns for open tax years. The Portfolio’s federal and state income and federal excise tax returns for tax years for which the applicable statutes of limitations have not expired are subject to examination by the Internal Revenue Service and state department of revenue. Generally, the earliest tax year that remains subject to examination by these jurisdictions is 2015.
NOTE 11 — OTHER ACCOUNTING PRONOUNCEMENTS
The Portfolio has made a change in accounting principle and adopted the provisions of Financial Accounting Standards Board (“FASB”) Accounting Standards Update 2017-08 (“ASU 2017-08”), Premium Amortization on Purchased Callable Debt Securities. ASU 2017-08 shortens the amortization period for certain callable debt securities held at a premium; specifically, requiring the premium to be amortized to the earliest call date. Prior to ASU 2017-08, premiums on callable debt securities were generally amortized to maturity date. ASU 2017-08 is intended to more closely align the amortization period with the expectations incorporated into the market pricing on the underlying security. ASU 2017-08 does not require an accounting change for securities held at a discount; the discount continues to be amortized to maturity date. Upon evaluation, the Portfolio has concluded that the change in accounting principle does not materially impact the financial statement amounts.
Also, in August 2018, the FASB issued Accounting Standards Update 2018-13, Fair Value Measurement (Topic 820): Disclosure Framework — Changes to the Disclosure Requirements for Fair Value Measurement (“ASU 2018-13”). The update provides guidance that eliminates, adds and modifies certain disclosure requirements for fair value measurements. ASU 2018-13 will be effective for annual periods beginning after December 15, 2019 and interim periods within those annual periods. At this time, the Portfolio has elected to early adopt the amendments that allow for removal of disclosure requirements related to transfers between Level 1 and Level 2 of the fair value hierarchy and the timing of transfers between levels of the fair value hierarchy. These changes did not have a material impact on the Portfolios’ financial statements. The Portfolio plans to adopt the amendments that require additional fair value measurement disclosures for annual periods beginning after December 15, 2019, and interim periods within those annual periods. The Portfolio is currently evaluating the impact of these changes on the financial statements.
NOTE 12 — AUDITOR CHANGE (UNAUDITED)
On September 12, 2019, KPMG LLP (“KPMG”) was dismissed as the independent registered public accounting firm to the Trust, on behalf of the Portfolio, upon completion of the audit for the fiscal year ended December 31, 2019. The decision to change independent registered public accounting firms was recommended by the Audit Committee of the Board and was approved by the Board.
KPMG’s reports on the Portfolio’s financial statements for the fiscal years ended December 31, 2019 and
17
NOTES TO FINANCIAL STATEMENTS AS OF DECEMBER 31, 2019 (CONTINUED)
NOTE 12 — AUDITOR CHANGE (UNAUDITED)
(continued)
December 31, 2018 contained no adverse opinion or disclaimer of opinion nor were they qualified or modified as to uncertainty, audit scope or accounting principle.
During the fiscal years ended December 31, 2019 and December 31, 2018: (i) there were no disagreements with KPMG on any matter of accounting principles or practices, financial statement disclosure or auditing scope or procedure, which disagreements, if not resolved to the satisfaction of KPMG, would have caused KPMG to make reference to the subject matter of the disagreements in connection with its reports on the Portfolio’s financial statements for such periods; and (ii) there were no “reportable events” of the kind described in Item 304(a)(1)(v) of Regulation S-K under the Securities Exchange Act of 1934, as amended.
On September 12, 2019, based on the recommendation of the Audit Committee of the Board, the Board approved the
selection of Ernst & Young LLP (“EY”) as the Portfolio’s independent registered public accounting firm for the fiscal year ending December 31, 2020. During the Portfolio’s fiscal years ended December 31, 2019 and December 31, 2018, neither the Portfolio, nor anyone on its behalf, consulted with EY on items which: (i) concerned the application of accounting principles to a specified transaction, either completed or proposed, or the type of audit opinion that might be rendered on the Portfolio’s financial statements; or (ii) concerned the subject of a disagreement (as described in paragraph (a)(1)(iv) of Item 304 of Regulation S-K) or reportable events (as described in paragraph (a)(1)(v) of said Item 304).
NOTE 13 — SUBSEQUENT EVENTS
The Portfolio has evaluated events occurring after the Statement of Assets and Liabilities date (“subsequent events”) to determine whether any subsequent events necessitated adjustment to or disclosure in the financial statements. No such subsequent events were identified.
18
| VOYA GLOBAL PERSPECTIVES® PORTFOLIO | PORTFOLIO OF INVESTMENTS
ASOF DECEMBER 31, 2019 |
| Shares | | | | | Value | | | Percentage
of Net
Assets | |
|---|
| | | | | | | | | | | |
MUTUAL FUNDS: 100.0% | | | | | | | | |
| | | Affiliated Investment Companies: 100.0% |
| 893,739 | | Voya Emerging Markets Index Portfolio — Class I | | $ | 10,939,364 | | | | 10.6 | |
| 1,035,213 | | Voya Global Bond Fund — Class R6 | | | 9,969,103 | | | | 9.6 | |
| 1,173,975 | | Voya GNMA Income Fund — Class I | | | 9,943,567 | | | | 9.6 | |
| 1,019,837 | | Voya High Yield Portfolio — Class I | | | 10,137,183 | | | | 9.8 | |
| 372,952 | | Voya Index Plus LargeCap Portfolio — Class I | | | 10,729,830 | | | | 10.3 | |
| 1,001,324 | | Voya International Index Portfolio — Class I | | | 10,624,045 | | | | 10.2 | |
| 757,535 | | Voya MidCap Opportunities Portfolio — Class I | | | 10,544,892 | | | | 10.2 | |
| Shares | | | | | Value | | | Percentage
of Net
Assets | |
|---|
| | | | | | | | | | | |
MUTUAL FUNDS: (continued) | | | | | | | | |
| | | Affiliated Investment Companies: (continued) |
| 628,397 | | Voya Small Company Portfolio — Class I | | $ | 10,707,882 | | | | 10.3 | |
| 908,597 | | Voya U.S. Bond Index Portfolio — Class I | | | 9,903,706 | | | | 9.6 | |
| 773,027 | | VY®Clarion Global Real Estate Portfolio — Class I | | | 10,134,388 | | | | 9.8 | |
| | | | | | | | | | | |
| | | Total Mutual Funds
(Cost $97,992,341) | | | 103,633,960 | | | | 100.0 | |
| | | Liabilities in Excess of Other Assets | | | (33,681 | ) | | | — | |
| | | Net Assets | | $ | 103,600,279 | | | | 100.0 | |
Fair Value Measurementsˆ
The following is a summary of the fair valuations according to the inputs used as of December 31, 2019 in valuing the assets and liabilities:
| | Quoted Prices
in Active Markets
for Identical
Investments
(Level 1) | | Significant
Other
Observable
Inputs
(Level 2) | | Significant
Unobservable
Inputs
(Level 3) | | Fair Value
at
December 31, 2019 |
|---|
Asset Table | | | | | | | | | | | | | | | | | | | | |
Investments, at fair value | | | | | | | | | | | | | | | | | | | | |
| Mutual Funds | | | $ | 103,633,960 | | | | $ | — | | | | $ | — | | | | $ | 103,633,960 | |
| Total Investments, at fair value | | | $ | 103,633,960 | | | | $ | — | | | | $ | — | | | | $ | 103,633,960 | |
ˆ See Note 2, “Significant Accounting Policies” in the Notes to Financial Statements for additional information.
Transactions with Affiliates
An investment of at least 5% of the voting securities of an issuer, or a company which is under common control results in that issuer becoming an affiliated person as defined by the 1940 Act.
The following table provides transactions during the period ended December 31, 2019, where the following issuers were considered an affiliate:
| Issuer | | Beginning
Fair Value
at 12/31/18 | | Purchases
at Cost | | Sales
at Cost | | Change in
Unrealized
Appreciation/
(Depreciation) | | Ending
Fair Value
at 12/31/19 | | Investment
Income | | Realized
Gains/
(Losses) | | Net
Capital Gain
Distributions |
|---|
| Voya Emerging Markets Index Portfolio — Class I | | $ | 10,253,346 | | | $ | 1,343,339 | | | $ | (1,820,938 | ) | | $ | 1,163,617 | | | $ | 10,939,364 | | | $ | 249,274 | | | $ | 352,092 | | | $ | — | |
| Voya Global Bond Fund — Class R6 | | | 10,287,608 | | | | 1,479,156 | | | | (2,005,528 | ) | | | 207,867 | | | | 9,969,103 | | | | 434,977 | | | | 114,721 | | | | — | |
| Voya GNMA Income Fund — Class I | | | 10,260,307 | | | | 1,561,388 | | | | (2,164,363 | ) | | | 286,235 | | | | 9,943,567 | | | | 310,288 | | | | (19,675 | ) | | | — | |
| Voya High Yield Portfolio — Class I | | | 10,280,117 | | | | 1,059,175 | | | | (2,098,910 | ) | | | 896,801 | | | | 10,137,183 | | | | 576,762 | | | | 31,119 | | | | — | |
| Voya Index Plus LargeCap Portfolio — Class I | | | 10,314,679 | | | | 1,329,460 | | | | (2,371,440 | ) | | | 1,457,131 | | | | 10,729,830 | | | | 166,222 | | | | 268,907 | | | | 915,116 | |
| Voya International Index Portfolio — Class I | | | 10,256,499 | | | | 664,016 | | | | (1,805,289 | ) | | | 1,508,819 | | | | 10,624,045 | | | | 328,084 | | | | 214,565 | | | | — | |
| Voya MidCap Opportunities Portfolio — Class I | | | 10,337,372 | | | | 1,486,466 | | | | (2,516,930 | ) | | | 1,237,984 | | | | 10,544,892 | | | | 28,034 | | | | 254,345 | | | | 1,233,879 | |
| Voya Small Company Portfolio — Class I | | | 10,313,036 | | | | 2,243,236 | | | | (3,798,032 | ) | | | 1,949,642 | | | | 10,707,882 | | | | 42,124 | | | | (883,675 | ) | | | 1,417,391 | |
| Voya U.S. Bond Index Portfolio — Class I | | | 10,264,985 | | | | 1,315,564 | | | | (2,274,148 | ) | | | 597,305 | | | | 9,903,706 | | | | 252,478 | | | | (6,376 | ) | | | — | |
See Accompanying Notes to Financial Statements
19
| VOYA GLOBAL PERSPECTIVES® PORTFOLIO | PORTFOLIO OF INVESTMENTS
ASOF DECEMBER 31, 2019 (CONTINUED) |
| Issuer | | Beginning
Fair Value
at 12/31/18 | | Purchases
at Cost | | Sales
at Cost | | Change in
Unrealized
Appreciation/
(Depreciation) | | Ending
Fair Value
at 12/31/19 | | Investment
Income | | Realized
Gains/
(Losses) | | Net
Capital Gain
Distributions |
|---|
VY® Clarion Global Real Estate Portfolio — Class I | | $ | 10,260,782 | | | $ | 671,875 | | | $ | (2,701,345 | ) | | $ | 1,903,076 | | | $ | 10,134,388 | | | $ | 299,337 | | | $ | 146,171 | | | $ | — | |
| | | $ | 102,828,731 | | | $ | 13,153,674 | | | $ | (23,556,922 | ) | | $ | 11,208,477 | | | $ | 103,633,960 | | | $ | 2,687,580 | | | $ | 472,195 | | | $ | 3,566,386 | |
The financial statements for the above mutual fund[s] can be found at www.sec.gov.
At December 31, 2019, the aggregate cost of securities and other investments and the composition of unrealized appreciation and depreciation of securities and other investments at year end were:
| Cost for federal income tax purposes was $100,388,640. | | | |
| Net unrealized appreciation consisted of: | | | |
| Gross Unrealized Appreciation | $ | 6,778,110 | |
| Gross Unrealized Depreciation | | (3,532,790 | ) |
| Net Unrealized Appreciation | $ | 3,245,320 | |
See Accompanying Notes to Financial Statements
20
TAX INFORMATION (UNAUDITED)
Dividends and distributions paid during the year ended December 31, 2019 were as follows:
| Portfolio Name | | Type | | Per Share Amount |
|---|
Voya Global Perspectives® Portfolio | | | | | | | | |
| Class ADV | | NII | | $0.3682 |
| Class I | | NII | | $0.4069 |
| Class S | | NII | | $0.3798 |
| All Classes | | LTCG | | $0.4711 |
NII — Net investment income
LTCG — Long-term capital gain
Of the ordinary distributions made during the year ended December 31, 2019, 10.96% qualifies for the dividends received deduction (DRD) available to corporate shareholders.
The Portfolio designates $4,391,681 of long-term capital gain distributions as 20% rate long-term capital gain dividends under Internal Revenue Code Section 852(b)(3)(C).
The Regulated Investment Company Modernization Act of 2010 allows qualified fund-of-funds to elect to pass through the ability to take foreign tax credits (or deductions) to the extent that foreign taxes are passed through from underlying funds. A qualified fund-of-funds is a regulated investment company that has at least 50% of the value of its total assets invested in other regulated investment companies at the end of each quarter of the taxable year. Pursuant to Section 853 of the Internal Revenue Code, the Portfolio designates the following amount as foreign taxes paid for the year ended December 31, 2019:
Creditable
Foreign
Taxes Paid | | Per Share
Amount | | Portion of Ordinary Income
Distribution Derived from
Foreign Sourced Income* |
|---|
| $36,848 | | $0.0040 | | 14.95% |
| * | | The Portfolio listed above did not derive any income from ineligible foreign sources as defined under Section 901(j) of the Internal Revenue Code. |
Foreign taxes paid or withheld must be included in taxable income with an offsetting deduction from gross income or as a credit for taxes paid to foreign governments. Shareholders are strongly advised to consult their own tax advisors regarding the appropriate treatment of foreign taxes paid.
Above figures may differ from those cited elsewhere in this report due to differences in the calculation of income and gains under U.S. generally accepted accounting principles (book) purposes and Internal Revenue Service (tax) purposes.
Shareholders are strongly advised to consult their own tax advisers with respect to the tax consequences of their investments in the Portfolio. In January, shareholders, excluding corporate shareholders, receive an IRS 1099-DIV regarding the federal tax status of the dividends and distributions they received in the calendar year.
21
TRUSTEE AND OFFICER INFORMATION (UNAUDITED)
The business and affairs of the Trust are managed under the direction of the Board. A Trustee, who is not an interested person of the Trust, as defined in the 1940 Act, is an independent trustee (“Independent Trustee”). The Trustees and Officers of the Trust are listed below. The Statement of Additional Information includes additional information about Trustees of the Trust and is available, without charge, upon request at (800) 366-0066.
| Name, Address and Age | | Position(s)
Held with
the Trust | | Term of Office
and Length of
Time Served(1) | | Principal Occupation(s) —
During the Past 5 Years | | Number of
funds in
Fund
Complex
Overseen by
Trustee(2) | | Other Board Positions
Held by Trustee |
|---|
| | | | | | | | | | | |
Independent Trustees*: | | | | | | | | | | |
| | | | | | | | | | | |
Colleen D. Baldwin
7337 East Doubletree Ranch Rd.
Suite 100
Scottsdale, Arizona 85258
Age: 59 | | Trustee
Chairperson | | November 2007–Present January 2020–Present | | President, Glantuam Partners, LLC, a business consulting firm (January 2009–Present). | | 146 | | Dentaquest (February 2014–Present); RSR Partners, Inc. (2016–Present). |
| | | | | | | | | | | |
John V. Boyer
7337 East Doubletree Ranch Rd.
Suite 100
Scottsdale, Arizona 85258
Age: 66 | | Trustee | | January 2005–Present | | Retired. Formerly, President and Chief Executive Officer, Bechtler Arts Foundation, an arts and education foundation (January 2008–December 2019). | | 146 | | None. |
| | | | | | | | | | | |
Patricia W. Chadwick
7337 East Doubletree Ranch Rd.
Suite 100
Scottsdale, Arizona 85258
Age: 71 | | Trustee | | January 2006–Present | | Consultant and President, Ravengate Partners LLC, a consulting firm that provides advice regarding financial markets and the global economy (January 2000–Present). | | 146 | | Wisconsin Energy Corporation (June 2006–Present); The Royce Fund (22 funds) (December 2009–Present); and AMICA Mutual Insurance Company (1992–Present). |
| | | | | | | | | | | |
Martin J. Gavin
7337 East Doubletree Ranch Rd. Suite 100
Scottsdale, AZ 85258
Age: 69 | | Trustee | | August 2015–Present | | Retired. Formerly, President and Chief Executive Officer, Connecticut Children’s Medical Center (May 2006–November 2015). | | 146 | | None. |
| | | | | | | | | | | |
Joseph E. Obermeyer
7337 East Doubletree Ranch Rd.
Suite 100
Scottsdale, Arizona 85258
Age: 62 | | Trustee | | May 2013–Present | | President, Obermeyer & Associates, Inc., a provider of financial and economic consulting services (November 1999–Present). | | 146 | | None. |
| | | | | | | | | | | |
Sheryl K. Pressler
7337 East Doubletree Ranch Rd.
Suite 100
Scottsdale, Arizona 85258
Age: 69 | | Trustee | | January 2006–Present | | Consultant (May 2001–Present). | | 146 | | None. |
| | | | | | | | | | | |
Christopher P. Sullivan
7337 East Doubletree Ranch Rd.
Suite 100
Scottsdale, Arizona 85258
Age: 66 | | Trustee | | October 2015–Present | | Retired. | | 146 | | None. |
22
TRUSTEE AND OFFICER INFORMATION (UNAUDITED) (CONTINUED)
| Name, Address and Age | | Position(s)
Held with
the Trust | | Term of Office
and Length of
Time Served(1) | | Principal Occupation(s) —
During the Past 5 Years | | Number of
funds in
Fund
Complex
Overseen by
Trustee(2) | | Other Board Positions
Held by Trustee |
|---|
| | | | | | | | | | | |
|---|
Trustee who is an “interested person”: |
| | | | | | | | | | | |
Dina Santoro
230 Park Avenue
New York, New York 10169
Age: 46 | | Trustee | | July 2018–Present | | President, Voya Investments, LLC and Voya Capital, LLC (March 2018–Present); Senior Vice President, Voya Investments Distributor, LLC (April 2018–Present); Senior Managing Director, Head of Product and Marketing Strategy, Voya Investment Management (September 2017–Present). Formerly, Managing Director, Quantitative Management Associates, LLC (January 2004–August 2017). | | 146 | | Voya Investments, LLC, Voya Capital, LLC, and Voya Funds Services, LLC (March 2018–Present); Voya Investments Distributor, LLC (April 2018–Present). |
(1) | | Trustees serve until their successors are duly elected and qualified. The tenure of each Trustee who is not an “interested person” as defined in the 1940 Act, of each Portfolio (“Independent Trustee”) is subject to the Board’s retirement policy which states that each duly elected or appointed Independent Trustee shall retire from and cease to be a member of the Board of Trustees at the close of business on December 31 of the calendar year in which the Independent Trustee attains the age of 75. A majority vote of the Board’s other Independent Trustees may extend the retirement date of an Independent Trustee if the retirement would trigger a requirement to hold a meeting of shareholders of the Trust under applicable law, whether for the purposes of appointing a successor to the Independent Trustee or otherwise comply under applicable law, in which case the extension would apply until such time as the shareholder meeting can be held or is no longer required (as determined by a vote of a majority of the other Independent Trustees). |
(2) | | For the purposes of this table, “Fund Complex” means the Voya family of funds including the following investment companies: Voya Asia Pacific High Dividend Equity Income Fund; Voya Balanced Portfolio, Inc.; Voya Emerging Markets High Dividend Equity Fund; Voya Equity Trust; Voya Funds Trust; Voya Global Advantage and Premium Opportunity Fund; Voya Global Equity Dividend and Premium Opportunity Fund; Voya Government Money Market Portfolio; Voya Infrastructure, Industrials and Materials Fund; Voya Intermediate Bond Portfolio; Voya International High Dividend Equity Income Fund; Voya Investors Trust; Voya Mutual Funds; Voya Natural Resources Equity Income Fund; Voya Partners, Inc.; Voya Prime Rate Trust; Voya Senior Income Fund; Voya Separate Portfolios Trust; Voya Strategic Allocation Portfolios, Inc.; Voya Variable Funds; Voya Variable Insurance Trust; Voya Variable Portfolios, Inc.; and Voya Variable Products Trust. The number of funds in the Fund Complex is as of January 31, 2020. |
| * | | Effective December 31, 2019, Russell H. Jones and Roger B. Vincent each retired as a Trustee of the Board. |
23
TRUSTEE AND OFFICER INFORMATION (UNAUDITED) (CONTINUED)
| Name, Address and Age | | Position(s)
Held With
the Trust | | Term of Office and Length
of Time Served(1) | | Principal Occupation(s) —
During the Past 5 Years |
|---|
| | | | | | | |
Michael Bell
One Orange Way
Windsor, Connecticut 06095
Age: 51 | | Chief Executive Officer | | March 2018–Present | | Chief Executive Officer and Director, Voya Investments, LLC, Voya Capital, LLC, and Voya Funds Services, LLC (March 2018–Present); Senior Vice President and Chief Financial Officer, Voya Investments Distributor, LLC (September 2019–Present); Chief Financial Officer, Voya Investment Management (September 2014–Present). Formerly, Senior Vice President, Chief Financial Officer and Treasurer, Voya Investments, LLC (November 2015–March 2018). |
| | | | | | | |
Dina Santoro
230 Park Avenue
New York, New York 10169
Age: 46 | | President | | March 2018–Present | | President and Director, Voya Investments, LLC and Voya Capital, LLC (March 2018–Present); Director, Voya Funds Services, LLC (March 2018–Present); Director and Senior Vice President, Voya Investments Distributor, LLC (April 2018–Present); Senior Managing Director, Head of Product and Marketing Strategy, Voya Investment Management (September 2017–Present). Formerly, Managing Director, Quantitative Management Associates, LLC (January 2004–August 2017). |
| | | | | | | |
Stanley D. Vyner
230 Park Avenue
New York, New York 10169
Age: 69 | | Executive Vice President
Chief Investment Risk Officer | | March 2003–Present
September 2009–Present | | Executive Vice President, Voya Investments, LLC (July 2000–Present) and Chief Investment Risk Officer, Voya Investments, LLC (January 2003–Present). |
| | | | | | | |
James M. Fink
5780 Powers Ferry Road NW
Atlanta, Georgia 30327
Age: 61 | | Executive Vice President | | March 2018–Present | | Managing Director, Voya Investments, LLC, Voya Capital, LLC, and Voya Funds Services, LLC (March 2018–Present); Senior Vice President, Voya Investments Distributor, LLC (April 2018–Present); Chief Administrative Officer, Voya Investment Management (September 2017–Present). Formerly, Managing Director, Operations, Voya Investment Management (March 1999–September 2017). |
| | | | | | | |
Kevin M. Gleason
7337 East Doubletree Ranch Rd.
Suite 100
Scottsdale, Arizona 85258
Age: 53 | | Chief Compliance Officer | | February 2012–Present | | Senior Vice President, Voya Investment Management and Chief Compliance Officer, Voya Family of Funds (February 2012–Present). |
| | | | | | | |
Todd Modic
7337 East Doubletree Ranch Rd.
Suite 100
Scottsdale, Arizona 85258
Age: 52 | | Senior Vice President, Chief/Principal Financial Officer and Assistant Secretary | | March 2005–Present | | President, Voya Funds Services, LLC (March 2018–Present) and Senior Vice President, Voya Investments, LLC (April 2005–Present). |
| | | | | | | |
Kimberly A. Anderson
7337 East Doubletree Ranch Rd.
Suite 100
Scottsdale, Arizona 85258
Age: 55 | | Senior Vice President | | November 2003–Present | | Senior Vice President, Voya Investments, LLC (September 2003–Present). |
| | | | | | | |
Robert Terris
5780 Powers Ferry Road NW
Atlanta, Georgia 30327
Age: 49 | | Senior Vice President | | May 2006–Present | | Senior Vice President, Voya Investments Distributor, LLC (April 2018–Present); Senior Vice President, Head of Division Operations, Voya Investments, LLC (October 2015–Present) and Voya Funds Services, LLC (March 2006–Present). |
| | | | | | | |
Fred Bedoya
7337 East Doubletree Ranch Rd.
Suite 100
Scottsdale, Arizona 85258
Age: 47 | | Vice President and Treasurer | | September 2012–Present | | Vice President, Voya Investments, LLC (October 2015–Present) and Voya Funds Services, LLC (July 2012–Present). |
| | | | | | | |
Maria M. Anderson
7337 East Doubletree Ranch Rd.
Suite 100
Scottsdale, Arizona 85258
Age: 61 | | Vice President | | September 2004–Present | | Vice President, Voya Investments, LLC (October 2015–Present) and Voya Funds Services, LLC (September 2004–Present). |
24
TRUSTEE AND OFFICER INFORMATION (UNAUDITED) (CONTINUED)
| Name, Address and Age | | Position(s)
Held With
the Trust | | Term of Office and Length
of Time Served(1) | | Principal Occupation(s) —
During the Past 5 Years |
|---|
| | | | | | | |
Sara M. Donaldson
7337 East Doubletree Ranch Rd.
Suite 100
Scottsdale, Arizona 85258
Age: 60 | | Vice President | | September 2014–Present | | Vice President, Voya Investments, LLC (October 2015–Present). Formerly, Vice President, Voya Funds Services, LLC (April 2014–October 2015). |
| | | | | | | |
Micheline S. Faver
7337 East Doubletree Ranch Rd.
Suite 100
Scottsdale, Arizona 85258
Age: 42 | | Vice President | | September 2016–Present | | Vice President, Head of Fund Compliance and Chief Compliance Officer, Voya Investments, LLC (June 2016–Present). Formerly, Vice President, Mutual Fund Compliance (March 2014–June 2016). |
| | | | | | | |
Robyn L. Ichilov
7337 East Doubletree Ranch Rd.
Suite 100
Scottsdale, Arizona 85258
Age: 52 | | Vice President | | November 1999–Present | | Vice President, Voya Funds Services, LLC (November 1995–Present) and Voya Investments, LLC (August 1997–Present). |
| | | | | | | |
Jason Kadavy
7337 East Doubletree Ranch Rd.
Suite 100
Scottsdale, Arizona 85258
Age: 43 | | Vice President | | September 2012–Present | | Vice President, Voya Investments, LLC (October 2015–Present) and Voya Funds Services, LLC (July 2007–Present). |
| | | | | | | |
Andrew K. Schlueter
7337 East Doubletree Ranch Rd.
Suite 100
Scottsdale, Arizona 85258
Age: 43 | | Vice President | | March 2018–Present | | Vice President, Voya Investments Distributor, LLC (April 2018–Present); Vice President, Voya Investments, LLC and Voya Funds Services, LLC (March 2018–Present); Vice President, Head of Mutual Fund Operations, Voya Investment Management (February 2018–Present). Formerly, Vice President, Voya Investment Management (March 2014–February 2018). |
| | | | | | | |
Craig Wheeler
7337 East Doubletree Ranch Rd.
Suite 100
Scottsdale, Arizona 85258
Age: 50 | | Vice President | | May 2013–Present | | Vice President — Director of Tax, Voya Investments, LLC (October 2015–Present). Formerly, Vice President — Director of Tax, Voya Funds Services, LLC (March 2013–October 2015). |
| | | | | | | |
Monia Piacenti
One Orange Way
Windsor, Connecticut 06095
Age: 43 | | Anti-Money Laundering Officer | | June 2018–Present | | Anti-Money Laundering Officer, Voya Investments Distributor, LLC, Voya Investment Management and Voya Investment Management Trust Co. (June 2018–Present); Compliance Consultant, Voya Financial, Inc. (January 2019–Present). Formerly, Senior Compliance Officer, Voya Investment Management (December 2009–December 2018). |
| | | | | | | |
Theresa K. Kelety
7337 East Doubletree Ranch Rd.
Suite 100
Scottsdale, Arizona 85258
Age: 57 | | Secretary | | January 2020–Present | | Vice President and Senior Counsel, Voya Investment Management — Mutual Fund Legal Department (March 2010–Present). |
| | | | | | | |
Paul A. Caldarelli
7337 East Doubletree Ranch Rd.
Suite 100
Scottsdale, Arizona 85258
Age: 68 | | Assistant Secretary | | June 2010–Present | | Vice President and Senior Counsel, Voya Investment Management — Mutual Fund Legal Department (March 2010–Present). |
| | | | | | | |
Joanne F. Osberg
7337 East Doubletree Ranch Rd.
Suite 100
Scottsdale, Arizona 85258
Age: 38 | | Assistant Secretary | | January 2020–Present | | Vice President and Counsel, Voya Investment Management — Mutual Fund Legal Department (January 2013–Present). |
(1) | | The Officers hold office until the next annual meeting of the Board of Trustees and until their successors shall have been elected and qualified. |
25
ADVISORY AND SUB-ADVISORY CONTRACT APPROVAL DISCUSSION (UNAUDITED)
BOARD CONSIDERATION AND APPROVAL OF INVESTMENT MANAGEMENT CONTRACT AND SUB-ADVISORY CONTRACT
At a meeting held on November 21, 2019, the Board of Trustees (“Board”) of Voya Investors Trust (the “Trust”), including a majority of the Independent Trustees, considered and approved the renewal of the investment management contract (the “Management Contract”) between Voya Investments, LLC (the “Manager”) and the Trust, on behalf of Voya Global Perspectives® Portfolio, a series of the Trust (the “Portfolio”), and the sub-advisory contract (the “Sub-Advisory Contract,” and together with the Management Contract, the “Contracts”) with Voya Investment Management Co. LLC, the sub-adviser to the Portfolio (the “Sub-Adviser”) for an additional one year period ending November 30, 2020. In determining to renew such contracts, the Board considered information furnished to it throughout the year at meetings of the Board and its committees, including information regarding performance, expenses, and other matters.
In addition to the Board meeting on November 21, 2019, the Independent Trustees also held meetings outside the presence of personnel representing the Manager or Sub-Adviser (collectively, such persons are referred to herein as “management”) on October 9, 2019, and November 19, 2019, specifically to review and consider materials related to the proposed continuance of the Contracts that they believed to be relevant to the renewal of the Contracts in light of their own business judgment and the legal advice furnished to them by K&L Gates LLP, their independent legal counsel. Subsequent references herein to factors considered and determinations made by the Independent Trustees and/or the Board include, as applicable, factors considered and determinations made at those meetings by the Independent Trustees. While the Board considered the renewal of the management contracts and sub-advisory contracts for all of the applicable investment companies in the Voya family of funds at the same meetings, the Board considered each Voya fund’s investment management and sub-advisory relationships separately.
The Board follows a process pursuant to which it seeks and considers relevant information when it evaluates whether to renew existing investment management and sub-advisory contracts for the Voya funds. The Board has established a Contracts Committee and Investment Review Committees (the “IRCs”), each of which includes only Independent Trustees as members. The Contracts Committee meets several times throughout the year to provide oversight with respect to the management and sub-advisory contracts approval and renewal process, among other functions, and each IRC meets several times throughout the year to provide oversight regarding the investment performance of the sub-advisers, as well as the
Manager’s role in monitoring the sub-advisers, with respect to each Voya fund that is assigned to that IRC.
The Contracts Committee oversees, and annually recommends Board approval of updates to, a methodology guide for the Voya funds (“Methodology Guide”) related to the investment management and sub-advisory contract renewal process. The Methodology Guide sets out a framework pursuant to which the Independent Trustees request, and management provides, certain information that the Independent Trustees deem to be important or potentially relevant. The Independent Trustees retain the services of an independent consultant with experience in the mutual fund industry to assist the Contracts Committee in developing and recommending to the Board: (1) a selected peer group of investment companies for the Portfolio (“Selected Peer Group”) based on the Portfolio’s particular attributes, such as fund type and size, fund category (as determined by Morningstar, Inc., an independent provider of mutual fund data (“Morningstar”)), sales channels and structure and the Portfolio share class being compared to the Selected Peer Group; and (2) updates to the Methodology Guide with respect to the content and format of various data including, but not limited to, investment performance, fee structure, and expense information prepared in connection with the renewal process. In addition, the Independent Trustees periodically have retained, including most recently in 2018, an independent firm to test and verify the accuracy of certain information presented to the Board for a representative sample of the Voya funds.
Provided below is an overview of certain material factors that the Board considered at its meetings regarding the renewal of the Contracts and the compensation to be paid thereunder. The Board members did not identify any particular information or factor that was overarching, and each Board member may have accorded different weight to the various factors in reaching his or her conclusions with respect to the Portfolio’s investment management and sub-advisory arrangements.
Nature, Extent and Quality of Services
The Manager oversees, subject to the authority of the Board, and is responsible for the provision of all investment advisory and portfolio management services for the Portfolio, but may delegate certain of these responsibilities to one or more sub-advisers. In addition, the Manager provides administrative services reasonably necessary for the operation of the Portfolio as set forth in the Management Contract, including oversight of the Portfolio’s operations and risk management and the oversight of its various other service providers.
The Board considered the “manager-of-managers” platform of the Voya funds that has been developed by the
26
ADVISORY AND SUB-ADVISORY CONTRACT APPROVAL DISCUSSION (UNAUDITED) (CONTINUED)
Manager pursuant to which the Manager selects, subject to the Board’s approval, sub-advisers to provide day-to-day management services to all or a portion of each Voya fund. The Board recognized that the Manager is responsible for monitoring the investment program, performance, developments, ongoing operations, and compliance with applicable regulations and investment policies and restrictions of the Sub-Adviser with respect to the Portfolio under this manager-of-managers arrangement. The Board also considered the techniques and resources that the Manager has developed to provide this ongoing oversight and due diligence with respect to the sub-advisers and to advocate or recommend, when it believes appropriate, changes in investment strategies or investment sub-advisers designed to assist in improving a Voya fund’s performance. The Board was advised that, in connection with the Manager’s performance of these duties, the Manager has developed an oversight process formulated by its Manager Research & Selection Group which reviews, among other matters, performance data, the Sub-Adviser’s management team, portfolio data and attribution analysis related to the Sub-Adviser through various means, including, but not limited to, in-person meetings, on-site visits, and telephonic meetings with the Sub-Adviser.
Further, the Board considered periodic compliance reports it receives from the Trust’s Chief Compliance Officer evaluating whether the regulatory compliance systems and procedures of the Manager and the Sub-Adviser are reasonably designed to ensure compliance with the federal securities laws and whether the investment policies and restrictions for the Portfolio are consistently complied with, and other periodic reports covering related matters.
The Board considered the portfolio management team assigned by the Sub-Adviser to the Portfolio and the level of resources committed to the Portfolio (and other relevant funds in the Voya funds) by the Manager and the Sub-Adviser, and whether those resources are sufficient to provide high-quality services to the Portfolio.
Based on their deliberations and the materials presented to them, the Board concluded that the nature, extent and quality of the overall services provided by the Manager and the Sub-Adviser under the Contracts were appropriate.
Portfolio Performance
In assessing the investment management and sub-advisory relationships, the Board placed emphasis on the investment returns of the Portfolio, including its investment performance over certain time periods compared to the Portfolio’s Morningstar category and primary benchmark, a broad-based securities market index that appears in the Portfolio’s prospectus. The Board also considered information from the Manager Research & Selection Group and received reports summarizing a separate analysis of
the Portfolio’s performance and risk, including risk-adjusted investment return information, from the Trust’s Chief Investment Risk Officer.
Economies of Scale
When evaluating the reasonableness of the management fee schedule, the Board considered whether economies of scale have been or likely will be realized by the Manager and the Sub-Adviser as the Portfolio grows larger and the extent to which any such economies are shared with the Portfolio. The Board considered that, while the Portfolio does not have management fee breakpoints, it has fee waiver and expense reimbursement arrangements. The Board considered the extent to which economies of scale realized by the Manager could be shared with the Portfolio through such fee waivers, expense reimbursements or other expense reductions. In evaluating these matters, the Independent Trustees also considered periodic management reports, Selected Peer Group comparisons, and industry information regarding economies of scale.
Information Regarding Services, Performance, and Fee Schedules Offered to Other Clients
The Board considered comparative information regarding the nature of services, performance, and fee schedules offered by the Manager and the Sub-Adviser to other clients with similar investment objectives, if applicable, including other registered investment companies and relevant institutional accounts. When the fee schedules offered to or the performance of such other clients differed materially from the Portfolio, the Board took into account the underlying rationale provided by the Manager or the Sub-Adviser, as applicable, for these differences.
Fee Schedules, Profitability, and Fall-out Benefits
The Board reviewed and considered the contractual management fee schedule and net management fee rate payable by the Portfolio to the Manager compared to the Portfolio’s Selected Peer Group. The Board also considered the compensation payable by the Manager to the Sub-Adviser for sub-advisory services for the Portfolio, including the portion of the contractual and net management fee rates that are paid to the Sub-Adviser, as compared to the compensation paid to the Manager. In addition, the Board considered the fee waivers, expense limitations, and recoupment arrangements that apply to the fees payable by the Portfolio, including whether the Manager intends to propose any changes thereto. The Board separately determined that the fees payable to the Manager and the fee schedule payable to the Sub-Adviser are reasonable for the services that each performs, which were considered in light of the nature, extent and quality of the services that each has performed and is expected to perform.
27
ADVISORY AND SUB-ADVISORY CONTRACT APPROVAL DISCUSSION (UNAUDITED) (CONTINUED)
The Board considered information on revenues, costs and profits or losses realized by the Manager and the Voya-affiliated Sub-Adviser related to their services to the Portfolio. In analyzing the profitability of the Manager and its affiliated service providers in connection with services they render to the Portfolio, the Board took into account the sub-advisory fee rate payable by the Manager to the Sub-Adviser. The Board also considered the profitability of the Manager and its affiliated Sub-Adviser attributable to servicing the Portfolio both with and without taking into account the profitability of the distributor of the Portfolio and any revenue sharing payments made by the Manager and both before and after giving effect to any expenses incurred by the Manager or the affiliated Sub-Adviser in making payments to affiliated insurance companies.
Although the Methodology Guide establishes a framework for profit calculation, the Board recognized that there is no uniform methodology within the asset management industry for determining profitability for this purpose. The Board also recognized that the use of different reasonable methodologies can give rise to dramatically different reported profit and loss results with respect to the Manager and the Voya-affiliated Sub-Adviser, as well as other industry participants with whom the profits of the Manager and its affiliated Sub-Adviser could be compared. In addition, the Board recognized that management’s calculations regarding its costs incurred in establishing the infrastructure necessary for the Portfolio’s operations may not be fully reflected in the expenses allocated to the Portfolio in determining profitability, and that the information presented may not portray all of the costs borne by the Manager or reflect all risks, including entrepreneurial, regulatory, legal and operational risks, associated with offering and managing a mutual fund complex in the current regulatory and market environment.
The Board also considered that the Manager is entitled to earn a reasonable level of profits for the services that it provides to the Portfolio. The Board also considered information regarding the potential fall-out benefits to the Manager and Sub-Adviser and their respective affiliates from their association with the Portfolio, including their ability to engage in soft-dollar transactions on behalf of the Portfolio. Following its reviews, the Board determined that the Manager’s and the Voya-affiliated Sub-Adviser’s profitability with respect to their services to the Portfolio and the Manager and Sub-Adviser’s potential fall-out benefits were not unreasonable.
Portfolio Analysis
Set forth below are certain of the specific factors that the Board considered at its October 9, 2019, November 19, 2019, and/or November 21, 2019 meetings in relation to approving the Portfolio’s Contracts and the conclusions reached by the Board. These specific factors are in addition to those
considerations discussed above. The Portfolio’s performance was compared to its Morningstar category, as well as its primary benchmark. The performance data provided to the Board primarily was for various periods ended March 31, 2019. In addition, the Board also considered at its October 9, 2019, November 19, 2019, and November 21, 2019 meetings certain additional data regarding the Portfolio’s more recent performance, asset levels and asset flows. The Portfolio’s management fee rate and expense ratio were compared to the management fee rates and expense ratios of the funds in its Selected Peer Group. With respect to the quintile rankings noted below, the first quintile represents the range of funds with the highest performance or the lowest management fee rate or expense ratio, as applicable, and the fifth quintile represents the range of funds with the lowest performance or the highest management fee rate or expense ratio, as applicable.
In considering whether to approve the renewal of the Contracts for Voya Global Perspectives® Portfolio, the Board considered that, based on performance data for the periods ended March 31, 2019: (1) the Portfolio is ranked in the first quintile of its Morningstar category for the five-year period, and the second quintile for the year-to-date, one-year and three-year periods; and (2) the Portfolio underperformed its primary benchmark for all periods presented, with the exception of the year-to-date period, during which it outperformed.
In considering the fees payable under the Contracts for the Portfolio, the Board took into account the factors described above and also considered: (1) the fairness of the compensation under a Management Contract with a level fee rate that does not include breakpoints; and (2) the pricing structure (including the net expense ratio to be borne by shareholders) of the Portfolio, as compared to its Selected Peer Group, including that: (a) the net management fee rate for the Portfolio is ranked in the fourth quintile of net management fee rates of the funds in its Selected Peer Group; (b) the contractual management fee rate for the Portfolio is ranked in the fourth quintile of contractual management fee rates of the funds in its Selected Peer Group; and (c) the all-in net expense ratio for the Portfolio, inclusive of the Acquired Fund Fees and Expenses (“AFFE”), is ranked in the first quintile of all-in net expense ratios of the funds in its Selected Peer Group, and the net expense ratio for the Portfolio, not inclusive of AFFE, is below the median of net expense ratios of the funds in its Selected Peer Group. In analyzing this fee data, the Board took into account: (1) that the Portfolio indirectly bears the fees payable by the underlying funds in which the Portfolio invests; and (2) management’s representations regarding its belief that the Portfolio’s pricing is competitive.
After its deliberation, the Board reached the following conclusions: (1) the Portfolio’s management fee rate is
28
ADVISORY AND SUB-ADVISORY CONTRACT APPROVAL DISCUSSION (UNAUDITED) (CONTINUED)
reasonable in the context of all factors considered by the Board; (2) the Portfolio’s net expense ratio is reasonable in the context of all factors considered by the Board; (3) the Portfolio’s performance is reasonable in the context of all factors considered by the Board; and (4) the sub-advisory fee rate payable by the Manager to the Sub-Adviser is reasonable in the context of all factors considered by the
Board. Based on these conclusions and other factors, the Board voted to renew the Contracts for the Portfolio for the year ending November 30, 2020. During this renewal process, different Board members may have given different weight to different individual factors and related conclusions.
29
(THIS PAGE INTENTIONALLY LEFT BLANK)
(THIS PAGE INTENTIONALLY LEFT BLANK)
Investment Adviser
Voya Investments, LLC
7337 East Doubletree Ranch Road, Suite 100
Scottsdale, Arizona 85258
Distributor
Voya Investments Distributor, LLC
7337 East Doubletree Ranch Road, Suite 100
Scottsdale, Arizona 85258
Transfer Agent
BNY Mellon Investment Servicing (U.S.) Inc.
301 Bellevue Parkway
Wilmington, Delaware 19809
Independent Registered Public Accounting Firm
KPMG LLP
Two Financial Center
60 South Street
Boston, Massachusetts 02111
Custodian
The Bank of New York Mellon
225 Liberty Street
New York, New York 10286
Legal Counsel
Ropes & Gray LLP
Prudential Tower
800 Boylston Street
Boston, Massachusetts 02199
Before investing, carefully consider the investment objectives, risks, charges and expenses of the variable annuity contract or variable life insurance policy and the underlying variable investment options. This and other information is contained in the prospectus for the variable annuity contract or variable life insurance policy and the underlying variable investment options. Obtain these prospectuses from your agent/registered representative and read them carefully before investing.
| RETIREMENT | INVESTMENTS | INSURANCE | |
| |
| voyainvestments.com | VPAR-VITFOFAIS (1219-021420) |
Annual Report
December 31, 2019
Classes ADV and I
| n | | Voya Retirement Conservative Portfolio |
| n | | Voya Retirement Growth Portfolio |
| n | | Voya Retirement Moderate Portfolio |
| n | | Voya Retirement Moderate Growth Portfolio |
Beginning on January 1, 2021, as permitted by regulations adopted by the U.S. Securities and Exchange Commission, paper copies of each Portfolio’s annual and semi-annual shareholder reports, like this annual report, will no longer be sent by mail, unless you specifically request paper copies of the reports. Instead, the reports will be made available on a website and you will be notified by mail each time a report is posted and provided with a website link to access the report.
If you already elected to receive shareholder reports electronically, you will not be affected by this change and you need not take any action. You may elect to receive shareholder reports and other communications from your insurance carrier electronically by contacting them directly.
You may elect to receive all future reports in paper free of charge. If you received this document in the mail, please follow the instructions provided to elect to continue receiving paper copies of your shareholder reports. You can inform us that you wish to continue receiving paper copies by calling 1-800-283-3427. Your election to receive reports in paper will apply to all the funds in which you invest. |
| This report is submitted for general information to shareholders of the Voya mutual funds. It is not authorized for distribution to prospective shareholders unless accompanied or preceded by a prospectus which includes details regarding the funds’ investment objectives, risks, charges, expenses and other information. This information should be read carefully. |
| | |
| | |
| INVESTMENT MANAGEMENT voyainvestments.com | |
TABLE OF CONTENTS
| | 1 | |
| | 2 | |
| | 4 | |
| | 10 | |
| | 11 | |
| | 12 | |
| | 13 | |
| | 14 | |
| | 16 | |
| | 18 | |
| | 25 | |
| | 33 | |
| | 34 | |
| | 38 | |
PROXY VOTING INFORMATION
A description of the policies and procedures that the Portfolios use to determine how to vote proxies related to portfolio securities is available: (1) without charge, upon request, by calling Shareholder Services toll-free at (800) 992-0180; (2) on the Portfolios’ website at www.voyainvestments.com; and (3) on the U.S. Securities and Exchange Commission’s (“SEC’s”) website at www.sec.gov. Information regarding how the Portfolios voted proxies related to portfolio securities during the most recent 12-month period ended June 30 is available without charge on the Portfolios’ website at www.voyainvestments.com and on the SEC’s website at www.sec.gov.
QUARTERLY PORTFOLIO HOLDINGS
The Portfolios file their complete schedule of portfolio holdings with the SEC for the first and third quarters of each fiscal year on Form N-Q or Form N-PORT, available for filings after March 31, 2019. The Portfolios’ Form N-Q or Form N-PORT is available on the SEC’s website at www.sec.gov. The Portfolios’ complete schedule of portfolio holdings, as filed on Form N-Q or Form N-PORT, are available: on www.voyainvestments.com and without charge upon request from the Portfolio by calling Shareholder Services toll-free at (800) 992-0180.
(THIS PAGE INTENTIONALLY LEFT BLANK)
New season, last year’s plot
Dear Shareholder,
The financial markets delivered strong performance in 2019, and at this juncture, in our view, the outlook for 2020 seems upbeat. Thanks to supportive central bank policies around the world, global economic growth is reaccelerating; manufacturing activity, a key metric for setting market expectations, appears to be strengthening. Recent progress in the trade negotiations between China and the U.S. also helps brighten the outlook as 2020 gets underway.
So expect smooth sailing, right? Maybe. Barely into the first week of the new year, the world faced the prospect of escalating conflict in the Middle East, though tensions appear to have eased since then. Markets initially pulled back in response to heightened uncertainty but regrouped quickly. Follow-on events, if they occur, may not impact markets that much: during 2019, investors generally did well by downplaying geopolitical concerns, and we could see the same behavior in 2020.
Still, we believe that turbulence seems to be the world’s modus operandi: economic and market uncertainty are still with us, trade issues remain unresolved and the upcoming U.S. presidential election adds another dimension of political uncertainty. Even though market participants have become more comfortable accepting risk, we have observed persistent preferences for higher-quality, lower-volatility assets. This tells us that investors perceive significant risks they wish to avoid, and points to the potential for volatile reactions to adverse news.
With potential surprises from anywhere, we believe investors should continue to diversify their portfolios as broadly as practicable, and not attempt to time the markets. At the start of 2019, in our opinion, many investors did not believe U.S. equities offered attractive return potential — acting on that belief would have resulted in missed opportunities. Remember that your portfolio is structured to meet your long-term objectives; changing it in response to short-term market conditions may put your long-term goals at risk. If your goals have changed, please discuss them thoroughly with your investment advisor before making any changes to your portfolio.
Voya seeks to remain a reliable partner committed to reliable investing, helping you and your investment advisor achieve your goals. We appreciate your continued confidence in us, and we look forward to serving your investment needs in the future.
Sincerely,
Dina Santoro
President
Voya Family of Funds
January 21, 2020
The views expressed in the President’s Letter reflect those of the President as of the date of the letter. Any such views are subject to change at any time based upon market or other conditions and the Voya mutual funds disclaim any responsibility to update such views. These views may not be relied on as investment advice and because investment decisions for a Voya mutual fund are based on numerous factors, may not be relied on as an indication of investment intent on behalf of any Voya mutual fund. Reference to specific company securities should not be construed as recommendations or investment advice.
International investing poses special risks including currency fluctuation, economic and political risks not found in investments that are solely domestic.
1
MARKET PERSPECTIVE: YEAR ENDED DECEMBER 31, 2019 In our semi-annual report, we described how global equities, in the form of the MSCI World IndexSM (the “Index”) measured in local currencies, including net reinvested dividends, rose 16.69% for the half-year after a nervous start.
A trade war between the U.S. and China had been ongoing for more than a year, with U.S. tariffs on some $250 billion of Chinese goods in place together with Chinese tariffs on $110 billion of U.S. goods. The war was being waged against a backdrop of slowing global growth, in part the result of uncertainties caused by the trade war itself.
Fears on both fronts: the trade war and slowing global growth, would ebb and flow in the second half; yet the Index rose five months out of six, ending the year up 27.34%, just below the record set a few days earlier. (The Index returned 27.67% for the year ended December 31, 2019, measured in U.S. dollars.)
Entering May, trade talks had appeared to be going reasonably well and the path of least resistance for the Index still seemed upwards. This all changed when the President tweeted his intention to raise the existing 10% tariff on $200 billion of the $250 billion to 25% of Chinese goods. Trade negotiations had evidently broken down. Later he unexpectedly threatened tariffs on Mexican goods for reasons unrelated to trade.
On perceived slowing global growth, there was still plenty to worry about.
In Europe, manufacturing was in contraction. The euro zone’s annual growth in gross domestic product (“GDP”) in the second and third quarters of 2019 was just 1.2%. In the U.K., chronic disagreement about whether and how to leave the European Union (“Brexit”) culminated in a general election called for December.
Japan, with manufacturing also in contraction, managed GDP growth of 2.0% annualized in the second quarter, slipping to 1.8% in the third. Exports and imports were both falling and core inflation languished at 0.8%, with a demand-dampening sales tax increase effective on October 1.
China’s GDP grew at 6.0% in the third quarter, the smallest advance in 27 years. Industrial production was expanding near the slowest pace in 17 years, retail sales in 16 years.
In the U.S., manufacturing fell into contraction in September. Corporate profits were flat to falling year-over-year. While annualized first quarter growth had surprised to the upside at 3.1%, it fell to 2.0% and 2.1% in the second and third quarters, respectively. Growth was heavily dependent on consumer spending, supported by the lowest unemployment rate since 1969.
Back in the markets, after May’s slump, central banks came to the rescue in June. On June 19 the Federal Open Market Committee (“FOMC”) left rates unchanged, but markets heard Chairman Powell signal a cut in July. The European Central Bank announced its willingness to cut its already negative deposit rate and resume bond purchases. The Japanese government also promised increased stimulus. Plans for tariffs on Mexican imports were “indefinitely suspended”, and investors were finally left to cheer a truce in the U.S.-China trade conflict, agreed on June 29.
July was a comparatively quiet month. The FOMC duly cut the federal funds rate by 25 basis points (0.25%), but disappointed some, including the President, by referring to it as only a “mid-cycle adjustment”. And it was back to trade-war angst in August, as first the President announced 10% tariffs on the approximately $300 billion of Chinese imports as yet unaffected, and then
increased existing and planned tariffs by 5% when China retaliated.
The market rollercoaster lurched back up in September and October, when high-level trade talks between the U.S. and China resumed. Both sides expressed confidence that “Phase 1” of a deal was possible by year-end. The FOMC cut rates again in both months.
And as year-end approached, a more positive narrative was increasingly heard. Markets were rising despite trade tensions, sluggish global growth, declining profits and political uncertainties in the U.S. and elsewhere. Perhaps, some commentators ventured, this was a signal that the worst was over. The Phase 1 trade deal was announced, amid some skepticism on the details, as was agreement on USMCA, the replacement for NAFTA. The U.K. government’s emphatic election victory might offer more clarity on Brexit. Central banks were all supportive and some of the economic data were starting to improve.
In U.S. fixed income markets, the Treasury yield curve fell. For the year, the Bloomberg Barclays U.S. Aggregate Bond Index rose 8.72%. The Bloomberg Barclays Long-Term U.S. Treasury sub-index returned 14.83%, the 30-year yield briefly dipping below 2% in August. The 10-year yield on Japanese and some euro zone government bonds ended below zero.
U.S. equities, represented by the S&P 500® Index, including dividends, surged 31.49%. Technology was by far the top performer, up 50.29%, led by Apple and Microsoft. Energy, exposed to slowing global economic activity, was the weakest, but still rose 11.81%.
In currencies, the dollar rose 2.04% against the euro, but lost 3.80% against the pound and 0.97% against the yen. On a trade-weighted basis, according to Reuters, the dollar had the smallest annual move ever in 2019.
In international markets, the MSCI Japan® Index ended up 18.48% for the year, supported by the Bank of Japan’s purchases of exchange-traded funds, but pressured by Japan’s own vulnerability to a trade war. The MSCI Europe ex U.K.® Index advanced 26.43%, powered by capital goods and pharmaceuticals companies. The MSCI U.K.® Index rose 16.37%, dampened by Brexit concerns, but also affected by the company-specific fortunes of MSCI U.K.’s market heavyweights. Among the largest contributors were pharmaceuticals, AstraZeneca and GlaxoSmithKline; the biggest detractors were miner Glencore and HSBC.
All indices are unmanaged and investors cannot invest directly in an index. Past performance does not guarantee future results. The performance quoted represents past performance.
Investment return and principal value of an investment will fluctuate, and shares, when redeemed, may be worth more or less than their original cost. Each Portfolio’s performance is subject to change since the period’s end and may be lower or higher than the performance data shown. Please call (800) 336-0066 or log on to www.voyainvestments.com to obtain performance data current to the most recent month end.
Market Perspective reflects the views of Voya Investment Management’s Chief Investment Risk Officer only through the end of the period, and is subject to change based on market and other conditions.
2
BENCHMARK DESCRIPTIONS
| Index | | Description |
| Bloomberg Barclays U.S. Aggregate Bond Index | | An index of publicly issued investment grade U.S. government, mortgage-backed, asset-backed and corporate debt securities. |
Bloomberg Barclays Long-Term U.S.
Treasury Index | | This index measures the performance of U.S. Treasury bills with long-term maturity. The credit level for this index is investment grade. The rebalance scheme is monthly. |
MSCI Europe, Australasia and Far East®
(“MSCI EAFE”) Index | | An index that measures the performance of securities listed on exchanges in Europe, Australasia and the Far East. It includes the reinvestment of dividends net of withholding taxes, but does not reflect fees, brokerage commissions or other expenses of investing. |
MSCI Europe ex UK® Index | | A free float-adjusted market capitalization index that is designed to measure developed market equity performance in Europe, excluding the UK. |
MSCI Japan® Index | | A free float-adjusted market capitalization index that is designed to measure developed market equity performance in Japan. |
MSCI U.K.® Index | | A free float-adjusted market capitalization index that is designed to measure developed market equity performance in the UK. |
MSCI World IndexSM | | An index that measures the performance of over 1,600 securities listed on exchanges in the U.S., Europe, Canada, Australia, New Zealand and the Far East. |
Russell 3000® Index | | An index that measures the performance of the largest 3000 U.S. companies representing approximately 98% of the investable U.S. equity market. |
S&P 500® Index | | An index that measures the performance of securities of approximately 500 large-capitalization companies whose securities are traded on major U.S. stock markets. |
S&P Target Risk® Aggressive Index* | | Seeks to emphasize exposure to equity securities, maximizing opportunities for long-term capital accumulation. It may include small allocations in fixed-income securities to enhance portfolio efficiency. |
S&P Target Risk® Conservative Index* | | Seeks to emphasize exposure to fixed income securities in order to produce a current income stream and avoid excessive volatility of returns. Equity securities are included to protect long-term purchasing power. |
S&P Target Risk® Growth Index* | | Seeks to measure the performance of an asset allocation strategy targeted to a growth focused risk profile. |
S&P Target Risk® Moderate Index* | | Seeks to measure the performance of an asset allocation strategy targeted to a moderate risk profile. |
| * | | Total return and gross index returns are presented. Index returns include the reinvestment of dividends and distributions. Gross index returns reflect the addition of an amount estimated by the index sponsor to approximate the fees incurred by index components. |
3
| VOYA RETIREMENT PORTFOLIOS | PORTFOLIO MANAGERS’ REPORT |
| | |
Voya Retirement Portfolios consist of Voya Retirement Conservative Portfolio, Voya Retirement Growth Portfolio, Voya Retirement Moderate Portfolio and Voya Retirement Moderate Growth Portfolio (each a “Portfolio” or collectively, the “Portfolios” or the “Retirement Portfolios”). Each Portfolio seeks to achieve its investment objective by investing in a combination of underlying funds which are actively managed funds or passively managed funds (index funds).(1) The Portfolios are managed by Halvard Kvaale, CIMA, Paul Zemsky, CFA, and Barbara Reinhard, CFA, Portfolio Managers of Voya Investment Management Co. LLC (“Voya IM”) — the Sub-Adviser (“Sub-Adviser).*
Portfolio Specifics: Over the reporting period, the Portfolios met their performance objectives by minimizing performance deviation relative to their strategic asset allocation benchmarks. Due to the strategic nature of the Portfolios, no tactical asset allocation moves were made during the period. As part of the annual review, we made changes to the strategic asset allocations at the end of June. Strategic changes included increasing emerging market equities and core fixed income, and decreasing developed international equities and Treasury inflation-protected securities (“TIPS”) in the Voya Retirement Conservative Portfolio.
In addition, we increased U.S. large-capitalization equities and TIPS, funded by lowered allocations to domestic mid- and small-cap equities, developed international and emerging market equities, as well as core fixed income in the Voya Retirement Growth Portfolio, the Voya Retirement Moderate Growth and the Voya Retirement Moderate Portfolio.
The underlying index funds performed as expected, minimizing performance deviation relative to their respective strategic allocation benchmarks, before the deduction of fees.
Current Strategy and Outlook: Our overarching investment thesis continues to be that the global growth slowdown ex-United States, which began in 2018, is abating. Policy responses from the U.S. Federal Reserve Board (“Fed”) and other central banks around the world are starting to feed through to the real economy. Dubbed as “insurance” cuts, the Fed moves are bearing fruit: inflation is ticking up towards the Fed’s 2% target, confidence has been revived and economic activity is increasing.
Reaccelerating economic growth is a global phenomenon and we think global equities are at an inflection point. Growth is turning, but our research suggests that it has not been fully incorporated into asset prices. We see light institutional equity positioning and relatively weak mutual fund flows. Market breadth is encouraging, with approximately 80% of all industry groups in uptrends. Additionally, we believe that liquidity is abundant and is flowing through raw materials prices, which are rising.
Even with the exceptional returns produced by stocks in 2019, we maintain our overweight to equity with a preference for U.S. large caps, where promising fundamentals outweigh valuations above historical averages. We expect U.S. stocks, which are dominated by technology companies, to outperform EAFE stocks, which are heavily weighted in financials. We have become more sanguine on international stocks overall, but prefer emerging to developed market equities.
We believe the quieting of trade tensions is helping developing countries. China manufacturing PMIs are looking up, as modest stimulus measures initiated at the beginning of 2019 start to take effect. In a sign of commitment to keep the momentum of industrial improvement going, the People’s Bank of China announced it will cut banks’ reserve requirement ratio. Barring an abrupt, significant and sustained change in the economic data, we think U.S. monetary policy is unlikely to change any time soon. Therefore, a stable to slightly weaker U.S. dollar should serve as an additional tailwind for China and other export oriented or dollar debt leveraged emerging market countries.
As always, risks to our outlook are manifold. Perhaps the most concerning, in our view, are those of a geopolitical nature. In recognition of our limited visibility on that front, we remain overweight investment grade bonds within our multi-asset portfolios. While geopolitically induced volatility could derail our forecast, such events and their impacts on the markets are nearly impossible to predict. We think there is a higher probability that markets will be driven by fundamentals, which are solid.
| * | | Each Portfolio’s relative performance versus its respective benchmarks can be found on page 5. |
| | | |
| (1) | | The investment objective of each Portfolio is described in the Portfolios’ prospectuses, each dated May 1, 2019. |
The views expressed in this commentary are informed opinions. They should not be considered promises or advice. The views expressed reflect those of the portfolio managers, only through the end of the period as stated on the cover. The portfolio managers’ views are subject to change at any time based on market and other conditions.
Portfolio holdings and characteristics are subject to change and may not be representative of current holdings and characteristics. Portfolio holdings are subject to change daily. The outlook for this Portfolio may differ from that presented for other Voya mutual funds. This report contains statements that may be “forward-looking” statements. Actual results may differ materially from those projected in the “forward-looking” statements. The Portfolio’s performance returns shown reflect applicable fee waivers and/or expense limits in effect during this period. Absent such fee waivers/expense limitations, if any, performance would have been lower. Performance for the different classes of shares will vary based on differences in fees associated with each class. An index has no cash in its portfolio and imposes no sales charges. An investor cannot invest directly in an index.
4
| PORTFOLIO MANAGERS’ REPORT | VOYA RETIREMENT PORTFOLIOS |
| | |
| Total Returns for the Period Ended December 31, 2019 |
|---|
| | 1 Year | |
|---|
| Voya Retirement Conservative Portfolio, Class I | | | 13.81 | % | |
S&P Target Risk® Conservative Index Total Return | | | 13.99 | % | |
| Voya Retirement Growth Portfolio, Class I | | | 22.09 | % | |
S&P Target Risk Aggressive® Index Total Return | | | 22.79 | % | |
Russell 3000® Index | | | 31.02 | % | |
MSCI EAFE® Index | | | 22.01 | % | |
| Bloomberg Barclays U.S. Aggregate Bond (“BCAB”) Index | | | 8.72 | % | |
| Voya Retirement Moderate Portfolio, Class I | | | 17.56 | % | |
S&P Target Risk® Moderate Index Total Return | | | 15.71 | % | |
Russell 3000® Index | | | 31.02 | % | |
MSCI EAFE® Index | | | 22.01 | % | |
| BCAB Index | | | 8.72 | % | |
| Voya Retirement Moderate Growth Portfolio, Class I | | | 20.40 | % | |
S&P Target Risk® Growth Index Total Return | | | 19.20 | % | |
Russell 3000® Index | | | 31.02 | % | |
MSCI EAFE® Index | | | 22.01 | % | |
| BCAB Index | | | 8.72 | % | |
Target Allocations as of 12/31/19
(as a percentage of net assets)(1) |
|---|
| Sub Asset Class | | | | Conservative | | Growth | | Moderate | | Moderate
Growth |
|---|
| U.S. Large Blend | | | | | 20.0 | % | | | 43.0 | % | | | 33.0 | % | | | 43.0 | % |
| U.S. Mid Cap Blend | | | | | 3.0 | % | | | 8.0 | % | | | 4.0 | % | | | 5.0 | % |
| U.S. Small Cap | | | | | 0.0 | % | | | 5.0 | % | | | 2.0 | % | | | 3.0 | % |
| International | | | | | 4.0 | % | | | 13.0 | % | | | 7.0 | % | | | 9.0 | % |
| Emerging Markets | | | | | 3.0 | % | | | 6.0 | % | | | 4.0 | % | | | 5.0 | % |
| Core Fixed Income | | | | | 61.0 | % | | | 21.0 | % | | | 41.0 | % | | | 29.0 | % |
| TIPS | | | | | 9.0 | % | | | 4.0 | % | | | 9.0 | % | | | 6.0 | % |
| Total Equity | | | | | 30.0 | % | | | 75.0 | % | | | 50.0 | % | | | 65.0 | % |
| Total Fixed Income | | | | | 70.0 | % | | | 25.0 | % | | | 50.0 | % | | | 35.0 | % |
| | | | | | 100.0 | % | | | 100.0 | % | | | 100.0 | % | | | 100.0 | % |
| | | | | | | | | | | | | | | | | | | |
(1) | | As these are target allocations, the actual allocations of each Portfolio’s assets may deviate from the percentages shown. Although the Retirement Portfolios expect to be fully invested at all times, they may maintain liquidity reserves to meet redemption requests. |
Portfolio holdings are subject to change.
5
| VOYA RETIREMENT CONSERVATIVE PORTFOLIO | PORTFOLIO MANAGERS’ REPORT |
| | |
| | Average Annual Total Returns for the Periods Ended December 31, 2019 | |
|---|
| | | | 1 Year | | 5 Year | | 10 Year | |
|---|
| | Class ADV | | | 13.61 | % | | | 4.33 | % | | | 5.28 | % | |
| | Class I | | | 13.81 | % | | | 4.50 | % | | | 5.50 | % | |
| | S&P Target Risk® Conservative Index Total Return | | | 13.99 | % | | | 4.84 | % | | | 5.31 | % | |
| | S&P Target Risk® Conservative Index Gross | | | 14.27 | % | | | 5.10 | % | | | 5.57 | % | |
Based on a $10,000 initial investment, the graph and table above illustrate the total return of the Voya Retirement Conservative Portfolio against the indices indicated. An index is unmanaged and has no cash in its portfolio and imposes no sales charges. An investor cannot invest directly in an index.
The Portfolio’s performance is shown without the imposition of any expenses or charges which are, or may be, imposed under your variable annuity contract or variable life insurance policy. Total returns would have been lower if such expenses or charges were included.
The performance graph and table do not reflect the deduction of taxes that a shareholder will pay on Portfolio distributions or the redemption of Portfolio shares.
The performance shown may include the effect of fee waivers and/or expense reimbursements by the Investment Adviser and/or other service providers, which have the effect of increasing total return. Had all fees and expenses been considered, the total returns would have been lower.
The performance update illustrates performance for a variable investment option available through a variable annuity contract or a
variable life insurance policy. The performance shown indicates past performance and is not a projection or prediction of future results. Actual investment returns and principal value will fluctuate so that shares and/or units, at redemption, may be worth more or less than their original cost. Please log on to www.voyainvestments.com or call (800) 366-0066 to get performance through the most recent month end.
Portfolio holdings are subject to change daily.
Effective May 1, 2019, the Adviser changed the primary benchmark from the S&P Target Risk® Conservative Index Gross (“Gross Index”) to the S&P Target Risk® Conservative Index Total Return as the Adviser believes it more accurately reflects the investment experience of an investor in the benchmark’s components. Index returns include the reinvestment of dividends and distributions. Gross index returns reflect the addition of an amount estimated by the index sponsor to approximate the fees incurred by index components.
6
| PORTFOLIO MANAGERS’ REPORT | VOYA RETIREMENT GROWTH PORTFOLIO |
| | |
| | Average Annual Total Returns for the Periods Ended December 31, 2019 | |
|---|
| | | | 1 Year | | 5 Year | | 10 Year | |
|---|
| | Class ADV | | | 21.55 | % | | | 6.64 | % | | | 7.94 | % | |
| | Class I | | | 22.09 | % | | | 7.10 | % | | | 8.41 | % | |
| | S&P Target Risk Aggressive® Index Total Return | | | 22.79 | % | | | 7.79 | % | | | 9.64 | % | |
| | S&P Target Risk Aggressive® Index Gross | | | 23.09 | % | | | 8.06 | % | | | 9.92 | % | |
| | Russell 3000® Index | | | 31.02 | % | | | 11.24 | % | | | 13.42 | % | |
| | MSCI EAFE® Index | | | 22.01 | % | | | 5.67 | % | | | 5.50 | % | |
| | BCAB Index | | | 8.72 | % | | | 3.05 | % | | | 3.75 | % | |
Based on a $10,000 initial investment, the graph and table above illustrate the total return of the Voya Retirement Growth Portfolio against the indices indicated. An index is unmanaged and has no cash in its portfolio and imposes no sales charges. An investor cannot invest directly in an index.
The Portfolio’s performance is shown without the imposition of any expenses or charges which are, or may be, imposed under your variable annuity contract or variable life insurance policy. Total returns would have been lower if such expenses or charges were included.
The performance graph and table do not reflect the deduction of taxes that a shareholder will pay on Portfolio distributions or the redemption of Portfolio shares.
The performance shown may include the effect of fee waivers and/or expense reimbursements by the Investment Adviser and/or other service providers, which have the effect of increasing total return. Had all fees and expenses been considered, the total returns would have been lower.
The performance update illustrates performance for a variable investment option available through a variable annuity contract or a
variable life insurance policy. The performance shown indicates past performance and is not a projection or prediction of future results. Actual investment returns and principal value will fluctuate so that shares and/or units, at redemption, may be worth more or less than their original cost. Please log on to www.voyainvestments.com or call (800) 366-0066 to get performance through the most recent month end.
Portfolio holdings are subject to change daily.
Effective May 1, 2019, the Adviser changed the primary benchmark from the S&P Target Risk Aggressive® Index Gross (“Gross Index”) to the S&P Target Risk Aggressive® Index Total Return as the Adviser believes it more accurately reflects the investment experience of an investor in the benchmark’s components. Index returns include the reinvestment of dividends and distributions. Gross index returns reflect the addition of an amount estimated by the index sponsor to approximate the fees incurred by index components.
7
| VOYA RETIREMENT MODERATE PORTFOLIO | PORTFOLIO MANAGERS’ REPORT |
| | |
| | Average Annual Total Returns for the Periods Ended December 31, 2019 | |
|---|
| | | | 1 Year | | 5 Year | | 10 Year | |
|---|
| | Class ADV | | | 17.14 | % | | | 5.30 | % | | | 6.34 | % | |
| | Class I | | | 17.56 | % | | | 5.66 | % | | | 6.70 | % | |
| | S&P Target Risk® Moderate Index Total Return | | | 15.71 | % | | | 5.44 | % | | | 6.10 | % | |
| | S&P Target Risk® Moderate Index Gross | | | 16.00 | % | | | 5.70 | % | | | 6.36 | % | |
| | Russell 3000® Index | | | 31.02 | % | | | 11.24 | % | | | 13.42 | % | |
| | MSCI EAFE® Index | | | 22.01 | % | | | 5.67 | % | | | 5.50 | % | |
| | BCAB Index | | | 8.72 | % | | | 3.05 | % | | | 3.75 | % | |
Based on a $10,000 initial investment, the graph and table above illustrate the total return of the Voya Retirement Moderate Portfolio against the indices indicated. An index is unmanaged and has no cash in its portfolio and imposes no sales charges. An investor cannot invest directly in an index.
The Portfolio’s performance is shown without the imposition of any expenses or charges which are, or may be, imposed under your variable annuity contract or variable life insurance policy. Total returns would have been lower if such expenses or charges were included.
The performance graph and table do not reflect the deduction of taxes that a shareholder will pay on Portfolio distributions or the redemption of Portfolio shares.
The performance shown may include the effect of fee waivers and/or expense reimbursements by the Investment Adviser and/or other service providers, which have the effect of increasing total return. Had all fees and expenses been considered, the total returns would have been lower.
The performance update illustrates performance for a variable investment option available through a variable annuity contract or a
variable life insurance policy. The performance shown indicates past performance and is not a projection or prediction of future results. Actual investment returns and principal value will fluctuate so that shares and/or units, at redemption, may be worth more or less than their original cost. Please log on to www.voyainvestments.com or call (800) 366-0066 to get performance through the most recent month end.
Portfolio holdings are subject to change daily.
Effective May 1, 2019, the Adviser changed the primary benchmark from the S&P Target Risk® Moderate Index Gross (“Gross Index”) to the S&P Target Risk® Moderate Index Total Return as the Adviser believes it more accurately reflects the investment experience of an investor in the benchmark’s components. Index returns include the reinvestment of dividends and distributions. Gross index returns reflect the addition of an amount estimated by the index sponsor to approximate the fees incurred by index components.
8
| PORTFOLIO MANAGERS’ REPORT | VOYA RETIREMENT MODERATE
GROWTH PORTFOLIO |
| | |
| | Average Annual Total Returns for the Periods Ended December 31, 2019 | |
|---|
| | | | 1 Year | | 5 Year | | 10 Year | |
|---|
| | Class ADV | | | 20.02 | % | | | 6.25 | % | | | 7.46 | % | |
| | Class I | | | 20.40 | % | | | 6.66 | % | | | 7.87 | % | |
| | S&P Target Risk® Growth Index Total Return | | | 19.20 | % | | | 6.63 | % | | | 7.87 | % | |
| | S&P Target Risk® Growth Index Gross | | | 19.50 | % | | | 6.90 | % | | | 8.14 | % | |
| | Russell 3000® Index | | | 31.02 | % | | | 11.24 | % | | | 13.42 | % | |
| | MSCI EAFE® Index | | | 22.01 | % | | | 5.67 | % | | | 5.50 | % | |
| | BCAB Index | | | 8.72 | % | | | 3.05 | % | | | 3.75 | % | |
Based on a $10,000 initial investment, the graph and table above illustrate the total return of the Voya Retirement Moderate Growth Portfolio against the indices indicated. An index is unmanaged and has no cash in its portfolio and imposes no sales charges. An investor cannot invest directly in an index.
The Portfolio’s performance is shown without the imposition of any expenses or charges which are, or may be, imposed under your variable annuity contract or variable life insurance policy. Total returns would have been lower if such expenses or charges were included.
The performance graph and table do not reflect the deduction of taxes that a shareholder will pay on Portfolio distributions or the redemption of Portfolio shares.
The performance shown may include the effect of fee waivers and/or expense reimbursements by the Investment Adviser and/or other service providers, which have the effect of increasing total return. Had all fees and expenses been considered, the total returns would have been lower.
The performance update illustrates performance for a variable investment option available through a variable annuity contract or a variable life insurance policy. The performance shown indicates past performance and is not a projection or prediction of future results. Actual investment returns and principal value will fluctuate
so that shares and/or units, at redemption, may be worth more or less than their original cost. Please log on to www.voyainvestments.com or call (800) 366-0066 to get performance through the most recent month end.
This report contains statements that may be “forward-looking” statements. Actual results may differ materially from those projected in the “forward-looking” statements.
The views expressed in this report reflect those of the portfolio managers, only through the end of the period as stated on the cover. The portfolio managers’ views are subject to change at any time based on market and other conditions.
Portfolio holdings are subject to change daily.
Effective May 1, 2019, the Adviser changed the primary benchmark from the S&P Target Risk® Growth Index Gross (“Gross Index”) to the S&P Target Risk® Growth Index Total Return as the Adviser believes it more accurately reflects the investment experience of an investor in the benchmark’s components. Index returns include the reinvestment of dividends and distributions. Gross index returns reflect the addition of an amount estimated by the index sponsor to approximate the fees incurred by index components.
9
SHAREHOLDER EXPENSE EXAMPLES (UNAUDITED) As a shareholder of a Portfolio, you incur two types of costs: (1) transaction costs, including redemption fees and exchange fees; and (2) ongoing costs, including management fees, distribution and/or service (12b-1) fees, and other Portfolio expenses. These Examples are intended to help you understand your ongoing costs (in dollars) of investing in a Portfolio and to compare these costs with the ongoing costs of investing in other mutual funds.
The Examples are based on an investment of $1,000 invested at the beginning of the period and held for the entire period from July 1, 2019 to December 31, 2019. The Portfolios’ expenses are shown without the imposition of any charges which are, or may be, imposed under your variable annuity contract, variable life insurance policy, qualified pension or retirement plan. Expenses would have been higher if such charges were included.
Actual Expenses
The left section of the table shown below, “Actual Portfolio Return,” provides information about actual account values and actual expenses. You may use the information in this section, together with the amount you invested, to estimate the expenses that you paid over the period. Simply divide your account value by $1,000 (for example, an $8,600 account value divided by $1,000 = 8.6), then multiply the result by the number in the first section under the heading entitled “Expenses Paid During the Period” to estimate the expenses you paid on your account during this period.
Hypothetical Example for Comparison Purposes
The right section of the table shown below, “Hypothetical (5% return before expenses),” provides information about hypothetical account values and hypothetical expenses based on a Portfolio’s actual expense ratio and an assumed rate of return of 5% per year before expenses, which is not a Portfolio’s actual return. The hypothetical account values and expenses may not be used to estimate the actual ending account balance or expenses you paid for the period. You may use this information to compare the ongoing costs of investing in a Portfolio and other mutual funds. To do so, compare this 5% hypothetical example with the 5% hypothetical examples that appear in the shareholder reports of the other mutual funds.
Please note that the expenses shown in the table are meant to highlight your ongoing costs only and do not reflect any transactional costs, such as redemption fees or exchange fees. Therefore, the hypothetical section of the table is useful in comparing ongoing costs only, and will not help you determine the relative total costs of owning different mutual funds. In addition, if these transactional costs were included, your costs would have been higher.
| | | | Actual Portfolio Return | | Hypothetical (5% return before expenses) | |
|---|
| | | | Beginning
Account
Value
July 1,
2019 | | Ending
Account
Value
December 31,
2019 | | Annualized
Expense
Ratio* | | Expenses Paid
During the
Period Ended
December 31,
2019** | | Beginning
Account
Value
July 1,
2019 | | Ending
Account
Value
December 31,
2019 | | Annualized
Expense
Ratio* | | Expenses Paid
During the
Period Ended
December 31,
2019** | |
|---|
| | Voya Retirement Conservative Portfolio |
| | Class ADV | | $ | 1,000.00 | | | $ | 1,042.40 | | | | 0.53 | % | | $ | 2.73 | | | $ | 1,000.00 | | | $ | 1,022.53 | | | | 0.53 | % | | $ | 2.70 | | |
| | Class I | | | 1,000.00 | | | | 1,043.30 | | | | 0.28 | | | | 1.44 | | | $ | 1,000.00 | | | | 1,023.79 | | | | 0.28 | | | | 1.43 | | |
| | Voya Retirement Growth Portfolio |
| | Class ADV | | $ | 1,000.00 | | | $ | 1,070.50 | | | | 0.68 | % | | $ | 3.55 | | | $ | 1,000.00 | | | $ | 1,021.78 | | | | 0.68 | % | | $ | 3.47 | | |
| | Class I | | | 1,000.00 | | | | 1,072.80 | | | | 0.26 | | | | 1.36 | | | | 1,000.00 | | | | 1,023.89 | | | | 0.26 | | | | 1.33 | | |
| | Voya Retirement Moderate Portfolio |
| | Class ADV | | $ | 1,000.00 | | | $ | 1,055.90 | | | | 0.61 | % | | $ | 3.16 | | | $ | 1,000.00 | | | $ | 1,022.13 | | | | 0.61 | % | | $ | 3.11 | | |
| | Class I | | | 1,000.00 | | | | 1,057.40 | | | | 0.27 | | | | 1.40 | | | | 1,000.00 | | | | 1,023.84 | | | | 0.27 | | | | 1.38 | | |
| | Voya Retirement Moderate Growth Portfolio |
| | Class ADV | | $ | 1,000.00 | | | $ | 1,066.10 | | | | 0.65 | % | | $ | 3.39 | | | $ | 1,000.00 | | | $ | 1,021.93 | | | | 0.65 | % | | $ | 3.31 | | |
| | Class I | | | 1,000.00 | | | | 1,068.70 | | | | 0.26 | | | | 1.36 | | | | 1,000.00 | | | | 1,023.89 | | | | 0.26 | | | | 1.33 | | |
| * | | The annualized expense ratios do not include expenses of the underlying funds. |
| ** | | Expenses are equal to each Portfolios’ respective annualized expense ratios multiplied by the average account value over the period, multiplied by 184/365 to reflect the most recent fiscal half-year. |
10
REPORT OF INDEPENDENT REGISTERED PUBLIC ACCOUNTING FIRM To the Shareholders of the Funds and Board of Trustees
Voya Investors Trust:
Opinion on the Financial Statements
We have audited the accompanying statements of assets and liabilities of Voya Retirement Conservative Portfolio, Voya Retirement Growth Portfolio, Voya Retirement Moderate Portfolio, and Voya Retirement Moderate Growth Portfolio (the Funds), each a series of Voya Investors Trust, including the portfolios of investments, as of December 31, 2019, the related statements of operations for the year then ended, the statements of changes in net assets for each of the years in the twoyear period then ended, and the related notes (collectively, the financial statements) and the financial highlights for each of the years in the five-year period then ended. In our opinion, the financial statements and financial highlights present fairly, in all material respects, the financial position of the Funds as of December 31, 2019, the results of their operations for the year then ended, the changes in their net assets for each of the years in the two-year period then ended, and the financial highlights for each of the years in the five-year period then ended, in conformity with U.S. generally accepted accounting principles.
Basis for Opinion
These financial statements and financial highlights are the responsibility of the Funds’ management. Our responsibility is to express an opinion on these financial statements and financial highlights based on our audits. We are a public accounting firm registered with the Public Company Accounting Oversight Board (United States) (PCAOB) and are required to be independent with respect to the Funds in accordance with the U.S. federal securities laws and the applicable rules and regulations of the Securities and Exchange Commission and the PCAOB.
We conducted our audits in accordance with the standards of the PCAOB. Those standards require that we plan and perform the audit to obtain reasonable assurance about whether the financial statements and financial highlights are free of material misstatement, whether due to error or fraud. Our audits included performing procedures to assess the risks of material misstatement of the financial statements and financial highlights, whether due to error or fraud, and performing procedures that respond to those risks. Such procedures included examining, on a test basis, evidence regarding the amounts and disclosures in the financial statements and financial highlights. Such procedures also included confirmation of securities owned as of December 31, 2019, by correspondence with the custodian, transfer agent and brokers or by other appropriate auditing procedures when replies from brokers were not received. Our audits also included evaluating the accounting principles used and significant estimates made by management, as well as evaluating the overall presentation of the financial statements and financial highlights. We believe that our audits provide a reasonable basis for our opinion.
We have served as the auditor of one or more Voya investment companies since 1975.
Boston, Massachusetts
February 26, 2020
11
STATEMENTS OF ASSETS AND LIABILITIES AS OF DECEMBER 31, 2019 | | Voya
Retirement
Conservative
Portfolio | | Voya
Retirement
Growth
Portfolio | | Voya
Retirement
Moderate
Portfolio | | Voya
Retirement
Moderate
Growth
Portfolio |
|---|
ASSETS: | | | | | | | | | | | | | | | | | | | | |
| Investments in affiliated underlying funds at fair value* | | | $ | 386,415,195 | | | | $ | 2,497,652,385 | | | | $ | 936,891,643 | | | | $ | 1,683,679,759 | |
| Investments in unaffiliated underlying funds at fair value** | | | | 37,908,178 | | | | | 103,634,316 | | | | | 92,031,112 | | | | | 106,739,056 | |
| Cash | | | | 826,016 | | | | | 2,346,759 | | | | | 1,920,001 | | | | | 1,026,992 | |
| Receivables: | | | | | | | | | | | | | | | | | | | | |
| Investments in affiliated underlying funds sold | | | | — | | | | | 2,669,179 | | | | | 288,471 | | | | | 1,914,678 | |
| Fund shares sold | | | | 1,360,969 | | | | | 125,498 | | | | | 30,741 | | | | | 5,830 | |
| Interest | | | | 497 | | | | | 1,186 | | | | | 1,164 | | | | | 1,440 | |
| Prepaid expenses | | | | 2,978 | | | | | 18,622 | | | | | 7,206 | | | | | 12,759 | |
| Other assets | | | | 16,976 | | | | | 155,502 | | | | | 57,453 | | | | | 103,919 | |
| Total assets | | | | 426,530,809 | | | | | 2,606,603,447 | | | | | 1,031,227,791 | | | | | 1,793,484,433 | |
LIABILITIES: | | | | | | | | | | | | | | | | | | | | |
| Payable for investments in affiliated underlying funds purchased | | | | 1,350,710 | | | | | — | | | | | — | | | | | — | |
| Payable for fund shares redeemed | | | | 10,193 | | | | | 2,794,677 | | | | | 319,213 | | | | | 614,449 | |
| Payable for investment management fees | | | | 131,959 | | | | | 553,835 | | | | | 271,144 | | | | | 383,780 | |
| Payable for distribution and shareholder service fees | | | | 90,354 | | | | | 921,458 | | | | | 291,646 | | | | | 583,794 | |
| Payable to trustees under the deferred compensation plan (Note 6) | | | | 16,976 | | | | | 155,502 | | | | | 57,453 | | | | | 103,919 | |
| Payable for trustee fees | | | | 2,094 | | | | | 13,024 | | | | | 5,118 | | | | | 8,977 | |
| Other accrued expenses and liabilities | | | | 49,499 | | | | | 276,905 | | | | | 114,644 | | | | | 209,476 | |
| Total liabilities | | | | 1,651,785 | | | | | 4,715,401 | | | | | 1,059,218 | | | | | 1,904,395 | |
NET ASSETS | | | $ | 424,879,024 | | | | $ | 2,601,888,046 | | | | $ | 1,030,168,573 | | | | $ | 1,791,580,038 | |
NET ASSETS WERE COMPRISED OF: | | | | | | | | | | | | | | | | | | | | |
| Paid-in capital | | | $ | 349,382,124 | | | | $ | 2,254,488,547 | | | | $ | 922,913,932 | | | | $ | 1,570,469,600 | |
| Total distributable earnings | | | | 75,496,900 | | | | | 347,399,499 | | | | | 107,254,641 | | | | | 221,110,438 | |
NET ASSETS | | | $ | 424,879,024 | | | | $ | 2,601,888,046 | | | | $ | 1,030,168,573 | | | | $ | 1,791,580,038 | |
| | | | | | | | | | | | | | | | | | | | | |
|
| * | Cost of investments in affiliated underlying funds | | | $ | 327,602,735 | | | | $ | 2,285,295,759 | | | | $ | 874,751,639 | | | | $ | 1,554,400,215 | |
| ** | Cost of investments in unaffiliated underlying funds | | | $ | 35,780,067 | | | | $ | 103,127,551 | | | | $ | 88,583,315 | | | | $ | 106,208,370 | |
Class ADV | | | | | | | | | | | | | | | | | | | | |
| Net assets | | | $ | 424,756,012 | | | | $ | 2,553,927,291 | | | | $ | 1,008,727,310 | | | | $ | 1,769,059,786 | |
| Shares authorized | | | | unlimited | | | | | unlimited | | | | | unlimited | | | | | unlimited | |
| Par value | | | $ | 0.001 | | | | $ | 0.001 | | | | $ | 0.001 | | | | $ | 0.001 | |
| Shares outstanding | | | | 45,645,220 | | | | | 196,470,613 | | | | | 87,325,351 | | | | | 146,231,171 | |
| Net asset value and redemption price per share | | | $ | 9.31 | | | | $ | 13.00 | | | | $ | 11.55 | | | | $ | 12.10 | |
| | | | | | | | | | | | | | | | | | |
Class I | | | | | | | | | | | | | | | | | | | | |
| Net assets | | | $ | 123,012 | | | | $ | 47,960,755 | | | | $ | 21,441,263 | | | | $ | 22,520,252 | |
| Shares authorized | | | | unlimited | | | | | unlimited | | | | | unlimited | | | | | unlimited | |
| Par value | | | $ | 0.001 | | | | $ | 0.001 | | | | $ | 0.001 | | | | $ | 0.001 | |
| Shares outstanding | | | | 13,014 | | | | | 3,667,374 | | | | | 1,832,941 | | | | | 1,876,848 | |
| Net asset value and redemption price per share | | | $ | 9.45 | | | | $ | 13.08 | | | | $ | 11.70 | | | | $ | 12.00 | |
See Accompanying Notes to Financial Statements
12
STATEMENTS OF OPERATIONS FOR THE YEAR ENDED DECEMBER 31, 2019 | | Voya
Retirement
Conservative
Portfolio | | Voya
Retirement
Growth
Portfolio | | Voya
Retirement
Moderate
Portfolio | | Voya
Retirement
Moderate
Growth
Portfolio |
INVESTMENT INCOME: | | | | | | | | | | | | | | | | | | | | |
| Dividends from affiliated underlying funds | | | $ | 9,041,767 | | | | $ | 69,307,907 | | | | $ | 24,567,115 | | | | $ | 45,539,120 | |
| Dividends from unaffiliated underlying funds | | | | 829,932 | | | | | 1,701,490 | | | | | 1,744,289 | | | | | 1,756,852 | |
| Interest | | | | 1,168 | | | | | 1,186 | | | | | 1,164 | | | | | 1,440 | |
| Total investment income | | | | 9,872,867 | | | | | 71,010,583 | | | | | 26,312,568 | | | | | 47,297,412 | |
| | | | | | | | | | | | | | | | | | |
EXPENSES: | | | | | | | | | | | | | | | | | | | | |
| Investment management fees | | | | 1,093,818 | | | | | 6,313,734 | | | | | 2,586,242 | | | | | 4,370,128 | |
| Distribution and shareholder service fees: | | | | | | | | | | | | | | | | | | | | |
| Class ADV | | | | 2,093,827 | | | | | 12,784,223 | | | | | 5,021,476 | | | | | 8,868,846 | |
| Transfer agent fees | | | | 518 | | | | | 2,036 | | | | | 1,154 | | | | | 1,920 | |
| Shareholder reporting expense | | | | 11,214 | | | | | 46,043 | | | | | 13,425 | | | | | 21,540 | |
| Professional fees | | | | 21,111 | | | | | 100,318 | | | | | 39,130 | | | | | 75,519 | |
| Custody and accounting expense | | | | 29,392 | | | | | 133,786 | | | | | 44,042 | | | | | 84,506 | |
| Trustee fees | | | | 16,754 | | | | | 104,196 | | | | | 40,947 | | | | | 71,817 | |
| Miscellaneous expense | | | | 18,077 | | | | | 83,294 | | | | | 32,624 | | | | | 59,135 | |
| | | | | | | | | | | | | | | | | | |
| Interest expense | | | | 256 | | | | | 571 | | | | | 593 | | | | | 217 | |
| Total expenses | | | | 3,284,967 | | | | | 19,568,201 | | | | | 7,779,633 | | | | | 13,553,628 | |
| Waived and reimbursed fees | | | | (1,038,537 | ) | | | | (1,920,163 | ) | | | | (1,593,804 | ) | | | | (1,961,769 | ) |
| Net expenses | | | | 2,246,430 | | | | | 17,648,038 | | | | | 6,185,829 | | | | | 11,591,859 | |
| Net investment income | | | | 7,626,437 | | | | | 53,362,545 | | | | | 20,126,739 | | | | | 35,705,553 | |
REALIZED AND UNREALIZED GAIN (LOSS): | | | | | | | | | | | | | | | | | | | | |
| Net realized gain (loss) on: | | | | | | | | | | | | | | | | | | | | |
| Sale of affiliated underlying funds | | | | 2,301,189 | | | | | (7,089,670 | ) | | | | 4,699,626 | | | | | 10,340,599 | |
| Sale of unaffiliated underlying funds | | | | 915,338 | | | | | 67,181 | | | | | 323,019 | | | | | 62,150 | |
| Capital gain distributions from affiliated underlying funds | | | | 7,604,013 | | | | | 140,591,273 | | | | | 35,341,781 | | | | | 82,348,370 | |
| Net realized gain | | | | 10,820,540 | | | | | 133,568,784 | | | | | 40,364,426 | | | | | 92,751,119 | |
| Net change in unrealized appreciation (depreciation) on: | | | | | | | | | | | | | | | | | | | | |
| Affiliated underlying funds | | | | 32,370,496 | | | | | 318,737,427 | | | | | 96,941,759 | | | | | 196,383,593 | |
| Unaffiliated underlying funds | | | | 2,313,384 | | | | | 506,765 | | | | | 3,660,424 | | | | | 530,686 | |
| Net change in unrealized appreciation (depreciation) | | | | 34,683,880 | | | | | 319,244,192 | | | | | 100,602,183 | | | | | 196,914,279 | |
| Net realized and unrealized gain | | | | 45,504,420 | | | | | 452,812,976 | | | | | 140,966,609 | | | | | 289,665,398 | |
Increase in net assets resulting from operations | | | $ | 53,130,857 | | | | $ | 506,175,521 | | | | $ | 161,093,348 | | | | $ | 325,370,951 | |
See Accompanying Notes to Financial Statements
13
STATEMENTS OF CHANGES IN NET ASSETS | | | Voya Retirement
Conservative Portfolio | | Voya Retirement
Growth Portfolio |
|---|
| | | Year Ended
December 31,
2019 | | Year Ended
December 31,
2018 | | Year Ended
December 31,
2019 | | Year Ended
December 31,
2018 |
|---|
FROM OPERATIONS: | | | | | | | | | | | | | | | | | |
| Net investment income | | | $ | 7,626,437 | | | $ | 7,505,307 | | | $ | 53,362,545 | | | $ | 43,002,792 | |
| Net realized gain | | | | 10,820,540 | | | | 13,347,703 | | | | 133,568,784 | | | | 181,985,576 | |
| Net change in unrealized appreciation (depreciation) | | | | 34,683,880 | | | | (32,610,206 | ) | | | 319,244,192 | | | | (426,487,656 | ) |
| Increase (decrease) in net assets resulting from operations | | | | 53,130,857 | | | | (11,757,196 | ) | | | 506,175,521 | | | | (201,499,288 | ) |
| |
FROM DISTRIBUTIONS TO SHAREHOLDERS: | | | | | | | | | | | | | | | | | |
| Total distributions (excluding return of capital): | | | | | | | | | | | | | | | | | |
| Class ADV | | | | (18,553,699 | ) | | | (20,314,882 | ) | | | (232,360,607 | ) | | | (266,303,828 | ) |
| Class I | | | | (3,535 | ) | | | (1,539 | ) | | | (4,625,627 | ) | | | (4,792,936 | ) |
| Total distributions | | | | (18,557,234 | ) | | | (20,316,421 | ) | | | (236,986,234 | ) | | | (271,096,764 | ) |
| |
FROM CAPITAL SHARE TRANSACTIONS: | | | | | | | | | | | | | | | | | |
| Net proceeds from sale of shares | | | | 31,957,062 | | | | 25,539,384 | | | | 12,832,178 | | | | 8,309,931 | |
| Reinvestment of distributions | | | | 18,557,191 | | | | 20,316,376 | | | | 236,986,234 | | | | 271,096,764 | |
| | | | | 50,514,253 | | | | 45,855,760 | | | | 249,818,412 | | | | 279,406,695 | |
| Cost of shares redeemed | | | | (60,509,716 | ) | | | (70,207,985 | ) | | | (410,938,244 | ) | | | (380,257,285 | ) |
| Net decrease in net assets resulting from capital share transactions | | | | (9,995,463 | ) | | | (24,352,225 | ) | | | (161,119,832 | ) | | | (100,850,590 | ) |
| Net increase (decrease) in net assets | | | | 24,578,160 | | | | (56,425,842 | ) | | | 108,069,455 | | | | (573,446,642 | ) |
| |
NET ASSETS: | | | | | | | | | | | | | | | | | |
| Beginning of year or period | | | | 400,300,864 | | | | 456,726,706 | | | | 2,493,818,591 | | | | 3,067,265,233 | |
| End of year or period | | | $ | 424,879,024 | | | $ | 400,300,864 | | | $ | 2,601,888,046 | | | $ | 2,493,818,591 | |
See Accompanying Notes to Financial Statements
14
STATEMENTS OF CHANGES IN NET ASSETS
| | | Voya Retirement
Moderate Portfolio | | Voya Retirement
Moderate Growth Portfolio |
|---|
| | | Year Ended
December 31,
2019 | | Year Ended
December 31,
2018 | | Year Ended
December 31,
2019 | | Year Ended
December 31,
2018 |
|---|
FROM OPERATIONS: | | | | | | | | | | | | | | | | | |
| Net investment income | | | $ | 20,126,739 | | | $ | 18,650,450 | | | $ | 35,705,553 | | | $ | 31,044,007 | |
| Net realized gain | | | | 40,364,426 | | | | 42,705,709 | | | | 92,751,119 | | | | 105,276,461 | |
| Net change in unrealized appreciation (depreciation) | | | | 100,602,183 | | | | (114,401,197 | ) | | | 196,914,279 | | | | (253,136,299 | ) |
| Increase (decrease) in net assets resulting from operations | | | | 161,093,348 | | | | (53,045,038 | ) | | | 325,370,951 | | | | (116,815,831 | ) |
| |
FROM DISTRIBUTIONS TO SHAREHOLDERS: | | | | | | | | | | | | | | | | | |
| Total distributions (excluding return of capital): | | | | | | | | | | | | | | | | | |
| Class ADV | | | | (62,980,933 | ) | | | (66,693,112 | ) | | | (146,075,017 | ) | | | (169,238,894 | ) |
| Class I | | | | (1,264,979 | ) | | | (1,252,742 | ) | | | (1,883,900 | ) | | | (2,141,323 | ) |
| Total distributions | | | | (64,245,912 | ) | | | (67,945,854 | ) | | | (147,958,917 | ) | | | (171,380,217 | ) |
| |
FROM CAPITAL SHARE TRANSACTIONS: | | | | | | | | | | | | | | | | | |
| Net proceeds from sale of shares | | | | 24,874,534 | | | | 14,449,278 | | | | 17,828,813 | | | | 10,671,117 | |
| Reinvestment of distributions | | | | 64,245,912 | | | | 67,945,854 | | | | 147,958,917 | | | | 171,380,217 | |
| | | | | 89,120,446 | | | | 82,395,132 | | | | 165,787,730 | | | | 182,051,334 | |
| Cost of shares redeemed | | | | (145,338,094 | ) | | | (162,130,311 | ) | | | (287,935,946 | ) | | | (292,994,805 | ) |
| Net decrease in net assets resulting from capital share transactions | | | | (56,217,648 | ) | | | (79,735,179 | ) | | | (122,148,216 | ) | | | (110,943,471 | ) |
| Net increase (decrease) in net assets | | | | 40,629,788 | | | | (200,726,071 | ) | | | 55,263,818 | | | | (399,139,519 | ) |
| |
NET ASSETS: | | | | | | | | | | | | | | | | | |
| Beginning of year or period | | | | 989,538,785 | | | | 1,190,264,856 | | | | 1,736,316,220 | | | | 2,135,455,739 | |
| End of year or period | | | $ | 1,030,168,573 | | | $ | 989,538,785 | | | $ | 1,791,580,038 | | | $ | 1,736,316,220 | |
See Accompanying Notes to Financial Statements
15
Selected data for a share of beneficial interest outstanding throughout each year or period.
| | | | | | Income (loss)
from investment
operations | | Less distributions | | | | | | | | | | | | | | | | | | Ratios to average
net assets | | Supplemental
data |
|---|
| | Net asset value, beginning
of year or period | | Net investment income (loss) | | Net realized and unrealized
gain (loss) | | Total from investment
operations | | From net investment income | | From net realized gains | | From return of capital | | Total distributions | | Payment by affiliate | | Net asset value,
end of year or period | | Total
Return(1) | | Expenses before reductions/
additions(2)(3)(4) | | Expenses net of fee waivers
and/or recoupments
if any(2)(3)(4) | | Expenses
net of all
reductions/
additions
(2)(3)(4) | | Net investment income
(loss)(2)(3) | | Net
assets,
end of
year or
period | | Portfolio turnover rate |
| Year or period ended | | ($) | | ($) | | ($) | | ($) | | ($) | | ($) | | ($) | | ($) | | ($) | | ($) | | (%) | | (%) | | (%) | | (%) | | (%) | | ($000’s) | | (%) |
Voya Retirement Conservative Portfolio | | | | | | | | | | | | | | | | | | | | | | | | | | | | | | | | | | | | | | | | | | | | | | | | | | | | | |
Class ADV | | | | | | | | | | | | | | | | | | | | | | | | | | | | | | | | | | | | | | | | | | | | | | | | | | | | | | | | | | | | | | | | | | | | |
| 12-31-19 | | | 8.57 | | | | 0.17 | | | | 0.98 | | | | 1.15 | | | | 0.17 | | | | 0.24 | | | | — | | | | 0.41 | | | | — | | | | 9.31 | | | | 13.61 | | | | 0.78 | | | | 0.53 | | | | 0.53 | | | | 1.82 | | | | 424,756 | | | | 24 | |
| 12-31-18 | | | 9.24 | | | | 0.17 | | | | (0.41 | ) | | | (0.24 | ) | | | 0.17 | | | | 0.26 | | | | — | | | | 0.43 | | | | — | | | | 8.57 | | | | (2.74 | ) | | | 0.77 | | | | 0.52 | | | | 0.52 | | | | 1.74 | | | | 400,267 | | | | 33 | |
| 12-31-17 | | | 8.89 | | | | 0.14 | • | | | 0.54 | | | | 0.68 | | | | 0.13 | | | | 0.20 | | | | — | | | | 0.33 | | | | — | | | | 9.24 | | | | 7.76 | | | | 0.76 | | | | 0.51 | | | | 0.51 | | | | 1.57 | | | | 456,710 | | | | 15 | |
| 12-31-16 | | | 8.81 | | | | 0.09 | | | | 0.32 | | | | 0.41 | | | | 0.13 | | | | 0.20 | | | | — | | | | 0.33 | | | | — | | | | 8.89 | | | | 4.68 | | | | 0.76 | | | | 0.51 | | | | 0.51 | | | | 1.17 | | | | 507,585 | | | | 23 | |
| 12-31-15 | | | 9.36 | | | | 0.13 | | | | (0.20 | ) | | | (0.07 | ) | | | 0.14 | | | | 0.34 | | | | — | | | | 0.48 | | | | — | | | | 8.81 | | | | (0.80 | ) | | | 0.76 | | | | 0.51 | | | | 0.51 | | | | 1.37 | | | | 486,347 | | | | 21 | |
Class I | | | | | | | | | | | | | | | | | | | | | | | | | | | | | | | | | | | | | | | | | | | | | | | | | | | | | | | | | | | | | | | | | | | | |
| 12-31-19 | | | 8.70 | | | | 0.21 | • | | | 0.98 | | | | 1.19 | | | | 0.20 | | | | 0.24 | | | | — | | | | 0.44 | | | | — | | | | 9.45 | | | | 13.81 | | | | 0.28 | | | | 0.28 | | | | 0.28 | | | | 2.31 | | | | 123 | | | | 24 | |
| 12-31-18 | | | 9.38 | | | | 0.19 | • | | | (0.41 | ) | | | (0.22 | ) | | | 0.20 | | | | 0.26 | | | | — | | | | 0.46 | | | | — | | | | 8.70 | | | | (2.54 | ) | | | 0.27 | | | | 0.27 | | | | 0.27 | | | | 2.11 | | | | 34 | | | | 33 | |
| 12-31-17 | | | 9.04 | | | | 0.31 | • | | | 0.39 | | | | 0.70 | | | | 0.16 | | | | 0.20 | | | | — | | | | 0.36 | | | | — | | | | 9.38 | | | | 7.81 | | | | 0.26 | | | | 0.26 | | | | 0.26 | | | | 3.44 | | | | 17 | | | | 15 | |
| 12-31-16 | | | 8.97 | | | | 0.14 | | | | 0.29 | | | | 0.43 | | | | 0.16 | | | | 0.20 | | | | — | | | | 0.36 | | | | — | | | | 9.04 | | | | 4.73 | | | | 0.26 | | | | 0.26 | | | | 0.26 | | | | 1.52 | | | | 1 | | | | 23 | |
| 12-31-15 | | | 9.52 | | | | 0.16 | | | | (0.20 | ) | | | (0.04 | ) | | | 0.17 | | | | 0.34 | | | | — | | | | 0.51 | | | | — | | | | 8.97 | | | | (0.50 | ) | | | 0.26 | | | | 0.26 | | | | 0.26 | | | | 1.72 | | | | 1 | | | | 21 | |
Voya Retirement Growth Portfolio | | | | | | | | | | | | | | | | | | | | | | | | | | | | | | | | | | | | | | | | | | | | | | | | | | | | | |
Class ADV | | | | | | | | | | | | | | | | | | | | | | | | | | | | | | | | | | | | | | | | | | | | | | | | | | | | | | | | | | | | | | | | | | | | |
| 12-31-19 | | | 11.74 | | | | 0.26 | • | | | 2.20 | | | | 2.46 | | | | 0.24 | | | | 0.96 | | | | — | | | | 1.20 | | | | — | | | | 13.00 | | | | 21.55 | | | | 0.76 | | | | 0.68 | | | | 0.68 | | | | 2.04 | | | | 2,553,927 | | | | 40 | |
| 12-31-18 | | | 13.99 | | | | 0.20 | • | | | (1.13 | ) | | | (0.93 | ) | | | 0.23 | | | | 1.09 | | | | — | | | | 1.32 | | | | — | | | | 11.74 | | | | (7.47 | ) | | | 0.76 | | | | 0.68 | | | | 0.68 | | | | 1.49 | | | | 2,449,356 | | | | 20 | |
| 12-31-17 | | | 13.10 | | | | 0.19 | • | | | 1.91 | | | | 2.10 | | | | 0.25 | | | | 0.96 | | | | — | | | | 1.21 | | | | — | | | | 13.99 | | | | 16.66 | | | | 0.76 | | | | 0.68 | | | | 0.68 | | | | 1.37 | | | | 3,018,225 | | | | 11 | |
| 12-31-16 | | | 13.14 | | | | 0.19 | • | | | 0.76 | | | | 0.95 | | | | 0.30 | | | | 0.69 | | | | — | | | | 0.99 | | | | — | | | | 13.10 | | | | 7.31 | | | | 0.76 | | | | 0.68 | | | | 0.68 | | | | 1.45 | | | | 3,275,638 | | | | 17 | |
| 12-31-15 | | | 13.63 | | | | 0.22 | • | | | (0.49 | ) | | | (0.27 | ) | | | 0.22 | | | | — | | | | — | | | | 0.22 | | | | — | | | | 13.14 | | | | (2.03 | ) | | | 0.76 | | | | 0.68 | | | | 0.68 | | | | 1.59 | | | | 3,611,216 | | | | 16 | |
Class I | | | | | | | | | | | | | | | | | | | | | | | | | | | | | | | | | | | | | | | | | | | | | | | | | | | | | | | | | | | | | | | | | | | | |
| 12-31-19 | | | 11.81 | | | | 0.31 | • | | | 2.22 | | | | 2.53 | | | | 0.30 | | | | 0.96 | | | | — | | | | 1.26 | | | | — | | | | 13.08 | | | | 22.09 | | | | 0.26 | | | | 0.26 | | | | 0.26 | | | | 2.48 | | | | 47,961 | | | | 40 | |
| 12-31-18 | | | 14.07 | | | | 0.26 | | | | (1.13 | ) | | | (0.87 | ) | | | 0.30 | | | | 1.09 | | | | — | | | | 1.39 | | | | — | | | | 11.81 | | | | (7.05 | ) | | | 0.26 | | | | 0.26 | | | | 0.26 | | | | 1.94 | | | | 44,463 | | | | 20 | |
| 12-31-17 | | | 13.18 | | | | 0.25 | • | | | 1.91 | | | | 2.16 | | | | 0.31 | | | | 0.96 | | | | — | | | | 1.27 | | | | — | | | | 14.07 | | | | 17.11 | | | | 0.26 | | | | 0.26 | | | | 0.26 | | | | 1.84 | | | | 49,040 | | | | 11 | |
| 12-31-16 | | | 13.22 | | | | 0.25 | | | | 0.76 | | | | 1.01 | | | | 0.36 | | | | 0.69 | | | | — | | | | 1.05 | | | | — | | | | 13.18 | | | | 7.80 | | | | 0.26 | | | | 0.26 | | | | 0.26 | | | | 1.93 | | | | 47,460 | | | | 17 | |
| 12-31-15 | | | 13.72 | | | | 0.28 | | | | (0.49 | ) | | | (0.21 | ) | | | 0.29 | | | | — | | | | — | | | | 0.29 | | | | — | | | | 13.22 | | | | (1.62 | ) | | | 0.26 | | | | 0.26 | | | | 0.26 | | | | 2.03 | | | | 47,401 | | | | 16 | |
Voya Retirement Moderate Portfolio | | | | | | | | | | | | | | | | | | | | | | | | | | | | | | | | | | | | | | | | | | | | | | | | | | | | | |
Class ADV | | | | | | | | | | | | | | | | | | | | | | | | | | | | | | | | | | | | | | | | | | | | | | | | | | | | | | | | | | | | | | | | | | | | |
| 12-31-19 | | | 10.51 | | | | 0.22 | • | | | 1.54 | | | | 1.76 | | | | 0.22 | | | | 0.50 | | | | — | | | | 0.72 | | | | — | | | | 11.55 | | | | 17.14 | | | | 0.77 | | | | 0.61 | | | | 0.61 | | | | 1.96 | | | | 1,008,727 | | | | 31 | |
| 12-31-18 | | | 11.79 | | | | 0.19 | • | | | (0.75 | ) | | | (0.56 | ) | | | 0.21 | | | | 0.51 | | | | — | | | | 0.72 | | | | — | | | | 10.51 | | | | (5.07 | ) | | | 0.77 | | | | 0.61 | | | | 0.61 | | | | 1.68 | | | | 972,232 | | | | 27 | |
| 12-31-17 | | | 11.35 | | | | 0.17 | • | | | 1.14 | | | | 1.31 | | | | 0.20 | | | | 0.67 | | | | — | | | | 0.87 | | | | — | | | | 11.79 | | | | 11.82 | | | | 0.76 | | | | 0.60 | | | | 0.60 | | | | 1.50 | | | | 1,170,685 | | | | 12 | |
| 12-31-16 | | | 11.49 | | | | 0.15 | • | | | 0.51 | | | | 0.66 | | | | 0.23 | | | | 0.57 | | | | — | | | | 0.80 | | | | — | | | | 11.35 | | | | 5.78 | | | | 0.76 | | | | 0.60 | | | | 0.60 | | | | 1.34 | | | | 1,257,324 | | | | 15 | |
| 12-31-15 | | | 12.68 | | | | 0.18 | • | | | (0.35 | ) | | | (0.17 | ) | | | 0.11 | | | | 0.91 | | | | — | | | | 1.02 | | | | — | | | | 11.49 | | | | (1.57 | ) | | | 0.76 | | | | 0.60 | | | | 0.60 | | | | 1.47 | | | | 1,387,932 | | | | 18 | |
Class I | | | | | | | | | | | | | | | | | | | | | | | | | | | | | | | | | | | | | | | | | | | | | | | | | | | | | | | | | | | | | | | | | | | | |
| 12-31-19 | | | 10.64 | | | | 0.25 | | | | 1.58 | | | | 1.83 | | | | 0.27 | | | | 0.50 | | | | — | | | | 0.77 | | | | — | | | | 11.70 | | | | 17.56 | | | | 0.27 | | | | 0.27 | | | | 0.27 | | | | 2.35 | | | | 21,441 | | | | 31 | |
| 12-31-18 | | | 11.93 | | | | 0.24 | | | | (0.76 | ) | | | (0.52 | ) | | | 0.26 | | | | 0.51 | | | | — | | | | 0.77 | | | | — | | | | 10.64 | | | | (4.73 | ) | | | 0.27 | | | | 0.27 | | | | 0.27 | | | | 2.03 | | | | 17,307 | | | | 27 | |
| 12-31-17 | | | 11.48 | | | | 0.22 | | | | 1.14 | | | | 1.36 | | | | 0.24 | | | | 0.67 | | | | — | | | | 0.91 | | | | — | | | | 11.93 | | | | 12.21 | | | | 0.26 | | | | 0.26 | | | | 0.26 | | | | 1.86 | | | | 19,580 | | | | 12 | |
| 12-31-16 | | | 11.62 | | | | 0.20 | • | | | 0.51 | | | | 0.71 | | | | 0.28 | | | | 0.57 | | | | — | | | | 0.85 | | | | — | | | | 11.48 | | | | 6.12 | | | | 0.26 | | | | 0.26 | | | | 0.26 | | | | 1.68 | | | | 17,956 | | | | 15 | |
| 12-31-15 | | | 12.82 | | | | 0.23 | | | | (0.36 | ) | | | (0.13 | ) | | | 0.16 | | | | 0.91 | | | | — | | | | 1.07 | | | | — | | | | 11.62 | | | | (1.24 | ) | | | 0.26 | | | | 0.26 | | | | 0.26 | | | | 1.81 | | | | 19,000 | | | | 18 | |
See Accompanying Notes to Financial Statements
16
FINANCIAL HIGHLIGHTS (CONTINUED)
Selected data for a share of beneficial interest outstanding throughout each year or period.
| | | | | | Income (loss)
from investment
operations | | Less distributions | | | | | | | | | | | | | | | | | | Ratios to average
net assets | | Supplemental
data |
|---|
| | Net asset value, beginning
of year or period | | Net investment income (loss) | | Net realized and unrealized
gain (loss) | | Total from investment
operations | | From net investment income | | From net realized gains | | From return of capital | | Total distributions | | Payment by affiliate | | Net asset value,
end of year or period | | Total
Return(1) | | Expenses before reductions/
additions(2)(3)(4) | | Expenses net of fee waivers
and/or recoupments
if any(2)(3)(4) | | Expenses
net of all
reductions/
additions
(2)(3)(4) | | Net investment income
(loss)(2)(3) | | Net
assets,
end of
year or
period | | Portfolio turnover rate |
| Year or period ended | | ($) | | ($) | | ($) | | ($) | | ($) | | ($) | | ($) | | ($) | | ($) | | ($) | | (%) | | (%) | | (%) | | (%) | | (%) | | ($000’s) | | (%) |
Voya Retirement Moderate Growth Portfolio | | | | | | | | | | | | | | | | | | | | | | | | | | | | | | | | | | | | | | | | | | | | | | | | | | | | | |
Class ADV | | | | | | | | | | | | | | | | | | | | | | | | | | | | | | | | | | | | | | | | | | | | | | | | | | | | | | | | | | | | | | | | | | | | |
| 12-31-19 | | | 10.97 | | | | 0.23 | • | | | 1.91 | | | | 2.14 | | | | 0.23 | | | | 0.78 | | | | — | | | | 1.01 | | | | — | | | | 12.10 | | | | 20.02 | | | | 0.76 | | | | 0.65 | | | | 0.65 | | | | 1.98 | | | | 1,769,060 | | | | 39 | |
| 12-31-18 | | | 12.80 | | | | 0.19 | • | | | (0.91 | ) | | | (0.72 | ) | | | 0.22 | | | | 0.89 | | | | — | | | | 1.11 | | | | — | | | | 10.97 | | | | (6.30 | ) | | | 0.76 | | | | 0.65 | | | | 0.65 | | | | 1.56 | | | | 1,716,501 | | | | 22 | |
| 12-31-17 | | | 12.23 | | | | 0.18 | • | | | 1.53 | | | | 1.71 | | | | 0.23 | | | | 0.91 | | | | — | | | | 1.14 | | | | — | | | | 12.80 | | | | 14.56 | | | | 0.76 | | | | 0.65 | | | | 0.65 | | | | 1.42 | | | | 2,111,439 | | | | 10 | |
| 12-31-16 | | | 12.76 | | | | 0.18 | • | | | 0.67 | | | | 0.85 | | | | 0.28 | | | | 1.10 | | | | — | | | | 1.38 | | | | — | | | | 12.23 | | | | 6.81 | | | | 0.76 | | | | 0.65 | | | | 0.65 | | | | 1.46 | | | | 2,275,963 | | | | 16 | |
| 12-31-15 | | | 13.54 | | | | 0.21 | • | | | (0.40 | ) | | | (0.19 | ) | | | 0.22 | | | | 0.37 | | | | — | | | | 0.59 | | | | — | | | | 12.76 | | | | (1.59 | ) | | | 0.76 | | | | 0.65 | | | | 0.65 | | | | 1.56 | | | | 2,521,814 | | | | 16 | |
Class I | | | | | | | | | | | | | | | | | | | | | | | | | | | | | | | | | | | | | | | | | | | | | | | | | | | | | | | | | | | | | | | | | | | | |
| 12-31-19 | | | 10.90 | | | | 0.29 | | | | 1.87 | | | | 2.16 | | | | 0.28 | | | | 0.78 | | | | — | | | | 1.06 | | | | — | | | | 12.00 | | | | 20.40 | | | | 0.26 | | | | 0.26 | | | | 0.26 | | | | 2.41 | | | | 22,520 | | | | 39 | |
| 12-31-18 | | | 12.73 | | | | 0.24 | • | | | (0.90 | ) | | | (0.66 | ) | | | 0.28 | | | | 0.89 | | | | — | | | | 1.17 | | | | — | | | | 10.90 | | | | (5.90 | ) | | | 0.26 | | | | 0.26 | | | | 0.26 | | | | 1.97 | | | | 19,816 | | | | 22 | |
| 12-31-17 | | | 12.17 | | | | 0.24 | | | | 1.52 | | | | 1.76 | | | | 0.29 | | | | 0.91 | | | | — | | | | 1.20 | | | | — | | | | 12.73 | | | | 15.05 | | | | 0.26 | | | | 0.26 | | | | 0.26 | | | | 1.84 | | | | 24,017 | | | | 10 | |
| 12-31-16 | | | 12.71 | | | | 0.24 | | | | 0.66 | | | | 0.90 | | | | 0.34 | | | | 1.10 | | | | — | | | | 1.44 | | | | — | | | | 12.17 | | | | 7.25 | | | | 0.26 | | | | 0.26 | | | | 0.26 | | | | 1.86 | | | | 22,088 | | | | 16 | |
| 12-31-15 | | | 13.50 | | | | 0.26 | • | | | (0.40 | ) | | | (0.14 | ) | | | 0.28 | | | | 0.37 | | | | — | | | | 0.65 | | | | — | | | | 12.71 | | | | (1.24 | ) | | | 0.26 | | | | 0.26 | | | | 0.26 | | | | 1.95 | | | | 21,862 | | | | 16 | |
(1) | | Total return is calculated assuming reinvestment of all dividends, capital gain distributions and return of capital distributions, if any, at net asset value and does not reflect the effect of insurance contract charges. Total return for periods less than one year is not annualized. |
(2) | | Annualized for periods less than one year. |
(3) | | Ratios reflect operating expenses of a Portfolio. Expenses before reductions/additions do not reflect amounts reimbursed or recouped by the Investment Adviser and/or Distributor or reductions from brokerage service arrangements or other expense offset arrangements and do not represent the amount paid by a Portfolio during periods when reimbursements or reductions occur. |
| | | Expenses net of fee waivers reflect expenses after reimbursement by the Investment Adviser and/or Distributor or recoupment of previously reimbursed fees by the Investment Adviser, but prior to reductions from brokerage service arrangements or other expense offset arrangements. Expenses net of all reductions/additions represent the net expenses paid by a Portfolio. Net investment income (loss) is net of all such additions or reductions. |
(4) | | Ratios do not include expenses of underlying funds and do not include fees and expenses charged under the variable annuity contract or variable life insurance policy. |
• | | Calculated using average number of shares outstanding throughout the year or period. |
See Accompanying Notes to Financial Statements
17
NOTES TO FINANCIAL STATEMENTS AS OF DECEMBER 31, 2019 NOTE 1 — ORGANIZATION
Voya Investors Trust (the “Trust”) is registered under the Investment Company Act of 1940, as amended (“1940 Act”), as an open-end management investment company. The Trust was organized as a Massachusetts business trust on August 3, 1988. The Trust currently consists of twenty-two active separate investment series. The four series (each, a “Portfolio” and collectively, the “Portfolios”) included in this report are: Voya Retirement Conservative Portfolio (“Conservative”), Voya Retirement Growth Portfolio (“Growth”), Voya Retirement Moderate Portfolio (“Moderate”) and Voya Retirement Moderate Growth Portfolio (“Moderate Growth”), each a diversified series of the Trust.
The classes of shares included in this report are: Adviser (“Class ADV”) and Institutional (“Class I”). With the exception of class specific matters, each class has equal voting rights as to voting privileges. For class specific proposals, only the applicable class would have voting privileges. The classes differ principally in the applicable distribution and shareholder service fees. Generally, shareholders of each class also bear certain expenses that pertain to that particular class. All shareholders are allocated the common expenses of a portfolio and earn income and realized gains/losses from a portfoliopro rata based on the daily ending net assets of each class, without distinction between share classes. Expenses that are specific to a portfolio or a class are charged directly to that portfolio or class. Other operating expenses shared by several portfolios are generally allocated among those portfolios based on average net assets. Distributions are determined separately for each class based on income and expenses allocated to each class. Realized gain distributions are allocated to each classpro rata based on the shares outstanding of each class on the date of distribution. Differences in per share dividend rates generally result from differences in separate class expenses, including distribution and shareholder service fees, if applicable.
Voya Investments, LLC (“Voya Investments” or the “Investment Adviser”), an Arizona limited liability company serves as the Investment Adviser to the Portfolios. Voya Investment Management Co. LLC (“Voya IM” or the “Sub-Adviser”), a Delaware limited liability company, serves as the Sub-Adviser to the Portfolios. Voya Investments Distributor, LLC (“VID” or the “Distributor”), a Delaware limited liability company, serves as the principal underwriter to the Portfolios.
Each Portfolio seeks to achieve its investment objective by investing in other investment companies (“Underlying Funds”) and uses asset allocation strategies to determine how much to invest in the Underlying Funds. The
investment objective of the Portfolios is described in the respective Portfolio’s Prospectus.
NOTE 2 — SIGNIFICANT ACCOUNTING POLICIES
The following significant accounting policies are consistently followed by the Portfolios in the preparation of their financial statements. Each Portfolio is considered an investment company under U.S. generally accepted accounting principles (“GAAP”) and follows the accounting and reporting guidance applicable to investment companies.
A. Security Valuation. Each Portfolio is open for business every day the New York Stock Exchange (“NYSE”) opens for regular trading (each such day, a “Business Day”). The net asset value (“NAV”) per share for each class of each Portfolio is determined each Business Day as of the close of the regular trading session (“Market Close”), as determined by the Consolidated Tape Association (“CTA”), the central distributor of transaction prices for exchange-traded securities (normally 4:00 p.m. Eastern time unless otherwise designated by the CTA). The data reflected on the consolidated tape provided by the CTA is generated by various market centers, including all securities exchanges, electronic communications networks, and third-market broker-dealers. The NAV per share of each class of each Portfolio is calculated by taking the value of the Portfolio’s assets attributable to that class, subtracting the Portfolio’s liabilities attributable to that class, and dividing by the number of shares of that class that are outstanding. On days when a Portfolio is closed for business, Portfolio shares will not be priced and a Portfolio does not transact purchase and redemption orders. To the extent a Portfolio’s assets are traded in other markets on days when a Portfolio does not price its shares, the value of a Portfolio’s assets will likely change and you will not be able to purchase or redeem shares of a Portfolio.
Assets for which market quotations are readily available are valued at market value. A security listed or traded on an exchange is valued at its last sales price or official closing price as of the close of the regular trading session on the exchange where the security is principally traded or, if such price is not available, at the last sale price as of the Market Close for such security provided by the CTA. Bank loans are valued at the average of the averages of the bid and ask prices provided to an independent loan pricing service by brokers. Futures contracts are valued at the final settlement price set by an exchange on which they are principally traded. Listed options are valued at the mean between the last bid and ask prices from the exchange on which they are principally traded. Investments in open-end registered investment companies that do not trade on an exchange are valued at the end of day NAV per share.
18
NOTES TO FINANCIAL STATEMENTS AS OF DECEMBER 31, 2019 (CONTINUED)
NOTE 2 — SIGNIFICANT ACCOUNTING POLICIES (continued)
Investments in registered investment companies that trade on an exchange are valued at the last sales price or official closing price as of the close of the regular trading session on the exchange where the security is principally traded.
When a market quotation is not readily available or is deemed unreliable, each Portfolio will determine a fair value for the relevant asset in accordance with procedures adopted by the Portfolios’ Board of Trustees (“Board”). Such procedures provide, for example, that: (a) Exchange-traded securities are valued at the mean of the closing bid and ask; (b) Debt obligations are valued using an evaluated price provided by an independent pricing service. Evaluated prices provided by the pricing service may be determined without exclusive reliance on quoted prices, and may reflect factors such as institution-size trading in similar groups of securities, developments related to specific securities, benchmark yield, quality, type of issue, coupon rate, maturity, individual trading characteristics and other market data; (c) Securities traded in the over-the-counter (“OTC”) market are valued based on prices provided by independent pricing services or market makers; (d) Options not listed on an exchange are valued by an independent source using an industry accepted model, such as Black-Scholes; (e) Centrally cleared swap agreements are valued using a price provided by the central counterparty clearinghouse; (f) OTC swap agreements are valued using a price provided by an independent pricing service; (g) Forward foreign currency exchange contracts are valued utilizing current and forward rates obtained from an independent pricing service. Such prices from the third party pricing service are for specific settlement periods and each Portfolio’s forward foreign currency exchange contracts are valued at an interpolated rate between the closest preceding and subsequent period reported by the independent pricing service; and (h) Securities for which market prices are not provided by any of the above methods may be valued based upon quotes furnished by brokers.
The prospectuses of the open-end registered investment companies in which each Portfolio may invest explain the circumstances under which they will use fair value pricing and the effects of using fair value pricing.
Foreign securities’ (including forward foreign currency exchange contracts) prices are converted into U.S. dollar amounts using the applicable exchange rates as of Market Close. If market quotations are available and believed to be reliable for foreign exchange-traded equity securities, the securities will be valued at the market quotations. Because trading hours for certain foreign securities end before Market Close, closing market quotations may become unreliable. An independent pricing service determines the
degree of certainty, based on historical data, that the closing price in the principal market where a foreign security trades is not the current value as of Market Close. Foreign securities’ prices meeting the approved degree of certainty that the price is not reflective of current value will be valued by the independent pricing service using pricing models designed to estimate likely changes in the values of those securities between the times in which the trading in those securities is substantially completed and Market Close. Multiple factors may be considered by the independent pricing service in determining the value of such securities and may include information relating to sector indices, American Depositary Receipts and domestic and foreign index futures.
All other assets for which market quotations are not readily available or became unreliable (or if the above fair valuation methods are unavailable or determined to be unreliable) are valued at fair value as determined in good faith by or under the supervision of the Board following procedures approved by the Board. The Board has delegated to the Investment Adviser responsibility for overseeing the implementation of the Portfolios’ valuation procedures; a “Pricing Committee” comprised of employees of the Investment Adviser or its affiliates has responsibility for applying the fair valuation methods set forth in the procedures and, if a fair valuation cannot be determined pursuant to the fair valuation methods, determining the fair value of assets held by the Portfolios. Issuer specific events, transaction price, position size, nature and duration of restrictions on disposition of the security, market trends, bid/ask quotes of brokers and other market data may be reviewed in the course of making a good faith determination of a security’s fair value. Valuations change in response to many factors including the historical and prospective earnings of the issuer, the value of the issuer’s assets, general economic conditions, interest rates, investor perceptions and market liquidity. Because of the inherent uncertainties of fair valuation, the values used to determine each Portfolio’s NAV may materially differ from the value received upon actual sale of those investments. Thus, fair valuation may have an unintended dilutive or accretive effect on the value of shareholders’ investments in each Portfolio.
Each investment asset or liability of the Portfolios is assigned a level at measurement date based on the significance and source of the inputs to its valuation. Quoted prices in active markets for identical securities are classified as “Level 1,” inputs other than quoted prices for an asset or liability that are observable are classified as “Level 2” and significant unobservable inputs, including the Sub-Adviser’s or Pricing Committee’s judgment about the assumptions that a market participant would use in pricing an asset or liability are classified as “Level 3.” The inputs
19
NOTES TO FINANCIAL STATEMENTS AS OF DECEMBER 31, 2019 (CONTINUED)
NOTE 2 — SIGNIFICANT ACCOUNTING POLICIES (continued)
used for valuing securities are not necessarily an indication of the risks associated with investing in those securities. Short-term securities of sufficient credit quality are generally considered to be Level 2 securities under applicable accounting rules. The Portfolios classify each of their investments in the Underlying Funds as Level 1, without consideration as to the classification level of the specific investments held by the Underlying Funds. A table summarizing the Portfolios’ investments under these levels of classification is included within the Portfolio of Investments.
GAAP requires a reconciliation of the beginning to ending balances for reported fair values that presents changes attributable to total realized and unrealized gains or losses, purchases and sales, and transfers in or out of the Level 3 category during the period. A reconciliation of Level 3 investments within the Portfolio of Investments is presented only when a Portfolio has a significant amount of Level 3 investments.
B. Securities Transactions and Revenue Recognition. Securities transactions are accounted for on the trade date. Dividend income received from the Underlying Funds is recognized on the ex-dividend date and is recorded as income distributions in the Statements of Operations. Capital gain distributions received from the Underlying Funds are recognized on the ex-dividend date and are recorded on the Statements of Operations as such. Realized gains and losses are reported on the basis of identified cost of securities sold.
C. Distributions to Shareholders. The Portfolios record distributions to their shareholders on the ex-dividend date. Each Portfolio declares and pays dividends and capital gain distributions, if any, annually. The Portfolios may make distributions on a more frequent basis to comply with the distribution requirements of the Internal Revenue Code. The characteristics of income and gains to be distributed are determined in accordance with income tax regulations, which may differ from GAAP for investment companies.
D. Federal Income Taxes. It is the policy of each Portfolio to comply with the requirements of subchapter M of the Internal Revenue Code that are applicable to regulated investment companies and to distribute substantially all of its net investment income and any net realized capital gains to its shareholders. Therefore, a federal income tax or excise tax provision is not required. Management has considered the sustainability of the Portfolios’ tax positions taken on federal income tax returns for all open tax years in making this determination. No capital gain distributions
shall be made until the capital loss carryforwards have been fully utilized or expire.
The Portfolios may utilize equalization accounting for tax purposes, whereby a portion of redemption payments are treated as distributions of income or gain.
E. Use of Estimates. The preparation of financial statements in conformity with GAAP requires management to make estimates and assumptions that affect the reported amounts of assets and liabilities and disclosure of contingent assets and liabilities at the date of the financial statements and the reported amounts of increases and decreases in net assets from operations during the reporting period. Actual results could differ from those estimates.
F. Indemnifications. In the normal course of business, the Trust may enter into contracts that provide certain indemnifications. The Trust’s maximum exposure under these arrangements is dependent on future claims that may be made against the Portfolios and, therefore, cannot be estimated; however, based on experience, management considers the risk of loss from such claims remote.
NOTE 3 — INVESTMENTS IN UNDERLYING FUNDS
For the year ended December 31, 2019, the cost of purchases and the proceeds from the sales of the Underlying Funds were as follows:
| | Purchases | | Sales |
|---|
| Conservative | | $ | 99,992,854 | | | $ | 121,621,854 | |
| Growth | | | 1,053,950,170 | | | | 1,401,065,634 | |
| Moderate | | | 321,811,360 | | | | 423,939,542 | |
| Moderate Growth | | | 710,342,022 | | | | 947,120,196 | |
NOTE 4 — INVESTMENT MANAGEMENT FEES
The Portfolios have entered into an investment management agreement (“Management Agreement”) with the Investment Adviser. The Investment Adviser has overall responsibility for the management of the Portfolios. The Investment Adviser oversees all investment management and portfolio management services for the Portfolios and assists in managing and supervising all aspects of the general day-to-day business activities and operations of the Portfolios, including custodial, transfer agency, dividend disbursing, accounting, auditing, compliance and related services. This Management Agreement compensates the Investment Adviser with a management fee, computed daily and payable monthly, based on: 0.24% of each Portfolio’s average daily net assets invested in affiliated Underlying Funds and 0.34% of each Portfolio’s average daily net assets invested in unaffiliated Underlying Funds and/or other direct investments.
20
NOTES TO FINANCIAL STATEMENTS AS OF DECEMBER 31, 2019 (CONTINUED)
NOTE 4 — INVESTMENT MANAGEMENT FEES (continued)
The Investment Adviser has entered into a sub-advisory agreement with Voya IM with respect to each Portfolio. Voya IM provides investment advice for the Portfolios and is paid by the Investment Adviser based on the average daily net assets of each respective Portfolio. Subject to such policies as the Board or the Investment Adviser may determine, Voya IM manages the Portfolios’ assets in accordance with the Portfolios’ investment objectives, policies, and limitations.
NOTE 5 — DISTRIBUTION AND SERVICE FEES
The Trust has entered into a shareholder service and distribution plan (the “Agreement”) for the Class ADV shares of each Portfolio. The Agreement compensates the Distributor for the provision of shareholder services and/or account maintenance services and the distribution of shares to direct or indirect beneficial owners of Class ADV shares. Under the Agreement, each Portfolio makes payments to the Distributor a shareholder service fee of 0.25% and a distribution fee of 0.25% of each Portfolio’s average daily net assets attributable to Class ADV shares. The Distributor has contractually agreed to waive 0.2480%, 0.0751%, 0.1587% and 0.1106% of the distribution fee for the Class ADV shares of Conservative, Growth, Moderate and Moderate Growth, respectively. The actual distribution fee to be paid by Conservative, Growth, Moderate and Moderate Growth is at an annual rate of 0.002%, 0.1749%, 0.0913% and 0.1394%, respectively. Termination or modification of this obligation requires approval by the Board.
NOTE 6 — OTHER TRANSACTIONS WITH AFFILIATES AND RELATED PARTIES
At December 31, 2019, the following direct or indirect, wholly-owned subsidiary of Voya Financial, Inc. owned more than 5% of the following Portfolios:
| Subsidiary | | Portfolio | | Percentage |
|---|
| Voya Institutional Trust Company | | | Conservative | | | | 21.31 | % |
| | | | Moderate | | | | 8.22 | |
Under the 1940 Act, the direct or indirect beneficial owner of more than 25% of the voting securities of a company (including a fund) is presumed to control such company. Companies under common control (e.g., companies with a common owner of greater than 25% of their respective voting securities) are affiliates under the 1940 Act.
The Portfolios have adopted a deferred compensation plan (the “DC Plan”), which allows eligible independent trustees, as described in the DC Plan, to defer the receipt of all or a portion of the trustees’ fees that they are entitled to receive from the Portfolios. For purposes of determining the
amount owed to the trustee under the DC Plan, the amounts deferred are invested in shares of the funds selected by the trustee (the “Notional Funds”). The Portfolios purchase shares of the Notional Funds, which are all advised by Voya Investments, in amounts equal to the trustees’ deferred fees, resulting in a Portfolio asset equal to the deferred compensation liability. Such assets, if applicable, are included as a component of “Other assets” on the accompanying Statements of Assets and Liabilities. Deferral of trustees’ fees under the DC Plan will not affect net assets of the Portfolios, and will not materially affect the Portfolios’ assets, liabilities or net investment income per share. Amounts will be deferred until distributed in accordance with the DC Plan.
NOTE 7— EXPENSE LIMITATION AGREEMENT
The Investment Adviser has entered into a written expense limitation agreement (“Expense Limitation Agreement”) with each Portfolio whereby the Investment Adviser has agreed to limit expenses, excluding interest, taxes, investment-related costs, leverage expenses and extraordinary expenses to the levels listed below:
| Portfolio(1) | | | | Class ADV | | Class I |
|---|
| Conservative | | | | 0.92% | | 0.67% |
| Growth | | | | 1.07% | | 0.82% |
| Moderate | | | | 1.00% | | 0.75% |
| Moderate Growth | | | | 1.04% | | 0.79% |
(1) | | The operating expense limits take into account the operating expenses incurred at the Underlying Fund level. The amount of fees and expenses of an Underlying Fund borne by each Portfolio will vary based on each Portfolio’s allocation of assets to, and the net expenses of, a particular Underlying Fund. |
The Investment Adviser may at a later date recoup from a Portfolio for fees waived and/or other expenses reimbursed by the Investment Adviser during the previous 36 months but only if, after such recoupment, a Portfolio’s expense ratio does not exceed the percentage described above. Waived and reimbursed fees net of any recoupment by the Investment Adviser of such waived and reimbursed fees are reflected on the accompanying Statements of Operations. Amounts payable by the Investment Adviser are reflected on the accompanying Statements of Assets and Liabilities.
As of December 31, 2019, the Portfolios did not have any amount of waived and/or reimbursed fees that would be subject to possible recoupment.
The Expense Limitation Agreement is contractual through May 1, 2020 and shall renew automatically for one-year terms. Termination or modification of this obligation requires approval by the Board.
21
NOTES TO FINANCIAL STATEMENTS AS OF DECEMBER 31, 2019 (CONTINUED)
NOTE 8 — OTHER ACCRUED EXPENSES AND LIABILITIES
As of December 31, 2019, the below Portfolios had the following payables included in Other Accrued Expenses and Liabilities on the Statements of Assets and Liabilities that exceeded 5% of total liabilities:
| Portfolio | | Accrued
Expense | | Amount |
|---|
| Growth | | | Custody | | | $ | 123,452 | |
| Moderate | | | Custody | | | | 51,840 | |
| | | | Audit | | | | 11,308 | |
| Moderate Growth | | | Custody | | | | 88,341 | |
NOTE 9 — LINE OF CREDIT
Effective May 17, 2019, each Portfolio, in addition to certain other funds managed by the Investment Adviser, has entered into a 364-day unsecured committed revolving line of credit agreement (the “Credit Agreement”) with The Bank of New York Mellon (“BNY”) for an aggregate amount of $400,000,000 through May 15, 2020. The proceeds may be used only to finance temporarily: (1) the purchase or sale of investment securities; or (2) the repurchase or redemption of shares of a Portfolio or certain other funds managed by the
Investment Adviser. The funds to which the line of credit is available pay a commitment fee equal to 0.15% per annum on the daily unused portion of the committed line amount payable quarterly in arrears. Prior to May 17, 2019, the predecessor line of credit was for an aggregate amount of $400,000,000 and paid a commitment fee equal to 0.15% per annum on the daily unused portion of the committed line amount through May 17, 2019.
Borrowings under the Credit Agreement accrue interest at the federal funds rate plus a specified margin. Repayments generally must be made within 60 days after the date of a revolving credit advance.
The following Portfolios utilized the line of credit during the year ended December 31, 2019:
| Portfolio | | | | Days
Utilized | | Approximate
Average
Daily
Balance For
Days
Utilized | | Approximate
Weighted
Average
Interest Rate
For Days
Utilized |
|---|
| Conservative | | | | | 2 | | | $ | 1,378,000 | | | | 3.39 | % |
| Moderate | | | | | 3 | | | | 2,129,000 | | | | 3.39 | |
| Moderate Growth | | | | | 1 | | | | 1,423,000 | | | | 3.40 | |
NOTE 10 — CAPITAL SHARES
Transactions in capital shares and dollars were as follows:
| | | | | Shares
sold | | Shares
issued in
merger | | Reinvestment
of
distributions | | Shares
redeemed | | Net
increase
(decrease)
in shares
outstanding | | Shares
sold | | Proceeds
from
shares
issued in
merger | | Reinvestment
of
distributions | | Shares
redeemed | | Net
increase
(decrease) |
|---|
| Year or period ended | | | | # | | # | | # | | # | | # | | ($) | | ($) | | ($) | | | ($) | | | ($) |
|---|
| Conservative | | | | | | | | | | | | | | | | | | | | | | | | | | | | | | | | | | | | | | | | | | |
Class ADV | | | | | | | | | | | | | | | | | | | | | | | | | | | | | | | | | | | | | | | | | | |
| 12/31/2019 | | | | | 3,536,081 | | | | — | | | | 2,070,725 | | | | (6,686,497 | ) | | | (1,079,691 | ) | | | 31,837,511 | | | | — | | | | 18,553,699 | | | | (60,469,570 | ) | | | (10,078,360 | ) |
| 12/31/2018 | | | | | 2,841,914 | | | | — | | | | 2,298,064 | | | | (7,821,481 | ) | | | (2,681,503 | ) | | | 25,517,975 | | | | — | | | | 20,314,882 | | | | (70,204,573 | ) | | | (24,371,716 | ) |
Class I | | | | | | | | | | | | | | | | | | | | | | | | | | | | | | | | | | | | | | | | | | |
| 12/31/2019 | | | | | 12,992 | | | | — | | | | 384 | | | | (4,275 | ) | | | 9,101 | | | | 119,551 | | | | — | | | | 3,492 | | | | (40,146 | ) | | | 82,897 | |
| 12/31/2018 | | | | | 2,338 | | | | — | | | | 167 | | | | (386 | ) | | | 2,119 | | | | 21,409 | | | | — | | | | 1,494 | | | | (3,412 | ) | | | 19,491 | |
Growth | | | | | | | | | | | | | | | | | | | | | | | | | | | | | | | | | | | | | | | | | | |
Class ADV | | | | | | | | | | | | | | | | | | | | | | | | | | | | | | | | | | | | | | | | | | |
| 12/31/2019 | | | | | 863,657 | | | | — | | | | 18,906,477 | | | | (31,986,663 | ) | | | (12,216,529 | ) | | | 10,699,562 | | | | — | | | | 232,360,607 | | | | (402,854,268 | ) | | | (159,794,099 | ) |
| 12/31/2018 | | | | | 453,203 | | | | — | | | | 20,675,763 | | | | (28,248,002 | ) | | | (7,119,036 | ) | | | 6,059,810 | | | | — | | | | 266,303,828 | | | | (376,782,863 | ) | | | (104,419,225 | ) |
Class I | | | | | | | | | | | | | | | | | | | | | | | | | | | | | | | | | | | | | | | | | | |
| 12/31/2019 | | | | | 167,795 | | | | — | | | | 374,848 | | | | (640,968 | ) | | | (98,325 | ) | | | 2,132,616 | | | | — | | | | 4,625,627 | | | | (8,083,976 | ) | | | (1,325,733 | ) |
| 12/31/2018 | | | | | 170,333 | | | | — | | | | 370,683 | | | | (260,600 | ) | | | 280,416 | | | | 2,250,121 | | | | — | | | | 4,792,936 | | | | (3,474,422 | ) | | | 3,568,635 | |
Moderate | | | | | | | | | | | | | | | | | | | | | | | | | | | | | | | | | | | | | | | | | | |
Class ADV | | | | | | | | | | | | | | | | | | | | | | | | | | | | | | | | | | | | | | | | | | |
| 12/31/2019 | | | | | 1,921,994 | | | | — | | | | 5,709,967 | | | | (12,776,626 | ) | | | (5,144,665 | ) | | | 21,377,716 | | | | — | | | | 62,980,933 | | | | (142,891,944 | ) | | | (58,533,295 | ) |
| 12/31/2018 | | | | | 1,135,735 | | | | — | | | | 5,981,445 | | | | (13,952,186 | ) | | | (6,835,006 | ) | | | 12,809,304 | | | | — | | | | 66,693,112 | | | | (159,101,417 | ) | | | (79,599,001 | ) |
Class I | | | | | | | | | | | | | | | | | | | | | | | | | | | | | | | | | | | | | | | | | | |
| 12/31/2019 | | | | | 308,962 | | | | — | | | | 113,451 | | | | (215,680 | ) | | | 206,733 | | | | 3,496,818 | | | | — | | | | 1,264,979 | | | | (2,446,150 | ) | | | 2,315,647 | |
| 12/31/2018 | | | | | 145,008 | | | | — | | | | 111,157 | | | | (271,268 | ) | | | (15,103 | ) | | | 1,639,974 | | | | — | | | | 1,252,742 | | | | (3,028,894 | ) | | | (136,178 | ) |
Moderate Growth | | | | | | | | | | | | | | | | | | | | | | | | | | | | | | | | | | | | | | | | | | |
Class ADV | | | | | | | | | | | | | | | | | | | | | | | | | | | | | | | | | | | | | | | | | | |
| 12/31/2019 | | | | | 1,344,775 | | | | — | | | | 12,735,398 | | | | (24,267,390 | ) | | | (10,187,217 | ) | | | 15,703,112 | | | | — | | | | 146,075,017 | | | | (284,531,681 | ) | | | (122,753,552 | ) |
| 12/31/2018 | | | | | 791,749 | | | | — | | | | 14,269,721 | | | | (23,572,373 | ) | | | (8,510,903 | ) | | | 9,798,257 | | | | — | | | | 169,238,894 | | | | (289,159,538 | ) | | | (110,122,387 | ) |
Class I | | | | | | | | | | | | | | | | | | | | | | | | | | | | | | | | | | | | | | | | | | |
| 12/31/2019 | | | | | 183,304 | | | | — | | | | 165,836 | | | | (290,771 | ) | | | 58,369 | | | | 2,125,701 | | | | — | | | | 1,883,900 | | | | (3,404,265 | ) | | | 605,336 | |
| 12/31/2018 | | | | | 71,549 | | | | — | | | | 182,240 | | | | (322,173 | ) | | | (68,384 | ) | | | 872,860 | | | | — | | | | 2,141,323 | | | | (3,835,267 | ) | | | (821,084 | ) |
22
NOTES TO FINANCIAL STATEMENTS AS OF DECEMBER 31, 2019 (CONTINUED)
NOTE 11 — FEDERAL INCOME TAXES
The amount of distributions from net investment income and net realized capital gains are determined in accordance with federal income tax regulations, which may differ from GAAP for investment companies. These book/tax differences may be either temporary or permanent. Permanent differences are reclassified within the capital accounts based on their federal tax-basis treatment; temporary differences are not reclassified. Key differences include the treatment of short-term capital gains, foreign currency transactions, and wash sale deferrals. Distributions in excess of net investment income and/or net realized capital gains for tax purposes are reported as return of capital.
Dividends paid by the Portfolios from net investment income and distributions of net realized short-term capital gains are, for federal income tax purposes, taxable as ordinary income to shareholders.
The tax composition of dividends and distributions to shareholders was as follows:
| | | | Year Ended December 31, 2019 | | | Year Ended December 31, 2018 |
|---|
| | | | Ordinary
Income | | Long-term
Capital Gains | | | Ordinary
Income | | Long-term
Capital Gains |
|---|
| Conservative | | | | $ | 7,825,835 | | | $ | 10,731,399 | | | | $ | 8,436,851 | | | $ | 11,879,570 | |
| Growth | | | | | 47,827,676 | | | | 189,158,558 | | | | | 47,951,500 | | | | 223,145,264 | |
| Moderate | | | | | 19,898,150 | | | | 44,347,762 | | | | | 20,043,021 | | | | 47,902,833 | |
| Moderate Growth | | | | | 33,939,686 | | | | 114,019,231 | | | | | 34,349,570 | | | | 137,030,647 | |
The tax-basis components of distributable earnings as of December 31, 2019 were:
| | | | Undistributed
Ordinary
Income | | Undistributed
Long-term
Capital Gains | | Unrealized
Appreciation/
(Depreciation) |
|---|
| Conservative | | | | $ | 9,995,366 | | | $ | 8,004,494 | | | $ | 57,510,468 | |
| Growth | | | | | 56,092,200 | | | | 100,096,833 | | | | 191,356,987 | |
| Moderate | | | | | 21,825,297 | | | | 31,922,444 | | | | 53,555,216 | |
| Moderate Growth | | | | | 37,871,828 | | | | 71,904,054 | | | | 111,422,671 | |
At December 31, 2019, the Portfolios did not have any capital loss carryovers for U.S. federal income tax purposes.
The Portfolios’ major tax jurisdictions are U.S. federal, Arizona state, and Massachusetts state.
As of December 31, 2019, no provision for income tax is required in the Portfolios’ financial statements as a result of tax positions taken on federal and state income tax returns for open tax years. The Portfolios’ federal and state income and federal excise tax returns for tax years for which the applicable statutes of limitations have not expired are subject to examination by the Internal Revenue Service and state department of revenue. Generally, the earliest tax year that remains subject to examination by these jurisdictions is 2015.
NOTE 12 — OTHER ACCOUNTING PRONOUNCEMENTS
The Portfolios have made a change in accounting principle and adopted the provisions of Financial Accounting Standards Board (“FASB”) Accounting Standards Update 2017-08 (“ASU 2017-08”), Premium Amortization on Purchased Callable Debt Securities. ASU 2017-08 shortens the amortization period for certain callable debt securities held at a premium; specifically, requiring the premium to be amortized to the earliest call date. Prior to ASU 2017-08, premiums on callable debt securities were generally amortized to maturity date. ASU 2017-08 is intended to more closely align the amortization period with the expectations incorporated into the market pricing on the underlying security. ASU 2017-08 does not require an accounting change for securities held at a discount; the discount continues to be amortized to maturity date. Upon evaluation, the Portfolios have concluded that the change
in accounting principle does not materially impact the financial statement amounts.
Also, in August 2018, the FASB issued Accounting Standards Update 2018-13, Fair Value Measurement (Topic 820): Disclosure Framework — Changes to the Disclosure Requirements for Fair Value Measurement (“ASU 2018-13”). The update provides guidance that eliminates, adds and modifies certain disclosure requirements for fair value measurements. ASU 2018-13 will be effective for annual periods beginning after December 15, 2019 and interim periods within those annual periods. At this time, the Portfolios have elected to early adopt the amendments that allow for removal of disclosure requirements related to transfers between Level 1 and Level 2 of the fair value hierarchy and the timing of transfers between levels of the fair value hierarchy. These changes did not have a material impact on the Portfolios’ financial statements. The Portfolios plan to adopt the amendments that require additional fair value
23
NOTES TO FINANCIAL STATEMENTS AS OF DECEMBER 31, 2019 (CONTINUED)
NOTE 12 — OTHER ACCOUNTING
PRONOUNCEMENTS (continued)
measurement disclosures for annual periods beginning after December 15, 2019, and interim periods within those annual periods. The Portfolios are currently evaluating the impact of these changes on the financial statements.
NOTE 13 — AUDITOR CHANGE (UNAUDITED)
On September 12, 2019, KPMG LLP (“KPMG”) was dismissed as the independent registered public accounting firm to the Trust, on behalf of the Portfolios, upon completion of the audit for the fiscal year ended December 31, 2019. The decision to change independent registered public accounting firms was recommended by the Audit Committee of the Board and was approved by the Board.
KPMG’s reports on the Portfolios’ financial statements for the fiscal years ended December 31, 2019 and December 31, 2018 contained no adverse opinion or disclaimer of opinion nor were they qualified or modified as to uncertainty, audit scope or accounting principle.
During the fiscal years ended December 31, 2019 and December 31, 2018: (i) there were no disagreements with KPMG on any matter of accounting principles or practices, financial statement disclosure or auditing scope or procedure, which disagreements, if not resolved to the satisfaction of KPMG, would have caused KPMG to make reference to the subject matter of the disagreements in
connection with its reports on the Portfolios’ financial statements for such periods; and (ii) there were no “reportable events” of the kind described in Item 304(a)(1)(v) of Regulation S-K under the Securities Exchange Act of 1934, as amended.
On September 12, 2019, based on the recommendation of the Audit Committee of the Board, the Board approved the selection of Ernst & Young LLP (“EY”) as the Portfolios’ independent registered public accounting firm for the fiscal year ending December 31, 2020. During the Portfolios’ fiscal years ended December 31, 2019 and December 31, 2018, neither the Portfolios, nor anyone on their behalf, consulted with EY on items which: (i) concerned the application of accounting principles to a specified transaction, either completed or proposed, or the type of audit opinion that might be rendered on the Portfolios’ financial statements; or (ii) concerned the subject of a disagreement (as described in paragraph (a)(1)(iv) of Item 304 of Regulation S-K) or reportable events (as described in paragraph (a)(1)(v) of said Item 304).
NOTE 14 — SUBSEQUENT EVENTS
The Portfolios have evaluated events occurring after the Statements of Assets and Liabilities date (“subsequent events”) to determine whether any subsequent events necessitated adjustment to or disclosure in the financial statements. No such subsequent events were identified.
24
VOYA RETIREMENT
CONSERVATIVE PORTFOLIO | PORTFOLIO OF INVESTMENTS
AS OF DECEMBER 31, 2019 |
| | |
| Shares | | | | | | | | Value | | | Percentage
of Net
Assets |
|---|
| | | | | | | | | | | | | | | |
|---|
EXCHANGE-TRADED FUNDS: 8.9% |
| 669,401 | | | | | | Schwab U.S. TIPS ETF | | $ | 37,908,178 | | | | 8.9 | |
| | | | | | | Total Exchange-Traded Funds
(Cost $35,780,067) | | | 37,908,178 | | | | 8.9 | |
| | | | | | | | | | | | | | | |
MUTUAL FUNDS: 91.0% |
| | | | | | | Affiliated Investment Companies: 91.0% |
| 1,088,760 | | | | | | Voya Emerging Markets Index Portfolio — Class I | | | 13,326,416 | | | | 3.1 | |
| 1,623,413 | | | | | | Voya International Index Portfolio — Class I | | | 17,224,417 | | | | 4.1 | |
| 945,505 | | | | | | Voya RussellTM Mid Cap Index Portfolio — Class I | | | 12,906,139 | | | | 3.1 | |
| Shares | | | | | | | | Value | | | Percentage
of Net
Assets |
|---|
| | | | | | | | | | | | | | | |
|---|
MUTUAL FUNDS: (continued) |
| | | | | | | Affiliated Investment Companies: (continued) |
| 23,504,850 | | | | | | Voya U.S. Bond Index Portfolio — Class I | | $ | 256,202,871 | | | | 60.3 | |
| 5,106,260 | | | | | | Voya U.S. Stock Index Portfolio — Class I | | | 86,755,352 | | | | 20.4 | |
| | | | | | | | | | | | | | | |
| | | | | | | Total Mutual Funds
(Cost $327,602,735) | | | 386,415,195 | | | | 91.0 | |
| | | | | | | Total Investments in Securities
(Cost $363,382,802) | | $ | 424,323,373 | | | | 99.9 | |
| | | | | | | Assets in Excess of Other Liabilities | | | 555,651 | | | | 0.1 | |
| | | | | | | Net Assets | | $ | 424,879,024 | | | | 100.0 | |
Fair Value Measurementsˆ
The following is a summary of the fair valuations according to the inputs used as of December 31, 2019 in valuing the assets and liabilities:
| | | Quoted Prices
in Active Markets
for Identical
Investments
(Level 1) | | Significant
Other
Observable
Inputs
(Level 2) | | Significant
Unobservable
Inputs
(Level 3) | | Fair Value
at
December 31, 2019 |
|---|
Asset Table | | | | | | | | | | | | | | | | | | | | | |
Investments, at fair value | | | | | | | | | | | | | | | | | | | | | |
| Exchange-Traded Funds | | | | $ | 37,908,178 | | | | $ | — | | | | $ | — | | | | $ | 37,908,178 | |
| Mutual Funds | | | | | 386,415,195 | | | | | — | | | | | — | | | | | 386,415,195 | |
| Total Investments, at fair value | | | | $ | 424,323,373 | | | | $ | — | | | | $ | — | | | | $ | 424,323,373 | |
| ˆ | | See Note 2, “Significant Accounting Policies” in the Notes to Financial Statements for additional information. |
Transactions with Affiliates
An investment of at least 5% of the voting securities of an issuer, or a company which is under common control results in that issuer becoming an affiliated person as defined by the 1940 Act.
The following table provides transactions during the year ended December 31, 2019, where the following issuers were considered an affiliate:
| Issuer | | Beginning
Fair Value
at 12/31/2018 | | Purchases
at Cost | | Sales
at Cost | | Change in
Unrealized
Appreciation/
(Depreciation) | | Ending
Fair Value
at 12/31/2019 | | Investment
Income | | Realized
Gains/
(Losses) | | Net
Capital Gain
Distributions |
|---|
| Voya Australia Index Portfolio — Class I | | | $ | 1,992,187 | | | | $ | 237,383 | | | | $ | (2,276,598 | ) | | | $ | 47,028 | | | | $ | — | | | | $ | 152,300 | | | | $ | 132,554 | | | | $ | — | |
| Voya Emerging Markets Index Portfolio — Class I | | | | 7,971,688 | | | | | 6,203,968 | | | | | (2,585,951 | ) | | | | 1,736,711 | | | | | 13,326,416 | | | | | 192,270 | | | | | (192,598 | ) | | | | — | |
Voya Euro STOXX 50® Index Portfolio — Class I | | | | 7,981,842 | | | | | 907,059 | | | | | (8,567,642 | ) | | | | (321,259 | ) | | | | — | | | | | 514,097 | | | | | 1,035,764 | | | | | 17,274 | |
Voya FTSE 100 Index® Portfolio — Class I | | | | 4,985,947 | | | | | 1,072,661 | | | | | (6,705,229 | ) | | | | 646,621 | | | | | — | | | | | 506,431 | | | | | (830,571 | ) | | | | 160,769 | |
| Voya International Index Portfolio — Class I | | | | — | | | | | 16,774,327 | | | | | (818,872 | ) | | | | 1,268,962 | | | | | 17,224,417 | | | | | — | | | | | 24,578 | | | | | — | |
Voya Japan TOPIX Index® Portfolio — Class I | | | | 4,977,422 | | | | | 1,356,875 | | | | | (6,178,569 | ) | | | | (155,728 | ) | | | | — | | | | | 234,621 | | | | | (260,250 | ) | | | | 661,819 | |
| Voya RussellTM Mid Cap Index Portfolio — Class I | | | | 12,026,667 | | | | | 3,624,164 | | | | | (3,534,735 | ) | | | | 790,043 | | | | | 12,906,139 | | | | | 189,247 | | | | | 271,748 | | | | | 2,116,472 | |
| Voya U.S. Bond Index Portfolio — Class I | | | | 227,380,364 | | | | | 55,562,761 | | | | | (40,087,227 | ) | | | | 13,346,973 | | | | | 256,202,871 | | | | | 5,957,167 | | | | | (20,380 | ) | | | | — | |
See Accompanying Notes to Financial Statements
25
VOYA RETIREMENT
CONSERVATIVE PORTFOLIO | PORTFOLIO OF INVESTMENTS
AS OF DECEMBER 31, 2019 (CONTINUED) |
| | |
| Issuer | | Beginning
Fair Value
at 12/31/2018 | | Purchases
at Cost | | Sales
at Cost | | Change in
Unrealized
Appreciation/
(Depreciation) | | Ending
Fair Value
at 12/31/2019 | | Investment
Income | | Realized
Gains/
(Losses) | | Net
Capital Gain
Distributions |
|---|
| Voya U.S. Stock Index Portfolio — Class I | | | $ | 81,375,233 | | | | $ | 12,618,016 | | | | $ | (22,249,042 | ) | | | $ | 15,011,145 | | | | $ | 86,755,352 | | | | $ | 1,295,634 | | | | $ | 2,140,344 | | | | $ | 4,647,679 | |
| | | | $ | 348,691,350 | | | | $ | 98,357,214 | | | | $ | (93,003,865 | ) | | | $ | 32,370,496 | | | | $ | 386,415,195 | | | | $ | 9,041,767 | | | | $ | 2,301,189 | | | | $ | 7,604,013 | |
The financial statements for the above mutual fund[s] can be found at www.sec.gov.
At December 31, 2019, the aggregate cost of securities and other investments and the composition of unrealized appreciation and depreciation of securities and other investments at year end were:
| Cost for federal income tax purposes was $366,812,905. | | | | | | |
| Net unrealized appreciation consisted of: | | | | | | |
| Gross Unrealized Appreciation | | | | $ | 57,510,468 | |
| Gross Unrealized Depreciation | | | | | — | |
| Net Unrealized Appreciation | | | | $ | 57,510,468 | |
See Accompanying Notes to Financial Statements
26
VOYA RETIREMENT
GROWTH PORTFOLIO | PORTFOLIO OF INVESTMENTS
AS OF DECEMBER 31, 2019 |
| | |
| Shares | | | | | | | | Value | | | Percentage
of Net
Assets |
|---|
| | | | | | | | | | | | | | | |
|---|
EXCHANGE-TRADED FUNDS: 4.0% |
| 1,830,025 | | | | | | Schwab U.S. TIPS ETF | | $ | 103,634,316 | | | | 4.0 | |
| | | | | | | Total Exchange-Traded Funds
(Cost $103,127,551) | | | 103,634,316 | | | | 4.0 | |
| | | | | | | | | | | | | | | |
MUTUAL FUNDS: 96.0% |
| | | | | | | Affiliated Investment Companies: 96.0% |
| 13,174,742 | | | | | | Voya Emerging Markets Index Portfolio — Class I | | | 161,258,839 | | | | 6.2 | |
| 31,902,970 | | | | | | Voya International Index Portfolio — Class I | | | 338,490,510 | | | | 13.0 | |
| 15,243,093 | | | | | | Voya RussellTM Mid Cap Index Portfolio — Class I | | | 208,068,220 | | | | 8.0 | |
| 9,151,166 | | | | | | Voya RussellTM Small Cap Index Portfolio — Class I | | | 130,861,677 | | | | 5.0 | |
| | | | | | | | | | | | | | | |
| Shares | | | | | | | | Value | | | Percentage
of Net
Assets |
|---|
| | | | | | | | | | | | | | | |
|---|
MUTUAL FUNDS: (continued) |
| | | | | | | Affiliated Investment Companies: (continued) |
| 48,725,387 | | | | | | Voya U.S. Bond Index Portfolio — Class I | | $ | 531,106,717 | | | | 20.4 | |
| 66,384,133 | | | | | | Voya U.S. Stock Index Portfolio — Class I | | | 1,127,866,422 | | | | 43.4 | |
| | | | | | | | | | | | | | | |
| | | | | | | Total Mutual Funds
(Cost $2,285,295,759) | | | 2,497,652,385 | | | | 96.0 | |
| | | | | | | Total Investments in Securities
(Cost $2,388,423,310) | | $ | 2,601,286,701 | | | | 100.0 | |
| | | | | | | Assets in Excess of
Other Liabilities | | | 601,345 | | | | 0.0 | |
| | | | | | | Net Assets | | $ | 2,601,888,046 | | | | 100.0 | |
Fair Value Measurementsˆ
The following is a summary of the fair valuations according to the inputs used as of December 31, 2019 in valuing the assets and liabilities:
| | Quoted Prices
in Active Markets
for Identical
Investments
(Level 1) | | Significant
Other
Observable
Inputs
(Level 2) | | Significant
Unobservable
Inputs
(Level 3) | | Fair Value
at
December 31, 2019 |
Asset Table | | | | | | | | | | | | | | | | | | | | |
Investments, at fair value | | | | | | | | | | | | | | | | | | | | |
| Exchange-Traded Funds | | | $ | 103,634,316 | | | | $ | — | | | | $ | — | | | | $ | 103,634,316 | |
| Mutual Funds | | | | 2,497,652,385 | | | | | — | | | | | — | | | | | 2,497,652,385 | |
| Total Investments, at fair value | | | $ | 2,601,286,701 | | | | $ | — | | | | $ | — | | | | $ | 2,601,286,701 | |
| ˆ | | See Note 2, “Significant Accounting Policies” in the Notes to Financial Statements for additional information. |
Transactions with Affiliates
An investment of at least 5% of the voting securities of an issuer, or a company which is under common control results in that issuer becoming an affiliated person as defined by the 1940 Act.
The following table provides transactions during the year ended December 31, 2019, where the following issuers were considered an affiliate:
| Issuer | | Beginning
Fair Value
at 12/31/2018 | | | Purchases
at Cost | | | Sales
at Cost | | | Change in
Unrealized
Appreciation/
(Depreciation) | | | Ending
Fair Value
at 12/31/2019 | | | Investment
Income | | | Realized
Gains/
(Losses) | | | Net
Capital Gain
Distributions |
|---|
| Voya Australia Index Portfolio — Class I | | $ | 49,481,579 | | | | $ | 4,181,646 | | | | $ | (57,221,516 | ) | | | $ | 3,558,291 | | | | $ | — | | | | $ | 4,139,390 | | | | $ | 566,939 | | | | $ | — | |
| Voya Emerging Markets Index Portfolio — Class I | | | 198,002,353 | | | | | 31,211,547 | | | | | (79,006,599 | ) | | | | 11,051,538 | | | | | 161,258,839 | | | | | 4,885,048 | | | | | 15,618,974 | | | | | — | |
Voya Euro STOXX 50® Index Portfolio — Class I | | | 179,675,732 | | | | | 12,083,507 | | | | | (204,468,243 | ) | | | | 12,709,004 | | | | | — | | | | | 9,047,950 | | | | | 6,519,461 | | | | | 397,752 | |
Voya FTSE 100 Index® Portfolio — Class I | | | 111,460,367 | | | | | 15,834,001 | | | | | (151,707,087 | ) | | | | 24,412,719 | | | | | — | | | | | 9,228,041 | | | | | (26,024,761 | ) | | | | 3,676,432 | |
| Voya Hang Seng Index Portfolio — Class I | | | 12,471,301 | | | | | 4,032,170 | | | | | (17,598,749 | ) | | | | 1,095,278 | | | | | — | | | | | 705,863 | | | | | (3,904,467 | ) | | | | 2,721,391 | |
| Voya International Index Portfolio — Class I | | | — | | | | | 334,268,512 | | | | | (20,416,379 | ) | | | | 24,638,377 | | | | | 338,490,510 | | | | | — | | | | | 1,101,240 | | | | | — | |
Voya Japan TOPIX Index® Portfolio — Class I | | | 117,444,474 | | | | | 25,018,988 | | | | | (150,706,721 | ) | | | | 8,243,259 | | | | | — | | | | | 4,602,459 | | | | | (15,810,811 | ) | | | | 13,587,373 | |
| Voya RussellTM Mid Cap Index Portfolio — Class I | | | 248,982,632 | | | | | 52,012,553 | | | | | (125,864,302 | ) | | | | 32,937,337 | | | | | 208,068,220 | | | | | 3,998,725 | | | | | (16,762,454 | ) | | | | 44,805,352 | |
See Accompanying Notes to Financial Statements
27
VOYA RETIREMENT
GROWTH PORTFOLIO | PORTFOLIO OF INVESTMENTS
AS OF DECEMBER 31, 2019 (CONTINUED) |
| | |
| Issuer | | Beginning
Fair Value
at 12/31/2018 | | | Purchases
at Cost | | | Sales
at Cost | | | Change in
Unrealized
Appreciation/
(Depreciation) | | | Ending
Fair Value
at 12/31/2019 | | | Investment
Income | | | Realized
Gains/
(Losses) | | | Net
Capital Gain
Distributions |
|---|
| Voya RussellTM Small Cap Index Portfolio — Class I | | $ | 124,268,952 | | | | $ | 27,614,381 | | | | $ | (33,782,314 | ) | | | $ | 12,760,658 | | | | $ | 130,861,677 | | | | $ | 1,413,744 | | | | $ | 2,420,441 | | | | $ | 13,475,555 | |
| Voya U.S. Bond Index Portfolio — Class I | | | 619,470,485 | | | | | 105,140,375 | | | | | (226,020,677 | ) | | | | 32,516,534 | | | | | 531,106,717 | | | | | 14,304,153 | | | | | 2,705,259 | | | | | — | |
| Voya U.S. Stock Index Portfolio — Class I | | | 834,331,314 | | | | | 334,766,116 | | | | | (196,045,440 | ) | | | | 154,814,432 | | | | | 1,127,866,422 | | | | | 16,982,534 | | | | | 26,480,510 | | | | | 61,927,417 | |
| | | $ | 2,495,589,189 | | | | $ | 946,163,796 | | | | $ | (1,262,838,027 | ) | | | $ | 318,737,427 | | | | $ | 2,497,652,385 | | | | $ | 69,307,907 | | | | $ | (7,089,670 | ) | | | $ | 140,591,273 | |
The financial statements for the above mutual fund[s] can be found at www.sec.gov.
At December 31, 2019, the aggregate cost of securities and other investments and the composition of unrealized appreciation and depreciation of securities and other investments at year end were:
| Cost for federal income tax purposes was $2,409,929,714. | | | | | | |
| Net unrealized appreciation consisted of: | | | | | | |
| Gross Unrealized Appreciation | | | | $ | 191,356,987 | |
| Gross Unrealized Depreciation | | | | | — | |
| Net Unrealized Appreciation | | | | $ | 191,356,987 | |
See Accompanying Notes to Financial Statements
28
VOYA RETIREMENT
MODERATE PORTFOLIO | PORTFOLIO OF INVESTMENTS
AS OF DECEMBER 31, 2019 |
| | |
| Shares | | | | | Value | | Percentage
of Net
Assets |
|---|
| | | | | | | | | | | | |
|---|
EXCHANGE-TRADED FUNDS: 8.9% |
| 1,625,130 | | | Schwab U.S. TIPS ETF | | $ | 92,031,112 | | | | 8.9 | |
| | | | Total Exchange-Traded Funds
(Cost $88,583,315) | | | 92,031,112 | | | | 8.9 | |
| | | | | | | | | | | | |
MUTUAL FUNDS: 91.0% |
| | | | Affiliated Investment Companies: 91.0% |
| 3,499,798 | | | Voya Emerging Markets Index Portfolio — Class I | | | 42,837,528 | | | | 4.2 | |
| 6,847,247 | | | Voya International Index Portfolio — Class I | | | 72,649,288 | | | | 7.1 | |
| 3,038,211 | | | Voya RussellTM Mid Cap Index Portfolio — Class I | | | 41,471,573 | | | | 4.0 | |
| 1,459,016 | | | Voya RussellTM Small Cap Index Portfolio — Class I | | | 20,863,928 | | | | 2.0 | |
| Shares | | | | | Value | | Percentage
of Net
Assets |
|---|
| | | | | | | | | | | | |
MUTUAL FUNDS: (continued) |
| | | | Affiliated Investment Companies: (continued) |
| 37,986,908 | | | Voya U.S. Bond Index Portfolio — Class I | | $ | 414,057,294 | | | | 40.2 | |
| 20,306,771 | | | Voya U.S. Stock Index Portfolio — Class I | | | 345,012,032 | | | | 33.5 | |
| | | | | | | | | | | | |
| | | | Total Mutual Funds | | | | | | | | |
| | | | (Cost $874,751,639) | | | 936,891,643 | | | | 91.0 | |
| | | | Total Investments in Securities
(Cost $963,334,954) | | $ | 1,028,922,755 | | | | 99.9 | |
| | | | Assets in Excess of Other Liabilities | | | 1,245,818 | | | | 0.1 | |
| | | | Net Assets | | $ | 1,030,168,573 | | | | 100.0 | |
Fair Value Measurementsˆ
The following is a summary of the fair valuations according to the inputs used as of December 31, 2019 in valuing the assets and liabilities:
| | Quoted Prices
in Active Markets
for Identical
Investments
(Level 1) | | Significant
Other
Observable
Inputs
(Level 2) | | Significant
Unobservable
Inputs
(Level 3) | | Fair Value
at
December 31, 2019 |
Asset Table | | | | | | | | | | | | | | | | | | | | |
|---|
Investments, at fair value | | | | | | | | | | | | | | | | | | | | |
| Exchange-Traded Funds | | | $ | 92,031,112 | | | | $ | — | | | | $ | — | | | | $ | 92,031,112 | |
| Mutual Funds | | | | 936,891,643 | | | | | — | | | | | — | | | | | 936,891,643 | |
| | | | | | | | | | | | | | | | | | | | | |
| Total Investments, at fair value | | | $ | 1,028,922,755 | | | | $ | — | | | | $ | — | | | | $ | 1,028,922,755 | |
| ˆ | | See Note 2, “Significant Accounting Policies” in the Notes to Financial Statements for additional information. |
Transactions with Affiliates
An investment of at least 5% of the voting securities of an issuer, or a company which is under common control results in that issuer becoming an affiliated person as defined by the 1940 Act.
The following table provides transactions during the year ended December 31, 2019, where the following issuers were considered an affiliate:
| Issuer | | Beginning
Fair Value
at 12/31/2018 | | | Purchases
at Cost | | | Sales
at Cost | | | Change in
Unrealized
Appreciation/
(Depreciation) | | | Ending
Fair Value
at 12/31/2019 | | | Investment
Income | | | Realized
Gains/
(Losses) | | | Net
Capital Gain
Distributions |
|---|
| Voya Australia Index Portfolio — Class I | | $ | 12,296,337 | | | | $ | 1,100,203 | | | | $ | (14,345,702 | ) | | | $ | 949,162 | | | | $ | — | | | | $ | 1,000,023 | | | | $ | 104,793 | | | | $ | — | |
| Voya Emerging Markets Index Portfolio — Class I | | | 49,203,837 | | | | | 8,460,363 | | | | | (17,505,966 | ) | | | | 2,679,294 | | | | | 42,837,528 | | | | | 1,190,086 | | | | | 4,133,215 | | | | | — | |
Voya Euro STOXX 50® Index Portfolio — Class I | | | 44,340,615 | | | | | 2,519,580 | | | | | (49,217,592 | ) | | | | 2,357,397 | | | | | — | | | | | 2,141,950 | | | | | 2,466,899 | | | | | 96,234 | |
Voya FTSE 100 Index® Portfolio — Class I | | | 29,544,153 | | | | | 4,415,392 | | | | | (39,673,102 | ) | | | | 5,713,557 | | | | | — | | | | | 2,316,742 | | | | | (5,818,862 | ) | | | | 955,330 | |
| Voya Hang Seng Index Portfolio — Class I | | | 2,478,931 | | | | | 721,109 | | | | | (3,467,047 | ) | | | | 267,007 | | | | | — | | | | | 91,345 | | | | | (669,386 | ) | | | | 460,665 | |
| Voya International Index Portfolio — Class I | | | — | | | | | 71,576,500 | | | | | (4,219,877 | ) | | | | 5,292,665 | | | | | 72,649,288 | | | | | — | | | | | 209,543 | | | | | — | |
Voya Japan TOPIX Index® Portfolio — Class I | | | 29,492,908 | | | | | 6,131,619 | | | | | (37,717,498 | ) | | | | 2,092,971 | | | | | — | | | | | 1,121,773 | | | | | (3,955,054 | ) | | | | 3,319,639 | |
| Voya RussellTM Mid Cap Index Portfolio — Class I | | | 49,492,264 | | | | | 11,753,736 | | | | | (24,002,233 | ) | | | | 4,227,806 | | | | | 41,471,573 | | | | | 779,441 | | | | | (842,662 | ) | | | | 8,732,335 | |
See Accompanying Notes to Financial Statements
29
VOYA RETIREMENT
MODERATE PORTFOLIO | PORTFOLIO OF INVESTMENTS
as of December 31, 2019 (continued) |
| | |
| Issuer | | Beginning
Fair Value
at 12/31/2018 | | | Purchases
at Cost | | | Sales
at Cost | | | Change in
Unrealized
Appreciation/
(Depreciation) | | | Ending
Fair Value
at 12/31/2019 | | | Investment
Income | | | Realized
Gains/
(Losses) | | | Net
Capital Gain
Distributions |
|---|
| Voya RussellTM Small Cap Index Portfolio — Class I | | $ | 29,643,384 | | | | $ | 6,793,995 | | | | $ | (18,217,196 | ) | | | $ | 2,643,745 | | | | $ | 20,863,928 | | | | $ | 329,490 | | | | $ | 339,082 | | | | $ | 3,151,970 | |
| Voya U.S. Bond Index Portfolio — Class I | | | 433,423,330 | | | | | 63,110,992 | | | | | (105,854,263 | ) | | | | 23,377,235 | | | | | 414,057,294 | | | | | 10,420,142 | | | | | 1,283,494 | | | | | — | |
| Voya U.S. Stock Index Portfolio — Class I | | | 251,208,625 | | | | | 110,162,048 | | | | | (63,699,561 | ) | | | | 47,340,920 | | | | | 345,012,032 | | | | | 5,176,123 | | | | | 7,448,566 | | | | | 18,625,607 | |
| | | $ | 931,124,384 | | | | $ | 286,745,537 | | | | $ | (377,920,037 | ) | | | $ | 96,941,759 | | | | $ | 936,891,643 | | | | $ | 24,567,115 | | | | $ | 4,699,626 | | | | $ | 35,341,781 | |
The financial statements for the above mutual fund[s] can be found at www.sec.gov.
At December 31, 2019, the aggregate cost of securities and other investments and the composition of unrealized appreciation and depreciation of securities and other investments at year end were:
| Cost for federal income tax purposes was $975,367,539. | | | | | | |
| Net unrealized appreciation consisted of: | | | | | | |
| Gross Unrealized Appreciation | | | | $ | 53,866,885 | |
| Gross Unrealized Depreciation | | | | | (311,669 | ) |
| Net Unrealized Appreciation | | | | $ | 53,555,216 | |
See Accompanying Notes to Financial Statements
30
VOYA RETIREMENT MODERATE
GROWTH PORTFOLIO | PORTFOLIO OF INVESTMENTS
AS OF DECEMBER 31, 2019 |
| | |
| Shares | | | | | Value | | Percentage
of Net
Assets |
|---|
| | | | | | | | | | | | |
|---|
EXCHANGE-TRADED FUNDS: 5.9% |
| 1,884,850 | | | Schwab U.S. TIPS ETF | | $ | 106,739,056 | | | | 5.9 | |
| | | | Total Exchange-Traded Funds | | | | | | | | |
| | | | (Cost $106,208,370) | | | 106,739,056 | | | | 5.9 | |
| | | | | | | | | | | | |
MUTUAL FUNDS: 94.0% |
| | | | Affiliated Investment Companies: 94.0% |
| 7,577,283 | | | Voya Emerging Markets Index Portfolio — Class I | | | 92,745,944 | | | | 5.2 | |
| 15,245,728 | | | Voya International Index Portfolio — Class I | | | 161,757,171 | | | | 9.0 | |
| 6,576,360 | | | Voya RussellTM Mid Cap Index Portfolio — Class I | | | 89,767,314 | | | | 5.0 | |
| 3,789,987 | | | Voya RussellTM Small Cap Index Portfolio — Class I | | | 54,196,817 | | | | 3.0 | |
| Shares | | | | | Value | | Percentage
of Net
Assets |
|---|
MUTUAL FUNDS: (continued) |
| | | | Affiliated Investment Companies: (continued) |
| 46,485,799 | | | Voya U.S. Bond Index Portfolio — Class I | | $ | 506,695,208 | | | | 28.3 | |
| 45,822,090 | | | Voya U.S. Stock Index Portfolio — Class I | | | 778,517,305 | | | | 43.5 | |
| | | | | | | | | | | | |
| | | | Total Mutual Funds | | | | | | | | |
| | | | (Cost $1,554,400,215) | | | 1,683,679,759 | | | | 94.0 | |
| | | | Total Investments in Securities
(Cost $1,660,608,585) | | $ | 1,790,418,815 | | | | 99.9 | |
| | | | Assets in Excess of Other Liabilities | | | 1,161,223 | | | | 0.1 | |
| | | | Net Assets | | $ | 1,791,580,038 | | | | 100.0 | |
Fair Value Measurementsˆ
The following is a summary of the fair valuations according to the inputs used as of December 31, 2019 in valuing the assets and liabilities:
| | Quoted Prices
in Active Markets
for Identical
Investments
(Level 1) | | Significant
Other
Observable
Inputs
(Level 2) | | Significant
Unobservable
Inputs
(Level 3) | | Fair Value
at
December 31, 2019 |
|---|
Asset Table | | | | | | | | | | | | | | | | | | | | |
Investments, at fair value | | | | | | | | | | | | | | | | | | | | |
| Exchange-Traded Funds | | | $ | 106,739,056 | | | | $ | — | | | | $ | — | | | | $ | 106,739,056 | |
| Mutual Funds | | | | 1,683,679,759 | | | | | — | | | | | — | | | | | 1,683,679,759 | |
| Total Investments, at fair value | | | $ | 1,790,418,815 | | | | $ | — | | | | $ | — | | | | $ | 1,790,418,815 | |
| ˆ | | See Note 2, “Significant Accounting Policies” in the Notes to Financial Statements for additional information. |
Transactions with Affiliates
An investment of at least 5% of the voting securities of an issuer, or a company which is under common control results in that issuer becoming an affiliated person as defined by the 1940 Act.
The following table provides transactions during the year ended December 31, 2019, where the following issuers were considered an affiliate:
| Issuer | | Beginning
Fair Value
at 12/31/2018 | | | Purchases
at Cost | | | Sales
at Cost | | | Change in
Unrealized
Appreciation/
(Depreciation) | | | Ending
Fair Value
at 12/31/2019 | | | Investment
Income | | | Realized
Gains/
(Losses) | | | Net
Capital Gain
Distributions |
|---|
| Voya Australia Index Portfolio — Class I | | $ | 30,157,385 | | | | $ | 2,522,988 | | | | $ | (34,781,059 | ) | | | $ | 2,100,686 | | | | $ | — | | | | $ | 2,401,112 | | | | $ | 614,465 | | | | $ | — | |
| Voya Emerging Markets Index Portfolio — Class I | | | 120,675,523 | | | | | 19,465,179 | | | | | (51,247,855 | ) | | | | 3,853,097 | | | | | 92,745,944 | | | | | 2,939,094 | | | | | 12,052,771 | | | | | — | |
Voya Euro STOXX 50® Index Portfolio — Class I | | | 94,940,229 | | | | | 6,164,064 | | | | | (106,545,065 | ) | | | | 5,440,772 | | | | | — | | | | | 4,612,817 | | | | | 4,918,127 | | | | | 207,495 | |
Voya FTSE 100 Index® Portfolio — Class I | | | 64,695,971 | | | | | 8,640,609 | | | | | (86,921,232 | ) | | | | 13,584,652 | | | | | — | | | | | 4,614,248 | | | | | (13,455,469 | ) | | | | 2,106,616 | |
| Voya Hang Seng Index Portfolio — Class I | | | 4,343,073 | | | | | 6,048,781 | | | | | (10,841,722 | ) | | | | 449,868 | | | | | — | | | | | 325,328 | | | | | (1,960,201 | ) | | | | 1,060,330 | |
| Voya International Index Portfolio — Class I | | | — | | | | | 158,429,033 | | | | | (8,474,869 | ) | | | | 11,803,007 | | | | | 161,757,171 | | | | | — | | | | | 425,578 | | | | | — | |
Voya Japan TOPIX Index® Portfolio — Class I | | | 64,582,429 | | | | | 13,446,995 | | | | | (82,284,023 | ) | | | | 4,254,599 | | | | | — | | | | | 2,515,021 | | | | | (8,450,141 | ) | | | | 7,413,163 | |
| Voya RussellTM Mid Cap Index Portfolio — Class I | | | 121,391,291 | | | | | 26,426,563 | | | | | (68,981,139 | ) | | | | 10,930,599 | | | | | 89,767,314 | | | | | 1,923,606 | | | | | (3,648,675 | ) | | | | 21,566,549 | |
See Accompanying Notes to Financial Statements
31
VOYA RETIREMENT MODERATE
GROWTH PORTFOLIO | PORTFOLIO OF INVESTMENTS
AS OF DECEMBER 31, 2019 (CONTINUED) |
| | |
| Issuer | | Beginning
Fair Value
at 12/31/2018 | | Purchases
at Cost | | Sales
at Cost | | Change in
Unrealized
Appreciation/
(Depreciation) | | Ending
Fair Value
at 12/31/2019 | | Investment
Income | | Realized
Gains/
(Losses) | | Net
Capital Gain
Distributions |
|---|
| Voya RussellTM Small Cap Index Portfolio — Class I | | | $ | 69,243,522 | | | | $ | 15,142,932 | | | | $ | (36,889,991 | ) | | | $ | 6,700,354 | | | | $ | 54,196,817 | | | | $ | 775,528 | | | | $ | 542,260 | | | | $ | 7,412,787 | |
| Voya U.S. Bond Index Portfolio — Class I | | | | 604,068,266 | | | | | 92,849,550 | | | | | (221,099,948 | ) | | | | 30,877,340 | | | | | 506,695,208 | | | | | 13,723,264 | | | | | 3,023,122 | | | | | — | |
| Voya U.S. Stock Index Portfolio — Class I | | | | 563,433,903 | | | | | 250,686,760 | | | | | (141,991,977 | ) | | | | 106,388,619 | | | | | 778,517,305 | | | | | 11,709,102 | | | | | 16,278,764 | | | | | 42,581,428 | |
| | | | $ | 1,737,531,592 | | | | $ | 599,823,454 | | | | $ | (850,058,880 | ) | | | $ | 196,383,593 | | | | $ | 1,683,679,759 | | | | $ | 45,539,120 | | | | $ | 10,340,599 | | | | $ | 82,348,370 | |
The financial statements for the above mutual fund[s] can be found at www.sec.gov.
At December 31, 2019, the aggregate cost of securities and other investments and the composition of unrealized appreciation and depreciation of securities and other investments at year end were:
| Cost for federal income tax purposes was $1,678,996,144. |
| Net unrealized appreciation consisted of: | | | | | | |
| Gross Unrealized Appreciation | | | | $ | 111,739,158 | |
| Gross Unrealized Depreciation | | | | | (316,487 | ) |
| Net Unrealized Appreciation | | | | $ | 111,422,671 | |
See Accompanying Notes to Financial Statements
32
TAX INFORMATION (UNAUDITED)
Dividends and distributions paid during the year ended December 31, 2019 were as follows:
| Portfolio Name | | | | Type | | Per Share Amount |
|---|
| Voya Retirement Conservative Portfolio | | | | | | | | | | |
| Class ADV | | | | NII | | $ | 0.1713 | |
| Class I | | | | NII | | $ | 0.1953 | |
| All Classes | | | | STCG | | $ | 0.0016 | |
| All Classes | | | | LTCG | | $ | 0.2371 | |
| Voya Retirement Growth Portfolio | | | | | | | | | | |
| Class ADV | | | | NII | | $ | 0.2414 | |
| Class I | | | | NII | | $ | 0.3035 | |
| All Classes | | | | LTCG | | $ | 0.9593 | |
| Portfolio Name | | | | Type | | Per Share Amount |
|---|
| Voya Retirement Moderate Portfolio | | | | | | | | | | |
| Class ADV | | | | NII | | $ | 0.2248 | |
| Class I | | | | NII | | $ | 0.2677 | |
| All Classes | | | | LTCG | | $ | 0.5028 | |
| Voya Retirement Moderate Growth Portfolio | | | | | | | | | | |
| Class ADV | | | | NII | | $ | 0.2313 | |
| Class I | | | | NII | | $ | 0.2843 | |
| All Classes | | | | LTCG | | $ | 0.7792 | |
NII — Net investment income
STCG — Short-term capital gain
LTCG — Long-term capital gain
Of the ordinary distributions made during the year ended December 31, 2019, the following percentages qualify for the dividends received deduction (DRD) available to corporate shareholders:
| Voya Retirement Conservative Portfolio | | | | | | | 23.90% | |
| Voya Retirement Growth Portfolio | | | | | | | 46.11% | |
| Voya Retirement Moderate Portfolio | | | | | | | 31.96% | |
| Voya Retirement Moderate Growth Portfolio | | | | | | | 42.95% | |
The Portfolios designate the following amounts of long-term capital gain distributions as 20% rate long-term capital gain dividends under Internal Revenue Code Section 852(b)(3)(C):
| Voya Retirement Conservative Portfolio | | $ | 10,731,399 | |
| Voya Retirement Growth Portfolio | | $ | 189,158,558 | |
| Voya Retirement Moderate Portfolio | | $ | 44,347,762 | |
| Voya Retirement Moderate Growth Portfolio | | $ | 114,019,231 | |
The Regulated Investment Company Modernization Act of 2010 allows qualified fund-of-funds to elect to pass through the ability to take foreign tax credits (or deductions) to the extent that foreign taxes are passed through from underlying funds. A qualified fund-of-funds is a regulated investment company that has at least 50% of the value of its total assets invested in other regulated investment companies at the end of each quarter of the taxable year. Pursuant to Section 853 of the Internal Revenue Code, the Portfolios designate the following amounts as foreign taxes paid for the year ended December 31, 2019:
| | Creditable
Foreign Taxes
Paid | | Per Share
Amount | | Portion of Ordinary Income
Distribution Derived from
Foreign Sourced Income* |
|---|
| Voya Retirement Conservative Portfolio | | $ | 35,060 | | | $ | 0.0008 | | | | 6.28% | |
| Voya Retirement Growth Portfolio | | $ | 425,967 | | | $ | 0.0021 | | | | 21.29% | |
| Voya Retirement Moderate Portfolio | | $ | 113,074 | | | $ | 0.0013 | | | | 13.26% | |
| Voya Retirement Moderate Growth Portfolio | | $ | 244,999 | | | $ | 0.0017 | | | | 17.25% | |
| * | | None of the Portfolios listed above derived any income from ineligible foreign sources as defined under Section 901(j) of the Internal Revenue Code. |
Foreign taxes paid or withheld should be included in taxable income with an offsetting deduction from gross income or as a credit for taxes paid to foreign governments. Shareholders are strongly advised to consult their own tax advisors regarding the appropriate treatment of foreign taxes paid.
Above figures may differ from those cited elsewhere in this report due to differences in the calculation of income and gains under U.S. generally accepted accounting principles (book) purposes and Internal Revenue Service (tax) purposes.
Shareholders are strongly advised to consult their own tax advisers with respect to the tax consequences of their investments in the Portfolios. In January, shareholders, excluding corporate shareholders, receive an IRS 1099-DIV regarding the federal tax status of the dividends and distributions they received in the calendar year.
33
TRUSTEE AND OFFICER INFORMATION (UNAUDITED)
The business and affairs of the Trust are managed under the direction of the Board. A Trustee, who is not an interested person of the Trust, as defined in the 1940 Act, is an independent trustee (“Independent Trustee”). The Trustees and Officers of the Trust are listed below. The Statement of Additional Information includes additional information about Trustees of the Trust and is available, without charge, upon request at (800) 366-0066.
| Name, Address and Age | | Position(s)
Held with
the Trust | | Term of Office
and Length of
Time Served(1) | | Principal Occupation(s) —
During the Past 5 Years | | Number of
funds in
Fund
Complex
Overseen by
Trustee(2) | | Other Board Positions
Held by Trustee |
|---|
| | | | | | | | | | | |
Independent Trustees*: | | | | | | | | |
| | | | | | | | | | | |
Colleen D. Baldwin
7337 East Doubletree Ranch Rd.
Suite 100
Scottsdale, Arizona 85258
Age: 59 | | Trustee
Chairperson | | November
2007–Present
January
2020–Present | | President, Glantuam Partners, LLC, a business consulting firm (January
2009–Present). | | 146 | | Dentaquest (February 2014–Present); RSR Partners, Inc.
(2016–Present). |
| | | | | | | | | | | |
John V. Boyer
7337 East Doubletree Ranch Rd.
Suite 100
Scottsdale, Arizona 85258
Age: 66 | | Trustee | | January
2005–Present | | Retired. Formerly, President and Chief Executive Officer, Bechtler Arts Foundation, an arts and education foundation (January 2008–December 2019). | | 146 | | None. |
| | | | | | | | | | | |
Patricia W. Chadwick
7337 East Doubletree Ranch Rd.
Suite 100
Scottsdale, Arizona 85258
Age: 71 | | Trustee | | January
2006–Present | | Consultant and President, Ravengate Partners LLC, a consulting firm that provides advice regarding financial markets and the global economy (January
2000–Present). | | 146 | | Wisconsin Energy Corporation (June
2006–Present); The Royce Fund (22 funds) (December 2009–Present); and AMICA Mutual Insurance Company (1992–Present). |
| | | | | | | | | | | |
Martin J. Gavin
7337 East Doubletree Ranch Rd.
Suite 100
Scottsdale, AZ 85258
Age: 69 | | Trustee | | August
2015–Present | | Retired. Formerly, President and Chief Executive Officer, Connecticut Children’s Medical Center (May 2006–November 2015). | | 146 | | None. |
| | | | | | | | | | | |
Joseph E. Obermeyer
7337 East Doubletree Ranch Rd.
Suite 100
Scottsdale, Arizona 85258
Age: 62 | | Trustee | | May
2013–Present | | President, Obermeyer & Associates, Inc., a provider of financial and economic consulting services (November 1999–Present). | | 146 | | None. |
| | | | | | | | | | | |
Sheryl K. Pressler
7337 East Doubletree Ranch Rd.
Suite 100
Scottsdale, Arizona 85258
Age: 69 | | Trustee | | January
2006–Present | | Consultant (May
2001–Present). | | 146 | | None. |
| | | | | | | | | | | |
Christopher P. Sullivan
7337 East Doubletree Ranch Rd.
Suite 100
Scottsdale, Arizona 85258
Age: 66 | | Trustee | | October
2015–Present | | Retired. | | 146 | | None. |
34
TRUSTEE AND OFFICER INFORMATION (UNAUDITED) (CONTINUED)
| Name, Address and Age | | Position(s)
Held with
the Trust | | Term of Office
and Length of
Time Served(1) | | Principal Occupation(s) —
During the Past 5 Years | | Number of
funds in
Fund
Complex
Overseen by
Trustee(2) | | Other Board Positions
Held by Trustee |
|---|
| | | | | | | | | | | |
Trustee who is an “interested person”: | | | | | | |
| | | | | | | | | | | |
Dina Santoro
230 Park Avenue
New York, New York 10169
Age: 46 | | Trustee | | July
2018–Present | | President, Voya Investments, LLC and Voya Capital, LLC (March 2018–Present); Senior Vice President, Voya Investments Distributor, LLC (April 2018–Present); Senior Managing Director, Head of Product and Marketing Strategy, Voya Investment Management (September 2017–Present). Formerly, Managing Director, Quantitative Management Associates, LLC (January 2004–August 2017). | | 146 | | Voya Investments, LLC, Voya Capital, LLC, and Voya Funds Services, LLC (March 2018–Present); Voya Investments Distributor, LLC (April 2018–Present). |
(1) | | Trustees serve until their successors are duly elected and qualified. The tenure of each Trustee who is not an “interested person” as defined in the 1940 Act, of each Portfolio (“Independent Trustee”) is subject to the Board’s retirement policy which states that each duly elected or appointed Independent Trustee shall retire from and cease to be a member of the Board of Trustees at the close of business on December 31 of the calendar year in which the Independent Trustee attains the age of 75. A majority vote of the Board’s other Independent Trustees may extend the retirement date of an Independent Trustee if the retirement would trigger a requirement to hold a meeting of shareholders of the Trust under applicable law, whether for the purposes of appointing a successor to the Independent Trustee or otherwise comply under applicable law, in which case the extension would apply until such time as the shareholder meeting can be held or is no longer required (as determined by a vote of a majority of the other Independent Trustees). |
| | | |
(2) | | For the purposes of this table, “Fund Complex” means the Voya family of funds including the following investment companies: Voya Asia Pacific High Dividend Equity Income Fund; Voya Balanced Portfolio, Inc.; Voya Emerging Markets High Dividend Equity Fund; Voya Equity Trust; Voya Funds Trust; Voya Global Advantage and Premium Opportunity Fund; Voya Global Equity Dividend and Premium Opportunity Fund; Voya Government Money Market Portfolio; Voya Infrastructure, Industrials and Materials Fund; Voya Intermediate Bond Portfolio; Voya International High Dividend Equity Income Fund; Voya Investors Trust; Voya Mutual Funds; Voya Natural Resources Equity Income Fund; Voya Partners, Inc.; Voya Prime Rate Trust; Voya Senior Income Fund; Voya Separate Portfolios Trust; Voya Strategic Allocation Portfolios, Inc.; Voya Variable Funds; Voya Variable Insurance Trust; Voya Variable Portfolios, Inc.; and Voya Variable Products Trust. The number of funds in the Fund Complex is as of January 31, 2020. |
| | | |
| * | | Effective December 31, 2019, Russell H. Jones and Roger B. Vincent each retired as a Trustee of the Board. |
35
TRUSTEE AND OFFICER INFORMATION (UNAUDITED) (CONTINUED)
| Name, Address and Age | | Position(s)
Held With
the Trust | | Term of Office
and Length of
Time Served(1) | | Principal Occupation(s) —
During the Past 5 Years |
|---|
| | | | | | | |
Michael Bell
One Orange Way
Windsor, Connecticut 06095
Age: 51 | | Chief Executive Officer | | March 2018–Present | | Chief Executive Officer and Director, Voya Investments, LLC, Voya Capital, LLC, and Voya Funds Services, LLC (March 2018–Present); Senior Vice President and Chief Financial Officer, Voya Investments Distributor, LLC (September 2019–Present); Chief Financial Officer, Voya Investment Management (September 2014–Present). Formerly, Senior Vice President, Chief Financial Officer and Treasurer, Voya Investments, LLC (November 2015–March 2018). |
| | | | | | | |
Dina Santoro
230 Park Avenue
New York, New York 10169
Age: 46 | | President | | March 2018–Present | | President and Director, Voya Investments, LLC and Voya Capital, LLC (March 2018–Present); Director, Voya Funds Services, LLC (March 2018–Present); Director and Senior Vice President, Voya Investments Distributor, LLC (April 2018–Present); Senior Managing Director, Head of Product and Marketing Strategy, Voya Investment Management (September 2017–Present). Formerly, Managing Director, Quantitative Management Associates, LLC (January 2004–August 2017). |
| | | | | | | |
Stanley D. Vyner
230 Park Avenue
New York, New York 10169
Age: 69 | | Executive Vice President
Chief Investment Risk Officer | | March 2003–Present
September 2009–Present | | Executive Vice President, Voya Investments, LLC (July 2000–Present) and Chief Investment Risk Officer, Voya Investments, LLC (January 2003–Present). |
| | | | | | | |
James M. Fink
5780 Powers Ferry Road NW
Atlanta, Georgia 30327
Age: 61 | | Executive Vice President | | March 2018–Present | | Managing Director, Voya Investments, LLC, Voya Capital, LLC, and Voya Funds Services, LLC (March 2018–Present); Senior Vice President, Voya Investments Distributor, LLC (April 2018–Present); Chief Administrative Officer, Voya Investment Management (September 2017–Present). Formerly, Managing Director, Operations, Voya Investment Management (March 1999–September 2017). |
| | | | | | | |
Kevin M. Gleason
7337 East Doubletree Ranch Rd.
Suite 100
Scottsdale, Arizona 85258
Age: 53 | | Chief Compliance Officer | | February 2012–Present | | Senior Vice President, Voya Investment Management and Chief Compliance Officer, Voya Family of Funds (February 2012–Present). |
| | | | | | | |
Todd Modic
7337 East Doubletree Ranch Rd.
Suite 100
Scottsdale, Arizona 85258
Age: 52 | | Senior Vice President, Chief/Principal Financial Officer and Assistant Secretary | | March 2005–Present | | President, Voya Funds Services, LLC (March 2018–Present) and Senior Vice President, Voya Investments, LLC (April 2005–Present). |
| | | | | | | |
Kimberly A. Anderson
7337 East Doubletree Ranch Rd.
Suite 100
Scottsdale, Arizona 85258
Age: 55 | | Senior Vice President | | November 2003–Present | | Senior Vice President, Voya Investments, LLC (September 2003–Present). |
| | | | | | | |
Robert Terris
5780 Powers Ferry Road NW
Atlanta, Georgia 30327
Age: 49 | | Senior Vice President | | May 2006–Present | | Senior Vice President, Voya Investments Distributor, LLC (April 2018–Present); Senior Vice President, Head of Division Operations, Voya Investments, LLC (October 2015–Present) and Voya Funds Services, LLC (March 2006–Present). |
| | | | | | | |
Fred Bedoya
7337 East Doubletree Ranch Rd.
Suite 100
Scottsdale, Arizona 85258
Age: 47 | | Vice President and Treasurer | | September 2012–Present | | Vice President, Voya Investments, LLC (October 2015–Present) and Voya Funds Services, LLC (July 2012–Present). |
| | | | | | | |
Maria M. Anderson
7337 East Doubletree Ranch Rd.
Suite 100
Scottsdale, Arizona 85258
Age: 61 | | Vice President | | September 2004–Present | | Vice President, Voya Investments, LLC (October 2015–Present) and Voya Funds Services, LLC (September 2004–Present). |
36
TRUSTEE AND OFFICER INFORMATION (UNAUDITED) (CONTINUED)
| Name, Address and Age | | Position(s)
Held With
the Trust | | Term of Office
and Length of
Time Served(1) | | Principal Occupation(s) —
During the Past 5 Years |
|---|
| | | | | | | |
Sara M. Donaldson
7337 East Doubletree Ranch Rd.
Suite 100
Scottsdale, Arizona 85258
Age: 60 | | Vice President | | September 2014–Present | | Vice President, Voya Investments, LLC (October 2015–Present). Formerly, Vice President, Voya Funds Services, LLC (April 2014–October 2015). |
| | | | | | | |
Micheline S. Faver
7337 East Doubletree Ranch Rd.
Suite 100
Scottsdale, Arizona 85258
Age: 42 | | Vice President | | September 2016–Present | | Vice President, Head of Fund Compliance and Chief Compliance Officer, Voya Investments, LLC (June 2016–Present). Formerly, Vice President, Mutual Fund Compliance (March 2014–June 2016). |
| | | | | | | |
Robyn L. Ichilov
7337 East Doubletree Ranch Rd.
Suite 100
Scottsdale, Arizona 85258
Age: 52 | | Vice President | | November 1999–Present | | Vice President, Voya Funds Services, LLC (November 1995–Present) and Voya Investments, LLC (August 1997–Present). |
| | | | | | | |
Jason Kadavy
7337 East Doubletree Ranch Rd.
Suite 100
Scottsdale, Arizona 85258
Age: 43 | | Vice President | | September 2012–Present | | Vice President, Voya Investments, LLC (October 2015–Present) and Voya Funds Services, LLC (July 2007–Present). |
| | | | | | | |
Andrew K. Schlueter
7337 East Doubletree Ranch Rd.
Suite 100
Scottsdale, Arizona 85258
Age: 43 | | Vice President | | March 2018–Present | | Vice President, Voya Investments Distributor, LLC (April 2018–Present); Vice President, Voya Investments, LLC and Voya Funds Services, LLC (March 2018–Present); Vice President, Head of Mutual Fund Operations, Voya Investment Management (February 2018–Present). Formerly, Vice President, Voya Investment Management (March 2014–February 2018). |
| | | | | | | |
Craig Wheeler
7337 East Doubletree Ranch Rd.
Suite 100
Scottsdale, Arizona 85258
Age: 50 | | Vice President | | May 2013–Present | | Vice President — Director of Tax, Voya Investments, LLC (October 2015–Present). Formerly, Vice President — Director of Tax, Voya Funds Services, LLC (March 2013–October 2015). |
| | | | | | | |
Monia Piacenti
One Orange Way
Windsor, Connecticut 06095
Age: 43 | | Anti-Money Laundering Officer | | June 2018–Present | | Anti-Money Laundering Officer, Voya Investments Distributor, LLC, Voya Investment Management and Voya Investment Management Trust Co. (June 2018–Present); Compliance Consultant, Voya Financial, Inc. (January 2019–Present). Formerly, Senior Compliance Officer, Voya Investment Management (December 2009–December 2018). |
| | | | | | | |
Theresa K. Kelety
7337 East Doubletree Ranch Rd.
Suite 100
Scottsdale, Arizona 85258
Age: 57 | | Secretary | | January 2020–Present | | Vice President and Senior Counsel, Voya Investment Management — Mutual Fund Legal Department (March 2010–Present). |
| | | | | | | |
Paul A. Caldarelli
7337 East Doubletree Ranch Rd.
Suite 100
Scottsdale, Arizona 85258
Age: 68 | | Assistant Secretary | | June 2010–Present | | Vice President and Senior Counsel, Voya Investment Management — Mutual Fund Legal Department (March 2010–Present). |
| | | | | | | |
Joanne F. Osberg
7337 East Doubletree Ranch Rd.
Suite 100
Scottsdale, Arizona 85258
Age: 38 | | Assistant Secretary | | January 2020–Present | | Vice President and Counsel, Voya Investment Management — Mutual Fund Legal Department (January 2013–Present). |
(1) | | The Officers hold office until the next annual meeting of the Board of Trustees and until their successors shall have been elected and qualified. |
37
ADVISORY AND SUB-ADVISORY CONTRACT APPROVAL DISCUSSION (UNAUDITED)
BOARD CONSIDERATION AND APPROVAL OF INVESTMENT MANAGEMENT CONTRACTS AND SUB-ADVISORY CONTRACTS
At a meeting held on November 21, 2019, the Board of Trustees (“Board”) of Voya Investors Trust (the “Trust”), including a majority of the Independent Trustees, considered and approved the renewal of the investment management contracts (the “Management Contracts”) between Voya Investments, LLC (the “Manager”) and the Trust, on behalf of Voya Retirement Conservative Portfolio, Voya Retirement Growth Portfolio, Voya Retirement Moderate Growth Portfolio, and Voya Retirement Moderate Portfolio, each a series of the Trust (the “Portfolios”), and the sub-advisory contracts (the “Sub-Advisory Contracts,” and together with the Management Contracts, the “Contracts”) with Voya Investment Management Co. LLC, the sub-adviser to each Portfolio (the “Sub-Adviser”) for an additional one year period ending November 30, 2020. In determining to renew such contracts, the Board considered information furnished to it throughout the year at meetings of the Board and its committees, including information regarding performance, expenses, and other matters.
In addition to the Board meeting on November 21, 2019, the Independent Trustees also held meetings outside the presence of personnel representing the Manager or Sub-Adviser (collectively, such persons are referred to herein as “management”) on October 9, 2019, and November 19, 2019, specifically to review and consider materials related to the proposed continuance of the Contracts that they believed to be relevant to the renewal of the Contracts in light of their own business judgment and the legal advice furnished to them by K&L Gates LLP, their independent legal counsel. Subsequent references herein to factors considered and determinations made by the Independent Trustees and/or the Board include, as applicable, factors considered and determinations made at those meetings by the Independent Trustees. While the Board considered the renewal of the management contracts and sub-advisory contracts for all of the applicable investment companies in the Voya family of funds at the same meetings, the Board considered each Voya fund’s investment management and sub-advisory relationships separately.
The Board follows a process pursuant to which it seeks and considers relevant information when it evaluates whether to renew existing investment management and sub-advisory contracts for the Voya funds. The Board has established a Contracts Committee and Investment Review Committees (the “IRCs”), each of which includes only Independent Trustees as members. The Contracts Committee meets several times throughout the year to provide oversight with respect to the management and sub-advisory contracts approval and renewal process, among
other functions, and each IRC meets several times throughout the year to provide oversight regarding the investment performance of the sub-advisers, as well as the Manager’s role in monitoring the sub-advisers, with respect to each Voya fund that is assigned to that IRC.
The Contracts Committee oversees, and annually recommends Board approval of updates to, a methodology guide for the Voya funds (“Methodology Guide”) related to the investment management and sub-advisory contract renewal process. The Methodology Guide sets out a framework pursuant to which the Independent Trustees request, and management provides, certain information that the Independent Trustees deem to be important or potentially relevant. The Independent Trustees retain the services of an independent consultant with experience in the mutual fund industry to assist the Contracts Committee in developing and recommending to the Board: (1) a selected peer group of investment companies for each Portfolio (“Selected Peer Group”) based on that Portfolio’s particular attributes, such as fund type and size, fund category (as determined by Morningstar, Inc., an independent provider of mutual fund data (“Morningstar”)), sales channels and structure and the Portfolio share class being compared to the Selected Peer Group; and (2) updates to the Methodology Guide with respect to the content and format of various data including, but not limited to, investment performance, fee structure, and expense information prepared in connection with the renewal process. In addition, the Independent Trustees periodically have retained, including most recently in 2018, an independent firm to test and verify the accuracy of certain information presented to the Board for a representative sample of the Voya funds.
Provided below is an overview of certain material factors that the Board considered at its meetings regarding the renewal of the Contracts and the compensation to be paid thereunder. The Board members did not identify any particular information or factor that was overarching, and each Board member may have accorded different weight to the various factors in reaching his or her conclusions with respect to each Portfolio’s investment management and sub-advisory arrangements.
Nature, Extent and Quality of Services
The Manager oversees, subject to the authority of the Board, and is responsible for the provision of all investment advisory and portfolio management services for the Portfolios, but may delegate certain of these responsibilities to one or more sub-advisers. In addition, the Manager provides administrative services reasonably necessary for the operation of the Portfolios as set forth in the Management Contracts, including oversight of the Portfolios’ operations and risk management and the oversight of their various other service providers.
38
ADVISORY AND SUB-ADVISORY CONTRACT APPROVAL DISCUSSION (UNAUDITED) (CONTINUED)
The Board considered the “manager-of-managers” platform of the Voya funds that has been developed by the Manager pursuant to which the Manager selects, subject to the Board’s approval, sub-advisers to provide day-to-day management services to all or a portion of each Voya fund. The Board recognized that the Manager is responsible for monitoring the investment program, performance, developments, ongoing operations, and compliance with applicable regulations and investment policies and restrictions of the Sub-Adviser with respect to the Portfolios under this manager-of-managers arrangement. The Board also considered the techniques and resources that the Manager has developed to provide this ongoing oversight and due diligence with respect to the sub-advisers and to advocate or recommend, when it believes appropriate, changes in investment strategies or investment sub-advisers designed to assist in improving a Voya fund’s performance. The Board was advised that, in connection with the Manager’s performance of these duties, the Manager has developed an oversight process formulated by its Manager Research & Selection Group which reviews, among other matters, performance data, the Sub-Adviser’s management team, portfolio data and attribution analysis related to the Sub-Adviser through various means, including, but not limited to, in-person meetings, on-site visits, and telephonic meetings with the Sub-Adviser.
Further, the Board considered periodic compliance reports it receives from the Trust’s Chief Compliance Officer evaluating whether the regulatory compliance systems and procedures of the Manager and the Sub-Adviser are reasonably designed to ensure compliance with the federal securities laws and whether the investment policies and restrictions for each Portfolio are consistently complied with, and other periodic reports covering related matters.
The Board considered the portfolio management team assigned by the Sub-Adviser to the Portfolios and the level of resources committed to the Portfolios (and other relevant funds in the Voya funds) by the Manager and the Sub-Adviser, and whether those resources are sufficient to provide high-quality services to the Portfolios.
Based on their deliberations and the materials presented to them, the Board concluded that the nature, extent and quality of the overall services provided by the Manager and the Sub-Adviser under the Contracts were appropriate.
Portfolio Performance
In assessing the investment management and sub-advisory relationships, the Board placed emphasis on the investment returns of each Portfolio, including its investment performance over certain time periods compared to the Portfolio’s Morningstar category and primary benchmark, a broad-based securities market index that appears in the Portfolio’s prospectus. The Board
also considered information from the Manager Research & Selection Group and received reports summarizing a separate analysis of each Portfolio’s performance and risk, including risk-adjusted investment return information, from the Trust’s Chief Investment Risk Officer.
Economies of Scale
When evaluating the reasonableness of the management fee schedules, the Board considered whether economies of scale have been or likely will be realized by the Manager and the Sub-Adviser as a Portfolio grows larger and the extent to which any such economies are shared with the Portfolio. The Board considered that, while the Portfolios do not have management fee breakpoints, they have fee waiver and expense reimbursement arrangements. The Board considered the extent to which economies of scale realized by the Manager could be shared with each Portfolio through such fee waivers, expense reimbursements or other expense reductions. In evaluating these matters, the Independent Trustees also considered periodic management reports, Selected Peer Group comparisons, and industry information regarding economies of scale.
Information Regarding Services, Performance, and Fee Schedules Offered to Other Clients
The Board considered comparative information regarding the nature of services, performance, and fee schedules offered by the Manager and the Sub-Adviser to other clients with similar investment objectives, if applicable, including other registered investment companies and relevant institutional accounts. When the fee schedules offered to or the performance of such other clients differed materially from a Portfolio, the Board took into account the underlying rationale provided by the Manager or the Sub-Adviser, as applicable, for these differences.
Fee Schedules, Profitability, and Fall-out Benefits
The Board reviewed and considered the contractual management fee schedule and net management fee rate payable by each Portfolio to the Manager compared to the Portfolio’s Selected Peer Group. The Board also considered the compensation payable by the Manager to the Sub-Adviser for sub-advisory services for each Portfolio, including the portion of the contractual and net management fee rates that are paid to the Sub-Adviser, as compared to the compensation paid to the Manager. In addition, the Board considered the fee waivers, expense limitations, and/or recoupment arrangements that apply to the fees payable by the Portfolios, including whether the Manager intends to propose any changes thereto. For each Portfolio, the Board separately determined that the fees payable to the Manager and the fee schedule payable to the Sub-Adviser are reasonable for the services that each performs, which were considered in light of the nature, extent and quality of the services that each has performed and is expected to perform.
39
ADVISORY AND SUB-ADVISORY CONTRACT APPROVAL DISCUSSION (UNAUDITED) (CONTINUED)
For each Portfolio, the Board considered information on revenues, costs and profits or losses realized by the Manager and the Voya-affiliated Sub-Adviser related to their services to the Portfolio. In analyzing the profitability of the Manager and its affiliated service providers in connection with services they render to a Portfolio, the Board took into account the sub-advisory fee rate payable by the Manager to the Sub-Adviser. The Board also considered the profitability of the Manager and its affiliated Sub-Adviser attributable to servicing each Portfolio both with and without taking into account the profitability of the distributor of the Portfolios and any revenue sharing payments made by the Manager and both before and after giving effect to any expenses incurred by the Manager or the affiliated Sub-Adviser in making payments to affiliated insurance companies.
Although the Methodology Guide establishes a framework for profit calculation, the Board recognized that there is no uniform methodology within the asset management industry for determining profitability for this purpose. The Board also recognized that the use of different reasonable methodologies can give rise to dramatically different reported profit and loss results with respect to the Manager and the Voya-affiliated Sub-Adviser, as well as other industry participants with whom the profits of the Manager and its affiliated Sub-Adviser could be compared. In addition, the Board recognized that management’s calculations regarding its costs incurred in establishing the infrastructure necessary for the Portfolios’ operations may not be fully reflected in the expenses allocated to each Portfolio in determining profitability, and that the information presented may not portray all of the costs borne by the Manager or reflect all risks, including entrepreneurial, regulatory, legal and operational risks, associated with offering and managing a mutual fund complex in the current regulatory and market environment.
The Board also considered that the Manager is entitled to earn a reasonable level of profits for the services that it provides to the Portfolios. The Board also considered information regarding the potential fall-out benefits to the Manager and Sub-Adviser and their respective affiliates from their association with the Portfolios, including their ability to engage in soft-dollar transactions on behalf of the Portfolios. Following its reviews, the Board determined that the Manager’s and the Voya-affiliated Sub-Adviser’s profitability with respect to their services to the Portfolios and the Manager and Sub-Adviser’s potential fall-out benefits were not unreasonable.
Portfolio-by-Portfolio Analysis
Set forth below are certain of the specific factors that the Board considered at its October 9, 2019, November 19, 2019, and/or November 21, 2019 meetings in relation to approving each Portfolio’s Contracts and the conclusions
reached by the Board. These specific factors are in addition to those considerations discussed above. In each case, the Portfolio’s performance was compared to its Morningstar category, as well as its primary benchmark. The performance data provided to the Board primarily was for various periods ended March 31, 2019. In addition, the Board also considered at its October 9, 2019, November 19, 2019, and November 21, 2019 meetings certain additional data regarding each Portfolio’s more recent performance, asset levels and asset flows. Each Portfolio’s management fee rate and expense ratio were compared to the management fee rates and expense ratios of the funds in its Selected Peer Group. With respect to the quintile rankings noted below, the first quintile represents the range of funds with the highest performance or the lowest management fee rate or expense ratio, as applicable, and the fifth quintile represents the range of funds with the lowest performance or the highest management fee rate or expense ratio, as applicable.
Voya Retirement Conservative Portfolio
In considering whether to approve the renewal of the Contracts for Voya Retirement Conservative Portfolio, the Board considered that, based on performance data for the periods ended March 31, 2019: (1) the Portfolio is ranked in the first quintile of its Morningstar category for the one-year and five-year periods, and the second quintile for the year-to-date, three-year and ten-year periods; and (2) the Portfolio outperformed its primary benchmark for all periods presented, with the exception of the three-year period, during which it underperformed.
In considering the fees payable under the Contracts for the Portfolio, the Board took into account the factors described above and also considered: (1) the fairness of the compensation under a Management Contract with a level fee rate that does not include breakpoints; and (2) the pricing structure (including the net expense ratio to be borne by shareholders) of the Portfolio, as compared to its Selected Peer Group, including that: (a) the net management fee rate for the Portfolio is ranked in the fifth quintile of net management fee rates of the funds in its Selected Peer Group; (b) the contractual management fee rate for the Portfolio is ranked in the third quintile of contractual management fee rates of the funds in its Selected Peer Group; and (c) the all-in net expense ratio for the Portfolio, inclusive of the Acquired Fund Fees and Expenses (“AFFE”), is ranked in the third quintile of all-in net expense ratios of the funds in its Selected Peer Group, and the net expense ratio for the Portfolio, not inclusive of AFFE, is above the median of net expense ratios of the funds in its Selected Peer Group. In analyzing this fee data, the Board took into account: (1) that the Portfolio indirectly bears the fees payable by the underlying funds in which the Portfolio invests; (2) management’s representations
40
ADVISORY AND SUB-ADVISORY CONTRACT APPROVAL DISCUSSION (UNAUDITED) (CONTINUED)
regarding the effect that the limited size of its Selected Peer Group had on the Portfolio’s pricing relative to its Selected Peer Group; and (3) management’s representations regarding its belief that the Portfolio’s pricing is competitive.
After its deliberation, the Board reached the following conclusions: (1) the Portfolio’s management fee rate is reasonable in the context of all factors considered by the Board; (2) the Portfolio’s net expense ratio is reasonable in the context of all factors considered by the Board; (3) the Portfolio’s performance is reasonable in the context of all factors considered by the Board; and (4) the sub-advisory fee rate payable by the Manager to the Sub-Adviser is reasonable in the context of all factors considered by the Board. Based on these conclusions and other factors, the Board voted to renew the Contracts for the Portfolio for the year ending November 30, 2020. During this renewal process, different Board members may have given different weight to different individual factors and related conclusions.
Voya Retirement Growth Portfolio
In considering whether to approve the renewal of the Contracts for Voya Retirement Growth Portfolio, the Board considered that, based on performance data for the periods ended March 31, 2019: (1) the Portfolio is ranked in the second quintile of its Morningstar category for the one-year period, the third quintile for the five-year and ten-year periods, and the fourth quintile for the year-to-date and three-year periods; and (2) the Portfolio underperformed its primary benchmark for all periods presented, with the exception of the one-year period, during which it outperformed. In analyzing this performance data, the Board took into account management’s representations regarding: (1) the impact of asset allocation on the Portfolio’s performance; and (2) the competitiveness of the Portfolio’s performance during certain periods.
In considering the fees payable under the Contracts for the Portfolio, the Board took into account the factors described above and also considered: (1) the fairness of the compensation under a Management Contract with a level fee rate that does not include breakpoints; and (2) the pricing structure (including the net expense ratio to be borne by shareholders) of the Portfolio, as compared to its Selected Peer Group, including that: (a) the net management fee rate for the Portfolio is ranked in the fifth quintile of net management fee rates of the funds in its Selected Peer Group; (b) the contractual management fee rate for the Portfolio is ranked in the fifth quintile of contractual management fee rates of the funds in its Selected Peer Group; and (c) the all-in net expense ratio for the Portfolio, inclusive of the Acquired Fund Fees and Expenses (“AFFE”), is ranked in the third quintile of all-in net expense ratios of the funds in its Selected Peer Group, and the net expense ratio for the Portfolio, not inclusive of
AFFE, is above the median of net expense ratios of the funds in its Selected Peer Group. In analyzing this fee data, the Board took into account: (1) that the Portfolio indirectly bears the fees payable by the underlying funds in which the Portfolio invests; (2) management’s representations regarding the effect that the limited size of its Selected Peer Group had on the Portfolio’s pricing relative to its Selected Peer Group; and (3) management’s representations regarding its belief that the Portfolio’s pricing is competitive.
After its deliberation, the Board reached the following conclusions: (1) the Portfolio’s management fee rate is reasonable in the context of all factors considered by the Board; (2) the Portfolio’s net expense ratio is reasonable in the context of all factors considered by the Board; (3) the Portfolio’s performance is reasonable in the context of all factors considered by the Board; and (4) the sub-advisory fee rate payable by the Manager to the Sub-Adviser is reasonable in the context of all factors considered by the Board. Based on these conclusions and other factors, the Board voted to renew the Contracts for the Portfolio for the year ending November 30, 2020. During this renewal process, different Board members may have given different weight to different individual factors and related conclusions.
Voya Retirement Moderate Growth Portfolio
In considering whether to approve the renewal of the Contracts for Voya Retirement Moderate Growth Portfolio, the Board considered that, based on performance data for the periods ended March 31, 2019: (1) the Portfolio is ranked in the second quintile of its Morningstar category for the year-to-date and five-year periods, and the third quintile for the one-year, five-year and ten-year periods; and (2) the Portfolio outperformed its primary benchmark for all periods presented, with the exception of the five-year period, during which it underperformed.
In considering the fees payable under the Contracts for the Portfolio, the Board took into account the factors described above and also considered: (1) the fairness of the compensation under a Management Contract with a level fee rate that does not include breakpoints; and (2) the pricing structure (including the net expense ratio to be borne by shareholders) of the Portfolio, as compared to its Selected Peer Group, including that: (a) the net management fee rate for the Portfolio is ranked in the third quintile of net management fee rates of the funds in its Selected Peer Group; (b) the contractual management fee rate for the Portfolio is ranked in the first quintile of contractual management fee rates of the funds in its Selected Peer Group; and (c) the all-in net expense ratio for the Portfolio, inclusive of the Acquired Fund Fees and Expenses (“AFFE”), is ranked in the fifth quintile of all-in net expense ratios of the funds in its Selected Peer Group, and the net expense ratio for the Portfolio, not inclusive of
41
ADVISORY AND SUB-ADVISORY CONTRACT APPROVAL DISCUSSION (UNAUDITED) (CONTINUED)
AFFE, is above the median of net expense ratios of the funds in its Selected Peer Group. In analyzing this fee data, the Board took into account: (1) that the Portfolio indirectly bears the fees payable by the underlying funds in which the Portfolio invests; (2) management’s representations regarding the effect that the limited size of its Selected Peer Group had on the Portfolio’s pricing relative to its Selected Peer Group; and (3) management’s representations regarding its belief that the Portfolio’s pricing is competitive.
After its deliberation, the Board reached the following conclusions: (1) the Portfolio’s management fee rate is reasonable in the context of all factors considered by the Board; (2) the Portfolio’s net expense ratio is reasonable in the context of all factors considered by the Board; (3) the Portfolio’s performance is reasonable in the context of all factors considered by the Board; and (4) the sub-advisory fee rate payable by the Manager to the Sub-Adviser is reasonable in the context of all factors considered by the Board. Based on these conclusions and other factors, the Board voted to renew the Contracts for the Portfolio for the year ending November 30, 2020. During this renewal process, different Board members may have given different weight to different individual factors and related conclusions.
Voya Retirement Moderate Portfolio
In considering whether to approve the renewal of the Contracts for Voya Retirement Moderate Portfolio, the Board considered that, based on performance data for the periods ended March 31, 2019: (1) the Portfolio is ranked in the first quintile of its Morningstar category for the five-year period, and the second quintile for the year-to-date, one-year, three-year and ten-year periods; and (2) the Portfolio outperformed its primary benchmark for all periods presented.
In considering the fees payable under the Contracts for the Portfolio, the Board took into account the factors described above and also considered: (1) the fairness of the compensation under a Management Contract with a level
fee rate that does not include breakpoints; and (2) the pricing structure (including the net expense ratio to be borne by shareholders) of the Portfolio, as compared to its Selected Peer Group, including that: (a) the net management fee rate for the Portfolio is ranked in the fifth quintile of net management fee rates of the funds in its Selected Peer Group; (b) the contractual management fee rate for the Portfolio is ranked in third quintile of contractual management fee rates of the funds in its Selected Peer Group; and (c) the all-in net expense ratio for the Portfolio, inclusive of the Acquired Fund Fees and Expenses (“AFFE”), is ranked in the third quintile of all-in net expense ratios of the funds in its Selected Peer Group, and the net expense ratio for the Portfolio, not inclusive of AFFE, is above the median of net expense ratios of the funds in its Selected Peer Group. In analyzing this fee data, the Board took into account: (1) that the Portfolio indirectly bears the fees payable by the underlying funds in which the Portfolio invests; (2) Management’s representations regarding the effect that the limited size of its Selected Peer Group had on the Portfolio’s pricing relative to its Selected Peer Group; and (3) Management’s representations regarding its belief that the Portfolio’s pricing is competitive.
After its deliberation, the Board reached the following conclusions: (1) the Portfolio’s management fee rate is reasonable in the context of all factors considered by the Board; (2) the Portfolio’s net expense ratio is reasonable in the context of all factors considered by the Board; (3) the Portfolio’s performance is reasonable in the context of all factors considered by the Board; and (4) the sub-advisory fee rate payable by the Manager to the Sub-Adviser is reasonable in the context of all factors considered by the Board. Based on these conclusions and other factors, the Board voted to renew the Contracts for the Portfolio for the year ending November 30, 2020. During this renewal process, different Board members may have given different weight to different individual factors and related conclusions.
42
(THIS PAGE INTENTIONALLY LEFT BLANK)


![[MISSING IMAGE: ing_cov.jpg]](https://capedge.com/proxy/N-CSR/0001104659-20-030747/ing_cov.jpg)
![[MISSING IMAGE: voya_covinvmgt.jpg]](https://capedge.com/proxy/N-CSR/0001104659-20-030747/voya_covinvmgt.jpg)
![[MISSING IMAGE: ph_dina-santoro.jpg]](https://capedge.com/proxy/N-CSR/0001104659-20-030747/ph_dina-santoro.jpg)
![[MISSING IMAGE: tv536350_lc-fi.jpg]](https://capedge.com/proxy/N-CSR/0001104659-20-030747/tv536350_lc-fi.jpg)
![[MISSING IMAGE: tv536350_lc-hy.jpg]](https://capedge.com/proxy/N-CSR/0001104659-20-030747/tv536350_lc-hy.jpg)
![[MISSING IMAGE: tv536350_lc-lcg.jpg]](https://capedge.com/proxy/N-CSR/0001104659-20-030747/tv536350_lc-lcg.jpg)
![[MISSING IMAGE: tv536350_lc-lcv.jpg]](https://capedge.com/proxy/N-CSR/0001104659-20-030747/tv536350_lc-lcv.jpg)
![[MISSING IMAGE: tv536350_chart-maturity.jpg]](https://capedge.com/proxy/N-CSR/0001104659-20-030747/tv536350_chart-maturity.jpg)
![[MISSING IMAGE: tv536350_lc-uss.jpg]](https://capedge.com/proxy/N-CSR/0001104659-20-030747/tv536350_lc-uss.jpg)
![[MISSING IMAGE: tv536350_lc-crep.jpg]](https://capedge.com/proxy/N-CSR/0001104659-20-030747/tv536350_lc-crep.jpg)
![[MISSING IMAGE: tv536350_lc-jpmscceq.jpg]](https://capedge.com/proxy/N-CSR/0001104659-20-030747/tv536350_lc-jpmscceq.jpg)